Proceedings of Abstracts 13 th International Conference on Air Quality Science and Application Venue: Aristotle University’s Research Dissemination Center (KEDEA) 27 June – 1 July 2022 EDITORS Nicolas Moussiopoulos, Ranjeet S. Sokhi, George Tsegas, Evangelia Fragkou, Eleftherios Chourdakis, Ioannis Pipilis ORGANISED BY University of Hertfordshire, UK and Aristotle University of Thessaloniki, Greece

Welcome message from author
This document is posted to help you gain knowledge. Please leave a comment to let me know what you think about it! Share it to your friends and learn new things together.
Transcript
Proceedings of Abstracts
13th International Conference on
Air Quality
Science and Application
Venue:
Aristotle University’s Research Dissemination Center (KEDEA)
27 June – 1 July 2022
EDITORS
Nicolas Moussiopoulos, Ranjeet S. Sokhi, George Tsegas,
Evangelia Fragkou, Eleftherios Chourdakis, Ioannis Pipilis
ORGANISED BY
University of Hertfordshire, UK and Aristotle University of Thessaloniki, Greece

Proceedings of Abstracts
13th International Conference on
Air Quality
Science and Application
EDITORS
Nicolas Moussiopoulos1, Ranjeet S. Sokhi2, George Tsegas1,
Evangelia Fragkou1, Eleftherios Chourdakis1, Ioannis Pipilis1
1Laboratory of Heat Transfer and Environmental Engineering, Aristotle University of Thessaloniki, Greece 2Centre for Atmospheric and Climate Physics Research and Centre for Climate Change Research, University of Hertfordshire, UK
ORGANISED BY
University of Hertfordshire, UK
Aristotle University of Thessaloniki, Greece
Published by the Air Quality Conference College Lane Hatfield AL10 9AB United Kingdom ISBN: 978-1-3999-2835-9 DOI: 10.18745/PB.25560 Suggested citation: Authors…… (2022). Proceedings of Abstracts 13th International Conference on Air Quality: Science and Application. Published by Aristotle University of Thessaloniki, Greece and University of Hertfordshire, UK, pp XX, https://doi.org/10.18745/PB.25560 © 2022 The Author(s). This an open access work distributed under the terms of the Creative Commons Attribution Licence (https://creativecommons.org/licenses/by/4.0/), which permits unrestricted reuse, distribution, and reproduction in any medium, provided the original work is properly cited. Production: Laboratory of Heat Transfer and Environmental Engineering Aristotle University of Thessaloniki Thessaloniki Greece All inquiries to: Professor Ranjeet S Sokhi Centre for Atmospheric and Climate Physics Research (CACP) Department of Physics, Astronomy and Mathematics University of Hertfordshire College Lane, Hatfield, AL0 9AB, UK Tel: +44(0) 1707 284520 Email: [email protected]
ACKNOWLEDGMENT TO SPONSORS AND SUPPORTERS
The support of the following institutions and enterprises is gratefully acknowledged:
ORGANISING INSTITUTIONS
University of Hertfordshire, UK
Aristotle University of Thessaloniki
SPONSORS
Thessaloniki Water Supply & Sewerage Co S.A.
Thessaloniki Port Authority S.A.
Gaia EPICHEIREIN
Ktima Kir-Yianni
SUPPORTERS
Research Committee – Aristotle University of Thessaloniki
Aristotle University’s School of Mechanical Engineering
SUPPORTING ORGANISATIONS
APHH UK-India Programme on Air Pollution and Human Health (funded by NERC, MOES, DBT,
MRC, Newton Fund)
American Meteorological Society (AMS)
Air & Waste Management Association (A&WMA)
World Meteorological Organisation (WMO), GAW Urban Research Meteorology and Environment
(GURME) Programme
We acknowledge the attendance of the following exhibitors:
Aerosol D.O.O. Cambustion Ellona EMISIA S.A. Passam AG TSI ltd

CONFERENCE ORGANISING COMMITTEE Aristotle University of Thessaloniki, Greece
Nicolas Moussiopoulos, Leonidas Ntziachristos, Nicolaos Theodossiou, Sokratis Basbas, John Bartzis, George Tsegas, Evangelia Fragkou, Theodora Slini, Afedo Koukounaris, Kleoniki Kyrkopoulou, Elli Chatzokou, Ioannis Pipilis and Christos Kalitsis
University of Hertfordshire, UK
Ranjeet S Sokhi, Ummugulsum Alyuz, Kester Momoh, Saurabh Kumar
INTERNATIONAL SCIENTIFIC AND ADVISORY COMMITTEE
Professor Ranjeet S Sokhi (Chair), University of Hertfordshire, UK
Professor Nicolas Moussiopoulos, Aristotle University of Thessaloniki, Greece
Professor John Bartzis, University of West Macedonia, Greece
Professor Zissis Samaras, Aristotle University of Thessaloniki, Greece
Professor Alexander Baklanov, World Meteorological Organisation
Dr Gufran Beig, Indian Institute of Tropical Meteorology, India
Professor Carlos Borrego, University of Aveiro, Portugal
Professor Greg Carmichael, University of Iowa, USA
Professor Judy Chow, Desert Research Institute, USA
Dr Sandro Finardi, ARIANET, Italy
Professor Eugene Genikhovich, Main Geophysical Observatory, Russia
Professor Sue Grimmond, University of Reading, UK
Professor Selahattin Incecik, Technical University of Istanbul, Turkey
Dr Jacek Kaminski, York University, Canada
Dr Matthias Ketzel, Aarhus University, Denmark
Professor Jaakko Kukkonen, Finnish Met Institute, Finland
Professor Roberto San Jose, Technical University of Madrid, Spain
Dr Vikas Singh, National Atmospheric Research Laboratory, India
Dr Andreas Skouloudis, JRC, ISPRA
Professor James Sloan, University of Waterloo, Canada
Dr Peter Suppan, Karlsruhe Institute of Technology, Germany

PREFACE
The 13th International Conference on Air Quality - Science and Application is being held in
the vibrant port city of Thessaloniki, Greece. To curtail the spread of COVID-19, the 12th
International meeting, which was to be held in Thessaloniki, was changed to a fully online event.
Since then, the pandemic landscape has changed and, for this meeting, we are offering for the
first time a hybrid format.
We have the pleasure of working with the Aristotle University of Thessaloniki for a second
time as the local hosts for the 13th Conference. The meeting is a continuation of the series that
began at the University of Hertfordshire, UK in July 1996. Subsequent meetings have been held
at the Technical University of Madrid (1999), Loutraki, Greece (2001), Charles University, Prague
(2003), Valencia, Spain (2005), Cyprus (2007), Istanbul, Turkey (2009) Athens, Greece (2012),
Garmisch-Partenkirchen (2014), Milan (2016) and Barcelona (2018), online (2020, hosted by
Aritotle University of Thessaloniki).
During the pandemic years, especially the earlier phase, air quality showed some
improvements in many parts of the world. Many studies, however, have shown that even with
this drastic reduction in emissions, the observed improvements would not necessarily lead to the
latest WHO guidelines being met. These findings emphasise the urgency of controlling air
pollution and highlight the complexities of the challenge. It is evident that the problem of poor
air quality persists in all cities of the globe. With increasing public awareness, the issue of poor air
quality remains at the forefront of societal concern, and with climate change, it is the most
important environmental risk for humanity.
As urbanisation grows, scientific research is showing that impact from air pollution in cities
depends on contributions from local scales, as well as from regional and global scales, including
interactions with climate change. Improvements in technology need to go hand in hand with
management and assessment strategies, but also with effective control policies, for reducing the
health impact of air pollution.
The presentations at the Conference address the diversity of scales, processes and
interactions affecting air pollution and its impact on health and the environment. As usual, the
conference is stimulating cross-fertilisation of ideas and cooperation between the different air
pollution science and user communities. There is greater involvement of city, regional and global
air pollution, climate change, users and health communities at the meeting.
The focus of the international conference will be to discuss the latest scientific advances in the understanding of air pollution and its impacts on our health and environment. The conference will also discuss new applications and developments in management strategies and assessment tools for policy and decision makers.
This Proceeding presents a collection of abstracts presented at the Conference under the
following science themes: Air pollution sources and emissions
Air quality management and policy development
Air quality prediction and forecasting
Air Quality and COVID-19
Characterisation of air pollutants
Development, application and evaluation of air quality related models for local to global scales
Dust and its impacts
Exposure and health assessment related to air pollution
Indoor air quality
Integrated assessment and air quality
Local air quality and impact studies
Meteorological processes and interactions including connections with climate change
Observations and emerging technologies for monitoring air pollution
Special session - Air pollution and health
Special Session - Biomonitoring air quality
Special Session - Sensors, crowd sourcing and numerical simulations for urban air quality
Special session - Shipping and air quality
Special Session - Air pollution in urban areas - science challenges and policy implications
Special Session - Green Mobility in SmartCities and Impact on Pollutant Emissions and Air Quality
Special Session - Ensuring Air Quality through the implementation of the SDGs
Special Session - Practical and usable solutions to air pollution
Special Session - Helmholtz European Partnership for Technological Advancement (HEPTA) Ranjeet S Sokhi, University of Hertfordshire, UK
Nicolas Moussiopoulos, Aristotle University of Thessaloniki, Greece
June 2022

TABLE OF CONTENTS
ORAL SESSIONS
SOURCE APPORTIONMENT OF PM10, PM1 AND OXIDATIVE POTENTIAL: A FOCUS ON NON-EXHAUST EMISSIONS 2 A. Albarracin
NEW LAGRANGIAN AIR POLLUTION MODEL FOR DENMARK 3 C. Andersen
AIR QUALITY AND GREENHOUSE GASES IN THE SAO PAULO MEGACITY: INTEGRATED NETWORK. 4 M.F. Andrade
THE EFFECT OF AIR POLLUTION ON RESPIRATORY HEALTH OUTCOMES WHEN MODIFIED BY AIR TEMPERATURE: A SYSTEMATIC REVIEW AND META-ANALYSIS 5 A.T. Areal
DOWNSCALING MODELLING OF GROUND-LEVEL OZONE 6 C. Asker
URBAN MOBILITY BASED AIR QUALITY MODELLING WITH A CHEMICAL TRANSPORT MODEL ON A CITY SCALE VALIDATED BY AIR QUALITY MONITORING STATIONS A TEST CASE 7 J. Backman
HOW GREEN INFRASTRUCTURES IMPACT ON URBAN AIR QUALITY OVER BARCELONA 8 A. Badia
VEGETATION FIRE AND SMOKE POLLUTION WARNING AND ADVISORY SYSTEM: RESEARCH FOCUS AND METHODOLOGY 9 A. Baklanov
MEASUREMENTS OF BOUNDARY LAYER VERTICAL PROFILES OF GREENHOUSE GAS MIXING RATIOS AND PARTICULATE MATTER CONCENTRATIONS USING A TETHERED BALLOON - CASE STUDY FROM KRAKOW CITY 10 J. Bartyzel
SIMPLIFIED MICROSCALE MODELING METHODOLOGIES FOR URBAN AIR QUALITY 11 J.G. Bartzis
EVALUATION OF LOW-COST GAS SENSORS TO QUANTIFY INTRA-URBAN VARIABILITY OF ATMOSPHERIC POLLUTANTS 12 A. Baruah
GEOGRAPHICAL AREAS AND ACTIVITY SECTORS ASSOCIATED WITH AIR QUALITY HEALTH IMPACTS IN THE UNECE REGION 13 C.A. Belis
THE NEED TO MODEL MOBILITY BEHAVIOURS FOR A BETTER ASSESSMENT OF AIR POLLUTION EXPOSURE AND TO HIGHLIGHT ENVIRONMENTAL HEALTH INEQUALITIES 14 T
A SPATIO-TEMPORAL STREET SCALE VEHICULAR EMISSION MODEL FOR AIR QUALITY STUDIES 15 A. Biswal
ASSIMILATING DATA FROM LOCAL THERMAL MEASUREMENTS IN URBAN-SCALE FLOW AND DISPERSION MODELLING 16 D. Boehnke
USING LOW-COST SENSORS FOR POLLUTION SOURCE IDENTIFICATION AND APPORTIONMENT 17 D. Bousiotis
2006-2021 CHANGES IN PM2.5 LEVELS AND SOURCE CONTRIBUTIONS IN THE CITY WUHAN, CHINA BASED ON MEASUREMENTS AND RECEPTOR MODELLING 18 A. Canals
REVIEW OF OBSTACLES INFLUENCE ON AIR POLLUTANT DISPERSION IN STREET CANYONS 19 O.S. Carlo
ASSESSING AIR POLLUTION FROM WOOD BURNING USING LOW-COST SENSORS AND CITIZEN SCIENCE 20 N. Castell
IS A CALIBRATION IN A CLIMATIC CHAMBER GOOD ENOUGH TO CORRECT FIELD MEASUREMENTS OF NO2 LOW-COST SENSORS? 21 M -Mateos
PROPECTIONS OF UV SOLAR RADIATION ON GLOBAL SCALE BASED ON SIMULATIONS FROM CMIPN MODELS DNA & CIE DOSE EFFECTS 22 A. Chatzopoulou
COMPARING SOURCE ORIENTED AND RECEPTOR ORIENTED SOURCE APPORTIONMENT RESULTS OVER THE MILAN AREA IN LIFE-REMY PROJECT 23 E. De Angelis
AIR QUALITY FORECASTING USING A DEEP LONG-SHORT MEMORY NETWORK MODEL 24 D. Delioglani
THE IMPORTANCE OF AEROBIOLOGICAL MONITORING IN THE AIR QUALITY ASSESSMENT 25 A. Di Menno di Bucchianico
THE 2020 LOCKDOWN IN AN ALPINE REGION - DISENTANGLING THE EFFECT OF METEOROLOGY AND EMISSIONS ON POLLUTANT CONCENTRATIONS 26 H
20 YEARS OF NO2 VERTICAL COLUMN CONCENTRATIONS IN ROME - RE-EVALUATION OF THE DATA SET WITH AN ADVANCED AND ACCURATE RETRIEVAL TECHNIQUE 27 H
VERTICAL PROFILE OF THE AEROSOL DIRECT RADIATIVE EFFECT IN AN ALPINE VALLEY 28 H. Di moz
STUDY ON THE ELECTRIC RANGE OF PLUG-IN HYBRID VEHICLES UNDER REAL WORLD CONDITIONS 29 S. Doulgeris
MEASURING THE IMPACT OF INLAND SHIPPING ON AIR POLLUTANT IMMISSIONS ALONG THE UPPER RHINE IN GERMANY 30 P. Eger
QUANTIFICATION OF GREENHOUSE GAS EMISSIONS IN THESSALONIKI 31 L. Feld
MULTISCALE AIR QUALITY IMPACT OF AIRPORT AND EN ROUTE AVIATION EMISSIONS 32 S. Finardi
MODELLING ANALYSIS OF COVID-19 MEASURES IMPACT ON THE AIR QUALITY IN ROME 33 S. Finardi
CONTRIBUTION OF SHIPPING TO AIR POLLUTION IN THE MEDITERRANEAN REGION MODEL EVALUATION OF FIVE REGIONAL SCALE CHEMISTRY TRANSPORT MODELS 34 L. Fink
SETTING TARGETS FOR UK AIR POLLUTANTS COMPATIBLE WITH NET CARBON ZERO 35 B.E.A. Fisher
ROAD TRAFFIC OR AIRPORT IMPACT - MOBILE ULTRA FINE PARTICLE MEASUREMENTS IN THE VICINITY OF BERLIN-TEGEL AIRPORT 36 S. Fritz
NON-EXHAUST PM EMISSIONS FROM RAILWAYS IN-SITU MEASURMENTS AND PARAMETER STUDY 37 D. Fruhwirt
SHORT-TERM EFFECTS OF PARTICULATE MATTER ON NATURAL MORTALITY IN ITALY 38 C. Gariazzo
DIFFERENCE IN CARCINOGENIC POTENCY OF PM10-BOUND PAHS BETWEEN WORKING AND NON- WORKING DAYS IN INDOOR URBAN ENVIRONMENTS. 39 M. Gherardi
IMPROVING THE PRECISION OF MINIDISCS MEASURING UFPS IN MULTIPLE CONFIGURATION 40 M. Gherardi
LNG-FUELLED SHIPS: ARE THEY AS CLIMATE-FRIENDLY AS HAS BEEN PREVIOUSLY ESTIMATED? 41 T.
DEVELOPING AN ATMOSPHERIC EMISSION INVENTORY WITH HIGH SPATIAL AND TEMPORAL RESOLUTIONS IN PORTUGAL 42 D

CHARACTERISATION OF SWITZERLAND'S PM10, PM2.5, AND ASSOCIATED OXIDATIVE POTENTIAL 43 S.K. Grange
EUROPEAN URBAN AIR QUALITY AND COVID-19 LOCKDOWNS 44 S.K. Grange
EVALUATION OF LAGRANGIAN PARTICLE DISPERSION MODEL FOR REGIONAL SCALE UP TO 200 KM BASED ON MODEL VALIDATED ON LOCAL SCALE 45 B
FIVE-YEAR TREND OF HOURLY RESOLVED, SOURCE-SEPARATED BLACK CARBON EMISSION RATES IN A CENTRAL-EUROPEAN CITY 46 A
FROM TERRESTIAL MACRO-PLASTIC TO ATMOSPHERIC MICRO-PLASTIC: A MICRO-PHYSICAL DESCRIPTION 47 R.A. Hansen
CORDEX FLAGSHIP PILOT STUDY ON URBANIZATION - URBAN ENVIRONMENTS AND REGIONAL CLIMATE CHANGE (URB-RCC) 48 T. Halenka
NON-CO2 FORCERS AND THEIR CLIMATE, WEATHER, AIR QUALITY AND HEALTH IMPACTS A NEW PROJECT FOCI 49
T. Halenka
NATIONAL ANNUAL AVERAGE STREETSCALE RESOLUTION AIR QUALITY MODELLING 50 C. Hood
PERFORMANCE OF LOW-COST SENSORS FOR NO AND NO2 DURING LONG-TERM DEPLOYMENTS 51 C
THE USE OF SENSOR-BASED AIR QUALITY STATION IN URBAN APPLICATIONS: DIFFERENT CITIES, DIFFERENT CHALLENGES 52 E. Ibarrola-Ulzurrun
FUTURE PREMATURE MORTALITY DUE TO EXPOSURE TO PM2.5 53 U. Im
OXIDATIVE POTENTIAL OF REGIONAL & URBAN BACKGROUND PM10, PM2.5, & PM1 IN BARCELONA 54 M
ON OPTIMIZING CATALYTIC GLYCEROL HYDRODEOXYGENATION TOWARDS GREEN PROPYLENE 55 G. Ioannidou
DNAAP - DETECTION OF NON-ANTHROPOGENIC AIR POLLUTION 56 M

TOXICOLOGICAL IMPACT OF SECONDARY ORGANIC AEROSOLS FORMED FROM THE REACTION OF LIMONENE WITH OZONE 57 F. Jacob
EMISSIONS FROM GLOBAL SHIPPING IN 2014-2020 58 J.P. Jalkanen
CRUISE SHIPS IN DANISH HARBOURS EMISSIONS, AIR QUALITY AND HEALTH BURDEN 59 S.S. Jensen
ON THE USE OF AQ SENSOR DATA IN LOCAL AIR QUALITY MODELLING A CASE STUDY IN HELSINKI 60 L. Johansson
IMPROVING 3-DAY DETERMINISTIC AIR POLLUTION FORECASTS USING MACHINE LEARNING 61 C. Johansson
GLOBAL MODEL CALCULATIONS OF THE EFFECTS OF INTERNATIONAL SHIP EMISSIONS IN DIFFERENT WORLD REGIONS. 62 J.E. Jonson
A FULLY CO UPLED AND DYNAMIC DISPERSIO N-EXPO SURE-RESPO NSE MO DELLING SCHEME FO R MITIGATIO N O F INDO O R AND SHO RTTERM AIRBO RNE RELEASES 63 K.E. Kakosimos
ACTIVE AIR SAMPLING FOR UNDERSTANDING THE VENTILATION AND INFECTION RISKS FOR THE TRANSMISSION OF SARS-CoV-2 IN PUBLIC INDOOR ENVIRONMENTS 64 G. Kalaiarasan
OPEN ACCESS AEROSOL DYNAMICS MODEL MAFOR 65 M. Karl
CITY-SCALE MODELLING OF ULTRAFINE PARTICLES 66 M. Karl
DATA FUSION FOR THE IMPROVEMENT OF THE SPATIAL RESOLUTION OF AIR QUALITY MODELING 67 T. Kassandros
AIR QUALITY AT YOUR STREET 2.0: RECENT ADVANCES IN NATIONAL MULTI-SCALE AIR POLLUTION ASSESSMENT TOOL OF DENMARK 68 J. Khan
COMPARISON OF THE OZONE BUDGET BETWEEN EUROPE AND SOUTHEAST ASIA AS SIMULATED WITH A GLOBAL-REGIONAL MODEL 69 M. Kilian
PROVIDING RESOLVED 3D MICROSCALE RADIATIVE FLUX FOR PHOTOLYSIS IN THE PALM MODEL 70 P

PARTICLE NUMBER EMISSIONS FROM SHIPPING - EFFECTS OF CLEANER FUELS AND SCRUBBERS 71 N. Kuittinen
ADVANCES IN THE ASSESSMENT OF THE IMPACTS OF SHIPPING EMISSIONS 72 J. Kukkonen
A COMPOSITIONAL KERNEL LEARNING BASED GAUSSIAN PROCESS MODEL FOR URBAN AIR POLLUTANTS PREDICTION USING UNCERTAIN AND HETEROGENEOUS DATASETS 73 C. Li
THE EFFECT OF INDUSTRIAL AND PORT ACTIVITY ON THE CONCENTRATION OF PM10 AND TROPOSPHERIC O3 IN LIMASSOL AND VASSILIKOS PORT REGIONS 74 I. Logothetis
INFLUENCE OF METEOROLOGICAL PARAMETERS ON THE SURFACE AIR COMPOSITION IN MOSCOW 75 M.A. Lokoshchenko
MULTIVARIATE ANALYSIS OF PERCEPTIONS, RESPONSES, AND EFFECTS OF AIR POLLUTION ON QUALITY OF LIFE 76 M. Machado
EXPERIMENTAL STUDY OF VISIBLE LIGHT RESPONSIVE PHOTOCATALYTIC PAINTS FOR INDOOR AIR QUALITY IMPROVEMENT 77 T h. Maggos
MODELLING EMISSIONS ORIGINATING FROM MARINE LNG ENGINES 78 E
AIR QUALITY IMPROVEMENT IN URBAN AGGLOMERATIONS BY THE CONVERSION OF FOSSIL FUEL DISTRICT HEATING SYSTEMS INTO RENEWABLE ENERGY PLANTS 79 E. Mamut
PREDICTION OF OZONE EXCEEDANCES WITH CLIMATE INDICATORS USING MACHINE LEARNING 80 A.M.M. Manders
AIR QUALITY MEASURMENTS FROM ON-BOARD PORTABLE PODS VS FIXED MONITORING STATIONS IN THE CITY OF THESSALONIKI 81 D. Margaritis
IMPACT OF THE COVID-19 LOCKDOWN EMISSION REDUCTIONS ON SECONDARY POLLUTANTS IN CENTRAL EUROPE 82 V. Matthias
FINDING THE RIGHT SOLUTIONS TO IMPROVE URBAN AIR QUALITY: THE CONCAWE NOX/NO2 SOURCE APPORTIONMENT VIEWER 83 A. Megaritis
INFLUENCE OF LAND TRANSPORT EMISSIONS ON OZONE IN EUROPE WHAT CAN WE LEARN FROM COMBINING IMPACT AND CONTRIBUTION ANALYSES? 84 M. Mertens

SUSTAINABLE MOBILITY MEASURES IN URBAN HILLY AREAS 85 L. Mitropoulos
MEASUREMENT CAMPAIGN FOR CHARACTERISING AND MONITORING OF EMISSIONS FROM VESSEL WITH ALTERNATIVE FUELS AND NOX EMISSION CONTROL 86 J. Moldanova
LINKING CLIMATE MITIGATION AND AIR QUALITY POLICIES AT URBAN LEVEL. EXPERIENCES AND CONSIDERATIONS FROM THE COVENANT OF MAYORS INITIATIVE 87 F. Monforti-Ferrario
THESSALONIKI AIR QUALITY: A 30 YEAR RETROSPECTIVE AND CRITICAL ANALYSIS 88 N. Moussiopoulos
NEW WHO GLOBAL AIR QUALITY GUIDELINES HOW THE CURRENT AMBIENT AIR SITUATION FITS TO IT IN EUROPE 89 H.G.
HIGH EMITTERS VEHICLES AND SUSTAINABLE DEVELOPMENT OF URBAN AREAS 90 F. Murena
IMPACT OF NOISE BARRIERS ON THE OBSERVED AIR QUALITY ALONG ROADS 91 M. Norman
IMPACT OF NOISE BARRIERS ON AIR QUALITY ALONG ROADS 92 M. Norman
EVALUATION OF A MINIATURISED EXHAUST EMISSION MEASURING SYSTEM USING LOW-COST AMBIENT SENSORS 93 I. Ntampos
NO2 POLLUTION EPISODE IN MADRID AFTER FILOMENA STORM IN JANUARY, 2021 94 L
EXPOSURE TO MULTIPLE AIR POLLUTANTS AND THE INCIDENCE OF CORONARY HEART DISEASE: A FINE-SCALE GEOGRAPHIC ANALYSIS 95 F. Occelli
NANOOFFICE NANOPARTICLES IN NEW AND RENOVATED OFFICE BUILDINGS 96 H. Orru
EVALUATION OF THE PERFORMANCE OF DIFFERENT INDOOR AIR QUALITY PREDICTIVE MODELS USING DATASETS FROM A SMART HOME 97 H. Omidvarborna
MILLISECOND ROADSIDE AMBIENT NICTRIC OXIDE AND NITROGEN DIOXIDE MEASUREMENTS 98 J. Parnell
DEVELOPMENT OF AN ON-LINE HYBRID AIR QUALITY MODELING SYSTEM FOR THE CITY OF MILAN 99 A. Piccoli
A NEW CLOUD-BASED SERVICE FOR URBAN AIR QUALITY FORECAST 100 N. Pina
2011-2020 URBAN AND REGIONAL BACKGROUND NH3 TRENDS IN NE SPAIN 101 X. Querol
URBAN POPULATION EXPOSURE TO AIR POLLUTION UNDER COVID-19 LOCKDOWN CONDITIONS: THE COMBINED EFFECT OF CHANGING EMISSIONS AND POPULATION ACTIVITY PATTERNS 102 M.O.P. Ramacher
DEVELOPING AN OPEN, ACCESSIBLE AND FUTURE-PROOF COMMUNITY EMISSION MODEL 103 S. Reis
MULTI-ANNUAL SOURCE APPORTIONMENT AND ABSORBING PROPERTIES OF ORGANIC AEROSOLS IN NORTHERN FRANCE 104 V. Riffault
VERTICAL PROFILE MEASUREMENTS USING UNMANNED AERIAL VEHICLE (UAV) FOR MONITORING AIR QUALITY IN STUTTGART 105 A. Samad
ANALYSIS OF IMPACTS IN OZONE CONCENTRATIONS IN MADRID (SPAIN) DURING THE COVID-19 LOCKDOWN WITH WRF/CHEM AND WRF-CAMX/OSAT MODELS 106 R. San Jose
IMPACTS OF PARTICULATE MATTER ON THE ARABIAN SEA TROPICAL CYCLONES - POLLUTANTS FROM INDIA ARE A MAJOR CONCERN 107 S. Gobishankar
REAL DRIVING EMISSION MEASUREMENTS OF VEHICLES: A VALIDATION STUDY OF THE PLUME CHASING METHOD 108 C. Schmidt
EXPLOITING SENTINEL-5P SATELLITE DATA FOR MAPPING URBAN AIR QUALITY 109 P. Schneider
A MULTI-MODEL AIR QUALITY SYSTEM FOR HEALTH RESEARCH 110 M. Seaton
IMPACT OF TEMPORAL EMISSION PROFILES ON PM10 CONCENTRATIONS IN CHEMICAL-TRANSPORT MODEL 111 T
CONCENTRATIONS OF NOX IN SWEDEN OVER THREE DECADES USING DISPERSION MODELLING AT LOCAL AND REGIONAL SCALE 112 D. Segersson
ESTIMATION OF SURFACE NO2 CONCENTRATION OVER EUROPE USING SENTINEL-5P OBSERVATIONS AND MACHINE LEARNING MODELS 113 S. Shetty

EXPOSURE DIFFERENTIATION FOR POPULATION GROUPS. AN EXAMPLE FOR PM2.5 AND BaP. 114 M.A. Siarga
NO2 AND PM10 AVOIDED HEALTH BURDEN IN PORTUGAL IN 2015-2019: APPLICATION OF THE NEW WHO AIR QUALITY GUIDELINES 115 A.C.T. Silva
VARIOUS SOURCES OF ABNORMALLY HIGH AEROSOL AIR POLLUTION IN MOSCOW 116 A. Skorokhod
THE INFLUENCE OF COVID-19 LOCKDOWN AND METEOROLOGICAL CONDITIONS ON THE ATMOSPHERIC AIR COMPOSITION IN MOSCOW IN 2020 117 A. Skorokhod
AIR QUALITY AND ENERGY IN GREECE: PRE AND POST COVID 19 FACTS 118 T. Slini
HOW WILL 2021 WHO AIR QUALITY GUIDELINES IMPACT THE HEALTH IMPACT ASSESSMENT BY THE EUROPEAN ENVIRONMENT AGENCY 119 J. Soares
HITTING THE HOTSPOTS TARGETED DEPLOYMENT OF AIR SOURCE HEAT PUMP TECHNOLOGY TO DELIVER CLEAN AIR COMMUNITIES AND CLIMATE PROGRESS: A CASE STUDY OF IRELAND 120 G. Sousa Santos
HOW LOW-COST SENSOR NETWORKS CAN IMPROVE AIR QUALITY MAPPING AND LOCAL EMISSION INVENTORIES 121 J. Sousa
TOOLKIT FOR EVALUATING REGIONAL AND LOCAL AIR QUALITY MODELS WITH OBSERVATIONS 122 A. Stidworthy
VALIDATION STRATEGIES FOR ATMOSPHERIC SATELLITE MISSIONS LIKE SENTINEL-5P CASE STUDY OF A NO2 AIRBORNE MAPPING CAMPAIGN OVER BELGIUM 123 F. Tack
ROAD TRAFFIC CONTRIBUTION TO URBAN BLACK CARBON CONCENTRATIONS: COIMBRA CASE STUDY 124 O. Tchepel
THE IMPACT OF AIR QUALITY TO THE IMPLEMENTATION OF THE SDGS 125 N. Theodossiou
AQ- 126 R . Timmermans
ASSESSMENT OF AIRBORNE PARTICLES, VENTILATION AND COVID-19 TRANSMISSION RISK IN UK SCHOOLS 127 A. Tiwari
GREEN WALLS FOR AIR QUALITY IMPROVEMENTS IN URBAN ENVIRONMENT 128 M. Tomson
REAL-WORLD DRIVING PN EMISSIONS OF PLUG-IN HYBRID ELECTRIC VEHICLES 129 Z. Toumasatos
EVALUATING WIND-DEFORMED GAUSSIAN PROCESS KERNELS FOR IMMISSION MODELLING 130 P. Tremper
EXPERIMENTAL STUDY ON THE REAL-WORLD POLLUTANT EMISSIONS PERFORMANCE OF LATEST EURO 6D-ISC LIGHT-DUTY VEHICLES 131 G. Triantafyllopoulos
CONCEPTS FOR A SUSTAINABLE URBAN ROAD OF THE FUTURE: A SYSTEMATIC REVIEW 132 S. Tsigdinos
REDUCING PERSONAL EXPOSURE OF RECREATIONAL RUNNERS TO AIRBORNE PARTICLES IN URBAN ENVIRONMENTS 133 M. Viana
IMPACT OF WILDFIRES ON AIRBORNE PARTICULATE MATTER IN THE IBERIAN PENINSULA 134 M. Viana
AIR POLLUTANTS MEASURED AROUND STUTTGART AIRPORT WITH AND WITHOUT AIR TRAFFIC DUE TO A TEMPORAL SHUTDOWN OF THE AIRPORT 135 U. Vogt
AEROSOL PHASES FROM DIFFERENT TRANSPORTATION SOURCES AND THEIR RELATION TO TOXICOLOGY 136 I. Vouitsis
GLOBAL HEALTH BURDEN BY DUST AND POLLUTION PM2.5 137 A. Yang
HEAT EFFECTS ON MORTALITY MODIFIED BY AIR POLLUTION IN ATHENS METROPOLITAN AREA, GREECE 138 S. Zafeiratou
SHORT-TERM EFFECTS OF ULTRAFINE PARTICLES ON HEART RATE VARIABILITY: A SYSTEMATIC REVIEW AND META-ANALYSIS 139 S. Zhang
SHORT-TERM EFFECTS OF HEAT ON CARDIOPULMONARY MORTALITY MODIFIED BY AIR POLLUTION: RESULTS FROM THE NORWEGIAN CONOR COHORT 140 S. Zhang
AIR QUALITY MODELLING OVER THE WEST MIDLANDS, UK: APPLICATION OF THE MAQS-HEALTH SYSTEM 141 J. Zhong

POSTER PRESENTATIONS
MULTI-ANTIBIOTIC RESISTANCE BACTERIA IN LANDFILL BIOAEROSOLS: A STUDY CASE IN AN INDUSTRIAL CARIBBEAN CITY OF COLOMBIA 143 D. Agudelo-
IMPACT OF URBAN AIR QUALITY ON HEALTH STUDIED AT THE LABORATORY: THE POLLURISK PLATFORM 144 E.A. Marj
MODEL VERIFICATION OVER FOUR CITIES IN SERBIA USING TAYLOR DIAGRAMS 145 N. Aleksandrov
IMPROVING WRF MODEL PERFORMANCE FOR EUROPEAN COASTAL REGIONS: CONTRIBUTION TO THE H2020 EMERGE PROJECT 146 U. Alyuz
A META-ANALYSIS ON THE ROLE OF EXPOSURE TO FIRE SMOKE ON FIREFIGHTERS LUNG FUNCTION 147 J.V. Barbosa
CFD DISPERSSION MODELLING OF SHIP EMISSIONS IN THE PORT OF MARSEILLE 148 C.K. Boikos
REAL WORLD PERFORMANCE OF LOW-COST SENSORS DEVICES FOR INDOOR AIR PARTICULATE MATTER MONITORING 149 H. Chojer
IMPACT OF URBAN AIR QUALITY ON HEALTH STUDIED AT THE LABORATORY WITH THE POLLURISK PLATFORM: PRELIMINARY RESULTS OF INNOVATIVE STUDIES AT THE LABORATORY 150 P. Coll
SIMBAD: A SIMPLIFIED MODEL FOR THE EVALUATION OF AIR QUALITY REMEDIATION POLICIES 151 M.P. Costa
NEW PARTICLE FORMATION OBSERVED IN THE CLOSE VICINITY OF A FRENCH MEGALOPOLE 152 S. Crumeyrolle
ENVIRONMENTAL EFFECTS OF MERCURY EMISSIONS FROM ATHABASCA OIL SANDS DEVELOPMENT (ALBERTA, CANADA) 153 A. Dastoor
IMPACT OF METEOROLOGICAL CONDITIONS ON AMBIENT FINE PARTICULATE MATTER (PM2.5) IN THE CITY OF NOVI SAD, SERBIA 154 N
ASSESSMENT AND PROFILING OF FINE AND ULTRAFINE PARTICULATE MATTER IN LUCKNOW CITY WITH PARTICULAR EMPHASIS ON INDOOR ENVIRONMENT 155 S. Dwivedi
SYNTHESIS OF SUSTAINABLE FUELS BY HETEROGENEOUSLY CATALYZED OLIGOMERIZATION OF RENEWABLE C2-C4 OLEFINS 156 C. Fuchs
DEVELOPMENT OF AIR QUALITY BOXES BASED ON LOW-COST SENSOR TECHNOLOGY FOR AMBIENT AIR QUALITY MONITORING 157 P
ESTIMATION OF UNKNOWN SOURCE PARAMETERS IN URBAN DOMAIN 158 P. Gkirmpas
AIR QUALITY MANAGEMENT POLICIES ASSESSMENT METHODOLOGY FOR THE GUADALAJARA METROPOLITAN AREA IN MEXICO 159 E. A. Egurrola-
UNVEILING ATMOSPHERIC EMISSIONS FROM CONSTRUCTION SITES 160 H. Grythe
SIMULATION OF POLLUTANT DISPERSION IN AN URBAN ENVIRONMENT 161 G. Ioannides
SUGARS TOWARDS REDUCING CO2 EMISSIONS 162 S. Ioannidou
DETERMINING RISK FROM AIR POLLUTION USING HIGH RESOLUTION MOBILE PHONE AND CONCENTRATION DATA 163B. Kelly
URBAN CHARACTERISTICS DEFINING THE SPATIAL VARIATION OF AIR QUALITY IN DOWNTOWN NANJING 164 T.V. Kokkonen
PARTICLE EMISSIONS OF A HYBRID AND A CNG VEHICLE: FOCUS ON URBAN ROUTES AND THE COLD-START PHASE 165 A. Kontses
USEFULNESS OF TREE SPECIES AS URBAN HEALTH INDICATORS 166 E. Simon
STUDYING THE AIR POLLUTION IN BANGALORE 167 M.A. Lokoshchenko
WHEN WOOD BURNING IN SECONDARY HOMES AFFECTS PROXIES FOR HEATING EMISSIONS 168 S. Lopez-Aparicio
ESTIMATION OF REAL-WORLD EMISSIONS FROM CARS USING BOOSTED REGRESSION TREE MODELS 169 S. Mahesh

TOTAL COLUMN AVERAGED MIXING RATIOS OF CO OVER THESSALONIKI, GREECE, USING A PORTABLE EM27/SUN FTIR SPECTROMETER AND TROPOMI OBSERVATIONS: A FIRE EPISODE CASE STUDY DURING SUMMER 2021 170 M. Mermigkas
PROBABLE HEALTH RISK ASSESSMENT OF BTEX CONCENTRATIONS AT AN INTERNATIONAL AIRPORT IN SOUTH AFRICA 171 R. Moolla
IMPACT ON THE AIR QUALITY FROM THE LARGE WASTE FIRE IN BOTKYRKA, SWEDEN 172 M. Norman
HEALTH AND ECONOMIC BURDEN OF SHIP-RELATED PM2.5 IN PORTUGUESE PORT CITIES 173 R.A.O. Nunes
SPATIO-TEMPORAL MAPPING AND ASSESSMENT OF SO2 LED AIR POLLUTION OVER MEGACITY DELHI, INDIA USING TROPOMI DATA 174 R . Oza
INFLUENCE OF THE STARTUP TIME FROM INITIAL CONDITIONS IN MODELING VOLCANIC ASH DISPERSION IN ECUADOR 175 R. Parra
UPDATED BLACK CARBON EMISSIONS ESTIMATE FROM FLARING IN RUSSIA IN 2012-2020 176 V.V. Paunu
LONG-TERM TENDENCIES OF CARBON MONOXIDE IN THE ATMOSPHERE OF THE MOSCOW MEGAPOLIS 177 V.S. Rakitin
INLAND SHIPPING EMISSION IMPACTS ON URBAN AIR QUALITY IN WESTERN-EUROPE CURRENT & FUTURE FLEET EMISSION SCENARIOS BASED ON REAL-WORLD EMISSION FACTORS 178 M.O.P. Ramacher
IMPACT OF WIND SPEED IN GAS DEPOSITION ON SEA SURFACE FROM SHIPPING 179 N. Rapkos
CASE STUDY: QUANTIFYING COARSE DUST ABATEMENT MEASURES IMPLEMENTED AT JURA CEMENT FACTORY (SWITZERLAND) USING PASSIVE SAMPLERS 180 J. Rausch
DEVELOPMENT OF AN AIR POLLUTANT EMISSIONS INVENTORY AND MODELING FRAMEWORK FOR AIR QUALITY CONTROL MEASURES IN LAGOS, NIGERIA 181 A. Resovsky
SELF-WESTERN MACEDONIA AREA, GREECE DURING THE PANDEMIC PERIOD 182 I.A. Sakellaris
SMART MOBILITY ESTIMATIONS AND INTELLIGENT AQ MONITORING FOR THE SUPPORT OF GREEN MOBILITY 183 J.M. Salanova
GHG AND POLLUTANT EMISSIONS MAPPING ON GEOTHERMAL SITES 184 P. Schiffmann
THE ROLE OF DPF REGENERATION EVENTS ON POLLUTANT EMISSIONS OF A EURO 6D-TEMP PASSENGER VEHICLE 185 Z. Toumasatos
GRANULOMETRY OF TIRE AND ROAD WEAR PARTICLES EMISSIONS ACCORDING TO DIFFERENT ROUTES 186 X.T. Truong
SPATIO-TEMPORAL MAPPING AND ASSESSMENT OF NO2 LED AIR POLLUTION OVER MEGACITY DELHI, INDIA USING TROPOMI DATA 187 A. Vaghela
AIR QUALITY MONITORING IN ATHLETICS STADIUMS: CAN LOW-COST SENSOR TECHNOLOGIES SUPPORT GUIDANCE FOR INTERNATIONAL COMPETITIONS? 188 M. Viana

ORAL SESSIONS
SOURCE APPORTIONMENT OF PM10, PM1 AND OXIDATIVE POTENTIAL: A FOCUS ON NON-EXHAUST
EMISSIONS
A. Albarracin (1), V. Moreno (1), A Karanasiou (1), B. Van Drooge (1) F. Kelly (2), A. Oliete(2) F. Lucarelli (3) G. Pazzi (3)
and F. Amato (1).
(1) Institute of Environmental Assessment and Water Research, Spain (IDAEA-CSIC), (2) Imperial College London, United
Kingdom, (3) University of Florence
Presenting author email: [email protected]
Summary
This study aims to resolve separated non-exhaust source contributions to ambient air PM10 and PM1 in the city of Barcelona.
The innovative aspect of this project (NEXT) approach is to combine state-of-the-art toxicological assays on oxidative
potential with unprecedented source apportionment, providing concurrent estimates (per µg/m3) from different non-exhaust
source contributions, rather than from an overall one or from elements (which are the originated from multiple source
contributions), and compare them with other sources allocated in Barcelona (primary exhaust, secondary exhaust, shipping,
Saharan dust, metallurgy, building activities, sea salt, regional aerosols). The results will allow for a prioritization of
recommendations towards those non-exhaust sources more responsible for PM mass and/or toxicity.
Introduction
The evidence for adverse health effects of ambient air pollution has grown dramatically in the past 20 years. The Global
Burden of Disease study ranked exposure to ambient fine particulate matter (PM) as the seventh most important risk factor
for premature deaths, causing 4.2 million deaths per year globally and as the fifth-largest contributor in East Asia (OECD,
2017; Wang et al., 2016).
Road traffic has been pointed as one of the most harmful source categories in multi-pollutants epidemiological studies
(WHO, 2013), but road traffic sector comprises several different emission processes: exhaust (from combustion engines) and
non-exhaust (which consists of brake, tire and road wear and resuspension of road dust). The relative impact on air quality
and the health of each source is unknown and so the different measures to reduce these impacts. Non-exhaust emissions, have
been steadily growing as a share of total PM10 and PM1 emissions and concentrations, representing now the dominant
source of PM from traffic.
The objectives of this study are to separate non-exhaust source contributions to PM10, PM1, and oxidative potential, among
other sources of PM in Barcelona.
Methodology and Results
We performed one intensive (Spring 2021) measurement campaign at two urban ground sites: one background site “Palau
Reial” and one traffic site “Eixample” both belonging to the local official air quality network. We combined high size-
resolved PM speciation using the new Electrical Low-Pressure Impactor (ELPI+,) with the high time-resolved (1-hour) PM
speciation using the STRAS sampler an advanced version of the Streaker sampler (Amato et al., 2010 and 2014), now able to
separate sub-micrometric from super-micrometric particles and to analyse not only elements concentrations (by means of
Proton-Induced-X-ray-Emission). In addition, we performed inorganic speciation PM10 and PM1 samples for high volume
samplers on a 24 hours resolution (OC-EC Method, ions).
PM1 and PM10 samples will be incubated at blood temperature for 4h with synthetic RTLF solutions containing physiologic
concentrations of three antioxidants naturally present at the surface of the lung i.e. ascorbate, urate and reduced glutathione.
Multi-elemental analysis of the aqueous extracts with ICP-MS will enable the estimation of physiologically soluble (bio-
accessible) concentrations of a range of elements in a simulated lung environment. Where relevant, speciation analysis of
aqueous samples using anion exchange HPLC in-line with ICP-MS will focus on relevant redox-sensitive pollutants e.g. Sb,
Cr, As. The remaining amounts of urate and ascorbate will be determined by reversed-phase HPLC with electrochemical
detection, based on a modified method after Iriyama et al. (1984). PM OP is then calculated as the percentage loss of
antioxidants after the incubation period. The source apportionment is performed by means of Positive Matrix Factorization
(PMF) using the EPA PMF version 5 software.
Conclusions
The laboratory analysis is currently ongoing. We expect to obtain hourly and daily contributions and size segregated (14
stages) for brake wear, tyre wear, road wear, and road dust resuspension (among other sources) to PM1, PM10 and oxidative
potential (only daily).
Acknowledgment
This work was funded by the Spanish Ministry of Science and Innovation (Project number: PID2019-110623RB-I00). The
authors acknowledge Agència de Salut Pública de Barcelona and Generalitat de Catalunya for the logistic support.
References
Amato et al., 2014. Environmental Science and Technology, 48, 14, 8069-8077
Amato et al., 2010. Science of the Total Environment, 408 (20), pp. 4309-4318.
Amato, 2018. 1st ed. SAN DIEGO: Elsevier. 330 p.
OECD, 2017. Health at a glance 2017: OECD Indicators. OECD Publishing. 2017. 210 p.
Iriyama et al., 1984. Anal Biochem 141, 238–243
Wang et al., 2017. Journal of Automobile Engineering, 231/10, 1326-1339
World Health Organization, 2013. Review of evidence on health aspects of air pollution.
2
NEW LAGRANGIAN AIR POLLUTION MODEL FOR DENMARK
C. Andersen (1), M. Ketzel (1), O. Hertel (2), J. Brandt (1)
(1) Aarhus University, Department of Environmental Science, Roskilde, Denmark (2) Aarhus University, Department of Ecoscience, Roskilde, Denmark
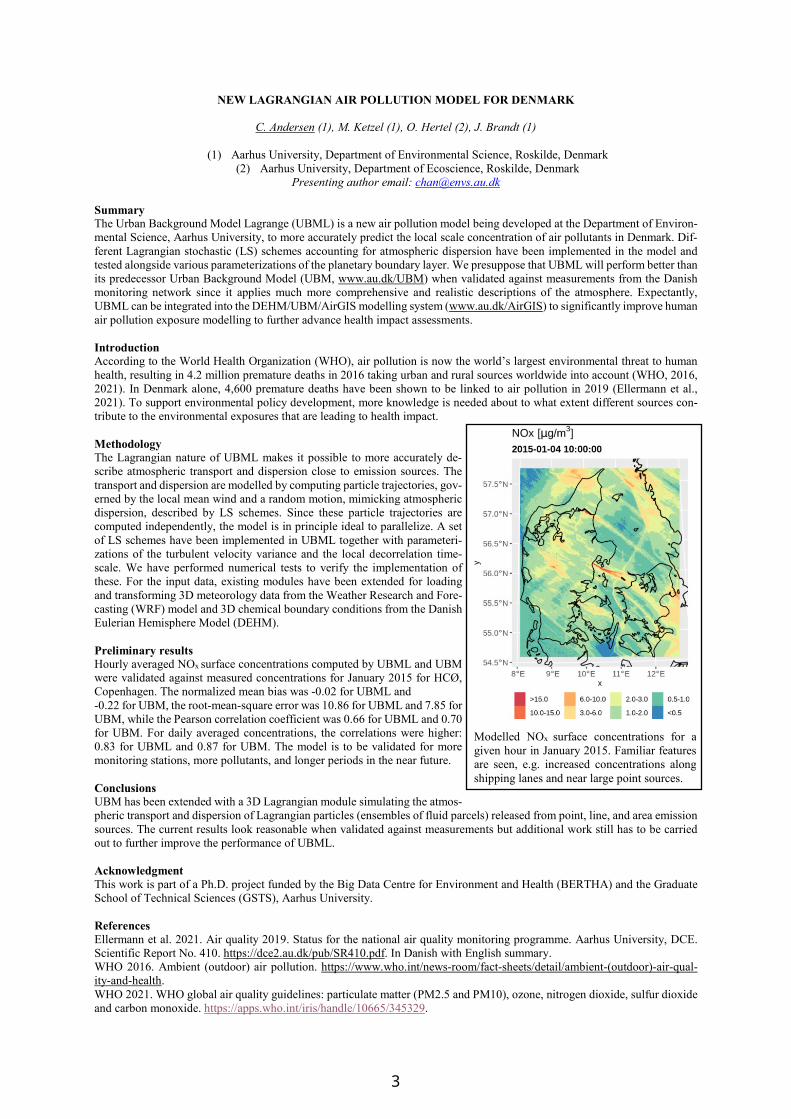
Presenting author email: [email protected] Summary The Urban Background Model Lagrange (UBML) is a new air pollution model being developed at the Department of Environ-mental Science, Aarhus University, to more accurately predict the local scale concentration of air pollutants in Denmark. Dif-ferent Lagrangian stochastic (LS) schemes accounting for atmospheric dispersion have been implemented in the model and tested alongside various parameterizations of the planetary boundary layer. We presuppose that UBML will perform better than its predecessor Urban Background Model (UBM, www.au.dk/UBM) when validated against measurements from the Danish monitoring network since it applies much more comprehensive and realistic descriptions of the atmosphere. Expectantly, UBML can be integrated into the DEHM/UBM/AirGIS modelling system (www.au.dk/AirGIS) to significantly improve human air pollution exposure modelling to further advance health impact assessments. Introduction According to the World Health Organization (WHO), air pollution is now the world’s largest environmental threat to human health, resulting in 4.2 million premature deaths in 2016 taking urban and rural sources worldwide into account (WHO, 2016, 2021). In Denmark alone, 4,600 premature deaths have been shown to be linked to air pollution in 2019 (Ellermann et al., 2021). To support environmental policy development, more knowledge is needed about to what extent different sources con-tribute to the environmental exposures that are leading to health impact. Methodology The Lagrangian nature of UBML makes it possible to more accurately de-scribe atmospheric transport and dispersion close to emission sources. The transport and dispersion are modelled by computing particle trajectories, gov-erned by the local mean wind and a random motion, mimicking atmospheric dispersion, described by LS schemes. Since these particle trajectories are computed independently, the model is in principle ideal to parallelize. A set of LS schemes have been implemented in UBML together with parameteri-zations of the turbulent velocity variance and the local decorrelation time-scale. We have performed numerical tests to verify the implementation of these. For the input data, existing modules have been extended for loading and transforming 3D meteorology data from the Weather Research and Fore-casting (WRF) model and 3D chemical boundary conditions from the Danish Eulerian Hemisphere Model (DEHM). Preliminary results Hourly averaged NOx surface concentrations computed by UBML and UBM were validated against measured concentrations for January 2015 for HCØ, Copenhagen. The normalized mean bias was -0.02 for UBML and -0.22 for UBM, the root-mean-square error was 10.86 for UBML and 7.85 for UBM, while the Pearson correlation coefficient was 0.66 for UBML and 0.70 for UBM. For daily averaged concentrations, the correlations were higher: 0.83 for UBML and 0.87 for UBM. The model is to be validated for more monitoring stations, more pollutants, and longer periods in the near future. Conclusions UBM has been extended with a 3D Lagrangian module simulating the atmos-pheric transport and dispersion of Lagrangian particles (ensembles of fluid parcels) released from point, line, and area emission sources. The current results look reasonable when validated against measurements but additional work still has to be carried out to further improve the performance of UBML. Acknowledgment This work is part of a Ph.D. project funded by the Big Data Centre for Environment and Health (BERTHA) and the Graduate School of Technical Sciences (GSTS), Aarhus University. References Ellermann et al. 2021. Air quality 2019. Status for the national air quality monitoring programme. Aarhus University, DCE. Scientific Report No. 410. https://dce2.au.dk/pub/SR410.pdf. In Danish with English summary. WHO 2016. Ambient (outdoor) air pollution. https://www.who.int/news-room/fact-sheets/detail/ambient-(outdoor)-air-qual-ity-and-health. WHO 2021. WHO global air quality guidelines: particulate matter (PM2.5 and PM10), ozone, nitrogen dioxide, sulfur dioxide and carbon monoxide. https://apps.who.int/iris/handle/10665/345329.
Modelled NOx surface concentrations for a given hour in January 2015. Familiar features are seen, e.g. increased concentrations along shipping lanes and near large point sources.
3
AIR QUALITY AND GREENHOUSE GASES IN THE SAO PAULO MEGACITY:
INTEGRATED NETWORK.
M.F. Andrade, E.D. Freitas, M. Gavidia-Calderon, C. E. Souto-Oliveira, T. Nogueira, A. Forcetto & M. T. A. Marques
Atmospheric Sciences Department, University of Sao Paulo, São Paulo, Brazil.
Presenting author email: [email protected] Summary
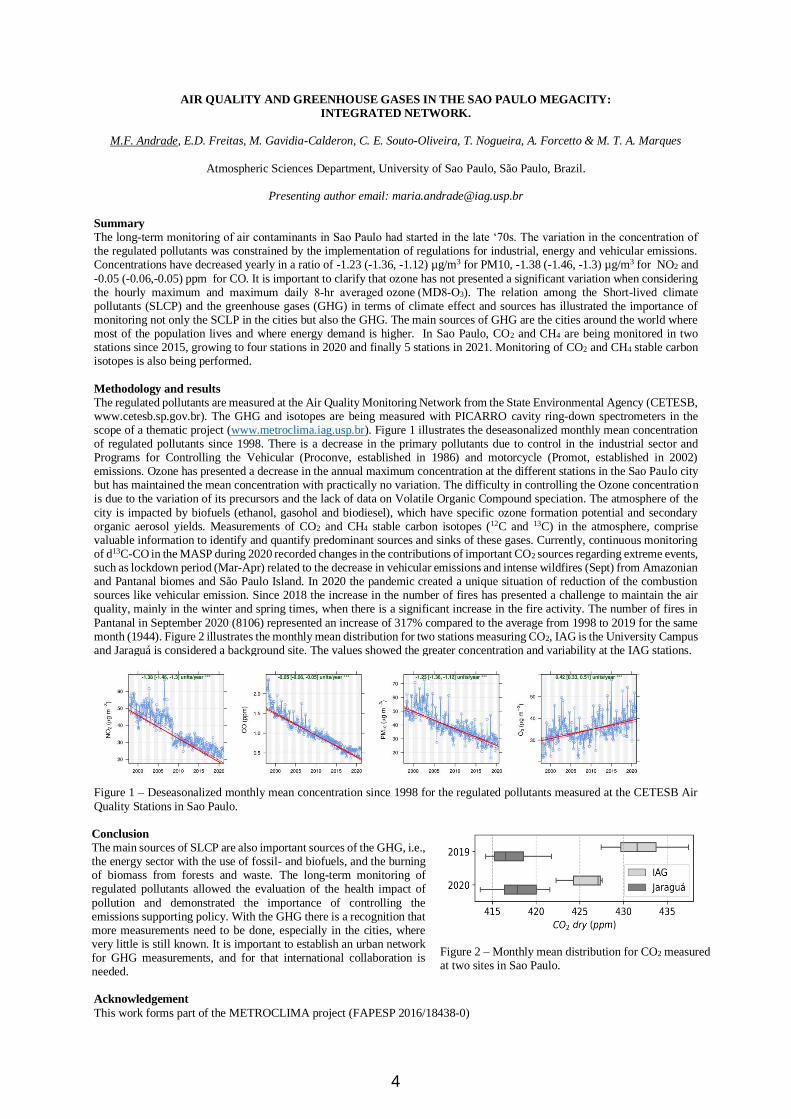
The long-term monitoring of air contaminants in Sao Paulo had started in the late ‘70s. The variation in the concentration of the regulated pollutants was constrained by the implementation of regulations for industrial, energy and vehicular emissions. Concentrations have decreased yearly in a ratio of -1.23 (-1.36, -1.12) µg/m3 for PM10, -1.38 (-1.46, -1.3) µg/m3 for NO2 and
-0.05 (-0.06,-0.05) ppm for CO. It is important to clarify that ozone has not presented a significant variation when considering the hourly maximum and maximum daily 8‐hr averaged ozone (MD8‐O3). The relation among the Short-lived climate pollutants (SLCP) and the greenhouse gases (GHG) in terms of climate effect and sources has illustrated the importance of monitoring not only the SCLP in the cities but also the GHG. The main sources of GHG are the cities around the world where most of the population lives and where energy demand is higher. In Sao Paulo, CO2 and CH4 are being monitored in two stations since 2015, growing to four stations in 2020 and finally 5 stations in 2021. Monitoring of CO2 and CH4 stable carbon isotopes is also being performed.
Methodology and results
The regulated pollutants are measured at the Air Quality Monitoring Network from the State Environmental Agency (CETESB, www.cetesb.sp.gov.br). The GHG and isotopes are being measured with PICARRO cavity ring-down spectrometers in the scope of a thematic project (www.metroclima.iag.usp.br). Figure 1 illustrates the deseasonalized monthly mean concentration of regulated pollutants since 1998. There is a decrease in the primary pollutants due to control in the industrial sector and Programs for Controlling the Vehicular (Proconve, established in 1986) and motorcycle (Promot, established in 2002) emissions. Ozone has presented a decrease in the annual maximum concentration at the different stations in the Sao Paulo city but has maintained the mean concentration with practically no variation. The difficulty in controlling the Ozone concentration is due to the variation of its precursors and the lack of data on Volatile Organic Compound speciation. The atmosphere of the
city is impacted by biofuels (ethanol, gasohol and biodiesel), which have specific ozone formation potential and secondary organic aerosol yields. Measurements of CO2 and CH4 stable carbon isotopes (12C and 13C) in the atmosphere, comprise valuable information to identify and quantify predominant sources and sinks of these gases. Currently, continuous monitoring of d13C-CO in the MASP during 2020 recorded changes in the contributions of important CO2 sources regarding extreme events, such as lockdown period (Mar-Apr) related to the decrease in vehicular emissions and intense wildfires (Sept) from Amazonian and Pantanal biomes and São Paulo Island. In 2020 the pandemic created a unique situation of reduction of the combustion sources like vehicular emission. Since 2018 the increase in the number of fires has presented a challenge to maintain the air quality, mainly in the winter and spring times, when there is a significant increase in the fire activity. The number of fires in
Pantanal in September 2020 (8106) represented an increase of 317% compared to the average from 1998 to 2019 for the same month (1944). Figure 2 illustrates the monthly mean distribution for two stations measuring CO2, IAG is the University Campus and Jaraguá is considered a background site. The values showed the greater concentration and variability at the IAG stations.
Figure 1 – Deseasonalized monthly mean concentration since 1998 for the regulated pollutants measured at the CETESB Air
Quality Stations in Sao Paulo.
Acknowledgement
This work forms part of the METROCLIMA project (FAPESP 2016/18438-0)
Conclusion
The main sources of SLCP are also important sources of the GHG, i.e., the energy sector with the use of fossil- and biofuels, and the burning of biomass from forests and waste. The long-term monitoring of regulated pollutants allowed the evaluation of the health impact of
pollution and demonstrated the importance of controlling the emissions supporting policy. With the GHG there is a recognition that more measurements need to be done, especially in the cities, where very little is still known. It is important to establish an urban network for GHG measurements, and for that international collaboration is needed.
Figure 2 – Monthly mean distribution for CO2 measured at two sites in Sao Paulo.
4
The effect of air pollution on respiratory health outcomes when modified by air temperature: a systematic review and
meta-analysis.
A. T Areal (1), Q. Zhao (1,2), C. Wigmann (1), A. Schneider (3), and T. Schikowski (1).
(1) Department of Epidemiology, IUF-Leibniz Research Institute for Environmental Medicine, Düsseldorf, Germany;
(2) Department of Epidemiology, School of Public Health, Cheeloo College of Medicine, Shandong University, Jinan, China;
(3) Institute of Epidemiology, Helmholtz Zentrum München – German Research Center for Environmental Health (GmbH),
Neuherberg, Germany
Presenting author email: [email protected]
Summary
This review aimed to assess evidence on the effects of air pollution on respiratory mortality and respiratory hospital admissions
when modified by air temperature. The Preferred Reporting items for Systematic reviews and Meta-Analyses (PRISMA)
guidelines were used to ensure that literature was fully and accurately assessed. We performed a meta-analysis to assess the
strength of evidence available by using random-effects models to account for within- and between-study heterogeneity. We
found that both PM10 and O3 were associated with an increased odds of respiratory hospital admissions and mortality when
modified by high temperatures; however, our analysis found that the effects of PM10 and O3 respectively, when modified by
low temperatures were not statistically significant. This study shows that air pollution when modified by temperature affects
respiratory health outcomes differently. As this is a relatively new field of study, further research is required to establish a
conclusion on the strength and direction that the combined effect of air pollution and temperature has on respiratory health.
Introduction
Air pollution and temperature are in a continuous feedback loop; air pollution is largely influenced by meteorological variables
such as temperature, while increased concentrations of air pollutants in the atmosphere lead to an increase in global
temperatures (1). This feedback loop contributes to climate change, which then directly and indirectly affects several facets of
human life such as human health. With approximately seven million people dying due to air pollution exposure every year, and
approximately 5 million people dying due to suboptimal temperatures, air pollution and suboptimal temperature represent two
of the biggest risks to health. While the effects of air pollution on cardiovascular disease when modified by air temperature
have been extensively studied, respiratory disease - a leading cause of mortality and morbidity - has not.
Method
We identified 26,656 papers in PubMed and Web of Science, up to the 31st March 2021, and selected 34 for analysis. Inclusion
criteria included observational studies with short-term air pollution effects modified by temperature, and outcomes defined
according to the International Classification of Diseases (ICD) 9 [codes: 460-519] and/or 10 [codes: J00-J99]. Air pollutants
considered were particulate matter with a diameter <10µm (PM10), ozone (O3), and nitrogen dioxide (NO2). A random-effects
model was used for our meta-analysis.
Results
For respiratory mortality we found that an increased pooled Odds Ratio (OR, 95% CI) of 1.019 (1.010-1.028), for the effect of
PM10 modified by high temperatures, and for the effect of O3 during the warm season the pooled OR was 1.007 (1.002-1.011).
For hospital admissions, the effects of PM10 and O3 during the warm season resulted in increased pooled ORs of 1.013 (1.005-
1.020), and 1.011 (1.005-1.020), respectively. Our results for the modification by low temperatures were not statistically
significant.
Conclusions
Exposure to air pollution when modified by high temperature indicated an adverse effect on respiratory hospital admissions
and mortality, whereas the modification by low temperatures did not. This was most prominent for both O3 and PM10
respectively. Analysis on the interactive effects of air pollution and temperature on health outcomes is a relatively new research
field and results are so far largely inconsistent; therefore, further research is encouraged to establish a more decisive conclusion
on the strength and direction of these effects.
Acknowledgments
We would like to thank Dr. Ute Kraus for her advice and assistance.
References
(1) Orru, H., Ebi, KL., Forsberg, B., 2017. The Interplay of Climate Change and Air Pollution on Health. Current
Environmental Health Reports. 143(5), 504-513.
5
DOWNSCALING MODELLING OF GROUND-LEVEL OZONEC. Asker(1), C. Andersson (1) and D. Segersson (1)
(1) Swedish Meteorological and Hydrological Institute (SMHI), SE-60176, Norrköping, SwedenPresenting author email: [email protected]
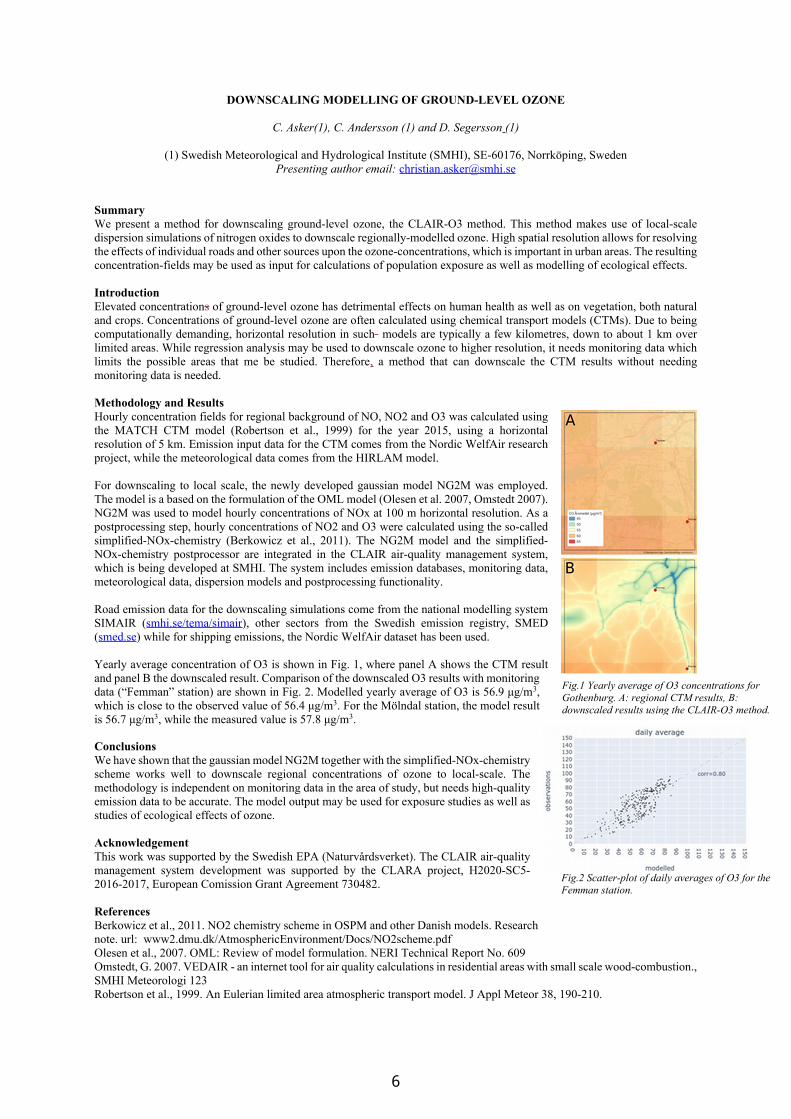
SummaryWe present a method for downscaling ground-level ozone, the CLAIR-O3 method. This method makes use of local-scaledispersion simulations of nitrogen oxides to downscale regionally-modelled ozone. High spatial resolution allows for resolvingthe effects of individual roads and other sources upon the ozone-concentrations, which is important in urban areas. The resultingconcentration-fields may be used as input for calculations of population exposure as well as modelling of ecological effects.IntroductionElevated concentrations of ground-level ozone has detrimental effects on human health as well as on vegetation, both naturaland crops. Concentrations of ground-level ozone are often calculated using chemical transport models (CTMs). Due to beingcomputationally demanding, horizontal resolution in such models are typically a few kilometres, down to about 1 km overlimited areas. While regression analysis may be used to downscale ozone to higher resolution, it needs monitoring data whichlimits the possible areas that me be studied. Therefore, a method that can downscale the CTM results without needingmonitoring data is needed.Methodology and ResultsHourly concentration fields for regional background of NO, NO2 and O3 was calculated usingthe MATCH CTM model (Robertson et al., 1999) for the year 2015, using a horizontalresolution of 5 km. Emission input data for the CTM comes from the Nordic WelfAir researchproject, while the meteorological data comes from the HIRLAM model.For downscaling to local scale, the newly developed gaussian model NG2M was employed.The model is a based on the formulation of the OML model (Olesen et al. 2007, Omstedt 2007).NG2M was used to model hourly concentrations of NOx at 100 m horizontal resolution. As apostprocessing step, hourly concentrations of NO2 and O3 were calculated using the so-calledsimplified-NOx-chemistry (Berkowicz et al., 2011). The NG2M model and the simplified-NOx-chemistry postprocessor are integrated in the CLAIR air-quality management system,which is being developed at SMHI. The system includes emission databases, monitoring data,meteorological data, dispersion models and postprocessing functionality.Road emission data for the downscaling simulations come from the national modelling systemSIMAIR (smhi.se/tema/simair), other sectors from the Swedish emission registry, SMED(smed.se) while for shipping emissions, the Nordic WelfAir dataset has been used.Yearly average concentration of O3 is shown in Fig. 1, where panel A shows the CTM resultand panel B the downscaled result. Comparison of the downscaled O3 results with monitoringdata (“Femman” station) are shown in Fig. 2. Modelled yearly average of O3 is 56.9 μg/m3,which is close to the observed value of 56.4 μg/m3. For the Mölndal station, the model resultis 56.7 μg/m3, while the measured value is 57.8 μg/m3.ConclusionsWe have shown that the gaussian model NG2M together with the simplified-NOx-chemistryscheme works well to downscale regional concentrations of ozone to local-scale. Themethodology is independent on monitoring data in the area of study, but needs high-qualityemission data to be accurate. The model output may be used for exposure studies as well asstudies of ecological effects of ozone.AcknowledgementThis work was supported by the Swedish EPA (Naturvårdsverket). The CLAIR air-qualitymanagement system development was supported by the CLARA project, H2020-SC5-2016-2017, European Comission Grant Agreement 730482.ReferencesBerkowicz et al., 2011. NO2 chemistry scheme in OSPM and other Danish models. Researchnote. url: www2.dmu.dk/AtmosphericEnvironment/Docs/NO2scheme.pdfOlesen et al., 2007. OML: Review of model formulation. NERI Technical Report No. 609Omstedt, G. 2007. VEDAIR - an internet tool for air quality calculations in residential areas with small scale wood-combustion.,SMHI Meteorologi 123Robertson et al., 1999. An Eulerian limited area atmospheric transport model. J Appl Meteor 38, 190-210.
Fig.1 Yearly average of O3 concentrations forGothenburg. A: regional CTM results, B:downscaled results using the CLAIR-O3 method.
Fig.2 Scatter-plot of daily averages of O3 for theFemman station.
6

URBAN MOBILITY BASED AIR QUALITY MODELLING WITH A CHEMICALTRANSPORT MODEL ON A CITY SCALE VALIDATED BY AIR QUALITY
MONITORING STATIONS – A TEST CASE
J. Backman(1), A. Rebeiro-Hargrave(2), M. Sofiev(1), A. Huertas(2), A. Uppstu(1), S. Varjonen(2), R. Kouznetsov(1),and S. Tarkoma(2)
(1) Atmospheric Composition Research, Finnish Meteorological Institute, Helsinki, Uusimaa, FI-00560, Finland; (2)Department of Computer Science, University of Helsinki, Helsinki, FI-00560, Finland
Presenting author email: j [email protected]
SummaryThis study investigates the feasibility to combine an urban mobility model with a chemical transport model to modelurban air pollution on a city scale. A central part of this approach is that the methodology used should be applicable toany city in the world which means that data sources of information needed to model city scale air pollution needs to behave a global coverage.
IntroductionThe world’s population is increasingly moving into cities and over half of the worlds population is estimated to live inurban areas. This migration will expose an increasing amount of urban dwellers to air pollution that is associated withcities and detrimental to human health and well-being (e.g. Pope and Dockery, 2006). The amount of air pollution canvary greatly from city to city but is almost always higher than in rural areas. In cities, traffic is often the biggest sourcesof air pollution. Traffic is therefore vital when modelling air pollution in an urban environment and is the focus of thisresearch. One challenge of modelling urban air pollution is that global emission inventories do not exist in a high enoughthe level of detail to resolve city scale features. Global emission inventories are at tens of kilometres scale at best, whichis far too coarse to be useful on a city scale. To be able to model air pollution in a city, emissions in the form of the city’sroad network is needed at a high spatial resolution;much higher resolution than regional emissioninventories have.
Methodology and ResultsIn this work we present the use of two models, onemodel simulating traffic providing city scale trafficemissions, and one chemical transport model to translatethe emissions into urban air quality. Traffic is modelledusing the Simulator of Urban Mobility (SUMO) modelthat is used to generate emissions for the chemicaltransport model. The SUMO model uses the global datasource of Open Street Map (OSM) to generate trafficpatterns and ultimately emissions. OSM coverage isglobal so this method is applicable to any city. Thechemical transport model (CTM) SILAM is used tosimulate urban air quality. It is a global-to-meso scale model which is here run at city scale using input from SUMO. Models need evaluation and so does this setup. The city of Antwerp was chosen as a test case because of the availabilityof high resolution meteorological data, fair amount of air quality measurement stations. As is often the case, air qualitymodels need to be adjusted and/or validated according to measurements. The novelty of this work, in addition tocombining the an urban mobility and CTM model, is the way in which the CTM model is adjusted according to airquality measurements. The adjustment is done by matching the model to the observations using a quantile-quantileapproach. Modelled levels of pollutants are extracted at observation station locations. These modelled observationsbecomes the input for the quantile-quantile model adjustment. The adjustment is done by fitting sigmoid functions to arange of quantiles for both the modelled and measured observations. These fits are then used to interpolate from onedistribution (modelled observatins) to the another (measured observations). This adjustment is then applied to the wholemodel domain.
ConclusionsThese preliminary results are promising. This method can be applied to any city. The adjustment procedure would greatlybenefit from an array of affordable air quality sensors which would expand this method to countries with less expensiveair quality monitoring infrastructure.
AcknowledgementThis work was supported by Business Finland Project 6884/31/2018 MegaSense Smart City.
ReferencesPope C.A., Dockery D.W., 2006. Health Effects of Fine Particulate Air Pollution: Lines that Connect. Journal of Air andWaste Management Association 56, 709-742.
Fig.1 PM2.5 pollution in Antwerp. Air quality stations for model validation and adjustment are shown as dots on the map.
7
HOW GREEN INFRASTRUCTURES IMPACT ON URBAN AIR QUALITY OVER BARCELONA
A. Badia (1), R. Segura (1), S. Ventura (1), V. Vidal (1, 2), G. Villalba (1)
(1) Institute of EnvironmentalScience and Technology (ICTA), Universitat Autònoma de Barcelona (UAB), Cerdanyola delValles, Spain; (2) Departament d'Arquitectura de Computadors i Sistemes Operatius, Universitat Autònoma de Barcelona
(UAB), Cerdanyola del Valles, Spain, Presenting author email: [email protected]
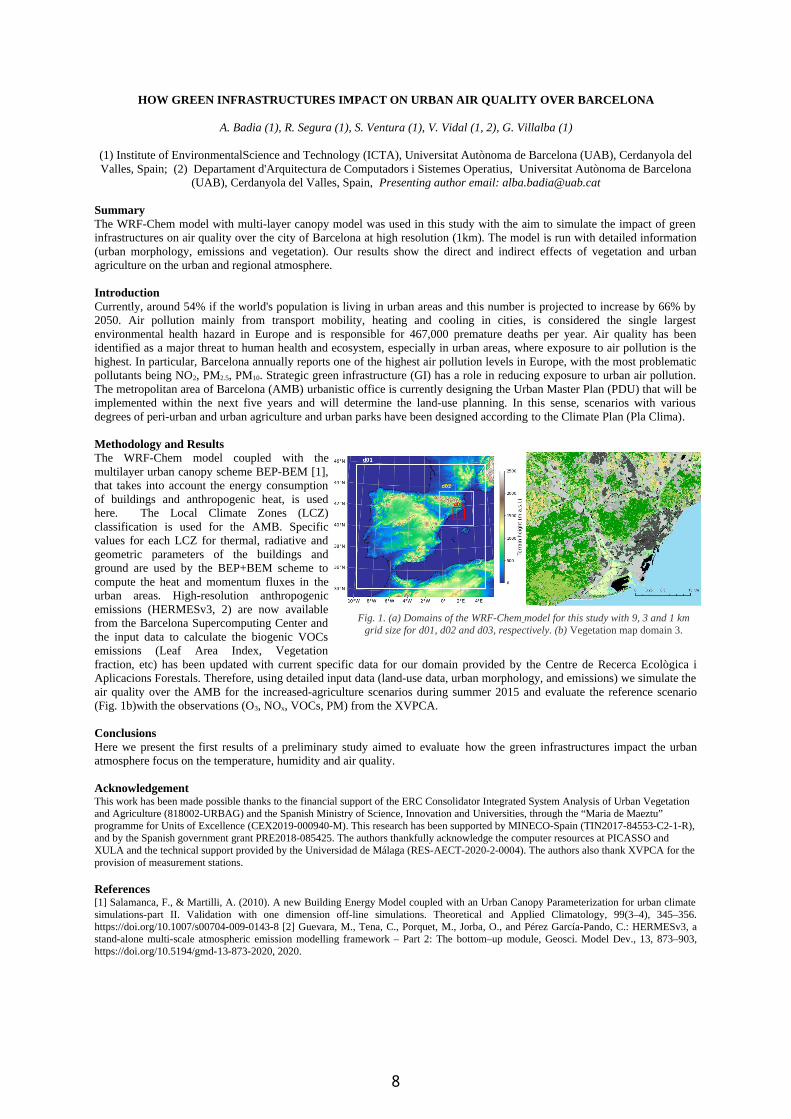
SummaryThe WRF-Chem model with multi-layer canopy model was used in this study with the aim to simulate the impact of greeninfrastructures on air quality over the city of Barcelona at high resolution (1km). The model is run with detailed information(urban morphology, emissions and vegetation). Our results show the direct and indirect effects of vegetation and urbanagriculture on the urban and regional atmosphere.
IntroductionCurrently, around 54% if the world's population is living in urban areas and this number is projected to increase by 66% by2050. Air pollution mainly from transport mobility, heating and cooling in cities, is considered the single largestenvironmental health hazard in Europe and is responsible for 467,000 premature deaths per year. Air quality has beenidentified as a major threat to human health and ecosystem, especially in urban areas, where exposure to air pollution is thehighest. In particular, Barcelona annually reports one of the highest air pollution levels in Europe, with the most problematicpollutants being NO2, PM2.5, PM10. Strategic green infrastructure (GI) has a role in reducing exposure to urban air pollution.The metropolitan area of Barcelona (AMB) urbanistic office is currently designing the Urban Master Plan (PDU) that will beimplemented within the next five years and will determine the land-use planning. In this sense, scenarios with variousdegrees of peri-urban and urban agriculture and urban parks have been designed according to the Climate Plan (Pla Clima).
Methodology and ResultsThe WRF-Chem model coupled with themultilayer urban canopy scheme BEP-BEM [1],that takes into account the energy consumptionof buildings and anthropogenic heat, is usedhere. The Local Climate Zones (LCZ)classification is used for the AMB. Specificvalues for each LCZ for thermal, radiative andgeometric parameters of the buildings andground are used by the BEP+BEM scheme tocompute the heat and momentum fluxes in theurban areas. High-resolution anthropogenicemissions (HERMESv3, 2) are now availablefrom the Barcelona Supercomputing Center andthe input data to calculate the biogenic VOCsemissions (Leaf Area Index, Vegetationfraction, etc) has been updated with current specific data for our domain provided by the Centre de Recerca Ecològica iAplicacions Forestals. Therefore, using detailed input data (land-use data, urban morphology, and emissions) we simulate theair quality over the AMB for the increased-agriculture scenarios during summer 2015 and evaluate the reference scenario(Fig. 1b)with the observations (O3, NOx, VOCs, PM) from the XVPCA.
ConclusionsHere we present the first results of a preliminary study aimed to evaluate how the green infrastructures impact the urbanatmosphere focus on the temperature, humidity and air quality.
AcknowledgementThis work has been made possible thanks to the financial support of the ERC Consolidator Integrated System Analysis of Urban Vegetation and Agriculture (818002-URBAG) and the Spanish Ministry of Science, Innovation and Universities, through the “Maria de Maeztu” programme for Units of Excellence (CEX2019-000940-M). This research has been supported by MINECO-Spain (TIN2017-84553-C2-1-R),and by the Spanish government grant PRE2018-085425. The authors thankfully acknowledge the computer resources at PICASSO and XULA and the technical support provided by the Universidad de Málaga (RES-AECT-2020-2-0004). The authors also thank XVPCA for theprovision of measurement stations.
References[1] Salamanca, F., & Martilli, A. (2010). A new Building Energy Model coupled with an Urban Canopy Parameterization for urban climatesimulations-part II. Validation with one dimension off-line simulations. Theoretical and Applied Climatology, 99(3–4), 345–356.https://doi.org/10.1007/s00704-009-0143-8 [2] Guevara, M., Tena, C., Porquet, M., Jorba, O., and Pérez García-Pando, C.: HERMESv3, astand-alone multi-scale atmospheric emission modelling framework – Part 2: The bottom–up module, Geosci. Model Dev., 13, 873–903,https://doi.org/10.5194/gmd-13-873-2020, 2020.
Fig. 1. (a) Domains of the WRF-Chem model for this study with 9, 3 and 1 kmgrid size for d01, d02 and d03, respectively. (b) Vegetation map domain 3.
8

VEGETATION FIRE AND SMOKE POLLUTION WARNING AND ADVISORY SYSTEM: RESEARCH FOCUS AND
METHODOLOGY
Alexander Baklanov (1), Radenko Pavlovic (2), Daniel Tong (3), Boon Ning Chew (4) and WMO VFSP-WAS team
(1) World Meteorological Organization (WMO), Switzerland
(2) Environment and Climate Change Canada, Canada
(3) George Mason University, USA
(4) Met Service Singapore, Singapore
Presenting author email: [email protected]
Summary
This paper presents the concept of a Vegetation Fire and Smoke Pollution Warning Advisory and Assessment System (VFSP-WAS). It
describes the scientific rationale for the system and provides guidance for addressing the issues of vegetation fire and smoke pollution,
including key research challenges.
Introduction
Vegetation fires release large amounts of particulate matter (PM) and toxic gases including carbon monoxide, nitrogen oxides, and
non-methane organic compounds into the atmosphere. Studies have demonstrated that smoke from vegetation fires is associated with
respiratory and cardiovascular diseases and that exposure to fire pollution represents the highest risk to vulnerable subsets of the
population, i.e., people with pre-existing respiratory or cardiovascular illnesses, infants and the elderly.
Resent evolution and results
Recognizing the need for international coordination of a diverse community dealing with the societal impacts of fires and smoke
pollution, the WMO Global Atmosphere Watch (GAW) Programme has taken the lead with international partners to develop and
implement the Vegetation Fire and Smoke Pollution Warning and Advisory System (VFSP-WAS). The VFSP-WAS is an international
network of research, national operational centres and users organised through regional nodes assisted by national and local centres. It
aims to enhance the ability of countries to deliver timely and quality vegetation fire and smoke pollution forecasts, observations,
information and knowledge to users and supports decision making processes with actionable science.
Research activities are aimed at providing information needed to reduce uncertainty in the forecasting of impacts of smoke from
vegetation fires, including the following priorities:
• Mapping and monitoring of peat burning and other high smoke risk fuel;
• Improvement of fire parameterization in Chemical Transport Models;
• Skill evaluation of climate and fire danger forecasts at synoptic, sub-seasonal and seasonal time-scales;
• Detailed databases of information on fire danger and near real time information on present situation;
• Generation of information products regarding smoke impacts that are user friendly and accessible.
At the current stage two regional VFSP-WAS research and development centers have been established. The first one in Singapore for
the Southeast Asia region. As the second node of VFSP-WAS, the North American Centre aims at building a network of operational
and research centers, such as Environment Canada and Climate Change (ECCC), National Oceanic and Atmospheric Administration
(NOAA), and National Aeronautic Space Agency (NASA) to provide wildfire related information to users in Canada, United States,
and Mexico. They are recommended as prototypes for other national or regional centers.
Conclusions
A high-level summary of ongoing VFSP-WAS activities, including ensemble forecasting and multi-model intercomparison, will be
discussed. Finally, we will provide information on how researchers and users can participate in this new exciting program, such as
interacting with regional centers and joining VFSP-WAS Workgroups in the areas of wildfire emissions, ensemble forecast,
verification, wildfire risk forecast, observations and detection, Arctic and other issues.
9
MEASUREMENTS OF BOUNDARY LAYER VERTICAL PROFILES OF GREENHOUSE GAS MIXING RATIOS
AND PARTICULATE MATTER CONCENTRATIONS USING A TETHERED BALLOON - CASE STUDY FROM
KRAKOW CITY
J. Bartyzel (1), M. Zimnoch (1), P. Sekuła (1), J. Nęcki (1), Ł. Chmura and M. Gałkowski (2)
(1) Faculty of Physics and Applied Computer Science, AGH-University of Science and Technology, 19 Reymonta St,
Krakow, 30-059, Poland Presenting author email: [email protected]
Summary
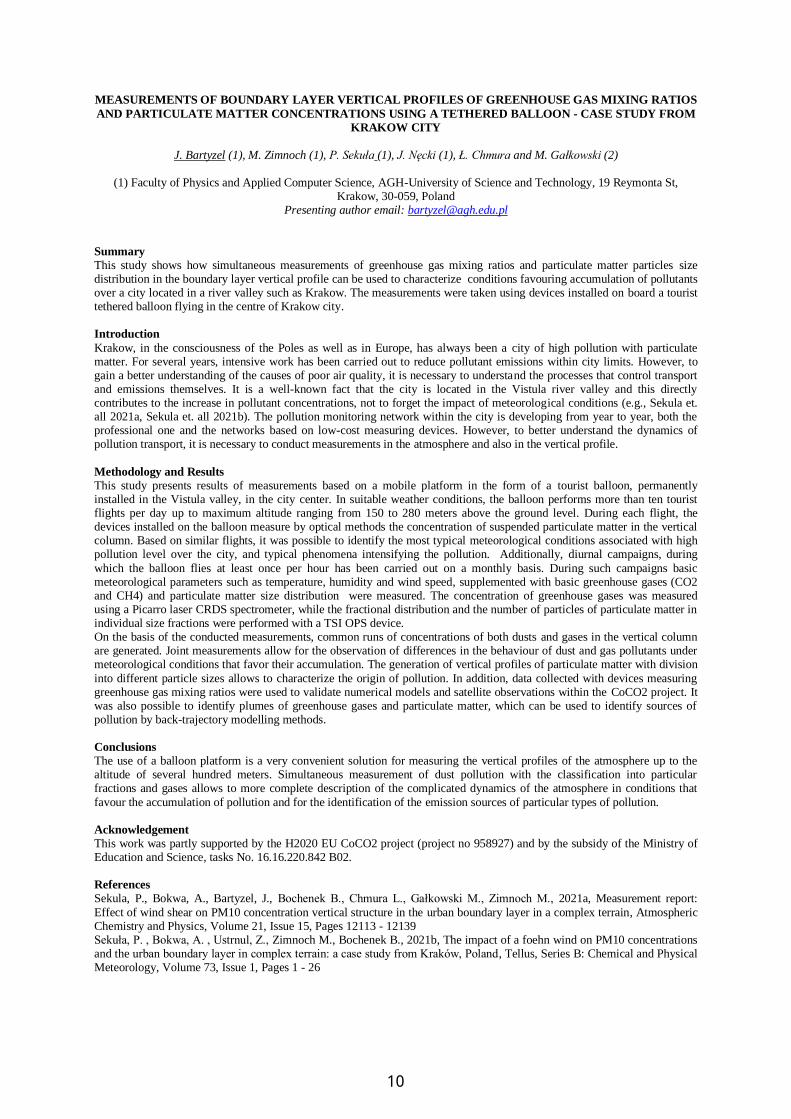
This study shows how simultaneous measurements of greenhouse gas mixing ratios and particulate matter particles size distribution in the boundary layer vertical profile can be used to characterize conditions favouring accumulation of pollutants over a city located in a river valley such as Krakow. The measurements were taken using devices installed on board a tourist tethered balloon flying in the centre of Krakow city. Introduction
Krakow, in the consciousness of the Poles as well as in Europe, has always been a city of high pollution with particulate matter. For several years, intensive work has been carried out to reduce pollutant emissions within city limits. However, to gain a better understanding of the causes of poor air quality, it is necessary to understand the processes that control transport and emissions themselves. It is a well-known fact that the city is located in the Vistula river valley and this directly contributes to the increase in pollutant concentrations, not to forget the impact of meteorological conditions (e.g., Sekula et. all 2021a, Sekula et. all 2021b). The pollution monitoring network within the city is developing from year to year, both the professional one and the networks based on low-cost measuring devices. However, to better understand the dynamics of pollution transport, it is necessary to conduct measurements in the atmosphere and also in the vertical profile.
Methodology and Results
This study presents results of measurements based on a mobile platform in the form of a tourist balloon, permanently installed in the Vistula valley, in the city center. In suitable weather conditions, the balloon performs more than ten tourist flights per day up to maximum altitude ranging from 150 to 280 meters above the ground level. During each flight, the devices installed on the balloon measure by optical methods the concentration of suspended particulate matter in the vertical column. Based on similar flights, it was possible to identify the most typical meteorological conditions associated with high pollution level over the city, and typical phenomena intensifying the pollution. Additionally, diurnal campaigns, during
which the balloon flies at least once per hour has been carried out on a monthly basis. During such campaigns basic meteorological parameters such as temperature, humidity and wind speed, supplemented with basic greenhouse gases (CO2 and CH4) and particulate matter size distribution were measured. The concentration of greenhouse gases was measured using a Picarro laser CRDS spectrometer, while the fractional distribution and the number of particles of particulate matter in individual size fractions were performed with a TSI OPS device. On the basis of the conducted measurements, common runs of concentrations of both dusts and gases in the vertical column are generated. Joint measurements allow for the observation of differences in the behaviour of dust and gas pollutants under meteorological conditions that favor their accumulation. The generation of vertical profiles of particulate matter with division
into different particle sizes allows to characterize the origin of pollution. In addition, data collected with devices measuring greenhouse gas mixing ratios were used to validate numerical models and satellite observations within the CoCO2 project. It was also possible to identify plumes of greenhouse gases and particulate matter, which can be used to identify sources of pollution by back-trajectory modelling methods. Conclusions
The use of a balloon platform is a very convenient solution for measuring the vertical profiles of the atmosphere up to the altitude of several hundred meters. Simultaneous measurement of dust pollution with the classification into particular fractions and gases allows to more complete description of the complicated dynamics of the atmosphere in conditions that
favour the accumulation of pollution and for the identification of the emission sources of particular types of pollution. Acknowledgement
This work was partly supported by the H2020 EU CoCO2 project (project no 958927) and by the subsidy of the Ministry of Education and Science, tasks No. 16.16.220.842 B02. References
Sekula, P., Bokwa, A., Bartyzel, J., Bochenek B., Chmura L., Gałkowski M., Zimnoch M., 2021a, Measurement report:
Effect of wind shear on PM10 concentration vertical structure in the urban boundary layer in a complex terrain, Atmospheric Chemistry and Physics, Volume 21, Issue 15, Pages 12113 - 12139 Sekuła, P. , Bokwa, A. , Ustrnul, Z., Zimnoch M., Bochenek B., 2021b, The impact of a foehn wind on PM10 concentrations and the urban boundary layer in complex terrain: a case study from Kraków, Poland, Tellus, Series B: Chemical and Physical Meteorology, Volume 73, Issue 1, Pages 1 - 26
10

SIMPLIFIED MICROSCALE MODELING METHODOLOGIES FOR URBAN AIR QUALITY
J.G. Bartzis (1), I. A. Sakellaris (1), I. Tolias (2), A. Venetsanos (2)
(1) University of Western Macedonia, Dept. of Mechanical Engineering, Sialvera & Bakola Str., 50100, Kozani, Greece.(2) Environmental Research Laboratory, INRASTES, NCSR Demokritos, Patriarchou Grigoriou & Neapoleos Str., 15310, Aghia
Paraskevi, Greece Presenting author email: [email protected]
Summary The present study main aim is to present and evaluate simplified approaches for microscale air quality modelling in urban environments. The complexity of the problem requires relatively advanced modelling such as CFD. The challenge here is to propose reliable simplified CFD methodologies that can minimize the computational effort making the approach attractive for everyday practice. Such a method is tested here for its validity and prediction capability in a real environment. Introduction The air quality pattern in an urban area is characterized by a relatively high degree of heterogeneity mainly due to the building presence and the associated emissions spatial and temporal variability. The CFD modelling able to resolve geometrical irregularities and emissions nonuniformity seems to be a reasonable choice for primary pollutants concentrations prediction with mild or no chemistry. However, the relatively high computational demand for those models poses an obstacle for using them in the everyday practice. In reducing such a burden simplified methodologies relating excess concentrations to the inverse of wind speed have been applied in the past (Santiago et al. 2020). In the present work such an approximation has been further tested and its limitations are discussed. A more refined methodology along these lines has been applied for the city of Antwerp in the frame of FAIRMODE (Forum for Air quality Modelling – https://fairmode.jrc.ec.europa.eu/) microscale modeling intercomparison exercise.
Methodology and Results The present problem concerns the Antwerp city section and its NO2 concentration differentiation due to traffic emissions. The starting point of the present simplified methodology is the minimal model atmospheric input requirements restricted to a single background meteorological station data able to provide hourly wind speed and direction at a reference(observation) point (VRE, VDIR) as well as atmospheric stability conditions. The past experience in point sources and open spaces have shown that such an input can be enough. In addition, for a given atmospheric stability the concentration seems to be proportional to the inverse of the reference wind speed. In the present work the assumption that this applies also for urban environment has been tested by performing extensive numerical simulations by the CFD RANS model ADREA-HF (Venetsanos et al., 2010). The limits of the approach are also discussed. Results at the 111 sensor positions are shown in Figure 1 for VREF=0.5,1,2,5, and 10 m/s and VDIR = N, S, E and W. For the Antwerp city the model results have been compared with observations giving relatively good results as shown in Figure 2.
Fig. 1 Ref velocity weighted concentrations comparisons Fig. 2 The Antwerp Passive samplers comparisons at the Antwerp samplers positions (VREF=0.5,1,2,5,10m/s VDIR=N, S, E, W) Conclusions The obtained results give further support to the above-mentioned simplified approach for more detailed air quality assessment in urban environments. It is expected the results to be more reliable in the areas where CFD RANS approximation is valid enough.
Acknowledgement The authors are particularly thankful to FAIRMODE initiative and the present data providers. This work was supported by National Strategic Reference Framework (NSRF) project “ Development of New Innovative Low Carbon Energy Technologies to Enhance Excellence in the Region of Western Macedonia”
References Santiago J.L., Borge R., Sanchez B., Quaassdorff C., de la Paz D., Martilli A., Rivas E., Martín F., 2021. Estimates of pedestrian exposure to atmospheric pollution using high-resolution modelling in a real traffic hot-spot. Science of The Total Environment, Volume 755, Part 1, 142475, ISSN 0048-9697, https://doi.org/10.1016/j.scitotenv.2020.142475.
11
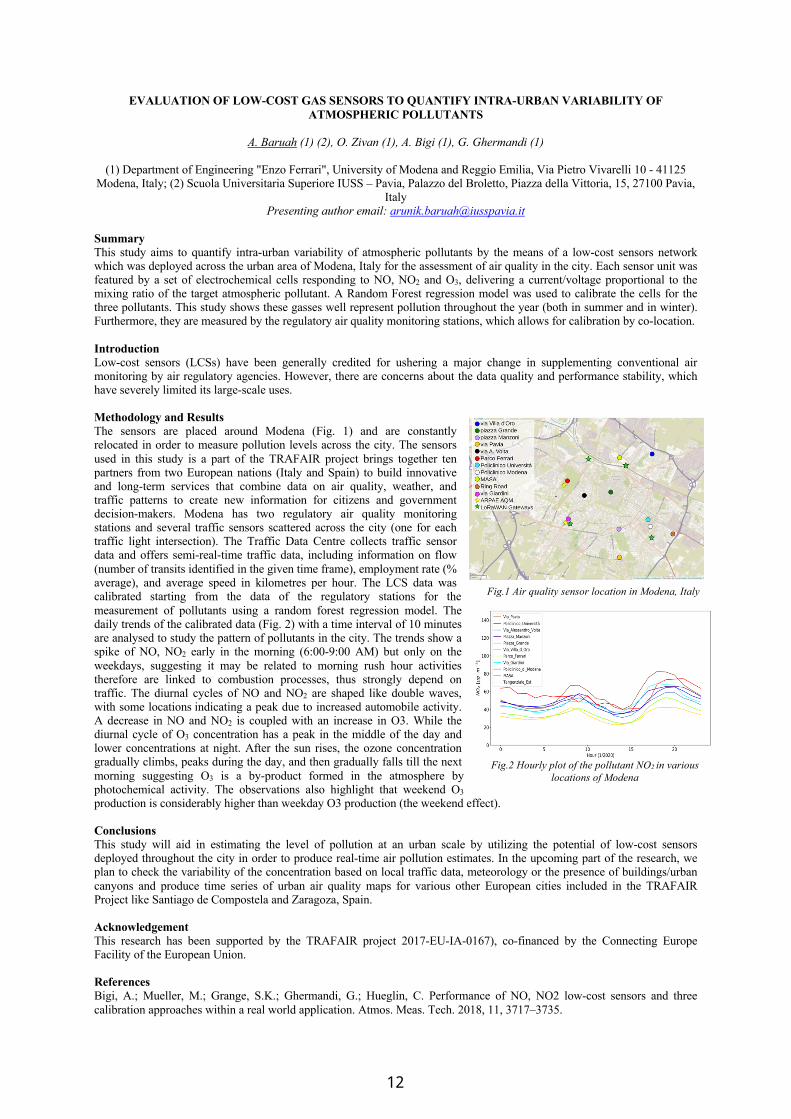
EVALUATION OF LOW-COST GAS SENSORS TO QUANTIFY INTRA-URBAN VARIABILITY OF ATMOSPHERIC POLLUTANTS
A. Baruah (1) (2), O. Zivan (1), A. Bigi (1), G. Ghermandi (1)
(1) Department of Engineering "Enzo Ferrari", University of Modena and Reggio Emilia, Via Pietro Vivarelli 10 - 41125
Modena, Italy; (2) Scuola Universitaria Superiore IUSS – Pavia, Palazzo del Broletto, Piazza della Vittoria, 15, 27100 Pavia, Italy
Presenting author email: [email protected] Summary This study aims to quantify intra-urban variability of atmospheric pollutants by the means of a low-cost sensors network which was deployed across the urban area of Modena, Italy for the assessment of air quality in the city. Each sensor unit was featured by a set of electrochemical cells responding to NO, NO2 and O3, delivering a current/voltage proportional to the mixing ratio of the target atmospheric pollutant. A Random Forest regression model was used to calibrate the cells for the three pollutants. This study shows these gasses well represent pollution throughout the year (both in summer and in winter). Furthermore, they are measured by the regulatory air quality monitoring stations, which allows for calibration by co-location. Introduction Low-cost sensors (LCSs) have been generally credited for ushering a major change in supplementing conventional air monitoring by air regulatory agencies. However, there are concerns about the data quality and performance stability, which have severely limited its large-scale uses. Methodology and Results The sensors are placed around Modena (Fig. 1) and are constantly relocated in order to measure pollution levels across the city. The sensors used in this study is a part of the TRAFAIR project brings together ten partners from two European nations (Italy and Spain) to build innovative and long-term services that combine data on air quality, weather, and traffic patterns to create new information for citizens and government decision-makers. Modena has two regulatory air quality monitoring stations and several traffic sensors scattered across the city (one for each traffic light intersection). The Traffic Data Centre collects traffic sensor data and offers semi-real-time traffic data, including information on flow (number of transits identified in the given time frame), employment rate (% average), and average speed in kilometres per hour. The LCS data was calibrated starting from the data of the regulatory stations for the measurement of pollutants using a random forest regression model. The daily trends of the calibrated data (Fig. 2) with a time interval of 10 minutes are analysed to study the pattern of pollutants in the city. The trends show a spike of NO, NO2 early in the morning (6:00-9:00 AM) but only on the weekdays, suggesting it may be related to morning rush hour activities therefore are linked to combustion processes, thus strongly depend on traffic. The diurnal cycles of NO and NO2 are shaped like double waves, with some locations indicating a peak due to increased automobile activity. A decrease in NO and NO2 is coupled with an increase in O3. While the diurnal cycle of O3 concentration has a peak in the middle of the day and lower concentrations at night. After the sun rises, the ozone concentration gradually climbs, peaks during the day, and then gradually falls till the next morning suggesting O3 is a by-product formed in the atmosphere by photochemical activity. The observations also highlight that weekend O3 production is considerably higher than weekday O3 production (the weekend effect). Conclusions This study will aid in estimating the level of pollution at an urban scale by utilizing the potential of low-cost sensors deployed throughout the city in order to produce real-time air pollution estimates. In the upcoming part of the research, we plan to check the variability of the concentration based on local traffic data, meteorology or the presence of buildings/urban canyons and produce time series of urban air quality maps for various other European cities included in the TRAFAIR Project like Santiago de Compostela and Zaragoza, Spain. Acknowledgement This research has been supported by the TRAFAIR project 2017-EU-IA-0167), co-financed by the Connecting Europe Facility of the European Union. References Bigi, A.; Mueller, M.; Grange, S.K.; Ghermandi, G.; Hueglin, C. Performance of NO, NO2 low-cost sensors and three calibration approaches within a real world application. Atmos. Meas. Tech. 2018, 11, 3717–3735.
Fig.1 Air quality sensor location in Modena, Italy
Fig.2 Hourly plot of the pollutant NO2 in various locations of Modena
12

GEOGRAPHICAL AREAS AND ACTIVITY SECTORS ASSOCIATED WITH AIR QUALITY HEALTH
IMPACTS IN THE UNECE REGION
R. Van Dingenen and C.A. Belis
European Commission, Joint Research Centre (JRC), Ispra, Italy
Presenting author e-mail: [email protected]
Summary:
The TM5-FASST tool was used to study the influence of abatement policies within and outside the UNECE region on the
exposure to O3 and PM2.5 and associated mortality in the UNECE countries. To that end, the impact of pollutants deriving from
different geographical areas and activity sectors was analysed using air pollutant and greenhouse gas emission scenarios. In the
current legislation scenario (CLE), the mortality associated with O3 exposure in the UNECE region grows steadily from 2020
to 2050 mainly due to the growing impact of CH4 and NOX-VOC emissions from areas outside UNECE. On the contrary, the
PM2.5 related mortality in UNECE is mainly due to anthropogenic emissions within this region followed by natural sources
(sea salt and dust) mainly located outside the UNECE region (ROW).
Introduction
The UNECE region is composed of 56 member states that cover a considerable share of the northern hemisphere surface
including Europe, North America and Western and Central Asia. The area has been selected for this study because is the
framework of the Air Convention, the most ambitious international agreement on transboundary atmospheric pollution. The
study focuses on two of the air pollutants that most affect health: PM2.5 and O3. In 2016, the UNECE average age-standardised
mortality rate attributed to ambient air pollution ranged from 7 deaths/105 inh. in Finland to 94 deaths/105 inh. in Tajikistan.
Methodology
The TM5-FASST tool used to estimate exposure and mortality is based on linearised emission concentration sensitivities
originally derived with the full chemistry transport model TM5 (Van Dingenen et al., 2018). The projections presented in this
analysis are based on the ECLIPSE v6b baseline scenario assuming a population trend in line with the Shared Socioeconomic
Pathway SSP2. The role of 11 anthropogenic sources was estimated following the emission reduction impact (brute force)
approach. For O3, the abovementioned approach was combined with perturbations aimed at estimating the impact of VOC-
NOX and CH4 precursor emissions from UNECE and ROW. The mortality attributed to PM2.5 and O3 was estimated according
to the GBD approach. The natural-background O3 mortality corresponds to the fraction above the counterfactual concentration
(zcf).
Results
In the CLE scenario, the mortality associated with O3 exposure in the UNECE region grows steadily from 2020 to 2050. Such
upward trend is mainly associated with the growing impact of CH4 emissions from areas outside UNECE (+58%). Also the
mortality related to NOX-VOC emissions outside UNECE increases by 20% in the same period. On the contrary, a measurable
decrease is observed in the mortality attributable to NOx-VOC emissions from UNECE. In the same time window, the mortality
associated with PM2.5 exposure in the UNECE region first decreases between 2020 and 2040 and then rises until 2050. In 2020,
the PM2.5 related mortality in UNECE is mainly due to anthropogenic emissions within this region (70%) followed by natural
sources (sea salt and dust) mainly located outside the UNECE region. Between 2020 and 2050, the impact of UNECE
anthropogenic emissions decreases progressively, in particular road traffic, energy production and combustion in the domestic
sector while those in ROW rise.
Conclusions:
Acting on anthropogenic CH4 and NOX-VOC emissions from areas outside UNECE may contribute significantly to keep under
control future O3 exposure in UNECE countries. On the contrary, the exposure to PM2.5 in the UNECE region is mainly
associated with anthropogenic emissions within this region although the role of such sources show a downward trend and the
opposite is true for sources outside UNECE.
References
Van Dingenen, R., Dentener, F., Crippa, M., Leitao, J., Marmer, E., Rao, S., Solazzo, E., Valentini, L., 2018. TM5-FASST: a
global atmospheric source–receptor model for rapid impact analysis of emission changes on air quality and short-lived climate
pollutants. Atmos. Chem. Phys. 18, 16173-16211.
13
THE NEED TO MODEL MOBILITY BEHAVIOURS FOR A BETTER ASSESSMENT OF AIR POLLUTION
EXPOSURE AND TO HIGHLIGHT ENVIRONMENTAL HEALTH INEQUALITIES
T. Benoussaïd (1), I. Coll (1), H. Charreire (2,3), A. Elessa Etuman (1)
(1) Univ Paris Est Creteil and Université de Paris, CNRS, LISA, F-94010 Créteil, France, (2) Lab’Urba, Université
Paris Est Créteil, Créteil, France, (3) Institut Universitaire de France (IUF)
Presenting author email: [email protected]
Summary
To feed the reflection on air pollution exposure inequalities and better assess the health impacts of pollution, it is necessary
to produce diagnoses at the individual level including socio-economic characteristics of populations. The objective of our
project is to set-up and implement an innovative method for estimating the exposure of individuals to air pollution by
considering their daily mobility in relation to their socio-economic characteristics.
Introduction
Exposure is one of the key issues in the assessment of the health impacts of pollution, and it is now necessary to consider
the exposure at individual level in order to (i) highlight the social inequalities that exposure covers, and (ii) assess the forms
of public action that can help reduce these inequalities. This exposure is intrinsically linked to residential areas and to the
daily mobility of individuals. This is why it is necessary to include, in the exposure modelling platforms, daily mobility
practices and residential areas according to socio-economic profiles at individual level. To answer these questions, an urban
modelling platform has been developed for the Ile-de-France region (France).
Methodology and Results
The platform is based on OLYMPUS, an environmental decision support model, that simulates individual mobility and
heating emissions (Elessa Etuman & Coll, 2018; Elessa Etuman et al., 2020).
We have done work on the statistical representation of the population in the model (so-called synthetic population) by
integrating socio-economic parameters such as socio-professional category (SPC), age, gender, vehicle ownership,
household composition. We use the 2010 census at neighbourhood level (IRIS) to reproduce each individual as finely as
possible. This allows us to model their schedule, i.e. the type of activity, the starting time and the duration, in order to
model mobility. The modelling of daily mobility and the choice of transport mode is based on utility equations: the model
calculates for each individual, after calibration of the equations, the probability of using car, walking or public transport to
make a trip. The emissions generated by mobility and heating are integrated into the modelling platform in different urban
scenarios whether current, hypothetical or prospective (telecommuting, LEZ). This allows to analyse the impact of the
city's organisation or public policies on mobility behaviours and practices.
Air quality is then modelled by a CTM, (CHIMERE) (Mailler et al., 2017) which kilometre-scale concentration fields are
refined to the street scale by a statistical downscaling method. Exposure is derived from the intersection of the socio-
differentiated mobility generated by OLYMPUS and fine-scale concentrations. We will present the validation of the socio-
differentiated mobility but also the calculated exposure of individuals according to different social (SPC) and geographical
criteria. Finally, we will discuss the role of mobility behaviours in pollution exposure.
Conclusions
Our developments allow (i) to enrich the characterization of modelled individuals by integrating socio-economic
parameters, and also (ii) by improving the modelling of mobility behaviours, to propose a new diagnosis of exposure
allowing more detailed analyses in terms of environmental inequalities (at the level of individual or population segments).
This approach allows to demonstrate the full potential of socio-differentiated mobility modelling in the calculation of
exposure and in the analysis of environmental inequalities.
Acknowledgement
This research received funding from the French National Agency for Research (ANR-14-CE22-0013), from the French
Environment and Energy Management Agency (ADEME) and the Île-de-France region (DIM R2DS and DIM QI²), and
from the French department Val-de-Marne. This work was granted access to the HPC resources of TGCC under the
allocation A0090107232 made by GENCI. We also acknowledge AIRPARIF for data supply.
References
Elessa Etuman, A., Coll, I., 2018. OLYMPUS v1.0: Development of an integrated air pollutant and GHG urban emissions
model - Methodology and calibration over the greater Paris. Geoscientific Model Development Discussions: 1‑29. Elessa Etuman, A., Coll, I., Makni, I., Benoussaid, T., 2020. Addressing the issue of exposure to primary pollution in urban
areas: Application to Greater Paris. Atmospheric Environment, 239 : 117661.
Mailler, S., Menut, L., Khvorostyanov, D., Valari, M., Couvidat, F., Siour, G., Turquety, S., Briant, R., Tuccella, P.,
Bessagnet, B., Colette, A., Létinois, L., Markakis, K., Meleux, F., 2017. CHIMERE-2017: from urban to hemispheric chemistry-transport modeling. Geoscientific Model Development, 10, 6 : 2397‑2423
14
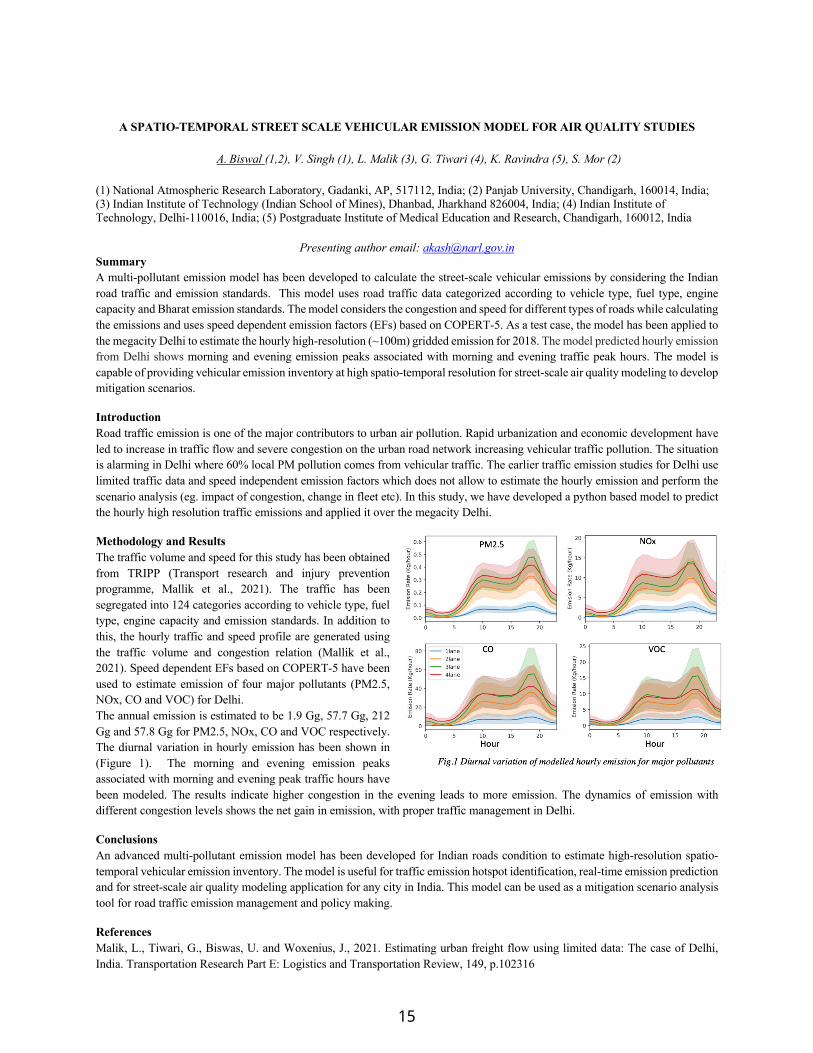
A SPATIO-TEMPORAL STREET SCALE VEHICULAR EMISSION MODEL FOR AIR QUALITY STUDIES
A. Biswal (1,2), V. Singh (1), L. Malik (3), G. Tiwari (4), K. Ravindra (5), S. Mor (2)
(1) National Atmospheric Research Laboratory, Gadanki, AP, 517112, India; (2) Panjab University, Chandigarh, 160014, India; (3) Indian Institute of Technology (Indian School of Mines), Dhanbad, Jharkhand 826004, India; (4) Indian Institute of Technology, Delhi-110016, India; (5) Postgraduate Institute of Medical Education and Research, Chandigarh, 160012, India
Presenting author email: [email protected] Summary A multi-pollutant emission model has been developed to calculate the street-scale vehicular emissions by considering the Indian road traffic and emission standards. This model uses road traffic data categorized according to vehicle type, fuel type, engine capacity and Bharat emission standards. The model considers the congestion and speed for different types of roads while calculating the emissions and uses speed dependent emission factors (EFs) based on COPERT-5. As a test case, the model has been applied to the megacity Delhi to estimate the hourly high-resolution (~100m) gridded emission for 2018. The model predicted hourly emission from Delhi shows morning and evening emission peaks associated with morning and evening traffic peak hours. The model is capable of providing vehicular emission inventory at high spatio-temporal resolution for street-scale air quality modeling to develop mitigation scenarios.
Introduction Road traffic emission is one of the major contributors to urban air pollution. Rapid urbanization and economic development have led to increase in traffic flow and severe congestion on the urban road network increasing vehicular traffic pollution. The situation is alarming in Delhi where 60% local PM pollution comes from vehicular traffic. The earlier traffic emission studies for Delhi use limited traffic data and speed independent emission factors which does not allow to estimate the hourly emission and perform the scenario analysis (eg. impact of congestion, change in fleet etc). In this study, we have developed a python based model to predict the hourly high resolution traffic emissions and applied it over the megacity Delhi.
Methodology and Results The traffic volume and speed for this study has been obtained from TRIPP (Transport research and injury prevention programme, Mallik et al., 2021). The traffic has been segregated into 124 categories according to vehicle type, fuel type, engine capacity and emission standards. In addition to this, the hourly traffic and speed profile are generated using the traffic volume and congestion relation (Mallik et al., 2021). Speed dependent EFs based on COPERT-5 have been used to estimate emission of four major pollutants (PM2.5, NOx, CO and VOC) for Delhi. The annual emission is estimated to be 1.9 Gg, 57.7 Gg, 212 Gg and 57.8 Gg for PM2.5, NOx, CO and VOC respectively. The diurnal variation in hourly emission has been shown in (Figure 1). The morning and evening emission peaks associated with morning and evening peak traffic hours have been modeled. The results indicate higher congestion in the evening leads to more emission. The dynamics of emission with different congestion levels shows the net gain in emission, with proper traffic management in Delhi.
Conclusions An advanced multi-pollutant emission model has been developed for Indian roads condition to estimate high-resolution spatio-temporal vehicular emission inventory. The model is useful for traffic emission hotspot identification, real-time emission prediction and for street-scale air quality modeling application for any city in India. This model can be used as a mitigation scenario analysis tool for road traffic emission management and policy making.
References Malik, L., Tiwari, G., Biswas, U. and Woxenius, J., 2021. Estimating urban freight flow using limited data: The case of Delhi, India. Transportation Research Part E: Logistics and Transportation Review, 149, p.102316
15
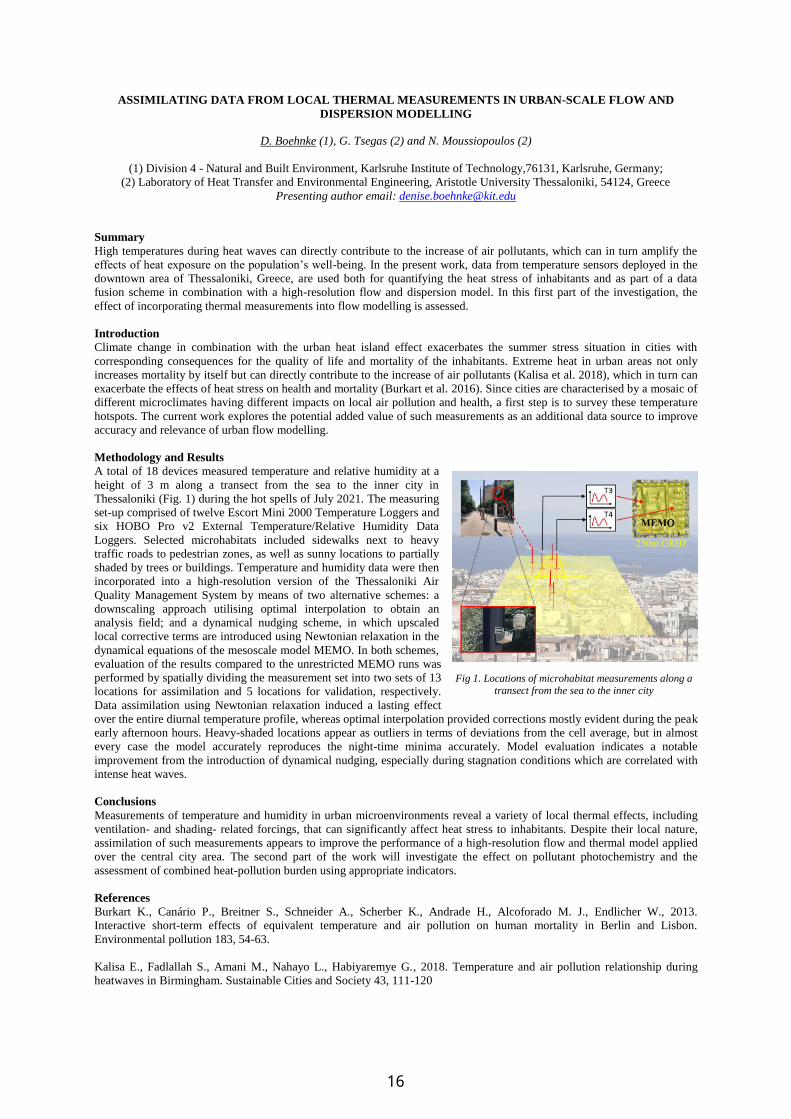
ASSIMILATING DATA FROM LOCAL THERMAL MEASUREMENTS IN URBAN-SCALE FLOW AND
DISPERSION MODELLING
D. Boehnke (1), G. Tsegas (2) and N. Moussiopoulos (2)
(1) Division 4 - Natural and Built Environment, Karlsruhe Institute of Technology,76131, Karlsruhe, Germany;
(2) Laboratory of Heat Transfer and Environmental Engineering, Aristotle University Thessaloniki, 54124, Greece
Presenting author email: [email protected]
Summary
High temperatures during heat waves can directly contribute to the increase of air pollutants, which can in turn amplify the
effects of heat exposure on the population’s well-being. In the present work, data from temperature sensors deployed in the
downtown area of Thessaloniki, Greece, are used both for quantifying the heat stress of inhabitants and as part of a data
fusion scheme in combination with a high-resolution flow and dispersion model. In this first part of the investigation, the
effect of incorporating thermal measurements into flow modelling is assessed.
Introduction
Climate change in combination with the urban heat island effect exacerbates the summer stress situation in cities with
corresponding consequences for the quality of life and mortality of the inhabitants. Extreme heat in urban areas not only
increases mortality by itself but can directly contribute to the increase of air pollutants (Kalisa et al. 2018), which in turn can
exacerbate the effects of heat stress on health and mortality (Burkart et al. 2016). Since cities are characterised by a mosaic of
different microclimates having different impacts on local air pollution and health, a first step is to survey these temperature
hotspots. The current work explores the potential added value of such measurements as an additional data source to improve
accuracy and relevance of urban flow modelling.
Methodology and Results
A total of 18 devices measured temperature and relative humidity at a
height of 3 m along a transect from the sea to the inner city in
Thessaloniki (Fig. 1) during the hot spells of July 2021. The measuring
set-up comprised of twelve Escort Mini 2000 Temperature Loggers and
six HOBO Pro v2 External Temperature/Relative Humidity Data
Loggers. Selected microhabitats included sidewalks next to heavy
traffic roads to pedestrian zones, as well as sunny locations to partially
shaded by trees or buildings. Temperature and humidity data were then
incorporated into a high-resolution version of the Thessaloniki Air
Quality Management System by means of two alternative schemes: a
downscaling approach utilising optimal interpolation to obtain an
analysis field; and a dynamical nudging scheme, in which upscaled
local corrective terms are introduced using Newtonian relaxation in the
dynamical equations of the mesoscale model MEMO. In both schemes,
evaluation of the results compared to the unrestricted MEMO runs was
performed by spatially dividing the measurement set into two sets of 13
locations for assimilation and 5 locations for validation, respectively.
Data assimilation using Newtonian relaxation induced a lasting effect
over the entire diurnal temperature profile, whereas optimal interpolation provided corrections mostly evident during the peak
early afternoon hours. Heavy-shaded locations appear as outliers in terms of deviations from the cell average, but in almost
every case the model accurately reproduces the night-time minima accurately. Model evaluation indicates a notable
improvement from the introduction of dynamical nudging, especially during stagnation conditions which are correlated with
intense heat waves.
Conclusions
Measurements of temperature and humidity in urban microenvironments reveal a variety of local thermal effects, including
ventilation- and shading- related forcings, that can significantly affect heat stress to inhabitants. Despite their local nature,
assimilation of such measurements appears to improve the performance of a high-resolution flow and thermal model applied
over the central city area. The second part of the work will investigate the effect on pollutant photochemistry and the
assessment of combined heat-pollution burden using appropriate indicators.
References
Burkart K., Canário P., Breitner S., Schneider A., Scherber K., Andrade H., Alcoforado M. J., Endlicher W., 2013.
Interactive short-term effects of equivalent temperature and air pollution on human mortality in Berlin and Lisbon.
Environmental pollution 183, 54-63.
Kalisa E., Fadlallah S., Amani M., Nahayo L., Habiyaremye G., 2018. Temperature and air pollution relationship during
heatwaves in Birmingham. Sustainable Cities and Society 43, 111-120
Fig 1. Locations of microhabitat measurements along a transect from the sea to the inner city
16
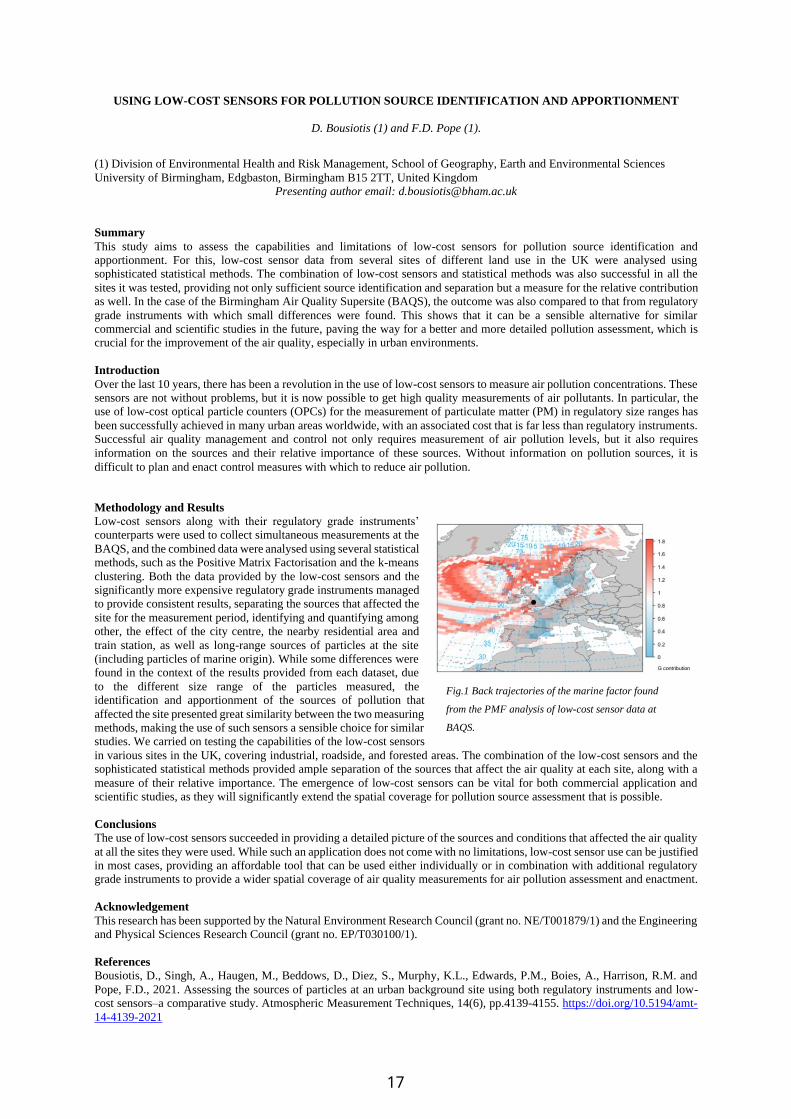
USING LOW-COST SENSORS FOR POLLUTION SOURCE IDENTIFICATION AND APPORTIONMENT
D. Bousiotis (1) and F.D. Pope (1).
(1) Division of Environmental Health and Risk Management, School of Geography, Earth and Environmental Sciences
University of Birmingham, Edgbaston, Birmingham B15 2TT, United Kingdom
Presenting author email: [email protected]
Summary
This study aims to assess the capabilities and limitations of low-cost sensors for pollution source identification and
apportionment. For this, low-cost sensor data from several sites of different land use in the UK were analysed using
sophisticated statistical methods. The combination of low-cost sensors and statistical methods was also successful in all the
sites it was tested, providing not only sufficient source identification and separation but a measure for the relative contribution
as well. In the case of the Birmingham Air Quality Supersite (BAQS), the outcome was also compared to that from regulatory
grade instruments with which small differences were found. This shows that it can be a sensible alternative for similar
commercial and scientific studies in the future, paving the way for a better and more detailed pollution assessment, which is
crucial for the improvement of the air quality, especially in urban environments.
Introduction
Over the last 10 years, there has been a revolution in the use of low-cost sensors to measure air pollution concentrations. These
sensors are not without problems, but it is now possible to get high quality measurements of air pollutants. In particular, the
use of low-cost optical particle counters (OPCs) for the measurement of particulate matter (PM) in regulatory size ranges has
been successfully achieved in many urban areas worldwide, with an associated cost that is far less than regulatory instruments.
Successful air quality management and control not only requires measurement of air pollution levels, but it also requires
information on the sources and their relative importance of these sources. Without information on pollution sources, it is
difficult to plan and enact control measures with which to reduce air pollution.
Methodology and Results
Low-cost sensors along with their regulatory grade instruments’
counterparts were used to collect simultaneous measurements at the
BAQS, and the combined data were analysed using several statistical
methods, such as the Positive Matrix Factorisation and the k-means
clustering. Both the data provided by the low-cost sensors and the
significantly more expensive regulatory grade instruments managed
to provide consistent results, separating the sources that affected the
site for the measurement period, identifying and quantifying among
other, the effect of the city centre, the nearby residential area and
train station, as well as long-range sources of particles at the site
(including particles of marine origin). While some differences were
found in the context of the results provided from each dataset, due
to the different size range of the particles measured, the
identification and apportionment of the sources of pollution that
affected the site presented great similarity between the two measuring
methods, making the use of such sensors a sensible choice for similar
studies. We carried on testing the capabilities of the low-cost sensors
in various sites in the UK, covering industrial, roadside, and forested areas. The combination of the low-cost sensors and the
sophisticated statistical methods provided ample separation of the sources that affect the air quality at each site, along with a
measure of their relative importance. The emergence of low-cost sensors can be vital for both commercial application and
scientific studies, as they will significantly extend the spatial coverage for pollution source assessment that is possible.
Conclusions
The use of low-cost sensors succeeded in providing a detailed picture of the sources and conditions that affected the air quality
at all the sites they were used. While such an application does not come with no limitations, low-cost sensor use can be justified
in most cases, providing an affordable tool that can be used either individually or in combination with additional regulatory
grade instruments to provide a wider spatial coverage of air quality measurements for air pollution assessment and enactment.
Acknowledgement
This research has been supported by the Natural Environment Research Council (grant no. NE/T001879/1) and the Engineering
and Physical Sciences Research Council (grant no. EP/T030100/1).
References
Bousiotis, D., Singh, A., Haugen, M., Beddows, D., Diez, S., Murphy, K.L., Edwards, P.M., Boies, A., Harrison, R.M. and
Pope, F.D., 2021. Assessing the sources of particles at an urban background site using both regulatory instruments and low-
cost sensors–a comparative study. Atmospheric Measurement Techniques, 14(6), pp.4139-4155. https://doi.org/10.5194/amt-
14-4139-2021
Fig.1 Back trajectories of the marine factor found
from the PMF analysis of low-cost sensor data at
BAQS.
17
2006-2021 CHANGES IN PM2.5 LEVELS AND SOURCE CONTRIBUTIONS IN THE CITY WUHAN, CHINA
BASED ON MEASUREMENTS AND RECEPTOR MODELLING
A. Canals (1,2), W. Lv (3), X. Zhuang (4), Y. Shangguan (4), X. Zhou (4), Y. Wang (5), S. Kong (5) A. Alastuey (1), B.L. van Drooge (1) and X. Querol (1,4)
(1) Institute of Environmental Assessment and Water Research (IDAEA), CSIC, Barcelona, Spain; (2) Department of
Chemical Engineering and Analytical Chemistry, Universitat de Barcelona, Spain; (3) Wuhan Regional Climate Centre, Wuhan, P. R. China; (4) School of Earth Resources, China University of Geosciences, Wuhan, P. R. China; (5) School of
Environmental Studies, China University of Geosciences, Wuhan, P. R. China
Presenting author email: [email protected]
Introduction
Air quality research is very relevant due to the link between emissions, air pollution and human diseases. Atmospheric particulate
matter (PM) concentrations are variable due to emissions from multiple sources, and influence of seasonal and meteorological
conditions. China experienced and increasing PM2.5 concentrations from 2000 to 2013, but since then marked decreases were
recorded (Geng et al., 2021). This decreasing trend was very evident in the city of Wuhan. The aim of the present study is to evaluate
the major PM2.5 changes in levels and source contributions in Wuhan.
Methodology and Results
Receptor modelling tools are applied to PM chemical speciation datasets from 2006-2007 (unpublished data from Lv, 2008) and
2019-2021. PM2.5 sampling by HiVols (24h) was carried out in industrial and urban sites, Changqian, Huaqiao and Gaoxin from
July 2006 to July 2007, and was repeated from June 2019 to January 2021 at an urban background site located in the campus of the
China University of Geosciences (CUG). Major and trace elements were analysed by ICP-MS and ICP-AES, water-soluble ions by
HPLC and elemental and organic carbon by thermal-optical transmittance (TOT) method. Filter fractions were solvent extraction and
GC-MS analysed for the determination of organic molecular tracer compounds and pollutants in samples collected in CUG 2019-
2021. Complementary daily data on SO2, NO2, PM2.5, PM10 and CO concentrations and meteorological conditions were supplied
by the Wuhan Environmental Bureau.
Results evidence a decrease of average PM2.5 levels of -65% between 2006-2007 and 2019-2021 due to the implementation of air
quality policy actions. For SO2 this decrease reached -88% attributable to the decrease of coal combustion, while the -25% NO2
reduction is attributable to the effect of the policy counter-rested by the increase of vehicles. Relative contributions to PM2.5, such as
OC, SO42-, NH4
+, EC and Cl- were also markedly (-48 to -71%) reduced, while that of NO3- was much less pronounced (-22%). The
ion balance proportions were considerably different in 2019-2021 than those obtained in 2006-2007, as the main product was
NH4NO3 (55%) rather than the 83-100% of (NH4)2SO4 present in 2006-2007. Levels of coal-combustion related elements (Pb, Ni,
Ga, Rb, As, Tl, Se, Sn, Bi, K and Zn) decreased by -76 to -90%, while levels of those associated to road dust, traffic and construction
(Al, Ca, Cu, Fe, Co, among others) reduced in a lesser proportion (-54 to -22%). Organic tracer analysis in the recent samples show
that toxic compounds, such as benzo[a]pyrene, are lower or in the range of generally accepted target concentrations.
Additionally, results on changes of source contributions to PM2.5 are supported by the source receptor modelling of PM speciation
datasets from both periods, using both organic and inorganic tracers for a deeper analysis of the current situation.
Conclusions
PM2.5 in Wuhan City decreased by .65% since 2006-.2007. The reduction of coal combustion and other policy actions markedly
favoured this drastic reduction. Other policy measures on industrial sources did also contribute to this decrease. Contribution from
traffic and residential sources and construction, decreased less markedly.
References
Geng G., Xiao Q., Liu S., Liu X., Cheng, J., Zheng Y., Xue T., Tong D., Zheng B., Peng Y., Huang X., He K. and Zhang Q., 2021.
Tracking Air Pollution in China: Near Real-Time PM2.5 Retrievals from Multisource Data Fusion. Environ. Sci. Technol. 55, 17,
12106-12115.
Lv, W. (2008). Environmental geochemistry and source apportionment of PM2.5 in Wuhan City, Central China. A dissertation
Submitted to China University of Geoscience for the Degree of Doctor of Philosophy, 114.
18
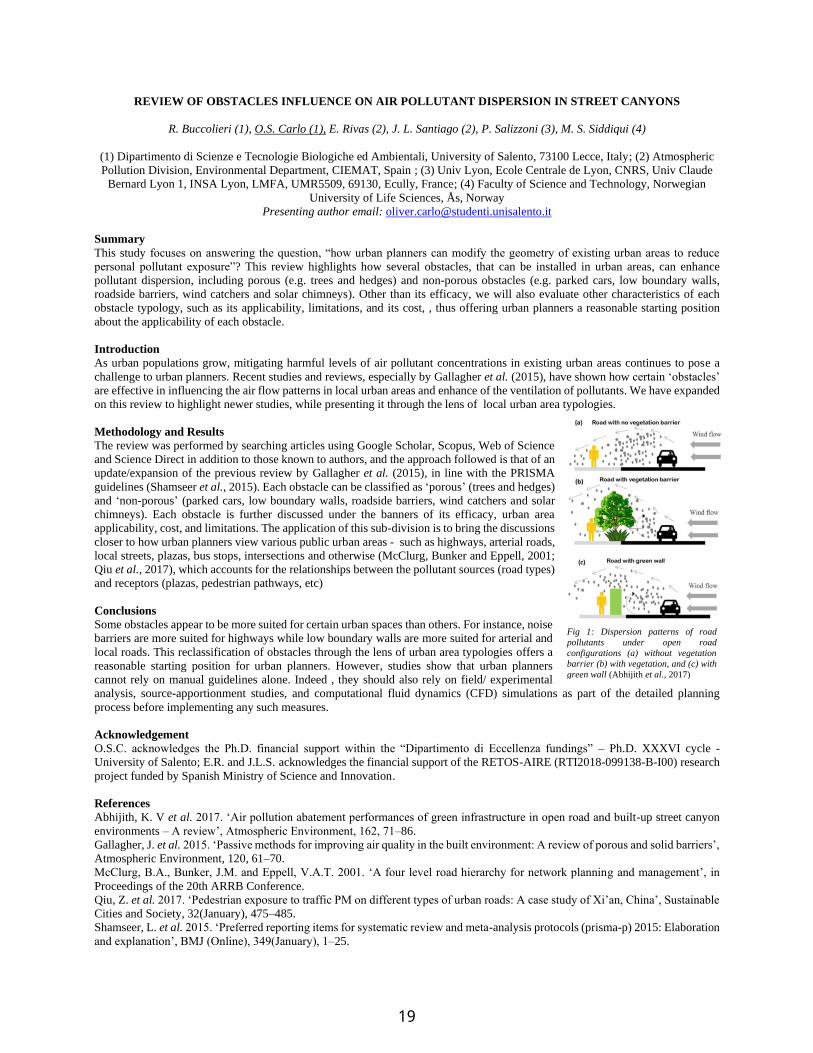
REVIEW OF OBSTACLES INFLUENCE ON AIR POLLUTANT DISPERSION IN STREET CANYONS
R. Buccolieri (1), O.S. Carlo (1), E. Rivas (2), J. L. Santiago (2), P. Salizzoni (3), M. S. Siddiqui (4)
(1) Dipartimento di Scienze e Tecnologie Biologiche ed Ambientali, University of Salento, 73100 Lecce, Italy; (2) Atmospheric
Pollution Division, Environmental Department, CIEMAT, Spain ; (3) Univ Lyon, Ecole Centrale de Lyon, CNRS, Univ Claude
Bernard Lyon 1, INSA Lyon, LMFA, UMR5509, 69130, Ecully, France; (4) Faculty of Science and Technology, Norwegian
University of Life Sciences, Ås, Norway
Presenting author email: [email protected]
Summary
This study focuses on answering the question, “how urban planners can modify the geometry of existing urban areas to reduce
personal pollutant exposure”? This review highlights how several obstacles, that can be installed in urban areas, can enhance
pollutant dispersion, including porous (e.g. trees and hedges) and non-porous obstacles (e.g. parked cars, low boundary walls,
roadside barriers, wind catchers and solar chimneys). Other than its efficacy, we will also evaluate other characteristics of each
obstacle typology, such as its applicability, limitations, and its cost, , thus offering urban planners a reasonable starting position
about the applicability of each obstacle.
Introduction
As urban populations grow, mitigating harmful levels of air pollutant concentrations in existing urban areas continues to pose a
challenge to urban planners. Recent studies and reviews, especially by Gallagher et al. (2015), have shown how certain ‘obstacles’
are effective in influencing the air flow patterns in local urban areas and enhance of the ventilation of pollutants. We have expanded
on this review to highlight newer studies, while presenting it through the lens of local urban area typologies.
Methodology and Results
The review was performed by searching articles using Google Scholar, Scopus, Web of Science
and Science Direct in addition to those known to authors, and the approach followed is that of an
update/expansion of the previous review by Gallagher et al. (2015), in line with the PRISMA
guidelines (Shamseer et al., 2015). Each obstacle can be classified as ‘porous’ (trees and hedges)
and ‘non-porous’ (parked cars, low boundary walls, roadside barriers, wind catchers and solar
chimneys). Each obstacle is further discussed under the banners of its efficacy, urban area
applicability, cost, and limitations. The application of this sub-division is to bring the discussions
closer to how urban planners view various public urban areas - such as highways, arterial roads,
local streets, plazas, bus stops, intersections and otherwise (McClurg, Bunker and Eppell, 2001;
Qiu et al., 2017), which accounts for the relationships between the pollutant sources (road types)
and receptors (plazas, pedestrian pathways, etc)
Conclusions
Some obstacles appear to be more suited for certain urban spaces than others. For instance, noise
barriers are more suited for highways while low boundary walls are more suited for arterial and
local roads. This reclassification of obstacles through the lens of urban area typologies offers a
reasonable starting position for urban planners. However, studies show that urban planners
cannot rely on manual guidelines alone. Indeed , they should also rely on field/ experimental
analysis, source-apportionment studies, and computational fluid dynamics (CFD) simulations as part of the detailed planning
process before implementing any such measures.
Acknowledgement
O.S.C. acknowledges the Ph.D. financial support within the “Dipartimento di Eccellenza fundings” – Ph.D. XXXVI cycle -
University of Salento; E.R. and J.L.S. acknowledges the financial support of the RETOS-AIRE (RTI2018-099138-B-I00) research
project funded by Spanish Ministry of Science and Innovation.
References
Abhijith, K. V et al. 2017. ‘Air pollution abatement performances of green infrastructure in open road and built-up street canyon
environments – A review’, Atmospheric Environment, 162, 71–86.
Gallagher, J. et al. 2015. ‘Passive methods for improving air quality in the built environment: A review of porous and solid barriers’,
Atmospheric Environment, 120, 61–70.
McClurg, B.A., Bunker, J.M. and Eppell, V.A.T. 2001. ‘A four level road hierarchy for network planning and management’, in
Proceedings of the 20th ARRB Conference.
Qiu, Z. et al. 2017. ‘Pedestrian exposure to traffic PM on different types of urban roads: A case study of Xi’an, China’, Sustainable
Cities and Society, 32(January), 475–485.
Shamseer, L. et al. 2015. ‘Preferred reporting items for systematic review and meta-analysis protocols (prisma-p) 2015: Elaboration
and explanation’, BMJ (Online), 349(January), 1–25.
Fig 1: Dispersion patterns of road
pollutants under open road
configurations (a) without vegetation
barrier (b) with vegetation, and (c) with
green wall (Abhijith et al., 2017)
19
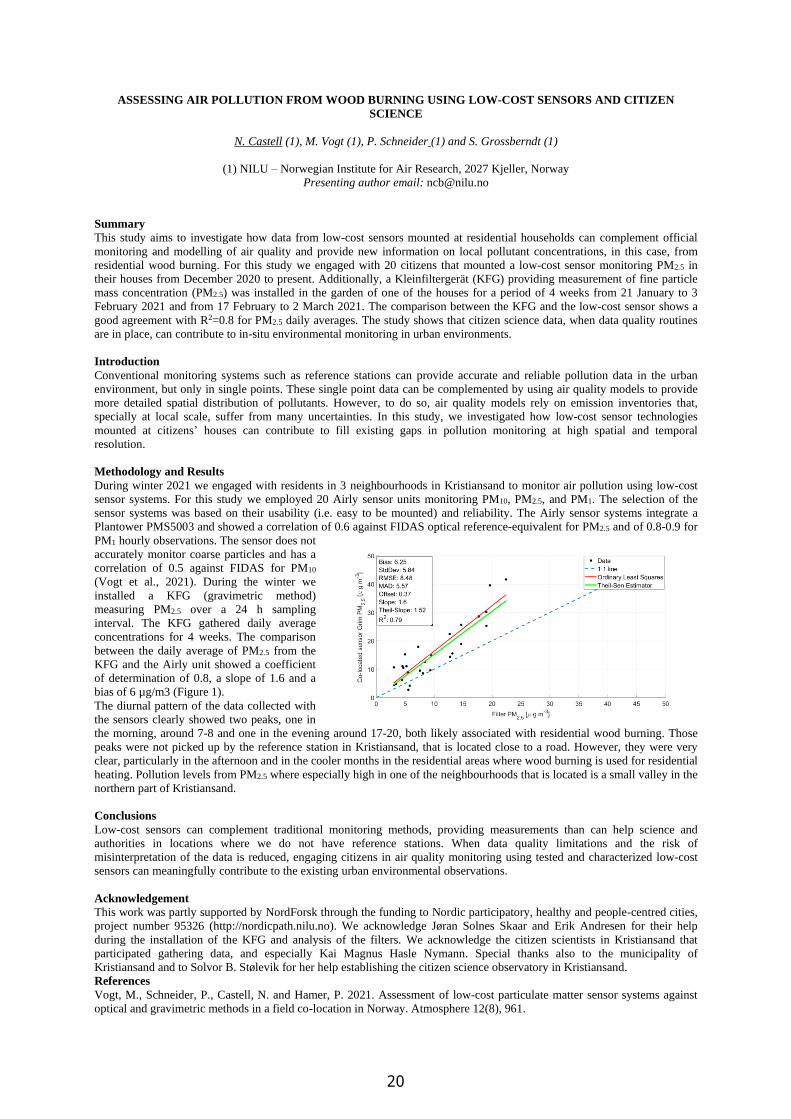
ASSESSING AIR POLLUTION FROM WOOD BURNING USING LOW-COST SENSORS AND CITIZEN
SCIENCE
N. Castell (1), M. Vogt (1), P. Schneider (1) and S. Grossberndt (1)
(1) NILU – Norwegian Institute for Air Research, 2027 Kjeller, Norway
Presenting author email: [email protected]
Summary
This study aims to investigate how data from low-cost sensors mounted at residential households can complement official
monitoring and modelling of air quality and provide new information on local pollutant concentrations, in this case, from
residential wood burning. For this study we engaged with 20 citizens that mounted a low-cost sensor monitoring PM2.5 in
their houses from December 2020 to present. Additionally, a Kleinfiltergerät (KFG) providing measurement of fine particle
mass concentration (PM2.5) was installed in the garden of one of the houses for a period of 4 weeks from 21 January to 3
February 2021 and from 17 February to 2 March 2021. The comparison between the KFG and the low-cost sensor shows a
good agreement with R2=0.8 for PM2.5 daily averages. The study shows that citizen science data, when data quality routines
are in place, can contribute to in-situ environmental monitoring in urban environments.
Introduction
Conventional monitoring systems such as reference stations can provide accurate and reliable pollution data in the urban
environment, but only in single points. These single point data can be complemented by using air quality models to provide
more detailed spatial distribution of pollutants. However, to do so, air quality models rely on emission inventories that,
specially at local scale, suffer from many uncertainties. In this study, we investigated how low-cost sensor technologies
mounted at citizens’ houses can contribute to fill existing gaps in pollution monitoring at high spatial and temporal
resolution.
Methodology and Results
During winter 2021 we engaged with residents in 3 neighbourhoods in Kristiansand to monitor air pollution using low-cost
sensor systems. For this study we employed 20 Airly sensor units monitoring PM10, PM2.5, and PM1. The selection of the
sensor systems was based on their usability (i.e. easy to be mounted) and reliability. The Airly sensor systems integrate a
Plantower PMS5003 and showed a correlation of 0.6 against FIDAS optical reference-equivalent for PM2.5 and of 0.8-0.9 for
PM1 hourly observations. The sensor does not
accurately monitor coarse particles and has a
correlation of 0.5 against FIDAS for PM10
(Vogt et al., 2021). During the winter we
installed a KFG (gravimetric method)
measuring PM2.5 over a 24 h sampling
interval. The KFG gathered daily average
concentrations for 4 weeks. The comparison
between the daily average of PM2.5 from the
KFG and the Airly unit showed a coefficient
of determination of 0.8, a slope of 1.6 and a
bias of 6 µg/m3 (Figure 1).
The diurnal pattern of the data collected with
the sensors clearly showed two peaks, one in
the morning, around 7-8 and one in the evening around 17-20, both likely associated with residential wood burning. Those
peaks were not picked up by the reference station in Kristiansand, that is located close to a road. However, they were very
clear, particularly in the afternoon and in the cooler months in the residential areas where wood burning is used for residential
heating. Pollution levels from PM2.5 where especially high in one of the neighbourhoods that is located is a small valley in the
northern part of Kristiansand.
Conclusions
Low-cost sensors can complement traditional monitoring methods, providing measurements than can help science and
authorities in locations where we do not have reference stations. When data quality limitations and the risk of
misinterpretation of the data is reduced, engaging citizens in air quality monitoring using tested and characterized low-cost
sensors can meaningfully contribute to the existing urban environmental observations.
Acknowledgement
This work was partly supported by NordForsk through the funding to Nordic participatory, healthy and people-centred cities,
project number 95326 (http://nordicpath.nilu.no). We acknowledge Jøran Solnes Skaar and Erik Andresen for their help
during the installation of the KFG and analysis of the filters. We acknowledge the citizen scientists in Kristiansand that
participated gathering data, and especially Kai Magnus Hasle Nymann. Special thanks also to the municipality of
Kristiansand and to Solvor B. Stølevik for her help establishing the citizen science observatory in Kristiansand.
References
Vogt, M., Schneider, P., Castell, N. and Hamer, P. 2021. Assessment of low-cost particulate matter sensor systems against
optical and gravimetric methods in a field co-location in Norway. Atmosphere 12(8), 961.
20
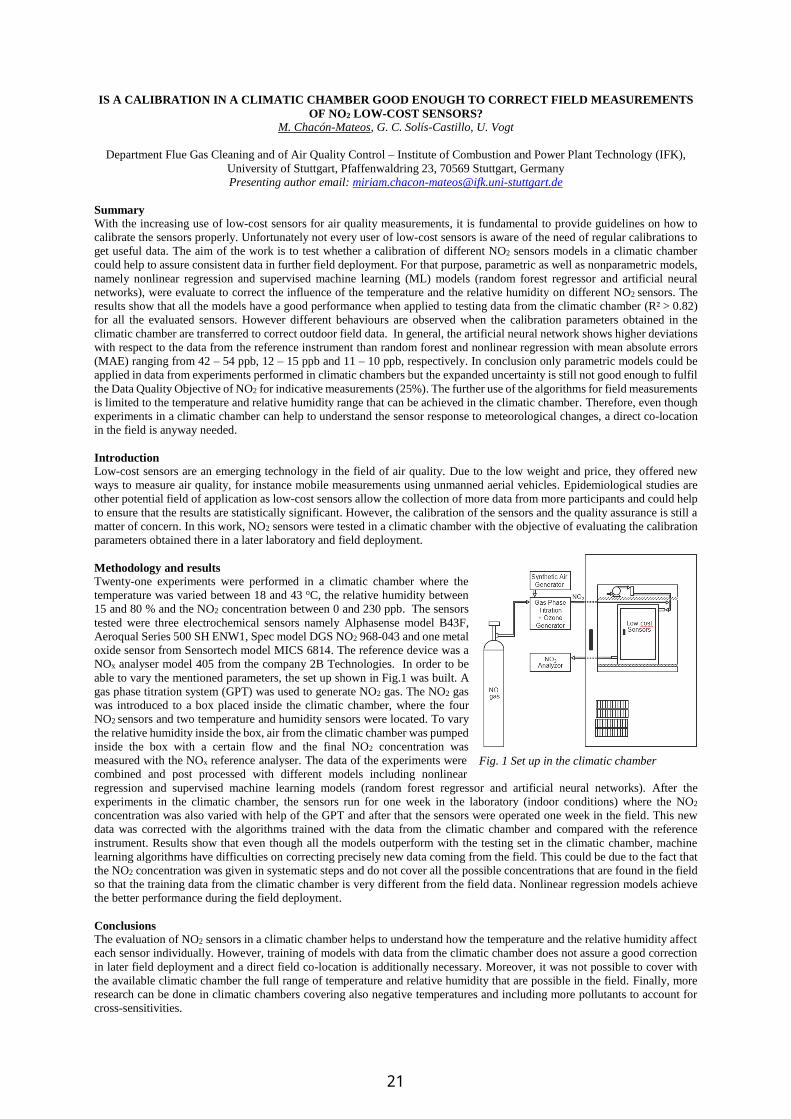
IS A CALIBRATION IN A CLIMATIC CHAMBER GOOD ENOUGH TO CORRECT FIELD MEASUREMENTS
OF NO2 LOW-COST SENSORS?
M. Chacón-Mateos, G. C. Solís-Castillo, U. Vogt
Department Flue Gas Cleaning and of Air Quality Control – Institute of Combustion and Power Plant Technology (IFK),
University of Stuttgart, Pfaffenwaldring 23, 70569 Stuttgart, Germany
Presenting author email: [email protected]
Summary
With the increasing use of low-cost sensors for air quality measurements, it is fundamental to provide guidelines on how to
calibrate the sensors properly. Unfortunately not every user of low-cost sensors is aware of the need of regular calibrations to
get useful data. The aim of the work is to test whether a calibration of different NO2 sensors models in a climatic chamber
could help to assure consistent data in further field deployment. For that purpose, parametric as well as nonparametric models,
namely nonlinear regression and supervised machine learning (ML) models (random forest regressor and artificial neural
networks), were evaluate to correct the influence of the temperature and the relative humidity on different NO2 sensors. The
results show that all the models have a good performance when applied to testing data from the climatic chamber (R² > 0.82)
for all the evaluated sensors. However different behaviours are observed when the calibration parameters obtained in the
climatic chamber are transferred to correct outdoor field data. In general, the artificial neural network shows higher deviations
with respect to the data from the reference instrument than random forest and nonlinear regression with mean absolute errors
(MAE) ranging from 42 – 54 ppb, 12 – 15 ppb and 11 – 10 ppb, respectively. In conclusion only parametric models could be
applied in data from experiments performed in climatic chambers but the expanded uncertainty is still not good enough to fulfil
the Data Quality Objective of NO2 for indicative measurements (25%). The further use of the algorithms for field measurements
is limited to the temperature and relative humidity range that can be achieved in the climatic chamber. Therefore, even though
experiments in a climatic chamber can help to understand the sensor response to meteorological changes, a direct co-location
in the field is anyway needed.
Introduction
Low-cost sensors are an emerging technology in the field of air quality. Due to the low weight and price, they offered new
ways to measure air quality, for instance mobile measurements using unmanned aerial vehicles. Epidemiological studies are
other potential field of application as low-cost sensors allow the collection of more data from more participants and could help
to ensure that the results are statistically significant. However, the calibration of the sensors and the quality assurance is still a
matter of concern. In this work, NO2 sensors were tested in a climatic chamber with the objective of evaluating the calibration
parameters obtained there in a later laboratory and field deployment.
Methodology and results
Twenty-one experiments were performed in a climatic chamber where the
temperature was varied between 18 and 43 oC, the relative humidity between
15 and 80 % and the NO2 concentration between 0 and 230 ppb. The sensors
tested were three electrochemical sensors namely Alphasense model B43F,
Aeroqual Series 500 SH ENW1, Spec model DGS NO2 968-043 and one metal
oxide sensor from Sensortech model MICS 6814. The reference device was a
NOx analyser model 405 from the company 2B Technologies. In order to be
able to vary the mentioned parameters, the set up shown in Fig.1 was built. A
gas phase titration system (GPT) was used to generate NO2 gas. The NO2 gas
was introduced to a box placed inside the climatic chamber, where the four
NO2 sensors and two temperature and humidity sensors were located. To vary
the relative humidity inside the box, air from the climatic chamber was pumped
inside the box with a certain flow and the final NO2 concentration was
measured with the NOx reference analyser. The data of the experiments were
combined and post processed with different models including nonlinear
regression and supervised machine learning models (random forest regressor and artificial neural networks). After the
experiments in the climatic chamber, the sensors run for one week in the laboratory (indoor conditions) where the NO2
concentration was also varied with help of the GPT and after that the sensors were operated one week in the field. This new
data was corrected with the algorithms trained with the data from the climatic chamber and compared with the reference
instrument. Results show that even though all the models outperform with the testing set in the climatic chamber, machine
learning algorithms have difficulties on correcting precisely new data coming from the field. This could be due to the fact that
the NO2 concentration was given in systematic steps and do not cover all the possible concentrations that are found in the field
so that the training data from the climatic chamber is very different from the field data. Nonlinear regression models achieve
the better performance during the field deployment.
Conclusions The evaluation of NO2 sensors in a climatic chamber helps to understand how the temperature and the relative humidity affect
each sensor individually. However, training of models with data from the climatic chamber does not assure a good correction
in later field deployment and a direct field co-location is additionally necessary. Moreover, it was not possible to cover with
the available climatic chamber the full range of temperature and relative humidity that are possible in the field. Finally, more
research can be done in climatic chambers covering also negative temperatures and including more pollutants to account for
cross-sensitivities.
Fig. 1 Set up in the climatic chamber
21

PROPECTIONS OF UV SOLAR RADIATION ON GLOBAL SCALE BASED ON SIMULATIONS FROM CMIPN
MODELS– DNA & CIE DOSE EFFECTS
Anthi Chatzopoulou , Kleareti Tourpali, Alkiviadis Bais .
Laboratory of Atmospheric Physics, Physics Department, Aristotle mniversity of Thessaloniki, Thessaloniki, Greece Corresponding author email: [email protected]
Summary
The aim of this study is the calculation of biological doses of deoxyribonucleic acid (DNA) damage and International
Commission on Illumination (CIE) Erythema, through projections of spectral mV radiation on global scale based on CMIP6
model simulations. The period of interest is the historical period from the middle of 20th century (1950-1960) until the end of the 21st century (2090-2100). There is an important influence of various factors on the amount of radiation reaching the
Earth’s surface, which has direct effects on the doses of DNA damage and Erythema on skin. This study was performed using
input data derived from simulations of Earth System Models (ESM) run in the framework of CMIP6, in order to gain a better
understanding of solar radiation related biological influences on humans.
Introduction
In the late 20th century, the interest to investigate the variability and the trends of mV radiation levels peaked and as a result, a
large number of studies were focused on this topic. The changes were mainly attributed to the stratospheric ozone depletion,
a major influence on the levels of mV radiation reaching Earth’s surface (Bais et al., 2018). Except ozone (O3), factors such
as aerosols, clouds and surface reflectivity play a major role in the amount of solar surface radiation (Bais et al., 2015).
Future changes in the above factors will affect the incident surface solar radiation and it is essential to evaluate them under a
changing climate (Barnes et al., 2019). Considering this, we used here ESM simulations performed using approaches of the
Shared Socioeconomic Pathways (SSPs) of Intergovernmental Panel on Climate Change (IPCC) for the future social-
economic trends of communities, as available from the 6th Phase of Coupled Model Intercomparison Project (CMIP6).
Methodology and Results
To calculate DNA damage and Erythema weighted biological doses, simulations of mV radiation were performed with the radiative transfer model libRadtran (Emde et al., 2016). As input data, monthly mean simulations of ESMs were used, for
historical (1950-2000) and future (2090-2100) levels of total ozone column, profile of ozone mixing ratio, surface
temperature and pressure, shortwave upwelling and downwelling radiation and aerosol optical depth (AOD) at 550 nm. Data
of ozone were derived both from models with interactive chemistry schemes and prescribed chemistry schemes. In order to
gain an overview of various scenarios with different climate policies, we selected three social-economic pathways for the 21st
century: SSP1-2.6, SSP3-7.0 and SSP5-8.5. For global coverage, our calculations were performed in five latitudinal bands: 2 polar zones (60-90o), 2 middle latitude zones (30-60o) and the tropics (30oS-30oN). The simulated spectral solar irradiance
was weighted with action spectra for DNA damage and Erythema respectively, to estimate the biological doses trends. The
projections of mV radiation levels are influenced from the climate change-driven effects mentioned in the previous section
and depend on different regions of Earth. Changes of ozone play a catalytic role over polar and middle latitude zones of both
hemispheres, due to ozone depletion and GHG’s, which have direct effect on ozone amount. Marked differences were found
in the future projections of biological doses between simulations of models run with interactive chemistry and prescribed
chemistry under the three pathways.
Conclusions
There is a complex interaction of mV radiation levels and their driving factors. Our simulations show that at the end of the
21st century both doses are lower, both in interactive and chemistry scheme models, compared to decade 1950-1960. As the amount of mV radiation dose on skin could be crucial to human’s health, it is important to monitor and project it, in order to
adopt appropriate policies in time so as to avoid fatal increases.
References
Bais AF, McKenzie RL, Bernhard G, Aucamp PJ, Ilyas M, Madronich S, Tourpali K. Ozone depletion and climate change:
impacts on mV radiation. PhotochemPhotobiol Sci. 2015 Jan;14(1):19-52. doi: 10.1039/c4pp90032d. PMID: 25380284., 5-8
Bais, Alkiviadis & Bernhard, Germar & McKenzie, Richard & Aucamp, Pieter & Young, Paul & Ilyas, Mohammad &
Jöckel, Patrick & Deushi, Makoto. (2019). Ozone–climate interactions and effects on solar ultraviolet radiation.
Photochemical & Photobiological Sciences. 18. 10.1039/C8PP90059K.,603
Barnes, P.W., Williamson, C.E., Lucas, R.M. et al. Ozone depletion, ultraviolet radiation, climate change and prospects for a sustainable future. Nat Sustain 2, 569–579 (2019). https://doi.org/10.1038/s41893-019-0314-2
EEAP. 2019. Environmental Effects and Interactions of Stratospheric Ozone Depletion, mV Radiation, and Climate Change.
2018 Assessment Report. Nairobi: Environmental Effects Assessment Panel, mnited Nations Environment Programme
(mNEP) 390 pp. https://ozone.unep.org/science/assessment/eeap, 43
Emde, C., Buras-Schnell, R., Kylling, A., Mayer, B., Gasteiger, J., Hamann, m., Kylling, J., Richter, B., Pause, C., Dowling,
T., and Bugliaro, L.: The libRadtran software package for radiative transfer calculations (version 2.0.1), Geosci. Model Dev.,
9, 1647–1672, https://doi.org/10.5194/gmd-9-1647-2016 , 2016.a
22

COMPARING SOURCE ORIENTED AND RECEPTOR ORIENTED SOURCE APPORTIONMENT RESULTS
OVER THE MILAN AREA IN LIFE-REMY PROJECT
E. De Angelis (1), G. Pirovano (1) V. Agresti (1), A. Piccoli (1,2), F. Ippolito (3), F. Amato (3), C. Colombi (4), G. Lanzani
(4), G. Maffeis (5)
(1) RSE SpA, Milano, 20134, Italy; (2) Department of Civil and Environmental Engineering, Politecnico di Milano, Milano,
Italy; (3) Institute of Environmental Assessment and Water Research, IDAEA, Spanish Research Council (CSIC), 08034
Barcelona, Spain; (4) Arpa Lombardia Settore Monitoraggi Ambientali UO Qualità dell’Aria , 20124 Milano, Italy; (5)
TerrAria s.r.l., 20125 Milano, Italy
Presenting author email: [email protected]
Summary
The LIFE-REMY (Reducing Emission Modelling uncertainty, https://liferemy.eu/) project, launched in May 2021, investigates
the impact of uncertainty in pollutants emission and air dispersion models that could negatively affect air quality assessment
and plans. A particular focus of the project is the modelling of emission and formation processes, involving primary and
secondary particulate generation as well as the comparison of source apportionment modelling techniques, which allow an
accurate quantification of key emission sources. In this work only the Milan area case study set up is presented and a first
example of results based on source oriented models is shown.
Introduction
The quantitative and reliable assessment of the role of the different sources with respect to pollution levels (source
apportionment, SA) represents a key prerequisite in order to reduce uncertainty in air quality modelling driven by emissions.
In this view, the comparison of SA results, particularly when based on different and independent methods (e.g. Receptor vs
Source oriented models) can provide informative outcomes.
Methodology and Results
The SMOKE-WRF-CAMx modelling system is applied over the Milan area (Northern Italy) by means of two computational
domains, with the larger domain covering the whole Italy at 4 km resolution, while the innermost one, centred over the city of
Milan, covers an area of 70x70 km2 at 1 km resolution (Agresti et al, 2020). Simulations are performed over two periods: a
baseline simulation covering the whole 2017 and COVID-19 simulation focused on February-April 2020. SA with source
oriented method is performed by means of the CAMx model able to evaluate both source “impacts” through the usual Brute
Force (BF) method and source “contributions”, by means of the embedded PSAT tool (Yarwood et al. 2004) for PM and related
precursors. SA analysis with Receptor oriented approach will be carried out by means of PMF (EPA PMF version 5) and
focused only on urban background site (Milano Pascal) and one rural site (Milano Schivenoglia), the chemical dataset includes
metals, ions sugar and OC/EC.
Fig.1 Modelled (red) and observed (black) PM2.5 daily concentrations at 11 air quality stations for 2017 over the Milan domain.
Fig. 1 shows an example of CAMx model performance evaluation for PM2.5 over the Milan domain for 2017 case study,
pointing out that CAMx is able to reproduce observed trends, except for few winter peaks. SA analysis will be then performed
to investigate the influence of the uncertainty in emission estimates on modelled concentration and observed discrepancies.
Fig. 2 shows an example of source contribution results from CAMx for PM2.5 in Milan
for COVID-19 simulation and focused on traffic sector. Particularly the pie chart
quantifies, among others, the contribution of the “removed” road transport emissions
(ROADTRA_RE, 5.57 g/m3), with respect to the remaining emission
(ROADTRA_SC, 1.19 g/m3) and all other sectors. This result can be then compared
with the corresponding source “impact”, computed by CAMx through BF approach
for further discussion on the comparability between SA methods. Finally, CAMx
results will be compared against RMs results, derived from measured PM
composition data, in order to evaluate the reliability of the modelled source
contributions and reduce possible uncertainty in emission estimate.
Acknowledgement RSE contribution was partially funded also by the Research Fund
for the Italian Electrical System (Decree 16/04/18).
References
Agresti V. et al, Sistema modellistico multi-scala per l’analisi della mobilità e la qualità dell’aria durante il lockdown
primaverile per COVID-19, Ricerca di sistema, RSE, n. 20010474, Milano, 2020.
Yarwood, G. et al, Particulate Matter Source Apportionment Technology (PSAT) in the CAMx Photochemical Grid Model.
Proceedings of the 27th NATO/ CCMS International Technical Meeting on Air Pollution Modeling and Application. 2004.
Fig.2 Source contribution results
obtained by CAMX for COVID 19
case study over the city of Milan
23

AIR QUALITY FORECASTING USING A DEEP LONG-SHORT MEMORY NETWORK MODEL
G. Gousios (1), V. Vourlioti (1), T. Mamouka (1), S. Kotsopoulos (1), P. Syropoulou (2), D. Delioglani (2), N. Pliakis (2)
(1) AGROAPPS PC 54-56 Themistokli Sofouli St. 54655, Thessaloniki, Greece, (2) DRAXIS Environmental S.A. 54-56
Themistokli Sofouli St. 54655, Thessaloniki, Greece
Presenting author email: [email protected]
Summary
Air pollution is among the most challenging issues modern societies are currently facing with direct impacts on society,
economy, politics, as well as on the health of the population and the environment (European Environmental Agency, 2020).
This study aims to introduce a state-of-the-art air quality forecasting model using a Deep Long-Short Memory Network
integrating data from various sources, from in-situ measurements coming from official ground-based stations to Earth
Observation (EO) from the Copernicus Atmosphere Monitoring Service (CAMS). The overall aim for the development of
this model is the production of air quality forecasts with higher spatial and temporal resolution than those offered from
Copernicus, capturing air pollution dynamics at a city level, something that will significantly affect decision-making allowing
the adoption and implementation of better measures by policy makers to minimise the effects of the degraded air quality.
Introduction
Air quality modelling has lately surfaced as a necessary alternative to air quality forecasting with its inherent ability to cover
both small (regional) as well as large (inter-continental) -scale pollution events and their transport effects (Wang A. et al.,
2021). This information can be later used for better decision-making to minimise the negative impacts of air pollution on
society (Baklanov and Zhang, 2020). Current air quality forecasting models are using various state-of-the-art methods to
produce relevant forecasts, among which Deep Learning and Machine Learning methods to be included. The air quality
forecasting model described in this study uses a Deep Long-Short Memory Network that harnesses data from various data
sources with the overall aim to improve the credibility of air quality forecasts.
Methodology and Results
The air quality forecasting model is constantly being trained on historical weather and air quality data deriving from various
sources. Currently, the air quality forecasts are based on the concentrations of the six pollutants with the most significant
impacts on the environment and the population, namely NO, NO2, O3, SO2, PM2.5 and PM10, but more pollutants can be
easily integrated in the model at any moment. For each of these pollutants an individual artificial neural network workflow
has been designed. These features constitute wind direction, wind angle, total precipitation, temperature, solar radiation and
the applicable pollutant. While data for the pollutants derive from various sources, e.g. in-situ measurements, EO, official
ground-based stations, CAMS, etc., information regarding the meteorological conditions derive from numerical weather
predictions generated by the Weather Research and Forecasting (WRF) model (version 4.3.1). The artificial neural network
workflows of the pollutants have similar architecture, with only a few minor differences, and all are trained by utilising 7
historical daily values and then predicting the following 2 days. A general overview of the architecture of a pollutant is
displayed below, including the number of units that were used and the activation function.
Fig. 1 General architecture of the Deep Long-Short Memory Network model.
Conclusions
The air quality forecasting model presented in this study uses a novel method based on artificial neural networks in order to
produce forecasts of future air quality conditions with high spatial and temporal resolution, by leveraging data from a wide
range of sources. Even though it was developed in the context of addressing the challenging issue of air pollution, the model
presented in this study could also be used, with a few modifications, to produce forecasts of other significant environmental
conditions, such as thermal comfort and the probability of forest fires.
Acknowledgement
This work was carried out in the context of two projects funded by the European Union’s Horizon 2020 programme, namely
EXHAUSTION (Topic: “Climate change impacts in Europe”, GA 820655) and CALLISTO (Topic: “Big data technologies
and Artificial Intelligence for Copernicus”, GA 101004152)
References
Baklanov A., Zhang Y., 2020. Advances in air quality modeling and forecasting, Global Transitions, Volume 2, Pages 261-
270, ISSN 2589-7918, https://doi.org/10.1016/j.glt.2020.11.001.
European Environmental Agency, 2020. The European environment – state and outlook 2010: Synthesis – Endnotes,
https://www.eea.europa.eu/soer/2010/synthesis/synthesis/references.xhtml#anchor-304-anchor
Wang A. et al., 2021. Near-road air quality modelling that incorporates input variability and model uncertainty,
Environmental Pollution, Volume 284, 117145, ISSN 0269-7491, https://doi.org/10.1016/j.envpol.2021.117145.
24
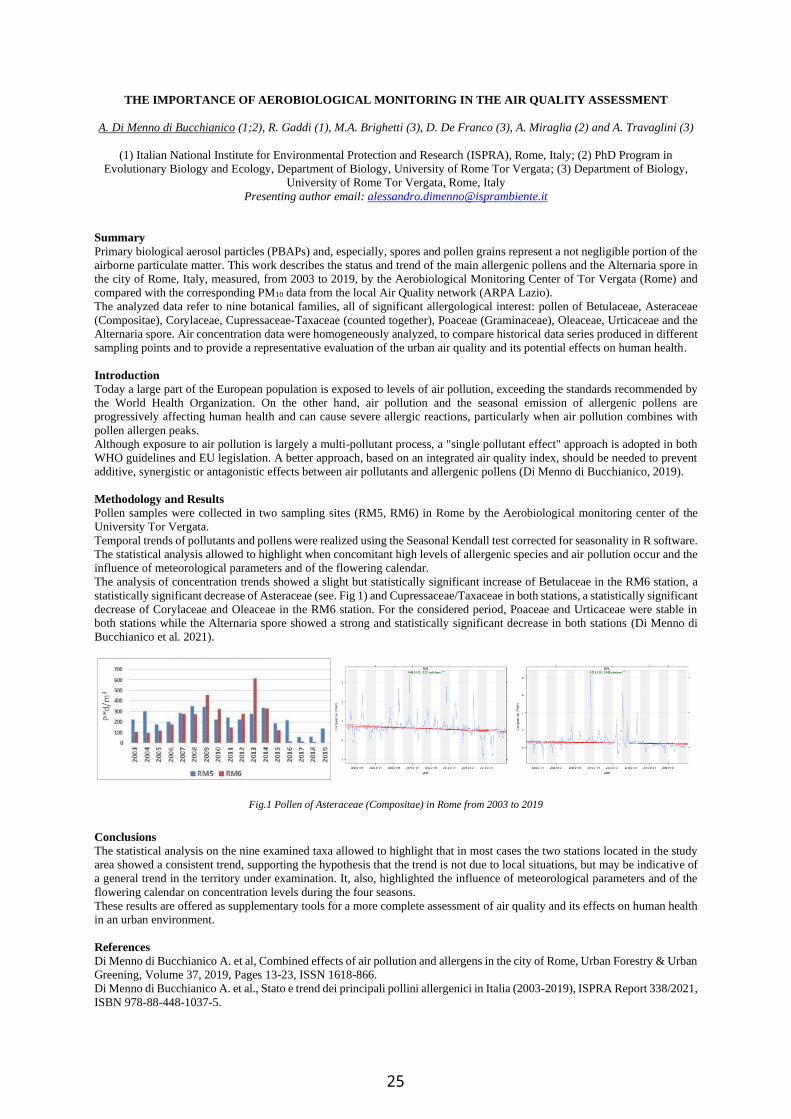
THE IMPORTANCE OF AEROBIOLOGICAL MONITORING IN THE AIR QUALITY ASSESSMENT
A. Di Menno di Bucchianico (1;2), R. Gaddi (1), M.A. Brighetti (3), D. De Franco (3), A. Miraglia (2) and A. Travaglini (3)
(1) Italian National Institute for Environmental Protection and Research (ISPRA), Rome, Italy; (2) PhD Program in
Evolutionary Biology and Ecology, Department of Biology, University of Rome Tor Vergata; (3) Department of Biology,
University of Rome Tor Vergata, Rome, Italy
Presenting author email: [email protected]
Summary
Primary biological aerosol particles (PBAPs) and, especially, spores and pollen grains represent a not negligible portion of the
airborne particulate matter. This work describes the status and trend of the main allergenic pollens and the Alternaria spore in
the city of Rome, Italy, measured, from 2003 to 2019, by the Aerobiological Monitoring Center of Tor Vergata (Rome) and
compared with the corresponding PM10 data from the local Air Quality network (ARPA Lazio).
The analyzed data refer to nine botanical families, all of significant allergological interest: pollen of Betulaceae, Asteraceae
(Compositae), Corylaceae, Cupressaceae-Taxaceae (counted together), Poaceae (Graminaceae), Oleaceae, Urticaceae and the
Alternaria spore. Air concentration data were homogeneously analyzed, to compare historical data series produced in different
sampling points and to provide a representative evaluation of the urban air quality and its potential effects on human health.
Introduction
Today a large part of the European population is exposed to levels of air pollution, exceeding the standards recommended by
the World Health Organization. On the other hand, air pollution and the seasonal emission of allergenic pollens are
progressively affecting human health and can cause severe allergic reactions, particularly when air pollution combines with
pollen allergen peaks.
Although exposure to air pollution is largely a multi-pollutant process, a "single pollutant effect" approach is adopted in both
WHO guidelines and EU legislation. A better approach, based on an integrated air quality index, should be needed to prevent
additive, synergistic or antagonistic effects between air pollutants and allergenic pollens (Di Menno di Bucchianico, 2019).
Methodology and Results
Pollen samples were collected in two sampling sites (RM5, RM6) in Rome by the Aerobiological monitoring center of the
University Tor Vergata.
Temporal trends of pollutants and pollens were realized using the Seasonal Kendall test corrected for seasonality in R software.
The statistical analysis allowed to highlight when concomitant high levels of allergenic species and air pollution occur and the
influence of meteorological parameters and of the flowering calendar.
The analysis of concentration trends showed a slight but statistically significant increase of Betulaceae in the RM6 station, a
statistically significant decrease of Asteraceae (see. Fig 1) and Cupressaceae/Taxaceae in both stations, a statistically significant
decrease of Corylaceae and Oleaceae in the RM6 station. For the considered period, Poaceae and Urticaceae were stable in
both stations while the Alternaria spore showed a strong and statistically significant decrease in both stations (Di Menno di
Bucchianico et al. 2021).
Fig.1 Pollen of Asteraceae (Compositae) in Rome from 2003 to 2019
Conclusions
The statistical analysis on the nine examined taxa allowed to highlight that in most cases the two stations located in the study
area showed a consistent trend, supporting the hypothesis that the trend is not due to local situations, but may be indicative of
a general trend in the territory under examination. It, also, highlighted the influence of meteorological parameters and of the
flowering calendar on concentration levels during the four seasons.
These results are offered as supplementary tools for a more complete assessment of air quality and its effects on human health
in an urban environment.
References
Di Menno di Bucchianico A. et al, Combined effects of air pollution and allergens in the city of Rome, Urban Forestry & Urban
Greening, Volume 37, 2019, Pages 13-23, ISSN 1618-866.
Di Menno di Bucchianico A. et al., Stato e trend dei principali pollini allergenici in Italia (2003-2019), ISPRA Report 338/2021,
ISBN 978-88-448-1037-5.
25

THE 2020 LOCKDOWN IN AN ALPINE REGION - DISENTANGLING THE EFFECT OF METEOROLOGYAND EMISSIONS ON POLLUTANT CONCENTRATIONS
H. Diémoz (1), T. Magri (1), G. Pession (1), C. Tarricone (1), I. K. F. Tombolato (1), G. Fasano (1,2), and M. Zublena (1)
(1) Regional Environmental Protection Agency (ARPA) of the Aosta Valley, Saint-Christophe, Italy;(2) Department of Physical, Sapienza – University of Rome, Rome, Italy
Presenting author email: [email protected]
SummaryThe effect of COVID-19 confinement regulations on air quality in the northwestern Alps (Aosta Valley, Italy, Fig. 1) isassessed at five valley sites in different environmental contexts. The contribution of emissions is disentangled from the effectof meteorology using deterministic (chemical transport) and empirical (machine learning) models, source apportionmentmethods (based on chemical, microphysical and optical aerosol properties) and remote sensing, profiling techniques. It isfound that the peculiar meteorological conditions met in 2020 partially mask the effect of the curtailed emissions and must beconsidered to accurately assess the impact of the pandemic on air quality, notably on fine aerosol particles.
IntroductionItaly and its northern regions were the European hotspot of the “firstwave” of the COVID-19 pandemic. To curb the spread of the infection,distancing rules and restrictions to the circulation (lockdown regulations)were issued by the national government at the end of February 2020 andpersisted, in varying degrees, throughout the years 2020 and 2021. As aconsequence, this has led to a sudden and countrywide shift in habits,energy consumption patterns and emissions in the atmosphere, thusrepresenting an accidental, and hopefully unique, switch-off experimentof specific air pollution sources.The vast majority of the published research focuses on very pollutedareas, such as large conurbations and densely populated regions, wherechanges are more evident. In contrast, very few studies address the effectsof COVID-19 confinement measures on air quality at more pristinemountain sites. Hence, we focus on a mountainous region in the European Alps, theAosta Valley. The air quality in the region is usually considered verygood due to the absence of heavy pollution sources, however the valley isadjacent to the Po basin, one of the atmospheric pollution hotspots inEurope. Here we consider observations at five stations located at shortspatial distance (<70 km) in different types of environments (traffic,urban background, industrial, semi-rural, and rural).
Methodology and ResultsSurface concentrations of nitrogen oxides (NO and NO2), ozone (O3), particulate matter (PM2.5 and PM10), together with athorough microphysical (size), chemical, and optical (light absorption) aerosol characterisation, complemented bymeasurements along the vertical column are considered.The variations observed during the first confinement period in the city of Aosta for each pollutant (-61% NO, -43% NO 2,+5% O3, +9% PM2.5, -12% PM10, relative to average 2015-2019 conditions) are attributed to the competing effects of airpollution lockdown-induced changes (-74%, -52%, +18%, -13%, -27%, relative to the counterfactual scenario for 2020provided by a predictive statistical model trained on past measurements) and meteorology (+52%, +18%, -11%, +25%,+20%, relative to average conditions). These changes agree well with the ones obtained from a chemical transport model withmodified emissions according to the restrictions. With regard to column-integrated quantities and vertical profiles, the NO 2
column density decreases by >20% due to the lockdown, whereas tropospheric aerosols are mainly influenced by large-scaledynamics (transport of secondary particles from the Po basin and mineral dust from the Sahara desert and the Caspian Sea),except a shallow layer about 500 m thick close to the surface, possibly sensitive to curtailed emissions (especially exhaustand non-exhaust particles from road traffic and fugitive emissions from the industry).
ConclusionsEven in the relatively pristine environment of the Alps, the «lockdown effect» is well discernible, both in the earlyconfinement phase and in late 2020. Remote sensing techniques probing the vertical column and optical, microphysical andchemical source apportionment methods, further complemented by models, turn out to be powerful tools to better interpretthe observed variation in pollutant concentrations.
ReferencesDiémoz H., Magri T., Pession G., Tarricone C., Tombolato I.K.F., Fasano G., Zublena M., 2021. Air Quality in the ItalianNorthwestern Alps during Year 2020: Assessment of the COVID-19 «Lockdown Effect» from Multi-TechniqueObservations and Models. Atmosphere 12, 1006.
Fig. 1: (a) Italy and (b) the Aosta Valley, as seenfrom space by the MODIS radiometer. The Alpsand the Po basin are highlighted in the left panel,while the locations considered in the study areshown in the right panel: Courmayeur (1), Aosta(2), and Donnas (3).
26
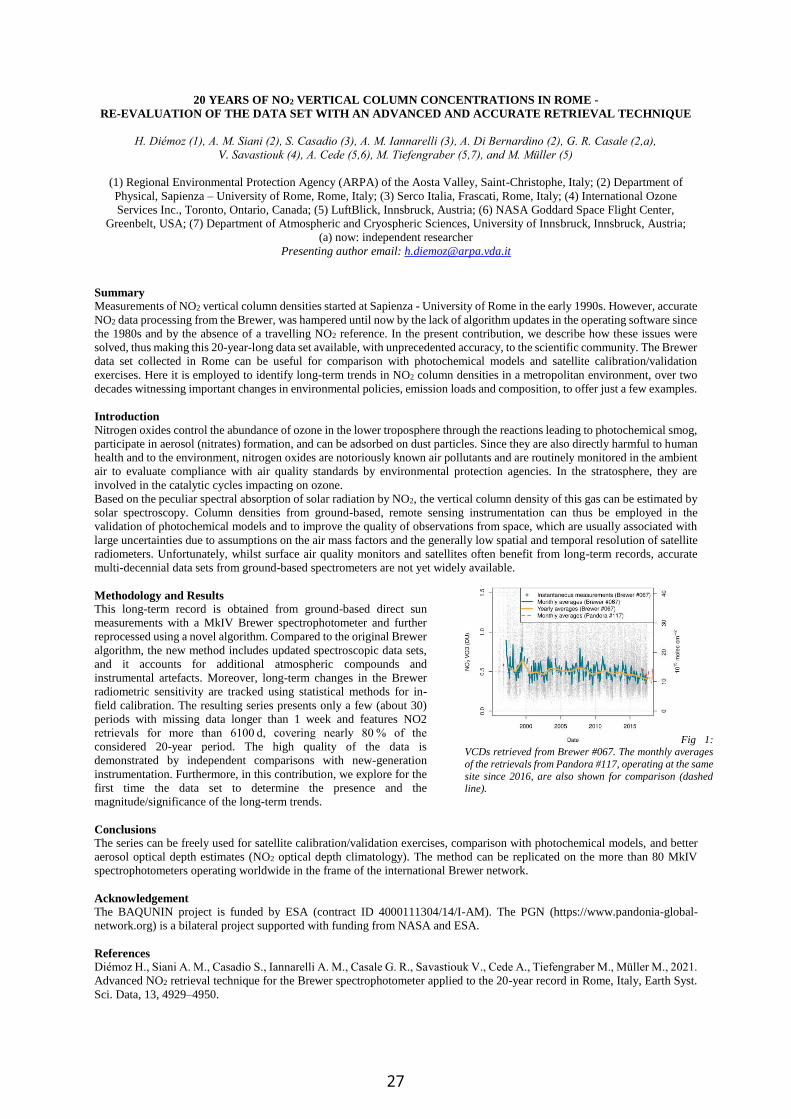
20 YEARS OF NO2 VERTICAL COLUMN CONCENTRATIONS IN ROME -
RE-EVALUATION OF THE DATA SET WITH AN ADVANCED AND ACCURATE RETRIEVAL TECHNIQUE
H. Diémoz (1), A. M. Siani (2), S. Casadio (3), A. M. Iannarelli (3), A. Di Bernardino (2), G. R. Casale (2,a), V. Savastiouk (4), A. Cede (5,6), M. Tiefengraber (5,7), and M. Müller (5)
(1) Regional Environmental Protection Agency (ARPA) of the Aosta Valley, Saint-Christophe, Italy; (2) Department of
Physical, Sapienza – University of Rome, Rome, Italy; (3) Serco Italia, Frascati, Rome, Italy; (4) International Ozone
Services Inc., Toronto, Ontario, Canada; (5) LuftBlick, Innsbruck, Austria; (6) NASA Goddard Space Flight Center,
Greenbelt, USA; (7) Department of Atmospheric and Cryospheric Sciences, University of Innsbruck, Innsbruck, Austria; (a) now: independent researcher
Presenting author email: [email protected]
Summary
Measurements of NO2 vertical column densities started at Sapienza - University of Rome in the early 1990s. However, accurate
NO2 data processing from the Brewer, was hampered until now by the lack of algorithm updates in the operating software since
the 1980s and by the absence of a travelling NO2 reference. In the present contribution, we describe how these issues were
solved, thus making this 20-year-long data set available, with unprecedented accuracy, to the scientific community. The Brewer
data set collected in Rome can be useful for comparison with photochemical models and satellite calibration/validation
exercises. Here it is employed to identify long-term trends in NO2 column densities in a metropolitan environment, over two
decades witnessing important changes in environmental policies, emission loads and composition, to offer just a few examples.
Introduction
Nitrogen oxides control the abundance of ozone in the lower troposphere through the reactions leading to photochemical smog,
participate in aerosol (nitrates) formation, and can be adsorbed on dust particles. Since they are also directly harmful to human
health and to the environment, nitrogen oxides are notoriously known air pollutants and are routinely monitored in the ambient
air to evaluate compliance with air quality standards by environmental protection agencies. In the stratosphere, they are
involved in the catalytic cycles impacting on ozone. Based on the peculiar spectral absorption of solar radiation by NO2, the vertical column density of this gas can be estimated by
solar spectroscopy. Column densities from ground-based, remote sensing instrumentation can thus be employed in the
validation of photochemical models and to improve the quality of observations from space, which are usually associated with
large uncertainties due to assumptions on the air mass factors and the generally low spatial and temporal resolution of satellite
radiometers. Unfortunately, whilst surface air quality monitors and satellites often benefit from long-term records, accurate
multi-decennial data sets from ground-based spectrometers are not yet widely available.
Methodology and Results This long-term record is obtained from ground-based direct sun
measurements with a MkIV Brewer spectrophotometer and further
reprocessed using a novel algorithm. Compared to the original Brewer
algorithm, the new method includes updated spectroscopic data sets,
and it accounts for additional atmospheric compounds and
instrumental artefacts. Moreover, long-term changes in the Brewer
radiometric sensitivity are tracked using statistical methods for in-
field calibration. The resulting series presents only a few (about 30)
periods with missing data longer than 1 week and features NO2
retrievals for more than 6100 d, covering nearly 80 % of the
considered 20-year period. The high quality of the data is
demonstrated by independent comparisons with new-generation
instrumentation. Furthermore, in this contribution, we explore for the
first time the data set to determine the presence and the
magnitude/significance of the long-term trends.
Conclusions
The series can be freely used for satellite calibration/validation exercises, comparison with photochemical models, and better
aerosol optical depth estimates (NO2 optical depth climatology). The method can be replicated on the more than 80 MkIV
spectrophotometers operating worldwide in the frame of the international Brewer network.
Acknowledgement
The BAQUNIN project is funded by ESA (contract ID 4000111304/14/I-AM). The PGN (https://www.pandonia-global-
network.org) is a bilateral project supported with funding from NASA and ESA.
References
Diémoz H., Siani A. M., Casadio S., Iannarelli A. M., Casale G. R., Savastiouk V., Cede A., Tiefengraber M., Müller M., 2021.
Advanced NO2 retrieval technique for the Brewer spectrophotometer applied to the 20-year record in Rome, Italy, Earth Syst.
Sci. Data, 13, 4929–4950.
Fig 1: VCDs retrieved from Brewer #067. The monthly averages
of the retrievals from Pandora #117, operating at the same
site since 2016, are also shown for comparison (dashed line).
27
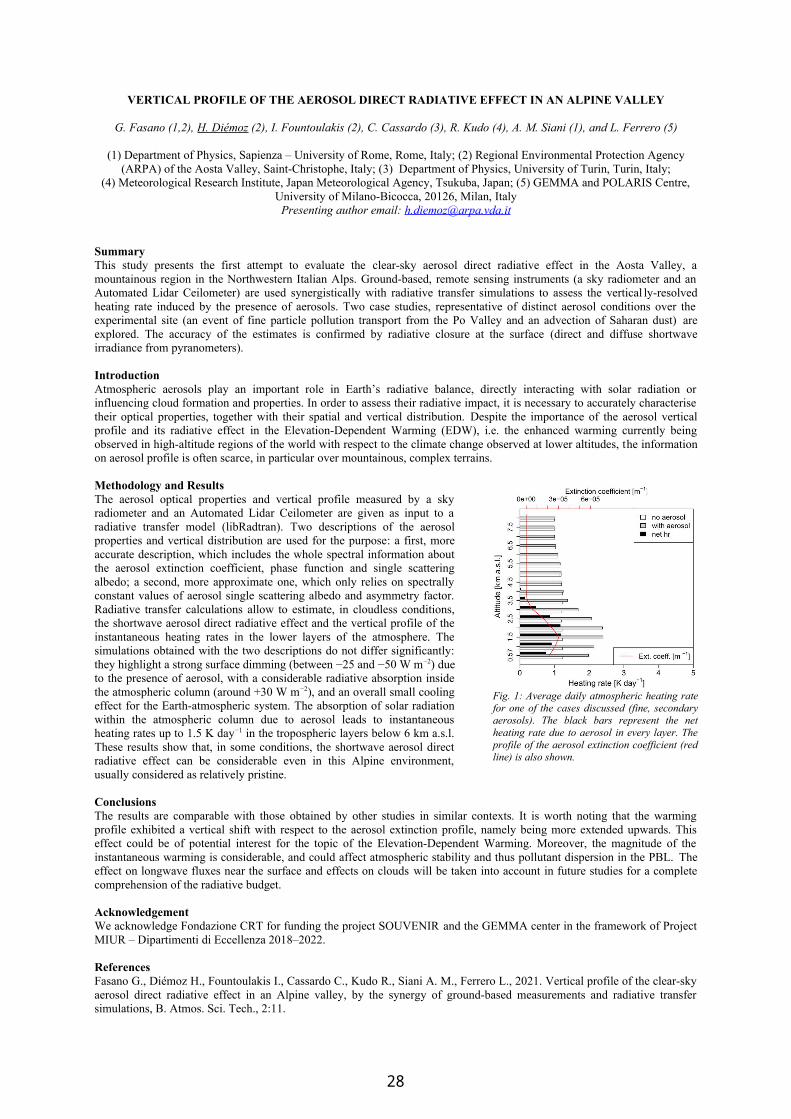
VERTICAL PROFILE OF THE AEROSOL DIRECT RADIATIVE EFFECT IN AN ALPINE VALLEY
G. Fasano (1,2), H. Diemoz (2), I. Fountoulakis (2), C. Cassardo (3), R. Kudo (4), A. M. Siani (1), and L. Ferrero (5)
(1) Department of Physics, Sapienza – University of Rome, Rome, Italy; (2) Regional Environmental Protection Agency(ARPA) of the Aosta Valley, Saint-Christophe, Italy; (3) Department of Physics, University of Turin, Turin, Italy;
(4) Meteorological Research Institute, Japan Meteorological Agency, Tsukuba, Japan; (5) GEMMA and POLARIS Centre,University of Milano-Bicocca, 20126, Milan, Italy
Presenting author email: [email protected]
SummaryThis study presents the first attempt to evaluate the clear-sky aerosol direct radiative effect in the Aosta Valley, amountainous region in the Northwestern Italian Alps. Ground-based, remote sensing instruments (a sky radiometer and anAutomated Lidar Ceilometer) are used synergistically with radiative transfer simulations to assess the vertical ly-resolvedheating rate induced by the presence of aerosols. Two case studies, representative of distinct aerosol conditions over theexperimental site (an event of fine particle pollution transport from the Po Valley and an advection of Saharan dust) areexplored. The accuracy of the estimates is confirmed by radiative closure at the surface (direct and diffuse shortwaveirradiance from pyranometers).
IntroductionAtmospheric aerosols play an important role in Earth’s radiative balance, directly interacting with solar radiation orinfluencing cloud formation and properties. In order to assess their radiative impact, it is necessary to accurately characterisetheir optical properties, together with their spatial and vertical distribution. Despite the importance of the aerosol verticalprofile and its radiative effect in the Elevation-Dependent Warming (EDW), i.e. the enhanced warming currently beingobserved in high-altitude regions of the world with respect to the climate change observed at lower altitudes, the informationon aerosol profile is often scarce, in particular over mountainous, complex terrains.
Methodology and ResultsThe aerosol optical properties and vertical profile measured by a skyradiometer and an Automated Lidar Ceilometer are given as input to aradiative transfer model (libRadtran). Two descriptions of the aerosolproperties and vertical distribution are used for the purpose: a first, moreaccurate description, which includes the whole spectral information aboutthe aerosol extinction coefficient, phase function and single scatteringalbedo; a second, more approximate one, which only relies on spectrallyconstant values of aerosol single scattering albedo and asymmetry factor.Radiative transfer calculations allow to estimate, in cloudless conditions,the shortwave aerosol direct radiative effect and the vertical profile of theinstantaneous heating rates in the lower layers of the atmosphere. Thesimulations obtained with the two descriptions do not differ significantly:they highlight a strong surface dimming (between −25 and −50 W m−2) dueto the presence of aerosol, with a considerable radiative absorption insidethe atmospheric column (around +30 W m−2), and an overall small coolingeffect for the Earth-atmospheric system. The absorption of solar radiationwithin the atmospheric column due to aerosol leads to instantaneousheating rates up to 1.5 K day−1 in the tropospheric layers below 6 km a.s.l.These results show that, in some conditions, the shortwave aerosol directradiative effect can be considerable even in this Alpine environment,usually considered as relatively pristine.
ConclusionsThe results are comparable with those obtained by other studies in similar contexts. It is worth noting that the warmingprofile exhibited a vertical shift with respect to the aerosol extinction profile, namely being more extended upwards. Thiseffect could be of potential interest for the topic of the Elevation-Dependent Warming. Moreover, the magnitude of theinstantaneous warming is considerable, and could affect atmospheric stability and thus pollutant dispersion in the PBL. Theeffect on longwave fluxes near the surface and effects on clouds will be taken into account in future studies for a completecomprehension of the radiative budget.
AcknowledgementWe acknowledge Fondazione CRT for funding the project SOUVENIR and the GEMMA center in the framework of ProjectMIUR – Dipartimenti di Eccellenza 2018–2022.
ReferencesFasano G., Diemoz H., Fountoulakis I., Cassardo C., Kudo R., Siani A. M., Ferrero L., 2021. Vertical profile of the clear-skyaerosol direct radiative effect in an Alpine valley, by the synergy of ground-based measurements and radiative transfersimulations, B. Atmos. Sci. Tech., 2:11.
Fig. 1: Average daily atmospheric heating ratefor one of the cases discussed (fine, secondaryaerosols). The black bars represent the netheating rate due to aerosol in every layer. Theprofile of the aerosol extinction coefficient (redline) is also shown.
28
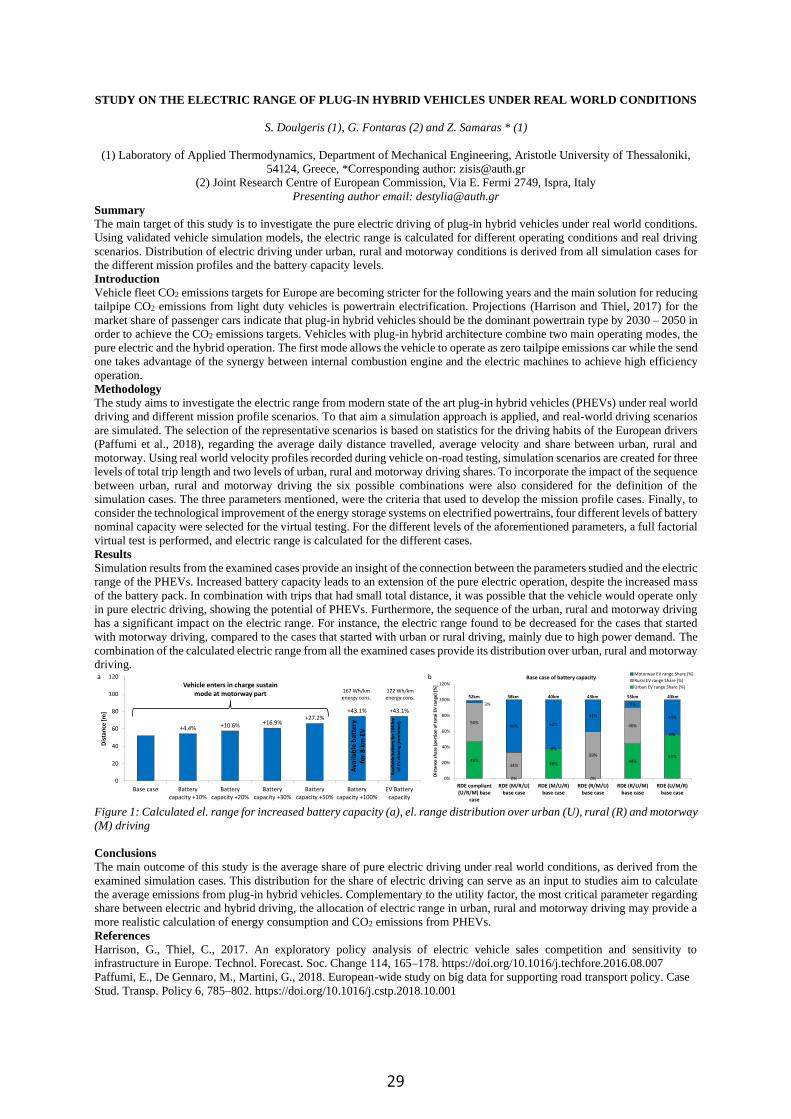
STUDY ON THE ELECTRIC RANGE OF PLUG-IN HYBRID VEHICLES UNDER REAL WORLD CONDITIONS
S. Doulgeris (1), G. Fontaras (2) and Z. Samaras * (1)
(1) Laboratory of Applied Thermodynamics, Department of Mechanical Engineering, Aristotle University of Thessaloniki,
54124, Greece, *Corresponding author: [email protected]
(2) Joint Research Centre of European Commission, Via E. Fermi 2749, Ispra, Italy
Presenting author email: [email protected]
Summary
The main target of this study is to investigate the pure electric driving of plug-in hybrid vehicles under real world conditions.
Using validated vehicle simulation models, the electric range is calculated for different operating conditions and real driving
scenarios. Distribution of electric driving under urban, rural and motorway conditions is derived from all simulation cases for
the different mission profiles and the battery capacity levels.
Introduction
Vehicle fleet CO2 emissions targets for Europe are becoming stricter for the following years and the main solution for reducing
tailpipe CO2 emissions from light duty vehicles is powertrain electrification. Projections (Harrison and Thiel, 2017) for the
market share of passenger cars indicate that plug-in hybrid vehicles should be the dominant powertrain type by 2030 – 2050 in
order to achieve the CO2 emissions targets. Vehicles with plug-in hybrid architecture combine two main operating modes, the
pure electric and the hybrid operation. The first mode allows the vehicle to operate as zero tailpipe emissions car while the send
one takes advantage of the synergy between internal combustion engine and the electric machines to achieve high efficiency
operation.
Methodology
The study aims to investigate the electric range from modern state of the art plug-in hybrid vehicles (PHEVs) under real world
driving and different mission profile scenarios. To that aim a simulation approach is applied, and real-world driving scenarios
are simulated. The selection of the representative scenarios is based on statistics for the driving habits of the European drivers
(Paffumi et al., 2018), regarding the average daily distance travelled, average velocity and share between urban, rural and
motorway. Using real world velocity profiles recorded during vehicle on-road testing, simulation scenarios are created for three
levels of total trip length and two levels of urban, rural and motorway driving shares. To incorporate the impact of the sequence
between urban, rural and motorway driving the six possible combinations were also considered for the definition of the
simulation cases. The three parameters mentioned, were the criteria that used to develop the mission profile cases. Finally, to
consider the technological improvement of the energy storage systems on electrified powertrains, four different levels of battery
nominal capacity were selected for the virtual testing. For the different levels of the aforementioned parameters, a full factorial
virtual test is performed, and electric range is calculated for the different cases.
Results
Simulation results from the examined cases provide an insight of the connection between the parameters studied and the electric
range of the PHEVs. Increased battery capacity leads to an extension of the pure electric operation, despite the increased mass
of the battery pack. In combination with trips that had small total distance, it was possible that the vehicle would operate only
in pure electric driving, showing the potential of PHEVs. Furthermore, the sequence of the urban, rural and motorway driving
has a significant impact on the electric range. For instance, the electric range found to be decreased for the cases that started
with motorway driving, compared to the cases that started with urban or rural driving, mainly due to high power demand. The
combination of the calculated electric range from all the examined cases provide its distribution over urban, rural and motorway
driving.
Figure 1: Calculated el. range for increased battery capacity (a), el. range distribution over urban (U), rural (R) and motorway
(M) driving
Conclusions
The main outcome of this study is the average share of pure electric driving under real world conditions, as derived from the
examined simulation cases. This distribution for the share of electric driving can serve as an input to studies aim to calculate
the average emissions from plug-in hybrid vehicles. Complementary to the utility factor, the most critical parameter regarding
share between electric and hybrid driving, the allocation of electric range in urban, rural and motorway driving may provide a
more realistic calculation of energy consumption and CO2 emissions from PHEVs.
References
Harrison, G., Thiel, C., 2017. An exploratory policy analysis of electric vehicle sales competition and sensitivity to
infrastructure in Europe. Technol. Forecast. Soc. Change 114, 165–178. https://doi.org/10.1016/j.techfore.2016.08.007
Paffumi, E., De Gennaro, M., Martini, G., 2018. European-wide study on big data for supporting road transport policy. Case
Stud. Transp. Policy 6, 785–802. https://doi.org/10.1016/j.cstp.2018.10.001
46%
0%
38%
0%
44%56%
50%
34%
0%
59%
46%
0%
3%
66% 62%
41%
8%
44%
0%
20%
40%
60%
80%
100%
120%
RDE compliant(U/R/M) base
case
RDE (M/R/U)base case
RDE (M/U/R)base case
RDE (R/M/U)base case
RDE (R/U/M)base case
RDE (U/M/R)base case
Dis
tan
ce s
har
e (
po
rtio
n o
f to
tal E
V r
ange
) [%
]
Base case of battery capacityMotorway EV range Share [%]
Rural EV range Share [%]
Urban EV range Share [%]
52km 38km 40km 43km 55km 43km
b
+4.4% +10.6% +16.9%+27.2%
+43.1% +43.1%
0
20
40
60
80
100
120
Base case Batterycapacity +10%
Batterycapacity +20%
Batterycapacity +30%
Batterycapacity +50%
Batterycapacity +100%
EV Batterycapacity
Dis
tan
ce [
m]
Vehicle enters in charge sustain mode at motorway part
Ava
ilab
le b
atte
ry
for
8 k
m E
V
167 Wh/km energy cons.
172 Wh/km energy cons.
Ava
ilab
le b
atte
ry f
or
10
6 k
m
of
EV d
rivi
ng
(co
mb
ine
d)
a
29

MEASURING THE IMPACT OF INLAND SHIPPING ON AIR POLLUTANT IMMISSIONS
ALONG THE UPPER RHINE IN GERMANY
P. Eger (1), T. Mathes (1), A. Zavarsky (1), T. Ternes (1) and L. Düster (1)
(1) Federal Institute of Hydrology, Am Mainzer Tor 1, 56068 Koblenz, Germany
Presenting author email: [email protected]
Summary
This study aims on a better understanding of the contribution of inland shipping on local air quality along the riversides of
German waterways. We quantify the emissions of atmospheric pollutants from cargo, tanker and cruise ships by using
various instrumentation to measure gaseous (NO2, NO, CO2, O3) and particulate (particle number concentration and size
distribution, black carbon) compounds at two measurement stations along the Upper Rhine in Germany. From our collected
data we derive typical plume characteristics like chemical composition, NO2-to-NOx ratio and particle size distribution. In
addition, the contribution of inland ships to atmospheric concentrations of nitrogen dioxide (NO2) and particulate matter
(PM2.5, PM10) is estimated and distinguished from local background levels (resulting from road transport, industry, residential
heating and agriculture). By comparing the amount of pollutants to the amount of CO2 measured, we calculate emission
factors for different vessel types and speeds relative to the river current, which can be used as a valuable input for micro-scale
atmospheric transport models.
Introduction
Besides industry and agriculture, the transport sector plays a central role when it comes to the emission of atmospheric
pollutants and the potential adverse effects on air quality and human health. Whereas the impact of road transport on
particulate matter and nitrogen dioxide levels has been controversially discussed in the past, the contribution of inland ships
(which often use relatively old Diesel engines) in the vicinity of busy
waterways is hardly explored. As part of the research project “RAUCH”
we aim on in-situ investigating the composition of ship exhaust plumes
and quantifying the influence of inland shipping on local air quality.
Methodology
We measure gaseous and particulate pollutants at two different stations
along the Upper Rhine. One is located in the city of Worms, in direct
vicinity to the shipping channel (instruments in a room inside a bridge)
and the other one in a more rural area, at a distance of about 100 meters to
the riverside. Along the measured species are NO2, NO, CO2, O3,
particulate matter (number concentration and size distribution from 10 nm
to 10 µm diameter) and black carbon. In addition, we use anonymised ship
position data (AIS) and a meteorological station to assign the peaks in
pollutant concentration to individual ships. The data has been collected for
a period of several months (April to December 2021) and is analysed with
regard to emission factors of various pollutants (relative to the amount of
fuel/energy used) and the contribution of ships to local pollutant levels.
Results
Peak NO2 concentrations measured at the two stations show a large
variation, depending on meteorological conditions and the distance of
individual ships to the point of measurement. The average contribution of
shipping to the local NO2 level is estimated as 0.6 ppb directly above the
shipping lane and 0.1 ppb at a distance of 100 m to the riverside. The
NO2-to-NOx ratio ranges from 5 to 8 % when sampled emissions are fresh
and reaches values up to 50 % in chemically aged plumes. For both
stations inland ships are found to mostly emit particles in the ultra-fine
range (UFP) with a diameter below 100 nm. This results in an average
contribution to PM2.5 levels of 0.5 µg/m³ in Worms, whereas the total
number concentration is increased by ~15 %. Emission factors (25-75 %
percentiles) calculated for the average fleet passing the station at the
Upper Rhine in Worms are 6-9 g NOx/kWh, 0.3-0.7 g NO2/kWh, 0.15-
0.30 g PM2.5/kWh and 0.05-0.12 g BC/kWh.
Conclusions and Outlook
Our results help to quantify the impact of ship emissions in cities located
along the Rhine by expanding the existing data basis for emission factors
of inland ships. The experimental data can serve as a valuable input to improve micro-scale atmospheric transport models and
help to make the impact of regulation and the modernization of the ship fleet visible. For the future it is planned to extend and
automatize data acquisition at existing stations and to further initiate measurements at other locations along navigable
waterways, e.g. at the Lower Rhine and the inland shipping channels in the North of Germany.
Fig.2 Time series of measured pollutants for a
ship in direct vicinity of the station in Worms.
Fig.1 Photo of the Rhine bridge in Worms. The inlet position is indicated by a blue circle.
30
QUANTIFICATION OF GREENHOUSE GAS EMISSIONS IN THESSALONIKI
Lena Feld (1), Roland Ruhnke (1), Frank Hase (1), Christian Scharun (1), Marios Mermigkas (2), Dimitrios Balis (2), andPeter Braesicke (1)
(1) Institute of Meteorology and Climate Research, Karlsruhe Institute of Technology, Karlsruhe, Germany; (2) Departmentof Applied and Environmental Physics, Aristotle University of Thessaloniki, Thessaloniki, Greece
Presenting author email: [email protected]
SummaryThis project aims to combine greenhouse gas (GHG) measurements and simulations to quantify the emissions in the urbanarea of Thessaloniki. Results of a preliminary measurement campaign in October 2021 are presented as well as a firstsimulation of the distribution and dispersion of GHG.
IntroductionLarge cities and urban areas are major contributors to methane and carbon-dioxide emissions. Official emission inventoriesare mostly based on a approach where the emissions are derived from activity data, e.g. fossil fuel burning. Differences in thereporting processes in different countries lead to high uncertainties in the official inventories (Scharun, 2022).
Methodology and resultsThe COllaborative Carbon Column Observing Network (COCCON) (Frey et al., 2019) measures the column-averaged dry-air mole fraction of GHG using ground-based remote sensing. In particular, the portable Fourier transform infrared (FTIR)spectrometers EM27/SUN are used, which were developed at KIT in cooperation with Bruker. Both stationary measurementsover longer periods of time as well as time-limited measurement campaigns with several instruments are performed. In theframework of measurement campaigns, the emissions of selected cities in Europe have been determined by measurements inorder to compare them with the results of the official inventories (see e.g. Hase et al., 2015).In order to gain further insights on the emissions responsible for the observed variations of column-avegared GHGabundances, the distribution and dispersion of GHG will be simulated with the state-of-the-art weather forecast model ICON(Zängl et al., 2015) and the ART extension for aerosols and reactive trace gases (Schröter et al., 2018) developed at KIT.
In the presented project, results of a smaller campaign in Thessaloniki in October 2021 are shown, which will becomplemented by a campaign lasting several months in the same location planned for summer 2022.The side-by-side calibration performed in October 2021 show a good agreement between the spectrometers. In the data of theOctober campaign gradients in the GHG abundances are clearly visible between the two stations hinting to detectableemissions in the area. Corresponding simulations capture a distinct emission plume over the city. However the modelconfiguration, including assumed emission strength and resolution, will be adjusted in order to properly match theobservations.For the campaign in summer 2022 it is also planned to improve measurement quality by selecting different observation sitesoptimized according to wind forecast.The aim of the project presented here is to improve the evaluation of the measurement campaigns by linking themeasurement results more directly to simulations of emissions and transport.
ConclusionCOCCON measurement campaigns are an effective method to verify official emission inventories. Data from a smallercampaign in Thessaloniki show clear signs of emissions in the area. To interpret this data set, corresponding simulations areinitialized, first simulations show a visible emission plume. In future, these simulations will be adapted and then linked to themeasurements to target a sophisticated estimate about the emission strength in the urban area of Thessaloniki.
ReferencesFrey, M., Sha, M. K., Hase, F., Kiel, M., Blumenstock, T., Harig, R., et al. (2019). Building the COllaborative Carbon
Column Observing Network (COCCON): long-term stability and ensemble performance of the EM27/SUN Fouriertransform spectrometer. Atmospheric Measurement Techniques, 12(3), 1513–1530. https://doi.org/10.5194/amt-12-1513-2019
Hase, F., Frey, M., Blumenstock, T., Groß, J., Kiel, M., Kohlhepp, R., et al. (2015). Application of portable FTIRspectrometers for detecting greenhouse gas emissions of the major city Berlin. Atmospheric MeasurementTechniques, 8(7), 3059–3068. https://doi.org/10.5194/amt-8-3059-2015
Scharun, C. (2022). Quantifying and modeling methane emissions from the North Sea region with ICON-ART. KarlsruheInstitute of Technology, Karlsruhe. https://doi.org/10.5445/IR/1000141826
Schröter, J., Rieger, D., Stassen, C., Vogel, H., Weimer, M., Werchner, S., et al. (2018). ICON-ART 2.1: a flexible tracerframework and its application for composition studies in numerical weather forecasting and climate simulations.Geoscientific Model Development, 11(10), 4043–4068. https://doi.org/10.5194/gmd-11-4043-2018
Zängl, G., Reinert, D., Rípodas, P., & Baldauf, M. (2015). The ICON (ICOsahedral Non-hydrostatic) modelling frameworkof DWD and MPI-M: Description of the non-hydrostatic dynamical core. Quarterly Journal of the RoyalMeteorological Society, 141(687), 563–579. https://doi.org/10.1002/qj.2378
31
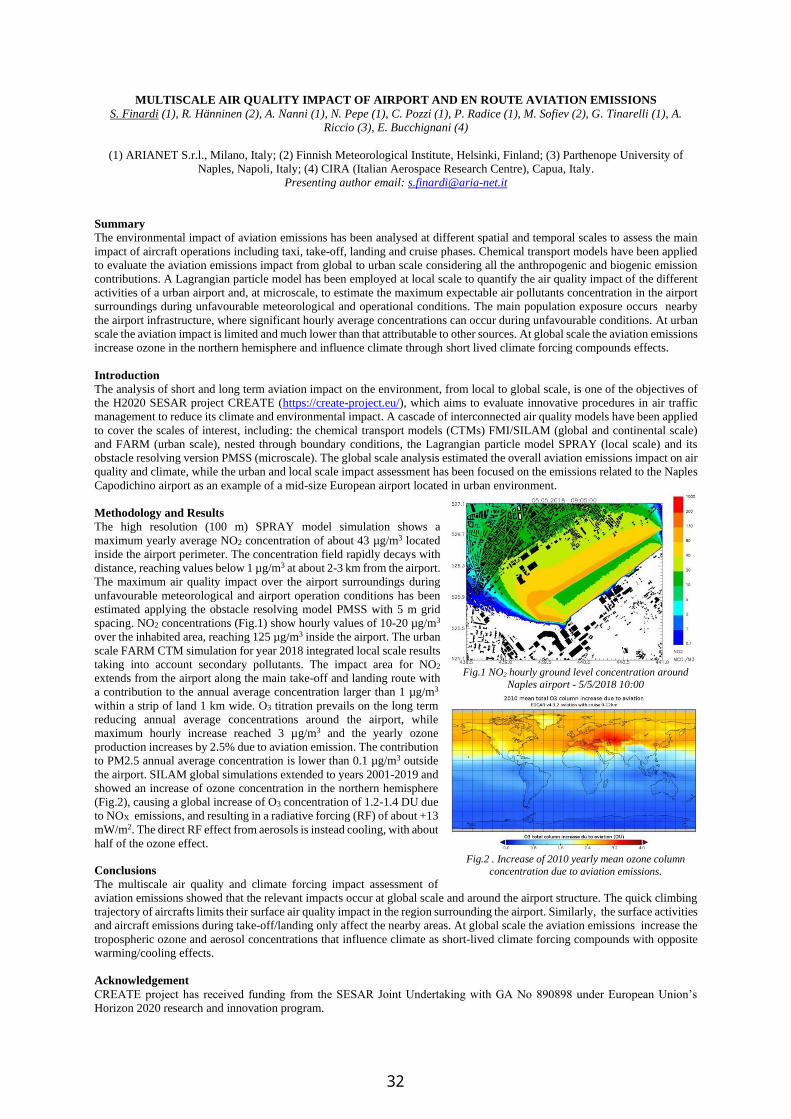
MULTISCALE AIR QUALITY IMPACT OF AIRPORT AND EN ROUTE AVIATION EMISSIONS
S. Finardi (1), R. Hänninen (2), A. Nanni (1), N. Pepe (1), C. Pozzi (1), P. Radice (1), M. Sofiev (2), G. Tinarelli (1), A.
Riccio (3), E. Bucchignani (4)
(1) ARIANET S.r.l., Milano, Italy; (2) Finnish Meteorological Institute, Helsinki, Finland; (3) Parthenope University of
Naples, Napoli, Italy; (4) CIRA (Italian Aerospace Research Centre), Capua, Italy. Presenting author email: [email protected]
Summary The environmental impact of aviation emissions has been analysed at different spatial and temporal scales to assess the main
impact of aircraft operations including taxi, take-off, landing and cruise phases. Chemical transport models have been applied
to evaluate the aviation emissions impact from global to urban scale considering all the anthropogenic and biogenic emission
contributions. A Lagrangian particle model has been employed at local scale to quantify the air quality impact of the different
activities of a urban airport and, at microscale, to estimate the maximum expectable air pollutants concentration in the airport
surroundings during unfavourable meteorological and operational conditions. The main population exposure occurs nearby
the airport infrastructure, where significant hourly average concentrations can occur during unfavourable conditions. At urban
scale the aviation impact is limited and much lower than that attributable to other sources. At global scale the aviation emissions
increase ozone in the northern hemisphere and influence climate through short lived climate forcing compounds effects.
Introduction The analysis of short and long term aviation impact on the environment, from local to global scale, is one of the objectives of
the H2020 SESAR project CREATE (https://create-project.eu/), which aims to evaluate innovative procedures in air traffic
management to reduce its climate and environmental impact. A cascade of interconnected air quality models have been applied
to cover the scales of interest, including: the chemical transport models (CTMs) FMI/SILAM (global and continental scale)
and FARM (urban scale), nested through boundary conditions, the Lagrangian particle model SPRAY (local scale) and its
obstacle resolving version PMSS (microscale). The global scale analysis estimated the overall aviation emissions impact on air
quality and climate, while the urban and local scale impact assessment has been focused on the emissions related to the Naples
Capodichino airport as an example of a mid-size European airport located in urban environment.
Methodology and Results The high resolution (100 m) SPRAY model simulation shows a
maximum yearly average NO2 concentration of about 43 µg/m3 located
inside the airport perimeter. The concentration field rapidly decays with
distance, reaching values below 1 µg/m3 at about 2-3 km from the airport.
The maximum air quality impact over the airport surroundings during
unfavourable meteorological and airport operation conditions has been
estimated applying the obstacle resolving model PMSS with 5 m grid
spacing. NO2 concentrations (Fig.1) show hourly values of 10-20 µg/m3
over the inhabited area, reaching 125 µg/m3 inside the airport. The urban
scale FARM CTM simulation for year 2018 integrated local scale results
taking into account secondary pollutants. The impact area for NO2
extends from the airport along the main take-off and landing route with
a contribution to the annual average concentration larger than 1 µg/m3
within a strip of land 1 km wide. O3 titration prevails on the long term
reducing annual average concentrations around the airport, while
maximum hourly increase reached 3 µg/m3 and the yearly ozone
production increases by 2.5% due to aviation emission. The contribution
to PM2.5 annual average concentration is lower than 0.1 µg/m3 outside
the airport. SILAM global simulations extended to years 2001-2019 and
showed an increase of ozone concentration in the northern hemisphere
(Fig.2), causing a global increase of O3 concentration of 1.2-1.4 DU due
to NOX emissions, and resulting in a radiative forcing (RF) of about +13
mW/m2. The direct RF effect from aerosols is instead cooling, with about
half of the ozone effect.
Conclusions The multiscale air quality and climate forcing impact assessment of
aviation emissions showed that the relevant impacts occur at global scale and around the airport structure. The quick climbing
trajectory of aircrafts limits their surface air quality impact in the region surrounding the airport. Similarly, the surface activities
and aircraft emissions during take-off/landing only affect the nearby areas. At global scale the aviation emissions increase the
tropospheric ozone and aerosol concentrations that influence climate as short-lived climate forcing compounds with opposite
warming/cooling effects.
Acknowledgement CREATE project has received funding from the SESAR Joint Undertaking with GA No 890898 under European Union’s
Horizon 2020 research and innovation program.
Fig.1 NO2 hourly ground level concentration around
Naples airport - 5/5/2018 10:00
Fig.2 . Increase of 2010 yearly mean ozone column
concentration due to aviation emissions.
32
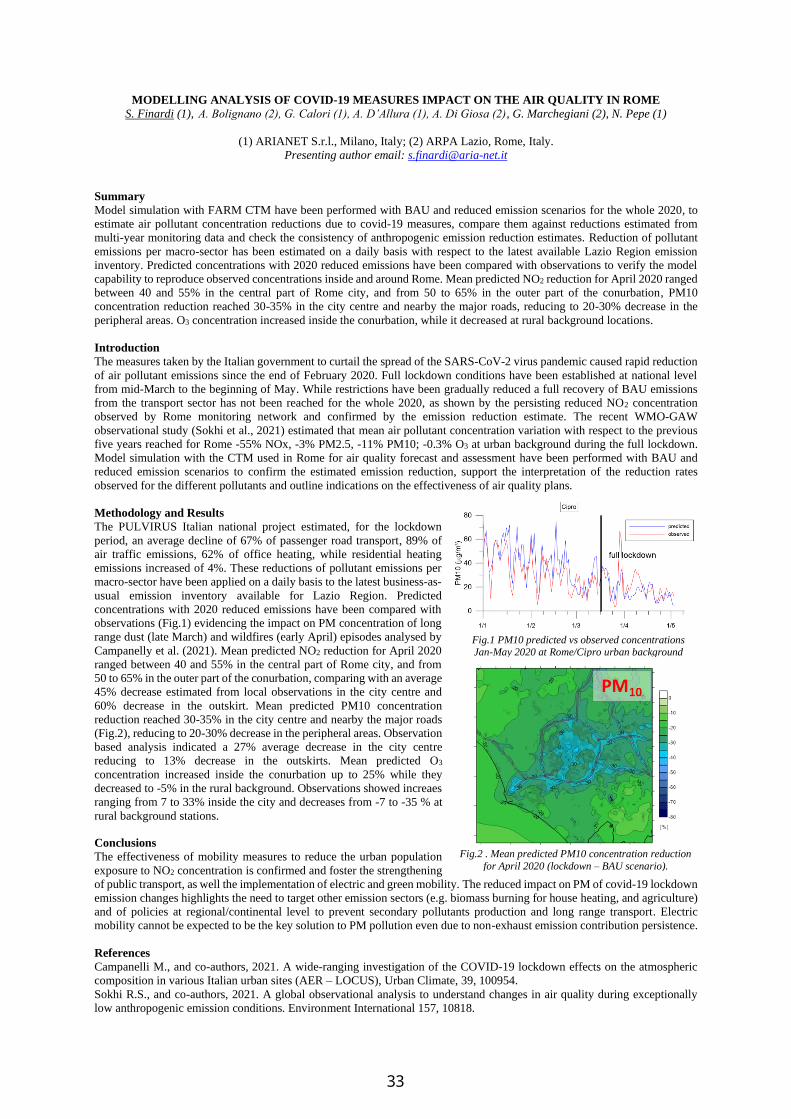
MODELLING ANALYSIS OF COVID-19 MEASURES IMPACT ON THE AIR QUALITY IN ROME
S. Finardi (1), A. Bolignano (2), G. Calori (1), A. D’Allura (1), A. Di Giosa (2), G. Marchegiani (2), N. Pepe (1)
(1) ARIANET S.r.l., Milano, Italy; (2) ARPA Lazio, Rome, Italy. Presenting author email: [email protected]
Summary Model simulation with FARM CTM have been performed with BAU and reduced emission scenarios for the whole 2020, to
estimate air pollutant concentration reductions due to covid-19 measures, compare them against reductions estimated from
multi-year monitoring data and check the consistency of anthropogenic emission reduction estimates. Reduction of pollutant
emissions per macro-sector has been estimated on a daily basis with respect to the latest available Lazio Region emission
inventory. Predicted concentrations with 2020 reduced emissions have been compared with observations to verify the model
capability to reproduce observed concentrations inside and around Rome. Mean predicted NO2 reduction for April 2020 ranged
between 40 and 55% in the central part of Rome city, and from 50 to 65% in the outer part of the conurbation, PM10
concentration reduction reached 30-35% in the city centre and nearby the major roads, reducing to 20-30% decrease in the
peripheral areas. O3 concentration increased inside the conurbation, while it decreased at rural background locations.
Introduction The measures taken by the Italian government to curtail the spread of the SARS-CoV-2 virus pandemic caused rapid reduction
of air pollutant emissions since the end of February 2020. Full lockdown conditions have been established at national level
from mid-March to the beginning of May. While restrictions have been gradually reduced a full recovery of BAU emissions
from the transport sector has not been reached for the whole 2020, as shown by the persisting reduced NO2 concentration
observed by Rome monitoring network and confirmed by the emission reduction estimate. The recent WMO-GAW
observational study (Sokhi et al., 2021) estimated that mean air pollutant concentration variation with respect to the previous
five years reached for Rome -55% NOx, -3% PM2.5, -11% PM10; -0.3% O3 at urban background during the full lockdown.
Model simulation with the CTM used in Rome for air quality forecast and assessment have been performed with BAU and
reduced emission scenarios to confirm the estimated emission reduction, support the interpretation of the reduction rates
observed for the different pollutants and outline indications on the effectiveness of air quality plans.
Methodology and Results The PULVIRUS Italian national project estimated, for the lockdown
period, an average decline of 67% of passenger road transport, 89% of
air traffic emissions, 62% of office heating, while residential heating
emissions increased of 4%. These reductions of pollutant emissions per
macro-sector have been applied on a daily basis to the latest business-as-
usual emission inventory available for Lazio Region. Predicted
concentrations with 2020 reduced emissions have been compared with
observations (Fig.1) evidencing the impact on PM concentration of long
range dust (late March) and wildfires (early April) episodes analysed by
Campanelly et al. (2021). Mean predicted NO2 reduction for April 2020
ranged between 40 and 55% in the central part of Rome city, and from
50 to 65% in the outer part of the conurbation, comparing with an average
45% decrease estimated from local observations in the city centre and
60% decrease in the outskirt. Mean predicted PM10 concentration
reduction reached 30-35% in the city centre and nearby the major roads
(Fig.2), reducing to 20-30% decrease in the peripheral areas. Observation
based analysis indicated a 27% average decrease in the city centre
reducing to 13% decrease in the outskirts. Mean predicted O3
concentration increased inside the conurbation up to 25% while they
decreased to -5% in the rural background. Observations showed increaes
ranging from 7 to 33% inside the city and decreases from -7 to -35 % at
rural background stations.
Conclusions The effectiveness of mobility measures to reduce the urban population
exposure to NO2 concentration is confirmed and foster the strengthening
of public transport, as well the implementation of electric and green mobility. The reduced impact on PM of covid-19 lockdown
emission changes highlights the need to target other emission sectors (e.g. biomass burning for house heating, and agriculture)
and of policies at regional/continental level to prevent secondary pollutants production and long range transport. Electric
mobility cannot be expected to be the key solution to PM pollution even due to non-exhaust emission contribution persistence.
References Campanelli M., and co-authors, 2021. A wide-ranging investigation of the COVID-19 lockdown effects on the atmospheric
composition in various Italian urban sites (AER – LOCUS), Urban Climate, 39, 100954.
Sokhi R.S., and co-authors, 2021. A global observational analysis to understand changes in air quality during exceptionally
low anthropogenic emission conditions. Environment International 157, 10818.
Fig.1 PM10 predicted vs observed concentrations Jan-May 2020 at Rome/Cipro urban background
station
Fig.2 . Mean predicted PM10 concentration reduction
for April 2020 (lockdown – BAU scenario).
33

Contribution of shipping to air pollution in the Mediterranean region – model evaluation of five regional scale
chemistry transport models
Lea Fink (1), Volker Matthias (1), Matthias Karl (1), Sonia Oppo (2), Damien Piga (2), Elisa Majamäki (3), Jukka-Pekka Jalkanen (3), Jeroen Kuenen (4), Richard Kranenburg (4), Jana Moldanova (5), Sara Jutterström (5)
(1) Helmholtz-Zentrum Hereon, Institute of Coastal Environmental Chemistry, 21502 Geesthacht, Germany; (2) AtmoSud,
13006 Marseille, France; (3) FMI, FI-00560 Helsinki, Finland; (4) TNO, 3584 CB Utrecht, The Netherlands; (5) IVL, Swedish Environmental Research Institute, 411 33 Göteborg, Sweden
Summary Regional air quality models are important tools for evaluating air quality issues and characterizing air pollution. Results act as guidance to enhance air quality management strategies, which are important regarding the impact of air pollution on human health and the environment. Intercomparison studies have shown that chemistry transport models (CTM) often underestimate NO2 and overestimate O3 concentrations (Karl et al. 2019; Im et al. 2015). In the framework of the SCIPPER project (Horizon 2020 project) five different chemistry transport models (CMAQ, Chimere, CAMx, LOTOS-EUROS, EMEP) are used to evaluate and compare modelled concentrations regarding regulatory air pollutants in the Mediterranean Sea. Models tend to underestimate NO2 and PM2.5 concentrations and overestimate O3 concentrations.
Introduction The Mediterranean Sea is a region with high ship traffic, which has a major contribution to emissions of air pollutants like NOx and particulate matter. Many cities along the Mediterranean coast show high concentrations of NO2 and particulate matter with combustion of ships being one main cause for this air pollution. Numerical chemistry transport models are applied to quantify the current impact of shipping on air pollution, but have simplifications and uncertainties leading to deviations among the various models and from observational data. To determine how well regional scale chemistry transport models simulate air pollutant concentrations and particularly the contribution of shipping to them, the model outputs from five regional scale models were compared against each other and to measured background data.
Methodology and Results The emission part of the set-up was the same for all models: ship emissions were calculated with STEAM version 3.3.0 and land-based emissions were taken from the CAMS-REG v2.2.1 dataset for a domain covering the Mediterranean Sea on a resolution of 12x12 km² (or 0.1° x 0.1°). All CTMs used their standard set-up for further input. With all models a reference run for the current air quality situation was performed including all emissions and one run without the emissions from shipping, i.e. the ship contribution was determined using the zero-out method. One run using the tagging method was performed with LOTOS-EUROS. The modelled year was 2015. Model results for total surface concentrations were evaluated against regular measurements provided by the EEA.
Results have shown that ship contribution to total NO2
looks similar for all models and highest contribution is at the main shipping routes with up to 85 % (Figure 1). Nevertheless, the distribution over the water area differs. Also, the tagging method calculates a lower shipping contribution with up to 75 %. Slightly
negative contributions over the Balkan peninsula are most likely an effect of non-linear chemistry effects in connection with the zero-out method. All models underestimated actually measured NO2 mean concentration by 52 % to 67 %. For O3 an inverse relationship was found with lowest contribution (-20 %) in areas with high NO2 values. The models overestimated the measured O3 mean concentration by 25 % to 55 %. Modelled PM2.5 ship contribution has values up to 15 % over the whole sea area but mostly at the main shipping routes. Four out of five models underestimated the actually measured PM2.5 mean values by up to 53 %.
Conclusion
Results show that there are differences and similarities between the model outputs. All models tend to underestimate NO2 and overestimate O3. Deviations from modelled to measured data and between the models can be traced back to combined uncertainties in input data as well as differences in the chemistry schemes.
References Im, U., Bianconi, R. Solazzo, E. et al. 2015. Evaluation of operational on-line-coupled regional air quality models over Europe and North America in the context of AQMEII phase 2. Part I: Ozone. Atmos. Environ. 115, 404-420. Karl, M., Jonson, J.E., Uppstu, A. et al., 2019. Effects of ship emissions on air quality in the Baltic Sea region simulated with
three different chemistry transport models. Atmos. Chem. Phys. 19, 7019-7053.
Acknowledgement This was work supported by SCIPPER project which has received funding from the European Union’s Horizon 2020 research and innovation programme under grant agreement Nr.814893.
Figure 1: annual mean NO2 ship contribution (a = CMAQ, b = Chimere, c = CAMx, d = LOTOS-EUROS (tagging), e = LOTOS-EUROS (zero-out), f = EMEP)
34
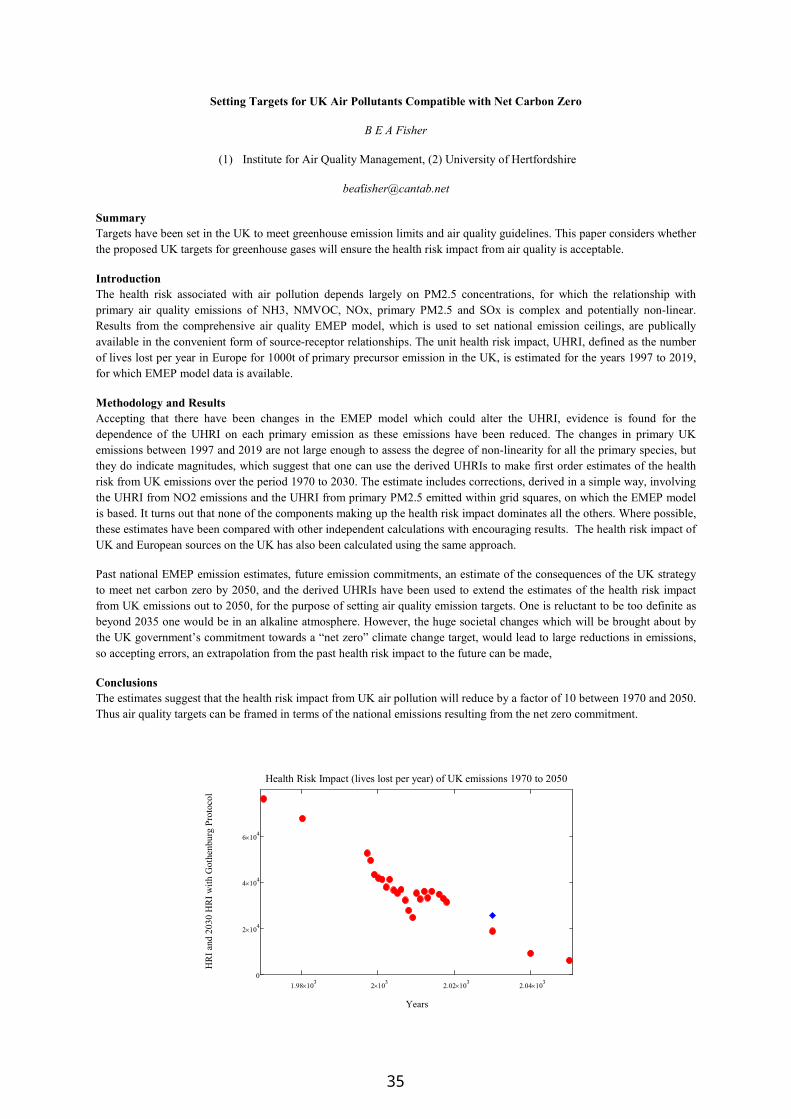
Setting Targets for UK Air Pollutants Compatible with Net Carbon Zero
B E A Fisher
(1) Institute for Air Quality Management, (2) University of Hertfordshire
Summary Targets have been set in the UK to meet greenhouse emission limits and air quality guidelines. This paper considers whether the proposed UK targets for greenhouse gases will ensure the health risk impact from air quality is acceptable.
Introduction The health risk associated with air pollution depends largely on PM2.5 concentrations, for which the relationship with primary air quality emissions of NH3, NMVOC, NOx, primary PM2.5 and SOx is complex and potentially non-linear. Results from the comprehensive air quality EMEP model, which is used to set national emission ceilings, are publically available in the convenient form of source-receptor relationships. The unit health risk impact, UHRI, defined as the number of lives lost per year in Europe for 1000t of primary precursor emission in the UK, is estimated for the years 1997 to 2019, for which EMEP model data is available.
Methodology and Results Accepting that there have been changes in the EMEP model which could alter the UHRI, evidence is found for the dependence of the UHRI on each primary emission as these emissions have been reduced. The changes in primary UK emissions between 1997 and 2019 are not large enough to assess the degree of non-linearity for all the primary species, but they do indicate magnitudes, which suggest that one can use the derived UHRIs to make first order estimates of the health risk from UK emissions over the period 1970 to 2030. The estimate includes corrections, derived in a simple way, involving the UHRI from NO2 emissions and the UHRI from primary PM2.5 emitted within grid squares, on which the EMEP model is based. It turns out that none of the components making up the health risk impact dominates all the others. Where possible, these estimates have been compared with other independent calculations with encouraging results. The health risk impact of UK and European sources on the UK has also been calculated using the same approach.
Past national EMEP emission estimates, future emission commitments, an estimate of the consequences of the UK strategy to meet net carbon zero by 2050, and the derived UHRIs have been used to extend the estimates of the health risk impact from UK emissions out to 2050, for the purpose of setting air quality emission targets. One is reluctant to be too definite as beyond 2035 one would be in an alkaline atmosphere. However, the huge societal changes which will be brought about by the UK government’s commitment towards a “net zero” climate change target, would lead to large reductions in emissions, so accepting errors, an extrapolation from the past health risk impact to the future can be made,
Conclusions The estimates suggest that the health risk impact from UK air pollution will reduce by a factor of 10 between 1970 and 2050. Thus air quality targets can be framed in terms of the national emissions resulting from the net zero commitment.
1.98 103 2 10
3 2.02 103 2.04 10
30
2 104
4 104
6 104
Health Risk Impact (lives lost per year) of UK emissions 1970 to 2050
Years
HR
I an
d 20
30 H
RI
wit
h G
othe
nbur
g P
roto
col
35
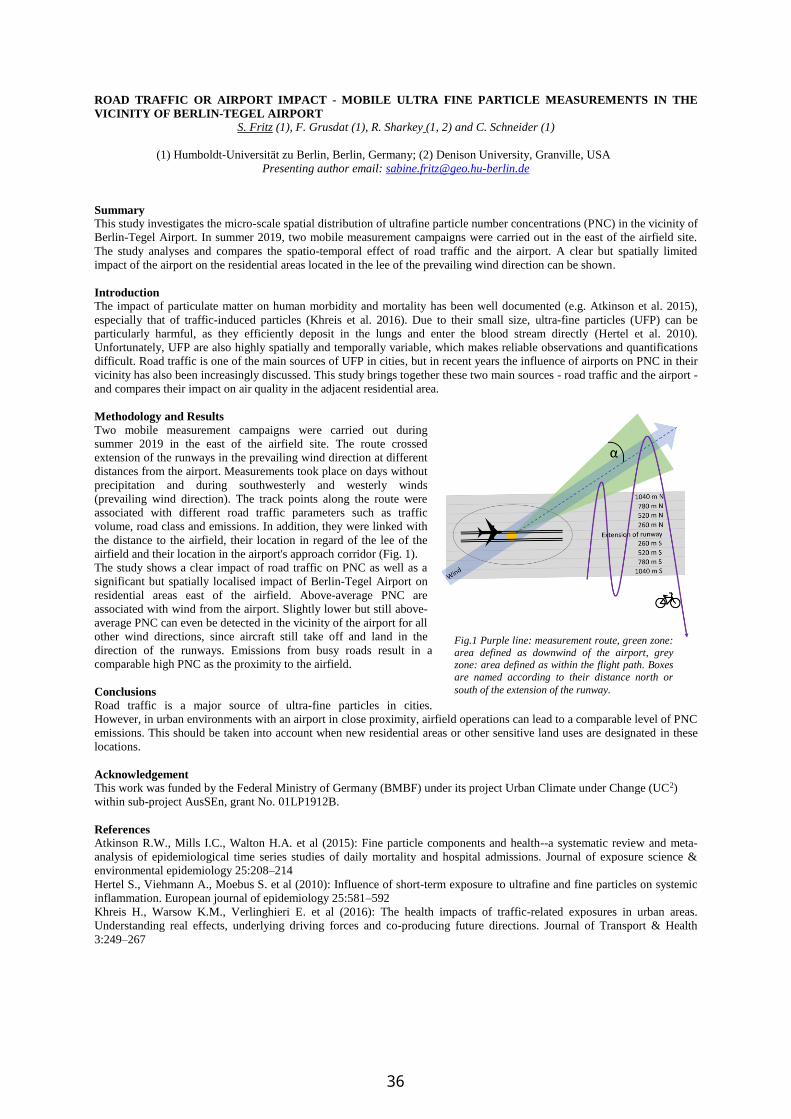
ROAD TRAFFIC OR AIRPORT IMPACT - MOBILE ULTRA FINE PARTICLE MEASUREMENTS IN THE
VICINITY OF BERLIN-TEGEL AIRPORT S. Fritz (1), F. Grusdat (1), R. Sharkey (1, 2) and C. Schneider (1)
(1) Humboldt-Universität zu Berlin, Berlin, Germany; (2) Denison University, Granville, USA
Presenting author email: [email protected]
Summary
This study investigates the micro-scale spatial distribution of ultrafine particle number concentrations (PNC) in the vicinity of
Berlin-Tegel Airport. In summer 2019, two mobile measurement campaigns were carried out in the east of the airfield site.
The study analyses and compares the spatio-temporal effect of road traffic and the airport. A clear but spatially limited
impact of the airport on the residential areas located in the lee of the prevailing wind direction can be shown.
Introduction
The impact of particulate matter on human morbidity and mortality has been well documented (e.g. Atkinson et al. 2015),
especially that of traffic-induced particles (Khreis et al. 2016). Due to their small size, ultra-fine particles (UFP) can be
particularly harmful, as they efficiently deposit in the lungs and enter the blood stream directly (Hertel et al. 2010).
Unfortunately, UFP are also highly spatially and temporally variable, which makes reliable observations and quantifications
difficult. Road traffic is one of the main sources of UFP in cities, but in recent years the influence of airports on PNC in their
vicinity has also been increasingly discussed. This study brings together these two main sources - road traffic and the airport -
and compares their impact on air quality in the adjacent residential area.
Methodology and Results
Two mobile measurement campaigns were carried out during
summer 2019 in the east of the airfield site. The route crossed
extension of the runways in the prevailing wind direction at different
distances from the airport. Measurements took place on days without
precipitation and during southwesterly and westerly winds
(prevailing wind direction). The track points along the route were
associated with different road traffic parameters such as traffic
volume, road class and emissions. In addition, they were linked with
the distance to the airfield, their location in regard of the lee of the
airfield and their location in the airport's approach corridor (Fig. 1).
The study shows a clear impact of road traffic on PNC as well as a
significant but spatially localised impact of Berlin-Tegel Airport on
residential areas east of the airfield. Above-average PNC are
associated with wind from the airport. Slightly lower but still above-
average PNC can even be detected in the vicinity of the airport for all
other wind directions, since aircraft still take off and land in the
direction of the runways. Emissions from busy roads result in a
comparable high PNC as the proximity to the airfield.
Conclusions
Road traffic is a major source of ultra-fine particles in cities.
However, in urban environments with an airport in close proximity, airfield operations can lead to a comparable level of PNC
emissions. This should be taken into account when new residential areas or other sensitive land uses are designated in these
locations.
Acknowledgement
This work was funded by the Federal Ministry of Germany (BMBF) under its project Urban Climate under Change (UC2)
within sub-project AusSEn, grant No. 01LP1912B.
References
Atkinson R.W., Mills I.C., Walton H.A. et al (2015): Fine particle components and health--a systematic review and meta-
analysis of epidemiological time series studies of daily mortality and hospital admissions. Journal of exposure science &
environmental epidemiology 25:208–214
Hertel S., Viehmann A., Moebus S. et al (2010): Influence of short-term exposure to ultrafine and fine particles on systemic
inflammation. European journal of epidemiology 25:581–592
Khreis H., Warsow K.M., Verlinghieri E. et al (2016): The health impacts of traffic-related exposures in urban areas.
Understanding real effects, underlying driving forces and co-producing future directions. Journal of Transport & Health
3:249–267
Fig.1 Purple line: measurement route, green zone:
area defined as downwind of the airport, grey zone: area defined as within the flight path. Boxes
are named according to their distance north or
south of the extension of the runway.
36

NON-EXHAUST PM EMISSIONS FROM RAILWAYS – IN-SITU MEASURMENTS AND PARAMETER STUDY
D. Fruhwirt (1), P. Sturm (1), T. Nöst (1), P. Leonhardt (1), A. Gruber (1), H. Steiner (2), A. Krieger (2)
(1) Institute of internal combustion engines and thermodynamics, Graz University of Technology, Austria; (2) Austrian Federal railways - ÖBB Infrastruktur AG, Vienna, Austria,
Presenting author email: [email protected] Summary Non-exhaust emissions from railways are mainly owed by abrasions and wear effects on brakes, wheels, rails and contact wires. A research on literature showed that only rare information is available about the quantity of emissions. Hence, extensive in-situ measurements were carried out in an Austrian high-speed railway tunnel to improve the database. These measurements include the monitoring of PM mass concentration, the chemical analysis of the dust composition and a study on the impact of relevant parameters. Based on the recorded data, emission factors were derived for different train categories and their dependency on the assessed parameters was analysed. Introduction Railways are an important part of the European transport strategy and are known as a green transport system as major parts of the railway tracks are electrified. However, due to wear processes and resuspension of dust the non-exhaust emissions of railways are relevant. Even if the emission sources and the emission mechanisms are well known, quite little information is available about the quantity of emissions. Some emission factors are published in Fridell 2010 and Piscitello 2021. First indicative results from in-situ measurements including derived TSP emission factors for various train categories are already published in Fruhwirt 2021. These results gave some information about the dependency of emissions on various parameters such as the train speed, the train length and precipitation. In order to investigate the impact of these parameters an additional measurement series has been started in June 2021. This publication presents first results from these measurements. Methodology and Results Due to the limited influence of secondary sources a tunnel was chosen as the test site for detailed investigations on the non-exhaust emission factors and relevant parameters. The measurement setup included two environmental dust monitors (GRIMM EDM180) as main monitors, two sequential air samplers (PARTISOL®-PLUS MODEL 2025) as a gravimetric reference, the monitoring of the tunnel air flow by the application of WS200 weather sensors, the monitoring of the outside air conditions (WS600) and a train detection system consisting of strain gauges on the rails and an IR camera for a video based analysis of the cargo. Using the data from these sensors the derivation of emission factors is done for PM1, PM2.5 as well as for PM10. First results show a strong dependency on the train speed and the train length. This could be observed by the comparison of railjet trains which are in operation in single traction as well as double traction. The influence of braking processes can be analysed by information about the train speed at both portal sites given by the train detection system. The PM1, PM2.5 and PM10 mass concentration curves during a braking event are shown in Figure 1. Compared to a train pass without braking, the share of PM1 and PM2.5 is significantly increased. Conclusions PM non-exhaust emissions from railways need to be investigated in more detail as there are numerous parameters that influence the actual emissions. In order to deepen the knowledge and to have more information about the impact of some parameters, the presented measurement series was carried out. First results indicate that the train speed and the train length are the most relevant factors. Brakes were already identified as the decisive source for non-exhaust emissions. This statement could be confirmed by the analysis of braking processes in which the PM concentration was significantly increased. The comparison of data from the optical dust monitor and the gravimetric reference device showed that special attention has to be paid on the density correction for optical monitors. Acknowledgement This work was funded by the Austrian Federal railways. A special thanks to Mr. Andreas Schön for his support in the project. References Fridell E., Ferm M., Ekberg A., 2010. Emissions of particulate matters from railways – Emission factors and condition monitoring. Journal of Transport Research Part D, 240 -245 Fruhwirt D., Sturm P., Steiner H., 2021. Particulate matter emissions in railway operation – in-situ measurements in an Austrian railway tunnel. International Transport and Air Pollution Conference, Graz, 2021 Piscitello A., Bianco C., Casasso A., Sethi R.; 2021. Non-exhaust traffic emissions: Sources, characterization, and mitigation measures. Journal of Science of the Total Environment 766
Fig.1 PM concentration curves during a braking process
37
SHORT-TERM EFFECTS OF PARTICULATE MATTER ON NATURAL MORTALITY IN ITALY
Claudio Gariazzo1, Matteo Renzi2, Alessandro Marinaccio1, Stefania Massari1, Sara Maio3, Massimo Stafoggia2, Giovanni
Viegi4, Stefania La Grutta3, on behalf of BIGEPI group.
1 Occupational and Environmental Medicine, Epidemiology and Hygiene Department, Italian Workers’ Compensation
Authority , Roma, Italy; 2 Department of Epidemiology, Lazio Regional Health Service, ASL Roma 1, Rome, Italy, 3 CNR –
Institute of Clinical Physiology, CNR, Pisa, Italy; 4 Institute for Research and Biomedical Innovation, CNR, Palermo, Italy
Presenting author email: [email protected]
Summary
The relationship between air pollution and natural mortality has been widely addressed in metropolitan areas but little is known
about the effects in non-urban settings. We estimated daily particulate matter (PM) concentrations at the municipality level
(1x1 km resolution) using satellite data and spatiotemporal predictors. We collected daily counts of mortality data for each
Italian municipality. Meta-analysis of province-specific estimates obtained by time-series models, adjusting for co-variates and
other confounders, was applied to extrapolate national estimates for the health outcome. Results addressed for positive
associations between PM and daily natural mortality when all types of municipalities are taken into account, finding risks even
at low concentrations and identifying the elderly as a population at higher risk.
Introduction
The adverse health effects of short-term exposure to ambient air pollution and in particular to particulate matter are well
documented (Liu et al., 2019). However, most evidence has been obtained from studies in large and well-monitored
metropolitan areas, whereas little is known about rural and suburban areas, mainly due to lack of information about exposure.
The availability of data from satellite observations and the progress of machine learning methods allowed to obtain countries
wide exposure estimations, which open to study health effects in less studied and monitored areas. The aim of this study was
to investigate about the association between daily PM concentrations and daily natural mortality in country wide context.
Materials and methods
The area of study covers the whole Italian territory, which is divided into 8,092 municipalities grouped in 110 administrative
provinces, with a total population of 60,483,973 inhabitants in 2017. Mortality data were extracted from the Italian National
Institute of Statistics (ISTAT) using the Tenth International Classification of Diseases (ICD-10). We selected data by day and
municipality of death. Natural all-causes (ICD-10 A00-R99) mortalities occurred during the study period (2013-2015) were
considered. Daily counts of cause-specific mortalities by each municipality were used to study the association with daily
ambient particulate matter concentrations. Daily mean concentrations of PM10 and PM2.5 at 1x1 km resolution were derived
from machine learning algorithms driven by satellite observations and spatiotemporal data. The entire process is described
elsewhere (M. Stafoggia et al. 2019). Daily estimates of mean air temperatures were obtained at 1x1km resolution by calibrating
air temperature observations to land surface temperature (LST) satellite data and spatiotemporal land use parameters. Daily
values of population weighted exposure to PM and temperature were then made available for the analysis at municipal level. The association of PM concentration with daily natural mortality was assessed using a time-series approach applying a two-
stage analytic protocol. In the first stage we applied a pooled analysis on the time-series of municipalities belonging to the same
province using over-dispersed Poisson generalized nonlinear models adjusted for a set of time-varying municipality-specific
covariates. In the second stage, we applied a random-effects meta-analysis to combine the province-specific estimates into a
national estimate. We then reported the pooled estimate and related 95% confidence intervals as the percentage change in daily
mortality per 10-μg-per-cubicmeter increase in PM concentration.
Results
During the studied period, 1.7M of persons died for natural causes. Among them 924K were female and 845K male. By
distinguishing them for age classes, we found 196K, 252K, 550K and 771K for ages 0-64, 65-74, 75-85 and 85+ respectively.
Mean PM10 and PM2.5 exposure were 21.12 and 15.06 g/m3 with inter-quantile ranges of 11.93 and 8.25 g/m3 respectively.
We estimated increment risks of 1.26% (95% CI 0.88-1.65) and 2.08% (95% CI 1.44-2.72) of short-term natural mortality for
PM10 and PM2.5 respectively, for increments of 10 g/m3 of concentration. Exposure-response function was estimated to be
linear up to 25 g/m3 with effects even at very low concentrations, reaching a plateau at higher concentrations. Risks were
found to increase with age with a maximum value at ages higher than 85. No differences were found in risks by gender.
Conclusions
We found a positive association between short-term PM concentration and daily natural mortality in Italy. This study, for the
first time, analysed the association not only in high urbanized areas, but also low and medium ones were taken into account in
a nation wide context. The health effect of PM was demonstrated to be significant also in these less studied areas. Risks were
higher for older population and can be found even at low concentrations.
References:
C. Liu, R. Chen, F. Sera, A.M. Vicedo‑Cabrera, Y. Guo, et al., 2019. Ambient Particulate Air Pollution and Daily Mortality
in 652 Cities. N Engl J Med 2019;381:705-15. DOI: 10.1056/NEJMoa1817364.
Stafoggia, M. et al. 2019. “Estimation of Daily PM10 and PM2.5 Concentrations in Italy, 2013–2015, Using a
Spatiotemporal Land-Use Random-Forest Model.” Environment International 124.
38

________________________________________________________________________________________________
DIFFERENCE IN CARCINOGENIC POTENCY OF PM10-BOUND PAHS BETWEEN WORKING AND NON-
WORKING DAYS IN INDOOR URBAN ENVIRONMENTS. M Gherardi, A Gordiani, N L’Episcopo, A Pelliccioni
INAIL, National Institute for Insurance against Accidents at Work, Department of Medicine, Epidemiology and
Occupational and Environmental Hygiene, Monte Porzio CAtone, Rome, Italy
In the framework of the INAIL VIEPI Project (Integrated Evaluation of Indoor Particulate Exposure), nine PM10-bounded
carcinogenic Polycyclic Aromatic Hydrocarbons (cPAHs) were measured in two classrooms of a university campus in
Rome in winter. The monitoring lasted for four weeks and the collected PM10 was analyzed for airborne concentration and
total carcinogenic potency (TCP) of cPAHs. To distinguish the carcinogenic contribution of ”working” and non-working
days, results were averaged over Weekdays (WDs) and Weekends (WDs). The indoor concentrations and estimated TCPs
were always lower than outdoor ones. Adding a fresh traffic source during working days returned a higher estimation of
TCP than on non-working days, which implicates higher carcinogenic risk of exposure.
Introduction
USEPA, 2005, has included a mix of 16 PAHs in a list of priority pollutants that are of a great concern for their ambient
persistence and toxicological properties. EU Directives 2004/107/EC has established a target value (1 ng/m3 annual mean
value) of carcinogenic benzo(a)pyrene (BaP) in ambient air as a marker substance for PAHs generally. Nevertheless,
carcinogenic congeners other than BaP contribute to the toxicity of PM and each component can be expressed relative to
the potency of BaP. In this work the contribution of carcinogenic PAHs bounded to PM10 was estimated in winter in two
classrooms and outdoors at a University campus in Rome. Distinguishing the sampling times for periods of Weekend and
Weekdays allowed evaluating the total carcinogenic potency for “non-working” and “working” days, these latter addressing
for the addition of fresh traffic contribution outdoors and for the presence of people indoor.
Methodology
Outdoor and two rooms, different for street view and frequency of people, were monitored for forty-five days in wintertime.
PM10 was collected on quarz filters and chemically characterized by Gas chromatography-mass spectrometry for the
content of: benzo(a)anthracene (BaA), chrysene (CH), Benzo(b)-(j)-(k)fluoranthene (BbjkF), benzo(a)pirene (BaP),
indeno(1,2,3-cd)pyrene (IP), dibenz(a,h)anthracene (DBahA), benzo(ghi)perylene (BghiP). Congeners’ concentrations
were used to calculate BaP equivalents to derive the Total Carcinogenic Potency of the mixture. For this purpose, the
Toxicity Equivalence Factors (TEFs) from Nisbet et al. (1992) were used. Sampling separately during weekend and
weekdays allowed analysing data on non-working and working days.
Results and Discussion
The total mean value of indoor cPAH concentration resulted 5.85 ng/m3, that of outdoor 8.68 ng/m3. Indoor mean
concentration during Weekend was 4.61 ng/m3 against 6.18 ng/m3 of Weekdays: the corresponding outdoor values during
Weekend and Weekdays were 5.26 ng/m3 and 9.68 ng/m3, respectively, indicating the increasing in cPAHs content passing
from Weekend to Weekdays. The indoor cPAH concentrations gave TCPs of 1.26 ng/m3 and 1.82 ng/m3 for Weekend and
Weekdays respectively. Those calculated for the same periods outdoors resulted 1.37 ng/m3 and 3.02 ng/m3 (Weekend and
Weekdays, respectively). The difference between cPAH outdoor concentrations of Weekdays and Weekend returned an
estimated TCP value of 1.65 ng/m3 for the addition of fresh traffic contribution: the corresponding profile, BaP equivalents
based, is shown in Figure 1.
Figure 1. Profile of BaP equivalents for estimated fresh traffic contribution
These results indicated that indoor concentrations and estimated TCPs were always lower than outdoor ones. The estimation
of TCP during "working days" returned a higher value than on "non-working". This phenomenon is supported by the
addition of fresh traffic source that practically doubles the carcinogenic potency of the mixture during working days; the
realive profile of BaPeqs indicated the greatest contribution of BaP and DahA to the toxicity of the mixture, followed by
IP. Therefore, the choice of including carcinogenic PAHs other than BaP in the exposure assessment leads to a better
estimation of the carcinogenic risk in indoor environments, especially during working days.
Nisbet, I. C. T. & LaGoy, P. K. Toxic equivalency factors (TEFs) for polycyclic aromatic hydrocarbons (PAHs). Regul.
Toxicol. Pharmacol. 1992, 16, 290–300.
Pelliccioni, A.; Monti, P.; Cattani, G.; Boccuni, F.; Cacciani, M.; Canepari, S.; Capone, P.; Catrambone, M.; Cusano, M.;
D’Ovidio, M.C.; De Santis, A.; Di Bernardino, A.; Di Menno di Bucchianico, A.; Di Renzi, S.; Ferrante, R.; Gaeta, A.;
Gaddi, R.; Gherardi, M.; Giusto, M.; Gordiani, A.; Grandoni, L.; Leon,e G.; Leuzzi, G.; L’Episcopo, N.; Marcovecchio,
F.; Pini, A.; Sargolini, T.; Tombolini, F.; Tofful, L.; Perrino, C. Integrated Evaluation of Indoor Particulate Exposure: The
VIEPI Project. Sustainability 2020, 12(22), 9758-9782.
39

IMPROVING THE PRECISION OF MINIDISCS MEASURING UFPS IN MULTIPLE
CONFIGURATION
A. Pelliccioni, M. Gherardi
INAIL, National Institute for Insurance against Accidents at Work, Department of Medicine, Epidemiology and Occupational
and Environmental Hygiene, Monte Porzio Catone, Rome, 00040, Italy
Presenting author email:[email protected]
Summary
This study aimed at improving the precision performance of multiple (two or more) Miniature DIffusion Size Classifiers
(MiniDISCs) simultaneously measuring Ultra Fine Particles (UFPs) in multi spatial configuration. For this purpose, a novel
intra-calibration procedure has been developed, which aligns the currents measured by the personal monitors unipolar
diffusion charging based. First, one of the MiniDISCs is selected as the reference to which the others refer. Therefore, raw
data of the measured current of diffusion (Id) and current of filter (If) of instruments to be calibrated are linked to those of the
reference by applying a mathematical procedure consisting in solving a system of two linear equations that makes the
currents Id and If much closer to those of the reference. Applying the aligned Id and If of the calibrated instrument in the
Fierz’ equations returns both the metrics Particle Number Concentration (PNC) and Particle Modal Size (PMS) improved in
precision. The procedure is able to increase the intra-precision measured by weighted coefficients of variation (CVs) by about
7 times thus making MiniDISCs very attractive for multi-spatial experiments in indoor environments when low gradients of
concentration occur.
Introduction
Measuring UFPs at high time resolution and resolved by size is a challenging task in indoor pollution studies. In order to
avoid noise and disturbance to the occupants, silent instruments should be preferred. In addition, the availability of small and
inexpensive tools should also allow better management of multiple configuration for multi-space investigations.
Among the small monitors now available, is the lightweight, battery operated and silent Miniature Diffusion Size Classifier
(MiniDISC), based on the unipolar diffusion charge of the aerosol, which measures particle number concentration (PNC) and
particle modal size (PMS) of UFPs in the size range 10-300 nm. Although the above characteristics, the typical accuracy of
approximately ±30% makes MiniDISCs not reliable enough for measurements of low gradients of concentration of UFPs by
multiple configuration. In order to improve the intra-precision of MiniDISCs that simultaneously measure UFPs, a novel
intra-calibration procedure has been developed that reduces the coefficients of variation CVs both for the metrics PNC and
PMS.
Methodology and Results
The novel theoretical method to intra-calibrate two or more MiniDISCs consists in aligning data of the measured electrical
signals Id and IF of the MiniDISC to be calibrated to those of a selected reference. First, among k+1 instruments, one
MiniDISC is selected as reference to which relate the other/s. Then, introducing a system of two linear equations (1-2) that
link the raw data of Id and If of the kth instrument to those of the reference, makes the electrical signals closer to each other.
The linear coefficients to be used in solving the two equations system are derived by sampling UFPs with MiniDISCs in
parallel lines at the same location for at most one day before the in-field campaign. The procedure can be applied to two or
more MiniDISCs, but one and the reference intrument always make the comparison.
Id (Rk)=αdk ⋅Id (k) + γdk (1)
If (Rk)=αfk ⋅If (k) + γfk (2)
Id (Rk) and If (Rk) are the new currents of diffusion and filter that simulate those of the reference, αdk , γdk , αfk , γfk are the
linear correlation coefficients derived during Intra-comparison campaign; Id (k) and If (k) are the experimental currents for
the kth MiniDISC. Using the new currents Id (Rk) and If (Rk) in the Fierz’s equations containing the calibration parameters of
the reference MiniDISC provides values of PNC and PMS of UFPs for the kth MiniDISC that can be considered proxy
variables of those of the reference. In this study three MiniDISCs (TESTO) were used and the choice of the reference was
made by the comparison with a Condensation Particle Counter (CPC), also considering the literature data relating to the same
type of comparison. The coefficient of variation averaged over eight monitoring campaigns after applying the calibration
procedure passed from 0.208 to 0.036 for PNC of UFPs, from 0.032 to 0.130 for PMS of UFPs, indicating that the intra-
calibration procedure improves the related CVs for PNC and PMS of UFPs about 8 and 6 time respectively. The new
procedure also results more performing than a simple regression analysis for PNC between two MiniDISCs.
Conclusions
The new intra-calibration procedure allows to improve the intra-precision of the PNC and PMS metrics of UFPs measured by
k+1 MiniDISCs in multi-spatial configuration. The procedure realizes a fleet of MiniDISCs, as if only one instrument was
relocated to more than one environment. This makes these instruments particularly attractive for measuring low gradients of
UFPs in contiguous multiple environments.
References
Pelliccioni A., Gherardi M., 2021. Development and validation of an intra-calibration procedure for MiniDISCs measuring
ultrafine particles in multi-spatial indoor environments. Atmospheric Environment 246 (2021) 118154.
Fierz M., Houle C., Steigmeier P., Burtscher, H., 2011. Design, calibration, and field performance of a miniature diffusion
size classifier. Aerosol Sci. Technol. 45 (1),1–10.
40
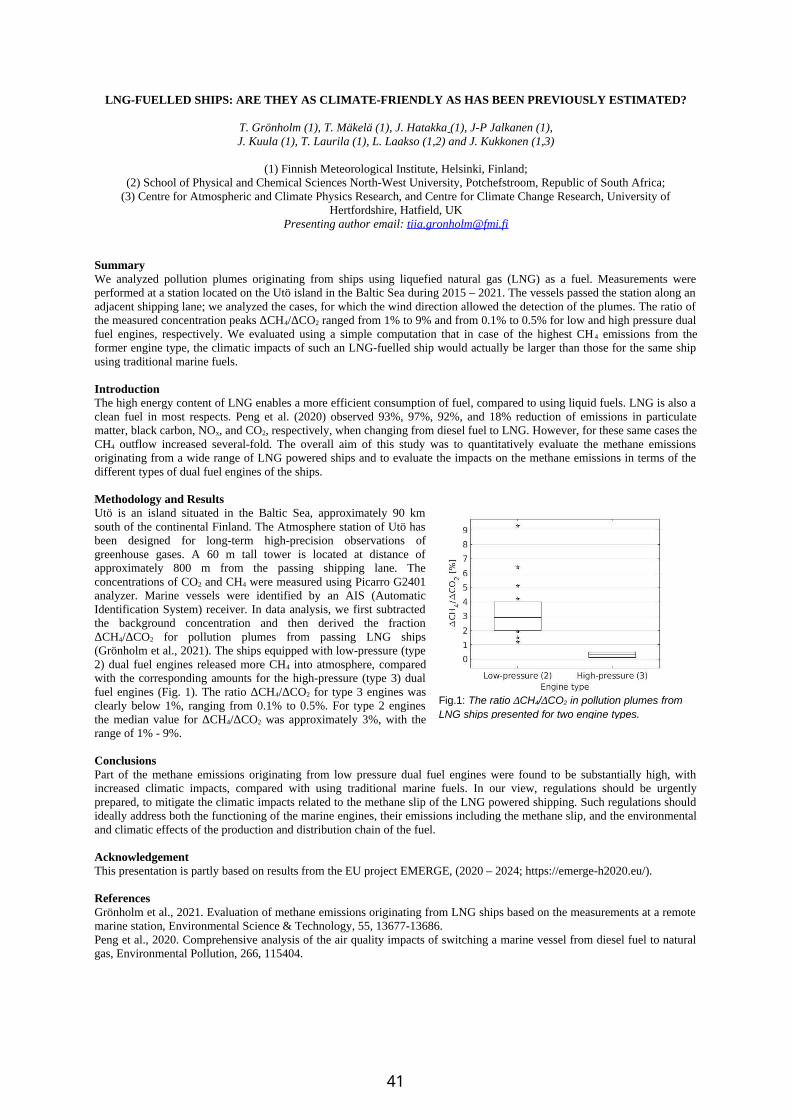
LNG-FUELLED SHIPS: ARE THEY AS CLIMATE-FRIENDLY AS HAS BEEN PREVIOUSLY ESTIMATED?
T. Grönholm (1), T. Mäkelä (1), J. Hatakka (1), J-P Jalkanen (1), J. Kuula (1), T. Laurila (1), L. Laakso (1,2) and J. Kukkonen (1,3)
(1) Finnish Meteorological Institute, Helsinki, Finland;(2) School of Physical and Chemical Sciences North-West University, Potchefstroom, Republic of South Africa;
(3) Centre for Atmospheric and Climate Physics Research, and Centre for Climate Change Research, University ofHertfordshire, Hatfield, UK
Presenting author email: [email protected]
SummaryWe analyzed pollution plumes originating from ships using liquefied natural gas (LNG) as a fuel. Measurements wereperformed at a station located on the Utö island in the Baltic Sea during 2015 – 2021. The vessels passed the station along anadjacent shipping lane; we analyzed the cases, for which the wind direction allowed the detection of the plumes. The ratio ofthe measured concentration peaks ΔCH4/ΔCO2 ranged from 1% to 9% and from 0.1% to 0.5% for low and high pressure dualfuel engines, respectively. We evaluated using a simple computation that in case of the highest CH 4 emissions from theformer engine type, the climatic impacts of such an LNG-fuelled ship would actually be larger than those for the same shipusing traditional marine fuels.
IntroductionThe high energy content of LNG enables a more efficient consumption of fuel, compared to using liquid fuels. LNG is also aclean fuel in most respects. Peng et al. (2020) observed 93%, 97%, 92%, and 18% reduction of emissions in particulatematter, black carbon, NOx, and CO2, respectively, when changing from diesel fuel to LNG. However, for these same cases theCH4 outflow increased several-fold. The overall aim of this study was to quantitatively evaluate the methane emissionsoriginating from a wide range of LNG powered ships and to evaluate the impacts on the methane emissions in terms of thedifferent types of dual fuel engines of the ships.
Methodology and ResultsUtö is an island situated in the Baltic Sea, approximately 90 kmsouth of the continental Finland. The Atmosphere station of Utö hasbeen designed for long-term high-precision observations ofgreenhouse gases. A 60 m tall tower is located at distance ofapproximately 800 m from the passing shipping lane. Theconcentrations of CO2 and CH4 were measured using Picarro G2401analyzer. Marine vessels were identified by an AIS (AutomaticIdentification System) receiver. In data analysis, we first subtractedthe background concentration and then derived the fractionΔCH4/ΔCO2 for pollution plumes from passing LNG ships(Grönholm et al., 2021). The ships equipped with low-pressure (type2) dual fuel engines released more CH4 into atmosphere, comparedwith the corresponding amounts for the high-pressure (type 3) dualfuel engines (Fig. 1). The ratio ΔCH4/ΔCO2 for type 3 engines wasclearly below 1%, ranging from 0.1% to 0.5%. For type 2 enginesthe median value for ΔCH4/ΔCO2 was approximately 3%, with therange of 1% - 9%.
ConclusionsPart of the methane emissions originating from low pressure dual fuel engines were found to be substantially high, withincreased climatic impacts, compared with using traditional marine fuels. In our view, regulations should be urgentlyprepared, to mitigate the climatic impacts related to the methane slip of the LNG powered shipping. Such regulations shouldideally address both the functioning of the marine engines, their emissions including the methane slip, and the environmentaland climatic effects of the production and distribution chain of the fuel.
AcknowledgementThis presentation is partly based on results from the EU project EMERGE, (2020 – 2024; https://emerge-h2020.eu/).
ReferencesGrönholm et al., 2021. Evaluation of methane emissions originating from LNG ships based on the measurements at a remotemarine station, Environmental Science & Technology, 55, 13677-13686.Peng et al., 2020. Comprehensive analysis of the air quality impacts of switching a marine vessel from diesel fuel to naturalgas, Environmental Pollution, 266, 115404.
Fig.1: The ratio ΔCH4/ΔCO2 in pollution plumes fromLNG ships presented for two engine types.
41
DEVELOPING AN ATMOSPHERIC EMISSION INVENTORY WITH HIGH SPATIAL AND TEMPORAL
RESOLUTIONS IN PORTUGAL
D. Graça(1), H. Relvas(1), S. Rafael(1), J. Ferreira(1), J. Reis(1), M. Lopes(1), D. Lopes(1)
(1)CESAM, Department of Environment and Planning, University of Aveiro, 3810-193 Aveiro, Portugal
Presenting author email: [email protected]
Summary
This study aims to present to the international scientific community the ongoing BigAir project (Lopes et al., 2021) where the
main purpose is to improve the performance of the air quality modelling (AQM) applications in Portugal using big data sets
(available at no cost) to calculate the historical and forecast Portuguese atmospheric emissions with high spatial (exact
location of emission sources) and temporal (hourly values) resolutions. The first worldwide open and collaborative emission
inventory database will be also developed to the stakeholders identify inadequate atmospheric emission values and lack of
emission sources. This database will also allow information sharing between the scientific community (international and
national) and provide a continuous improvement of the Portuguese emission inventory.
Introduction
Air pollution is the largest single environmental risk to human health, and it is responsible for 4.2 million worldwide deaths
every year. In Portugal, since the ’90s AQM has been developed and applied to provide scientific advice on the definition of
AQ improvement measures, AQ forecast, AQ assessment and AQ policy regulations. Although great advances in
computational power and scientific research have been made, the atmospheric emissions (global and European inventories)
used by AQM still be the major source of uncertainty and the main reasons are: i) the inaccurate magnitude of emissions
values related to inadequate emission factors (e.g. from road dust resuspension) and activities data: ii) imprecise emission
locations due to the coarse horizontal resolution of the available inventories (between 0.0625˚ and 0.1˚); and iii) unsuitable
temporal (monthly, weekday and hourly) and speciation profiles applied to the annual atmospheric emission values. In recent
years, the massive collection of information (Big data) has emerged as one solution for air pollution, namely for emission
inventories improvement.
Methodology and results
To accomplish the main goal, the BigAir project is organized into 5 Tasks: Task 1) Big data sources; Task 2) Road dust
resuspension; Task 3) Emission data; Task 4) Evaluation of the new approach; and Task 5) Emission inventory database. In
Task 1, the big data sets (e.g. meteorological data) will be handled, stored and processed using a high-performance
computational system, python programme language and its data science tools. Since the importance of road transport
emissions from non-exhaust sources will increase and there is a lack of information regarding it, in Task 2, the emission
factors from road dust resuspension will be quantified considering the USEPA (the United States Environmental Protection
Agency) AP-42 procedure. In Task 3, using the data obtained in the previous tasks, historical and forecast Portuguese
atmospheric emissions with high spatial and temporal resolutions will be quantified applying, whenever possible, the more
accurate methodology provided by the European air pollution inventory guidebook. Regarding the forecast emissions, it will
be estimated using artificial neural networks, meteorology forecast data, opening hours of the facilities and transport
schedules. In addition, an ensemble approach, considering the available global and European inventories, will be developed
to compare it with the inventory developed in this research project. In Task 4, AQM performance (using Eulerian, Gaussian
and Lagrangian models), inventory uncertainty and the impact of the atmospheric emission uncertainty in the AQM results
will be evaluated. Finally, in the last Task, the open and collaborative atmospheric emission database will be developed.
At the first stage, hourly atmospheric emissions from the energetic and industrial activities in mainland Portugal and islands
(i.e., Madeira and Azores) were quantified for the year 2020. The obtained results were compared with available European
emission inventories (e.g. European Monitoring and Evaluation Programme - EMEP) in terms of spatial and temporal
distribution (i.e., annual, monthly, weekday and hourly patterns).
Conclusion
Preliminary results demonstrate the potential of the BigAir project to reduce the uncertainty of the AQM performance,
identify new research scientific challenges in the atmospheric pollution field and provide important information to society
about its emission contribution. The obtained results will be also useful to fill the annual reports required by the European
commission to the Portuguese Environmental Agency and provide more reliable data (available at no cost) to the decision-
makers regarding the main atmospheric emission sources.
Acknowledgement
This work was financially supported by the project “BigAir - Big data to improve atmospheric emission inventories”,
PTDC/EAM-AMB/2606/2020, funded by national funds through FCT - Foundation for Science and Technology. We
acknowledge financial support to CESAM by FCT/MCTES (UIDP/50017/2020+UIDB/50017/2020+ LA/P/0094/2020),
through national funds.
References
Lopes, D., Ferreira, J., Rafael, S., Relvas, H., Reis, J., Graça, D., Alves, C., Casotti Rienda, I., Lopes, M., 2021. BigAir - Big
data to improve atmospheric emission inventories [WWW Document]. URL http://bigair.web.ua.pt/ (accessed 2.6.22).
42

CHARACTERISATION OF SWITZERLAND'S PM10, PM2.5, AND ASSOCIATED OXIDATIVE POTENTIAL
S.K. Grange (1,2), G. Uzu (3), S. Weber (3), J.-L. Jaffrezo (3), A. Alastuey (4), X. Querol (4), C. Hüglin (1) (1) Empa, Swiss Federal Laboratories for Materials Science and Technology, 8600 Dübendorf, Switzerland; (2) Wolfson Atmospheric Chemistry Laboratories, University of York, York, YO10 5DD, United Kingdom; (3) Univ. Grenoble Alpes, IRD, CNRS, Grenoble INP, IGE (Institute of Environmental Geosciences), Grenoble, France; (4) Institute of Environmental Assessment and Water Research, Consejo Superior de Investigaciones Científicas, Barcelona, Spain
Presenting author email: [email protected] Summary To investigate Switzerland's PM10 and PM2.5, an extensive filter-based sampling campaign was conducted at five locations across Switzerland between June, 2018 and May, 2019. Most PM components and sources demonstrated a clear rural to urban-traffic gradient, but this was not apparent for most secondary sources. An investigation of the urban and urban-traffic increments highlighted the importance of non-exhaust emissions in such environments. Oxidative potential (OP), a biological-relevant metric complementary to PM mass demonstrated the same rural to urban-traffic gradient, and the road traffic and wood combustion sources were subsequently identified as the most potent OP sources. The analysis strongly suggests that road traffic (especially non-exhaust emissions) and wood combustion are the PM sources which should be prioritised for management of the OP of PM in Switzerland. Introduction Particulate matter (PM) is a very diverse pollutant with many sources and components, however, in routine monitoring, only PM mass and sometimes number are reported. Therefore, detailed chemical characterisation and analysis of the composition and sources of PM can be very useful to inform the design of efficacious management priorities. Oxidative potential (OP) is a complementary metric for PM which has the goal representing biological toxicity (Daellenbach et al., 2020) and was included in this sampling campaign. Methodology and Results Daily PM10 and PM2.5 filter samples were taken at five sampling sites across Switzerland between June, 2018 and May, 2019. A total of 908 filters were analysed for their chemical composition and three OP assays. The observations were exposed to various modelling techniques including: source apportionment by positive matrix factorisation (PMF), random forest, and multiple linear regression to determine key PM sources and their linkage to OP. The results demonstrated that mass, and most PM constituents displayed a progressive rural to urban-traffic gradient, with the exception of most secondary components (Figure 1). When investigating the urban and urban-traffic increments, it was found that tracers associated with non-exhaust emissions (especially the brake wear tracers: Ba, Cu, and Sb) were the most enhanced, including in the fine-mode indicating road traffic emissions were mostly responsible for the enhanced concentrations in Switzerland’s urban and urban-traffic environments. The use of random forest and linear regression models suggested that metals associated with non-exhaust emissions and wood combustion tracers (the aforementioned metals, Rb, K, and organics resulting from the pyrolysis of cellulose, for example, levoglucosan) created the best predictive models to explain OP. The exact species used to represent non-exhaust and wood burning emissions was not critical and they were mostly interchangeable, the models simply required a term to represent these two processes to explain OP. Conclusions The filter-based PM sampling campaign across Switzerland between 2018 and 2019 strongly suggests that non-exhaust and wood burning emissions require further management in Switzerland to further reduce PM concentrations, OP, and presumably biological harm. Acknowledgement This work was funded by the Federal Office for the Environment (FOEN) [contract number: 16.0096.PJ/R152-0739]. The authors thank the wider project team for their contributions. References Daellenbach, K. R., et al. (2020). Sources of particulate-matter air pollution and its oxidative potential in Europe. Nature, 587(7834):414--419. https://doi.org/10.1038/s41586-020-2902-8
Figure 1. Means of PM mass, the secondary nitrate-rich PMF source, and OPv
DTT for five sites in Switzerland between 2018 and 2019.
43

EUROPEAN URBAN AIR QUALITY AND COVID-19 LOCKDOWNS
S.K. Grange (1,2), J.D. Lee (2,3), W.S. Drysdale (2), A.C. Lewis (2,3), C. Hueglin (1), L. Emmenegger (1), D.C. Carslaw (2,4)
(1) Empa, Swiss Federal Laboratories for Materials Science and Technology, 8600 Dübendorf, Switzerland; (2) Wolfson Atmospheric Chemistry Laboratories, University of York, York, YO10 5DD; (3) National Centre for Atmospheric Science, University of York, York, YO10 5DD; (4) Ricardo Energy & Environment, Harwell, Oxfordshire, OX11 0QR
Presenting author email: [email protected] Summary The implementation of non-pharmaceutical interventions across the world in early 2020 to slow the transmission of SARS-CoV-2, the virus which causes COVID-19 had many positive environmental impacts, including the reduction of air pollutant emissions and subsequent improvements in air quality. Concentrations of nitrogen dioxide (NO2) and ozone (O3) in European urban areas were especially affected. Here, machine learning derived counterfactual models were used to generate time series with which the observed concentrations could be compared. The results indicate that European urban NO2 concentrations decreased by approximately a third but O3 increased by a similar magnitude. The near-complete replacement of NO2 by O3 suggests that enhanced urban O3 pollution in European urban areas could be expected in the near future as NO2 concentrations continue to decline over time. Introduction In early 2020, most European countries applied extensive non-pharmaceutical interventions to control the transmission of SARS-CoV-2, the virus that causes COVID-19. These non-pharmaceutical interventions had dramatic effects on the mobility of the European population and in turn emission reductions of many air pollutants were observed. The quantification of the decreases in air pollutant emissions and concentrations is complicated by the rather unusual weather patterns experienced in most of Europe in the first half of 2020. In this work, robust "what would have been" counterfactual time series were calculated with machine learning models to account for the unusual weather situation at the start of 2020. Methodology and Results Hourly observations from 246 ambient monitoring sites in 102 urban areas in 34 European countries were analysed between February and July 2020. Counterfactual, business-as-usual time series were calculated using random forest machine learning models trained on surface meteorological variables to account for natural weather variability. The analysis suggested that NO2 reduced by 33 % on average while O3 increased by 21 to 30 %, depending on site type classification, at the time when the reduction of population mobility was at its greatest (for example, Figure 1). Despite NO2 concentrations decreasing by approximately a third, total oxidant (NO2 + O3 = Ox) changed little, suggesting that the reductions of NO2 were substituted by increases in O3. The analysis suggests that the expected reductions in NO2 across Europe in the next decade might be accompanied by additional O3 concentrations. Thus, management of non-traffic emission sources may be required to mitigate or avoid this likely, and undesirable situation in European urban areas. Conclusions The effects of the non-pharmaceutical interventions implemented to control the spread of SARS-CoV-2 on urban air quality can be leveraged to investigate potential future air quality issues. In this work, the robust quantification of NO2 and O3
concentrations in European urban areas highlight a potential future O3 issue that may need to be prompted to avoid such an undesirable situation in the near future. Acknowledgement This work was supported by the Swiss Federal Office for the Environment (FOEN) and the Natural Environment Research Council (NERC). References Grange, S. K., Lee, J. D., Drysdale, W. S., Lewis, A. C., Hueglin, C., Emmenegger, L., and Carslaw, D. C. (2021). COVID-19 lockdowns highlight a risk of increasing ozone pollution in European urban areas. Atmospheric Chemistry and Physics. 21.5, pp. 4169--4185. https://doi.org/10.5194/acp-21-4169-2021
Figure 1. Observed vs. predicted concentration deltas for NO2, O3, and Ox for Spanish sites between February and July, 2020.
44
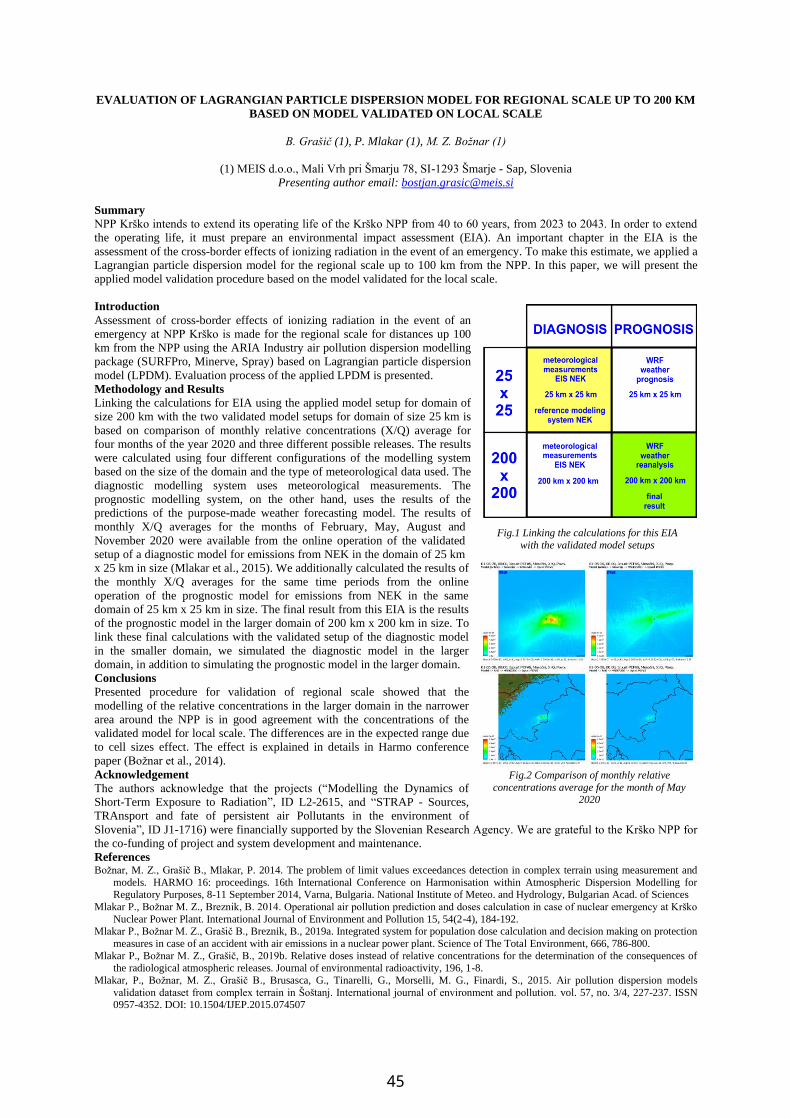
EVALUATION OF LAGRANGIAN PARTICLE DISPERSION MODEL FOR REGIONAL SCALE UP TO 200 KM
BASED ON MODEL VALIDATED ON LOCAL SCALE
B. Grašič (1), P. Mlakar (1), M. Z. Božnar (1)
(1) MEIS d.o.o., Mali Vrh pri Šmarju 78, SI-1293 Šmarje - Sap, Slovenia
Presenting author email: [email protected]
Summary
NPP Krško intends to extend its operating life of the Krško NPP from 40 to 60 years, from 2023 to 2043. In order to extend
the operating life, it must prepare an environmental impact assessment (EIA). An important chapter in the EIA is the
assessment of the cross-border effects of ionizing radiation in the event of an emergency. To make this estimate, we applied a
Lagrangian particle dispersion model for the regional scale up to 100 km from the NPP. In this paper, we will present the
applied model validation procedure based on the model validated for the local scale.
Introduction
Assessment of cross-border effects of ionizing radiation in the event of an
emergency at NPP Krško is made for the regional scale for distances up 100
km from the NPP using the ARIA Industry air pollution dispersion modelling
package (SURFPro, Minerve, Spray) based on Lagrangian particle dispersion
model (LPDM). Evaluation process of the applied LPDM is presented.
Methodology and Results
Linking the calculations for EIA using the applied model setup for domain of
size 200 km with the two validated model setups for domain of size 25 km is
based on comparison of monthly relative concentrations (X/Q) average for
four months of the year 2020 and three different possible releases. The results
were calculated using four different configurations of the modelling system
based on the size of the domain and the type of meteorological data used. The
diagnostic modelling system uses meteorological measurements. The
prognostic modelling system, on the other hand, uses the results of the
predictions of the purpose-made weather forecasting model. The results of
monthly X/Q averages for the months of February, May, August and
November 2020 were available from the online operation of the validated
setup of a diagnostic model for emissions from NEK in the domain of 25 km
x 25 km in size (Mlakar et al., 2015). We additionally calculated the results of
the monthly X/Q averages for the same time periods from the online
operation of the prognostic model for emissions from NEK in the same
domain of 25 km x 25 km in size. The final result from this EIA is the results
of the prognostic model in the larger domain of 200 km x 200 km in size. To
link these final calculations with the validated setup of the diagnostic model
in the smaller domain, we simulated the diagnostic model in the larger
domain, in addition to simulating the prognostic model in the larger domain.
Conclusions
Presented procedure for validation of regional scale showed that the
modelling of the relative concentrations in the larger domain in the narrower
area around the NPP is in good agreement with the concentrations of the
validated model for local scale. The differences are in the expected range due
to cell sizes effect. The effect is explained in details in Harmo conference
paper (Božnar et al., 2014).
Acknowledgement
The authors acknowledge that the projects (“Modelling the Dynamics of
Short-Term Exposure to Radiation”, ID L2-2615, and “STRAP - Sources,
TRAnsport and fate of persistent air Pollutants in the environment of
Slovenia”, ID J1-1716) were financially supported by the Slovenian Research Agency. We are grateful to the Krško NPP for
the co-funding of project and system development and maintenance.
References Božnar, M. Z., Grašič B., Mlakar, P. 2014. The problem of limit values exceedances detection in complex terrain using measurement and
models. HARMO 16: proceedings. 16th International Conference on Harmonisation within Atmospheric Dispersion Modelling for Regulatory Purposes, 8-11 September 2014, Varna, Bulgaria. National Institute of Meteo. and Hydrology, Bulgarian Acad. of Sciences
Mlakar P., Božnar M. Z., Breznik, B. 2014. Operational air pollution prediction and doses calculation in case of nuclear emergency at Krško
Nuclear Power Plant. International Journal of Environment and Pollution 15, 54(2-4), 184-192. Mlakar P., Božnar M. Z., Grašič B., Breznik, B., 2019a. Integrated system for population dose calculation and decision making on protection
measures in case of an accident with air emissions in a nuclear power plant. Science of The Total Environment, 666, 786-800.
Mlakar P., Božnar M. Z., Grašič, B., 2019b. Relative doses instead of relative concentrations for the determination of the consequences of
the radiological atmospheric releases. Journal of environmental radioactivity, 196, 1-8.
Mlakar, P., Božnar, M. Z., Grašič B., Brusasca, G., Tinarelli, G., Morselli, M. G., Finardi, S., 2015. Air pollution dispersion models
validation dataset from complex terrain in Šoštanj. International journal of environment and pollution. vol. 57, no. 3/4, 227-237. ISSN 0957-4352. DOI: 10.1504/IJEP.2015.074507
Fig.2 Comparison of monthly relative
concentrations average for the month of May 2020
Fig.1 Linking the calculations for this EIA
with the validated model setups
45
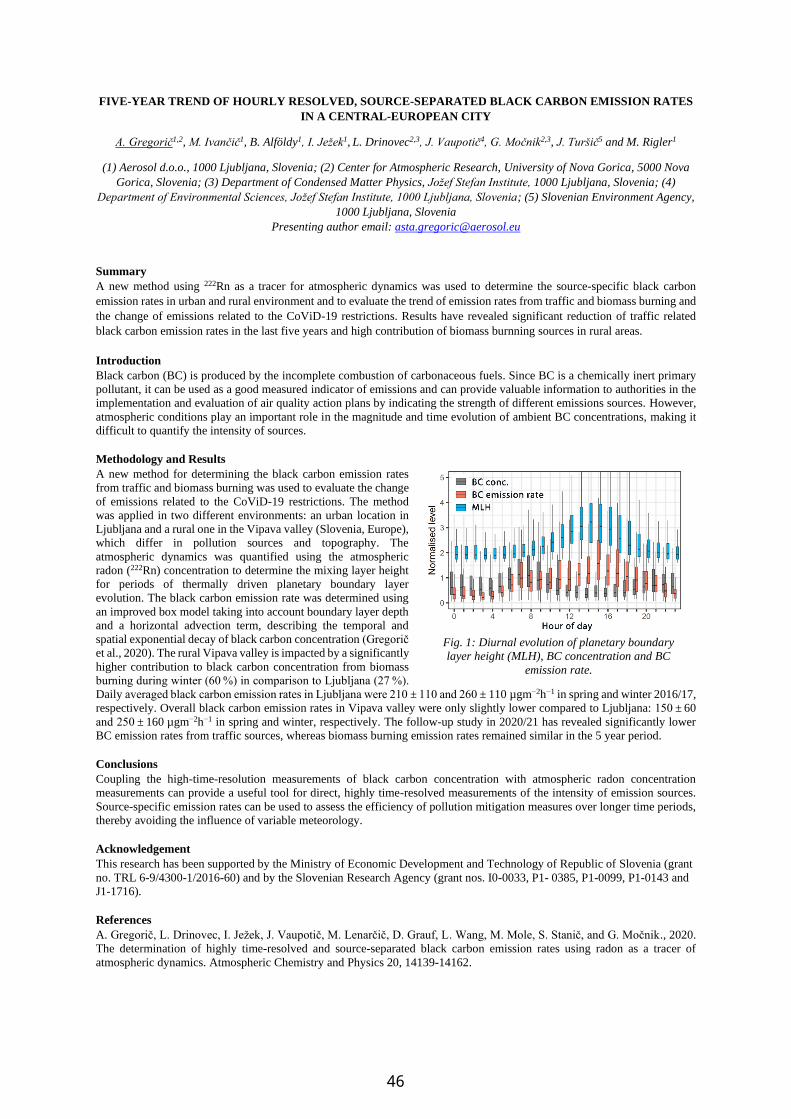
FIVE-YEAR TREND OF HOURLY RESOLVED, SOURCE-SEPARATED BLACK CARBON EMISSION RATES
IN A CENTRAL-EUROPEAN CITY
A. Gregorič1,2, M. Ivančič1, B. Alföldy1, I. Ježek1, L. Drinovec2,3, J. Vaupotič4, G. Močnik2,3, J. Turšič5 and M. Rigler1
(1) Aerosol d.o.o., 1000 Ljubljana, Slovenia; (2) Center for Atmospheric Research, University of Nova Gorica, 5000 Nova
Gorica, Slovenia; (3) Department of Condensed Matter Physics, Jožef Stefan Institute, 1000 Ljubljana, Slovenia; (4)
Department of Environmental Sciences, Jožef Stefan Institute, 1000 Ljubljana, Slovenia; (5) Slovenian Environment Agency,
1000 Ljubljana, Slovenia
Presenting author email: [email protected]
Summary
A new method using 222Rn as a tracer for atmospheric dynamics was used to determine the source-specific black carbon
emission rates in urban and rural environment and to evaluate the trend of emission rates from traffic and biomass burning and
the change of emissions related to the CoViD-19 restrictions. Results have revealed significant reduction of traffic related
black carbon emission rates in the last five years and high contribution of biomass burnning sources in rural areas.
Introduction
Black carbon (BC) is produced by the incomplete combustion of carbonaceous fuels. Since BC is a chemically inert primary
pollutant, it can be used as a good measured indicator of emissions and can provide valuable information to authorities in the
implementation and evaluation of air quality action plans by indicating the strength of different emissions sources. However,
atmospheric conditions play an important role in the magnitude and time evolution of ambient BC concentrations, making it
difficult to quantify the intensity of sources.
Methodology and Results
A new method for determining the black carbon emission rates
from traffic and biomass burning was used to evaluate the change
of emissions related to the CoViD-19 restrictions. The method
was applied in two different environments: an urban location in
Ljubljana and a rural one in the Vipava valley (Slovenia, Europe),
which differ in pollution sources and topography. The
atmospheric dynamics was quantified using the atmospheric
radon (222Rn) concentration to determine the mixing layer height
for periods of thermally driven planetary boundary layer
evolution. The black carbon emission rate was determined using
an improved box model taking into account boundary layer depth
and a horizontal advection term, describing the temporal and
spatial exponential decay of black carbon concentration (Gregorič
et al., 2020). The rural Vipava valley is impacted by a significantly
higher contribution to black carbon concentration from biomass
burning during winter (60 %) in comparison to Ljubljana (27 %).
Daily averaged black carbon emission rates in Ljubljana were 210 ± 110 and 260 ± 110 µgm−2h−1 in spring and winter 2016/17,
respectively. Overall black carbon emission rates in Vipava valley were only slightly lower compared to Ljubljana: 150 ± 60
and 250 ± 160 µgm−2h−1 in spring and winter, respectively. The follow-up study in 2020/21 has revealed significantly lower
BC emission rates from traffic sources, whereas biomass burning emission rates remained similar in the 5 year period.
Conclusions
Coupling the high-time-resolution measurements of black carbon concentration with atmospheric radon concentration
measurements can provide a useful tool for direct, highly time-resolved measurements of the intensity of emission sources.
Source-specific emission rates can be used to assess the efficiency of pollution mitigation measures over longer time periods,
thereby avoiding the influence of variable meteorology.
Acknowledgement
This research has been supported by the Ministry of Economic Development and Technology of Republic of Slovenia (grant
no. TRL 6-9/4300-1/2016-60) and by the Slovenian Research Agency (grant nos. I0-0033, P1- 0385, P1-0099, P1-0143 and
J1-1716).
References
A. Gregorič, L. Drinovec, I. Ježek, J. Vaupotič, M. Lenarčič, D. Grauf, L. Wang, M. Mole, S. Stanič, and G. Močnik., 2020.
The determination of highly time-resolved and source-separated black carbon emission rates using radon as a tracer of
atmospheric dynamics. Atmospheric Chemistry and Physics 20, 14139-14162.
Fig. 1: Diurnal evolution of planetary boundary
layer height (MLH), BC concentration and BC
emission rate.
46

FROM TERRESTIAL MACRO-PLASTIC TO ATMOSPHERIC MICRO-PLASTIC: A MICRO-PHYSICAL DESCRIPTION
R.A. Hansen (1), M. Birkved (2), G.C. Vega (2) and A. Gross (1)
(1) Department of Businesses and Technology (BTECH) – Analytical and Experimental Laboratory (A/E LAB), University of Aarhus, Denmark; (2) Institute of Chemical Engineering, Biotechnology and Environmental Technology, University of
Southern Denmark, Denmark
Presenting author email: [email protected] Summary This study aims to expand existing micro-physical description of MicroPlastic (MP) by combining existing photovoltaic degradation model for macro- to MP with a physics model describing how the degraded MP can be lifted from a surface and suspended in the atmosphere. Main output of the work is that we have derived a microphysical model which makes it easier to implement macro- and microplastic into 0D and 3D models. A normal mode model has been used to describe the evolution of the MP size distributions. We will utilise the model to show which size distributions of the MP that will stay on the ground surface and which sizes will be lifted into the air, which mainly are the finer particles which have a higher potential for being inhaled deep into the lungs by humans and animals. Introduction There is a close link between health and Particulate Matter PM (Seaton, Godden et al. 1995), where the smallest particles have the greatest negative health impact, since these fine particles can get deep into the lungs and some may even translocate into the bloodstream. Exposure to such particles can affect a person's lungs and heart. Coarser particles (PM2.5-PM10) are of less concern, although they can irritate a person's eyes, nose, and throat, but do not exhibit same potential for translocation though lung tissue or being retained in this tissue. During the last couple of decades, a new environmental particle has been introduced into the scientific community MPs. Not only as an “external” pollutant, but as something “unnatural” unescapably being ingested by wildlife and subsequently humans (Ballantyne, Péronard et al. 2021). Several studies have modelled the prevalence of plastic (incl. MPs) in different lake (Daily and Hoffman 2020) and sea compartments (Peeken, Primpke et al. 2018). Other models have been applied to describe the emission of MPs particles from ground into the air (Evangeliou, Grythe et al. 2020). Even though MPs is generally defined as a particle <5mm, the dominant size classes found in both surface water and more interesting surface sediments are <500µm, according to recent research (Li, Zhang et al. (2021)), and depending on shape and weight it is light enough to be lifted from a surface impacted by a wind profile. Considering this, we model the initial lift of a MP particle from the terrestrial ground such as a soil/sand surface into the lower atmospheric boundary layer. Thus, in this study, we investigate under which conditions MPs can reach a height such that it can be inhaled by human. Methodology and Results A micro-physical model is developed which describe and combine two separate elements: (1) the degradation of macro-plastic to MP using a model describing the photovoltaic degradation of plastics over time and related size distribution of resulting secondary MPs particles ( Vega, Gross et al. 2021), and (2) a model quantifying the forces a MP particle are exposed to and apply this to estimate how the individual MPs positioned on a surface is lifted into the air over a given time. The model includes among others a micro-physical description of surface type, air resistance, distance, and drag. Conclusions In this study we present a novel approach by combining a macroplastic degradation to MPs followed by microphysical description of the lift of a stationary MP lying on the ground into to the atmosphere. We will show the evolution of MP particles under different meteorological conditions and surface roughness. Its flight is interesting since it follows a typical ballistic trajectory, and we will show under which conditions the MP particle potentially can be inhaled by human. Furthermore, the model can easily implement into 3d ACTM models. References Ballantyne, A. G., J.-P. d. C. Péronard, R. A. Hansen and A. Gross (2021). "Media Issue Crystallization: The Case of Microplastic in Denmark." Environmental Communication 15(5): 610-624. Croxatto Vega, G., A. Gross and M. Birkved (2021). "The impacts of plastic products on air pollution - A simulation study for advanced life cycle inventories of plastics covering secondary microplastic production." Sustainable Production and Consumption 28: 848-865. Daily, J. and M. J. Hoffman (2020). "Modeling the three-dimensional transport and distribution of multiple microplastic polymer types in Lake Erie." Marine Pollution Bulletin 154: 111024. Evangeliou, N., H. Grythe, Z. Klimont, C. Heyes, S. Eckhardt, S. Lopez-Aparicio and A. Stohl (2020). "Atmospheric transport is a major pathway of microplastics to remote regions." Nature communications 11(1): 1-11. Li, Y., Y. Zhang, G. Chen, K. Xu, H. Gong, K. Huang, M. Yan and J. Wang (2021). "Microplastics in Surface Waters and Sediments from Guangdong Coastal Areas, South China." Sustainability 13(5): 2691. Peeken, I., S. Primpke, B. Beyer, J. Gütermann, C. Katlein, T. Krumpen, M. Bergmann, L. Hehemann and G. Gerdts (2018). "Arctic sea ice is an important temporal sink and means of transport for microplastic." Nature communications 9(1): 1-12. Seaton, A., D. Godden, W. MacNee and K. Donaldson (1995). "Particulate air pollution and acute health effects." the lancet 345(8943): 176-178.
47
CORDEX FLAGSHIP PILOT STUDY ON URBANIZATION - URBAN ENVIRONMENTS AND REGIONAL
CLIMATE CHANGE (URB-RCC)
T. Halenka (1), G. Langendijk (2)
(1) Dept. of Atmospheric Physics, Fac. of Mathematics and Physics, Charles University, Prague, Czech Republic,
(2) German Climate Service Center, The Helmholtz-Zentrum Hereon, Hamburg, Germany
Presenting author email: [email protected]
Summary
Cities play a fundamental role on climate at local to regional scales through modification of heat and moisture fluxes, as well
as affecting local atmospheric chemistry and composition, alongside air-pollution dispersion. Vice versa, regional climate change impacts urban areas and is expected to increasingly affect cities and their citizens in the upcoming decades.
Simultaneously, the share of the population living in urban areas is growing, and is projected to reach about 70% of the world
population up to 2050. Additionally, from the perspective of recent regional climate model (RCM) developments with
increasing resolution down to the city scale, proper parameterization of urban processes plays an important role to understand local/regional climate change (CC). This is valid for coupled atmospheric chemistry as well, thus even air pollution
modelling has to consider the urban environment. The inclusion of the individual urban processes affecting energy balance
and transport (i.e. heat, humidity, momentum fluxes, emissions) via special urban land-use parameterization of distinct local
processes becomes vital to simulate the urban effects properly. This will enable improved assessment of CC impacts in the
cities and inform adaptation and/or mitigation options, as well as adequately prepare for climate related risks (e.g. heat
waves, smog conditions etc.). Cities are becoming one of the most vulnerable environments under CC. In 2013, the
CORDEX community identified cities to be a prime scientific challenge. Therefore, we proposed this topic as activity at
CORDEX platform, within the framework of so-called flagship pilot studies (FPS), which was accepted and started in 2021.
Introduction
The main goal of this FPS is to understand the effect of urban areas on the regional climate, as well as the impact of regional
CC on cities, with the help of coordinated experiments with urbanized RCMs. While the urban climate with all the complex processes has been studied for decades, there is a significant gap to incorporate this knowledge into RCMs. This FPS aims to
bridge this gap, leading the way to include urban parameterization (UP) schemes as a standard component in RCM
simulations, especially at high resolutions. Overview of the RCMs simulations available with UP will be presented, as well as
potential of coupled RCM/CTM models.
Methodology
The main principle of the methodology came out from the fundamental background of CORDEX simulations, i.e. multimodel
ensemble of simulations to improve the robustness of the results and the reliability of their interpretation. The common simulation and analysis protocol provides the basic tool to get comparable outputs. Careful selection of targeted coordinated
simulations has to be performed, with justified choice of targeted city, however, accepting the possibility of individual
contributions following the protocol to get comparable spread of information from other regions. Multiple science aims arise
from the FPS proposal objectives: • Understanding the interaction of urban environments with local-to-regional CC and the assessment of added value of
urbanized RCM simulations in ensemble experiments for selected (mega)cities across the domains.
• Better understand the urban environment’s vulnerability in a changing world based on “up-to-date” scenarios (CMIP6),
particularly how CC impacts cities. • Understand the capability of RCMs to simulate cities and relevant regional-to-local processes. Assessing options for UPs,
efficient for RCM CORDEX simulations at high-res, comparison to statistical downscaling and off-line modelling methods.
• Identifying how UPs on convection permitting scales improve the regional/local scale information.
• Understanding urban effects interactions with air-pollution in changing climate including the role of aerosols in precipitation and their health effects.
• Analyzing the effects of past and future urbanization on CC in urbanized regions.
• Further developing science-based information underpinning climate services in urban areas.
Expected impacts consider the assessment of overall urban effects on regional climate by means of including UPs into high-
res RCM simulations with coupled RCM/CTM runs as well, providing ways forward on further development of the urban
representation in RCM/CP-RCM simulations, and robust assessment of CC impacts in the urban environment in connection
to urban climate services, risk management, city planning, development and proposing adaptation or mitigation measures to
minimize e.g. the health effects, air-pollution exceedances etc.
Conclusions
Proposed activities clearly comply with the first CORDEX FPS criterion to address regional to local scales problems and local impacts, which cannot be addressed by GCMs and is not included in the standard CORDEX framework. They require
specific data, for the land-use parameterization, and observations, which are available from previous campaigns, to make the
expected simulations and their validation complying with the second criterion. This FPS action can be supported by – and
contributing to – Special IPCC Assessment Report planned for cities in next cycle after AR6, WCRP Grand Challenges – Weather and Climate Extremes – on local scale, and SDG (Sustainable Development Goal) on sustainable cities (#11),
climate action (#13) and health (#3), providing information for risk management in these aspects to urban stakeholders,
which corresponds to the third CORDEX FPS criterion. As for the fourth criterion, urbanization is important for many groups
participating in CORDEX activities and goes across CORDEX domains as big cities appear in each of them.
48

NON-CO2 FORCERS AND THEIR CLIMATE, WEATHER, AIR QUALITY AND HEALTH IMPACTS – A NEW PROJECT FOCI
T. Halenka (1), R.S. Sokhi (2) and FOCI team
(1) Department of Atmospheric Physics, Faculty of Mathematics and Physics, Charles University, V Holesovickach 2, 180 00 Prague, Czech Republic (2) Department of Physics, Astronomy and Mathematics, Centre for Climate
Change Research (C3R), University of Hertfordshire, Hartfield, United Kingdom Presenting author email: [email protected]
Summary While the overall global warming and processes affecting well mixed greenhouse gases (GHGs), especially CO2, and their impacts on global to continental scales are well understood with a high level of confidence, there are significant knowledge gaps concerning the impact of many non-CO2 radiative forcers leading to low confidence in how they affect climate change (IPCC, 2021). This relates mainly to specific anthropogenic and natural precursor emissions of short-lived GHGs and aerosols and their precursors. A new EC Horizon Europe project FOCI (accepted within the call HORIZON-CL5-2021-D1-01-01) focuses on non-CO2 radiative forcers and their impacts on weather, air quality and health. Methodology
FOCI addresses global warming potential of key anthropogenic and natural non-CO2 radiative forcers, namely, aerosol components such as black carbon (BC), dust, primary organic aerosol (POA), secondary organic aerosol (SOA), sulphate (SO4) and nitrate (NO3), aerosol precursors (SO2 and NH3), ozone (O3) precursors NOx, and VOCs, carbon monoxide (CO) and methane (CH4). The overall work programme is organised into 8 science and 1 management interlinked work packages (WP) with one cross cutting activity of data integration and data products. The processes that control the impact of non-CO2 radiative forcers on the climate system are examined through approaches based on Earth System Models and Regional Climate Models. The project employs these coupled tools, evaluated with observations, to investigate mitigation and adaptation measures targeted at Europe and other regions of the world. We will develop new regionally tuned scenarios based on improved emissions to assess the effects of non-CO2 forcers. Consultations with climate services and other end-users will provide feedbacks for specific scenario preparation and potential application to support decision making, including air quality and climate policy. Figure 1 below, summarises the main components and their inter-connections that form the basis of the project.
Figure 1 Connections and information flow between the main work package (WP) components. The organisations responsible for leading the tasks are also shown. Blue arrows show the flow of information between the main four pillars of the project and the red arrows show the interconnections and dependencies between the work packages. Conclusions The overall aim of FOCI is to improve our knowledge of individual and cumulative contribution of non-CO2 radiative forcers and their precursors. Specifically, we will target those species where there is the greatest of uncertainty in determining their impact on climate change and the associated influence on weather patterns (e.g., atmospheric and ocean circulation and extreme weather events), air pollution episodes and health impacts. Our integrated observational and modelling analysis will focus on the radiative forcing properties of PM2.5, PM10, cloud condensation nuclei (CCN) and components of aerosols as well as gaseous species including O3 and its precursors in the wider context of the warming potential of all key GHGs. Reference IPCC, 2021: Summary for Policymakers. Cambridge University Press, in press, 2021.
49
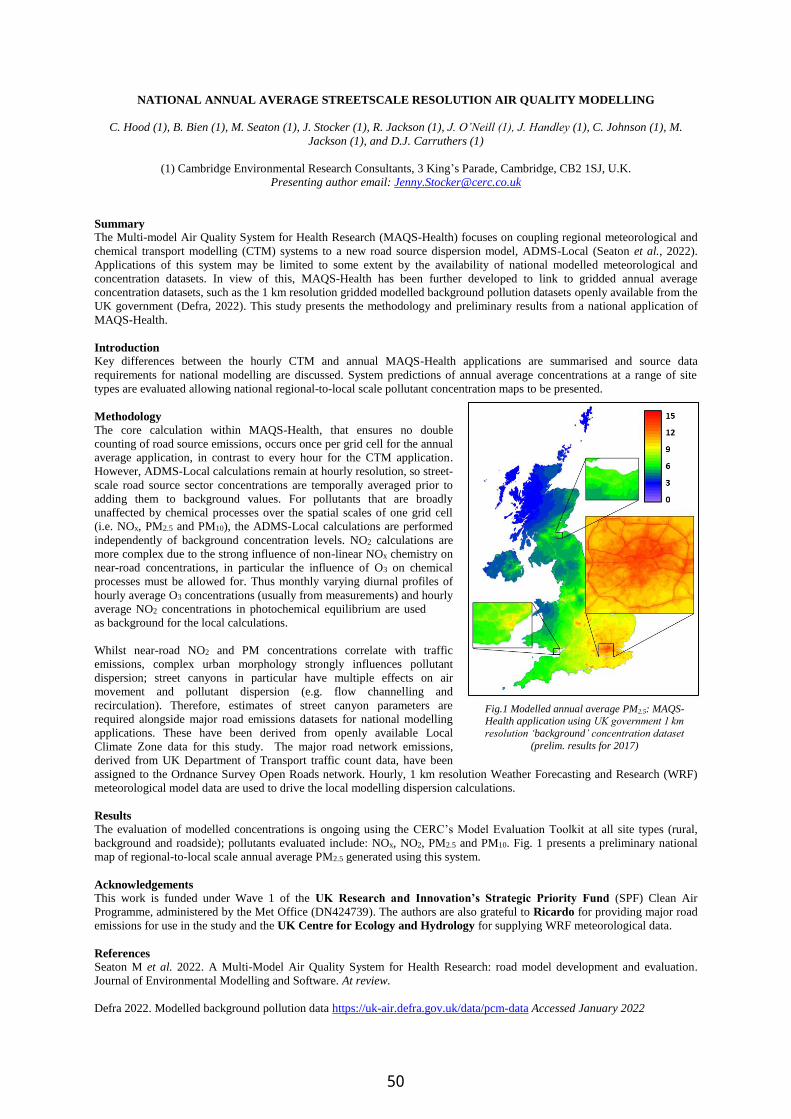
NATIONAL ANNUAL AVERAGE STREETSCALE RESOLUTION AIR QUALITY MODELLING
C. Hood (1), B. Bien (1), M. Seaton (1), J. Stocker (1), R. Jackson (1), J. O’Neill (1), J. Handley (1), C. Johnson (1), M.
Jackson (1), and D.J. Carruthers (1)
(1) Cambridge Environmental Research Consultants, 3 King’s Parade, Cambridge, CB2 1SJ, U.K.
Presenting author email: [email protected]
Summary
The Multi-model Air Quality System for Health Research (MAQS-Health) focuses on coupling regional meteorological and
chemical transport modelling (CTM) systems to a new road source dispersion model, ADMS-Local (Seaton et al., 2022).
Applications of this system may be limited to some extent by the availability of national modelled meteorological and
concentration datasets. In view of this, MAQS-Health has been further developed to link to gridded annual average
concentration datasets, such as the 1 km resolution gridded modelled background pollution datasets openly available from the
UK government (Defra, 2022). This study presents the methodology and preliminary results from a national application of
MAQS-Health.
Introduction
Key differences between the hourly CTM and annual MAQS-Health applications are summarised and source data
requirements for national modelling are discussed. System predictions of annual average concentrations at a range of site
types are evaluated allowing national regional-to-local scale pollutant concentration maps to be presented.
Methodology
The core calculation within MAQS-Health, that ensures no double
counting of road source emissions, occurs once per grid cell for the annual
average application, in contrast to every hour for the CTM application.
However, ADMS-Local calculations remain at hourly resolution, so street-
scale road source sector concentrations are temporally averaged prior to
adding them to background values. For pollutants that are broadly
unaffected by chemical processes over the spatial scales of one grid cell
(i.e. NOx, PM2.5 and PM10), the ADMS-Local calculations are performed
independently of background concentration levels. NO2 calculations are
more complex due to the strong influence of non-linear NOx chemistry on
near-road concentrations, in particular the influence of O3 on chemical
processes must be allowed for. Thus monthly varying diurnal profiles of
hourly average O3 concentrations (usually from measurements) and hourly
average NO2 concentrations in photochemical equilibrium are used
as background for the local calculations.
Whilst near-road NO2 and PM concentrations correlate with traffic
emissions, complex urban morphology strongly influences pollutant
dispersion; street canyons in particular have multiple effects on air
movement and pollutant dispersion (e.g. flow channelling and
recirculation). Therefore, estimates of street canyon parameters are
required alongside major road emissions datasets for national modelling
applications. These have been derived from openly available Local
Climate Zone data for this study. The major road network emissions,
derived from UK Department of Transport traffic count data, have been
assigned to the Ordnance Survey Open Roads network. Hourly, 1 km resolution Weather Forecasting and Research (WRF)
meteorological model data are used to drive the local modelling dispersion calculations.
Results
The evaluation of modelled concentrations is ongoing using the CERC’s Model Evaluation Toolkit at all site types (rural,
background and roadside); pollutants evaluated include: NOx, NO2, PM2.5 and PM10. Fig. 1 presents a preliminary national
map of regional-to-local scale annual average PM2.5 generated using this system.
Acknowledgements
This work is funded under Wave 1 of the UK Research and Innovation’s Strategic Priority Fund (SPF) Clean Air
Programme, administered by the Met Office (DN424739). The authors are also grateful to Ricardo for providing major road
emissions for use in the study and the UK Centre for Ecology and Hydrology for supplying WRF meteorological data.
References
Seaton M et al. 2022. A Multi-Model Air Quality System for Health Research: road model development and evaluation.
Journal of Environmental Modelling and Software. At review.
Defra 2022. Modelled background pollution data https://uk-air.defra.gov.uk/data/pcm-data Accessed January 2022
Fig.1 Hatfield Tunnel and its sketch map
Fig.1 Modelled annual average PM2.5: MAQS-Health application using UK government 1 km
resolution ‘background’ concentration dataset
(prelim. results for 2017)
50
PERFORMANCE OF LOW-COST SENSORS FOR NO AND NO2 DURING LONG-TERM DEPLOYMENTS
H. Kim (1), L. Emmenegger (1), S. Henne (1), M. Müller (1,2), C. Hüglin (1)
(1) Empa, Swiss Federal Laboratories for Materials Science and Technology, 8600 Dübendorf, Switzerland; (2) Amt für Geoinformation, Kanton Basel-Landschaft, 4410 Liestal, Switzerland
Presenting author email: [email protected] Summary The behaviour and performance of electrochemical sensors for NO and NO2 were determined over longer operating periods in different deployments. The sensors have been co-located with reference instruments during six months and carefully calibrated by using robust linear regression and random forest regression. The resulting coefficients of determination of both types of sensors were high (R2 > 0.9) and the root mean square errors (RMSE) of NO and NO2 sensors were about 6.8ppb and 3.5ppb, respectively, for 10 minute mean concentrations. The RMSE of the NO2 sensors, however, more than doubled, when the sensors were deployed without re-calibration for a one year period at other site types (including urban background locations), where the range and the variability of air pollutant concentrations differed from the calibration site (no NO measurements as reference available at deployment sites). This indicates a significant effect of re-location on the quality of sensor data. During deployment, we observed that the NO2 sensors were capable of distinguishing general pollution levels (urban background versus polluted), but they proved unsuitable for accurate measurements, mainly due to significant biases. In order to investigate the long-term stability of the original calibration, the sensors were reinstalled for another four months at the original co-location site after deployment. Encouragingly, the coefficient of determination and the RMSE of the NO sensor remained almost unchanged after more than one year of operation. In contrast, the performance of the NO2 sensors clearly deteriorated as indicated by a higher RMSE (about 7.5 ppb, 10 minute mean concentrations) and a lower coefficient of determination (R2=0.59). Introduction Low-cost sensors have a large potential for complementing classical air quality measurements in existing monitoring networks. However, the use of low-cost sensors (LCS) poses some major challenges; for example, calibration of LCS is not straightforward due to non-linearity and interference from environmental conditions. Furthermore, the robustness of sensor calibrations over time are often unknown. Furthermore, the possible effect of sensor re-location, i.e. the change in sensor performance when used in a new location, is not well understood (WMO, 2021). In this study, the above-mentioned issues associated with the use of low-cost sensors for measuring air quality were investigated. Methodology Four sensor units for NO and NO2 were deployed next to reference instruments during two co-location campaigns. The first co-location campaign had a duration of six months and was carried out for sensor calibration and evaluation of sensor performance. The second, four months long, co-location campaign was done about one and a half year after the first co-location campaign with the aim of assessing the long-term stability of the calibrated sensors and re-evaluation of sensor performance after an extended period of operation. During the time between the two co-location campaigns, the sensors were deployed in a small sensor network in Zurich (Switzerland) where the NO2 sensor data could be compared to the bi-weekly integrated measurement of NO2 using diffusive passive samplers. The full details are described in Kim et al. (2022). Conclusions Although only two specific types of sensors were used in this study, some general conclusions can be drawn. Co-location with reference instruments is a pragmatic and appropriate approach for the calibration of individual low-cost sensors. However, the duration of the co-location measurements should be sufficiently long so that a wide range of environmental conditions, which may occur during deployment, are covered. In addition, the chosen co-location site should allow covering the full concentration range expected during deployment. During deployment of the LCS in a small sensor network in Zurich, we observed that the achieved data quality for NO2 was much lower than expected from the comparison with a reference instrument at the co-location site. An important factor for lower than expected data quality was seen in the fact that sensors were deployed in locations where the concentration range of the target air pollutant was considerably smaller than at the co-location site (e.g., at urban background locations). The calibration models derived from co-location with reference instruments were strongly influenced by the measurements at the highest prevailing concentrations and, therefore, may not be optimal for cleaner locations. References Kim H., Müller M., Henne S., Hüglin C., 2022. Long-term behavior and stability of calibration models for NO and NO2 low cost sensors. Atmospheric Measurement Techniques Discussions, https://doi.org/10.5194/amt-2021-433. WMO, 2021. An update on low-cost sensors for the measurement of atmospheric composition. Ed. R. Pelletier, WMO-Report 1215, World Meteorological Organization.
51

THE USE OF SENSOR-BASED AIR QUALITY STATION IN URBAN APPLICATIONS: DIFFERENT CITIES,
DIFFERENT CHALLENGES
E. Ibarrola-Ulzurrun (1), M. Escribano (1), J. Fernandez (1)
(1) Kunak Technologies, Polígono Parque Empresarial la Muga, 9, Planta 4, Oficina 1, 31160 Orcoyen, Navarra
Presenting author email: [email protected]
Summary
This study shows the difficulties and challenges when deploying an air quality sensor system in an urban environment.
During the development of the project, several considerations must be taken into account, as the environmental conditions
found in each specific location, which will affect the sensors, as well as the installation, maintenance, and calibration of the
sensor systems. Thus, in the study, examples of very different locations are shown, explaining the challenges found in every
specific location and how they were solved, providing reliable and accurate air quality data in each specific project.
Introduction
When thinking in air quality monitoring, the most common application that comes to our mind is measuring the air pollutants
at cities. Most real cases shown are in this context, and several projects all around the world are being developed. However,
when deploying an air quality device, some challenges must be considered: (i) the effect of environmental conditions in the
sensors, (ii) the drift that these sensors suffer in time, and (iii) the proper installation and maintenance of the devices (WMO,
2020) to obtain reliable and meaningful data. The air quality sensor systems must have a well-known QA&QC procedure,
allowing the proper maintenance and calibration when deploying a sensor system in different locations. The data provided by
the sensor system must be corrected in temperature and humidity and depending on the city, different types of device
installation and maintenance will be provided.
In this study, sensor-based devices were installed in different urban environments. We show the different challenge that have
been found when deploying the sensor system and during maintenance and calibration and how to solve them.
Methodology and Results
Kunak Air Pro air quality sensor systems were installed in different cities with different environmental conditions: New
Delhi (India), Antwerp (Belgium), London (UK), Reno (Nevada, USA), Guadalupe (France), Addis Ababa (Ethiopia) and
Doha (Qatar). All the locations have not only different environmental conditions, but also each city have different facilities to
install and carry out the maintenance of the devices.
Regarding the environmental condition, some cities have extreme temperatures and humidity which affect directly in the
performance of the sensors. New Delhi, Qatar, Addis Ababa, Reno and Guadalupe suffered for temperatures higher than
40ºC, and large daily changes in humidity, while in Antwerp and London, the humidity could be higher than 87% during
several days. About the installation, it is necessary to have an autonomous solution with and easy and fast installation, to
cover all the situations that you could find during deployment. In developed countries, it exists the possibility to install the
device connected to the power grid or with solar panel, while in low- and middle-income countries (LMICs), the power grid
could suffer from some electric losses. However, the budget of those projects is limited and there is not the possibility to
install a solar panel, thus, the battery should have some autonomy to withstand this power losses. Finally, the sensor system
must have an easy remote calibration that allows to have reliable data. Usually, this type of technology is co-located against
reference station to carry out the calibration, but there is not always the possibility to do it, as in Addis Ababa. In this case, it
must be assured the data quality when the device is installed, without needing a reference station.
Fig 1. (left) Tº and RH% in Doha (Qatar), (right) Max. PM10 values in Reno during a fire event.
Conclusions
When developing an air quality monitoring project in urban environments, several matters must be considered, the climatic
conditions, the facilities when installing the sensors, possibilities of calibration and maintenance of the sensor system. Thus,
the air quality sensor system must have a well-known QA&QC procedure, in which the temperature and humidity effects that
the sensors suffer, are well corrected, independently of the final location. Besides, the sensor system needs to allow a proper
installation, maintenance and calibration when deploying it, providing reliable and accurate air quality data effortless.
Acknowledgement
This company has received a grant co-financed 50% by the European Regional Development Fund through the FEDER
Operational Program 2014-2020 of Navarra.
References
Peltier R.E., et al. 2020. An update of low-cost sensors for the measurement of atmospheric composition. World
Meteorological Organization.
52
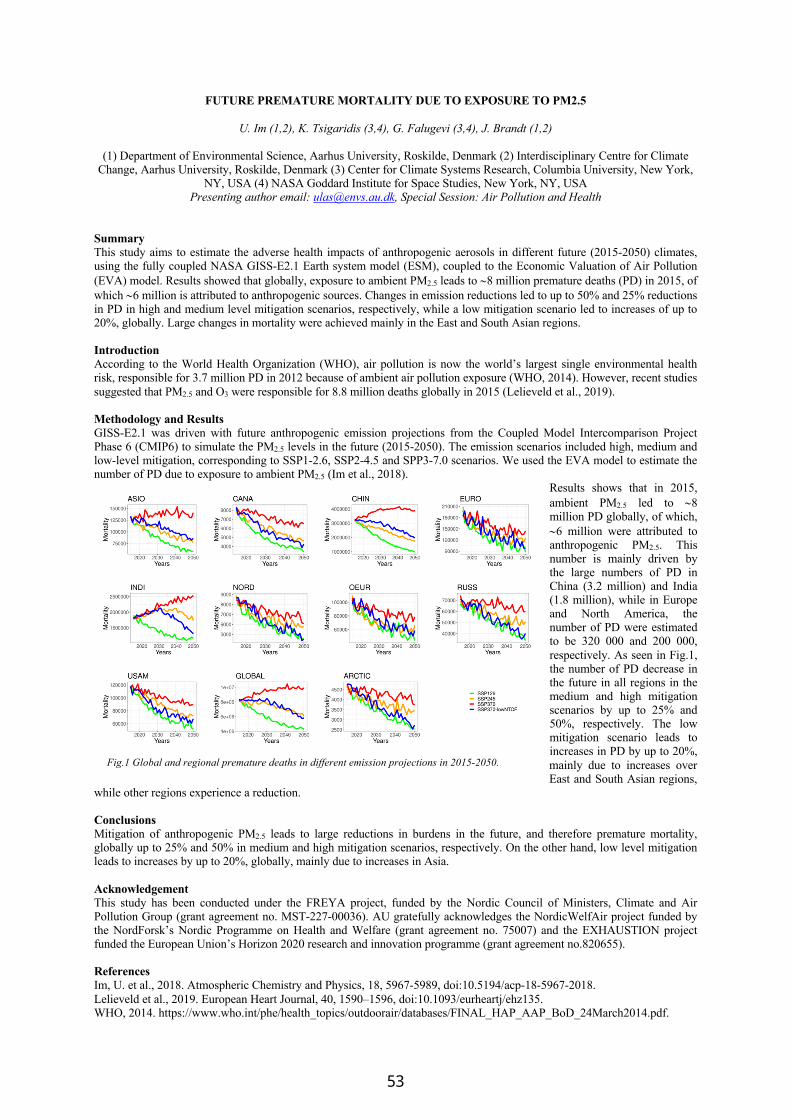
FUTURE PREMATURE MORTALITY DUE TO EXPOSURE TO PM2.5
U. Im (1,2), K. Tsigaridis (3,4), G. Falugevi (3,4), J. Brandt (1,2)
(1) Department of Environmental Science, Aarhus University, Roskilde, Denmark (2) Interdisciplinary Centre for Climate Change, Aarhus University, Roskilde, Denmark (3) Center for Climate Systems Research, Columbia University, New York,
NY, USA (4) NASA Goddard Institute for Space Studies, New York, NY, USA Presenting author email: [email protected], Special Session: Air Pollution and Health
Summary This study aims to estimate the adverse health impacts of anthropogenic aerosols in different future (2015-2050) climates, using the fully coupled NASA GISS-E2.1 Earth system model (ESM), coupled to the Economic Valuation of Air Pollution (EVA) model. Results showed that globally, exposure to ambient PM2.5 leads to ~8 million premature deaths (PD) in 2015, of which ~6 million is attributed to anthropogenic sources. Changes in emission reductions led to up to 50% and 25% reductions in PD in high and medium level mitigation scenarios, respectively, while a low mitigation scenario led to increases of up to 20%, globally. Large changes in mortality were achieved mainly in the East and South Asian regions. Introduction According to the World Health Organization (WHO), air pollution is now the world’s largest single environmental health risk, responsible for 3.7 million PD in 2012 because of ambient air pollution exposure (WHO, 2014). However, recent studies suggested that PM2.5 and O3 were responsible for 8.8 million deaths globally in 2015 (Lelieveld et al., 2019). Methodology and Results GISS-E2.1 was driven with future anthropogenic emission projections from the Coupled Model Intercomparison Project Phase 6 (CMIP6) to simulate the PM2.5 levels in the future (2015-2050). The emission scenarios included high, medium and low-level mitigation, corresponding to SSP1-2.6, SSP2-4.5 and SPP3-7.0 scenarios. We used the EVA model to estimate the number of PD due to exposure to ambient PM2.5 (Im et al., 2018).
Results shows that in 2015, ambient PM2.5 led to ~8 million PD globally, of which, ~6 million were attributed to anthropogenic PM2.5. This number is mainly driven by the large numbers of PD in China (3.2 million) and India (1.8 million), while in Europe and North America, the number of PD were estimated to be 320 000 and 200 000, respectively. As seen in Fig.1, the number of PD decrease in the future in all regions in the medium and high mitigation scenarios by up to 25% and 50%, respectively. The low mitigation scenario leads to increases in PD by up to 20%, mainly due to increases over East and South Asian regions,
while other regions experience a reduction. Conclusions Mitigation of anthropogenic PM2.5 leads to large reductions in burdens in the future, and therefore premature mortality, globally up to 25% and 50% in medium and high mitigation scenarios, respectively. On the other hand, low level mitigation leads to increases by up to 20%, globally, mainly due to increases in Asia. Acknowledgement This study has been conducted under the FREYA project, funded by the Nordic Council of Ministers, Climate and Air Pollution Group (grant agreement no. MST-227-00036). AU gratefully acknowledges the NordicWelfAir project funded by the NordForsk’s Nordic Programme on Health and Welfare (grant agreement no. 75007) and the EXHAUSTION project funded the European Union’s Horizon 2020 research and innovation programme (grant agreement no.820655). References Im, U. et al., 2018. Atmospheric Chemistry and Physics, 18, 5967-5989, doi:10.5194/acp-18-5967-2018. Lelieveld et al., 2019. European Heart Journal, 40, 1590–1596, doi:10.1093/eurheartj/ehz135. WHO, 2014. https://www.who.int/phe/health_topics/outdoorair/databases/FINAL_HAP_AAP_BoD_24March2014.pdf.
Fig.1 Global and regional premature deaths in different emission projections in 2015-2050.
53

OXIDATIVE POTENTIAL OF REGIONAL & URBAN BACKGROUND PM10, PM2.5, & PM1 IN BARCELONA
M. in ‘t Veld (1,2), M. Pandolfi (1), F. Amato (1), N. Pérez (1), C. Reche (1), G. Uzu (3), P. Dominutti (3),
J. Jaffrezo (3), A. Alastuey (1), X. Querol (1)
(1) Institute of Environmental Assessment &Water Research (IDAEA-CSIC), Barcelona, Spain; (2) Dep. of Civil &
Environmental Engineering, UPC, Barcelona, Spain; (3) University Grenoble Alpes (CNRS, IRD, IGE (UMR 5001)),
Grenoble, France
Presenting author email: [email protected]
Summary
This study aims to determine the oxidative potential (OP) of PM10, PM2.5, and PM1 in the Barcelona Area, using an urban
background and regional background twin supersite, to correlate OP with the chemical speciation and source contributions to
PM. A dataset was created combining the inorganic chemical speciation, Positive Matrix Factorization (PMF) source
apportionment, and measuring the reactive oxidative species (ROS) using a dithiothreitol (DTT) and ascorbic acid (AA)
assays. Using this data, a multilinear regression model (MLR) was created to determine the intrinsic toxicity of chemicals and
source in different PM sizes. This study showed that in the case of Barcelona, the intrinsic toxicity of the sources had an
inverse ranking compared to the mass contribution of each source, with industry being the source with the highest intrinsic
toxicity. This study showed that anthropogenic sources as combustion, road dust, and industry are the most toxic sources
when looking at human exposure, but SOA is also a significant contributor in PM10 in BCN and in all PM sizes in MSY.
Introduction
In a previous study, performed by in ’t Veld et al. (2021), a time-series trend analysis was performed on the source
apportionment and chemical speciation of PM2.5 between 2009 - 2018 in the North-East of Spain, comparing an urban
background (Barcelona, BCN) and a close regional background (Montseny, MSY) site. The study concluded there was a
decrease in PM2.5 levels (-29%, BCN; -26%, MSY). While simultaneously measuring an increase in the relative contribution
of organic aerosols (OA; +12%, BCN; +9%. MSY), mostly driven by SOA. Therefore, this follow-up study was performed
with to determine the OP of the PM to trace its toxic potential for humans and correlate this with the chemical speciation and
source contributions to PM, to identify major drivers (species and source contributions) of OP in the study area.
Methodology and Results
Filter samples of all PM sizes were obtained at a set of the BCN and MSY twin supersites from January 2018 until March
2019. These filter samples underwent chemical speciation and source apportionment analyses and were analysed for OP by
measuring the ROS using a DTT, and AA assay. For the source apportionment the PMF model was applied on the dataset.
Initially, the limited dataset did not obtain an adequate solution for PM2.5 and PM1 due to the lower concentrations, even
when applying a multisite solution. Therefore, to improve the robustness of our PMF model, but also for allowing the
comparison of the OP for source contributions to different PM size fractions, a multi-size solution was implemented by
aggregating the results of PM10, PM2.5, and PM1 of both stations into a single dataset, which drastically improved the PM
attribution. We are aware of the possible differences in chemical profiles of a given source for different PM size fractions and
for the two sites, but interpretations of the OP/PMF analysis were also supported by the evaluation of OP/elemental
concentrations in each PM size fraction. In total 9 common sources were identified: SOA (traced by organic carbon, OC),
Secondary sulphate (SST, SO42-, and NH4+), Secondary nitrate (SNT, NO3-, NH4+), Mineral (MIN, Al, Ti, Ga, Rb, Sr, Li,
La), Sea spray (SS, Na, and Mg), Combustion (COM, elemental carbon, EC), Road dust (RD, Fe, Cr, Cu, Sn), Industry (IND,
Mn, Zn, Cd, Pb), and Heavy oil (HO, V, Ni). OP values measured for PM were relatively low when compared with other
studies, specially where biomass burning is identified as a major PM source. To determine the source contribution to OP, a
MLR model was applied. The AA assay of BCN and MSY were dominated by the IND and RD sources; while the largest
PM contributing sources, such as SST, SOA, COM, and MIN (the latter, high only in the case of PM10) have quite low
intrinsic OP. Similar results were obtained for DTT OP assay of both stations, with RD being the main source OP in MSY
over all PM sizes, while in BCN it was led by HO (PM10), RD (PM2.5), and IND (PM1), which are all one of the least
contributing sources in terms of PM mass concentration. The human exposure redistributed the order of the sources ranking.
In BCN traffic sources (COM + RD) were the most toxic sources in PM10 and PM2.5, with IND being the most toxic in PM1
in both assays. In MSY, SOA was the most toxic source in PM10, and IND in PM2.5 and PM1 in the AA assay, while the DTT
assay clearly showed that the RD source had the highest human exposure.
Conclusions
This study showed that anthropogenic sources (COM, RD, and IND) had the biggest toxic effect on human health over all
PM sizes in BCN, when looking at their human exposure. But SOA was also a significant contributor in PM10. In MSY, IND,
RD, and SOA also were the most toxic sources over all PM sizes. These sources to be the focus for further mitigation to
improve air quality in the area.
References
Support was received from the European Union’s Horizon 2020 research and innovation programme (grant agreement
101036245, RI-URBANS); the Agencia Estatal de Investigación from the Spanish Ministry of Science and, Innovation, and
FEDER funds (projects CAIAC, PID2019-108990RB-I00); and the Direcció General de Territori, Generalitat de Catalunya.
References
in ’t Veld, M., Alastuey, A., Pandolfi, M., Amato, F., Pérez, N., Reche, C., Via, M., Minguillón, M.C., Escudero, M., Querol,
X., 2021. Compositional changes of PM2.5 in NE Spain during 2009–2018: A trend analysis of the chemical
composition and source apportionment. Sci. Total Environ. 795.
54
ON OPTIMIZING CATALYTIC GLYCEROL HYDRODEOXYGENATION TOWARDS GREEN PROPYLENE
G. Ioannidou (1), V.L. Yfanti (1), and A.A Lemonidou (1,2)
(1) Laboratory of Petrochemical Technology, Chemical Engineering Department, Aristotle University of Thessaloniki, University Campus, Thessaloniki 54124, Greece; (2) Chemical Process Engineering Research Institute (CERTH/CPERI),
P.O. Box 60361 Thermi, Thessaloniki 57001, Greece Presenting author email: [email protected]
Summary In this study the catalytic conversion of glycerol to propylene is exploited over molybdenum-based catalysts supported on Black Carbon. The effect of the reaction parameters (Po
H2, PoH2/ Po
glyc, LHSV, W/F) on propylene production has been studied experimentally and optimized via response surface methodology. The empirical model process developed fit the experimental data very well as it is confirmed by the high values of determination coefficient R2. Introduction Reducing greenhouse gas emissions, including both CO2 and CH4, from petroleum industry might be one of the most challenging aspects of climate change mitigation. Lower olefins (ethylene and propylene) which are the most common chemical compounds with the highest production volumes (over 260 MMt/a) worldwide are traditionally produced through processes that are highly dependent on fossil resources, such as steam and fluid catalytic cracking. These technologies consume vast amounts of energy resulting in high CO2 emissions. The latter is associated with environmental concerns that highlight the importance of using renewable feedstocks for their production as they could offer significant advantages relating to sustainability, reduced CO2 emissions and environmental pollution. Biomass and its derivatives, such as glycerol (a residual product from biodiesel process) have been considered promising alternative carbon resources to produce fuels and chemicals that are currently produced through fossil-based processes [1]. Complete glycerol deoxygenation along with the formation of a C=C bond, is a challenging path, that could lead to propylene production [2]. Methodology and Results Glycerol hydrodexoygenation experiments to propylene were conducted in a high pressure fixed bed reactor (FlowCat, HEL) in vapour phase over molybdenum-based catalyst supported on black carbon (BC) using 10wt% aqueous glycerol solution as feed. The effect of the reaction parameters (Po
H2: 8.7-56.4 bar, PoH2/ Po
glyc ratio: 22-250, LHSV: 0.4-1.2 h-1, W/F: 155-517 gcat/molglych and total pressure: 10-80 bar) on propylene production led to the optimization of the experimental conditions. The main products detected in liquid phase are 1-propanol followed by propanal and 2-propenol. In gas phase apart from propylene, which is the main product detected, some experimental conditions favour propane production. In addition, two response surface prediction models (RSM) were developed with the aid of Minitab 7.0. software to describe the effect of process parameters on the responses (propylene yield and rate) over the examined region and to predict the optimum reaction conditions. The results shown that high hydrogen availability (high values of Po
H2 or PoH2/ Po
glyc) is indispensable, as it enhances propylene production suppressing the formation of partially deoxygenated products (such as propanal). The increase of W/F positively affects propylene production as well, due to the accessibility of more active sites in the catalyst surface area. However, high values of W/F (>325 gcat/molglych) and Po
H2/ Poglyc (>150) enhances the further hydrogenation of propylene to
propane resulting in lower propylene yield. Under the optimum reaction conditions maximum propylene yield (64.8%) and rate (3.1 mmolesC3H6/gcath) were achieved for complete glycerol conversion at Po
H2=41 bar, PoH2/ Po
glyc=90, LHSV-1.2 h-1 and W/F=211 gcat/molglych, while 1 propanol was the main product detected in liquid phase (20% selectivity). The two-response surface predicted models adequately fit the experimental data as it is indicated by the high value of determination coefficient R2 (>85%) and predict that higher values of propylene yields (>65%) and rate (>2.2 mmolesC3H6/gcath) can be achieved at high hydrogen concentration eliminating the formation of the intermediate products. Conclusions The present work refers to one-step gas phase complete glycerol deoxygenation to propylene, over a Mo/BC catalyst under continuous flow conditions. Glycerol can be selectively converted to propylene showing maximum 64.8% yield and 1.6 gC3H6/gMoh propylene productivity. The reaction was optimized using two response surface models expressing the effect of the process parameters on responses. The results shown that propylene production is enhanced in the excess of hydrogen partial pressure. Acknowledgement This research has been by the European Regional Development Fund of the European Union and Greek national funds through the Operational Program Competitiveness, Entrepreneurship and Innovation, under the call RESEARCH – CREATE – INNOVATE (project code:T1EDK-02864). Ms G. Ioannidou acknowledges the Helmholtz Association of German Research Centers for funding the doctoral dissertation through the European program Helmholtz European Partnership for Technological Advancement (HEPTA).
References [1] V. Zacharopoulou, A.A. Lemonidou. (2018). Olefins from biomass intermediates: A review. Catalysts. 8 (1): 2-20 [2]. V. Zacharopoulou, E.S. Vasiliadou, A.A. Lemonidou. (2015). One-step propylene formation from bio-glycerol over molybdena-based catalysts. Green Chem. 17 (2): 903-912.
55
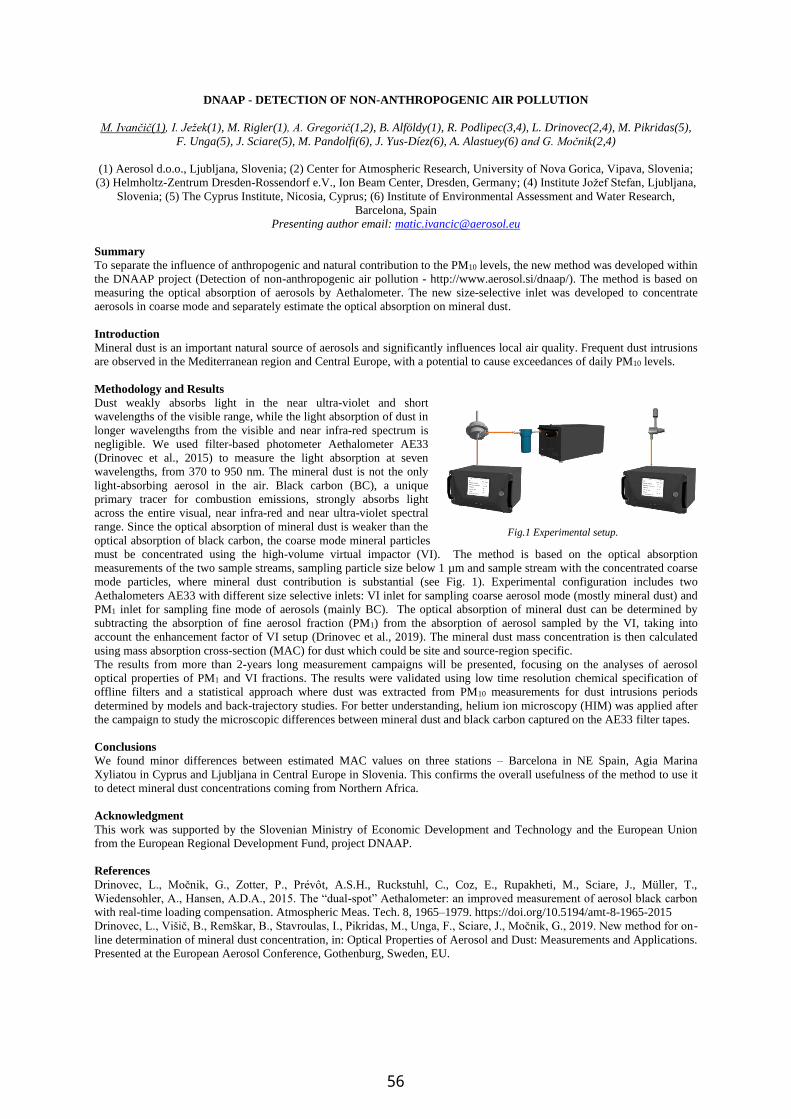
DNAAP - DETECTION OF NON-ANTHROPOGENIC AIR POLLUTION
M. Ivančič(1), I. Ježek(1), M. Rigler(1), A. Gregorič(1,2), B. Alföldy(1), R. Podlipec(3,4), L. Drinovec(2,4), M. Pikridas(5),
F. Unga(5), J. Sciare(5), M. Pandolfi(6), J. Yus-Díez(6), A. Alastuey(6) and G. Močnik(2,4)
(1) Aerosol d.o.o., Ljubljana, Slovenia; (2) Center for Atmospheric Research, University of Nova Gorica, Vipava, Slovenia;
(3) Helmholtz-Zentrum Dresden-Rossendorf e.V., Ion Beam Center, Dresden, Germany; (4) Institute Jožef Stefan, Ljubljana,
Slovenia; (5) The Cyprus Institute, Nicosia, Cyprus; (6) Institute of Environmental Assessment and Water Research,
Barcelona, Spain
Presenting author email: [email protected]
Summary
To separate the influence of anthropogenic and natural contribution to the PM10 levels, the new method was developed within
the DNAAP project (Detection of non-anthropogenic air pollution - http://www.aerosol.si/dnaap/). The method is based on
measuring the optical absorption of aerosols by Aethalometer. The new size-selective inlet was developed to concentrate
aerosols in coarse mode and separately estimate the optical absorption on mineral dust.
Introduction
Mineral dust is an important natural source of aerosols and significantly influences local air quality. Frequent dust intrusions
are observed in the Mediterranean region and Central Europe, with a potential to cause exceedances of daily PM10 levels.
Methodology and Results
Dust weakly absorbs light in the near ultra-violet and short
wavelengths of the visible range, while the light absorption of dust in
longer wavelengths from the visible and near infra-red spectrum is
negligible. We used filter-based photometer Aethalometer AE33
(Drinovec et al., 2015) to measure the light absorption at seven
wavelengths, from 370 to 950 nm. The mineral dust is not the only
light-absorbing aerosol in the air. Black carbon (BC), a unique
primary tracer for combustion emissions, strongly absorbs light
across the entire visual, near infra-red and near ultra-violet spectral
range. Since the optical absorption of mineral dust is weaker than the
optical absorption of black carbon, the coarse mode mineral particles
must be concentrated using the high-volume virtual impactor (VI). The method is based on the optical absorption
measurements of the two sample streams, sampling particle size below 1 µm and sample stream with the concentrated coarse
mode particles, where mineral dust contribution is substantial (see Fig. 1). Experimental configuration includes two
Aethalometers AE33 with different size selective inlets: VI inlet for sampling coarse aerosol mode (mostly mineral dust) and
PM1 inlet for sampling fine mode of aerosols (mainly BC). The optical absorption of mineral dust can be determined by
subtracting the absorption of fine aerosol fraction (PM1) from the absorption of aerosol sampled by the VI, taking into
account the enhancement factor of VI setup (Drinovec et al., 2019). The mineral dust mass concentration is then calculated
using mass absorption cross-section (MAC) for dust which could be site and source-region specific. The results from more than 2-years long measurement campaigns will be presented, focusing on the analyses of aerosol
optical properties of PM1 and VI fractions. The results were validated using low time resolution chemical specification of
offline filters and a statistical approach where dust was extracted from PM10 measurements for dust intrusions periods
determined by models and back-trajectory studies. For better understanding, helium ion microscopy (HIM) was applied after
the campaign to study the microscopic differences between mineral dust and black carbon captured on the AE33 filter tapes.
Conclusions
We found minor differences between estimated MAC values on three stations – Barcelona in NE Spain, Agia Marina
Xyliatou in Cyprus and Ljubljana in Central Europe in Slovenia. This confirms the overall usefulness of the method to use it
to detect mineral dust concentrations coming from Northern Africa.
Acknowledgment
This work was supported by the Slovenian Ministry of Economic Development and Technology and the European Union
from the European Regional Development Fund, project DNAAP.
References
Drinovec, L., Močnik, G., Zotter, P., Prévôt, A.S.H., Ruckstuhl, C., Coz, E., Rupakheti, M., Sciare, J., Müller, T.,
Wiedensohler, A., Hansen, A.D.A., 2015. The “dual-spot” Aethalometer: an improved measurement of aerosol black carbon
with real-time loading compensation. Atmospheric Meas. Tech. 8, 1965–1979. https://doi.org/10.5194/amt-8-1965-2015
Drinovec, L., Višič, B., Remškar, B., Stavroulas, I., Pikridas, M., Unga, F., Sciare, J., Močnik, G., 2019. New method for on-
line determination of mineral dust concentration, in: Optical Properties of Aerosol and Dust: Measurements and Applications.
Presented at the European Aerosol Conference, Gothenburg, Sweden, EU.
Fig.1 Experimental setup.
56
TOXICOLOGICAL IMPACT OF SECONDARY ORGANIC AEROSOLS FORMED FROM THE REACTION OF
LIMONENE WITH OZONE
Florence JACOB (1,2), Nicolas HOUZEL (3), Laurent ALLEMAN (2), Esperanza PERDRIX (2), Sébastien ANTHERIEU (1),
Cécile COEUR (3), Paul GENEVRAY (4), Guillaume GARÇON (1), Alexandre TOMAS (2), Jean-Marc LO GUIDICE (1)
(1) Univ. Lille, CHU Lille, Institut Pasteur de Lille, ULR 4483-IMPECS, 59000 Lille, France ; (2) IMT Nord Europe,
Institut Mines-Télécom, Univ. Lille, Centre Energie et Environnement, 59000 Lille, France ; (3) Laboratoire de Physico-
Chimie de l’Atmosphère, Université du Littoral Côte d’Opale, 59140 Dunkerque, France ; (4) Centre Commun de Mesure,
Université du Littoral Côte d’Opale, 59140 Dunkerque, France
Presenting author email: [email protected]
Summary
Secondary organic aerosols (SOAs) formed from the reaction of limonene with O3 were generated under weak and strong
oxidation conditions in a flow reactor in order to evaluate their toxicity in relation to their physicochemical characteristics
studied. SOAs were analysed with an SMPS (Scanning Mobility Particle Sizer) to measure the particle size distribution and by
ESI-LC-QToF (ElectroSpray Ionization - Liquid Chromatography - Quadrupole - Time of Flight) to determine their chemical
composition. Cell-free measurements of the intrinsic oxidative potential (OP) of the aerosols were performed using antioxidant
depletions (DTT, AA) and a fluorescent probe (carboxyl-H2DCF-DA). In vitro tests, on the human bronchial epithelial BEAS-
2B cells, were conducted to evaluate the oxidative and the inflammatory responses under various exposure conditions. The first
results showed an intrinsic OP of the generated SOAs and the induction of antioxidant response-related parameters in exposed
cells.
Introduction
Chronic exposure to PM2.5 at concentrations above the regulatory limit values leads to many premature deaths by causing
and/or aggravating respiratory, cardiovascular or neurological pathologies and cancers (Chen et al., 2016). The regulations
which set threshold concentration values of particles in µg/m3, does not yet consider the links between the chemical
composition and the generated biological effects. SOAs, which can represent up to 90% of the organic carbon mass in PM2.5
(Gelencsér et al., 2007), are currently being studied to determine their impact on pulmonary toxicity. Indeed, their harmfulness
is still poorly known, whereas their concentration in the atmosphere should raise in the future because of the concomitant
increase of the emissions of volatile organic compound (VOC) precursors and the oxidizing capacity of the atmosphere in
connection with the climate change. As VOCs of biogenic origin contribute to 90% of global emissions, we chose to work first
on a model of SOAs resulting from the ozonolysis of limonene, one of the most emitted VOCs in the family of monoterpenes.
The physicochemical characterization of the formed SOAs was carried out, as well as the measurements of their intrinsic OP
and the investigation of the mechanisms involved in their lung toxicity.
Methodology and Results
The controlled generation of the SOAs produced from the limonene ozonolysis was developed in a laminar flow reactor. Two
oxidation conditions were implemented, with low (1 ppmv) and high (50 ppmv) ozone concentrations. The particle size
distribution of the generated SOAs showed the formation of ultrafine particles with a mean diameter of about 100 nm. The
average mass concentrations obtained were 2.13 ± 0.15 mg/m3 and 3.12 ± 0.17 mg/m3 for the SOAs formed from weak and
strong oxidation, respectively. The chemical composition was also studied by ESI-LC-QToF after aerosol sampling on quartz
fibre filters and extraction by dichloromethane. A large range of oligomers up to 1300-1350 uma was observed. The intrinsic
OP of the particles was evaluated with antioxidant depletion methods (DTT, AA) and carboxyl-H2DCF-DA fluorescent probe
excitation. In addition, in vitro toxicity tests were conducted on BEAS-2B cells after exposure to the SOAs generated in both
conditions. Two subtoxic doses of SOAs at 9 and 14 µg/cm2 of cell layer (10 % and 20 % lethal concentration, respectively)
were selected to evaluate the cellular effects of the particles after exposure during 6 h, 24 h or 48 h. Oxidative stress was
assessed by measuring intracellular ROS, GSSG/GSH ratio, oxidative damage (4 hydroxynonenal adduct (4-HNE), 8-hydroxy-
2’-deoxyguanosine (8-OHDG), carbonylated proteins), and the activation of the nuclear factor E2-related factor 2 (Nrf2)
signalling pathway. The inflammatory response was also assessed by quantification of cytokine secretion and/or gene
expression. Our preliminary results indicate that biogenic SOAs generated with lower ozone concentrations have a higher
intrinsic OP and induce greater cellular oxidative stress than those generated with higher ozone concentrations.
Conclusions
The quantities of biogenic SOA formed in the atmosphere should strongly increase in the coming decades. Already representing
a major part of the particulate mass, this study showed that SOAs produced from the ozonolysis reaction of limonene had an
intrinsic OP and were able to induce a cellular oxidative stress. It is therefore necessary to further understand the toxicological
impact of other SOAs generated from various VOC precursors, including anthropogenic ones.
Acknowledgements
We acknowledge the Lille university Hospital (CHU Lille) and the Institute for Multidisciplinary Research in Environmental
Sciences (IREPSE) for the financing of the reagents, as well as the government-region plan contract CLIMIBIO and the
European Metropolis of Lille (MEL) who financed the equipment used for in vitro experiments.
References
R. Chen et al., 2016. Beyond PM2.5: The role of ultrafine particles on adverse health effects of air pollution. Biochimica et
Biophysica Acta, vol. 1860, no 12, 2844‑2855.
A. Gelencsér et al., 2007. Source apportionment of PM2.5 organic aerosol over Europe: Primary/secondary,
natural/anthropogenic, and fossil/biogenic origin. Journal of Geophysical Research, vol. 112, no D23, D23S04.
57

EMISSIONS FROM GLOBAL SHIPPING IN 2014-2020
J.-P. Jalkanen (1), H. Liu (2), E. Majamäki (1), L. Johansson (1), X. Wang (2), W. Yi (2), Z. Luo (2), E. Carr (3) and J. J.
Corbett (4)
(1)Atmospheric Composition research, Finnish Meteorological Institute, P.O. Box 503, FI-00101 Helsinki, Finland; (2)
Division of Air Pollution Control, School of Environment, Tsinghua University, Beijing, China; (3) Energy and
Environmental Research Associates LLC, 2 Babcock Farms Lane, Pittsford, New York 14534, USA; (4) University of
Delaware, School of Marine Policy, Newark, DE 19711, USA
Presenting author email: [email protected]
Summary
In this paper, global and regional air emission timeseries for shipping during the period of 2014-2020 are reported. These
emission inventories are based on full bottom-up modeling of ships and include several features, like the global sulphur cap of
0.5%, which became effective in January 2020, and the disruption caused by the COVID-19 pandemic.
Introduction
The factors contributing to changes in emissions cannot be identified by looking at emission totals only. This work reports
bottom-up emission inventories of ship emissions based on Automatic Identification System (AIS) data (Johansson et al., 2017;
Wang et al., 2021). A detailed view on the changes of environmental regulation and global COVID19 pandemic are provided.
Methodology and Results
Regional (EU, SE Asia and North America) and global emission inventories were generated in this work, which enabled time
dependent, high-resolution emission studies to identify e.g impacts of rotating lockdown periods on ship emissions. We report
a decrease of -9.2% in global fleet fuel consumption, but -75% and -52% decrease in SOx and PM emissions because of the
combined effect of the pandemic and the global sulphur cap. These reductions are smaller for Emission Control Areas where
sulfur emissions have already been regulated.
Figure 1. Changes of CO2 (left) and SOx
(right) emissions in EU sea regions. The
differences in CO2 reflect the impact of
global pandemic, but the diffe-rences in
SOx emissions are the result of both the
pandemic and the intro-duction of global
2020 Sulphur cap. Circles repre-sent
changes in total emissions
The North American ECA and the Chinese Domestic ECA include similar complexities in ship emission construction and are
included in our current work. Around China, 2019 has witnessed a 78.2% drop of SOx emission from shipping from 2018 as a
result of the implementation of the latest Chinese Domestic ECA policy. In the area of SE Asia, a similar trend of shipping
activities and emissions synergistic with the globe was observed, with the decrease of CO2 emissions estimated to be -3.9%,
while SOx and PM to be -77.6% and -72.3%, respectively, in 2020 compared with 2019.
Conclusions
Ship emission inventories for 2020 are impacted by at least a) global sulfur cap, b) COVID19 pandemic and c) changes in ship
activity data coverage. Each of these contributed differently to ship emissions, but these features cannot be determined by
comparing annual total emissions from different years. Regional changes, like improvements of vessel activity description or
impacts of regional lockdown periods, are visible in fully dynamic ship emission inventories. Changes in the geographic
distribution of emissions occurred because the pandemic impacted different types of ship traffic in a variable manner. Large
emission changes were observed for passenger shipping, but less so for cargo ships. These features are notoriously difficult to
determine from static annual inventories and temporal profiles.
Acknowledgement
We acknowledge the funding from the Copernicus Atmosphere Monitoring Service (CAMS), which is implemented by the
European Centre for Medium-Range Weather Forecasts (ECMWF) on behalf of the European Commission.
References
Johansson, L., Jalkanen, J.-P., Kukkonen, J., 2017. Global assessment of shipping emissions in 2015 on a high spatial and
temporal resolution. Atmos. Environ. 167, 403–415. https://doi.org/10.1016/j.atmosenv.2017.08.042
Wang, X., Yi, W., Lv, Z., Deng, F., Zheng, S., Xu, H., Zhao, J., Liu, H., He, K., 2021. Ship emissions around China under
gradually promoted control policies from 2016 to 2019. Atmos. Chem. Phys. 21, 13835–13853. https://doi.org/10.5194/acp-
21-13835-2021
58

CRUISE SHIPS IN DANISH HARBOURS
– EMISSIONS, AIR QUALITY AND HEALTH BURDEN
S.S. Jensen (1), P. Løfstrøm (1), M. Winther (1), L.M. Frohn (1), M. Ketzel (1)
(1) Aarhus University, Department of Environmental Science, Roskilde, Denmark
Presenting author email: [email protected]
Summary
Cruise ship and other ship activity and their emissions were investigated in the five largest cruise ship harbours in Denmark
from 2015 to 2019. Air quality calculations were carried out for cruise ships for PM2.5 and NO2 for different heights in the
harbours and adjacent urban areas for 2019, and in addition for other ships for the harbours of Copenhagen and Aarhus. Air
quality concentrations were visualised on maps and compared with EU limit values and the new WHO air quality guidelines
(AQG).The health burden of cruise ship emissions in the harbours of Copenhagen and Aarhus was estimated for 2019.
Introduction
Visits by cruise ships are increasing in Danish harbours. The harbours and cities are increasingly attracting cruise ships and
tourists to benefit the local economy. However, at the same time cities also want to create more attractive harbour areas with
more commercial and residential buildings. The dilemma causes annoyance and exposure to employees and residents in the
harbour areas due to exhaust from ship engines while being at quay.
Methodology and Results
Air quality calculations have been carried out with an air
quality model (OML, www.au.dk/oml-international) based on
detailed ship activity data, an emission inventory and physical
parameters of the ships together with meteorological data and
background concentrations. Concentrations were computed
for all centre points in a fine receptor grid in the harbours at
different heights (1.5 m, 25 m, 50 m and 70 m). Ships were
grouped into cruise ships and other ships. Emission inventories
were compiled for the five largest cruise ship harbours from
2015 to 2019. Air quality and health burden for 2019 were
estimated for the harbours of Copenhagen and Aarhus. The
resulting concentrations for PM2.5 and NO2 were visualised on
maps and compared with EU limit values and the new WHO
air quality guidelines (AQG).
Conclusions with focus on Harbour of Copenhagen
Cruise ship activity and emissions have increased from 2015
to 2019. No exceedances of the EU limit values at ground level
for annual means of NO2 and PM2.5 were observed although
the new WHO AQG were exceeded.
Exceedances of the EU Limit value for the 19th highest hourly
value of NO2 were seen in heights of 25 m, 50 m and 70 m,
and the new WHO AQG was also exceeded
Exceedances of the EU limit value occur in the near vicinity
of the quay areas within 100-200 m. No exceedances of the EU
limit value occur in urban areas adjacent to the harbours.
Both ‘Only cruise ships’ and ‘Only other ships’ cause
exceedances of the EU limit value for the 19th highest hourly
value for NO2 in heights of 25 m and 50 m and ‘Only cruise
ships’ also in height of 70 m. A similar overall picture was
seen for three of the other harbours with cruise ships (Aarhus, Aalborg, Skagen but not Rønne). Approximately three premature
deaths were calculated due to cruise ships emissions in Copenhagen and Aarhus harbours based on the EVA-system (Economic
Valuation of Air Pollution, www.au.dk/EVA).
Acknowledgement
This work was supported by the Danish Ministry of Environment.
References
Jensen et al. 2019. Mapping of air pollution from cruise ships. Aarhus University, DCE, Scientific Report No. 316.
http://dce2.au.dk/pub/SR316.pdf. In Danish with English summary.
Jensen et al. 2021. Mapping of trends in air pollution from cruise ships and other ships in five Danish harbours. Aarhus
University, DCE. Scientific Report No. 413. http://dce2.au.dk/pub/SR413.pdf. In Danish.
Ellermann et al. 2021. Air quality 2019. Status for the national air quality monitoring programme. Aarhus University, DCE.
Scientific report No. 410. http://dce2.au.dk/pub/SR410.pdf. In Danish with English summary.
Map of Copenhagen harbour with concentration iso-curves for
2019 results. The 19th highest hourly value of NO2 in height of
25 m is visualised. Areas with the red iso-curves are exceeding
the EU limit value.
59
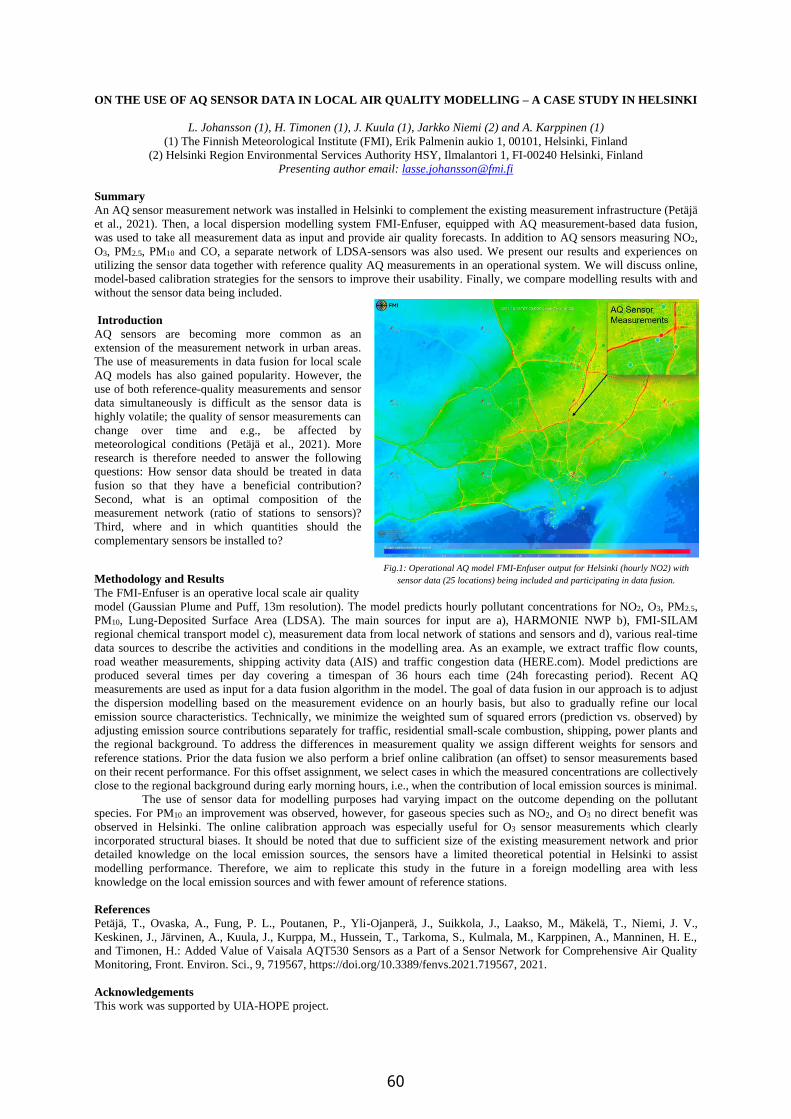
ON THE USE OF AQ SENSOR DATA IN LOCAL AIR QUALITY MODELLING – A CASE STUDY IN HELSINKI
L. Johansson (1), H. Timonen (1), J. Kuula (1), Jarkko Niemi (2) and A. Karppinen (1)
(1) The Finnish Meteorological Institute (FMI), Erik Palmenin aukio 1, 00101, Helsinki, Finland
(2) Helsinki Region Environmental Services Authority HSY, Ilmalantori 1, FI-00240 Helsinki, Finland
Presenting author email: [email protected]
Summary
An AQ sensor measurement network was installed in Helsinki to complement the existing measurement infrastructure (Petäjä
et al., 2021). Then, a local dispersion modelling system FMI-Enfuser, equipped with AQ measurement-based data fusion,
was used to take all measurement data as input and provide air quality forecasts. In addition to AQ sensors measuring NO2,
O3, PM2.5, PM10 and CO, a separate network of LDSA-sensors was also used. We present our results and experiences on
utilizing the sensor data together with reference quality AQ measurements in an operational system. We will discuss online,
model-based calibration strategies for the sensors to improve their usability. Finally, we compare modelling results with and
without the sensor data being included.
Introduction
AQ sensors are becoming more common as an
extension of the measurement network in urban areas.
The use of measurements in data fusion for local scale
AQ models has also gained popularity. However, the
use of both reference-quality measurements and sensor
data simultaneously is difficult as the sensor data is
highly volatile; the quality of sensor measurements can
change over time and e.g., be affected by
meteorological conditions (Petäjä et al., 2021). More
research is therefore needed to answer the following
questions: How sensor data should be treated in data
fusion so that they have a beneficial contribution?
Second, what is an optimal composition of the
measurement network (ratio of stations to sensors)?
Third, where and in which quantities should the
complementary sensors be installed to?
Methodology and Results
The FMI-Enfuser is an operative local scale air quality
model (Gaussian Plume and Puff, 13m resolution). The model predicts hourly pollutant concentrations for NO2, O3, PM2.5,
PM10, Lung-Deposited Surface Area (LDSA). The main sources for input are a), HARMONIE NWP b), FMI-SILAM
regional chemical transport model c), measurement data from local network of stations and sensors and d), various real-time
data sources to describe the activities and conditions in the modelling area. As an example, we extract traffic flow counts,
road weather measurements, shipping activity data (AIS) and traffic congestion data (HERE.com). Model predictions are
produced several times per day covering a timespan of 36 hours each time (24h forecasting period). Recent AQ
measurements are used as input for a data fusion algorithm in the model. The goal of data fusion in our approach is to adjust
the dispersion modelling based on the measurement evidence on an hourly basis, but also to gradually refine our local
emission source characteristics. Technically, we minimize the weighted sum of squared errors (prediction vs. observed) by
adjusting emission source contributions separately for traffic, residential small-scale combustion, shipping, power plants and
the regional background. To address the differences in measurement quality we assign different weights for sensors and
reference stations. Prior the data fusion we also perform a brief online calibration (an offset) to sensor measurements based
on their recent performance. For this offset assignment, we select cases in which the measured concentrations are collectively
close to the regional background during early morning hours, i.e., when the contribution of local emission sources is minimal.
The use of sensor data for modelling purposes had varying impact on the outcome depending on the pollutant
species. For PM10 an improvement was observed, however, for gaseous species such as NO2, and O3 no direct benefit was
observed in Helsinki. The online calibration approach was especially useful for O3 sensor measurements which clearly
incorporated structural biases. It should be noted that due to sufficient size of the existing measurement network and prior
detailed knowledge on the local emission sources, the sensors have a limited theoretical potential in Helsinki to assist
modelling performance. Therefore, we aim to replicate this study in the future in a foreign modelling area with less
knowledge on the local emission sources and with fewer amount of reference stations.
References
Petäjä, T., Ovaska, A., Fung, P. L., Poutanen, P., Yli-Ojanperä, J., Suikkola, J., Laakso, M., Mäkelä, T., Niemi, J. V.,
Keskinen, J., Järvinen, A., Kuula, J., Kurppa, M., Hussein, T., Tarkoma, S., Kulmala, M., Karppinen, A., Manninen, H. E.,
and Timonen, H.: Added Value of Vaisala AQT530 Sensors as a Part of a Sensor Network for Comprehensive Air Quality
Monitoring, Front. Environ. Sci., 9, 719567, https://doi.org/10.3389/fenvs.2021.719567, 2021.
Acknowledgements
This work was supported by UIA-HOPE project.
Fig.1: Operational AQ model FMI-Enfuser output for Helsinki (hourly NO2) with
sensor data (25 locations) being included and participating in data fusion.
60
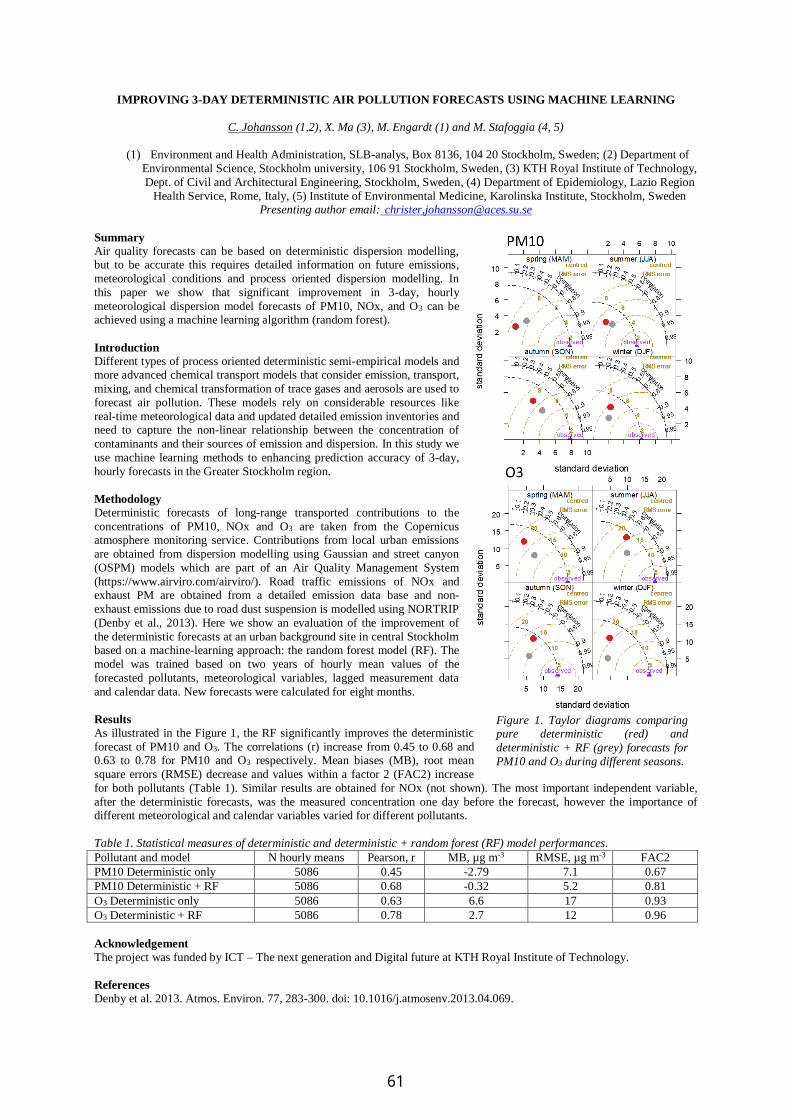
IMPROVING 3-DAY DETERMINISTIC AIR POLLUTION FORECASTS USING MACHINE LEARNING
C. Johansson (1,2), X. Ma (3), M. Engardt (1) and M. Stafoggia (4, 5)
(1) Environment and Health Administration, SLB-analys, Box 8136, 104 20 Stockholm, Sweden; (2) Department of
Environmental Science, Stockholm university, 106 91 Stockholm, Sweden, (3) KTH Royal Institute of Technology,
Dept. of Civil and Architectural Engineering, Stockholm, Sweden, (4) Department of Epidemiology, Lazio Region
Health Service, Rome, Italy, (5) Institute of Environmental Medicine, Karolinska Institute, Stockholm, Sweden Presenting author email: christer,[email protected]
Summary
Air quality forecasts can be based on deterministic dispersion modelling, but to be accurate this requires detailed information on future emissions,
meteorological conditions and process oriented dispersion modelling. In
this paper we show that significant improvement in 3-day, hourly
meteorological dispersion model forecasts of PM10, NOx, and O3 can be achieved using a machine learning algorithm (random forest).
Introduction
Different types of process oriented deterministic semi-empirical models and
more advanced chemical transport models that consider emission, transport,
mixing, and chemical transformation of trace gases and aerosols are used to
forecast air pollution. These models rely on considerable resources like
real-time meteorological data and updated detailed emission inventories and need to capture the non-linear relationship between the concentration of
contaminants and their sources of emission and dispersion. In this study we
use machine learning methods to enhancing prediction accuracy of 3-day,
hourly forecasts in the Greater Stockholm region.
Methodology
Deterministic forecasts of long-range transported contributions to the
concentrations of PM10, NOx and O3 are taken from the Copernicus atmosphere monitoring service. Contributions from local urban emissions
are obtained from dispersion modelling using Gaussian and street canyon
(OSPM) models which are part of an Air Quality Management System
(https://www.airviro.com/airviro/). Road traffic emissions of NOx and exhaust PM are obtained from a detailed emission data base and non-
exhaust emissions due to road dust suspension is modelled using NORTRIP
(Denby et al., 2013). Here we show an evaluation of the improvement of
the deterministic forecasts at an urban background site in central Stockholm based on a machine-learning approach: the random forest model (RF). The
model was trained based on two years of hourly mean values of the
forecasted pollutants, meteorological variables, lagged measurement data
and calendar data. New forecasts were calculated for eight months.
Results
As illustrated in the Figure 1, the RF significantly improves the deterministic
forecast of PM10 and O3. The correlations (r) increase from 0.45 to 0.68 and 0.63 to 0.78 for PM10 and O3 respectively. Mean biases (MB), root mean
square errors (RMSE) decrease and values within a factor 2 (FAC2) increase
for both pollutants (Table 1). Similar results are obtained for NOx (not shown). The most important independent variable,
after the deterministic forecasts, was the measured concentration one day before the forecast, however the importance of
different meteorological and calendar variables varied for different pollutants.
Table 1. Statistical measures of deterministic and deterministic + random forest (RF) model performances.
Pollutant and model N hourly means Pearson, r MB, µg m-3 RMSE, µg m-3 FAC2
PM10 Deterministic only 5086 0.45 -2.79 7.1 0.67
PM10 Deterministic + RF 5086 0.68 -0.32 5.2 0.81
O3 Deterministic only 5086 0.63 6.6 17 0.93
O3 Deterministic + RF 5086 0.78 2.7 12 0.96
Acknowledgement
The project was funded by ICT – The next generation and Digital future at KTH Royal Institute of Technology.
References
Denby et al. 2013. Atmos. Environ. 77, 283-300. doi: 10.1016/j.atmosenv.2013.04.069.
Figure 1. Taylor diagrams comparing pure deterministic (red) and
deterministic + RF (grey) forecasts for
PM10 and O3 during different seasons.
61
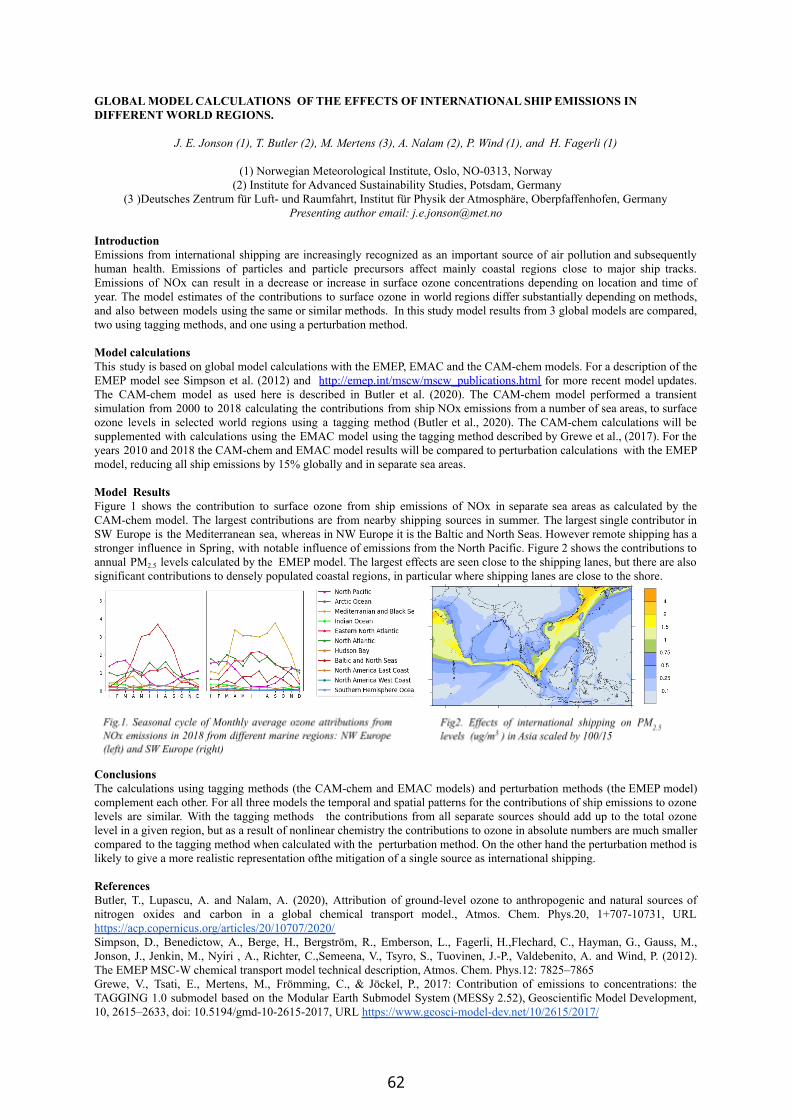
GLOBAL MODEL CALCULATIONS OF THE EFFECTS OF INTERNATIONAL SHIP EMISSIONS INDIFFERENT WORLD REGIONS.
J. E. Jonson (1), T. Butler (2), M. Mertens (3), A. Nalam (2), P. Wind (1), and H. Fagerli (1)
(1) Norwegian Meteorological Institute, Oslo, NO-0313, Norway(2) Institute for Advanced Sustainability Studies, Potsdam, Germany
(3 )Deutsches Zentrum für Luft- und Raumfahrt, Institut für Physik der Atmosphäre, Oberpfaffenhofen, GermanyPresenting author email: [email protected]
IntroductionEmissions from international shipping are increasingly recognized as an important source of air pollution and subsequentlyhuman health. Emissions of particles and particle precursors affect mainly coastal regions close to major ship tracks.Emissions of NOx can result in a decrease or increase in surface ozone concentrations depending on location and time ofyear. The model estimates of the contributions to surface ozone in world regions differ substantially depending on methods,and also between models using the same or similar methods. In this study model results from 3 global models are compared,two using tagging methods, and one using a perturbation method.
Model calculationsThis study is based on global model calculations with the EMEP, EMAC and the CAM-chem models. For a description of theEMEP model see Simpson et al. (2012) and http://emep.int/mscw/mscw_publications.html for more recent model updates.The CAM-chem model as used here is described in Butler et al. (2020). The CAM-chem model performed a transientsimulation from 2000 to 2018 calculating the contributions from ship NOx emissions from a number of sea areas, to surfaceozone levels in selected world regions using a tagging method (Butler et al., 2020). The CAM-chem calculations will besupplemented with calculations using the EMAC model using the tagging method described by Grewe et al., (2017). For theyears 2010 and 2018 the CAM-chem and EMAC model results will be compared to perturbation calculations with the EMEPmodel, reducing all ship emissions by 15% globally and in separate sea areas.
Model ResultsFigure 1 shows the contribution to surface ozone from ship emissions of NOx in separate sea areas as calculated by theCAM-chem model. The largest contributions are from nearby shipping sources in summer. The largest single contributor inSW Europe is the Mediterranean sea, whereas in NW Europe it is the Baltic and North Seas. However remote shipping has astronger influence in Spring, with notable influence of emissions from the North Pacific. Figure 2 shows the contributions toannual PM2.5 levels calculated by the EMEP model. The largest effects are seen close to the shipping lanes, but there are alsosignificant contributions to densely populated coastal regions, in particular where shipping lanes are close to the shore.
ConclusionsThe calculations using tagging methods (the CAM-chem and EMAC models) and perturbation methods (the EMEP model)complement each other. For all three models the temporal and spatial patterns for the contributions of ship emissions to ozonelevels are similar. With the tagging methods the contributions from all separate sources should add up to the total ozonelevel in a given region, but as a result of nonlinear chemistry the contributions to ozone in absolute numbers are much smallercompared to the tagging method when calculated with the perturbation method. On the other hand the perturbation method islikely to give a more realistic representation ofthe mitigation of a single source as international shipping.
ReferencesButler, T., Lupascu, A. and Nalam, A. (2020), Attribution of ground-level ozone to anthropogenic and natural sources ofnitrogen oxides and carbon in a global chemical transport model., Atmos. Chem. Phys.20, 1+707-10731, URLhttps://acp.copernicus.org/articles/20/10707/2020/Simpson, D., Benedictow, A., Berge, H., Bergström, R., Emberson, L., Fagerli, H.,Flechard, C., Hayman, G., Gauss, M.,Jonson, J., Jenkin, M., Nyıri , A., Richter, C.,Semeena, V., Tsyro, S., Tuovinen, J.-P., Valdebenito, A. and Wind, P. (2012).The EMEP MSC-W chemical transport model technical description, Atmos. Chem. Phys.12: 7825–7865Grewe, V., Tsati, E., Mertens, M., Frömming, C., & Jöckel, P., 2017: Contribution of emissions to concentrations: theTAGGING 1.0 submodel based on the Modular Earth Submodel System (MESSy 2.52), Geoscientific Model Development,10, 2615–2633, doi: 10.5194/gmd-10-2615-2017, URL https://www.geosci-model-dev.net/10/2615/2017/
62
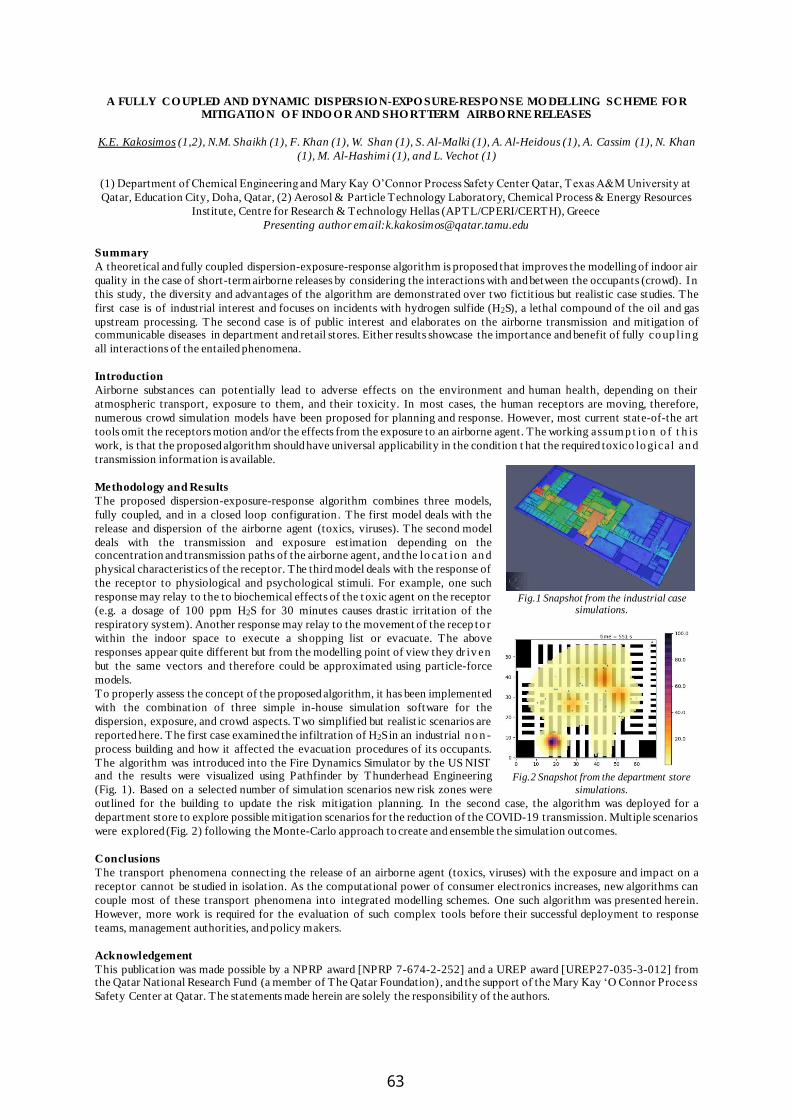
A FULLY CO UPLED AND DYNAMIC DISPERSIO N-EXPO SURE-RESPO NSE MO DELLING SCHEME FO R MITIGATIO N O F INDO O R AND SHO RT TERM AIRBO RNE RELEASES
K.E. Kakosimos (1,2), N.M. Shaikh (1), F. Khan (1), W. Shan (1), S. Al-Malki (1), A. Al-Heidous (1), A. Cassim (1), N. Khan
(1), M. Al-Hashimi (1), and L. Vechot (1)
(1) Department of Chemical Engineering and Mary Kay O’Connor Process Safety Center Qatar, Texas A&M University at
Qatar, Education City, Doha, Qatar, (2) Aerosol & Particle Technology Laboratory, Chemical Process & Energy Resources
Institute, Centre for Research & Technology Hellas (APTL/CPERI/CERTH), Greece
Presenting author email:[email protected]
Summary
A theoretical and fully coupled dispersion-exposure-response algorithm is proposed that improves the modelling of indoor air
quality in the case of short-term airborne releases by considering the interactions with and between the occupants (crowd). In
this study, the diversity and advantages of the algorithm are demonstrated over two fictitious but realistic case studies. The
first case is of industrial interest and focuses on incidents with hydrogen sulfide (H2S), a lethal compound of the oil and gas
upstream processing. The second case is of public interest and elaborates on the airborne transmission and mitigation of communicable diseases in department and retail stores. Either results showcase the importance and benefit of fully co up lin g
all interactions of the entailed phenomena.
Introduction
Airborne substances can potentially lead to adverse effects on the environment and human health, depending on their
atmospheric transport, exposure to them, and their toxicity. In most cases, the human receptors are moving, therefore,
numerous crowd simulation models have been proposed for planning and response. However, most current state-of-the art
tools omit the receptors motion and/or the effects from the exposure to an airborne agent. The working assum p t io n o f t h is
work, is that the proposed algorithm should have universal applicability in the condition t hat the required toxico lo gical an d
transmission information is available.
Methodology and Results
The proposed dispersion-exposure-response algorithm combines three models,
fully coupled, and in a closed loop configuration. The first model deals with the
release and dispersion of the airborne agent (toxics, viruses). The second model
deals with the transmission and exposure estimation depending on the concentration and transmission paths of the airborne agent, and the lo cat io n an d
physical characteristics of the receptor. The third model deals with the response of
the receptor to physiological and psychological stimuli. For example, one such
response may relay to the to biochemical effects of the t oxic agent on the receptor
(e.g. a dosage of 100 ppm H2S for 30 minutes causes drastic irritation of the
respiratory system). Another response may relay to the movement of the recep to r
within the indoor space to execute a shopping list or evacuate. The above
responses appear quite different but from the modelling point of view they dr iv en
but the same vectors and therefore could be approximated using particle-force
models.
To properly assess the concept of the proposed algorithm, it has been implemented
with the combination of three simple in-house simulation software for the
dispersion, exposure, and crowd aspects. Two simplified but realist ic scenarios are
reported here. The first case examined the infiltration of H2S in an industrial n o n -
process building and how it affected the evacuation procedures of its occupants.
The algorithm was introduced into the Fire Dynamics Simulator by the US NIST and the results were visualized using Pathfinder by Thunderhead Engineering
(Fig. 1). Based on a selected number of simulation scenarios new risk zones were
outlined for the building to update the risk mitigation planning. In the second case, the algorithm was deployed for a
department store to explore possible mitigation scenarios for the reduction of the COVID-19 transmission. Multiple scenarios
were explored (Fig. 2) following the Monte-Carlo approach to create and ensemble the simulation outcomes.
Conclusions
The transport phenomena connecting the release of an airborne agent (toxics, viruses) with the exposure and impact on a
receptor cannot be studied in isolation. As the computational power of consumer electronics increases, new algorithms can
couple most of these transport phenomena into integrated modelling schemes. One such algorithm was presented herein.
However, more work is required for the evaluation of such complex tools before their successful deployment to response
teams, management authorities, and policy makers.
Acknowledgement
This publication was made possible by a NPRP award [NPRP 7-674-2-252] and a UREP award [UREP27-035-3-012] from the Qatar National Research Fund (a member of The Qatar Foundation) , and the support of the Mary Kay ‘O Connor Process
Safety Center at Qatar. The statements made herein are solely the responsibility of the authors.
Fig.1 Snapshot from the industrial case
simulations.
Fig.2 Snapshot from the department store
simulations.
63
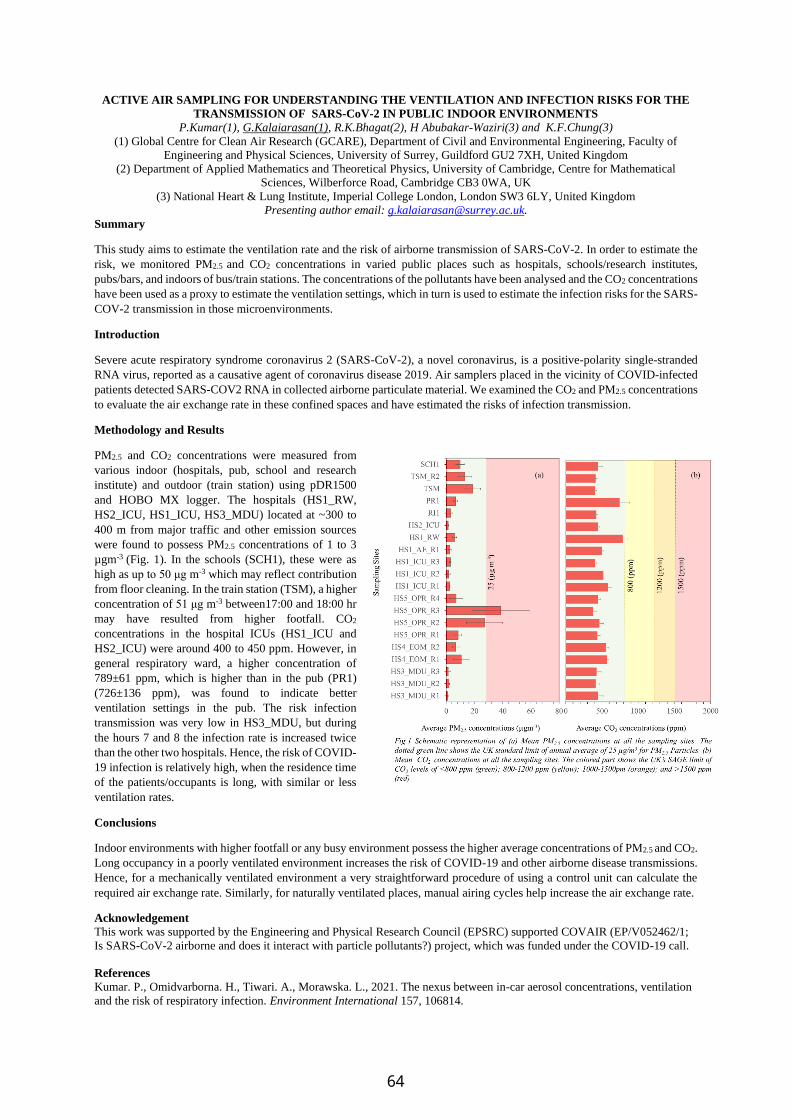
ACTIVE AIR SAMPLING FOR UNDERSTANDING THE VENTILATION AND INFECTION RISKS FOR THE
TRANSMISSION OF SARS-CoV-2 IN PUBLIC INDOOR ENVIRONMENTS
P.Kumar(1), G.Kalaiarasan(1), R.K.Bhagat(2), H Abubakar-Waziri(3) and K.F.Chung(3)
(1) Global Centre for Clean Air Research (GCARE), Department of Civil and Environmental Engineering, Faculty of
Engineering and Physical Sciences, University of Surrey, Guildford GU2 7XH, United Kingdom
(2) Department of Applied Mathematics and Theoretical Physics, University of Cambridge, Centre for Mathematical
Sciences, Wilberforce Road, Cambridge CB3 0WA, UK
(3) National Heart & Lung Institute, Imperial College London, London SW3 6LY, United Kingdom
Presenting author email: [email protected].
Summary
This study aims to estimate the ventilation rate and the risk of airborne transmission of SARS-CoV-2. In order to estimate the
risk, we monitored PM2.5 and CO2 concentrations in varied public places such as hospitals, schools/research institutes,
pubs/bars, and indoors of bus/train stations. The concentrations of the pollutants have been analysed and the CO2 concentrations
have been used as a proxy to estimate the ventilation settings, which in turn is used to estimate the infection risks for the SARS-
COV-2 transmission in those microenvironments.
Introduction
Severe acute respiratory syndrome coronavirus 2 (SARS-CoV-2), a novel coronavirus, is a positive-polarity single-stranded
RNA virus, reported as a causative agent of coronavirus disease 2019. Air samplers placed in the vicinity of COVID-infected
patients detected SARS-COV2 RNA in collected airborne particulate material. We examined the CO2 and PM2.5 concentrations
to evaluate the air exchange rate in these confined spaces and have estimated the risks of infection transmission.
Methodology and Results
PM2.5 and CO2 concentrations were measured from
various indoor (hospitals, pub, school and research
institute) and outdoor (train station) using pDR1500
and HOBO MX logger. The hospitals (HS1_RW,
HS2_ICU, HS1_ICU, HS3_MDU) located at ~300 to
400 m from major traffic and other emission sources
were found to possess PM2.5 concentrations of 1 to 3
µgm-3 (Fig. 1). In the schools (SCH1), these were as
high as up to 50 μg m-3 which may reflect contribution
from floor cleaning. In the train station (TSM), a higher
concentration of 51 μg m-3 between17:00 and 18:00 hr
may have resulted from higher footfall. CO2
concentrations in the hospital ICUs (HS1_ICU and
HS2_ICU) were around 400 to 450 ppm. However, in
general respiratory ward, a higher concentration of
789±61 ppm, which is higher than in the pub (PR1)
(726±136 ppm), was found to indicate better
ventilation settings in the pub. The risk infection
transmission was very low in HS3_MDU, but during
the hours 7 and 8 the infection rate is increased twice
than the other two hospitals. Hence, the risk of COVID-
19 infection is relatively high, when the residence time
of the patients/occupants is long, with similar or less
ventilation rates.
Conclusions
Indoor environments with higher footfall or any busy environment possess the higher average concentrations of PM2.5 and CO2.
Long occupancy in a poorly ventilated environment increases the risk of COVID-19 and other airborne disease transmissions.
Hence, for a mechanically ventilated environment a very straightforward procedure of using a control unit can calculate the
required air exchange rate. Similarly, for naturally ventilated places, manual airing cycles help increase the air exchange rate.
Acknowledgement
This work was supported by the Engineering and Physical Research Council (EPSRC) supported COVAIR (EP/V052462/1;
Is SARS-CoV-2 airborne and does it interact with particle pollutants?) project, which was funded under the COVID-19 call.
References
Kumar. P., Omidvarborna. H., Tiwari. A., Morawska. L., 2021. The nexus between in-car aerosol concentrations, ventilation
and the risk of respiratory infection. Environment International 157, 106814.
64
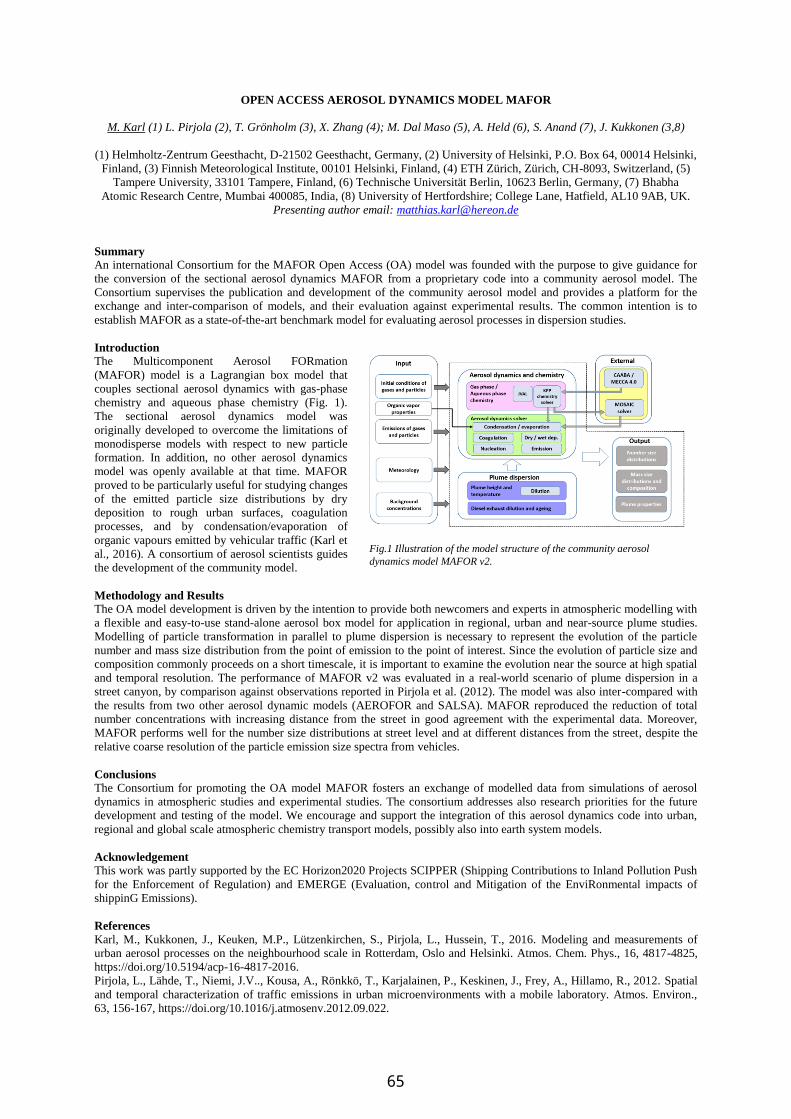
OPEN ACCESS AEROSOL DYNAMICS MODEL MAFOR
M. Karl (1) L. Pirjola (2), T. Grönholm (3), X. Zhang (4); M. Dal Maso (5), A. Held (6), S. Anand (7), J. Kukkonen (3,8)
(1) Helmholtz-Zentrum Geesthacht, D-21502 Geesthacht, Germany, (2) University of Helsinki, P.O. Box 64, 00014 Helsinki,
Finland, (3) Finnish Meteorological Institute, 00101 Helsinki, Finland, (4) ETH Zürich, Zürich, CH-8093, Switzerland, (5)
Tampere University, 33101 Tampere, Finland, (6) Technische Universität Berlin, 10623 Berlin, Germany, (7) Bhabha
Atomic Research Centre, Mumbai 400085, India, (8) University of Hertfordshire; College Lane, Hatfield, AL10 9AB, UK.
Presenting author email: [email protected]
Summary
An international Consortium for the MAFOR Open Access (OA) model was founded with the purpose to give guidance for
the conversion of the sectional aerosol dynamics MAFOR from a proprietary code into a community aerosol model. The
Consortium supervises the publication and development of the community aerosol model and provides a platform for the
exchange and inter-comparison of models, and their evaluation against experimental results. The common intention is to
establish MAFOR as a state-of-the-art benchmark model for evaluating aerosol processes in dispersion studies.
Introduction
The Multicomponent Aerosol FORmation
(MAFOR) model is a Lagrangian box model that
couples sectional aerosol dynamics with gas-phase
chemistry and aqueous phase chemistry (Fig. 1).
The sectional aerosol dynamics model was
originally developed to overcome the limitations of
monodisperse models with respect to new particle
formation. In addition, no other aerosol dynamics
model was openly available at that time. MAFOR
proved to be particularly useful for studying changes
of the emitted particle size distributions by dry
deposition to rough urban surfaces, coagulation
processes, and by condensation/evaporation of
organic vapours emitted by vehicular traffic (Karl et
al., 2016). A consortium of aerosol scientists guides
the development of the community model.
Methodology and Results
The OA model development is driven by the intention to provide both newcomers and experts in atmospheric modelling with
a flexible and easy-to-use stand-alone aerosol box model for application in regional, urban and near-source plume studies.
Modelling of particle transformation in parallel to plume dispersion is necessary to represent the evolution of the particle
number and mass size distribution from the point of emission to the point of interest. Since the evolution of particle size and
composition commonly proceeds on a short timescale, it is important to examine the evolution near the source at high spatial
and temporal resolution. The performance of MAFOR v2 was evaluated in a real-world scenario of plume dispersion in a
street canyon, by comparison against observations reported in Pirjola et al. (2012). The model was also inter-compared with
the results from two other aerosol dynamic models (AEROFOR and SALSA). MAFOR reproduced the reduction of total
number concentrations with increasing distance from the street in good agreement with the experimental data. Moreover,
MAFOR performs well for the number size distributions at street level and at different distances from the street, despite the
relative coarse resolution of the particle emission size spectra from vehicles.
Conclusions
The Consortium for promoting the OA model MAFOR fosters an exchange of modelled data from simulations of aerosol
dynamics in atmospheric studies and experimental studies. The consortium addresses also research priorities for the future
development and testing of the model. We encourage and support the integration of this aerosol dynamics code into urban,
regional and global scale atmospheric chemistry transport models, possibly also into earth system models.
Acknowledgement
This work was partly supported by the EC Horizon2020 Projects SCIPPER (Shipping Contributions to Inland Pollution Push
for the Enforcement of Regulation) and EMERGE (Evaluation, control and Mitigation of the EnviRonmental impacts of
shippinG Emissions).
References
Karl, M., Kukkonen, J., Keuken, M.P., Lützenkirchen, S., Pirjola, L., Hussein, T., 2016. Modeling and measurements of
urban aerosol processes on the neighbourhood scale in Rotterdam, Oslo and Helsinki. Atmos. Chem. Phys., 16, 4817-4825,
https://doi.org/10.5194/acp-16-4817-2016.
Pirjola, L., Lähde, T., Niemi, J.V.., Kousa, A., Rönkkö, T., Karjalainen, P., Keskinen, J., Frey, A., Hillamo, R., 2012. Spatial
and temporal characterization of traffic emissions in urban microenvironments with a mobile laboratory. Atmos. Environ.,
63, 156-167, https://doi.org/10.1016/j.atmosenv.2012.09.022.
Fig.1 Illustration of the model structure of the community aerosol
dynamics model MAFOR v2.
65
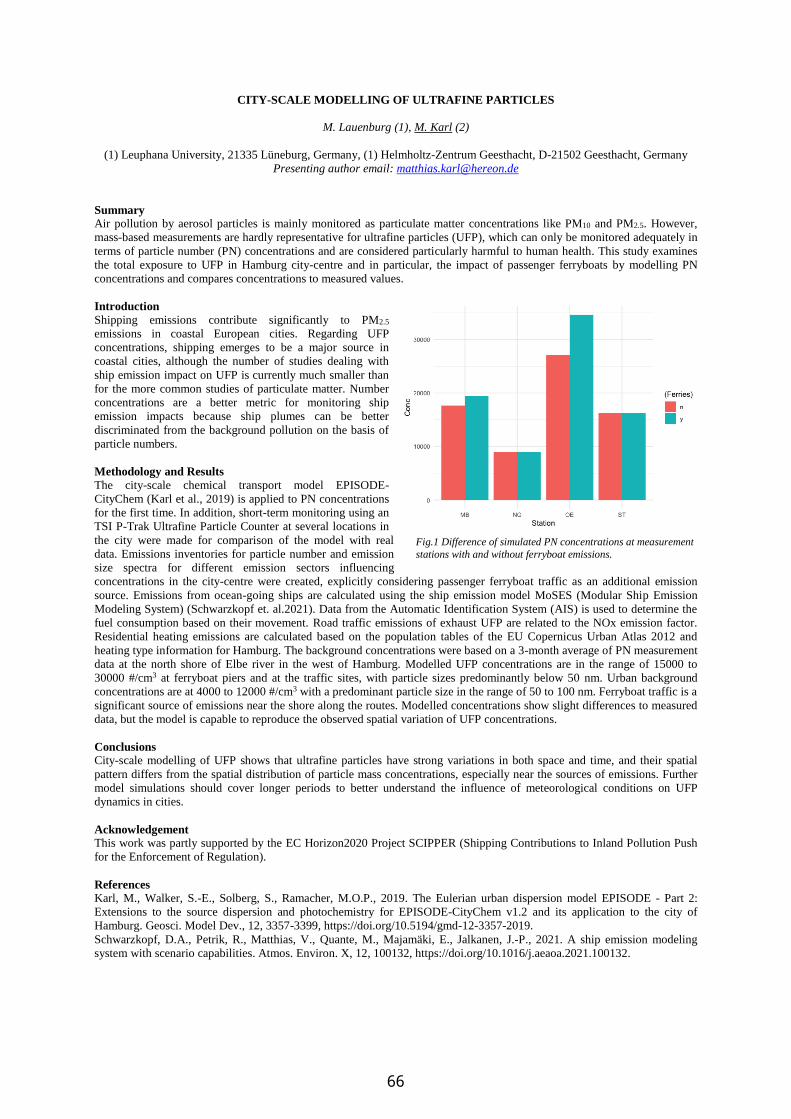
CITY-SCALE MODELLING OF ULTRAFINE PARTICLES
M. Lauenburg (1), M. Karl (2)
(1) Leuphana University, 21335 Lüneburg, Germany, (1) Helmholtz-Zentrum Geesthacht, D-21502 Geesthacht, Germany
Presenting author email: [email protected]
Summary
Air pollution by aerosol particles is mainly monitored as particulate matter concentrations like PM10 and PM2.5. However,
mass-based measurements are hardly representative for ultrafine particles (UFP), which can only be monitored adequately in
terms of particle number (PN) concentrations and are considered particularly harmful to human health. This study examines
the total exposure to UFP in Hamburg city-centre and in particular, the impact of passenger ferryboats by modelling PN
concentrations and compares concentrations to measured values.
Introduction
Shipping emissions contribute significantly to PM2.5
emissions in coastal European cities. Regarding UFP
concentrations, shipping emerges to be a major source in
coastal cities, although the number of studies dealing with
ship emission impact on UFP is currently much smaller than
for the more common studies of particulate matter. Number
concentrations are a better metric for monitoring ship
emission impacts because ship plumes can be better
discriminated from the background pollution on the basis of
particle numbers.
Methodology and Results
The city-scale chemical transport model EPISODE-
CityChem (Karl et al., 2019) is applied to PN concentrations
for the first time. In addition, short-term monitoring using an
TSI P-Trak Ultrafine Particle Counter at several locations in
the city were made for comparison of the model with real
data. Emissions inventories for particle number and emission
size spectra for different emission sectors influencing
concentrations in the city-centre were created, explicitly considering passenger ferryboat traffic as an additional emission
source. Emissions from ocean-going ships are calculated using the ship emission model MoSES (Modular Ship Emission
Modeling System) (Schwarzkopf et. al.2021). Data from the Automatic Identification System (AIS) is used to determine the
fuel consumption based on their movement. Road traffic emissions of exhaust UFP are related to the NOx emission factor.
Residential heating emissions are calculated based on the population tables of the EU Copernicus Urban Atlas 2012 and
heating type information for Hamburg. The background concentrations were based on a 3-month average of PN measurement
data at the north shore of Elbe river in the west of Hamburg. Modelled UFP concentrations are in the range of 15000 to
30000 #/cm3 at ferryboat piers and at the traffic sites, with particle sizes predominantly below 50 nm. Urban background
concentrations are at 4000 to 12000 #/cm3 with a predominant particle size in the range of 50 to 100 nm. Ferryboat traffic is a
significant source of emissions near the shore along the routes. Modelled concentrations show slight differences to measured
data, but the model is capable to reproduce the observed spatial variation of UFP concentrations.
Conclusions
City-scale modelling of UFP shows that ultrafine particles have strong variations in both space and time, and their spatial
pattern differs from the spatial distribution of particle mass concentrations, especially near the sources of emissions. Further
model simulations should cover longer periods to better understand the influence of meteorological conditions on UFP
dynamics in cities.
Acknowledgement
This work was partly supported by the EC Horizon2020 Project SCIPPER (Shipping Contributions to Inland Pollution Push
for the Enforcement of Regulation).
References
Karl, M., Walker, S.-E., Solberg, S., Ramacher, M.O.P., 2019. The Eulerian urban dispersion model EPISODE - Part 2:
Extensions to the source dispersion and photochemistry for EPISODE-CityChem v1.2 and its application to the city of
Hamburg. Geosci. Model Dev., 12, 3357-3399, https://doi.org/10.5194/gmd-12-3357-2019.
Schwarzkopf, D.A., Petrik, R., Matthias, V., Quante, M., Majamäki, E., Jalkanen, J.-P., 2021. A ship emission modeling
system with scenario capabilities. Atmos. Environ. X, 12, 100132, https://doi.org/10.1016/j.aeaoa.2021.100132.
Fig.1 Difference of simulated PN concentrations at measurement
stations with and without ferryboat emissions.
66

DATA FUSION FOR THE IMPROVEMENT OF THE SPATIAL RESOLUTION OF AIR QUALITY MODELING
T. Kassandros (1), E. Bagkis (1), K. Karatzas (1)
(1) Environmental Informatics Research Group, School of Mechanical Engineering, Aristotle University, 54124
Thessaloniki, Greece
Presenting author email: [email protected]
Summary
We investigate the spatial resolution improvement of air quality modelling via a data fusion approach, for the Greater
Thessaloniki Area (GTA). We focus on PM10 and employ monitoring data from a Low-Cost Air Quality Sensor Node
(LCAQSN) network installed in the GTA in the frame of the KASTOM project. The LCAQSN are calibrated on field and have
therefore been proven able to be used as indicative measurements for regulatory purposes, following the Data Quality Objective
(DQO) of the Guide to the Demonstration of Equivalence of Ambient Air Monitoring Methods. Other data sources include
three-dimensional AQ and meteorological models, traffic congestion index and Land Use (LU) data. Using spatial interpolation
techniques, such as Universal Kriging (UK) we are able to increase the spatial resolution to 50m2 under near real time
operational conditions. The LCAQSN network proved to be essential for the effectiveness of data fusion while traffic related
data are necessary for better spatial variability of the model.
Introduction
The GTA is experiencing poor AQ, especially in terms of PM10 (frequently exceeding the European AQ guidelines), monitored
with the aid of a small number of reference AQ monitoring stations. The KASTOM project is developing a versatile and flexible
urban air quality monitoring and forecasting system by deploying an IoT-oriented network of LCAQSN, while in parallel
developing a state-of-the-art AQ modelling system based on an innovative emission modelling module (anthropogenic and
natural emissions-NEMO (Liora et al. 2016)), a three-dimensional photochemical model (CAMx) and a meteorological model
(WRF). Recent studies indicate that Machine Learning (ML) may significantly improve the performance of air quality sensor
nodes reducing the impact of cross-sensitivity issues as well as measurement uncertainty, thus allowing for improved data
fusion approaches (Gressent et al., 2020) to support citizens and local authorities with detailed information about air pollution.
Methodology and Results
The KASTOM project has installed 33 LQAQSN in the GTA. As
a first step, we used a new computational procedure to calibrate the
network, using ML models trained in three reference stations.
Results showed improved PM10 measurements (Relative
Expanded Uncertainty below 50 μg/m3). The following data
required for the fusion procedure are gathered and processed
operationally in a mongoDB database: i) Calibrated Node
monitoring data, ii) CAMx estimation (2km2), iii) WRF
estimation (250m2), iv) Traffic data available online from the
Hellenic Institute of Transport (Street Network) v) LU data
derived from Copernicus (250m2). The empirical variogram is then
calculated and fitted to a Gaussian model. A Universal Kriging with
external drifts from various combinations of data sources is then
applied with a grid of 50m2 (see Fig.1). Results show a good
performance against the reference stations while the addition of
traffic data is increasing the spatial variability.
Conclusions
AQ data fusion based on LQAQSN network, AQ modelling traffic and LU data is feasible under operational near real time
conditions and leads to improved spatial representation of air pollution. Results require further evaluation for longer time
periods under operational conditions. Additional data sources such as building height and stock, population, normalized
vegetation index, position and species of trees may be considered to better represent the city as a digital twin and pave the way
towards improved urban environment modelling for better quality of life.
Acknowledgement
This research has been co‐financed by the European Union and Greek national funds through the Operational Program
Competitiveness, Entrepreneurship and Innovation, under the call RESEARCH – CREATE – INNOVATE. Project code
Τ1ΕDΚ-01697; project name Innovative system for air quality monitoring and forecasting (KASTOM, www.air4me.eu).
References
Gressent A., Malherbe L., Colette A., Rollin H., Scimia R., 2020. Data fusion for air quality mapping using low-cost sensor
observations: Feasibility and added-value. Environment International 143, https://doi.org/10.1016/j.envint.2020.105965
Liora N., Poupkou A., Giannaros T.M., Kakosimos K.E., Stein O., Melas D., 2016. Impacts of natural emission sources on
particle pollution levels in Europe. Atmospheric Environment 137, 171-185.
Fig.1 PM10 spatial variability snapshot after data fusion.
Fig.1 PM10 spatial variability snapshot after data fusion.
67
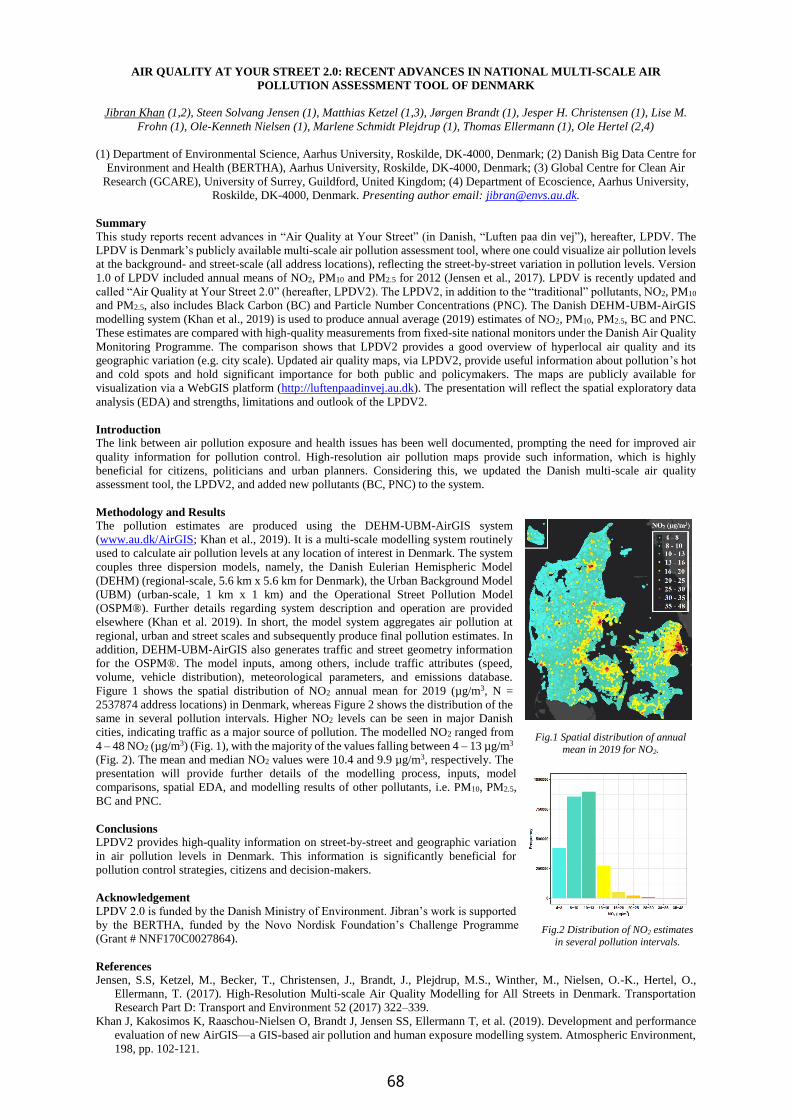
AIR QUALITY AT YOUR STREET 2.0: RECENT ADVANCES IN NATIONAL MULTI-SCALE AIR
POLLUTION ASSESSMENT TOOL OF DENMARK
Jibran Khan (1,2), Steen Solvang Jensen (1), Matthias Ketzel (1,3), Jørgen Brandt (1), Jesper H. Christensen (1), Lise M.
Frohn (1), Ole-Kenneth Nielsen (1), Marlene Schmidt Plejdrup (1), Thomas Ellermann (1), Ole Hertel (2,4)
(1) Department of Environmental Science, Aarhus University, Roskilde, DK-4000, Denmark; (2) Danish Big Data Centre for
Environment and Health (BERTHA), Aarhus University, Roskilde, DK-4000, Denmark; (3) Global Centre for Clean Air
Research (GCARE), University of Surrey, Guildford, United Kingdom; (4) Department of Ecoscience, Aarhus University,
Roskilde, DK-4000, Denmark. Presenting author email: [email protected].
Summary
This study reports recent advances in “Air Quality at Your Street” (in Danish, “Luften paa din vej”), hereafter, LPDV. The
LPDV is Denmark’s publicly available multi-scale air pollution assessment tool, where one could visualize air pollution levels
at the background- and street-scale (all address locations), reflecting the street-by-street variation in pollution levels. Version
1.0 of LPDV included annual means of NO2, PM10 and PM2.5 for 2012 (Jensen et al., 2017). LPDV is recently updated and
called “Air Quality at Your Street 2.0” (hereafter, LPDV2). The LPDV2, in addition to the “traditional” pollutants, NO2, PM10
and PM2.5, also includes Black Carbon (BC) and Particle Number Concentrations (PNC). The Danish DEHM-UBM-AirGIS
modelling system (Khan et al., 2019) is used to produce annual average (2019) estimates of NO2, PM10, PM2.5, BC and PNC.
These estimates are compared with high-quality measurements from fixed-site national monitors under the Danish Air Quality
Monitoring Programme. The comparison shows that LPDV2 provides a good overview of hyperlocal air quality and its
geographic variation (e.g. city scale). Updated air quality maps, via LPDV2, provide useful information about pollution’s hot
and cold spots and hold significant importance for both public and policymakers. The maps are publicly available for
visualization via a WebGIS platform (http://luftenpaadinvej.au.dk). The presentation will reflect the spatial exploratory data
analysis (EDA) and strengths, limitations and outlook of the LPDV2.
Introduction
The link between air pollution exposure and health issues has been well documented, prompting the need for improved air
quality information for pollution control. High-resolution air pollution maps provide such information, which is highly
beneficial for citizens, politicians and urban planners. Considering this, we updated the Danish multi-scale air quality
assessment tool, the LPDV2, and added new pollutants (BC, PNC) to the system.
Methodology and Results
The pollution estimates are produced using the DEHM-UBM-AirGIS system
(www.au.dk/AirGIS; Khan et al., 2019). It is a multi-scale modelling system routinely
used to calculate air pollution levels at any location of interest in Denmark. The system
couples three dispersion models, namely, the Danish Eulerian Hemispheric Model
(DEHM) (regional-scale, 5.6 km x 5.6 km for Denmark), the Urban Background Model
(UBM) (urban-scale, 1 km x 1 km) and the Operational Street Pollution Model
(OSPM®). Further details regarding system description and operation are provided
elsewhere (Khan et al. 2019). In short, the model system aggregates air pollution at
regional, urban and street scales and subsequently produce final pollution estimates. In
addition, DEHM-UBM-AirGIS also generates traffic and street geometry information
for the OSPM®. The model inputs, among others, include traffic attributes (speed,
volume, vehicle distribution), meteorological parameters, and emissions database.
Figure 1 shows the spatial distribution of NO2 annual mean for 2019 (µg/m3, N =
2537874 address locations) in Denmark, whereas Figure 2 shows the distribution of the
same in several pollution intervals. Higher NO2 levels can be seen in major Danish
cities, indicating traffic as a major source of pollution. The modelled NO2 ranged from
4 – 48 NO2 (µg/m3) (Fig. 1), with the majority of the values falling between 4 – 13 µg/m3
(Fig. 2). The mean and median NO2 values were 10.4 and 9.9 µg/m3, respectively. The
presentation will provide further details of the modelling process, inputs, model
comparisons, spatial EDA, and modelling results of other pollutants, i.e. PM10, PM2.5,
BC and PNC.
Conclusions
LPDV2 provides high-quality information on street-by-street and geographic variation
in air pollution levels in Denmark. This information is significantly beneficial for
pollution control strategies, citizens and decision-makers.
Acknowledgement
LPDV 2.0 is funded by the Danish Ministry of Environment. Jibran’s work is supported
by the BERTHA, funded by the Novo Nordisk Foundation’s Challenge Programme
(Grant # NNF170C0027864).
References
Jensen, S.S, Ketzel, M., Becker, T., Christensen, J., Brandt, J., Plejdrup, M.S., Winther, M., Nielsen, O.-K., Hertel, O.,
Ellermann, T. (2017). High-Resolution Multi-scale Air Quality Modelling for All Streets in Denmark. Transportation
Research Part D: Transport and Environment 52 (2017) 322–339. Khan J, Kakosimos K, Raaschou-Nielsen O, Brandt J, Jensen SS, Ellermann T, et al. (2019). Development and performance
evaluation of new AirGIS—a GIS-based air pollution and human exposure modelling system. Atmospheric Environment,
198, pp. 102-121.
Fig.1 Spatial distribution of annual
mean in 2019 for NO2.
Fig.2 Distribution of NO2 estimates
in several pollution intervals.
68
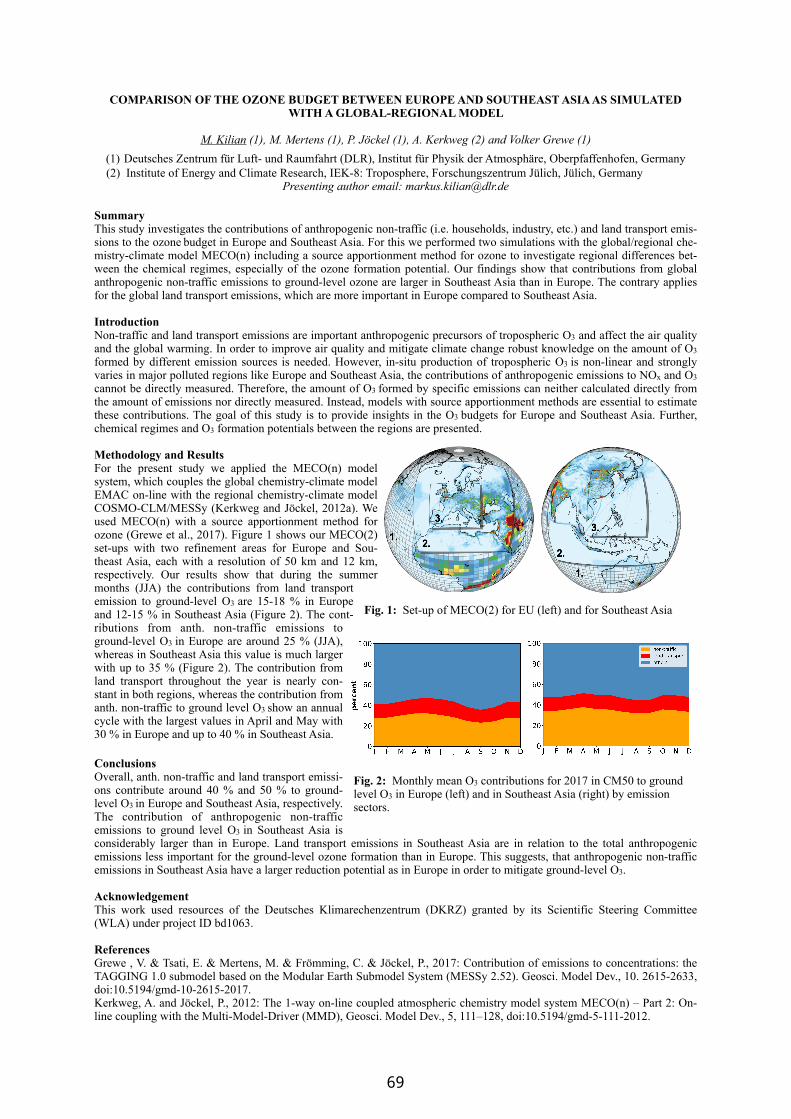
COMPARISON OF THE OZONE BUDGET BETWEEN EUROPE AND SOUTHEAST ASIA AS SIMULATED WITH A GLOBAL-REGIONAL MODEL
M. Kilian (1), M. Mertens (1), P. Jöckel (1), A. Kerkweg (2) and Volker Grewe (1) (1) Deutsches Zentrum für Luft- und Raumfahrt (DLR), Institut für Physik der Atmosphäre, Oberpfaffenhofen, Germany
(2) Institute of Energy and Climate Research, IEK-8: Troposphere, Forschungszentrum Jülich, Jülich, Germany Presenting author email: [email protected]
Summary This study investigates the contributions of anthropogenic non-traffic (i.e. households, industry, etc.) and land transport emis-sions to the ozone budget in Europe and Southeast Asia. For this we performed two simulations with the global/regional che-mistry-climate model MECO(n) including a source apportionment method for ozone to investigate regional differences bet-ween the chemical regimes, especially of the ozone formation potential. Our findings show that contributions from global anthropogenic non-traffic emissions to ground-level ozone are larger in Southeast Asia than in Europe. The contrary applies for the global land transport emissions, which are more important in Europe compared to Southeast Asia.
Introduction Non-traffic and land transport emissions are important anthropogenic precursors of tropospheric O3 and affect the air quality and the global warming. In order to improve air quality and mitigate climate change robust knowledge on the amount of O3 formed by different emission sources is needed. However, in-situ production of tropospheric O3 is non-linear and strongly varies in major polluted regions like Europe and Southeast Asia, the contributions of anthropogenic emissions to NOx and O3 cannot be directly measured. Therefore, the amount of O3 formed by specific emissions can neither calculated directly from the amount of emissions nor directly measured. Instead, models with source apportionment methods are essential to estimate these contributions. The goal of this study is to provide insights in the O3 budgets for Europe and Southeast Asia. Further, chemical regimes and O3 formation potentials between the regions are presented.
Methodology and Results For the present study we applied the MECO(n) model system, which couples the global chemistry-climate model EMAC on-line with the regional chemistry-climate model COSMO-CLM/MESSy (Kerkweg and Jöckel, 2012a). We used MECO(n) with a source apportionment method for ozone (Grewe et al., 2017). Figure 1 shows our MECO(2) set-ups with two refinement areas for Europe and Sou-theast Asia, each with a resolution of 50 km and 12 km, respectively. Our results show that during the summer months (JJA) the contributions from land transport emission to ground-level O3 are 15-18 % in Europe and 12-15 % in Southeast Asia (Figure 2). The cont-ributions from anth. non-traffic emissions to ground-level O3 in Europe are around 25 % (JJA), whereas in Southeast Asia this value is much larger with up to 35 % (Figure 2). The contribution from land transport throughout the year is nearly con-stant in both regions, whereas the contribution from anth. non-traffic to ground level O3 show an annual cycle with the largest values in April and May with 30 % in Europe and up to 40 % in Southeast Asia.
Conclusions Overall, anth. non-traffic and land transport emissi-ons contribute around 40 % and 50 % to ground-level O3 in Europe and Southeast Asia, respectively. The contribution of anthropogenic non-traffic emissions to ground level O3 in Southeast Asia is considerably larger than in Europe. Land transport emissions in Southeast Asia are in relation to the total anthropogenic emissions less important for the ground-level ozone formation than in Europe. This suggests, that anthropogenic non-traffic emissions in Southeast Asia have a larger reduction potential as in Europe in order to mitigate ground-level O3.
Acknowledgement This work used resources of the Deutsches Klimarechenzentrum (DKRZ) granted by its Scientific Steering Committee (WLA) under project ID bd1063.
References Grewe , V. & Tsati, E. & Mertens, M. & Frömming, C. & Jöckel, P., 2017: Contribution of emissions to concentrations: the TAGGING 1.0 submodel based on the Modular Earth Submodel System (MESSy 2.52). Geosci. Model Dev., 10. 2615-2633, doi:10.5194/gmd-10-2615-2017. Kerkweg, A. and Jöckel, P., 2012: The 1-way on-line coupled atmospheric chemistry model system MECO(n) – Part 2: On-line coupling with the Multi-Model-Driver (MMD), Geosci. Model Dev., 5, 111–128, doi:10.5194/gmd-5-111-2012.
Fig. 1: Set-up of MECO(2) for EU (left) and for Southeast Asia
Fig. 2: Monthly mean O3 contributions for 2017 in CM50 to ground level O3 in Europe (left) and in Southeast Asia (right) by emission sectors.
69

PROVIDING RESOLVED 3D MICROSCALE RADIATIVE FLUX FOR PHOTOLYSIS IN THE PALM MODEL
P. Krč (1) and J. Resler (1)
(1) Institute of Computer Science, The Czech Academy of Sciences, Prague, Czech RepublicPresenting author email: [email protected]
SummaryA novel method for providing resolved microscale radiative fluxes in the urban layer is described. This method isimplemented as part of the Radiative Transfer Model (RTM) within the PALM large-eddy simulation model. The RTMsimulates explicit radiative interactions within the urban canopy layer and/or complex terrain with respect to full-3D surfacegeometry and resolved plant canopy, taking into account multiple reflections, shading, absorption and emission, with nativecoupling to solar radiative forcing, surface energy balance, plant canopy model and other components of PALM. The newlyintroduced method integrated in the RTM calculates the direct and diffuse solar radiation as well as an estimate of thereflected radiation to provide a sphere-integrated short-wave radiative flux at each point of the 3D grid within the urbancanopy, which is used as actinic flux for the photolysis model.
IntroductionThe RTM model integrated in the PALM model system simulates explicit 3D radiative interactions within the urban canopyand/or complex terrain. It uses a ray-tracing algorithm to calculate view factors and other static information about mutualvisibility in advance as part of the preprocessing step, which allows the time-stepping part of the model to run efficiently.However, this static information allows to calculate radiative fluxes only at surface elements and within resolved plantcanopy. In order to provide actinic flux at each point of the 3D grid, additional static information about shading from directsolar radiation as well as the sky-view factor had to be included for each grid cell. This information had to be calculated andstored in such a way that it would neither hurt the scalability of the model, nor increase the memory demands significantly.
The implemented method and its aspectsIn the RTM prior to version 4.0, the geometry of terrain, buildings and other obstacles was considered as a 2.5D geometry,which means that for each horizontal location in the grid, there was a single height value (discretized according to verticalgrid structure), below which everything was considered as an opaque obstacle (i.e. terrain or building) and above which therewas only free air with possible inclusion of resolved plant canopy. This structure was sufficient for the representation of amajority of both natural and urban objects within the intended grid resolution of units of metres or tens of metres, with thefew exceptions of overhanging structures, bridges etc.The 2.5D simplification carried significant computational advantages, as for each observer and each direction there was asingle horizon height and the sky view was always continuous from zenith to horizon (with the exception of semi-transparentplant canopy). RTM version 4.0 introduced the support for full-3D geometry, but in order to maintain efficiency, itsimplementation took the advantage of the expectation that the vast majority of the simulated domain may could be describedwith the 2.5D geometry.Should the actinic flux for photolysis be computed with respect to the full-3D geometry (with the information about shadingand visibility computed in advance), the amount of information stored for each grid cell would grow above acceptable limits.It was therefore decided that for the purpose of calculating the actinic flux, only the 2.5D geometry would be considered andthat the plant canopy would be simplified as either fully transparent or fully opaque and included in the 2.5D representation.Instead of the full ray-tracing algorithm, the actinic flux calculation uses a simplified horizon-tracing algorithm for thepreprocessing. It calculates the shadow height for each column and each discretized solar position, which provides theinformation about the direct solar radiative flux. In addition to that, it calculates the sphere-integrated sky-view factor foreach grid cell. This factor is used to include the diffuse solar radiation, and its complement to one (i.e. the ground or obstacleview factor) is used to include the approximate reflected radiation. In order to minimize memory demands, this radiationcomponent is estimated from the average reflected radiation towards the sky.The newly available actinic flux is currently being coupled to the chemistry model in PALM for the calculation of photolysis.A sensitivity study evaluating the benefits of the inclusion of explicit resolved radiation for photolysis is being prepared.
ConclusionsThe implemented method provides a fully resolved sphere-integrated short-wave radiative flux at each point of the 3D gridcell within the urban canopy layer. The points above the urban canopy layer are by definition free from obstacles, so for themthis flux may be provided trivially as homogeneous. This allows the calculation of photolysis to include not only the explicitshading of the direct solar radiation, but also the diffuse radiation and approximate reflected radiation. With this newlyavailable microscale information, it is possible to calculate the photolysis in greater detail and to evaluate the improvement ofits precision.
AcknowledgementThis work was supported by the Norway Grants and Technology Agency of the Czech Republic project TO01000219:“Turbulent-resolving urban modeling of air quality and thermal comfort”.
ReferencesKrč, P., Resler, J., Sühring, M., Schubert, S., Salim, M. H., and Fuka, V., 2021. Radiative Transfer Model 3.0 integrated intothe PALM model system 6.0. Geosci. Model Dev., 14, 3095–3120, https://doi.org/10.5194/gmd-14-3095-2021.
70

PARTICLE NUMBER EMISSIONS FROM SHIPPING - EFFECTS OF CLEANER FUELS AND SCRUBBERS
N. Kuittinen (1), J.-P. Jalkanen (2), J. Alanen (1), L. Ntziachristos (1), P. Karjalainen (1), P. Aakko-Saksa (3), K. Lehtoranta
(3), E. Asmi (2), H. Lihavainen (2,4), H. Timonen (2), T. Rönkkö (1)
(1) Aerosol Physics Laboratory, Physics Unit,Tampere University, Tampere, Finland; (2) Atmospheric Composition
Research, Finnish Meteorological Institute, Helsinki, Finland; (3) VTT Technical Research Centre of Finland, Espoo,
Finland; (4) Svalbard Integrated Arctic Earth Observing System, Longyearbyen, Norway
Presenting author email: [email protected]
Summary
In this study, fuel-specific particle number (PN) emissions were determined by laboratory and on-board measurements of
ship engine exhaust, for different fuels and desulfurization applied in shipping. The emission factors were compared to ship
exhaust plume observations and, furthermore, exploited in the assessment of global PN emissions from shipping, utilizing
STEAM ship emission model. (Kuittinen et al. 2021). In addition, the effects of scrubber on PN emission were investigated
in detail (Kuittinen et al. manuscript in prep.).
Introduction
Ship exhausts are a major source of particles over open seas and coastlines, and the emitted particles both have climatic
effects and contribute to impaired air-quality. To accurately estimate the climate-forcing impacts as well as health effects
related to ultrafine particles (UFPs), PN and size distribution (PSD) of the emitted aerosols are important, further to total
particle mass. Since 2020, ships have been required to burn fuels with <0.5% sulphur or apply scrubbers for SO2 abatement.
Methodology and Results
Measurements were conducted in laboratory on 1.6MW
marine engine with 6 different marine fuels with varying
properties under maneuvering and cruising load conditions, as
well as on-board a cruise ship, before and after scrubber, from
the exhaust lines of two main engines (ME1 and ME2,
applying SCR). Identical sampling setup was applied in all
campaigns, consisting of a porous tube diluter together with
residence time chamber and ejector diluter, simulating
atmospheric dilution conditions (Keskinen and Rönkkö, 2010).
PN and PSDs were studied by scanning mobility particle sizer
and condensation particle counters (CPC). To study the effect
of scrubber on non-volatile particles, a catalytic stripper was
applied. The obtained PN emission factors were compared to
plume observations conducted on the Finnish coastline by
chasing ships by aircraft. STEAM model was applied to assess
the globally distributed PN emissions from international
shipping and to estimate the influence of the 2020 sulfur
regulation. The PN emission factors for different fuels varied
between 1.38-5.83×10¹⁶ kgfuel-1. The scrubber effectively reduced PN in the nucleation mode size range. The global PN
emissions from shipping are localized close to coastal lines and busy port areas, but significant emissions exist also on open
seas and oceans. The global annual PN produced by marine shipping was 1.2×1028 (±0.34×1028) in 2016, which is of same
magnitude with total anthropogenic PN emissions in continental areas (Paasonen et al. 2016).
Conclusions
The study indicates that the potential to reduce PN emissions from shipping depends strongly on the adopted technology mix.
Freshly emitted PN can be reduced by adoption of natural gas and scrubbers, but no significant decrease is expected if heavy
fuel oil is mainly replaced by low sulphur residual fuels.
Acknowledgements
This study was financially supported by the Finnish Funding Agency for Technology and Innovation (projects HERE, grant
no. 40330/13; SEA-EFFECTS BC, grant no. 40357/14; and MMEA, CLEEN Oy grant no. 427/10), the European Regional
Development Fund/Central Baltic INTERREG IV A Programme (project SNOOP), and the Academy of Finland (Center of
Excellence programme, grant no. 307331, KAMON, grant no. 283034, and Flagship funding grant no. 337552).
References
Keskinen, J., Rönkkö, T., 2010. Can real-world diesel exhaust particle size distribution be reproduced in the laboratory? A
critical review. J. Air Waste Manag. Assoc. 60, 1245–1255.
Paasonen, P., Kupiainen, K., Klimont, Z., Visshedijk, A., Denier van der Gon, H.A.C., Amann, M., 2016. Continental
anthropogenic primary particle number emissions. Atmos. Chem. Phys. Discuss. 1–39.
Kuittinen, N., Jalkanen, J.P., Alanen, J., Ntziachristos, L., Hannuniemi, H., Johansson, L., Karjalainen, P., Saukko, E.,
Isotalo, M., Aakko-Saksa, P., Lehtoranta, K., Keskinen, J., Simonen, P., Saarikoski, S., Asmi, E., Laurila, T.,
Hillamo, R., Mylläri, F., Lihavainen, H., Timonen, H., Rönkkö, T., 2021. Shipping Remains a Globally Significant
Source of Anthropogenic PN Emissions even after 2020 Sulfur Regulation. Environ. Sci. Technol. 55, 129–138.
Figure 1. Global distribution of PN emission from marine traffic in 2016. Kuittinen et al. (2021). DOI:
10.1021/acs.est.0c03627. Reprinted with permission from
Environmental Science and Technology. Copyright 2021 American Chemical Society.
71
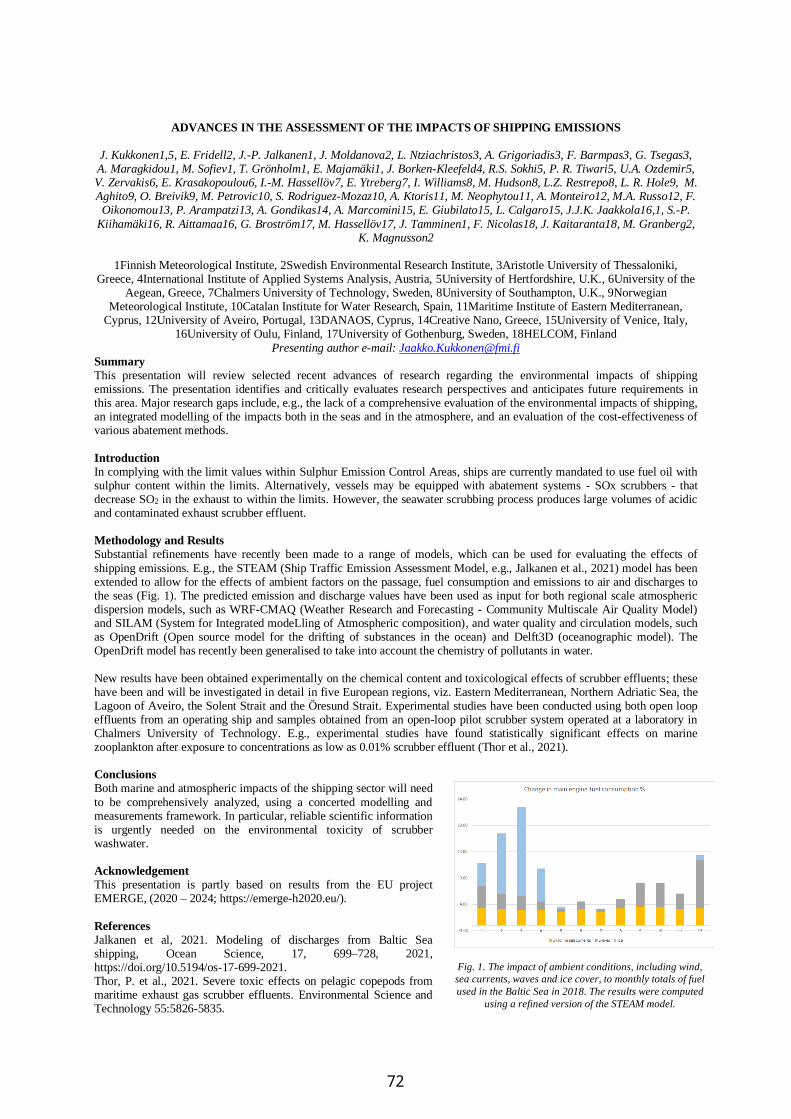
ADVANCES IN THE ASSESSMENT OF THE IMPACTS OF SHIPPING EMISSIONS
J. Kukkonen1,5, E. Fridell2, J.-P. Jalkanen1, J. Moldanova2, L. Ntziachristos3, A. Grigoriadis3, F. Barmpas3, G. Tsegas3, A. Maragkidou1, M. Sofiev1, T. Grönholm1, E. Majamäki1, J. Borken-Kleefeld4, R.S. Sokhi5, P. R. Tiwari5, U.A. Ozdemir5, V. Zervakis6, E. Krasakopoulou6, I.-M. Hassellöv7, E. Ytreberg7, I. Williams8, M. Hudson8, L.Z. Restrepo8, L. R. Hole9, M. Aghito9, O. Breivik9, M. Petrovic10, S. Rodriguez-Mozaz10, A. Ktoris11, M. Neophytou11, A. Monteiro12, M.A. Russo12, F. Oikonomou13, P. Arampatzi13, A. Gondikas14, A. Marcomini15, E. Giubilato15, L. Calgaro15, J.J.K. Jaakkola16,1, S.-P.
Kiihamäki16, R. Aittamaa16, G. Broström17, M. Hassellöv17, J. Tamminen1, F. Nicolas18, J. Kaitaranta18, M. Granberg2, K. Magnusson2
1Finnish Meteorological Institute, 2Swedish Environmental Research Institute, 3Aristotle University of Thessaloniki,
Greece, 4International Institute of Applied Systems Analysis, Austria, 5University of Hertfordshire, U.K., 6University of the Aegean, Greece, 7Chalmers University of Technology, Sweden, 8University of Southampton, U.K., 9Norwegian
Meteorological Institute, 10Catalan Institute for Water Research, Spain, 11Maritime Institute of Eastern Mediterranean, Cyprus, 12University of Aveiro, Portugal, 13DANAOS, Cyprus, 14Creative Nano, Greece, 15University of Venice, Italy,
16University of Oulu, Finland, 17University of Gothenburg, Sweden, 18HELCOM, Finland
Presenting author e-mail: [email protected] Summary
This presentation will review selected recent advances of research regarding the environmental impacts of shipping emissions. The presentation identifies and critically evaluates research perspectives and anticipates future requirements in this area. Major research gaps include, e.g., the lack of a comprehensive evaluation of the environmental impacts of shipping, an integrated modelling of the impacts both in the seas and in the atmosphere, and an evaluation of the cost-effectiveness of various abatement methods.
Introduction
In complying with the limit values within Sulphur Emission Control Areas, ships are currently mandated to use fuel oil with sulphur content within the limits. Alternatively, vessels may be equipped with abatement systems - SOx scrubbers - that decrease SO2 in the exhaust to within the limits. However, the seawater scrubbing process produces large volumes of acidic and contaminated exhaust scrubber effluent. Methodology and Results
Substantial refinements have recently been made to a range of models, which can be used for evaluating the effects of
shipping emissions. E.g., the STEAM (Ship Traffic Emission Assessment Model, e.g., Jalkanen et al., 2021) model has been extended to allow for the effects of ambient factors on the passage, fuel consumption and emissions to air and discharges to the seas (Fig. 1). The predicted emission and discharge values have been used as input for both regional scale atmospheric dispersion models, such as WRF-CMAQ (Weather Research and Forecasting - Community Multiscale Air Quality Model) and SILAM (System for Integrated modeLling of Atmospheric composition), and water quality and circulation models, such as OpenDrift (Open source model for the drifting of substances in the ocean) and Delft3D (oceanographic model). The OpenDrift model has recently been generalised to take into account the chemistry of pollutants in water.
New results have been obtained experimentally on the chemical content and toxicological effects of scrubber effluents; these have been and will be investigated in detail in five European regions, viz. Eastern Mediterranean, Northern Adriatic Sea, the Lagoon of Aveiro, the Solent Strait and the Öresund Strait. Experimental studies have been conducted using both open loop effluents from an operating ship and samples obtained from an open-loop pilot scrubber system operated at a laboratory in Chalmers University of Technology. E.g., experimental studies have found statistically significant effects on marine zooplankton after exposure to concentrations as low as 0.01% scrubber effluent (Thor et al., 2021). Conclusions
Both marine and atmospheric impacts of the shipping sector will need
to be comprehensively analyzed, using a concerted modelling and measurements framework. In particular, reliable scientific information is urgently needed on the environmental toxicity of scrubber washwater. Acknowledgement
This presentation is partly based on results from the EU project EMERGE, (2020 – 2024; https://emerge-h2020.eu/).
References
Jalkanen et al, 2021. Modeling of discharges from Baltic Sea shipping, Ocean Science, 17, 699–728, 2021, https://doi.org/10.5194/os-17-699-2021. Thor, P. et al., 2021. Severe toxic effects on pelagic copepods from maritime exhaust gas scrubber effluents. Environmental Science and Technology 55:5826-5835.
Fig. 1. The impact of ambient conditions, including wind,
sea currents, waves and ice cover, to monthly totals of fuel
used in the Baltic Sea in 2018. The results were computed
using a refined version of the STEAM model.
72
A COMPOSITIONAL KERNEL LEARNING BASED GAUSSIAN PROCESS MODEL FOR URBAN AIR
POLLUTANTS PREDICTION USING UNCERTAIN AND HETEROGENEOUS DATASETS
C. Li(1), M. Hefenbrock(2), P. Tremper(1), T. Riedel(1) and M. Beigl(1)
(1) Institute for Telematics, TECO, KIT, Karlsruhe, Germany; (2) RevoAI, Karlsruhe, Germany
Presenting author email: [email protected]
Summary
In this study, we aim to propose a Gaussian Process model based on improving the existing Neural Kernel Network method
(Sun et al., 2018) for urban air pollutants prediction using uncertain and heterogeneous datasets. We will evaluate our model
on realistic urban air quality dataset from the SmartAQnet project (Budde et al., 2017) and compare the performance with other
statistical models.
Introduction
Machine learning (ML) technology has been widely used in various fields thanks to its rapid development in recent years. In
the field of urban air quality modeling, we also noticed that statistical modeling based on ML algorithms is receiving more and
more attention. ML algorithms generally require large-scale datasets for better capturing the underlying relationship between
features and predictions. However, when deploying the measurement network, a trade-off must be made between the network
size and the cost of a single sensor due to budget constraints. A common practice in recent years is to build a measurement
network that includes a small number of high-precision measurement stations and a large number of low-cost sensors (Grothe
et al., 2016), (Budde et al., 2017). This results in large-scale urban air quality datasets often characterized by high input
uncertainty and heterogeneity. However, the current popular Neural Network (NN) models are better at handling precise
homogeneous data.
Gaussian Process (GP) is a classic nonparametric machine learning algorithm often used for regression tasks. Compared with
the NN models, the GP models have an advantage in dealing with the uncertainty in the input and predictions, and they are also
more explainable. At the same time, the continuous development of GP in recent years has freed it from the disadvantage that
it is difficult to apply to large-scale datasets. The introduction of various kernel learning methods also further reduces the
requirement of researchers' personal experience when selecting appropriate kernels for a GP model. The above research
progress paved the way for using GP models for urban air quality modeling.
Methodology
Based on Gaussian Process Regression, we improve the existing Neural Kernel Network (NKN) method to make it more
suitable for urban air pollutant prediction tasks based on uncertain and heterogeneous datasets. Unlike NKN, which uses
commonly used basic kernels (RBF, PER, LIN, and RQ) for fully connected combination, we divide the features in the dataset
into several groups to contribute more targeted kernels and use the structure of NKN to learn their combination structure. In
addition, we will optimize our method using existing Scalable GP techniques to ensure that it has acceptable computational
performance.
We will evaluate our method on realistic datasets from the SmartAQnet project and compare it to other baseline methods such
as Neural Network, Vanilla GP, and some variants of GP such as Deep Kernel Learning and vanilla NKN.
Expectations and Conclusions
Existing research has repeatedly confirmed that even without changing the model we used, the model's performance can be
improved considerably by properly organizing and transforming the input features. It can be achieved either through the feature
engineering step or by designing the structure of the model with prior knowledge. A general problem with commonly used
feature engineering methods is that their processing usually loses the explainability of the data, an effect that is regrettable
when we use explainable models such as GP.
With the above-mentioned approach, we expect to guide the prediction model to capture the underlying relationships in the
dataset more efficiently by incorporating our existing prior knowledge about the features that influence the distribution of urban
air pollutants into the model in a more explicit way. By this, we hope to improve the model's performance and preserve the
explainable properties of the Compositional Kernel Learning GP model.
Acknowledgment
This work is supported by Helmholtz European Partnership for Technological Advancement (HEPTA).
References
Budde M., Riedel T., Beigl M., Schäfer K., Emeis S., Cyrys J., Schnelle -Kreis J., Philipp A., Ziegler V., Grimm H., Gratza T.,
2017. SmartAQnet: Remote and In -Situ Sensing of Urban Air Quality, Proc. SPIE 10424, Remote Sensing of Clouds and the
Atmosphere XXII, 104240C.
Grothe M., Broecke J.V., Carton L.J., Volten H., Kieboom R., 2016. Smart Emission-Building a Spatial Data Infrastructure for
an Environmental Citizen Sensor Network. In Jirka S.; Stasch C.; Hitchcock A.(ed.), Proceedings of the Geospatial Sensor
Webs Conference 2016 (GSW 2016), Münster, Germany, August 29-31, 2016. (pp. 1-7). Münster, Germany: CEUR-WS.
org/Vol-1762.
Sun S., Zhang G., Wang C., Zeng W., Li J., Grosse R., 2018. Differentiable compositional kernel learning for Gaussian
processes. In International Conference on Machine Learning (pp. 4828-4837). PMLR.
73
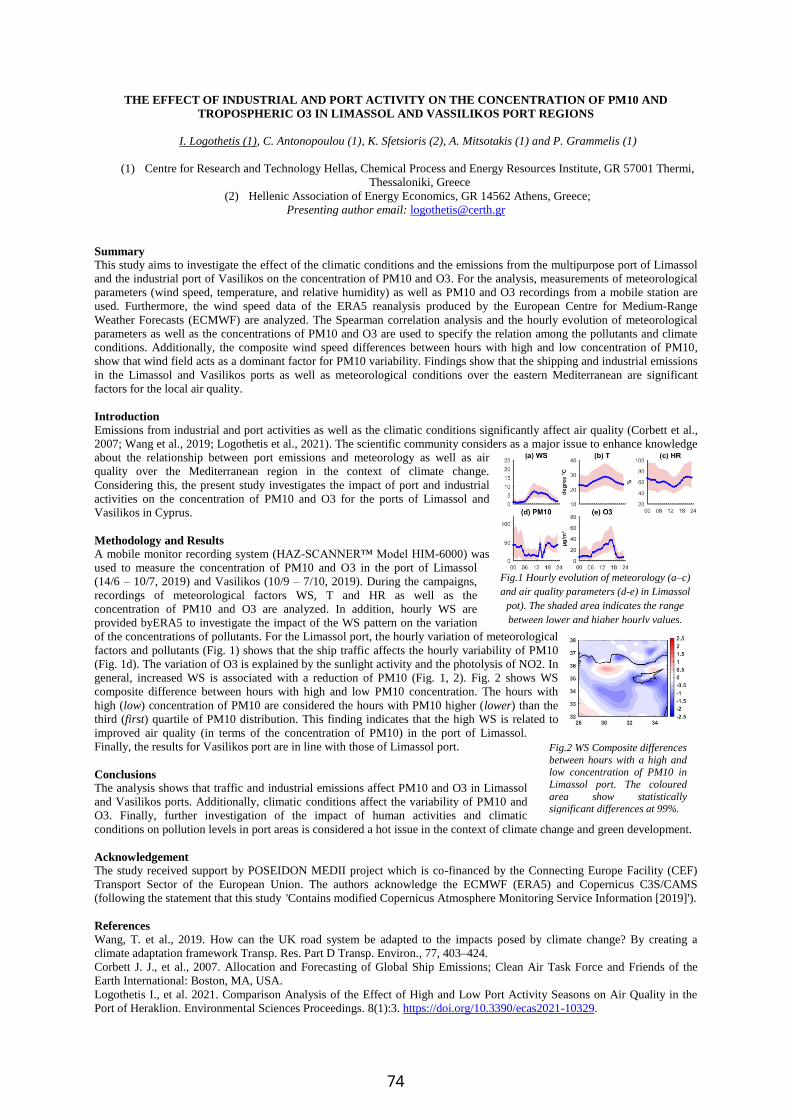
THE EFFECT OF INDUSTRIAL AND PORT ACTIVITY ON THE CONCENTRATION OF PM10 AND
TROPOSPHERIC O3 IN LIMASSOL AND VASSILIKOS PORT REGIONS
I. Logothetis (1), C. Antonopoulou (1), K. Sfetsioris (2), A. Mitsotakis (1) and P. Grammelis (1)
(1) Centre for Research and Technology Hellas, Chemical Process and Energy Resources Institute, GR 57001 Thermi,
Thessaloniki, Greece
(2) Hellenic Association of Energy Economics, GR 14562 Athens, Greece;
Presenting author email: [email protected]
Summary
This study aims to investigate the effect of the climatic conditions and the emissions from the multipurpose port of Limassol
and the industrial port of Vasilikos on the concentration of PM10 and O3. For the analysis, measurements of meteorological
parameters (wind speed, temperature, and relative humidity) as well as PM10 and O3 recordings from a mobile station are
used. Furthermore, the wind speed data of the ERA5 reanalysis produced by the European Centre for Medium-Range
Weather Forecasts (ECMWF) are analyzed. The Spearman correlation analysis and the hourly evolution of meteorological
parameters as well as the concentrations of PM10 and O3 are used to specify the relation among the pollutants and climate
conditions. Additionally, the composite wind speed differences between hours with high and low concentration of PM10,
show that wind field acts as a dominant factor for PM10 variability. Findings show that the shipping and industrial emissions
in the Limassol and Vasilikos ports as well as meteorological conditions over the eastern Mediterranean are significant
factors for the local air quality.
Introduction
Emissions from industrial and port activities as well as the climatic conditions significantly affect air quality (Corbett et al.,
2007; Wang et al., 2019; Logothetis et al., 2021). The scientific community considers as a major issue to enhance knowledge
about the relationship between port emissions and meteorology as well as air
quality over the Mediterranean region in the context of climate change.
Considering this, the present study investigates the impact of port and industrial
activities on the concentration of PM10 and O3 for the ports of Limassol and
Vasilikos in Cyprus.
Methodology and Results
A mobile monitor recording system (HAZ-SCANNER™ Model HIM-6000) was
used to measure the concentration of PM10 and O3 in the port of Limassol
(14/6 – 10/7, 2019) and Vasilikos (10/9 – 7/10, 2019). During the campaigns,
recordings of meteorological factors WS, T and HR as well as the
concentration of PM10 and O3 are analyzed. In addition, hourly WS are
provided byERA5 to investigate the impact of the WS pattern on the variation
of the concentrations of pollutants. For the Limassol port, the hourly variation of meteorological
factors and pollutants (Fig. 1) shows that the ship traffic affects the hourly variability of PM10
(Fig. 1d). The variation of O3 is explained by the sunlight activity and the photolysis of NO2. In
general, increased WS is associated with a reduction of PM10 (Fig. 1, 2). Fig. 2 shows WS
composite difference between hours with high and low PM10 concentration. The hours with
high (low) concentration of PM10 are considered the hours with PM10 higher (lower) than the
third (first) quartile of PM10 distribution. This finding indicates that the high WS is related to
improved air quality (in terms of the concentration of PM10) in the port of Limassol.
Finally, the results for Vasilikos port are in line with those of Limassol port.
Conclusions
The analysis shows that traffic and industrial emissions affect PM10 and O3 in Limassol
and Vasilikos ports. Additionally, climatic conditions affect the variability of PM10 and
O3. Finally, further investigation of the impact of human activities and climatic
conditions on pollution levels in port areas is considered a hot issue in the context of climate change and green development.
Acknowledgement
The study received support by POSEIDON MEDII project which is co-financed by the Connecting Europe Facility (CEF)
Transport Sector of the European Union. The authors acknowledge the ECMWF (ERA5) and Copernicus C3S/CAMS
(following the statement that this study 'Contains modified Copernicus Atmosphere Monitoring Service Information [2019]').
References
Wang, T. et al., 2019. How can the UK road system be adapted to the impacts posed by climate change? By creating a
climate adaptation framework Transp. Res. Part D Transp. Environ., 77, 403–424.
Corbett J. J., et al., 2007. Allocation and Forecasting of Global Ship Emissions; Clean Air Task Force and Friends of the
Earth International: Boston, MA, USA.
Logothetis I., et al. 2021. Comparison Analysis of the Effect of High and Low Port Activity Seasons on Air Quality in the
Port of Heraklion. Environmental Sciences Proceedings. 8(1):3. https://doi.org/10.3390/ecas2021-10329.
Fig.1 Hourly evolution of meteorology (a–c)
and air quality parameters (d-e) in Limassol
pot). The shaded area indicates the range
between lower and higher hourly values.
Fig.2 WS Composite differences
between hours with a high and low concentration of PM10 in
Limassol port. The coloured
area show statistically significant differences at 99%.
74
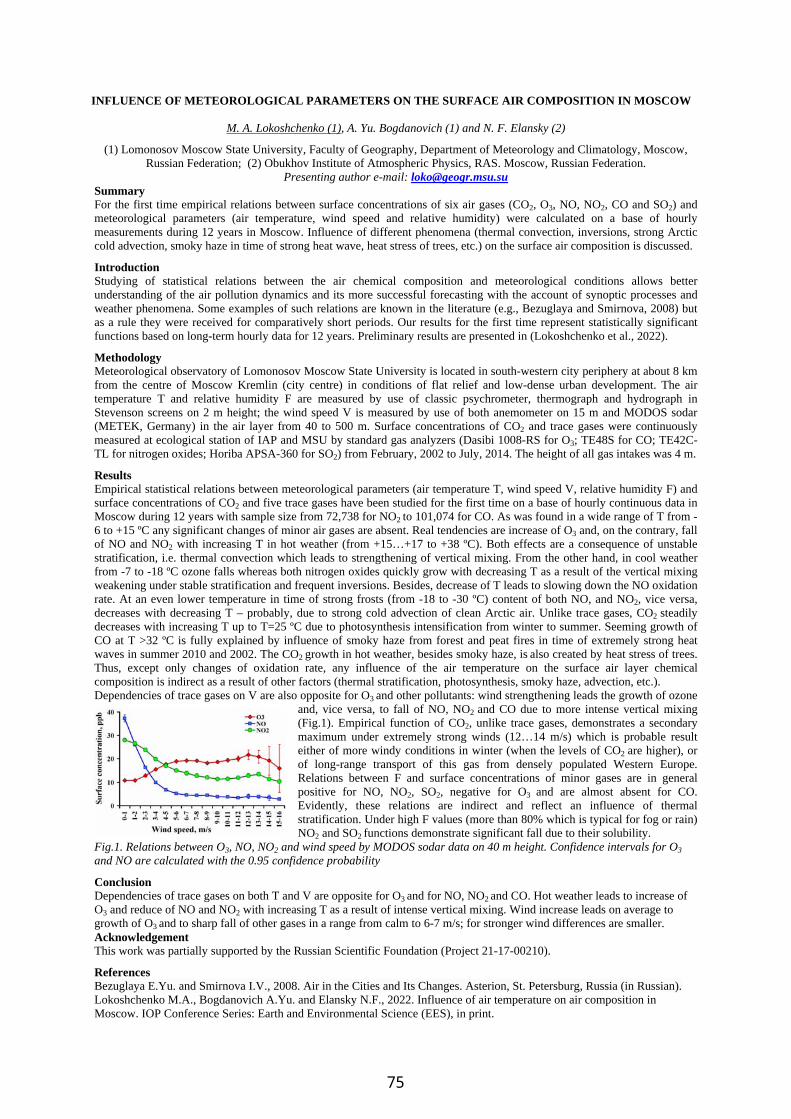
INFLUENCE OF METEOROLOGICAL PARAMETERS ON THE SURFACE AIR COMPOSITION IN MOSCOW
M. A. Lokoshchenko (1), A. Yu. Bogdanovich (1) and N. F. Elansky (2)
(1) Lomonosov Moscow State University, Faculty of Geography, Department of Meteorology and Climatology, Moscow, Russian Federation; (2) Obukhov Institute of Atmospheric Physics, RAS. Moscow, Russian Federation.
Presenting author e-mail: [email protected] Summary For the first time empirical relations between surface concentrations of six air gases (CO2, O3, NO, NO2, CO and SO2) and meteorological parameters (air temperature, wind speed and relative humidity) were calculated on a base of hourly measurements during 12 years in Moscow. Influence of different phenomena (thermal convection, inversions, strong Arctic cold advection, smoky haze in time of strong heat wave, heat stress of trees, etc.) on the surface air composition is discussed.
Introduction Studying of statistical relations between the air chemical composition and meteorological conditions allows better understanding of the air pollution dynamics and its more successful forecasting with the account of synoptic processes and weather phenomena. Some examples of such relations are known in the literature (e.g., Bezuglaya and Smirnova, 2008) but as a rule they were received for comparatively short periods. Our results for the first time represent statistically significant functions based on long-term hourly data for 12 years. Preliminary results are presented in (Lokoshchenko et al., 2022).
Methodology Meteorological observatory of Lomonosov Moscow State University is located in south-western city periphery at about 8 km from the centre of Moscow Kremlin (city centre) in conditions of flat relief and low-dense urban development. The air temperature T and relative humidity F are measured by use of classic psychrometer, thermograph and hydrograph in Stevenson screens on 2 m height; the wind speed V is measured by use of both anemometer on 15 m and MODOS sodar (METEK, Germany) in the air layer from 40 to 500 m. Surface concentrations of CO2 and trace gases were continuously measured at ecological station of IAP and MSU by standard gas analyzers (Dasibi 1008-RS for O3; TE48S for CO; TE42C-TL for nitrogen oxides; Horiba APSA-360 for SO2) from February, 2002 to July, 2014. The height of all gas intakes was 4 m.
Results Empirical statistical relations between meteorological parameters (air temperature T, wind speed V, relative humidity F) and surface concentrations of CO2 and five trace gases have been studied for the first time on a base of hourly continuous data in Moscow during 12 years with sample size from 72,738 for NO2 to 101,074 for CO. As was found in a wide range of T from -6 to +15 ºC any significant changes of minor air gases are absent. Real tendencies are increase of O3 and, on the contrary, fall of NO and NO2 with increasing T in hot weather (from +15…+17 to +38 ºC). Both effects are a consequence of unstable stratification, i.e. thermal convection which leads to strengthening of vertical mixing. From the other hand, in cool weather from -7 to -18 ºC ozone falls whereas both nitrogen oxides quickly grow with decreasing T as a result of the vertical mixing weakening under stable stratification and frequent inversions. Besides, decrease of T leads to slowing down the NO oxidation rate. At an even lower temperature in time of strong frosts (from -18 to -30 ºC) content of both NO, and NO2, vice versa, decreases with decreasing T – probably, due to strong cold advection of clean Arctic air. Unlike trace gases, CO2 steadily decreases with increasing T up to T=25 ºC due to photosynthesis intensification from winter to summer. Seeming growth of CO at T >32 ºC is fully explained by influence of smoky haze from forest and peat fires in time of extremely strong heat waves in summer 2010 and 2002. The CO2 growth in hot weather, besides smoky haze, is also created by heat stress of trees. Thus, except only changes of oxidation rate, any influence of the air temperature on the surface air layer chemical composition is indirect as a result of other factors (thermal stratification, photosynthesis, smoky haze, advection, etc.). Dependencies of trace gases on V are also opposite for O3 and other pollutants: wind strengthening leads the growth of ozone
and, vice versa, to fall of NO, NO2 and CO due to more intense vertical mixing (Fig.1). Empirical function of CO2, unlike trace gases, demonstrates a secondary maximum under extremely strong winds (12…14 m/s) which is probable result either of more windy conditions in winter (when the levels of CO2 are higher), or of long-range transport of this gas from densely populated Western Europe. Relations between F and surface concentrations of minor gases are in general positive for NO, NO2, SO2, negative for O3 and are almost absent for CO. Evidently, these relations are indirect and reflect an influence of thermal stratification. Under high F values (more than 80% which is typical for fog or rain) NO2 and SO2 functions demonstrate significant fall due to their solubility.
Fig.1. Relations between O3, NO, NO2 and wind speed by MODOS sodar data on 40 m height. Confidence intervals for O3 and NO are calculated with the 0.95 confidence probability
Conclusion Dependencies of trace gases on both T and V are opposite for O3 and for NO, NO2 and CO. Hot weather leads to increase of O3 and reduce of NO and NO2 with increasing T as a result of intense vertical mixing. Wind increase leads on average to growth of O3 and to sharp fall of other gases in a range from calm to 6-7 m/s; for stronger wind differences are smaller. Acknowledgement This work was partially supported by the Russian Scientific Foundation (Project 21-17-00210).
References Bezuglaya E.Yu. and Smirnova I.V., 2008. Air in the Cities and Its Changes. Asterion, St. Petersburg, Russia (in Russian). Lokoshchenko M.A., Bogdanovich A.Yu. and Elansky N.F., 2022. Influence of air temperature on air composition in Moscow. IOP Conference Series: Earth and Environmental Science (EES), in print.
75

MULTIVARIATE ANALYSIS OF PERCEPTIONS, RESPONSES, AND EFFECTS OF AIR POLLUTION ON
QUALITY OF LIFE
M. Machado (1), F. R. Cavalcante (1), P. R. Prezotti Filho (1), J. M. Santos (2), V. A. Reisen (3), N. C. Reis Jr. (2), P.
Bondon (4)
Federal Institute of Science and Technology of Espírito Santo (IFES), Guarapari, Brazil, (2) Department of
Environmental Engineering, Federal University of Espírito Santo (UFES), Vitoria, Brazil, (3) Department of Statistics, Federal University of Espírito Santo (UFES), Vitoria, Brazil (4), Université Paris-Saclay, CNRS, CentraleSupélec,
Laboratoire des signaux et systèmes, 91190, Gif-sur-Yvette, France.
Presenting author email: [email protected]
Summary
Industry's social and environmental impacts in urban areas have been an important theme in recent years. This work aims to
perform a multivariate statistical analysis of perceptions, responses, and effects of air pollution on quality of life. Data were obtained through face-to-face surveys (questionnaires) of randomly selected urban and industrialized areas residents. A chi-
squared test for heterogeneity and an ordinal logistic regression model were applied to analyse the data. The results show that
air pollution assessments by community residents reflect the importance of how citizens and science can use relevant
information to contribute to the search for solutions to reduce air pollution and its societal impacts on quality of life.
Introduction
In the context of environmental impacts, surveys are helpful as they allow for the detailed analysis of multiple variables on
air pollution perception, reaction, and effects (Hayes et al., 2017). In the literature, few studies have addressed how and why people respond differently to industrial emissions and which variables influence the quality of life in industrial areas, see,
e.g., (Machado et al., 2021). The southern region of the ES is an urban and industrialized area with mining, oil and gas,
chemical, and port companies, which provides an opportunity to study the industry's impact on the population's quality of
life. Here, we demonstrate the importance of citizen-science relationships through findings from a survey of perceptions of the effects of air pollution in cities and industrialized areas.
Methodology and Results
Selected communities are located in exposed areas of industrial sources of air pollutants (steel mills, iron ore pellet plants, and
chemical industries). Between 2016 and 2020, industrial activity
at a mining plant in the region was disrupted by an
environmental accident. Hence, social effects are also observed. A face-to-face questionnaire was applied to 341 members of the
community (over the age of 16) in July 2019. A chi-squared test
for heterogeneity and an ordinal logistic regression model were
applied for statistical analysis of the data. The results show that nearly 80% of respondents believe air pollution affects the
quality of life and health. From an ordinal logistic regression
model, predictors of perceived quality of life were identified:
changes in income, sources of air pollution, evaluations of living and working in the area, reasons for leaving the site, location,
and household income. The heterogeneity test shows that member
residence is an influential factor in giving answers.
Conclusions
This research supports the hypothesis that the perception of air pollutants impacts can modulate community dissatisfaction. A
perspective on citizens and science is beneficial because it considers community opinion to reduce the environmental effects.
Finally, the air pollution perception survey provides a tool for understanding the factors involved, primarily when
implemented in communities interested in improving the quality of life.
Acknowledgement
This work was supported by Fundação de Amparo à Pesquisa e Inovação do Espírito Santo- FAPES (Vitoria, Brazil),
References
Hayes, J. E., R. J. Stevenson, and R. M. Stuetz. "Survey of the effect of odour impact on communities." Journal of
environmental management 204, 349-354, 2017.
Machado, M., Santos, J. M., Frere, S., et al. Deconstruction of annoyance due to air pollution by multiple correspondence analyses. Environmental Science and Pollution 28, 47904-47920, 2021.
76

EXPERIMENTAL STUDY OF VISIBLE LIGHT RESPONSIVE PHOTOCATALYTIC PAINTS FOR INDOOR AIR QUALITY IMPROVEMENT
Th. Maggos (1), P. Panagopoulos (1), C. Theodorou (2), A. Nikolakopoulos (2), G. Kiriakidis (3,4) and V. Binas (3)
(1) Atmospheric Chemistry and Innovative Technologies Laboratory/INRASTES/NCSR Demokritos Athens, Greece; (2) VITEX S.A Aspropyrgos, Greece, (3) Institute of Electronic Structure & Lasers/FORTH, Heraclion, Crete, Greece, 4PCN
Materials IKE, Crete, Greece
Presenting author email: [email protected] Summary In the frame of a LIFE19 project named “VISIONS”, an innovative photocatalytic paint was produced for healthy environment and energy saving purposes. To that end a photocatalytic powder was optimized in order to be mixed in paints without downgrading paint physical properties and to reduce production cost. More specifically, the optimization concerned the synthetic pathways, the concentration of dopants and the particles size. The photocatalytic efficiency of the powder as well as the VISIONS photo-paints was performed both in lab and real scale applications. Lab-scale tests were performed in a continuous tank reactor (fig.1) in order to quantify the capacity of VISIONS paints to degrade photocatalytically inorganic (nitrogen oxides NOx) and volatile organic (VOCs e.g toluene) air pollutants under both Visible and UV irradiation. Real-scale tests are taking place in Demo-houses and the Hellenic Naval Academy building where VISIONS paints are monitored with regards to Indoor Air Quality (IAQ) improvement and reduction of energy consumption. Introduction Establishing more efficient control of the indoor environment can have beneficial impact on both improvement of Indoor Air Quality (IAQ) and on the energy consumption. Among the existing various techniques to mitigate the problem of contamination in the indoor environment and their limitations, photocatalysis, as an alternative technology, is considered to be the most innovative, effective, economic and promising solution. Bringing together the scientific and the practical knowledge, the LIFE19 VISIONS project set realistic targets for the resolution of the IAQ and energy consumption issues. Methodology and Results Lab-scale tests: The most promising optimized powders were tested in a photocatalytic reactor (fig.1) according to CEN/TS 16980-1:2017 under both UV and Vis light in order to verify their performance characteristics in terms of NOx, VOCs degradation and mechanical properties. Results showed that the most promising powder photocatalytically degrade 84.4% and 29.5% of NO and toluene respectively (fig.2). Subsequently, the optimized photo-powder was mixed with 3 different kinds of paints: Organic (with organic binder), Inorganic silicate paint (with potassium silicate binder) and Hybrid (with silicon acrylic binder). Results showed 20.4% and 8.4% efficiency of organic paint to degrade NO and toluene respectively. Real scale tests: Application of the 3 Photo-Paints in Demo-Houses prototype demonstrator is taking place. The ultimate scope of the current action is to estimate the effectiveness of the 3 Photo-Paints to degrade air pollutants as well as to eliminate energy consumption in the demo-houses and promote the most promising one to be applied in real life conditions. The latter is held in the Hellenic Naval Academy building located in the port of Piraeus.
Fig.1 Photocatalytic reactor Fig.2 Air pollutants trends during the photocatalytic process
Conclusions Taking into consideration the fact that air quality in indoor microenvironments can be controlled easier than outdoors and the expected results of an applied methodology can be easily quantified in indoor environments, VISIONS is the ‘model’ for the implementation of an innovative and cost-effective methodology for the reduction of indoor air pollutants concentrations and energy consumption. In lab scale experiments the degradation of the pollutants reached up to 85%. However, when incorporate the photocatalytic powder with paints the corresponding percentage was eliminated up to 21%. Nevertheless, the latter is a significant percentage of pollutant degradation for a building material application (paint). . Acknowledgement This work was supported by LIFE VISIONS project (LIFE19 ENV/GR/000100) with the contribution of the LIFE Programme of the European Union. This work reflects only the authors' view and CINEA is not responsible for any use that may be made of the information it contains. References Maggos, T., Binas, V., Siaperas, V., Terzopoulos, A., Panagopoulos, P., Kiriakidis, G. 2019 A Promising technological approach to improve indoor air quality, Applied Sciences (Switzerland), 9 (22), art. no. 4837, DOI: 10.3390/app9224837.
77

MODELLING EMISSIONS ORIGINATING FROM MARINE LNG ENGINES
E. Majamäki (1), T. Grönholm (1), L. Johansson (1), J.-P. Jalkanen (1) and J. Kukkonen (1,2)
(1) Finnish Meteorological Institute, FI-00560 Helsinki, Finland
(2) University of Hertfordshire, Hatfield AL10 9AB, UK
Presenting author email: [email protected]
Summary
Global ship emission model STEAM was refined with a capability of modelling the fuel consumption and emissions of different
marine LNG engines. Engine efficiency and emission factors were evaluated based on existing literature and the available
technical information of marine LNG engines. Local scale dispersion was modelled with a gaussian puff dispersion model,
FMI-PuffStream, and evaluated against on-shore measurements of methane plumes attributed to passing ships along a shipping
lane in the vicinity of the Utö island in the Baltic Sea.
Introduction
Liquefied Natural Gas (LNG) contains less carbon per unit of energy than traditional marine fuels and therefore, less carbon
dioxide (CO2) is released during the combustion. Also, the sulphur content of LNG is low, and it is possible to comply with
the NOx emission limits by choosing a low-NOx dual fuel engine and optimizing the engine operation. These properties make
LNG an attractive option for ship operation in Emission Control Areas (ECAs). However, the main chemical component of
LNG, methane (CH4), has a higher global warming potential than CO2 and therefore, emissions of unburned methane, also
referred to as methane slip, might increase the climatic impact of the ship (e.g., Grönholm et al., 2021). Comprehensive and
reliable modelling tools are essential to evaluate the effectiveness of current and potential future regulations. The aims of this
study were (i) to develop tools for compiling a detailed global inventory of methane emissions attributed to LNG-fuelled ships
and (ii) to evaluate the performance of the modelling tools by comparing the predicted results to the on-shore measurements of
passing LNG ship plumes, as observed at a measurement station located in the Utö island.
Methodology and Results
To estimate the contribution of vessels using LNG as a fuel to the air pollutant and greenhouse gas emissions from shipping,
the Ship Traffic Emission Assessment Model (STEAM) (Johansson et al. 2017) was refined with a comprehensive method for
modelling the fuel consumption and emissions of different marine LNG engines. The model was extended to treat also methane,
including the methane slip. Marine engines that can use LNG as fuel were divided into five categories: (1) Lean-Burn Spark
Ignited engines (LBSI-engine), (2) four-stroke Low pressure Dual-Fuel engines (LPDF-engines), (3) two-stroke Low pressure
Dual-Fuel engines (LPDF-engines), (4) high-pressure injection dual-fuel (HPDF) engines, and (5) steam and gas turbines.
Additionally, the engine age was taken into consideration when determining the emission factors. Emission factors of different
engine types were defined based on a literature review. To identify the engine type and specific energy consumption, technical
information was collected for 86 LNG fuelled
marine engines, based on data from the
manufactures. Dispersion of the gas plumes
was modelled by the FMI-PuffStream (a
gaussian puff dispersion model). The
modelling system STEAM + FMI-PuffStream
was evaluated by modelling the emissions of
LNG fuelled ships that have passed the
measurement station in the Utö island and
comparing the predicted results to the on-
shore measurements. The measurements and
analyses of ship plumes in Utö have been
discussed in detail by Grönholm et al. (2021). The global CH4 emissions from LNG fuelled
ships in 2019 are presented in Figure 1,
computed using the refined STEAM model.
Acknowledgement
This study has received funding from the European Union's Horizon 2020 Programme Research and Innovation action under
grant agreement No 814893 (SCIPPER project) and No 874990 (EMERGE project).
References
Grönholm, T., Mäkelä T., Hatakka J., Jalkanen J.-P., Kuula J., Laurila T., Laakso L. and Kukkonen J. 2021. Evaluation of
Methane Emissions Originating from LNG Ships Based on the Measurements at a Remote Marine Station. Environ. Sci.
Technol. 2021, 55, 20, 13677–13686. https://doi.org/10.1021/acs.est.1c03293.
Johansson, L., Jalkanen, J.-P. J. P. and Kukkonen, J. 2017 Global assessment of shipping emissions in 2015 on a high spatial
and temporal resolution, Atmos. Environ., 167, 403–415, doi:10.1016/j.atmosenv.2017.08.042
Figure 1. Predicted global methane emissions [kg] from shipping in 2019.
78
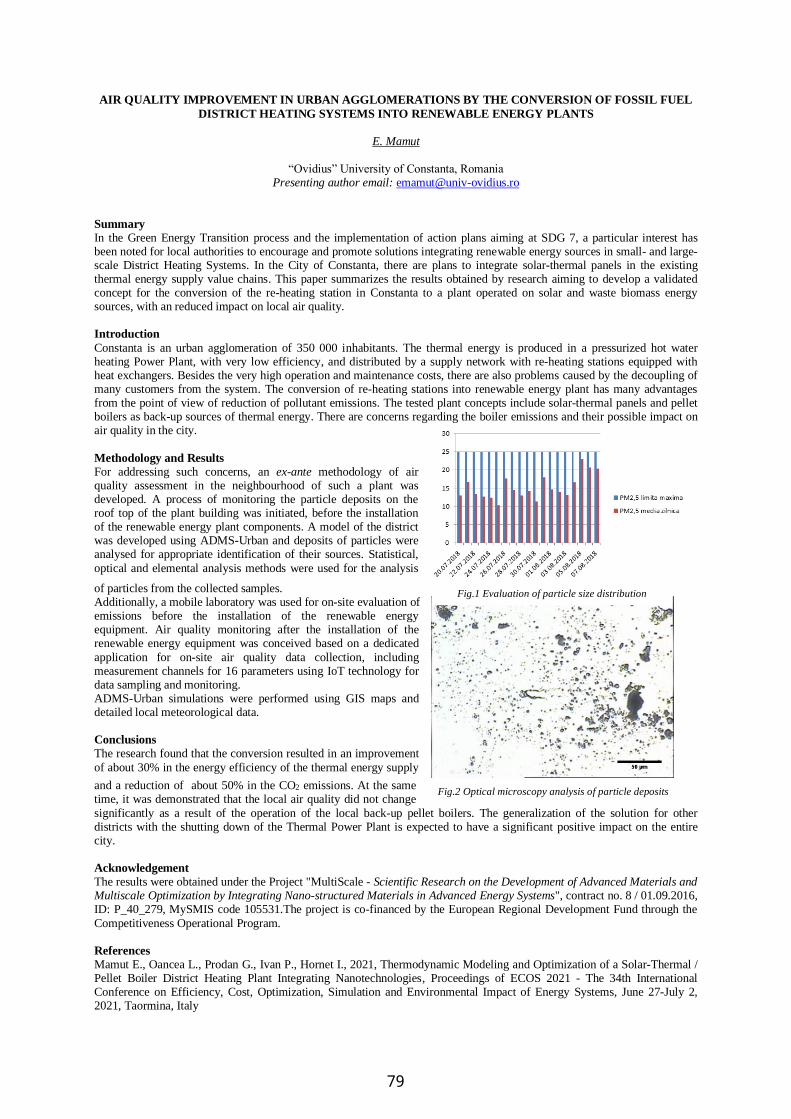
AIR QUALITY IMPROVEMENT IN URBAN AGGLOMERATIONS BY THE CONVERSION OF FOSSIL FUEL
DISTRICT HEATING SYSTEMS INTO RENEWABLE ENERGY PLANTS
E. Mamut
“Ovidius” University of Constanta, Romania
Presenting author email: [email protected]
Summary
In the Green Energy Transition process and the implementation of action plans aiming at SDG 7, a particular interest has been noted for local authorities to encourage and promote solutions integrating renewable energy sources in small- and large-scale District Heating Systems. In the City of Constanta, there are plans to integrate solar-thermal panels in the existing thermal energy supply value chains. This paper summarizes the results obtained by research aiming to develop a validated concept for the conversion of the re-heating station in Constanta to a plant operated on solar and waste biomass energy sources, with an reduced impact on local air quality. Introduction
Constanta is an urban agglomeration of 350 000 inhabitants. The thermal energy is produced in a pressurized hot water heating Power Plant, with very low efficiency, and distributed by a supply network with re-heating stations equipped with heat exchangers. Besides the very high operation and maintenance costs, there are also problems caused by the decoupling of many customers from the system. The conversion of re-heating stations into renewable energy plant has many advantages from the point of view of reduction of pollutant emissions. The tested plant concepts include solar-thermal panels and pellet boilers as back-up sources of thermal energy. There are concerns regarding the boiler emissions and their possible impact on air quality in the city.
Methodology and Results For addressing such concerns, an ex-ante methodology of air quality assessment in the neighbourhood of such a plant was developed. A process of monitoring the particle deposits on the roof top of the plant building was initiated, before the installation of the renewable energy plant components. A model of the district was developed using ADMS-Urban and deposits of particles were analysed for appropriate identification of their sources. Statistical,
optical and elemental analysis methods were used for the analysis
of particles from the collected samples. Additionally, a mobile laboratory was used for on-site evaluation of emissions before the installation of the renewable energy equipment. Air quality monitoring after the installation of the renewable energy equipment was conceived based on a dedicated
application for on-site air quality data collection, including measurement channels for 16 parameters using IoT technology for data sampling and monitoring. ADMS-Urban simulations were performed using GIS maps and detailed local meteorological data. Conclusions The research found that the conversion resulted in an improvement
of about 30% in the energy efficiency of the thermal energy supply
and a reduction of about 50% in the CO2 emissions. At the same time, it was demonstrated that the local air quality did not change
significantly as a result of the operation of the local back-up pellet boilers. The generalization of the solution for other districts with the shutting down of the Thermal Power Plant is expected to have a significant positive impact on the entire city. Acknowledgement
The results were obtained under the Project "MultiScale - Scientific Research on the Development of Advanced Materials and Multiscale Optimization by Integrating Nano-structured Materials in Advanced Energy Systems", contract no. 8 / 01.09.2016, ID: P_40_279, MySMIS code 105531.The project is co-financed by the European Regional Development Fund through the
Competitiveness Operational Program. References
Mamut E., Oancea L., Prodan G., Ivan P., Hornet I., 2021, Thermodynamic Modeling and Optimization of a Solar-Thermal / Pellet Boiler District Heating Plant Integrating Nanotechnologies, Proceedings of ECOS 2021 - The 34th International Conference on Efficiency, Cost, Optimization, Simulation and Environmental Impact of Energy Systems, June 27-July 2, 2021, Taormina, Italy
Fig.1 Evaluation of particle size distribution
Fig.2 Optical microscopy analysis of particle deposits
79
Prediction of ozone exceedances with climate indicators using machine learning
A.M.M. Manders (1), S. Shahmohammadi (1), A.C. Mues (2), S. Kessinger (2), M. Schaap (1)
(1) TNO, PO Box 80015, 3508TA Utrecht, The Netherlands (2) UBA,Wörlitzer Platz 1 06844 Dessau-Roßlau
Presenting author email: [email protected]
Summary
Climate change will enhance the conditions favorable for ozone production, leading to more exceedances of ozone thresholds.
We have used machine learning methods to establish relationships between annual or seasonal climate indicators like number
of summer days, and the annual number of ozone exceedances for monitoring locations in Germany, covering 1995-2018.
Separate algorithms were developed for normal and extreme conditions and a classification model of normal and extreme
conditions was made. Although good performance of the models was found, that supports the use of the algorithms to explore
the effect of climate scenarios on ozone exceedances, these models would not be suitable for emission scenarios which limits
their applicability. In addition, not all required information is by default available from climate models (relative humidity
indicator, seasonal indicators instead of annual indicators).
Introduction
To quantify the impact of climate change on air pollution, chemistry-transport models have been coupled to climate
simulations to calculate ozone concentrations on an hourly basis. However, this is a computationally demanding method and
requires access to large volumes of meteorological data from climate models. On the other hand, annual climate indicators are
stored routinely and are available for many years, both from reanalysis simulations and for simulations with (regional) climate
models. These aggregated data cannot be used to predict ozone on a day-to-day basis, but it may be possible to establish a
relationship between annual number of ozone exceedances and annual climate data. The aim of this research is to derive such
relationships for Germany using machine learning methods
Data and method
We used hourly ozone data from Germany covering 1995-2018. The number of exceedances was based on the daily maximum
8-hour running mean (MDA8), with a threshold of 120 µg/m3. Climate variables were derived from COSMO reanalysis data
at a resolution of 6x6 km2. The relevant variables were daily maximum and minimum temperature, daily mean relative
humidity, wind speed and wind direction, cumulative radiation, and daily rain. These data were further processed to derive the
climate variables: number of summer days, hot days and tropical nights, wet days, moist and crisp days, days, calm days and
days with northerly/easterly/southerly/westerly wind. Since ozone is a summer phenomenon, only days from April-September
were included.
For every station and year it was determined whether the number of exceedances was normal or extreme, based on interquantile
ratios of the full data set. A classification mode was trained , so that also for new stations and years the appropriate model can
be selected and applied. A number of algorithms was trained, including GBM and deep learning. Stacked ensembles were also
constructed.
Results and discussion
The stacked ensemble models gave the best performance, with GBM models performing very well and in general better than
the deep learning models. For the normal conditions, the number of exceedances could be predicted with an RMSE of around
6 exceedances, with number of exceedances in the range 0-55 days. For extreme conditions, RMSE was around 8.7, with
number of exceedances in the range 55-90. For the normal cases, temperature indicators (tropical nights, summer days) were
dominant, next to information on latitude, station altitude and station classification. For the extreme cases, effects of radiation,
relative humidity and wind became more dominant, and radiation was important factor in the classification of normal and
extreme cases.
Some climate indicators that were used are not available from climate databases but would be relevant, like an indicator for
relative humidity (not available at all). Other variables (like number of calm days) are only available on annual basis whereas
for ozone only the April-September values are relevant. It would therefore be beneficial if climate dataset are stored on a
seasonal level and not on annual level, which was already done for some climate data sets. Also an indicator of relative
humidity does not exist yet in climate databases but would be relevant for ozone.
Conclusion
Reasonably good accuracy was reached by using different algorithms for normal and extreme cases, in spite of the constraint
of using annually aggregated data. To explore the impact of climate change only, the algorithm can be a computationally
efficient alternative to a chemistry transport model, if all climate indicators are available on seasonal scale. To reliably include
the impact of substantial emission changes in the scenarios, the training data were however insufficient which is a limitation.
Acknowledgement
This work was done in the framework of the UBA KliWo project, KFZ 3719132020
80
AIR QUALITY MEASURMENTS FROM ON-BOARD PORTABLE PODS VS FIXED MONITORING STATIONS IN THE CITY OF THESSALONIKI
Dimitris Margaritis1, Dimitra Lambropoulou2,3, Evangelos Bekiaris1
1Centre for Research and Technology Hellas (CERTH) / Hellenic Institute of Transport (HIT)
6th km, Charilaou - Thermi Rd., P.O. Box 60361, 57001, Thermi, Thessaloniki, Greece 2Aristotle University of Thessaloniki / School of Chemistry, University Campus, 54124, Thessaloniki, Greece
3Center for Interdisciplinary Research and Innovation (CIRI-AUTH), Balkan Centre, 57001, Thessaloniki, Greece
Presenting author e-mail: [email protected]
Summary The aim of this study was the investigation of potential correlation of a mobile and fixed air quality monitoring stations’ measurements that corresponded to main arterial city roads. The comparison of the on-board and fixed stations data showed some similarities in the trend, even though the pollutant were measured not at the exact same position. A linear, not strong, correlation has been identified for CO, NO, NO2 and SO2 concentrations. Introduction Pollution of urban ambient air is a serious issue that has occupied the research community and city authorities for several decades. It is not only industry and domestic activities that contribute to a considerable extent to the burden of air quality, but also transport, especially in densely populated cities that natural ventilation is obstructed. As a result of this fact are the increased concentrations of gaseous pollutants, which affect human health. Although it is common for air quality to be monitored with fixed stations to achieve sufficient time series, there are countries - especially in America - that also use mobile stations for the combined analysis of measurements and the most complete picture at the regional level. In the city of Hamilton in Canada, measurements from fixed stations showed a continuous reduction of pollutants. Measurements from a mobile station, however, showed fluctuations, which were determined spatially (Adams, 2012). Another use of mobile stations is on-the-move measurements, when the measuring devices allow a high measurement frequency (at the level of seconds). According to Wang et al. (2009), fluctuations in gaseous pollutant concentrations were correlated with the variation in the speed of vehicles and the type of the road. Method The measurements took place in the city of Thessaloniki. Most of the routes have been chosen inside the residential area, where the highest concentrations of pollutants have been observed. The measuring devices used are: a. OBD Link MX dongle, b. Samsung Galaxy S6 smartphone, and c. AQMesh portable air quality monitoring system. A FIAT Fiorino 2011 model has been used as the vehicle to carry the devices. The AQMesh was mounted on a roof rack. The average speed of the vehicle was kept below the 25 km/h in order to avoid any disturbances due to aerodynamic effect while driving. The primary raw data were logged in the same time frame but were stored in different files with different frequency. As next step, the synchronization of the primary data took place in order to create a single register of measurements that should bear a single time stamp. The Environmental Agency of the city of Thessaloniki has provided the data from two monitoring stations in the city centre.
Results The linear correlation of the two fixed stations with the data of the on-board pod indicated a weak correlation for NO2 and CO (R2 = 0.12 and R2 = 0.13 respectively) and a weak-moderate for NO and SO2 (R2 = 0.36 and R2 = 0.30 respectively). However this was expected because the sampling was done at a significant different height (2.0m of the vehicle vs >4.5m of the fixed stations), the on-board pod was quite close to the exhaust pipes of the surrounding traffic, thus the delusion of the gasses in space and their dispersion varies from a fixed station located at an open space, and basically because the location of the mobile pod changed in time (because of the moving vehicle), although at a close proximity from the fixed station. Conclusions Changes in concentrations are spatially differentiated and cannot be accurately captured by fixed stations. Some similarities in the concentration trends is a finding that could be studied more extensively for the estimation of
correlation coefficients. Concentrations of pollutants showed a similar tendency with the vehicles speed variation. References Adams, M., DeLuca, P., Corr, D., Kanaroglou, P., 2012. Mobile Air Monitoring: Measuring Change in Air Quality in the City of Hamilton, 2005–2010. Social Indicators Research, September 2012, Volume 108, Issue 2, 351–364. Wang, M., Zhu, M., T., Zheng, J., Zhang, R. Y., Zhang, S. Q., Xie, X., Han, Y. Q., Li, Y., 2009. Use of a mobile laboratory to evaluate changes in on-road air pollutants during the Beijing 2008 Summer Olympics. Atmos. Chem. Phys., 9, 2009, 8247–8263.
81
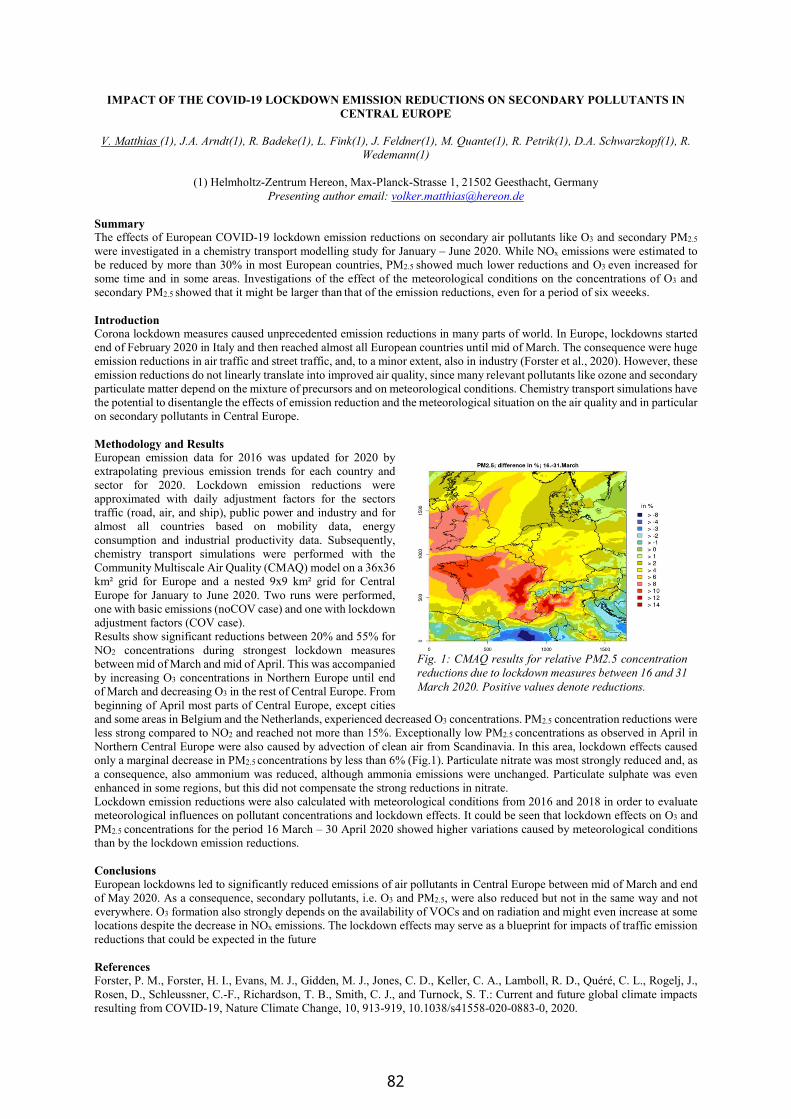
IMPACT OF THE COVID-19 LOCKDOWN EMISSION REDUCTIONS ON SECONDARY POLLUTANTS IN CENTRAL EUROPE
V. Matthias (1), J.A. Arndt(1), R. Badeke(1), L. Fink(1), J. Feldner(1), M. Quante(1), R. Petrik(1), D.A. Schwarzkopf(1), R.
Wedemann(1)
(1) Helmholtz-Zentrum Hereon, Max-Planck-Strasse 1, 21502 Geesthacht, Germany Presenting author email: [email protected]
Summary The effects of European COVID-19 lockdown emission reductions on secondary air pollutants like O3 and secondary PM2.5
were investigated in a chemistry transport modelling study for January – June 2020. While NOx emissions were estimated to be reduced by more than 30% in most European countries, PM2.5 showed much lower reductions and O3 even increased for some time and in some areas. Investigations of the effect of the meteorological conditions on the concentrations of O3 and secondary PM2.5 showed that it might be larger than that of the emission reductions, even for a period of six weeeks. Introduction Corona lockdown measures caused unprecedented emission reductions in many parts of world. In Europe, lockdowns started end of February 2020 in Italy and then reached almost all European countries until mid of March. The consequence were huge emission reductions in air traffic and street traffic, and, to a minor extent, also in industry (Forster et al., 2020). However, these emission reductions do not linearly translate into improved air quality, since many relevant pollutants like ozone and secondary particulate matter depend on the mixture of precursors and on meteorological conditions. Chemistry transport simulations have the potential to disentangle the effects of emission reduction and the meteorological situation on the air quality and in particular on secondary pollutants in Central Europe. Methodology and Results European emission data for 2016 was updated for 2020 by extrapolating previous emission trends for each country and sector for 2020. Lockdown emission reductions were approximated with daily adjustment factors for the sectors traffic (road, air, and ship), public power and industry and for almost all countries based on mobility data, energy consumption and industrial productivity data. Subsequently, chemistry transport simulations were performed with the Community Multiscale Air Quality (CMAQ) model on a 36x36 km² grid for Europe and a nested 9x9 km² grid for Central Europe for January to June 2020. Two runs were performed, one with basic emissions (noCOV case) and one with lockdown adjustment factors (COV case). Results show significant reductions between 20% and 55% for NO2 concentrations during strongest lockdown measures between mid of March and mid of April. This was accompanied by increasing O3 concentrations in Northern Europe until end of March and decreasing O3 in the rest of Central Europe. From beginning of April most parts of Central Europe, except cities and some areas in Belgium and the Netherlands, experienced decreased O3 concentrations. PM2.5 concentration reductions were less strong compared to NO2 and reached not more than 15%. Exceptionally low PM2.5 concentrations as observed in April in Northern Central Europe were also caused by advection of clean air from Scandinavia. In this area, lockdown effects caused only a marginal decrease in PM2.5 concentrations by less than 6% (Fig.1). Particulate nitrate was most strongly reduced and, as a consequence, also ammonium was reduced, although ammonia emissions were unchanged. Particulate sulphate was even enhanced in some regions, but this did not compensate the strong reductions in nitrate. Lockdown emission reductions were also calculated with meteorological conditions from 2016 and 2018 in order to evaluate meteorological influences on pollutant concentrations and lockdown effects. It could be seen that lockdown effects on O3 and PM2.5 concentrations for the period 16 March – 30 April 2020 showed higher variations caused by meteorological conditions than by the lockdown emission reductions. Conclusions European lockdowns led to significantly reduced emissions of air pollutants in Central Europe between mid of March and end of May 2020. As a consequence, secondary pollutants, i.e. O3 and PM2.5, were also reduced but not in the same way and not everywhere. O3 formation also strongly depends on the availability of VOCs and on radiation and might even increase at some locations despite the decrease in NOx emissions. The lockdown effects may serve as a blueprint for impacts of traffic emission reductions that could be expected in the future References Forster, P. M., Forster, H. I., Evans, M. J., Gidden, M. J., Jones, C. D., Keller, C. A., Lamboll, R. D., Quéré, C. L., Rogelj, J., Rosen, D., Schleussner, C.-F., Richardson, T. B., Smith, C. J., and Turnock, S. T.: Current and future global climate impacts resulting from COVID-19, Nature Climate Change, 10, 913-919, 10.1038/s41558-020-0883-0, 2020.
Fig. 1: CMAQ results for relative PM2.5 concentration reductions due to lockdown measures between 16 and 31 March 2020. Positive values denote reductions.
82

FINDING THE RIGHT SOLUTIONS TO IMPROVE URBAN AIR QUALITY: THE CONCAWE NOX/NO2
SOURCE APPORTIONMENT VIEWER
A. Megaritis (1), B. Degraeuwe (2), M. Vanhulsel (2), S. Janssen (2), and G. Valastro (1)
(1) Concawe, Environmental Science for European refining, Boulevard du Souverain 165, 1160 Brussels, Belgium
(2) Vlaamse Instelling voor Technologisch Onderzoek (VITO), Mol, Belgium
Presenting author email: [email protected]
Summary
In this contribution we present an EU-wide NOx/NO2 source apportionment tool that was developed with a unique focus on
road transport. The tool uses a high resolution of 125 x 125 m and provides explicit information on any location over Europe,
regarding the contribution of different vehicle categories, the different Euro norms, as well as the different types of fuel used
to NOx emissions and NO2 concentrations. Through illustrative examples, the study will assess the significance of the road
transport sector to NO2 concentrations, and how the fleet turnover as well as current and forthcoming legislative initiatives
could contribute in further improving urban air quality.
Introduction
Emission reduction measures have significantly improved air quality in Europe. However, air quality remains a concern in
many urban areas. Road transport has been the primary focus for emission controls as it is often assumed to be one of the
main causes of non-compliance with Air Quality Limit Values (AQLVs) especially for nitrogen dioxide (NO2). On average,
40% of total NOx emissions in Europe are due to road transport (EEA, 2020).
Air quality is also a multi-scale and multifactorial phenomenon with a strong spatial variability depending on the pollutant
and location type. Common methodologies for air quality assessment at an EU-wide scale, typically use Chemical Transport
Models (CTM) run at roughly, 7 x 7 to 10 x 10 km2 grid resolution. However, due to the high spatial variability of sources
such as traffic and the strong concentration gradients near the roads, these methodologies are inadequate to provide a detailed
and robust information on the road-contributions in general. This is more evident to pollutants such as NO2 where road
transport emissions dominate its concentrations. The attribution of the pollutant concentrations to different source categories
should therefore be carefully evaluated when assessing local measures as solutions to improve air quality in hotspots.
Methodology and Results
To provide further insights on the importance of source apportionment in determining the effective solution for improving air
quality, Concawe in partnership with Vito, developed an EU-wide NOx/NO2 source apportionment tool. The tool was built
based on VITO’s methodology called QUARK (Quick Urban Air Quality using Kernels) (Lefebvre and Maiheu, 2017) to
model the annual NO2 concentrations in Europe at a high resolution (~ 100m).
Through a user-friendly interface,
the user can select any location in
Europe and get information about
the national fleet composition in
current (i.e., 2015) and projected
years (i.e., 2020-2025-2030) as
well as the contribution of road
transport and other sectors to NOx
emissions, calculated based on
COPERT emission factors and
Sibyl fleet projections. A dynamic
analysis functionality is
implemented that allows the user
to select specific traffic-categories
concerning different vehicle types,
Euro norms, as well as types of
fuels used, and assess their
contribution to NO2
concentrations. Additional
functionalities that can be used to
perform a number of sensitivity
analyses (e.g., city-level analyses, introducing
a new “Euro norm”, etc.) are also available.
Conclusions
Air quality modelling can offer a means of robust, evidence-based approach in supporting air quality assessment and
assessing how air quality can be further improved. To this end, high resolution and EU-wide modelling tools that can provide
a detailed view of the contribution of emissions sources with high spatial variability, such as road transport, and eventually
determine the most effective solutions for improving air quality will be essential.
References
European Environment Agency (EEA), 2020. Air quality in Europe – 2020 report, Report No 09/2020.
Lefebvre W., Maiheu B., 2017: QUARK - Quick Urban AiR quality model using Kernels Version 1.1,
https://ec.europa.eu/environment/air/publications/models.htm.
Fig.1 The Concawe NOx/NO2 source apportionment viewer (example for Paris).
83
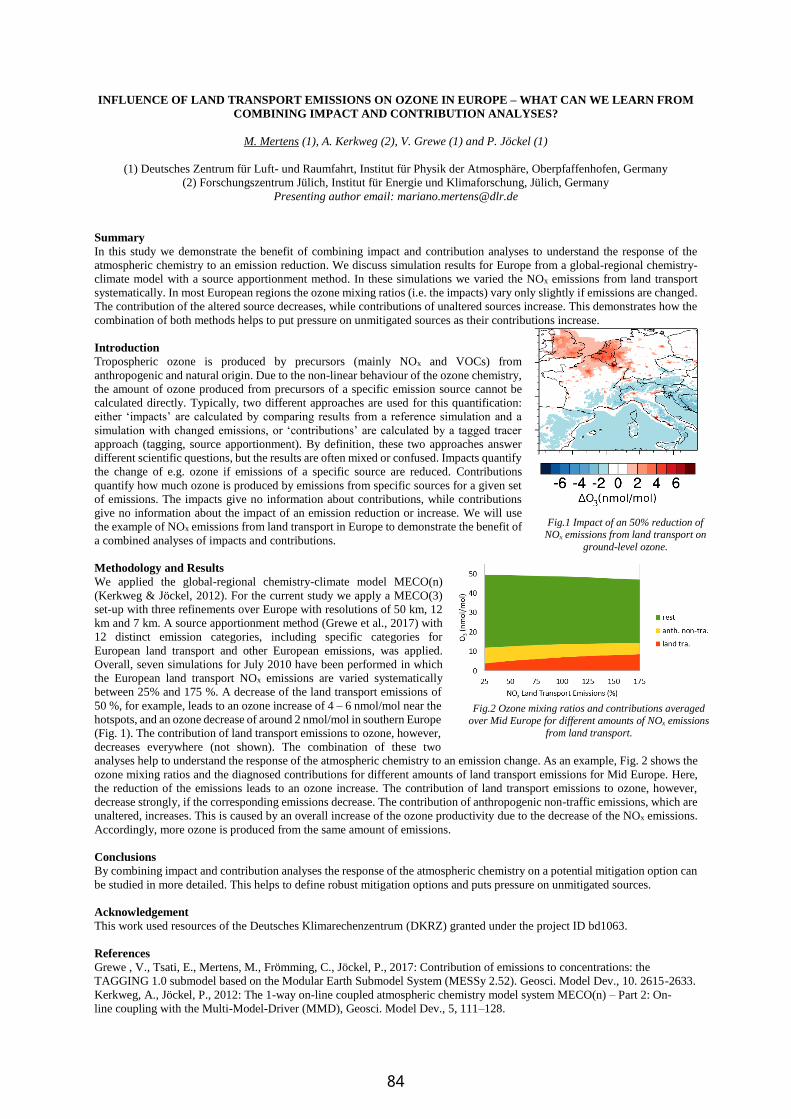
INFLUENCE OF LAND TRANSPORT EMISSIONS ON OZONE IN EUROPE – WHAT CAN WE LEARN FROM
COMBINING IMPACT AND CONTRIBUTION ANALYSES?
M. Mertens (1), A. Kerkweg (2), V. Grewe (1) and P. Jöckel (1)
(1) Deutsches Zentrum für Luft- und Raumfahrt, Institut für Physik der Atmosphäre, Oberpfaffenhofen, Germany
(2) Forschungszentrum Jülich, Institut für Energie und Klimaforschung, Jülich, Germany
Presenting author email: [email protected]
Summary
In this study we demonstrate the benefit of combining impact and contribution analyses to understand the response of the
atmospheric chemistry to an emission reduction. We discuss simulation results for Europe from a global-regional chemistry-
climate model with a source apportionment method. In these simulations we varied the NOx emissions from land transport
systematically. In most European regions the ozone mixing ratios (i.e. the impacts) vary only slightly if emissions are changed.
The contribution of the altered source decreases, while contributions of unaltered sources increase. This demonstrates how the
combination of both methods helps to put pressure on unmitigated sources as their contributions increase.
Introduction
Tropospheric ozone is produced by precursors (mainly NOx and VOCs) from
anthropogenic and natural origin. Due to the non-linear behaviour of the ozone chemistry,
the amount of ozone produced from precursors of a specific emission source cannot be
calculated directly. Typically, two different approaches are used for this quantification:
either ‘impacts’ are calculated by comparing results from a reference simulation and a
simulation with changed emissions, or ‘contributions’ are calculated by a tagged tracer
approach (tagging, source apportionment). By definition, these two approaches answer
different scientific questions, but the results are often mixed or confused. Impacts quantify
the change of e.g. ozone if emissions of a specific source are reduced. Contributions
quantify how much ozone is produced by emissions from specific sources for a given set
of emissions. The impacts give no information about contributions, while contributions
give no information about the impact of an emission reduction or increase. We will use
the example of NOx emissions from land transport in Europe to demonstrate the benefit of
a combined analyses of impacts and contributions.
Methodology and Results
We applied the global-regional chemistry-climate model MECO(n)
(Kerkweg & Jöckel, 2012). For the current study we apply a MECO(3)
set-up with three refinements over Europe with resolutions of 50 km, 12
km and 7 km. A source apportionment method (Grewe et al., 2017) with
12 distinct emission categories, including specific categories for
European land transport and other European emissions, was applied.
Overall, seven simulations for July 2010 have been performed in which
the European land transport NOx emissions are varied systematically
between 25% and 175 %. A decrease of the land transport emissions of
50 %, for example, leads to an ozone increase of 4 – 6 nmol/mol near the
hotspots, and an ozone decrease of around 2 nmol/mol in southern Europe
(Fig. 1). The contribution of land transport emissions to ozone, however,
decreases everywhere (not shown). The combination of these two
analyses help to understand the response of the atmospheric chemistry to an emission change. As an example, Fig. 2 shows the
ozone mixing ratios and the diagnosed contributions for different amounts of land transport emissions for Mid Europe. Here,
the reduction of the emissions leads to an ozone increase. The contribution of land transport emissions to ozone, however,
decrease strongly, if the corresponding emissions decrease. The contribution of anthropogenic non-traffic emissions, which are
unaltered, increases. This is caused by an overall increase of the ozone productivity due to the decrease of the NOx emissions.
Accordingly, more ozone is produced from the same amount of emissions.
Conclusions
By combining impact and contribution analyses the response of the atmospheric chemistry on a potential mitigation option can
be studied in more detailed. This helps to define robust mitigation options and puts pressure on unmitigated sources.
Acknowledgement
This work used resources of the Deutsches Klimarechenzentrum (DKRZ) granted under the project ID bd1063.
References
Grewe , V., Tsati, E., Mertens, M., Frömming, C., Jöckel, P., 2017: Contribution of emissions to concentrations: the
TAGGING 1.0 submodel based on the Modular Earth Submodel System (MESSy 2.52). Geosci. Model Dev., 10. 2615-2633.
Kerkweg, A., Jöckel, P., 2012: The 1-way on-line coupled atmospheric chemistry model system MECO(n) – Part 2: On-
line coupling with the Multi-Model-Driver (MMD), Geosci. Model Dev., 5, 111–128.
Fig.1 Impact of an 50% reduction of NOx emissions from land transport on
ground-level ozone.
Fig.2 Ozone mixing ratios and contributions averaged
over Mid Europe for different amounts of NOx emissions
from land transport.
84
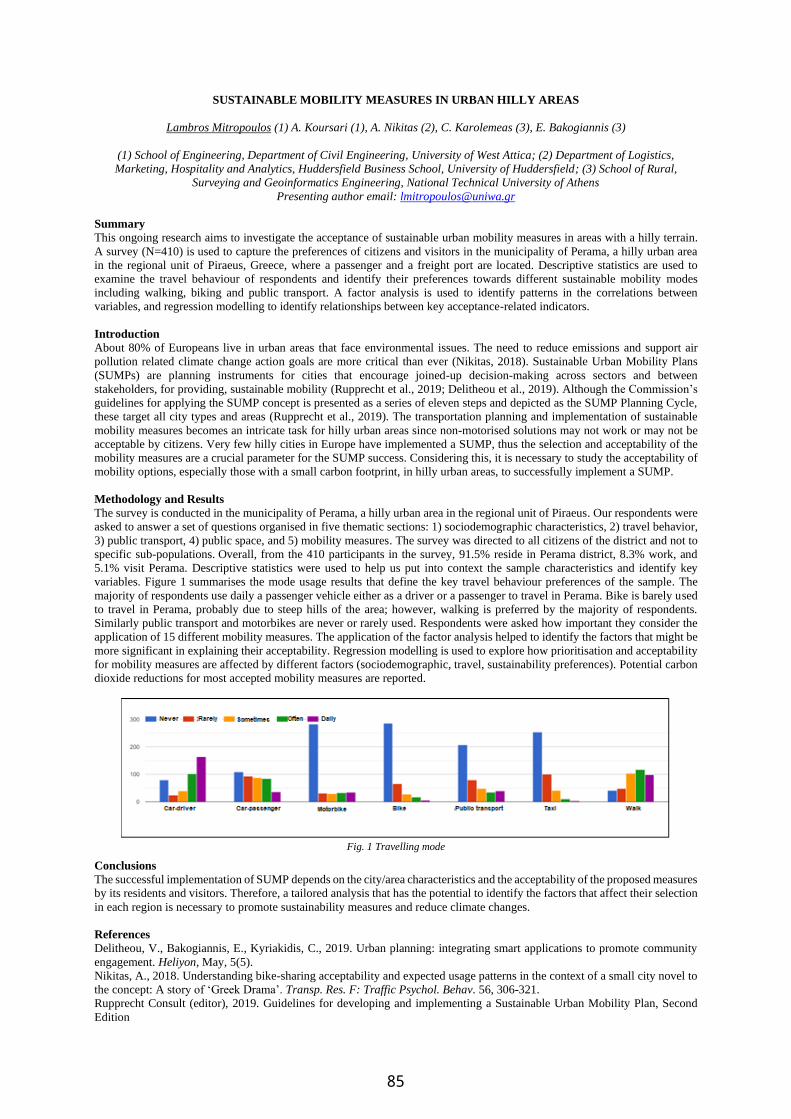
SUSTAINABLE MOBILITY MEASURES IN URBAN HILLY AREAS
Lambros Mitropoulos (1) A. Koursari (1), A. Nikitas (2), C. Karolemeas (3), E. Bakogiannis (3)
(1) School of Engineering, Department of Civil Engineering, University of West Attica; (2) Department of Logistics,
Marketing, Hospitality and Analytics, Huddersfield Business School, University of Huddersfield; (3) School of Rural,
Surveying and Geoinformatics Engineering, National Technical University of Athens
Presenting author email: [email protected]
Summary
This ongoing research aims to investigate the acceptance of sustainable urban mobility measures in areas with a hilly terrain.
A survey (N=410) is used to capture the preferences of citizens and visitors in the municipality of Perama, a hilly urban area
in the regional unit of Piraeus, Greece, where a passenger and a freight port are located. Descriptive statistics are used to
examine the travel behaviour of respondents and identify their preferences towards different sustainable mobility modes
including walking, biking and public transport. A factor analysis is used to identify patterns in the correlations between
variables, and regression modelling to identify relationships between key acceptance-related indicators.
Introduction
About 80% of Europeans live in urban areas that face environmental issues. The need to reduce emissions and support air
pollution related climate change action goals are more critical than ever (Nikitas, 2018). Sustainable Urban Mobility Plans
(SUMPs) are planning instruments for cities that encourage joined-up decision-making across sectors and between
stakeholders, for providing, sustainable mobility (Rupprecht et al., 2019; Delitheou et al., 2019). Although the Commission’s
guidelines for applying the SUMP concept is presented as a series of eleven steps and depicted as the SUMP Planning Cycle,
these target all city types and areas (Rupprecht et al., 2019). The transportation planning and implementation of sustainable
mobility measures becomes an intricate task for hilly urban areas since non-motorised solutions may not work or may not be
acceptable by citizens. Very few hilly cities in Europe have implemented a SUMP, thus the selection and acceptability of the
mobility measures are a crucial parameter for the SUMP success. Considering this, it is necessary to study the acceptability of
mobility options, especially those with a small carbon footprint, in hilly urban areas, to successfully implement a SUMP.
Methodology and Results
The survey is conducted in the municipality of Perama, a hilly urban area in the regional unit of Piraeus. Our respondents were
asked to answer a set of questions organised in five thematic sections: 1) sociodemographic characteristics, 2) travel behavior,
3) public transport, 4) public space, and 5) mobility measures. The survey was directed to all citizens of the district and not to
specific sub-populations. Overall, from the 410 participants in the survey, 91.5% reside in Perama district, 8.3% work, and
5.1% visit Perama. Descriptive statistics were used to help us put into context the sample characteristics and identify key
variables. Figure 1 summarises the mode usage results that define the key travel behaviour preferences of the sample. The
majority of respondents use daily a passenger vehicle either as a driver or a passenger to travel in Perama. Bike is barely used
to travel in Perama, probably due to steep hills of the area; however, walking is preferred by the majority of respondents.
Similarly public transport and motorbikes are never or rarely used. Respondents were asked how important they consider the
application of 15 different mobility measures. The application of the factor analysis helped to identify the factors that might be
more significant in explaining their acceptability. Regression modelling is used to explore how prioritisation and acceptability
for mobility measures are affected by different factors (sociodemographic, travel, sustainability preferences). Potential carbon
dioxide reductions for most accepted mobility measures are reported.
Fig. 1 Travelling mode
Conclusions
The successful implementation of SUMP depends on the city/area characteristics and the acceptability of the proposed measures
by its residents and visitors. Therefore, a tailored analysis that has the potential to identify the factors that affect their selection
in each region is necessary to promote sustainability measures and reduce climate changes.
References
Delitheou, V., Bakogiannis, E., Kyriakidis, C., 2019. Urban planning: integrating smart applications to promote community
engagement. Heliyon, May, 5(5).
Nikitas, A., 2018. Understanding bike-sharing acceptability and expected usage patterns in the context of a small city novel to
the concept: A story of ‘Greek Drama’. Transp. Res. F: Traffic Psychol. Behav. 56, 306-321.
Rupprecht Consult (editor), 2019. Guidelines for developing and implementing a Sustainable Urban Mobility Plan, Second
Edition
85
MEASUREMENT CAMPAIGN FOR CHARACTERISING AND MONITORING OF EMISSIONS FROM VESSEL
WITH ALTERNATIVE FUELS AND NOX EMISSION CONTROL
Jana Moldanova (1), Hilkka Timonen (2), Ruud Verbeek (3), Pauli Simonen (4), Andreas Weigelt (5), Brice Temime-Roussel
(6), Johan Mellqvist (7), Jonathan Weisheit (8), Tuomas Rantala (9), Nikos Kousias (10), Linda Haedrich (11), Jon Knudsen
(12), Tim Smyth (13), Håkan Salberg (1), Luca Merelli (1), Luis Barreira (2), Kimmo Teinilä (2), Sanna Saarikoski (2),
Vincent E. Verhagen (3), Declan van Heesen (3), Armando P. Indrajuana (3), Antti Rostedt (4), Lassi Markkula (4), Joni
Kalliokoski (4), Jörg Beecken (5), Grazia Maria Lanzafame (6), Barbara D'Anna (6), Vladimir Conde Jacobo (7), Au Ching
Nok (8), Matti Irjala (9), Bettina Knudsen (12), Leonidas Ntziachristos(10)
(1) IVL, Swedish Environmental Research Institute, Gothenburg, Sweden; (2) Finnish Meteorological Institute, Helsinki,
Finland; (3) TNO, Holland; (4) Tampere Uninersity of Technology, Tampere, Finland; (5) German Maritime and
Hydrographic Agency, Hamburg, Germany; (6) Aix Marseille University, UMR7376, Marseille, France; (7) Chalmers
University of Technology, Gothenburg, Sweden; (8) Fraunhofer Centre for Maritime Technologies and Services, Hamburg,
Germany; (9) AEROMON, Helsinki, Finland; (10) Aristotle University of Thessaloniki, Thessaloniki, Greece; (11)
Helmholtz Zentrum München, the National Research Center for Environment and Health, München, Germany; (12) Explicit,
Kongens Lyngby, Denmark; (13) Plymouth Marine Laboratory, Plymouth, UK.
Presenting author email: [email protected]
Summary
A comprehensive measurement campaign was performed onboard a RoPax ferry within the SCIPPER project, combining
detailed investigation of the emissions in the ship funnel, field-testing and verification of onboard monitoring sensors, and
remote emission monitoring from on-shore sniffer stations and sensors flown by UAVs (drones). The measurements performed
with the high-end instruments provided information for the assessment of the impact of ship emission regulations on air
pollution and also served for validation of the on-board monitoring sensors and of remote monitoring. The intensive campaign
has been followed up by a continuous monitoring period, testing the sensors’ endurance and long-term performance.
Introduction
In recent years, regulations and emission limits on emissions of harmful air pollutants from shipping have gradually begun to
be implemented in the sector. To assess effectiveness of the regulations, impacts of the shipping emissions on air quality under
different regulatory scenarios need to be investigated, and this requires good knowledge of the impact of abatement measures
employed to meet the emission limits for targeted pollutants and performance in other emitted species. Fundamental
prerequisite for the effective implementation of the regulations is the systematic monitoring of ships’ compliance, achieved by
measuring shipping emissions in various phases of their normal operation. In this study, we present some of the results of the
measurement campaign combining detailed characterisation of emissions and field tests of onboard and remote monitoring
sensors.
Methodology and Results
The core period of the campaign comprised of one-week measurements onboard a RoPax ferry on route between Kiel and
Gothenburg, when emissions from two different fuels, marine gas oil (MGO) and blue methanol, and impact of selective
catalytic reduction (SCR) system, were characterized with an array of high-end instrumentation and onboard sensors, under
different operational conditions. The in-stack measurements were performed both in the engine room and close to the exhaust
funnel outlet, downstream of the catalyst, and gave information about chemical and physical properties of the exhaust and their
changes with the different fuels, with and without urea injection upstream of the catalyst and over the catalyst. Two mobile
laboratories carried advanced state-of-the-art instrumentation for online analyses of detailed chemical composition and physical
properties of gases and particles in the exhaust, including secondary particulate matter formed in the Potential Aerosol Mass
(PAM) Oxidation Flow Reactor. In parallel, sensors monitoring emissions of gaseous air pollutants and particles, including a
prototype of soot sensor, were installed in the stack and transmission of the data to the SCIPPER data centre was established.
A third mobile laboratory analysed the plume released from the funnel with an IR camera and sniffer instruments connected to
a sample inlet placed on a 10-m tall mast on the ship deck. Other sensors monitored pollutants on the deck upwind and
downwind the stack.
At the same time, a mobile measurement station was monitoring emissions from ships at the entrance to the Kiel canal capturing
also plumes from the investigated ship. During its voyage, the ship also passed by fixed monitoring stations on the Great Belt
Bridge and at Älvsborg’s fortress by entrance to Gothenburg. Both in Kiel and in Gothenburg, the plume was investigated with
sensors flown by UAVs. Besides the opportunity to validate the remote sensing systems, the parallel in-funnel and remote
measurements also provided data for the investigation of in-plume processes for the emitted gases and particles.
The measurements have shown significant reduction of organic part of particulate matter over the SCR system, also without
urea injection, while the urea injection mainly reduced emissions of NOx and a led to a slip of NH3 and increase of the
ammonium content in the particles. Methanol fuel showed significantly reduced emissions of soot and emissions of
formaldehyde. The finding of the onboard measurements could be confirmed by the relevant remote monitoring systems
showing their potential for compliance monitoring. The objective of this continuous monitoring was also to propose practical
averaged emissions indicators suitable for a satisfactory expression of the environmental performance of the vessel and the
relation with the IMO MARPOL pollutant legislation.
Acknowledgement
The SCIPPER project has received funding from the European Union’s Horizon 2020 research and innovation programme
under grant agreement Nr.814893. Stena Line and engine crew of Stena Germanica are gratefully acknowledged for their great
support of the measurement campaign.
86

LINKING CLIMATE MITIGATION AND AIR QUALITY POLICIES AT URBAN LEVEL.
EXPERIENCES AND CONSIDERATIONS FROM THE COVENANT OF MAYORS INITIATIVE
Fabio Monforti-Ferrario1, Eleonora Lo Vullo1, Luana Valentini2, Emanuela Peduzzi1, Enrico Pisoni1, and Marta Giulia Baldi
'1 European Commission, Joint Research Centre (JRC), Ispra (VA), Italy 2 Seidor Italy, Milan, Italy
Corresponding author: [email protected]
Summary
The EU Joint Research Centre (JRC) supports local decision makers by providing robust urban climate datasets and other
useful tools. In the frame of its support to the EU Covenant of Mayor (CoM) initiative, the JRC is bringing to the attention of
the city administrators the importance of tuning climate change mitigation and air quality. For this goal, in cooperation with the
CoM stakeholders (e.g. local experts, NGOs EU DGs) we are developing a specific tool aimed at allowing the CoM signatories
to evaluate the consequences of their mitigation policies on the air pollutants emissions taking place in their territory. The tool
could be helpful to the CoM community, including urban and energy planners, in designing more integrated mitigation actions
and could be used in the ex-ante evaluation phase of the policy-making cycle. We will present both the tool and its scientific
rationale together with the participatory process leading to its development and use.
Introduction
Tackling Climate Change is a priority for the European Union, who has set targets for reducing greenhouse gas emissions
progressively up to 2050. In 2008, acknowledging the role of local authorities, the European Commission (EC) launched the
Covenant of Mayors (CoM) initiative to endorse their efforts in the implementation of sustainable energy and climate policies.
In the CoM framework, cities and the other local authorities are encouraged to be proactive in fighting climate change by
developing a urban climate pan, where the mitigation actions are designed based on the city GHG emission data. The JRC
plays a central role in the CoM ecosystem, providing the methodological guidelines that enable cities to process their own
GHG emission data. Furthermore, the JRC provides scientific supervision and makes a comprehensive GHG dataset available
to the whole CoM community (Kona et al., 2021). Since 2018 the JRC has also started to investigate an additional perspective
focusing the attention on the synergies and trade-offs between climate and air quality by means of scientific analyses,
workshops and, finally developing and making available to the CoM community a dedicated on-line tool.
Methodology
The tool development is divided into two steps: (1) in the first part of the research project, a pilot version of the tool has been
developed based on the methodology reported in two previous studies, Monforti-Ferrario et al. (2018) and Peduzzi et al.
(2020); (2) after setting up the tool, the pilot tool will be made available to a group of of CoM local experts. Their comments
and feedbacks will be collected through questionnaires, interviews and workshops. A dedicated Community of Practices will
be created with the ambition of finally developing thematic guidelines.
As reported in Peduzzi et al. (2020) the tool is based on the comparison between the Baseline Emission Inventory (BEI) and the
successive Monitoring Emission Inventories (MEI) the signatories need to submit to comply with CoM requirements. Indeed,
the BEI can be considered as a “starting point” and provides a quantification of energy consumption and CO2 emissions for
different sectors and fuels (referred to as energy carriers) for a baseline year chosen by the signatory. MEIs provide the same
type of information for one or more following years and should be submitted in principle every fourth year. The changes in
energy consumption (by sector and carrier) between BEI and MEI were translated into the corresponding changes in air
pollutant emissions by means of estimated emission factors. In particular, PM2.5 and NOx emission changes from two
macrosectors (residential and transport).
Results
Such a participatory process has resulted in a tool supporting urban planning and, in perspective, to facilitate a more active role
of citizens for what matters the interplay between climate mitigation and air pollution control policies.
Updated data on the actual use of the tool and feedback from users and practitioners will be provided and discussed. We will
complete the presentation with reflections and suggestions for local authorities to practically improve the co-designing of
climate and air pollution policies based on the experience collected throughout the CoM initiative.
Conclusions
The CoM air quality tool provides support to signatories to better tune their climate mitigation and air quality strategies,
especially in the case of small and average size communities with limited resources. Moreover, feedback collected through
dedicated Community of Practices is contributing to the ongoing development of dedicated guidelines to be offered to the CoM
community and to local administrators at whole.
References
Kona, A., Monforti-Ferrario, F., Bertoldi, P., Baldi, M. G., Kakoulaki, G., Vetters, N., Thiel, C., Melica, G., Lo Vullo, E.,
Sgobbi, A., Ahlgren, C., and Posnic, B., 2021, Global Covenant of Mayors, a dataset of greenhouse gas emissions for 6200
cities in Europe and the Southern Mediterranean countries, Earth Syst. Sci. Data, 13, 3551–3564
Monforti-Ferrario F., Kona A., Peduzzi E., Pernigotti D., Pisoni E., 2018, The impact on air quality of energy saving measures
in the major cities signatories of the Covenant of Mayors initiative. Environmental International, 118, 222-234
Peduzzi E., Baldi M. G., Pisoni E., Kona A., Bertoldi P., Monforti-Ferrario F., 2020, Impacts of a climate change initiative on
air pollutant emissions: Insights from the Covenant of Mayors, Environment International, Volume 145, 106029
87

THESSALONIKI AIR QUALITY: A 30 YEAR RETROSPECTIVE AND CRITICAL ANALYSIS
N. Moussiopoulos and G. Tsegas
Laboratory of Heat Transfer and Environmental Engineering, Aristotle University Thessaloniki,
Thessaloniki 54124, Greece
Keywords: Urban Air Quality, Operational modelling, Intervention assessment
Presenting author email: [email protected]
Summary
Several aspects of the air pollution problems of Thessaloniki will be discussed, with emphasis on the efforts of the
authors and their co-workers in the last 30 years to analyze the air quality situation in the city and to suggest
possible actions for finding remedies.
Introduction
Thessaloniki is the second largest city in Greece, with a population of more than 1 million inhabitants in an area of
about 200 km2. Hasty urbanization and excessive motorization in the last three decades of the 20th century resulted
in a significant deterioration of air quality, so that Thessaloniki in recent years has been characterized as one of the
most polluted cities in the European Union.
Methodology
The authors and their colleagues in the Laboratory of Heat
Transfer and Environmental Engineering of the Aristotle
University of Thessaloniki (LHTEE/AUTh) have invested a
large amount of effort in the last 30 years analyzing the air
quality situation in the city aiming to assess existing problems
and to suggest possible actions for finding remedies. To this
end, a suite of measurement-based and modelling tools have
been developed and applied over the years, starting from
methodologies for baseline activity and emissions
quantification, incorporating scenario set-up and assessment
and culminating in the application of multi-scale methods for
detailed exposure assessment. As a starting point, the local air
pollution characteristics will be presented based on the results
of the Thessaloniki '91 field measurement campaign, which
was the first comprehensive experimental activity in this respect. Subsequently we will present the results of
various projects with our involvement, aiming to analyze how legislative and technological interventions to road
traffic in the Greater Thessaloniki Area would affect urban air quality. We will present results from field and
modelling assessment of a big landfill fire which caused a toxic fallout over the southern-eastern parts of the city.
We will further present results of a combined experimental and model simulation analysis of the air quality
deterioration because of biomass burning for space heating (Saffari et al. 2013), a consequence of the economic
crisis in the last decade. Finally, we will discuss the performance of our Air Quality Management System that is
operating for more than ten years in Thessaloniki as a tool allowing local and regional authorities to assess the
potential air quality impact of various possible interventions in the conurbation.
Conclusions and expectations
The 30-year period of the retrospective coincides with many important developments on air quality science and
practice in Europe. The way that the physical, historical and social characteristics of Thessaloniki as a middle-size
Mediterranean city affected its air quality, together with LHTEE/AUTh’s efforts to develop, adapt and apply tools
to its study provide a unique perspective to this end. Valuable lessons on both the planning and research, theory
and practice aspects of urban air quality are bound to emerge from a critical analysis of these timelines.
References
Saffari A., Daher N., Samara C., Voutsa Dimitra., Kouras Ath., Manoli E., Karagkiozidou O., Vlachokostas Ch.,
Moussiopoulos N., Shafer M., Schauer J. and Sioutas C. (2013), Increased biomass burning due to the economic
crisis in Greece and its adverse impact on wintertime air quality in Thessaloniki, Environmental Science and
Technology 47, 23, 13313–13320.
Fig.1 Wintertime smog episode in Thessaloniki associated with widespread biomass burning
88
NEW WHO GLOBAL AIR QUALITY GUIDELINES – HOW THE CURRENT AMBIENT AIR SITUATION FITS TO IT IN EUROPE
Hans-Guido Mücke
WHO Collaborating Centre for Air Quality Management and Air Pollution Control German Environment Agency, Dept. of Environmental Hygiene, Corrensplatz 1, 14195 Berlin, Germany
Email: [email protected] Summary Air pollution is one of the biggest environmental threats to human health, alongside climate change. This puts the burden of disease attributable to air pollution on a par with other major global health risks such as unhealthy diet and tobacco smoking. The goal of the new 2021 WHO global air quality guidelines (AQGs) is for all countries to achieve recommended air quality levels. Because this will be a difficult task to reach for many countries and regions struggling with high air pollution concentration levels, the AQGs propose interim targets to facilitate stepwise improvement in air quality and health benefits for the population. Background Every year, exposure to both ambient and indoor air pollution is estimated to cause more than seven million deaths globally, and millions more of healthy years of life lost. This burden of disease is large and makes air pollution the single most important environmental risk factor for public health. It is one of the leading risk factors for noncommunicable diseases, which continue to increase worldwide. Since 1987, the World Health Organization (WHO) releases air quality guidelines (AQGs), which are designed to offer guidance on reducing the health impacts of air pollution and are based on expert evaluation of the latest scientific evidence. Since its last update in 2005, there has been a substantial increase in evidence of how and to what degree air pollution affects different aspects of human health. In September 2021, the WHO global AQGs recommend revised air quality levels for six classical pollutants - particulate matter (PM), ozone (O₃), nitrogen dioxide (NO₂) sulfur dioxide (SO₂) and carbon monoxide (CO), where evidence has advanced the most on health effects from exposure. Now, it is of high interest to evaluate the current ambient air situation in Europe comparing with the new AQG values. Stronger air pollution abatement needed to save health and lives In 2019, more than 90% of the global population lived in areas where ambient air concentrations exceeded the 2005 AQGs for long term exposure to PM₂.₅. Countries with strong policy-driven improvements in air quality have often seen marked reduction in air pollution, whereas declines over the past 30 years were less noticeable in regions with already good air quality, like parts of Europe. Europe's most serious pollutants in terms of harm to human health, particularly in urban areas, are particulate matter (PM), NO2 and ground-level ozone. Air pollution exposure is estimated based on concentrations measured at all urban and suburban background monitoring stations for most of the urban population and at traffic stations for populations living within 100 meters of major roads. In 2018, Europe’s urban population was exposed to exceeding the 2005 AQG values: 48% for PM10, 74% for PM2.5, 99% for ozone, 19% for SO2, but only 4% for NO2. The 2021 AQGs recommend some new and updated air quality levels and interim targets, both partly lower in comparison to the 2005 ones. Therefore, this study gives an insight on first results of the current ambient air quality situation in Europe in line with the new AQGs, and assess how such new values and interim targets proposed are reached or exceeded. First WHO health impact assessments show, that most 80% of deaths related to PM₂.₅ could be avoided in the world if the current air pollution levels were reduced to those proposed in the updated AQGs. The achievement of interim targets would result in reducing the burden of disease, of which the greatest benefit would be observed in countries with high PM₂.₅ concentrations and large populations. Conclusion The revised 2021 WHO AQGs provide a robust health argument supporting the global fight against climate change and environmental pollution. Values and interim targets are provided to support a stepwise progress towards their achievement, and to improve public health - outdoors and indoors. In fact, harmful air pollutants can exist in higher concentrations in indoors than in ambient spaces. As Europeans for example spend most of their time indoors (over 90%), exposure to indoor air pollution is an important health risk factor, which needs to be considered too. However, air pollution health effects depend not only on exposure but also on the susceptibility of people. References European Environment Agency (2020). Air quality in Europe – 2020 report. EEA Report No 09/2020. 160 pages. Publication Office of the European Union, Luxembourg. World Health Organization (2021). WHO global air quality guidelines: particulate matter (PM2.5 and PM10), ozone, nitrogen dioxide, sulfur dioxide and carbon monoxide. 267 pages. World Health Organization. https://apps.who.int/iris/handle/10665/345329.
89

HIGH EMITTERS VEHICLES AND SUSTAINABLE DEVELOPMENT OF URBAN AREAS
F. Murena and D. Toscano
Chemical, Material and Production Engineering Department – University of Naples “Federico II”
Summary
The contribution of high emitters vehicles (HEVs) to fine particles (FPs) concentration has been studied in the old centre of
Naples. Measurements were carried out using a condensation particle counter (CPC) in two one-way narrow and deep street
canyons. Videos of traffic recorded with a camera were overlapped to concentration vs time diagrams to identify HEVs. An
automatic procedure has been developed to identify the concentration peaks and to create a correspondence between passing
vehicles and peaks. The results show how HEVs can be effectively identified and that their contribution to local FPS
concentration is very significant.
Introduction
Sustainable development of urban areas is one of the main challenges of the next future. Urban air quality management
represents a fundamental task of this challenge. The significant contribution of high emitters vehicles (HEVs) to atmospheric
pollution in urban areas is often reported in literature. HEVs accounted for a range of 41% to 63% of the total CO emissions,
between 47% to 65% of HC emissions and 32% of NOx emissions (Park and Rakha, 2009). Schifter, et al., (2013) have
evaluated that the contribution of HEVs to CO and NMHC emissions is 30% for both pollutants and 40% for NOx.
Methodology
Monitoring campaigns were performed in two adjacent one-way narrow and deep street canyons of similar geometry: width W
≈ 5.5 m and aspect ratio H/W ≈ 4 but with different traffic levels (low- and high-traffic). A TSI P-Trak particle counter (model
8525) was deployed to measure the particle number concentration (PNC) from 20 to 1000 nm, with a range up to 500,000
particles/cm3. A video camera was used to monitor traffic in the observed area. This information was used to associate vehicles
with FPs concentration peaks. In order to analyse peaks, an automatic procedure was developed in MATLAB2021a. The
procedure consists of: statistical analysis of peaks, identification of HEVs and their corresponding peaks of FPs concentration,
calculation of areas of peaks associated to HEVs. Area of peaks was used to calculate the contribution of HEVs to local FPS
concentration.
Results
The number and category of vehicles studied are reported in Table 1. Most of the vehicles do not generate any PNC peak.
Figure 1 shows the reduction of FPs concentration that could be achieved banning the circulation of HEVs.
Table 1. Summary of vehicles studied
N° vehicles N° peaks
Cars 47 13
2-wheels 71 26
Vans 7 2
Total 125 41
Figure 1. PN concentration reduction; circle: total vehicles;
triangle: cars; square: 2-wheel vehicles.
Conclusions
One-way narrow and deep street canyons are very common in old centre of urban areas and could represent an effective gate
to individuate high emitters vehicles using a video camera and a fast response analyser. Our results confirm that HEVs
emissions represent a critical issue for the sustainable development of urban areas, and it would be necessary to prohibit their
circulation.
References:
Park, S., & Rakha, H. (2009). Environmental impacts of high-emitting vehicles. Transportation research record, 2123(1), 97-
108.
Schifter, I., Díaz, L., & González, U. (2013). Impact of reformulated ethanol–gasoline blends on high-emitting vehicles.
Environmental technology, 34(7), 911-922.
0%
10%
20%
30%
40%
0% 20% 40% 60% 80% 100%
% P
N r
edu
ctio
n
% Vehicles
90

IMPACT OF NOISE BARRIERS ON THE OBSERVED AIR QUALITY ALONG ROADS
M. Norman (1) and C. Johansson (1,2)
(1) Environment and Health Administration, SLB-analys, Box 8136, 104 20 Stockholm, Sweden; (2) Department of
Environmental Science, Stockholm university, 106 91 Stockholm, Sweden
Presenting author email: [email protected]
Summary
This study aims to quantify the effect of noise barriers on traffic generated air pollution. The study includes both model
studies and measurements. This presentation focus on the measurements and the model results are presented in another
presentation. A 2.2m high barrier close to a road has been studies with measurement at equal distance from the road both
with and without noise barrier. The result showed significant lower concentration behind the barrier compared to on the road
side of the barrier, but also higher concentrations next to the road compared to a road stretch without barrier. The effect of the
barrier decreased with increasing distance from the road and at 40m distance could no effect be observed.
Introduction
Previous studies have shown that noise barriers not only affect the levels of noise behind the screen, but also have a positive
effect on the air pollution levels behind the barriers. Both measurement and model calculations has shown 15 – 60 % lower
concentrations behind the noise barrier compared to when no barrier was present. According to model studies the effect is
mainly caused by increased dilution when the polluted air from the road is forced up and above the barrier. The results in the
studies depend on, for example, the height of the screen and the distance from the screen. Several studies have also shown
higher concentrations on the road side of the barrier compared to when no barrier exists. In some cases, the levels in the
roadway area can increase with several 100% depending on the geometry (screen height, one or two screens, distance to
traffic and meteorological conditions).
Methodology
In the spring of 2021, measurements were carried out on different sides of a 2.2-meter-high noise barrier along
Bergslagsvägen in Stockholm. Bergslagsvägen is one of the major roads passing in to Stockholm and has a signed speed of
60 km/h. Three stations with continuous measurements of particles (PM10, PM2.5) and nitrogen oxides (NOx, NO2) were
placed along the road. Two stations were placed with equal distance, 10 m, from the road. One station behind the noise
barrier and the other on the stretch of the road were there was no noise barrier. The third station was placed on the other side
of the road as an upwind reference which also included meteorology. In addition, passive samplers of NOx and NO2 which
gave weekly averages were placed on both sides of the noise barrier as well as on different distance from the barrier.
In spring 2022 similar measurement will be carried out along another road outside Stockholm. This time at a highway with
100 km/h and 4 m high noise barrier.
Results and Conclusions
The passive samplers showed that the NOx- concentrations were on averaged 65 % lower 1 m behind the barrier compared to
the road side of the barrier. However, the passive samplers also showed that on average was the concentration of NOx up to 2
times higher on the road side of the barrier compared to when no barrier was present. The effect from the noise barrier
decreased with increasing distance from the barrier, Figure 1. When comparing without barrier was the NOx- concentration
35 - 45 % lower 1m behind the barrier and 10 - 20 % lower 10 m behind the barrier. At 40 m distance could no effect be
observed.
Figure 1. Average NOx concentration at different distance from the noise barrier along Bergslagsvägen.
The continuous measurements 10m from the road could be sorted for example wind direction and hours with high traffic
density. The average effect for NOx was 15 % but during daytime and weekdays higher with on average 25 %. For PM10 was
the effect smaller with average of 5 % and daytime during weekdays 12 %. When sorting for wind direction it was also found
that only a limited of time was the wind at the site perpendicular road. This differs from the wind direction observed at a mast
nearby. The possible reason is that one of the effects from the barrier at this road was channelling the wind along the road.
So, the observed effect on air quality behind the barrier was probably not only due to the increased dilution when the air was
lifted above the barrier, but also preventing the air from blowing over the barrier.
Acknowledgement
This work was supported by the Swedish Transport Administration.
91
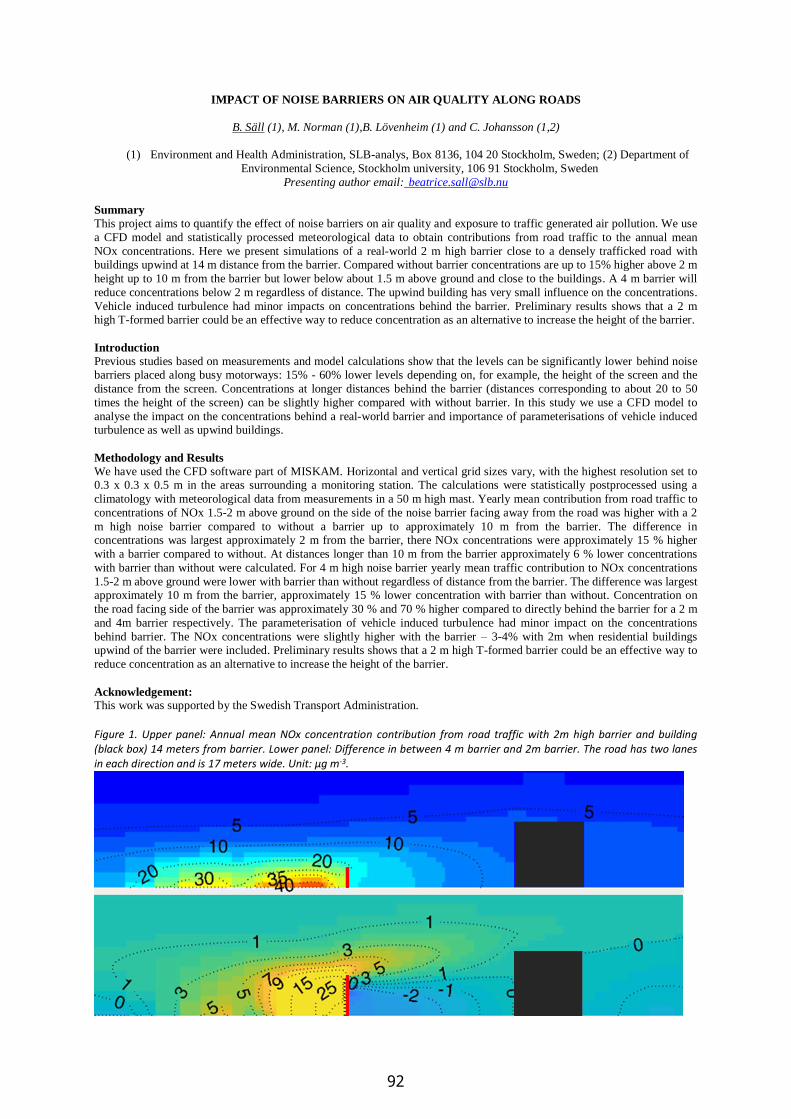
IMPACT OF NOISE BARRIERS ON AIR QUALITY ALONG ROADS
B. Säll (1), M. Norman (1),B. Lövenheim (1) and C. Johansson (1,2)
(1) Environment and Health Administration, SLB-analys, Box 8136, 104 20 Stockholm, Sweden; (2) Department of
Environmental Science, Stockholm university, 106 91 Stockholm, Sweden
Presenting author email: [email protected]
Summary
This project aims to quantify the effect of noise barriers on air quality and exposure to traffic generated air pollution. We use
a CFD model and statistically processed meteorological data to obtain contributions from road traffic to the annual mean
NOx concentrations. Here we present simulations of a real-world 2 m high barrier close to a densely trafficked road with buildings upwind at 14 m distance from the barrier. Compared without barrier concentrations are up to 15% higher above 2 m
height up to 10 m from the barrier but lower below about 1.5 m above ground and close to the buildings. A 4 m barrier will
reduce concentrations below 2 m regardless of distance. The upwind building has very small influence on the concentrations.
Vehicle induced turbulence had minor impacts on concentrations behind the barrier. Preliminary results shows that a 2 m high T-formed barrier could be an effective way to reduce concentration as an alternative to increase the height of the barrier.
Introduction
Previous studies based on measurements and model calculations show that the levels can be significantly lower behind noise
barriers placed along busy motorways: 15% - 60% lower levels depending on, for example, the height of the screen and the
distance from the screen. Concentrations at longer distances behind the barrier (distances corresponding to about 20 to 50
times the height of the screen) can be slightly higher compared with without barrier. In this study we use a CFD model to
analyse the impact on the concentrations behind a real-world barrier and importance of parameterisations of vehicle induced turbulence as well as upwind buildings.
Methodology and Results
We have used the CFD software part of MISKAM. Horizontal and vertical grid sizes vary, with the highest resolution set to 0.3 x 0.3 x 0.5 m in the areas surrounding a monitoring station. The calculations were statistically postprocessed using a
climatology with meteorological data from measurements in a 50 m high mast. Yearly mean contribution from road traffic to
concentrations of NOx 1.5-2 m above ground on the side of the noise barrier facing away from the road was higher with a 2
m high noise barrier compared to without a barrier up to approximately 10 m from the barrier. The difference in concentrations was largest approximately 2 m from the barrier, there NOx concentrations were approximately 15 % higher
with a barrier compared to without. At distances longer than 10 m from the barrier approximately 6 % lower concentrations
with barrier than without were calculated. For 4 m high noise barrier yearly mean traffic contribution to NOx concentrations
1.5-2 m above ground were lower with barrier than without regardless of distance from the barrier. The difference was largest approximately 10 m from the barrier, approximately 15 % lower concentration with barrier than without. Concentration on
the road facing side of the barrier was approximately 30 % and 70 % higher compared to directly behind the barrier for a 2 m
and 4m barrier respectively. The parameterisation of vehicle induced turbulence had minor impact on the concentrations
behind barrier. The NOx concentrations were slightly higher with the barrier – 3-4% with 2m when residential buildings upwind of the barrier were included. Preliminary results shows that a 2 m high T-formed barrier could be an effective way to
reduce concentration as an alternative to increase the height of the barrier.
Acknowledgement: This work was supported by the Swedish Transport Administration.
Figure 1. Upper panel: Annual mean NOx concentration contribution from road traffic with 2m high barrier and building (black box) 14 meters from barrier. Lower panel: Difference in between 4 m barrier and 2m barrier. The road has two lanes in each direction and is 17 meters wide. Unit: µg m-3.
92
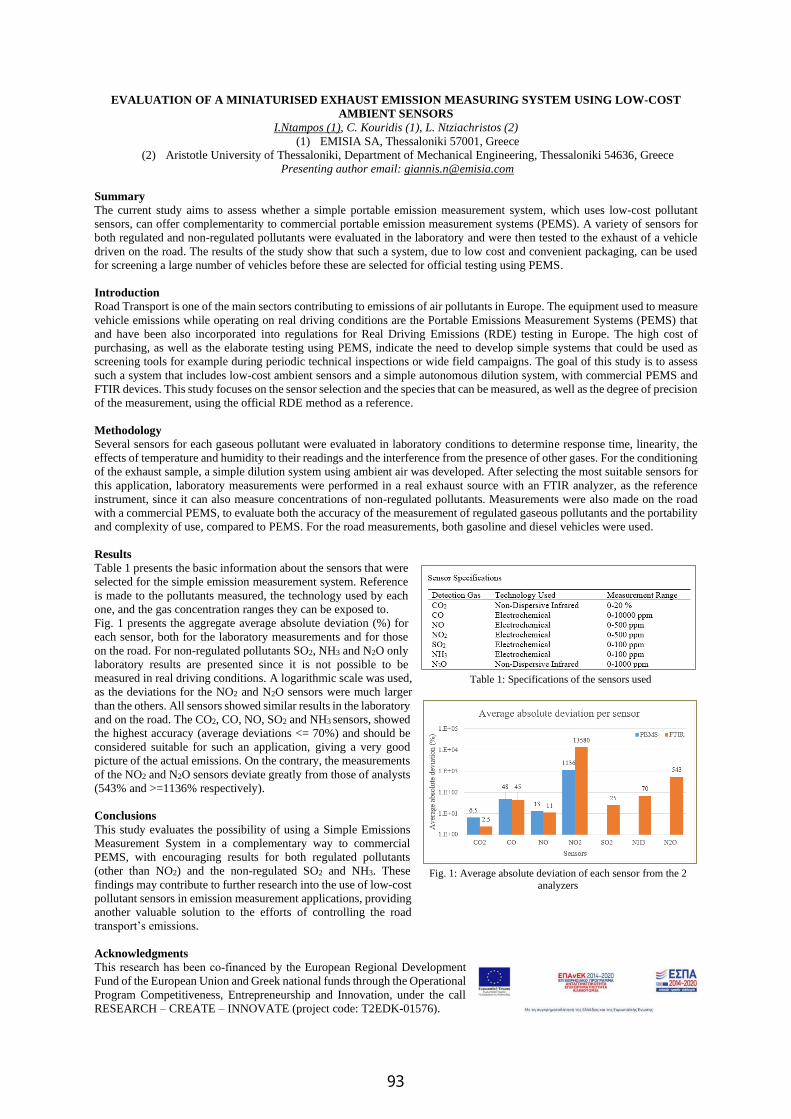
EVALUATION OF A MINIATURISED EXHAUST EMISSION MEASURING SYSTEM USING LOW-COST
AMBIENT SENSORS
I.Ntampos (1), C. Kouridis (1), L. Ntziachristos (2)
(1) EMISIA SA, Thessaloniki 57001, Greece
(2) Aristotle University of Thessaloniki, Department of Mechanical Engineering, Thessaloniki 54636, Greece
Presenting author email: [email protected]
Summary
The current study aims to assess whether a simple portable emission measurement system, which uses low-cost pollutant
sensors, can offer complementarity to commercial portable emission measurement systems (PEMS). A variety of sensors for
both regulated and non-regulated pollutants were evaluated in the laboratory and were then tested to the exhaust of a vehicle
driven on the road. The results of the study show that such a system, due to low cost and convenient packaging, can be used
for screening a large number of vehicles before these are selected for official testing using PEMS.
Introduction
Road Transport is one of the main sectors contributing to emissions of air pollutants in Europe. The equipment used to measure
vehicle emissions while operating on real driving conditions are the Portable Emissions Measurement Systems (PEMS) that
and have been also incorporated into regulations for Real Driving Emissions (RDE) testing in Europe. The high cost of
purchasing, as well as the elaborate testing using PEMS, indicate the need to develop simple systems that could be used as
screening tools for example during periodic technical inspections or wide field campaigns. The goal of this study is to assess
such a system that includes low-cost ambient sensors and a simple autonomous dilution system, with commercial PEMS and
FTIR devices. This study focuses on the sensor selection and the species that can be measured, as well as the degree of precision
of the measurement, using the official RDE method as a reference.
Methodology
Several sensors for each gaseous pollutant were evaluated in laboratory conditions to determine response time, linearity, the
effects of temperature and humidity to their readings and the interference from the presence of other gases. For the conditioning
of the exhaust sample, a simple dilution system using ambient air was developed. After selecting the most suitable sensors for
this application, laboratory measurements were performed in a real exhaust source with an FTIR analyzer, as the reference
instrument, since it can also measure concentrations of non-regulated pollutants. Measurements were also made on the road
with a commercial PEMS, to evaluate both the accuracy of the measurement of regulated gaseous pollutants and the portability
and complexity of use, compared to PEMS. For the road measurements, both gasoline and diesel vehicles were used.
Results
Table 1 presents the basic information about the sensors that were
selected for the simple emission measurement system. Reference
is made to the pollutants measured, the technology used by each
one, and the gas concentration ranges they can be exposed to.
Fig. 1 presents the aggregate average absolute deviation (%) for
each sensor, both for the laboratory measurements and for those
on the road. For non-regulated pollutants SO2, NH3 and N2O only
laboratory results are presented since it is not possible to be
measured in real driving conditions. A logarithmic scale was used,
as the deviations for the NO2 and N2O sensors were much larger
than the others. All sensors showed similar results in the laboratory
and on the road. The CO2, CO, NO, SO2 and NH3 sensors, showed
the highest accuracy (average deviations <= 70%) and should be
considered suitable for such an application, giving a very good
picture of the actual emissions. On the contrary, the measurements
of the NO2 and N2O sensors deviate greatly from those of analysts
(543% and >=1136% respectively).
Conclusions
This study evaluates the possibility of using a Simple Emissions
Measurement System in a complementary way to commercial
PEMS, with encouraging results for both regulated pollutants
(other than NO2) and the non-regulated SO2 and NH3. These
findings may contribute to further research into the use of low-cost
pollutant sensors in emission measurement applications, providing
another valuable solution to the efforts of controlling the road
transport’s emissions.
Acknowledgments
This research has been co‐financed by the European Regional Development
Fund of the European Union and Greek national funds through the Operational
Program Competitiveness, Entrepreneurship and Innovation, under the call
RESEARCH – CREATE – INNOVATE (project code: T2EDK-01576).
Table 1: Specifications of the sensors used
Fig. 1: Average absolute deviation of each sensor from the 2 analyzers
93
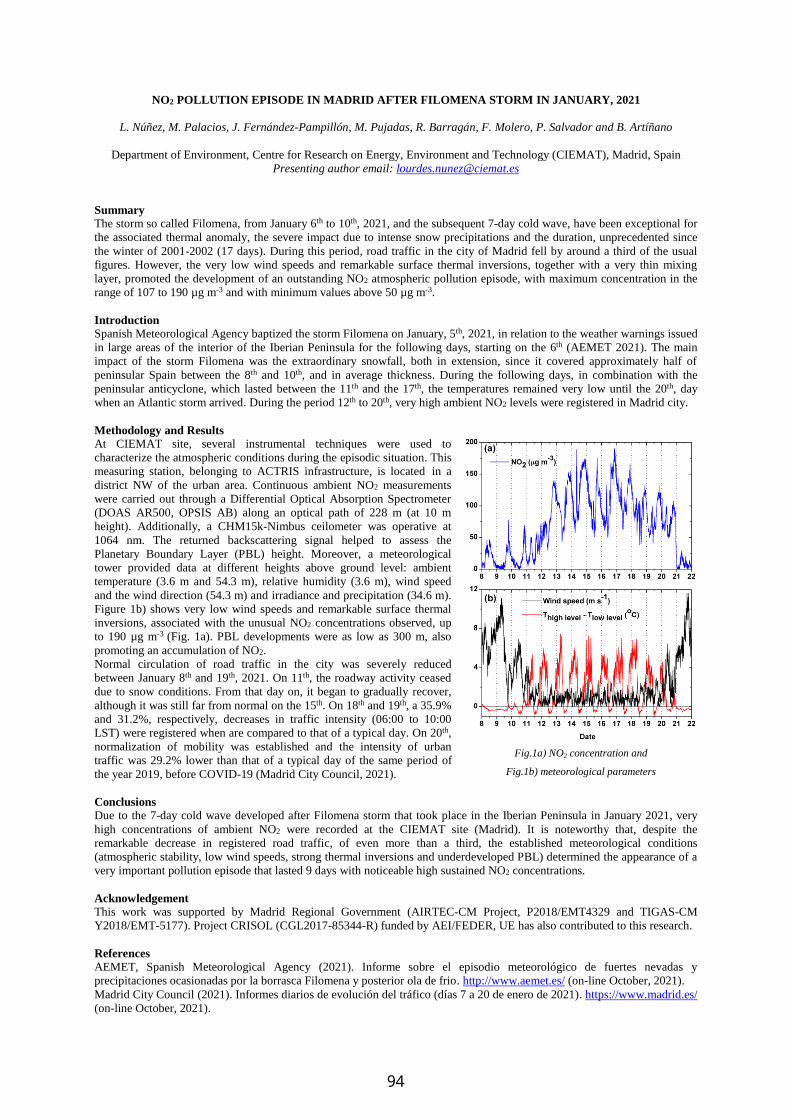
NO2 POLLUTION EPISODE IN MADRID AFTER FILOMENA STORM IN JANUARY, 2021
L. Núñez, M. Palacios, J. Fernández-Pampillón, M. Pujadas, R. Barragán, F. Molero, P. Salvador and B. Artíñano
Department of Environment, Centre for Research on Energy, Environment and Technology (CIEMAT), Madrid, Spain
Presenting author email: [email protected]
Summary
The storm so called Filomena, from January 6th to 10th, 2021, and the subsequent 7-day cold wave, have been exceptional for
the associated thermal anomaly, the severe impact due to intense snow precipitations and the duration, unprecedented since
the winter of 2001-2002 (17 days). During this period, road traffic in the city of Madrid fell by around a third of the usual
figures. However, the very low wind speeds and remarkable surface thermal inversions, together with a very thin mixing
layer, promoted the development of an outstanding NO2 atmospheric pollution episode, with maximum concentration in the
range of 107 to 190 µg m-3 and with minimum values above 50 µg m-3.
Introduction
Spanish Meteorological Agency baptized the storm Filomena on January, 5th, 2021, in relation to the weather warnings issued
in large areas of the interior of the Iberian Peninsula for the following days, starting on the 6th (AEMET 2021). The main
impact of the storm Filomena was the extraordinary snowfall, both in extension, since it covered approximately half of
peninsular Spain between the 8th and 10th, and in average thickness. During the following days, in combination with the
peninsular anticyclone, which lasted between the 11th and the 17th, the temperatures remained very low until the 20th, day
when an Atlantic storm arrived. During the period 12th to 20th, very high ambient NO2 levels were registered in Madrid city.
Methodology and Results
At CIEMAT site, several instrumental techniques were used to
characterize the atmospheric conditions during the episodic situation. This
measuring station, belonging to ACTRIS infrastructure, is located in a
district NW of the urban area. Continuous ambient NO2 measurements
were carried out through a Differential Optical Absorption Spectrometer
(DOAS AR500, OPSIS AB) along an optical path of 228 m (at 10 m
height). Additionally, a CHM15k-Nimbus ceilometer was operative at
1064 nm. The returned backscattering signal helped to assess the
Planetary Boundary Layer (PBL) height. Moreover, a meteorological
tower provided data at different heights above ground level: ambient
temperature (3.6 m and 54.3 m), relative humidity (3.6 m), wind speed
and the wind direction (54.3 m) and irradiance and precipitation (34.6 m).
Figure 1b) shows very low wind speeds and remarkable surface thermal
inversions, associated with the unusual NO2 concentrations observed, up
to 190 µg m-3 (Fig. 1a). PBL developments were as low as 300 m, also
promoting an accumulation of NO2.
Normal circulation of road traffic in the city was severely reduced
between January 8th and 19th, 2021. On 11th, the roadway activity ceased
due to snow conditions. From that day on, it began to gradually recover,
although it was still far from normal on the 15th. On 18th and 19th, a 35.9%
and 31.2%, respectively, decreases in traffic intensity (06:00 to 10:00
LST) were registered when are compared to that of a typical day. On 20th,
normalization of mobility was established and the intensity of urban
traffic was 29.2% lower than that of a typical day of the same period of
the year 2019, before COVID-19 (Madrid City Council, 2021).
Conclusions
Due to the 7-day cold wave developed after Filomena storm that took place in the Iberian Peninsula in January 2021, very
high concentrations of ambient NO2 were recorded at the CIEMAT site (Madrid). It is noteworthy that, despite the
remarkable decrease in registered road traffic, of even more than a third, the established meteorological conditions
(atmospheric stability, low wind speeds, strong thermal inversions and underdeveloped PBL) determined the appearance of a
very important pollution episode that lasted 9 days with noticeable high sustained NO2 concentrations.
Acknowledgement
This work was supported by Madrid Regional Government (AIRTEC-CM Project, P2018/EMT4329 and TIGAS-CM
Y2018/EMT-5177). Project CRISOL (CGL2017-85344-R) funded by AEI/FEDER, UE has also contributed to this research.
References
AEMET, Spanish Meteorological Agency (2021). Informe sobre el episodio meteorológico de fuertes nevadas y
precipitaciones ocasionadas por la borrasca Filomena y posterior ola de frio. http://www.aemet.es/ (on-line October, 2021).
Madrid City Council (2021). Informes diarios de evolución del tráfico (días 7 a 20 de enero de 2021). https://www.madrid.es/
(on-line October, 2021).
Fig.1a) NO2 concentration and
Fig.1b) meteorological parameters
94
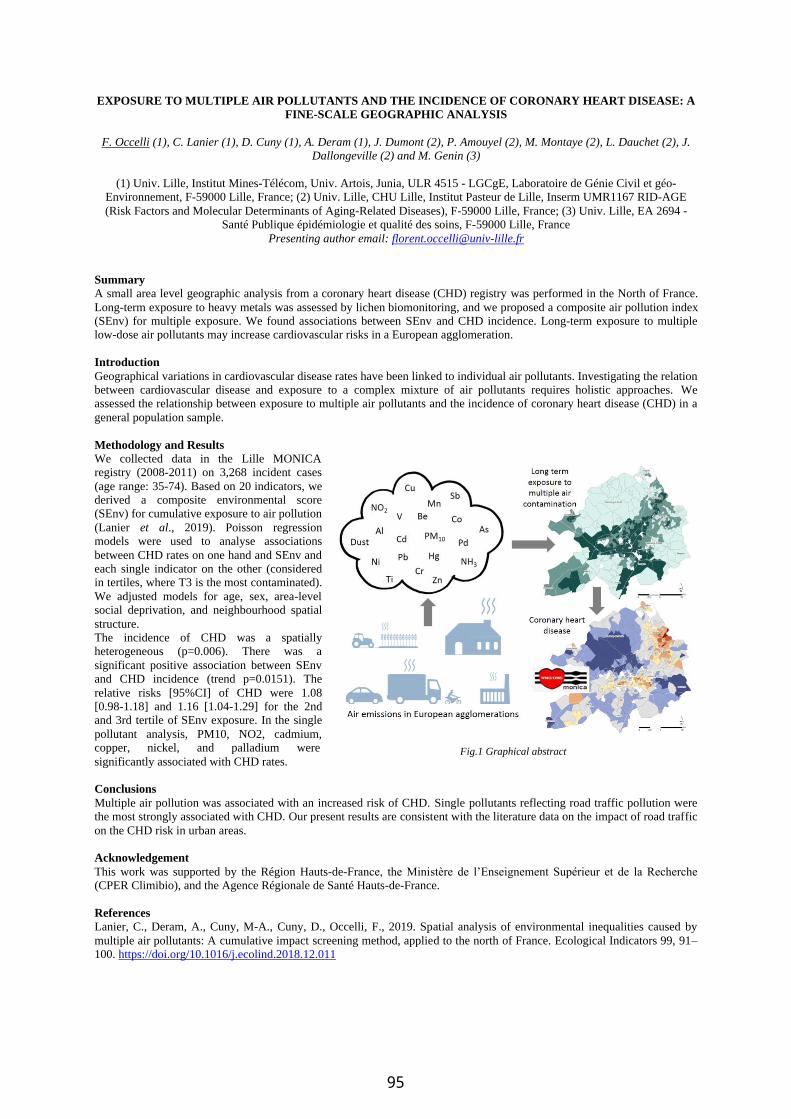
EXPOSURE TO MULTIPLE AIR POLLUTANTS AND THE INCIDENCE OF CORONARY HEART DISEASE: A
FINE-SCALE GEOGRAPHIC ANALYSIS
F. Occelli (1), C. Lanier (1), D. Cuny (1), A. Deram (1), J. Dumont (2), P. Amouyel (2), M. Montaye (2), L. Dauchet (2), J.
Dallongeville (2) and M. Genin (3)
(1) Univ. Lille, Institut Mines-Télécom, Univ. Artois, Junia, ULR 4515 - LGCgE, Laboratoire de Génie Civil et géo-
Environnement, F-59000 Lille, France; (2) Univ. Lille, CHU Lille, Institut Pasteur de Lille, Inserm UMR1167 RID-AGE
(Risk Factors and Molecular Determinants of Aging-Related Diseases), F-59000 Lille, France; (3) Univ. Lille, EA 2694 -
Santé Publique épidémiologie et qualité des soins, F-59000 Lille, France
Presenting author email: [email protected]
Summary
A small area level geographic analysis from a coronary heart disease (CHD) registry was performed in the North of France.
Long-term exposure to heavy metals was assessed by lichen biomonitoring, and we proposed a composite air pollution index
(SEnv) for multiple exposure. We found associations between SEnv and CHD incidence. Long-term exposure to multiple
low-dose air pollutants may increase cardiovascular risks in a European agglomeration.
Introduction
Geographical variations in cardiovascular disease rates have been linked to individual air pollutants. Investigating the relation
between cardiovascular disease and exposure to a complex mixture of air pollutants requires holistic approaches. We
assessed the relationship between exposure to multiple air pollutants and the incidence of coronary heart disease (CHD) in a
general population sample.
Methodology and Results
We collected data in the Lille MONICA
registry (2008-2011) on 3,268 incident cases
(age range: 35-74). Based on 20 indicators, we
derived a composite environmental score
(SEnv) for cumulative exposure to air pollution
(Lanier et al., 2019). Poisson regression
models were used to analyse associations
between CHD rates on one hand and SEnv and
each single indicator on the other (considered
in tertiles, where T3 is the most contaminated).
We adjusted models for age, sex, area-level
social deprivation, and neighbourhood spatial
structure.
The incidence of CHD was a spatially
heterogeneous (p=0.006). There was a
significant positive association between SEnv
and CHD incidence (trend p=0.0151). The
relative risks [95%CI] of CHD were 1.08
[0.98-1.18] and 1.16 [1.04-1.29] for the 2nd
and 3rd tertile of SEnv exposure. In the single
pollutant analysis, PM10, NO2, cadmium,
copper, nickel, and palladium were
significantly associated with CHD rates.
Conclusions
Multiple air pollution was associated with an increased risk of CHD. Single pollutants reflecting road traffic pollution were
the most strongly associated with CHD. Our present results are consistent with the literature data on the impact of road traffic
on the CHD risk in urban areas.
Acknowledgement
This work was supported by the Région Hauts-de-France, the Ministère de l’Enseignement Supérieur et de la Recherche
(CPER Climibio), and the Agence Régionale de Santé Hauts-de-France.
References
Lanier, C., Deram, A., Cuny, M-A., Cuny, D., Occelli, F., 2019. Spatial analysis of environmental inequalities caused by
multiple air pollutants: A cumulative impact screening method, applied to the north of France. Ecological Indicators 99, 91–
100. https://doi.org/10.1016/j.ecolind.2018.12.011
Fig.1 Graphical abstract
95
NANOOFFICE – NANOPARTICLES IN NEW AND RENOVATED OFFICE BUILDINGS
H. Orru (1, 2), A. Hagenbjörk (1), H. Olstrup (2)
(1) Department of Public Health and Clinical Medicine, Umea University, Umea, SE-901 87, Sweden; (2) Institute of Family
Medicine and Public Health, Faculty of Medicine, University of Tartu, Ravila 19, 50411 Tartu, Estonia
Presenting author email: [email protected]
Summary
The smallest particles are believed to have the highest toxicity. Nanoparticles or ultrafine particles (often defined as <100 nm)
can easily enter our circulatory system. Due to their small size, nanoparticles penetrate from outdoors to indoors, but there are
also additional indoor sources. As people spend up to 90% of the time indoors, the indoor exposure plays a major role in the
total exposure. During our measurement in Umea in north of Sweden, we could see very large temporal and spatial differences.
During daytime, the particle number concentrations often exceeded 100,000 per cm3, whereas during night-time less than 100
particles per cm3 were present. The levels were highest in the offices close to a bus terminal and lowest in the offices near a
park. We could also see the effects of ventilation system and new building phenomena.
Introduction
More and more people work in offices with complicated ventilation and heating systems. Sometimes, people feel uncomfortable
or sick in a certain building and one possible reason can be exposure to nanoparticles (<100 nm). Nanoparticles can be
penetrated either from outdoors or emitted by heating and ventilation systems, by office equipment and from materials and
chemicals. The aim of the current study was to determine the levels and characteristics of nanoparticles in office environments.
Another aim was to establish potential links between outdoor and indoor particle levels, the characteristics of the buildings and
the impact of the ventilation systems.
Methodology
The concentrations of nanoparticles (10-500 nm) were measured with 5-min time resolution in twelve office buildings in Umeå
for one week during the heating season and for one week during the non-heating season. The measurement technique SMPS
3938 was used for indoor measurements and DiscMini was used for outdoor measurements. Indoor temperature, humidity, CO2
levels and ventilation air flows were measured with AMI310.
Results Measurements showed very large differences in nanoparticle number concentrations, varying from just a few particles per cm3
to more than 100,000 per cm3. The levels were highest in offices close to a bus terminal and lowest in offices near a park. Also,
a very strong temporal effect appeared as levels were highest during the day (often 50,000-100,000 particles per cm3), whereas
less than 100 nanoparticles per cm3 were present during the night.
A high infiltration rate of outdoor nanoparticles into the indoor air appeared as simultaneous measurements of nanoparticles
indoors and outdoors generally differed by less than 20% in the buildings located near heavily trafficked roads. The reason for
very high infiltration rate could be the very small size of the particles (average diameter around 20 nm among outdoor particles).
However, the correlations between indoor and outdoor particle number concentrations were in general low. Pearson correlation
coefficients were in general <0.4 (max 0.89, min -0.15), and usually, there were differences between the correlations during
the heating and the non-heating season. We could also see effects of particle growth as indoor particles were on average around
two times larger in comparison with the particles measured outdoors.
The effect of ventilations systems appeared as well. The levels of nanoparticles were relatively lower in energy efficient offices
with modern ventilation where the air flow was regulated with sensors. Our measurements also showed relatively lower air
flow in these buildings compared to the buildings with older ventilation systems. We could also see very large indoor emissions
of nanoparticles in a new office building (opened one month before our measurements campaign), but three months later the
levels were decreased by 50%. In a newly built office, we could also see the cleaning effect of the ventilation.
Conclusions
High levels of nanoparticles appeared, especially during daytime in offices close to traffic. Infiltration of outdoor particles
contributed to the high levels measured indoors. The ventilation flow could lead to both an increase and a decrease in the
nanoparticle levels depending on whether outdoor sources or indoor sources were the main source.
Acknowledgement
This work was supported by FORMAS grant 2015-01557 “NanoOffice – Nanoparticles in new and renovated office buildings”.
96

EVALUATION OF THE PERFORMANCE OF DIFFERENT INDOOR AIR QUALITY PREDICTIVE MODELS
USING DATASETS FROM A SMART HOME
Hamid Omidvarborna and Prashant Kumar
Global Centre for Clean Air Research (GCARE), Department of Civil and Environmental Engineering,
Faculty of Engineering and Physical Sciences, University of Surrey, Guildford GU2 7XH, United Kingdom.
Presenting author email: [email protected]
Summary
This study aims to evaluate the performance of different regression models on predicting and forecasting indoor air quality
(IAQ) inside smart homes, where IAQ is controlled by low-cost sensors (LCSs). To do this, the LCSs first have to be evaluated
for their performance, e.g. inside the Envilution® Chamber (Omidvarborna et al., 2020), and later a series of quality control
(QC) and quality assurance (QA) steps must be followed before introducing the dataset to the models (Omidvarborna et al.,
2021). Here, we evaluated different models, including Linear Discriminant Analysis (LDA), Classification and Regression
Trees (CART), k-Nearest Neighbours (kNN), Support Vector Machines (SVM), Random Forest (RF), and Artificial Neural
Network (ANN) using a dataset from a smart home to understand, which one would result in a better prediction performance
with respect to PM2.5, as the indoor representative pollutant. The finalised models will be improved and optimised for a real
situation inside a smart home, where the IAQ dataset is collected from a network of LCSs.
Introduction
The rapid developments of air quality LCSs in homes open up the great potential to ensure living comfort and health for
residents (Schieweck et al., 2018). However, the amount of generated data by these units requires proper data handling and
processing (Kumar et al., 2015). This is important as the processed data has to be reliable for reporting to the smart home
inhabitants and later feeding into prediction models. Deep learning has made substantial contributions to prediction and
forecasting IAQ (Omidvarborna et al., 2020 and 2021). The literature review resulted in several Machine Learning (ML)
methods with different capabilities (see Fig. 1). Here, we applied six algorithms to predict PM2.5 of a smart home prototype
building, which was built in 2020/21 at the Innovation Centre, University of Surrey, Guildford, UK.
Methodology
In this study, several indoor parameters (7 hours at 1-
min time frequency), including temperature, relative
humidity (RH), particulate matter (PM) in different
size fractions (PM1, PM2.5, and PM10), carbon dioxide
(CO2), and total volatile organic compounds (TVOC),
and occupancy information were used to build the
regression models. The collected data were initially
processed for a series of QC/QA steps, including out
of spec, outlier and anomaly detection and later fed
into the prediction models (Omidvarborna et al.,
2021). During the model development, 70% of the
data were used for training and the remaining 30% were used for testing/validation. The performance of models was evaluated
using mean absolute error (MAE), root-mean-square error (RMSE), and the coefficient of determination (R2) metrics.
Results
The comparison against six regression models (Fig. 1) revealed better performance for RF, SVM, and ANN as compared to
other models. The MAE, RMSE, and R2 values of the top three regression models were within 0.27-0.30, 0.37-0.42 (μg m-3),
and 0.85-0.89, respectively. This study shows that advanced ML models are quite capable of predicting indoor PM2.5. The
results can be improved by considering multiple LCSs and ambient air quality. Further model development and improvement
will be applied to the selected algorithms before adopting them in the smart home prototype at the University of Surrey.
Conclusions
The study showed that it is possible to develop a relatively accurate indoor predictive model for well-mixed air in smart homes
using the indoor-related variables as model input. Such advanced ML methods could provide the residents’ insight into the IAQ
and prohibit long-term exposure to indoor air pollutants that result in appreciable health benefits to the residents.
Acknowledgement
This work was supported by an Innovate UK funded project ‘MyGlobalHome’ prototype project and the pilot demonstrator
under the Technology Strategy Board File References: 104782 and 106168, respectively.
References
Kumar, P., et al., 2015. The rise of low-cost sensing for managing air pollution in cities. Environ. Int. 75, 199-205.
Omidvarborna, H., Kumar, P. and Tiwari, A., 2020. ‘Envilution™’ chamber for performance evaluation of low-cost sensors.
Atmos. Environ. 223, 117264.
Omidvarborna, H., Kumar, P., et al., 2021. Low-Cost Air Quality Sensing towards Smart Homes. Atmosphere, 12, 453.
Schieweck, A., Uhde, E., Salthammer, T., Salthammer, L.C., Morawska, L., Mazaheri, M. and Kumar, P., 2018. Smart homes
and the control of indoor air quality. Renew. Sust. Energ. Rev. 94, 705-718.
Fig. 1. Prediction of PM2.5 inside a smart home using six regression models.
97
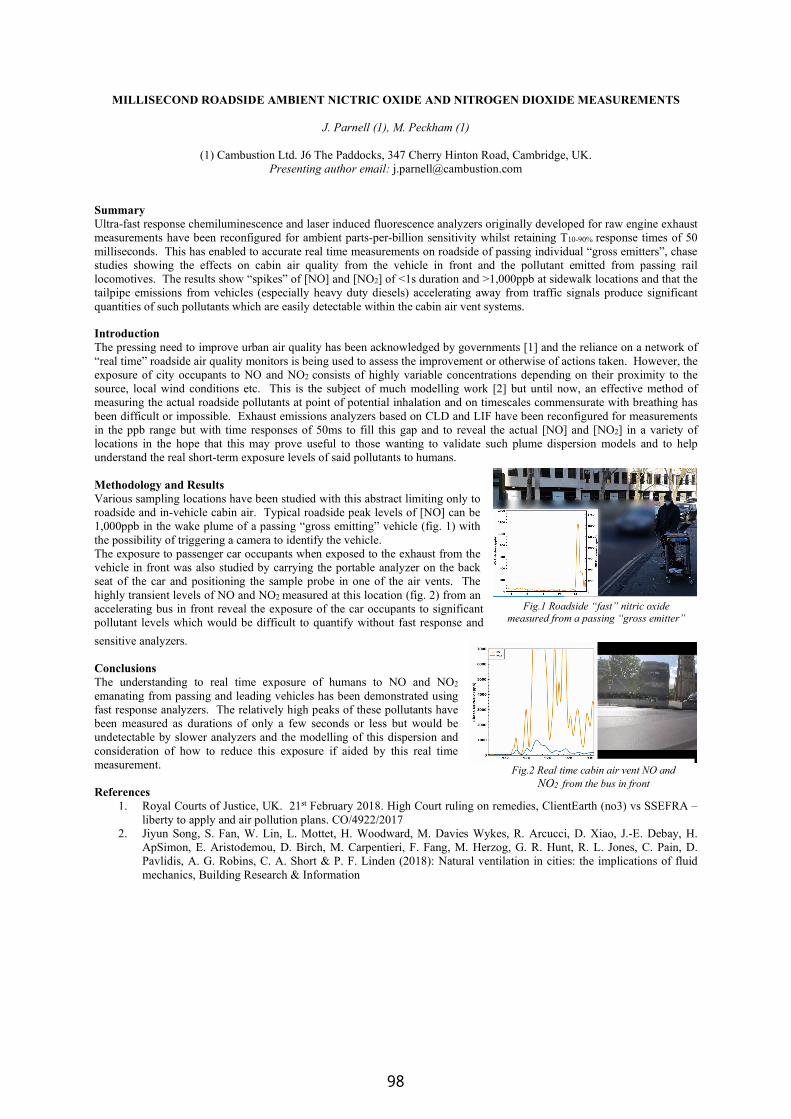
MILLISECOND ROADSIDE AMBIENT NICTRIC OXIDE AND NITROGEN DIOXIDE MEASUREMENTS
J. Parnell (1), M. Peckham (1)
(1) Cambustion Ltd. J6 The Paddocks, 347 Cherry Hinton Road, Cambridge, UK. Presenting author email: [email protected]
Summary Ultra-fast response chemiluminescence and laser induced fluorescence analyzers originally developed for raw engine exhaust measurements have been reconfigured for ambient parts-per-billion sensitivity whilst retaining T10-90% response times of 50 milliseconds. This has enabled to accurate real time measurements on roadside of passing individual “gross emitters”, chase studies showing the effects on cabin air quality from the vehicle in front and the pollutant emitted from passing rail locomotives. The results show “spikes” of [NO] and [NO2] of <1s duration and >1,000ppb at sidewalk locations and that the tailpipe emissions from vehicles (especially heavy duty diesels) accelerating away from traffic signals produce significant quantities of such pollutants which are easily detectable within the cabin air vent systems.
Introduction The pressing need to improve urban air quality has been acknowledged by governments [1] and the reliance on a network of “real time” roadside air quality monitors is being used to assess the improvement or otherwise of actions taken. However, the exposure of city occupants to NO and NO2 consists of highly variable concentrations depending on their proximity to the source, local wind conditions etc. This is the subject of much modelling work [2] but until now, an effective method of measuring the actual roadside pollutants at point of potential inhalation and on timescales commensurate with breathing has been difficult or impossible. Exhaust emissions analyzers based on CLD and LIF have been reconfigured for measurements in the ppb range but with time responses of 50ms to fill this gap and to reveal the actual [NO] and [NO2] in a variety of locations in the hope that this may prove useful to those wanting to validate such plume dispersion models and to help understand the real short-term exposure levels of said pollutants to humans. Methodology and Results Various sampling locations have been studied with this abstract limiting only to roadside and in-vehicle cabin air. Typical roadside peak levels of [NO] can be 1,000ppb in the wake plume of a passing “gross emitting” vehicle (fig. 1) with the possibility of triggering a camera to identify the vehicle. The exposure to passenger car occupants when exposed to the exhaust from the vehicle in front was also studied by carrying the portable analyzer on the back seat of the car and positioning the sample probe in one of the air vents. The highly transient levels of NO and NO2 measured at this location (fig. 2) from an accelerating bus in front reveal the exposure of the car occupants to significant pollutant levels which would be difficult to quantify without fast response and
sensitive analyzers. Conclusions The understanding to real time exposure of humans to NO and NO2
emanating from passing and leading vehicles has been demonstrated using fast response analyzers. The relatively high peaks of these pollutants have been measured as durations of only a few seconds or less but would be undetectable by slower analyzers and the modelling of this dispersion and consideration of how to reduce this exposure if aided by this real time measurement. References
1. Royal Courts of Justice, UK. 21st February 2018. High Court ruling on remedies, ClientEarth (no3) vs SSEFRA – liberty to apply and air pollution plans. CO/4922/2017
2. Jiyun Song, S. Fan, W. Lin, L. Mottet, H. Woodward, M. Davies Wykes, R. Arcucci, D. Xiao, J.-E. Debay, H. ApSimon, E. Aristodemou, D. Birch, M. Carpentieri, F. Fang, M. Herzog, G. R. Hunt, R. L. Jones, C. Pain, D. Pavlidis, A. G. Robins, C. A. Short & P. F. Linden (2018): Natural ventilation in cities: the implications of fluid mechanics, Building Research & Information
Fig.1 Roadside “fast” nitric oxide measured from a passing “gross emitter”
Fig.2 Real time cabin air vent NO and NO2 from the bus in front
98
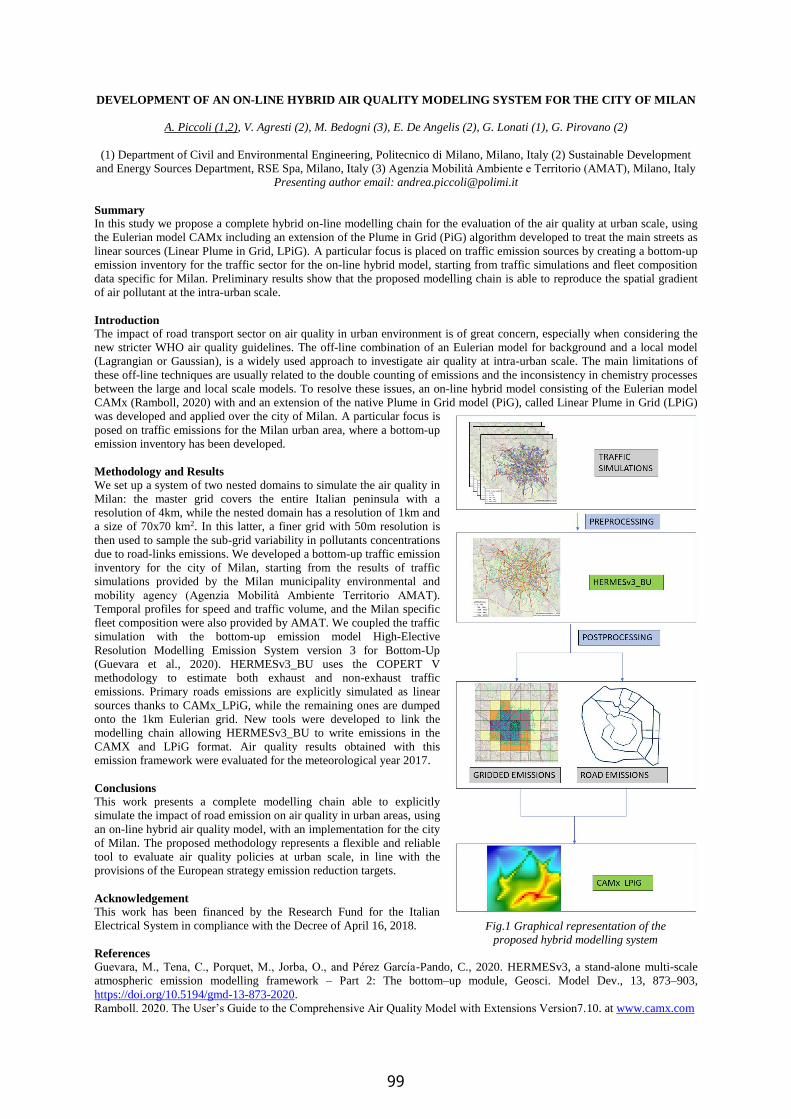
DEVELOPMENT OF AN ON-LINE HYBRID AIR QUALITY MODELING SYSTEM FOR THE CITY OF MILAN
A. Piccoli (1,2), V. Agresti (2), M. Bedogni (3), E. De Angelis (2), G. Lonati (1), G. Pirovano (2)
(1) Department of Civil and Environmental Engineering, Politecnico di Milano, Milano, Italy (2) Sustainable Development
and Energy Sources Department, RSE Spa, Milano, Italy (3) Agenzia Mobilità Ambiente e Territorio (AMAT), Milano, Italy
Presenting author email: [email protected]
Summary
In this study we propose a complete hybrid on-line modelling chain for the evaluation of the air quality at urban scale, using
the Eulerian model CAMx including an extension of the Plume in Grid (PiG) algorithm developed to treat the main streets as
linear sources (Linear Plume in Grid, LPiG). A particular focus is placed on traffic emission sources by creating a bottom-up
emission inventory for the traffic sector for the on-line hybrid model, starting from traffic simulations and fleet composition
data specific for Milan. Preliminary results show that the proposed modelling chain is able to reproduce the spatial gradient
of air pollutant at the intra-urban scale.
Introduction
The impact of road transport sector on air quality in urban environment is of great concern, especially when considering the
new stricter WHO air quality guidelines. The off-line combination of an Eulerian model for background and a local model
(Lagrangian or Gaussian), is a widely used approach to investigate air quality at intra-urban scale. The main limitations of
these off-line techniques are usually related to the double counting of emissions and the inconsistency in chemistry processes
between the large and local scale models. To resolve these issues, an on-line hybrid model consisting of the Eulerian model
CAMx (Ramboll, 2020) with and an extension of the native Plume in Grid model (PiG), called Linear Plume in Grid (LPiG)
was developed and applied over the city of Milan. A particular focus is
posed on traffic emissions for the Milan urban area, where a bottom-up
emission inventory has been developed.
Methodology and Results
We set up a system of two nested domains to simulate the air quality in
Milan: the master grid covers the entire Italian peninsula with a
resolution of 4km, while the nested domain has a resolution of 1km and
a size of 70x70 km2. In this latter, a finer grid with 50m resolution is
then used to sample the sub-grid variability in pollutants concentrations
due to road-links emissions. We developed a bottom-up traffic emission
inventory for the city of Milan, starting from the results of traffic
simulations provided by the Milan municipality environmental and
mobility agency (Agenzia Mobilità Ambiente Territorio AMAT).
Temporal profiles for speed and traffic volume, and the Milan specific
fleet composition were also provided by AMAT. We coupled the traffic
simulation with the bottom-up emission model High-Elective
Resolution Modelling Emission System version 3 for Bottom-Up
(Guevara et al., 2020). HERMESv3_BU uses the COPERT V
methodology to estimate both exhaust and non-exhaust traffic
emissions. Primary roads emissions are explicitly simulated as linear
sources thanks to CAMx_LPiG, while the remaining ones are dumped
onto the 1km Eulerian grid. New tools were developed to link the
modelling chain allowing HERMESv3_BU to write emissions in the
CAMX and LPiG format. Air quality results obtained with this
emission framework were evaluated for the meteorological year 2017.
Conclusions
This work presents a complete modelling chain able to explicitly
simulate the impact of road emission on air quality in urban areas, using
an on-line hybrid air quality model, with an implementation for the city
of Milan. The proposed methodology represents a flexible and reliable
tool to evaluate air quality policies at urban scale, in line with the
provisions of the European strategy emission reduction targets.
Acknowledgement
This work has been financed by the Research Fund for the Italian
Electrical System in compliance with the Decree of April 16, 2018.
References
Guevara, M., Tena, C., Porquet, M., Jorba, O., and Pérez García-Pando, C., 2020. HERMESv3, a stand-alone multi-scale
atmospheric emission modelling framework – Part 2: The bottom–up module, Geosci. Model Dev., 13, 873–903,
https://doi.org/10.5194/gmd-13-873-2020.
Ramboll. 2020. The User’s Guide to the Comprehensive Air Quality Model with Extensions Version7.10. at www.camx.com
Fig.1 Graphical representation of the
proposed hybrid modelling system
99

A NEW CLOUD-BASED SERVICE FOR URBAN AIR QUALITY FORECAST
N.Pina (1), J.Verdasca (1), L.Coimbra (1), R. Vitorino(1)
(1) Ubiwhere, lda., Travessa Senhor das Barrocas, 38, Aveiro, 3800–075, Portugal
Presenting author email: [email protected]
Summary
This study aims to develop an innovative cloud-based service for air quality estimation and forecast at a high spatial resolution.
The service, named ATMO-4CAST, has been designed under the H2020 project NEANIAS. This service presents a modelling
system for air quality simulation, consisting of weather, emissions and air quality models. This service is developed for the
web, where a user may run a simulation and download and visualise the outputs through a standard web browser, thus
simplifying the onboarding process of researchers. These efforts showcase the importance of promoting Open Science practices
and playing an active role in materialising the European Open Science Cloud (EOSC) ecosystem.
Introduction
Air pollution is currently the most important environmental risk to human health (EEA, 2019), especially in urban areas, where,
according to the UN, most of the population lives. Local air quality monitoring stations may give information on pollutant
concentration in specific monitored areas, although being usually insufficient to provide comprehensive information on their
spatial distribution over an urban area. Therefore, it is crucial to develop and implement air quality modelling systems that
report it. Considering this, the H2020 NEANIAS project developed the ATMO-4CAST service, which aims to deliver a novel
cloud-based solution that provides both weather and air quality estimations and forecasts.
Methodology and Results
The focus of NEANIAS is to materialise the European Open Science Cloud (EOSC) and deliver services that help the research
community. The task of air quality modelling requires a series of modelling steps, which demand a vast effort from the
researchers. In this sense, the ATMO-4CAST service presents the air quality modelling chain at the local/urban scale as a
system that integrates emission modelling, meteorology and background concentration data. Having the AUSTAL2000 model
at its core, to simulate the dispersion of pollutants at a local scale, the system also integrates background concentrations from
the regional forecasts from the Copernicus Atmosphere Monitoring Service (CAMS), to comply with state-of-the-art
technology. Moreover, the service enables users to process emission modelling due to traffic contribution, one of the main
urban sources, with the user being able to provide other urban sources contributions and complex terrain data as inputs for the
AUSTAL2000 model. Furthermore, the outputs from the weather forecast (based on the Weather Research and Forecasting
model) are processed as AUSTAL2000 inputs. Finally, the service enables users to map atmospheric pollutants concentration
at local/urban levels by automatically generating the mapping results in the cloud-based service.
Fig.1 ATMO-4CAST air quality modelling system structure (input files displayed in yellow).
Conclusions
As air quality remains an issue that composes a human health risk, especially in urban areas, the study of air quality at the
urban/local levels is crucial. Moreover, the next generation of models will be cloud-based, providing this service with an utter
value by enabling a user to quickly run a forecast for weather, emission or air quality and reducing the learning curve for the
research community. Furthermore, it was designed to reduce the cost and time invested on technology instantiation and
simulations execution, to play an important role in research and promote knowledge sharing through open and fair access.
Acknowledgement
This work was supported by the H2020 project NEANIAS (H2020-INFRAEOSC-2018-2020) and Ubiwhere.lda company.
References
EEA (European Environment Agency), 2019. Air quality in Europe — 2019 report. EEA Report No 10/2019.
UN Sustainable Development Goal 11: Make cities inclusive, safe, resilient and sustainable
https://www.un.org/sustainabledevelopment/cities/
100
2011-2020 URBAN AND REGIONAL BACKGROUND NH3 TRENDS IN NE SPAIN
C. Reche (1), N. Pérez (1), A. Alastuey (1), N. Cots (2), E. Pérez (2), X. Querol (1)
(1) Institute of Environmental Assessment and Water Research (IDAEA-CSIC), Barcelona, Spain; (2) Departament de
Territori i Sostenibilitat, Generalitat de Catalunya, Barcelona, Spain.
Presenting author email: [email protected]
Summary
NE Spain has been pointed by ESA and NASA NH3 hotspots by using remote sensing. NH3 levels might have very large effects on PM2.5 by favouring the formation of secondary inorganic PM. This study aims to evaluate concentrations of NH3 from simultaneous 2011 to 2020 urban and regional background in NE Spain. To this end passive dosimeters were used to continuously measure concentrations on a week basis during the study period. Shorter measurements were carried also in a traffic site for comparison. The highest NH3 concentrations were recorded at the traffic site (5.3 µg/m3 on average), followed by those measured at the urban background site (2.1 µg/m3). Mean concentrations at the regional background site in the pre-Pyrenees reached 1.6 µg/m3, while the lowest concentrations (0.9 µg/m3) reached in a regional background site 40 km N of
Barcelona. This comparison points at traffic emissions as a remarkable source of NH3. A statistically significant time trend of this pollutant was observed at the urban background site, increasing by 9.4 % per year. Levels in one of the regional background site followed also a summer increasing trend, while stable annual and seasonal concentrations were evidenced for the other regional background site. Introduction
NE Spain has been pointed by ESA and NASA NH3 hotspots by using remote sensing (Van Damme et al., 2018). NH3 levels might have very large effects on PM2.5 by favouring the formation of secondary inorganic PM. IN the Spanish Royal decree
102/2011 it was suggested to measure urban NH3 at traffic sites to evaluate the NH3 trends to follow up the possible effect of the introduction of SCR-deNOx systems in diesel vehicles. This study aims to evaluate concentrations of NH3 from simultaneous 2011 to 2020 urban and regional background in NE Spain. Methodology and Results
Passive samplers (ALPHA) were employed for measurements of atmospheric NH3 in an urban background site and a traffic site of Barcelona (UB and TR) and two regional background monitoring sites, Montseny (MSY, 40 km n Barcelona) and Montsec (MSC, in the pre-Pyrenees, NW Barcelona), between 2011 and 2020 (including COVID-19 scenario), except at the
TR site, where measurements were performed from 2014 to 2018. The highest NH3 concentrations were recorded at TR site (5.3 µg/m3 on average), followed by those measured at the UB (2.1 µg/m3). Mean concentrations at the regional background site in the pre-Pyrenees (MSC, just into the NH3 hotspot evidenced by remote sensing) reached 1.6 µg/m3, while the lowest concentrations (0.9 µg/m3) reached in a regional background MSY site 40 km N of Barcelona. This comparison points at traffic emissions as a remarkable source of NH3. A statistically significant time trend of this pollutant was observed at the urban background site, increasing by 9.4 % per year. A season-separated analysis also revealed a significant increasing trend at the MSC regional background site during summer periods, probably related with increasing emissions from agricultural/livestock activities, from which the evidenced NH3 is
supposed to be derived. These increases in NH3 concentrations were hypothesized to be responsible for the lack of a decreasing trend of NO3
- concentrations at the monitoring sites, in spite of a markedly reduction of NO2 along the period, especially at the UB. Thus, this would in turn affect the effectiveness of current action plans to abate fine aerosols, importantly apportioned by secondary compounds. Actions to reduce NH3 concentrations at urban backgrounds are challenging though, as predicting NH3 is subjected to a high uncertainty and complexity due to the involved mix of factors interfering. This complexity is clearly indicated by the application of a decision tree algorithm to find the parameters better predicting NH3 at the urban background under study. O3, NO, NO2, CO, SO2 and OM+EC concentrations, together with meteorological indicators, were used as independent variables, obtaining no combination of parameters evidently able to predict significant differences in NH3 concentrations.
Conclusions
Ammonia concentrations in NE Spain are stable in the last decade in the regional background, but in specific areas of this regional background, these seem to slightly increase. In the urban background of Barcelona there is a marked increase related with urban emissions, pointing to traffic as a major one. Ammonia emission abatement policies are urgently required in NE Spain, if air quality targets intend to approach the new WHO air quality standard for PM2.5. Acknowledgement
Support was received from the European Union’s Horizon 2020 research and innovation programme under grant agreement 101036245 (RI-URBANS); the “Agencia Estatal de Investigación” from the Spanish Ministry of Science and, Innovation, and FEDER funds under the projects CAIAC (PID2019-108990RB-I00); and the Generalitat de Catalunya (AGAUR 2017 SGR41) and the Direcció General de Territori.
References Van Damme, M., Clarisse, L., Franco, C., Sutton, M.A., et al., 2021. Global, regional and national trends of atmospheric ammonia derived from a decadal (2008-2018) satellite record. Environment Research Letters, 16, 5.
101

URBAN POPULATION EXPOSURE TO AIR POLLUTION UNDER COVID-19 LOCKDOWN CONDITIONS: THE COMBINED EFFECT OF CHANGING EMISSIONS AND POPULATION ACTIVITY PATTERNS
Martin Otto Paul Ramacher (1), Ronny Badeke (1), Markus Quante (1), Josefine Feldner (1), Lea Fink (1), Jan Arndt (1), Ronny Petrik (1), Volker Matthias (1)
(1) Helmholtz-Zentrum Geesthacht, Chemistry Transport Modelling, Max-Planck-Strasse 1, 21502 Geesthacht, Germany
Presenting author email: [email protected] Summary This study aims to quantify the combined effect of changing emissions and population activity in the estimation of urban population during the first COVID19-lockdown measures in the beginning of the year 2020. While most studies focus on the impact of changing emissions in concentration reductions due to lockdown measures, we identified the additional change in population exposure for three different cities in Europe, when taking into account the change in population activity in a dynamic urban population exposure model. The results show that population exposure is underestimated by up to 8% for NO2 and by up to 29% for PM2.5 exposure, when neglecting the change in population activity. Introduction The lockdown response to the coronavirus disease 2019 (COVID-19) has caused an exceptional reduction in global economic and transport activity. Many recent measurement and modelling studies tested the hypothesis that this has reduced ground-level air pollution concentrations as well as the associated population exposure and health effects, especially in urban areas. Although Google and Apple mobility data is utilized in such air quality modelling studies to derive changes in emissions, the mobility data is not used to reflect changes in population activity patterns. Nevertheless, neglecting the mobility of populations in exposure estimates is known to introduce substantial BIAS; especially on urban-scales. Therefore, we identified the additional change in population exposure for three different cities in Europe (Hamburg - DE, Liège - BE, Marseille - FR), when taking into account the change in population activity in a dynamic urban population exposure model. Methodology and Results To model the impact of (1) changing emissions and (2) the change in population activity patterns in our multi-city exposure study, we applied mobility data as derived from different sources (Google, Eurostat, Automatic Identification System, etc.). The aim is to quantify the BIAS in air pollution (PM2.5, NO2) exposure estimates that arises from neglecting population activity under COVID-19 lockdown conditions. We applied the urban-scale chemistry transport model EPISODE-CityChem (Karl et. al 2019) and the urban dynamic exposure model UNDYNE (Ramacher et al. 2020) in the European cities Marseille (FR), Liège (BE) and Hamburg (DE) in the first six months of 2020. Based on flexible microenvironment definitions for different surroundings (based on the Copernicus UrbanAtlas) and modes of transport (based on OpenStreetMap), the UNDYNE model allows for a flexible application of population activity in European urban areas (Fig. 1). This feature was used to evaluate and compare a set of emission and activity scenarios.
Fig.1 Framework to estimate dynamic urban population
exposure.
Conclusions Compared to non-lockdown conditions, the derived lockdown activity profiles showed substantial additional changes in the total exposure of the urban population in all cities with up to 8% for NO2 and by up to 29% for PM2.5. The analysis of estimated exposure in the different microenvironments (Fig. 2) home, work and transport reflects the changes in population activity with increasing exposure in the home environment and decreasing exposure in the work and transport environments. Due to the general high reduction of population exposure in transport activities, a significant change of exposure for different modes of transport was not observed.
Fig.2 Changes in urban population exposure to NO2 for different activity scenarios in the City of Hamburg (blue = no changes in activity, yellow = daily changing activity).
References Karl, M.; Walker, S.-E.; Solberg, S.; Ramacher, M.O.P. The Eulerian urban dispersion model EPISODE—Part 2: Extensions to the source dispersion and photochemistry for EPISODE–CityChem v1.2 and its application to the city of Hamburg. Geosci. Model Dev. 2019, 12, 3357–3399, https://doi.org/10.5194/gmd-12-3357-2019. Ramacher, M.O.P.; Karl, M. Integrating Modes of Transport in a Dynamic Modelling Approach to Evaluate Population Exposure to Ambient NO2 and PM2.5 Pollution in Urban Areas. Int. J. Environ. Res. Public Health 2020, 17, 2099, doi:10.3390/ijerph17062099.
102
DEVELOPING AN OPEN, ACCESSIBLE AND FUTURE-PROOF COMMUNITY EMISSION MODEL
S Reis1, M Brown2, R Claxton3, C Dore3, J Goodwin3, M Hollaway2, T Murrells4, M Pommier4, R Sokhi5 @ the DUKEMS
project team
(1) UK Centre for Ecology & Hydrology, Bush Estate, Penicuik EH26 0QB, United Kingdom (2) UK Centre for Ecology & Hydrology, Library Ave, Bailrigg, Lancaster LA1 4AP, United Kingdom (3) Aether Ltd., Oxford Centre for Innovation, New Road, Oxford OX1 1BY, United Kingdom (4) Ricardo Energy & Environment, The Gemini Building, Fermi Avenue, Harwell, Didcot OX11 0QR, United Kingdom (5) Centre for Atmospheric and Instrumentation Research (CAIR), University of Hertfordshire, Hatfield, Hertfordshire, AL10 9AB, United Kingdom
Presenting author email: [email protected]
Summary Here we describe the rationale and approach for the development of the UK Emission Modelling System (https://www.uk-ems.org.uk/), a community-driven activity to establish an open access, future-proof and scalable tool for generating spatially explicit and temporally resolved emission input data (primarily) for atmospheric chemistry transport modelling. We focus here on the design principles and will present the current state of development and implementation. Introduction Emission data have been recognised as essential for understanding and managing air quality for a long time. Over the decades, the UK’s National Atmospheric Emissions Inventory (NAEI, https://naei.beis.gov.uk/) has been expanded and developed in far greater geographical and sector detail covering a much wider range of pollutants and sources. This has largely been achieved through a combination of far greater abundance of statistical information on source activities from which emissions can be calculated, information collected by operators and regulators in response to permitting and other legislative requirements, atmospheric and source-specific emission measurements, scientific research and greater computational power allowing more complex methodologies to be used to estimate emissions from different sources. The NAEI now covers a multitude of air pollutants and greenhouse gases and covers well over 400 individual sources and is developed to meet statutory reporting obligations to various international bodies following now well-established inventory reporting guidelines. Inventories such as the NAEI are designed for regulatory reporting purposes are constrained by rigid calculation guidelines and rules to ensure their comparability and consistency with national or international agreements. This rigidity limits the utility of such inventories for use as model input data, but does not constitute a shortcoming of the inventory itself, but rather a mismatch in requirements. Methodology and Results Here, we focus on the development and implementation of a flexible, open access, transparent emission modelling system, which is designed to address the following key gaps and issues identified by an expert group comprising UK atmospheric chemistry transport modellers and emission inventory compilers: Ability of modellers to modify data underlying emission calculations (e.g. emission factors, activity data) to generate
consistent scenarios, time series and maps for multiple years. Seamless integration of national (UK) and regional (European, Global), as well as local (e.g. urban) emission datasets
into one consistent set of model input data. Integration of air pollutant and greenhouse gas emissions into one dataset. Transparent and well-documented inclusion of research findings, e.g. on chemical or physical speciation, temporal and
spatial resolution, and identification of emerging pollutants. Integration of biogenic/natural and anthropogenic emissions. In the following sections, we describe the process of eliciting user needs and conceptually developing and building a
first community emission modelling system for the UK. Conclusions While the UK-EMS is still in development, the process of user engagement throughout the development process and the ongoing conversations with funders and stakeholders has been designed to ensure both community support and buy-in, and longer-term legacy enabling the system to be maintained and expanded in the future. Acknowledgement This work is supported by grant DN424761 CR19-3 “UK Emissions Modelling System - Developing a UK Community Emission Modelling System (DUKEMS)” funded by the UK MetOffice under the UK Research and Innovation Strategic Priority Fund on Clean Air.
103
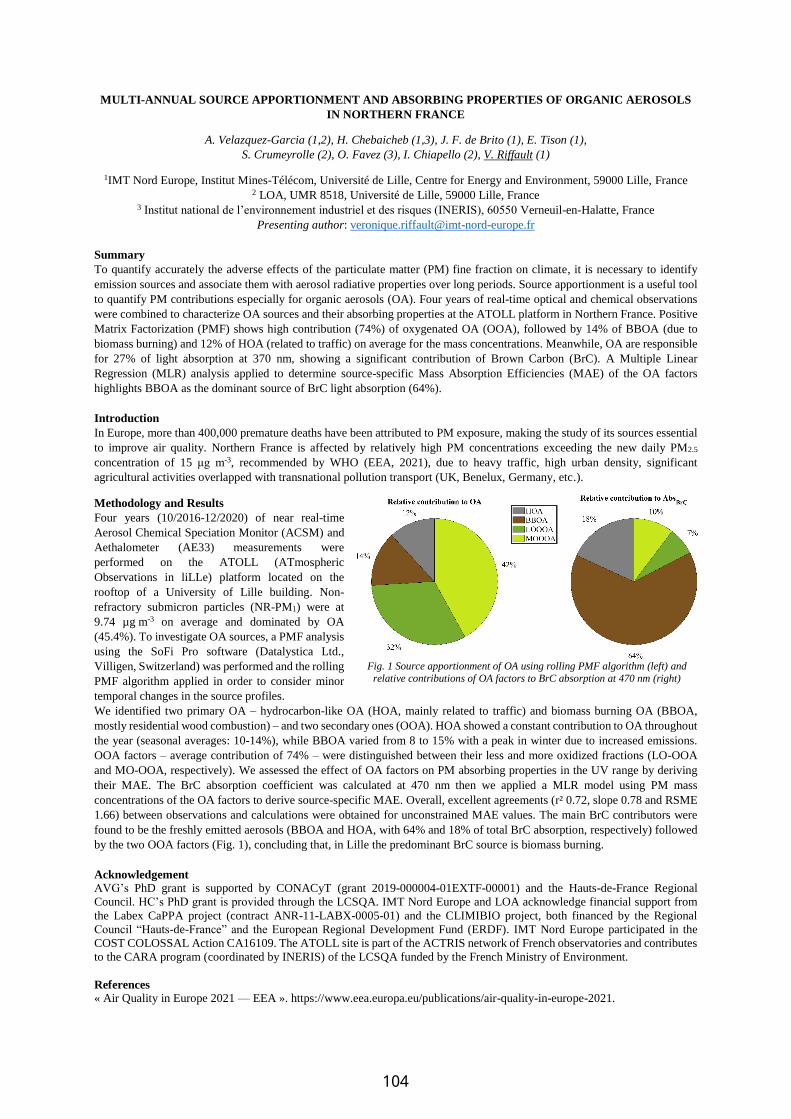
MULTI-ANNUAL SOURCE APPORTIONMENT AND ABSORBING PROPERTIES OF ORGANIC AEROSOLS
IN NORTHERN FRANCE
A. Velazquez-Garcia (1,2), H. Chebaicheb (1,3), J. F. de Brito (1), E. Tison (1),
S. Crumeyrolle (2), O. Favez (3), I. Chiapello (2), V. Riffault (1)
1IMT Nord Europe, Institut Mines-Télécom, Université de Lille, Centre for Energy and Environment, 59000 Lille, France 2 LOA, UMR 8518, Université de Lille, 59000 Lille, France
3 Institut national de l’environnement industriel et des risques (INERIS), 60550 Verneuil-en-Halatte, France
Presenting author: [email protected]
Summary
To quantify accurately the adverse effects of the particulate matter (PM) fine fraction on climate, it is necessary to identify
emission sources and associate them with aerosol radiative properties over long periods. Source apportionment is a useful tool
to quantify PM contributions especially for organic aerosols (OA). Four years of real-time optical and chemical observations
were combined to characterize OA sources and their absorbing properties at the ATOLL platform in Northern France. Positive
Matrix Factorization (PMF) shows high contribution (74%) of oxygenated OA (OOA), followed by 14% of BBOA (due to
biomass burning) and 12% of HOA (related to traffic) on average for the mass concentrations. Meanwhile, OA are responsible
for 27% of light absorption at 370 nm, showing a significant contribution of Brown Carbon (BrC). A Multiple Linear
Regression (MLR) analysis applied to determine source-specific Mass Absorption Efficiencies (MAE) of the OA factors
highlights BBOA as the dominant source of BrC light absorption (64%).
Introduction
In Europe, more than 400,000 premature deaths have been attributed to PM exposure, making the study of its sources essential
to improve air quality. Northern France is affected by relatively high PM concentrations exceeding the new daily PM2.5
concentration of 15 μg m-3, recommended by WHO (EEA, 2021), due to heavy traffic, high urban density, significant
agricultural activities overlapped with transnational pollution transport (UK, Benelux, Germany, etc.).
Methodology and Results
Four years (10/2016-12/2020) of near real-time
Aerosol Chemical Speciation Monitor (ACSM) and
Aethalometer (AE33) measurements were
performed on the ATOLL (ATmospheric
Observations in liLLe) platform located on the
rooftop of a University of Lille building. Non-
refractory submicron particles (NR-PM1) were at
9.74 µg m-3 on average and dominated by OA
(45.4%). To investigate OA sources, a PMF analysis
using the SoFi Pro software (Datalystica Ltd.,
Villigen, Switzerland) was performed and the rolling
PMF algorithm applied in order to consider minor
temporal changes in the source profiles.
We identified two primary OA – hydrocarbon-like OA (HOA, mainly related to traffic) and biomass burning OA (BBOA,
mostly residential wood combustion) – and two secondary ones (OOA). HOA showed a constant contribution to OA throughout
the year (seasonal averages: 10-14%), while BBOA varied from 8 to 15% with a peak in winter due to increased emissions.
OOA factors – average contribution of 74% – were distinguished between their less and more oxidized fractions (LO-OOA
and MO-OOA, respectively). We assessed the effect of OA factors on PM absorbing properties in the UV range by deriving
their MAE. The BrC absorption coefficient was calculated at 470 nm then we applied a MLR model using PM mass
concentrations of the OA factors to derive source-specific MAE. Overall, excellent agreements (r² 0.72, slope 0.78 and RSME
1.66) between observations and calculations were obtained for unconstrained MAE values. The main BrC contributors were
found to be the freshly emitted aerosols (BBOA and HOA, with 64% and 18% of total BrC absorption, respectively) followed
by the two OOA factors (Fig. 1), concluding that, in Lille the predominant BrC source is biomass burning.
Acknowledgement
AVG’s PhD grant is supported by CONACyT (grant 2019-000004-01EXTF-00001) and the Hauts-de-France Regional
Council. HC’s PhD grant is provided through the LCSQA. IMT Nord Europe and LOA acknowledge financial support from
the Labex CaPPA project (contract ANR-11-LABX-0005-01) and the CLIMIBIO project, both financed by the Regional
Council “Hauts-de-France” and the European Regional Development Fund (ERDF). IMT Nord Europe participated in the
COST COLOSSAL Action CA16109. The ATOLL site is part of the ACTRIS network of French observatories and contributes
to the CARA program (coordinated by INERIS) of the LCSQA funded by the French Ministry of Environment.
References
« Air Quality in Europe 2021 — EEA ». https://www.eea.europa.eu/publications/air-quality-in-europe-2021.
Fig. 1 Source apportionment of OA using rolling PMF algorithm (left) and
relative contributions of OA factors to BrC absorption at 470 nm (right)
104
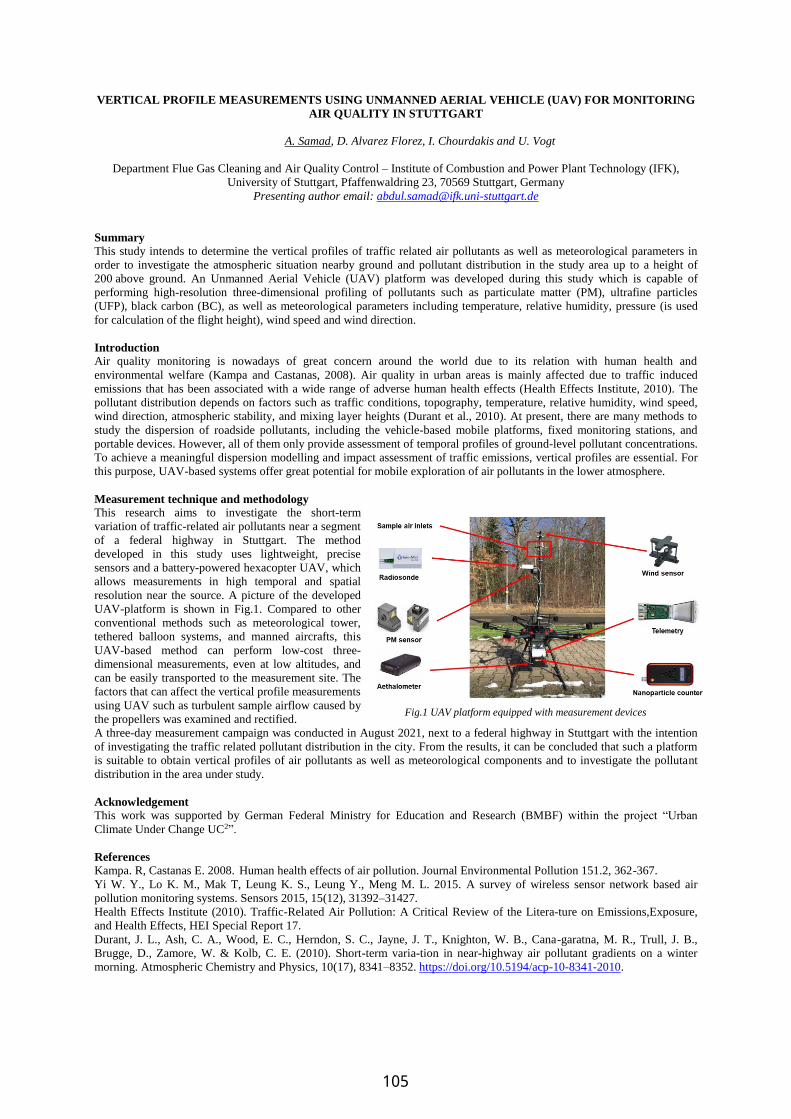
VERTICAL PROFILE MEASUREMENTS USING UNMANNED AERIAL VEHICLE (UAV) FOR MONITORING
AIR QUALITY IN STUTTGART
A. Samad, D. Alvarez Florez, I. Chourdakis and U. Vogt
Department Flue Gas Cleaning and Air Quality Control – Institute of Combustion and Power Plant Technology (IFK),
University of Stuttgart, Pfaffenwaldring 23, 70569 Stuttgart, Germany
Presenting author email: [email protected]
Summary
This study intends to determine the vertical profiles of traffic related air pollutants as well as meteorological parameters in
order to investigate the atmospheric situation nearby ground and pollutant distribution in the study area up to a height of
200 above ground. An Unmanned Aerial Vehicle (UAV) platform was developed during this study which is capable of
performing high-resolution three-dimensional profiling of pollutants such as particulate matter (PM), ultrafine particles
(UFP), black carbon (BC), as well as meteorological parameters including temperature, relative humidity, pressure (is used
for calculation of the flight height), wind speed and wind direction.
Introduction
Air quality monitoring is nowadays of great concern around the world due to its relation with human health and
environmental welfare (Kampa and Castanas, 2008). Air quality in urban areas is mainly affected due to traffic induced
emissions that has been associated with a wide range of adverse human health effects (Health Effects Institute, 2010). The
pollutant distribution depends on factors such as traffic conditions, topography, temperature, relative humidity, wind speed,
wind direction, atmospheric stability, and mixing layer heights (Durant et al., 2010). At present, there are many methods to
study the dispersion of roadside pollutants, including the vehicle-based mobile platforms, fixed monitoring stations, and
portable devices. However, all of them only provide assessment of temporal profiles of ground-level pollutant concentrations.
To achieve a meaningful dispersion modelling and impact assessment of traffic emissions, vertical profiles are essential. For
this purpose, UAV-based systems offer great potential for mobile exploration of air pollutants in the lower atmosphere.
Measurement technique and methodology
This research aims to investigate the short-term
variation of traffic-related air pollutants near a segment
of a federal highway in Stuttgart. The method
developed in this study uses lightweight, precise
sensors and a battery-powered hexacopter UAV, which
allows measurements in high temporal and spatial
resolution near the source. A picture of the developed
UAV-platform is shown in Fig.1. Compared to other
conventional methods such as meteorological tower,
tethered balloon systems, and manned aircrafts, this
UAV-based method can perform low-cost three-
dimensional measurements, even at low altitudes, and
can be easily transported to the measurement site. The
factors that can affect the vertical profile measurements
using UAV such as turbulent sample airflow caused by
the propellers was examined and rectified.
A three-day measurement campaign was conducted in August 2021, next to a federal highway in Stuttgart with the intention
of investigating the traffic related pollutant distribution in the city. From the results, it can be concluded that such a platform
is suitable to obtain vertical profiles of air pollutants as well as meteorological components and to investigate the pollutant
distribution in the area under study.
Acknowledgement
This work was supported by German Federal Ministry for Education and Research (BMBF) within the project “Urban
Climate Under Change UC2”.
References
Kampa. R, Castanas E. 2008. Human health effects of air pollution. Journal Environmental Pollution 151.2, 362-367.
Yi W. Y., Lo K. M., Mak T, Leung K. S., Leung Y., Meng M. L. 2015. A survey of wireless sensor network based air
pollution monitoring systems. Sensors 2015, 15(12), 31392–31427.
Health Effects Institute (2010). Traffic-Related Air Pollution: A Critical Review of the Litera-ture on Emissions,Exposure,
and Health Effects, HEI Special Report 17.
Durant, J. L., Ash, C. A., Wood, E. C., Herndon, S. C., Jayne, J. T., Knighton, W. B., Cana-garatna, M. R., Trull, J. B.,
Brugge, D., Zamore, W. & Kolb, C. E. (2010). Short-term varia-tion in near-highway air pollutant gradients on a winter
morning. Atmospheric Chemistry and Physics, 10(17), 8341–8352. https://doi.org/10.5194/acp-10-8341-2010.
Fig.1 UAV platform equipped with measurement devices
105
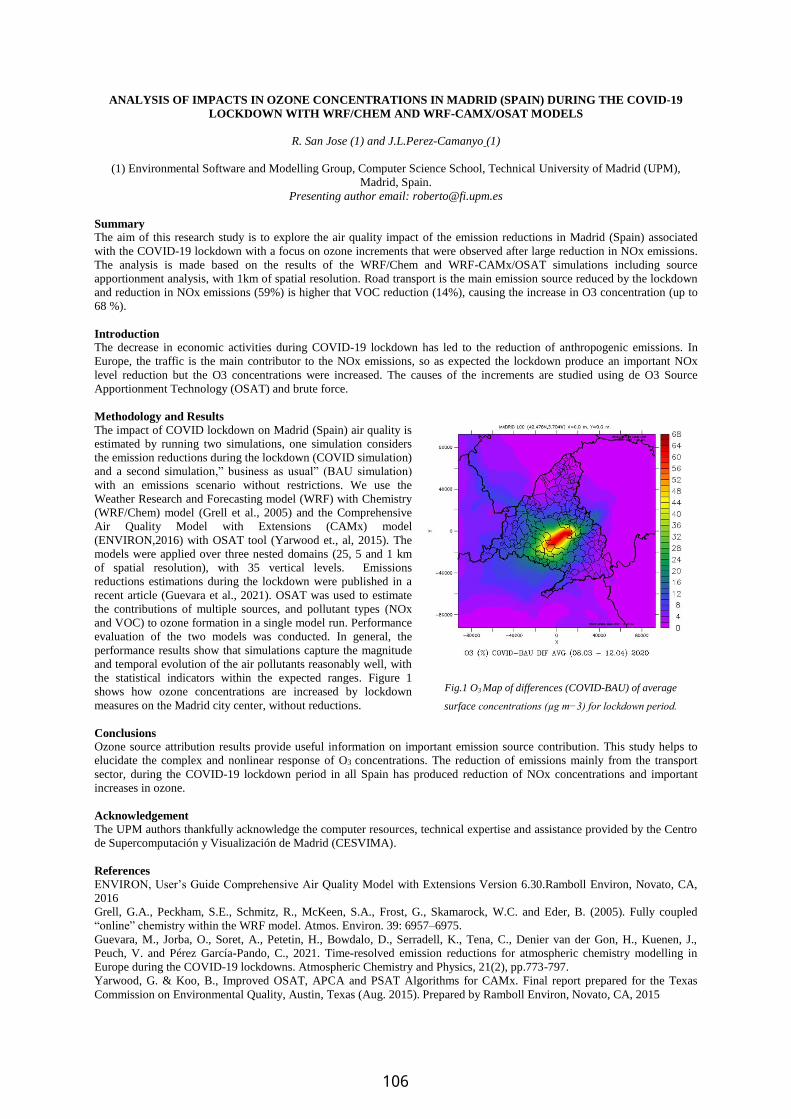
ANALYSIS OF IMPACTS IN OZONE CONCENTRATIONS IN MADRID (SPAIN) DURING THE COVID-19
LOCKDOWN WITH WRF/CHEM AND WRF-CAMX/OSAT MODELS
R. San Jose (1) and J.L.Perez-Camanyo (1)
(1) Environmental Software and Modelling Group, Computer Science School, Technical University of Madrid (UPM),
Madrid, Spain.
Presenting author email: [email protected]
Summary
The aim of this research study is to explore the air quality impact of the emission reductions in Madrid (Spain) associated
with the COVID-19 lockdown with a focus on ozone increments that were observed after large reduction in NOx emissions.
The analysis is made based on the results of the WRF/Chem and WRF-CAMx/OSAT simulations including source
apportionment analysis, with 1km of spatial resolution. Road transport is the main emission source reduced by the lockdown
and reduction in NOx emissions (59%) is higher that VOC reduction (14%), causing the increase in O3 concentration (up to
68 %).
Introduction
The decrease in economic activities during COVID-19 lockdown has led to the reduction of anthropogenic emissions. In
Europe, the traffic is the main contributor to the NOx emissions, so as expected the lockdown produce an important NOx
level reduction but the O3 concentrations were increased. The causes of the increments are studied using de O3 Source
Apportionment Technology (OSAT) and brute force.
Methodology and Results
The impact of COVID lockdown on Madrid (Spain) air quality is
estimated by running two simulations, one simulation considers
the emission reductions during the lockdown (COVID simulation)
and a second simulation,” business as usual” (BAU simulation)
with an emissions scenario without restrictions. We use the
Weather Research and Forecasting model (WRF) with Chemistry
(WRF/Chem) model (Grell et al., 2005) and the Comprehensive
Air Quality Model with Extensions (CAMx) model
(ENVIRON,2016) with OSAT tool (Yarwood et., al, 2015). The
models were applied over three nested domains (25, 5 and 1 km
of spatial resolution), with 35 vertical levels. Emissions
reductions estimations during the lockdown were published in a
recent article (Guevara et al., 2021). OSAT was used to estimate
the contributions of multiple sources, and pollutant types (NOx
and VOC) to ozone formation in a single model run. Performance
evaluation of the two models was conducted. In general, the
performance results show that simulations capture the magnitude
and temporal evolution of the air pollutants reasonably well, with
the statistical indicators within the expected ranges. Figure 1
shows how ozone concentrations are increased by lockdown
measures on the Madrid city center, without reductions.
Conclusions
Ozone source attribution results provide useful information on important emission source contribution. This study helps to
elucidate the complex and nonlinear response of O3 concentrations. The reduction of emissions mainly from the transport
sector, during the COVID-19 lockdown period in all Spain has produced reduction of NOx concentrations and important
increases in ozone.
Acknowledgement
The UPM authors thankfully acknowledge the computer resources, technical expertise and assistance provided by the Centro
de Supercomputación y Visualización de Madrid (CESVIMA).
References
ENVIRON, User’s Guide Comprehensive Air Quality Model with Extensions Version 6.30.Ramboll Environ, Novato, CA,
2016
Grell, G.A., Peckham, S.E., Schmitz, R., McKeen, S.A., Frost, G., Skamarock, W.C. and Eder, B. (2005). Fully coupled
“online” chemistry within the WRF model. Atmos. Environ. 39: 6957–6975.
Guevara, M., Jorba, O., Soret, A., Petetin, H., Bowdalo, D., Serradell, K., Tena, C., Denier van der Gon, H., Kuenen, J.,
Peuch, V. and Pérez García-Pando, C., 2021. Time-resolved emission reductions for atmospheric chemistry modelling in
Europe during the COVID-19 lockdowns. Atmospheric Chemistry and Physics, 21(2), pp.773-797.
Yarwood, G. & Koo, B., Improved OSAT, APCA and PSAT Algorithms for CAMx. Final report prepared for the Texas
Commission on Environmental Quality, Austin, Texas (Aug. 2015). Prepared by Ramboll Environ, Novato, CA, 2015
Fig.1 O3 Map of differences (COVID-BAU) of average
surface concentrations (µg m−3) for lockdown period.
106

IMPACTS OF PARTICULATE MATTER ON THE ARABIAN SEA TROPICAL CYCLONES - POLLUTANTS
FROM INDIA ARE A MAJOR CONCERN
S. Gobishankar
University of Sri Jayewardenepura, Nugegoda, Sri Lanka,
Presenting author email: [email protected]
Summary
Tropical cyclones (TC) are one of the most catastrophic natural hazards in the Northern Indian Ocean (NIO) including the
Arabian Sea and the Bay of Bengal bring floods, landslides and claiming lives. The increase in frequency of TC could be due
to climate change and air pollution. Particulate matter (PM) and aerosols released into the ambient air are transported through
the wind and accumulate over the ocean surface. This directly and indirectly affects the TC formation and intensification. We
used the forecast data from Whole Atmospheric Community Climate Model (WACCM) to observe the PM over the Arabian
Sea surface during the cyclonic events and archived meteorological data from HYSPLIT to observe the pollutant trajectories.
Our results suggest there is a positive relationship between TC and PM. Also, PM from India is a contributor to cyclone
formation and intensification.
Introduction
Tropical cyclones are extreme weather events form as result of several environmental conditions such as wind shear, warm
sea surface temperature, humidity, and atmospheric instability. This is particularly true in Northern Indian Ocean where the
Bay of Bengal and the Arabian Sea are becoming hotspots for frequent tropical storms. Anthropogenic emissions such as
particulate matter and aerosols can also impact tropical cyclone formation and inhibition. According to Evan et al.,2011 from
1997 to 2010 cyclone frequency in the Arabian Sea was increased. Black carbon and particulate matter clouds block the sun's
radiation above the surface leading to cooling in the upper ocean surface relative to the equatorial Indian Ocean. This
environment enhances the formation of a deep depression which then intensifies into more violent tropical cyclones.
Ultimately the strength of the cyclones and their direction are affected by particulate matter and aerosols. Our objective is to
predict the movement of air parcels and identify their locality to study their impact on tropical cyclone formation.
Methodology and Results
Data for WACCAM analysis- Web-based sea surface
particulate matter data were used for the WACCM model and
were obtained from National Centre for Atmospheric Research.
Data for HYSPLIT analysis - Web-based HYSPLIT model was
obtained from NOAA READY site. With the vertical pressure
coordinates with a spatial resolution of 1°and temporal
resolution of 12-hour version was used to run the web-based
HYSPLIT model to track the pollutant dispersion into the
Arabian sea. We used the web version of WACCM to create
the map for particulate matter composition in the Arabian Sea.
Also, we used the web version of HYSPLIT to run backward
pollution movement in the Arabian sea region at 100m, 500m,
and 1000m vertical heights. WACCM output show the
particulate matter was very high in India relative to other
countries. During the cyclonic event, the particulate matter forms
a thick layer and high concentration in the outer periphery of the
deep depression. Also, all the deep depressions formed are
intensified to tropical cyclones over the sea surface indicate there
is a clear connection between particulate matter pollution and
cyclone formation and intensification. The HYSPLIT output
indicates during Tuktae, Gati air pollution originated from Indian
states and for Nisarga, and Pawan shows the air pollutants were
carried from Arabian Sea itself.
Conclusions
The trend shows that the occurrence of cyclones is favoured by
regional climate shifts caused by the emission of particulate
matter. If anthropogenic pollutants significantly affect the
cyclone formation and intensification the main contributor to this
man-made hazard is India. The implication of the study remind
we need to focus more on how sea surface temperature and
surface chemistry are affected by the particulate matter.
References
Evan, A.T., Kossin, J.P. and Ramanathan, V., 2011. Arabian Sea
tropical cyclones intensified by emissions of black carbon and other aerosols. Nature, 479(7371), pp.94-97.
Fig.1 WACCM outputs a,b,c,d shows PM concentration over
the Arabian Sea for TP Tuktae, Gati, Nisarga, Pawan
Fig.2 HYSPLIT output a,b,c,d indicates air parcel
movement of backward trajectories for cyclones Tuktae,
Gati, Nisarga, and Pawan.
dataset
107

REAL DRIVING EMISSION MEASUREMENTS OF VEHICLES: A VALIDATION STUDY OF THE PLUME
CHASING METHOD
C. Schmidt (1,2), D. Pöhler (1,2), S. Schmitt (1,2), U. Platt (2), Q. Vroom (3) N. E. Ligterink (3), N. J. Farren (4), D. C.
Carslaw (4) and Å. Sjödin (5)
(1) Institute of Environmental Physics, University of Heidelberg, INF 229, 69120 Heidelberg, Germany; (2) Airyx GmbH,
Justus-von-Liebig-Straße 14, 69214 Eppelheim, Germany; (3) TNO, Anna van Buerenplein 1, 2595, The Hague,
Netherlands; (4) Wolfson Atmospheric Chemistry Laboratories, University of York, York, United Kingdom; (5) Transport &
Mobility Group, IVL Swedish Environmental Research Institute
Presenting author email: [email protected]
Summary
In this study we demonstrate the robustness and reliability of Plume Chasing as a Remote Emission Measurement Technique
in detecting NOx emissions. For example, it allows to identify high-NOx-emitting vehicles. During a 5-day-study controlled
Plume Chasing measurements of different types of vehicles were performed on a test track. In 21 different sessions with
different driving properties, the emission control systems of the test vehicles were activated and deactivated in a blind
comparison experiment. The Plume Chasing method showed excellent correlation with the averaged reference PEMS / SEMS
NOx data. The main cause for deviations was found to be situations when emissions are significantly influenced by other
plumes. So far, Plume Chasing has already been used in several studies to identify high emitters. Another one is planned for
2022 in Prague.
Introduction
High Nitrogen Oxide (NOx) concentrations are one of the main health risks in urban areas. The main source of NOx are
emissions from vehicles, which are regulated by the EURO norm. The most established method to check whether the vehicles
comply with the regulations over their lifetime is a PEMS (Portable Emission Measurement System). Nonetheless, due to its
high costs and need of installation in the tested vehicle, only a few vehicles can be checked by this system. To check more
vehicles in real driving conditions, several remote emission sensing techniques have been developed over the past years. Some
of them are further investigated within the framework of the EU project CARES (City Air Remote Emission Sensing). One of
those techniques is the ‘Plume Chasing’ method that we investigate.
Methodology and Results The Plume Chasing method uses a measurement
vehicle equipped with different instruments to chase
the emission plume of vehicles for at least several
seconds. The sampled air from the emitted plume is
analysed in real-time. Several validation studies of
Plume Chasing against the established PEMS have
previously shown very good agreement between the
observed emission values (e.g. Janssen and Hagberg,
2020; Roth, 2018). During a 5-day CARES study in the Netherlands in June 2021, controlled Plume Chasing measurements of
different types of vehicles were performed on a test track. Two ICAD NOx-CO2 instruments (Airyx GmbH, 1s time resolution,
high accuracy of sub ppb and wide range of 0–5000 ppb for NOx) were installed together with a LICOR CO2-sensor, particle
instruments, a radar and an ultrasonic anemometer in a measurement vehicle from TNO (Utrecht, Netherlands). Furthermore,
the chased vehicles were equipped with a SEMS (Smart Emission Measurement System) or PEMS for reference emission data.
In 21 different sessions, the emission control systems of the test vehicles were activated and deactivated in a blind comparison
experiment. In addition, the driving conditions were varied, e.g. the velocity, the distance between the vehicles or their driving
order, to investigate strengths and weaknesses of the different remote emission sensing techniques in identifying high and low
emitters. The Plume Chasing method showed excellent correlation with the averaged reference NOx data. The main cause for
deviations was found to be situations when emissions are significantly influenced by other high concentration emission plumes,
e.g. a passenger car driving closely behind a very high-emitting truck.
Conclusions
By showing very good agreement to on-board SEMS / PEMS measurements, this study demonstrates the robustness and
reliability of the Plume Chasing method in detecting NOx emissions, thus allowing for example to identify high-emitting
vehicles. Also driving conditions where measurements are significantly influenced are identified and recommendations are
derived. In 2022 a city demonstration campaign will take place in Prague, where the Plume Chasing method is used to identify
in real traffic high emitters for further inspections.
Acknowledgement
We acknowledge all project partners (EU H2020 CARES Project No. 814966) for their help during sampling and/or analysis.
References Janssen J. and Hagberg N., 2020. Plume Chasing - A way to detect high NOx emitting vehicles, Public Report, AVL MTC
Motorestcentre AB, Sweden, study performed for Danish Road Traffic Authority
Roth U., 2018. Optimierung und Validierung des “Plume Chasing” Verfahrens bei LKWs, Bachelorthesis, University of
Heidelberg.
Fig. 1: Selection of test vehicles at RWE test track, Lelystad, Netherlands,
Session 16, Plume Chasing vehicle at 4th position. Motorcycle and Scooter not shown in the picture.
108
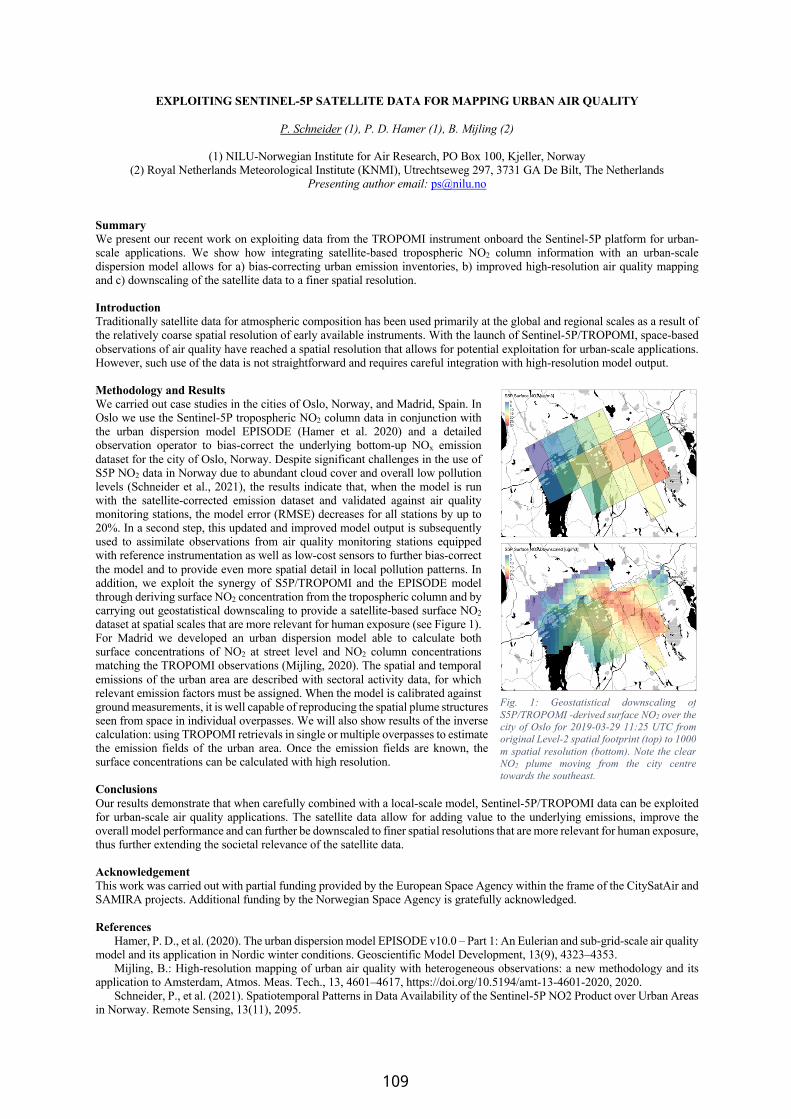
EXPLOITING SENTINEL-5P SATELLITE DATA FOR MAPPING URBAN AIR QUALITY
P. Schneider (1), P. D. Hamer (1), B. Mijling (2)
(1) NILU-Norwegian Institute for Air Research, PO Box 100, Kjeller, Norway (2) Royal Netherlands Meteorological Institute (KNMI), Utrechtseweg 297, 3731 GA De Bilt, The Netherlands
Presenting author email: [email protected] Summary We present our recent work on exploiting data from the TROPOMI instrument onboard the Sentinel-5P platform for urban-scale applications. We show how integrating satellite-based tropospheric NO2 column information with an urban-scale dispersion model allows for a) bias-correcting urban emission inventories, b) improved high-resolution air quality mapping and c) downscaling of the satellite data to a finer spatial resolution. Introduction Traditionally satellite data for atmospheric composition has been used primarily at the global and regional scales as a result of the relatively coarse spatial resolution of early available instruments. With the launch of Sentinel-5P/TROPOMI, space-based observations of air quality have reached a spatial resolution that allows for potential exploitation for urban-scale applications. However, such use of the data is not straightforward and requires careful integration with high-resolution model output. Methodology and Results We carried out case studies in the cities of Oslo, Norway, and Madrid, Spain. In Oslo we use the Sentinel-5P tropospheric NO2 column data in conjunction with the urban dispersion model EPISODE (Hamer et al. 2020) and a detailed observation operator to bias-correct the underlying bottom-up NOx emission dataset for the city of Oslo, Norway. Despite significant challenges in the use of S5P NO2 data in Norway due to abundant cloud cover and overall low pollution levels (Schneider et al., 2021), the results indicate that, when the model is run with the satellite-corrected emission dataset and validated against air quality monitoring stations, the model error (RMSE) decreases for all stations by up to 20%. In a second step, this updated and improved model output is subsequently used to assimilate observations from air quality monitoring stations equipped with reference instrumentation as well as low-cost sensors to further bias-correct the model and to provide even more spatial detail in local pollution patterns. In addition, we exploit the synergy of S5P/TROPOMI and the EPISODE model through deriving surface NO2 concentration from the tropospheric column and by carrying out geostatistical downscaling to provide a satellite-based surface NO2 dataset at spatial scales that are more relevant for human exposure (see Figure 1). For Madrid we developed an urban dispersion model able to calculate both surface concentrations of NO2 at street level and NO2 column concentrations matching the TROPOMI observations (Mijling, 2020). The spatial and temporal emissions of the urban area are described with sectoral activity data, for which relevant emission factors must be assigned. When the model is calibrated against ground measurements, it is well capable of reproducing the spatial plume structures seen from space in individual overpasses. We will also show results of the inverse calculation: using TROPOMI retrievals in single or multiple overpasses to estimate the emission fields of the urban area. Once the emission fields are known, the surface concentrations can be calculated with high resolution. Conclusions Our results demonstrate that when carefully combined with a local-scale model, Sentinel-5P/TROPOMI data can be exploited for urban-scale air quality applications. The satellite data allow for adding value to the underlying emissions, improve the overall model performance and can further be downscaled to finer spatial resolutions that are more relevant for human exposure, thus further extending the societal relevance of the satellite data. Acknowledgement This work was carried out with partial funding provided by the European Space Agency within the frame of the CitySatAir and SAMIRA projects. Additional funding by the Norwegian Space Agency is gratefully acknowledged. References
Hamer, P. D., et al. (2020). The urban dispersion model EPISODE v10.0 – Part 1: An Eulerian and sub-grid-scale air quality model and its application in Nordic winter conditions. Geoscientific Model Development, 13(9), 4323–4353.
Mijling, B.: High-resolution mapping of urban air quality with heterogeneous observations: a new methodology and its application to Amsterdam, Atmos. Meas. Tech., 13, 4601–4617, https://doi.org/10.5194/amt-13-4601-2020, 2020.
Schneider, P., et al. (2021). Spatiotemporal Patterns in Data Availability of the Sentinel-5P NO2 Product over Urban Areas in Norway. Remote Sensing, 13(11), 2095.
Fig. 1: Geostatistical downscaling of S5P/TROPOMI -derived surface NO2 over the city of Oslo for 2019-03-29 11:25 UTC from original Level-2 spatial footprint (top) to 1000 m spatial resolution (bottom). Note the clear NO2 plume moving from the city centre towards the southeast.
109
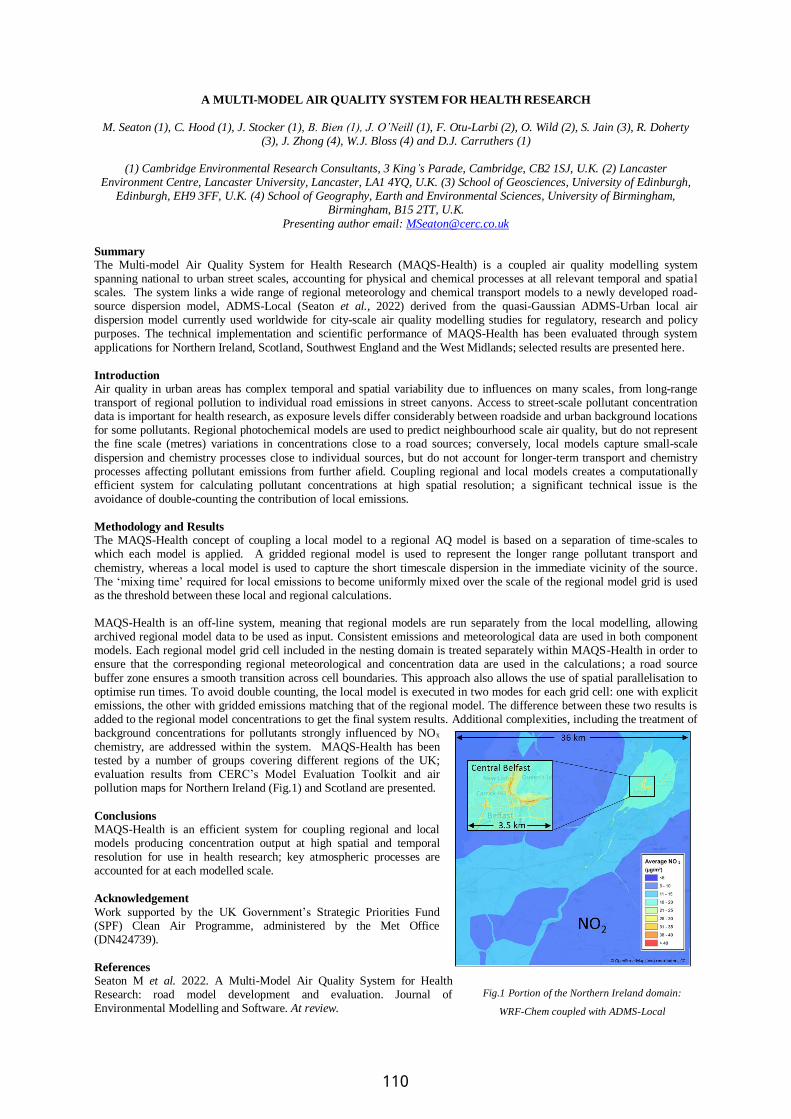
Fig.1 Portion of the Northern Ireland domain:
WRF-Chem coupled with ADMS-Local
A MULTI-MODEL AIR QUALITY SYSTEM FOR HEALTH RESEARCH
M. Seaton (1), C. Hood (1), J. Stocker (1), B. Bien (1), J. O’Neill (1), F. Otu-Larbi (2), O. Wild (2), S. Jain (3), R. Doherty
(3), J. Zhong (4), W.J. Bloss (4) and D.J. Carruthers (1)
(1) Cambridge Environmental Research Consultants, 3 King’s Parade, Cambridge, CB2 1SJ, U.K. (2) Lancaster Environment Centre, Lancaster University, Lancaster, LA1 4YQ, U.K. (3) School of Geosciences, University of Edinburgh,
Edinburgh, EH9 3FF, U.K. (4) School of Geography, Earth and Environmental Sciences, University of Birmingham, Birmingham, B15 2TT, U.K.
Presenting author email: [email protected]
Summary The Multi-model Air Quality System for Health Research (MAQS-Health) is a coupled air quality modelling system spanning national to urban street scales, accounting for physical and chemical processes at all relevant temporal and spatial scales. The system links a wide range of regional meteorology and chemical transport models to a newly developed road-source dispersion model, ADMS-Local (Seaton et al., 2022) derived from the quasi-Gaussian ADMS-Urban local air dispersion model currently used worldwide for city-scale air quality modelling studies for regulatory, research and policy purposes. The technical implementation and scientific performance of MAQS-Health has been evaluated through system
applications for Northern Ireland, Scotland, Southwest England and the West Midlands; selected results are presented here.
Introduction Air quality in urban areas has complex temporal and spatial variability due to influences on many scales, from long-range transport of regional pollution to individual road emissions in street canyons. Access to street-scale pollutant concentration data is important for health research, as exposure levels differ considerably between roadside and urban background locations for some pollutants. Regional photochemical models are used to predict neighbourhood scale air quality, but do not represent the fine scale (metres) variations in concentrations close to a road sources; conversely, local models capture small-scale
dispersion and chemistry processes close to individual sources, but do not account for longer-term transport and chemistry processes affecting pollutant emissions from further afield. Coupling regional and local models creates a computationally efficient system for calculating pollutant concentrations at high spatial resolution; a significant technical issue is the avoidance of double-counting the contribution of local emissions.
Methodology and Results The MAQS-Health concept of coupling a local model to a regional AQ model is based on a separation of time-scales to which each model is applied. A gridded regional model is used to represent the longer range pollutant transport and
chemistry, whereas a local model is used to capture the short timescale dispersion in the immediate vicinity of the source. The ‘mixing time’ required for local emissions to become uniformly mixed over the scale of the regional model grid is used as the threshold between these local and regional calculations. MAQS-Health is an off-line system, meaning that regional models are run separately from the local modelling, allowing archived regional model data to be used as input. Consistent emissions and meteorological data are used in both component models. Each regional model grid cell included in the nesting domain is treated separately within MAQS-Health in order to ensure that the corresponding regional meteorological and concentration data are used in the calculations; a road source
buffer zone ensures a smooth transition across cell boundaries. This approach also allows the use of spatial parallelisation to optimise run times. To avoid double counting, the local model is executed in two modes for each grid cell: one with explicit emissions, the other with gridded emissions matching that of the regional model. The difference between these two results is added to the regional model concentrations to get the final system results. Additional complexities, including the treatment of background concentrations for pollutants strongly influenced by NOx chemistry, are addressed within the system. MAQS-Health has been tested by a number of groups covering different regions of the UK; evaluation results from CERC’s Model Evaluation Toolkit and air pollution maps for Northern Ireland (Fig.1) and Scotland are presented.
Conclusions MAQS-Health is an efficient system for coupling regional and local models producing concentration output at high spatial and temporal resolution for use in health research; key atmospheric processes are accounted for at each modelled scale.
Acknowledgement
Work supported by the UK Government’s Strategic Priorities Fund (SPF) Clean Air Programme, administered by the Met Office (DN424739).
References Seaton M et al. 2022. A Multi-Model Air Quality System for Health Research: road model development and evaluation. Journal of Environmental Modelling and Software. At review.
110
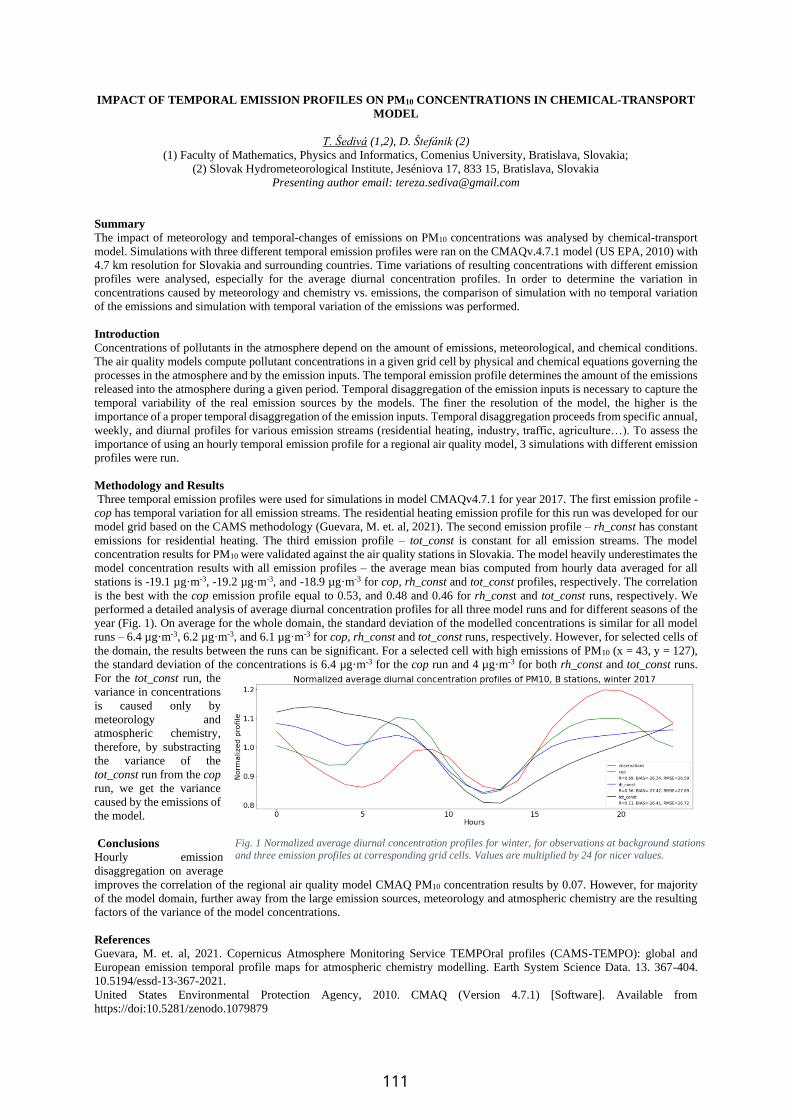
IMPACT OF TEMPORAL EMISSION PROFILES ON PM10 CONCENTRATIONS IN CHEMICAL-TRANSPORT
MODEL
T. Šedivá (1,2), D. Štefánik (2)
(1) Faculty of Mathematics, Physics and Informatics, Comenius University, Bratislava, Slovakia;
(2) Slovak Hydrometeorological Institute, Jeséniova 17, 833 15, Bratislava, Slovakia
Presenting author email: [email protected]
Summary
The impact of meteorology and temporal-changes of emissions on PM10 concentrations was analysed by chemical-transport
model. Simulations with three different temporal emission profiles were ran on the CMAQv.4.7.1 model (US EPA, 2010) with
4.7 km resolution for Slovakia and surrounding countries. Time variations of resulting concentrations with different emission
profiles were analysed, especially for the average diurnal concentration profiles. In order to determine the variation in
concentrations caused by meteorology and chemistry vs. emissions, the comparison of simulation with no temporal variation
of the emissions and simulation with temporal variation of the emissions was performed.
Introduction
Concentrations of pollutants in the atmosphere depend on the amount of emissions, meteorological, and chemical conditions.
The air quality models compute pollutant concentrations in a given grid cell by physical and chemical equations governing the
processes in the atmosphere and by the emission inputs. The temporal emission profile determines the amount of the emissions
released into the atmosphere during a given period. Temporal disaggregation of the emission inputs is necessary to capture the
temporal variability of the real emission sources by the models. The finer the resolution of the model, the higher is the
importance of a proper temporal disaggregation of the emission inputs. Temporal disaggregation proceeds from specific annual,
weekly, and diurnal profiles for various emission streams (residential heating, industry, traffic, agriculture…). To assess the
importance of using an hourly temporal emission profile for a regional air quality model, 3 simulations with different emission
profiles were run.
Methodology and Results
Three temporal emission profiles were used for simulations in model CMAQv4.7.1 for year 2017. The first emission profile -
cop has temporal variation for all emission streams. The residential heating emission profile for this run was developed for our
model grid based on the CAMS methodology (Guevara, M. et. al, 2021). The second emission profile – rh_const has constant
emissions for residential heating. The third emission profile – tot_const is constant for all emission streams. The model
concentration results for PM10 were validated against the air quality stations in Slovakia. The model heavily underestimates the
model concentration results with all emission profiles – the average mean bias computed from hourly data averaged for all
stations is -19.1 µg·m-3, -19.2 µg·m-3, and -18.9 µg·m-3 for cop, rh_const and tot_const profiles, respectively. The correlation
is the best with the cop emission profile equal to 0.53, and 0.48 and 0.46 for rh_const and tot_const runs, respectively. We
performed a detailed analysis of average diurnal concentration profiles for all three model runs and for different seasons of the
year (Fig. 1). On average for the whole domain, the standard deviation of the modelled concentrations is similar for all model
runs – 6.4 µg·m-3, 6.2 µg·m-3, and 6.1 µg·m-3 for cop, rh_const and tot_const runs, respectively. However, for selected cells of
the domain, the results between the runs can be significant. For a selected cell with high emissions of PM10 (x = 43, y = 127),
the standard deviation of the concentrations is 6.4 µg·m-3 for the cop run and 4 µg·m-3 for both rh_const and tot_const runs.
For the tot_const run, the
variance in concentrations
is caused only by
meteorology and
atmospheric chemistry,
therefore, by substracting
the variance of the
tot_const run from the cop
run, we get the variance
caused by the emissions of
the model.
Conclusions
Hourly emission
disaggregation on average
improves the correlation of the regional air quality model CMAQ PM10 concentration results by 0.07. However, for majority
of the model domain, further away from the large emission sources, meteorology and atmospheric chemistry are the resulting
factors of the variance of the model concentrations.
References
Guevara, M. et. al, 2021. Copernicus Atmosphere Monitoring Service TEMPOral profiles (CAMS-TEMPO): global and
European emission temporal profile maps for atmospheric chemistry modelling. Earth System Science Data. 13. 367-404.
10.5194/essd-13-367-2021.
United States Environmental Protection Agency, 2010. CMAQ (Version 4.7.1) [Software]. Available from
https://doi:10.5281/zenodo.1079879
Fig. 1 Normalized average diurnal concentration profiles for winter, for observations at background stations
and three emission profiles at corresponding grid cells. Values are multiplied by 24 for nicer values.
111

CONCENTRATIONS OF NOX IN SWEDEN OVER THREE DECADES USING DISPERSION MODELLING AT
LOCAL AND REGIONAL SCALE
D. Segersson (1), C. Asker (1), C. Bennet (1) and C. Andersson (1)
(1) Swedish Meteorological and Hydrological Institute, 60176 Norrköping, Sweden Presenting author email: [email protected]
Summary We present a new method to combine results from Gaussian local-scale dispersion modelling and regional scale chemical
transport modelling. The method has been applied for Sweden to estimate source-specific NOx concentrations at a resolution
of 100x100m2 for the period 1990-2015. Previous national assessments of NOx concentrations in Sweden are limited to a spatial
resolution of 1x1km2. A new post-processing scheme has been applied to exclude the contribution from local sources from
hourly concentration fields generated by a Chemical Transport model (CTM). The method is applied off-line, is independent
of the CTM used and has low computational requirements.
Introduction A detailed and accurate representation of exposure to air pollution is key to establish a link between air pollution and health
effects. In epidemiological cohort studies, exposure estimates are often required for large geographical areas and time-periods
of several decades. Exposure can be estimated based on measurements, modelling, or preferably, a combination of both. There
are indications that studies based on exposure estimates that resolve concentration gradients within cities generally indicate
steeper risk estimates per μg/m3 (Segersson et al, 2021). In order to estimate concentrations over large areas with a high spatial
resolution using dispersion modelling, it is often necessary to combine dispersion models representing different spatial scales.
Wind et al. (2020) presented a scheme to estimate the fraction of the concentrations originating from local sources as an
integrated part of a CTM-model. This allows a distinction between local and non-local contribution within the CTM-result and
makes it possible to replace the local contribution from the CTM with a result from a local scale dispersion model, without risk
of double-counting emissions. We present an alternative solution to this problem using a semi-lagrangean post-processing
scheme, which is independent of the CTM used. Methodology and Results Regional background concentration of NOx was modelled for the whole period 1990-2015 using
the MATCH CTM. The local contribution was excluded from the background concentrations using
a new post-processing scheme called BUDD (Back-trace Upwind Diffuse Downwind). Both
BUDD and local scale Gaussian modelling are performed using a moving window approach,
where the local modelling window is limited to ~15x15km2, which together with a buffer zone for
emission sources is aligned with the BUDD modelling window (see Fig. 1). This allows an
almost seamless description of the local contribution over the whole country. Local scale
modelling was carried out for 1990, 2000, 2011 and 2015. In between these years, linear
interpolation was used in combination with a gridded ventilation index to describe the inter-
annual variation in the yearly average local contribution.
Conclusions A new method has been developed to remove local-contribution within an limited part of a CTM result. The resulting non-local contribution can be combined
with a local scale dispersion model without risking double-counting of the
emissions. The method has been applied to remove local contribution from hourly
NOx concentrations at 5x5 km2 resolution for 1990-2015 across Sweden. Local
scale modelling at 100x100 m2 resolution has been carried using a moving window
approach. Yearly average NOx concentrations for 2015 are shown in Fig 2. Hourly
concentrations are modelled for four years and annual average concentrations are
interpolated to produce sector-specific estimates for the whole time-period. An
evaluation using all available regional and urban background monitoring stations
in Sweden indicates a fairly good agreement with measurements.
Acknowledgement This work was supported by the Swedish research council FORTE and
NordForsk under the Nordic Programme on Health and Welfare, Project #75007.
References Segersson, D., Johansson, C., Forsberg, B., 2021. Near-Source Risk Functions for Particulate Matter Are Critical When
Assessing the Health Benefits of Local Abatement Strategies. Int. J. Environ. Res. Public. Health 18, 6847.
https://doi.org/10.3390/ijerph18136847
Wind, P., Rolstad Denby, B., Gauss, M., 2020. Local fractions – a method for the calculation of local source contributions to
air pollution, illustrated by examples using the EMEP MSC-W model (rv4_33). Geosci. Model Dev. 13, 1623–1634.
https://doi.org/10.5194/gmd-13-1623-2020
Fig 1. The CTM grid with local window L, emission buffer and BUDD model window B, and a backward trajectory to identify concentrations at C.
Fig 2. Yearly average NOx contribution from local and non-local sources 2015.
112

ESTIMATION OF SURFACE NO2 CONCENTRATION OVER EUROPE USING SENTINEL-5P OBSERVATIONS
AND MACHINE LEARNING MODELS
S. Shetty (1,2), P. Schneider (1), P. Hamer (1), K. Stebel (1), A. Kylling and T.K. Berntsen (2)
(1) Norwegian Institute for Air Research (NILU), Kjeller, Norway; (2) Department of Geosciences, University of Oslo, Oslo,
Norway
Presenting author email: [email protected]
Summary
This study aims to derive a spatially continuous surface nitrogen dioxide (NO2) concentration over Europe by exploring the
potential of Sentinel-5P (S5P) NO2 tropospheric vertical column data. To estimate the surface concentration from vertical
column density, relationship between S5P NO2 and surface measurements of NO2 from ground-monitoring stations was
studied by training these datasets using Machine Learning models such as Random Forest and Extreme Gradient Boosting
(XGBoost). These machine learning models thus derive accurate and spatially continuous surface NO2 concentrations by
estimating surface NO2 even at locations where there are no monitoring stations, which are spatially sparse in distribution.
Addition of other input variables such as day-night band from the Visible Infrared Imaging Radiometer Suite (VIIRS)
instrument aboard the Suomi National Polar-orbiting Partnership (SUOMI-NPP) satellite, meteorological parameters, Digital
Surface Model (DSM) and land use land cover information helps in further improving the accuracy of surface NO2
estimations without increasing the model complexity.
Introduction
Increased fossil fuel combustion due to industrialization and traffic density has been the main source of NO2 in the
atmosphere over Europe. The presence of NO2 in air leads to the formation of secondary pollutants such as tropospheric
ozone and nitrate aerosols, negatively impacting human health and environmental conditions. Therefore, it is important to
continuously monitor the distribution of NO2 concentrations over large regions to regulate the existing environmental policies
for sustainable development. Ground Monitoring stations provide surface concentrations at high temporal frequency and
accuracy, but they have a sparse spatial network. On the other hand, remote sensing datasets from satellites such as S5P
provide spatially continuous NO2 datasets at high resolution of 3.5 km x 5.5 km. However, they typically only provide an
integrated estimate of the tropospheric NO2 column and not of the surface concentration of NO2, which is the measure
usually used for exposure and health applications. Hence the spatial spread of satellite datasets and localised data from
ground monitoring stations can be combined to obtain a more continuous spatial distribution of surface NO2 concentrations
(Chan et al., 2021).
Methodology and Results
S5P Level-3 gridded NO2 datasets provided by Google Earth Engine platform was used for analysis. In-situ NO2 data from
ground monitoring stations of Europe were obtained from European Environmental Agency (EEA) database for the years
2018, 2019 and 2020. Since S5P NO2 has a temporal frequency of one day and in-situ measurements are present at hourly
frequency, there is a need to map the in-situ measurements that closely match the satellite overpass time. Based on
correlation, weighted average of in-situ measurements within the period of satellite overpass time was considered as the
target dataset for training the machine learning models. In addition to S5P NO2, other factors that effect NO2 distribution such
as solar zenith angle, ERA meteorological data, VIIRS day-night radiance, DSM and CORINE land cover information are
provided as input to train the Random Forest and XGBoost models. On evaluating the NO2 surface concentrations predicted
from machine learning models with in-situ measurements, Random Forest reported an average Mean Absolute Error (MAE)
of 4.75 µg/m3 and XGBoost reported an average MAE of 5.17 µg/m3 over Europe. Among the input variables to the model,
the satellite based S5P tropospheric NO2 information had the highest feature importance based on the ranking derived by both
Random Forest and XGBoost models.
Conclusions
The synergy of ground measurement stations, satellite datasets and machine learning models can play an important role in
estimating a spatially continuous surface concentration of atmospheric pollutants such as NO2 which are required for decision
making and policy planning. The NO2 surface concentrations obtained in the study show good agreement with in-situ
measurements. The feature importance ranking also indicates the high contribution of satellite-based information from high
resolution datasets such as S5P tropospheric NO2 in deriving surface concentrations.
References
Chan, K. L., Khorsandi, E., Liu, S., Baier, F., & Valks, P. (2021). Estimation of Surface NO2 Concentrations over Germany
from TROPOMI Satellite Observations Using a Machine Learning Method. Remote Sensing, 13(5), 969.
https://doi.org/10.3390/rs13050969
113

Fig.2 BaP daily exposure mean concentrations.
EXPOSURE DIFFERENTIATION FOR POPULATION GROUPS. AN EXAMPLE FOR PM2.5 AND BaP.
K.K. Kalimeri (1), J.G. Bartzis (2), I.A. Sakellaris (2), M.A. Siarga (2)
(1) Chemical Service of Kozani, Chemical Service of Epirus – Western Macedonia, General Chemical State Laboratory, Farmaki 13, 50132, Kozani, Greece; (2) Energy & Pollution Control Systems Engineering Laboratory, Dep. of Mechanical Engineering, University of Western Macedonia, Bakola & Sialvera, 50132, Kozani, Greece
Presenting author email: [email protected] Summary In assessing health impact vs air quality, there is a need to differentiate exposure for the various population groups. An important role for such a differentiation plays the indoor microenvironment. Here a methodology on how to statistically quantify such a differentiation on daily exposure is presented, taking into consideration - among others - the outdoor concentration statistics as well as the outdoor/indoor interaction. As an application, the emerging pollutants PM2.5 and BaP in PM2.5 has been considered and the methodology is applied in a specific city, randomly selected, where outdoor daily PM2.5 concentrations exist (i.e. Brandenburg, Germany). The application reveals the importance of such an exposure differentiation. Introduction Epidemiological studies for pollutants of mainly outdoor origin, such as PM2.5, usually use the outdoor pollutant concentration as a stressor indicator (Pope, 2000). People spent almost 90% of their day in indoor environments, thus indoor air is of major importance for human exposure. In order to prevent mis-estimation of the real exposure and the related risks caused by indoor air pollution, it would be more realistic to use as an indicator the exposure concentration, which differs for the various population groups and is influenced by the occupants’ activities and the time use of the various microenvironments (MEs) to which the individual is exposed. This study presents a relatively simple methodology to quantify the daily PM2.5 indoor exposure differentiation of specific subgroups of the general population, that occupy different indoor MEs. Methodology and Results The methodology for assessing this differentiation in statistical terms, is presented here and is illustrated through a randomly selected application. Indoor and outdoor PM2.5 observation data for offices, schools and residencies were retrieved from the HEALS EDMS Database in order to produce the respective I/O ratios as well as their statistical behaviour (Kalimeri et al., 2019). We use the model EXPO_ME_PDF under development in UOWM_ETL Lab to estimate exposures. An important feature of the model is that all input and output parameters i.e. outdoor/indoor concentrations, I/O ratios, ventilation, infiltration, deposition, sources) are treated as pdf/cdf able to produce means, standard deviations percentiles, exceedances etc. As an application, the emerging pollutants PM2.5 and BaP in PM2.5 has been considered and the methodology is applied in a specific city, randomly selected, where outdoor daily PM2.5 concentrations exist (i.e. Brandenburg, Germany). Four population groups have been considered i.e. school children 6-12yrs, office workers, housekeepers and retired people. The daily time fraction estimation per group is based on Torfs et al., (2008). For simplification purposes only four ME are considered i.e. outdoors, home, office and school). In figure 1 and 2 the produced mean daily exposure concentrations are given for PM2.5 and BaP respectively. Conclusions The present study demonstrates the importance of the indoor exposure differentiation and presents the methodology on how to assess such an effect. Acknowledgement This work has received funding from the European Union's Seventh Programme for Research, Technological Development and Demonstration under grant agreement No. 603946 (Health and Environment-wide Associations based on Large population Surveys, HEALS). It has been additionally supported by National Strategic Reference Framework (NSRF) project “Development of New Innovative Low Carbon Energy Technologies to Enhance Excellence in the Region of Western Macedonia” References Pope, C.A., 2000. Epidemiology of fine particulate air pollution and human health: biologic mechanisms and who’s at risk? Environ. Health Perspect. 108, 713–723 Kalimeri K.K., Bartzis J.G., Sakellaris I.A., Fernandes E.O., 2019. Investigation of the PM2.5, NO2 and O3 I/O ratios for office and school microenvironments. Environmental Research https://doi.org/10.1016/j.envres.2019.108791. Torfs R., Brouwere K.D., Spruyt M., Goelen E., Nickmilder M., Bernard A., 2008. Exposure and Risk Assessment of Air Fresheners. Flemish Institute for Technological Research NV (VITO) (2008/IMS/R/2222).
Fig.1 PM2.5 daily exposure mean concentrations.
114

NO2 AND PM10 AVOIDED HEALTH BURDEN IN PORTUGAL IN 2015-2019: APPLICATION OF THE NEW WHO AIR QUALITY GUIDELINES
Ana Catarina T. Silva (1), Pedro T.B.S. Branco (1), Fernando G. Martins (1), Sofia I.V. Sousa (1)
(1) LEPABE – Laboratory for Process Engineering, Environment, Biotechnology and Energy, Faculty of Engineering, University of Porto, Rua Dr. Roberto Frias, 4200-465 Porto, Portugal
Presenting author email: [email protected] Summary The present study aims to estimate the health burden related to NO2 and PM10 exposure to levels above the EU limit value and the new WHO Air Quality Guidelines. Hence, AirQ+ tool was used to estimate the all-cause mortality of adults aged above 30 years old (30+) due to NO2 long-term exposure and postneonatal infant mortality due to PM10 long-term exposure. The analysis was based on the air pollutants’ concentrations collected from the National Air Quality Monitoring Network (QualAr 2019), between 2015 and 2019 in Portugal. The studies were performed for Portugal domain and specifically for Lisbon and Porto Metropolitan Areas. In average, 55% of premature deaths attributable to long-term NO2 exposure would have been avoided for Portugal domain if the new WHO guidelines were not surpassed, and 6% would have been avoided if there were no exceedances to the EU limit values. As for PM10, 20% of postneonatal infant mortality would have been avoided if concentrations were below the new WHO guidelines. Furthermore, considering the metropolitan areas, sometimes a higher number of avoided premature deaths were achieved compared to Portugal domain. The metropolitan areas represented up to 58% of the total mortality of Portugal attributable to air pollution (compared to WHO guidelines), highlighting the importance of the development of policies to mitigate air pollution, especially at urban areas. Introduction Anthropogenic activities are one of the leading causes of air pollution worldwide, contributing to many severe diseases. The World Health Organization (WHO) estimated in 2016 that 4.2 million premature deaths occur per year worldwide due to air pollution (WHO 2018). For this reason, research focused on estimations of the health burden are extremely important to prevent and/or minimise the further intensification of this problem. Thus, the health burden due to NO2 and PM10 exposure above EU limit values and new WHO guidelines was estimated during 2015-2019 for Portugal domain and for the two main Portuguese metropolitan areas, Porto and Lisbon. Methodology and Results All cause mortality of adults aged above 30 years old (30+) due to NO2 long-term exposure and postneonatal infant mortality due to PM10 long-term exposure were estimated using the AirQ+ (version 2.1.1.) tool, developed by WHO, for 2015-2019, for Portugal and specifically in the metropolitan areas of Porto and Lisbon, using population data from the most recent Census available (2011) (ESS 2021). The annual mean NO2 and PM10 concentrations were calculated based on the hourly concentrations collected from the National Air Quality Monitoring Network (QualAr 2019). Interpolation by inverse distance weighting (IDW) method was performed to determine the average air pollutants’ concentrations that the Portuguese population were exposed to, for the estimation of the health burden that could be avoided if exposure were below the EU limit values (NO2: 40 µg/m3, PM10: 40 µg/m3) or the new WHO air quality guidelines (NO2:10 µg/m3, PM10: 15 µg/m3). Considering the EU limit values for NO2, an avoided mortality of 6%, 8%, and 6% per year were estimated for Portugal, Porto and Lisbon Metropolitan Areas, respectively. Considering the WHO guidelines, an attributable avoided mortality of 55%, 63%, and 40% per year were estimated for Portugal, Porto and Lisbon Metropolitan Areas, respectively. As for PM10, no exceedances to the EU limit value were found. Considering the WHO guidelines, an avoided postneonatal infant mortality of 20% and 29% per year for Portugal and Lisbon Metropolitan Area, respectively, and up to 17% per year in Porto Metropolitan Area were estimated. Conclusions Overall, the most significant health gains were found in the metropolitan areas, especially if the new WHO air quality guidelines were achieved, once the metropolitan areas represent up to 58% of Portugal’s mortality attributable to air pollution. Thus, this research highlights the importance and urgency of air pollution reduction in Portugal, particularly in metropolitan areas, and gives policy-makers better insights into this problem. Acknowledgements This work was financially supported by: Base Funding – UID/EQU/00511/2020 of the Laboratory for Process Engineering, Environment, Biotechnology and Energy – LEPABE – funded by national funds through FCT/MCTES (PIDDAC). References ESS (European Statistical System), 2021. 2011 Census Hub. https://ec.europa.eu/CensusHub2/query.do?step=selectHyperCube&qhc=false (accessed 15 October 2021). QualAr, 2019. Estações. https://qualar.apambiente.pt/qualar/estacoes (accessed 25 June 2021). WHO (World Health Organization), 2018. Ambient (outdoor) air pollution. https://www.who.int/news-room/fact-sheets/detail/ambient-(outdoor)-air-quality-and-health (accessed 13 February 2021).
115

VARIOUS SOURCES OF ABNORMALLY HIGH AEROSOL AIR POLLUTION IN MOSCOW
D. Gubanova, A. Skorokhod, O. Chetiani, N. Elansky, M. Iordanskii
A.M. Obukhov Institute of Atmospheric Physics (OIAP), Russian Academy of Sciences, Moscow, 119017, Russia
Presenting author email: [email protected]
Summary
Continuous observations of composition and mass concentration of near-surface aerosol in Moscow in different seasons of
2020-2021 revealed episodes with abnormally high concentrations of aerosol particles PM10 (up to 3-5 MPC values). All of
them occurred under conditions of anticyclonic activity, but had different genesis. Studies of the variability of elemental
composition of near-surface aerosol during the periods of abnormal values of its concentration revealed a strong increase in
the mass concentration of terrigenous elements (Al, Ca, Fe, etc.) during the long-range transport of dust aerosol from the arid
southeastern regions of European Territory of Russia (ETR), a number of terrigenous elements and heavy metals (Na, Mg,
Ca, Fe, V, Cr, Cu, Zn, W, Sn, Sb) during the regional transport of aerosols from nearby areas with numerous fires, elements
of various groups (Al, Fe, Ca, Mn, Cr, Zn, Hg, As, Se, Bi, La, Th, U) in the case of air pollution from the nearest of intense
local anthropogenic source in the city.
Introduction
Aerosol particles play a significant role in air pollution in large cities. This component of the atmosphere is characterized by
strong spatial and temporal variability, as well by high chemical activity of aerosol particles in the city. In addition, synoptic
and meteorological conditions, features of the wind regime, spelling and
urban development, as well the specifics of local anthropogenic sources
strongly influence mechanisms of transport, removal, chemical
transformation and deposition of aerosol particles. In this paper, we
compare the composition of abnormal aerosol pollution of near-surface
air in Moscow during the periods of impacts from the various sources.
Methodology and Results
During 2020-21, four episodes were revealed (Fig., above) with abnormal
values of near-surface aerosol concentration in different seasons.
Descriptions of the experiment, equipment and methods of observations
and analysis are given in details in (Gubanova et al., 2021). Comparison
with similar data obtained at the “Mosecomonitoring” station closest to
the OIAP RAS (https://mosecom.mos.ru/spiridonovka /) is carried out
constantly. Episode 1 (27.03.-29.03.2020.) is associated with the regional
atmospheric transport of combustion aerosols to Moscow region from
nearby areas with biomass burning. During this time, there was an
increase in the concentration of a number of elements of natural origin of
various groups, such as Na, Mg, Ca, Fe, V, Cr, Cu, Zn, W, Sn, Sb (Fig.,
below). Episodes 2 (05.10.-14.10.2020.) and 3 (12.04.-15.04.2021.) were
caused by the long-range transport of dust aerosol from arid and desolate
areas of the south-east of ETR and the Northern Caspian Sea. This is
confirmed by the air mass trajectory analysis and the similarity of the
elemental composition of near-surface aerosol in Moscow and the areas of Kalmykia (high concentrations of terrigenous
elements Al, Ca, Fe, Na, Mg, K). This is a rare event for the latitudes of Moscow, and the authors are not currently aware of
the work of other researchers describing similar phenomena. Episode 4 (14.07.-23.07.2021.) presents the influence of a close
local anthropogenic source associated with the dismantling and demolition of industrial buildings. During this period, the
values of the maximum single and average daily MPC values for PM10 aerosols (by 7-15 and 2-5 times, respectively),
increased concentrations of elements of natural and anthropogenic origin, including macronutrients and heavy metals (Al, Fe,
Ca, Mn, Cr, Zn, Hg, As, Se, Bi, La, Th, U) were recorded. All these results are quite comparable with the data on the
composition of road dust (Kasimov et al., 2020) in Moscow.
Conclusions
Abnormal aerosol pollution of surface air in Moscow can have various causes and sources. Unfavorable meteorological
conditions increase the accumulation of pollutants in the surface layer of the atmosphere. The local anthropogenic source of
aerosol pollution turned out to be comparable with the effect of dust storm brought to Moscow from the southern regions of
ETR. Such phenomena and their consequences may be dangerous for human health and city’s ecosystems.
Acknowledgement
This work was partly supported by RFBR, projects No. 19-05-50088 (aerosol composition in Moscow) and by RSF, grant
No. 20-17-00214 (the composition of arid aerosol in Kalmykia).
References
Gubanova, D.P., Vinogradova, A.A., Iordanskii, M.A. and A.I. Skorokhod, 2021. Time Variations in the Composition of
Atmospheric Aerosol in Moscow in Spring 2020. Izv. Atmos. Ocean. Phys. 57, 297–309.
https://doi.org/10.1134/S0001433821030051
Kasimov N.S., Vlasov D.V., Kosheleva N.E., 2020. Enrichment of road dust particles and adjacent environments with metals
and metalloids in eastern Moscow. Urban Climate 32, 100638. https://doi.org/10.1016/j.uclim.2020.100638.
Fig.1 Figure. Concentrations of PM10 aerosols
(above) and of different elements (below).
116
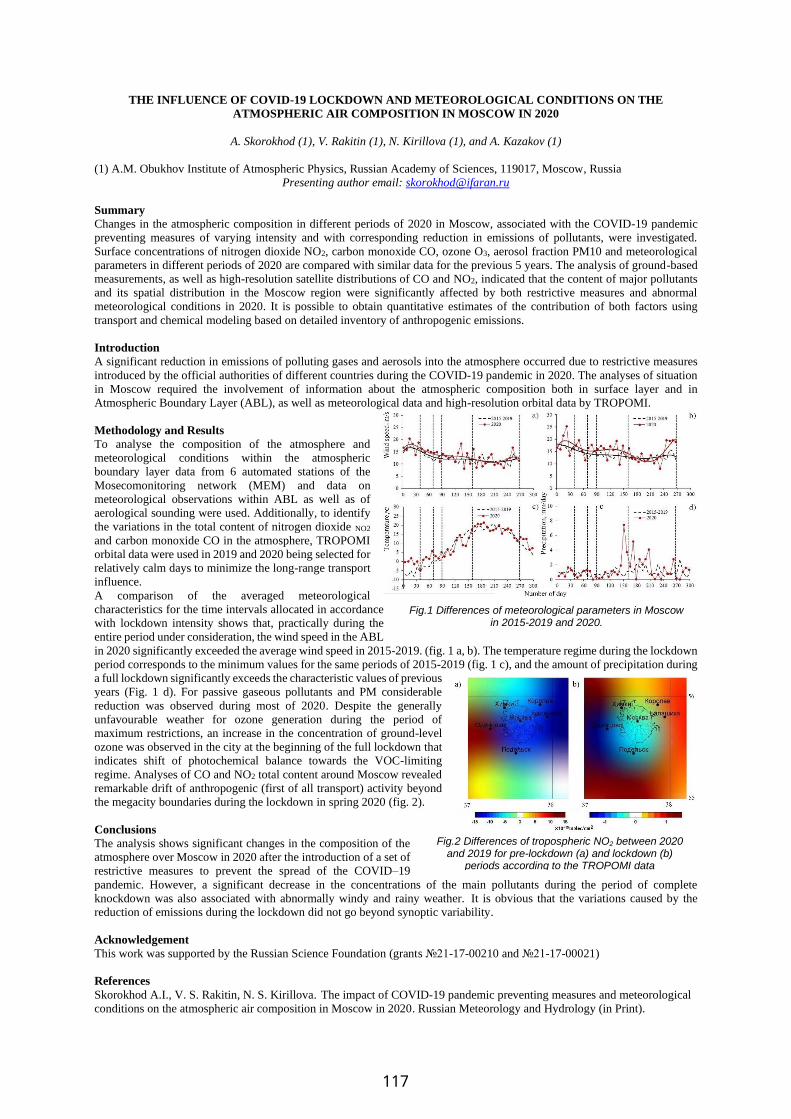
THE INFLUENCE OF COVID-19 LOCKDOWN AND METEOROLOGICAL CONDITIONS ON THE
ATMOSPHERIC AIR COMPOSITION IN MOSCOW IN 2020
A. Skorokhod (1), V. Rakitin (1), N. Kirillova (1), and A. Kazakov (1)
(1) A.M. Obukhov Institute of Atmospheric Physics, Russian Academy of Sciences, 119017, Moscow, Russia
Presenting author email: [email protected]
Summary
Changes in the atmospheric composition in different periods of 2020 in Moscow, associated with the COVID-19 pandemic
preventing measures of varying intensity and with corresponding reduction in emissions of pollutants, were investigated.
Surface concentrations of nitrogen dioxide NO2, carbon monoxide CO, ozone O3, aerosol fraction PM10 and meteorological
parameters in different periods of 2020 are compared with similar data for the previous 5 years. The analysis of ground-based
measurements, as well as high-resolution satellite distributions of CO and NO2, indicated that the content of major pollutants
and its spatial distribution in the Moscow region were significantly affected by both restrictive measures and abnormal
meteorological conditions in 2020. It is possible to obtain quantitative estimates of the contribution of both factors using
transport and chemical modeling based on detailed inventory of anthropogenic emissions.
Introduction
A significant reduction in emissions of polluting gases and aerosols into the atmosphere occurred due to restrictive measures
introduced by the official authorities of different countries during the COVID-19 pandemic in 2020. The analyses of situation
in Moscow required the involvement of information about the atmospheric composition both in surface layer and in
Atmospheric Boundary Layer (ABL), as well as meteorological data and high-resolution orbital data by TROPOMI.
Methodology and Results
To analyse the composition of the atmosphere and
meteorological conditions within the atmospheric
boundary layer data from 6 automated stations of the
Mosecomonitoring network (MEM) and data on
meteorological observations within ABL as well as of
aerological sounding were used. Additionally, to identify
the variations in the total content of nitrogen dioxide NO2
and carbon monoxide CO in the atmosphere, TROPOMI
orbital data were used in 2019 and 2020 being selected for
relatively calm days to minimize the long-range transport
influence.
A comparison of the averaged meteorological
characteristics for the time intervals allocated in accordance
with lockdown intensity shows that, practically during the
entire period under consideration, the wind speed in the ABL
in 2020 significantly exceeded the average wind speed in 2015-2019. (fig. 1 a, b). The temperature regime during the lockdown
period corresponds to the minimum values for the same periods of 2015-2019 (fig. 1 c), and the amount of precipitation during
a full lockdown significantly exceeds the characteristic values of previous
years (Fig. 1 d). For passive gaseous pollutants and PM considerable
reduction was observed during most of 2020. Despite the generally
unfavourable weather for ozone generation during the period of
maximum restrictions, an increase in the concentration of ground-level
ozone was observed in the city at the beginning of the full lockdown that
indicates shift of photochemical balance towards the VOC-limiting
regime. Analyses of CO and NO2 total content around Moscow revealed
remarkable drift of anthropogenic (first of all transport) activity beyond
the megacity boundaries during the lockdown in spring 2020 (fig. 2).
Conclusions
The analysis shows significant changes in the composition of the
atmosphere over Moscow in 2020 after the introduction of a set of
restrictive measures to prevent the spread of the COVID–19
pandemic. However, a significant decrease in the concentrations of the main pollutants during the period of complete
knockdown was also associated with abnormally windy and rainy weather. It is obvious that the variations caused by the
reduction of emissions during the lockdown did not go beyond synoptic variability.
Acknowledgement
This work was supported by the Russian Science Foundation (grants №21-17-00210 and №21-17-00021)
References
Skorokhod A.I., V. S. Rakitin, N. S. Kirillova. The impact of COVID-19 pandemic preventing measures and meteorological
conditions on the atmospheric air composition in Moscow in 2020. Russian Meteorology and Hydrology (in Print).
Fig.2 Differences of tropospheric NO2 between 2020 and 2019 for pre-lockdown (a) and lockdown (b)
periods according to the TROPOMI data
Fig.1 Differences of meteorological parameters in Moscow in 2015-2019 and 2020.
117

AIR QUALITY AND ENERGY IN GREECE: PRE AND POST COVID 19 FACTS
T. Slini (1) and N. Moussiopoulos (1)
(1) Laboratory of Heat Transfer and Environmental Engineering, Department of Mechanical Engineering, Aristotle
University Thessaloniki, Thessaloniki, GR-54124, Greece
Presenting author email: [email protected]
Summary
This study aims to analyse the air quality and energy data during last few years that is the pre and post covid-19 era in Greece.
The concentration of key air pollutants, human induced emissions and energy use have dramatically changed during the period
of March 2020 to May 2021, mainly due to the restrictions applied, resulting in a raised number of avoided deaths due to poor
air quality conditions. Daily life habits, transportation, industry operation are some examples of the fields that have monitored
significant variations over the last years. Subsequently it is useful and vital for future environmental management and energy
planning to study the impact of the restriction measures in air quality and energy in Greece. Data analysed include particular
matters (PM): PM10 and PM2.5 concentrations, energy consumption and avoided health impacts as well as deaths attributed in
air quality. The comparison, where possible, is accomplished by the descriptive statistical indices and appropriate tests. This
study shows that impact of restriction measures in air quality and human health.
Introduction
The recent health crisis and restriction contributed significantly to lower traffic and transportation needs over the last three
years (2020-22) in polluted sites and cities in Greece, Europe and globally. Considering that poor air quality is the most critical
environmental health risk in Europe, it is interesting to analyse the observed pollutant concentrations, energy data and avoided
deaths due to pandemic measures.
Methodology and Results
In the current study, data monitored by the Greek Ministry of
Environment and Energy are analysed covering the period 2017-20 in
Greater Athens and Thessaloniki Areas. A variety of stations areas and
types are selected, such as urban and suburban, traffic, background
and industrial in both cities. Namely, the following stations are used
in Athens: Aristotelous, Thrakomakedones, Elefsina, Peristeri,
Peiraeus and in Thessaloniki: Agia Sofia, Kordelio, Sindos and
Panorama. Daily and annual concentrations are estimated for the PM10
and PM2.5, where available, for all stations. The graphical presentation
(Fig. 1) indicates the decreasing trend in observed concentrations that
is proven to be statistical significant over the years (Spearman’s
correlation coefficient, p<0.05). Meanwhile, the annual deaths
attributable to the exposure in PM2.5 ranged around 12,000 during the
period 2014-18 in Greece (EEA, 2020). In 2020, in Europe, it is
estimated that more than 6364 health incidents (namely deaths,
emergency room visits for asthma and preterm births) were avoided,
due to the lockdown measures lasting only few months. The current
study is showing the impact of the monitored reduction of PM
concentration and energy consumption is highly related to the
decrease of negative health impacts. Another remarkable fact is that
while there is an expected decline of the final energy consumption,
there is a certain increase in renewable energy sources (mainly solar)
over the last years. The slightly decreasing trend due the pandemic is
now followed by the current turbulent and volatile period in global
energy market causing potentially significant impacts, not only in air
quality but further in economy and sustainable growth in all levels:
governments, companies, investors, society, communities, individual
consumers.
Conclusions
While the pandemic conditions and air pollution improvements resulted in the reduction of PM concentration levels, poor
ambient air continue to drive a significant environmental risk in Europe. The fall in PM emission levels are can be attributed
to the severe restriction measures due to COVID-19 and its additional long-term effect in energy globally, but also in improved
combustion processes (in both industrial and residential operation), the optimised energy mix (with less fossil fuels and coal),
progress in transport and agriculture. Focus in low-carbon energy technologies including renewables, energy efficiency are the
key variables for the way out of the current energy crisis and impasse in order to enhance resilience and achieve long term
ambitions.
References
EEA - European Environment Agency, 2021. Air quality in Europe — 2021 report. Report 15/2021. doi: 10.2800/549289
(a)
(b)
Fig.1 Mean PM10 concentrations in (a) Athens and
(b) Thessaloniki selected stations
118

HOW WILL 2021 WHO AIR QUALITY GUIDELINES IMPACT THE HEALTH IMPACT ASSESSMENT BY
THE EUROPEAN ENVIRONMENT AGENCY
J. Soares (1), A. Gsella (2), J. Horálek (3), C. Guerreiro (1), A. González Ortiz (2)
(1) Norwegian Institute for Air Research (NILU), Kjeller, 2007, Norway; (2) European Environment Agency,
Copenhagen, 1050, Denmark; (3) Czech Meteorological Institute, Praha, 14300, Czechia
Presenting author email: [email protected]
Summary
Following the publication of the 2021 WHO Air Quality Guidelines (AQG), this paper assesses the impact of the new
concentration-response functions (CRFs) on the estimations of the health outcomes and the potential health benefits for the
European citizens of attaining the new AQG, as calculated by the European Environment Agency. The number of premature
deaths (PD) and years of life lost (YLL) were estimated for fine particulate matter (PM2.5), ozone (O3) and nitrogen dioxide
(NO2) to illustrate the health impact related to air pollution. The estimations were based on the CRFs currently
recommended by WHO and the CRFs indicated by recent studies serving as scoping platforms for newer WHO’s
recommendations. The results based on 2019 data show that implementing up-to-date recommendations on CRF will reduce
in 26 % the PD and YLL related to PM2.5 exposure, and an increase of 62 % for NO2, and of 340 % for O3 is expected. The
highest benefit when attaining 2021 WHO AQG is for PM2.5. The reduction in premature deaths caused by exposure to
PM2. 5 is estimated to be 58 %, compared to the exposure levels in Europe in 2019, which is 10 % higher when compared
to the benefits of attaining the 2013 WHO AQG for PM2.5 .
Introduction
Air pollution is the single most significant environmental health risk in Europe (HEI, 2020), causing around 400 000
premature deaths per year due to exposure to PM2.5 alone (EEA, 2020). The new WHO AQG were published in 2021 to
provide up-to-date health-based guideline levels for major health-damaging air pollutants. These guidelines encourage
authorities and civil society to enforce measures to control exposure to harmful air pollution.
Methodology & Results
The health risk assessment presented here is based on Soares et al. (2020) methodology with some adjustments to reflect
the year in question. The estimation of the relative risk followed two different sets of CRFs: 1) the recommendations in the
HRAPIE project (WHO, 2013), and 2) the Huangfu and Atkinson (2020) and Chen and Hoek (2020) methodology reviews
supporting WHO’s update of the global air quality guidelines. PD and YLL were estimated per grid cell, then aggregated
to country-level by combining population and demographic data per country, age, and sex with gridded concentrations.
Sensitivity and benefit analysis studies were carried out and benchmarked against the calculations using the WHO (2013)
recommendations. The sensitivity analysis assumed different CRFs and counterfactual concentrations (C0) for the three
pollutants. The analysis indicates that changes can have considerable impacts on the results. The largest variability related
to changing CRF is for O3 and NO2, with an increase of 340 % and 62 % on the PD and YLL, respectively. A 26 % reduction
is expected for PM2.5. Changes in C0 increase the estimations for PD and YLL related to O3 and NO2 exposure by 70 %
and decrease ~21% of the PM2.5 estimations. The benefit analysis estimations assume that all grid-cells across Europe with
annual mean concentrations in 2019 above the WHO AQG of PM2.5 and NO2 will be in attainment with the WHO AQGs.
For PM2.5, the results show a considerable reduction: 47% and 58% considering 2021 and 2013 AQG, respectively. The
reduction for NO2 is less significant, with an estimated 2 % and 8 %, considering 2021 and 2013 AQG, respectively.
Conclusions
Health impacts due to air pollution across Europe remain high, especially due to exposure to PM2.5 over central and eastern
European countries. The use of potentially new CRFs and C0 can substantially impact the estimation of PD and YLL.. The
estimates indicate that attaining 2021 WHO AQG will benefit the European population by reducing mortaly by between 8
to 58 % regarding exposure to NO2 and PM2.5 levels, respectively, compared to 2019 exposure levels.
Acknowledgment
This work was funded by the EEA and co-founded by the Norwegian Ministry of Climate and Environment.
References
Chen J. and Hoek G., 2020. Long-term exposure to PM and all-cause and cause-specific mortality: A systematic review
and meta-analysis, Environment International, 144, doi: 10.1016/J.ENVINT.2020.105974
EEA, 2020. Air Quality in Europe – 2020 report, EEA Report No 10/2020 (https://www.eea.europa.eu/publications/air-
quality-in-europe-2020)
HEI, 2020. State of Global Air 2020. Special Report, Health Effects Institute, Boston, MA, USA.
Huangfu P. and Atkinson R., 2020. Long-term exposure to NO2 and O3 and all-cause and respiratory mortality: A
systematic review and meta-analysis, Environment International, 144, doi: 10.1016/J.ENVINT.2020.105998. WHO 2013. Health risks of air pollution in Europe - HRAPIE project. Recommendations for concentration-response
functions for cost-benefit analysis of particulate matter, ozone and nitrogen dioxide. Copenhagen, Denmark
119
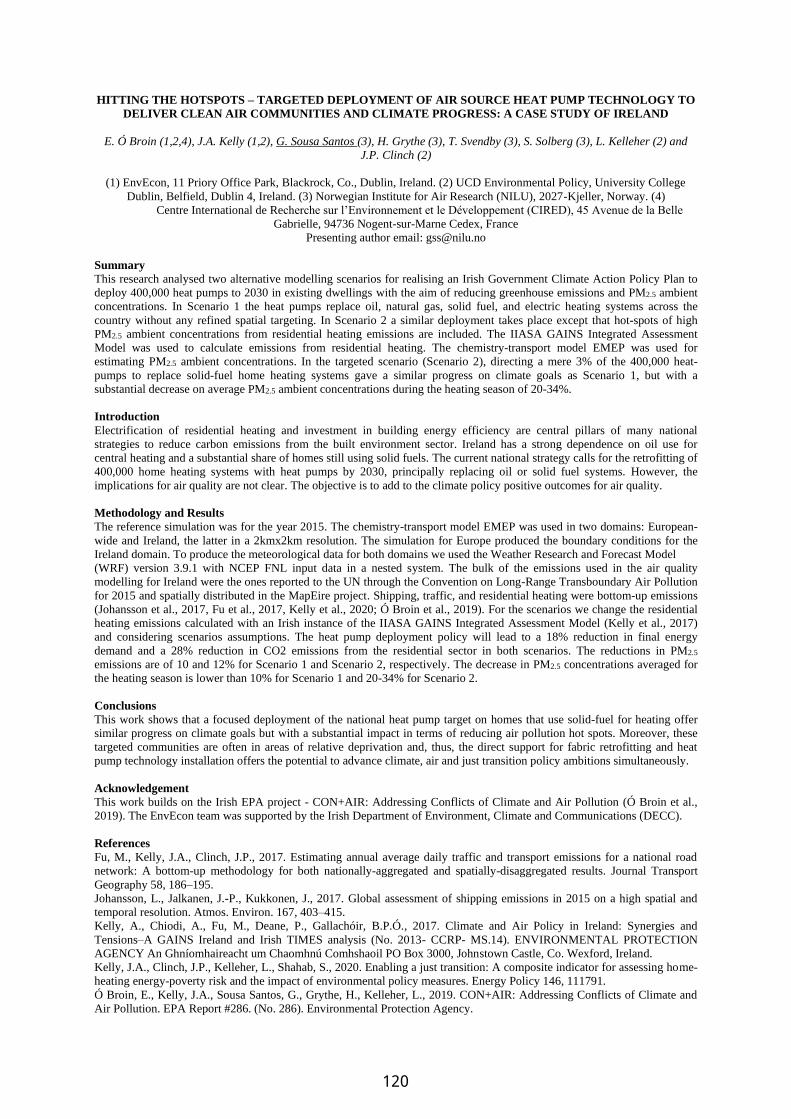
HITTING THE HOTSPOTS – TARGETED DEPLOYMENT OF AIR SOURCE HEAT PUMP TECHNOLOGY TO
DELIVER CLEAN AIR COMMUNITIES AND CLIMATE PROGRESS: A CASE STUDY OF IRELAND
E. Ó Broin (1,2,4), J.A. Kelly (1,2), G. Sousa Santos (3), H. Grythe (3), T. Svendby (3), S. Solberg (3), L. Kelleher (2) and
J.P. Clinch (2)
(1) EnvEcon, 11 Priory Office Park, Blackrock, Co., Dublin, Ireland. (2) UCD Environmental Policy, University College
Dublin, Belfield, Dublin 4, Ireland. (3) Norwegian Institute for Air Research (NILU), 2027-Kjeller, Norway. (4)
Centre International de Recherche sur l’Environnement et le Développement (CIRED), 45 Avenue de la Belle
Gabrielle, 94736 Nogent-sur-Marne Cedex, France
Presenting author email: [email protected]
Summary
This research analysed two alternative modelling scenarios for realising an Irish Government Climate Action Policy Plan to
deploy 400,000 heat pumps to 2030 in existing dwellings with the aim of reducing greenhouse emissions and PM2.5 ambient
concentrations. In Scenario 1 the heat pumps replace oil, natural gas, solid fuel, and electric heating systems across the
country without any refined spatial targeting. In Scenario 2 a similar deployment takes place except that hot-spots of high
PM2.5 ambient concentrations from residential heating emissions are included. The IIASA GAINS Integrated Assessment
Model was used to calculate emissions from residential heating. The chemistry-transport model EMEP was used for
estimating PM2.5 ambient concentrations. In the targeted scenario (Scenario 2), directing a mere 3% of the 400,000 heat-
pumps to replace solid-fuel home heating systems gave a similar progress on climate goals as Scenario 1, but with a
substantial decrease on average PM2.5 ambient concentrations during the heating season of 20-34%.
Introduction
Electrification of residential heating and investment in building energy efficiency are central pillars of many national
strategies to reduce carbon emissions from the built environment sector. Ireland has a strong dependence on oil use for
central heating and a substantial share of homes still using solid fuels. The current national strategy calls for the retrofitting of
400,000 home heating systems with heat pumps by 2030, principally replacing oil or solid fuel systems. However, the
implications for air quality are not clear. The objective is to add to the climate policy positive outcomes for air quality.
Methodology and Results
The reference simulation was for the year 2015. The chemistry-transport model EMEP was used in two domains: European-
wide and Ireland, the latter in a 2kmx2km resolution. The simulation for Europe produced the boundary conditions for the
Ireland domain. To produce the meteorological data for both domains we used the Weather Research and Forecast Model
(WRF) version 3.9.1 with NCEP FNL input data in a nested system. The bulk of the emissions used in the air quality
modelling for Ireland were the ones reported to the UN through the Convention on Long-Range Transboundary Air Pollution
for 2015 and spatially distributed in the MapEire project. Shipping, traffic, and residential heating were bottom-up emissions
(Johansson et al., 2017, Fu et al., 2017, Kelly et al., 2020; Ó Broin et al., 2019). For the scenarios we change the residential
heating emissions calculated with an Irish instance of the IIASA GAINS Integrated Assessment Model (Kelly et al., 2017)
and considering scenarios assumptions. The heat pump deployment policy will lead to a 18% reduction in final energy
demand and a 28% reduction in CO2 emissions from the residential sector in both scenarios. The reductions in PM2.5
emissions are of 10 and 12% for Scenario 1 and Scenario 2, respectively. The decrease in PM2.5 concentrations averaged for
the heating season is lower than 10% for Scenario 1 and 20-34% for Scenario 2.
Conclusions
This work shows that a focused deployment of the national heat pump target on homes that use solid-fuel for heating offer
similar progress on climate goals but with a substantial impact in terms of reducing air pollution hot spots. Moreover, these
targeted communities are often in areas of relative deprivation and, thus, the direct support for fabric retrofitting and heat
pump technology installation offers the potential to advance climate, air and just transition policy ambitions simultaneously.
Acknowledgement
This work builds on the Irish EPA project - CON+AIR: Addressing Conflicts of Climate and Air Pollution (Ó Broin et al.,
2019). The EnvEcon team was supported by the Irish Department of Environment, Climate and Communications (DECC).
References
Fu, M., Kelly, J.A., Clinch, J.P., 2017. Estimating annual average daily traffic and transport emissions for a national road
network: A bottom-up methodology for both nationally-aggregated and spatially-disaggregated results. Journal Transport
Geography 58, 186–195.
Johansson, L., Jalkanen, J.-P., Kukkonen, J., 2017. Global assessment of shipping emissions in 2015 on a high spatial and
temporal resolution. Atmos. Environ. 167, 403–415.
Kelly, A., Chiodi, A., Fu, M., Deane, P., Gallachóir, B.P.Ó., 2017. Climate and Air Policy in Ireland: Synergies and
Tensions–A GAINS Ireland and Irish TIMES analysis (No. 2013- CCRP- MS.14). ENVIRONMENTAL PROTECTION
AGENCY An Ghníomhaireacht um Chaomhnú Comhshaoil PO Box 3000, Johnstown Castle, Co. Wexford, Ireland.
Kelly, J.A., Clinch, J.P., Kelleher, L., Shahab, S., 2020. Enabling a just transition: A composite indicator for assessing home-
heating energy-poverty risk and the impact of environmental policy measures. Energy Policy 146, 111791.
Ó Broin, E., Kelly, J.A., Sousa Santos, G., Grythe, H., Kelleher, L., 2019. CON+AIR: Addressing Conflicts of Climate and
Air Pollution. EPA Report #286. (No. 286). Environmental Protection Agency.
120

HOW LOW-COST SENSOR NETWORKS CAN IMPROVE AIR QUALITY MAPPING AND LOCAL EMISSION
INVENTORIES
S. Janssen, J. Sousa, H. Hooyberghs, W. Lefebvre and S. Vranckx
VITO, Boeretang 200, Mol, Belgium
Presenting author email: [email protected]
Summary
The recently completed DenCity project demonstrated the potential of using information from a low-cost air quality sensor
network to improve the quality of a modelled urban air quality map. In addition the methodology provides relevant
information about specific updates of the underlying traffic emission inventory. The methodology developed for Antwerp
(Belgium) is also applied for the city of LuanCheng (China) and confirms the findings and the potential of this new emerging
technology.
Introduction
Low-cost sensor networks are gaining more and more attention and are being deployed in cities all over the world. A
fundamental question that arises is how useful the low-cost sensor data is and how it can be integrated in the existing air
quality management toolbox. The recently completed Dencity project which was setup as a Smart City demonstrator, aimed
to identify the potential as well as current shortcomings and obstacles of such a low-cost sensor network and its integration in
air quality modelling applications.
Methodology and Results
Within the smart zone of the city of Antwerp, Belgium an air quality
sensor network was deployed and generated a continuous stream of
near real time air quality data. In parallel a near real time application
of the ATMO-Street model (Lefebvre et al, 2013) was setup to
provide high resolution air quality maps at an hourly basis (Fig 1).
The modelled maps take into account near real time meteorology as
well as data from the fixed monitoring network of the Flemish
Environment agency. However, no real time traffic information is
currently available at different road links. As an alternative, use was
made of modelled annual averaged traffic volumes which are
modulated by seasonal, weekly and daily time profiles. In this way
local and accidental traffic events are not picked up by the modelling
chain and as such are not reflected in the air quality maps.
Within the Dencity project, it was demonstrated how sensor network
data collected within the smart zone has the potential to mitigate this
problem via a data assimilation methodology. Sensor network data
and the modelled map are fused by an ensemble Kalman filter. In this
data assimilation procedure the traffic emissions are taken as input
variables with a given uncertainty. Subsequently this input is
translated by the model into a concentration field respecting model
characteristics such as street canyon effects and inter-street
dependency (Fig 2). By applying this methodology, is was
demonstrated than an updated air quality map can be produced taking
into account local sensor data, in the same time providing updated
information about the underlying emission strengths.
The same methodology was subsequently applied for the city of
LuanCheng, China. Here the focus was on PM2.5 concentrations
collected by a city wide low-cost sensor network. Also in this
application combining high resolution model with a low-cost sensor
data set clearly illustrated that the mapping results improved, in the same time giving value update about unknown local PM10
sources. The latter is seen as an additional promising application of low-cost sensor technology.
Conclusions
The near real time ATMO-Street application developed within the Dencity project illustrated the potential of a combined use
of a model applications and sensor network data to provided more accurate air quality maps and in the same time provide
updated information about the underlying emission inventories.
References
W. Lefebvre, M. Van Poppel, B. Maiheu, S. Janssen, E. Dons, Evaluation of the RIO-IFDM-street canyon model chain,
Atmospheric Environment 77 (2013) 325-337
Fig.1: Hourly ATMO-Street output for the city of
Antwerp.
Fig.2: Changes in the updated AMTO-Street map due to assimilation of the sensor data. Demonstration case with
3 sensors.
121
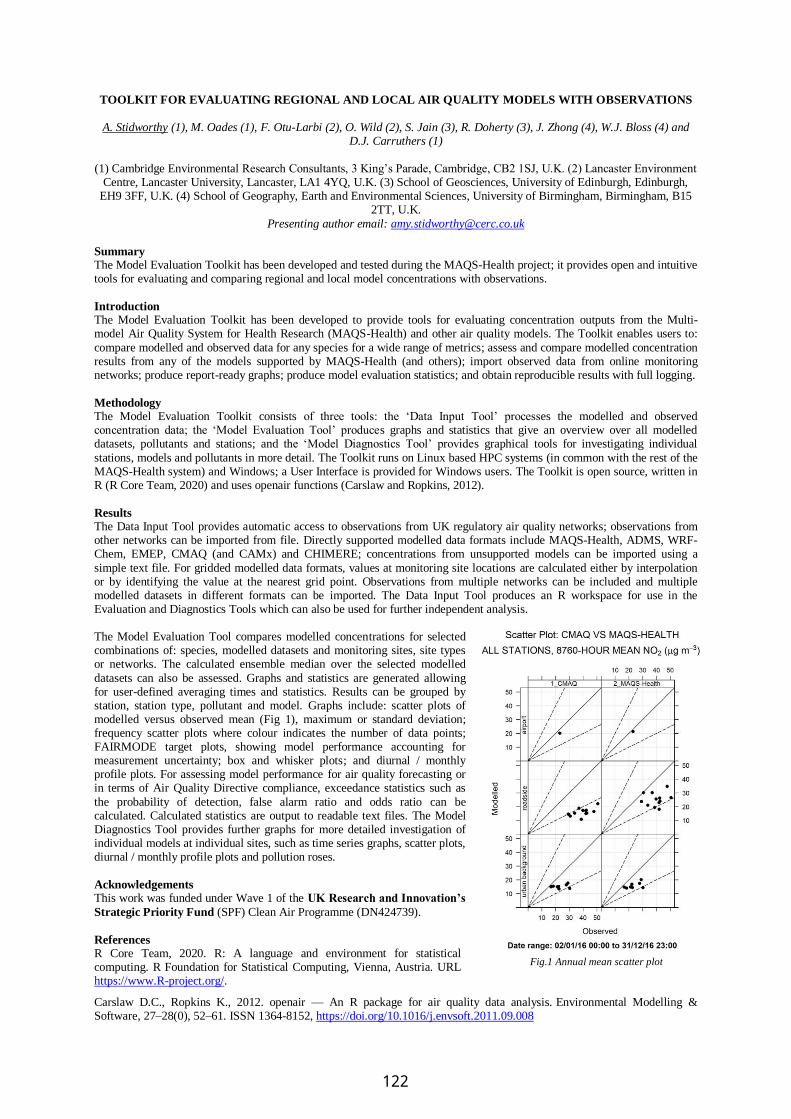
TOOLKIT FOR EVALUATING REGIONAL AND LOCAL AIR QUALITY MODELS WITH OBSERVATIONS
A. Stidworthy (1), M. Oades (1), F. Otu-Larbi (2), O. Wild (2), S. Jain (3), R. Doherty (3), J. Zhong (4), W.J. Bloss (4) and
D.J. Carruthers (1)
(1) Cambridge Environmental Research Consultants, 3 King’s Parade, Cambridge, CB2 1SJ, U.K. (2) Lancaster Environment Centre, Lancaster University, Lancaster, LA1 4YQ, U.K. (3) School of Geosciences, University of Edinburgh, Edinburgh,
EH9 3FF, U.K. (4) School of Geography, Earth and Environmental Sciences, University of Birmingham, Birmingham, B15 2TT, U.K.
Presenting author email: [email protected]
Summary The Model Evaluation Toolkit has been developed and tested during the MAQS-Health project; it provides open and intuitive tools for evaluating and comparing regional and local model concentrations with observations.
Introduction The Model Evaluation Toolkit has been developed to provide tools for evaluating concentration outputs from the Multi-model Air Quality System for Health Research (MAQS-Health) and other air quality models. The Toolkit enables users to:
compare modelled and observed data for any species for a wide range of metrics; assess and compare modelled concentration results from any of the models supported by MAQS-Health (and others); import observed data from online monitoring networks; produce report-ready graphs; produce model evaluation statistics; and obtain reproducible results with full logging.
Methodology The Model Evaluation Toolkit consists of three tools: the ‘Data Input Tool’ processes the modelled and observed concentration data; the ‘Model Evaluation Tool’ produces graphs and statistics that give an overview over all modelled datasets, pollutants and stations; and the ‘Model Diagnostics Tool’ provides graphical tools for investigating individual
stations, models and pollutants in more detail. The Toolkit runs on Linux based HPC systems (in common with the rest of the MAQS-Health system) and Windows; a User Interface is provided for Windows users. The Toolkit is open source, written in R (R Core Team, 2020) and uses openair functions (Carslaw and Ropkins, 2012).
Results The Data Input Tool provides automatic access to observations from UK regulatory air quality networks; observations from other networks can be imported from file. Directly supported modelled data formats include MAQS-Health, ADMS, WRF-Chem, EMEP, CMAQ (and CAMx) and CHIMERE; concentrations from unsupported models can be imported using a
simple text file. For gridded modelled data formats, values at monitoring site locations are calculated either by interpolation or by identifying the value at the nearest grid point. Observations from multiple networks can be included and multiple modelled datasets in different formats can be imported. The Data Input Tool produces an R workspace for use in the Evaluation and Diagnostics Tools which can also be used for further independent analysis. The Model Evaluation Tool compares modelled concentrations for selected combinations of: species, modelled datasets and monitoring sites, site types or networks. The calculated ensemble median over the selected modelled
datasets can also be assessed. Graphs and statistics are generated allowing for user-defined averaging times and statistics. Results can be grouped by station, station type, pollutant and model. Graphs include: scatter plots of modelled versus observed mean (Fig 1), maximum or standard deviation; frequency scatter plots where colour indicates the number of data points; FAIRMODE target plots, showing model performance accounting for measurement uncertainty; box and whisker plots; and diurnal / monthly profile plots. For assessing model performance for air quality forecasting or in terms of Air Quality Directive compliance, exceedance statistics such as
the probability of detection, false alarm ratio and odds ratio can be calculated. Calculated statistics are output to readable text files. The Model Diagnostics Tool provides further graphs for more detailed investigation of individual models at individual sites, such as time series graphs, scatter plots, diurnal / monthly profile plots and pollution roses.
Acknowledgements This work was funded under Wave 1 of the UK Research and Innovation’s
Strategic Priority Fund (SPF) Clean Air Programme (DN424739).
References R Core Team, 2020. R: A language and environment for statistical computing. R Foundation for Statistical Computing, Vienna, Austria. URL https://www.R-project.org/.
Carslaw D.C., Ropkins K., 2012. openair — An R package for air quality data analysis. Environmental Modelling & Software, 27–28(0), 52–61. ISSN 1364-8152, https://doi.org/10.1016/j.envsoft.2011.09.008
Fig.1 Annual mean scatter plot
122

VALIDATION STRATEGIES FOR ATMOSPHERIC SATELLITE MISSIONS LIKE SENTINEL-5P – CASE
STUDY OF A NO2 AIRBORNE MAPPING CAMPAIGN OVER BELGIUM
F. Tack (1), A. Merlaud (1), M. Sha (1), D. Iordache (2), B. Bomans (2), D. Schuettemeyer (3) and M. Van Roozendael (1)
(1) BIRA-IASB, Royal Belgian Institute for Space Aeronomy, Brussels, Belgium; (2) VITO, Flemish Institute for
Technological Research, Mol, Belgium; (3) ESA-ESTEC, European Space Agency, Noordwijk, The Netherlands
Presenting author email: [email protected]
Summary
Sentinel-5 precursor (S-5P), launched on 13 October 2017, is the first mission of the Copernicus Programme dedicated to the
monitoring of air quality, climate, ozone and UV radiation. The S-5P characteristics, such as the fine spatial resolution,
introduce many new opportunities and challenges, requiring to carefully assess the quality and validity of the generated data
products by comparison with independent measurements and analyses. In the framework of the S-5P campaigns, several key
airborne, mobile and stationary instruments are being deployed in different locations to validate key atmospheric TROPOMI
products such as NO2 and CO. After providing an overview of the different campaigns and discussing validation strategies,
we will focus on an airborne mapping campaign that was conducted over key cities in Belgium to map tropospheric NO2.
Introduction
In the presented study, the TROPOMI tropospheric NO2 level2 product (OFFL v1.03.01; 3.5 km × 7 km at nadir
observations) has been validated over strongly polluted urban regions in Belgium by comparison with coincident high-
resolution Airborne Prism EXperiment (APEX) remote sensing observations (∼75 m × 120 m). NO2 is a key pollutant with a
direct impact on human health and an important precursor of tropospheric ozone and particulate matter. Satellite products can
be optimally assessed based on (APEX) airborne remote sensing observations, since a large amount of satellite pixels can be
fully mapped at high accuracy and in a relatively short time interval, reducing the impact of spatiotemporal mismatches.
Additionally, such data sets allow to map and study the fine scale NO2 patterns, as well as the satellite subpixel variability
and impact of signal smoothing due to its finite satellite pixel size, typically coarser than fine-scale gradients in the urban
NO2 field.
Methodology and Results
In the framework of the S-5P validation campaign over Belgium (S5PVAL-BE), the APEX imaging spectrometer has been
deployed during four mapping flights (26–29 June 2019) over Brussels and the harbour and city of Antwerp, in order to map
the horizontal distribution of tropospheric NO2. For each flight, 10 to 20 TROPOMI pixels were fully covered by
approximately 2700 to 4000 APEX measurements within each TROPOMI pixel. The TROPOMI and APEX NO2 vertical
column density (VCD) retrieval schemes are similar in concept. Overall, for the ensemble of the four flights, the standard
TROPOMI NO2 VCD product is well correlated (R = 0.92) but biased negatively by −1.2 ± 1.2 × 10¹⁵ molec cm−2 or −14% ±
12%, on average, with respect to coincident APEX NO2 retrievals. When
replacing the coarse 1° TM5 a priori NO2 profiles by NO2 profile shapes
from the Copernicus Atmospheric Monitoring Service (CAMS) regional
chemistry transport model (CTM) ensemble at 0.1°, R is 0.94 and the slope
increases from 0.82 to 0.93. The bias is reduced to −0.1 ± 1.0 × 10¹⁵ molec
cm−2 or −1.0% ± 12%. The absolute difference is on average 1.3 × 10¹⁵
molec cm−2 (16%) and 0.7 × 10¹⁵ molec cm−2 (9%), when comparing
APEX NO2 VCDs with TM5-MP-based and CAMS-based NO2 VCDs,
respectively. Both sets of retrievals are well within the mission accuracy
requirement of a maximum bias of 25%–50% for the TROPOMI
tropospheric NO2 product for all individual compared pixels. Additionally,
the APEX data set allows the study of TROPOMI subpixel variability and
impact of signal smoothing due to its finite satellite pixel size, typically
coarser than fine-scale gradients in the urban NO2 field, as can be observed
in Fig.1. For a case study in the Antwerp region, the current TROPOMI
data underestimate localized enhancements and overestimate background
values by approximately 1–2 × 10¹⁵ molec cm−2 (10%–20%).
Conclusions
The study demonstrates that the urban/industrial NO2 distribution, and its
fine scale variability, can be mapped accurately based on airborne mapping
observations. It provides a unique data set for air quality studies, as well as
a set of reference data for validation of satellite data quality and
quantification of the retrieval uncertainties. Different validation strategies
will be presented, also for other species like CO. The presented validation
strategies can be valuable for the assessment of products from future
atmospheric satellite missions, such as S-5, S-4, TEMPO and GEMS.
Fig. 1 APEX tropospheric NO2 VCD grids retrieved over the city and harbour of Antwerp on 27 June
2019. Coinciding TROPOMI tropospheric NO2
VCD retrievals are overlain as colour-coded polygons. White dots are the main stacks, present in
the emission inventory (© Google Maps).
123

ROAD TRAFFIC CONTRIBUTION TO URBAN BLACK CARBON CONCENTRATIONS: COIMBRA CASE STUDY
Noela Pina (1), Susana Marta Almeida (2), Inês Lopes (2), Joana Coutinho (2), Ismael Casotti Rienda (3), João Pedro
Rodrigues (1), Marta Ferreira (1), Teresa Nunes (3), Casimiro Pio (3), Celia Alves (3), Oxana Tchepel (1)
(1) CITTA, Faculty of Sciences and Technology, University of Coimbra, Portugal; (2) C2TN, Instituto Superior Técnico, Portugal; (3) CESAM, Department of Environment and Planning, University of Aveiro, Portugal
Presenting author email: [email protected]
Summary This study aims to quantify local contribution of road traffic to urban concentrations of black carbon (BC) with a high spatial and temporal resolution by implementing urban scale modelling and measurements. The ADMS-Roads Gaussian model was applied at urban scale and validated with data from gravimetric and optical measurements obtained during 6-month measurement campaign. The road traffic was identified as a major source of BC (83.7%), but the biomass burning contribution achieved 32% during the winter period. Introduction Black carbon (BC) has negative impacts on human health and climate. To define an effective pollution abatement policy, it is important to identify the contribution of different pollution sources that could be a challenge. In urban areas, road traffic is recognised as one of the key sources of BC. For this study, the following objectives are defined: (i) implementation of emission and dispersion modelling of black carbon at urban scale and (ii) validation of the modelling results using measurements from experimental campaign in Coimbra, Portugal. Methodology and Results To address the defined objectives, a detailed characterization of traffic-related BC concentrations at urban scale was implemented using an integrated modelling approach and in-situ aerosol measurements. A modelling cascade based on transportation-emission-dispersion modelling was implemented for a medium-sized Portuguese city, Coimbra (Figure 1). The emission model has been extended to include a new module for quantification of BC emissions from road traffic. Also, characterization of emissions from residential combustion was implemented considering detailed geostatistical information on residential buildings and Heating Degree Days. A new generation Gaussian dispersion model (ADMS-Roads) based on up-to-date physics is used to calculate concentrations at city scale. For the validation of modelling results, a measurement campaign was implemented (January - June 2019). Optical BC measurements were obtained by an aethalometer model AE33 and used to analyse the contribution of various combustion sources, such a diesel and biomass burning, on a minute basis. Additionally, the gravimetric quantification of PM10 filters was performed (Alves et al., 2021) and the carbonaceous content (organic and elemental carbon, OC and EC) of PM10 samples was analysed by a thermal-optical transmission technique. Conclusions Based on the modelling approach and aerosol measurements implemented in this work, the local contribution of road traffic to BC aerosols was obtained. The measurement system used in the study allows an insight on the composition of light absorbing carbonaceous particles and distinguish among the different signatures of various combustion sources such as diesel and biomass, with high temporal resolution. During the six-month study period, average BC concentration at road side location was 4.34 µg/m3 and significant differences were observed for cold (5.62 µg/m3) and warm (3.34 µg/m3) periods. Based on modelling results and measurements, the road traffic was identified as a major source of BC (83.7%), but the biomass burning contribution achieved 32% during the winter. The methodology implemented in this work provides an opportunity to analyse the contribution of different emission sources to BC concentrations in urban area and to explore their spatial and temporal variability relevant for population exposure studies and mitigation policies. Acknowledgement This work was supported by ISY-AIR project (MIT-EXPL/IRA/0023/2017), TRAPHIC project (PTDC/ECM-URB/3329/2014, POCI-01-0145-FEDER-016729), FCT PhD grant of N. Pina (PD/BD/128048/2016) and COST Action Colossal (CA16109). References Alves C., Rienda I.C., Vicente A., Vicente E., Gonçalves C., Candeias C., Rocha F., Lucarelli F., Pazzi G., Kováts N., Hubai K., Pio C., Tchepel O., 2021. Morphological properties, chemical composition, cancer risks and toxicological potential of airborne particles from traffic and urban background sites. Atmospheric Research, v.264, Article Number: 105837. https://doi.org/10.1016/j.atmosres.2021.105837
Figure 1. Traffic contribution to daily average BC concentrations for a selected day in Coimbra urban area (PT), and location of road traffic (red) and urban background (blue) measurement points
124
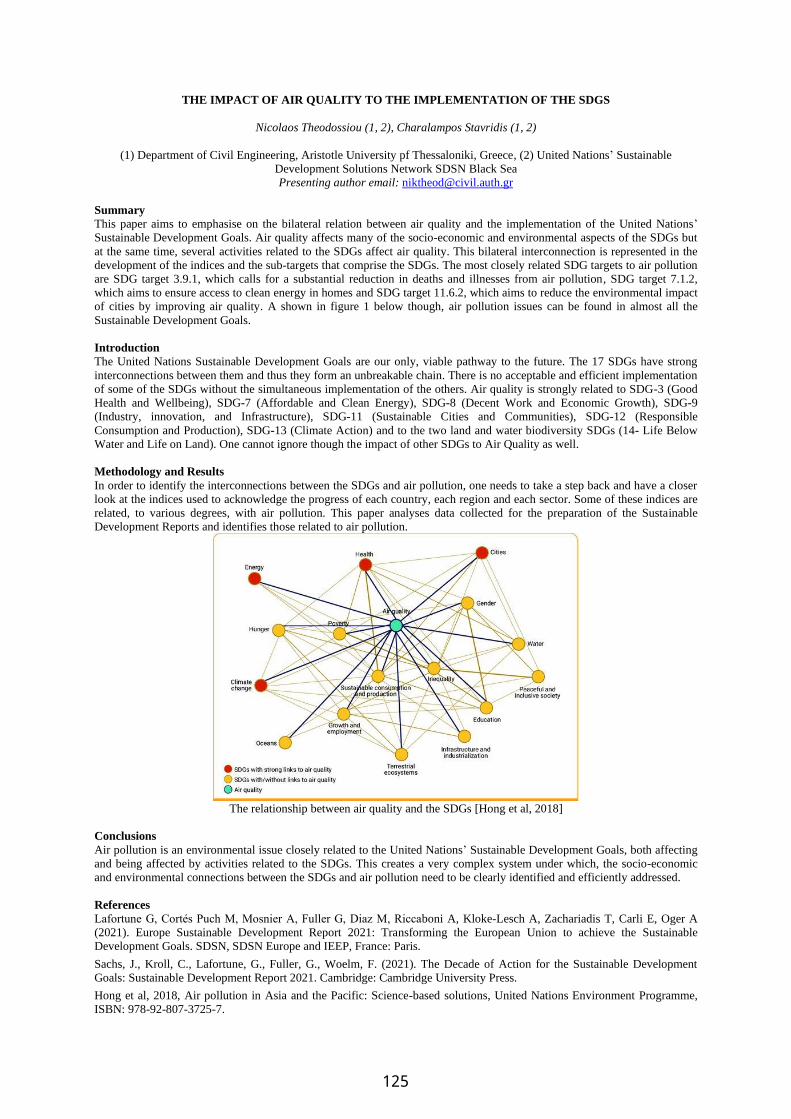
THE IMPACT OF AIR QUALITY TO THE IMPLEMENTATION OF THE SDGS
Nicolaos Theodossiou (1, 2), Charalampos Stavridis (1, 2)
(1) Department of Civil Engineering, Aristotle University pf Thessaloniki, Greece, (2) United Nations’ Sustainable
Development Solutions Network SDSN Black Sea
Presenting author email: [email protected]
Summary
This paper aims to emphasise on the bilateral relation between air quality and the implementation of the United Nations’
Sustainable Development Goals. Air quality affects many of the socio-economic and environmental aspects of the SDGs but
at the same time, several activities related to the SDGs affect air quality. This bilateral interconnection is represented in the
development of the indices and the sub-targets that comprise the SDGs. The most closely related SDG targets to air pollution
are SDG target 3.9.1, which calls for a substantial reduction in deaths and illnesses from air pollution, SDG target 7.1.2,
which aims to ensure access to clean energy in homes and SDG target 11.6.2, which aims to reduce the environmental impact
of cities by improving air quality. A shown in figure 1 below though, air pollution issues can be found in almost all the
Sustainable Development Goals.
Introduction
The United Nations Sustainable Development Goals are our only, viable pathway to the future. The 17 SDGs have strong
interconnections between them and thus they form an unbreakable chain. There is no acceptable and efficient implementation
of some of the SDGs without the simultaneous implementation of the others. Air quality is strongly related to SDG-3 (Good
Health and Wellbeing), SDG-7 (Affordable and Clean Energy), SDG-8 (Decent Work and Economic Growth), SDG-9
(Industry, innovation, and Infrastructure), SDG-11 (Sustainable Cities and Communities), SDG-12 (Responsible
Consumption and Production), SDG-13 (Climate Action) and to the two land and water biodiversity SDGs (14- Life Below
Water and Life on Land). One cannot ignore though the impact of other SDGs to Air Quality as well.
Methodology and Results
In order to identify the interconnections between the SDGs and air pollution, one needs to take a step back and have a closer
look at the indices used to acknowledge the progress of each country, each region and each sector. Some of these indices are
related, to various degrees, with air pollution. This paper analyses data collected for the preparation of the Sustainable
Development Reports and identifies those related to air pollution.
The relationship between air quality and the SDGs [Hong et al, 2018]
Conclusions
Air pollution is an environmental issue closely related to the United Nations’ Sustainable Development Goals, both affecting
and being affected by activities related to the SDGs. This creates a very complex system under which, the socio-economic
and environmental connections between the SDGs and air pollution need to be clearly identified and efficiently addressed.
References
Lafortune G, Cortés Puch M, Mosnier A, Fuller G, Diaz M, Riccaboni A, Kloke-Lesch A, Zachariadis T, Carli E, Oger A
(2021). Europe Sustainable Development Report 2021: Transforming the European Union to achieve the Sustainable
Development Goals. SDSN, SDSN Europe and IEEP, France: Paris.
Sachs, J., Kroll, C., Lafortune, G., Fuller, G., Woelm, F. (2021). The Decade of Action for the Sustainable Development
Goals: Sustainable Development Report 2021. Cambridge: Cambridge University Press.
Hong et al, 2018, Air pollution in Asia and the Pacific: Science-based solutions, United Nations Environment Programme,
ISBN: 978-92-807-3725-7.
125

AQ-WATCH’S AIR QUALITY SOURCE ATTRIBUTION AND MITIGATION SERVICE
R. Timmermans (1), G. Pfister (2), M. Guevara (3), N. Huneeus (4), R. Kranenburg (1), R. Kumar (2), E. Dammers (1), Y. Boose (5), M. Dan (6), G. Brasseur (7), C. Li (7), C. Granier (8), and M. Schaap (1)
(1) Department on Climate, Air and Sustainability, TNO, PO Box 80015, 3508TA Utrecht, The Netherlands; (2) University Corporation for Atmospheric Research (UCAR), Colorado, US; (3) Barcelona Supercomputing Centre (BSC), Barcelona, Spain; (4) University de Chile, Santiago de Chile, Chile; (5) Breezometer, Haifa, Israel; (6) BCC, Beijing, China; (7) Max
Planck Institute for Meteorology, Hamburg, Germany; (8) CNRS, France Presenting author email: [email protected]
Summary Within the AQ-WATCH project, a user driven operational source apportionment and mitigation service has been set-up providing information on the main sources (both sector and source regions) contributing to concentrations of nitrogen dioxide (NO2), particulate matter (PM) and carbon monoxide (CO) and allowing decision-makers to evaluate the efficiency of proposed mitigation measures in different industrial sectors on the level of air pollutants. The services are demonstrated in three different populated regions of the world (the Colorado Northern Front Range, the region around Santiago de Chile and the Chinese city of Cangzhou) to establish the potential for their widespread adoption to other regions in the world beyond the lifetime of the project. Introduction Within the EU Horizon2020 project AQ-watch (https://www.aq-watch.eu/), several air quality services are set-up that provide information on the past, current and future (next 2-3 days) air quality situation in the world and specifically for three target regions (Santiago de Chile, Colorado Northern Front Range and Beijing). The aim of the work presented here is to go a step further by providing insight in the dominant source sectors and regions responsible for (high) levels of air pollution and what the expected impact is of emission reductions in the selected source sectors. This information is crucial to support the design of effective mitigation strategies for improving air quality and, hence, public health in the target regions. Methodology and Results The services are based on a set of different air quality models, source attribution and mitigation methods. These include the LOTOS-EUROS model for NO2 and PM including its tagging method (Kranenburg et al. 2013) and the WRF-CHEM model (https://www2.acom.ucar.edu/wrf-chem) including specific tracers for source attribution. The mitigation service is based on sets of model runs (with the LOTOS-EUROS model and CHIMERE-SIRANE model chains) with different emission reduction scenarios, and the establishment of relationships between emission changes and concentrations. Figure 1 shows an example of the information provided by the source attribution service illustrating the variability in the main sources contributing to PM10 levels. Validation of modelled concentrations with observations showed some biases in modelled concentrations. These are attributed to biases in emissions, underestimated dust production, and errors in the input meteorology. The use of regional emission inventories showed an improved performance. The dust production can be improved through updates of landuse maps and adapting this to the region of interest.mFor areas with complex topography, high resolution meteorological input is desired to correctly represent the meteorological conditions. Conclusions We have demonstrated two air quality services for policy applications in three regions of the world. The service is set-up in a generalised way allowing transfer to other regions in the world but the quality of the results is depending on the quality of the available model input information e.g. emissions and their distribution in time and space, meteorological data and land use information. Acknowledgement This work has received funding from the European Union’s Horizon 2020 research and innovation programme under grant agreement No 870301 References Kranenburg, R., Segers, A.J.J., Hendriks, C., Schaap, M., 2013. Source apportionment using LOTOS-EUROS: module description and evaluation. Geosci. Model Dev. 6, 721–733. https://doi.org/10.5194/gmd-6-721-2013
Fig.1 Example of 6 weeks source sector attribution of PM10 for a station in Northern Colorado Front Range
126
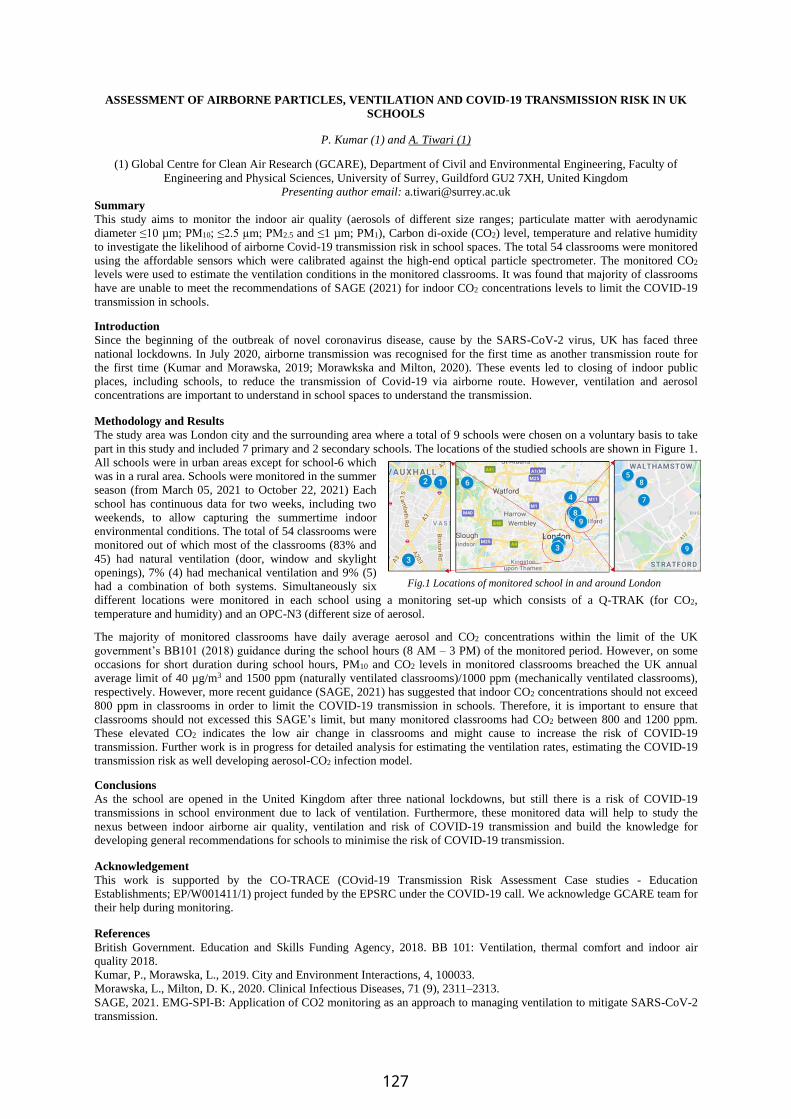
ASSESSMENT OF AIRBORNE PARTICLES, VENTILATION AND COVID-19 TRANSMISSION RISK IN UK
SCHOOLS
P. Kumar (1) and A. Tiwari (1)
(1) Global Centre for Clean Air Research (GCARE), Department of Civil and Environmental Engineering, Faculty of
Engineering and Physical Sciences, University of Surrey, Guildford GU2 7XH, United Kingdom
Presenting author email: [email protected]
Summary
This study aims to monitor the indoor air quality (aerosols of different size ranges; particulate matter with aerodynamic
diameter ≤10 µm; PM10; ≤2.5 µm; PM2.5 and ≤1 µm; PM1), Carbon di-oxide (CO2) level, temperature and relative humidity
to investigate the likelihood of airborne Covid-19 transmission risk in school spaces. The total 54 classrooms were monitored
using the affordable sensors which were calibrated against the high-end optical particle spectrometer. The monitored CO2
levels were used to estimate the ventilation conditions in the monitored classrooms. It was found that majority of classrooms
have are unable to meet the recommendations of SAGE (2021) for indoor CO2 concentrations levels to limit the COVID-19
transmission in schools.
Introduction
Since the beginning of the outbreak of novel coronavirus disease, cause by the SARS-CoV-2 virus, UK has faced three
national lockdowns. In July 2020, airborne transmission was recognised for the first time as another transmission route for
the first time (Kumar and Morawska, 2019; Morawkska and Milton, 2020). These events led to closing of indoor public
places, including schools, to reduce the transmission of Covid-19 via airborne route. However, ventilation and aerosol
concentrations are important to understand in school spaces to understand the transmission.
Methodology and Results
The study area was London city and the surrounding area where a total of 9 schools were chosen on a voluntary basis to take
part in this study and included 7 primary and 2 secondary schools. The locations of the studied schools are shown in Figure 1.
All schools were in urban areas except for school-6 which
was in a rural area. Schools were monitored in the summer
season (from March 05, 2021 to October 22, 2021) Each
school has continuous data for two weeks, including two
weekends, to allow capturing the summertime indoor
environmental conditions. The total of 54 classrooms were
monitored out of which most of the classrooms (83% and
45) had natural ventilation (door, window and skylight
openings), 7% (4) had mechanical ventilation and 9% (5)
had a combination of both systems. Simultaneously six
different locations were monitored in each school using a monitoring set-up which consists of a Q-TRAK (for CO2,
temperature and humidity) and an OPC-N3 (different size of aerosol.
The majority of monitored classrooms have daily average aerosol and CO2 concentrations within the limit of the UK
government’s BB101 (2018) guidance during the school hours (8 AM – 3 PM) of the monitored period. However, on some
occasions for short duration during school hours, PM10 and CO2 levels in monitored classrooms breached the UK annual
average limit of 40 µg/m3 and 1500 ppm (naturally ventilated classrooms)/1000 ppm (mechanically ventilated classrooms),
respectively. However, more recent guidance (SAGE, 2021) has suggested that indoor CO2 concentrations should not exceed
800 ppm in classrooms in order to limit the COVID-19 transmission in schools. Therefore, it is important to ensure that
classrooms should not excessed this SAGE’s limit, but many monitored classrooms had CO2 between 800 and 1200 ppm.
These elevated CO2 indicates the low air change in classrooms and might cause to increase the risk of COVID-19
transmission. Further work is in progress for detailed analysis for estimating the ventilation rates, estimating the COVID-19
transmission risk as well developing aerosol-CO2 infection model.
Conclusions
As the school are opened in the United Kingdom after three national lockdowns, but still there is a risk of COVID-19
transmissions in school environment due to lack of ventilation. Furthermore, these monitored data will help to study the
nexus between indoor airborne air quality, ventilation and risk of COVID-19 transmission and build the knowledge for
developing general recommendations for schools to minimise the risk of COVID-19 transmission.
Acknowledgement
This work is supported by the CO-TRACE (COvid-19 Transmission Risk Assessment Case studies - Education
Establishments; EP/W001411/1) project funded by the EPSRC under the COVID-19 call. We acknowledge GCARE team for
their help during monitoring.
References
British Government. Education and Skills Funding Agency, 2018. BB 101: Ventilation, thermal comfort and indoor air
quality 2018.
Kumar, P., Morawska, L., 2019. City and Environment Interactions, 4, 100033.
Morawska, L., Milton, D. K., 2020. Clinical Infectious Diseases, 71 (9), 2311–2313.
SAGE, 2021. EMG-SPI-B: Application of CO2 monitoring as an approach to managing ventilation to mitigate SARS-CoV-2
transmission.
Fig.1 Locations of monitored school in and around London
127
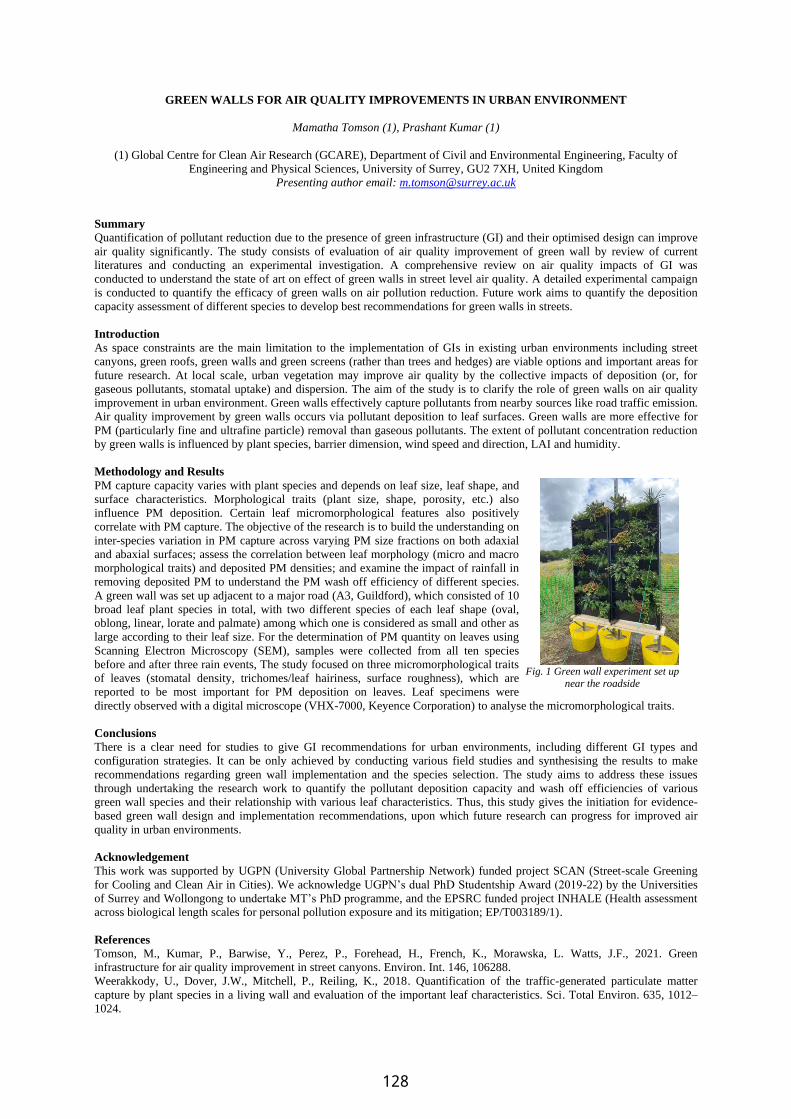
GREEN WALLS FOR AIR QUALITY IMPROVEMENTS IN URBAN ENVIRONMENT
Mamatha Tomson (1), Prashant Kumar (1)
(1) Global Centre for Clean Air Research (GCARE), Department of Civil and Environmental Engineering, Faculty of
Engineering and Physical Sciences, University of Surrey, GU2 7XH, United Kingdom
Presenting author email: [email protected]
Summary
Quantification of pollutant reduction due to the presence of green infrastructure (GI) and their optimised design can improve
air quality significantly. The study consists of evaluation of air quality improvement of green wall by review of current
literatures and conducting an experimental investigation. A comprehensive review on air quality impacts of GI was
conducted to understand the state of art on effect of green walls in street level air quality. A detailed experimental campaign
is conducted to quantify the efficacy of green walls on air pollution reduction. Future work aims to quantify the deposition
capacity assessment of different species to develop best recommendations for green walls in streets.
Introduction
As space constraints are the main limitation to the implementation of GIs in existing urban environments including street
canyons, green roofs, green walls and green screens (rather than trees and hedges) are viable options and important areas for
future research. At local scale, urban vegetation may improve air quality by the collective impacts of deposition (or, for
gaseous pollutants, stomatal uptake) and dispersion. The aim of the study is to clarify the role of green walls on air quality
improvement in urban environment. Green walls effectively capture pollutants from nearby sources like road traffic emission.
Air quality improvement by green walls occurs via pollutant deposition to leaf surfaces. Green walls are more effective for
PM (particularly fine and ultrafine particle) removal than gaseous pollutants. The extent of pollutant concentration reduction
by green walls is influenced by plant species, barrier dimension, wind speed and direction, LAI and humidity.
Methodology and Results
PM capture capacity varies with plant species and depends on leaf size, leaf shape, and
surface characteristics. Morphological traits (plant size, shape, porosity, etc.) also
influence PM deposition. Certain leaf micromorphological features also positively
correlate with PM capture. The objective of the research is to build the understanding on
inter-species variation in PM capture across varying PM size fractions on both adaxial
and abaxial surfaces; assess the correlation between leaf morphology (micro and macro
morphological traits) and deposited PM densities; and examine the impact of rainfall in
removing deposited PM to understand the PM wash off efficiency of different species.
A green wall was set up adjacent to a major road (A3, Guildford), which consisted of 10
broad leaf plant species in total, with two different species of each leaf shape (oval,
oblong, linear, lorate and palmate) among which one is considered as small and other as
large according to their leaf size. For the determination of PM quantity on leaves using
Scanning Electron Microscopy (SEM), samples were collected from all ten species
before and after three rain events, The study focused on three micromorphological traits
of leaves (stomatal density, trichomes/leaf hairiness, surface roughness), which are
reported to be most important for PM deposition on leaves. Leaf specimens were
directly observed with a digital microscope (VHX-7000, Keyence Corporation) to analyse the micromorphological traits.
Conclusions
There is a clear need for studies to give GI recommendations for urban environments, including different GI types and
configuration strategies. It can be only achieved by conducting various field studies and synthesising the results to make
recommendations regarding green wall implementation and the species selection. The study aims to address these issues
through undertaking the research work to quantify the pollutant deposition capacity and wash off efficiencies of various
green wall species and their relationship with various leaf characteristics. Thus, this study gives the initiation for evidence-
based green wall design and implementation recommendations, upon which future research can progress for improved air
quality in urban environments.
Acknowledgement
This work was supported by UGPN (University Global Partnership Network) funded project SCAN (Street-scale Greening
for Cooling and Clean Air in Cities). We acknowledge UGPN’s dual PhD Studentship Award (2019-22) by the Universities
of Surrey and Wollongong to undertake MT’s PhD programme, and the EPSRC funded project INHALE (Health assessment
across biological length scales for personal pollution exposure and its mitigation; EP/T003189/1).
References
Tomson, M., Kumar, P., Barwise, Y., Perez, P., Forehead, H., French, K., Morawska, L. Watts, J.F., 2021. Green
infrastructure for air quality improvement in street canyons. Environ. Int. 146, 106288.
Weerakkody, U., Dover, J.W., Mitchell, P., Reiling, K., 2018. Quantification of the traffic-generated particulate matter
capture by plant species in a living wall and evaluation of the important leaf characteristics. Sci. Total Environ. 635, 1012–
1024.
Fig. 1 Green wall experiment set up
near the roadside
128
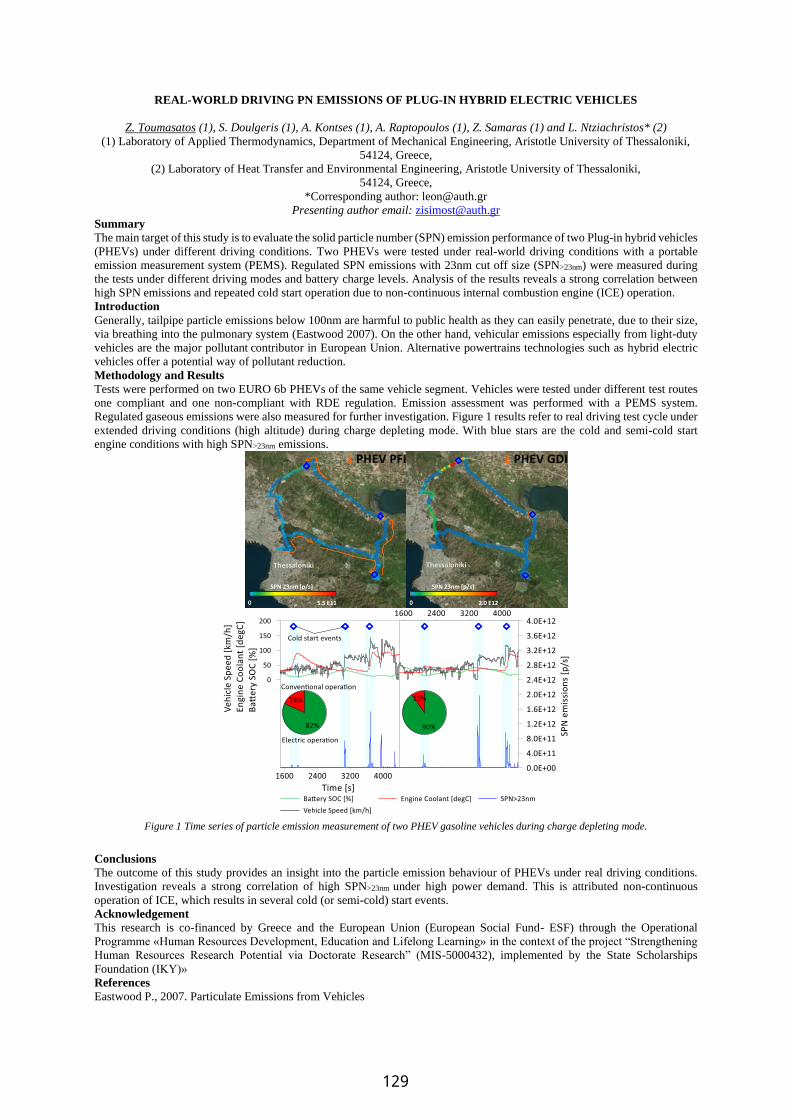
REAL-WORLD DRIVING PN EMISSIONS OF PLUG-IN HYBRID ELECTRIC VEHICLES
Z. Toumasatos (1), S. Doulgeris (1), A. Kontses (1), A. Raptopoulos (1), Z. Samaras (1) and L. Ntziachristos* (2)
(1) Laboratory of Applied Thermodynamics, Department of Mechanical Engineering, Aristotle University of Thessaloniki,
54124, Greece,
(2) Laboratory of Heat Transfer and Environmental Engineering, Aristotle University of Thessaloniki,
54124, Greece,
*Corresponding author: [email protected]
Presenting author email: [email protected]
Summary
The main target of this study is to evaluate the solid particle number (SPN) emission performance of two Plug-in hybrid vehicles
(PHEVs) under different driving conditions. Two PHEVs were tested under real-world driving conditions with a portable
emission measurement system (PEMS). Regulated SPN emissions with 23nm cut off size (SPN>23nm) were measured during
the tests under different driving modes and battery charge levels. Analysis of the results reveals a strong correlation between
high SPN emissions and repeated cold start operation due to non-continuous internal combustion engine (ICE) operation.
Introduction
Generally, tailpipe particle emissions below 100nm are harmful to public health as they can easily penetrate, due to their size,
via breathing into the pulmonary system (Eastwood 2007). On the other hand, vehicular emissions especially from light-duty
vehicles are the major pollutant contributor in European Union. Alternative powertrains technologies such as hybrid electric
vehicles offer a potential way of pollutant reduction. Methodology and Results
Tests were performed on two EURO 6b PHEVs of the same vehicle segment. Vehicles were tested under different test routes
one compliant and one non-compliant with RDE regulation. Emission assessment was performed with a PEMS system.
Regulated gaseous emissions were also measured for further investigation. Figure 1 results refer to real driving test cycle under
extended driving conditions (high altitude) during charge depleting mode. With blue stars are the cold and semi-cold start
engine conditions with high SPN>23nm emissions.
Figure 1 Time series of particle emission measurement of two PHEV gasoline vehicles during charge depleting mode.
Conclusions
The outcome of this study provides an insight into the particle emission behaviour of PHEVs under real driving conditions.
Investigation reveals a strong correlation of high SPN>23nm under high power demand. This is attributed non-continuous
operation of ICE, which results in several cold (or semi-cold) start events.
Acknowledgement
This research is co-financed by Greece and the European Union (European Social Fund- ESF) through the Operational
Programme «Human Resources Development, Education and Lifelong Learning» in the context of the project “Strengthening
Human Resources Research Potential via Doctorate Research” (MIS-5000432), implemented by the State Scholarships
Foundation (ΙΚΥ)»
References
Eastwood P., 2007. Particulate Emissions from Vehicles
0 5.5 E11
SPN 23nm [p/s]
0 2.0 E12
SPN 23nm [p/s]
129
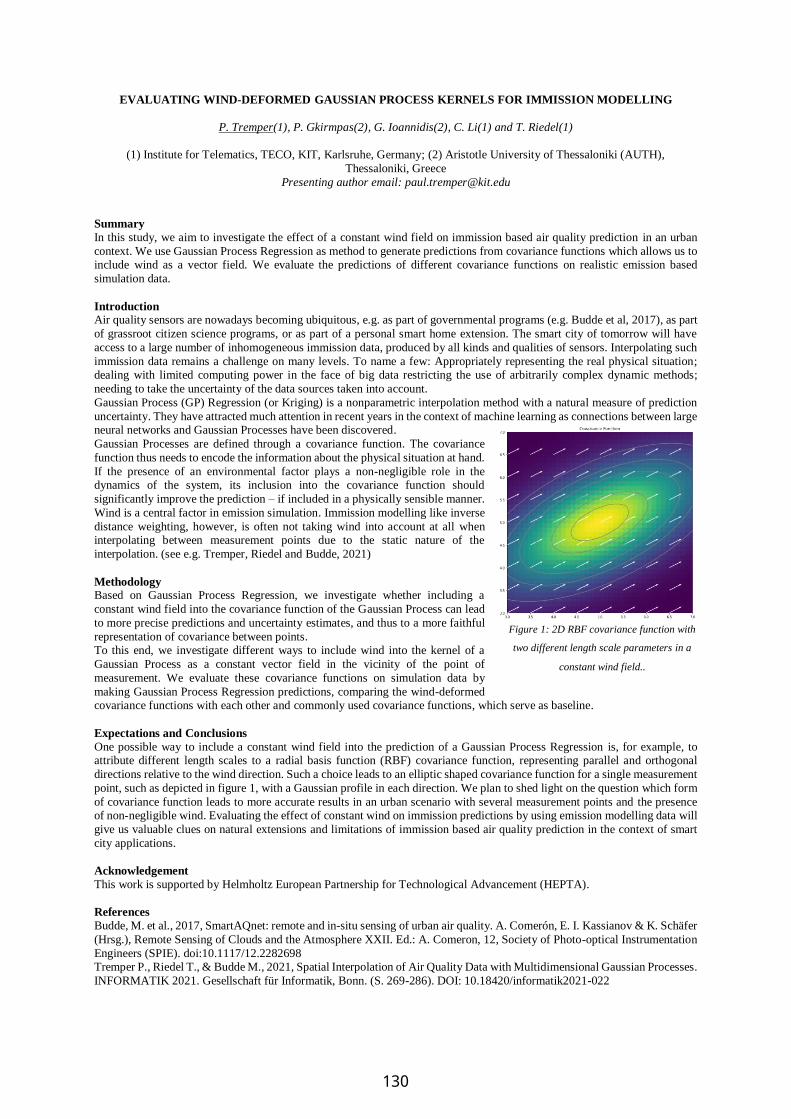
EVALUATING WIND-DEFORMED GAUSSIAN PROCESS KERNELS FOR IMMISSION MODELLING
P. Tremper(1), P. Gkirmpas(2), G. Ioannidis(2), C. Li(1) and T. Riedel(1)
(1) Institute for Telematics, TECO, KIT, Karlsruhe, Germany; (2) Aristotle University of Thessaloniki (AUTH),
Thessaloniki, Greece
Presenting author email: [email protected]
Summary
In this study, we aim to investigate the effect of a constant wind field on immission based air quality prediction in an urban
context. We use Gaussian Process Regression as method to generate predictions from covariance functions which allows us to include wind as a vector field. We evaluate the predictions of different covariance functions on realistic emission based
simulation data.
Introduction Air quality sensors are nowadays becoming ubiquitous, e.g. as part of governmental programs (e.g. Budde et al, 2017), as part
of grassroot citizen science programs, or as part of a personal smart home extension. The smart city of tomorrow will have
access to a large number of inhomogeneous immission data, produced by all kinds and qualities of sensors. Interpolating such
immission data remains a challenge on many levels. To name a few: Appropriately representing the real physical situation; dealing with limited computing power in the face of big data restricting the use of arbitrarily complex dynamic methods;
needing to take the uncertainty of the data sources taken into account.
Gaussian Process (GP) Regression (or Kriging) is a nonparametric interpolation method with a natural measure of prediction
uncertainty. They have attracted much attention in recent years in the context of machine learning as connections between large neural networks and Gaussian Processes have been discovered.
Gaussian Processes are defined through a covariance function. The covariance
function thus needs to encode the information about the physical situation at hand.
If the presence of an environmental factor plays a non-negligible role in the dynamics of the system, its inclusion into the covariance function should
significantly improve the prediction – if included in a physically sensible manner.
Wind is a central factor in emission simulation. Immission modelling like inverse
distance weighting, however, is often not taking wind into account at all when interpolating between measurement points due to the static nature of the
interpolation. (see e.g. Tremper, Riedel and Budde, 2021)
Methodology Based on Gaussian Process Regression, we investigate whether including a
constant wind field into the covariance function of the Gaussian Process can lead
to more precise predictions and uncertainty estimates, and thus to a more faithful
representation of covariance between points. To this end, we investigate different ways to include wind into the kernel of a
Gaussian Process as a constant vector field in the vicinity of the point of
measurement. We evaluate these covariance functions on simulation data by
making Gaussian Process Regression predictions, comparing the wind-deformed covariance functions with each other and commonly used covariance functions, which serve as baseline.
Expectations and Conclusions
One possible way to include a constant wind field into the prediction of a Gaussian Process Regression is, for example, to attribute different length scales to a radial basis function (RBF) covariance function, representing parallel and orthogonal
directions relative to the wind direction. Such a choice leads to an elliptic shaped covariance function for a single measurement
point, such as depicted in figure 1, with a Gaussian profile in each direction. We plan to shed light on the question which form
of covariance function leads to more accurate results in an urban scenario with several measurement points and the presence of non-negligible wind. Evaluating the effect of constant wind on immission predictions by using emission modelling data will
give us valuable clues on natural extensions and limitations of immission based air quality prediction in the context of smart
city applications.
Acknowledgement
This work is supported by Helmholtz European Partnership for Technological Advancement (HEPTA).
References
Budde, M. et al., 2017, SmartAQnet: remote and in-situ sensing of urban air quality. A. Comerón, E. I. Kassianov & K. Schäfer
(Hrsg.), Remote Sensing of Clouds and the Atmosphere XXII. Ed.: A. Comeron, 12, Society of Photo-optical Instrumentation
Engineers (SPIE). doi:10.1117/12.2282698 Tremper P., Riedel T., & Budde M., 2021, Spatial Interpolation of Air Quality Data with Multidimensional Gaussian Processes.
INFORMATIK 2021. Gesellschaft für Informatik, Bonn. (S. 269-286). DOI: 10.18420/informatik2021-022
Figure 1: 2D RBF covariance function with
two different length scale parameters in a
constant wind field..
130
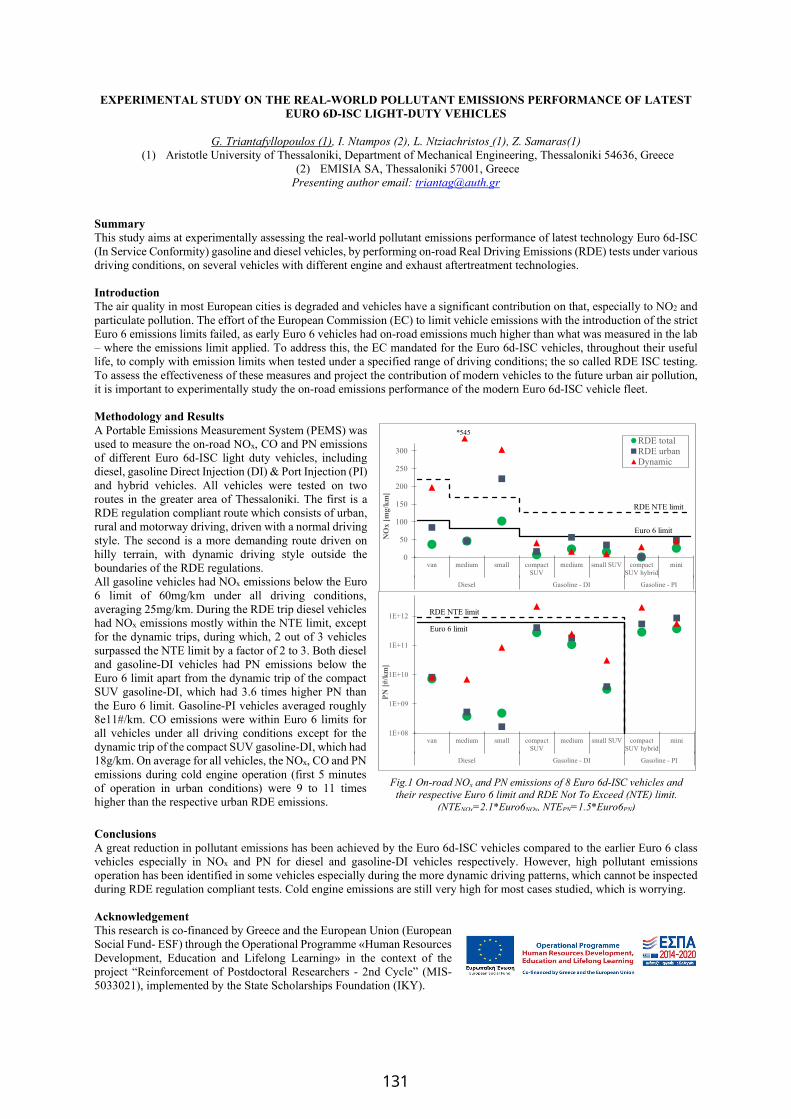
EXPERIMENTAL STUDY ON THE REAL-WORLD POLLUTANT EMISSIONS PERFORMANCE OF LATEST EURO 6D-ISC LIGHT-DUTY VEHICLES
G. Triantafyllopoulos (1), I. Ntampos (2), L. Ntziachristos (1), Z. Samaras(1)
(1) Aristotle University of Thessaloniki, Department of Mechanical Engineering, Thessaloniki 54636, Greece (2) EMISIA SA, Thessaloniki 57001, Greece
Presenting author email: [email protected] Summary This study aims at experimentally assessing the real-world pollutant emissions performance of latest technology Euro 6d-ISC (In Service Conformity) gasoline and diesel vehicles, by performing on-road Real Driving Emissions (RDE) tests under various driving conditions, on several vehicles with different engine and exhaust aftertreatment technologies. Introduction The air quality in most European cities is degraded and vehicles have a significant contribution on that, especially to NO2 and particulate pollution. The effort of the European Commission (EC) to limit vehicle emissions with the introduction of the strict Euro 6 emissions limits failed, as early Euro 6 vehicles had on-road emissions much higher than what was measured in the lab – where the emissions limit applied. To address this, the EC mandated for the Euro 6d-ISC vehicles, throughout their useful life, to comply with emission limits when tested under a specified range of driving conditions; the so called RDE ISC testing. To assess the effectiveness of these measures and project the contribution of modern vehicles to the future urban air pollution, it is important to experimentally study the on-road emissions performance of the modern Euro 6d-ISC vehicle fleet. Methodology and Results A Portable Emissions Measurement System (PEMS) was used to measure the on-road NOx, CO and PN emissions of different Euro 6d-ISC light duty vehicles, including diesel, gasoline Direct Injection (DI) & Port Injection (PI) and hybrid vehicles. All vehicles were tested on two routes in the greater area of Thessaloniki. The first is a RDE regulation compliant route which consists of urban, rural and motorway driving, driven with a normal driving style. The second is a more demanding route driven on hilly terrain, with dynamic driving style outside the boundaries of the RDE regulations. All gasoline vehicles had NOx emissions below the Euro 6 limit of 60mg/km under all driving conditions, averaging 25mg/km. During the RDE trip diesel vehicles had NOx emissions mostly within the NTE limit, except for the dynamic trips, during which, 2 out of 3 vehicles surpassed the NTE limit by a factor of 2 to 3. Both diesel and gasoline-DI vehicles had PN emissions below the Euro 6 limit apart from the dynamic trip of the compact SUV gasoline-DI, which had 3.6 times higher PN than the Euro 6 limit. Gasoline-PI vehicles averaged roughly 8e11#/km. CO emissions were within Euro 6 limits for all vehicles under all driving conditions except for the dynamic trip of the compact SUV gasoline-DI, which had 18g/km. On average for all vehicles, the NOx, CO and PN emissions during cold engine operation (first 5 minutes of operation in urban conditions) were 9 to 11 times higher than the respective urban RDE emissions. Conclusions A great reduction in pollutant emissions has been achieved by the Euro 6d-ISC vehicles compared to the earlier Euro 6 class vehicles especially in NOx and PN for diesel and gasoline-DI vehicles respectively. However, high pollutant emissions operation has been identified in some vehicles especially during the more dynamic driving patterns, which cannot be inspected during RDE regulation compliant tests. Cold engine emissions are still very high for most cases studied, which is worrying. Acknowledgement This research is co-financed by Greece and the European Union (European Social Fund- ESF) through the Operational Programme «Human Resources Development, Education and Lifelong Learning» in the context of the project “Reinforcement of Postdoctoral Researchers - 2nd Cycle” (MIS-5033021), implemented by the State Scholarships Foundation (ΙΚΥ).
Fig.1 On-road NOx and PN emissions of 8 Euro 6d-ISC vehicles and their respective Euro 6 limit and RDE Not To Exceed (NTE) limit.
(NTENOx=2.1*Euro6NOx, NTEPN=1.5*Euro6PN)
0
50
100
150
200
250
300
van medium small compactSUV
medium small SUV compactSUV hybrid
mini
Diesel Gasoline - DI Gasoline - PI
NO
x [m
g/km
]
RDE totalRDE urbanDynamic
*545
Euro 6 limit
RDE NTE limit
1E+08
1E+09
1E+10
1E+11
1E+12
van medium small compactSUV
medium small SUV compactSUV hybrid
mini
Diesel Gasoline - DI Gasoline - PI
PN [#
/km
]
Euro 6 limit
RDE NTE limit
131
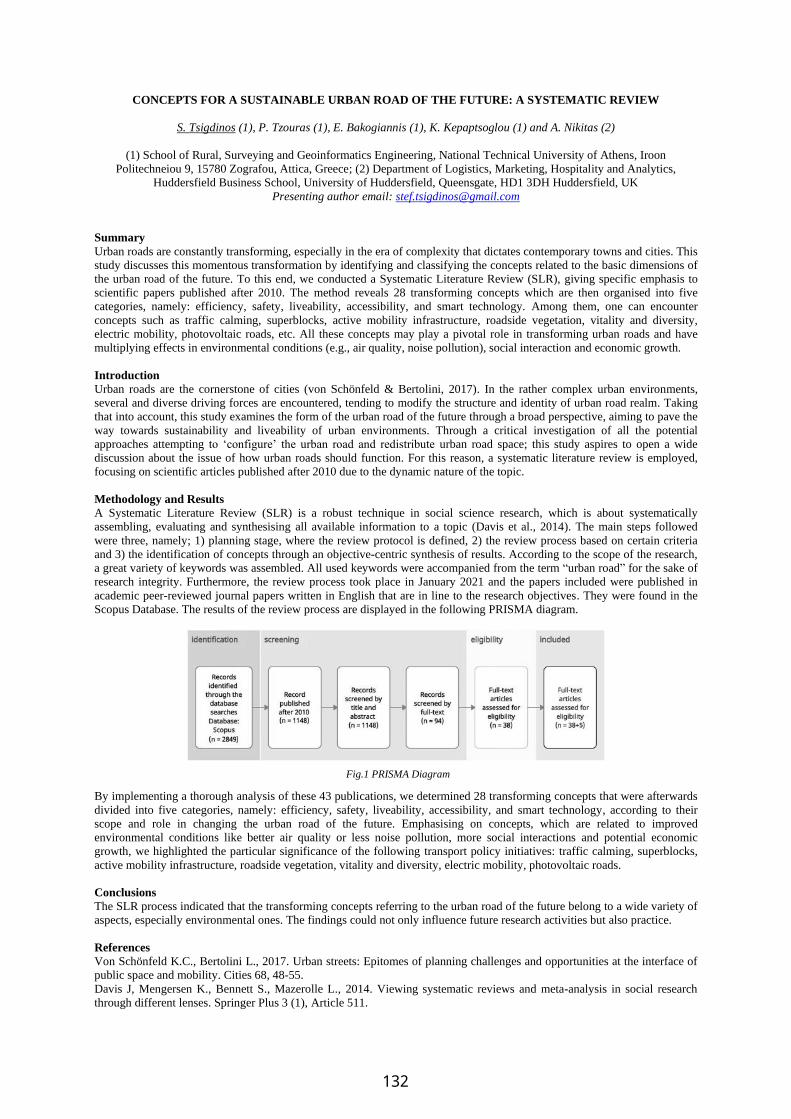
CONCEPTS FOR A SUSTAINABLE URBAN ROAD OF THE FUTURE: A SYSTEMATIC REVIEW
S. Tsigdinos (1), P. Tzouras (1), E. Bakogiannis (1), K. Kepaptsoglou (1) and A. Nikitas (2)
(1) School of Rural, Surveying and Geoinformatics Engineering, National Technical University of Athens, Iroon
Politechneiou 9, 15780 Zografou, Attica, Greece; (2) Department of Logistics, Marketing, Hospitality and Analytics,
Huddersfield Business School, University of Huddersfield, Queensgate, HD1 3DH Huddersfield, UK
Presenting author email: [email protected]
Summary
Urban roads are constantly transforming, especially in the era of complexity that dictates contemporary towns and cities. This
study discusses this momentous transformation by identifying and classifying the concepts related to the basic dimensions of
the urban road of the future. To this end, we conducted a Systematic Literature Review (SLR), giving specific emphasis to
scientific papers published after 2010. The method reveals 28 transforming concepts which are then organised into five
categories, namely: efficiency, safety, liveability, accessibility, and smart technology. Among them, one can encounter
concepts such as traffic calming, superblocks, active mobility infrastructure, roadside vegetation, vitality and diversity,
electric mobility, photovoltaic roads, etc. All these concepts may play a pivotal role in transforming urban roads and have
multiplying effects in environmental conditions (e.g., air quality, noise pollution), social interaction and economic growth.
Introduction
Urban roads are the cornerstone of cities (von Schönfeld & Bertolini, 2017). In the rather complex urban environments,
several and diverse driving forces are encountered, tending to modify the structure and identity of urban road realm. Taking
that into account, this study examines the form of the urban road of the future through a broad perspective, aiming to pave the
way towards sustainability and liveability of urban environments. Through a critical investigation of all the potential
approaches attempting to ‘configure’ the urban road and redistribute urban road space; this study aspires to open a wide
discussion about the issue of how urban roads should function. For this reason, a systematic literature review is employed,
focusing on scientific articles published after 2010 due to the dynamic nature of the topic.
Methodology and Results
A Systematic Literature Review (SLR) is a robust technique in social science research, which is about systematically
assembling, evaluating and synthesising all available information to a topic (Davis et al., 2014). The main steps followed
were three, namely; 1) planning stage, where the review protocol is defined, 2) the review process based on certain criteria
and 3) the identification of concepts through an objective-centric synthesis of results. According to the scope of the research,
a great variety of keywords was assembled. All used keywords were accompanied from the term “urban road” for the sake of
research integrity. Furthermore, the review process took place in January 2021 and the papers included were published in
academic peer-reviewed journal papers written in English that are in line to the research objectives. They were found in the
Scopus Database. The results of the review process are displayed in the following PRISMA diagram.
By implementing a thorough analysis of these 43 publications, we determined 28 transforming concepts that were afterwards
divided into five categories, namely: efficiency, safety, liveability, accessibility, and smart technology, according to their
scope and role in changing the urban road of the future. Emphasising on concepts, which are related to improved
environmental conditions like better air quality or less noise pollution, more social interactions and potential economic
growth, we highlighted the particular significance of the following transport policy initiatives: traffic calming, superblocks,
active mobility infrastructure, roadside vegetation, vitality and diversity, electric mobility, photovoltaic roads.
Conclusions
The SLR process indicated that the transforming concepts referring to the urban road of the future belong to a wide variety of
aspects, especially environmental ones. The findings could not only influence future research activities but also practice.
References
Von Schönfeld K.C., Bertolini L., 2017. Urban streets: Epitomes of planning challenges and opportunities at the interface of
public space and mobility. Cities 68, 48-55.
Davis J, Mengersen K., Bennett S., Mazerolle L., 2014. Viewing systematic reviews and meta-analysis in social research
through different lenses. Springer Plus 3 (1), Article 511.
Fig.1 PRISMA Diagram
132

REDUCING PERSONAL EXPOSURE OF RECREATIONAL RUNNERS TO AIRBORNE PARTICLES IN
URBAN ENVIRONMENTS
M. Viana (1), C. Reche (1), M. Escribano (2), P.E. Adami (3), S. Bermon (3)
(1) Institute of Environmental Assessment and Water Research, IDAEA-CSIC, Barcelona, Spain; (2) Kunak Technologies,
Pamplona, Spain; (3) World Athletics, Monaco, Monaco
Presenting author email: [email protected]
Summary
The aim of this work was to estimate the quantitative exposure reductions achievable by monitoring personal exposure to fine
particles during recreational runs. We used portable monitors to characterise personal exposure of runners across the city, and
quantified the reductions achievable by modifying the routes and times of day. The exposures were then correlated with data
on running habits as a function of age and gender, to identify the most exposed population groups. We conclude that it is
possible to achieve significant reductions in personal exposure (up to 71%) without significantly modifying running habits.
Introduction
Running is one of the major recreational forms of exercise in urban areas (Andersen & Nikolova, 2021), which has in
addition increased exponentially during the COVID19 pandemic. However, urban environments are known for their
frequently poor air quality, resulting in high air pollutant exposures of urban runners. Specifically, these exposures have a
gender perspective, as men and women tend to run during different times of the day and days of the week. Light-weight,
portable and fast-reading tools can help runners reduce their exposures to air pollution without significantly altering their
running habits (routes and times of the day to exercise).
Methodology and Results
Portable, personal particle monitors (AirBeam2,
HabitatMap.org) were provided to volunteer runners to
map personal exposures to particles (PM10, PM2.5, PM1)
across a 2x2 km area in central Barcelona (Spain). The
time resolution of the monitors was 5 seconds, and the
position and route of the runners were traced by GPS from
their mobile phones, to which the sensors were connected
via Bluetooth. The sensors were calibrated against EU-
reference instrumentation before and after the data
collection by the volunteers, showing an adequate
correlation (R2=0.80 for PM10, 0.87 for PM2.5, 0.85 for
PM1) and a lack of significant drifts. During recruitment,
the volunteers were instructed not to alter their usual
running routes or time of the day for sports, to ensure
maximum data representativity, and to carry the sensors at
all times during runs. Meteorological variability was
accounted for by comparison with reference PM2.5 data
from a local air quality monitoring station. Furthermore,
PM2.5 exposure concentrations were compared throughout individual runs, i.e., along different roads on the same day,
therefore minimising the influence of meteorology.
A total of 240.000 datapoints was collected between October 2020 and February 2021. The dataset contained 60 runs, each
run with an average duration of 35 minutes and with distances ranging between 3-5 km/run. As expected, air pollutant
exposures were directly linked to traffic emissions, with the highest contributions being monitored along major roads.
Junctions were identified as especially relevant hotspots, due to the increased use of brakes and engine start/stop while the
runners were static and exposed for longer periods of time. However, air intake (and therefore, dose) is expected to be
reduced at junctions, as the breathing rate of runners decreased. Average exposure concentrations per run ranged between 3
and 17 µgPM2.5/m3, with a mean of 10.1 µgPM2.5/m3. However, when using the portable monitors to select the cleanest
routes, runners were able to reduce their average exposures by 44% (to 6.3 µgPM2.5/m3). When comparing exposures along
the major roads (most polluted environments, with 27.7 µgPM2.5/m3) and the cleanest routes (e.g., crossing park areas),
average reductions of up to 71% in personal exposure to PM2.5 were achieved. Finally, exposure reductions were converted
into dose reductions, separately for male and female runners, as a function of breathing rates and average body mass.
Conclusions
We conclude that portable sensors are useful tools to reduce personal exposure to airborne particles during recreational runs
in urban areas.
Acknowledgement
This work was made possible by the volunteer runners, and was supported by projects CEX2018-000794-S and 2017SGR41.
References
Andersen J.J., Nikolova V. (2021). https://runrepeat.com/research-marathon-performance-across-nations
Fig.1 Mean PM2.5 exposure ranges when runners took their usual
route versus the cleanest (<10th percentile) or most polluted
(>90th percentile) roads.
133
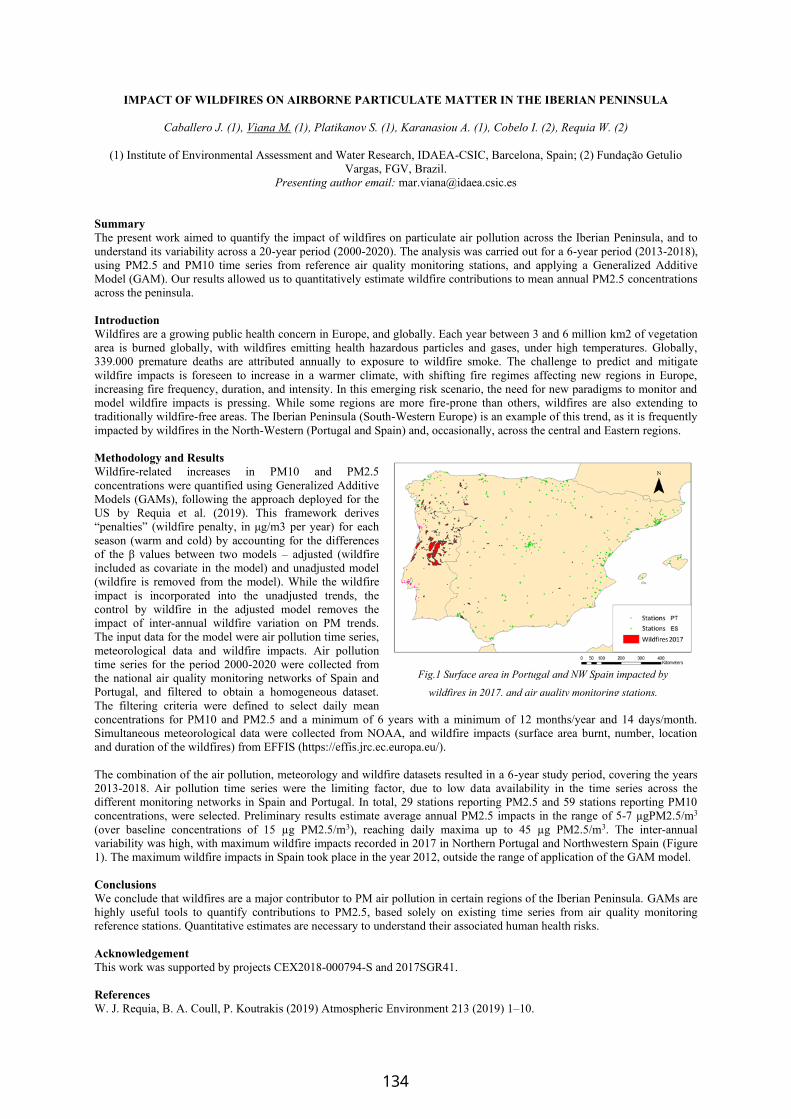
IMPACT OF WILDFIRES ON AIRBORNE PARTICULATE MATTER IN THE IBERIAN PENINSULA
Caballero J. (1), Viana M. (1), Platikanov S. (1), Karanasiou A. (1), Cobelo I. (2), Requia W. (2)
(1) Institute of Environmental Assessment and Water Research, IDAEA-CSIC, Barcelona, Spain; (2) Fundação Getulio
Vargas, FGV, Brazil.
Presenting author email: [email protected]
Summary
The present work aimed to quantify the impact of wildfires on particulate air pollution across the Iberian Peninsula, and to
understand its variability across a 20-year period (2000-2020). The analysis was carried out for a 6-year period (2013-2018),
using PM2.5 and PM10 time series from reference air quality monitoring stations, and applying a Generalized Additive
Model (GAM). Our results allowed us to quantitatively estimate wildfire contributions to mean annual PM2.5 concentrations
across the peninsula.
Introduction
Wildfires are a growing public health concern in Europe, and globally. Each year between 3 and 6 million km2 of vegetation
area is burned globally, with wildfires emitting health hazardous particles and gases, under high temperatures. Globally,
339.000 premature deaths are attributed annually to exposure to wildfire smoke. The challenge to predict and mitigate
wildfire impacts is foreseen to increase in a warmer climate, with shifting fire regimes affecting new regions in Europe,
increasing fire frequency, duration, and intensity. In this emerging risk scenario, the need for new paradigms to monitor and
model wildfire impacts is pressing. While some regions are more fire-prone than others, wildfires are also extending to
traditionally wildfire-free areas. The Iberian Peninsula (South-Western Europe) is an example of this trend, as it is frequently
impacted by wildfires in the North-Western (Portugal and Spain) and, occasionally, across the central and Eastern regions.
Methodology and Results
Wildfire-related increases in PM10 and PM2.5
concentrations were quantified using Generalized Additive
Models (GAMs), following the approach deployed for the
US by Requia et al. (2019). This framework derives
“penalties” (wildfire penalty, in μg/m3 per year) for each
season (warm and cold) by accounting for the differences
of the β values between two models – adjusted (wildfire
included as covariate in the model) and unadjusted model
(wildfire is removed from the model). While the wildfire
impact is incorporated into the unadjusted trends, the
control by wildfire in the adjusted model removes the
impact of inter-annual wildfire variation on PM trends.
The input data for the model were air pollution time series,
meteorological data and wildfire impacts. Air pollution
time series for the period 2000-2020 were collected from
the national air quality monitoring networks of Spain and
Portugal, and filtered to obtain a homogeneous dataset.
The filtering criteria were defined to select daily mean
concentrations for PM10 and PM2.5 and a minimum of 6 years with a minimum of 12 months/year and 14 days/month.
Simultaneous meteorological data were collected from NOAA, and wildfire impacts (surface area burnt, number, location
and duration of the wildfires) from EFFIS (https://effis.jrc.ec.europa.eu/).
The combination of the air pollution, meteorology and wildfire datasets resulted in a 6-year study period, covering the years
2013-2018. Air pollution time series were the limiting factor, due to low data availability in the time series across the
different monitoring networks in Spain and Portugal. In total, 29 stations reporting PM2.5 and 59 stations reporting PM10
concentrations, were selected. Preliminary results estimate average annual PM2.5 impacts in the range of 5-7 µgPM2.5/m3
(over baseline concentrations of 15 µg PM2.5/m3), reaching daily maxima up to 45 µg PM2.5/m3. The inter-annual
variability was high, with maximum wildfire impacts recorded in 2017 in Northern Portugal and Northwestern Spain (Figure
1). The maximum wildfire impacts in Spain took place in the year 2012, outside the range of application of the GAM model.
Conclusions
We conclude that wildfires are a major contributor to PM air pollution in certain regions of the Iberian Peninsula. GAMs are
highly useful tools to quantify contributions to PM2.5, based solely on existing time series from air quality monitoring
reference stations. Quantitative estimates are necessary to understand their associated human health risks.
Acknowledgement
This work was supported by projects CEX2018-000794-S and 2017SGR41.
References
W. J. Requia, B. A. Coull, P. Koutrakis (2019) Atmospheric Environment 213 (2019) 1–10.
Fig.1 Surface area in Portugal and NW Spain impacted by
wildfires in 2017, and air quality monitoring stations.
134
AIR POLLUTANTS MEASURED AROUND STUTTGART AIRPORT WITH AND WITHOUT AIR TRAFFIC
DUE TO A TEMPORAL SHUTDOWN OF THE AIRPORT
K. Molina, U. Vogt, I. Chourdakis
Department of Flue Gas Cleaning and Air Quality Control, Institute of Combustion and Power Plant Technology,
University of Stuttgart, Germany
Presenting author email: [email protected]
Summary
Short term measurements of different air pollutants were performed in the close vicinity of the international airport in the city
of Stuttgart in Germany. These measurements were the first of this kind at this airport. Three different periods could be
investigated, one period when there was a shutdown of the airport due to renovation activities. A second phase after the
reopening of the airport with low flight activity and a third period with more flight activity during summer holidays in the
year 2020. The focus was set to landing aircrafts and measurements were performed at the fence of the airport. The more air
traffic took place the more peak concentrations could be measured, caused by the individual aircrafts. The highest peaks
could be measured for UFPs (ultrafine particles).
Introduction
Previous airport emission studies conducted in Los Angeles (Westerdahl, D., et al., 2008), Amsterdam (Keuken, M. P., et al.,
2015), and other cities have all shown that aircrafts do significantly increase the ambient air pollutants at the airport and even
at distances of several kilometres away. Since results cannot be directly applied from one city to another, the objective of this
study was to investigate if similar aircraft pollutant levels could be measured at the airport fence and in the vicinity of
Stuttgart airport. Three different phases could be defined for performing the measurements with different air traffic density.
Methodology and Results
While more emissions are released during flight departures, this study focused on measuring levels from flight landings.
Under these conditions, the aircrafts would be lower to the ground and thus, closer to the measurement devices. To capture
the aircraft plumes, stationary measurements were made at various points on the east and west sides of the airport in the
extension of the runway. Measurements were made over the course of three phases and included devices measuring UFPs,
PM, BC, CO2, O3, NO2, NO, and wind speed and direction. The first phase of measurements was done when the airport was
completely closed and there was no air traffic due to construction work on the runway. A few weeks later, the second
measurement phase was done when the airport reopened and there was some air traffic. Finally, a third phase of
measurements was conducted some time later during the summer holiday travel season. When comparing the results from the
three phases, the greatest changes were seen in the UFP particle number concentrations (PNCs) and with the corresponding
particle diameters (Dp). When there were no planes during phase 1, the PNCs were under 10,000 particles/cm³, and the Dp
sizes were 38 nm and above. Then, over the course of phases 2 and 3 in which more and more air traffic took place, there
were PNC peaks from planes that were over 300,000 particles/cm³ with Dp sizes as low as 10 nm. The simultaneous UFP
measurements also showed that the elevated UFP peaks could be measured both at the airport fence and up to 2.7 kilometres
away. This same trend of increasing UFP PNCs and decreasing Dp sizes over the three phases was also seen with the particle
size distribution (PSD) measurements which further strengthened the validity of the UFP results both at and in the vicinity of
the airport.
With the other air pollutants that were measured, there were less noticeable changes in measured concentrations seen across
the three phases. With the PM1, PM2.5, and PM10 results, the majority of the PM2.5 and PM10 peaks stayed within limits.
The coarser fraction peaks that did occur were mainly related to passing cars or tractors and not to aircrafts. There was also
minimal variability with the BC measurements, and the median concentration remained under 1 μg/m3 during all three
phases. Throughout the entire campaign, only three significant BC peaks were measured which took place in phase three.
These peaks were all preceded by large commercial aircraft landings and followed by a strong smell of kerosene.
Finally, of the gases measured in phases 2 and 3, the biggest difference was seen with the NO2 values of which the median
concentration was about a third higher in phase 3 than in phase 2.
Conclusions
The conducted measurements proved, that air traffic has a significant influence on the air pollution situation in the vicinity of
Stuttgart airport, especially for ultrafine particle, but also for other components. Further long-term measurements are
recommended to find out if long-term limit values are exceeded and the population living close to the airport could be
exposed to critical and harmful pollutant concentrations.
References
Keuken, M. P.; Moerman, M.; Zandveld, P.; Henzing, J. S.; Hoek, G. (2015): Total and size-resolved particle number and
black carbon concentrations in urban areas near Schiphol airport (the Netherlands). In Atmospheric Environment 104, pp.
132–142. DOI: 10.1016/j.atmosenv.2015.01.015.
Westerdahl, D., et al. (2008): The Los Angeles International Airport as a source of ultrafine particles and other pollutants to
nearby communities. In Atmospheric Environment 42 (13), pp. 3143–3155. DOI: 10.1016/j.atmosenv.2007.09.006.
135
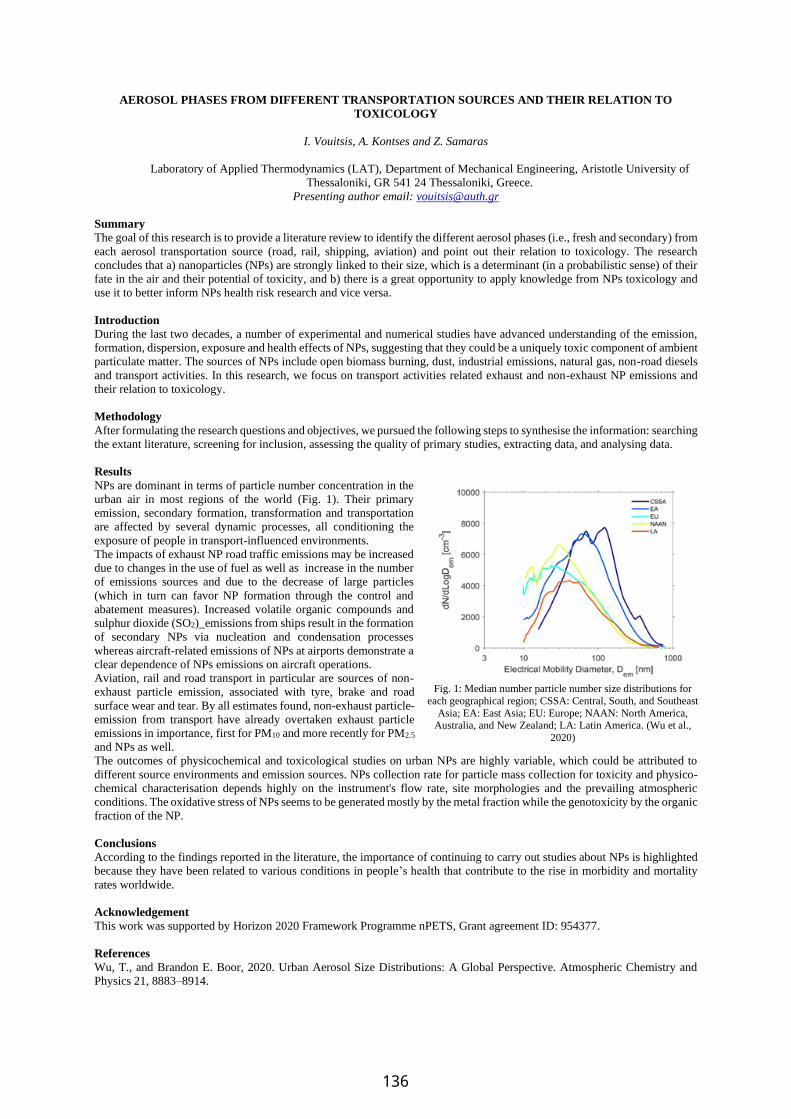
AEROSOL PHASES FROM DIFFERENT TRANSPORTATION SOURCES AND THEIR RELATION TO
TOXICOLOGY
I. Vouitsis, A. Kontses and Z. Samaras
Laboratory of Applied Thermodynamics (LAT), Department of Mechanical Engineering, Aristotle University of
Thessaloniki, GR 541 24 Thessaloniki, Greece.
Presenting author email: [email protected]
Summary
The goal of this research is to provide a literature review to identify the different aerosol phases (i.e., fresh and secondary) from
each aerosol transportation source (road, rail, shipping, aviation) and point out their relation to toxicology. The research
concludes that a) nanoparticles (NPs) are strongly linked to their size, which is a determinant (in a probabilistic sense) of their
fate in the air and their potential of toxicity, and b) there is a great opportunity to apply knowledge from NPs toxicology and
use it to better inform NPs health risk research and vice versa.
Introduction
During the last two decades, a number of experimental and numerical studies have advanced understanding of the emission,
formation, dispersion, exposure and health effects of NPs, suggesting that they could be a uniquely toxic component of ambient
particulate matter. The sources of NPs include open biomass burning, dust, industrial emissions, natural gas, non-road diesels
and transport activities. In this research, we focus on transport activities related exhaust and non-exhaust NP emissions and
their relation to toxicology.
Methodology
After formulating the research questions and objectives, we pursued the following steps to synthesise the information: searching
the extant literature, screening for inclusion, assessing the quality of primary studies, extracting data, and analysing data.
Results
NPs are dominant in terms of particle number concentration in the
urban air in most regions of the world (Fig. 1). Their primary
emission, secondary formation, transformation and transportation
are affected by several dynamic processes, all conditioning the
exposure of people in transport-influenced environments.
The impacts of exhaust NP road traffic emissions may be increased
due to changes in the use of fuel as well as increase in the number
of emissions sources and due to the decrease of large particles
(which in turn can favor NP formation through the control and
abatement measures). Increased volatile organic compounds and
sulphur dioxide (SO2)_emissions from ships result in the formation
of secondary NPs via nucleation and condensation processes
whereas aircraft-related emissions of NPs at airports demonstrate a
clear dependence of NPs emissions on aircraft operations.
Aviation, rail and road transport in particular are sources of non-
exhaust particle emission, associated with tyre, brake and road
surface wear and tear. By all estimates found, non-exhaust particle-
emission from transport have already overtaken exhaust particle
emissions in importance, first for PM10 and more recently for PM2.5
and NPs as well.
The outcomes of physicochemical and toxicological studies on urban NPs are highly variable, which could be attributed to
different source environments and emission sources. NPs collection rate for particle mass collection for toxicity and physico-
chemical characterisation depends highly on the instrument's flow rate, site morphologies and the prevailing atmospheric
conditions. The oxidative stress of NPs seems to be generated mostly by the metal fraction while the genotoxicity by the organic
fraction of the NP.
Conclusions
According to the findings reported in the literature, the importance of continuing to carry out studies about NPs is highlighted
because they have been related to various conditions in people’s health that contribute to the rise in morbidity and mortality
rates worldwide.
Acknowledgement
This work was supported by Horizon 2020 Framework Programme nPETS, Grant agreement ID: 954377.
References
Wu, T., and Brandon E. Boor, 2020. Urban Aerosol Size Distributions: A Global Perspective. Atmospheric Chemistry and
Physics 21, 8883–8914.
Fig. 1: Median number particle number size distributions for
each geographical region; CSSA: Central, South, and Southeast
Asia; EA: East Asia; EU: Europe; NAAN: North America, Australia, and New Zealand; LA: Latin America. (Wu et al.,
2020)
136
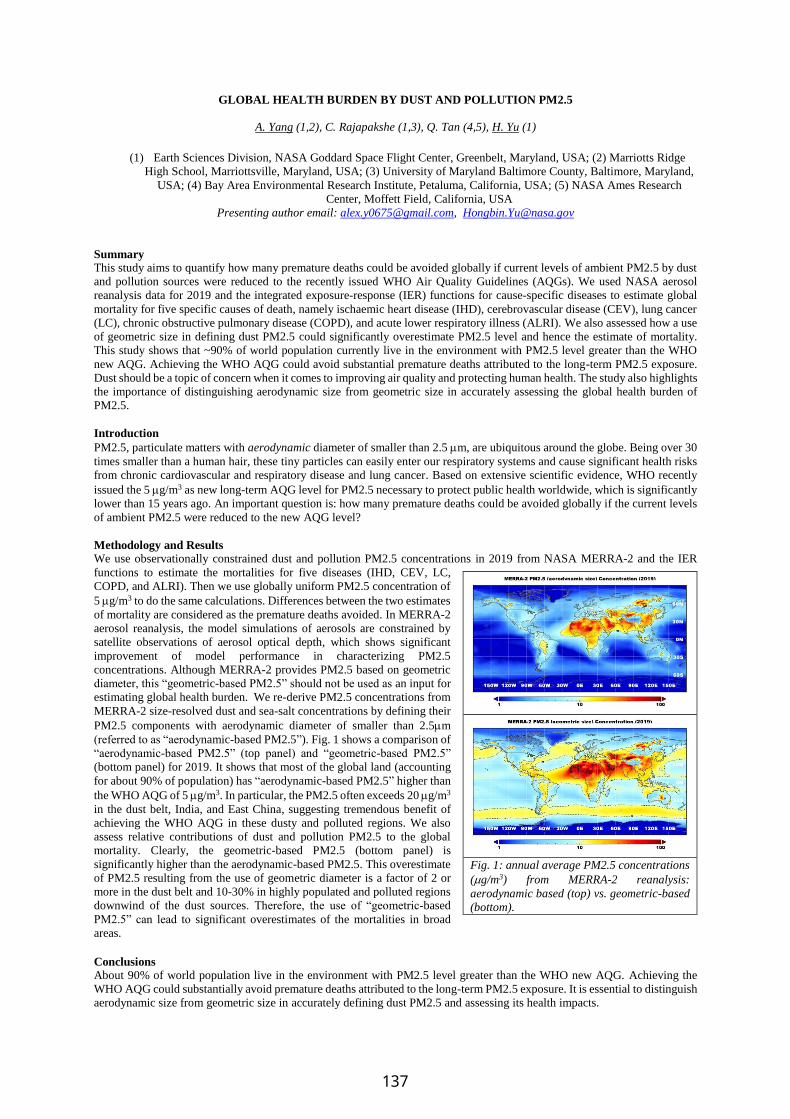
GLOBAL HEALTH BURDEN BY DUST AND POLLUTION PM2.5
A. Yang (1,2), C. Rajapakshe (1,3), Q. Tan (4,5), H. Yu (1)
(1) Earth Sciences Division, NASA Goddard Space Flight Center, Greenbelt, Maryland, USA; (2) Marriotts Ridge
High School, Marriottsville, Maryland, USA; (3) University of Maryland Baltimore County, Baltimore, Maryland,
USA; (4) Bay Area Environmental Research Institute, Petaluma, California, USA; (5) NASA Ames Research
Center, Moffett Field, California, USA
Presenting author email: [email protected], [email protected]
Summary
This study aims to quantify how many premature deaths could be avoided globally if current levels of ambient PM2.5 by dust
and pollution sources were reduced to the recently issued WHO Air Quality Guidelines (AQGs). We used NASA aerosol
reanalysis data for 2019 and the integrated exposure-response (IER) functions for cause-specific diseases to estimate global
mortality for five specific causes of death, namely ischaemic heart disease (IHD), cerebrovascular disease (CEV), lung cancer
(LC), chronic obstructive pulmonary disease (COPD), and acute lower respiratory illness (ALRI). We also assessed how a use
of geometric size in defining dust PM2.5 could significantly overestimate PM2.5 level and hence the estimate of mortality.
This study shows that ~90% of world population currently live in the environment with PM2.5 level greater than the WHO
new AQG. Achieving the WHO AQG could avoid substantial premature deaths attributed to the long-term PM2.5 exposure.
Dust should be a topic of concern when it comes to improving air quality and protecting human health. The study also highlights
the importance of distinguishing aerodynamic size from geometric size in accurately assessing the global health burden of
PM2.5.
Introduction
PM2.5, particulate matters with aerodynamic diameter of smaller than 2.5 m, are ubiquitous around the globe. Being over 30
times smaller than a human hair, these tiny particles can easily enter our respiratory systems and cause significant health risks
from chronic cardiovascular and respiratory disease and lung cancer. Based on extensive scientific evidence, WHO recently
issued the 5 g/m3 as new long-term AQG level for PM2.5 necessary to protect public health worldwide, which is significantly
lower than 15 years ago. An important question is: how many premature deaths could be avoided globally if the current levels
of ambient PM2.5 were reduced to the new AQG level?
Methodology and Results
We use observationally constrained dust and pollution PM2.5 concentrations in 2019 from NASA MERRA-2 and the IER
functions to estimate the mortalities for five diseases (IHD, CEV, LC,
COPD, and ALRI). Then we use globally uniform PM2.5 concentration of
5 g/m3 to do the same calculations. Differences between the two estimates
of mortality are considered as the premature deaths avoided. In MERRA-2
aerosol reanalysis, the model simulations of aerosols are constrained by
satellite observations of aerosol optical depth, which shows significant
improvement of model performance in characterizing PM2.5
concentrations. Although MERRA-2 provides PM2.5 based on geometric
diameter, this “geometric-based PM2.5” should not be used as an input for
estimating global health burden. We re-derive PM2.5 concentrations from
MERRA-2 size-resolved dust and sea-salt concentrations by defining their
PM2.5 components with aerodynamic diameter of smaller than 2.5m
(referred to as “aerodynamic-based PM2.5”). Fig. 1 shows a comparison of
“aerodynamic-based PM2.5” (top panel) and “geometric-based PM2.5”
(bottom panel) for 2019. It shows that most of the global land (accounting
for about 90% of population) has “aerodynamic-based PM2.5” higher than
the WHO AQG of 5 g/m3. In particular, the PM2.5 often exceeds 20 g/m3
in the dust belt, India, and East China, suggesting tremendous benefit of
achieving the WHO AQG in these dusty and polluted regions. We also
assess relative contributions of dust and pollution PM2.5 to the global
mortality. Clearly, the geometric-based PM2.5 (bottom panel) is
significantly higher than the aerodynamic-based PM2.5. This overestimate
of PM2.5 resulting from the use of geometric diameter is a factor of 2 or
more in the dust belt and 10-30% in highly populated and polluted regions
downwind of the dust sources. Therefore, the use of “geometric-based
PM2.5” can lead to significant overestimates of the mortalities in broad
areas.
Conclusions
About 90% of world population live in the environment with PM2.5 level greater than the WHO new AQG. Achieving the
WHO AQG could substantially avoid premature deaths attributed to the long-term PM2.5 exposure. It is essential to distinguish
aerodynamic size from geometric size in accurately defining dust PM2.5 and assessing its health impacts.
Fig. 1: annual average PM2.5 concentrations
(g/m3) from MERRA-2 reanalysis:
aerodynamic based (top) vs. geometric-based
(bottom).
137
HEAT EFFECTS ON MORTALITY MODIFIED BY AIR POLLUTION IN ATHENS METROPOLITAN AREA,
GREECE
S. Zafeiratou (1), M. Stafoggia (2), E. Samoli (1), A. Analitis (1), K. Dimakopoulou (1), C. Giannakopoulos (3), K.V.
Varotsos (3), A. Schneider (4), K. Katsouyanni (1,5)
(1) Department of Hygiene, Epidemiology and Medical Statistics, National and Kapodistrian University of Athens, Greece;
(2) Department of Epidemiology, Lazio Region Health Service, ASL Roma 1, Italy; (3) Institute for Environmental Research
and Sustainable Development, National Observatory of Athens, Greece; (4) Institute of Epidemiology, Helmholtz Zentrum
München, Germany; (5) Environmental Research Group, MRC Centre for Environment and Health, Imperial College, UK
Presenting author email: [email protected]
Summary
The aim of our study was to assess daily air pollution exposure as potential effect modifier of the temperature-mortality
association in Athens, Greece. We used modelled spatio-temporal exposure data at municipality level, accounting for the spatial
variability of exposure within an urban area. Temperature effect estimates were estimated in low and high levels of PM10 and
ozone. Effects were also estimated by NUTS3 region within the study area. The percent change in all-cause mortality estimated
to 13.3% (95% CI:8.1, 18.8) and 19.5% (95% CI: 16.0, 23.1) on days with low and high PM10 levels, respectively. A statistically
significant increase in mortality was found only on high ozone days (16.2% (95% CI: 11.1,21.6)). Similar patterns were
observed for cause-specific mortality as well as in NUTS3-specific results. Under ongoing climate change, the synergistic
effects of heat and air pollution on mortality represent a crucial public health issue and mitigation strategies are needed.
Introduction
The effects of short-term exposure to increased temperature on mortality are known (e.g., Baccini et al. 2008), whereas possible
interaction with air pollution is not well-established. There is some evidence that increased levels of PM10 and ozone result in
significantly higher temperature effects on mortality (Analitis et al. 2018, Grigorieva & Lukyanets 2021) but the evidence is
not consistent. In the context of climate change, air temperature is expected to increase, whereas air pollution may be reduced
if control measures are implemented (Breitner et al. 2009). Identification of possible effect modification of temperature-related
health effects by air pollution may be of great importance and result in public health benefits.
Methodology and Results
A municipality-specific generalized additive Poisson regression model allowing for overdispersion during the warm season
(May-September) was used to investigate the synergistic effect of temperature and air pollution on all-cause, cardiovascular,
and respiratory mortality. We used the moving average of the current and previous day for daily mean temperature and daily
mean of PM10 and ozone, derived from models, in each municipality as exposures. The percent change in mortality associated
with an increase in temperature from the 75th to the 99th percentile was estimated in low and high (5th and 95th percentile
respectively) levels of pollutants. Α random-effects meta-analysis was applied to obtain pooled estimates at study area level
and by NUTS3 regions within the study area. A rise in mean temperature resulted in an increase in all-cause mortality of 13.3%
(95% CI:8.1, 18.8) on days with low levels of PM10, and 19.5% (95% CI: 16.0, 23.1) on days with high concentrations. For
cardiovascular and respiratory mortality, the heat effect on low PM10 days was not statistically significant but on days
characterized by high concentrations the increase in mortality was 14.7% (95% CI:9.4, 20.2) and 48.9% (95% CI:33.0, 66.7)
respectively. A non-statistically significant effect of increased temperature was found on low ozone days, while for high ozone
days the heat effect ranged from 16.2% (95% CI:11.1, 21.6) for all-cause to 47.2% (95% CI:27.7,69.6) for respiratory mortality.
Same pattern was observed for the estimates by NUTS3 region in the study area.
Conclusions
A municipality-specific approach was developed to estimate the heat effects on mortality in different pollution levels, over a
metropolitan area. Significant modification of heat effects on mortality was indicated in our study, with a clear pattern of higher
heat effects on high air pollution days. Results by NUTS3 regions confirmed the increasing trend of heat effects for increasing
levels of pollutants. Under climate change and global warming, pollution control measures are urgent, as the heat effect on
human health seems to increase with elevated levels of air pollutants.
Acknowledgement
This research was conducted in the framework of the EXHAUSTION project (Horizon 2020- Grant agreement No 820655).
References
Analitis A., Michelozzi P., D'Ippoliti D., De'Donato F., Menne B., Matthies F., Atkinson RW., Iñiguez C., Basagaña X.,
Schneider A., Lefranc A., Paldy A., Bisanti L., Katsouyanni K., 2014. Effects of heat waves on mortality: effect modification
and confounding by air pollutants. Epidemiology, 25(1), 15–22.
Baccini M., Biggeri A., Accetta G., Kosatsky T., Katsouyanni K., Analitis A., Anderson H.R., Bisanti L., D'Ippoliti D., Danova
J., Forsberg B., Medina S., Paldy A., Rabczenko D., Schindler C., Michelozzi P., 2008. Heat effects on mortality in 15 European
cities. Epidemiology, 19(5), 711–719.
Breitner S., Stölzel M., Cyrys J., Pitz M., Wölke G., Kreyling W., Küchenhoff H., Heinrich J., Wichmann H. E., Peters A.,
2009. Short-term mortality rates during a decade of improved air quality in Erfurt, Germany. Environmental health perspectives
117(3), 448–454.
Grigorieva E., Lukyanets A., 2021. Combined Effect of Hot Weather and Outdoor Air Pollution on Respiratory Health:
Literature Review. Atmosphere 12, 790.
138
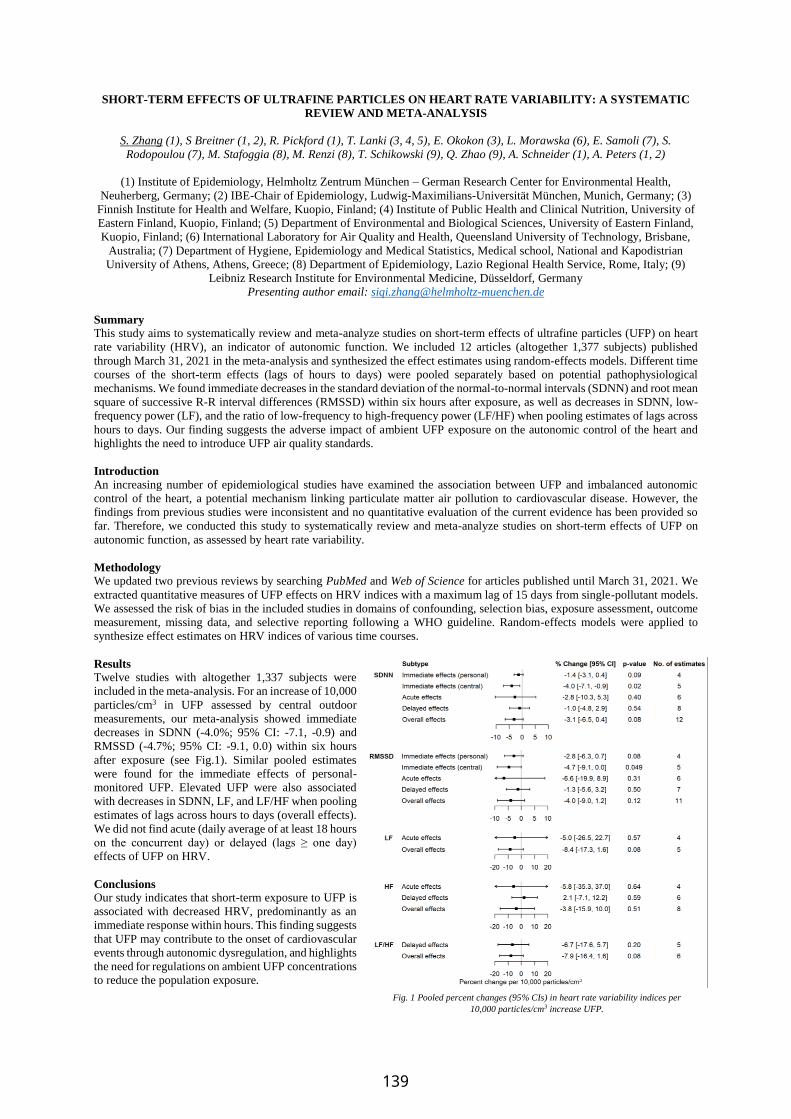
SHORT-TERM EFFECTS OF ULTRAFINE PARTICLES ON HEART RATE VARIABILITY: A SYSTEMATIC
REVIEW AND META-ANALYSIS
S. Zhang (1), S Breitner (1, 2), R. Pickford (1), T. Lanki (3, 4, 5), E. Okokon (3), L. Morawska (6), E. Samoli (7), S.
Rodopoulou (7), M. Stafoggia (8), M. Renzi (8), T. Schikowski (9), Q. Zhao (9), A. Schneider (1), A. Peters (1, 2)
(1) Institute of Epidemiology, Helmholtz Zentrum München – German Research Center for Environmental Health,
Neuherberg, Germany; (2) IBE-Chair of Epidemiology, Ludwig-Maximilians-Universität München, Munich, Germany; (3)
Finnish Institute for Health and Welfare, Kuopio, Finland; (4) Institute of Public Health and Clinical Nutrition, University of
Eastern Finland, Kuopio, Finland; (5) Department of Environmental and Biological Sciences, University of Eastern Finland,
Kuopio, Finland; (6) International Laboratory for Air Quality and Health, Queensland University of Technology, Brisbane,
Australia; (7) Department of Hygiene, Epidemiology and Medical Statistics, Medical school, National and Kapodistrian
University of Athens, Athens, Greece; (8) Department of Epidemiology, Lazio Regional Health Service, Rome, Italy; (9)
Leibniz Research Institute for Environmental Medicine, Düsseldorf, Germany
Presenting author email: [email protected]
Summary
This study aims to systematically review and meta-analyze studies on short-term effects of ultrafine particles (UFP) on heart
rate variability (HRV), an indicator of autonomic function. We included 12 articles (altogether 1,377 subjects) published
through March 31, 2021 in the meta-analysis and synthesized the effect estimates using random-effects models. Different time
courses of the short-term effects (lags of hours to days) were pooled separately based on potential pathophysiological
mechanisms. We found immediate decreases in the standard deviation of the normal-to-normal intervals (SDNN) and root mean
square of successive R-R interval differences (RMSSD) within six hours after exposure, as well as decreases in SDNN, low-
frequency power (LF), and the ratio of low-frequency to high-frequency power (LF/HF) when pooling estimates of lags across
hours to days. Our finding suggests the adverse impact of ambient UFP exposure on the autonomic control of the heart and
highlights the need to introduce UFP air quality standards.
Introduction
An increasing number of epidemiological studies have examined the association between UFP and imbalanced autonomic
control of the heart, a potential mechanism linking particulate matter air pollution to cardiovascular disease. However, the
findings from previous studies were inconsistent and no quantitative evaluation of the current evidence has been provided so
far. Therefore, we conducted this study to systematically review and meta-analyze studies on short-term effects of UFP on
autonomic function, as assessed by heart rate variability.
Methodology
We updated two previous reviews by searching PubMed and Web of Science for articles published until March 31, 2021. We
extracted quantitative measures of UFP effects on HRV indices with a maximum lag of 15 days from single-pollutant models.
We assessed the risk of bias in the included studies in domains of confounding, selection bias, exposure assessment, outcome
measurement, missing data, and selective reporting following a WHO guideline. Random-effects models were applied to
synthesize effect estimates on HRV indices of various time courses.
Results
Twelve studies with altogether 1,337 subjects were
included in the meta-analysis. For an increase of 10,000
particles/cm3 in UFP assessed by central outdoor
measurements, our meta-analysis showed immediate
decreases in SDNN (-4.0%; 95% CI: -7.1, -0.9) and
RMSSD (-4.7%; 95% CI: -9.1, 0.0) within six hours
after exposure (see Fig.1). Similar pooled estimates
were found for the immediate effects of personal-
monitored UFP. Elevated UFP were also associated
with decreases in SDNN, LF, and LF/HF when pooling
estimates of lags across hours to days (overall effects).
We did not find acute (daily average of at least 18 hours
on the concurrent day) or delayed (lags ≥ one day)
effects of UFP on HRV.
Conclusions
Our study indicates that short-term exposure to UFP is
associated with decreased HRV, predominantly as an
immediate response within hours. This finding suggests
that UFP may contribute to the onset of cardiovascular
events through autonomic dysregulation, and highlights
the need for regulations on ambient UFP concentrations
to reduce the population exposure.
Fig. 1 Pooled percent changes (95% CIs) in heart rate variability indices per
10,000 particles/cm3 increase UFP.
139

SHORT-TERM EFFECTS OF HEAT ON CARDIOPULMONARY MORTALITY MODIFIED BY AIR POLLUTION:
RESULTS FROM THE NORWEGIAN CONOR COHORT
S. Zhang (1), A. Schneider (1), T. Bekkevold (2), A. Diz-Lois Palomares (2), L. Vazquez Fernandez (2), C. Koren (2), C. Geels (3),
L. M. Frohn (3), S. Rao (2)
(1) Helmholtz Munich – German Research Center for Environmental Health, Neuherberg, Germany; (2) Institute of
Public Health, Oslo, Norway; (3) Aarhus University, Roskilde, Denmark
Presenting author email: [email protected]
Summary
This time-stratified case-crossover study assessed the potential effect modification of fine particulate matter (PM2.5) and ozone
(O3) on associations between short-term exposure to heat and cardiopulmonary (CPD) mortality during the warm season in the
CONOR cohort, Norway. Altogether 6,966 deaths from CPD were identified among the cohort participants during the warm
season (May-September) between 1994 and 2018. Daily mean air temperature and air pollutant concentrations were estimated
by spatial-temporal models and were assigned to participants’ home addresses. We applied a conditional logistic regression
model with a tensor smoother of air temperature and air pollutant (PM2.5 or O3) of lag 0-1 days to estimate heat effects at the
low, medium, and high levels of air pollutants. We observed increased risks for CPD and cardiovascular (CVD) mortality in
association with heat at the medium and high levels of O3, but the differences in effect estimates were not significant across
different levels of O3. Besides, no heat effects on mortality were found at any levels of PM2.5. This study suggests that there
was no effect modification of air pollution on associations between heat and CPD mortality in the Norwegian CONOR cohort.
Introduction
The adverse effects of heat on mortality have been well recognized. Besides, there is literature showing modification of the
heat effects by air pollution. However, most of the evidence was from ecological studies at the population level. So far, few
studies have investigated the interactive effects between air temperature and air pollution on cause-specific mortality using
individual data, especially in Northern Europe. This time-stratified case-crossover study examined the potential modification
of short-term heat effects on CPD mortality by PM2.5 and O3 during the warm season (May-September) in the CONOR cohort,
Norway.
Methodology
The CONOR cohort recruited more than 180,000 participants between 1994 and 2003. The vital status and cause of death of
participants were obtained from the Cause of Death Registry of Norway. Daily mean air temperature and air pollutant
concentrations were estimated by spatial-temporal models at a 1 km × 1 km resolution and were assigned to participants’ home
addresses. We applied conditional logistic regression models to assess the heat effects. A tensor smoother between air
temperature (lag 0-1) and air pollutant (PM2.5 or O3, lag0-1) was used to determine the heat effects at the 5th (low), 50th
(medium), and 95th (high) percentiles of the air pollutant distribution.
Results
We identified 15,653 cases of natural-cause deaths in the warm
season between 1994 and 2018, including 6,966 deaths from CPD,
5,656 deaths from CVD, and 1,310 deaths from respiratory
diseases. The mean temperature during the study period was
12.0 °C (SD: 4.3 °C) and the median concentrations of PM2.5 and
O3 were 2.9 µg/m3 and 67.8 µg/m3, respectively. Short-term
exposure to heat was associated with increased risks for CPD and
CVD mortality. When considering the interaction with air
pollution, we observed heat-related increases in the risks for CPD
and CVD mortality at the medium and high levels of O3 (see Fig.
1). For an increment from the 75th to the 99th percentile of the
temperature distribution, the risk for CPD mortality increased by
27.3% (95% CI: 4.7, 49.9) and 26.5% (95% CI: -1.6, 54.5) at the
medium and high levels of O3, respectively. Similarly, the risk for
CVD mortality increased respectively by 26.9% (2.7, 51.2) and
28.0% (-2.5, 58.4) at the medium and high O3 levels. The
differences in the effect estimates of heat across different levels of
O3 were not significant. No associations between heat and mortality were found at any levels of PM2.5.
Conclusions
This study suggests that there was no significant modification of the short-term heat effects on CPD and CVD mortality by air
pollution during the warm season in the Norwegian CONOR cohort. The results indicate potential spatial variations in the
interactive effects of air temperature and air pollution on mortality.
Fig. 1 Modification of heat effects on mortality by PM2.5 and O3.
140

AIR QUALITY MODELLING OVER THE WEST MIDLANDS, UK: APPLICATION OF
THE MAQS-HEALTH SYSTEM
J. Zhong (1), C. Hood (2), K. Johnson (2), J. Stocker (2), M. Jackson (2) and W.J. Bloss (1)
(1) School of Geography, Earth & Environmental Sciences, University of Birmingham, Edgbaston, Birmingham, B15 2TT,
United Kingdom; (2) Cambridge Environmental Research Consultants, Cambridge, CB2 1SJ, United Kingdom
Presenting author email: [email protected]
Summary
This study implemented and tested the MAQS-Health system [developed under the SPF Clean Air project ‘Multi-Model Air
Quality System for Health Research’ (MAQS-Health)] for the West Midlands (UK) domain. Regional WRF-CMAQ
modelling [available from the NERC WM-Air (Clean Air Science For The West Midlands) project] was used to represent the
meteorology and chemical-transport effects at regional scale. The regional model outputs were then coupled with ADMS-
local modelling, in which the high resolution explicit major road transport emissions and street canyon effects were
simulated. The system evaluation was conducted by comparing modelled and measured concentrations of NO, NO2, O3,
PM10, and PM2.5 using the MAQS-Health Verification system, and the modelling system overall performed well. Contour
runs were also conducted to generate street-scale resolution air quality maps, which could potentially be linked to health and
economic models.
Introduction
Air pollution forms a substantial environmental risk, causing adverse effects to human health. Air quality modelling can
provide air pollutant concentrations at high spatial and temporal resolution for health related modelling studies. There is a
need to couple regional with local modelling to better predict the local air quality, therefore allowing better assessment for
health. The MAQS-Health system was such a model developed by Cambridge Environmental Research Consultants. This
study conducted implementation and testing of the MAQS-Health system for the West Midlands (UK) domain.
Methodology and Results
The regional WRF-CMAQ model included 4 nested domains with horizontal resolutions of 27 km, 9 km, 3 km and 1 km.
There are 30 vertical layers with the lowest layer depth up to a height of 20 m. The finest domain outputs of meteorology and
concentrations with 1 km horizonal resolution were used for coupling with the ADMS-local modelling. The road transport
emissions and underlying urban morphology data used in this study were same as that used in Zhong et al (2021). There were
32 air quality sites of 3 types (i.e. Urban background, Roadside and Airport) from AURN and local authorities. The MAQS-
Health system was run on the Bluebear cluster at the University of Birmingham. Scatter plots of annual NO2 for 2016
comparing the models (CMAQ and MAQS-Health) and measurements are shown in Fig. 1, suggesting there was similar
performance between the two models for urban background and airport sites, while the MAQS-Health system captured the
higher concentrations measured at roadside sites. From the contour run of the MAQS-Health system, street-scale resolution
air quality maps can be generated (an example shown in Fig. 2) and could be projected into health-related population layers
(e.g. ward levels and Lower-level Super Output Areas - LSOA).
Fig.1 Scatter plots of annual NO2 for 2016 Fig.2 Example contour map of NO2 (1 week average in Jan. 2016) over the West Midlands
Conclusions
The MAQS-Health modelling system has been successfully tested for air quality modelling over the West Midlands, UK.
Model evaluation against air quality measurements was overall satisfactory. Street-scale resolution air quality maps can be
generated, and potentially used by the WM-Air health and economic model-Air Quality Lifecourse Assessment Tool (AQ-
LAT).
Acknowledgement
This work was supported by BEIS / Met Office (DN424739; MAQS-Health project) and NERC (NE/S003487/1; WM-Air
project). We acknowledge the University of Birmingham’s BlueBEAR HPC service (http://www.bear.bham.ac.uk) for
provision of computational resources, local authorities within the West Midlands for provision of local air quality
measurement and modelling data, and Transport for West Midlands (TfWM) and Birmingham City Council for provision of
traffic data, previous modelling and reports.
References
Zhong J., Hood C., Johnson K., Stocker J., Handley H., Wolstencroft M., Mazzeo A., Cai X., Bloss W.J., 2021 Using task
farming to optimize a street-scale resolution air quality model of the West Midlands (UK). Atmosphere 12(8), 983.
141

POSTER PRESENTATIONS

MULTI-ANTIBIOTIC RESISTANCE BACTERIA IN LANDFILL BIOAEROSOLS: A STUDY CASE IN AN
INDUSTRIAL CARIBBEAN CITY OF COLOMBIA
W. Morgado-Gamero (2) A. Parody (3), J. Medina (2), L.A. Rodriguez-Villamizar (4), D. Agudelo-Castañeda(1)
(1) Department of Civil and Environmental Engineering, Universidad del Norte, Km 5 Vía Puerto Colombia, 081007,
Barranquilla, Colombia; (2) Department of Civil and Environmental, Universidad de la Costa, Cl. 58 ##55 – 66, 080002
Barranquilla, Colombia. (3) Engineering Faculty, Universidad Libre Barranquilla, Cra 46 No. 48-170, Barranquilla,
Colombia. (4) Department of Public Health, Universidad Industrial de Santander, Bucaramanga, Colombia
Presenting author email: [email protected]
Summary
The aim of this study was to reveal the multi-antibiotic
resistance bacterial bioaerosol emitted by a sanitary landfill
and the surrounding area. We evaluated the influence of
environmental conditions in the occurrence of A.R.B and
biological risk assessment. This study confirmed the multi-
antibiotic resistance in bacterial bioaerosol in a landfill and in
the surrounding area. Obtained mean concentrations of
bacterial bioaerosols, as well as antibiotic resistance in
bacterial bioaerosol (A.R.B), were high, especially for fine
particles that may be a threat for human health. Results
suggest the possible risk of antibiotic-resistance interchange
between pathogenic and non-pathogenic species in the landfill
facilities, thus promoting antibiotic multi-resistance genes
spreading into the environment.
Introduction
Landfills, as well as other waste management facilities, are
well-known bioaerosols sources. These places may foment
antibiotic resistance in bacterial bioaerosol (A.R.B) due to
inadequate pharmaceutical waste disposal. This issue may
foster the necessity of using last-generation antibiotics with
extra costs in the health care system, and deaths.
Methodology and Results
Bacterial bioaerosol was sampled in six (6) sites located
within the landfill and the neighbouring municipality. An
Andersen six-stage viable cascade impactor (Thermo Fisher
Scientific ©) was used to collect bacterial bioaerosol in six
aerodynamic diameter size ranges We performed the species
identification and the antibiotic susceptibility tests by a BD
Phoenix-100 automated interpretation system (BD Diagnostic
Systems). Leachate pools, which concentrations should be comparable with wastewater treatment plants, showed lower
values than the active cell location. Fig 1.a shows that more than 52% of the A.R.B in the active cell, passive cell 2, and
village 1 penetrate the human respiratory system until the alveoli. In comparison, more than 53% of the A.R.B. in the
leachate pool, passive cell 1 and village 2 were in the terminal bronchi. A.R.B. higher concentration was placed in the
aerodynamic size between 3.3-4.7 μm, Fig 1.b shows that the higher concentration of A.R.B was in the trachea and primary
bronchi. The evidence from this study suggests that bacterial bioaerosols, i.e. associated to fine particles, may have been
transported from inside the landfill to the village, thus representing a health risk for the inhabitants of the surrounding area..
Conclusions
Five species of the total of the thirteen (13) identified viable bacteria were A.R.B. Some of these species are pathogens,
others opportunistic in immunodeficient individuals, and others non-pathogenic by inhalation. P. aeruginosa, B. cereus, P.
pentosaceus showed multi-antibiotic resistance.
The relevance of multi-antibiotic resistance is clearly supported. Some identified species showed resistance to vancomycin,
one of the last resources for severe infections treatment. The higher percentage of the A.R.B. detected were resistant to
Ampicillin-Sulbactam, Benzylpenicillin, Penicillin G, Gentamicin, Vancomycin, and Teicoplanin
Acknowledgement
Universidad de la Costa- financial support. Colciencias- scholarships of grad students. Barranquilla Air Quality Monitoring
Network. E.P.A. Professor Heidi Posso from Metropolitan Hospital of Barranquilla. Martha Mendoza and Erika Arbelaez
for the support in the samplings.
References
Morgado-Gamero, W.B., Hernandez, M.M., Ramirez, M.C., Medina-Altahona, J., De La Hoz, S., Mendoza, H.P., Parody,
A., Teixeira, E.C., Agudelo-Castañeda, D.M., 2019. Antibiotic resistance of airborne viable bacteria and size distribution
in neonatal intensive care units. Int. J. Environ. Res. Public Health 16. https://doi.org/10.3390/ijerph16183340
Figure 1. ;% of resistance bacterial bioaerosol (a): and
total mean concentration of resistance bacterial
bioaerosol (b)
143
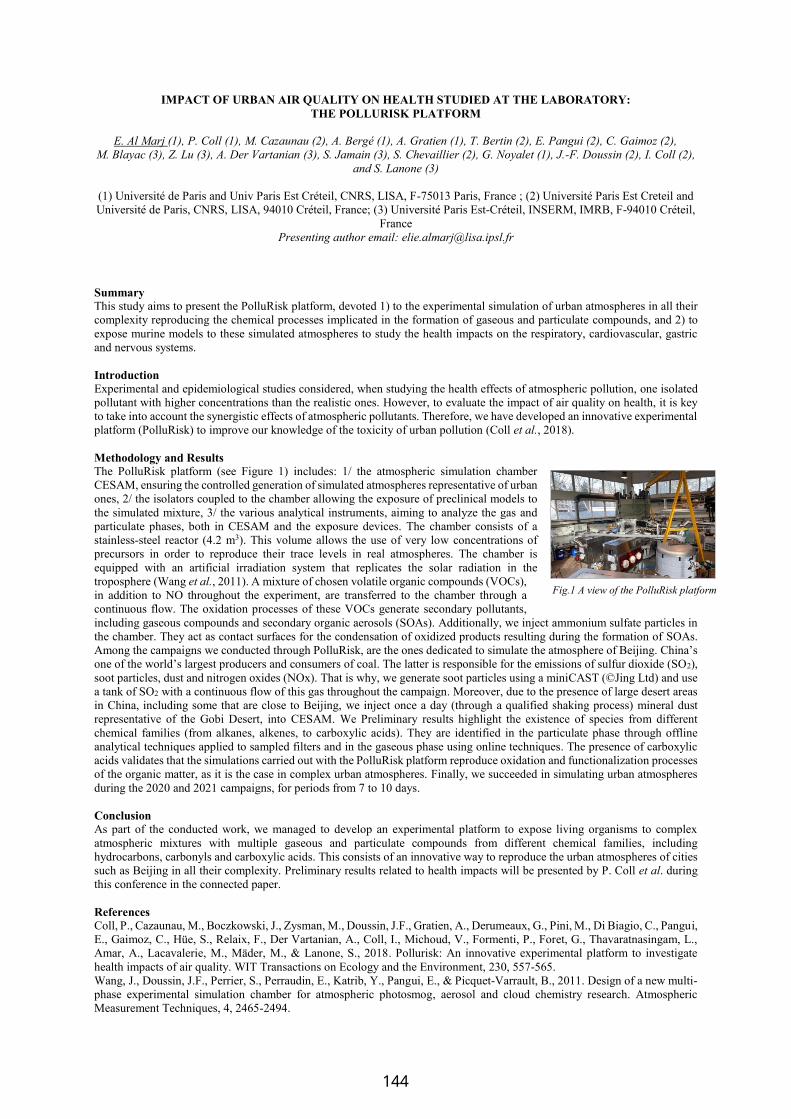
IMPACT OF URBAN AIR QUALITY ON HEALTH STUDIED AT THE LABORATORY:
THE POLLURISK PLATFORM
E. Al Marj (1), P. Coll (1), M. Cazaunau (2), A. Bergé (1), A. Gratien (1), T. Bertin (2), E. Pangui (2), C. Gaimoz (2),
M. Blayac (3), Z. Lu (3), A. Der Vartanian (3), S. Jamain (3), S. Chevaillier (2), G. Noyalet (1), J.-F. Doussin (2), I. Coll (2),
and S. Lanone (3)
(1) Université de Paris and Univ Paris Est Créteil, CNRS, LISA, F-75013 Paris, France ; (2) Université Paris Est Creteil and
Université de Paris, CNRS, LISA, 94010 Créteil, France; (3) Université Paris Est-Créteil, INSERM, IMRB, F-94010 Créteil,
France
Presenting author email: [email protected]
Summary
This study aims to present the PolluRisk platform, devoted 1) to the experimental simulation of urban atmospheres in all their
complexity reproducing the chemical processes implicated in the formation of gaseous and particulate compounds, and 2) to
expose murine models to these simulated atmospheres to study the health impacts on the respiratory, cardiovascular, gastric
and nervous systems.
Introduction
Experimental and epidemiological studies considered, when studying the health effects of atmospheric pollution, one isolated
pollutant with higher concentrations than the realistic ones. However, to evaluate the impact of air quality on health, it is key
to take into account the synergistic effects of atmospheric pollutants. Therefore, we have developed an innovative experimental
platform (PolluRisk) to improve our knowledge of the toxicity of urban pollution (Coll et al., 2018).
Methodology and Results
The PolluRisk platform (see Figure 1) includes: 1/ the atmospheric simulation chamber
CESAM, ensuring the controlled generation of simulated atmospheres representative of urban
ones, 2/ the isolators coupled to the chamber allowing the exposure of preclinical models to
the simulated mixture, 3/ the various analytical instruments, aiming to analyze the gas and
particulate phases, both in CESAM and the exposure devices. The chamber consists of a
stainless-steel reactor (4.2 m3). This volume allows the use of very low concentrations of
precursors in order to reproduce their trace levels in real atmospheres. The chamber is
equipped with an artificial irradiation system that replicates the solar radiation in the
troposphere (Wang et al., 2011). A mixture of chosen volatile organic compounds (VOCs),
in addition to NO throughout the experiment, are transferred to the chamber through a
continuous flow. The oxidation processes of these VOCs generate secondary pollutants,
including gaseous compounds and secondary organic aerosols (SOAs). Additionally, we inject ammonium sulfate particles in
the chamber. They act as contact surfaces for the condensation of oxidized products resulting during the formation of SOAs.
Among the campaigns we conducted through PolluRisk, are the ones dedicated to simulate the atmosphere of Beijing. China’s
one of the world’s largest producers and consumers of coal. The latter is responsible for the emissions of sulfur dioxide (SO2),
soot particles, dust and nitrogen oxides (NOx). That is why, we generate soot particles using a miniCAST (©Jing Ltd) and use
a tank of SO2 with a continuous flow of this gas throughout the campaign. Moreover, due to the presence of large desert areas
in China, including some that are close to Beijing, we inject once a day (through a qualified shaking process) mineral dust
representative of the Gobi Desert, into CESAM. We Preliminary results highlight the existence of species from different
chemical families (from alkanes, alkenes, to carboxylic acids). They are identified in the particulate phase through offline
analytical techniques applied to sampled filters and in the gaseous phase using online techniques. The presence of carboxylic
acids validates that the simulations carried out with the PolluRisk platform reproduce oxidation and functionalization processes
of the organic matter, as it is the case in complex urban atmospheres. Finally, we succeeded in simulating urban atmospheres
during the 2020 and 2021 campaigns, for periods from 7 to 10 days.
Conclusion
As part of the conducted work, we managed to develop an experimental platform to expose living organisms to complex
atmospheric mixtures with multiple gaseous and particulate compounds from different chemical families, including
hydrocarbons, carbonyls and carboxylic acids. This consists of an innovative way to reproduce the urban atmospheres of cities
such as Beijing in all their complexity. Preliminary results related to health impacts will be presented by P. Coll et al. during
this conference in the connected paper.
References
Coll, P., Cazaunau, M., Boczkowski, J., Zysman, M., Doussin, J.F., Gratien, A., Derumeaux, G., Pini, M., Di Biagio, C., Pangui,
E., Gaimoz, C., Hüe, S., Relaix, F., Der Vartanian, A., Coll, I., Michoud, V., Formenti, P., Foret, G., Thavaratnasingam, L.,
Amar, A., Lacavalerie, M., Mäder, M., & Lanone, S., 2018. Pollurisk: An innovative experimental platform to investigate
health impacts of air quality. WIT Transactions on Ecology and the Environment, 230, 557-565.
Wang, J., Doussin, J.F., Perrier, S., Perraudin, E., Katrib, Y., Pangui, E., & Picquet-Varrault, B., 2011. Design of a new multi-
phase experimental simulation chamber for atmospheric photosmog, aerosol and cloud chemistry research. Atmospheric
Measurement Techniques, 4, 2465-2494.
Fig.1 A view of the PolluRisk platform
144
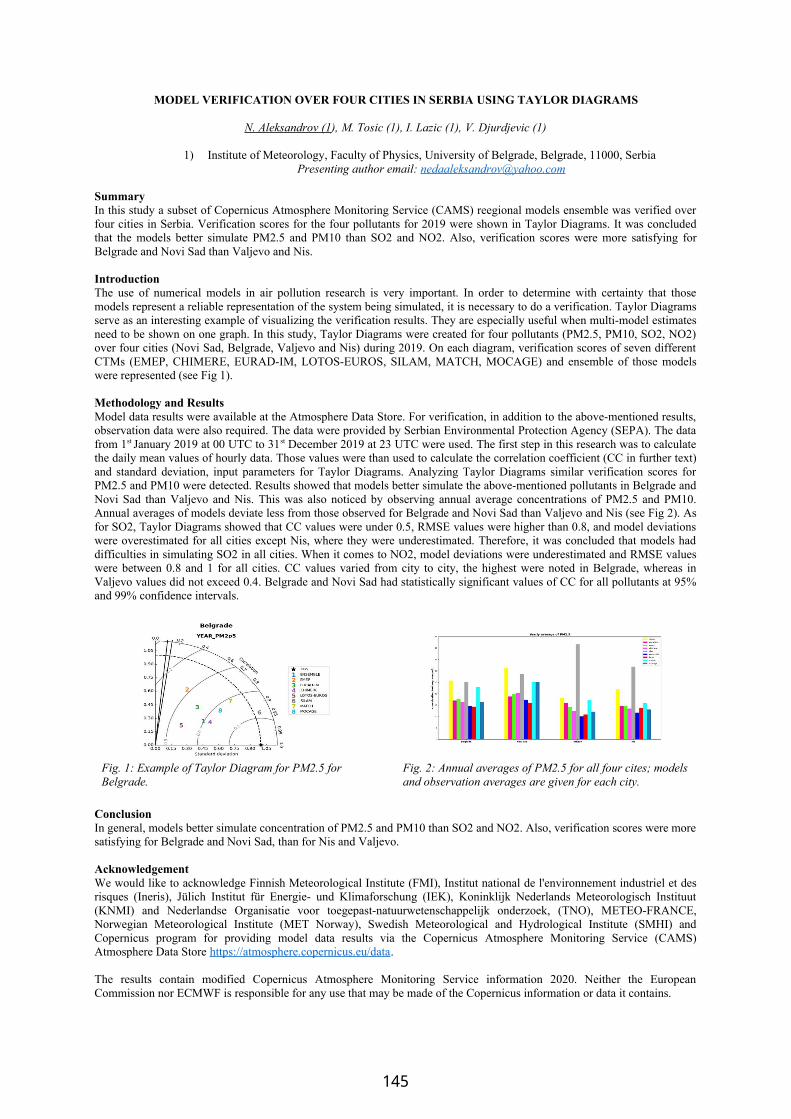
MODEL VERIFICATION OVER FOUR CITIES IN SERBIA USING TAYLOR DIAGRAMS
N. Aleksandrov (1), M. Tosic (1), I. Lazic (1), V. Djurdjevic (1)
1) Institute of Meteorology, Faculty of Physics, University of Belgrade, Belgrade, 11000, SerbiaPresenting author email: [email protected]
SummaryIn this study a subset of Copernicus Atmosphere Monitoring Service (CAMS) reegional models ensemble was verified overfour cities in Serbia. Verification scores for the four pollutants for 2019 were shown in Taylor Diagrams. It was concludedthat the models better simulate PM2.5 and PM10 than SO2 and NO2. Also, verification scores were more satisfying forBelgrade and Novi Sad than Valjevo and Nis.
Introduction The use of numerical models in air pollution research is very important. In order to determine with certainty that thosemodels represent a reliable representation of the system being simulated, it is necessary to do a verification. Taylor Diagramsserve as an interesting example of visualizing the verification results. They are especially useful when multi-model estimatesneed to be shown on one graph. In this study, Taylor Diagrams were created for four pollutants (PM2.5, PM10, SO2, NO2)over four cities (Novi Sad, Belgrade, Valjevo and Nis) during 2019. On each diagram, verification scores of seven differentCTMs (EMEP, CHIMERE, EURAD-IM, LOTOS-EUROS, SILAM, MATCH, MOCAGE) and ensemble of those modelswere represented (see Fig 1).
Methodology and ResultsModel data results were available at the Atmosphere Data Store. For verification, in addition to the above-mentioned results,observation data were also required. The data were provided by Serbian Environmental Protection Agency (SEPA). The datafrom 1st January 2019 at 00 UTC to 31st December 2019 at 23 UTC were used. The first step in this research was to calculatethe daily mean values of hourly data. Those values were than used to calculate the correlation coefficient (CC in further text)and standard deviation, input parameters for Taylor Diagrams. Analyzing Taylor Diagrams similar verification scores forPM2.5 and PM10 were detected. Results showed that models better simulate the above-mentioned pollutants in Belgrade andNovi Sad than Valjevo and Nis. This was also noticed by observing annual average concentrations of PM2.5 and PM10.Annual averages of models deviate less from those observed for Belgrade and Novi Sad than Valjevo and Nis (see Fig 2). Asfor SO2, Taylor Diagrams showed that CC values were under 0.5, RMSE values were higher than 0.8, and model deviationswere overestimated for all cities except Nis, where they were underestimated. Therefore, it was concluded that models haddifficulties in simulating SO2 in all cities. When it comes to NO2, model deviations were underestimated and RMSE valueswere between 0.8 and 1 for all cities. CC values varied from city to city, the highest were noted in Belgrade, whereas inValjevo values did not exceed 0.4. Belgrade and Novi Sad had statistically significant values of CC for all pollutants at 95%and 99% confidence intervals.
Fig. 1: Example of Taylor Diagram for PM2.5 for Belgrade.
Fig. 2: Annual averages of PM2.5 for all four cites; modelsand observation averages are given for each city.
ConclusionIn general, models better simulate concentration of PM2.5 and PM10 than SO2 and NO2. Also, verification scores were moresatisfying for Belgrade and Novi Sad, than for Nis and Valjevo.
AcknowledgementWe would like to acknowledge Finnish Meteorological Institute (FMI), Institut national de l'environnement industriel et desrisques (Ineris), Jülich Institut für Energie- und Klimaforschung (IEK), Koninklijk Nederlands Meteorologisch Instituut(KNMI) and Nederlandse Organisatie voor toegepast-natuurwetenschappelijk onderzoek, (TNO), METEO-FRANCE,Norwegian Meteorological Institute (MET Norway), Swedish Meteorological and Hydrological Institute (SMHI) andCopernicus program for providing model data results via the Copernicus Atmosphere Monitoring Service (CAMS)Atmosphere Data Store https://atmosphere.copernicus.eu/data.
The results contain modified Copernicus Atmosphere Monitoring Service information 2020. Neither the EuropeanCommission nor ECMWF is responsible for any use that may be made of the Copernicus information or data it contains.
145

IMPROVING WRF MODEL PERFORMANCE FOR EUROPEAN COASTAL REGIONS: CONTRIBUTION TO THE H2020 EMERGE PROJECT
Ummugulsum ALYUZ (1), Ranjeet Sokhi (1), Jaakko Kukkonen (2), Mikhail Sofiev (2) and EMERGE team (3)
(1) University of Hertfordshire, U.K., (2) Finnish Meteorological Institute, (3) https://emerge-h2020.eu/consortium/ Summary Summer (July and August) and Winter (January and February) of the year 2018 was simulated over Europe with three sensitivity analyses using the Weather Research and Forecasting (WRF) model at 5-km horizontal grid. The objective of the research is to improve WRF predictions over coastal regions. The impact of USGS and MODIS land use land cover (LULC) changes on simulation of the meteorology in the coastal regions was examined along with other WRF options. After checking LULC sensitivities, a combined modelling approach was designed for WRF leading to improved performance. Final set of model configuration were tested for the whole 2018 in five coastal regions over Europe.
Introduction Modellers need more accurate weather predictions when coastal meteorological data is essential in studies such as investigating the air quality and health impact of shipping emissions. Analysis of the WRF model results, demonstrated that performance for coastal regions was worse than for inland locations. This study reports on a detailed analysis to improve the performance of WRF predictions over coastal regions. Such datasets are critical for undertaking air quality predictions and forecasting. Methodology and Results The quality of topography and land use data plays a major role in the representativeness of the coastal regions within the meteorology model. Thus, sensitivity analyses were performed with USGS LULC and with MODIS. The model results were evaluated against MIDAS [1] observations at the Solent region of South England. As shown in Fig. 1, the WRF model with both USGS and MODIS LULC has no significant impact on 2m Temperature (T2) for the Hurn station. However, the model predictions of wind speed (WS) and planetary boundary layer height (PBLH) show better agreement with observations for MODIS LULC at this location. The analysis has been extended to several stations which showed that generally, the WRF model gave better results in South UK stations with MODIS LULC compared to USGS for T2, relative humidity (RH), WS and PBLH.
To improve WRF prediction results with MODIS LULC, several options of the WRF model were investigated such as sea surface temperature (SST) update, daily initialization, vertical interpolation, and grid nudging. All these changes were named as 'final update' in the third sensitivity and as seen in Fig 1 as an example, the final update (red dot on Fig. 1) shows the dramatic improvements in the predictions. A full annual run of the WRF model was conducted for 2018 for the whole European domain with a grid resolution of 5 km. Öresund (Denmark), Aveiro (Portugal), Piraeus (Greece), Venice (Italy) and Solent (South UK) case study areas were considered in the evaluation of the results. Model performances were evaluated from a synthesis of the FAC2, mean bias, mean gross error, normalized mean bias, normalized mean gross error, correlation coefficient and index of agreement and improved accuracy of simulated WS as well as T2, RH and PBLH.
Conclusions While significant improvements in the WRF model outputs have been achieved for coastal locations. higher resolution LULC data would increase the accuracy of WS and WD providing a better description of sea surface temperature and sea breeze. Further research is planned to examine the impact of higher resolution of 1x1 km over the case study areas. NCEP-FNL [2] operational global analysis and forecast dataset was used in this study which are on 0.25°×0.25° grids while horizontal features being considered in the simulations of coastal environments are of the order of several hundred meters. Where possible, higher resolution atmospheric data is needed to better represent local conditions (i.e., local winds) at coastal sites. Acknowledgement This presentation is based on results from the EU project EMERGE, (2020 – 2024; https://emerge-h2020.eu/). References [1] Met Office Integrated Data Archive System (MIDAS) Land surface and marine surface observations data. https://catalogue.ceda.ac.uk [2] National Centers for Environmental Prediction/National Weather Service/NOAA/U.S. Department of Commerce 2015
Fig. 1. Taylor diagram for Hurn coastal station in South UK for
Summer and Winter 2018 for 2m Temperature (C).
146
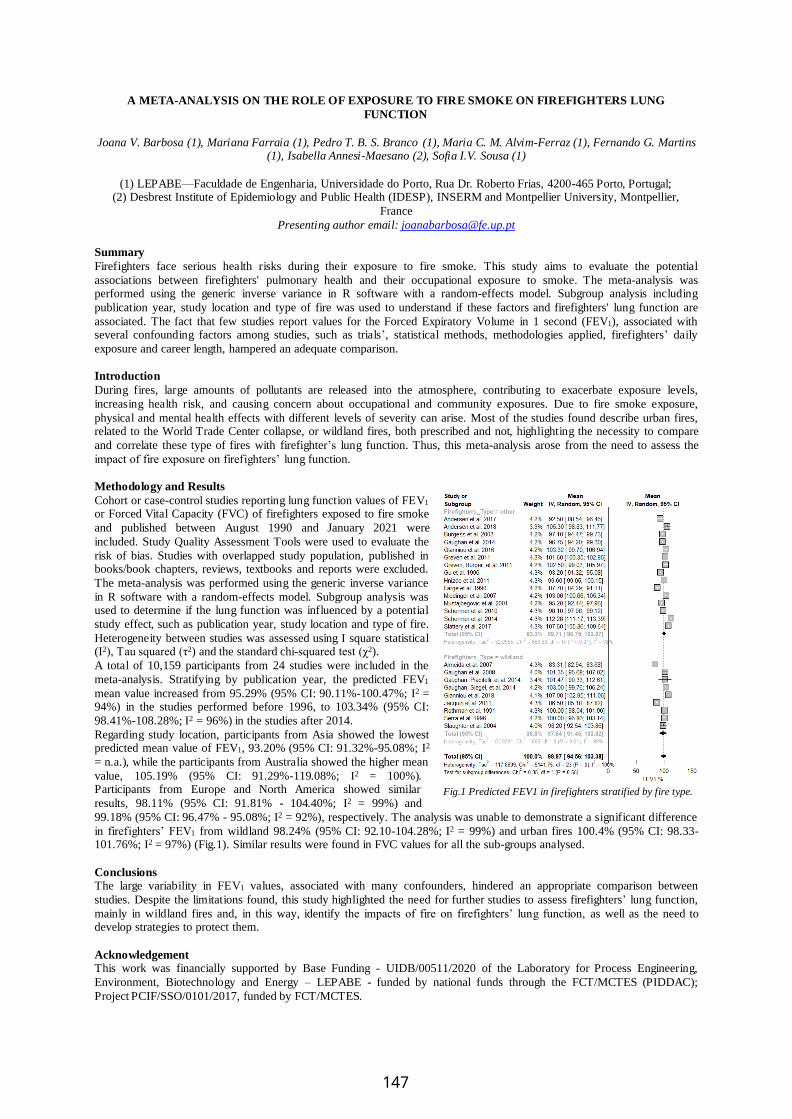
A META-ANALYSIS ON THE ROLE OF EXPOSURE TO FIRE SMOKE ON FIREFIGHTERS LUNG
FUNCTION
Joana V. Barbosa (1), Mariana Farraia (1), Pedro T. B. S. Branco (1), Maria C. M. Alvim-Ferraz (1), Fernando G. Martins (1), Isabella Annesi-Maesano (2), Sofia I.V. Sousa (1)
(1) LEPABE—Faculdade de Engenharia, Universidade do Porto, Rua Dr. Roberto Frias, 4200-465 Porto, Portugal; (2) Desbrest Institute of Epidemiology and Public Health (IDESP), INSERM and Montpellier University, Montpellier,
France
Presenting author email: [email protected]
Summary
Firefighters face serious health risks during their exposure to fire smoke. This study aims to evaluate the potential
associations between firefighters' pulmonary health and their occupational exposure to smoke. The meta-analysis was performed using the generic inverse variance in R software with a random-effects model. Subgroup analysis including
publication year, study location and type of fire was used to understand if these factors and firefighters' lung function are
associated. The fact that few studies report values for the Forced Expiratory Volume in 1 second (FEV1), associated with several confounding factors among studies, such as trials’, statistical methods, methodologies applied, firefighters’ daily
exposure and career length, hampered an adequate comparison.
Introduction
During fires, large amounts of pollutants are released into the atmosphere, contributing to exacerbate exposure levels,
increasing health risk, and causing concern about occupational and community exposures. Due to fire smoke exposure,
physical and mental health effects with different levels of severity can arise. Most of the studies found describe urban fires, related to the World Trade Center collapse, or wildland fires, both prescribed and not, highlighting the necessity to compare
and correlate these type of fires with firefighter’s lung function. Thus, this meta-analysis arose from the need to assess the
impact of fire exposure on firefighters’ lung function.
Methodology and Results
Cohort or case-control studies reporting lung function values of FEV1 or Forced Vital Capacity (FVC) of firefighters exposed to fire smoke
and published between August 1990 and January 2021 were
included. Study Quality Assessment Tools were used to evaluate the
risk of bias. Studies with overlapped study population, published in books/book chapters, reviews, textbooks and reports were excluded.
The meta-analysis was performed using the generic inverse variance
in R software with a random-effects model. Subgroup analysis was used to determine if the lung function was influenced by a potential
study effect, such as publication year, study location and type of fire.
Heterogeneity between studies was assessed using I square statistical (I2), Tau squared (τ2) and the standard chi-squared test (χ2).
A total of 10,159 participants from 24 studies were included in the
meta-analysis. Stratifying by publication year, the predicted FEV1
mean value increased from 95.29% (95% CI: 90.11%-100.47%; I2 = 94%) in the studies performed before 1996, to 103.34% (95% CI:
98.41%-108.28%; I2 = 96%) in the studies after 2014.
Regarding study location, participants from Asia showed the lowest predicted mean value of FEV1, 93.20% (95% CI: 91.32%-95.08%; I2
= n.a.), while the participants from Australia showed the higher mean
value, 105.19% (95% CI: 91.29%-119.08%; I2 = 100%). Participants from Europe and North America showed similar
results, 98.11% (95% CI: 91.81% - 104.40%; I2 = 99%) and
99.18% (95% CI: 96.47% - 95.08%; I2 = 92%), respectively. The analysis was unable to demonstrate a significant difference
in firefighters’ FEV1 from wildland 98.24% (95% CI: 92.10-104.28%; I2 = 99%) and urban fires 100.4% (95% CI: 98.33-101.76%; I2 = 97%) (Fig.1). Similar results were found in FVC values for all the sub-groups analysed.
Conclusions The large variability in FEV1 values, associated with many confounders, hindered an appropriate comparison between
studies. Despite the limitations found, this study highlighted the need for further studies to assess firefighters’ lung function,
mainly in wildland fires and, in this way, identify the impacts of fire on firefighters’ lung function, as well as the need to develop strategies to protect them.
Acknowledgement This work was financially supported by Base Funding - UIDB/00511/2020 of the Laboratory for Process Engineering,
Environment, Biotechnology and Energy – LEPABE - funded by national funds through the FCT/MCTES (PIDDAC);
Project PCIF/SSO/0101/2017, funded by FCT/MCTES.
Fig.1 Predicted FEV1 in firefighters stratified by fire type.
147

CFD DISPERSSION MODELLING OF SHIP EMISSIONS IN THE PORT OF MARSEILLE
C. K. Boikos, P. Siamidis, F. Barbas, L. Ntziachristos
Laboratory of Heat Transfer and Environmental Engineering (LHTEE), Aristotle University of Thessaloniki , 54124, Greece
Presenting author email: [email protected]
Summary
Current work presents first efforts in quantifying the effect of ship emissions on air quality in an area next to the port of
Marseille. More specifically, it studies ship emission dispersion, quantifying the concentration level of a chemically inert
pollutant, based on different scenarios, the main parameters of which are ship emissions and meteorological conditions. CFD
microscale methodology is implemented to develop the plume dispersion model. For ship emission scenarios, AIS data as well
the emission factors of the SCIPPER project (D4.1) are used.
Introduction
International maritime traffic has undergone a remarkable development over the last decades , leading to ship traffic increase in many ports all over the world (Review of Maritime Transport 2020). As a result, port authorities and international
organizations are forcing stricter regulations to control shipping emissions and its impact on air quality. This work studies the
plume dispersion of ship emissions in the port of Marseille implementing a CFD-RANS model. It aims to demonstrate the local
air quality impacts in the port for different emission and meteorological scenarios.
Methodology and Results
For the development of the dispersion model, CFD-RANS
methodology was implemented. The 3D cad of the buildings in
Marseille was simplified and corrected to meet computational
standards such as dimensional accuracy, volumes distinction and
computational demands. No chemical reactions were included,
meaning that the pollutant is treated as an inert gas and its
concentration is proportional to its release rate for fixed
meteorological conditions. Temperature was kept constant
(isothermal simulations), and buoyancy effects were neglected.
Meteorological data (wind speed and wind direction) was used as boundary conditions. AIS data was implemented in order to specify
ship traffic at the port of Marseille. Ship emissions were estimated
using the load dependent emission factors (EFs) of the SCIPPER
project (D4.1), based on engine power, engine load, and operational
point (maneuvering, berthing).
Conclusions and expectations
Recently, ship traffic has been increased and so has ship emissions. CFD models can predict the concentration of a pollutant
locally in urban areas, leading to a better understanding of the flow patterns and turbulence level. This kind of information
compared with on-site measurements can provide a more wholistic view of the air quality in ports like that of Marseille. In
turn, this can assist the establishment of immediate measures that can significantly contribute in decreasing exposure in the
vicinity of ship activities.
Acknowledgement
In this work emission factors for ships as well as meteorological and AIS data were provided in the context of SCIPPER project (Contract Number 814893).
References
[1] SCIPPER project D4.1, New set of emission factors and activity information (Under review)
[2] Review of Maritime Transport 2020, UNCAD
Fig.1 Plume dispersion in the port of Marseille
148
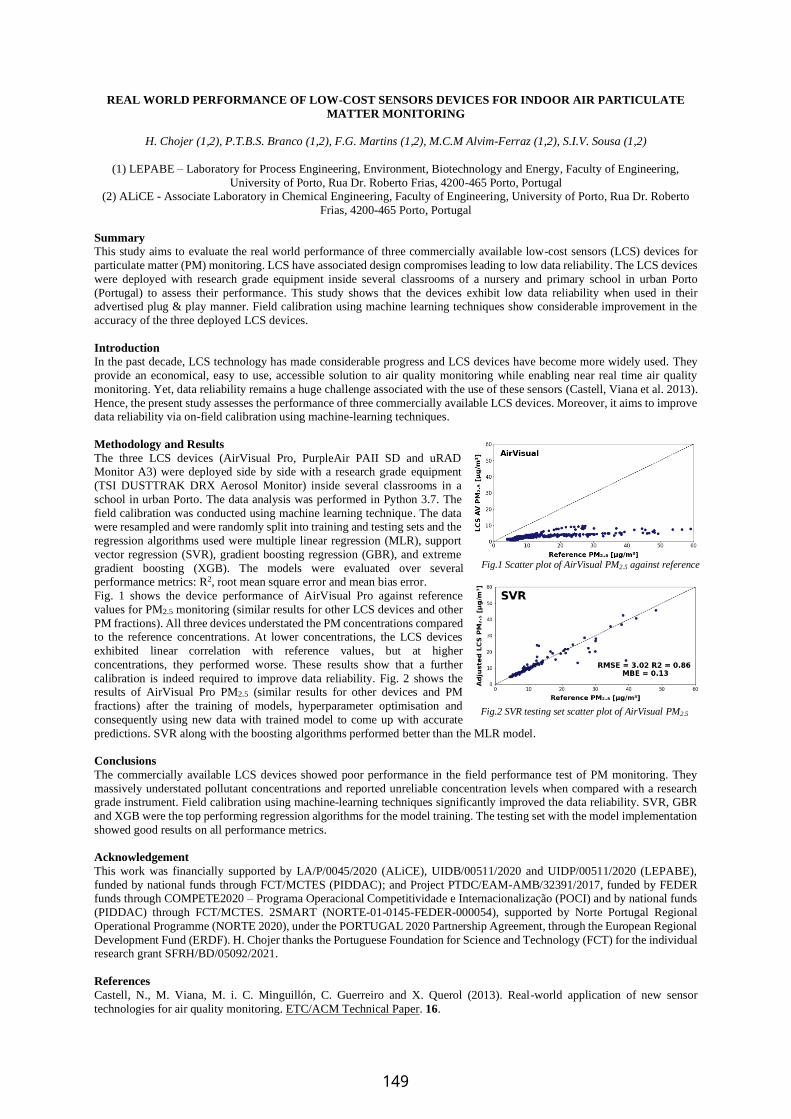
REAL WORLD PERFORMANCE OF LOW-COST SENSORS DEVICES FOR INDOOR AIR PARTICULATE
MATTER MONITORING
H. Chojer (1,2), P.T.B.S. Branco (1,2), F.G. Martins (1,2), M.C.M Alvim-Ferraz (1,2), S.I.V. Sousa (1,2)
(1) LEPABE – Laboratory for Process Engineering, Environment, Biotechnology and Energy, Faculty of Engineering,
University of Porto, Rua Dr. Roberto Frias, 4200-465 Porto, Portugal (2) ALiCE - Associate Laboratory in Chemical Engineering, Faculty of Engineering, University of Porto, Rua Dr. Roberto
Frias, 4200-465 Porto, Portugal
Summary
This study aims to evaluate the real world performance of three commercially available low-cost sensors (LCS) devices for
particulate matter (PM) monitoring. LCS have associated design compromises leading to low data reliability. The LCS devices
were deployed with research grade equipment inside several classrooms of a nursery and primary school in urban Porto
(Portugal) to assess their performance. This study shows that the devices exhibit low data reliability when used in their advertised plug & play manner. Field calibration using machine learning techniques show considerable improvement in the
accuracy of the three deployed LCS devices.
Introduction
In the past decade, LCS technology has made considerable progress and LCS devices have become more widely used. They
provide an economical, easy to use, accessible solution to air quality monitoring while enabling near real time air quality
monitoring. Yet, data reliability remains a huge challenge associated with the use of these sensors (Castell, Viana et al. 2013).
Hence, the present study assesses the performance of three commercially available LCS devices. Moreover, it aims to improve data reliability via on-field calibration using machine-learning techniques.
Methodology and Results
The three LCS devices (AirVisual Pro, PurpleAir PAII SD and uRAD Monitor A3) were deployed side by side with a research grade equipment
(TSI DUSTTRAK DRX Aerosol Monitor) inside several classrooms in a
school in urban Porto. The data analysis was performed in Python 3.7. The
field calibration was conducted using machine learning technique. The data were resampled and were randomly split into training and testing sets and the
regression algorithms used were multiple linear regression (MLR), support
vector regression (SVR), gradient boosting regression (GBR), and extreme
gradient boosting (XGB). The models were evaluated over several performance metrics: R2, root mean square error and mean bias error.
Fig. 1 shows the device performance of AirVisual Pro against reference
values for PM2.5 monitoring (similar results for other LCS devices and other
PM fractions). All three devices understated the PM concentrations compared to the reference concentrations. At lower concentrations, the LCS devices
exhibited linear correlation with reference values, but at higher
concentrations, they performed worse. These results show that a further
calibration is indeed required to improve data reliability. Fig. 2 shows the results of AirVisual Pro PM2.5 (similar results for other devices and PM
fractions) after the training of models, hyperparameter optimisation and
consequently using new data with trained model to come up with accurate
predictions. SVR along with the boosting algorithms performed better than the MLR model.
Conclusions
The commercially available LCS devices showed poor performance in the field performance test of PM monitoring. They
massively understated pollutant concentrations and reported unreliable concentration levels when compared with a research
grade instrument. Field calibration using machine-learning techniques significantly improved the data reliability. SVR, GBR
and XGB were the top performing regression algorithms for the model training. The testing set with the model implementation
showed good results on all performance metrics.
Acknowledgement
This work was financially supported by LA/P/0045/2020 (ALiCE), UIDB/00511/2020 and UIDP/00511/2020 (LEPABE),
funded by national funds through FCT/MCTES (PIDDAC); and Project PTDC/EAM-AMB/32391/2017, funded by FEDER funds through COMPETE2020 – Programa Operacional Competitividade e Internacionalização (POCI) and by national funds
(PIDDAC) through FCT/MCTES. 2SMART (NORTE-01-0145-FEDER-000054), supported by Norte Portugal Regional
Operational Programme (NORTE 2020), under the PORTUGAL 2020 Partnership Agreement, through the European Regional
Development Fund (ERDF). H. Chojer thanks the Portuguese Foundation for Science and Technology (FCT) for the individual research grant SFRH/BD/05092/2021.
References
Castell, N., M. Viana, M. i. C. Minguillón, C. Guerreiro and X. Querol (2013). Real-world application of new sensor
technologies for air quality monitoring. ETC/ACM Technical Paper. 16.
Fig.2 SVR testing set scatter plot of AirVisual PM2.5
Fig.1 Scatter plot of AirVisual PM2.5 against reference
149

IMPACT OF URBAN AIR QUALITY ON HEALTH STUDIED AT THE LABORATORY WITH THE
POLLURISK PLATFORM:
PRELIMINARY RESULTS OF INNOVATIVE STUDIES AT THE LABORATORY
P. Coll (1), Blayac (3), Z. Lu (3), A. Der Vartanian (3), S. Jamain (3), F. Relaix (3), G. Derumeaux (3), M. Cazaunau (2),
A. Bergé (1), E. Al Marj (1), A. Gratien (1), T. Bertin (2), E. Pangui (2), C. Gaimoz (2), M. S. Chevaillier (2), G. Noyalet
(1), J.-F. Doussin (2) and S. Lanone (3)
(1) Université de Paris and Univ Paris Est Créteil, CNRS, LISA, F-75013 Paris, France ; (2) Université Paris Est Creteil
and Université de Paris, CNRS, LISA, 94010 Créteil, France ; (3) Université Paris Est-Créteil, INSERM, IMRB, F-94010
Créteil, France
Presenting author email : [email protected]
Summary
Taking benefit of the PolluRisk platform (described in Elie Al Marj’s paper, “Impact of urban air quality on Health studied
at the laboratory: the PolluRisk platform”), we report here first biological/toxicological results regarding exposure of
preclinical models to complex simulated atmospheric environments, representative of urban environments as Paris or
Beijing ones.
Introduction
Following ethics guidelines, we exposed different murine models to simulated complex (aerosol and gas phases)
atmospheres (Beijing-like or Paris-like) for durations from 48h to 7 days, and compared their biological response to that of
murine models exposed to a reference atmosphere. We are particularly interested by the impact of such exposures on lung
physiology (in the context of health or disease such as chronic obstructive pulmonary disease or cystic fibrosis, at all life-
stages), as well as muscular, cardiometabolic and digestive alterations.
Methodology and Results
We have developed a platform, named PolluRisk (Coll et al., 2018), that allows simulating for days the atmospheric phases
(gases and aerosols) similar to those of cities like Paris, Beijing, etc. It is mainly resulting from the coupling of an
atmospheric simulation chamber to exposure
devices able to host preclinical models
(isolators from Noroit® company). We also
developed protocols for the exposure of murine
models to the state-of-the-art urban atmospheric
simulation carried out with the PolluRisk
platform, in the framework of a REMEDIA test
campaign (Benjdir et al., 2021). As an
illustration of the results obtained we observed
an increased inflammatory response in cystic
fibrosis mice lungs when exposed to a
simulated atmospheric environment of Paris for
48h as compared to their unexposed
counterparts.
Conclusions
The first test campaigns indicate that exposure to complex urban atmospheres simulated thanks to PolluRisk platform 1.
can induce respiratory effects in compromised mice (cystic fibrosis) already after 48h-72h exposure, 2. is associated with
increased risk to develop lung disease at adult age, after in utero exposure for 7 days. Overall, PolluRisk platform represents
an innovative and highly relevant tool for biologists interested in addressing the complex issue of Health effects resulting
from air pollution.
Acknowledgements
This work has received funding from the European Union’s Horizon 2020 research and innovation programme through the
EUROCHAMP-2020 Infrastructure Activity under grant agreement N° 730997, and for REMEDIA project under grant
agreement #874753. We also thank CNRS/INSU, INSERM, Région Ile de France, Fondation du Crédit Agricole, Fondation
du Souffle and UPEC.
References
Benjdir M., E. Audureau, A. Beresniak, P. Coll, R. Epaud, …, S. Lanone, 2021, Assessing the impact of exposome on the course of chronic
obstructive pulmonary disease and cystc fibrosis, Environmental Epidemiology, 5 - Issue e165,
https://doi.org/10.1097/EE9.0000000000000165.
Coll P., M. Cazaunau, J. Boczkowski, M. Zysman, J.F. Doussin, A. Gratien, G. Derumeaux, M. Pini, C. Di-Biagio, E. Pangui, C. Gaimoz,
S. Hüe, F. Relaix, A. Der Vatanian, I. Coll, V. Michoud, P. Formenti, G. Foret, L. Thavaratnasingam, A. Amar, M. Lacavalerie, M. Mäder
and S. Lanone, 2018, PolluRisk : an innovative experimental platform to investigate Health impacts of Air Quality, WIT Transactions on
Ecology and the Environment, 230, 557-565.
4
humid,itpassesthroughadesiccatorfilledwithsilicagel,beforethechamber,todrytheaerosolsandlimit
theintroductionofwatervapor.InordertorealisticallysimulateanatmosphererepresentativeofBeijing,wegeneratesootparticlesusingasootgenerator(miniCASTSeries5200producerealcombustionsootparticlebyusingawelldefinedflamethatsimulatesthecombustioninthemoderncombustionengines),basedonthecombustionofpropane.Theseparticlesaretransferredintoasmallerchamber,asootreservoirchamber,andarebeinginjectedonceadayintotheCESAMchamberataflowof0.5L/min.Moreover,onceaday,weinjectmineraldustparticles,producedthroughashakingprocessfromaGobiDesertsample,intothechamber(simulatingadesertstorm,impactingBeijingwithamineraldustplume).The detailed protocol is reported in Di Biagio et al., Atmos. Chem. Phys., 17, 1901–1929,
https://doi.org/10.5194/acp-17-1901-2017,(2017).
(*) https://acm.aqrc.ucdavis.edu/sites/g/files/dgvnsk3471/files/inline-files/ACM2020_Rickard_MCM.pdf
Mostofourinstrumentaldevelopmentsinthisfirstperiodrefertothe:
- Needtocontrolthetemperatureoftheexposuredevice(tomaintainthetemperatureoftheenvironmentstowhichthepreclinicalmodelsareexposedbetween22°Cand25°C)
- Regulationoftheflowsofgasesandaerosolsbetweenalltheactivepartsoftheplatform(precursorsgenerationdevices,atmosphericchamber,exposuredevices,instrumentsthatanalysegasesandaerosols–onlineandoffline–inthechamberand/orintheexposuredevices)
- Analyticalmeasurementsofgasesandaerosols–onlineandoffline–inthechamberand/orintheexposuredevices)
- Accommodationofcagesintotheexposuredevices.
Inadditiontothat,wetrainedP1andP2teamstooperatetheplatform,ona24/7basis,toestablish
operationalprotocolsandsecurityrules,takingbenefitoftheexposureofCysticFibrosispreclinicalmodels
obtainedintheframeworkofanotherscientificproject.ThisopportunitywasahighgainforREMEDIA
becauseithelpsustolearnalotabouthowtomaintainanatmosphererepresentativeofatargeted
environmentonthe“longterm”(7days),andtoundoubtlyqualifytheuniquecapabilitiesoftheplatform
forsuchstudies.
Figure1:Aschematicviewoftheatmosphericsimulation,startingtotheleftwithacontinuousintroductionofairandprecursorsintheatmosphericsimulationchamber,thenundertheirradiationofXelampsatthetopofthechamberthechemistrytakesplace,leadingafterafewhourstoasecondaryatmosphere“feeding”theexposuredevicewheretheexposedpreclinicalmodelsarepositioned,whilethereferencepreclinicalmodelsareexposedtoareference
atmosphere(airfilteredfrompollutants).Analyticalinstrumentsallowtoqualify/quantifythepollutantspresentinthesimulatedatmosphere,bothonlineandoffline.
O3
NOxSO2
CO/CO2
SMPS-CPC
OPC
150
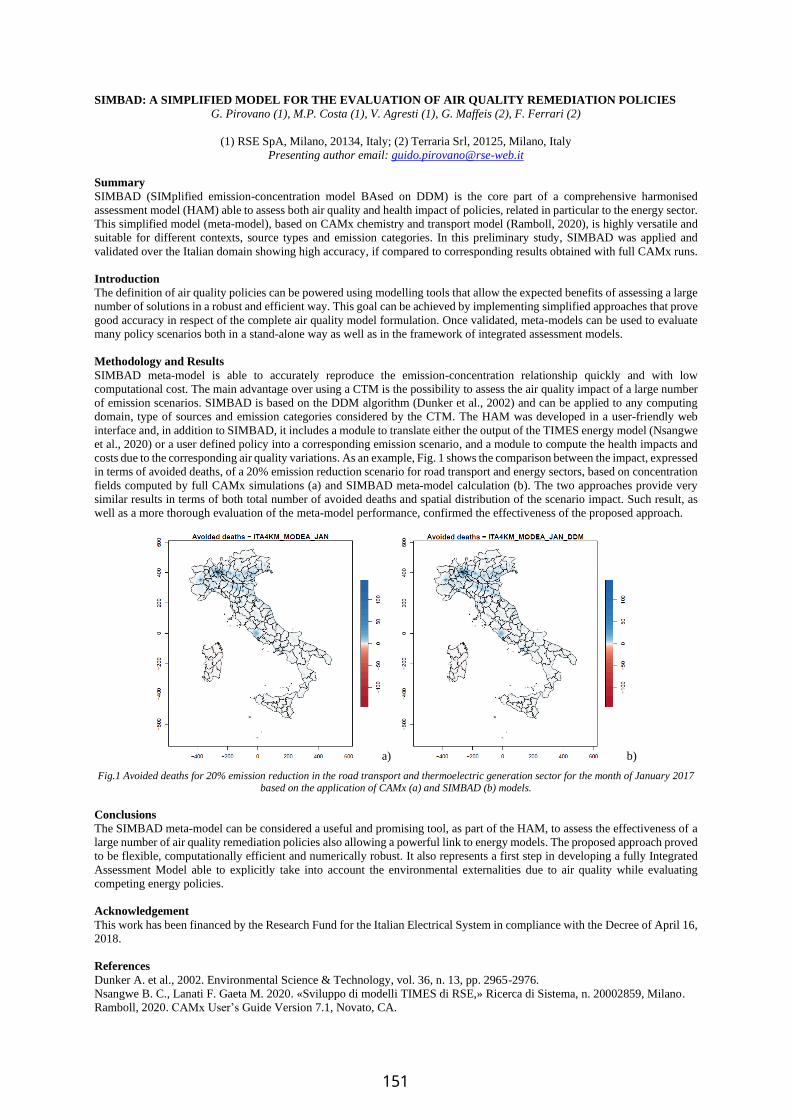
SIMBAD: A SIMPLIFIED MODEL FOR THE EVALUATION OF AIR QUALITY REMEDIATION POLICIES
G. Pirovano (1), M.P. Costa (1), V. Agresti (1), G. Maffeis (2), F. Ferrari (2)
(1) RSE SpA, Milano, 20134, Italy; (2) Terraria Srl, 20125, Milano, Italy
Presenting author email: [email protected]
Summary
SIMBAD (SIMplified emission-concentration model BAsed on DDM) is the core part of a comprehensive harmonised
assessment model (HAM) able to assess both air quality and health impact of policies, related in particular to the energy sector.
This simplified model (meta-model), based on CAMx chemistry and transport model (Ramboll, 2020), is highly versatile and
suitable for different contexts, source types and emission categories. In this preliminary study, SIMBAD was applied and
validated over the Italian domain showing high accuracy, if compared to corresponding results obtained with full CAMx runs.
Introduction
The definition of air quality policies can be powered using modelling tools that allow the expected benefits of assessing a large
number of solutions in a robust and efficient way. This goal can be achieved by implementing simplified approaches that prove
good accuracy in respect of the complete air quality model formulation. Once validated, meta-models can be used to evaluate
many policy scenarios both in a stand-alone way as well as in the framework of integrated assessment models.
Methodology and Results
SIMBAD meta-model is able to accurately reproduce the emission-concentration relationship quickly and with low
computational cost. The main advantage over using a CTM is the possibility to assess the air quality impact of a large number
of emission scenarios. SIMBAD is based on the DDM algorithm (Dunker et al., 2002) and can be applied to any computing
domain, type of sources and emission categories considered by the CTM. The HAM was developed in a user-friendly web
interface and, in addition to SIMBAD, it includes a module to translate either the output of the TIMES energy model (Nsangwe
et al., 2020) or a user defined policy into a corresponding emission scenario, and a module to compute the health impacts and
costs due to the corresponding air quality variations. As an example, Fig. 1 shows the comparison between the impact, expressed
in terms of avoided deaths, of a 20% emission reduction scenario for road transport and energy sectors, based on concentration
fields computed by full CAMx simulations (a) and SIMBAD meta-model calculation (b). The two approaches provide very
similar results in terms of both total number of avoided deaths and spatial distribution of the scenario impact. Such result, as
well as a more thorough evaluation of the meta-model performance, confirmed the effectiveness of the proposed approach.
a) b)
Fig.1 Avoided deaths for 20% emission reduction in the road transport and thermoelectric generation sector for the month of January 2017 based on the application of CAMx (a) and SIMBAD (b) models.
Conclusions
The SIMBAD meta-model can be considered a useful and promising tool, as part of the HAM, to assess the effectiveness of a
large number of air quality remediation policies also allowing a powerful link to energy models. The proposed approach proved
to be flexible, computationally efficient and numerically robust. It also represents a first step in developing a fully Integrated
Assessment Model able to explicitly take into account the environmental externalities due to air quality while evaluating
competing energy policies.
Acknowledgement
This work has been financed by the Research Fund for the Italian Electrical System in compliance with the Decree of April 16,
2018.
References
Dunker A. et al., 2002. Environmental Science & Technology, vol. 36, n. 13, pp. 2965-2976.
Nsangwe B. C., Lanati F. Gaeta M. 2020. «Sviluppo di modelli TIMES di RSE,» Ricerca di Sistema, n. 20002859, Milano.
Ramboll, 2020. CAMx User’s Guide Version 7.1, Novato, CA.
151
NEW PARTICLE FORMATION OBSERVED IN THE CLOSE VICINITY OF A FRENCH MEGALOPOLE
S. Crumeyrolle1, J. Kontkanen2, C. Rose3, V. Riffault4, E. Bourrianne1, E. Tison4, J. De Brito4, A. Velasquez Garcia1,4, I.
Chiapello1 1 LOA-Laboratoire d’Optique Atmosphérique, CNRS, UMR 8518, Univ. Lille, 59000, Lille, France
2 Institute for Atmospheric and Earth System Research/Physics, Faculty of Science, University of Helsinki, Finland 3 Université Clermont Auvergne, CNRS, Laboratoire de Météorologie Physique (LaMP), 63000 Clermont-Ferrand, France 4 IMT Nord Europe, Institut Mines-Télécom, Université de Lille, Centre for Energy and Environment, 59000, Lille, France
Summary:
The objective of this study is to illustrate events of new particle formation (NPF) observed with a SMPS and to provide
information on the conditions favouring their occurrences in the close vicinity of a French megalopole. The data analysis
highlights a strong seasonal variation of the New Particle Formation (NPF) occurrences with a maximum observed during
warm period. From this data set, the environmental conditions favouring the occurrence of NPF events were studied.
Introduction:
Ultrafine particles (UFPs) are particles with an aerodynamic diameter of 100 nm or less, has negligible mass concentration but
is the dominant contributor to the total particle number concentration. Formation of UFP in the urban atmosphere is expected
to be far less favored than in the rural atmosphere due to the high existing surface area for condensation of involatile materials
needed for homogeneous nucleation. Previous comparative studies between rural and urban site reported higher frequency of
NPF events (Peng et al., 2017) over urban sites in comparison to background sites as well as higher growth and formation rates
(Nieminen et al., 2018) attributed to the higher concentration of condensable species. The present study aims to better
understand the environmental factors favoring, or disfavoring, atmospheric NPF over Lille a large city North of France and to
analyze the impact of such event on urban air quality using a long-term dataset (3 years).
Methodology and Results :
The ATOLL (Atmospheric Observation at LiLLE) station is located in the Villeneuve d’Ascq, Northern France (50.63 N; 3.05
E) and only 6 km away from the city center of Lille. A large set of in-situ and remote sensing instruments are implemented in
ATOLL to characterize physico-chemical, optical and radiative properties of particles and clouds. The relevant aerosol
instrumental setup for this study consisted of several instruments (Scanning Mobility Particle Sizer (SMPS), Aerosol Chemical
Speciation Monitor (ACSM), aethalometer and nephelometer) used to measure aerosol properties such as, size distributions,
chemical composition, and optical properties in different size fractions (PM10 and PM1). The measurements used for that study
were performed from 1st July 2017 to 31st December 2020. Meteorological data including temperature, water vapour mixing
ratio, and solar radiation were also measured every minute at the sampling site. Three-day backtrajectories of air masses arriving
at the site at half the boundary layer height between July 1, 2017 and December 31, 2020 were computed every hour using the
Hybrid Single-Particle Lagrangian Integrated Trajectory (HYSPLIT version 5.1.0, Stein et al., 2015) transport and dispersion
model. The results highlight a strong seasonal variation of the new particle formation event (NPF) frequency, with a maximum
observed during spring (27) and summer (53). Relatively high values of CS (~10-2) during event days suggesting that CS is not
the main factor limiting the occurrence of events at this site. Moreover, the airmasses trajectories during event days highlight
a specific path along the Eastern North Sea region with only a small fraction passing over any continental area and therefore
not crossing many aerosols sources, while, most of the back trajectories during non-event days pass over large cities (Dunkirk,
Paris, London, Rotterdam) before reaching Lille.
Conclusions
The results observed over Lille show that high temperature (T > 295K), low RH (RH< 45%) and high solar radiation favor the
observation of NPF events at AtOLL. The cloud coverage was also highlighted as a parameter limiting the NPF occurrences.
The average cloud fraction observed is around 0.51 during event days and 0.88 during non-event days. Clearly, the cloud
fraction, mostly through its parasol effect, is playing a major role in the occurrence of NPF events. Moreover, it was shown
that NPF has a large influence of UFP on air quality especially during summer when the particle concentrations with diameter
lower than 100nm reach in average 10000#/cm-3 during event days instead of 3500#/cm-3 during non-event days. In the future,
we are planning to study the Urban Canopy Layer (UCL) dynamics on the NPF onsets.
References :
Nieminen, T., Kerminen, V.-M., Petäjä, T., et al. #/cm-3 , 2018. Global analysis of continental boundary layer new particle
formation based on long-term measurements. Atmospheric Chem. Phys. 18, 14737–14756. https://doi.org/10.5194/acp-18-
14737-2018
Peng, Y., Dong, Y., Li, X., Liu, X., Dai, J., Chen, C., Dong, Z., Du, C., Wang, Z., 2017. Different Characteristics of New
Particle Formation Events at Two Suburban Sites in Northern China. Atmosphere 8, 258.
https://doi.org/10.3390/atmos8120258
Stein, A.F., Draxler, R.R., Rolph, G.D., Stunder, B.J.B., Cohen, M.D., Ngan, F., 2015. NOAA’s HYSPLIT Atmospheric
Transport and Dispersion Modeling System. Bull. Am. Meteorol. Soc. 96, 2059–2077. https://doi.org/10.1175/BAMS-D-14-
00110.1
152
ENVIRONMENTAL EFFECTS OF MERCURY EMISSIONS FROM ATHABASCA OIL SANDS DEVELOPMENT
(ALBERTA, CANADA)
Ashu Dastoor (1), Andrei Ryjkov (1), Gregor Kos (2), Junhua Zhang (3), Jane Kirk (4), Matthew Parsons (5), and Alexandra
Steffen (3)
(1) Air Quality Research Division, Environment and Climate Change Canada (ECCC), Dorval, Québec, Canada; (2) Department
of Chemistry and Biochemistry, Concordia University, Montreal, Québec, Canada; (3) Air Quality Research Division, ECCC,
Toronto, Ontario, Canada; (4) Aquatic Contaminants Research Division, ECCC, Burlington, Ontario, Canada; (5) Meteorological
Service of Canada, ECCC, Edmonton, Alberta, Canada
Presenting author email: [email protected]
Summary
A global to urban scale meteorology-chemistry mercury (Hg) model was applied to simulate the Hg burden in and around the
Alberta, Canada, oil sands development region from 2012-2015. Since Hg contamination in the region also originates from global
and other Canadian Hg emissions (primary and legacy anthropogenic and geogenic sources), the relative contributions of oil sands
and other Hg emission sources to Hg levels in the region were determined. Further, the relative importance of year-to-year changes
in emissions and meteorological conditions to inter-annual variations in Hg deposition was examined.
Introduction
Hg enters the environment through atmospheric emissions from anthropogenic (e.g., fossil fuel burning, metal smelting and
artisanal gold mining) and geogenic (volcanoes and the weathering of Hg-containing rocks) activities, and the re-emissions of
historically deposited Hg (including via wildfires). Hg accumulates in the food web and transfers to humans mainly through
consumption of contaminated fish, where it exhibits toxic effects. To protect human health and the environment from anthropogenic
emissions of Hg, an international treaty - the Minimata Convention on mercury - entered into force in 2017.
Bituminous oil sands in northern Alberta and Saskatchewan comprise 97% of Canada’s oil reserves, and the world’s third largest
reserves. Oil sands upgrading facilities in the Athabasca Oil Sands Region (AOSR) have been reporting Hg emissions since the
year 2000, but the ecological impact of these emissions on the surrounding environment is still unclear. The aim of this study was
to apply a process-based 3D mercury model, Global Environmental Multiscale - Modelling Air quality and CHemistry – Mercury
(GEM-MACH-Hg), to develop a comprehensive understanding of atmospheric Hg pathways and levels in air and deposition, and
the role of Athabasca oil sands activities on the spatiotemporal distribution of Hg contamination in the AOSR (Dastoor et al. 2021).
Methodology and results
GEM-MACH-Hg model simulations (2012–2015) were performed for 3 nested domains (global at 10×10 latitude-longitude, North
America at 10 km, and AOSR at 2.5 km resolutions) using all sources of Hg emissions and meteorological conditions for the
respective years. Multiple controlled model simulations were performed by choosing appropriate geographic domain and
selectively excluding Hg emissions from oil sands, wildfires, anthropogenic, geogenic and legacy sources from specific regions to
assess their relative contributions on Hg levels in the AOSR. Additional controlled simulations were performed to estimate the
influences of inter-annual changes in meteorology, and wildfire and oil sands emissions on changes in Hg deposition in the AOSR
by successively adding these three temporal changes to simulations from 2012 to 2015.
On a broad spatial scale, imported Hg from global sources dominated the annual Hg deposition in the AOSR, with present-day
global anthropogenic emissions contributing to 40%, and geogenic and legacy emissions (i.e., re-emissions of historic Hg
deposition) contributing to 60% of the background Hg deposition. Regional wildfire events contributed to Hg deposition
enhancements of 1-13% in the region. In contrast, the oil sands emissions were responsible for significant enhancement of Hg
deposition in the vicinity of oil sands development activities, which was about 10 times larger in winter than summer (enhancement
of 250 – 350% in winter and ~35% in summer). The spatial extent of the impact of oil sands activities on Hg deposition was also
greater in winter (~100 km) than summer (~30 km). Wintertime Hg loadings in snowpack (via atmospheric Hg deposition)
displayed the largest inter-annual variations due to both changes in meteorological conditions as well as oil sands emissions.
Conclusion
Mercury runoff in springtime meltwater flood, comprising the majority of annual riverine Hg discharge, is mainly derived from
seasonal snowpack Hg loadings and mobilization of Hg deposited in surface soils, both of which are impacted by Hg emissions
from oil sands development. Model results suggest that sustained efforts to reduce anthropogenic Hg emissions from both global
and oil sands sources are required to mitigate the impacts of Hg contamination in the AOSR.
References Dastoor, A., Ryjkov, A., Kos, G., Zhang, J., Kirk, J., Parsons, M., and Steffen, A.: Impact of Athabasca oil sands operations on
mercury levels in air and deposition, Atmos. Chem. Phys., 21, 12783–12807, https://doi.org/10.5194/acp-21-12783-2021, 2021.
153
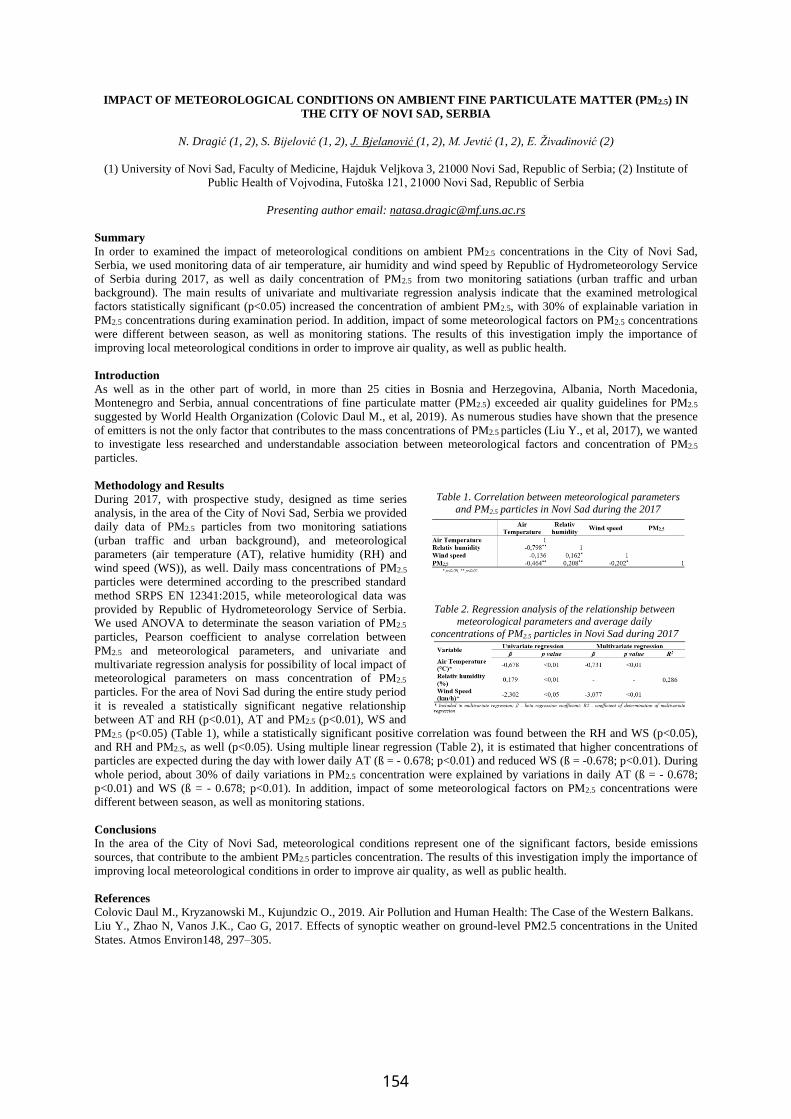
IMPACT OF METEOROLOGICAL CONDITIONS ON AMBIENT FINE PARTICULATE MATTER (PM2.5) IN
THE CITY OF NOVI SAD, SERBIA
N. Dragić (1, 2), S. Bijelović (1, 2), J. Bjelanović (1, 2), M. Jevtić (1, 2), E. Živadinović (2)
(1) University of Novi Sad, Faculty of Medicine, Hajduk Veljkova 3, 21000 Novi Sad, Republic of Serbia; (2) Institute of
Public Health of Vojvodina, Futoška 121, 21000 Novi Sad, Republic of Serbia
Presenting author email: [email protected]
Summary
In order to examined the impact of meteorological conditions on ambient PM2.5 concentrations in the City of Novi Sad,
Serbia, we used monitoring data of air temperature, air humidity and wind speed by Republic of Hydrometeorology Service
of Serbia during 2017, as well as daily concentration of PM2.5 from two monitoring satiations (urban traffic and urban
background). The main results of univariate and multivariate regression analysis indicate that the examined metrological
factors statistically significant (p<0.05) increased the concentration of ambient PM2.5, with 30% of explainable variation in
PM2.5 concentrations during examination period. In addition, impact of some meteorological factors on PM2.5 concentrations
were different between season, as well as monitoring stations. The results of this investigation imply the importance of
improving local meteorological conditions in order to improve air quality, as well as public health.
Introduction
As well as in the other part of world, in more than 25 cities in Bosnia and Herzegovina, Albania, North Macedonia,
Montenegro and Serbia, annual concentrations of fine particulate matter (PM2.5) exceeded air quality guidelines for PM2.5
suggested by World Health Organization (Colovic Daul M., et al, 2019). As numerous studies have shown that the presence
of emitters is not the only factor that contributes to the mass concentrations of PM2.5 particles (Liu Y., et al, 2017), we wanted
to investigate less researched and understandable association between meteorological factors and concentration of PM2.5
particles.
Methodology and Results
During 2017, with prospective study, designed as time series
analysis, in the area of the City of Novi Sad, Serbia we provided
daily data of PM2.5 particles from two monitoring satiations
(urban traffic and urban background), and meteorological
parameters (air temperature (AT), relative humidity (RH) and
wind speed (WS)), as well. Daily mass concentrations of PM2.5
particles were determined according to the prescribed standard
method SRPS EN 12341:2015, while meteorological data was
provided by Republic of Hydrometeorology Service of Serbia.
We used ANOVA to determinate the season variation of PM2.5
particles, Pearson coefficient to analyse correlation between
PM2.5 and meteorological parameters, and univariate and
multivariate regression analysis for possibility of local impact of
meteorological parameters on mass concentration of PM2.5
particles. For the area of Novi Sad during the entire study period
it is revealed a statistically significant negative relationship
between AT and RH (p<0.01), AT and PM2.5 (p<0.01), WS and
PM2.5 (p<0.05) (Table 1), while a statistically significant positive correlation was found between the RH and WS (p<0.05),
and RH and PM2.5, as well (p<0.05). Using multiple linear regression (Table 2), it is estimated that higher concentrations of
particles are expected during the day with lower daily AT (ß = - 0.678; p<0.01) and reduced WS (ß = -0.678; p<0.01). During
whole period, about 30% of daily variations in PM2.5 concentration were explained by variations in daily AT (ß = - 0.678;
p<0.01) and WS (ß = - 0.678; p<0.01). In addition, impact of some meteorological factors on PM2.5 concentrations were
different between season, as well as monitoring stations.
Conclusions
In the area of the City of Novi Sad, meteorological conditions represent one of the significant factors, beside emissions
sources, that contribute to the ambient PM2.5 particles concentration. The results of this investigation imply the importance of
improving local meteorological conditions in order to improve air quality, as well as public health.
References
Colovic Daul M., Kryzanowski M., Kujundzic O., 2019. Air Pollution and Human Health: The Case of the Western Balkans.
Liu Y., Zhao N, Vanos J.K., Cao G, 2017. Effects of synoptic weather on ground-level PM2.5 concentrations in the United
States. Atmos Environ148, 297–305.
Table 2. Regression analysis of the relationship between
meteorological parameters and average daily
concentrations of PM2.5 particles in Novi Sad during 2017
Table 1. Correlation between meteorological parameters
and PM2.5 particles in Novi Sad during the 2017
154
Assessment and Profiling of Fine and Ultrafine Particulate Matter in Lucknow City with particular emphasis on
Indoor Environment
Samridhi Dwivedi*, Alfred Lawrence
1Department of Chemistry, Isabella Thoburn College, Lucknow INDIA
*Presenting author [email protected]
Summary
The present study objects to quantify the concentrations of particulate matter (PM) namely PM2.5, PM>2.5, PM1.0-2.5, PM0.50-1.0,
PM0.25-0.50, and PM<0.25 in the selected indoor and outdoor microenvironments from industrial, commercial and residential areas
at Lucknow city, India. The study will assist the professionals in this field to set proper guidelines and standards for Ultrafine
particulate matter, specifically in indoors.
Introduction
Air pollution by particulate matter (PM) is a leading threat to human health especially in nations where there are no stringent
regulatory guidelines in place and where the pollution levels are continually exceeding. Particulate matter or atmospheric
aerosol consisting of course (<10 µm), fine (<2.5 µm) and ultrafine UFPs (<0.1 µm) microscopic particles is a major cause of
respiratory diseases. The ultrafine fine particle [UFP] fraction can be easily transported through the respiratory system and
linked to genotoxicity, neurotoxicity, several cardiovascular diseases and even cancer. Therefore, it is an urgent need for the
assessment and remediation of these particulate matter.
Methodology and Results
Six houses each, situated in residential, commercial and industrial areas were monitored during the winter season (1st
November, 2021-15th February 2022). A total of 24 samples were obtained from each site, overall, 432samples were gathered
and analysed. Indoor and outdoor PM2.5 samples were collected through GF/A 47 mm filter paper via APM 550, Envirotech
sampler at a flow rate of 17.5 lpm for 8 hrs. whereas, sub-micron particulate matter was collected using Leland legacy sample
pump with five-stage Sioutas Cascade Impactor at 9 lpm for 24 hrs. PM > 2.5, PM1.0-2.5, PM 0.50-1.0, PM0.25-0.50,was collected
using 25mm Millipore filter paper with pore size of 0.5µm whereas PM<0.25 was collected using GF/A 37mm filter paper (pore
size 0.5µm).The average concentration of indoor PM2.5 was highest in the industrial area (310.5143 µg/m3). The average mass
concentration for PM> 2.5, PM1.0-2.5, PM0.50-1.0, PM0.25-0.50, PM<0.25 micron ranged from 61-73 µg/m3, 89-95 µg/m3,96-116
µg/m3,112-124 µg/m3 and 84-102 µg/m3 respectively for indoors, whereas, 50-60 µg/m3,38-48 µg/m3,62-68 µg/m3 ,98-118 µg/m3 and 99-119 µg/m3 respectively for outdoors.
Conclusions
As people are spending almost 90% of their time indoors it becomes necessary to assess the indoor air quality. Major official
regulations and air quality standards focus on PM2.5, and accordingly, majority of scientific Work are intensively on fine
particles, which are inadequate in explaining the effect of UFPs. Thus, study focussing on the UFPs are predominantly
informative. However, the study covered the major locations of the city where the particulate profiling is still unaddressed. The
findings have important implications for the exposure assessment and future designing of buildings to safeguard against
unwanted exposure and to come up with effective control mechanisms to reduce health risks.
Acknowledgement
The authors are thankful to Dr. (Mrs.) V. Prakash, Principal, Isabella Thoburn College, Lucknow, India for her support.
References
Das, A., Kumar, A., Habib, G., & Perumal, V., 2021. Insights on the biological role of ultrafine particles of size PM.
Environmental Pollution. 268. 115638. 10.1016/j.envpol.2020.115638.
155
SYNTHESIS OF SUSTAINABLE FUELS BY HETEROGENEOUSLY CATALYZED OLIGOMERIZATION OF
RENEWABLE C2-C4 OLEFINS
C. Fuchs, U. Arnold, J. Sauer
Institute of Catalysis Research and Technology (IKFT), Karlsruhe Institute of Technology (KIT), Germany
Presenting author email: [email protected]
Summary
Objective of this study is the synthesis of aromatics-free, high-octane gasoline as well as jet-fuel via heterogeneously
catalyzed oligomerization of olefins in the range of C2-C4. Therefore, experiments in a lab-scale plant with different
feedstocks and nickel as catalyst supported on a commercial silica-alumina have been performed. Highly branched molecules
fitting in the gasoline range and standard were synthesized, which exhibit octane numbers up to 100. With more than one
olefin species in the feed, the selectivity to one specific hydrocarbon chain length decreases. As a result, the spectrum of the
liquid products broadens and next to gasoline species, higher oligomers in the range of jet-fuel and diesel are produced.
Consequently, it is possible to produce various kinds of fuels on a renewable basis, which are free of aromatic components.
Introduction
Renewable fuels provide a CO2-neutral option to extend the operation of combustion engines in cars, trucks, planes and
ships. Aromatics are considered to be the precursors to particle formation during engine combustion [1], but offer the
advantage of high octane ratings for gasoline [2]. Reducing the aromatics content in fuels consequently reduces particle
emissions in engine combustion. On the other side, this results in a decreased octane number, which is pushed by aromatic
components. This loss has to be compensated by highly branched molecules like iso-octane. Fuels with these specifications
can be produced by heterogeneously catalyzed oligomerization of olefins [3]. As a sustainable feedstock, alcohols like
methanol, ethanol or butanol can be employed which may be transformed through dehydration to renewable olefins in the
range of ethylene to butylene [4, 5]. Additionally, the targeted synthesis of individual components provides a further
advantage of such synthetic fuels by the adaptability of certain physico-chemical properties.
Methodology and Results
Experiments for the oligomerization of C2-C4 olefins are performed in a plug flow reactor with an inner diameter of 16 mm
and a maximum production volume of 2.5 l/week. The gaseous phase is analyzed by online gas chromatography, the liquid
product phase is analyzed by offline gas chromatography. Catalysts for olefin oligomerization have been prepared by
incipient wetness impregnation of silica-alumina supports (SIRALOX) with aqueous nickel solutions. The acidity of the
catalyst influences the compositions of the liquid product mixtures. The catalysts are mildly acidic, but it is visible that with
increasing acidity the product is shifted towards higher oligomers, also resulting in shorter lifetime due to blocking of acid
sites. Regarding the temperature, 120 °C was beneficial concerning olefin conversion, selectivity to octenes and their degree
of branching. Two different olefin partial pressure levels, 16 and 32 bar, were investigated. The higher level significantly
increases olefin conversion, and the liquid product spectrum is slightly shifted towards larger molecules. The highest
selectivity to one specific carbon chain length is achievable by feeding only one olefin species. This species reacts mainly to
integer multiples of itself. In the case of butene (C4) the main products with a total selectivity of about 80% are C8 and C12
hydrocarbons, the oligomerization of propene mainly leads to C9 and C12 hydrocarbons. The co-oligomerization of ethene,
propene and butene, as a typical product mixture obtained from methanol-to-olefins conversion, leads to a broad spectrum of
olefins in the range of C5 to C16. This is due to the increased number of possible oligomerization pathways for the different
olefins. Regarding the quality of the gasoline fraction, highly branched molecules like iso-octene with octane ratings of 100
were synthesized. In summary, it is shown that hydrocarbon mixtures with chain lengths from 6 to 16 carbon atoms and
without any aromatics may be synthesized on the basis of renewable resources representing gasoline, jet-fuel and diesel.
Conclusions
The heterogeneously catalyzed oligomerization of olefins, made up from renewable sources, is a pathway to produce
renewable fuels with adjustable properties. Furthermore, they may be used in existing fleets and are free of aromatic
components providing an advantage in air pollution control in conurbations.
Acknowledgement
The authors gratefully acknowledge the financial support from the Ministerium für Verkehr Baden Württemberg as well as
the Strategiedialog Automobilwirtschaft BW within the framework of the project "reFuels – rethinking fuels”. In addition, the
support from the Helmholtz European Partnership for Technological Advancement (HEPTA) is gratefully acknowledged.
References
[1] Eckert P, Rakowski S. 2019. Schadstoffbildung. In Grundlagen Verbrennungsmotoren, vol. 42, ed. Günter P. Merker
and Rüdiger Teichmann, 943–977. Wiesbaden: Springer Fachmedien Wiesbaden GmbH.
[2] American Petroleum Institute. 1958. Knocking Characteristics of Pure Hydrocarbons. : ASTM International.
[2] O'Connor, C T. 2008. Oligomerization. In Handbook of heterogeneous catalysis, ed. Gerhard Ertl, 2nd edn. Weinheim,
Chichester: Wiley-VCH.
[4] Eagan N, Kumbhalkar M, Buchanan J, Dumesic J, Huber G. 2019. Chemistries and processes for the conversion of
ethanol into middle-distillate fuels. Nature Reviews Chemistry (4) 3: 223–249.
[5] Tian P, Wei Y, Ye M, Liu Z. 2015. Methanol to Olefins (MTO): From Fundamentals to Commercialization. ACS
Catal. 5(3):1922–1938.
156
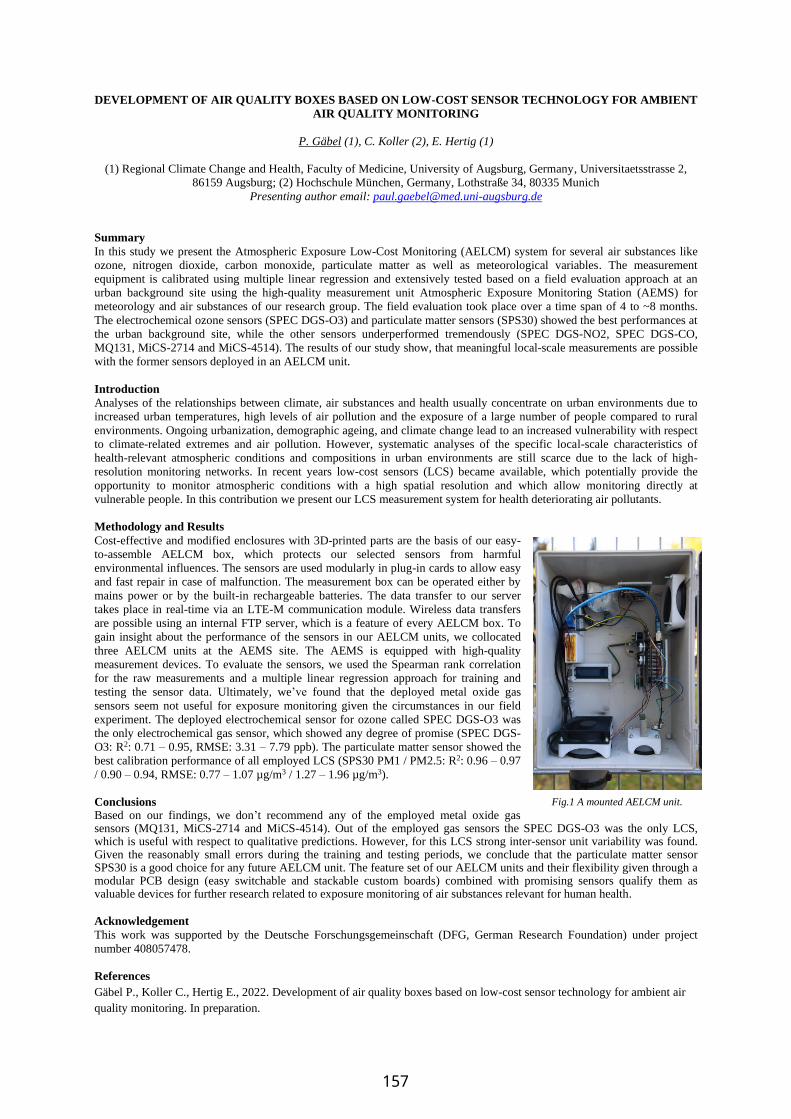
DEVELOPMENT OF AIR QUALITY BOXES BASED ON LOW-COST SENSOR TECHNOLOGY FOR AMBIENT
AIR QUALITY MONITORING
P. Gäbel (1), C. Koller (2), E. Hertig (1)
(1) Regional Climate Change and Health, Faculty of Medicine, University of Augsburg, Germany, Universitaetsstrasse 2,
86159 Augsburg; (2) Hochschule München, Germany, Lothstraße 34, 80335 Munich
Presenting author email: [email protected]
Summary
In this study we present the Atmospheric Exposure Low-Cost Monitoring (AELCM) system for several air substances like
ozone, nitrogen dioxide, carbon monoxide, particulate matter as well as meteorological variables. The measurement
equipment is calibrated using multiple linear regression and extensively tested based on a field evaluation approach at an
urban background site using the high-quality measurement unit Atmospheric Exposure Monitoring Station (AEMS) for
meteorology and air substances of our research group. The field evaluation took place over a time span of 4 to ~8 months.
The electrochemical ozone sensors (SPEC DGS-O3) and particulate matter sensors (SPS30) showed the best performances at
the urban background site, while the other sensors underperformed tremendously (SPEC DGS-NO2, SPEC DGS-CO,
MQ131, MiCS-2714 and MiCS-4514). The results of our study show, that meaningful local-scale measurements are possible
with the former sensors deployed in an AELCM unit.
Introduction
Analyses of the relationships between climate, air substances and health usually concentrate on urban environments due to
increased urban temperatures, high levels of air pollution and the exposure of a large number of people compared to rural
environments. Ongoing urbanization, demographic ageing, and climate change lead to an increased vulnerability with respect
to climate-related extremes and air pollution. However, systematic analyses of the specific local-scale characteristics of
health-relevant atmospheric conditions and compositions in urban environments are still scarce due to the lack of high-
resolution monitoring networks. In recent years low-cost sensors (LCS) became available, which potentially provide the
opportunity to monitor atmospheric conditions with a high spatial resolution and which allow monitoring directly at
vulnerable people. In this contribution we present our LCS measurement system for health deteriorating air pollutants.
Methodology and Results
Cost-effective and modified enclosures with 3D-printed parts are the basis of our easy-
to-assemble AELCM box, which protects our selected sensors from harmful
environmental influences. The sensors are used modularly in plug-in cards to allow easy
and fast repair in case of malfunction. The measurement box can be operated either by
mains power or by the built-in rechargeable batteries. The data transfer to our server
takes place in real-time via an LTE-M communication module. Wireless data transfers
are possible using an internal FTP server, which is a feature of every AELCM box. To
gain insight about the performance of the sensors in our AELCM units, we collocated
three AELCM units at the AEMS site. The AEMS is equipped with high-quality
measurement devices. To evaluate the sensors, we used the Spearman rank correlation
for the raw measurements and a multiple linear regression approach for training and
testing the sensor data. Ultimately, we’ve found that the deployed metal oxide gas
sensors seem not useful for exposure monitoring given the circumstances in our field
experiment. The deployed electrochemical sensor for ozone called SPEC DGS-O3 was
the only electrochemical gas sensor, which showed any degree of promise (SPEC DGS-
O3: R2: 0.71 – 0.95, RMSE: 3.31 – 7.79 ppb). The particulate matter sensor showed the
best calibration performance of all employed LCS (SPS30 PM1 / PM2.5: R2: 0.96 – 0.97
/ 0.90 – 0.94, RMSE: 0.77 – 1.07 µg/m3 / 1.27 – 1.96 µg/m3).
Conclusions Based on our findings, we don’t recommend any of the employed metal oxide gas sensors (MQ131, MiCS-2714 and MiCS-4514). Out of the employed gas sensors the SPEC DGS-O3 was the only LCS, which is useful with respect to qualitative predictions. However, for this LCS strong inter-sensor unit variability was found. Given the reasonably small errors during the training and testing periods, we conclude that the particulate matter sensor SPS30 is a good choice for any future AELCM unit. The feature set of our AELCM units and their flexibility given through a modular PCB design (easy switchable and stackable custom boards) combined with promising sensors qualify them as valuable devices for further research related to exposure monitoring of air substances relevant for human health.
Acknowledgement
This work was supported by the Deutsche Forschungsgemeinschaft (DFG, German Research Foundation) under project
number 408057478.
References
Gäbel P., Koller C., Hertig E., 2022. Development of air quality boxes based on low-cost sensor technology for ambient air
quality monitoring. In preparation.
Fig.1 A mounted AELCM unit.
157

ESTIMATION OF UNKNOWN SOURCE PARAMETERS IN URBAN DOMAIN
P. Gkirmpas, F. Barmpas, G. Efthimiou, N. Moussiopoulos
Laboratory of Heat Transfer and Environmental Engineering (LHTEE), Aristotle University of Thessaloniki, 54124,
Thessaloniki, Greece
Presenting author email: [email protected]
Summary
This study aims to estimate the location and the release rate of an unknown stationary source of air pollution within an urban area. The Mock Urban Setting Test (MUST) wind tunnel experiment domain is tested as an urban area test case. The ANSYS
Computational Fluid Dynamics (CFD) software and the open-source CFD tool, OpenFOAM, are implemented for mesh
development and solving the wind flow field and the pollutant dispersion within the MUST domain. The adjoint advection-
diffusion equation (Marchuck, 2013) is used as the solution of the inverse dispersion modelling problem. The minimization of
a cost function is utilized to estimate the coordinates and the release rate of the source. The methodology is validated against MUST wind tunnel experiment data.
Introduction
The accidental or malevolent releases of high toxic airborne agents or gases can lead to disastrous impacts on the population
health and the environment, especially in high-density urban areas. In such events, the parameters of the source (location, release rate) are often unknown. The Atmospheric Transport and Dispersion Models (ATDM) are combined with Source Term
Estimation (STE) techniques to estimate the unknown source parameters by utilizing information from the sensors of the air
pollutant measurement network. CFD models are used to calculate the wind flow field in complex geometry urban areas in
which the pollutant dispersion is affected by turbulence.
Methodology
The MUST wind tunnel experiment domain is selected for the
methodology application. A steady-state forward in time simulation
is implemented to calculate the wind flow field by applying the Reynolds Average Navier Stokes (RANS) technique (Fig. 1). A
RANS backward in time simulation is used by setting each sensor of
the measurement network as a source based on the measured
concentrations. Both simulations solve the turbulent kinetic energy
equation, k, and the turbulent kinetic energy dissipation rate, epsilon (k-epsilon model). The adjoint advection-diffusion equation is solved
for each sensor by inversing the wind flow field of the forward
simulation and the adjoint concentration is estimated at every
candidate source location. The cost function is calculated at each grid
node of the computational domain. The minimum value of the cost function indicates the location of the source. The release rate is
estimated at the source location grid node. The result is evaluated
against the MUST wind tunnel experiment data.
Conclusions and expectations STE techniques can estimate the parameters of an unknown air
pollutant source. CFD models can resolve the wind flow field and the
dispersion of the pollutant dispersion accurately in urban areas by
estimating the effect of turbulence. The whole methodology can provide significant information to the policymakers in
emergency cases of unknown high toxic airborne releases.
Acknowledgement
This work is supported by Helmholtz European Partnership for Technological Advancement (HEPTA) project.
References Marchuk G. I., 2013. Adjoint equations and analysis of complex systems (Vol. 295). Springer Science & Business Media.
Fig. 1 Wind speed of the forward in time simulation in level
x-y for z=0.5m
158

AIR QUALITY MANAGEMENT POLICIES ASSESSMENT METHODOLOGY FOR THE GUADALAJARA METROPOLITAN AREA IN MEXICO
E. A. Egurrola-Hernández, L. A. Magallanes-Luna, C. González-Figueredo, H. De Alba-Martínez and G. Ochoa-
Covarrubias
Technological and Industrial Processes Department, Western Institute of Technology and Higher Education (ITESO), Periférico Sur Manuel Gómez Morín 8585, Tlaquepaque, Jalisco, México
Presenting author email: [email protected] Summary This study proposes an impact assessment methodology for air quality management policies. This methodology is based on poor air quality exposure criteria and simulations of pollution dispersion scenarios. A geospatialized numerical impact index is defined using the quantity of people potentially exposed to a poor air quality scenario, considering pollution dispersion simulations. This methodology considers the population density, economic units’ quantity, and public transport users for the impact index definition. The MiBici public bicycle system coverage expansion is used to exemplify this methodology. This study shows that expanding the coverage of the MiBici system, although it does not help to substantially improve air quality, does reduce the number of people exposed to events of poor air quality. Introduction The ProAire 2014-2020 program, published by the Jalisco state Environment and Territorial Development Ministry is the principal document for the Guadalajara city air quality management. This document contains different strategies such as emissions reduction and public health protection (SEMADET, 2014). These strategies are based on an analysis of the city's sociodemographic situation, as well as on an air quality diagnosis that considers an emissions inventory. However, these plans do not have clear monitoring and impact evaluation instruments, so it is necessary to define a simple methodology for impact assessment of the strategies proposed in the ProAire plan. Furthermore, the evaluation criteria used are mainly based on perception and do not include simulation in their procedures. Standard HIA methods are most used for impact assessment, but they require health and mortality information (e.g. O’Connell & Hurley, 2009), which is not easily disclosed by authorities. Considering these factors, this work proposes the use of sociodemographic information and pollutant dispersion simulations, to measure the impact of public policies on improving air quality in the city. Methodology and Results The MiBici public bicycle system was selected as study case; the system information platform reports hourly number of trips between its different stations. This information was used to calculate the area with highest travel densities and thus define the study area. Subsequently, this area was discretized into smaller 500 m hexagonal-shaped areas, and the total population, quantity of economic units and public transport trips (bicycle, bus, and BRT) were calculated for each section; the sum of these 3 variables is considered as the total possible exposed people to poor air quality at a given time. On the other hand, PM10 dispersion simulations were generated using the year 2019 as a baseline and projecting backwards, to year 2015, in which the MiBici system began their operations. According to information reported by the administration of the same system, 20% of the users of the system correspond to motorists who changed the car for the bicycle and 80% to people who left public transport. This was considered for the estimation of the PM10 emission factors corresponding to 3 types of roads, classified by their traffic density. Simulations were performed with the Aermod View software (ver. 9.9.0). The dispersion results were discretized with the same resolution as the number of exposed people and an exposure factor was defined by multiplying exposition by the PM10 concentration (normalized with respect the local legislation limits). The difference between the baseline exposure factors and the projected scenario was defined as the impact index of this policy. As a result, it was observed that, although the expansion of the coverage of the MiBici circuit helped to considerably reduce traffic in the study area, it did not have a significant impact on improving air quality in general. Conclusions The proposed impact index corresponds to a simple methodology for impact assesment of public policies on air quality issues, for localities where there is no available health information to use traditional HIA strategies. The result of piloting this methodology with the expansion of the coverage of the MiBici system, showed that although it did not considerably improve the air quality in the study area, it impacts favorably on the implementation of public policies. Acknowledgement We acknowledge Lakes Environmental Software for the academic discount granted on the Aermod view licensing. References Jalisco state Environment and Territorial Development Ministry, 2014. Proaire Jalisco 2014 – 2020: State program to improve air quality. https://semadet.jalisco.gob.mx/sites/semadet.jalisco.gob.mx/files/proaire_jalisco_2014-2020.pdf O’Connell, E., & Hurley, F. (2009). A review of the strengths and weaknesses of quantitative methods used in health impact assessment. Public Health, 123(4), 306–310. https://doi.org/10.1016/j.puhe.2009.02.008.
159
UNVEILING ATMOSPHERIC EMISSIONS FROM CONSTRUCTION SITES
H. Grythe (1), S. Lopez-Aparicio (1)
(1) NILU – Norwegian Institute for Air Research, Instituttveien 18, 2007 Kjeller, Norway
Presenting author email: [email protected]
Summary
The interest in off-road transport and specifically non-road mobile machinery (NRMM), is increasing over time. At urban
scale, NRMM associated with building and construction may constitute a significant source of air pollutants, both exhaust
and non-exhaust, and greenhouse gases (GHG) emissions. Only road traffic and residential heating may be larger sources.
However, building and construction activity is a very defragmented and heterogeneous sector, with large variability in space
and time and, compared to other sectors, virtually unquantified. In this study, we present a new methodology to estimate
emissions from NRMM in construction. It is based on a complete national database of exact location of building activity,
machine registries and takes into account ground conditions. For non-exhaust, soil and meteorological factors are used
together with activity data. The methodology is developed on Norwegian data but can be implemented in other countries
where similar input data is available.
Introduction
The past and current intense growth of urban cities around the world requires construction of buildings and infrastructure in
already most densely populated areas. These construction sites are also the workplace for roughly 10% of the workforce.
These sites employ large machines, a source of both exhaust emissions and non-exhaust particulate matter (PM). Emissions
from NRMM contribute to 18% and 16% of total NOx in United State and European Union, respectively, of which 46% and
25% is associated with construction activity (ICCT, 2016). These shares will be higher at urban scale. Emissions are
complex, diverse and for the most part unquantified and at best significantly less regulated than other sectors such as road
traffic. Construction sites are a direct source of PM emissions but also indirectly through transport of mass from the sites onto
roads for then to become suspended, with potential to influence air quality in areas far extended. Construction activity is,
therefore, a large source of both climate gases and compounds detrimental to air quality, which remains largely unquantified.
It is also a comparatively growing source as many other sources decline fast due technological advances and legislative
measures. Currently, and to our knowledge, no method exists to estimate and spatially distribute emissions from NRMM in
building and construction based on the exact location where the construction activity takes place. Most of the methods rely on
downscaling proxies based on population, building/road constructed area or land use data. We will present a methodology
that allows to characterize the contribution from NRMM to emissions in urban areas, and later on to pollution episodes.
Methodology and Results
The EmSite model is based on the combination of different data-sets that allows us to determine i) the location, area and time
of construction projects at fine resolution; ii) energy demand for NRMM and iii) emissions. For the spatio-temporal
distribution of building activity, we processed data on building construction permits from 2010 to 2020 and combined with
other variables that influence emissions, i.e., soil data for the silt content and ground conditions together with the size and
type of construction (or demolition) work, as it determines the energy demand for machinery. A specific parametrization to
determine the different building phases (i.e., ground work, heating, building work) and duration of construction projects was
developed based on real data. The final result is construction activity in Norway per year and grid expressed as m2. The
energy demand for NRMM is establish considering that large machineries, heaters and small machineries are employed in the
ground work, heating and building work, respectively. Specific energy demands expressed in kWh/m2 are used for the
different construction phases to obtain energy demand for NRMM in construction (kWh). To calculate emissions, specific
dynamic emission factors for large and small NRMM, and heaters, were developed based on information on current machine
park in Norway, continuous introduction of machines over time, the machine population per power class in Europe and basic
emission factors from EMEP/EEA Guidebook. The detailed process allows for bottom-up emissions estimates for NRMM
employed in construction, and the results are comparable with official emissions submitted to the CLRTAP. A key finding of
the study is that heating of unfinished buildings in Norway may be an even larger source of emissions than large and small
construction machinery, contributing up to 60% of total NOx emissions from NRMM. Moreover, PM non-exhaust emissions
from construction sites is probably one of the most intense sources of PM.
Conclusions
Very little is known of the environmental impact from construction activity due to lack of data. Yet, there are numerous
costly efforts to reduce emissions from this industry. These efforts are generally based on coarse assumptions, and it is hard
to evaluate both the importance of emissions and the effectiveness of emission mitigation efforts. EmSite model is developed
not only for research, but also to provide stakeholders with a better overview and the possibility to better understand and act
to reduce emissions from construction work. The bottom-up calculation allows for individual evaluation of building sites.
Acknowledgement
The study has been financed by the Norwegian Environment Agency.
References
ICCT, 2016. Technology pathways for diesel engines used in non-road vehicles and equipment. The International Council on
Clean Transportation. White paper, September 2016. Washington, USA.
160

SIMULATION OF POLLUTANT DISPERSION IN AN URBAN ENVIRONMENT
Giannis Ioannides, Anna Antoniou, Leonidas Ntziachristos
Laboratory of Heat Transfer and Environmental Engineering (LHTEE), Aristotle University Thessaloniki, 54124, Greece
Keywords: CFD, Urban Air Quality, Pollutant Dispersion
Presenting author email: [email protected],gr
Summary
This particular study intents to examine the effects of the building’s structure and size on the dispersion of pollutants originating
from traffic within an urban domain, through state-of-the-art Computational Fluid Dynamics (CFD) tools. The advanced
multidisciplinary CAE pre-processing tool ANSA, the general-purpose modelling CFD software ANSYS and the open source
CFD software OpenFoam will be implemented for the geometry processing, mesh development, solving and post-processing
of the model. The building shape and height as well as the street width, have drastic effect on the pollutant’s dispersion, creating
turbulent wind flow throughout the street canyons, hence enhancing the uncertainty of the pollutant’s behaviour.
Introduction
There is undoubtedly great necessity in keeping the emission levels in urban areas low, and accordingly with air quality
regulations, minimizing the exposure of urban population to gaseous and particulate pollutants [CO, NOx, SOx, PM10, PM2.5].
Both dominate the Urban Atmospheric Boundary Layer (UABL) [1]. The deployment of an Atmospheric Transport and
Dispersion Model (ATDM) can forecast the final concentrations of pollutants, in any given conditions. Taking this into account,
simulating the effect of wind flow on pollutant dispersion in urban environments contributes to our wider understanding of
atmospheric pollution.
Methodology and Modelling
The 3-D Geometry of the city is acquired and after processing using pre-processing software tools, a computational domain is
constructed containing the building structures. Linear emission sources are designed on the domain ground. The emission
sources along with a selected domain surface are named as velocity inlets and one surface is selected as pressure outlet, thus
defining the wind flow direction. Mesh construction in the domain and around the buildings creates the computational field
needed for solving wind flow (Navier-Stokes equations) and pollutant transport (convection-diffusion equation). The solver
intended to be used in this study, will consider dimensionless pollutant value. Different wind speed and wind directions will be
examined, to evaluate the pollutant’s final concentration in each case.
Figure.1 Computational domain containing the city geometry Figure.2 Pollutant dispersion between two buildings
Expectations and Conclusions
Micro-scale modelling of the traffic emission’s behaviour within an urban area, will provide us with significant information
about the parameters that influence the pollutant’s dispersion. This modelling technique allows us to better monitor the pollution
levels and is of service to the air quality monitoring and regulation agencies.
References
[1] Air Quality in Europe – 2019 report
161

“GREEN” HYDROCARBON FUELS PRODUCTION FROM LIGNOCELLULOSIC BIOMASS SUGARS
TOWARDS REDUCING CO2 EMISSIONS
S. Ioannidou (1) and K. Triantafyllidis (1)
(1) Department of Chemistry, Aristotle University of Thessaloniki, Greece
Presenting author email: [email protected] Summary The main objective of this work is to develop novel processes and design a new more efficient technology for 2nd generation transportation biofuels production, with the aim of reducing CO2 net emissions under the scope of cleaner air in the cities. For this purpose, model biomass-derived sugars and real biorefinery (hemicellulose) streams were initially converted to respective furans, like furfural, by acid catalysis in aqueous and biphasic systems. In subsequent steps, furans will undergo condensation with appropriate (bio)alcohols, aldehydes and ketones towards C8-C13 oxygenated compounds, which will be finally hydrodeoxygenated to the corresponding alkanes, to be considered as biofuels (i.e. green gasoline, diesel, jet-fuels).
Introduction Depletion of natural resources, degradation of environment and air pollution motivated scientists to investigate and exploit new renewable sources of fuels and chemicals with residual lignocellulosic biomass (Huber, Chheda et al. 2005), composed by cellulose, hemicellulose and lignin, to be an attractive alternative source. Within the “biorefinery” context, this work aims to the valorization of real hemicellulose streams towards the production of furfural and sequentially advanced 2nd generation transportation biofuels.
Methodology and Results Pure xylose and real hemicellulose streams (C5/C6 sugars), derived from hydrothermally pretreated beechwood (Lignocel) with diluted acid solution, were used for the furfural production experiments. Organic solvents were utilized to form biphasic systems, combined with NaCl, such as THF, Ethyl acetate, γ-GVL, 1- Butanol, MEK and MIBK. As homogeneous/liquid catalyst, sulphuric acid (H2SO4) was used. The aqueous solution, after the reaction, was analyzed by HPLC while the organic phase in the case of biphasic systems, after separation, was analyzed by GC-MS. As can be seen in Fig. 1, the reaction temperature, in comparison with the time, is the main factor which affects conversion of xylose in water as solvent, reaching the maximum 100% at about 175oC. On the other hand, selectivity to furfural is higher at moderate temperatures due to the
commence of degradation reactions of furfural at higher temperatures. Overall, the optimum parameters for higher furfural yield were 190oC, 15 min (close to those of 175oC, 30 min). Preliminary experiments in biphasic systems were also conducted with the aim to induce the in situ extraction of furfural to the organic phase, thus reducing its degradation to humins which occurs mainly in the aqueous phase. With regard to the hemicellulose stream recovered from the hydrothermal pretreatment of beechwood biomass, the optimum reaction conditions for maximizing conversion of xylose and selectivity/yield of furfural were 190oC, 15 min, being at the same range with those for pure xylose. Also, the higher sulphuric acid concentration (as dehydration catalyst) led to higher conversion of sugars but lower selectivity and yield of furfural due to furfural degradation towards humins.
Fig.1 : Furfural production from model xylose dehydration in water with dilute sulphuric acid (0.14 %v/v)
Conclusions The milder xylose dehydration conditions led to higher furfural selectivity but conversion and yield are favored at slightly
elevated temperature both in aqueous and biphasic systems. Low concentration of furfural was detected in the aqueous phase of biphasic systems indicating that most of the produced furfural has been extracted to the organic phase. In the case of hemicellulose streams the most intense conditions led to the higher sugars conversion, furfural selectivity and yield.
Acknowledgement S.I. would like to acknowledge financial support through the PhD scholarship program GRACE (Graduate School for Climate and Environment) and HEPTA project of Karlsruhe Institute of Technology.
References
Huber, G. W., J. N. Chheda, C. J. Barrett and J. A. Dumesic (2005). "Production of Liquid Alkanes by Aqueous-Phase Processing of Biomass-Derived Carbohydrates." 308(5727): 1446-1450.
162
Determining risk from air pollution using high resolution mobile phone and concentration data
Blaise Kelly(1), Bas Henzing (1), Ioanna Skoulidou (3), Robert Jansen (2), Janot Tokaya (1) and Mara Hauck (1,4)
(1)TNO, Climate Air and Sustainability (2) Zicht Op Data BV, Netherlands (3) Laboratory of Atmospheric Physics, Aristotle
University of Thessaloniki (4)Technical University Eindhoven
Presenting author email: [email protected]
Summary
Risk Coefficients from an adapted version of the Global Burden of Disease (GBD) Integrated Exposure Response (IER)
model are combined with high temporal and spatial resolution population and air pollution concentration data and local
mortality statistics to enable impacts from pollution to be better defined for areas within Eindhoven in the Netherlands.
Introduction
Attributing population mortality to specific causes, such as air pollution concentrations, is important for an understanding of
the risk posed to society from specific factors. However, the air pollution and population data used in these assessments is often
aggregated over large periods and generally assumes populations stay within their home area all of the time. In reality, air
pollution concentrations and the distribution of the population varies throughout the day, depending on activities across a city.
This work looks at using Risk Coefficients from an adapted version of the Global Burden of Disease (GBD) Integrated Exposure
Response (IER) model. The Coefficients from this model define the Relative Risk, which is a ratio of the probability of an
event occurring, in this case diseases commonly associated with air pollution, compared to the probability in the non-exposed
group. This ratio is applied to high resolution mortality data and high temporal and spatial resolution population and air
pollution concentration estimates, to enable impacts from pollution to be better estimated at the regional/postcode level for
Eindhoven in the Netherlands.
Methodology and results
Since 1996, the Global Burden of Disease (GBD) concept has been used to estimate mortality and morbidity for a range of
diseases and injury. In 2010 this was taken a step further with the development of the Integrated Exposure Risk (IER) model
which has gradually been refined and expanded until the most recent version in. A number of studies have built on this work,
evaluating regional specific Particulate Matter <2.5 µm (PM2.5) exposure response models to produce a consistent set of
regional specific global effect factors.
Statistics Netherlands CBS has figures on deaths by major underlying causes of death age and gender at municipality and
neighbourhood level. The relevant diseases are extracted using ICD-10 codes defined by the World Health Organisation (WHO)
and split by the weekly mortality estimates. The result is a weekly, mortality estimate for the five main diseases commonly
associated with PM2.5 exposure. This are combined with the Relative Risk (RR) factors from the GBD IER models to estimate
the proportion of deaths from PM2.5.
Hourly PM2.5 concentration data at a 1km x 1km resolution is estimated using the LOTOS EUROS chemistry transport
model(Manders et al., 2017). The concentrations from this model were assimilated with ground based measurement sites,
including the Innovative Air Measurement System (ILM) in Eindhoven. It uses a Local Ensemble Transform Kalman Filter to
reduce the bias error(Skoulidou et al., 2021). This provides hourly concentration estimates at 1km spatial resolution, both in
real-time and historically, with labels able to distinguish the source.
Zicht Op Data and Resono provide estimates from mobile smart phones using a propriety algorithm called 'hyperfencing'. Using
this technique for the district of Eindhoven, it is possible to estimate a real time intensity figure to indicate how busy a defined
area is at 15 minute intervals. More accurate population estimates, including demographic data, can be retrieved a few days
later.
A key aspect of this work is the area over which the data inputs are aggregated. It is common for areas of the city to be defined
by postcodes. CBS uses regional divisions for population data with 'Neighbourhood' being the smallest regional division.
Alternatively another method for defining urban areas has been proposed called the 'Clockboard'. This divides the city into
segments that reflect the numbering order of a clock face and which increase in size away from the city.
Conclusion
This submission describes a reproducible modelling methodology being developed for combining high spatial and temporal
resolution population and PM2.5 concentration data with weekly neighbourhood mortality statistics to develop a better
understanding of where the risk to populations is greatest and also where policy measures should be targeted.
References
Manders, A.M.M. et al. (2017) ‘Curriculum vitae of the LOTOS–EUROS (v2.0) chemistry transport model’, Geoscientific
Model Development, 10(11), pp. 4145–4173. doi:10.5194/gmd-10-4145-2017.
Skoulidou, I. et al. (2021) ‘Changes in Power Plant NOx Emissions over Northwest Greece Using a Data Assimilation
Technique’, Atmosphere, 12(7), p. 900. doi:10.3390/atmos12070900.
163
URBAN CHARACTERISTICS DEFINING THE SPATIAL VARIATION OF AIR QUALITY IN DOWNTOWN NANJING
T.V. Kokkonen (1,2,3), Y. Xie (2), P. Paasonen (3), S. Gani (3,4), L. Jiang (2), B. Wang (5), D. Zhou (1,2), W. Qin (6), W. Nie
(1), V.-M. Kerminen (1,3), T. Petäjä (1,3), J. Sun (1,2), M. Kulmala (1,3) and A. Ding (1)
(1) Joint International Research Laboratory of Atmospheric and Earth System Sciences, School of Atmospheric Sciences, Nanjing University, Nanjing, China; (2) Nanjing Atmospheric Environment and Green Development Research Institute
(NAGR), Nanjing, China; (3) Institute for Atmospheric and Earth System Research/Physics, Faculty of Science, University of Helsinki, Helsinki, Finland; (4) Helsinki Institute of Sustainability Science, University of Helsinki, Helsinki, Finland; (5) Gulou Environment Protection Department, Nanjing, China; (6) Jiangsu Environmental Monitoring Center, Nanjing, China
Presenting author email: [email protected] Summary The effects of the urban morphological characteristics on the spatial variation of near-surface PM2.5 air quality were examined in this study utilizing an air quality observation network in downtown Nanjing. The effect of nearby trees was identified to be the most important urban morphological characteristics defining the near-surface pollutant concentrations in street canyons and the height normalized roughness length as the second most important. The strong accumulation of pollutants due to the trees highlights the importance of utilizing scientific knowledge before planting urban trees in street canyons. The results obtained in this study can help urban planners to identify the key urban characteristics affecting the near-surface PM2.5 air quality and help researchers to evaluate how representative the existing measurement stations are compared to other parts of the cities. Introduction We examined the effect of the few most regularly used urban morphological characteristics on spatial variation of air quality in downtown Nanjing. Previous studies have been focusing on the effect of individual morphological characteristics, modelling, idealized street canyons or few individual sites (Sharma et al., 2005; Xia et al., 2014; Kadaverugu et al., 2019). We performed this study in real urban environment using continuous observations from 1 December 2019 to 29 February 2020 in 31 study sites with highly varying urban densities covering the whole range of urban densities typically found in cities. Methodology and Results 31 study site scattered around downtown Nanjing were used in this study. A bit more than half (N = 17) was located in rather open areas (e.g. next to parking lots, urban parks etc.) and the rest of the sites were located in typical urban street canyons with buildings at both sides of the road. The study areas are circles with a 500 m radius around the stations, which were divided into 8 different wind sectors (width 45°). Urban morphological characteristics were defined individually for each wind sector leading to 248 study sectors with highly varying characteristics. The hourly PM2.5 concentrations were normalized for each hour using the minimum of all stations, which was assumed to represent the urban background concentrations. The normalization was made to minimize the effect of transported pollutants and the effect of meteorological conditions. The characteristics studied were the surface cover fraction of urban trees within 50 m radius (ftree), height normalized roughness length (z0/zH), distance to nearest major road (Droad) and street canyon aspect ratio (lS). An increase in ftree from 25th percentile to 75th percentile (i.e. by the interquartile range, IQR) increased the normalized PM2.5 by up to 24 % in street canyons. However, in open areas an increase of the ftree by the IQR decreased the PM2.5 concentration by up to 6 %. An increase in z0/zH by the IQR increased the normalized PM2.5 by 9% in the street canyons. Surprisingly, the effect of street canyon aspect ratio on the normalized PM2.5 concentration was found to be insignificant. Conclusions The urban morphological characteristics explained up to 73 % of the variance in normalized PM2.5 concentrations in street canyons, indicating that the variables studied were defining the spatial variation of the near surface air quality. Since the effect of nearby trees was deteriorating the air quality substantially compared to other urban morphological characteristics, it emphasizes that the inclusion of the trees in any type of urban planning or urban modelling related to air quality is crucial to obtain representative results. Acknowledgement The work is supported by Academy of Finland (project no. 272041, 316114, 315203, 307537, 311932), European Research Council via ATM-GTP 266 (742206), Business Finland via Megasense-project, European Commission via SMart URBan Solutions for air quality, disasters and city growth, (689443), ERA-NET-Cofund as well Jane and Aatos Erkko Foundation and Academy of Finland Flagship funding (grant no. 337549). Partial support from the National Key R&D Program of China (2016YFC0200500), and the National Natural Science Foundation of China (91544231 & 41725020) is acknowledged. References Kadaverugu, R., Sharma, A., Matli, C. and Biniwale, R., 2019. High Resolution Urban Air Quality Modeling by Coupling CFD and Mesoscale Models: a Review. Asia-Pac. J. Atmospheric Sci. 55, 539–556. Sharma, N., Chaudhry, K.K. and Rao, C.V.C., 2005. Air pollution dispersion studies through environmental wind tunnel (EWT) investigations: a review. J. Sci. Ind. Res. 64, 549–559. Xia, Q., Niu, J.L. and Liu, X.P., 2014. Dispersion of air pollutants around buildings: a review of past studies and their methodologies, Indoor Built Environ. 23, 201–224.
164
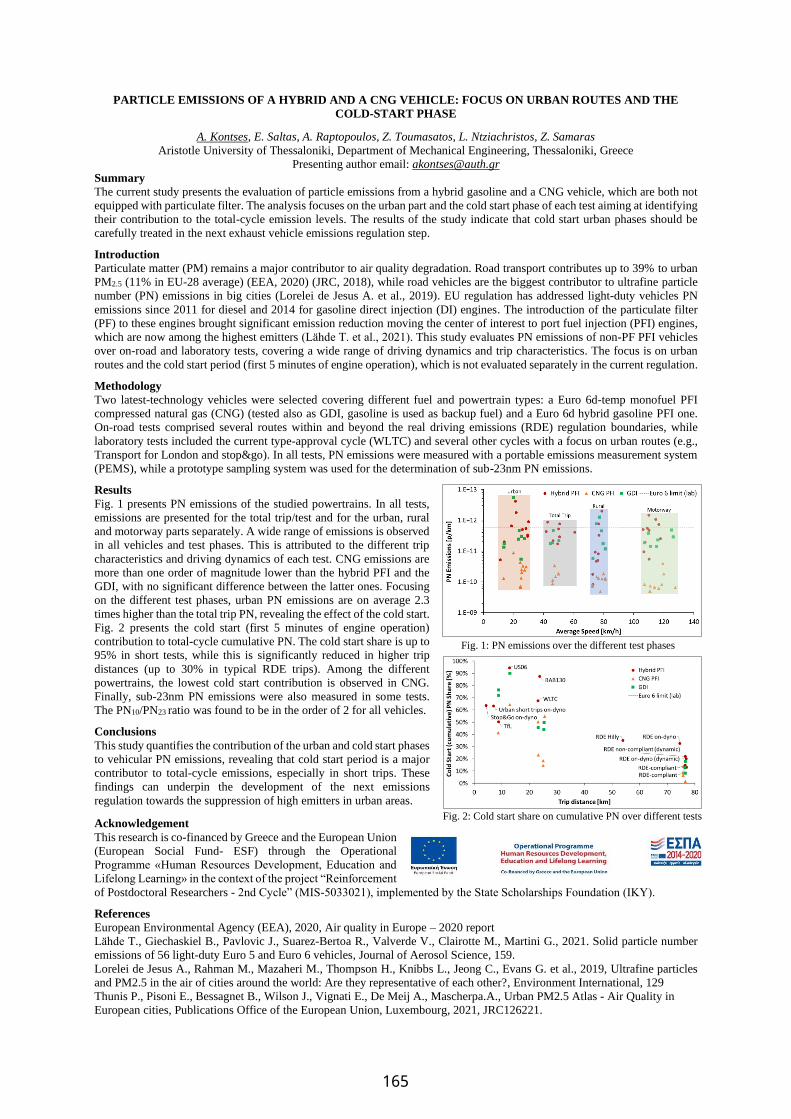
PARTICLE EMISSIONS OF A HYBRID AND A CNG VEHICLE: FOCUS ON URBAN ROUTES AND THE
COLD-START PHASE
A. Kontses, E. Saltas, A. Raptopoulos, Z. Toumasatos, L. Ntziachristos, Z. Samaras
Aristotle University of Thessaloniki, Department of Mechanical Engineering, Thessaloniki, Greece
Presenting author email: [email protected]
Summary
The current study presents the evaluation of particle emissions from a hybrid gasoline and a CNG vehicle, which are both not
equipped with particulate filter. The analysis focuses on the urban part and the cold start phase of each test aiming at identifying
their contribution to the total-cycle emission levels. The results of the study indicate that cold start urban phases should be
carefully treated in the next exhaust vehicle emissions regulation step.
Introduction
Particulate matter (PM) remains a major contributor to air quality degradation. Road transport contributes up to 39% to urban
PM2.5 (11% in EU-28 average) (EEA, 2020) (JRC, 2018), while road vehicles are the biggest contributor to ultrafine particle
number (PN) emissions in big cities (Lorelei de Jesus A. et al., 2019). EU regulation has addressed light-duty vehicles PN
emissions since 2011 for diesel and 2014 for gasoline direct injection (DI) engines. The introduction of the particulate filter
(PF) to these engines brought significant emission reduction moving the center of interest to port fuel injection (PFI) engines,
which are now among the highest emitters (Lähde T. et al., 2021). This study evaluates PN emissions of non-PF PFI vehicles
over on-road and laboratory tests, covering a wide range of driving dynamics and trip characteristics. The focus is on urban
routes and the cold start period (first 5 minutes of engine operation), which is not evaluated separately in the current regulation.
Methodology
Two latest-technology vehicles were selected covering different fuel and powertrain types: a Euro 6d-temp monofuel PFI
compressed natural gas (CNG) (tested also as GDI, gasoline is used as backup fuel) and a Euro 6d hybrid gasoline PFI one.
On-road tests comprised several routes within and beyond the real driving emissions (RDE) regulation boundaries, while
laboratory tests included the current type-approval cycle (WLTC) and several other cycles with a focus on urban routes (e.g.,
Transport for London and stop&go). In all tests, PN emissions were measured with a portable emissions measurement system
(PEMS), while a prototype sampling system was used for the determination of sub-23nm PN emissions.
Results
Fig. 1 presents PN emissions of the studied powertrains. In all tests,
emissions are presented for the total trip/test and for the urban, rural
and motorway parts separately. A wide range of emissions is observed
in all vehicles and test phases. This is attributed to the different trip
characteristics and driving dynamics of each test. CNG emissions are
more than one order of magnitude lower than the hybrid PFI and the
GDI, with no significant difference between the latter ones. Focusing
on the different test phases, urban PN emissions are on average 2.3
times higher than the total trip PN, revealing the effect of the cold start.
Fig. 2 presents the cold start (first 5 minutes of engine operation)
contribution to total-cycle cumulative PN. The cold start share is up to
95% in short tests, while this is significantly reduced in higher trip
distances (up to 30% in typical RDE trips). Among the different
powertrains, the lowest cold start contribution is observed in CNG.
Finally, sub-23nm PN emissions were also measured in some tests.
The PN10/PN23 ratio was found to be in the order of 2 for all vehicles.
Conclusions
This study quantifies the contribution of the urban and cold start phases
to vehicular PN emissions, revealing that cold start period is a major
contributor to total-cycle emissions, especially in short trips. These
findings can underpin the development of the next emissions
regulation towards the suppression of high emitters in urban areas.
Acknowledgement
This research is co-financed by Greece and the European Union
(European Social Fund- ESF) through the Operational
Programme «Human Resources Development, Education and
Lifelong Learning» in the context of the project “Reinforcement
of Postdoctoral Researchers - 2nd Cycle” (MIS-5033021), implemented by the State Scholarships Foundation (ΙΚΥ).
References
European Environmental Agency (EEA), 2020, Air quality in Europe – 2020 report
Lähde T., Giechaskiel B., Pavlovic J., Suarez-Bertoa R., Valverde V., Clairotte M., Martini G., 2021. Solid particle number
emissions of 56 light-duty Euro 5 and Euro 6 vehicles, Journal of Aerosol Science, 159.
Lorelei de Jesus A., Rahman M., Mazaheri M., Thompson H., Knibbs L., Jeong C., Evans G. et al., 2019, Ultrafine particles
and PM2.5 in the air of cities around the world: Are they representative of each other?, Environment International, 129
Thunis P., Pisoni E., Bessagnet B., Wilson J., Vignati E., De Meij A., Mascherpa.A., Urban PM2.5 Atlas - Air Quality in
European cities, Publications Office of the European Union, Luxembourg, 2021, JRC126221.
Fig. 1: PN emissions over the different test phases
Fig. 2: Cold start share on cumulative PN over different tests
165
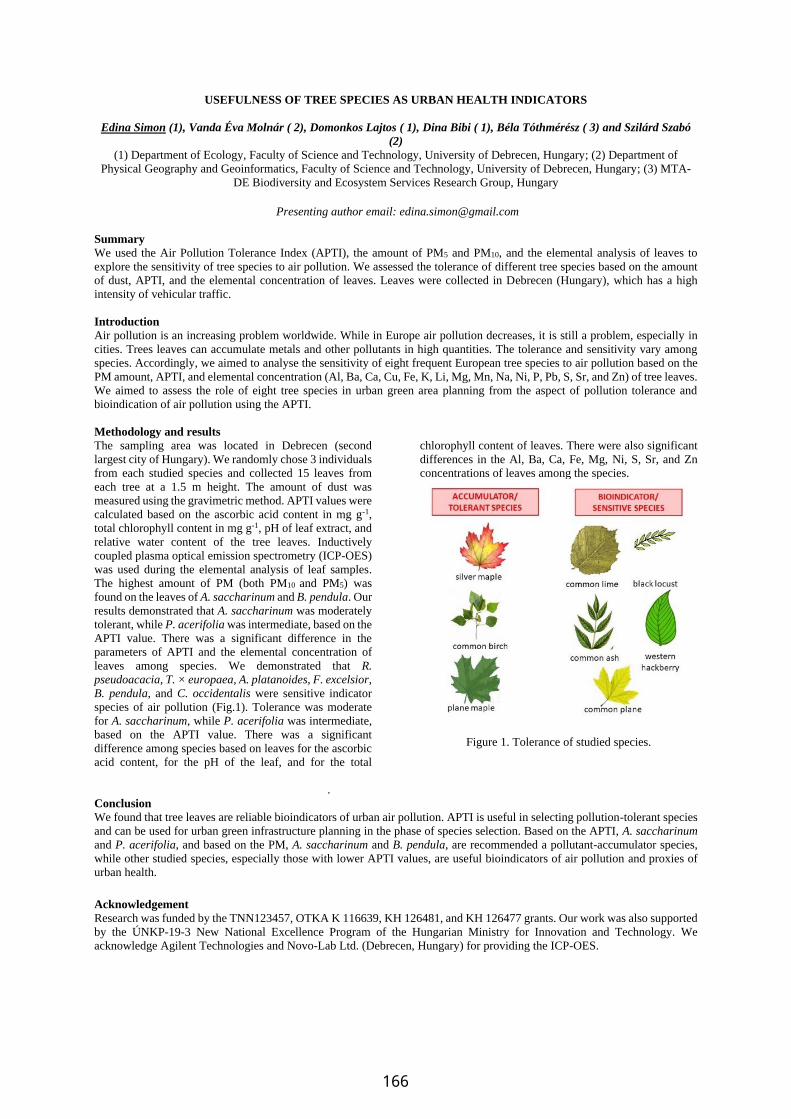
USEFULNESS OF TREE SPECIES AS URBAN HEALTH INDICATORS
Edina Simon (1), Vanda Éva Molnár ( 2), Domonkos Lajtos ( 1), Dina Bibi ( 1), Béla Tóthmérész ( 3) and Szilárd Szabó
(2)
(1) Department of Ecology, Faculty of Science and Technology, University of Debrecen, Hungary; (2) Department of
Physical Geography and Geoinformatics, Faculty of Science and Technology, University of Debrecen, Hungary; (3) MTA-
DE Biodiversity and Ecosystem Services Research Group, Hungary
Presenting author email: [email protected]
Summary
We used the Air Pollution Tolerance Index (APTI), the amount of PM5 and PM10, and the elemental analysis of leaves to
explore the sensitivity of tree species to air pollution. We assessed the tolerance of different tree species based on the amount
of dust, APTI, and the elemental concentration of leaves. Leaves were collected in Debrecen (Hungary), which has a high
intensity of vehicular traffic.
Introduction
Air pollution is an increasing problem worldwide. While in Europe air pollution decreases, it is still a problem, especially in
cities. Trees leaves can accumulate metals and other pollutants in high quantities. The tolerance and sensitivity vary among
species. Accordingly, we aimed to analyse the sensitivity of eight frequent European tree species to air pollution based on the
PM amount, APTI, and elemental concentration (Al, Ba, Ca, Cu, Fe, K, Li, Mg, Mn, Na, Ni, P, Pb, S, Sr, and Zn) of tree leaves.
We aimed to assess the role of eight tree species in urban green area planning from the aspect of pollution tolerance and
bioindication of air pollution using the APTI.
Methodology and results
The sampling area was located in Debrecen (second
largest city of Hungary). We randomly chose 3 individuals
from each studied species and collected 15 leaves from
each tree at a 1.5 m height. The amount of dust was
measured using the gravimetric method. APTI values were
calculated based on the ascorbic acid content in mg g-1,
total chlorophyll content in mg g-1, pH of leaf extract, and
relative water content of the tree leaves. Inductively
coupled plasma optical emission spectrometry (ICP-OES)
was used during the elemental analysis of leaf samples.
The highest amount of PM (both PM10 and PM5) was
found on the leaves of A. saccharinum and B. pendula. Our
results demonstrated that A. saccharinum was moderately
tolerant, while P. acerifolia was intermediate, based on the
APTI value. There was a significant difference in the
parameters of APTI and the elemental concentration of
leaves among species. We demonstrated that R.
pseudoacacia, T. × europaea, A. platanoides, F. excelsior,
B. pendula, and C. occidentalis were sensitive indicator
species of air pollution (Fig.1). Tolerance was moderate
for A. saccharinum, while P. acerifolia was intermediate,
based on the APTI value. There was a significant
difference among species based on leaves for the ascorbic
acid content, for the pH of the leaf, and for the total
chlorophyll content of leaves. There were also significant
differences in the Al, Ba, Ca, Fe, Mg, Ni, S, Sr, and Zn
concentrations of leaves among the species.
Figure 1. Tolerance of studied species.
.
Conclusion
We found that tree leaves are reliable bioindicators of urban air pollution. APTI is useful in selecting pollution-tolerant species
and can be used for urban green infrastructure planning in the phase of species selection. Based on the APTI, A. saccharinum
and P. acerifolia, and based on the PM, A. saccharinum and B. pendula, are recommended a pollutant-accumulator species,
while other studied species, especially those with lower APTI values, are useful bioindicators of air pollution and proxies of
urban health.
Acknowledgement
Research was funded by the TNN123457, OTKA K 116639, KH 126481, and KH 126477 grants. Our work was also supported
by the ÚNKP-19-3 New National Excellence Program of the Hungarian Ministry for Innovation and Technology. We
acknowledge Agilent Technologies and Novo-Lab Ltd. (Debrecen, Hungary) for providing the ICP-OES.
166
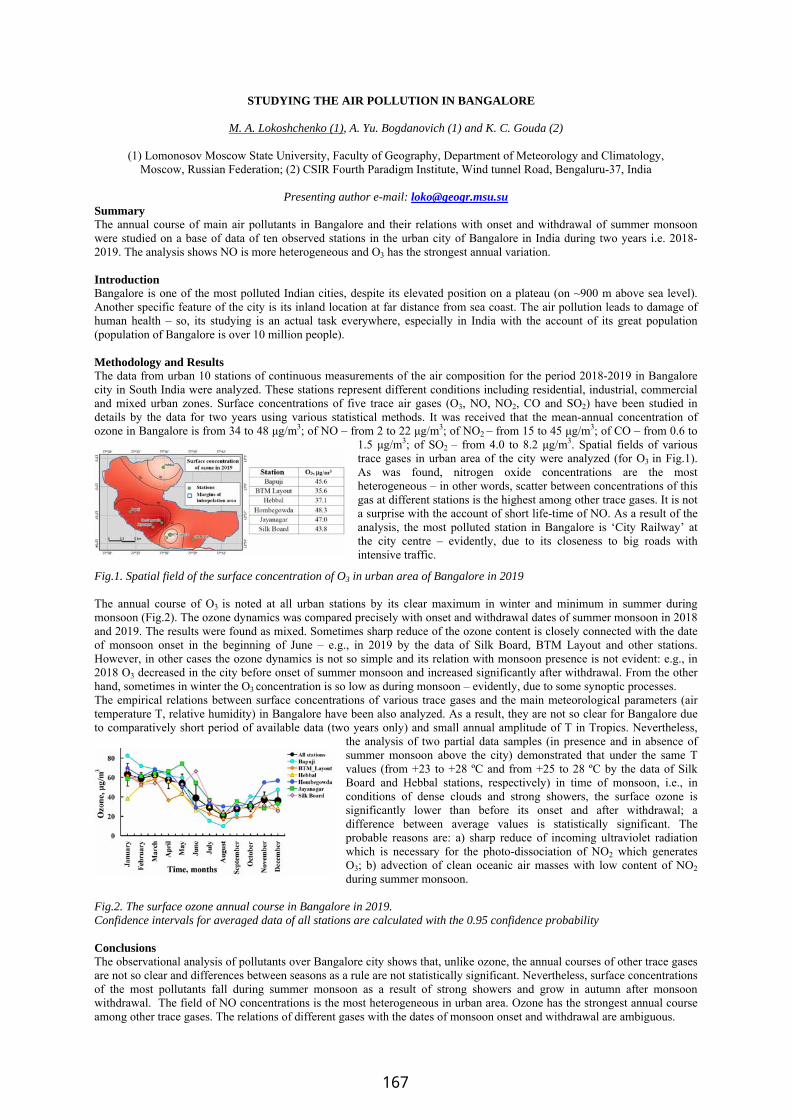
STUDYING THE AIR POLLUTION IN BANGALORE
M. A. Lokoshchenko (1), A. Yu. Bogdanovich (1) and K. C. Gouda (2)
(1) Lomonosov Moscow State University, Faculty of Geography, Department of Meteorology and Climatology, Moscow, Russian Federation; (2) CSIR Fourth Paradigm Institute, Wind tunnel Road, Bengaluru-37, India
Presenting author e-mail: [email protected]
Summary The annual course of main air pollutants in Bangalore and their relations with onset and withdrawal of summer monsoon were studied on a base of data of ten observed stations in the urban city of Bangalore in India during two years i.e. 2018-2019. The analysis shows NO is more heterogeneous and O3 has the strongest annual variation. Introduction Bangalore is one of the most polluted Indian cities, despite its elevated position on a plateau (on ~900 m above sea level). Another specific feature of the city is its inland location at far distance from sea coast. The air pollution leads to damage of human health – so, its studying is an actual task everywhere, especially in India with the account of its great population (population of Bangalore is over 10 million people). Methodology and Results The data from urban 10 stations of continuous measurements of the air composition for the period 2018-2019 in Bangalore city in South India were analyzed. These stations represent different conditions including residential, industrial, commercial and mixed urban zones. Surface concentrations of five trace air gases (O3, NO, NO2, CO and SO2) have been studied in details by the data for two years using various statistical methods. It was received that the mean-annual concentration of ozone in Bangalore is from 34 to 48 μg/m3; of NO – from 2 to 22 μg/m3; of NO2 – from 15 to 45 μg/m3; of CO – from 0.6 to
1.5 μg/m3; of SO2 – from 4.0 to 8.2 μg/m3. Spatial fields of various trace gases in urban area of the city were analyzed (for O3 in Fig.1). As was found, nitrogen oxide concentrations are the most heterogeneous – in other words, scatter between concentrations of this gas at different stations is the highest among other trace gases. It is not a surprise with the account of short life-time of NO. As a result of the analysis, the most polluted station in Bangalore is ‘City Railway’ at the city centre – evidently, due to its closeness to big roads with intensive traffic.
Fig.1. Spatial field of the surface concentration of O3 in urban area of Bangalore in 2019 The annual course of O3 is noted at all urban stations by its clear maximum in winter and minimum in summer during monsoon (Fig.2). The ozone dynamics was compared precisely with onset and withdrawal dates of summer monsoon in 2018 and 2019. The results were found as mixed. Sometimes sharp reduce of the ozone content is closely connected with the date of monsoon onset in the beginning of June – e.g., in 2019 by the data of Silk Board, BTM Layout and other stations. However, in other cases the ozone dynamics is not so simple and its relation with monsoon presence is not evident: e.g., in 2018 O3 decreased in the city before onset of summer monsoon and increased significantly after withdrawal. From the other hand, sometimes in winter the O3 concentration is so low as during monsoon – evidently, due to some synoptic processes. The empirical relations between surface concentrations of various trace gases and the main meteorological parameters (air temperature T, relative humidity) in Bangalore have been also analyzed. As a result, they are not so clear for Bangalore due to comparatively short period of available data (two years only) and small annual amplitude of T in Tropics. Nevertheless,
the analysis of two partial data samples (in presence and in absence of summer monsoon above the city) demonstrated that under the same T values (from +23 to +28 ºC and from +25 to 28 ºC by the data of Silk Board and Hebbal stations, respectively) in time of monsoon, i.e., in conditions of dense clouds and strong showers, the surface ozone is significantly lower than before its onset and after withdrawal; a difference between average values is statistically significant. The probable reasons are: a) sharp reduce of incoming ultraviolet radiation which is necessary for the photo-dissociation of NO2 which generates O3; b) advection of clean oceanic air masses with low content of NO2 during summer monsoon.
Fig.2. The surface ozone annual course in Bangalore in 2019. Confidence intervals for averaged data of all stations are calculated with the 0.95 confidence probability Conclusions The observational analysis of pollutants over Bangalore city shows that, unlike ozone, the annual courses of other trace gases are not so clear and differences between seasons as a rule are not statistically significant. Nevertheless, surface concentrations of the most pollutants fall during summer monsoon as a result of strong showers and grow in autumn after monsoon withdrawal. The field of NO concentrations is the most heterogeneous in urban area. Ozone has the strongest annual course among other trace gases. The relations of different gases with the dates of monsoon onset and withdrawal are ambiguous.
167
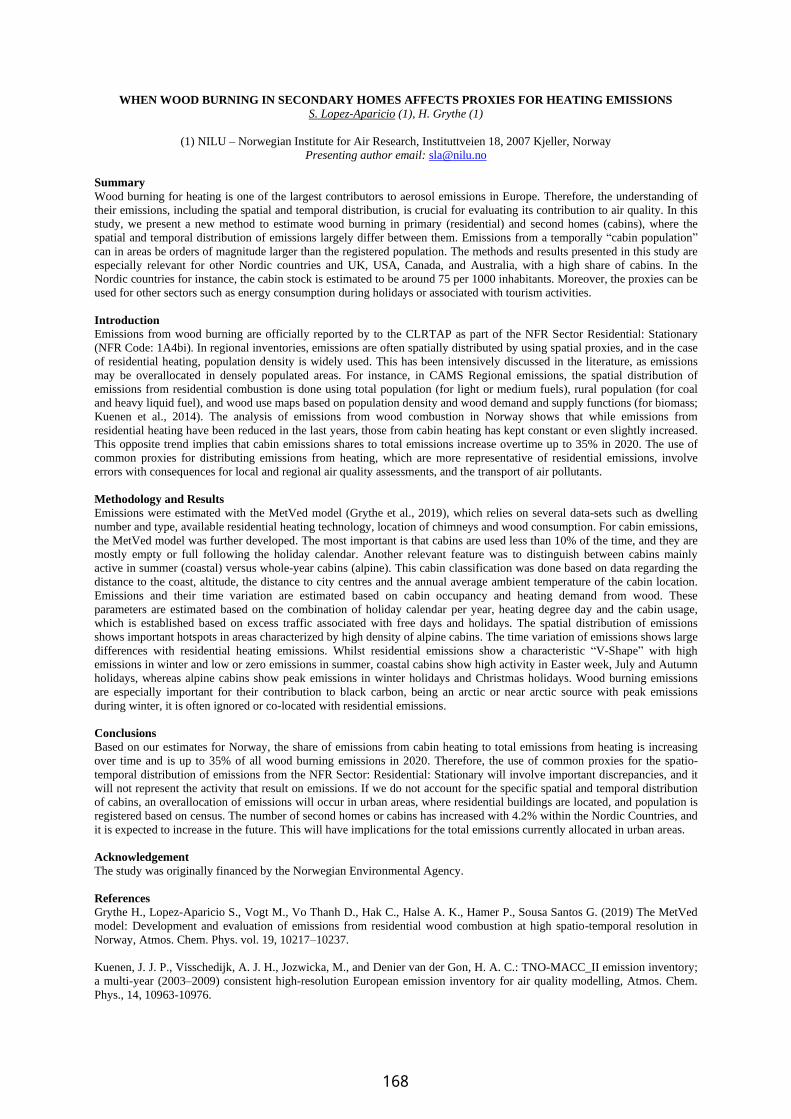
WHEN WOOD BURNING IN SECONDARY HOMES AFFECTS PROXIES FOR HEATING EMISSIONS
S. Lopez-Aparicio (1), H. Grythe (1)
(1) NILU – Norwegian Institute for Air Research, Instituttveien 18, 2007 Kjeller, Norway
Presenting author email: [email protected]
Summary
Wood burning for heating is one of the largest contributors to aerosol emissions in Europe. Therefore, the understanding of
their emissions, including the spatial and temporal distribution, is crucial for evaluating its contribution to air quality. In this
study, we present a new method to estimate wood burning in primary (residential) and second homes (cabins), where the
spatial and temporal distribution of emissions largely differ between them. Emissions from a temporally “cabin population”
can in areas be orders of magnitude larger than the registered population. The methods and results presented in this study are
especially relevant for other Nordic countries and UK, USA, Canada, and Australia, with a high share of cabins. In the
Nordic countries for instance, the cabin stock is estimated to be around 75 per 1000 inhabitants. Moreover, the proxies can be
used for other sectors such as energy consumption during holidays or associated with tourism activities.
Introduction
Emissions from wood burning are officially reported by to the CLRTAP as part of the NFR Sector Residential: Stationary
(NFR Code: 1A4bi). In regional inventories, emissions are often spatially distributed by using spatial proxies, and in the case
of residential heating, population density is widely used. This has been intensively discussed in the literature, as emissions
may be overallocated in densely populated areas. For instance, in CAMS Regional emissions, the spatial distribution of
emissions from residential combustion is done using total population (for light or medium fuels), rural population (for coal
and heavy liquid fuel), and wood use maps based on population density and wood demand and supply functions (for biomass;
Kuenen et al., 2014). The analysis of emissions from wood combustion in Norway shows that while emissions from
residential heating have been reduced in the last years, those from cabin heating has kept constant or even slightly increased.
This opposite trend implies that cabin emissions shares to total emissions increase overtime up to 35% in 2020. The use of
common proxies for distributing emissions from heating, which are more representative of residential emissions, involve
errors with consequences for local and regional air quality assessments, and the transport of air pollutants.
Methodology and Results
Emissions were estimated with the MetVed model (Grythe et al., 2019), which relies on several data-sets such as dwelling
number and type, available residential heating technology, location of chimneys and wood consumption. For cabin emissions,
the MetVed model was further developed. The most important is that cabins are used less than 10% of the time, and they are
mostly empty or full following the holiday calendar. Another relevant feature was to distinguish between cabins mainly
active in summer (coastal) versus whole-year cabins (alpine). This cabin classification was done based on data regarding the
distance to the coast, altitude, the distance to city centres and the annual average ambient temperature of the cabin location.
Emissions and their time variation are estimated based on cabin occupancy and heating demand from wood. These
parameters are estimated based on the combination of holiday calendar per year, heating degree day and the cabin usage,
which is established based on excess traffic associated with free days and holidays. The spatial distribution of emissions
shows important hotspots in areas characterized by high density of alpine cabins. The time variation of emissions shows large
differences with residential heating emissions. Whilst residential emissions show a characteristic “V-Shape” with high
emissions in winter and low or zero emissions in summer, coastal cabins show high activity in Easter week, July and Autumn
holidays, whereas alpine cabins show peak emissions in winter holidays and Christmas holidays. Wood burning emissions
are especially important for their contribution to black carbon, being an arctic or near arctic source with peak emissions
during winter, it is often ignored or co-located with residential emissions.
Conclusions
Based on our estimates for Norway, the share of emissions from cabin heating to total emissions from heating is increasing
over time and is up to 35% of all wood burning emissions in 2020. Therefore, the use of common proxies for the spatio-
temporal distribution of emissions from the NFR Sector: Residential: Stationary will involve important discrepancies, and it
will not represent the activity that result on emissions. If we do not account for the specific spatial and temporal distribution
of cabins, an overallocation of emissions will occur in urban areas, where residential buildings are located, and population is
registered based on census. The number of second homes or cabins has increased with 4.2% within the Nordic Countries, and
it is expected to increase in the future. This will have implications for the total emissions currently allocated in urban areas.
Acknowledgement
The study was originally financed by the Norwegian Environmental Agency.
References
Grythe H., Lopez-Aparicio S., Vogt M., Vo Thanh D., Hak C., Halse A. K., Hamer P., Sousa Santos G. (2019) The MetVed
model: Development and evaluation of emissions from residential wood combustion at high spatio-temporal resolution in
Norway, Atmos. Chem. Phys. vol. 19, 10217–10237.
Kuenen, J. J. P., Visschedijk, A. J. H., Jozwicka, M., and Denier van der Gon, H. A. C.: TNO-MACC_II emission inventory;
a multi-year (2003–2009) consistent high-resolution European emission inventory for air quality modelling, Atmos. Chem.
Phys., 14, 10963-10976.
168

ESTIMATION OF REAL-WORLD EMISSIONS FROM CARS USING BOOSTED REGRESSION TREE MODELS
S. Mahesh (1), M. Giberti (2), B. Ghosh (1), A. McNabola (1), W. Smith (2) and D. Timoney (2)
(1) Department of Civil, Structural and Environmental Engineering, School of Engineering, Trinity College Dublin,
Dublin, D02PN40, Ireland; (2) School of Mechanical and Materials Engineering, University College Dublin,
Dublin, D04V1W8, Ireland
Presenting author email: [email protected]
Summary
This study aims to estimate real-world emissions from cars using boosted regression tree models. The second-by-second
Portable Emission Measurement System (PEMS) data used in this study is from urban arterial road segments in the United
Kingdom. Traditionally, emission models developed using PEMS data are polynomial regression models which have many
underlying assumptions about the data which are not generally satisfied due to the inherent variability involved in real-world
emission measurements. Boosted regression trees are non-parametric and have no formal distributional assumptions. Thus,
they can be used for skewed and multi-modal data. The performance of the developed models is compared with the
traditional polynomial regression models.
Introduction
Emissions from motor vehicles are a significant contributor of air pollutants in Ireland (Alam et al. 2017). Despite the
improvement in the emission standards for petrol and diesel vehicles over the last three decades, the number of motor
vehicles has grown exponentially, thus preventing overall reduction in emissions. The recent pandemic has further
encouraged people to use private vehicles instead of public transport modes which could further add to the emissions from
private cars in cities. Quantification of the emissions from motor vehicles is necessary to take appropriate policy measures
aimed at mitigating further increase in emissions. The policy measures could include phasing out high emitting vehicles,
creating low emission zones, collection a higher tax for older vehicles, and providing incentives to low or zero emission
vehicles such as hybrid and electric vehicles. Emission tests from cars can be either laboratory based or real-world.
Laboratory based emission tests are known to poorly represent the real-world driving conditions and hence may not provide
accurate emission values. Real-world emission tests are conducted using on-board emission analysers directly measuring
emissions from the tailpipe of the vehicle during its operation on the road.
Methodology and Results
Boosted regression tree based models are developed using real-world PEMS data from twenty in-use passenger cars of
different engine sizes and emissions standards (Euro 4, Euro 5, and Euro 6). The dataset was limited to urban arterial road
segments in the United Kingdom, with second-by-second measurements of CO, CO2, and NOx. These twenty vehicle models
are the most common cars in Ireland based on data from the department of transport in Ireland, and included both petrol and
diesel powered cars with engine sizes ranging from 1500 to 2000 cm3. To verify the distributions of the emissions, the
Kolmogorov-Smirnov (K-S) test was adopted. The dataset was partitioned into a training set and a test set. Results
demonstrate that the proposed method performs significantly better than the traditional polynomial regression models with
lower Mean Absolute Error (MAE) and Root Mean Square Error (RMSE).
Conclusions
Laboratory based emission tests of motor vehicles have limited ability to capture real-world operation of the vehicle. Real-
world emissions measured using PEMS provides more accurate understanding of real-world emissions and hence the models
proposed in this study using PEMS data from cars could be used as input into emission estimation models.
Acknowledgement
This work was supported by Environmental Protection Agency (EPA), Ireland through the REDMAP project (EPA-2019-
CCRP-MS.67).
References
Alam, M. S., Hyde, B., Duffy, P., & McNabola, A., 2017. Assessment of pathways to reduce CO2 emissions from passenger
car fleets: Case study in Ireland. Applied energy 189, 283-300.
169

TOTAL COLUMN AVERAGED MIXING RATIOS OF CO OVER THESSALONIKI, GREECE, USING A
PORTABLE EM27/SUN FTIR SPECTROMETER AND TROPOMI OBSERVATIONS: A FIRE EPISODE CASE
STUDY DURING SUMMER 2021
Marios Mermigkas(1) , Chrysanthi Topaloglou(1), Dimitrios Balis(1), Maria Elissavet Koukouli(1), Lena Feld(2), Darko
Dubravica(2), Frank Hase(2), Peter Braesicke(2)
(1) Laboratory of Atmospheric Physics, Department of Physics, Aristotle University of Thessaloniki, Thessaloniki, Greece ;
Campus Box 149;54124 Thessaloniki;GREECE; (2) Institute of Meteorology and Climate Research (KIT-IMK), Karlsruhe
Institute of Technology, Karlsruhe , Germany; P.O. Box 3640;D-76021 Karlsruhe;GERMANY;
Presenting author email: [email protected]
Summary The column-averaged dry-air mole fractions of carbon monoxide (XCO) measured at a mid-latitude urban station,
Thessaloniki, Greece, using the Bruker EM27/SUN ground-based low-resolution Fourier Transform spectrometer, are
presented and examined for the fire episodes during summer period of 2021, in conjunction with TROPOspheric Monitoring
Instrument (TROPOMI), Sentinel-5P space borne sensor observations.
Introduction Industrialisation, urbanisation, transport and domestic heating not only sustain but continuously increase the need for fossil
fuel combustion, the main source of the anthropogenic component of the carbon cycle. Agriculture, coal mining, waste
management, natural gas networks and other human activities also greatly contribute to the increase of greenhouse gas
(GHG) concentrations in the atmosphere. Carbon monoxide is produced by the oxidation of methane, biomass burning and
the combustion of fossil fuels, while the dominant sink of CO is oxidation with hydroxyl radicals (OH). The EM27/SUN
instruments constitute the Collaborative Carbon Column Observing Network (COCCON), with stations worldwide for the
quantification of local sinks and sources, working as an important supplement of TCCON to increase the density of column-
averaged greenhouse gas observations.
Methodology and Results
In this work, we present the FTIR timeseries of column-averaged dry-air mole fractions of carbon monoxide (XCO), together
with TROPOMI observations, exhibiting high values in August 2021. The time series of FTIR measurements are examined
together with satellite data and meteorological conditions for better understanding of how local events or air mass transport
pollution affect the species variability. Figure 1 shows the XCO values during these 3 years of measurements in Thessaloniki.
Figure 1. Dry-air mole fraction of carbon monoxide over Thessaloniki, Greece
Conclusions
XCO column abundances in Thessaloniki, generally, show higher daily mean values in the winter (up to 0.12 ppm) due to
anthropogenic sources and lower values in the summer (below 0.08 ppm) as a consequence of the reaction with hydroxyl
radicals (OH). However, high levels of CO, similar to winter maximums, are recorded in August 2021 (daily mean values of
0.12 ppm) capturing the big fires in Athens and Evoia. Sharp increases are also observed in July 2021, with values exceeding
even 0.2 ppm, as a result of fire episodes in close proximity to the measurement site of Thessaloniki. In addition, TROPOMI
observations of XCO also show high values with a mean of over 0.13 ppm, verifying the fire episodes during this time of the
year.
Acknowledgement
This research was co-financed by the Karlsruhe Institute of Technology (KIT—―The Research University in the Helmholtz
Association‖)
References
Hase, F., Frey, M., Blumenstock, T., Groß, J., Kiel, M., Kohlhepp, R., Mengistu Tsidu, G., Schäfer, K., Sha, M. K., and
Orphal, J.: Application of portable FTIR spectrometers for detecting greenhouse gas emissions of the major city Berlin,
Atmos. Meas. Tech., 8, 3059–3068, https://doi.org/10.5194/amt-8-3059-2015, 2015.
170

PROBABLE HEALTH RISK ASSESSMENT OF BTEX CONCENTRATIONS AT AN INTERNATIONAL
AIRPORT IN SOUTH AFRICA
Z. Mahlangu (1), M. Dubazana (1), R. Moolla (1)
(1) School of Geography, Archaeology and environmental Studies, University of the Witwatersrand, Johannesburg, 2006,
South Africa
Presenting author email: [email protected]
Summary
The probable human health risk associated with airport related emissions has been a highlight of many studies in the last two
to three decades. Studies have focused on exposure to volatile organic compounds (VOCs), and specifically a group of
VOCs; viz. benzene, toluene ethyl-benzene and xylenes (BTEX), a group of compounds associated with airport activity. This
is due to their associated adverse health effects. However, little work has been done in Southern Africa to quantify the
potential health risk for populations living near airports.
Introduction
In recent years public health concerns over the health effects of emissions from airport-related activities have risen (Kim et
al., 2015). Globally there has been a rise in the development of legislation that requires airports to conduct air quality, and
health impact studies for each new airport-related development. The presence and predominance of BTEX emissions at an
airport as well as the associated potency and risk warrant an investigation of these potential effects.
Methodology and Results
When conducting the Inhalation Health Risk Assessment, the methodological strategy followed was adapted from the United
States Environmental Protection Agency and World Health Organisation, (US EPA, 2014; World Health Organization,
2016). The methodological design
entailed a three step process to address
the inhalation risk assessment. This
included an air sampling campaign
(using diffusive passive samplers to
monitor ambient BTEX concentrations
seasonally); kriging interpolation
surfaces (in order to predict emissions
across the entire airport); and finally,
quantifying the hazard quotient (HQ) of
non-cancer risk; incremental lifelong
cancer risk (ILCR) and lifetime average
daily dose (LADD) (to represent
exposure of the hypothetical
subpopulation groups that reside near
the airport). The results of the passive
sampling campaign indicated that
BTEXtotal concentrations ranged from
0.7 to 30.59 μg/m-3. The 0-6 month (i.e.
infants) subpopulation group had the
highest LADD, HQ and cancer risk
overall. Furthermore, ILCR levels were above the 1 x10⁻⁶ US EPA guideline for all subpopulation groups. The kriging
results further indicated areas of high BTEXtotal concentrations during autumn and winter.
Conclusions
The highest concentrations of BTEX were over the winter and autumn periods. The results showed that the health risk
assessment were above US EPA guidelines, indicating a probable health risk for all populations. With the prolific increase in
air traffic transportation, the probability of deteriorating air quality and the resultant associated health risk for populations in
and/or around airports may intensify, which is a cause for concern and further investigation.
Acknowledgement
This work was funded by NRF South Africa (Grant Number: TTK150709124599).
References
Kim, B., et. al.: 2015 Understanding Airport Air Quality and Public Health Studies Related to Airports. Transportation
Research Board, Washington, D.C. https://doi.org/10.17226/22119.
US EPA: 2014. Conducting a Human Health Risk Assessment. URL https://www.epa.gov/risk/conducting-human-health-
risk-assessment.
World Health Organization: 2014. WHO Expert Meeting: Methods and tools for assessing the health risks of air pollution
(Meeting Report No. DK-2100).
Figure 1: Isoconcentration Maps of BTEXtotal, Benzene, Toluene, Xylene and
Ethylbenzene.
171
IMPACT ON THE AIR QUALITY FROM THE LARGE WASTE FIRE IN BOTKYRKA, SWEDEN
M. Norman (1), S. Silvergren (1), M. Brydolf (1), Billy Sjövall, C. Johansson (1,2), M. Elmgren (1) and A. Wisthaler (3)
(1) Environment and Health Administration, SLB-analys, Box 8136, 104 20 Stockholm, Sweden; (2) Department of
Environmental Science, Stockholm university, 106 91 Stockholm, Sweden; (3) Department of Chemistry, Oslo
university, Box 1072 Blindern, 0316 Oslo, Norway
Presenting author email: [email protected]
Summary
A large pile of construction waste and garbage (~100 000 tons) was burning for more than two months in Botkyrka outside
Stockholm, Sweden. The plume from the fire caused large problems for the people living nearby. Several different types of
measurements were made in the vicinity of the fire. The measurements included continuous measurement PM10, PM2.5, soot
and NOx, filter sampling and analysis for heavy metals and PAH and a mobile laboratory for short term measurements of
VOC. The plume from the fire caused periodically very high concentrations of PM2.5, soot and benzene. Among the highest
concentrations for short periods that has been observed in Sweden.
Introduction
Large scale garbage or waste fire are an increasing problem in several countries. Locally this can have a tremendous negative
impact on the air quality and can cause both short-term and long terms effect on the health for the people being exposed. The
fires can also cause large emission of various toxic compound that can pollute both nearby waters and soils.
In December 2020 a fire started in large pile of waste in Botkyrka outside Stockholm, Sweden. The pile consisted of
approximate 100 000 tons of unsorted construction material and various waste material. The fire continued for more than two
months before the pile was covered with sand which successfully ended the fire.
Methodology
Several different measurements were done in order study the impact on the air quality in the nearby villages. Two
measurement station were placed at the nearest resident houses which was slightly less than 1 km from the fire. The stations
measured continuously levels of PM10, PM2.5, NOx, NO2 and black carbon. In addition, was one filter sampler place at each
station. The filters were analysed for heavy metals including As, Cd, Pb, Ni and Hg and alternately for PAH including B(a)P.
The stationary measurements were complemented with mobile hand held PM10 and PM2.5 instruments which enabled
gradient studies as well as short measurements close to the fire. For one day was also one mobile laboratory (van) from
University of Oslo measuring around the fire. The mobile laboratory consisted of a proton-transfer-reaction mass
spectrometry, PTR-MS, (Lindinger et al., 1998) which enabled measurement of VOC.
Results and Conclusions
The levels of PM2.5 at the nearby villages of course varied a lot dependent of the current wind direction. But during worst
measured condition 24-hour average of more than 200 µg/m3 of PM2.5 was observed with maximum hourly average of
almost 400 µg/m3. The short-term concentration of PM2.5 was compared to health recommendations based on pollution from
forest fires in California. During periods of time exceeded the PM2.5 levels the limit for all people to stay indoors and
sensitive people to avoid any physical activity. At the same time was high concentrations of soot measured with maximum
daily average of 7.4 µg/m3 and maximum 1-hour average of 22 µg/m3. Almost no elevated concentrations of NOx were
observed in the plume from the fire. The mobile measurement of VOC showed very high concentration of benzene in the
plume. Highest concentration at the houses was almost 100 µg/m3 and at nearby bus stop the concentration exceeded 120
µg/m3 of benzene. Other toxic VOC’s that was found in high concentration was Formaldehyde, Acetaldehyde, Acreolin and
1,3 Butadien. The strong signal of various VOC proved that there were different kinds of plastic burning and that the smoke
from the fire was more toxic that smoke from forest fires.
The chemical analysis of the filter samplers showed elevated concentration of for example Cd, As, Zn, Cr and Pb, but also
PAH’s like benso(a)pyren. Only low concentrations of Ni, Co and particulate Hg was measured.
Acknowledgement
This work was to large extent supported by Botkyrka kommun.
References
Lindinger, W., Hansel, A., and Jordan, A.: On-line monitoring of volatile organic compounds at pptv levels by means of
proton-transfer-reaction mass spectrometry (PTR-MS) medical applications, food control and environmental research, Int. J.
Mass Spectrom., 173, 191–241, https://doi.org/10.1016/S0168-1176(97)00281-4, 1998.
172

HEALTH AND ECONOMIC BURDEN OF SHIP-RELATED PM2.5 IN PORTUGUESE PORT CITIES
R.A.O. Nunes (1), (2), A. C. T. Silva (1), (2), M.C.M. Alvim-Ferraz (1), (2), F.G. Martins (1), (2), S.I.V. Sousa (1), (2)
(1) LEPABE – Laboratory for Process Engineering, Environment, Biotechnology and Energy, Faculty of Engineering,
University of Porto, Rua Dr. Roberto Frias, 4200-465, Porto, Portugal, (2) ALiCE – Associate Laboratory in Chemical
Engineering, Faculty of Engineering, University of Porto, Rua Dr. Roberto Frias, 4200-465 Porto, Portugal
Presenting author email: [email protected]
Summary
This work aims to estimate the years of lost life (YLLs) associated with PM2.5 air pollution by ships from three major ports of
Portugal and the associated external costs for 2014. Local shipping emissions from a previous study were used (Nunes et al.,
2017a). PM2.5 ship-related concentrations were modelled with AERMOD modelling system and the baseline concentrations
were obtained from the monitoring network operated by the Environmental Portuguese Agency for the municipalities where
the ports are located. A log-linear function based on WHO-HRAPIE relative risks (RR) was used to calculate the mortality
over the age of 30 as YLLs which were valued using the value of a life year (VOLY). Results showed that in-port ship-
related emissions are an environmental problem with substantial YLLs increases and costs in the populations living in the
municipalities where the ports are located.
Introduction
The awareness that air pollution is a major environmental risk factor has been growing in recent years and it was recently
reported responsible for one-third of deaths from stroke, lung cancer and heart disease (Dhimal et al., 2021). Shipping has
been recognised as responsible for thousands of premature deaths, years of life lost and other health issues, especially close to
the port areas. Emissions of in-port ships account for only a few per cent of the global emissions related to shipping, despite
this they can have an important impact on local air quality in port cities due to additional emissions from manoeuvring and
hotelling activities, resulting in health impairment. Local studies concerning the health impact and monetary evaluation of
ship-related emissions are still scarce. Thus, the aim of the present study was to evaluate the mortality as number of years of
lost life (YLL) associated with PM2.5 air pollution by ships from three major ports of Portugal and the associated external
costs.
Methodology and Results
To determine the effects of long-term PM2.5 ship-related air pollution, in-port emissions for Leixões, Setúbal and Sines ports
were obtained from a previous study (Nunes et al., 2017). The AERMOD modelling system was used to study the dispersion
modelling of PM2.5 in-port emissions as an area source. Annual average concentrations of PM2.5 were calculated based on
hourly concentrations of PM2.5 for Matosinhos (where Leixões port is located), Setúbal and Sines municipalities, obtained
from the QualAr Monitoring Network operated by the Environmental Portuguese Agency. Annual average concentrations of
PM2.5 were assigned to each parish of each municipality, applying the inverse distance weighting method. Health impacts and
costs were calculated for two scenarios: (i) a baseline scenario (B-SCN) considering the concentrations from the monitoring
network; and (ii) a non-shipping scenario (WTS-SCN) resulting of the difference between the B-SCN concentrations and the
ship-related concentrations performed with AERMOD model. Log-linear functions based on WHO-HRAPIE assuming the
relative risk (RR) of 1.062 per 10 μg m-3 (95% CI 1.040–1.083) for the annual average PM2.5 concentrations for all-cause
(natural) mortality in ages above 30 years were used to estimate the excess of mortality as number of YLLs for each parish.
YLLs were calculated using WHO life-tables methodology assuming that the number of YLLs was equal to life expectancy
at age of death. Costs associated with YLLs were estimated as the product of the excess burden of disease and its unit health
cost value (VOLY valuation). PM2.5 ship-related in-port emissions caused 315 (95% CI: 288–341) YLLs corresponding to a
cost of around 10 million € for Matosinhos, 305 (95% CI: 266–342) YLLs corresponding to a cost of around 10 million € for
Setúbal, and 58 (95% CI: 54–61) YLLs corresponding to a cost of 2 million € for Sines. Considering the Matosinhos, Setubal
and Sines municipal council budget for 2014, the costs calculated in the present study would represent almost 10%, 8% and
6% of the total, respectively.
Conclusions
Results show that PM2.5 in-port emissions increased the number of YLLs on the three Portuguese port cities studied for 2014.
Considering the Matosinhos, Setubal and Sines municipal council budget for 2014, the external costs associated with the
YLLs calculated in the present study would represent almost 10%, 8% and 6% of the total, respectively, which confirms the
impact of the in-port shipping emissions for the populations living close to these port cities.
Acknowledgments
This work was financially supported by: LA/P/0045/2020 (ALiCE) and UIDB/00511/2020 - UIDP/00511/2020 (LEPABE)
funded by national funds through FCT/MCTES (PIDDAC) and project EMISSHIP (PTDC/CTA-AMB/32201/2017), funded
by FCT/MCTES. Rafael A.O. Nunes thanks the Portuguese Foundation for Science and Technology (FCT) for the individual
research grant SFRH/BD/146159/2019.
References
Dhimal, M., Chirico, F., Bista, B., Sharma, S., Chalise, B., Dhimal, M.L., Ilesanmi, O.S., Trucillo, P., Sofia, D., 2021. Impact
of air pollution on global burden of disease in 2019. Processes 9.
Nunes, R.A.O., Alvim-Ferraz, M.C.M., Martins, F.G., Sousa, S.I.V., 2017. Assessment of shipping emissions on four ports of
Portugal. Environ. Pollut. 231.
173
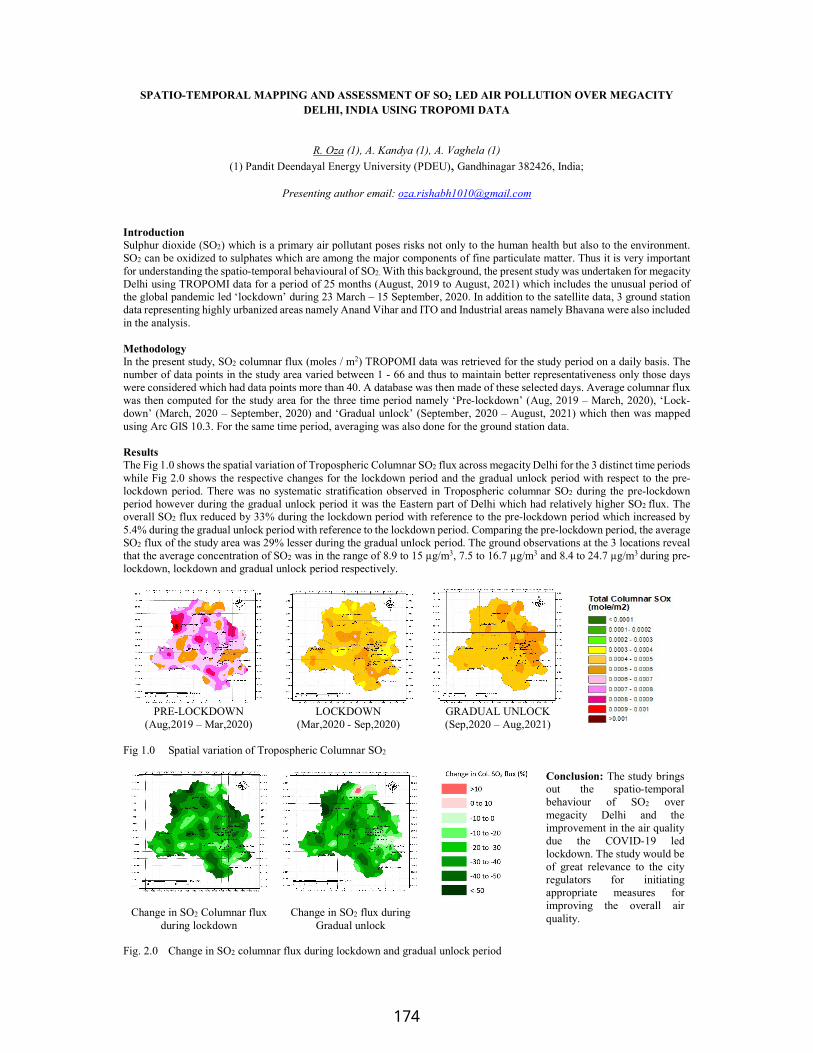
SPATIO-TEMPORAL MAPPING AND ASSESSMENT OF SO2 LED AIR POLLUTION OVER MEGACITY DELHI, INDIA USING TROPOMI DATA
R. Oza (1), A. Kandya (1), A. Vaghela (1)
(1) Pandit Deendayal Energy University (PDEU), Gandhinagar 382426, India;
Presenting author email: [email protected] Introduction Sulphur dioxide (SO2) which is a primary air pollutant poses risks not only to the human health but also to the environment. SO2 can be oxidized to sulphates which are among the major components of fine particulate matter. Thus it is very important for understanding the spatio-temporal behavioural of SO2. With this background, the present study was undertaken for megacity Delhi using TROPOMI data for a period of 25 months (August, 2019 to August, 2021) which includes the unusual period of the global pandemic led ‘lockdown’ during 23 March – 15 September, 2020. In addition to the satellite data, 3 ground station data representing highly urbanized areas namely Anand Vihar and ITO and Industrial areas namely Bhavana were also included in the analysis. Methodology In the present study, SO2 columnar flux (moles / m2) TROPOMI data was retrieved for the study period on a daily basis. The number of data points in the study area varied between 1 - 66 and thus to maintain better representativeness only those days were considered which had data points more than 40. A database was then made of these selected days. Average columnar flux was then computed for the study area for the three time period namely ‘Pre-lockdown’ (Aug, 2019 – March, 2020), ‘Lock-down’ (March, 2020 – September, 2020) and ‘Gradual unlock’ (September, 2020 – August, 2021) which then was mapped using Arc GIS 10.3. For the same time period, averaging was also done for the ground station data. Results The Fig 1.0 shows the spatial variation of Tropospheric Columnar SO2 flux across megacity Delhi for the 3 distinct time periods while Fig 2.0 shows the respective changes for the lockdown period and the gradual unlock period with respect to the pre-lockdown period. There was no systematic stratification observed in Tropospheric columnar SO2 during the pre-lockdown period however during the gradual unlock period it was the Eastern part of Delhi which had relatively higher SO2 flux. The overall SO2 flux reduced by 33% during the lockdown period with reference to the pre-lockdown period which increased by 5.4% during the gradual unlock period with reference to the lockdown period. Comparing the pre-lockdown period, the average SO2 flux of the study area was 29% lesser during the gradual unlock period. The ground observations at the 3 locations reveal that the average concentration of SO2 was in the range of 8.9 to 15 µg/m3, 7.5 to 16.7 µg/m3 and 8.4 to 24.7 µg/m3 during pre-lockdown, lockdown and gradual unlock period respectively.
PRE-LOCKDOWN
(Aug,2019 – Mar,2020) LOCKDOWN
(Mar,2020 - Sep,2020) GRADUAL UNLOCK (Sep,2020 – Aug,2021)
Fig 1.0 Spatial variation of Tropospheric Columnar SO2
Conclusion: The study brings out the spatio-temporal behaviour of SO2 over megacity Delhi and the improvement in the air quality due the COVID-19 led lockdown. The study would be of great relevance to the city regulators for initiating appropriate measures for improving the overall air quality. Change in SO2 Columnar flux
during lockdown Change in SO2 flux during
Gradual unlock
Fig. 2.0 Change in SO2 columnar flux during lockdown and gradual unlock period
174

INFLUENCE OF THE STARTUP TIME FROM INITIAL CONDITIONS IN MODELING VOLCANIC ASH DISPERSION IN ECUADOR
R. Parra (1, 2), D. Andrade (2)
(1) Instituto de Simulación Computacional (ISC-USFQ), (2) Colegio de Ciencias e Ingenierías, Universidad San Francisco de
Quito, Ecuador Presenting author email: [email protected]
Summary We modeled three historical Vulcanian eruptions at the Tungurahua using different startup times from Initial Conditions (IC). Results suggested at least one day as startup time and a maximum of three days as extended time from IC. Introduction Forecasting of volcanic ash dispersion is a priority in Ecuador. For this purpose, Atmospheric Transport Models (ATMs) are pivotal. One of the components of an ATM is the meteorological model, which describes the state and evolution of the atmosphere, which disperses volcanic ash. ATMs find an approximate numerical solution to the full atmospheric governing equations. Due to potential errors in the Initial Conditions (IC), these models can provide poor results during the first hours of simulations. Also, due to the nonlinearity of atmospheric motions, the forecast skill of ATMs extends to only some days from IC. Operatively, it is necessary to define both a minimum startup period and the maximum number of extended days, to get valuable performances in modeling the dispersion of volcanic ash. Methodology and Results We simulated the meteorology over Ecuador, using the Weather Research & Forecasting (WRF4.0.3) model with a spatial resolution of 4 km and different startup times. The meteorological outputs were ingested into the FALL3D V7.1.4 model to simulate ash dispersion from three Vulcanian eruptions of the Tungurahua volcano occurred on 16-Dec-2012, 14-Jul-2013 (Fig. 1), and 01-Feb-2014 (Parra et al., 2016). The computed ash fallout quantities were compared with records from ashmeters. For the eruption on 14-Jul-2013, the linear correlation coefficient (R2) values varied between 0.25 to 0.72 (Fig. 1d), and the corresponding maps were categorized into the same group (Fig. 1e).Also, modeled ash fallout maps were compared to classify them by groups through a hierarchical cluster approach. For the three eruptions, the best results (higher R2 values) were obtained for startup times between 24 and 70 h,
(a)
(b)
(c)
(d)
(e)
Fig.1 Eruption on 14-Jul-2013. Modeled ash fallout maps for selected startup times: (a) 24 h, (b) 48 h, (c) 108 h. (d) R2
values for different startup times. (e) Cluster dendogram Conclusions For modeling volcanic ash dispersion in Ecuador, at least one day as startup time is advisable, and a maximum of three days as extended time from IC. Acknowledgement This research is part of the project “Emisiones y Contaminación Atmosférica en el Ecuador 2021-2022”. References Parra, R., Bernard, B., Narváez, D., Le Pennec, J.-L., Hasselle, N., Folch, A., 2016. Eruption Source Parameters for forecasting ash dispersion and deposition from vulcanian eruptions at Tungurahua volcano: Insights from field data from the July 2013 eruption. Journal of Volcanology and Geothermal Research 309, 1–13. doi:10.1016/j.jvolgeores.2015.11.001
175

UPDATED BLACK CARBON EMISSIONS ESTIMATE FROM FLARING IN RUSSIA IN 2012-2020
V.-V. Paunu (1), K. Böttcher (1), M. Zhizhin (2), N. Karvosenoja (1), K. Kupiainen (3), M. Savolahti (1), A. Matveev (4), S.
Väätäinen (5), H. Lamberg (5)
(1) Finnish Environment Institute SYKE, Latokartanonkaari 11, 00790 Helsinki, Finland; (2) Colorado School of Mines,
USA; (3) Ministry of the Environment (YM), Government, Finland; (4) National University of Oil and Gas “Gubkin
University”, Moscow, Russia; (5) University of Eastern Finland, Finland
Presenting author email: [email protected]
Summary
We calculated an updated estimate for black carbon (BC) emissions from flaring in Russia for 2012-2020. The emissions
vary from year to year, but emissions per flared gas volume have gone down throughout the study period. Major part of the
emissions occurred in flares in oil fields. In recent years, flared gas volumes and BC emissions have mainly been increasing
in the oil and gas condensate fields, while for other fields they have remained stagnant.
Introduction
Gas flaring is a major source of black carbon (BC) emissions. Particularly in the Arctic, where flaring accounts for one to two
thirds of the BC emissions (Stohl 2015). The Arctic is especially sensitive to the warming impacts of BC. Major part of
flaring in or close to the Arctic occurs in Russia. In our recent paper we presented BC emissions from Russian flaring for
2012-2017 (Böttcher et al., 2021). Here, we update the estimates with latest satellite observation data and extend the
estimates up to 2020.
Methodology and Results
The updated emissions were calculated using the latest satellite-observed
flared gas volume from VIIRS Nightfire data (Zhizhin et al., 2021).
Emission factors were based on heating value and BC emission
relationship developed by Conrad and Johnson (2017). We used four
separate gas compositions, and, therefore, heating values based on where
the flare was located: three field types (oil, oil and gas, oil and gas
condensate), and downstream flares (e.g. refineries). The detailed method
description can be found in Böttcher et al. (2021). The calculated BC
emissions are presented in Fig 1. Compared to the estimates in Böttcher et
al., the mean emissions for 2012-2017 were 0.5% lower in the update
(68.3 vs 68.0 Gg/year). Yearly the difference ranged from 2.5% lower (for
2012) to 0.7% higher (for 2017) compared to the Böttcher et al. estimates,
i.e., the updated emissions were in line with the previous estimates. In the
Böttcher et al. paper we concluded that there was a slight decreasing trend
in the emissions for 2012-2017. The updated emissions show that when the latest years are included, no clear trend can be
seen. The flared gas volumes have been increasing every year since 2017. The emissions have increased from 2017, but only
slightly from 2018 to 2020. The magnitude of the emissions followed the flared gas volumes, but emissions per unit gas
volume decreased over time. Oil fields remained the main field type for the emissions with an 81% share on average. In oil
and gas condensate fields (average share 11%) the flared gas volume and emissions had an increasing trend. The uncertainty
in the emission estimates remained similar to Böttcher et al., ranging from 21 Gg/year to 171 Gg/year for the average
emissions. There were new flares identified in regions close to the Arctic, i.e. Yamalo-Nenets and Nenets. In Yamalo-Nenets
the emissions had an increasing trend. In Nenets, the emissions were decreasing onwards from peak year 2016. Of all
regions, Orenburg had the highest increase in emissions from 2017 to 2020.
Conclusions
Our updated Russian flaring BC emission timeline shows that the emissions have increased since 2017, but stagnated in the
last few years. In order to reduce the uncertainty in the calculated emission, more measured flared gas compositions from
different fields should be applied next. This could also enhance the regional details in the results.
Acknowledgement
This work was supported by Business Finland (BC Footprint; 1462/31/2019) and Academy of Finland (NABCEA 296644;
BBrCAC, 342579). We are grateful to Brad Conrad and Matthew Johnson (Carleton University, Ottawa, Canada) and Carbon
Limits (Norway) for their help with emission factors, gas compositions and heating values.
References
Böttcher, K., Paunu, V.-V., Kupiainen, K., Zhizhin, M., Matveev, A., Savolahti, M., Klimont, Z., Väätäinen, S., Lamberg, H.,
Karvosenoja, N., 2021. Black carbon emissions from flaring in Russia in the period 2012-2017. Atmos Environ. 118390.
Conrad, B.M., Johnson, M.R., 2017. Field Measurements of Black Carbon Yields from Gas Flaring. Environ. Sci. Technol.
51, 1893–1900.
Stohl, A. et al., 2015. Evaluating the climate and air quality impacts of short-lived pollutants. Atmos. Chem. Phys. 15,
10529–10566.
Zhizhin, M., Matveev, A., Ghosh, T., Hsu, F.-C., Howells, M., Elvidge, C., 2021. Measuring Gas Flaring in Russia with
Multispectral VIIRS Nightfire. Remote Sensing 13, 3078.
Fig.1 Russian flaring BC emissions and flared
gas volumes.
176
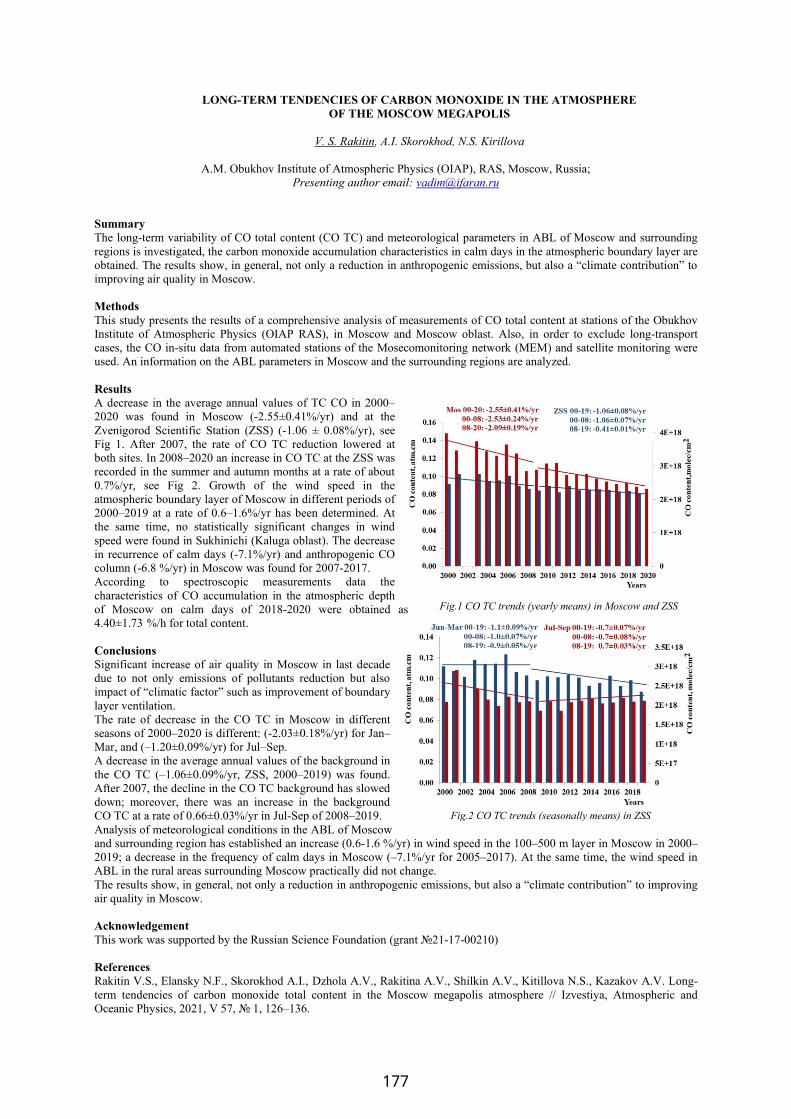
LONG-TERM TENDENCIES OF CARBON MONOXIDE IN THE ATMOSPHERE
OF THE MOSCOW MEGAPOLIS
V. S. Rakitin, A.I. Skorokhod, N.S. Kirillova
A.M. Obukhov Institute of Atmospheric Physics (OIAP), RAS, Moscow, Russia;
Presenting author email: [email protected]
Summary
The long-term variability of CO total content (CO TC) and meteorological parameters in ABL of Moscow and surrounding
regions is investigated, the carbon monoxide accumulation characteristics in calm days in the atmospheric boundary layer are
obtained. The results show, in general, not only a reduction in anthropogenic emissions, but also a “climate contribution” to
improving air quality in Moscow.
Methods
This study presents the results of a comprehensive analysis of measurements of CO total content at stations of the Obukhov
Institute of Atmospheric Physics (OIAP RAS), in Moscow and Moscow oblast. Also, in order to exclude long-transport
cases, the CO in-situ data from automated stations of the Mosecomonitoring network (MEM) and satellite monitoring were
used. An information on the ABL parameters in Moscow and the surrounding regions are analyzed.
Results
A decrease in the average annual values of TC CO in 2000–
2020 was found in Moscow (-2.55±0.41%/yr) and at the
Zvenigorod Scientific Station (ZSS) (-1.06 ± 0.08%/yr), see
Fig 1. After 2007, the rate of CO TC reduction lowered at
both sites. In 2008–2020 an increase in CO TC at the ZSS was
recorded in the summer and autumn months at a rate of about
0.7%/yr, see Fig 2. Growth of the wind speed in the
atmospheric boundary layer of Moscow in different periods of
2000–2019 at a rate of 0.6–1.6%/yr has been determined. At
the same time, no statistically significant changes in wind
speed were found in Sukhinichi (Kaluga oblast). The decrease
in recurrence of calm days (-7.1%/yr) and anthropogenic CO
column (-6.8 %/yr) in Moscow was found for 2007-2017.
According to spectroscopic measurements data the
characteristics of CO accumulation in the atmospheric depth
of Moscow on calm days of 2018-2020 were obtained as
4.40±1.73 %/h for total content.
Conclusions
Significant increase of air quality in Moscow in last decade
due to not only emissions of pollutants reduction but also
impact of “climatic factor” such as improvement of boundary
layer ventilation.
The rate of decrease in the CO TC in Moscow in different
seasons of 2000–2020 is different: (-2.03±0.18%/yr) for Jan–
Mar, and (–1.20±0.09%/yr) for Jul–Sep.
A decrease in the average annual values of the background in
the CO TC (–1.06±0.09%/yr, ZSS, 2000–2019) was found.
After 2007, the decline in the CO TC background has slowed
down; moreover, there was an increase in the background
CO TC at a rate of 0.66±0.03%/yr in Jul-Sep of 2008–2019.
Analysis of meteorological conditions in the ABL of Moscow
and surrounding region has established an increase (0.6-1.6 %/yr) in wind speed in the 100–500 m layer in Moscow in 2000–
2019; a decrease in the frequency of calm days in Moscow (–7.1%/yr for 2005–2017). At the same time, the wind speed in
ABL in the rural areas surrounding Moscow practically did not change.
The results show, in general, not only a reduction in anthropogenic emissions, but also a “climate contribution” to improving
air quality in Moscow.
Acknowledgement
This work was supported by the Russian Science Foundation (grant №21-17-00210)
References
Rakitin V.S., Elansky N.F., Skorokhod A.I., Dzhola A.V., Rakitina A.V., Shilkin A.V., Kitillova N.S., Kazakov A.V. Long-
term tendencies of carbon monoxide total content in the Moscow megapolis atmosphere // Izvestiya, Atmospheric and
Oceanic Physics, 2021, V 57, № 1, 126–136.
Fig.1 CO TC trends (yearly means) in Moscow and ZSS
Fig.2 CO TC trends (seasonally means) in ZSS
177
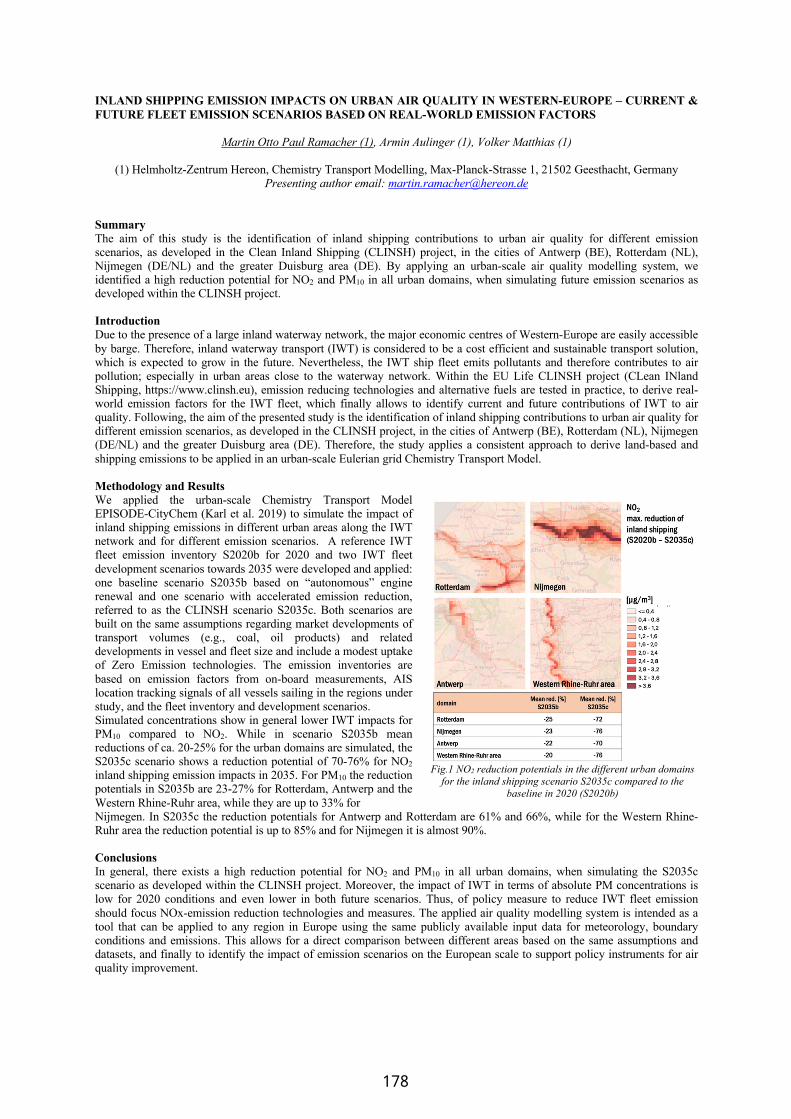
INLAND SHIPPING EMISSION IMPACTS ON URBAN AIR QUALITY IN WESTERN-EUROPE – CURRENT & FUTURE FLEET EMISSION SCENARIOS BASED ON REAL-WORLD EMISSION FACTORS
Martin Otto Paul Ramacher (1), Armin Aulinger (1), Volker Matthias (1)
(1) Helmholtz-Zentrum Hereon, Chemistry Transport Modelling, Max-Planck-Strasse 1, 21502 Geesthacht, Germany Presenting author email: [email protected]
Summary The aim of this study is the identification of inland shipping contributions to urban air quality for different emission scenarios, as developed in the Clean Inland Shipping (CLINSH) project, in the cities of Antwerp (BE), Rotterdam (NL), Nijmegen (DE/NL) and the greater Duisburg area (DE). By applying an urban-scale air quality modelling system, we identified a high reduction potential for NO2 and PM10 in all urban domains, when simulating future emission scenarios as developed within the CLINSH project. Introduction Due to the presence of a large inland waterway network, the major economic centres of Western-Europe are easily accessible by barge. Therefore, inland waterway transport (IWT) is considered to be a cost efficient and sustainable transport solution, which is expected to grow in the future. Nevertheless, the IWT ship fleet emits pollutants and therefore contributes to air pollution; especially in urban areas close to the waterway network. Within the EU Life CLINSH project (CLean INland Shipping, https://www.clinsh.eu), emission reducing technologies and alternative fuels are tested in practice, to derive real-world emission factors for the IWT fleet, which finally allows to identify current and future contributions of IWT to air quality. Following, the aim of the presented study is the identification of inland shipping contributions to urban air quality for different emission scenarios, as developed in the CLINSH project, in the cities of Antwerp (BE), Rotterdam (NL), Nijmegen (DE/NL) and the greater Duisburg area (DE). Therefore, the study applies a consistent approach to derive land-based and shipping emissions to be applied in an urban-scale Eulerian grid Chemistry Transport Model. Methodology and Results We applied the urban-scale Chemistry Transport Model EPISODE-CityChem (Karl et al. 2019) to simulate the impact of inland shipping emissions in different urban areas along the IWT network and for different emission scenarios. A reference IWT fleet emission inventory S2020b for 2020 and two IWT fleet development scenarios towards 2035 were developed and applied: one baseline scenario S2035b based on “autonomous” engine renewal and one scenario with accelerated emission reduction, referred to as the CLINSH scenario S2035c. Both scenarios are built on the same assumptions regarding market developments of transport volumes (e.g., coal, oil products) and related developments in vessel and fleet size and include a modest uptake of Zero Emission technologies. The emission inventories are based on emission factors from on-board measurements, AIS location tracking signals of all vessels sailing in the regions under study, and the fleet inventory and development scenarios. Simulated concentrations show in general lower IWT impacts for PM10 compared to NO2. While in scenario S2035b mean reductions of ca. 20-25% for the urban domains are simulated, the S2035c scenario shows a reduction potential of 70-76% for NO2 inland shipping emission impacts in 2035. For PM10 the reduction potentials in S2035b are 23-27% for Rotterdam, Antwerp and the Western Rhine-Ruhr area, while they are up to 33% for
Fig.1 NO2 reduction potentials in the different urban domains
for the inland shipping scenario S2035c compared to the baseline in 2020 (S2020b)
Nijmegen. In S2035c the reduction potentials for Antwerp and Rotterdam are 61% and 66%, while for the Western Rhine-Ruhr area the reduction potential is up to 85% and for Nijmegen it is almost 90%. Conclusions In general, there exists a high reduction potential for NO2 and PM10 in all urban domains, when simulating the S2035c scenario as developed within the CLINSH project. Moreover, the impact of IWT in terms of absolute PM concentrations is low for 2020 conditions and even lower in both future scenarios. Thus, of policy measure to reduce IWT fleet emission should focus NOx-emission reduction technologies and measures. The applied air quality modelling system is intended as a tool that can be applied to any region in Europe using the same publicly available input data for meteorology, boundary conditions and emissions. This allows for a direct comparison between different areas based on the same assumptions and datasets, and finally to identify the impact of emission scenarios on the European scale to support policy instruments for air quality improvement.
178

IMPACT OF WIND SPEED IN GAS DEPOSITION ON SEA SURFACE FROM SHIPPING
N. Rapkos, F. Barmpas, L. Ntziachristos
Laboratory of Heat Transfer and Environmental Engineering (LHTEE), Aristotle University of Thessaloniki
Presenting author email: [email protected]
Summary
This study aims to understand the effect of wind speed values in plume deposition on sea surface level from container ships
(Figure 1). Micro-scale modeling used for simulating gas dispersion, considering provides acceptable results. Ship funnel is
set as the pollution source and ship geometry is the parameter considered as a flow obstacle. A parametric analysis
demonstrates the impact of turbulent phenomena, since increment of wind speed favors downward plume dispersion (e.g
Badeke and Matthias, 2021). Solution concern dimensionless data to be qualitatively perceived.
Introduction
Effects from shipping in air and water quality is a part of science that is still under research. Regulations from international
and local organizations force researchers and companies reach pollution limits for different gas species. Deficient literature
constitutes this parametric analysis a remarkable starting point for further research from air and water modeling teams.
Quantification of gas deposition for container ship that depends on wind speed is notable aspect of interest.
Methodology and Results
Micro-scale modelling was used for simulating plume
dispersion from a container ship. Specifically, OpenFOAM,
an open-source Computational Fluid Dynamics code that
models flow and gas dispersion phenomena, used as tool for
simulations. Pollutant transports in the computational domain
and its concentration input defined as a dimensionless value.
This allows the choice to consider any gaseous pollutant
(SO2, CO2, HCs , etc.). Wind speed is a parameter that
increases downward dispersion of plume as a result of the
vortices intensity due to ship structure. This fact is a criterion
that downward dispersion result increment of gas
concentration on the sea surface. Thus, knowledge from air
quality can be introduced to water quality since gas trace
reaches air-water interface and enters sea.
Conclusions
Data from this work are useful for both air and water quality since pollution from shipping activities occupies many sectors.
Gas quantification on sea surface from container ships that relates to wind speed creates knowledge that can be used for any
type of ship.
References
Badeke, R., Matthias, V., and Grawe, D.: Parameterizing the vertical downward dispersion of ship exhaust gas in the near
field, Atmos. Chem. Phys., 21, 5935–5951
Figure 1: Gas Deposition Visualization
179

CASE STUDY: QUANTIFYING COARSE DUST ABATEMENT MEASURES IMPLEMENTED AT JURA
CEMENT FACTORY (SWITZERLAND) USING PASSIVE SAMPLERS
Dr. J. Rausch (1), Dr. D. Jaramillo Vogel (1), S. Bryner (2)
(1) Particle Vision Ltd., Fribourg, Switzerland; (2) Jura Cement SA, Wildegg, Switzerland,
Presenting author email: [email protected]
Summary
Passive samplers were used at the Jura Cement Factory (JCF) quarry between 2016-2020 to verify and quantify the
effectiveness of implemented dust mitigation actions. Samples of the PM80-2.5 fraction were collected with the SIGMA-2
passive sampler on carbon-pad surfaces. Subsequently, single particles were analysed using automated SEM/EDX coupled
with a newly developed machine learning classifier to differentiate and quantify the dust emissions/immissions at different
locations, within and around the quarry, and in particularly the particles stemming from the quarrying activities. The
measured annual mean PM80-2.5 concentration originating from the quarry in 2016 (i.e. before implementation of dust
abatement measures) was 35 µg/m3, while in 2020 concentrations dropped to 13.8 µg/m3 after dust abatement measures have
been progressively applied. This corresponds to a decline of 61% compared to the initial situation preceding the
implementation of the dust control measures 4 years earlier.
Introduction
The link between increased particle pollution and health issues has been well documented. To quantify the effectiveness of
implemented dust reduction measures, the need for a fast, simple, and cost-effective method appears. This case study
elaborates an alternative way of identifying and quantifying PM80-2.5 pollution not only as a total concentration but with a
source-differentiation approach applicable for various environmental questions and industries.
Methodology and Results
Carbon pad substrates were exposed for 14-days periods within the SIGMA-2 passive samplers (VDI2119:2013) and
subsequently analysed by an automated SEM/EDX single particle technique. An area of 1 – 6 mm2 of each exposed sample
was analysed with the Zeiss Gemini 300 Field Emission Gun – SEM equipped with an Oxford X-MAX EDX detector (80 mm2
window), and the particle analysis software Aztec Feature. The newly developed machine learning based particle
classification method (Rausch et al., 2022) used for this case study is highly efficient in identifying the particles of different
sources since it makes use of a powerful combination of morpho-textural-chemical information of each analysed particle.
Results
The applied source-differentiation approach evidences that besides the limestone, marl and siliceous particles stemming from
the quarry, natural (pollen and geogenic dust) and anthropogenic particles (mostly from road traffic, i.e. tire, brake and road
abrasion) are also present. The influence of these other particle types (sources) is strongly season-dependent and accounted
for between 19 wt.% (Per. 15) and 66 wt.% (Per. 20) of the total coarse dust in the campaign 2020. It was also observed that
the relative and absolute proportion of quarry-related particles can vary greatly throughout the year (Figure 1, left side). The
annual mean value of PM80-2.5, which can be attributed to the quarrying activities at the measuring site in 2020, was 13.8
µg/m3. Thus, compared to the mean value of quarry-related coarse PM emissions of 35 µg/m3 from 2016, a decrease of 61%
was recorded (Figure 1, right).
Figure 1: Left: PM80-2.5 concentration trend showing the sum of mineral particles stemming from the quarry vs. the sum of
all other particles at the measuring site during 2020. Right: annual mean concentrations of quarry particles (PM80-2.5) in
2016-2020 and the corresponding concentration decrease in % compared to 2016.
Conclusions
Between the years 2016-2020, dust-abatement measures were progressively implemented, which are interpreted to be largely
responsible for the obtained dust reduction. Owing the morpho-textural-chemical particle characterization, and source-
differentiation approach applied here, the influence of the quarry activities on coarse dust emissions could be quantified,
allowing a verification and quantification of the effectiveness of the implemented dust mitigation measures over time.
References
Rausch J, Jaramillo-Vogel D, Perseguers S, Schnidrig N, Grobéty B, Yajan P., 2022. Automated identification and
quantification of tire wear particles (TWP) in airborne dust: SEM/EDX single particle analysis coupled to a machine learning
classifier. Science of The Total Environment. 10;803:149832.
VDI 2119, 2013. Ambient air measurements sampling of atmospheric particles > 2.5 μm on an acceptor surface using the
Sigma-2 passive sampler. Characterization by Optical Microscopy and Calculation of Number Settling Rate and Mass
Concentration. ICS:13.040.01. Beuth Verlag, Berlin.
180
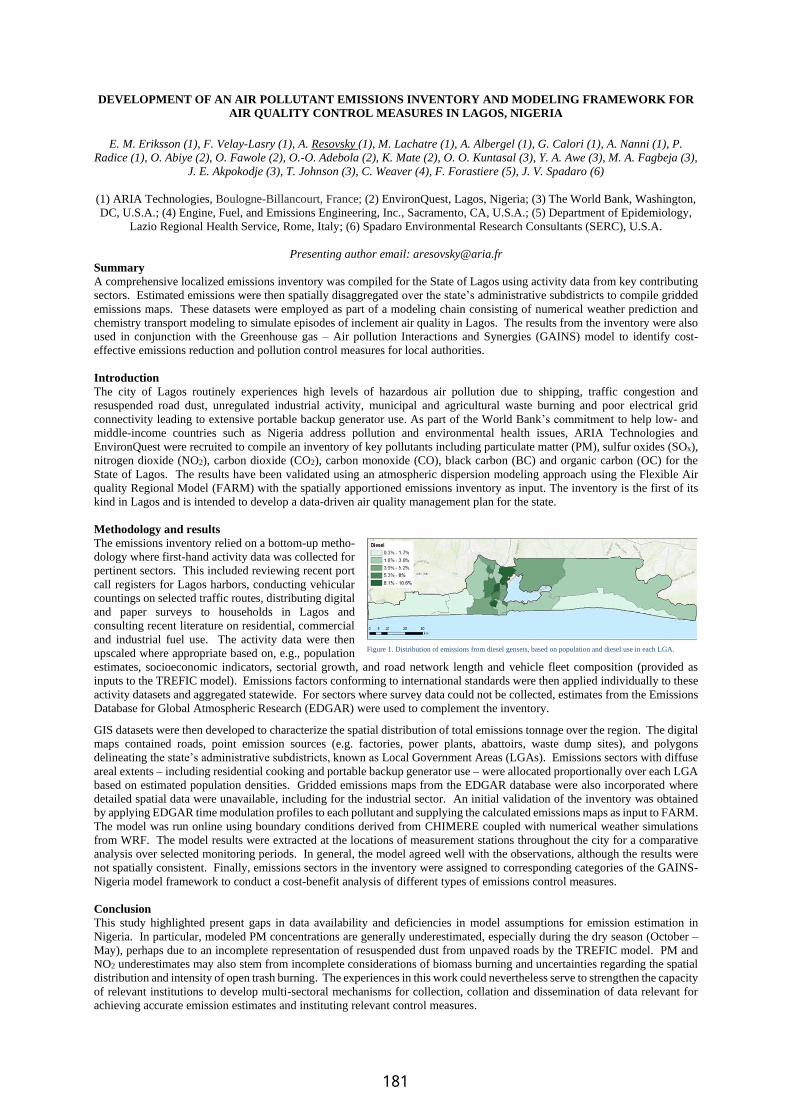
DEVELOPMENT OF AN AIR POLLUTANT EMISSIONS INVENTORY AND MODELING FRAMEWORK FOR
AIR QUALITY CONTROL MEASURES IN LAGOS, NIGERIA
E. M. Eriksson (1), F. Velay-Lasry (1), A. Resovsky (1), M. Lachatre (1), A. Albergel (1), G. Calori (1), A. Nanni (1), P.
Radice (1), O. Abiye (2), O. Fawole (2), O.-O. Adebola (2), K. Mate (2), O. O. Kuntasal (3), Y. A. Awe (3), M. A. Fagbeja (3),
J. E. Akpokodje (3), T. Johnson (3), C. Weaver (4), F. Forastiere (5), J. V. Spadaro (6)
(1) ARIA Technologies, Boulogne-Billancourt, France; (2) EnvironQuest, Lagos, Nigeria; (3) The World Bank, Washington,
DC, U.S.A.; (4) Engine, Fuel, and Emissions Engineering, Inc., Sacramento, CA, U.S.A.; (5) Department of Epidemiology,
Lazio Regional Health Service, Rome, Italy; (6) Spadaro Environmental Research Consultants (SERC), U.S.A.
Presenting author email: [email protected]
Summary
A comprehensive localized emissions inventory was compiled for the State of Lagos using activity data from key contributing
sectors. Estimated emissions were then spatially disaggregated over the state’s administrative subdistricts to compile gridded
emissions maps. These datasets were employed as part of a modeling chain consisting of numerical weather prediction and
chemistry transport modeling to simulate episodes of inclement air quality in Lagos. The results from the inventory were also
used in conjunction with the Greenhouse gas – Air pollution Interactions and Synergies (GAINS) model to identify cost-
effective emissions reduction and pollution control measures for local authorities.
Introduction
The city of Lagos routinely experiences high levels of hazardous air pollution due to shipping, traffic congestion and
resuspended road dust, unregulated industrial activity, municipal and agricultural waste burning and poor electrical grid
connectivity leading to extensive portable backup generator use. As part of the World Bank’s commitment to help low- and
middle-income countries such as Nigeria address pollution and environmental health issues, ARIA Technologies and
EnvironQuest were recruited to compile an inventory of key pollutants including particulate matter (PM), sulfur oxides (SOx),
nitrogen dioxide (NO2), carbon dioxide (CO2), carbon monoxide (CO), black carbon (BC) and organic carbon (OC) for the
State of Lagos. The results have been validated using an atmospheric dispersion modeling approach using the Flexible Air
quality Regional Model (FARM) with the spatially apportioned emissions inventory as input. The inventory is the first of its
kind in Lagos and is intended to develop a data-driven air quality management plan for the state.
Methodology and results
The emissions inventory relied on a bottom-up metho-
dology where first-hand activity data was collected for
pertinent sectors. This included reviewing recent port
call registers for Lagos harbors, conducting vehicular
countings on selected traffic routes, distributing digital
and paper surveys to households in Lagos and
consulting recent literature on residential, commercial
and industrial fuel use. The activity data were then
upscaled where appropriate based on, e.g., population
estimates, socioeconomic indicators, sectorial growth, and road network length and vehicle fleet composition (provided as
inputs to the TREFIC model). Emissions factors conforming to international standards were then applied individually to these
activity datasets and aggregated statewide. For sectors where survey data could not be collected, estimates from the Emissions
Database for Global Atmospheric Research (EDGAR) were used to complement the inventory.
GIS datasets were then developed to characterize the spatial distribution of total emissions tonnage over the region. The digital
maps contained roads, point emission sources (e.g. factories, power plants, abattoirs, waste dump sites), and polygons
delineating the state’s administrative subdistricts, known as Local Government Areas (LGAs). Emissions sectors with diffuse
areal extents – including residential cooking and portable backup generator use – were allocated proportionally over each LGA
based on estimated population densities. Gridded emissions maps from the EDGAR database were also incorporated where
detailed spatial data were unavailable, including for the industrial sector. An initial validation of the inventory was obtained
by applying EDGAR time modulation profiles to each pollutant and supplying the calculated emissions maps as input to FARM.
The model was run online using boundary conditions derived from CHIMERE coupled with numerical weather simulations
from WRF. The model results were extracted at the locations of measurement stations throughout the city for a comparative
analysis over selected monitoring periods. In general, the model agreed well with the observations, although the results were
not spatially consistent. Finally, emissions sectors in the inventory were assigned to corresponding categories of the GAINS-
Nigeria model framework to conduct a cost-benefit analysis of different types of emissions control measures.
Conclusion
This study highlighted present gaps in data availability and deficiencies in model assumptions for emission estimation in
Nigeria. In particular, modeled PM concentrations are generally underestimated, especially during the dry season (October –
May), perhaps due to an incomplete representation of resuspended dust from unpaved roads by the TREFIC model. PM and
NO2 underestimates may also stem from incomplete considerations of biomass burning and uncertainties regarding the spatial
distribution and intensity of open trash burning. The experiences in this work could nevertheless serve to strengthen the capacity
of relevant institutions to develop multi-sectoral mechanisms for collection, collation and dissemination of data relevant for
achieving accurate emission estimates and instituting relevant control measures.
Figure 1. Distribution of emissions from diesel gensets, based on population and diesel use in each LGA.
181

SELF-REPORTED HEALTH SYMPTOMS AND OCCUPANTS’ COMFORT IN OFFICES AT WESTERN MACEDONIA AREA, GREECE DURING THE PANDEMIC PERIOD
I. A. Sakellaris (1,2), T. Xenofontos (1), I. Papadopoulos (1), D. Saraga (2), E. Tolis (1), G. Panaras (1) and J. G. Bartzis (1)
(1) University of Western Macedonia, Dep. of Mechanical Engineering, Environmental Technology Laboratory, Bakola & Sialvera, Kozani, 50100, Greece; (2) Atmospheric Chemistry and Innovative Technologies Laboratory, Institute of Nuclear and Radiological Sciences & Technology, Energy & Safety, National Centre for Scientific Research “Demokritos”, 15310
Ag. Paraskevi, Athens, Greece Presenting author email: [email protected]; [email protected]
Summary This study aims to investigate the perceived Indoor Environment Quality (IEQ) and comfort, as well as the perceived health symptoms of 135 people working in office buildings located in Western Macedonia, Greece. The study is characterised by a raising interest in the aspects of (a) the region of Western Macedonia, which is an area characterised by aggravated air quality and currently is in a transition phase due to the changes in energy production strategy by reducing the use of lignite as energy fuel and (b) the survey’s time, characterized by new working conditions implemented during the COVID-19 pandemic period. Eight (8) office buildings located in the cities of Kozani (6) and Ptolemaida (2) were included in the questionnaire survey which contained questions regarding the personal characteristics, health, IEQ comfort and control aspects as well as the level of acceptance of the new working conditions regulations due to the pandemic. Introduction In the recent years, there is raising concern about the indoor environment quality in office buildings due to the new construction design, modern equipment and new building materials. Also, the location and the outdoor air are factors that often determine the indoor environment, especially in areas with heavy air pollution like Western Macedonia (WM), Greece. The quality of the indoor environment is determined by a set of factors such as temperature, humidity, levels of air pollutants, noise, lighting and ventilation conditions (Sakellaris et al. 2016). The way that the occupants of a building perceive this set of factors i.e., perceived air quality, is linked to their sense of comfort in the workplace as well as to the way that these factors impact on their health. The relationship between indoor environment factors and perceived comfort and health, is complex and difficult to understand, especially nowadays that office occupants face new commuting and working conditions. Methodology and Results The study was performed in eight (8) office buildings (Fig. 1) located in the cities of Kozani (6) and Ptolemaida (2) covering a variety of characteristics such as: year of construction, location (city center/suburban), activities (university, public sector, construction company), type of ventilation (natural vs mechanical). An online questionnaire was distributed to the office occupants covering IAQ and IEQ comfort and health perception as well as individual characteristics, approved by UOWM’s ethics committee. 135 questionnaires were collected. Indicatively, the results showed that occupants reported in general moderate overall comfort (~44%) while only the 15% were fully satisfied. Privacy (60%) and decoration (42%) and glare (42%) were revealed to be the most dissatisfying parameters (values 1-3 from the 7-point scale). Occupants reported complains about very high temperature (36%), dry and smelly air (36% and 31%) noise inside the building (Fig. 2). The most reported heath symptoms were headache (41%), dry eyes (30%) and sneezing, lethargy (16%,15%) (Fig. 3). Perceived control of noise (mean=3) showed the lowest score. On the other hand, the perceived control of light (mean=5.3) had the highest. The acceptance of new working conditions and the aspect of how the rest occupants in their office accept them showed significant statistical correlation with their overall comfort (Spearman cor. 0.185, p<0.01 and 0.370 p<0.01). Conclusions Comfort and healthy office environments are still a crucial aspect in WM area. Focusing on the current post pandemic period, it is interesting that employees clearly prefer to work in offices (no teleworking from homes). In general, employees agree with the proposed measures (social distance, masks etc.) although having raised concerns about the application in their working environment. Acknowledgement This work was supported by National Strategic Reference Framework (NSRF) projects (a) EDBM103 - entitled: Support for researchers in emphasis on young researchers - part B and (b) Development of New Innovative Low Carbon Energy Technologies to Enhance Excellence in the Region of Western Macedonia. References Sakellaris I. et al. 2016. Perceived Indoor Environment and Occupants’ Comfort in European “Modern” Office Buildings: The OFFICAIR Study. Int. J. Environ. Res. Public Health 2016, 13, 444; doi:10.3390/ijerph13050444.
Fig.1 Buildings’ locations in WM
Fig.2 Dissatisfaction with IEQ parameters
182

SMART MOBILITY ESTIMATIONS AND INTELLIGENT AQ MONITORING FOR THE SUPPORT OF GREEN
MOBILITY
Th. Kassandros(1), E. Bagkis(1), S. Cheristanidis(2), D. Melas(2), K. Karatzas(1), J.M. Salanova(3), D. Margaritis(3), G.
Aifandopoulou(3), P. Tzenos (3)
(1)Environmental Informatics Research Group, School of Mechanical Engineering, Aristotle University, 54124 Thessaloniki,
Greece; (2)Laboratory of Atmospheric Physics & KEDEK, School of Physics, Aristotle University, 54124 Thessaloniki,
Greece; (3)Hellenic Institute of Transport, Centre for Research and Technology Hellas, Thessaloniki, 57001, Greece
Summary
We investigate the relationship between mobility and air quality data collected via city integrated, “smart” infrastructure in
order to identify greener vehicle mobility patterns in the city of Thessaloniki.
Introduction
The Thessaloniki Smart Mobility Living Lab collects data since 2014 from a network of 43 Bluetooth detectors located
strategically (Misakis et al. 2017) in the busiest intersections of the city while enlarging the area coverage to the whole city.
The Bluetooth receivers provide anonymised identification information from Bluetooth devices that today are integrated into
almost all modern vehicles and other widespread devices that support the Bluetooth protocol (smart phones, netbooks,
headphones etc.). Each sensor can record (and anonymize) the unique MAC address of a Bluetooth device when the latter
enters its transmission range together with the time of detection. The captured information is transmitted from the Bluetooth
sensors to a central computing system at regular time intervals via GPRS technology by utilizing the appropriate
communication protocols (UDP). Each record consists of the actual date and time at which the detection occurred, the unique
anonymized MAC address of the detected device, as well as the unique identifier (ID) of the Bluetooth detector. Via suitably
developed computational processes, the data is properly filtered and processed so that they can be used latterly to produce route
times, to detect and to identify possible traffic congestions (Misakis et al. 2015), to calculate origin-destination matrices or,
under specific circumstances, to estimate traffic volumes (Salanova et al. 2017).
Methodology and Results
These mobility-traffic information is combined with air quality data collected via the monitoring network established in the
frame of the KASTOM air quality monitoring and modelling system for the Greater Thessaloniki Area. Data include gaseous
pollutant concentrations (NO2, O3 and CO) estimated with the aid of electrochemical sensors as well as particulate
concentrations (PM10 and PM2.5) estimated by optical counting sensors, complemented by temperature, relative humidity and
pressure readings established via an electronic sensor. Atmospheric quality data are then processed by an innovative
computational intelligence calibration procedure, resulting in improved uncertainty (Bagkis et al., 2021; Kassandros et al.,
2021). Environmental as well as mobility-traffic data are analyzed with the aid of graphical methods, statistical methods
(correlation analysis) as well as computational intelligence methods like self-organizing maps, to reveal relationships and
dependencies between mobility and air quality levels. In addition, mobility data are being used as inputs for data-driven AQ
level models, with the aid of classic linear regression, artificial neural networks as well as advanced ensemble learners. Results
reveal interesting relationships between mobility/traffic data, support the suitability of mobility data for QQ modelling and
estimations, and underline the limitations posed by data availability and quality.
Conclusions
Integrating smart sensors for mobility/traffic as well as for environmental quality (like air pollution) in the city web may allow
for identifying patterns of environmental pressures and mobility service demand leading to greener mobility.
Acknowledgement
This research has been co‐financed by the European Union and Greek national funds through the Operational Program
Competitiveness, Entrepreneurship and Innovation, under the call RESEARCH – CREATE – INNOVATE. Project code
Τ1ΕDΚ-01697; project name Innovative system for air quality monitoring and forecasting (KASTOM, www.air4me.eu).
References
Mitsakis E., Chrysohoou E., Salanova J. M., Iordanopoulos P., Aifadopoulou G. (2017). The sensor location problem:
methodological approach and application. Transport 31(4) pp. 1-7 [doi: 10.3846/16484142.2016.1258674].
Mitsakis E., Salanova J. M., Chrysohoou E., Aifadopoulou G. (2015). A robust method for real time estimation of travel times
for dense urban road networks using point-to-point detectors. Transport 30(3) 2015, pp. 264-272. Special Issue on Smart and
Sustainable Transport. [DOI:10.3846/16484142.2015.1078845]
Salanova Grau J. M., Stamos I., Mitsakis E., Margaritis D., Tzenos P., Aifadopoulou G. (2017) “Estimation of traffic flow
from Bluetooth detections”, Transportation Research Board 96th Annual Meeting, 8-12 January, 2017, Washington, USA.
Bagkis Ε., Kassandros T., Karteris Μ., Karteris Α., Karatzas Κ (2021), Analyzing and Improving the Performance of a
Particulate Matter Low Cost Air Quality Monitoring Device. Atmosphere 12(2), 251. https://doi.org/10.3390/atmos12020251
Kassandros Th., Bagkis E., Karatzas K. (2021), Data fusion for the improvement of Low-Cost Air Quality Sensors, ITM 2021:
International Technical Meeting on Air Pollution Modelling and its Application, 18 - 22 October 2021, Barcelona. Air Pollution
Modelling and its Application volume XXVIII, Springer Proceedings in Complexity Series
183
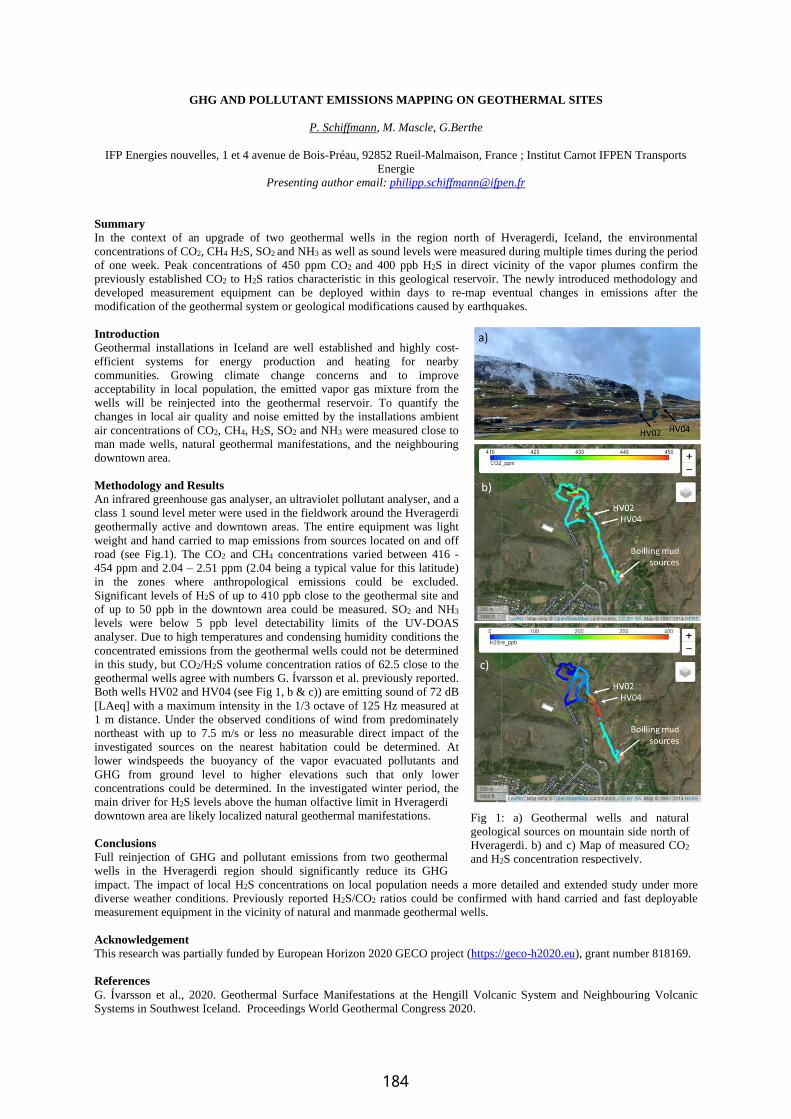
GHG AND POLLUTANT EMISSIONS MAPPING ON GEOTHERMAL SITES
P. Schiffmann, M. Mascle, G.Berthe
IFP Energies nouvelles, 1 et 4 avenue de Bois-Préau, 92852 Rueil-Malmaison, France ; Institut Carnot IFPEN Transports
Energie
Presenting author email: [email protected]
Summary
In the context of an upgrade of two geothermal wells in the region north of Hveragerdi, Iceland, the environmental
concentrations of CO2, CH4 H2S, SO2 and NH3 as well as sound levels were measured during multiple times during the period
of one week. Peak concentrations of 450 ppm CO2 and 400 ppb H2S in direct vicinity of the vapor plumes confirm the
previously established CO2 to H2S ratios characteristic in this geological reservoir. The newly introduced methodology and
developed measurement equipment can be deployed within days to re-map eventual changes in emissions after the
modification of the geothermal system or geological modifications caused by earthquakes.
Introduction
Geothermal installations in Iceland are well established and highly cost-
efficient systems for energy production and heating for nearby
communities. Growing climate change concerns and to improve
acceptability in local population, the emitted vapor gas mixture from the
wells will be reinjected into the geothermal reservoir. To quantify the
changes in local air quality and noise emitted by the installations ambient
air concentrations of CO2, CH4, H2S, SO2 and NH3 were measured close to
man made wells, natural geothermal manifestations, and the neighbouring
downtown area.
Methodology and Results
An infrared greenhouse gas analyser, an ultraviolet pollutant analyser, and a
class 1 sound level meter were used in the fieldwork around the Hveragerdi
geothermally active and downtown areas. The entire equipment was light
weight and hand carried to map emissions from sources located on and off
road (see Fig.1). The CO2 and CH4 concentrations varied between 416 -
454 ppm and 2.04 – 2.51 ppm (2.04 being a typical value for this latitude)
in the zones where anthropological emissions could be excluded.
Significant levels of H2S of up to 410 ppb close to the geothermal site and
of up to 50 ppb in the downtown area could be measured. SO2 and NH3
levels were below 5 ppb level detectability limits of the UV-DOAS
analyser. Due to high temperatures and condensing humidity conditions the
concentrated emissions from the geothermal wells could not be determined
in this study, but CO2/H2S volume concentration ratios of 62.5 close to the
geothermal wells agree with numbers G. Ívarsson et al. previously reported.
Both wells HV02 and HV04 (see Fig 1, b & c)) are emitting sound of 72 dB
[LAeq] with a maximum intensity in the 1/3 octave of 125 Hz measured at
1 m distance. Under the observed conditions of wind from predominately
northeast with up to 7.5 m/s or less no measurable direct impact of the
investigated sources on the nearest habitation could be determined. At
lower windspeeds the buoyancy of the vapor evacuated pollutants and
GHG from ground level to higher elevations such that only lower
concentrations could be determined. In the investigated winter period, the
main driver for H2S levels above the human olfactive limit in Hveragerdi
downtown area are likely localized natural geothermal manifestations.
Conclusions
Full reinjection of GHG and pollutant emissions from two geothermal
wells in the Hveragerdi region should significantly reduce its GHG
impact. The impact of local H2S concentrations on local population needs a more detailed and extended study under more
diverse weather conditions. Previously reported H2S/CO2 ratios could be confirmed with hand carried and fast deployable
measurement equipment in the vicinity of natural and manmade geothermal wells.
Acknowledgement
This research was partially funded by European Horizon 2020 GECO project (https://geco-h2020.eu), grant number 818169.
References
G. Ívarsson et al., 2020. Geothermal Surface Manifestations at the Hengill Volcanic System and Neighbouring Volcanic
Systems in Southwest Iceland. Proceedings World Geothermal Congress 2020.
Fig 1: a) Geothermal wells and natural
geological sources on mountain side north of
Hveragerdi. b) and c) Map of measured CO2
and H2S concentration respectively.
184

THE ROLE OF DPF REGENERATION EVENTS ON POLLUTANT EMISSIONS OF A EURO 6D-TEMP
PASSENGER VEHICLE
Z. Toumasatos (1), A. Raptopoulos-Chatzistefanou (1), D. Kolokotronis (1), P. Pistikopoulos (1), Z. Samaras (1) and L.
Ntziachristos* (2)
(1) Laboratory of Applied Thermodynamics, Department of Mechanical Engineering, Aristotle University of Thessaloniki,
54124, Greece,
(2) Laboratory of Heat Transfer and Environmental Engineering, Aristotle University of Thessaloniki,
54124, Greece,
*Corresponding author: [email protected]
Presenting author email: [email protected]
Summary
The current study assesses the contribution of DPF active regeneration to the regulated (solids at 23nm or SPN23) and non-
regulated (volatiles and solid particles or TPN) particle emissions of a diesel passenger car (Euro 6d-temp). A novel exhaust gas
sampling and dilution system were employed that allowed the investigation of particulate emission down to 2.5nm. Results
suggest that a significant number of particles during DPF regeneration evades current SPN23 regulation.
Introduction
Despite the ongoing efforts to mitigate climate change and air pollution, air pollution levels remain dangerously high in many
areas of the world. Road transport is a countable contributor while UFP have received distinct attention, due to their
significant contribution to total particle number (PN) emissions from vehicles (Samaras et al., 2020). Although the latest
DPF-equipped vehicles are generally considered to be low PN emitters, our understanding of the contribution of diesel
particle filter (DPF) regenerations to actual PN emissions on the road is in general limited.
Methodology and Results
Tests were performed on real driving (RDE) and laboratory conditions. A PN PEMS (23nm) was utilized in RDE, while in
chassis dyno tests a novel sampling and dilution system were used for exhaust PN measurements. The system was developed
in the framework of the EU DownToTen project (Samaras, 2020). Figure 1 depicts the evolution of sub-23nm particles along
with CO2 and HC emissions rates during a DPF regeneration event. The figure suggests an increase of TPN emission by an
order of magnitude over the SPN respected values.
Figure 1 Evolution of SPN10nm, TPN10nm, HC and CO2 emissions (lower) concerning engine operating characteristics (upper). The
current snapshot depicts the evolution of a DPF active regeneration.
Conclusions
The current study is a part of an under publication paper in the Journal of Aerosol and Science. The outcome of this study
provides an insight into particle emission behaviour of DPF active regeneration under RDE and laboratory conditions.
Investigation reveals that a significant number of particles during regeneration evades current SPN23 regulation.
Acknowledgement
This research is co-financed by Greece and the European Union (European Social Fund- ESF) through the Operational
Programme «Human Resources Development, Education and Lifelong Learning» in the context of the project “Strengthening
Human Resources Research Potential via Doctorate Research” (MIS-5000432), implemented by the State Scholarships
Foundation (ΙΚΥ)»
References
Samaras, Z., Andersson, J., Bergmann, A., Hausberger, S., Toumasatos, Z., Keskinen, J., Bainschab, M. (2020). Measuring
Automotive Exhaust Particles down to 10 nm. SAE Technical Papers, 3(2020), 2020-01–2209. https://doi.org/10.4271/2020-
01-2209
185
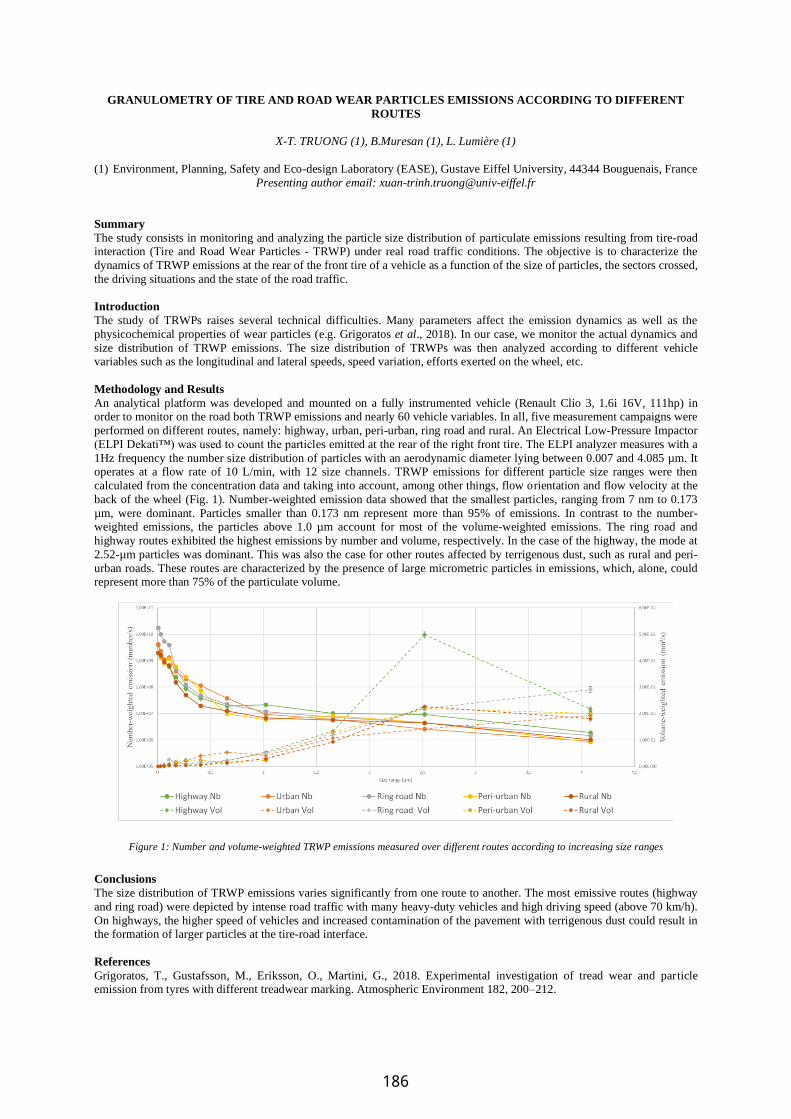
GRANULOMETRY OF TIRE AND ROAD WEAR PARTICLES EMISSIONS ACCORDING TO DIFFERENT
ROUTES
X-T. TRUONG (1), B.Muresan (1), L. Lumière (1)
(1) Environment, Planning, Safety and Eco-design Laboratory (EASE), Gustave Eiffel University, 44344 Bouguenais, France
Presenting author email: [email protected]
Summary
The study consists in monitoring and analyzing the particle size distribution of particulate emissions resulting from tire-road interaction (Tire and Road Wear Particles - TRWP) under real road traffic conditions. The objective is to characterize the
dynamics of TRWP emissions at the rear of the front tire of a vehicle as a function of the size of particles, the sectors crossed,
the driving situations and the state of the road traffic.
Introduction
The study of TRWPs raises several technical difficulties. Many parameters affect the emission dynamics as well as the
physicochemical properties of wear particles (e.g. Grigoratos et al., 2018). In our case, we monitor the actual dynamics and
size distribution of TRWP emissions. The size distribution of TRWPs was then analyzed according to different vehicle variables such as the longitudinal and lateral speeds, speed variation, efforts exerted on the wheel, etc.
Methodology and Results
An analytical platform was developed and mounted on a fully instrumented vehicle (Renault Clio 3, 1.6i 16V, 111hp) in order to monitor on the road both TRWP emissions and nearly 60 vehicle variables. In all, five measurement campaigns were
performed on different routes, namely: highway, urban, peri-urban, ring road and rural. An Electrical Low-Pressure Impactor
(ELPI Dekati™) was used to count the particles emitted at the rear of the right front tire. The ELPI analyzer measures with a
1Hz frequency the number size distribution of particles with an aerodynamic diameter lying between 0.007 and 4.085 µm. It operates at a flow rate of 10 L/min, with 12 size channels. TRWP emissions for different particle size ranges were then
calculated from the concentration data and taking into account, among other things, flow orientation and flow velocity at the
back of the wheel (Fig. 1). Number-weighted emission data showed that the smallest particles, ranging from 7 nm to 0.173
µm, were dominant. Particles smaller than 0.173 nm represent more than 95% of emissions. In contrast to the number-weighted emissions, the particles above 1.0 µm account for most of the volume-weighted emissions. The ring road and
highway routes exhibited the highest emissions by number and volume, respectively. In the case of the highway, the mode at
2.52-µm particles was dominant. This was also the case for other routes affected by terrigenous dust, such as rural and peri-
urban roads. These routes are characterized by the presence of large micrometric particles in emissions, which, alone, could represent more than 75% of the particulate volume.
Figure 1: Number and volume-weighted TRWP emissions measured over different routes according to increasing size ranges
Conclusions
The size distribution of TRWP emissions varies significantly from one route to another. The most emissive routes (highway
and ring road) were depicted by intense road traffic with many heavy-duty vehicles and high driving speed (above 70 km/h).
On highways, the higher speed of vehicles and increased contamination of the pavement with terrigenous dust could result in the formation of larger particles at the tire-road interface.
References
Grigoratos, T., Gustafsson, M., Eriksson, O., Martini, G., 2018. Experimental investigation of tread wear and particle emission from tyres with different treadwear marking. Atmospheric Environment 182, 200–212.
186

SPATIO-TEMPORAL MAPPING AND ASSESSMENT OF NO2 LED AIR POLLUTION OVER MEGACITY DELHI, INDIA USING TROPOMI DATA
A. Vaghela (1), A. Kandya (1), R. Oza (1), M. Mohan (2)
(1) Pandit Deendayal Energy University (PDEU), Gandhinagar 382426, India; (2) Indian Institute of Technology (IIT) Delhi, New Delhi 110016, India
Presenting author email: [email protected]
Introduction Nitrogen dioxides (NO2) are responsible for a number of environmental effects such as ozone formations, acid rain which can have adverse effect on both terrestrial and aquatic ecosystem. The adverse impacts of NO2 and its reaction products have been reported in many studies. In the background of facing the severe NO2 pollution problem and its adverse effects, it’s very important to undertake the spatio-temporal behaviour of NO2 so that adequate mitigation strategies can be initiated. With this focus the present study was undertaken for megacity Delhi using TROPOMI data for a period of 25 months (August, 2019 to August, 2021) which includes the unusual period of the global pandemic led ‘lockdown’ during 23 March – 15 September, 2020. Methodology In the present study, NO2 columnar flux (moles / m2) TROPOMI data was retrieved for the study period on a daily basis. The number of data points in the study area varied between 14 – 78 and thus to maintain better representativeness only those days were considered which had data points more than 55. A database was then made of these selected days. Average columnar flux was then computed for the study area for the three time period namely ‘Pre-lockdown’ (Aug, 2019 – March, 2020), ‘Lock-down’ (March, 2020 – September, 2020) and ‘Gradual unlock’ (September, 2020 – August, 2021) which then was mapped using Arc GIS 10.3. Results The Fig 1.0 shows the spatial variation of Tropospheric Columnar NO2 across megacity Delhi for the 3 distinct time periods while Fig 2.0 shows the respective changes for the lockdown period and gradual unlock period with respect to the pre-lockdown period. At the outset it can be seen that the Central to East Delhi having highly urbanized areas like ITO, Sitaram Bazar are always having relatively higher NO2 flux. During the lockdown period these areas witnessed a reduction in the range of 50-60%. On an average, during the lockdown period the NO2 flux reduced by 51% (maximum reduction was 62% while minimum reduction was 24%) while the pollution levels during the gradual unlock period was around 15% lesser than the pre-lock period (maximum reduction was 23% while minimum reduction was 0.5%)
PRE-LOCKDOWN
(Aug,2019 – Mar,2020) LOCKDOWN
(Mar,2020 - Sep,2020) GRADUAL UNLOCK (Sep,2020 – Aug,2021)
Fig 1.0 Spatial variation of Tropospheric Columnar NO2
Conclusion: The study brings out the spatio-temporal behaviour of NO2 over megacity Delhi along with the NO2 hotspots and the improvement in the air quality due the COVID-19 led lockdown. The study would be of great relevance to the city regulators for initiating appropriate measures.
Change in NO2 Columnar flux during lockdown
Change in NO2 flux during Gradual unlock
Fig. 2.0 Change in NO2 columnar flux during lockdown and gradual unlock period
187
AIR QUALITY MONITORING IN ATHLETICS STADIUMS: CAN LOW-COST SENSOR TECHNOLOGIES
SUPPORT GUIDANCE FOR INTERNATIONAL COMPETITIONS?
M. Viana (1), K. Karatzas (2), T. Arvanitis (2), C. Reche (1), M. Escribano (3), E. Ibarrola (3), P.E. Adami (4), S. Bermon (4)
(1) Institute of Environmental Assessment and Water Research, IDAEA-CSIC, Barcelona, Spain; (2) Environmental
Informatics Research Group, School of Mechanical Engineering, Aristotle University, Thessaloniki, Greece; (3) Kunak
Technologies, Pamplona, Spain; (4) World Athletics, Monaco, Monaco.
Presenting author email: [email protected]
Summary
The aim of this work was to evaluate the extent to which low-cost sensor technologies can contribute to setting air quality
guidelines for international sports events. To this end, we implemented a pilot study which deployed air quality monitors in
the main athletics stadium in 6 major cities around the globe, for a 1-year period. The ultimate goal was to provide
recommendations on the usability of cost-effective monitors for athletics events’ organisers, to minimise exposure of
participants and spectators, avoid impacts on athletic performance and facilitate decision-making regarding the potential
cancellation, postponement or relocation of competitions due to air quality issues.
Introduction
The links between air pollution and cardiovascular and respiratory health are well established, especially for general and
high-risk populations. Research is also available on health impacts for general populations performing physical activities
(walking, cycling). However, the literature is scarce on athletes and recreational sports practitioners (Reche et al., 2020).
Exposure to air pollution has the potential to impact athletes’ performance, a topic which is receiving increasing attention
from sports federations due to implications in terms of public image and loss of revenues. Despite this, guidelines to
minimise air pollution exposures during sports events are mostly non-existent. The main issue limiting exposure
characterisation for athletes is the lack of detailed, high-quality air pollution data in the vicinity of stadiums.
Methodology and Results
Cost-effective air quality monitors (KunakAir, Kunak Technologies) making use of low-cost sensors for NO, NO2, O3, PMx
and CO were deployed in the athletics stadiums of 6 major cities worldwide (not disclosed due to confidentiality; 1 monitor
each in Europe, N America, Asia, Australia, and 2 in Africa). The monitors, with individually calibrated sensing units, were
intercompared and compared with reference data by the manufacturer at a single location in Spain prior to shipment to the
stadiums (R2 against reference >0.85 for each pollutant). Because this work aims to understand the potential of off-the-shelf
air quality monitors based on low-cost sensor technologies, with limited or no access to reference data for comparison, the
monitors were not calibrated locally at each of the locations. As a result, the absolute concentrations of particulate and
gaseous pollutants monitored were not compared across cities, and they were only evaluated in terms of temporal trends.
Time series analysis and Self Organizing Maps (SOMs) were applied.
Results evidenced similar daily patterns for the gaseous pollutants (NO2, O3) across most of the cities, indicating the
influence of traffic emissions and meteorology, but markedly different trends for PM suggesting the additional influence of
sources such as dust resuspension. The detailed, high temporal-resolution of the data generated was seen as highly valuable
for event organisers, as it would allow them to select the optimal time periods for scheduling of different types of track and
field competitions. In addition, hyper-local data allowed detecting the impacts of specific, unexpected sources such as
wildfires, as well as setting guidelines regarding potential thresholds above which events should be postponed or cancelled
(based e.g. on ratios with regard to the days prior to the competitions). Finally, guidance for mitigation can also be provided:
while air quality is competence of city authorities, certain mitigation actions may be implemented inside the stadiums if
sufficient data are available to point to specific sources (application of dust binders in stadiums with high impacts of coarse
dust).
Conclusions
We conclude that the hyper-local data generated by the sensors were useful to describe daily air pollutant trends and identify
hourly maxima for the different pollutants under study. This information has high added value for event organisers in terms
of (1) identifying optimal times and seasons for competitions, (2) setting thresholds to decide on postponement or
cancellation of events, and (3) application of targeted mitigation strategies. Absolute pollutant concentrations can only be
compared directly across if sensors are calibrated locally, as sensor performance is impacted by local meteorology and air
pollution mix (e.g., particle hygroscopicity, particle density and chemical composition).
Acknowledgement
This work was supported by projects CEX2018-000794-S and 2017SGR41.
References
Reche, C. (2020) Athletes’ exposure to air pollution during World Athletics Relays: A pilot study. Sci. Total Environ. 717.
188
Related Documents


