Appendix D6 Air Quality Baseline

Welcome message from author
This document is posted to help you gain knowledge. Please leave a comment to let me know what you think about it! Share it to your friends and learn new things together.
Transcript
Appendix D6
Air Quality Baseline
AIR QUALITY BASELINE ASSESSMENT FOR THE NQUGRA MANGANESE FREIGHT LINE EIA PROJECT
Report No. uMN012-2012 i
AIR QUALITY BASELINE ASSESSMENT
FOR THE NQUGRA MANGANESE FREIGHT LINE EIA PROJECT
Issued by: Issued to: uMoya-NILU Consulting (Pty) Ltd P O Box 20622 Durban North, 4016 South Africa
Environmental Resources Management (Southern Africa) Pty Ltd Silverwood House Block A, SteenbergOffice Park Steenberg 7945, Cape Town South Africa
Mark Zunckel September 2012
AIR QUALITY BASELINE ASSESSMENT FOR THE NQUGRA MANGANESE FREIGHT LINE EIA PROJECT
Report No. uMN012-2012 ii
Report details Client: Environmental Resources Management (Southern Africa) Pty
Ltd Report title: Air quality baseline assessment for the Nqugra Manganese
Freight Line EIA project Project: uMN012-12 Report number: uMN012-2012 Version: Draft Author details Author: Mark Zunckel Reviewer: Sarisha Perumal
This report has been produced for Environmental Resources Management (Southern Africa) Pty Ltd ERM), representing Transnet SOC Ltc, by uMoya-NILU Consulting (Pty) Ltd. The intellectual property contained in this report remains vested in uMoya-NILU Consulting (Pty) Ltd. No part of the report may be reproduced in any manner without written permission from ERM, Transnet SOC Ltd and uMoya-NILU Consulting (Pty) Ltd. When used as a reference this report should be cited as follows:
uMoya-NILU (2012): Air quality baseline assessment for the Nqugra Manganese Freight Line EIA, uMoya-NILU Consulting (Pty) Ltd, Report No. uMN012-2012.
AIR QUALITY BASELINE ASSESSMENT FOR THE NQUGRA MANGANESE FREIGHT LINE EIA PROJECT
Report No. uMN012-2012 iii
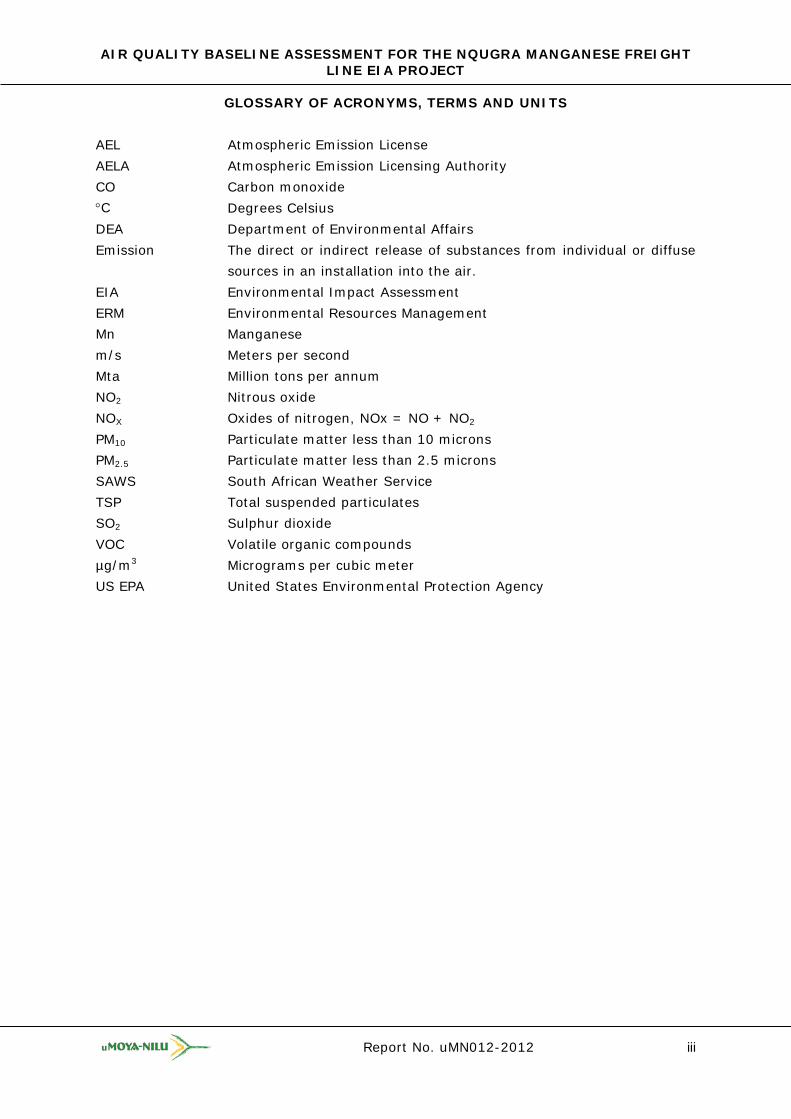
GLOSSARY OF ACRONYMS, TERMS AND UNITS AEL Atmospheric Emission License AELA Atmospheric Emission Licensing Authority CO Carbon monoxide °C Degrees Celsius DEA Department of Environmental Affairs Emission The direct or indirect release of substances from individual or diffuse
sources in an installation into the air. EIA Environmental Impact Assessment ERM Environmental Resources Management Mn Manganese m/s Meters per second Mta Million tons per annum NO2 Nitrous oxide NOX Oxides of nitrogen, NOx = NO + NO2 PM10 Particulate matter less than 10 microns PM2.5 Particulate matter less than 2.5 microns SAWS South African Weather Service TSP Total suspended particulates SO2 Sulphur dioxide VOC Volatile organic compounds µg/m3 Micrograms per cubic meter US EPA United States Environmental Protection Agency
AIR QUALITY BASELINE ASSESSMENT FOR THE NQUGRA MANGANESE FREIGHT LINE EIA PROJECT
Report No. uMN012-2012 iv
TABLE OF CONTENTS
GLOSSARY OF ACRONYMS, TERMS AND UNITS ........................................................ iii TABLE OF CONTENTS ............................................................................................ iv 1. INTRODUCTION ............................................................................................... 1 2. PROJECT DESCRIPTION AND AIR QUALITY .......................................................... 1
2.1 Project description .................................................................................. 1 2.2 Sources of air pollution ............................................................................ 1
2.2.1 Construction ................................................................................ 1 2.1.3 Operations ................................................................................... 3
2.3 Air pollutant overview .............................................................................. 3 3. THE REGULATORY REQUIREMENTS ..................................................................... 5
3.1 Atmospheric emission license ................................................................... 5 3.2 Ambient air quality standards ................................................................... 6
4. AIR QUALITY STATUS ....................................................................................... 7 4.1 Climate .................................................................................................. 7 4.2 Ambient air quality .................................................................................. 9
5. REFERENCES ................................................................................................. 10
AIR QUALITY BASELINE ASSESSMENT FOR THE NQUGRA MANGANESE FREIGHT LINE EIA PROJECT
1
1. INTRODUCTION Transnet SOC Ltd has appointed Environmental Resources Management (Southern Africa) (ERM) to undertake an Environmental Impact Assessment (EIA) for the upgrade of the manganese freight line from Hotazel in the Northern Cape to the Port of Nqugra in the Eastern Cape (Figure 1). The upgrade involves, amongst other activities, the extension of existing loops and the development of new loops, route widening, and the development of a compilation yard and common user facility. The construction work and the operation of the freight line, the compilation yard and common user facility are associated with potential impacts on air quality. ERM has therefore appointed uMoya-NILU Consulting (Pty) Ltd, a specialist air quality management consultancy, to undertake the air quality specialist study for the EIA. This baseline assessment is the first component of the air quality specialist study and includes an overview of the freight line upgrade project and the potential sources of air pollution, an overview of the pollutants, a discussion of the regulatory requirements with respect to air quality, and a description of the receiving environment with emphasis on air quality. 2. PROJECT DESCRIPTION AND AIR QUALITY 2.1 Project description The existing manganese freight line from Hotazel is used to transport 5.5 Mta of manganese (Mn) ore to the export terminal at Port Elizabeth harbour. The ore is transported in open ore cars by electric powered locomotives. An upgrade of the line is necessary to meet the requirements of the proposed increase in export of Mn ore to 16 Mta, through the planned terminal and the Port of Nqugra. The proposed upgrade activities are detailed in Transnet (2012) and include the:
• Extension of 15 loops at various places on the existing line for 200 wagons and one for 105 wagons;
• Construction of a new loop and Sishen for 200 wagons; • Reinstating 161 km of double line on three sections and the doubling of 3 line
sections; • Expansion of 11 single 3 kV DC sub-stations to double sub-stations • Expansion of 8 single 25 kV AC sub-stations to double sub-stations; • Development of a compilation yard at Mamathwane; and • Development of a Common User Facility at Mamathwane with a transfer point and
stockpiles. 2.2 Sources of air pollution 2.2.1 Construction Most civil construction activities generate dust and the emission of particulates into the atmosphere is through vehicle dust entrainment, excavation, ground levelling, etc. In most cases the dust is relatively course, but may include fine respireable particles (PM10).

AIR QUALITY BASELINE ASSESSMENT FOR THE NQUGRA MANGANESE FREIGHT LINE EIA PROJECT
2
Figure 1: The manganese freight line from Hotazel to the Port of Nqugra showing
50 km circles of radius around the main commercial centres
AIR QUALITY BASELINE ASSESSMENT FOR THE NQUGRA MANGANESE FREIGHT LINE EIA PROJECT
3
Emissions are released close to ground level and have no buoyancy, which limits their dispersion. As a result the coarse particulates generally settle relatively close to the emission source. Finer particulates may be transported further from the point of release, as they are easily carried by wind. Exhaust emissions from construction vehicles and equipment typically include particulates (including PM10), carbon monoxide (CO), nitrogen oxides (NOx), sulphur dioxide (SO2) and volatile organic compounds (VOCs) including benzene. 2.1.3 Operations Freight line Dust from open rail cars and emissions from locomotives are potential sources of air pollutants on the freight line. Little or no dust is expected to be blown from the ore wagons as the ore is wet when the wagon train departs. Similarly, the wagons have closed bins so dust will not fall from them and deposit on the rail tracks. Analysis conducted on soil collected along the existing freight line did not show higher Mn content along the line than elsewhere (uMoya-NILU, 2008). There are no emissions from the electrically powered locomotives on the main freight line. Compilation yard The consolidation and deconsolidation of wagon trains by diesel locomotives in the compilation yard will result in emissions which include particulates, oxides of nitrogen (NOX), sulphur dioxide (SO2) and volatile organic compounds (VOCs) including benzene. The movement of vehicles and equipment in the compilation yard may generate dust. Dust may also be generated off open areas in the compilation yard by the wind. Common user facility Air pollutants will result in the Common User Facility from exhaust emissions and from haulage vehicles. The movement of vehicles and equipment in the compilation yard may generate dust. Dust may also result from stockpiles, from stacking and reclaiming activities as well as being generated off open areas in the facility by the wind. 2.3 Air pollutant overview Particulate matter In the ambient environment airborne particulates are ranked according to size. Coarse particles associated with dust fallout or depositions are regarded as nuisance impacts, through accumulation and possible discolouration. Finer dust is categorised into sub-classes depending on its size and the associated human health impacts. The coarsest of the fine dust refers to all dust with a diameter of less than 100 µm, known as total suspended particulates (TSP). The fraction of TSP that is inhalable and associated with health impacts has a diameter equal to or smaller than 10 µm and is known as PM10. When exposed to particulate matter through normal nasal breathing, particles larger than 10 μm would be removed in the passage of the air stream through the nose and upper respiratory airways, and particles between 3 μm and 10 μm would be deposited in the upper airways.
AIR QUALITY BASELINE ASSESSMENT FOR THE NQUGRA MANGANESE FREIGHT LINE EIA PROJECT
4
Finer particles with a diameter equal to or less than 2.5 µm (PM2.5) have yielded stronger associations with health impacts than PM10 as these particles can infiltrate deeper into the lung. Sources of PM2.5 include combustion processes and the formation of atmospheric aerosols during chemical transformations in the atmosphere. Health effects of PM depend on particle size and chemical composition. While the deposition of particulates on to surfaces may pose a nuisance, they may also be a potential risk to human health and wellbeing. Depending on the chemical nature of the particulate and bioavailability of metals, runoff into drinking water or accumulation on vegetation can occur. The South African ambient air quality standards for PM10 and PM2.5 and dust fallout limits are shown in Table 1. Oxides of nitrogen (NO
X)
Nitrogen dioxide (NO2) and nitric oxide (NO) are formed simultaneously in combustion processes and other high temperature operations such as metallurgical furnaces, blast furnaces, and internal combustion engines. NOX is a term commonly used to refer to the combination of NO and NO2. The route of exposure to NO2 is inhalation and the seriousness of the effects depend more on the concentrations inhaled rather than the length of exposure. The site of deposition for NO2 is the distal lung (because NO2 does not readily dissolve in the moist upper respiratory system) where NO2 reacts with moisture in the fluids of the lower respiratory tract to form nitrous and nitric acids (WHO, 1997). About 80 to 90% of inhaled nitrogen dioxide is absorbed through the lungs (CCINFO, 1998). Nitrogen dioxide (present in the blood as the nitrite ion) oxidises unsaturated membrane lipids and proteins, which results in loss of control of cell permeability. Nitrogen dioxide causes decrements in lung function, particularly increased airway resistance. People with chronic respiratory problems and people who work or exercise outside will be more at risk to NO2 exposure (EAE, 2006). In the atmosphere, NO2 reacts with water vapour to produce nitric acid. This acidic pollution can be transported over long distances by wind and deposited as acid rain, causing the acidification of soils, lakes, and streams, accelerated corrosion of buildings and monuments and damages paintwork. NO2 is also a major source of secondary fine particulate pollution which decreases visibility, and contributes to surface ozone formation through its reaction with VOCs in the presence of sunlight. The South African ambient air quality standards for NO2 are shown in Table 1. Sulphur dioxide (SO2) The major source of SO2 is the combustion of sulphur containing fossil fuels such coal, oil and diesel. On inhalation, most SO2 only penetrates as far as the nose and throat (because it is readily soluble in the moist lining of the upper respiratory system), minimal amounts reach the lungs, unless the person is breathing heavily, breathing only through the mouth, or if the concentration of SO2 is high (CCINFO, 1998). The acute response to SO2 is rapid, within 10 minutes for people suffering from asthma (WHO, 2005). Effects such as a reduction in lung function, an increase in airway resistance, wheezing and shortness of breath, are enhanced by exercise, that increases the volume of air inspired, as it allows SO2 to penetrate further into the respiratory tract (WHO, 1999).SO2 reacts with cell moisture in the respiratory system to form sulphuric acid. This can lead to impaired cell function and effects such as coughing, broncho-constriction, exacerbation of asthma and reduced lung function. SO2 has the potential to form sulphurous acid or to slowly form sulphuric acid in the atmosphere via oxidation by the hydroxyl radical. The sulphuric acid may then dissolve in water droplets and fall as precipitation. The South African ambient air quality standards for SO2 are shown in Table 1.
AIR QUALITY BASELINE ASSESSMENT FOR THE NQUGRA MANGANESE FREIGHT LINE EIA PROJECT
5
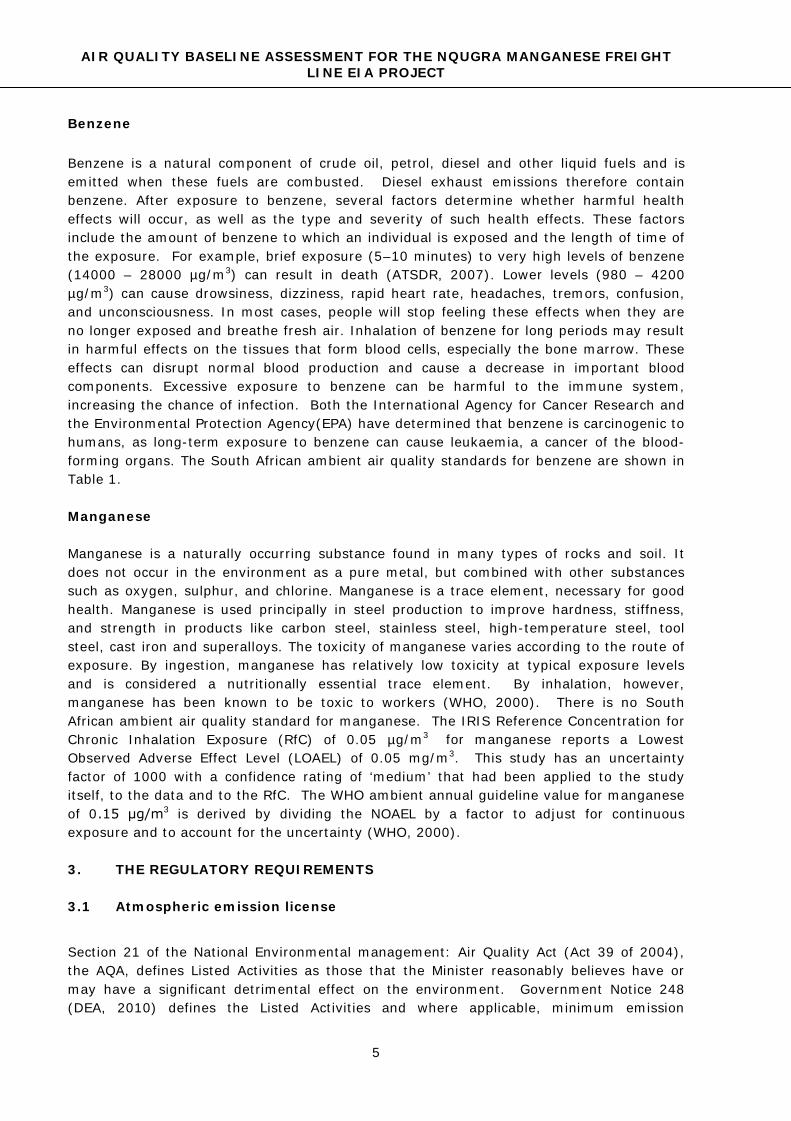
Benzene Benzene is a natural component of crude oil, petrol, diesel and other liquid fuels and is emitted when these fuels are combusted. Diesel exhaust emissions therefore contain benzene. After exposure to benzene, several factors determine whether harmful health effects will occur, as well as the type and severity of such health effects. These factors include the amount of benzene to which an individual is exposed and the length of time of the exposure. For example, brief exposure (5–10 minutes) to very high levels of benzene (14000 – 28000 µg/m3) can result in death (ATSDR, 2007). Lower levels (980 – 4200 µg/m3) can cause drowsiness, dizziness, rapid heart rate, headaches, tremors, confusion, and unconsciousness. In most cases, people will stop feeling these effects when they are no longer exposed and breathe fresh air. Inhalation of benzene for long periods may result in harmful effects on the tissues that form blood cells, especially the bone marrow. These effects can disrupt normal blood production and cause a decrease in important blood components. Excessive exposure to benzene can be harmful to the immune system, increasing the chance of infection. Both the International Agency for Cancer Research and the Environmental Protection Agency(EPA) have determined that benzene is carcinogenic to humans, as long-term exposure to benzene can cause leukaemia, a cancer of the blood-forming organs. The South African ambient air quality standards for benzene are shown in Table 1. Manganese Manganese is a naturally occurring substance found in many types of rocks and soil. It does not occur in the environment as a pure metal, but combined with other substances such as oxygen, sulphur, and chlorine. Manganese is a trace element, necessary for good health. Manganese is used principally in steel production to improve hardness, stiffness, and strength in products like carbon steel, stainless steel, high-temperature steel, tool steel, cast iron and superalloys. The toxicity of manganese varies according to the route of exposure. By ingestion, manganese has relatively low toxicity at typical exposure levels and is considered a nutritionally essential trace element. By inhalation, however, manganese has been known to be toxic to workers (WHO, 2000). There is no South African ambient air quality standard for manganese. The IRIS Reference Concentration for Chronic Inhalation Exposure (RfC) of 0.05 µg/m3 for manganese reports a Lowest Observed Adverse Effect Level (LOAEL) of 0.05 mg/m3. This study has an uncertainty factor of 1000 with a confidence rating of ‘medium’ that had been applied to the study itself, to the data and to the RfC. The WHO ambient annual guideline value for manganese of 0.15 μg/m3 is derived by dividing the NOAEL by a factor to adjust for continuous exposure and to account for the uncertainty (WHO, 2000). 3. THE REGULATORY REQUIREMENTS 3.1 Atmospheric emission license
Section 21 of the National Environmental management: Air Quality Act (Act 39 of 2004), the AQA, defines Listed Activities as those that the Minister reasonably believes have or may have a significant detrimental effect on the environment. Government Notice 248 (DEA, 2010) defines the Listed Activities and where applicable, minimum emission
AIR QUALITY BASELINE ASSESSMENT FOR THE NQUGRA MANGANESE FREIGHT LINE EIA PROJECT
6
standards and special conditions. According to Section 37 of the AQA, an application for and Atmospheric Emission License is required for all Listed Activities. According to Category 5 (Mineral processing, storage and Handling and sub-category 5.1 (Storage and handling of ore or coal) of the list of activities, all installations that are not situated on a mine and hold more than 100 000 tons of ore or coal are classified as a Listed Activity. Transnet may therefore require an AEL for the Common User Facility and this should be supported by an atmospheric impact report (Section 30 of the AQA). The application should be lodged with the AEL Authority. The principal condition of sub-category 5.1 is that dust fall is measured in eight principal wind directions and the 3-month running average does not exceed the limit values for the adjacent land-use, according to the Draft National Dust Control Regulation (DEA, 2011b) (published on 27 May 2011 for public comment) which formalises the SANS recommendations. This regulation states that no person may conduct any activity in such a way as to give rise to dust in such quantities and concentrations that:
a) The dust, or dust fall, has a detrimental effect on the environment, including health, social conditions, economic conditions, ecological conditions or cultural heritage, or has contributed to the degradation of ambient air quality beyond the premises where it originates; or
b) The dust remains visible in the ambient air beyond the premises where it originates; or
c) The dust fall at the boundary and beyond the boundary of the premises where it originates exceeds:
i) 600 mg/m2/day averaged over 30 days in residential or light commercial areas measured using reference method ASTM D1739; or
ii) 1200 mg/m2/day averaged over 30 days in areas other than residential and light commercial areas measured using reference method ASTM D1739.
3.2 Ambient air quality standards Health-based ambient air quality standards have been established for criteria pollutants and one toxic air pollutant in South Africa. Being health-based, these standards imply that the ambient concentrations less than the standard do not pose a health risk, while concentrations above the standard may pose a risk. The national ambient air quality standard consists of a limit value and a permitted frequency of exceedance. The limit value is the fixed concentration level aimed at reducing the harmful effects of a pollutant. The permitted frequency of exceedance represents the tolerated exceedance of the limit value and accounts for high concentrations as a result of process upsets and meteorological variation. Compliance with the ambient standard, therefore implies that ambient concentrations are below the limit value and the frequency of exceedance does not exceed the permitted tolerance. The criteria pollutants of concern for this assessment are SO2, NO2, PM10, PM2.5 and benzene from diesel locomotives and ore handling. The national ambient standards are listed in Table 1.
AIR QUALITY BASELINE ASSESSMENT FOR THE NQUGRA MANGANESE FREIGHT LINE EIA PROJECT
7
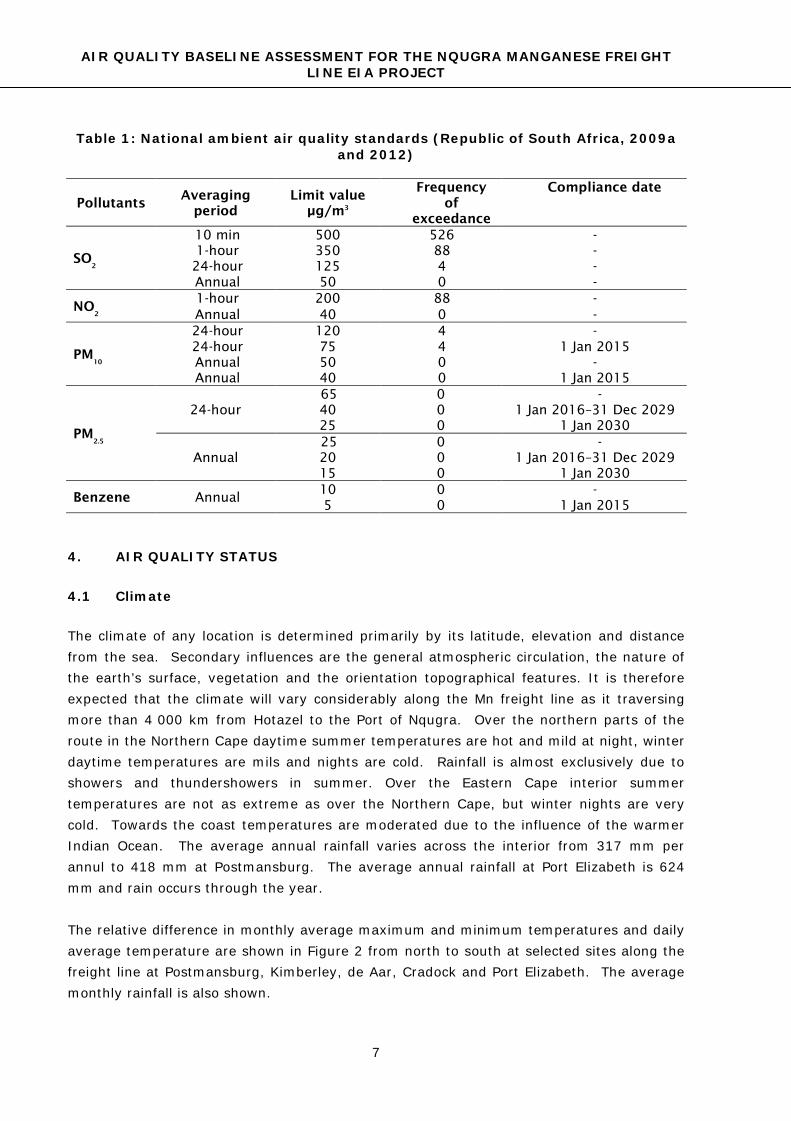
Table 1: National ambient air quality standards (Republic of South Africa, 2009a and 2012)
Pollutants Averaging
period Limit value
µg/m3
Frequency of
exceedance
Compliance date
SO2
10 min 500 526 - 1-hour 350 88 - 24-hour 125 4 - Annual 50 0 -
NO2
1-hour 200 88 - Annual 40 0 -
PM10
24-hour 120 4 - 24-hour 75 4 1 Jan 2015 Annual 50 0 - Annual 40 0 1 Jan 2015
PM2.5
24-hour 65 0 - 40 0 1 Jan 2016–31 Dec 2029 25 0 1 Jan 2030
Annual 25 0 - 20 0 1 Jan 2016–31 Dec 2029 15 0 1 Jan 2030
Benzene Annual 10 0 - 5 0 1 Jan 2015
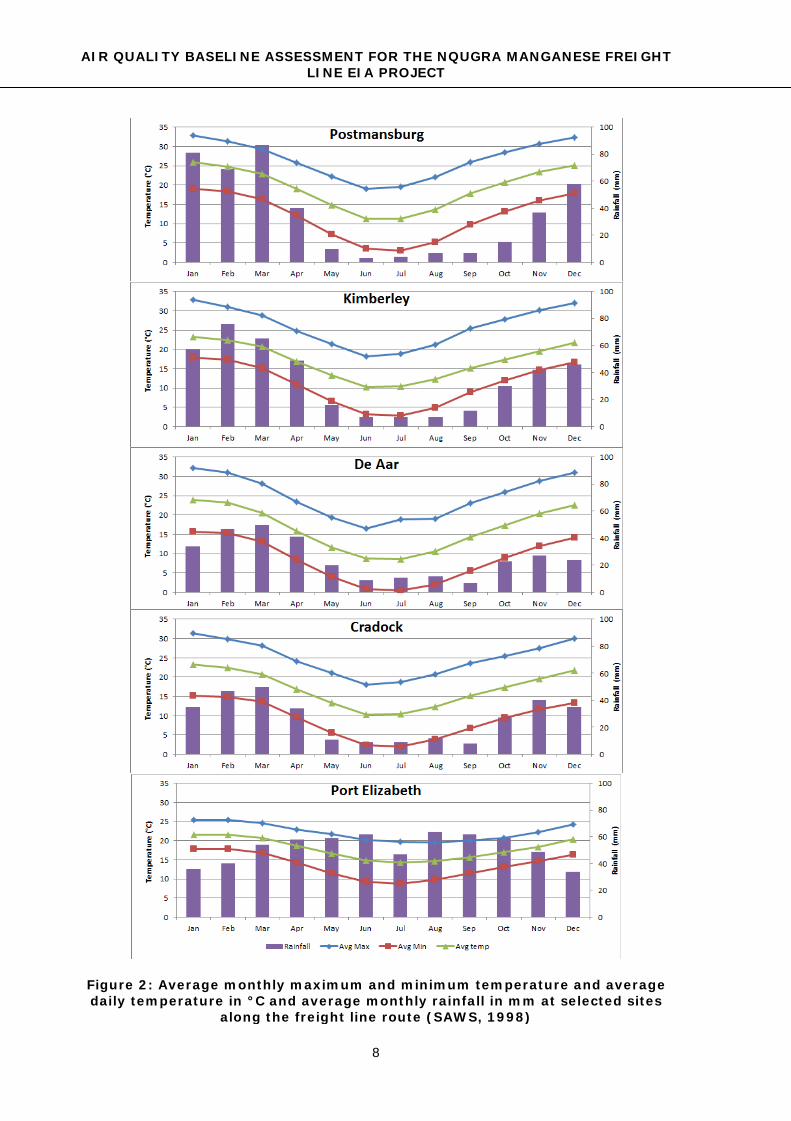
4. AIR QUALITY STATUS 4.1 Climate The climate of any location is determined primarily by its latitude, elevation and distance from the sea. Secondary influences are the general atmospheric circulation, the nature of the earth’s surface, vegetation and the orientation topographical features. It is therefore expected that the climate will vary considerably along the Mn freight line as it traversing more than 4 000 km from Hotazel to the Port of Nqugra. Over the northern parts of the route in the Northern Cape daytime summer temperatures are hot and mild at night, winter daytime temperatures are mils and nights are cold. Rainfall is almost exclusively due to showers and thundershowers in summer. Over the Eastern Cape interior summer temperatures are not as extreme as over the Northern Cape, but winter nights are very cold. Towards the coast temperatures are moderated due to the influence of the warmer Indian Ocean. The average annual rainfall varies across the interior from 317 mm per annul to 418 mm at Postmansburg. The average annual rainfall at Port Elizabeth is 624 mm and rain occurs through the year. The relative difference in monthly average maximum and minimum temperatures and daily average temperature are shown in Figure 2 from north to south at selected sites along the freight line at Postmansburg, Kimberley, de Aar, Cradock and Port Elizabeth. The average monthly rainfall is also shown.
AIR QUALITY BASELINE ASSESSMENT FOR THE NQUGRA MANGANESE FREIGHT LINE EIA PROJECT
8
Figure 2: Average monthly maximum and minimum temperature and average daily temperature in °C and average monthly rainfall in mm at selected sites
along the freight line route (SAWS, 1998)
AIR QUALITY BASELINE ASSESSMENT FOR THE NQUGRA MANGANESE FREIGHT LINE EIA PROJECT
9
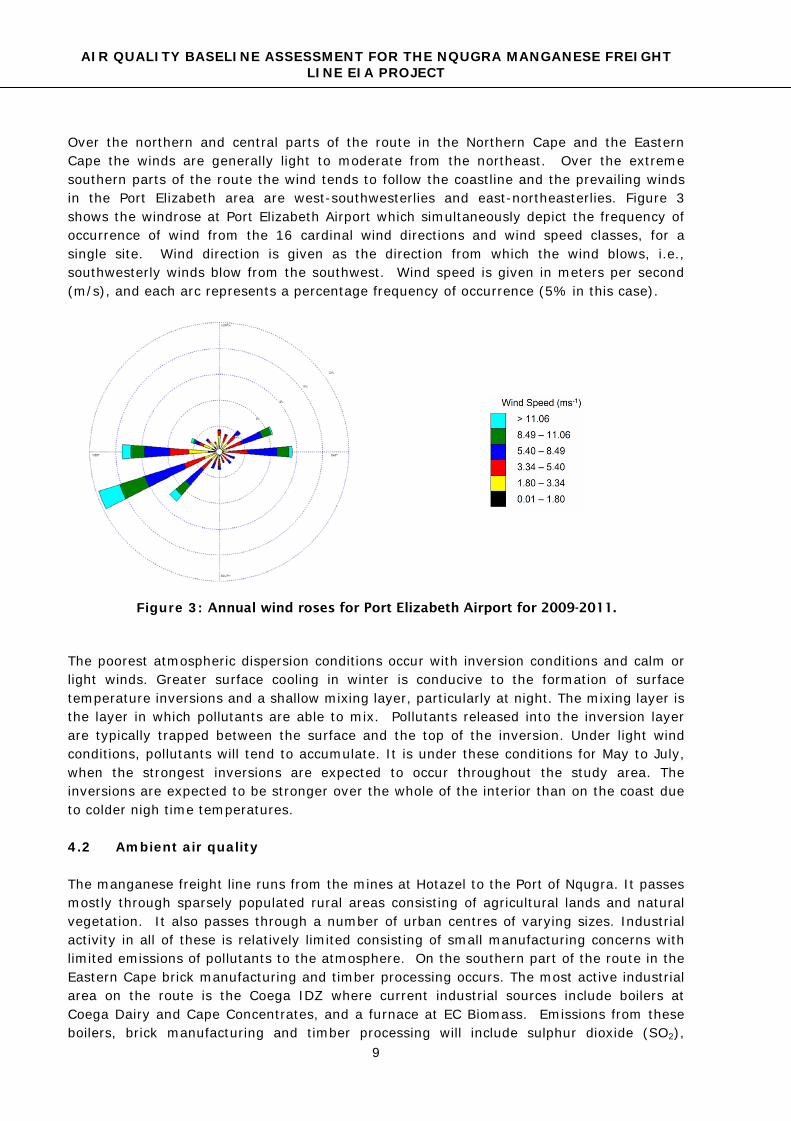
Over the northern and central parts of the route in the Northern Cape and the Eastern Cape the winds are generally light to moderate from the northeast. Over the extreme southern parts of the route the wind tends to follow the coastline and the prevailing winds in the Port Elizabeth area are west-southwesterlies and east-northeasterlies. Figure 3 shows the windrose at Port Elizabeth Airport which simultaneously depict the frequency of occurrence of wind from the 16 cardinal wind directions and wind speed classes, for a single site. Wind direction is given as the direction from which the wind blows, i.e., southwesterly winds blow from the southwest. Wind speed is given in meters per second (m/s), and each arc represents a percentage frequency of occurrence (5% in this case).
Figure 3: Annual wind roses for Port Elizabeth Airport for 2009-2011.
The poorest atmospheric dispersion conditions occur with inversion conditions and calm or light winds. Greater surface cooling in winter is conducive to the formation of surface temperature inversions and a shallow mixing layer, particularly at night. The mixing layer is the layer in which pollutants are able to mix. Pollutants released into the inversion layer are typically trapped between the surface and the top of the inversion. Under light wind conditions, pollutants will tend to accumulate. It is under these conditions for May to July, when the strongest inversions are expected to occur throughout the study area. The inversions are expected to be stronger over the whole of the interior than on the coast due to colder nigh time temperatures. 4.2 Ambient air quality The manganese freight line runs from the mines at Hotazel to the Port of Nqugra. It passes mostly through sparsely populated rural areas consisting of agricultural lands and natural vegetation. It also passes through a number of urban centres of varying sizes. Industrial activity in all of these is relatively limited consisting of small manufacturing concerns with limited emissions of pollutants to the atmosphere. On the southern part of the route in the Eastern Cape brick manufacturing and timber processing occurs. The most active industrial area on the route is the Coega IDZ where current industrial sources include boilers at Coega Dairy and Cape Concentrates, and a furnace at EC Biomass. Emissions from these boilers, brick manufacturing and timber processing will include sulphur dioxide (SO2),
AIR QUALITY BASELINE ASSESSMENT FOR THE NQUGRA MANGANESE FREIGHT LINE EIA PROJECT
10
oxides of nitrogen (NOX) and particulate matter including respireable PM10 and PM2.5. In Hotazel mining, ore processing and handling are sources of particulates. In unelectrified homes in residential areas along the routs wood and other fuels are burnt for cooking and space heating. In winter typically more fuel is burnt than in summer because of the colder temperatures. Pollutants associated with wood burning include CO, NOX and particulates. Vegetation burning for agricultural purposes and other forms of land management are also sources of gaseous and particulate pollutants. There are no measurements of ambient air quality on the manganese freight line except in the Coega IDZ and at Van Zyl’s Rus and Kuruman in the Northern Cape. In the Coega IDZ NO2, and PM10 monitored at Amsterdamplein, Motherwell and Saltworks during 2009, 2010 and 2011 provide an indication of the current ambient air quality status in the Coega IDZ (C&M Consulting Engineers, 2009; 2010; 2011). The highest concentrations typically occur in the winter months, between June and October, and are most likely attributed to local scale biomass burning and the trapping of industrial emissions by stable atmospheric conditions. Despite a few reported spikes in data in 2009, ambient SO2 and NO2 concentrations in 2009- 2011 were generally low at all three of the monitoring sites and well below standards. PM10 concentrations were exceeded at Amsterdamplein in 2011, and were otherwise below the current and 2015 standards. At the mines and ore handling facilities in the Northern Cape, ambient particulate concentrations are expected to be relatively high. Air quality is expected to be relatively good and this is shown by manganese monitoring at Van Zyl’s Rs and Kuruman. Measured concentrations at these residential sites are below the WHO annual ambient air quality guideline (DEA, 2009b). In the urbanised centres along the freight route, ambient air quality is expected to be generally good and possibly only impacted on by emissions from sources such as small industrial boilers and motor vehicles. In residential areas that the freight line runs close to, where wood and other biomass fuels are used for heating and cooking, air quality may to be poor. In the evenings and early mornings when fires are made, especially in winter air quality in these areas will be most impacted. Elsewhere along the route ambient air quality is expected to be very good. 5. REFERENCES C & M Consulting Engineers, (2009): Coega annual ambient air quality report: January
2009 - December 2009, Prepared for the Coega Development Corporation, Report no. CN519-AR-Y1
C & M Consulting Engineers, (2010): Coega annual ambient air quality report: January 2010- December 2010, Prepared for the Coega Development Corporation, Report no. CN519-AR-Y2
C & M Consulting Engineers, (2011): Coega annual ambient air quality report: January 2011- December 2011, Prepared for the Coega Development Corporation, Report no. CN519-AR-Y3
CCINFO, (1998): The Canadian Centre for Occupational Health and Safety database. http://ccinfoweb.ccohs.ca visited on 21 July 2003.
EAE, (2006): Encyclopaedia of the Atmospheric Environment, 2006, Nitrogen [Online], http://www.ace.mmu.ac.uk/eae/Air_Quality/Older/Nitrogen_Dioxide.html
DEA, (2009a): National Ambient Air Quality Standards, DEA, 32861, Vol. 1210, 24 December 2009.
AIR QUALITY BASELINE ASSESSMENT FOR THE NQUGRA MANGANESE FREIGHT LINE EIA PROJECT
11
DEA, (2009b): State of Air Report 2005, A Report on the State of Air in South Africa, ISBN 978-0-621-38724-7.
DEA, (2010): Listed Activities and Associated Minimum Emission Standards indentified in terms of Section 21 of the Air Quality Act, Act No. 39 of 2004, DEA, 33064.
DEA, (2011): Draft National Dust Control Regulations in terms of the National Environmental of the Air Quality Act, Act No. 39 of 2004, Notice 309 of 2011, Government Gazette, 34307.
DEA, (2012): Proposed National Ambient Air Quality Standard for Particulate Matter of Aerodynamic Diameter less than 2.5 micrometers, Notice 515 of 2011, Government Gazette, 34493.
Transnet (2012): Nqugra 16 Mta Manganese Rail Scope of Work, 4 June 2012. WHO, (1997): Guidance for setting air quality standards. Report on a Working Group.
Barcelona, Spain 12-14. WHO, (1999): Guidelines for Air Quality, World Health Organisation,
http://www.who.int/peh/air/Airqualitygd.htm WHO, (2000): Air Quality Guidelines for Europe, 2nd Edition, World Health Organisation,
ISBN 92 890 1358 3. WHO, (2005): WHO Air quality guidelines for particulate matter, ozone, nitrogen dioxide
and sulphur dioxide, Global update 2005, Summary of risk assessment, WHO/SDE/PHE/OEH/06.02.
Related Documents