Air Quality, Atmospheric Deposition, and Lake Tahoe October 15, 2003 Western Regional Pollution Prevention Network Grannlibakken, Lake Tahoe Jim Pederson Research Division, California Air Resources Board

Air Quality, Atmospheric Deposition, and Lake Tahoe October 15, 2003 Western Regional Pollution Prevention Network Grannlibakken, Lake Tahoe Jim Pederson.
Dec 27, 2015
Welcome message from author
This document is posted to help you gain knowledge. Please leave a comment to let me know what you think about it! Share it to your friends and learn new things together.
Transcript

Air Quality, Atmospheric Deposition, and Lake Tahoe
October 15, 2003Western Regional Pollution Prevention Network
Grannlibakken, Lake Tahoe
Jim PedersonResearch Division,
California Air Resources Board
Outline of Topics
• Air Quality Terminology
• Air Quality Trends
• Atmospheric Deposition
• Lake Tahoe Atmospheric Deposition Study

Air Chemistry Sampler
• Atmospheric Reactions of NOX and VOCs
– NOX and VOCs + Sunlight O3 + PM
– Hydroxyl radical (OH) and ozone from sunlight-initiated reactions of NOX and VOCs
– NO2 + OH HNO3 (nitric acid, 5-30% per hour)
– HNO3 + NH3 NH4NO3 (ammonium nitrate)• at low sulfuric acid, low temperatures, and wet conditions
– Other N species: PAN, HONO, NO3, N2O5

“Criteria” Pollutants
• AQ Standards -- Acute Exposures
• Human Health or Welfare
• “Non-Attainment” Areas
• Control Strategies in State Implementation Plans (SIPs)
• e.g. Particle Mass -- PM10, PM2 Ozone, Nitrogen Dioxide, Sulfur Dioxide, Carbon Monoxide,
“Toxic” Air Contaminants
• Formal Identification
• Risk Assessment
• Long-Term Health Effects– e.g., cancer, birth defects
• Control
• Reduction of Exposures
Direct Emissions and Secondary Pollutants
• Directly Emitted Pollutants – CO, NO, NO2, VOCs,, NH3, some PM
• Products Formed in Atmosphere: – Ozone, some PM, HNO3
• NOx and VOCs regulated as precursors of ozone or PM

Why Regulate Particles?
HEALTH
Health effects are significant
Premature death and cardiorespiratory disease
Body of evidence is substantial
WELFARE
Reduced visibility
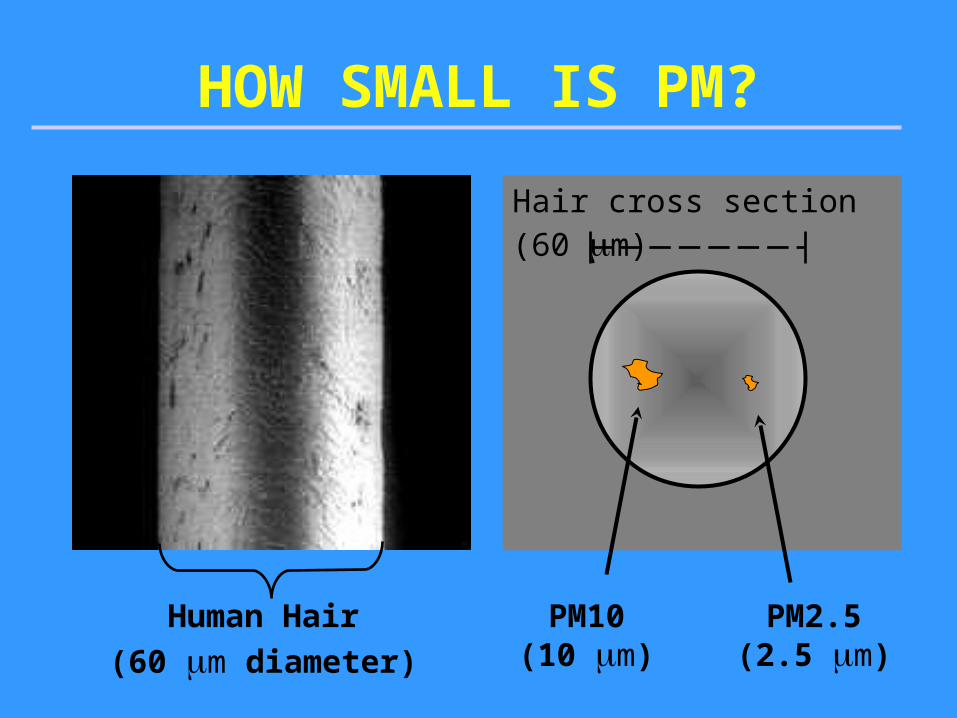
HOW SMALL IS PM?
Human Hair
(60 m diameter)
PM10(10 m)
PM2.5(2.5 m)
Hair cross section (60 m)
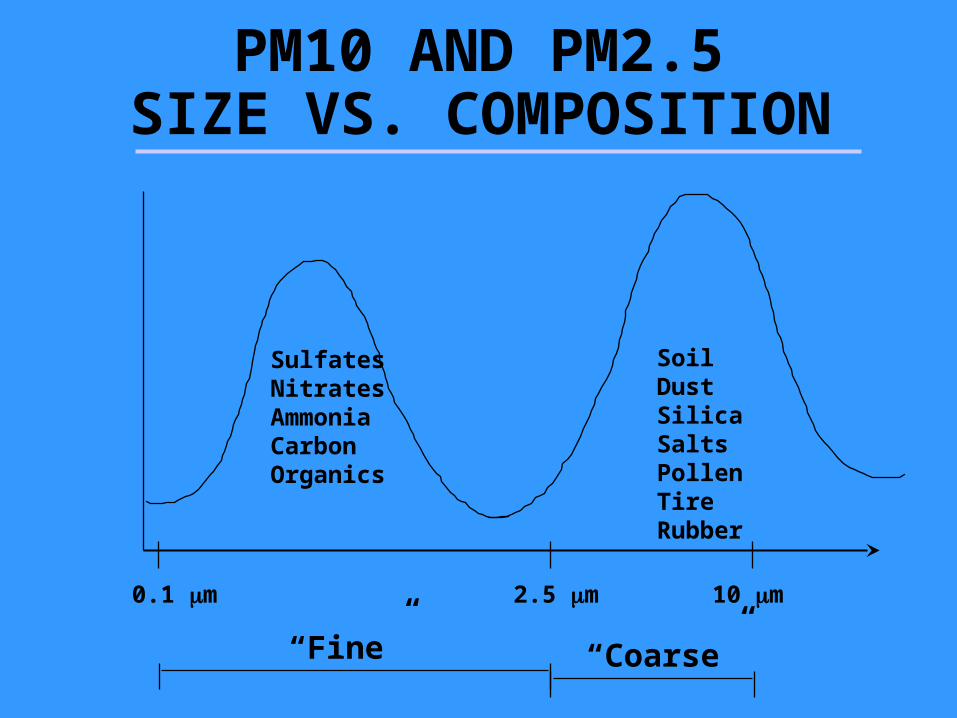
10 m0.1 m
SulfatesNitratesAmmoniaCarbonOrganics
SoilDustSilicaSaltsPollenTire Rubber
2.5 m
PM10 AND PM2.5 SIZE VS. COMPOSITION
“Coarse”“Fine”
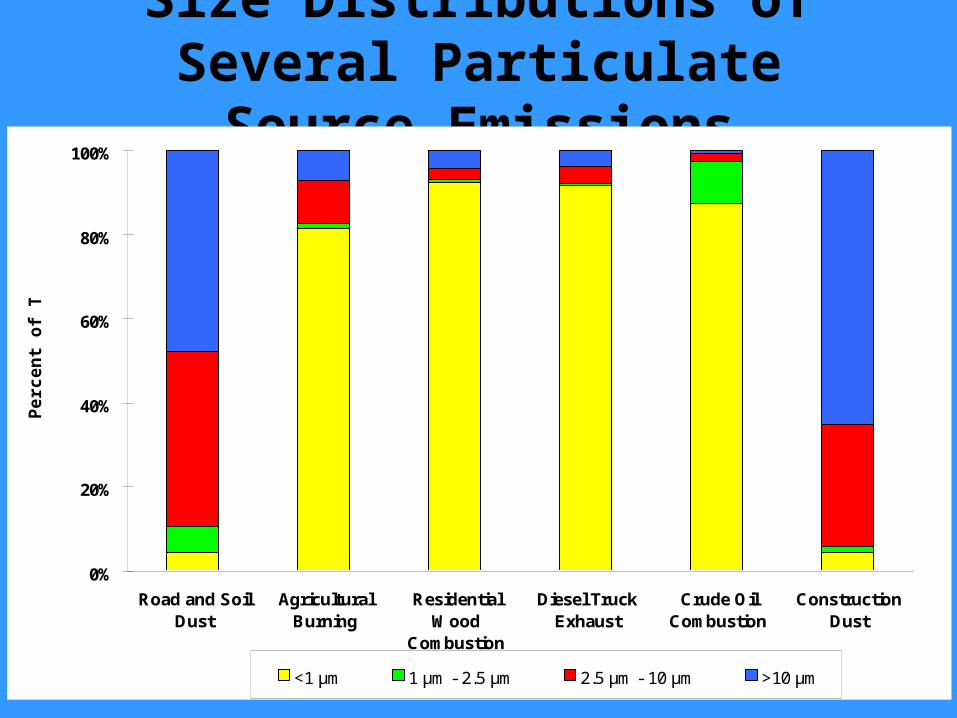
Size Distributions of Several Particulate Source Emissions
0%
20%
40%
60%
80%
100%
Road and SoilDust
AgriculturalBurning
ResidentialWood
Combustion
Diesel TruckExhaust
Crude OilCombustion
ConstructionDust
Per
cen
t o
f T
SP
<1 µm 1 µm - 2.5 µm 2.5 µm - 10 µm >10 µm
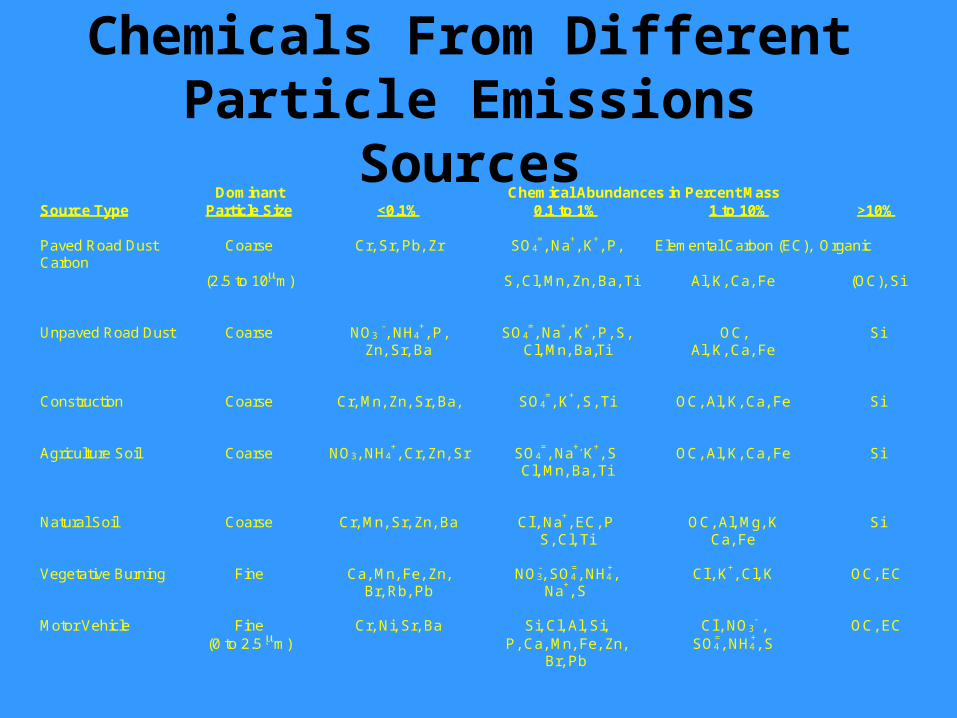
Chemicals From Different Particle Emissions Sources
Dominant Chemical Abundances in Percent MassSource Type Particle Size <0.1% 0.1 to 1% 1 to 10% >10%
Paved Road Dust Coarse Cr, Sr, Pb, Zr SO4=, Na+, K+, P, Elemental Carbon (EC), Organic
Carbon(2.5 to 10m) S, Cl, Mn, Zn, Ba, Ti Al, K, Ca, Fe (OC), Si
Unpaved Road Dust Coarse NO3 -, NH4
+, P, SO4=, Na+, K+, P, S, OC, Si
Zn, Sr, Ba Cl, Mn, Ba,Ti Al, K, Ca, Fe
Construction Coarse Cr, Mn, Zn, Sr, Ba, SO4=, K+, S, Ti OC, Al, K, Ca, Fe Si
Agriculture Soil Coarse NO3, NH4+, Cr, Zn, Sr SO4
=, Na+, K+, S OC, Al, K, Ca, Fe SiCl, Mn, Ba, Ti
Natural Soil Coarse Cr, Mn, Sr, Zn, Ba Cl-, Na+, EC, P OC, Al, Mg, K SiS, Cl, Ti Ca, Fe
Vegetative Burning Fine Ca, Mn, Fe, Zn, NO3-, SO4
=, NH4+, Cl-, K+, Cl, K OC, EC
Br, Rb, Pb Na+, S
Motor Vehicle Fine Cr, Ni, Sr, Ba Si, Cl, Al, Si, Cl-, NO3- , OC, EC
(0 to 2.5 m) P, Ca, Mn, Fe, Zn, SO4=, NH4
+, SBr, Pb
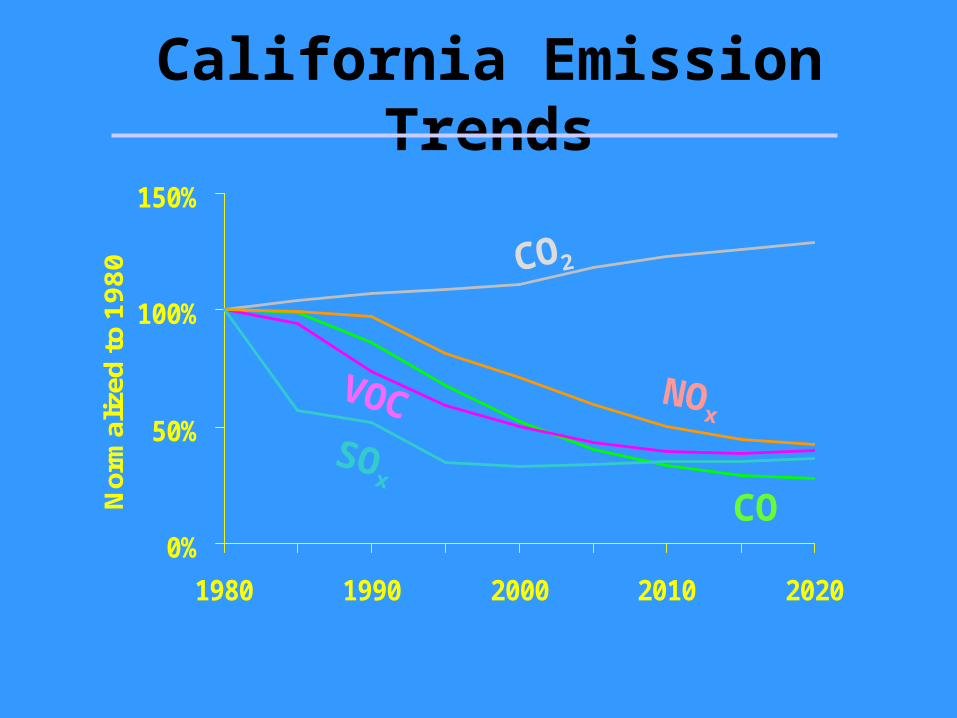
California Emission Trends
0%
50%
100%
150%
1980 1990 2000 2010 2020
Nor
mal
ized
to
1980 CO2
NOx
SOx
VOC
CO

Ozone and NOX Trends
1-hour Maximum NOX and Ozone Trends South Coast Air Basin (summers, Jun-Aug)
0
25
50
75
100
125
150
1980 1982 1984 1986 1988 1990 1992 1994 1996 1998 2000
NO
X a
nd O
zone
(pp
b)
0
500
1000
1500
2000
2500
3000
3500
4000
NO
X a
nd R
OG
em
issi
ons
(ton
s/da
y)O3
NOX
Trend statistic: 32 site mean of daily peak 1-hour concentrationsTrend line: Moving 3-year mean
ROG emissionsNOX emissions

NOX and PM10-nitrate Trends South Coast Air Basin
0
2
4
6
8
10
12
14
16
1985 1986 1987 1988 1989 1990 1991 1992 1993 1994 1995 1996 1997 1998 1999 2000
Nitr
ate(
µg/m
3)
0
2
4
6
8
10
NO
X (
pphm
)
NO3-
NOX
Trend statistic: 12 site mean of matched 24-hour mean concentrationsTrend line: Moving 3-year mean

NOX and PM10-nitrate Trends San Joaquin Valley (Winters, Nov-Feb)
0
5
10
15
20
25
30
1985 1986 1987 1988 1989 1990 1991 1992 1993 1994 1995 1996 1997 1998 1999 2000
Nitr
ate(
µg/m
3 )
0
1
2
3
4
5
6
7
8
9
10
NO
X (p
phm
)
NO3-
NOX
Trend statistic: 9 site mean of matched 24-hour mean concentrationsTrend line: Moving 3-year mean
Historical Perspective on Ozone
• 1959 Haagen-Smit paper
• 1970s Ozone frequently 600 ppb
• Today Ozone rarely exceeds 200 ppb – Pop., Vehicles/person, Miles/vehicle all up– Reduced Both NOx and VOC Emissions
• Health Based NAAQS is 120 ppb
What Sets Deposition Rates?
• Concentration
• Largest Particles: – Settling velocity (PM size, density)
• Gases and Smaller Particles:– Multiple Rate Limiting Steps
• Deposition Velocity– Deposition Rate/Concentration– Normalized Rate - Not Process– Differentiate from Setting Velocity

Deposition of Gases and PM1. Turbulence mixes pollutants toward “sink”
– Atmospheric turbulence set by wind speed, surface roughness (decreased by thermal stratification)
– Aerodynamic Resistance
2. Diffusion across very thin laminar layer– Depth of layer (wind speed. surface elements)
– Rate of diffusion (particle size, molecular weight)
– Quasi-laminar Resistance
3. Capture by surface – Pollutant solubility, chemical reactivity
– Surface type, biophysical factors (stomatal opening)
– Surface Resistance
Three-Step Deposition Model
• Resistance Analogy
– Aerodynamic Resistance
– Laminar Layer Resistance
– Surface Resistance
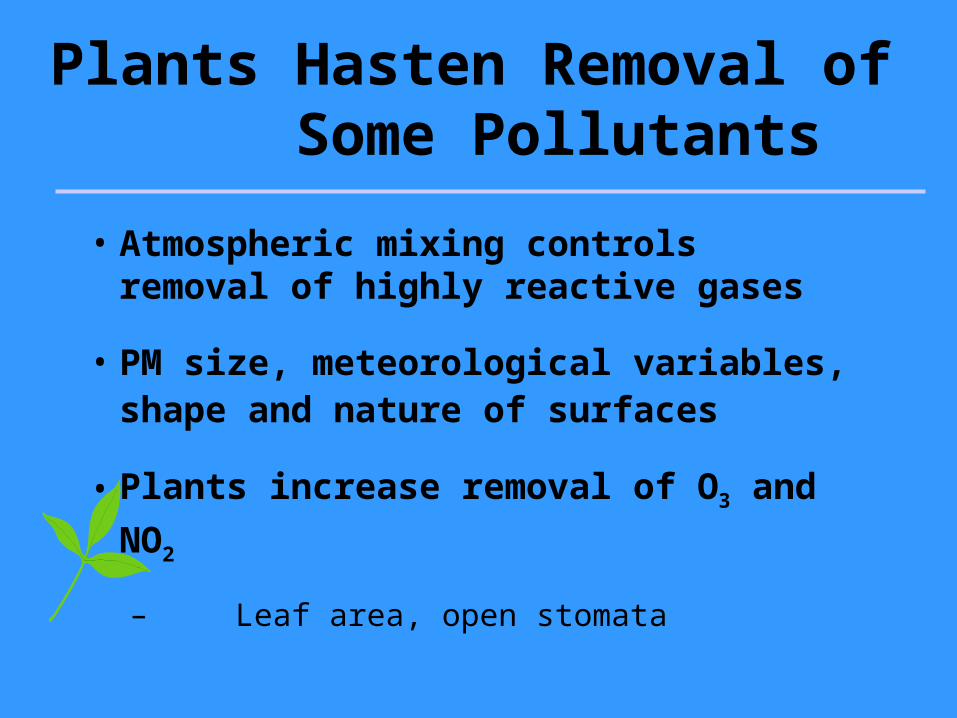
Plants Hasten Removal of Some Pollutants
• Atmospheric mixing controls removal of highly reactive gases
• PM size, meteorological variables, shape and nature of surfaces
• Plants increase removal of O3 and NO2
– Leaf area, open stomata
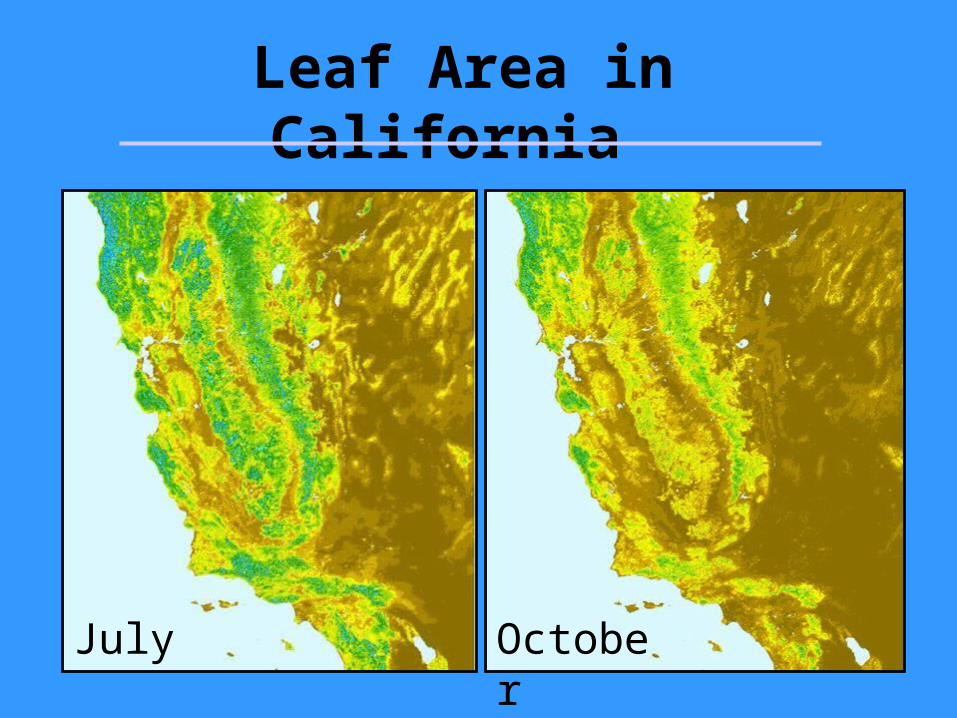
Leaf Area in California
OctoberJuly

Rate of Deposition of Gases to Water
• Highly Reactive or Soluble?– Surface Resistance ~ 0– Aerodynamic Resistance Sets Rate
• What determines turbulence? – Wind speed, Direction, Fetch – Thermal Stratification
• Relatively Insoluble Gas? – Surface Resistance Sets Rate
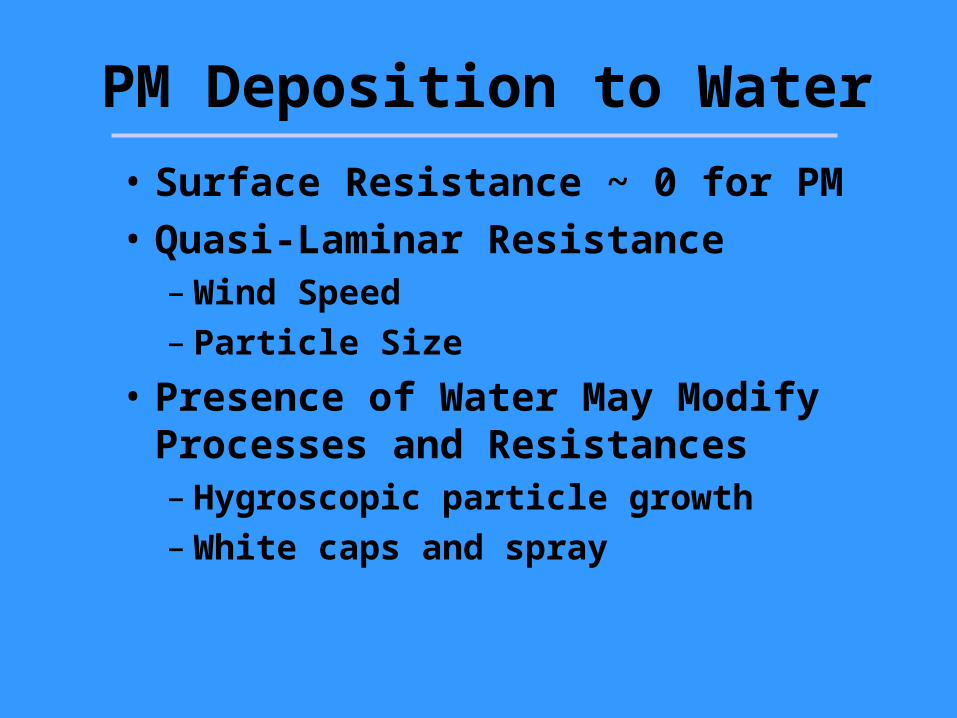
PM Deposition to Water
• Surface Resistance ~ 0 for PM• Quasi-Laminar Resistance
– Wind Speed– Particle Size
• Presence of Water May Modify Processes and Resistances– Hygroscopic particle growth– White caps and spray
Lake Tahoe Atmospheric
Deposition Study

• Objectives
• Methods and Equipment
• Special Studies
• Calculations
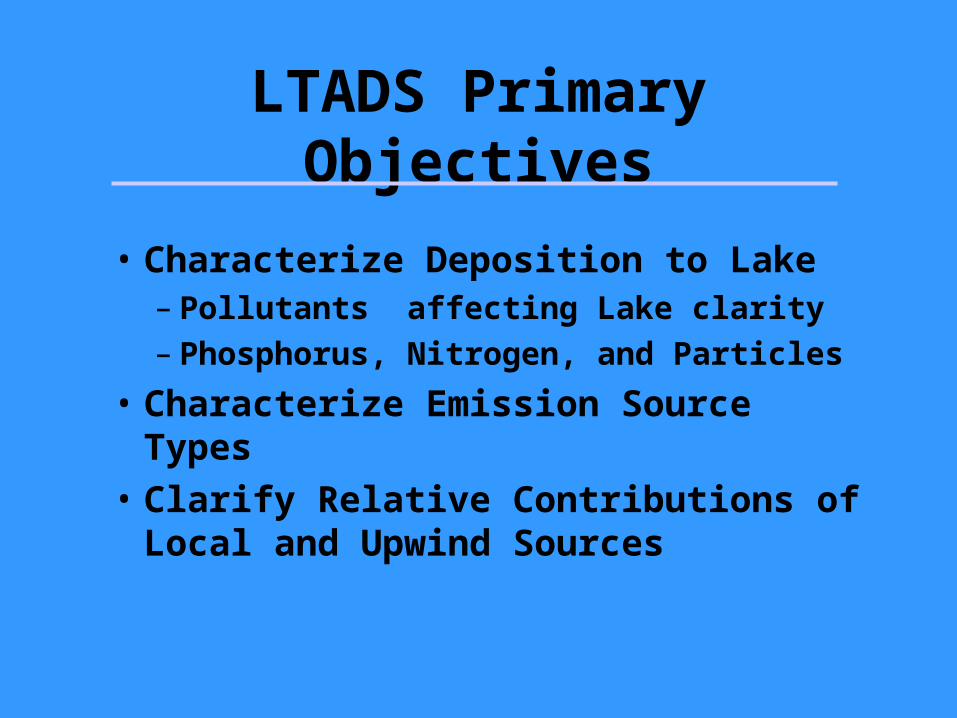
LTADS Primary Objectives
• Characterize Deposition to Lake– Pollutants affecting Lake clarity– Phosphorus, Nitrogen, and Particles
• Characterize Emission Source Types
• Clarify Relative Contributions of Local and Upwind Sources
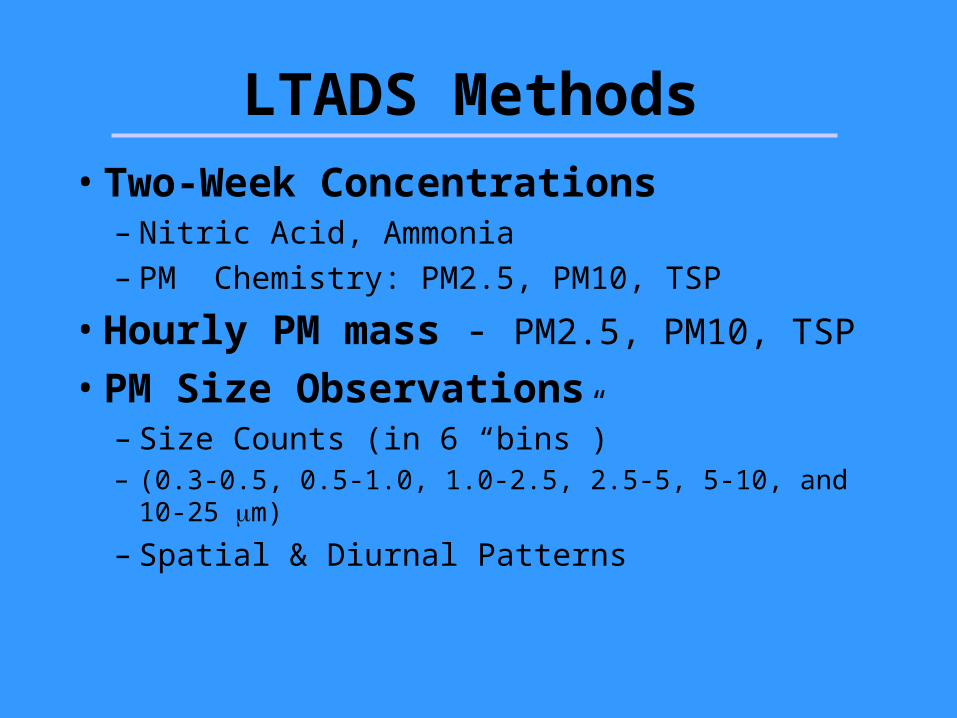
LTADS Methods
• Two-Week Concentrations– Nitric Acid, Ammonia– PM Chemistry: PM2.5, PM10, TSP
• Hourly PM mass - PM2.5, PM10, TSP
• PM Size Observations– Size Counts (in 6 “bins”) – (0.3-0.5, 0.5-1.0, 1.0-2.5, 2.5-5, 5-10, and 10-25 m)
– Spatial & Diurnal Patterns
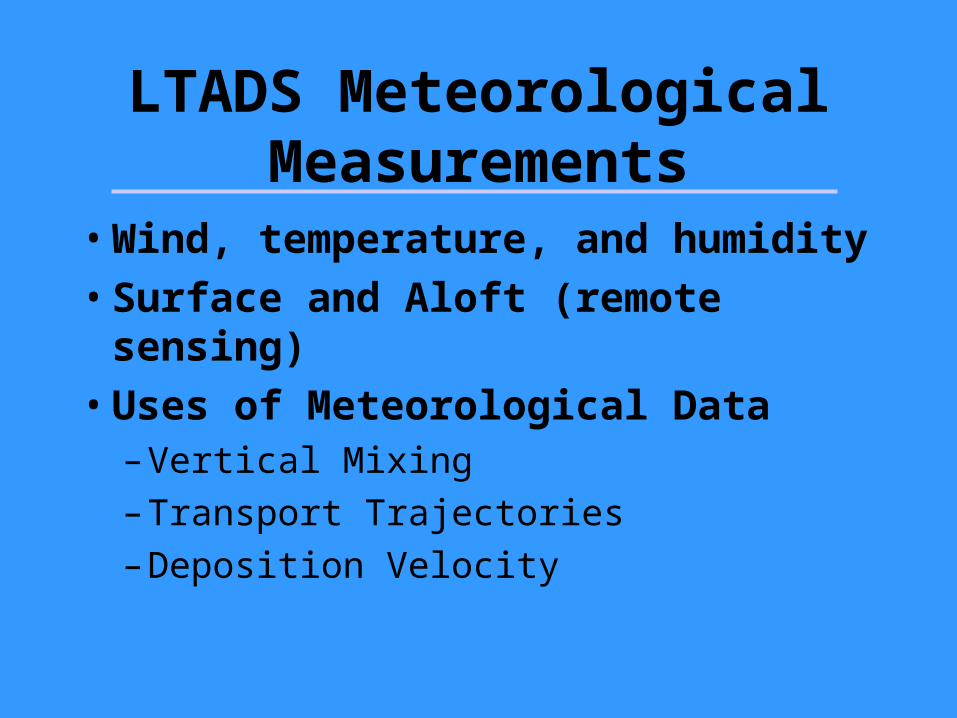
LTADS Meteorological Measurements
• Wind, temperature, and humidity
• Surface and Aloft (remote sensing)
• Uses of Meteorological Data– Vertical Mixing
– Transport Trajectories
– Deposition Velocity
6
4
2
13
3
11
14
10
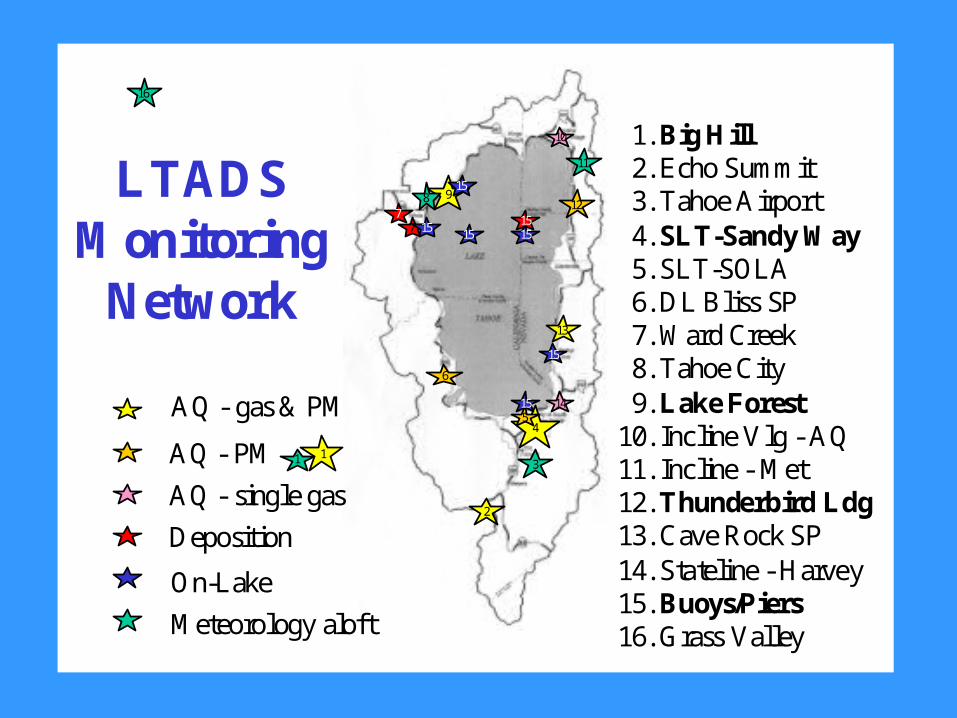
LTADSMonitoring
Network
15
15
7
AQ - gas & PM
AQ - PM
AQ - single gas
Deposition
On-Lake
9
1
15
1. Big Hill 2. Echo Summit 3. Tahoe Airport 4. SLT-Sandy Way 5. SLT-SOLA 6. DL Bliss SP 7. Ward Creek 8. Tahoe City 9. Lake Forest10. Incline Vlg - AQ11. Incline - Met12. Thunderbird Ldg13. Cave Rock SP14. Stateline - Harvey15. Buoys/Piers16. Grass Valley
5
1215
157
Meteorology aloft
16
15
158
1
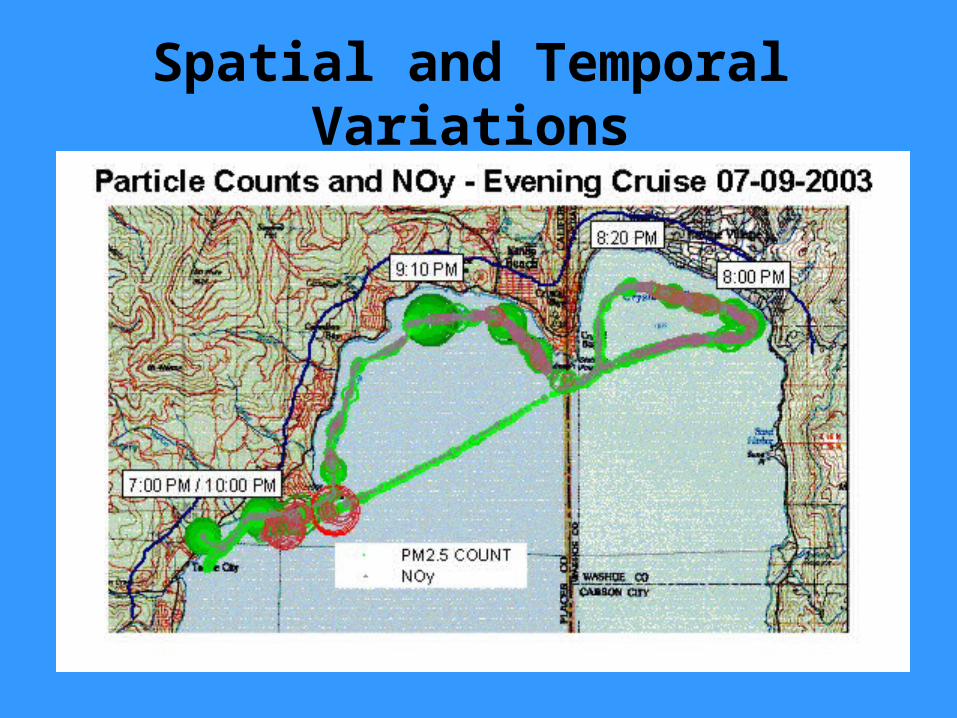
Spatial and Temporal Variations
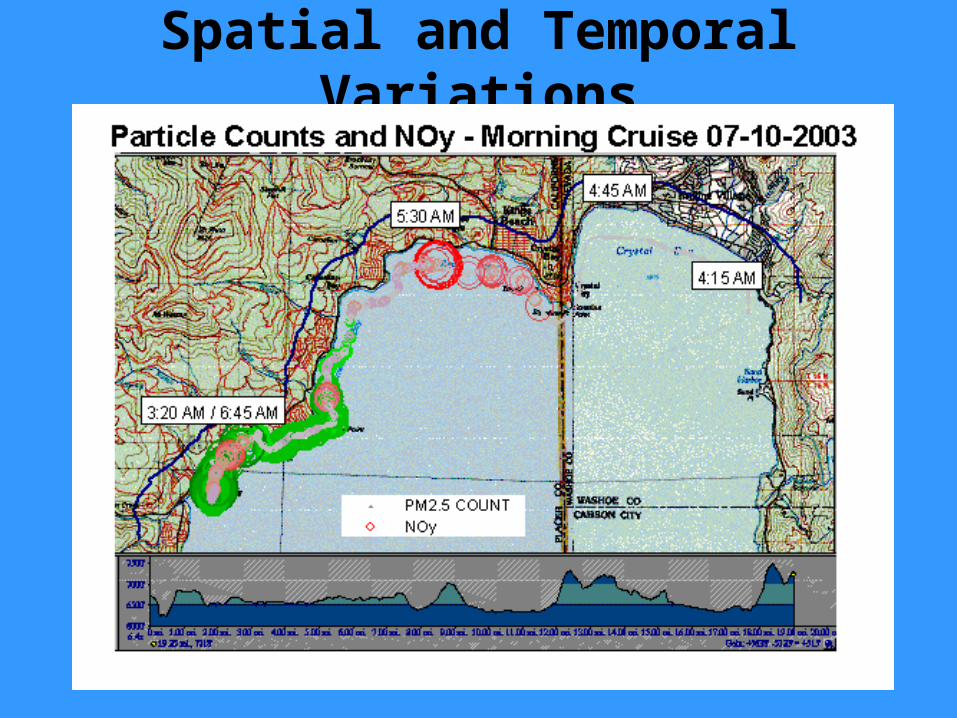
Spatial and Temporal Variations

Calculation of Deposition
• Estimate Deposition Velocities
• Spatial and Temporal Variation of– Concentration– Deposition Velocity
• Calculate Deposition Rate – (Concentration x Deposition Velocity)
• Analysis of Uncertainty• Bounding Calculations
Related Documents