Mike Hilton Senior VP and GM, Electronics and Performance Materials Bank of America BASics / Industrials Conference May 7, 2008

air products & chemicals 7 May 2008 Bankof America BASics
Jul 18, 2015
Welcome message from author
This document is posted to help you gain knowledge. Please leave a comment to let me know what you think about it! Share it to your friends and learn new things together.
Transcript

Mike HiltonSenior VP and GM, Electronics and Performance MaterialsBank of AmericaBASics / Industrials ConferenceMay 7, 2008
2
ForwardForward--Looking Statements Looking Statements NOTE: This document contains “forward-looking statements” within the safe harbor provisions of the Private Securities Litigation Reform Act of 1995. These forward-looking statements are based on management’s reasonable expectations and assumptions as of the date of this document regarding important risk factors. Actual performance and financial results may differ materially from projections and estimates expressed in the forward-looking statements because of many factors, including, without limitation, overall economic and business conditions different than those currently anticipated; future financial and operating performance of major customers and industries served by the Company; the impact of competitive products and pricing; interruption in ordinary sources of supply of raw materials; the ability to recover unanticipated increased energy and raw material costs from customers; costs and outcomes of litigation or regulatory activities; consequences of acts of war or terrorism impacting the United States’ and other markets; the effects of a pandemic or a natural disaster; the ability to attract, hire and retain qualified personnel in all regions of the world where the company operates; charges related to portfolio management, goodwill recoverability, business restructuring and cost reduction actions; the success of implementing cost reduction programs; the timing, impact, and other uncertainties of future acquisitions or divestitures; unanticipated contract terminations or customer cancellation or postponement of projects or sales; significant fluctuations in interest rates and foreign currencies from that currently anticipated; the continued availability of capital funding sources in all of the company's foreign operations; the impact of new or changed environmental, healthcare, tax or other legislation and regulations in jurisdictions in which the Company and its affiliates operate; the impact of new or changed financial accounting standards; and the timing and rate at which tax credits can be utilized. The Company disclaims any obligation or undertaking to disseminate any updates or revisions to any forward-looking statements contained in this document to reflect any change in the Company’s assumptions, beliefs or expectations or any change in events, conditions or circumstances upon which any such forward-looking statements are based.

3
Air Products Air Products At a glanceAt a glance
$10B companyDiverse markets and geographiesPositioned for continued long-term value creation
FY07 Geographic Sales
United States(44%)
Asia(17%)
Europe(32%)
Canada/LatinAmerica (5%)
FY07 Segment SalesROW (2%)
MerchantGases(34%)
TonnageGases(31%)
Equipment & Energy
(6%)Healthcare
(7%)Electronics &
Performance Materials(22%)

4
Air Products Value PropositionAir Products Value PropositionProfitable GrowthProfitable Growth
Stability– Long term contracts– Consistent and predictable
cash flows – Strong balance sheet
Growth– Solid project backlog– High bidding activity– Energy opportunities
Improving returns– Margin improvement– Productivity– Increasing dividends– Share buyback

5
Supply Modes Supply Modes Durable Business ModelsDurable Business Models
Package Gases & Specialty Materials
25%
Onsite/Pipeline36%
Liquid/Bulk21%
10, 15 and 20-year contractsTake-or-pay
Contractual energy pass-throughFormula escalation
3-5 year contractsRegional business
Cost pass-through/surcharges
Equipment & Services 18%
66
Lesscyclical
Higherreturn
Higher growth
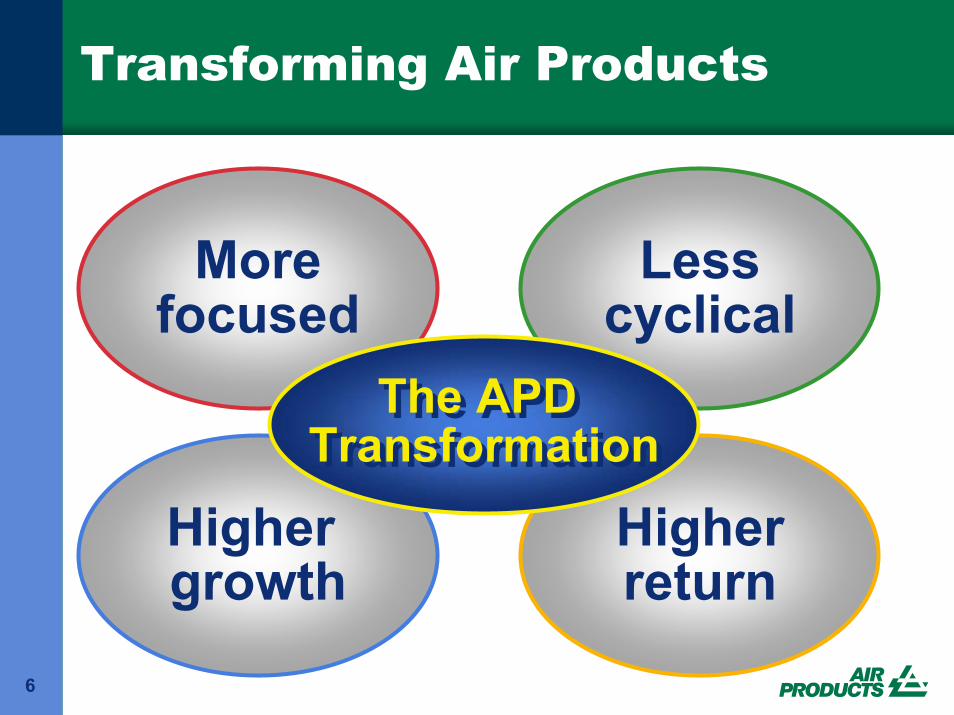
Morefocused
Morefocused
Lesscyclical
Higherreturn
Higher growth
Transforming Air Products
The APDTransformation
The APDTransformation
7
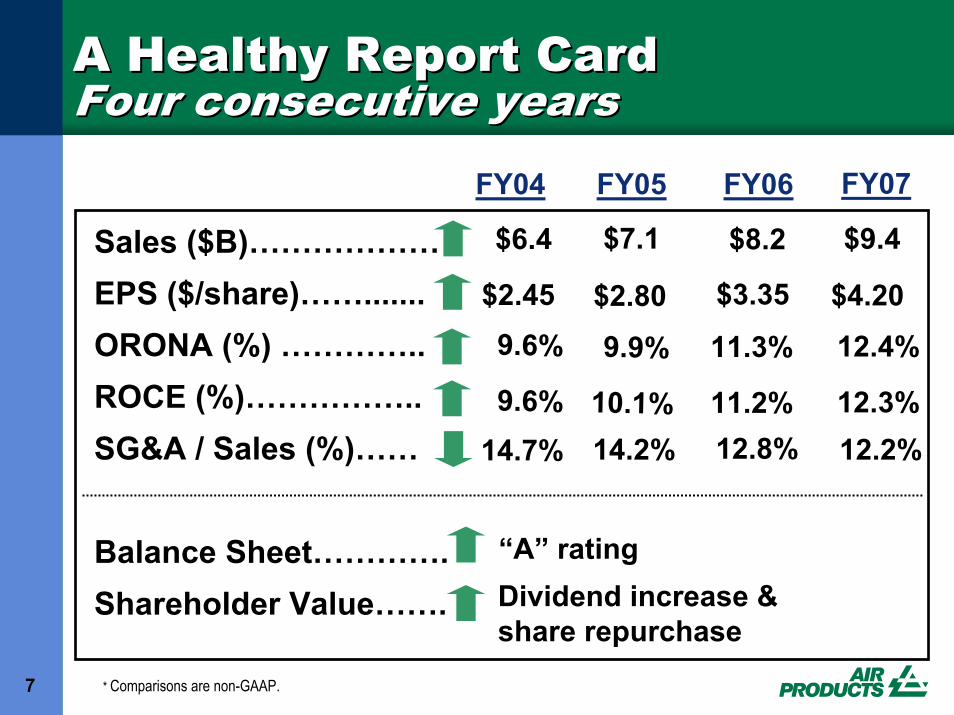
Sales ($B)………………EPS ($/share)…….......ORONA (%) …………..ROCE (%)……………..SG&A / Sales (%)……
Balance Sheet………….Shareholder Value…….
A Healthy Report CardA Healthy Report CardFour consecutive yearsFour consecutive years
9.6%$2.45
14.7%
“A” ratingDividend increase & share repurchase
$6.4 $7.1 $8.2
FY04 FY05 FY06
$2.80 $3.35
9.9%
14.2% 12.8%
11.3%
FY07
$9.4
$4.20
12.4%
12.2%9.6% 10.1% 11.2% 12.3%
* Comparisons are non-GAAP.

8
Sales ($B) $4.8 $5.1 11%
SG&A as a % of Sales 12.2% 12.0% (20bp)
Operating Margin 13.7% 14.5% 80bp
Diluted EPS ($/share) $1.96 $2.39 22%
ROCE (%) 11.7% 12.4% 70bp
Q2 YTD Q2 YTDFY07 FY08 Change
Consolidated Consolidated ’’08 YTD Financials:08 YTD Financials:Delivering LeverageDelivering Leverage
Comparisons are non-GAAP
9
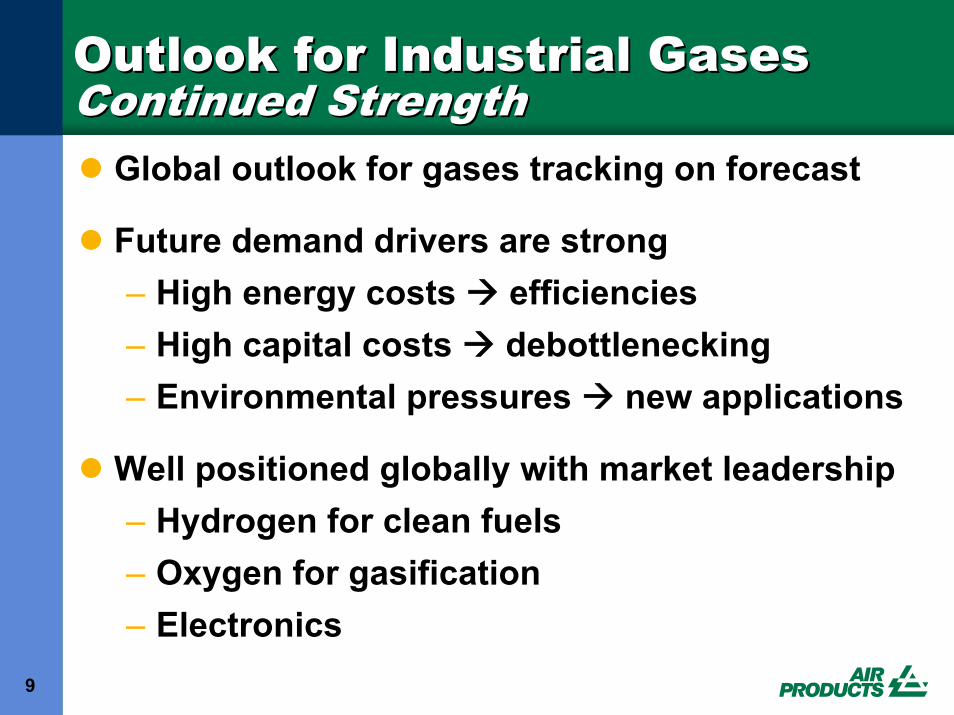
Outlook for Industrial GasesOutlook for Industrial GasesContinued StrengthContinued Strength
Global outlook for gases tracking on forecast
Future demand drivers are strong– High energy costs efficiencies– High capital costs debottlenecking– Environmental pressures new applications
Well positioned globally with market leadership– Hydrogen for clean fuels– Oxygen for gasification– Electronics
10
Electronics & Performance Materials:Electronics & Performance Materials:A natural extension of whatA natural extension of whatAir Products does bestAir Products does best
$2B+ segment under-pinned by technology, innovationFranchise positions / global leadershipStrategic positions with leading customers Operationally excellent global supply chainGlobal process engineering capabilityLeading edge applied technology
11
ElectronicsElectronicsContinued Strong GrowthContinued Strong Growth
Global leader, double-digit top-line growth~$1.3 billion bulk gas, specialty material and equipment businessDriven principally by: – Semiconductor (~85%)– LCD (~10%)
Board markets: Silicon and compound semiconductors, flat panel displays, photovoltaic devicesBusiness trends:– New materials for 45nm– Asia growth– Product simplification & controlling the
value chain

12
Performance MaterialsPerformance MaterialsGrowth through DifferentiationGrowth through Differentiation
A global platform with >$700MM in sales#1 or #2 positions in targeted markets– Performance-based sale
3 key product lines + new initiative platforms– Epoxy curing agents– Specialty surfactants– Polyurethane additives
~50% of sales outside of North AmericaFormulated products that drive leadership positionsGlobal supply chain, R&D, applied technology infrastructure

13
Electronics & Performance MaterialsElectronics & Performance MaterialsPerformance MetricsPerformance Metrics
Sales
0
500
1000
1500
2000
2500
2004 2005 2006 2007
Operating Income & Margin
0
50
100
150
200
250
2004 2005 2006 20070.0%
3.0%
6.0%
9.0%
12.0%
15.0%$MM $MM
11% CAGR
Asia (40%)
North America (40%)
Latin America (2%)Europe
(18%)
Revenue by region ($, FY07) • Strong top line growth over the past four years
• Excellent profit and return improvement
• Near term focus on further improvement:
Electronics Performance Materials- Continued strong hit rate - Mix improvement - Portfolio restructuring - Growth in adjacent
markets

14
2008 and Beyond2008 and BeyondSustainable DoubleSustainable Double--Digit GrowthDigit Growthat Superior Returnsat Superior Returns
Targeting sustainable double-digit EPS growth– 15% to 19% EPS growth in FY 08
● Targeting 300bp margin improvement over 3 years– Cost reduction and SG&A improvement– Accelerated productivity– 100 basis points in FY’08
Targeting a ROCE 3% to 5% above our cost of capital
More Focused, Less Cyclical,More Focused, Less Cyclical,Higher Growth, Higher ReturnsHigher Growth, Higher Returns

tell me morewww.airproducts.com
Thank you
Related Documents