Louisiana State University LSU Digital Commons LSU Historical Dissertations and eses Graduate School 1978 Air Pollution Studies by Laser Induced Infrared Fluorescence and Laser Intracavity Absorption Spectroscopy. Donald Eugene Neles Louisiana State University and Agricultural & Mechanical College Follow this and additional works at: hps://digitalcommons.lsu.edu/gradschool_disstheses is Dissertation is brought to you for free and open access by the Graduate School at LSU Digital Commons. It has been accepted for inclusion in LSU Historical Dissertations and eses by an authorized administrator of LSU Digital Commons. For more information, please contact [email protected]. Recommended Citation Neles, Donald Eugene, "Air Pollution Studies by Laser Induced Infrared Fluorescence and Laser Intracavity Absorption Spectroscopy." (1978). LSU Historical Dissertations and eses. 3254. hps://digitalcommons.lsu.edu/gradschool_disstheses/3254

Welcome message from author
This document is posted to help you gain knowledge. Please leave a comment to let me know what you think about it! Share it to your friends and learn new things together.
Transcript

Louisiana State UniversityLSU Digital Commons
LSU Historical Dissertations and Theses Graduate School
1978
Air Pollution Studies by Laser Induced InfraredFluorescence and Laser Intracavity AbsorptionSpectroscopy.Donald Eugene NettlesLouisiana State University and Agricultural & Mechanical College
Follow this and additional works at: https://digitalcommons.lsu.edu/gradschool_disstheses
This Dissertation is brought to you for free and open access by the Graduate School at LSU Digital Commons. It has been accepted for inclusion inLSU Historical Dissertations and Theses by an authorized administrator of LSU Digital Commons. For more information, please [email protected].
Recommended CitationNettles, Donald Eugene, "Air Pollution Studies by Laser Induced Infrared Fluorescence and Laser Intracavity AbsorptionSpectroscopy." (1978). LSU Historical Dissertations and Theses. 3254.https://digitalcommons.lsu.edu/gradschool_disstheses/3254
INFORMATION TO USERS
This material was produced from a microfilm copy of the original document. While the most advanced technological means to photograph and reproduce this document have been used, the quality is heavily dependent upon the quality of the original submitted.
The following explanation of techniques is provided to help you understand markings or patterns which may appear on this reproduction.
1. The sign or "target" for pages apparently lacking from the document photographed is "Missing Page(s)". If it was possible to obtain the missing page(s) or section, they are spliced into the film along with adjacent pages. This may have necessitated cutting thru an image and duplicating adjacent pages to insure you complete continuity.
2. When an image on the film is obliterated with a large round black mark, it is an indication that the photographer suspected that the copy may have moved during exposure and thus cause a blurred image. You will find a good image of the page in the adjacent frame.
3. When a map, drawing or chart, etc., was part of the material being photographed the photographer followed a definite method in "sectioning" the material. It is customary to begin photoing at the upper left hand comer of a large sheet and to continue photoing from left to right in equal sections with a small overlap. If necessary, sectioning is continued again — beginning below the first row and continuing on until complete.
4. The majority of users indicate that the textual content is of greatest value, however, a somewhat higher quality reproduction could be made from "photographs" if essential to the understanding of the dissertation. Silver prints of "photographs" may be ordered at additional charge by writing the Order Department, giving the catalog number, title, author and specific pages you wish reproduced.
6. PLEASE NOTE: Some pages may have indistinct print. Filmed as received.
University Microfilms International300 North Zeeb RoadAnn Arbor, Michigan 48106 USASt. John's Road, Tyler's QreenHigh Wycombe, Bucks, England HP10 8HR
79031A9
NETTLES* DONALD EUGENEAIR POLLUTION STUDIES BY LASER INDUCED IR FLUORESCENCE AND LASER INTRACAVITY ABSORPTION SPECTROSCOPY•
THE LOUISIANA STATE UNIVERSITY AND AGRICULTURAL AND HECHANICAL COL.* P H . D . , 1978
UnlversttvMicrofilms
In te m a ttO n a ] M O N . ZEEB ROAD, ANN ARBOR. Ml 4BI06
AIR POLLUTION STUDIES BY LASER INDUCED
IR FLUORESCENCE AND LASER INTRACAVITY ABSORPTION SPECTROSCOPY
A Dissertation
Submitted to the Graduate Faculty of the Louisiana State University and
Agricultural and Mechanical College in partial fulfillment of the requirements for the degree of
Doctor of Philosophy
inThe Department of Chemistry
by
Donald E. Nettles
B.S., Louisiana State University in New Orleans, 1972
August, 1978
DEDICATION
TOBeth who patiently and unselfishly made this
end possible.
i
ii
A C K N O W L E D G M E N T
The a u t h o r wi s h e s to express a p p r e c i a t i o n to
Dr. J. W. R o b i n s o n for his i n s t r uction, g u i d a n c e and
l e a d e r s h i p during the y e ars of g r a d u a t e w o r k at LSU.
He also w i s h e s to a c k n o w l e d g e the e n c o u r a g e m e n t and
i n s p i r a t i o n p r o v i d e d by P e t e r Jo w e t t and the support
of the o t h er g r oup members. In addition, G e o r g e Sexton,
Ralph Seab and Les Elin r e n d e r e d v a l u a b l e a s s i s t a n c e
in the r e s e a r c h p r o j e c t s and in the I n s t r u m e n t a l A n a l y s i s
Lab course. A s p e c i a l thanks is g i v e n to L i n d a Nettles
G r e e n e for her p a t i e n c e and the m a n y hours spent
u n s e l f i s h l y in typing this dissert a t i o n .
The au t h o r w i s h e s to ex t e n d a s p ecial thanks
to his m o t h e r and dad for their c o n t i n u a l s u p port and
e n c o u r a g e m e n t t h r o u g h o u t all phases of his education.
The a u t h o r a c k n o w l e d g e s f i n a n c i a l s u p p o r t
r e c e i v e d from the Dr. C h arles E. Coa t e s M e m o r i a l Fund
of LSU for the p r e p a r a t i o n of this d i s s e r t a t i o n .
ill
TABLE OF CONTENTS
pageA C K N O W L E D G M E N T ................................................. Ill
LIST OF T A B L E S ................................................. x
LIST OF F I G U R E S ................................................ xil
A B S T R A C T ......................................................... xv
I N T R O D U C T I O N .................................................... 1
A. Remote Sensing M e t h o d s ................................. 16
1. N o n-Laser T e c h n i q u e s ................................ 17
a. Long Path A b s o r p t i o n .......................... 17
b. Thermal E m i s s i o n ............................... 18
2. Laser T e c h n i q u e s .................................... 20
a. Elastic B a c k s c a t t e r ........................... 22
i. Rayleigh S c a t t e r .......................... 23
ii. Mie S c a t t e r ................................ 24
b. Raman B a c k s c a t t e r .............................. 26
c. Long Path A b s o r p t i o n .......................... 30
d. R e sonance B a c k s e a t t e r / E l e c t r o n i c ”E x c i t a t i o n ...................................... 38
e. IR F l u o r e s c e n c e ................................. 42
i. D e f i n i t i o n .................................. 42
ii. Studies P e r formed at L S U ............... 43
ill. Parameters Aff e c t i n g Las e r InducedIR F l u o r e s c e n c e .......................... 49
iv. A p p l i c a t i o n of Laser Induced IRF l u o r e s c e n c e to Remote Monitoring... 54
iv
ga&eB, Las e r I n t r a c a v i t y A b s o r p t i o n S p e c t r o s c o p y ........... 59
1. C r i t e r i a for L a s e r Line E x i s t e n c e ........... 65
2. L a s e r I n t r a c a v i t y A b s o r p t i o n C h a r a c t e r i s t i c s ...................................... 67
a. S e l e c t i v i t y . . . . . . . . . ......................... 6 8
b. S e n s i t i v i t y ............... 6 8
c. L a s e r M o d i n g .................................... 69
3. Las e r I n t r a c a v i t y A b s o r p t i o n as aP o l l u t a n t M o n i t o r i n g S y s t e m ............... 70
4. P a r a m e t e r s A f f e c t i n g L a s e r I n t r a c a v i t y A b s o r p t i o n ............................................. 71
a. L a s e r W a v e l e n g t h R a n g e ...................... 71
b. L a s e r L i n e W i d t h .............................. 72
c. D u m p i n g M i r r o r R e f l e c t i v i t y ................ 72
d. Sample Cell P o s i t i o n ......................... 73
e. L a s e r S t a b i l i t y ................................ 73
5. L a s e r I n t r a c a v i t y A b s o r p t i o n Usi n gDye L a s e r s .................. 75
6 . L a s e r I n t r a c a v i t y A b s o r p t i o n Usi n gGas L a s e r s ............................................. 76
E X P E R I M E N T A L ..................................................... 81
A. R e m o t e S e n s i n g ........................................ 81
1. E q u i p m e n t .............................................. 81
a . L a s e r s ............................................ 81
b. C h o p p e r ......... 81
c. P o w e r M o n i t o r . ................................. 81
d. F i l t e r S y s t e m ................................... 81
v
Pa«e
e. D e t e c t o r s ........................................ 81
f. A m p l i f i e r ........................................ 85
g. R e c o r d e r ......................................... 85
h . M i r r o r s .......................................... 85
1. L a m p .............................................. 8 6
j . Gas C e l l ......................................... 8 6
k. Infrared S p e c t r o p h o t o m e t e r .................. 8 6
2. System A l i g n m e n t . . . . . . ........................... 8 6
a. Initial Remote Sensing Configuration.... 8 6
b. First Modification of the RemoteSensing C o n f i g u r a t i o n ........................ 89
c. Laser Scatter S t u d i e s ........................ 93
i. Scatter from A s b e s t o s ................... 93
ii. Scatter from G l a s s ....................... 93
lii. Scatter from a Glass C e l l ...... 94
d. Further System M o d i f i c a t i o n ................ 96
e. Final System M o d i f i c a t i o n ............ 98
B. Laser Intracavity A b s o r p t i o n ......................... 101
1. Equipment and R e a g e n t s ............................ 101
a. L a s e r s ......................... 101
b. Laser Gas Mixing S y s t e m ..................... 101
c. C h o p p e r .......................................... 102
d. Power M o n i t o r ................................... 102
e. M o n o c h r o m a t o r ................................... 102
vi
Pagef. Scatter S i t e .................................... 102
g. D e t e c t o r . . . . ............................... 102
h. A m p l i f i e r .............................. 102
1. R e c o r d e r ......................................... 102
j . O p t i c s ....................................... 102
k. S y r i n g e .................. 103
1. Sample Mixing C h a m b e r * . . .................... 103
m. Sample C e l l ..................................... 103
n. R e a g e n t s ......................................... 103
2. System Configuration and A l i g n m e n t ............ 105
a. Initial System C o n f i g u r a t i o n ............... 105
b. First System M o d i f i c a t i o n ................... 109
c. Sample C e l l s .................................... Ill
d. Injection S y s t e m .............................. 112
e. Gas Scrubber S y s t e m .......................... 112
f. Final Equipment Configuration,N o n t u n a b l e ...................................... 114
g. Cooling System M o d i f i c a t i o n ................ 114
h. Equipment Configuration, Tunable - 1.... 114
i. Equipment Configuration, Tunable - 2.... 118
j. Equipment Configuration, Tunable - 3.... 119
3. Sample P r e p a r a t i o n ................................ 121
a. Gaseous S a m p l e s ................................ 121
b. Liquid S a m p l e s ................................. 121
vii
Fa&e
"4. Sample Injection and S t u d y ....................... 122
a. Laser System, Totally ReflectingM i r r o r ........................................... 122
b. Laser System, G r a t i n g ........................ 122
R E S U L T S ......................................................... 124
A. Remote S e n s i n g ........................................... 124
1. The Effect of Laser Power onFluorescence I n t e n s i t y ........................... 124
2. Spectral Regions O b s e r v e d ........................ 129
3. Detector S e l e c t i o n ........... 134
4. Phase Shift S t u d y .................................. 139
5. Time C o n s t a n t ........................................ 141
6 . Diurnal S t u d i e s ..................................... 142
B. Laser Intracavity Absorption S p e c t r o s c o p y....... 144
1. Laser Output C h a r a c t e r i s t i c s .................... 145
a. Laser G a i n ...................................... 145
b. Laser Output L i n e s ............................ 146
c. Laser S t a b i l i t y ................................ 152
1. Totally Reflecting Mirror System.... 152
11. Grating S y s t e m ........................... 152
2. Sample and Sample C o n c e n t r a t i o n ................ 156
a. Vinyl C h l o r i d e ................................ 156
b. P r o p y l e n e ...................................... 164
c. E t h y l e n e ........................................ 167
d. Ethyl C h l o r i d e ................................. 170
viii
e. 1 - B u t e n e ........................................ 173
3. Moded Laser L i n e s .................................. 173
4. I n t e r f e r e n c e s ........................................ 177
5. JG A m p l i f i e r ......................................... 184
6 . Temperature S t u d y .................................. 184
D I S C U S S I O N ..................................................... 193
A. Remote S e n s i n g ........................................... 193
1. Mechanisms of E x c i t a t i o n .......................... 195
a. Ground State A b s o r p t i o n ..................... 195
b. Thermal E x c i t a t i o n ........................... 196
c. Excited State A b s o r p t i o n ................... 196
d. Collision A c t i v a t i o n ......................... 197
e. Stepwise Multiphoton A b s o r p t i o n .......... 198
2. Simultaneous Multiphoton A b s o r p t i o n ........... 198
B. Laser Intracavity Absorption S p e c t r o s c o p y .......... 200
1. S e l e c t i v i t y . . 201
2. M o d i n g ................................................. 202
3. Interference Study for Vinyl ChlorideM o n i t o r i n g ........................................... 202
4. Tunable Laser S y s t e m ............................... 203
5. Laser Cavity Coolant Temperature S t u d y ....... 206
C O N C L U S I O N S .................................................... 208
A. Remote S e n s i n g ........................................... 208
B. Laser Intracavity Absorption S p e c t r o s c o p y .......... 208
R E F E R E N C E S ..................................................... 210
V I T A ............................................................. 217
ix
LIST OF TABLES
Table Page1. T r a n s m i s s i o n Range of Filters on Filter
W h e e l ..................................................... 82
2. Las e r S t ability Study 1 .............................. 126
3. Las e r Stability Study 2 .............................. 128
4. Las e r Output Pow e r with the O 2 ScrubberS y s t e m .................................................... 147
5. Las e r Output Lines with a TotallyR e f l e c t i n g M i r r o r ..................................... 149
6 . La s e r Output Lines of N o n t u n a b l e Laser - 1.... 150
7. L a s e r Ou t p u t Lines of N o n t u n a b l e L a s e r - 2.... 150
8 . Total Number of Ou t p u t Lines Obse r v e d w i t h E m p l o y m e n t of the G r a t i n g ........................... 153
9. C O 2 L a s e r Lines of the P - B r a n c h E x p e r i m e n t a l l y O b s e r v e d ( 0 0 ° 1 - 1 0 ° 0 ) ..... 153
10. C O 2 L a s e r Lines of the R - B r a n c h E x p e r i m e n t a l l y O b s e r v e d.. ( 0 0 ° 1 - 1 0 ® 0 ) ..... 154
11. C 0 2 L a s e r Lines of the P-BranchE x p e r i m e n t a l l y O b s e r v e d ( 0 0 ° l - 0 2 ® 0 ) ............ 155
12. C0« L a ser Lines of the R - B r a n c hE x p e r i m e n t a l l y O b s e r v e d ( 0 0 ® l - 0 2 ° 0 ) ............ 155
13. L a ser Output versus Vinyl ChlorideS ample I n j e c t i o n .......... ............... ............ 158
14. Las e r Out p u t versus P r o p y l e n e SampleI n j e c t i o n ................................................ 165
15. L a ser Output versus Ethy l e n e SampleI n j e c t i o n ................................................ 169
16. Las e r Output versus 1-Butene SampleI n j e c t i o n ................................................ 174
17. Las e r Lines Prod u c e d by 1% VinylC h l o r i d e in N 2 ......................................... 175
x
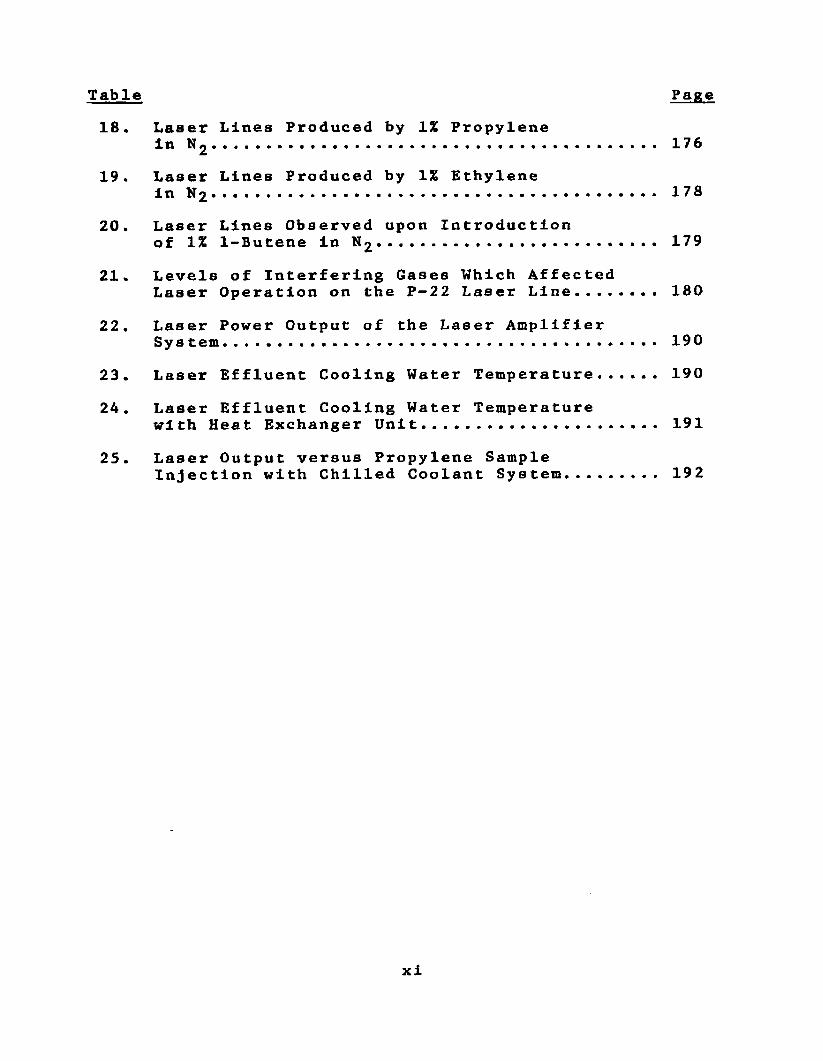
Table Page18. L a s e r L i n e s P r o d u c e d by 1% P r o p y l e n e
In N 2 ....................................................... 176
19. L a s e r Lin e s P r o d u c e d by 1% E t h y l e n ein N 2.............................................. 178
20. L a s e r L i n e s O b s e r v e d u p o n I n t r o d u c t i o nof 1 % 1 - B u t e n e In N 2 .................................. 179
21. L e v e l s of I n t e r f e r i n g Gas e s W h i c h A f f e c t e dL a s e r O p e r a t i o n on the P - 2 2 L a s e r L i n e .......... 180
22. L a s e r P o w e r O u t p u t of the L a s e r A m p l i f i e rSys tern..................................... 190
23. L a s e r E f f l u e n t C o o l i n g W a t e r T e m p e r a t u r e ........ 190
24. L a s e r E f f l u e n t C o o l i n g W a t e r T e m p e r a t u r ew i t h H e a t E x c h a n g e r U n i t . ................... 191
25. L a s e r O u t p u t v e r s u s P r o p y l e n e S a m p l eI n j e c t i o n w i t h C h i l l e d C o o l a n t S y s t e m ........... 192
xi
LIST OF FIGURES
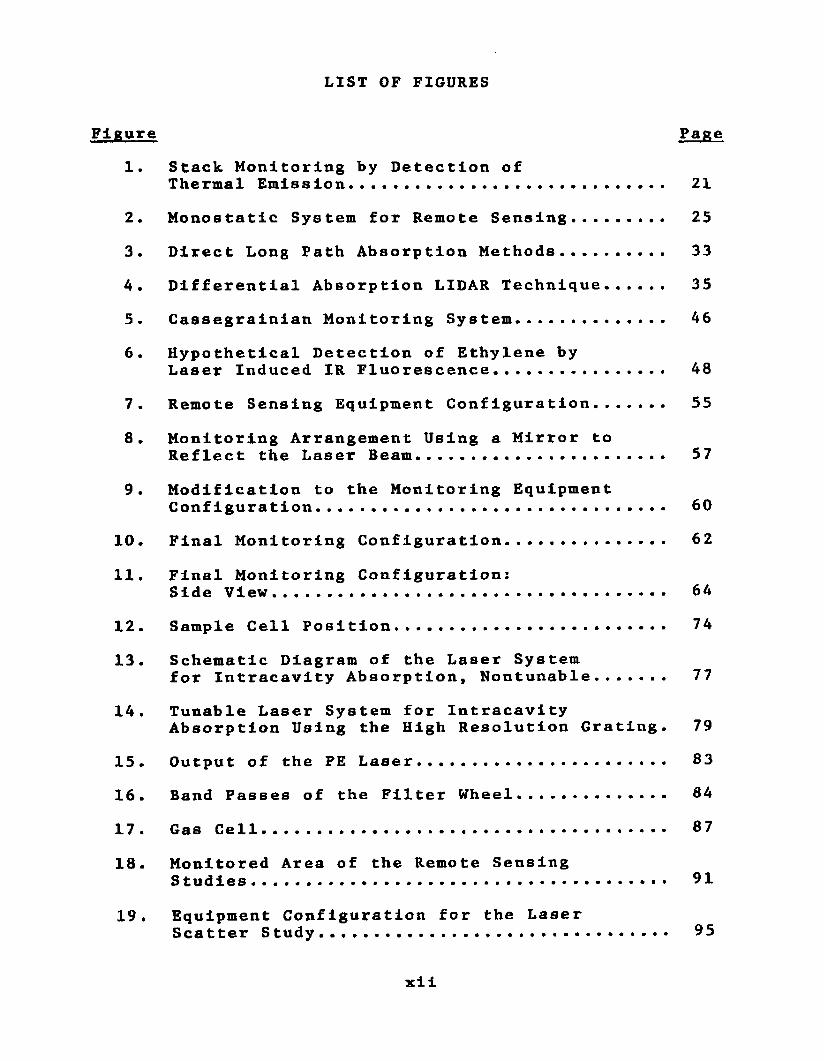
Figure Page1. S t a c k M o n i t o r i n g by D e t e c t i o n of
T h e r m a l E m i s s i o n ........... 21
2. M o n o s t a t i c S y s t e m for R e m o t e S e n s i n g ............ 25
3. D i r e c t L o n g P a t h A b s o r p t i o n M e t h o d s ............. 33
4. D i f f e r e n t i a l A b s o r p t i o n L I D A R T e c h n i q u e ........ 35
5. G a s s e g r a i n i a n M o n i t o r i n g S y s t e m ................... 46
6 . H y p o t h e t i c a l D e t e c t i o n of E t h y l e n e byL a s e r I n d u c e d IR F l u o r e s c e n c e ..................... 48
7. R e m o t e S e n s i n g E q u i p m e n t C o n f i g u r a t i o n ......... 55
8 . M o n i t o r i n g A r r a n g e m e n t U s i n g a M i r r o r toR e f l e c t the L a s e r B e a m ............................... 57
9. M o d i f i c a t i o n to the M o n i t o r i n g E q u i p m e n tC o n f i g u r a t i o n ........................................... 60
10. F i n a l M o n i t o r i n g C o n f i g u r a t i o n .................... 62
11. F i n a l M o n i t o r i n g C o n f i g u r a t i o n :S i d e V i e w ................................................. 64
12. S a m p l e C e l l P o s i t i o n . ................................. 74
13. S c h e m a t i c D i a g r a m of the L a s e r S y s t e mfor I n t r a c a v i t y A b s o r p t i o n , N o n t u n a b l e ........ 77
14. T u n a b l e L a s e r S y s t e m for I n t r a c a v i t y A b s o r p t i o n U s i n g the H i g h R e s o l u t i o n G r a t i n g . 79
15. O u t p u t of the PE L a s e r ............................ 83
16. B a n d P a s s e s of the F i l t e r W h e e l ................... 84
17. Gas C e l l ................................................... 87
18. M o n i t o r e d A r e a of the R e m o t e S e n s i n gS t u d i e s . . . . . . . . . . . . . . ............................... 91
19. E q u i p m e n t C o n f i g u r a t i o n for the L a s e rS c a t t e r S t u d y ........................................... 95
xii
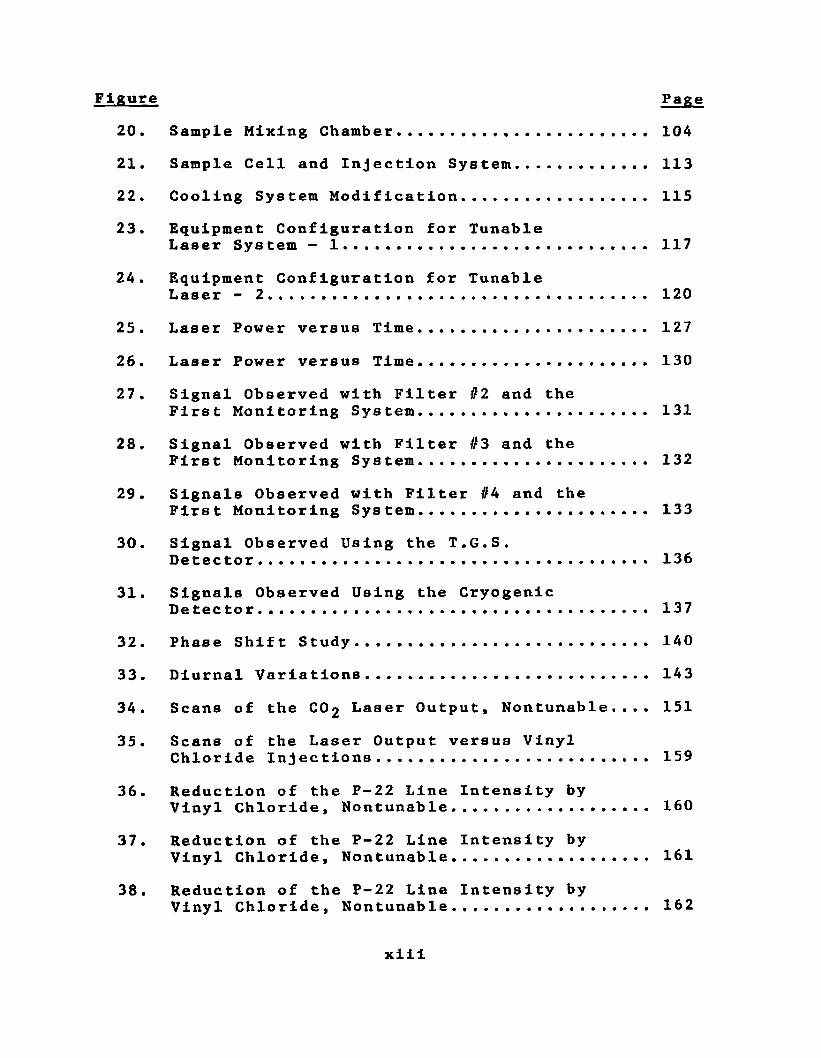
Figure Page20. Sample M i x i n g C h a m b e r ................................ 104
21. Sample Cell and I n j e c t i o n S y s t e m ................. 113
22. C o oling S y s t e m M o d i f i c a t i o n ....................... 115
23. Equ i p m e n t C o n f i g u r a t i o n for TunableL as e r S y s t e m - 1 ...................................... 117
24. E q u i p m e n t C o n f i g u r a t i o n for TunableL a s e r - 2 ..................... 120
25. Laser Power versus T i m e ............................. 127
26. L a ser Power versus T i m e . . . . . . . . . ............... 130
27. Signal O b s e r v e d w i t h Filter #2 and theFirst M o n i t o r i n g S y s t e m ............................ 131
28. Signal O b s e r v e d w i t h Fi l t e r #3 and theFirst M o n i t o r i n g S y s t e m ............................ 132
29. Signals O b s e r v e d w i t h Filter #4 and theFirst M o n i t o r i n g S y s t e m ............................ 133
30. Signal O b s e r v e d U s i n g the T.G.S.D e t e c t o r ................ 136
31. Signals O b s e r v e d Usi n g the Cry o g e n i cD e t e c t o r ................................................ 137
32. Phase Shift S t u d y ..................................... 140
33. D i u r n a l V a r i a t i o n s . . . . . ............................. 143
34. Scans of the C O 2 Las e r Output, N o n t u n a b l e ..., 151
35. Scans of the Laser Output versus VinylChlo r i d e I n j e c t i o n s .................................. 159
36. R e d u c t i o n of the P-22 Line I n t ensity byVinyl Chloride, N o n t u n a b l e ........................ 160
37. R e d u c t i o n of the P-22 Line Intensity byVin y l Chloride, N o n t u n a b l e ........................ 161
38. R e d u c t i o n of the P-22 Line I n t ensity byVinyl Chloride, N o n t u n a b l e ........................ 162
xiii
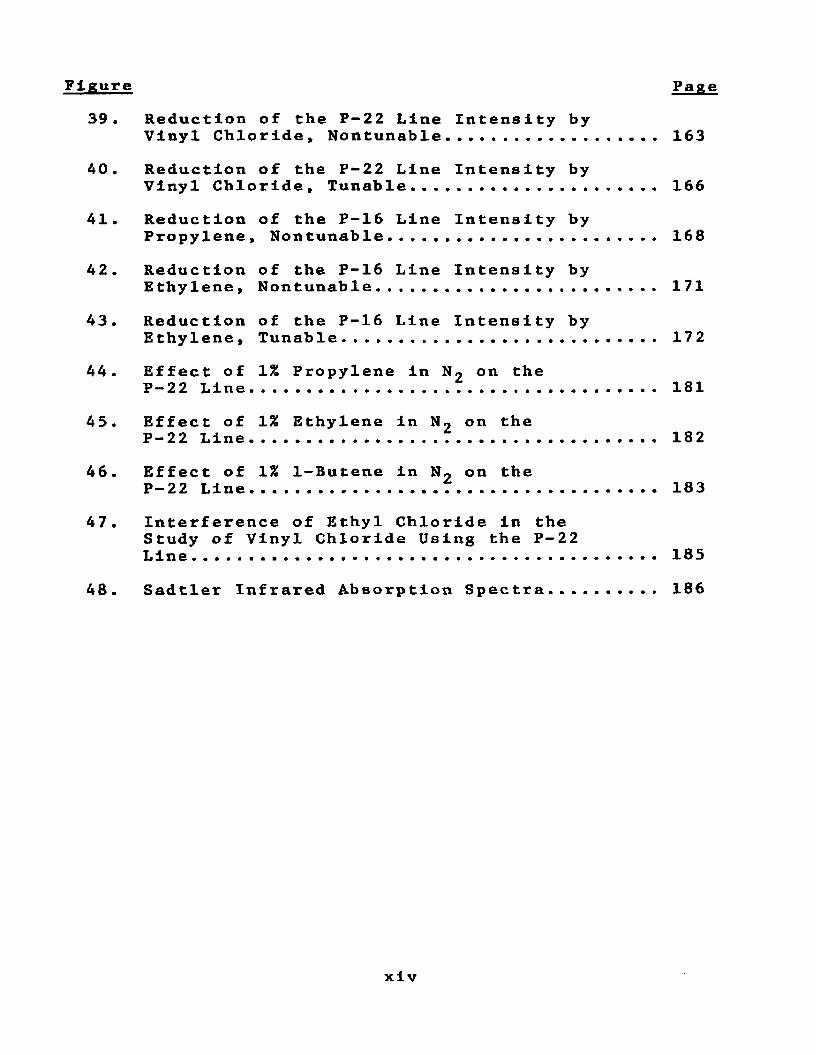
Figure Page39. R e d u c t i o n of the P - 2 2 L i n e I n t e n s i t y by
V i n y l C h l o r i d e , N o n t u n a b l e .......................... 163
40. R e d u c t i o n o f the P - 2 2 L i n e I n t e n s i t y byV i n y l C h l o r i d e , T u n a b l e .............................. 166
41. R e d u c t i o n of t h e P - 1 6 L i n e I n t e n s i t y byP r o p y l e n e , N o n t u n a b l e ................................. 1 6 8
42. R e d u c t i o n of the P - 1 6 L i n e I n t e n s i t y byE t h y l e n e , N o n t u n a b l e ................................... 171
43. R e d u c t i o n of the P - 1 6 L i n e I n t e n s i t y b yE t h y l e n e , T u n a b l e ....................................... 1 7 2
44. E f f e c t of 1% P r o p y l e n e in N« o n theP - 2 2 L i n e .................................................. 181
45. E f f e c t of 1% E t h y l e n e in N» o n theP - 2 2 L i n e ................................................... 182
46. E f f e c t of 1% 1 - B u t e n e in N 2 o n theP - 2 2 L i n e ................................................... 1 8 3
47. I n t e r f e r e n c e of E t h y l C h l o r i d e in the S t u d y of V i n y l C h l o r i d e U s i n g the P - 2 2L i n e .......................................................... 18 5
48. S a d t l e r I n f r a r e d A b s o r p t i o n S p e c t r a .............. 186
xl v
ABSTRACT
Studies in our laboratories have been concerned
with problems related to air pollution for a number of years.
The research reported in this dissertation is related to the
research trends in our labs and is divided into two main parts.
The first part deals with the use of laser induced ir fluores
cence as a remote sensing technique of atmospheric organic
molecular pollutants. The second part of this work deals
with laser intracavity absorption spectorscopy which has
great potential for use in atmospheric pollutant monitoring.
Part I: Remote Sensing by Laser Induced IR Fluorescence
A modified optical system was developed for the
real-time monitoring of organic molecular pollutants in the
atmosphere by laser induced ir fluorescence. The entire
system used included a CO 2 laser aligned with a large
gathering mirror and a filter/detector assembly. Relatively
weak fluorescence signals were distinguished from high back
ground radiation by modulating the laser beam and tuning the
detector to the modulation frequency. Scatter from the laser
beam was eliminated by proper choice of the filter system
to block out light at the laser wavelength, and a phase-
shifting technique to select only fluoresced radiation.
Instrumental variables on the fluorescence signal were
measured. The variables were changes in the phase angle,
filter bandwidths and the use of different detectors such
as (a) TGS and (b) the cryogenic detector. Fluorescencexv
Intensities at different times of the day in ambient air
were measured. A proposed mechanism of excitation was
discussed for the observation of shorter wavelength
fluorescence by simultaneous multiphoton absorption.
Part II: Analytical Implications of Laser Moding Causedby Intracavity Absorption
A continuous C0£ laser using a reflecting mirror
will operate at several wavelengths simultaneously. If an
organic vapor is introduced into a separate cavity in the
laser optical path, the laser will sometimes mode rapidly
causing some lasing lines to diminish to zero and others to
become enhanced. This was observed even when concentrations
of the organic gases were very low (1 0 ” ^g).
Laser intracavity absorption spectroscopy is depen
dent upon an overlap of a vibrational/rotational line of a
sample with a laser transition line. The absorption effect
exerted by the sample greatly affects the laser wavetraln
operating at that particular wavelength and interferes with
the lasing action. The technique was not based upon Beer's
Law and analytical detection limits observed with the tech
nique were orders of magnitude better than those of conventional
infrared absorption spectroscopy.
Two laser systems were used and various organic
gas samples were studied. One laser system utilized a totally
reflecting mirror which permitted free moding while another
used a grating as the rear cavity optics restricting the
xvi
wavelengths of the laser lines. Vinyl chloride, propylene,
ethylene and ethyl chloride were studied and the results
reported in this dissertation. The detection limits found
for these compounds were 0 .14^, 0 . 9 5 ^ and O . S O ^ f o r vinyl
chloride, propylene, and ethylene respectively when using
a totally reflecting mirror. The detection limits using2the grating system were found to be 1.4x10^/^, 9 4 / ^ ?63^gand
0 .2 or vinyl chloride, propylene, ethylene and ethyl
chloride, respectively.
Several other studies were conducted and reported
in this dissertation. An Interference study was made to
determine the effect of propylene, ethylene, 1 -butene,
benzene, ethyl acetate, acetone, and ethyl chloride on the
determination of vinyl chloride. In addition, two minor
studies were attempted on laser amplification and laser
line sharpening.
xvii
INTRODUCTION
Air pollution has been defined as the presence of
any abnormal material in air or the presence of a substance
that reduces the usefulness of the atmosphere.^-
The number of air pollution studies undertaken has
sharply increased over the past decade. This is due in part
to the fact that man has become more aware of his impact upon
the environment. The rapid deterioration of the quality of
the atmosphere has thus spurred man to undertake measures
necessary for the preservation or even upgrading of the
quality of the atmosphere. Secondly man has become aware
of the environment's impact upon himself primarily in the
sense of possible bad health effects.
The sources of air pollution are extremely numerous
and diversified both in the type of pollutant emitted as well
as in the quantity emitted. The sources can be divided into
two categories: natural and man-made . 2
All natural sources of pollution are classified as
stationary. These sources include: volcanoes, ocean spray,
pollen and soil transported by the wind. Except for a few
instances these sources are uncontrollable by man.
Man-made sources can be classified as stationary
or mobile. Stationary sources are the major contributors
to air pollution and cover a wide range of emission sources.
Combustion has been a characteristic of civilization for both
the generation of heat and thermal power.^ As a result of
1
2
combustion processes; smoke, ash, noxious, and benign gases
and odors have been emitted into the atmosphere. Petroleum
refineries vary extensively in the characteristics and quan
tity of emissions.^ However, the basic pollutants commonly
produced by the refineries are smoke and particulate matter,
hydrocarbons, gaseous compounds particularly sulfur and
nitrogen oxides and malodorous vapors. Production of
naturally occurring non-metallic minerals into salable products
involves certain processes which add pollutants to the
atmosphere.5 Certain mining processes pollute the atmosphere
due to the discharge of deep mining ventilation air. Open-
pit mining produces much particulate matter through drilling,
blasting, and ore handling procedures. Particulate emission
is also very prevalent during loading and unloading as well
as stockpiling. In addition, wind erosion of the stockpiled
material contributes to the problem. Ferrous metallurgical
processes include iron and steel production as well as sinter
production.^ The sintering process changes the fines in ore
to cakes in order to prevent the entrainment of the fines in
the off gases of the blast furnace. Emissions due to the
sintering process are in the form of dust, the composition
of which is quite high in iron oxides. The particle size
varies according to the materials being processed and can
be as large as 500/t and smaller than 2/t. Blast furnace gas
produced in iron production methods is also high in dust con
tent. Dust catchers, gas washers and electrostatic precipita
tors are used to reduce the quantity of particles exhausted;
3
however, the collection la not 100% efficient. The size of
the dust emitted Is dependent upon the materials charged,
furnace pressures and wind volume. The production of steel
Is a source of dust emission characteristic of the specific
operational factors. The major constituents of the dust are
Iron oxides. Nonferrous metallurgical operations deal
primarily with the production of copper, lead, zinc and
aluminum.^ Dust fumes and gases are emitted In the mining
and processing of all four elements. Most of the copper,
lead and zinc ores mined are in the form of a sulfide mineral.
Emission of SO 2 is a by-product of the processes some of
which escapes into the atmosphere. The Inorganic chemical
Industry deals principally with the manufacture of certain
inorganic acids and alkalies, phosphate fertilizers, ammonium
nitrate and bromine and chlorine.& Production of various
Inorganic acids causes pollution in the forms of hydrogen
sulfide, fluosilic acid, oxides of nitrogen, sulfur trloxide,
sulfuric acid mist and dust. Inorganic base production
produces emission of ammonia. Fine rock dust, sulfur
dioxide, carbon dioxide, silicon tetrafluoride and fluorides
are present in the exhaust from the preparation of phosphate
fertilizers. Ammonia and nitric oxide are the principal
pollutants in ammonium nitrate production. In addition,
commercial production of chlorine and bromine yield chloride
as a pollutant. The pulp and paper industry is a source of
both gaseous and particulate emissions.^ Typical gas emis
sions include such compounds as l^S, C H 3 SH, CH 3 SCH 3 and
4
(CH^S)2 * Food and feed processing is also a potential source for air pollution in the form of dust whenever a dry powder
is produced or handled.
The second division of man-made pollutants arise
from mobile sources. This deals primarily with the atmo
spheric pollution from gasoline-powered and diesel-powered
equipment, gas turbines and automobile e m i s s i o n s . ^ Exhaust
emissions from gasoline-powered equipment include carbon
monoxide, unburned hydrocarbons, oxides of nitrogen, partial
combustion products as well as particulate matter. Diesel-
powered equipment produce pollution in the form of unburned
hydrocarbons, nitric oxides, oxygenated compounds, carbon
monoxide in addition to smoke and odor. Gas turbines emit
small amounts of carbon monoxide and unburned hydrocarbons
due to extremely lean fuel mixtures used; however, some N0X
and oxygenates are produced. Automobile exhaust emissions
have been studied in great detail. These Include hydrocarbons,
carbon monoxide and oxides of nitrogen and certain metal salts.
Pollutants emitted from the numerous sources can
be categorized into three broad areas: particulates, aerosols1 1and molecular pollutants. * Particulates can include both
solid and liquid species ranging in size from 1 0 ” to 1 0 mm,
or larger. Fog, smoke particles, fly ash, dust, haze, sulfates,
nitrates and some combustion products are particulate pollutants.
Aerosols are air or gas suspension of particles. These sus
pensions are between approximately 1 0 " and 2 0^<in diameter.
They possess a large surface area-to-mass ratio and can remain
suspended in the atmosphere for long periods of time. The
length of time an aerosol is suspended in the air depends
on the settling velocity of the particle. The settling
velocity is in turn dependent upon the particle size.
Particles larger than the mean free path of the gas mole
cules attain a constant settling velocity. Particles
smaller than the mean free path do not attain constant
settling velocity due to the bombardments by air m o l e c u l e s . ^
Examples of aerosols are sulfuric and nitric acid vapor,
ocean spray, and fractions of vehicle exhaust. Molecular
or gaseous pollutants are exemplified by SC>2 , N0X , CO, and
C O 2 , and hydrocarbons emitted from vehicle and industrial
exhausts.
The level of pollutants in the atmosphere became
a major concern in the last two decades with the public
realization that air pollution causes physical, chemical
and biological damage.Physical changes in the atmosphere can be brought
about by air pollutants.-^ These atmospheric changes can
range from the highly obvious observation of heavy smoke
to subtle temperature and precipitation changes over a
region. The pollutants producing the effect can be either
gaseous or particulate in nature.
The most obvious Impact of air pollutants is
measured in terms of visibility of the atmosphere. It Is
this impact that has spawned much public concern over the
quality of the atmosphere.
6
Dirtiness caused by air pollution can be observed
on clothes, buildings and vegetation. This aspect has led
to much reform on certain types of pollution. Excellent
examples of pollution legislation can be seen in the dis~
appearance of soot on buildings in such cities as London
and Pittsburgh.
The mechanism of precipitate formation in the
atmosphere can be affected by air pollutants. Weather
modification on a worldwide basis has been a concern of
geophysicists in addition to concern over fog formation
and persistence on a regional basis. The integrity of the
ozone layer has received much emphasis in recent years in
relationship to fluorocarbon pollution.
The chemistry of the atmosphere has certain
thermodynamic considerations. The trend is toward oxidative
change to simpler, more stable compounds with less internal
energy than the precursors. However, the chemistry of the
atmosphere is subject to change and often complex and unstable
substances are produced as a result of chemical interruptions
due to the presence of air pollutants.15
The effects of air pollution on biological systems
can be broadly categorized into two areas: (a) effect on
vegetation and (b) the effect on human health.
Vegetation damage has been one of the earliest
indicators of air pollution. The Impact of sulfur dioxide
and fluoride on vegetation in the locale of certain industries
in Germany was investigated as early as the middle of the
nineteenth century.
7
The sulfur oxides are contributors to vegetation
damage primarily as sulfur dioxide. Sulfur dioxide was
observed to cause vegetation destruction around smelters
in the nineteenth century. Today, complete vegetation
destruction is not a major concern as localized concen
trations of SO 2 have been reduced. However, the concern
over SO 2 emission has been renewed with the advent of
coal-converslon in both heavy industries and power generating
plants.
Other pollutants have been studied as to their
impact on vegetation. Ozone and peroxyacyl nitrate (PAN)
have been reported as causing damage to certain vegetation.
Nitrogen dioxide in high concerntrations is also detrimental
to certain vegetation. Ethylene is toxic to vegetation as
well as airborne pesticides, chlorine, heavy metals, acid
aerosols, ammonia, aldehydes, hydrogen chloride, hydrogen
sulfide and certain particulates.
The impact of air pollutants on human health has
been a topic of much research and discussion. The effects
of pollutants in the atmosphere on human health include:
(a) acute sickness or death; (b) chronic disease, shortening
of life span, or impairment of development and growth;
(c) alteration of certain physiological functions; (d) impair
ment of performance; (3) untoward symptoms; (f) storage of
potentially harmful materials in the body and (g) discomfort.17
8
Several tragedies have focused public attention to
the problem of the health effects of air pollution. An early
case occurred In 1930 in the Meuse Valley of Belgium. A
thermal inversion confined the local pollution emissions to
the valley. The pollution sources were coke ovens, steel
mills, blast furnaces, zinc smelters, glass factories and
sulfuric acid industries. The resulting 60 deaths and
numerous cases of illness were suspected to be related to
the high concentration of S O 2 in the air: 25mg to 1 0 0 mg/m^.
It is believed that the S O 2 was oxidized with the final
result of formation of H 2 SO4 mist. A similar situation
occurred in 1948 in Donora, Pennsylvania. A higher con
centration of SO 2 (estimated to be 1.4 - 5.5mg/m3) was the
result of a temperature inversion in the area which con
tained a large steel mill, sulfuric acid plant and a large
zinc production plant. This incidence resulted in 20 deaths.
An accidental leak of I^S into foggy weather and a low inver
sion layer over Poza Rica, Mexico in 1950 resulted in the
hospitalization of 322 people and 22 deaths. In 1958 a high
frequency of asthma cases was reported in Mew Orleans. A
study of the incidence of high asthma periods suggested that
a flour mill may have been responsible.
Several gaseous pollutants have been studied as to
their effect on human health. These include; sulfur dioxide,
ozone and other oxidants, carbon monoxide, nitrogen dioxide
and other nitrogen oxides, hydrogen sulfide and mercaptans
and various hydrocarbon vapors. Sulfur dioxide has been known

9
to cause Impairment of lung functions and the development
of asthma attacks on healthy individuals. Low concentration
(O.Sppm) produces a distasteful odor with slightly higher
concentrations leading to increased airway resistance. As
mentioned in earlier cases, S0 2 in large concentration has
caused death. Ozone and other oxidants usually affect humans
in the form of respiratory and eye irritation. The eye
irritants are thought to be formaldehyde, acrolein, peroxy-
benzol nitrate and peroxyacyl nitrate. Ozone causes irrita
tion in the sense of throat dryness at a level of about
0.3ppm. Relatively high-level ozone exposure produces
pulmonary edema, or a leakage of fluid into the lung parts
responsible for gas exchange. The effects of carbon monoxide
depends upon the amount present in the body. It is not
irritating and cannot be detected by the human senses.
Carbon monoxide binds with hemoglobin thus preventing one
of the hemoglobin's primary functions; that is, carrying
oxygen to tissues. If a sufficient amount of CO is present
in the blood, the body is deprived of the necessary amount
of oxygen and the individual dies. Only two of the oxides
of nitrogen known to exist in the atmosphere are believed to
affect human health. These are: nitric oxide and nitrogen
dioxide. Both nitrogen oxides can produce inactive forms
of hemoglobin. Hydrogen sulfide is a sensory irritant and
Inhalation in sufficient concentration can be fatal. Methyl
and ethyl mercaptans are potent odorants and produce no other
health effect when in concentrations above the level at which
they are nuisances. Organlcs such as formaldehyde and
acrolein are potent irritants. Benzene is believed to
interfere with red blood cell formation in the bone marrow
with the possibility of producing leukemia.
Particulate pollutants producing health effects
on humans are: asbestos, lead, mercury, beryllium, arsenic,
fluoride, chromium and manganese. Asbestos deposition in
the lung of humans has resulted in shortness of breath as
well as respiratory diseases, including lung cancer.
Absorption of lead by the body from inhalation can produce
gastrointestinal cramps, central and nervous system effects
such as anemia. Kidney disease and vascular disease have
been related to exposure to lead in the environment.
Atmospheric contamination with mercury is due to coal and
fossil fuel combustion. Inhalation of metallic mercury can
result in brain damage. Exposure to beryllium affects the
lung and an acute pneumonic disease has been reported.
Arsenic is more toxic in the trlvalent than in the penta-
valent form. Skin cancer has been induced by long-term
exposure to high concentration of arsenic trioxide. Fluorld
absorption from the atmosphere by children has led to dental
mottling. Hexavalent chromium in the atmosphere is of con
cern as human exposure has led to both respiratory and skin
problems. Manganese has been suggested as a possible cause
of Parkinson's disease, thus labelling it as a toxic air
pollutant.
11
In order for man to attempt to control the pollu
tion of the environment as well as predict the environmental
health Impact it Is necessary to develop monitoring systems
capable of determining a wide range of diversified pollutants.
Pollutant monitoring presents quite a task as most pollu
tants exist In the 0 . 1 to lug/m^ concentration range in the
atmosphere.
Current methods of air pollution monitoring
Include such techniques as deposition, scrubbing, filtra
tion, adsorption, freeze-out, absorption, electrostatic and
thermal precipitation.
Deposition is used in the determination of dusts
and particulate m a t t e r . ^ The technique relies on the sedi
mentation of the sample which is the ability of the particles
to settle. There exists a relationship that involves the
terminal settling velocity of the particle falling under
the influence of gravity. Generally, particles whose
diameter is larger than IO^m are "settleable" while those
of smaller diameter tend to remain suspended. It is possible
to employ a miniature cyclone to aid in the collection of the
particles.
Liquid scrubbing has been used to collect particles 19of all sizes. The particle size is increased in the scrubber
due to an impact with a scrubber solution droplet or by con
densation of the solution on the particle. The attractive
force existing between the particle and the solution drop
entrain the sample. Liquid scrubbers have been applied to
12
remove almost any size particle; however, the efficiency
of collection Is related to the contacting power of the
scrubber. Scrubbers have the advantage of being low in
cost, capable of handling sticky particles and explosive
or flammable streams, flexibility, and possible simultaneous
collection of gaseous pollutants. The disadvantages include:
wet collection of particles, noise of high velocity gases
and poor efficiencies for collecting certain particles.
Filtration is employed to trap samples when average diameter is less than ltyu.^0 - 2 2 ^ high-volume
fiberglass filter can be used. Other filter media include
paper, membranes, and inorganic fiber filters. The filter
ing effect is achieved by the ability of the filter matrix
to pass the gaseous portion of the sample while retaining
the particulate material from the stream. Impaction,
interception and diffusional impaction are several mechanisms
involved in the sample collection. Filtration can be used
to separate dusts and some mists from gas streams.
Adsorption is a surface phenomenon whereby gaseous
materials adhere, to some degree, to a solid surface.23
The technique is used for the collection of atmospheric
gaseous pollutants on activated charcoal or silica gel.
The pollutant may be recovered in its original form by
heating to produce vaporization or as a different compound
if chemlsorption occurred. Adsorption has been used for
removing vapors and certain gases over a wide concentration
range. Physical adsorption cannot be used to collect true
13
gases such as N 2 * Oj, H 2 * CO and CH^ and is inefficient in
absorbing H 2 S, NH^, HC1, HgCO and ethylene. True gases
are defined as having a critical temperature K. -50°C and
boiling points ^ -150°C.
Gaseous pollutants can be trapped out of the
atmosphere by passing the samples through a series of col-a *
lection chambers, each at a progressively lower temperature.
The gas is condensed in the chamber whose temperature is
lower than the boiling point of the gas. Alternatively, a
single chamber can be used at a sufficiently low tempera
ture to simultaneously trap out all the gaseous samples.
Another technique by which gaseous air pollutants
can be collected is absorption. In absorption the gaseous
molecules diffuse into a liquid, i.e., absorption. Henry's
Law is obeyed for slightly soluble gases, thus the driving
force is the difference between the saturation concentra
tion in the liquid phase and the actual concentration present.
Absorption has been used for absorbing gases, vapors and
some particulates.Electrostatic precipitation has been used to
collect particulate matter, mists and aerosols. Particles
become charged as they pass through a corona discharge and
are then collected by an electrode of opposite charge.
The captured particles are then flushed from the electrode
and contained. In order for the technique to be useful,
the material to be collected must have proper resistivity
otherwise the matter is released and reentrained in the gas
14
stream. Advantages of electrostatic precipitators Is that
they have high temperature capability, can collect mists,
sticky and abrasive materials, high efficiency and long life
but the noise, voltage and cost levels are high.
Thermal precipitation methods employ hot wires
or plates to establish and maintain a temperature gradient.
Particulate matter falls into slides or cold plateB due to
the combined forces of gravity and the heat gradient.
It is felt that the current methods just discussed
have certain inherent disadvantages which seriously limit
their uses as the most efficient techniques for atmospheric
monitoring. First, the time needed for the analysis is
generally quite long. As an example, pollutant A is to be
monitored whose average allowable concentration is lOppm
with a critical level of 15ppm. The sampling time may be
an 8 hour work shift or perhaps a 24 hour period. In either
case, the sample is analyzed after a long collection period
and the results yield an average concentration value of the
pollutant over the collection time. The analysis, for this
example, indicates a pollutant level of A to be 8 ppm, which
is below the acceptable maximum. However, this information
can be misleading. The average level of pollutant A is
8 ppm but during the analysis period A may have increased
to levels much higher perhaps even above the critical level
of 15ppm. Then due to a general low concentration during
most of the collection time, A may have been averaged out
to 8 ppm. The data, then, has not accurately described the
15
concentration level of the pollutant. On the other hand,
the analysis may show that A exceeded lOppm. This fact now
alerts the populace to the problem but the fact Is now a
piece of history with possible damage already having
occurred.
Another major disadvantage of current methods Is
the possible contamination problem. Any time the sample
Is handled, I.e., extracted, there exists the possibility
of contaminating the sample by contacting It with chemicals
or containers.
In addition to the disadvantages mentioned, inter
ferences degrade the performance of current methods. Inter
ferences can cause erroneous data by acting In a similar
fashion as the sample sought or in preventing the collection
of the sample.
As an alternative to the currently used methods,
remote sensing offers a number of advantages. One of the
primary advantages is the fact that the technique Is capable
of continuous, real time monitoring. The data reduction is
accomplished rapidly, therefore, the pollutant level can be
determined In a matter of seconds or minutes. This allows
the observer to follow the pollutant concentration level more
accurately instead of obtaining average values taken over a
long time period as in the case of most current methods.
Another major advantage of remote sensing lies in the fact
that sample handling is not necessary. Contamination of
the sample due to collection, storing and recovery is not a
problem as there Is no contact made with the sample other
than with the laser beam. The ability to monitor inacces
sible locations enhances remote sensing capabilities. It
is possible to monitor the atmosphere over difficult terrain
such as marsh lands or inaccessible areas as the stratosphere
Due to the very heterogeneous nature of the atmosphere the
sampling location is ultimately important. With conventional
methods such as deposition, filtration, etc., the sample
collected may not be representative of the pollutant level
in the area. Using remote sensing it is possible to sweep
large areas in order to monitor the pollutant level profile
which describes more accurately the atmospheric contamination
Remote sensing techniques are also non-interfering in the
sense that the measurements can be made of effluents, etc.
without interruption of the industrial process. Other
advantages are that the remote sensing techniques are
sensitive and can be selective. Pollutant concentrations
in the air are generally between 0 . 1 and l^j/m^ which is12not beyond the remote sensing capability.
A. Remote Sensing Methods
Remote sensing techniques can be classified under
two broad headings: (a) non-laser techniques and (b) laser
techniques. Included as non-laser techniques are some Long
Path IR Absorption techniques and Thermal Emission methods.
The laser techniques are more numerous and can be subdivided
into: (a) Elastic Backscattering, (b) Raman Backscattering,
(c) Long Path Absorption and (d) Resonance Backscattering.
17
1. Non-Laser Techniques
a . Long Path Absorption by Atmospheric Pollutants
The components of the atmosphere have
been studied In a variety of ways using long path absorption.
Some of the first spectroscopic studies were of the Fraunhofer-
type experiments. In these experiments a spectrophotometer
was used to scan the atmospheric absorption spectra from the
ultraviolet to the far infrared. Sun's rays were collected
via a sun tracking mirror. The collected rays were then
reflected to a fixed mirror and ultimately focused onto the
monochromator by a third mirror. Line widths of the con
stituents in the atmosphere indicated their altitude with-1 25pollutants near sea level being approximately 0 .2 0 cm wide.
Much work has been done on transmission
studies of the pure atmosphere by photometric analysis and
has been reported in an atlas published by the Royal
Observatory. However, studies of polluted atmosphere uti
lizing the sun's rays were made as early as the mid-fifties.
Stain and Gates observed absorption bands of pollutants in
the smog of Los Angeles using the sun's rays. In 1956, Scott,
et al used a Nernst glower source, a folded path of several
hundred meters, and a conventional spectrophotometer to2 6observe various air pollutants in South Pasadena. The air
pollutants included ozone, acetylene, ethylene, carbon mon
oxide, peroxyacyl nitrate and various other hydrocarbons.
18
The lr region has proven to be more useful
than the uv region of the spectrum for determination of air
pollutants in long path absorption techniques for a
variety of reasons. In general, uv bands are more Intense
than ir bands and more senstive detectors are available
for use in the uv region; however, due to the nature of the
uv bands there exists more overlap between bands of different
species in the uv region. Bands in the uv region are due to
electronic transitions accompanied by vibrational transitions.
The resulting bands are very broad and therefore the possi
bility of overlap between the bands of two compounds is great.
In the ir region the bands are due to vibrational and rota
tional transitions and are much narrower than the uv bands,
thus there is less overlap between the bands of different
compounds. Host pollutants of interest have characteristic
absorption bands in the ir and may exhibit the C-H stretch
around 3,3/l* . The 3.3yu region is not an optimum region for
analysis of various pollutants as in this region there is
considerable overlap of the various pollutants' lr bands.
However, many regions exist in which there is less likelihood
of overlap such as the following regions 2.7-3. 3 ^ , 0-H stretch;
2.7-3.3yu , N-H stretch; 7 . 7 - 1 1 . 1 ^ , C-0 stretch; 5 . 9 - 6 . ^ ,
C«*C stretch; 5,4-6.1^# 0 0 stretch; 4.2-4.8yU, C*C stretch;
4 . 2 - 4 . ^ , C-N stretch; 15-20^, C-Cl band, e t c . ^
b . Thermal Emission of Atmospheric Pollutants
Molecules can be made to emit radiation in
19
9 Qthe lr region by thermal excitation. The heating effect
causes the molecules to become vibrationally excited with the
consequent emission of radiation upon de-excltatlon. This
principal has been applied to achieve remote sensing of
various stack emitted pollutants. Low and Clancy used the
technique to monitor a Rutgers power plant smokestack using
a scanning interference spectrometer. The results showed29identification fo SO 2 present in the stack effluent.
Other common pollutants have been qualitatively defined
such as SO , NO , and 0~.X X -5Although the method lends itself to remote
sensing of stack emitted pollutants, there are several
disadvantages Inherent In the system. The emitted signal is
quite weak in comparison to the high background signal there
by requiring multiple scans, in some cases as high as 50-100,
to observe the signal. In addition, the technique requires a
sophisticated detector and computer system for the signal
analysis. The intensity of the signal is dependent upon the
temperature difference between the radiation source and the
detector. One part of the problem is easy; that is, the
detector temperature can be qultu easily controlled. However,
the control or even the determination of the sample temperature
is almost impossible. The temperature of the plume emitted
at any one point is dependent upon the process temperature
giving rise to the stack emission, point location within the
stack, the ambient temperature and wind factors. The process
generating the stack plume is usually at a constant
20
temperature range. The top of the stack is usually quite
large in diameter; therefore, the cross section of the gases
passing through the stack should not be at the same tem
perature. Portions closest to the stack walls should be at
a different temperature than those toward the stack center.
This causes problems in determining the correct stack
temperature and greater problems in determining sample temper
atures. The ambient temperature will affect the plume
temperature, and therefore sample temperature, tending to
cool the plume much quicker when the temperature differences
are quite large; for instance, during winter periods. Hind
speed also affects sample temperature as the plume is cooled
by the wind speed. These factors result in an emitted sample
that is very lnhomogeneous in composition as well as in
temperature. The end result is a possibility of qualitative
analysis of the stack but quantitative analysis is not
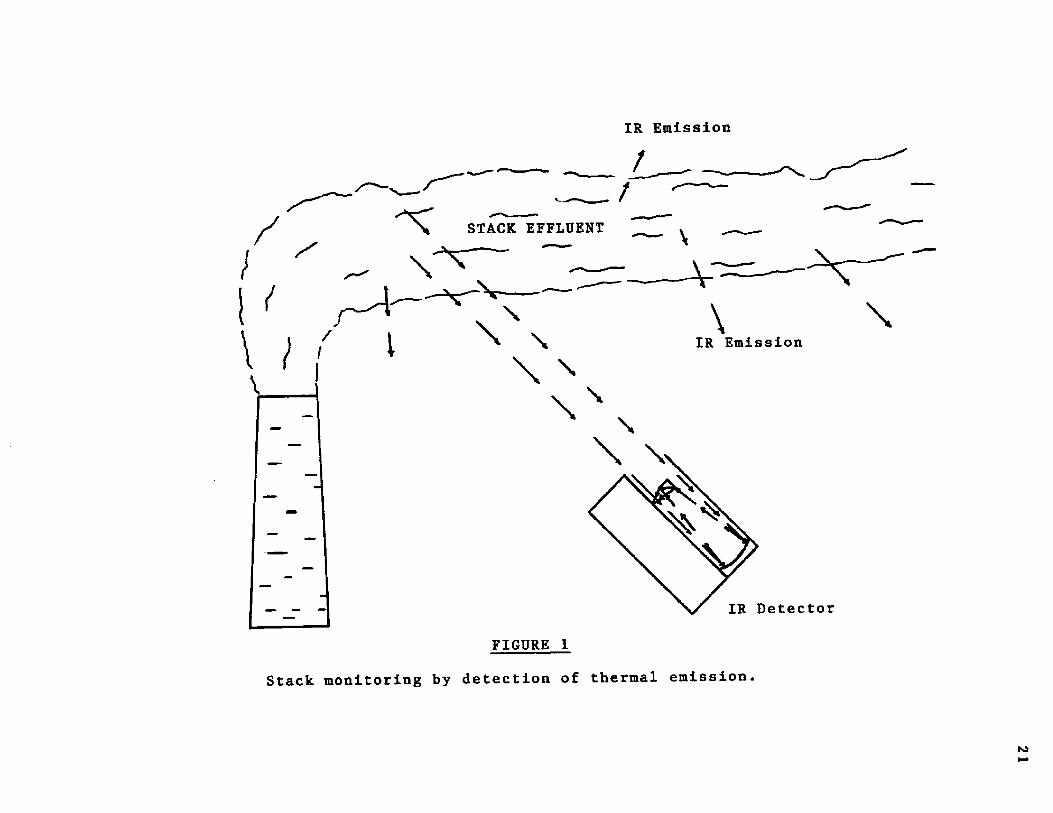
feasible.Figure 1 shows the stack monitoring via
thermal emission.
2. Laser Techniques
The application of the laser to pollution
anlysis has greatly enhanced the potential of remote sensing.
The two main reasons responsible for this enhancement are:
(1 ) the laser beam can be collimated and (2 ) the laser energy
can be confined to a narrow range of frequencies. The former
reason allows the laser beam to propagate a great distance
IR Emission
STACK EFFLUENT
/
IR Detector
FIGURE 1
Stack monitoring by detection of thermal emission.
22
through the atmosphere while retaining Its power density.
The latter gives the experimenter an extremely narrow but
powerful line for selective analysis.
a . Elastic Backscatter
LIDAR (light detection and ranging) has
become an established technique for remote probing of the 30atmosphere. It is a combination of weather radar and
optical scattering principles which is capable of observing
particulates, aerosols and molecular species in the atmo
sphere. The LIDAR system basically consists of a pulsed
source of energy such as a Q-switched laser and a collection
system is utilized to gather a portion of the radiation
scattered from the specie of interest. The scattered
radiation is then detected and displayed using a photo
multiplier/oscilloscope system.
LIDAR was actually conceived in the 1930's
for assessing the density and dust loading of the atmo
sphere. The experiments employed a vertically-pointed
searchlight and a remotely located photodetector. In the
1940's-1950's Llgda, at the Stanford Research Institute,31employed a Q-swltched ruby laser.
The elastic backscatter phenomenon that
comprises most LIDAR experiments can be subdivided into two
main categories depending upon the diameter of the particles
monitored. The categories are: (a) Rayleigh and (b) Mie
scattering.
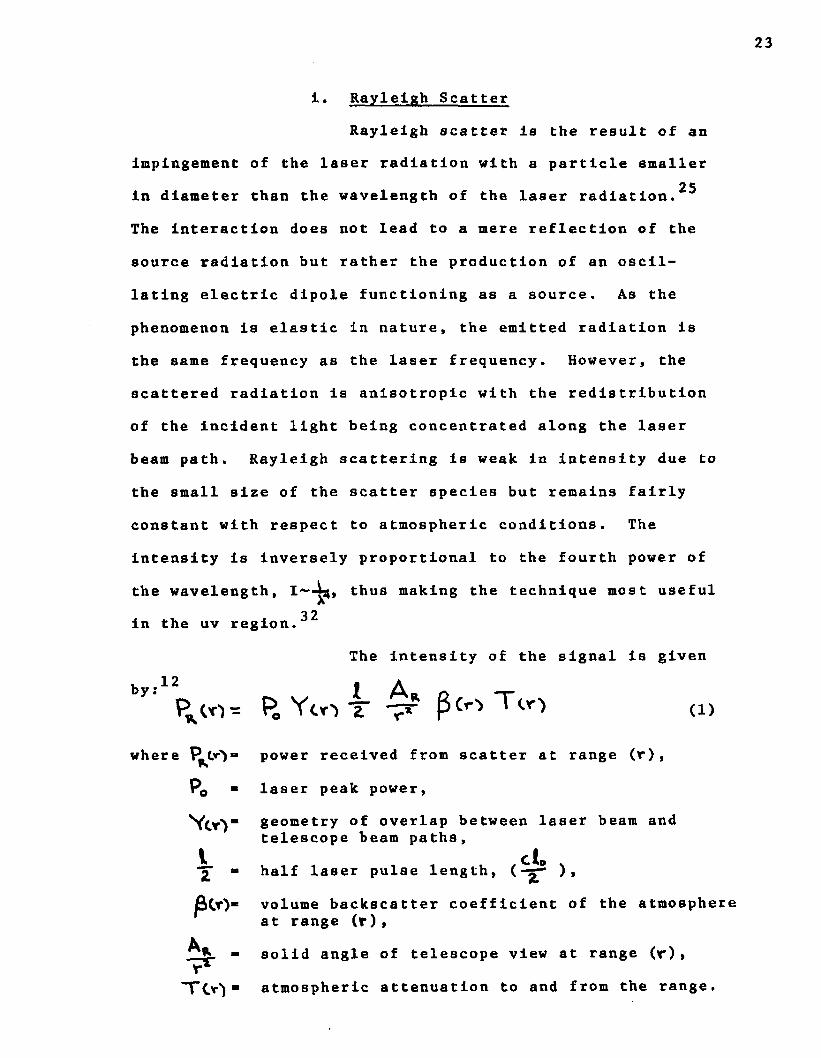
i . Rayleigh Scatter
Rayleigh scatter Is the result of an
Impingement of the laser radiation with a particle smaller25In diameter than the wavelength of the laser radiation.
The Interaction does not lead to a mere reflection of the
source radiation but rather the production of an oscil
lating electric dipole functioning as a source. As the
phenomenon Is elastic In nature, the emitted radiation Is
the same frequency as the laser frequency. However, the
scattered radiation is anisotropic with the redistribution
of the incident light being concentrated along the laser
beam path. Rayleigh scattering is weak in intensity due to
the small size of the scatter species but remains fairly
constant with respect to atmospheric conditions. The
intensity is inversely proportional to the fourth power of
the wavelength, 1 “ -^, thus making the technique most useful3 2in the uv region.
The intensity of the signal is given
P. Yc o T ptrt Tto d,power received from scatter at range (r),
laser peak power,
geometry of overlap between laser beam and telescope beam paths,
half laser pulse length, ( ) ,
volume backscatter coefficient of the atmosphe at range (r),
solid angle of telescope view at range (r),
atmospheric attenuation to and from the range.
b y :12
where
.rr
T i r ) -
24
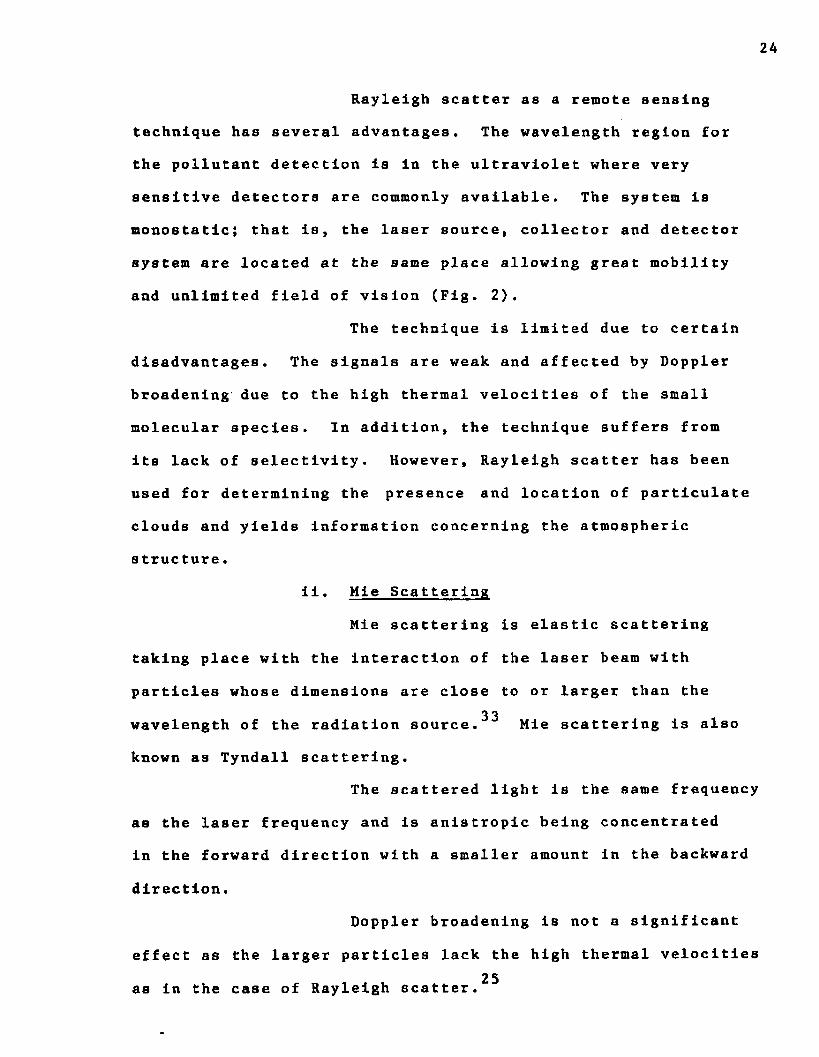
Rayleigh scatter as a remote sensing
technique has several advantages. The wavelength region for
the pollutant detection is in the ultraviolet where very
sensitive detectors are commonly available. The system is
monostatic; that is, the laser source, collector and detector
system are located at the same place allowing great mobility
and unlimited field of vision (Fig. 2).
The technique is limited due to certain
disadvantages. The signals are weak and affected by Doppler
broadening due to the high thermal velocities of the small
molecular species. In addition, the technique suffers from
its lack of selectivity. However, Rayleigh scatter has been
used for determining the presence and location of particulate
clouds and yields Information concerning the atmospheric
structure.i i . Mie Scattering
Mie scattering is elastic scattering
taking place with the interaction of the laser beam with
particles whose dimensions are close to or larger than the3 3wavelength of the radiation source. Mie scattering is also
known as Tyndall scattering.The scattered light is the same frequency
as the laser frequency and is anistroplc being concentrated
in the forward direction with a smaller amount in the backward
direction.
Doppler broadening is not a significant
effect as the larger particles lack the high thermal velocities25as in the case of Rayleigh scatter.
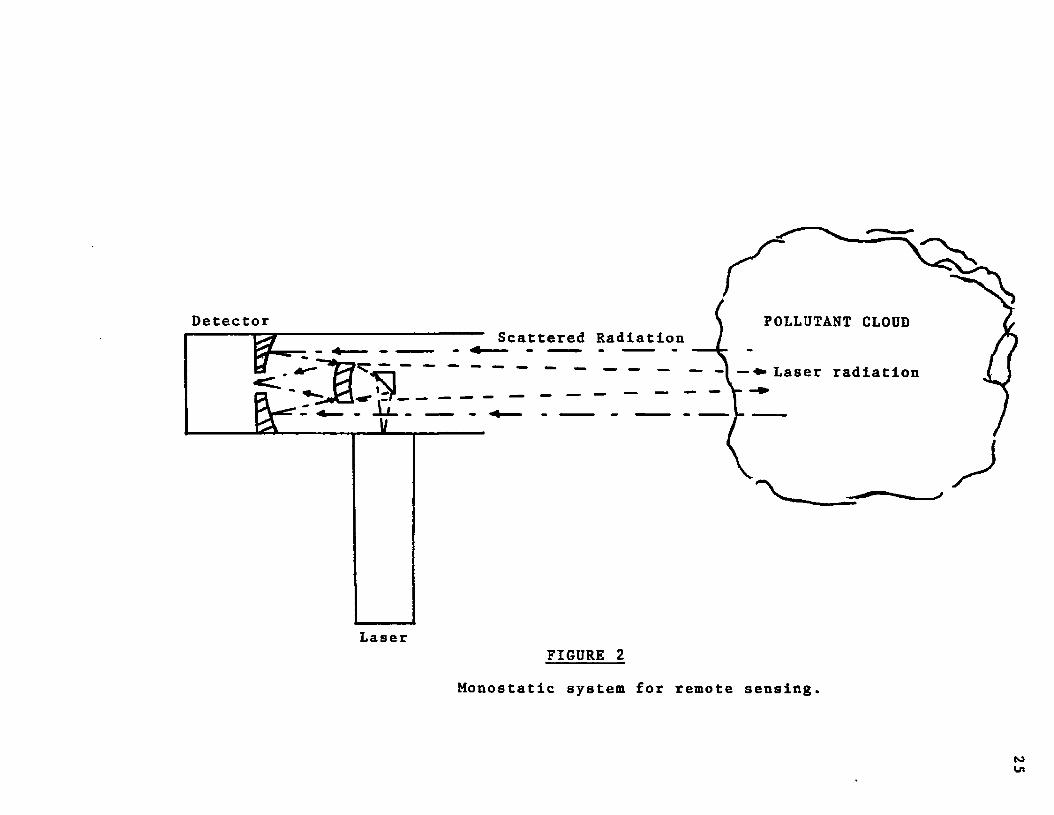
Detector POLLUTANT CLOUDScattered Radiation
Laser radiation
LaserFIGURE 2
Honostatic system for remote sensing.
fOLn
26
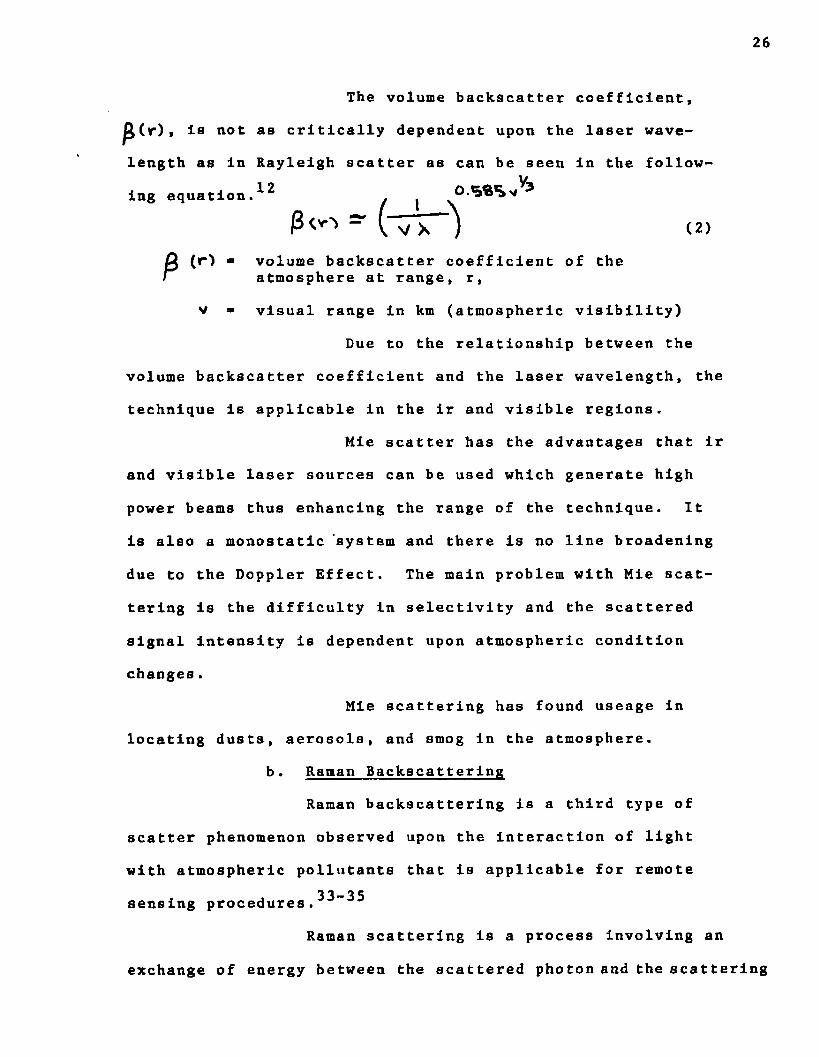
The volume backscatter coefficient,
^J(r), la not as critically dependent upon the laser wave
length as In Rayleigh scatter as can be seen In the follow
ing equation.^^ ^
" ("V X ) (2)
P(r) ■ volume backscatter coefficient of the atmosphere at range, r,
v ■ visual range in km (atmospheric visibility)
Due to the relationship between the
volume backscatter coefficient and the laser wavelength, the
technique is applicable in the ir and visible regions.
Mie scatter has the advantages that ir
and visible laser sources can be used which generate high
power beams thus enhancing the range of the technique. It
is also a monostatic system and there is no line broadening
due to the Doppler Effect. The main problem with Mie scat
tering is the difficulty in selectivity and the scattered
signal intensity is dependent upon atmospheric condition
changes.
Mie scattering has found useage in
locating dusts, aerosols, and smog in the atmosphere.
b . Raman Backscattering
Raman backscattering is a third type of
scatter phenomenon observed upon the interaction of light
with atmospheric pollutants that is applicable for remote33-3 5sensing procedures.
Raman scattering is a process involving an
exchange of energy between the scattered photon and the scattering
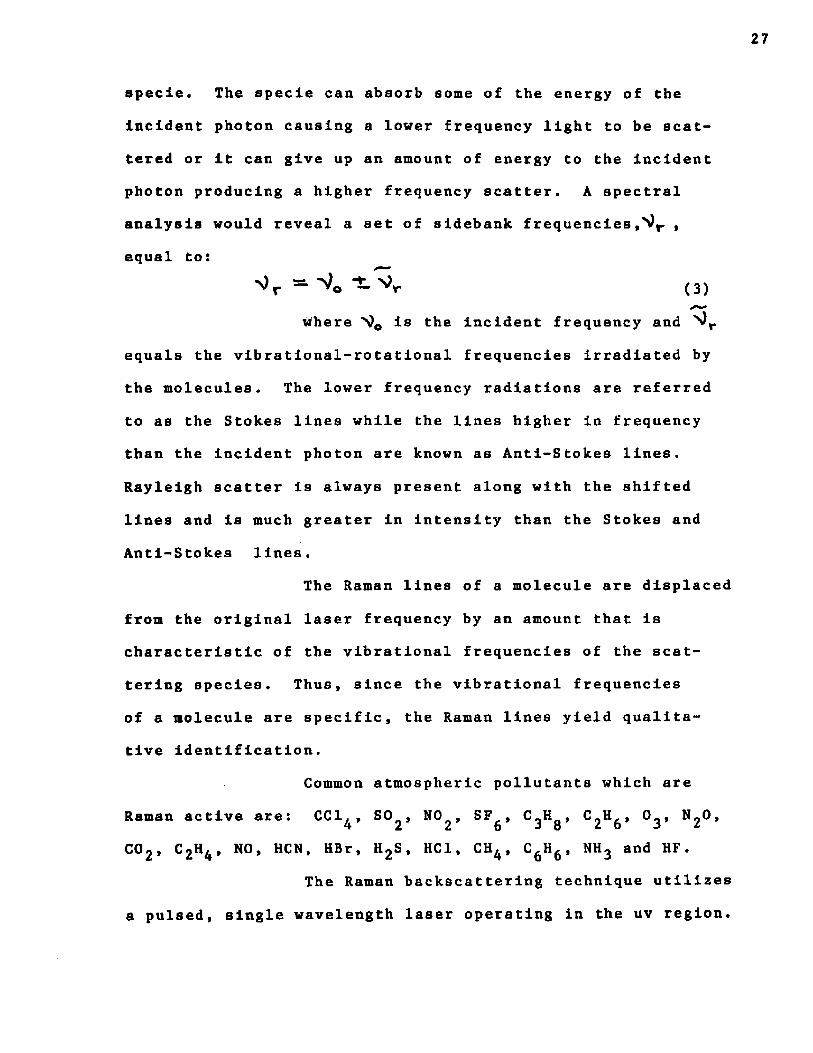
27
specie. The specie can absorb some of the energy of the
Incident photon causing a lower frequency light to be scat
tered or it can give up an amount of energy to the incident
photon producing a higher frequency scatter. A spectral
analysis would reveal a set of sldebank frequencies ,^)r ,
equal to:
(3)
Where is the incident frequency and
equals the vibrational-rotational frequencies irradiated by
the molecules. The lower frequency radiations are referred
to as the Stokes lines while the lines higher in frequency
than the Incident photon are known as Anti-Stokes lines.
Rayleigh scatter is always present along with the shifted
lines and is much greater in intensity than the Stokes and
Anti-Stokes lines.
The Raman lines of a molecule are displaced
from the original laser frequency by an amount that is
characteristic of the vibrational frequencies of the scat
tering species. Thus, since the vibrational frequencies
of a molecule are specific, the Raman lines yield qualita
tive identification.
Common atmospheric pollutants which are
Raman active are: CCl^, S0^» N° 2 * SF 6 * C 3H8* C 2H 6 ’ °3' ^2®*C02 , C 2H^, NO, HCN, H B r , HjS, HC1, C H ^ , CgHg, NH 3 and H F .
The Raman backscattering technique utilizes
a pulsed, single wavelength laser operating in the uv region.
28
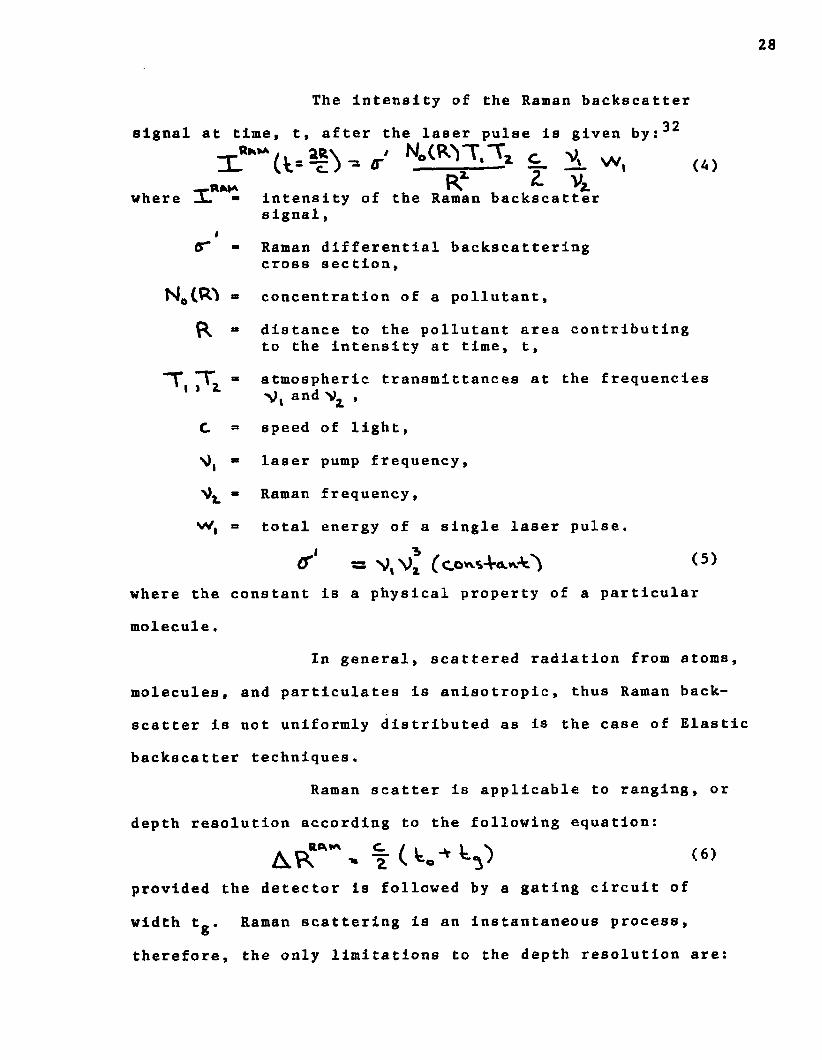
The intensity of the Raman backscattero 2signal at time, t, after the laser pulse is given by:’’
x «-* i S ) , / N . W T J , c V w , ( 4 )R 1 z v4where j - - intensity of the Raman backscatter
signal,i
OT - Raman differential backscattering cross section,
concentration of a pollutant,
“ distance to the pollutant area contributing to the intensity at time, t,
T.T, - atmospheric transmittances at the frequencies 1 * V, and ,c » speed of light,
■ laser pump frequency,
« Raman frequency,
= total energy of a single laser pulse.
<r‘ (5)the cons tant is a physical property of a particular
m ole cule.In general, scattered radiation from atoms,
molecules, and particulates is anisotropic, thus Raman back
scatter is not uniformly distributed as is the case of Elastic
backscatter techniques.
Raman scatter is applicable to ranging, or
depth resolution according to the following equation:
< 6 >
provided the detector is followed by a gating circuit of
width tg. Raman scattering is an instantaneous process,
therefore, the only limitations to the depth resolution are:
29
(1 ) the laser pulse length, t0 , and (2 ) the gate width,
Oxygen and nitrogen exist in the atmosphere
in large quantities and are Raman active. This fact can be
both an advantage as well as a disadvantage. Qualitative
analysis of a pollutant can be made as its Raman shift can
be determined due to the built-in standards, N 2 » and
Quantitative results can be made by comparing the back-
scattered intensity of the pollutant with the intensity
of the N 2 and 0 2 Raman lines. On the other hand, the Raman
lines of N 2 and 0 2 are much more intense than those of the
trace pollutants. Therefore, there exists the possibility
that the N 2 and 0 ^ signals may swamp or mask the pollutant
signal if its shifted lines occur near N 2 or 0 2 lines.
A serious disadvantage to the Raman back
scatter method is the lack of selective excitation. The
backscatter signal includes Raman scatter from all pollu
tants in the laser path along with the sample of interest.
This leads to interferences which can be so great as to make
the desired signal recovery impossible.
Raman backscatter utilizes a laser operating
in the uv region due to the scatter intensity relationship
to the inverse of the wavelength raised to the fourth power.
Atmospheric attenuation of a laser beam becomes a problem0
when operating at wavelengths shorter than 2500A due to
oxygen absorption. Significant ozone absorption also occurs
between 2000A and 3000& at concentrations in the range of
o.lppm. Rayleigh and Mie scattering are also a factor
decreasing the atmospheric transparency to the laser beam.
Resonance Raman scattering has been pro
posed as a means of Improving the scatter signal intensity
through an improvement in the Raman backscatter coefficient.
The laser source frequency, pump frequency, is selected to
be close to an allowed electronic transition of the molecule
of interest. This effect enhances the scattering cross
section and therefore increases the scatter intensity. This
technique requires a discretely tunable uv laser and there
fore the total output power is decreased.
The Raman scatter technique is monostatic
and therefore has the same degree of mobility as the Elastic
Backscatter technique.
c . Long Path Absorption
Long path absorption can be employed as a
remote sensing technique using a laser as the light source.
In this technique attenuation of a laser beam, as it propa
gates through the atmosphere, due to molecular specie
absorption is correlated to the concentration of the specie
in the atmosphere. There are two basic types of laser
absorption techniques used in remote sensing: (1 ) direct
absorption monitoring in which the intensity of the laser
beam is measured before and after absorption by a molecular
specie and (2 ) indirect measurement of the amount of mole
cular pollutant by observation of laser beam scatter;
Differential Absorption LIDAR.
31
In order for long path absorption techniques
to detect the presence of a compound, there must be an overlap of the laser line with an absorption band of the compound.3^-39
One must have access to at least two different laser lines;
one which is absorbed by the compound, and the other which is
not absorbed. In this way the second line serves as a refer
ence with which to compare the absorption of the first line.
The atmospheric attenuation, excluding the sample's affect
must be the same for both lines.
The region of interest is the "fingerprint"
region of the spectrum which extends from about 2 microns
to 20 microns wavelength. This region includes the funda
mental absorption bands (as well as some overtones) and
vibration-rotational bands. Most of the common pollutant
molecules exhibit fundamental vibrations in the region giving
rise to their detection. The entire fingerprint region is
not, however, available for use in remote sensing as water
and carbon dioxide absorption is prevalent. Carbon dioxide
exhibits very strong absorption in the 4.2-4.5/tand 14-16^.
regions. Water exhibits broad band absorption in the follow
ing regions: 2.4-3.^**, 4.6-8.!^m, and 16-2^**. Water absorption
does not reduce the per cent transmission to 0 % over the
entire regions listed; therefore, parts of these regions are
accessible for remote sensing. However, it 1b necessary to
use high resolution equipment and work in and around the
strong band absorption.
A number of laser media have been shown
to emit wavelengths In the fingerprint region. These Includ
neon, argon, krypton, Iodine, carbon dioxide, carbon monoxid
nitric oxide, and nitrous oxide. A good compilation of the
lasers used for atmospheric monitoring of this nature Is37available In the literature.
In order to use long path absorption as a
remote sensing technique, one must know the absorption bands
of the pollutant of Interest In order to tune the laser
source to match the absorption band. For Instance, a CO^
laser must be made to operate at 9.5yu In order to overlap
with the absorption band of 0^. The 9.2^* line of the CO 2
laser can then be used as the reference line as O 3 Is trans
parent to the CO 2 line.
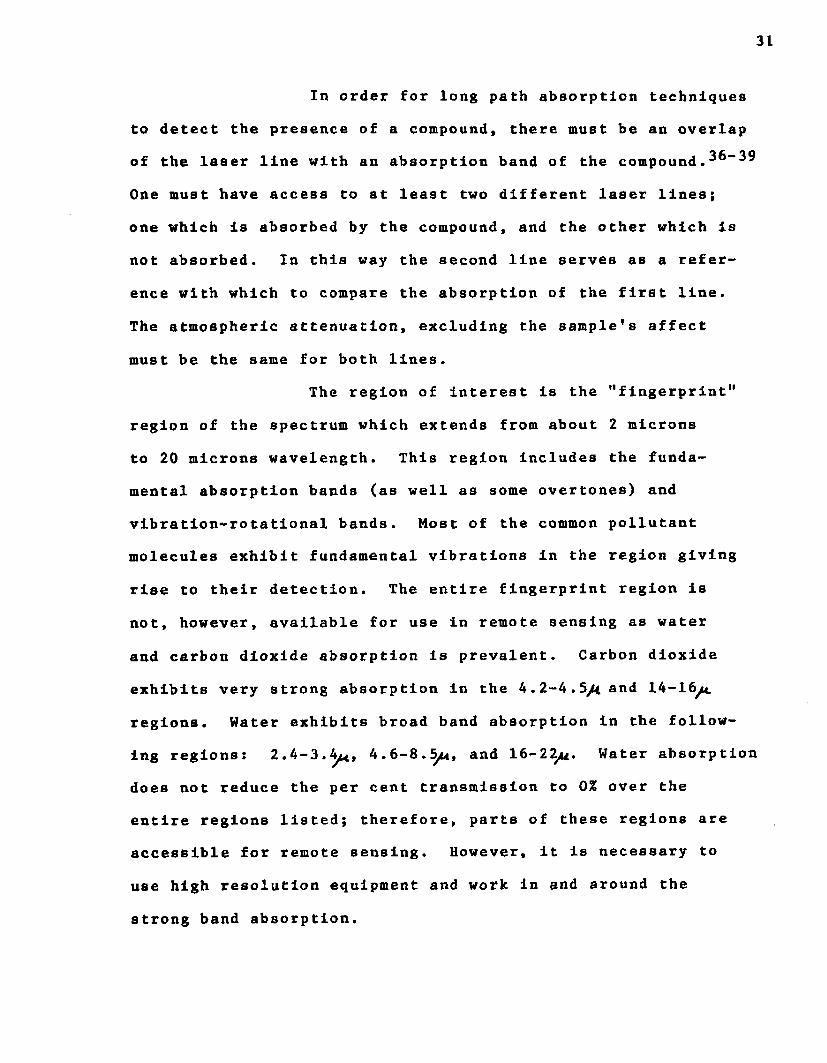
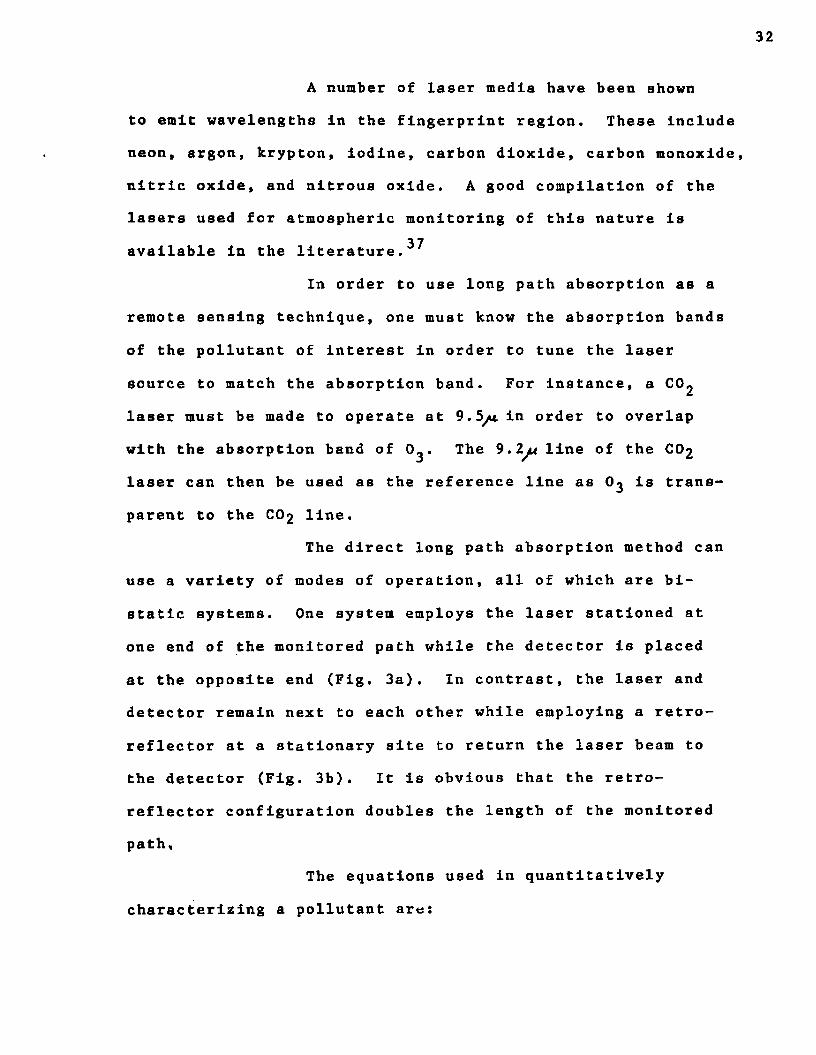
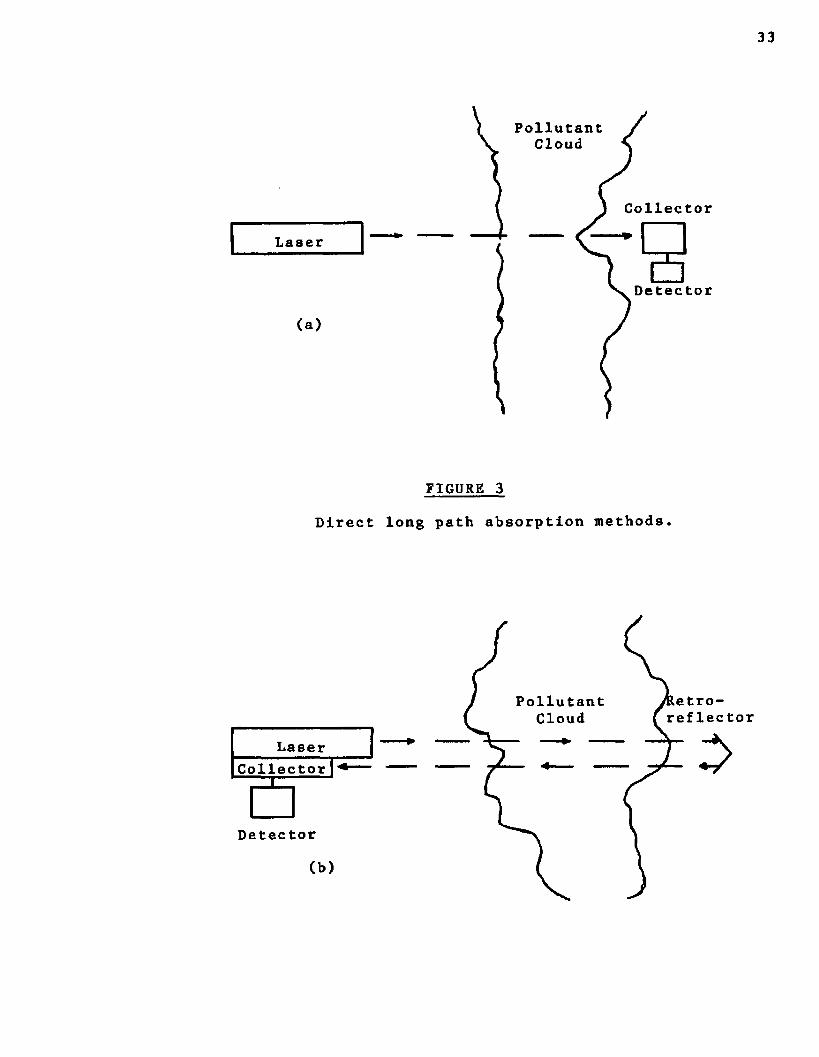
The direct long path absorption method can
use a variety of modes of operation, all of which are bi
static systems. One system employs the laser stationed at
one end of the monitored path while the detector is placed
at the opposite end (Fig. 3a). In contrast, the laser and
detector remain next to each other while employing a retro-
reflector at a stationary site to return the laser beam to
the detector (Fig. 3b). It Is obvious that the retro-
reflector configuration doubles the length of the monitored
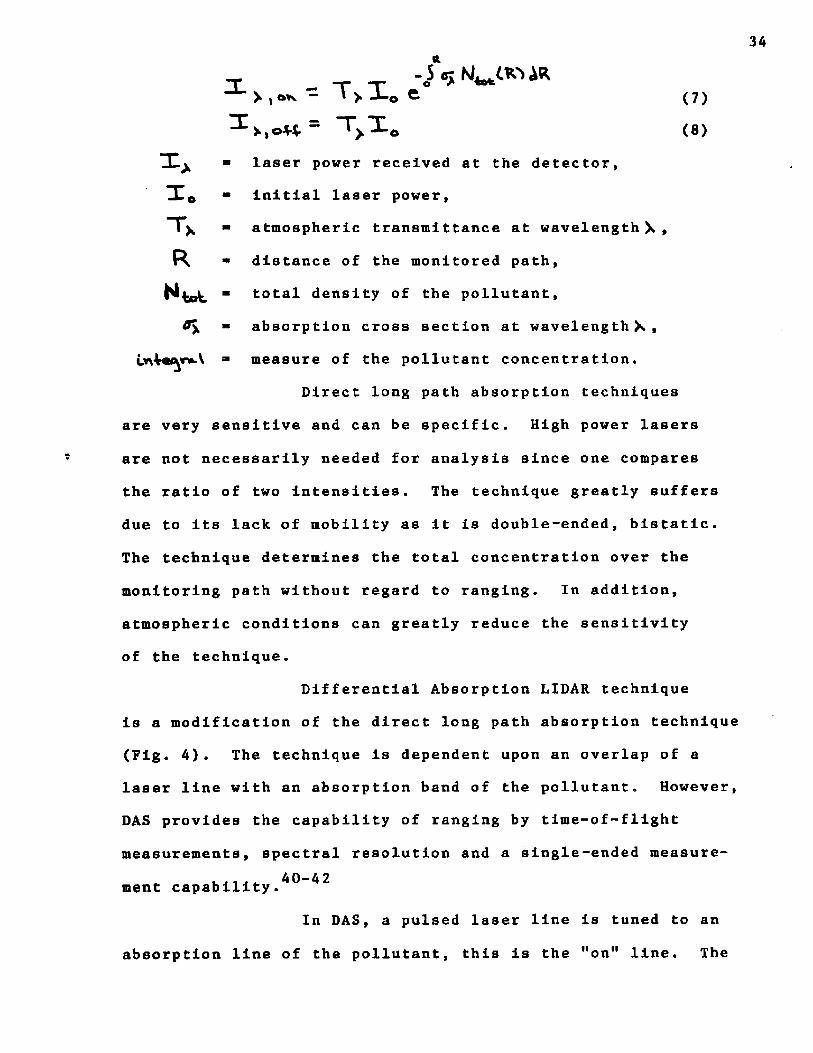
path.The equations used in quantitatively
characterizing a pollutant are:
33
Laser
(a)
PollutantCloud
Collector
Detec tor
FIGURE 3
Direct long path absorption methods,
PollutantCloud
Laser
letro- reflector
Collectorr ----
De tec tor
(b)
34
-r -p -r-> , e>*v - \ > -L0 e (7)
^ ,o«. = ^ 1 , (8)■ laser power received at the detector,
31© * initial laser power,
"T")* ■ atmospheric transmittance at wavelength X ,
R, * distance of the monitored path,
Nfcoi - total density of the pollutant,
0), ■ absorption cross section at wavelength X ,
i*vtay»A ■ measure of the pollutant concentration.
Direct long path absorption techniques
are very sensitive and can be specific. High power lasers
are not necessarily needed for analysis since one compares
the ratio of two intensities. The technique greatly suffers
due to its lack of mobility as it is double-ended, blstatic.
The technique determines the total concentration over the
monitoring path without regard to ranging. In addition,
atmospheric conditions can greatly reduce the sensitivity
of the technique.
Differential Absorption LIDAR technique
is a modification of the direct long path absorption technique
(Fig. 4). The technique is dependent upon an overlap of a
laser line with an absorption band of the pollutant. However,
DAS provides the capability of ranging by time-of-flight
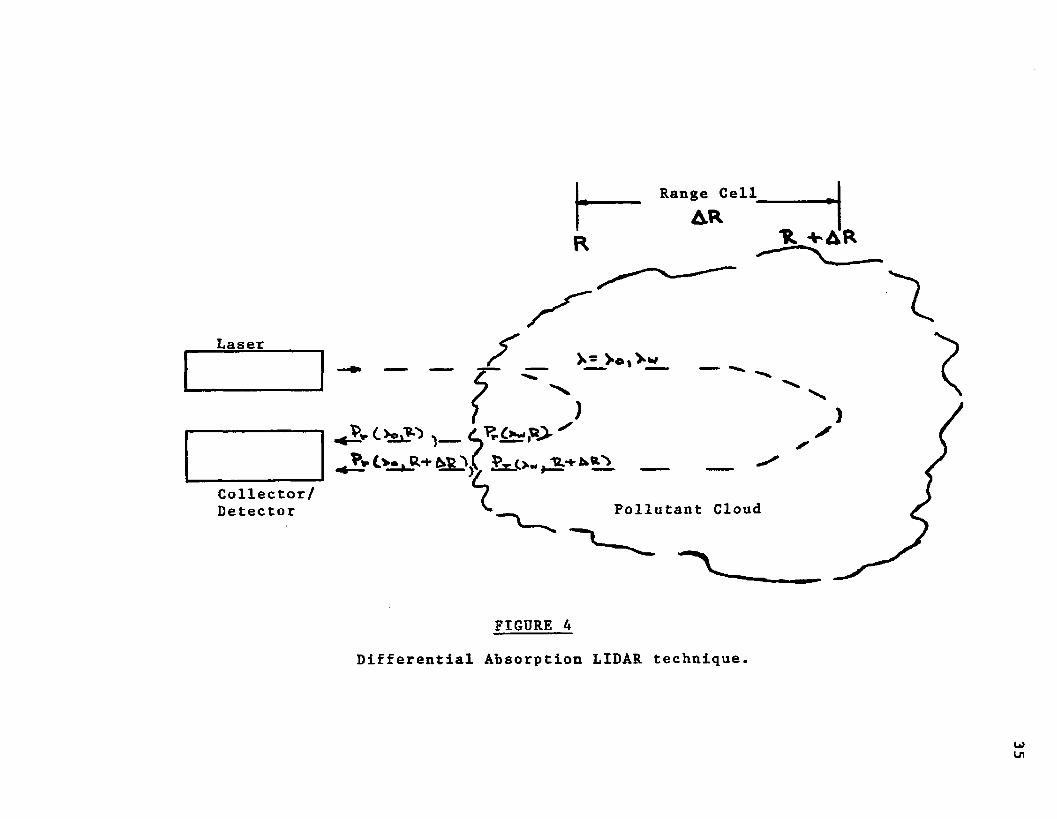
measurements, spectral resolution and a single-ended measure-40-42ment capability.
In DAS, a pulsed laser line is tuned to an
absorption line of the pollutant, this is the "on" line. The
Laser
Collector/Detector
Range Cell_AR H. -*-AR
r X - Vo ) Vw
)
Pollutant Cloud
FIGURE 4
Differential Absorption LIDAR technique.
u>Ul
36
scatter from various species in the laser beam path is
collected by a detector placed coaxially with the laser.
The intensity of the signal is recorded and stored. The
laser beam is then tuned to a line not absorbed by the sample
of Interest; thus, the "off" laser line. Again, the scatter
signal is collected and recorded. The amount of pollutant
in the laser path is then calculated from the data using
the following equations: —
^ % e (9)Y o r V geometry of the overlap between the laser
beam and the collection system's view,
-sj - half the laser pulse length,
ft*-solid angle of the collecting mirror at range, R,
°S c - atmospheric scatter coefficient,
P » initial laser power.„ (NfcR.-+NfOP « * e- (10)
N p ■ average pollutant level in the cloud at' length, L,
“ molecular concentration already present,
\ _ - length of the pollutant cloud.It is assumed that nothing absorbs the laser
line tuned "off" the absorption line of the sample. The
atmospheric attenuation must be equal for both the "on" and
"off" lines for all atmospheric species except the one of
interest.
Differential Absorption L1DAR appears to
have more potential among long path absorption techniques
37
than the conventional long path absorption techniques.
This of course is due to the advantages of being single
ended. It has been shown to be more sensitive than Raman backscatter.
DAS has a disadvantage in that its/ Odetectivity is dependent upon atmospheric turbulence.
Random variations in the amplitude and phase of a signal
are generated when the laser beam passes through the atmo
sphere and interacts with eddies. The laser system is degraded
due to effects such as; (1 ) beam steering, (2 ) image dancing,
(3) beam spreading, (4) image blurring, (5) scintillation
and (6 ) phase fluctuations. Beam steering is the result of
the laser beam deviating from its Initial path. This of
course causes a loss of power received at the collecting
system. Variations in the angle of the received wavefront
leads to image dancing since the image is no longer focused
at one point but at different points. Beam spreading is a
divergence of the beam due to small-angle scattering. This
decreases the power density of the beam. Image blurring is
the result of phase changes across the beam which results
in destruction of the phase coherence and therefore a blur
ring of the image. Bright areas and dark areas can appear
in the beam due to fluctuations in amplitude caused by
destructive beam interference. This effect is known as
scintillation. Phase fluctuation is the time variation in
the phase.

In spite of the above effects, sensitivities achieved with DAS are quite good. Sulfur dioxide has been
detected at a range of 1km with sensitivities less that I5ppb.
Scattering is a problem in the uv region
due to the Rayleigh effect and hence degrades DAS performance.
DAS is also limited by the atmospheric opaqueness in certain
regions. Ozone and oxygen have absorption regions in the uv,
thus limiting the system's wavelength range.
d . Resonance Backscatter/Electronic Excitation
Resonance backscatter occurs when the energy
of the incident photon is equal to the energy difference
between the pollutant's ground state level and an excited
state level. After absorption of the photon, the pollutant
may relax by a radlational process, thus emitting a photon.
This spontaneous emission is isotropic in nature; that is,
the radiation has a solid angle of 4lT steradians . Col
lection of a portion of the backscatter is then used to
determine the pollutant concentration level.
Due to the specificity of the energy level
differences, the technique employing a tunable laser source
can be used to excite selectively a wide variety of species.
Examples of atomic species excited are the various metal
vapor pollutants such as: arsenic, cadmium, zinc, sodium and
mercury. Several molecules considered are: benzene, N0 2 >
S02> and CO.In order for electronic excitation to occur,
the energy of the photon from the laser must equal the energy
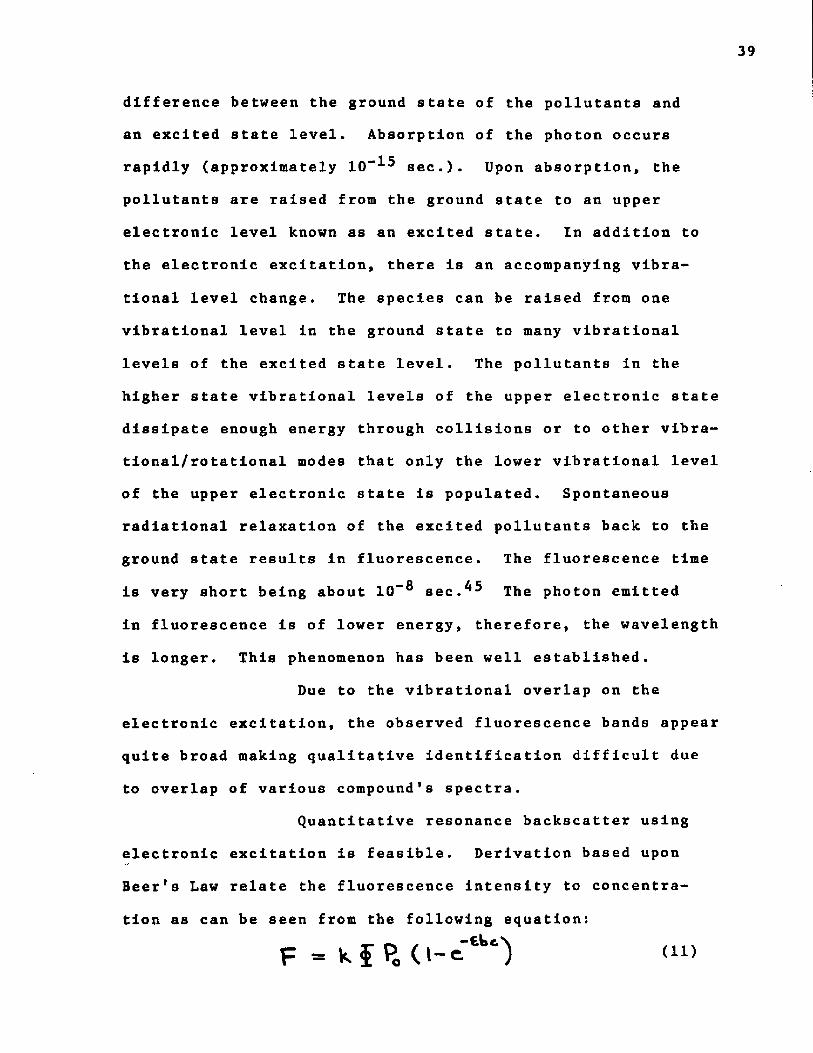
39
difference between the ground state of the pollutants and
an excited state level. Absorption of the photon occurs
rapidly (approximately lO”^ sec.). Upon absorption, the
pollutants are raised from the ground state to an upper
electronic level known as an excited state. In addition to
the electronic excitation, there is an accompanying vibra
tional level change. The species can be raised from one
vibrational level in the ground state to many vibrational
levels of the excited state level. The pollutants in the
higher state vibrational levels of the upper electronic state
dissipate enough energy through collisions or to other vibra
tional/rotational modes that only the lower vibrational level
of the upper electronic state is populated. Spontaneous
radlatlonal relaxation of the excited pollutants back to the
ground state results in fluorescence. The fluorescence time
is very short being about 10”® s e c . ^ The photon emitted
in fluorescence is of lower energy, therefore, the wavelength
is longer. This phenomenon has been well established.
Due to the vibrational overlap on the
electronic excitation, the observed fluorescence bands appear
quite broad making qualitative identification difficult due
to overlap of various compound's spectra.
Quantitative resonance backscatter using
electronic excitation is feasible. Derivation based upon
Beer's Law relate the fluorescence intensity to concentra
tion as can be seen from the following equation:
F = w * P0 ( i d
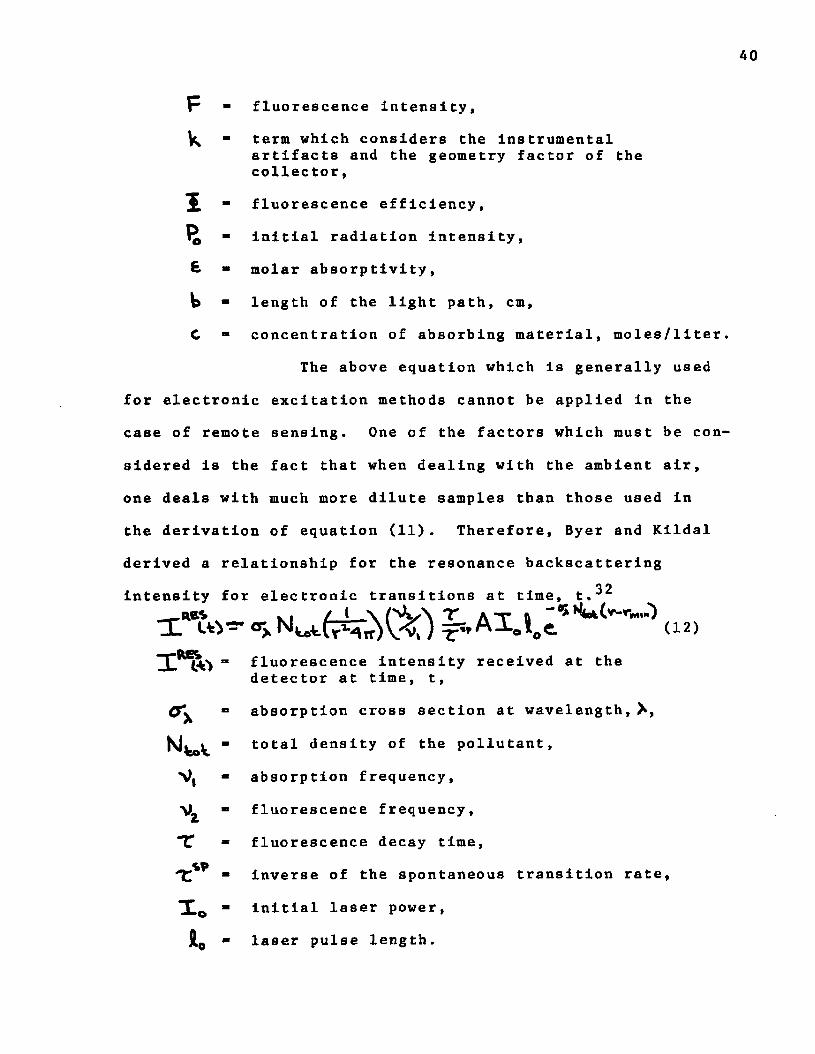
p - fluorescence intensity,term which considers the instrumental artifacts and the geometry factor of the collector,
I -P. -
fluorescence efficiency
initial radiation intensity
6 - molar absorptivity,
b ■ length of the light path, cm,
C ■ concentration of absorbing material, moles/lite
& ■
The above equation which is generally used
for electronic excitation methods cannot be applied in the
case of remote sensing. One of the factors which must be co
sidered is the fact that when dealing with the ambient air,
one deals with much more dilute samples than those used in
the derivation of equation (11). Therefore, Byer and Klldal
derived a relationship for the resonance backscatteringa 2intensity for electronic transitions at time* t.
(12)fluorescence intensity received at the detector at time, t,
(Xy " absorption cross section at wavelength, X,
total density of the pollutant,
V, absorption frequency
“ fluorescence frequency,
TT ■ fluorescence decay time,
"T; ■ inverse of the spontaneous transition rate
■ initial laser power
jl0 ■ laser pulse length.
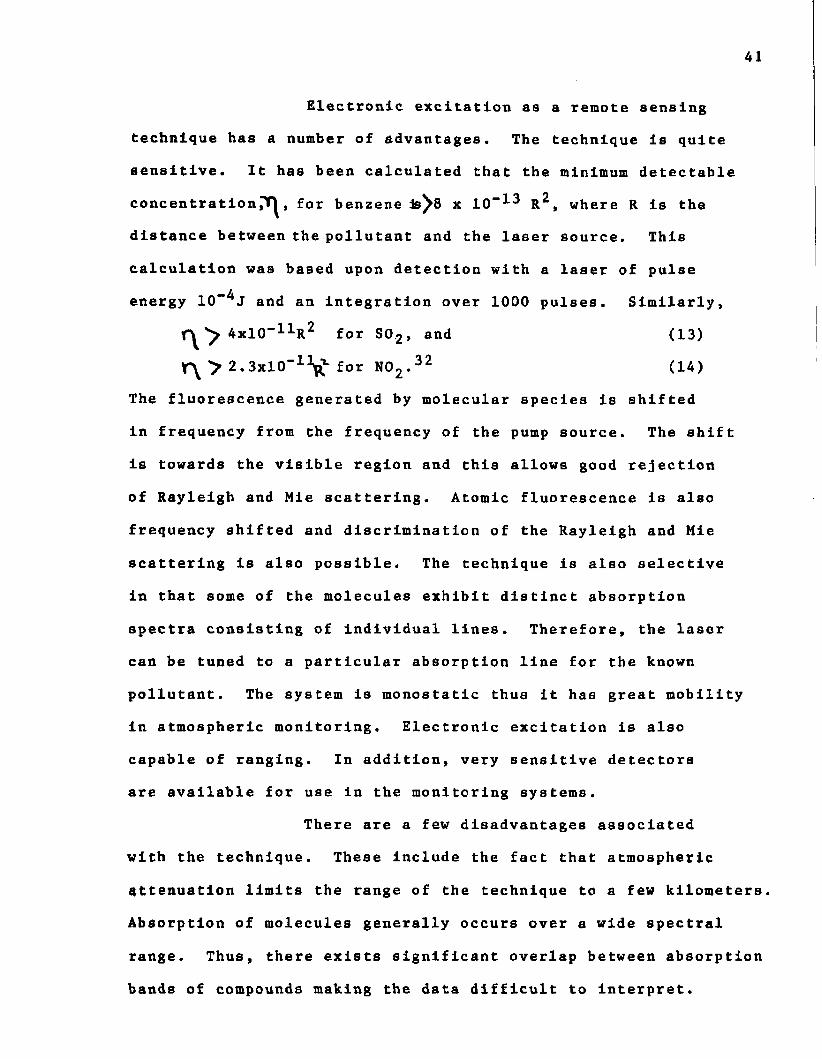
41
Electronic excitation as a remote sensing
technique has a number of advantages. The technique is quite
sensitive. It has been calculated that the minimum detectable
concentration,T|, for benzene ls 8 x 10 ~ 1 3 R 2 , where R is the
distance between the pollutant and the laser source. This
calculation was based upon detection with a laser of pulse
energy 10~^J and an integration over 1000 pulses. Similarly,
4xlO"1 1 R 2 for S02 » and (13)
r \ > 2.3xl0-11^ for N0 2 . 32 (14)
The fluorescence generated by molecular species is shifted
in frequency from the frequency of the pump source. The shift
is towards the visible region and this allows good rejection
of Rayleigh and Mie scattering. Atomic fluorescence is also
frequency shifted and discrimination of the Rayleigh and Mie
scattering is also possible. The technique is also selective
in that some of the molecules exhibit distinct absorption
spectra consisting of individual lines. Therefore, the laser
can be tuned to a particular absorption line for the known
pollutant. The system is monostatic thus it has great mobility
in atmospheric monitoring. Electronic excitation is also
capable of ranging. In addition, very sensitive detectors
are available for use in the monitoring systems.
There are a few disadvantages associated
with the technique. These include the fact that atmospheric
attenuation limits the range of the technique to a few kilometers.
Absorption of molecules generally occurs over a wide spectral
range. Thus, there exists significant overlap between absorption
bands of compounds making the data difficult to interpret.
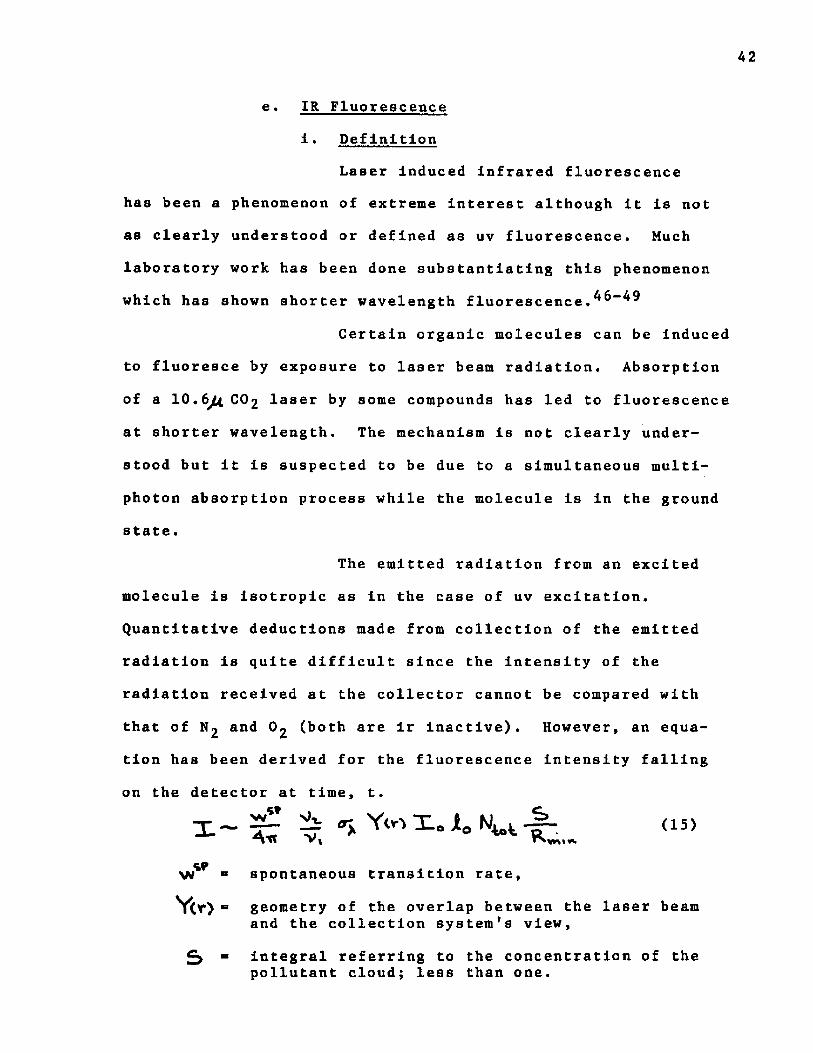
42
e . IR Fluorescence
i • Definition
Laser induced infrared fluorescence has been a phenomenon of extreme interest although it is not
as clearly understood or defined as uv fluorescence. Much
laboratory work has been done substantiating this phenomenon
which has shown shorter wavelength fluor e s c e n c e , ^ ”^
Certain organic molecules can be induced
to fluoresce by exposure to laser beam radiation. Absorption
of a 1 0 .6^4 CC>2 laser by some compounds has led to fluorescence
at shorter wavelength. The mechanism is not clearly under
stood but it is suspected to be due to a simultaneous multi
photon absorption process while the molecule is in the ground
state.
The emitted radiation from an excited
molecule is isotropic as in the case of uv excitation.
Quantitative deductions made from collection of the emitted
radiation is quite difficult since the intensity of the
radiation received at the collector cannot be compared with
that of Nj and O 2 (both are lr inactive). However, an equa
tion has been derived for the fluorescence intensity falling
on the detector at time, t.
W “ spontaneous transition rate,
Yor>- geometry of the overlap between the laser beam and the collection system's view,
3 ■ integral referring to the concentration of thepollutant cloud; less than one.
43
Laser induced Ir fluorescence is
sensitive, selective monostatic and capable of ranging
operations. However, the main disadvantage is the lack
of easy quantitation.
i i . Studies Performed at LSU
Work began in this laboratory in 1965
to investigate laser Induced infrared fluorescence using a
quasi-contlnuous CO 2 laser. The ultimate goal of the project
was the development of the technique as an analytical tool
capable of remote sensing operation.
The first Investigations were made
using dilute mixtures of various gases with air in closed
cells. Numerous gases fluoresced under the influence of
the laser beam. These gases included methane, ethane, propane,
n-pentane, Isopentane, n-hexane, n-heptane, ethylene, acetylene,
acetic acid, n-butyl amine, and methylene chloride. Shorter
wavelength fluorescence was observed as well as fluorescence
occurring at all wavelengths corresponding to vibrational
transitions seen in ir spectroscopy.In order for the technique to be use
ful as a quantitative method, a relationship between the
fluorescence intensity and concentration was researched.
The result of the studies led to the observation of self
absorption .Interference studies were undertaken
in order to determine the feasibility of measuring the
fluorescence of one compound in the presence of o t h e r s . ^
44
This was necessary if the technique were to be applied to
real world monitoring systems.
Further study of the parameters con
trolling the fluorescence intensity was undertaken using
ethylene as a standard gas. Fluorescence intensity was5 2monitored as a function of laser power, gas concentra
t i o n ^ , 53 an<j excitation lasing l i n e . ^ Fluorescence life
times of ethylene were also investigated.^
Ethylene was again chosen as the gas
to be studied in a series of quenching studies. In these
studies the collisional effect of various molecules on the
fluorescence intensity of ethylene was o b s e r v e d . ^
Other studies made included the relation
ship between fluorescence intensity and ethylene partial
pressures and pump p o w e r . F l u o r e s c e n c e spectra of approxi-57mately forty-five compounds 3 0 and ozone have been reported.
Laser induced chemical reactions were
studied in our laboratories as a remote sensing related problem.47,58,59 initially it was found that oxygen in an
air/propylene sample reacted with the propylene when irradiated
with a low power C O 2 laser beam. The laser Induced reactions
presented a possible analytical Interference for remote
sensing of organic pollutants in the atmosphere with the
CO 2 laser, especially for propylene.
Reaction studies were conducted in
which the oxygen content and laser power were varied. It
was found that the extent of reaction increased with
45
Increasing oxygen content and laser power. Paraformaldehyde
visibly formed in the reaction of the oxygen and propylene
with acetaldehyde being a major product. The role of
acetaldehyde in the reaction was then Investigated.
Acetaldehyde was found to first form in the reaction of
oxygen with propylene and then interacted with the laser
beam and decomposed.
Thermal reaction between oxygen and
propylene was attempted up to 200°C but no reaction was
observed.
From the laser induced chemical reaction
studies it was concluded that the propylene/oxygen reaction
was too slow to produce significant analytical interference
for the remote sensing of propylene.
Laser induced infrared fluorescence
was then applied as a remote sensing technique. The first
optical arrangement utilized a cassegralnian telescope as
seen in Fig. 5. This arrangement proved to be insensitive
to the theoretically most intense fluorescence signals. The
optical system was changed and a diurnal study was made using
this t e c h n i q u e . T h i s study indicated that it was feasible
to monitor weak fluorescence signals in the presence of large
amounts of ir background.
Hypothetical calculations have been
made for the remote sensing of e t h y l e n e . ^ For these cal
culations it was assumed that the laser power was, 1 0 0 0 W;
sample thickness, lmj telescope mirror area, lm^, detectivity
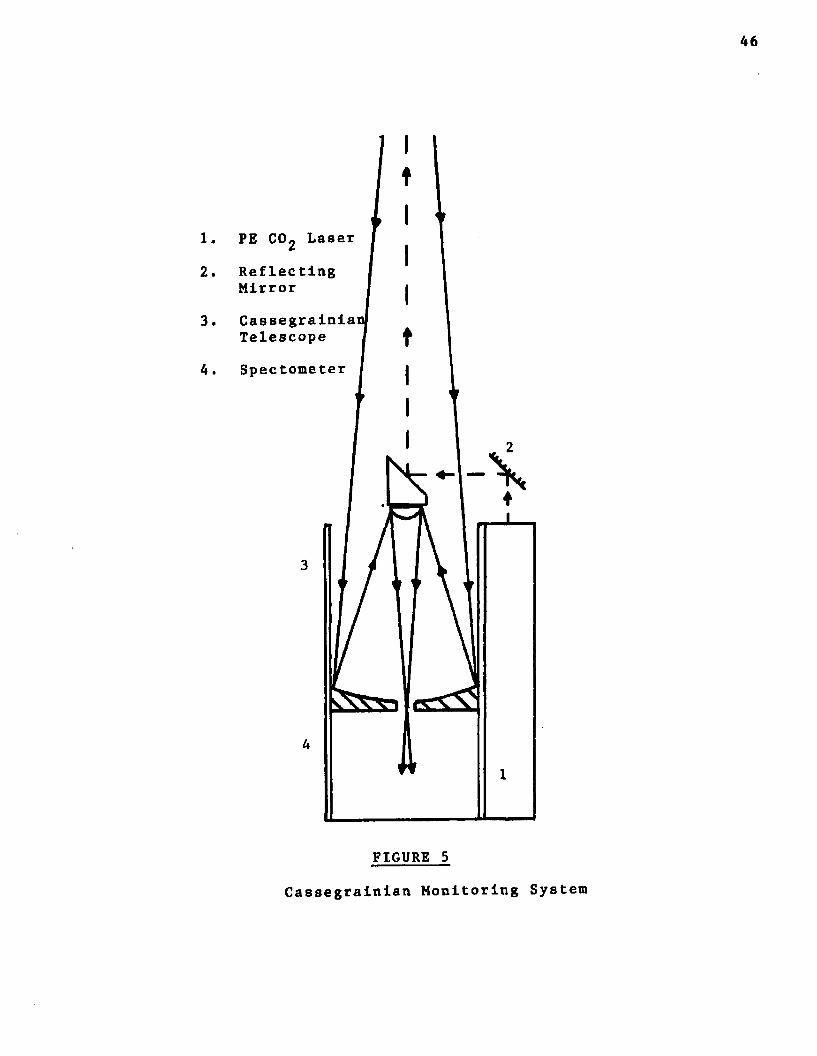
46
PE CO, Laser«
ReflectingMirror
CassegrainiaTelescope
Spectometer
FIGURE 5
Cassegrainlan Monitoring System
13of the detector, 1 0 , and efficiency of the spectrometer,
0.1. In addition, the intensity of ethylene fluorescence
was assumed to be a linear function of the laser power and
sample concentration. The atmospheric attenuation of the
laser beam was considered to be negligible as well as self
absorption by ethylene. Fig. 6 is a graph of the results
of the hypothetical calculations. From Fig. 6 it can be
seen that an ethylene concentration of O.lppm can be detected
at a distance of 10km with a detection of lOOppm at a range
of 1000km. Thus, it is felt that industrial site monitoring♦could be performed from earth satellites in cases where
ethylene emission is quite high.
The work presented in this dissertation
includes several refinements to the optical system initially
employed in remote sensing studies. The new system employed
a 16" concave collecting mirror instead of a cassegrainian
system. One of the refinements allowed observation of the
strongest fluorescence signals; that is the fluorescence
generated within the first few meters of the laser beam path.
Other refinements included the elimination of mirror surfaces
not only the one used to reflect the laser beam through a
laboratory window but a secondary collecting mirror in the
optics system. The reduction in the number of mirror sur
faces increased the efficiency of the gathering/detection
system and decreased the laser power loss.
Laser induced ir fluorescence signals
were observed in the atmosphere employing the new optical
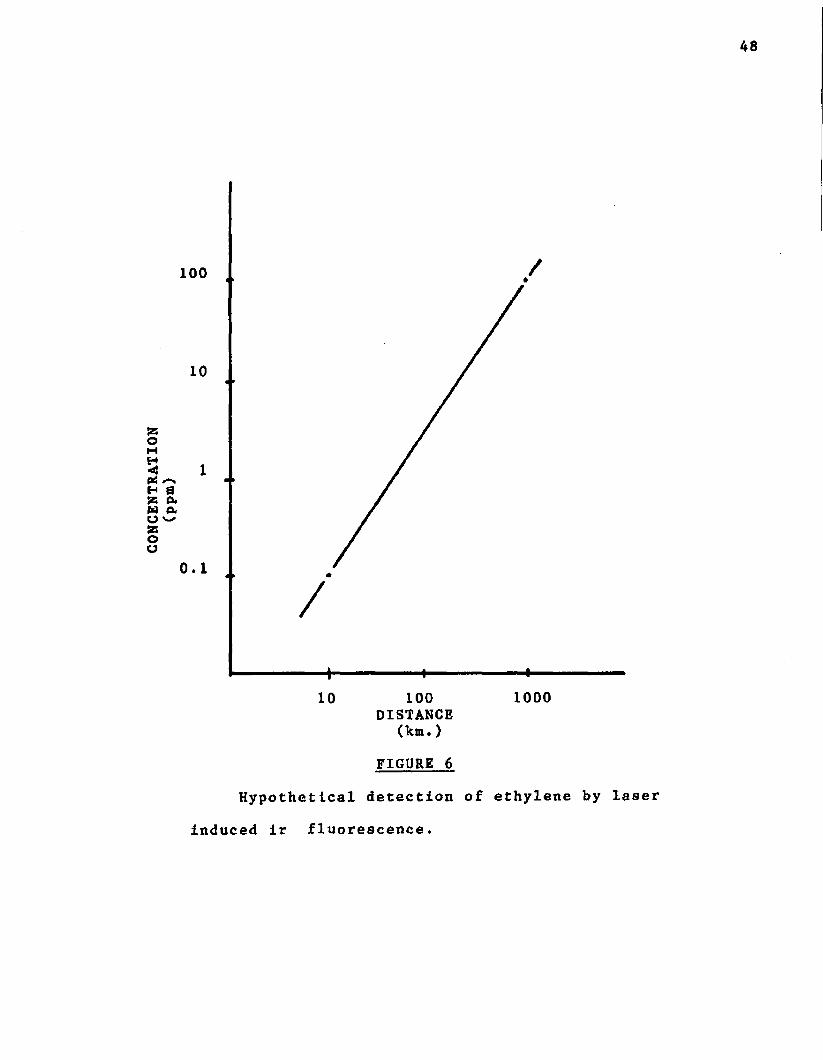
CONC
ENTR
ATIO
N(p
pm)
48
100
10
1
1
10 100 1000 DISTANCE
(km. )
FIGURE 6
Hypothetical detection of ethylene by laser
Induced lr fluorescence.
arrangement. A comparison study between a pyroelectric
and cryogenic detector was performed as to the signal
response for each of the detectors. The two detectors
differed in the sizes of the detector surface areas,
detectivity, noise levels, and response times. Various
ir regions were viewed in relationship to signal intensity
observed. These regions included: 1.7-5.(Jn, 3.3-lO.^t,
and 7.0-15.(Jxt. Signals were observed and compared for
each of the filter ranges as well as those seen without
the use of a filter. Employment of electronically phase
shifting the detector system led to the discrimination of
scatter from the COj laser. The fluorescence intensity
was shown to be dependent upon the degree of phase shift
ing employed in addition to the elimination of laser scatter
Finally, several diurnal patterns were obtained using the
laser induced lr fluorescence of organic atmospheric pollu-1 2 fi 2tants over a university parking lot.
i i i , Parameters Which Affect Laser InducedIR Fluorescence
A number of parameters affect the inte
slty of the laser induced ir fluorescence signals and must
be considered. These parameters are: (/1) laser character
istics, (/) sample characteristics and (fi.) collection/
detector system characteristics.
XL. Laser Characteristics
Three laser characteristics affect
the fluorescence intensity: laser excitation line, laser
power and laser beam distortion.
50
The excitation line of the laser must overlap with an absorption band of the compound of
interest in order for the compound to fluoresce, unless one is dealing with sensitized fluorescence. Therefore, it is
necessary to have a wide range of available laser lines in
order to monitor the numerous atmospheric pollutants. Dif
ferent laser media can be used in order to obtain the laslng
line needed. For instance, there exists a variety of com-
merically available lasers based on the use of materials such
as dyes, gas mixtures, and solid state material. In addition,
one may further select various Individual lasing lines of
some of these media through the utilization of optical
elements such as a prism or grating. In the case of the
CC>2 laser, lasing occurs at four main regions or "envelopes."
Each envelope is composed of approximately 20 individual
and very similar wavelength lines. Selection of a single
line output of the CO 2 laser can be made by employing the
dispersive element and adjusting the angle of the element
until the desired laser line is made to lase. Other line
selective techniques employ utilization of certain gaseous
isotopes and the employment of an absorbing gas which causes
the laser to mode.
The amount of laser power used to
generate fluorescence in various studies has been as low as
several milliwatts cm"^ and as high as several gigawatts.
Studies have been made on ethylene fluorescence intensitye oas laser power was varied. In this study the fluorescence
intensity of the ethylene from 1.7^** to S^t was proportional
to the power raised to a factor of 2.2. The relationship in
the region of 3. to 10 / a was found to be p^*^. Both6 3results agreed with work reported by Yuan and Flynn. In
the region of 7 ^ to lS^u. the intensity of ethylene fluores
cence was approximately linear with laser power.
A laser beam propagating through
the atmosphere can be affected by air pockets since there
exists a change in the atmospheric refractive index. The
results of this change lead to a change In laser beam
direction, destructive beam interference and beam diver
gence. The laser beam may also be slightly phase shifted
and different in a m p l i t u d e . T h e s e effects reduce the
intensity of the fluorescence.
Sample Characteristics
The sample concentration and
fluorescence lifetimes as well as particulate and molecular
interferences can limit the use of laser induced ir fluores
cence as a remote sensing technique. The sample concentra
tion may lead to self absorption. Self absorption is caused
by an absorption of the fluorescence photons by unexcited
sample molecules. This quenching effect of ir fluorescence
is quite similar to that observed for uv fluorescence. The
stronger the emission of the fluorophors the greater the
problem as the concentration of sample must be lower in
order for there to be a direct relationship between fluores
cence intensity and concentration. H. Barnes conducted a
study of the self absorption phenomenon for various organic
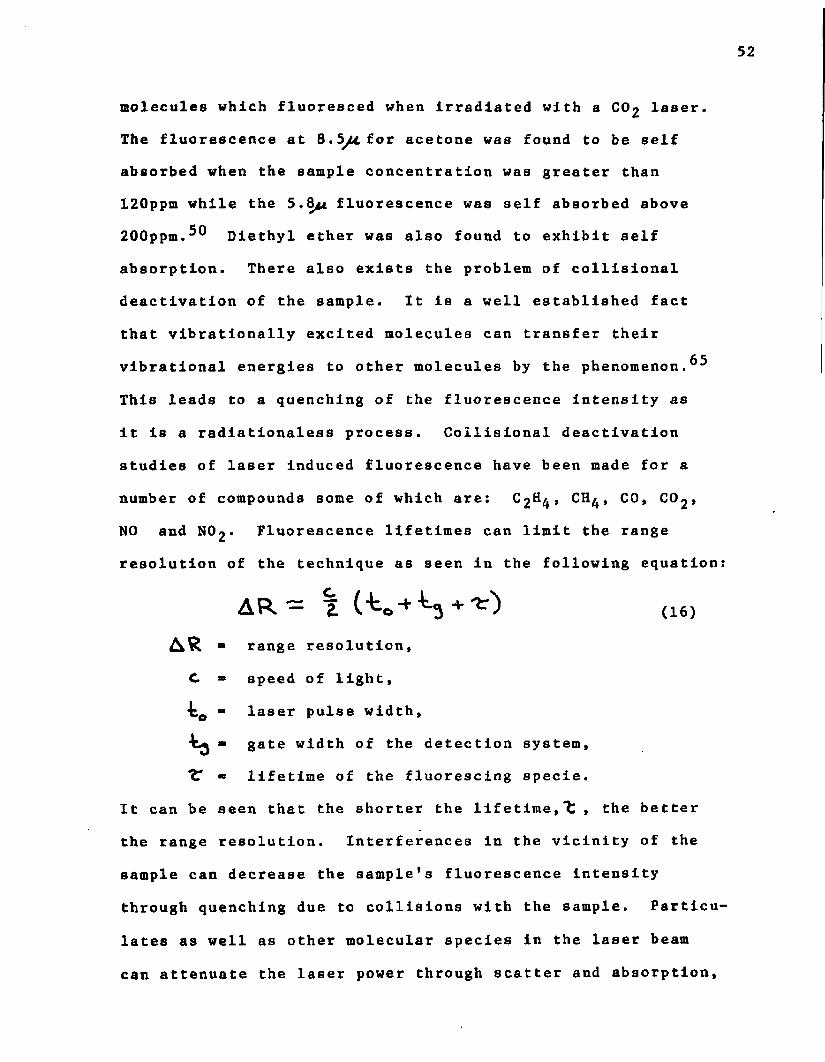
molecules which fluoresced when Irradiated with a C0 2 laser.
The fluorescence at B.5/4. for acetone was found to be self
absorbed when the sample concentration was greater than
120ppm while the 5.84* fluorescence was self absorbed above
200ppm.^® Diethyl ether was also found to exhibit self
absorption. There also exists the problem of colllsional
deactivation of the sample. It Is a well established fact
that vlbrationally excited molecules can transfer their
vibrational energies to other molecules by the phe n o m e n o n . ^
This leads to a quenching of the fluorescence Intensity as
It Is a radlationaless process. Colllsional deactivation
studies of laser Induced fluorescence have been made for a
number of compounds some of which are: ^ 2 ^4 ’ CH 4 » c o > C0 2 »NO and N 0 2 - Fluorescence lifetimes can limit the range
resolution of the technique as seen In the following equatlo
A R - 2 (■ 0 “*“ + (i6)AR - range resolution,
c ■ speed of light,
t0 " laser pulse width,
gate width of the detection system,
tr « lifetime of the fluorescing specie.
It can be seen that the shorter the lifetime,“t , the better
the range resolution. Interferences in the vicinity of the
sample can decrease the sample's fluorescence Intensity
through quenching due to collisions with the sample. Partlc
lates as well as other molecular species in the laser beam
can attenuate the laser power through scatter and absorption
respectively. Existing components of the atmosphere can
also affect the sample's fluorescence intensity as in the case of N 2 which has been shown to quench ethylene
to gather a large portion of the fluorescence signal and
transfer the signal to a detector system without any light
loss. The ideal collector system would view the entire
laser beam path, especially the portion closest to the
source since the fluorescence intensity is inversely pro
portional to the square of the distance. The collector
system should also contain a minimum number of reflecting
surfaces in order to minimize light losses and it should
concentrate the light onto the detector element.
detectivity. The detectivity is a measure of the detector's
sensitivity and is defined by the following equations:
fluorescence 66
>C . Collection/Detection System
A collector system should be able
The detector should have a large
(17)
2A ■ area of the detector in cm ,
NEP ■ noise equivalent power.
2PQ ■ infrared flux in watts/cm
S/N ■ signal to noise ratio,
(18)
f - bandwidth of the amplifier, in hertz
54
i v . Application of Laser Induced IRFluorescence to Remote MonitoringApplication of laser induced ir
fluorescence as a remote sensing method has been shown to
be feasible by work done in this laboratory. The initial
attempt at atmospheric monitoring was made by employing a
cassegrainian collector system (Fig. 5) with a 4-1/4 inch
aluminum coated primary mirror. The apparatus was not
sufficiently sensitive to observe fluorescence signals. The
power of the laser beam was too low to excite molecules more
than a few feet from the laser. The cassegrainian system,
in turn, was not capable of viewing the first few feet of the
optical path; therefore, the system was blind to the most
intense fluorescence signals. In a second attempt, a large
gold coated collecting mirror was used to collect fluores
cence generated in the laser beam path (Fig. 7 ). A diurnal
study was made employing this optical configuration; however,
the system did not distinguish between laser scatter and
fluorescence.The work presented in this disserta
tion describes various optical arrangements and p.ocedures
used in order to distinguish between the laser induced fluores
cence of organic atmospheric pollutants and laser scatter. The
first optical configuration (Fig. 8 ) utilized a small front
surfaced gold coated mirror to transmit the laser beam through
an open laboratory window. A large,16-1/2 inch, front sur
faced collecting mirror and a smaller focusing mirror were used
to gather the fluorescence signals and focus them onto a filter/
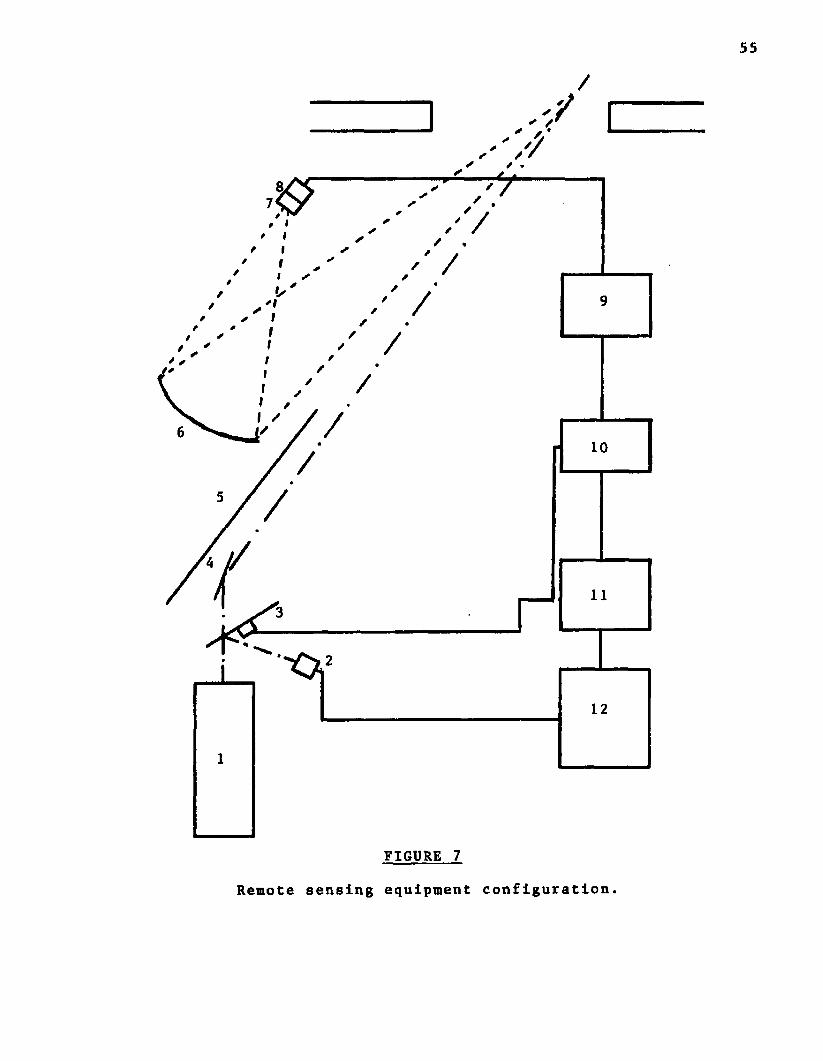
FIGURE 7
Remote sensing equipment configuration.

56
FIGURE 7 (cont.)1 . Laser
2 . Power Monitor
3. Chopper
4. Flat Mirror
5. Partition
6 . Collecting Mirror
7. Filter Wheel
8 . Detector
9. Pre-amplifier
1 0 . Lock-in Amplifier
1 1 . Dual Pen Recorder
1 2 . Power Monitor Amplifier
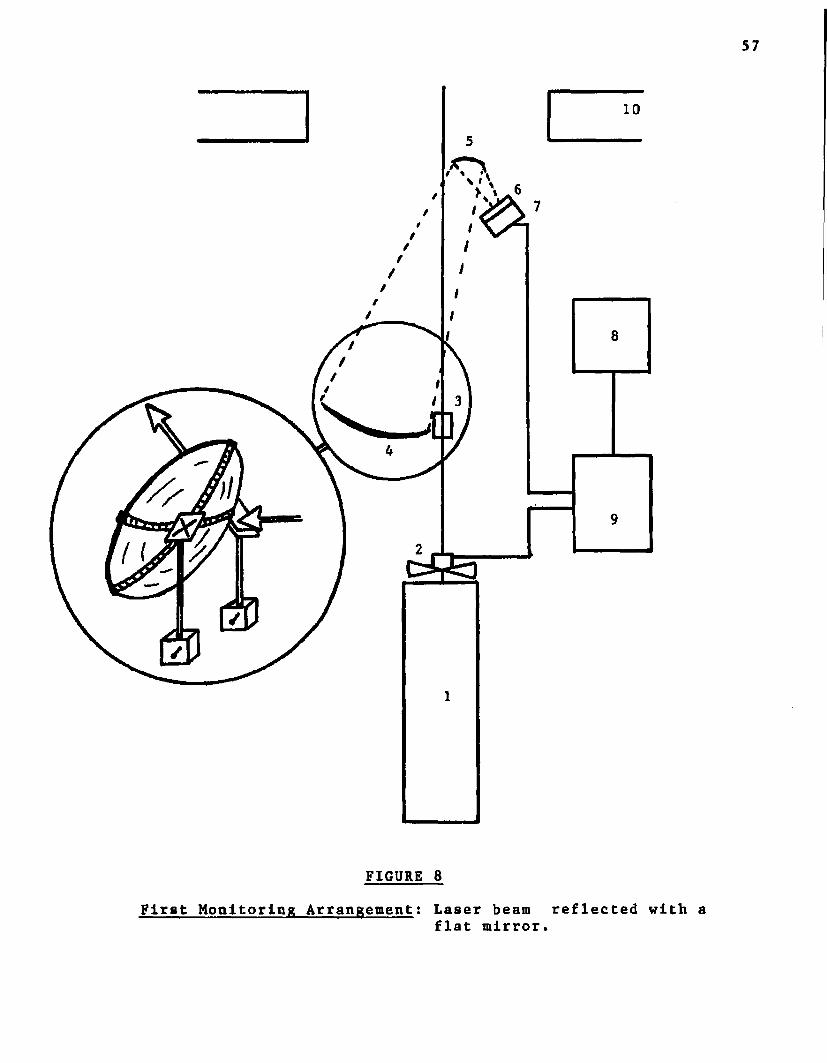
N '<
FIGURE 8
First Monitoring Arrangement; Laser beam reflected withflat mirror.

58
FIGURE 8 (cont.)1. Laser
2. Chopper3. Flat, Front-Surface Mirror
A. Collecting Mirror
5. Focusing Mirror
6 . Filter Wheel
7. Detector
8 . Recorder
9. Pre-amp and Lock-in Amplifier
10. Window Frame
59
detector system. A modification of the equipment set up
can be seen in Fig. 9 in which the laser is positioned in
such a manner that the laser beam propagates out the window
without the use of a reflecting mirror. The collection
system still employed two mirrors; one a gathering mirror,
the other a focusing mirror. A final modification (Figs.
1 0 , 1 1 ) eliminated the small focusing mirror in an attempt
to minimize light losses from mirror surfaces.
The final modification arrangement
was used for various studies. These studies Included:
diurnal, phase shifting, filter, and detector studies.
It is felt that the system can be
further improved upon in several ways. A more powerful laser
with less beam divergence would extend the range of excita
tion. (In these studies the Perkin Elmer laser had a maxi
mum power of 7-14 watts/cm^). In order to excite selectively
certain organic compounds, a tunable laser is required. A
better collecting mirror would enhance the signal intensity
as in the studies reported, the mirror used was of poor
optical quality. Large detector elements would also enhance
the capability of the system to view weaker fluorescence
signals.
B . Laser Intracavitv Absorption Spectroscopy
Laser intracavity absorption spectroscopy is a
sensitive absorption technique based upon the interaction of
a sample with a laser line after introduction into the laser
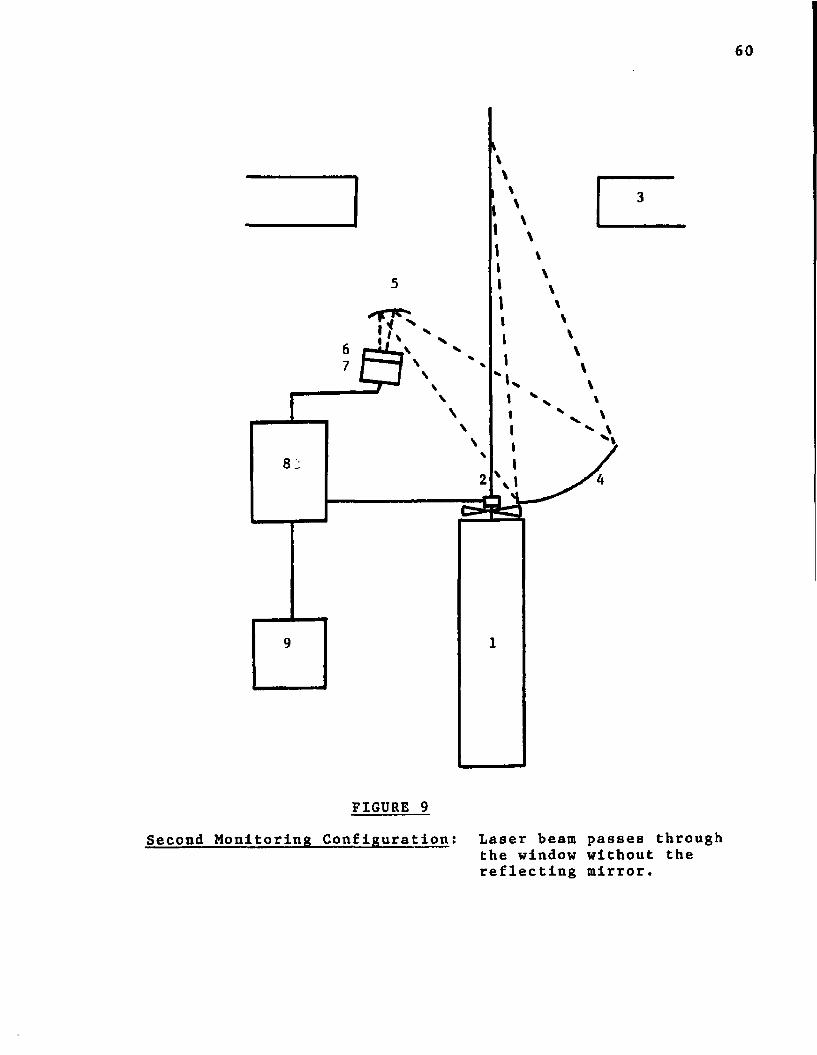
60
FIGURE 9Second Monitoring Configuration: Laser beam passes through
the window without the reflecting mirror.
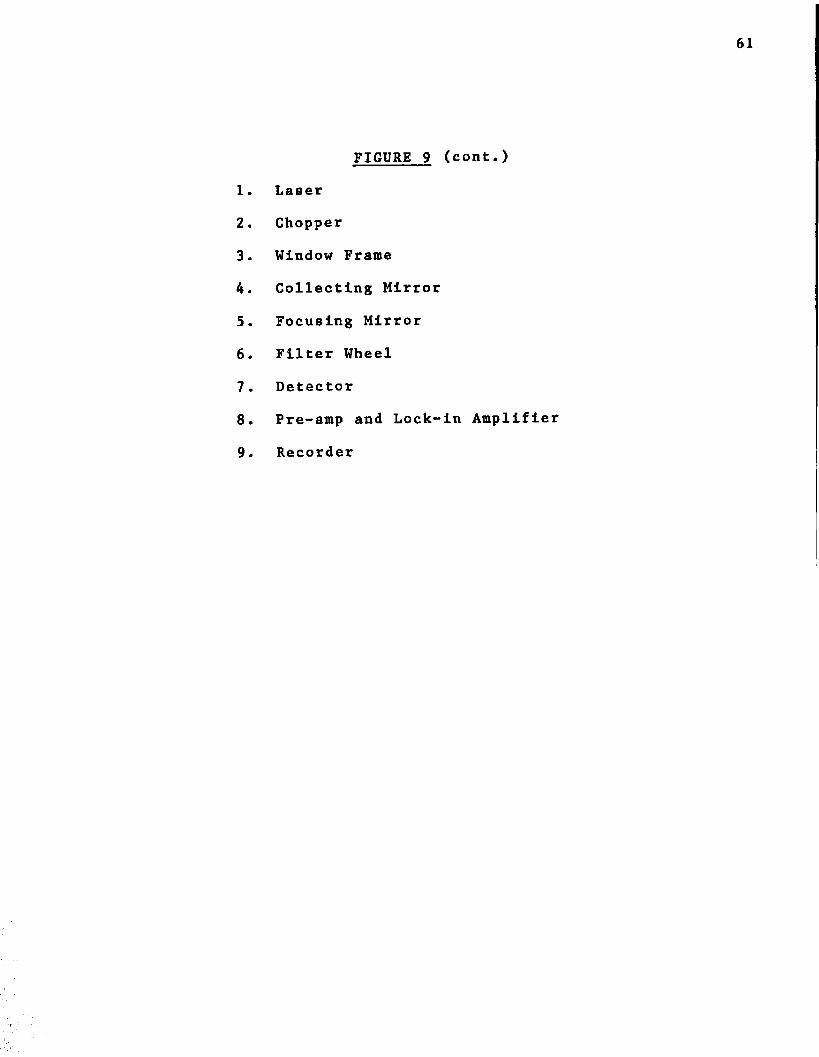
61
FIGURE 9 (cont.)
1 . Laser
2 . Chopper
3, Window Frame
4 . Collecting Mirror
5. Focusing Mirror
6 . Filter Wheel
7. Detector
8 . Pre-amp and Lock-in Amplifier
9. Recorder
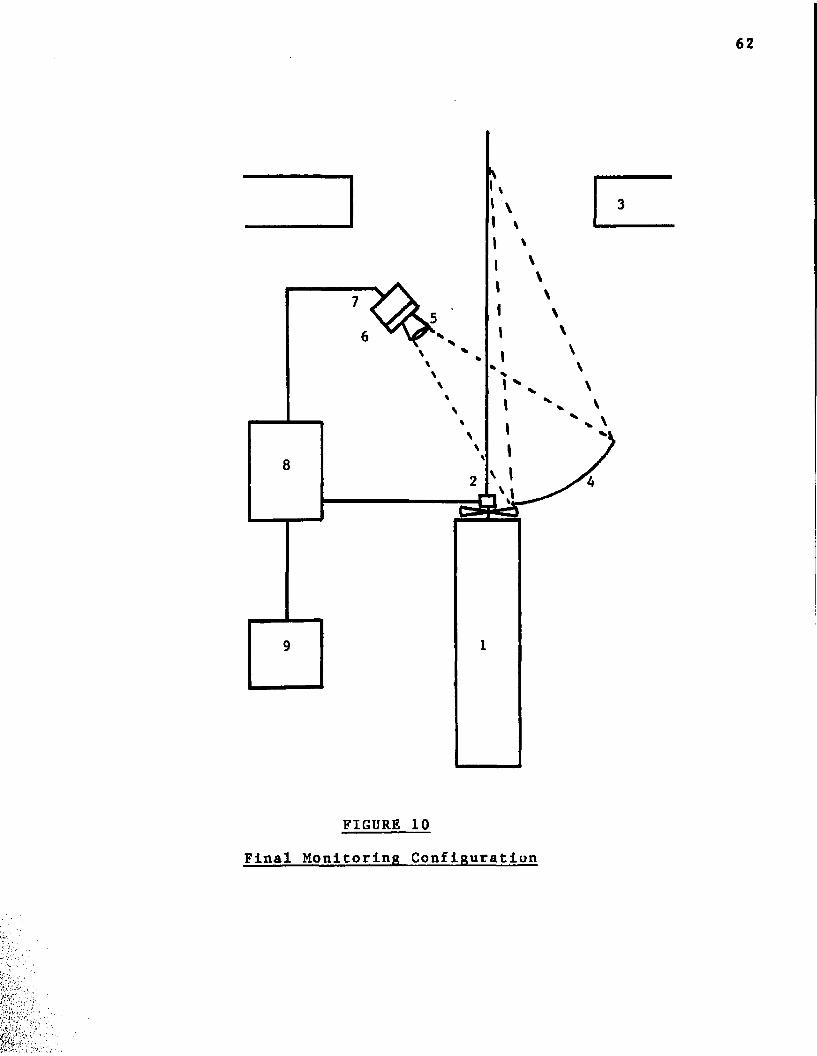
FIGURE 10
Final Monitoring Configuration
63
FIGURE 10 (cont.)
1. Laser
2. Chopper
3. Window Frame4. Collecting Mirror
5. Truncation Cone
6 . Filter Wheel
7. Detector8 . Pre-amp and Lock-in Amplifier
9. Recorder
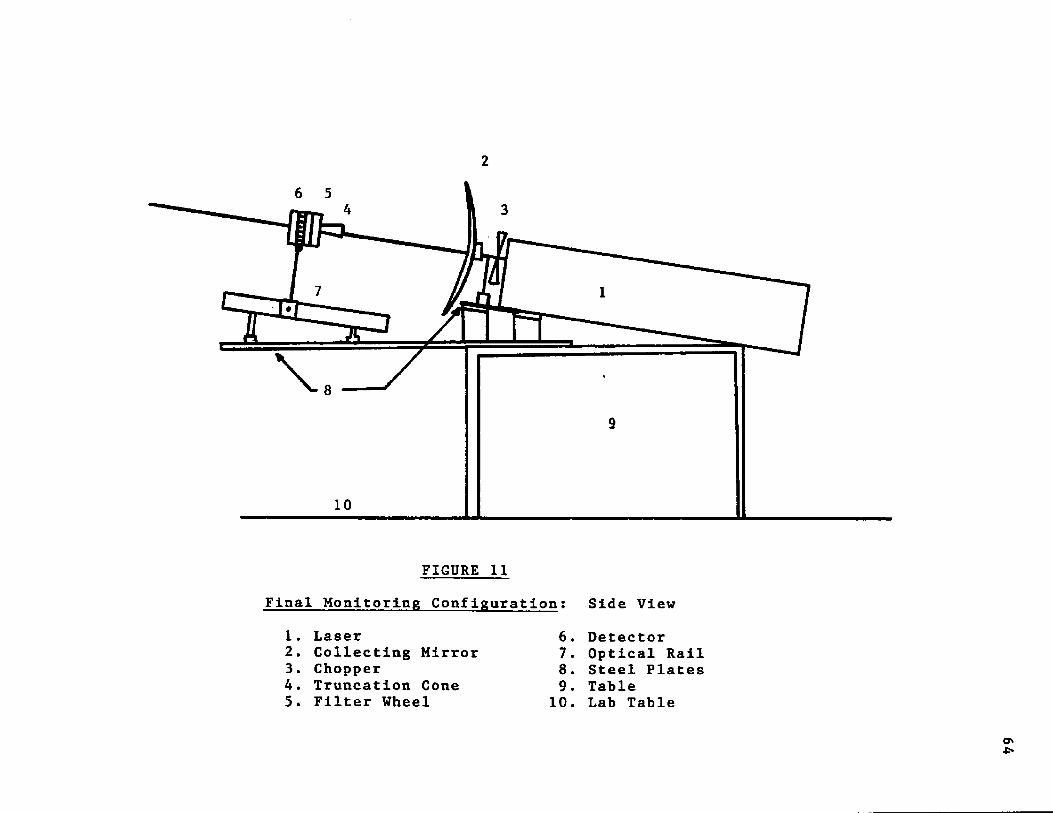
2
FIGURE 11
Final Monitoring Configuration: Side View
1. Laser 6 . Detector2. Collecting Mirror 7. Optical Rail3. Chopper 8 . Steel Plates4. Truncation Cone 9. Table5. Filter Wheel 10. Lab Table
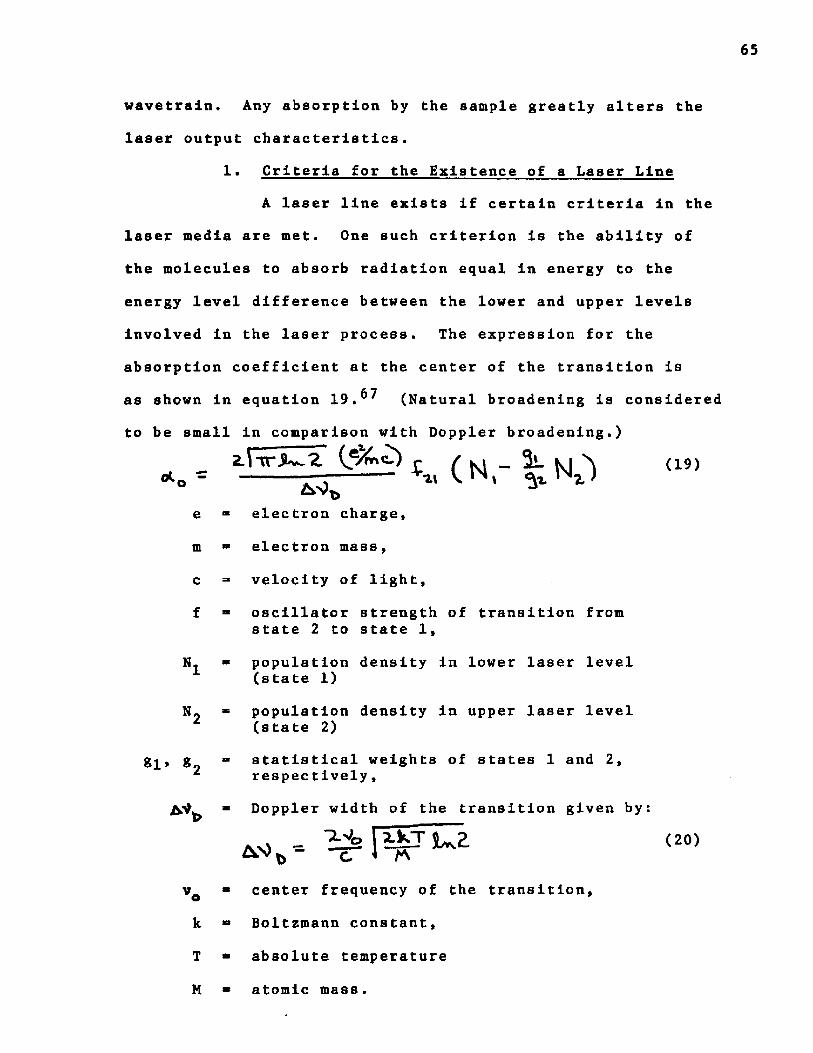
65
wavetraln. Any absorption by the sample greatly alters the
laser output characteristics.
1. Criteria for the Existence of a Laser Line
A laser line exists if certain criteria in the
laser media are met. One such criterion is the ability of
the molecules to absorb radiation equal in energy to the
energy level difference between the lower and upper levels
involved in the laser process. The expression for the
absorption coefficient at the center of the transition is
as shown in equation 1 9 . ^ (Natural broadening is considered
to be small in comparison with Doppler broadening.)
e “ electron charge*
m “ electron mass*
c = velocity of light,
f = oscillator strength of transition from state 2 to state 1 ,
N 1 » population density in lower laser level(state 1 )
N> * population density in upper laser level(state 2 )
, g " statistical weights of states 1 and 2 ,^ respectively,
" Doppler width of the transition given by:
_ ids li rsua- ~cT J *Vc b center frequency of the transition,
k “ Boltzmann constant,
T b absolute temperature
M b atomic mass.
(19)
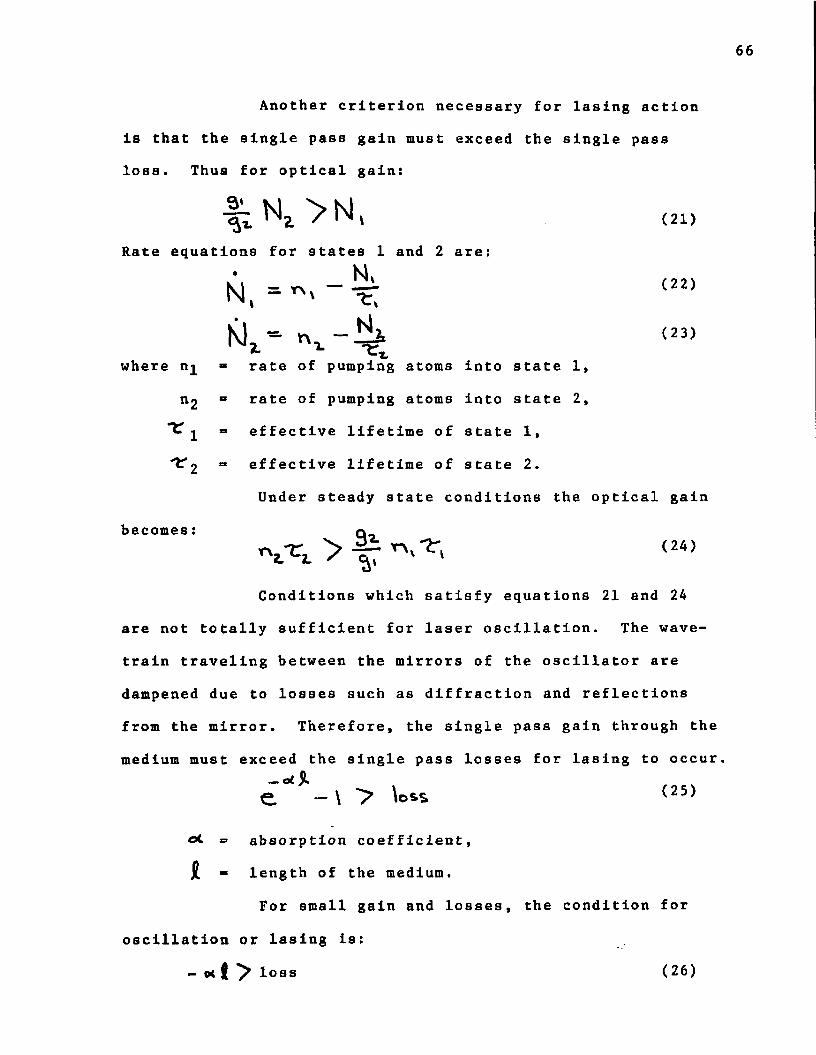
66
Another criterion necessary for lasing action
Is that the single pass gain must exceed the single pass loss. Thus for optical gain:
m ,Rate equations for states 1 and 2 are:
• _ N . (2 2)
(23)-twhere n^ » rate of pumping atoms into state 1 ,
ri2 ° rate of pumping atoms Into state 2 ,
\ = effective lifetime of state 1 ,
2 “ effective lifetime of state 2 .
Under steady state conditions the optical gain
becomes:
Conditions which satisfy equations 21 and 24
are not totally sufficient for laser oscillation. The wave-
traln traveling between the mirrors of the oscillator are
dampened due to losses such as diffraction and reflections
from the mirror. Therefore, the single pass gain through the
medium must exceed the single pass losses for lasing to occur,
e. — \ > \oss <25)
©C = absorption coefficient,
£ - length of the medium.
For small gain and losses, the condition for
oscillation or lasing is:
- ©t 4 ^ loss (26)
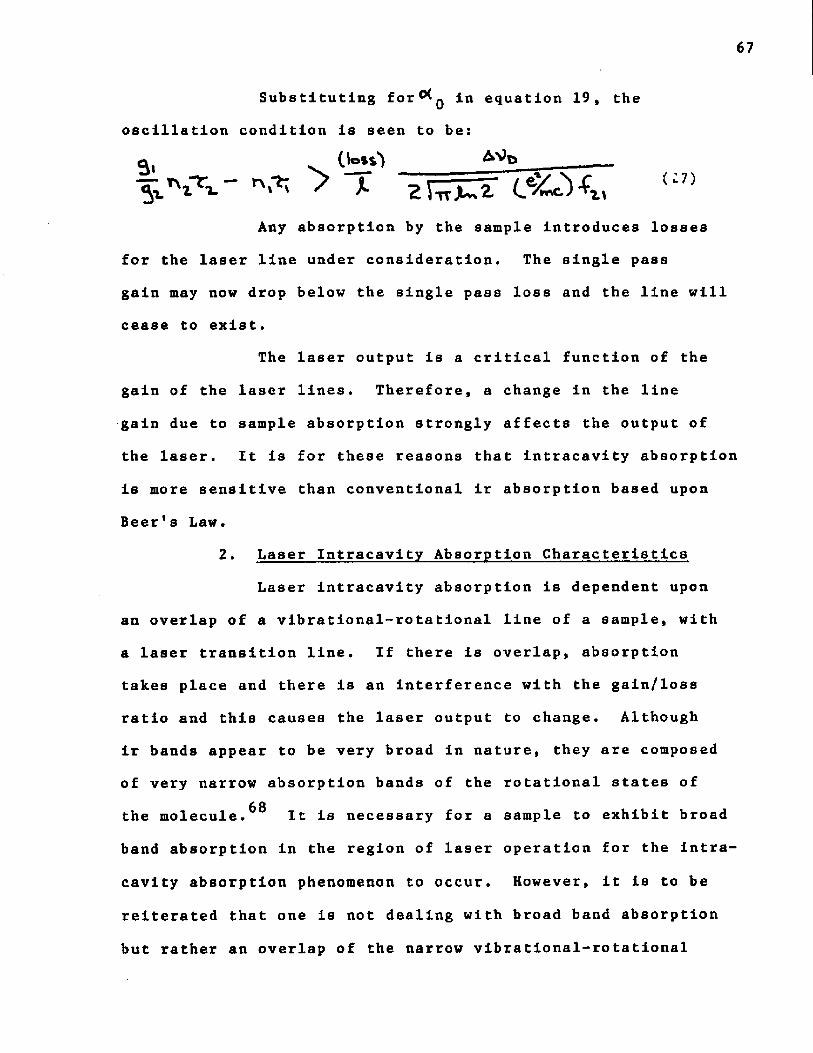
67
Substituting f o r 0^ in equation 19, the
oscillation condition is seen to be:
Q, . _______ _____^ c e* c X , U 7 )
Any absorption by the sample introduces losses
for the laser line under consideration. The single pass
gain may now drop below the single pass loss and the line will
cease to exist.
The laser output is a critical function of the
gain of the laser lines. Therefore, a change in the line
gain due to sample absorption strongly affects the output of
the laser. It is for these reasons that intracavity absorption
is more sensitive than conventional ir absorption based upon
Beer's Law.
2. Laser Intracavity Absorption Characteristics
Laser intracavity absorption is dependent upon
an overlap of a vibrational-rotational line of a sample, with
a laser transition line. If there is overlap, absorption
takes place and there is an interference with the gain/loss
ratio and this causes the laser output to change. Although
ir bands appear to be very broad in nature, they are composed
of very narrow absorption bands of the rotational states of 6 8the molecule. It is necessary for a sample to exhibit broad
band absorption in the region of laser operation for the intra
cavity absorption phenomenon to occur. However, it is to be
reiterated that one is not dealing with broad band absorption
but rather an overlap of the narrow vibrational-rotational
68
lines, which are superimposed upon broad band absorption,
of the sample with laser transition lines. This is sup
ported by the fact that certain compounds which exhibit
broad band absorption over the entire laser transition range
do not affect all the laser lines equally. If broad band
absorption was the criterion, each laser line would be
equally affected. It has also been observed that samples
lacking broad band absorption in the region of laser opera
tion appear transparent when Introduced into the optical
cavity of the laser.
a , Selec tivity
This absorption phenomenon is somewhat
selective in that the sample introduces laser power losses
at specific wavelengths. The loss associated with each
laser line is dependent upon an overlap of a sample's
vibrational-rotational line with a particular laser line.
This has been supported by the observation that various
compounds, each having broad band absorption in the laser
region, selectively decreases different laser lines. In
addition, each sample affects the various laser lines dif
ferently as there exists a different degree of overlap of
the sample's vibrational-rotational lines with the individual
laser lines.
b . Sensitivity
Laser Intracavity absorption is a sensitive
absorption technique and in some cases has been reported to
be orders of magnitude more sensitive than simple molecular
69
absorption. The sensitivity of the technique Is brought
about by the losses Introduced Into the wavetrain of the
laser by the sample's absorption. The absorption effect of
the sample Is exaggerated since the laser output Is a critical
function of the gain/loss ratio of each laser line. If a
sample quenches a particular laser line in a homogeneously
broadened laser such as a dye laser, the energy for the line
which has been absorbed is transferred to an adjacent line.
The lasing in the second line depletes the upper population
level for both lines and prevents population inversion for
the absorbed line also. For both dye and gas lasers the
laser utilizes a rear optical element and a dumping mirror.
Due to the reflectivity of the dumping mirror, the wavetrain
can be reflected through the laser media several times.
This multipass system also enhances the sensitivity of laser
lntracavlty absorption.
c . Laser Moding
The laser can freely shift from one set
of lines to another set as the gain of the lines change.
The shift can be made to take place by introducing a sample
of sufficient concentration to completely quench a normal lasing line. This shifting of the lines, which the laser
emits, to other lines is referred to as moding. Absorption
of one laser line causes moding of the laser. The moding
from one wavelength to another is dependent upon the sample
introduced into the cavity.
3. Laser Intracavity Absorption as a PollutantMonitoring System
In order for the technique to be developed
Into a valid monitoring method for a particular substance,
interference studies must be made. The most desirable laser
line used for trace gas analysis is the one which exhibits
the greatest degree of overlap with one of the sample's
vibrational-rotational lines. The interference investiga
tions must be made in order to check the effect of other
compounds on the analysis line which has been chosen. If
another sample, indeed, exhibits overlap, the concentration
level at which it produces sufficient cavity loss for the
laser line must be determined. The analysis line is still
valid for the sample determination provided the concentra
tion level of the interferent is below the level at which it
affects the pertinent laser line intensity. If the second
sample is present in quantities at which interference is
observed, several steps can be taken in order to overcome
the problem. A second line which is sufficiently sensitive
for the compound of interest may be used provided the second compound does not interfere. If interference still exists,
gain profiles of the laser output can be taken by a scanning
procedure. The sample of interest will affect all laser
lines differently than the interfering compound due to the
differences in vibrational-rotational structures of the
compounds. Therefore, a scan of the entire laser output
should allow the analysis to be performed as there should
be regions of the profiles which will be different. However,
the sensitivity may not be as great since the sample will
not affect all the laser lines to the same degree. Therefore, regions in the gain profile of the laser will not be
equally sensitive. More data is needed in order to deter
mine whether or not the technique is sufficiently sensitive
for analysis of all compounds of interest in the presence of interfering species.
4. Parameters Affecting Laser Intracavity Absorption
Several equipment parameters are important in
laser Intracavity absorption spectroscopy. These parameters
include: (1 ) laser wavelength range, (2 ) individual laser
line width, (3) dumping mirror reflectivity, (4) sample cell
position and (5) laser stability.
a . Laser Wavelength Range
The laser wavelength range must overlap
with an absorption band of the sample. The laser must
operate in a region where the sample exhibits absorption.
A suitable laser media must first be chosen that is capable
of lasing in the region of sample absorption. In the case
of studying vinyl chloride, a CO 2 laser is a valid choice
as there exists strong sample absorption in the wavelength
region of the laser output. The laser may not normally
operate on a theoretically possible laser line which perhaps
might overlap with a sample's vibrational-rotational line.
In this case, several methods can be used to shift the laser
lines to the desired region. One method employs a dispersive6 9 — 7 7/element such as a grating or p r i s m . A b s o r b e r gases
72
can also be Introduced Into a second laser cavity at'a'
sufficient concentrations and/or pressures to produce
selective moding of the l a s e r . ^ " ^ The choice and
pressure of the gas determines the line to which the
laser modes. Various isotopes of common laser media7 g — 7 9have also been employed to obtain certain laser lines.
In addition, laser cavity length variations have been used80 81to enhance the gain of one particular laser line. ’
b , Individual Laser Line Width
The line width of the laser line is an
important parameter. Laser lines which are broadened due
to pressure and temperature effects are less discriminatory
with respect to overlap with sample vibrational-rotational
lines. The extent of laser line-sample line overlap neces
sary for the intracavity absorption phenomenon is not yet
understood. However, it is to be reasoned that a sharpening
of the laser line would lead to more selectivity for the
technique with perhaps the ultimate result being specificity.
c . Dumping Mirror ReflectivityThe reflectivity of the dumping mirror
determines the number of passes a wavetrain experiences
before emerging from the laser system. As the number of
wavetrain passes increases, the longer the effective length
of the sample cell. This is due to the multiple passes made
through the sample. The. end result should yield a greater
sample affect on the laser wavetrain, thus increasing the
sensitivity of the system.
73
d . Sample Cell Position
Sample cell position Is especially Important In a system using a low reflective dumping mirror. The
sample cell must be In the laser optical path but not In
the laser plasma. The cell can either be placed between the
plasma and the dumping mirror or between the plasma and the
rear optical element (Figs. 12a, b ) . In the former case
(Fig.12a), the sample effect due to absorption should be
lessened If the dumping mirror allows only one wavetrain
pass. Thus, part of the laser emission passes through the
cell only once. However, if the cell is placed directly in
front of the rear optical element (Fig.12b) the wavetrain
passes through the cell twice for a low reflective dumping
mirror. The multipass effect is a factor in the sensitivity
of the apparatus. If the dumping mirror has a high degree
of reflectivity, this allows the wavetrain to bounce between
the optical elements a number of times before emerging from
the laser, the sample cell position is much less of an effect.
e . Laser Stability
Laser stability tremendously affects the
detectivity of the system. In laser intracavity absorption,
the output intensity of a particular line is monitored as an
absorber is introduced into the optical path. A decrease in
intensity of the monitored line does not have to be complete
(a kill) for the analysis. A measurement of the relative
decrease in intensity is a function of the laser line stability.
If the laser line intensity is affected by mechanical or
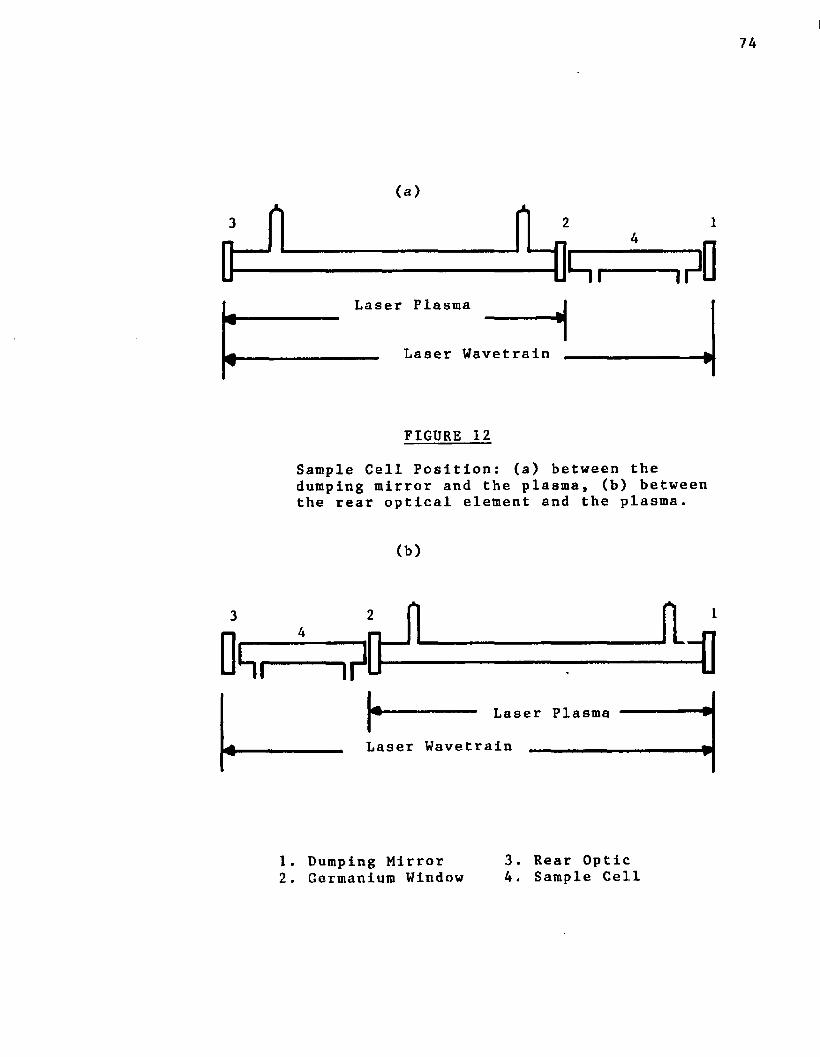
74
(a)
IP = IP -P ? 0Laser Plasma
FIGURE 12
Sample Cell Position: (a) between thedumping mirror and the plasma, (b) between the rear optical element and the plasma.
(b)
ir $ t o
Laser Plasma
Laser Wavetrain
1. Dumping Mirror 3. Rear Optic2. Germanium Window 4. Sample Cell
75
thermal vibrations, the line intensity fluctuates in normal
operation. This necessitates a substantial decrease in laser
line Intensity upon injection of an absorber in order to
distinguish between the effect of the absorber and in
stability. It is, therefore, advantageous to employ a
vibration free foundation for the laser, fixed temperature
laser operation and ultimately a frequency stabilizer system
which tracks and corrects any variation in laser power.
5. Laser Intracavity Absorption Using Dye Lasers
A variety of intracavity absorption studies
have been reported using dye lasers. Numerous atomic species
have been investigated employing the technique. The studies7 8 2include detection of 9x10 atoms of Cs. Latz, Wyles, and
Green analyzed mercury and barium by quenching of laser83 84fluorescence. Thrash, et al observed the phenomenon
for Sr and Ba+ by using a burner placed inside the optic al
path of the laser. Trace analysis of sodium has been exten-85 — 87sively reported by using an intracavity burner , and
8 3 8 8 8 Qemploying an intracavity sample cell. * *
Molecular species have been detected by the
intracavity absorption technique using dye lasers. Atkinson,
et al9® quantitatively detected NO 2 . Latz, Wyles, and Green®^
not only used the technique to detect NO 2 but also investi
gated condensed phase absorption of p-benzoqulnone in hexane.8 8 91—9 3Several investigations have been made of I2 * and
84other molecular species studied include CuH, H^O, BaO,
HoC1 3 ,9 4 Pr(NO 3 )3 , NdCl 3 and H 0 CI 3 . 9 5 In addition, transient
76
Q 0species such as free radicals have also been investigated,9 6The hydroxide ion haB been studied by the intracavity
97absorption technique. E. N. Antonov, et al have also
measured values of a number of absorption coefficients of
air using the technique.
6 . Laser Intracavity Absorption Using Gas Lasers
Several studies have been reported using intra
cavity absorption with gas lasers. Traces of insecticides9 8have been detected using a tunable CO 2 laser. In this
study a grating was used in order to tune the laser output.
In addition, the sample cell was placed in the optical cavity
of the laser but was located between the dumping mirror and
the laser plasma. Personnel in our laboratories felt that an
increase in sensitivity for intracavity absorption experi
ments could be achieved by placing the sample cell between
the laser plasma and the rear optical element. With this
arrangement, work in this laboratory has been reported for99several gases using both a nontunable and a tunable CO 2
l a s e r . C h a c k e r i a n , Jr. and Seisback detected NO using a
CO l a s e r . G a r s i d e , et al more recently measured resonance
absorption of NO with a line-tunable CO l a s e r D j e u ^ ® ^
employed the intracavity laser technique with a CO laser for
measurements of the absolute densities of individual vibrational levels of CO produced from a reaction between 0 and Cs.
Work presented in this dissertation describes
the apparatus used in order to study various samples with a
nontunable CO 2 laser (Fig.13) as well as a tunable CO 2 laser
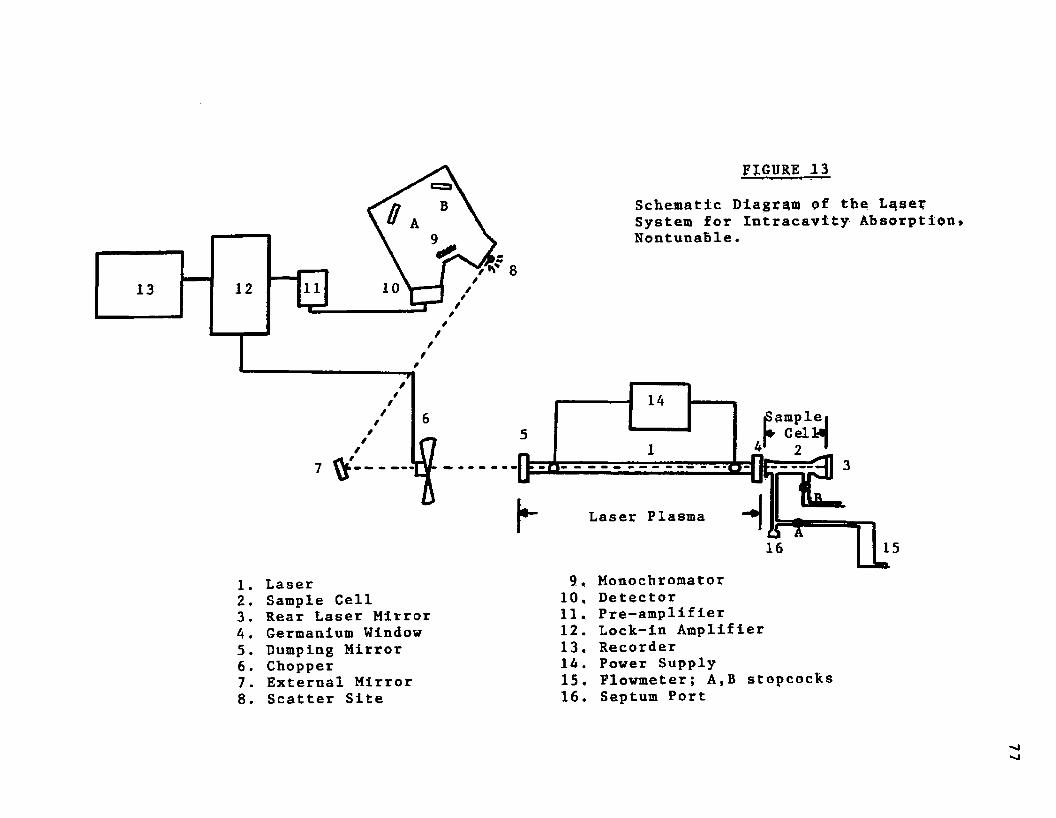
1013
1. Laser2. Sample Cell3. Rear Laser Mirror A. Germanium Window5. Dumping Mirror6 . Chopper7. External Mirror8 . Scatter Site
FIGURE 13Schematic Diagram of the Laser System for Intracavity Absorption* Nontunable.
8
Laser Plasma16 15
9, Monochromator10, Detector11, Pre-amplifier12, Lock-in Amplifier13, Recorder1A. Power Supply15. Flowmeter; A,B stopcocks16. Septum Port
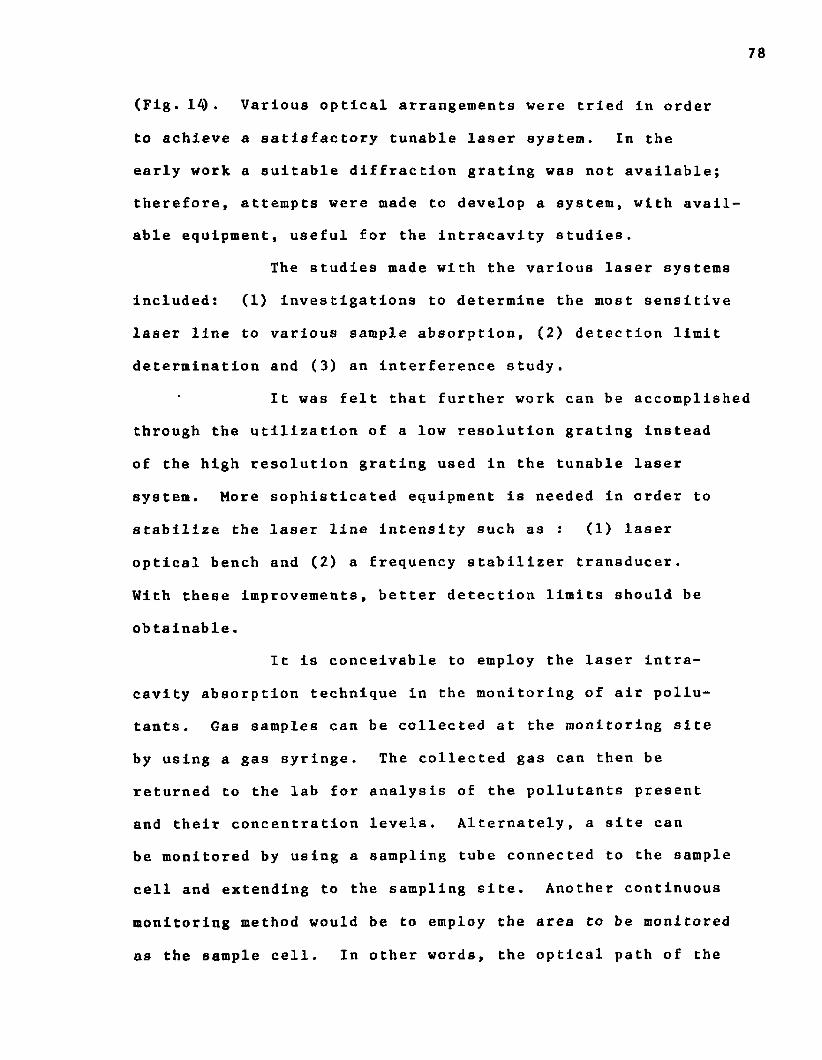
(Fig. 14)* Various optical arrangements were tried in order
to achieve a satisfactory tunable laser system. In the
early work a suitable diffraction grating was not available;
therefore, attempts were made to develop a system, with avail
able equipment, useful for the intracavity studies.
The studies made with the various laser systems
Included: (1 ) investigations to determine the most sensitive
laser line to various sample absorption, (2 ) detection limit
determination and (3) an interference study.
It was felt that further work can be accomplish
through the utilization of a low resolution grating instead
of the high resolution grating used in the tunable laser
system. More sophisticated equipment is needed in order to
stabilize the laser line intensity such as : (1 ) laser
optical bench and (2 ) a frequency stabilizer transducer.
With these improvements, better detection limits should be
obtainable.It is conceivable to employ the laser intra
cavity absorption technique in the monitoring of air pollu
tants. Gas samples can be collected at the monitoring site
by using a gas syringe. The collected gas can then be
returned to the lab for analysis of the pollutants present
and their concentration levels. Alternately, a site can
be monitored by using a sampling tube connected to the sample
cell and extending to the sampling site. Another continuous
monitoring method would be to employ the area to be monitored
as the sample cell. In other words, the optical path of the
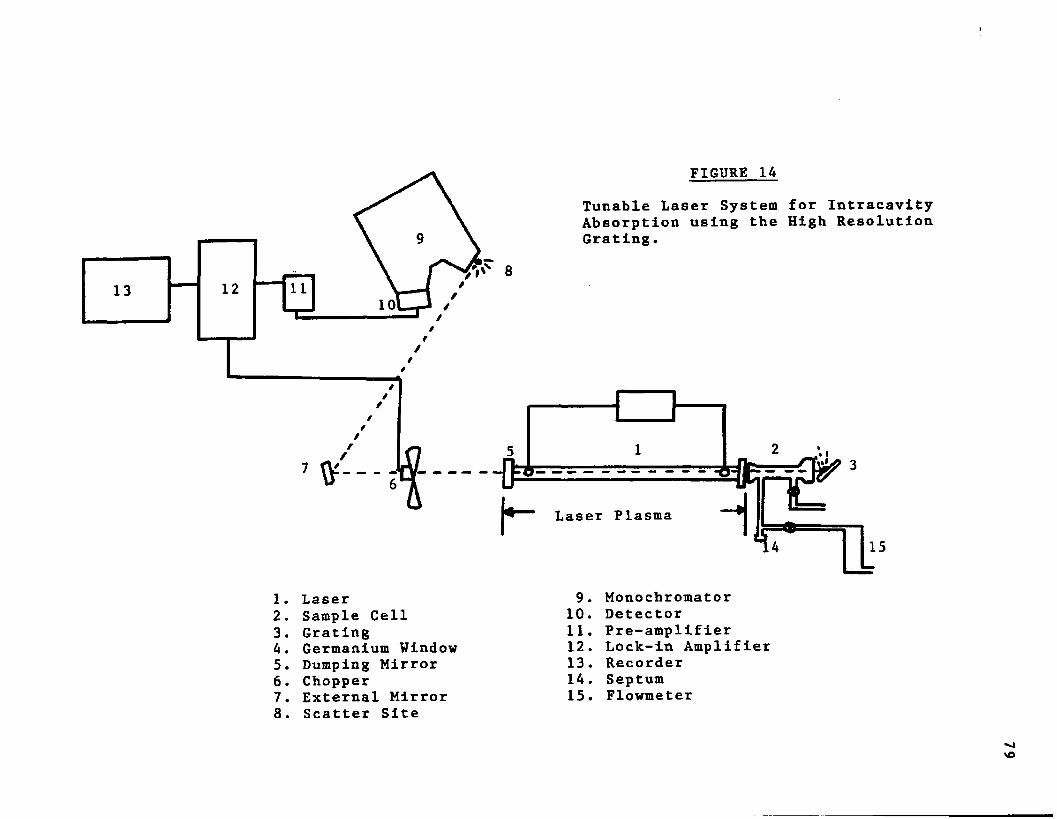
1. Laser2. Sample Cell3. Grating4. Germanium Window5. Dumping Mirror6 . Chopper7. External Mirror8 . Scatter Site
FIGURE 14Tunable Laser System for Intracavity Absorption using the High Resolution Grating.
}
9. Monochromator10. Detector11. Pre-amplifier12. Lock-in Amplifier13. Recorder14. Septum15. Flowmeter
80
laser would extend across the monitored area. The laser
plasma would be at one point and the rear optical element
at a point on the other end of the monitored path.In conclusion, laser intracavity absorption
is sensitive, selective and rapid. However, a main dis
advantage exists in the fact that one lasing media is not capable of monitoring all common pollutants. For instance,
a CC>2 laser cannot be used in the monitoring of NO; instead
a CO laser must be used.
EXPERIMENTAL
A. Remote Sensing1. Equipment
a . Lasers
1. Perkin Elmer Model 6200 quasi-continu-
ous CO 2 gas laser. Output power of 7 to 9 watts/cm^.
Principle lasing line: 10.6^. Total output spectrum shown
In Fig. 15.11. Metrological Instruments Model 210
OHelium-Neon laser. Output power: 0.5 milliwatts at 6328A.
b . Chopper
Princeton Applied Research Model 125
mechanical chopper. Two chopping frequencies available:
13.3 and 26.6^2*c . Power Monitor
Coherent Radiation Model 201 power meter.
Operating range: 0.3 to 30 microns. Power dissipation:0 2 1 0 0 watts/cm^ continuous, 2 0 0 watts/cm maximum.
d . Filter System
GCA McPherson Model 607 filter wheel.
Four spectral ranges available as indicated in Table 1
The filter system was checked using an infrared spectro
photometer and the results can be seen in Fig.16.
e . Detectorsi. Barnes Engineering Co. Pyroelectric
Detector. Model 662 Triglycine Sulfate detector. Area:
4 x 10- ^cm^. Detectivity: 8.1 x 10®.
81
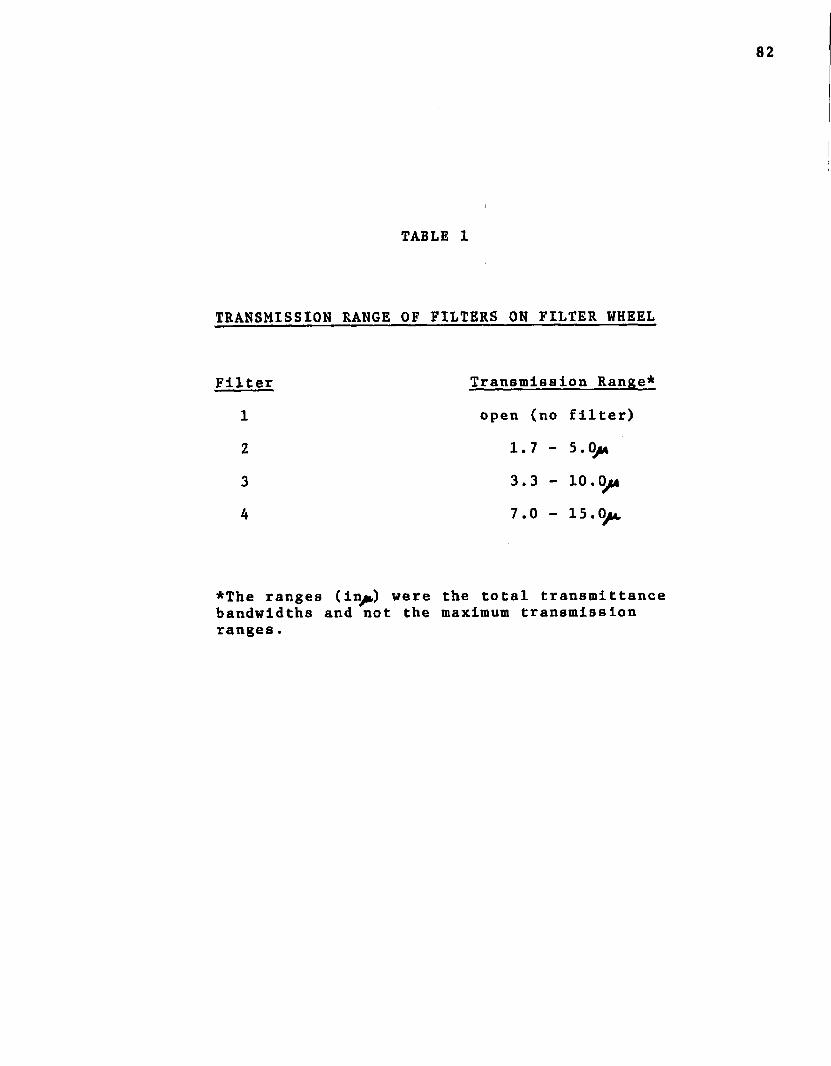
TABLE 1
TRANSMISSION RANGE OF FILTERS ON FILTER WHEEL
Filter Transmission Range*
1 open (no filter)
2 1.7 - 5. Oja
3 3 . 3 - 1 0 . 0 ^ *
A 7.0 - 15.tyu.
*The ranges (iny») were the total transmittance bandwidths and not the maximum transmission ranges.
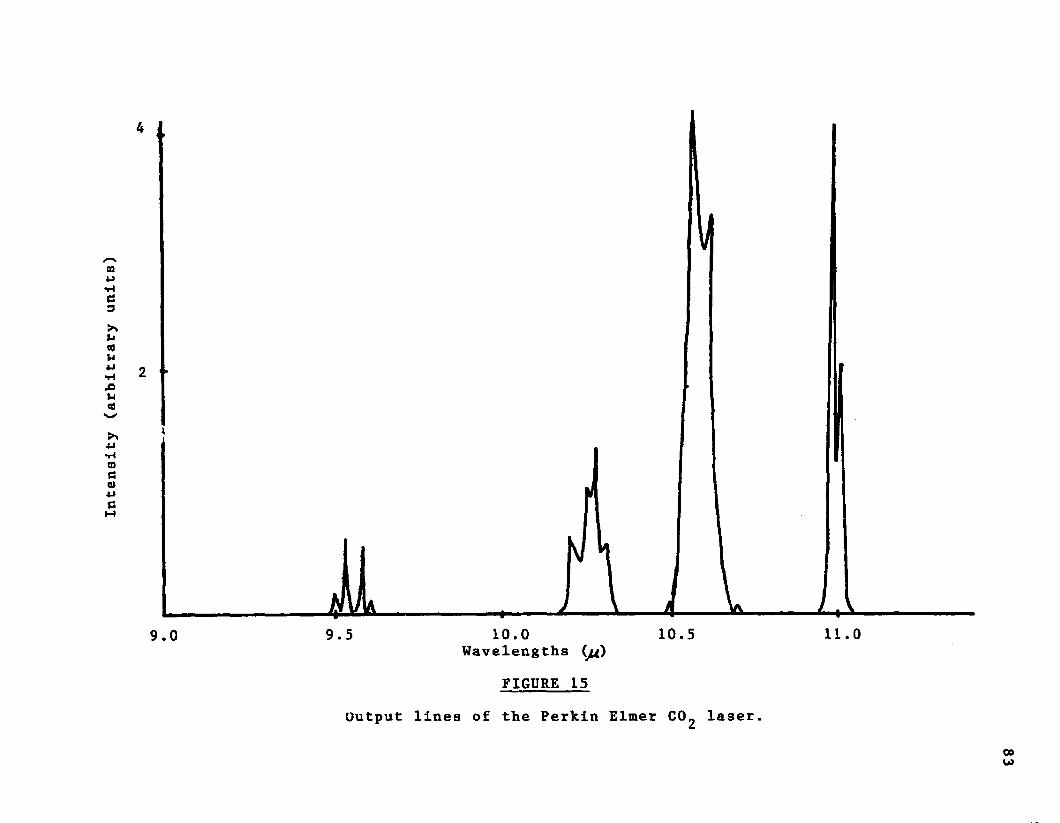
Inte
nsit
y (a
rbit
rary
un
its)
4
2
9.0 9.5 10.0 Wavelengths (^)
FIGURE 15
10.5 11.0
Output lines of the Perkin Elmer CO2 laser,
GO
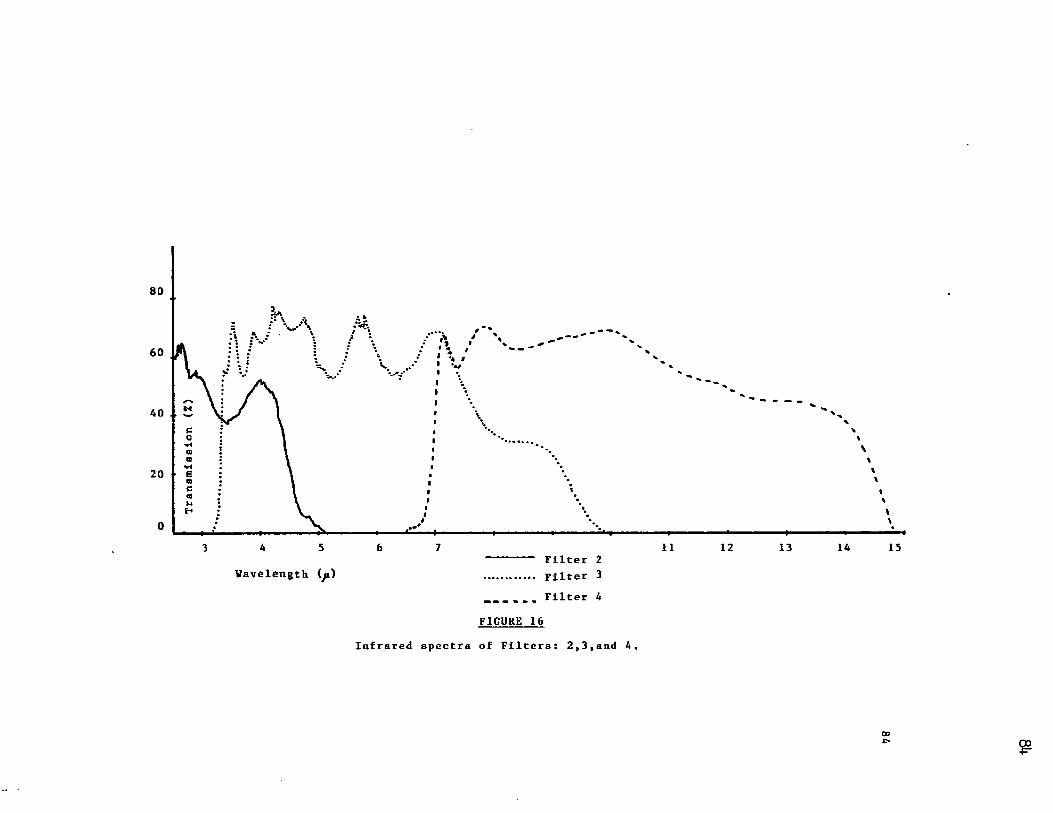
80
60
AO
20
4 5 6 7 11 12 13 14 153------- Filter 2
Wavelength (yi) Filter 3_______ Filter 4
FICURE 16
Infrared spectra of Filters: 2,3,and 4.
00
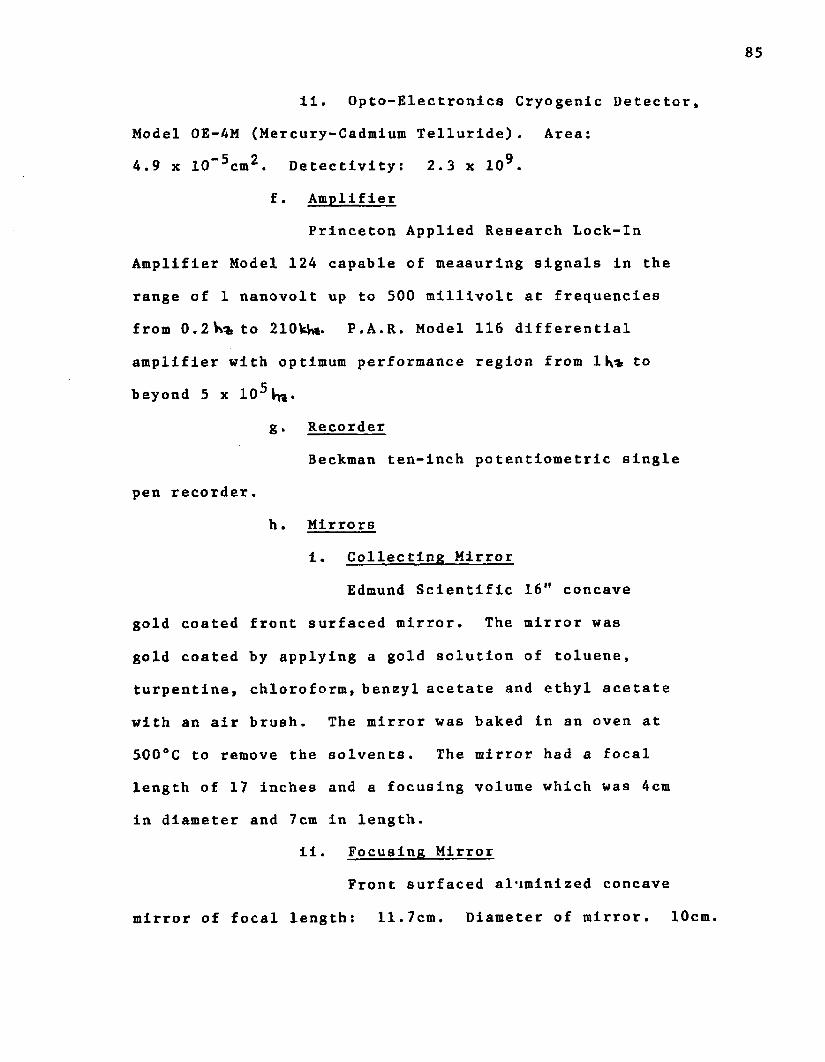
85
ii. Opto-Electronics Cryogenic Detector,
Model 0E-4M (Mercury-Cadmium Telluride). Area:
4.9 x lO’ c m^. Detectivity: 2.3 x 10®.
f . Amplifier
Princeton Applied Research Lock-In
Amplifier Model 124 capable of measuring signals in the
range of 1 nanovolt up to 500 millivolt at frequencies
from 0.2Vt%to 2l0kV*. P.A.R. Model 116 differential
amplifier with optimum performance region from 1 K% to
beyond 5 x 10^V«.g . Recorder
Beckman ten-inch potentiometrie single
pen recorder.
h . Mirrors
i . Collecting Mirror
Edmund Scientific 16” concave
gold coated front surfaced mirror. The mirror was
gold coated by applying a gold solution of toluene,
turpentine, chloroform,benzyl acetate and ethyl acetate
with an air brush. The mirror was baked in an oven at
500°C to remove the solvents. The mirror had a focal
length of 17 inches and a focusing volume which was 4cm
in diameter and 7cm in length.
11• Focusing MirrorFront surfaced al'iminized concave
mirror of focal length: 11.7cm. Diameter of mirror. 10cm.
86
iii. Flat MirrorFront surfaced mirror used in alignment
and to reflect the CC^ laser beam out of the laboratory
window In the early stages of the experiment.
1 . Lamp
Flood lamp used as a source of infrared
emission.j . Gas Cell
The cell was primarily a glass cell with
three windows and a mirror. All three windows were Irtran 2
material. The two windows opposite each other allowed the
laser beam to pass through the cell (Fig. 17 ). The third
window was mounted opposite the concave front surfaced mirror
which was located in the cell bottom.
k . Infrared Spectrophotometer
A Perkin Elmer Model 137 Infrared Sodium
Chloride Spectrophotometer was used to measure the spectral
regions of the filter wheel as well as various optical components
used in the laser.
2. System AlignmentSeveral basic equipment configurations were
used in the remote sensing studies reported in this disserta
tion. For each configuration alignment procedures were used
and described in the following text.
a . Initial Remote Sensing Configuration
The first attempt at remote sensing utilized
an equipment configuration as seen in Fig. 8 , The Perkin Elmer,
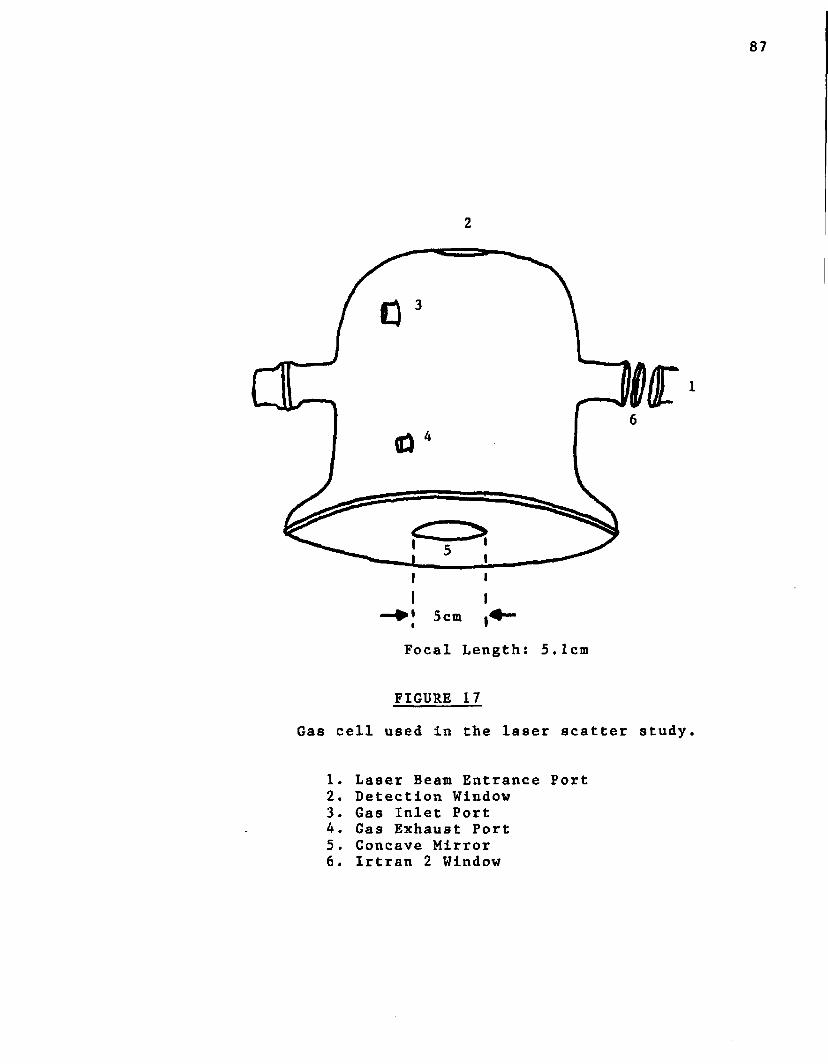
87
Focal Length: 5.1cm
FIGURE 17
Gas cell used in the laser scatter study.
1. Laser Beam Entrance Port2. Detection Window3. Gas Inlet Port4. Gas Exhaust Port5. Concave Mirror6 . Irtran 2 Window
88
(PE), laser was situated In a horizontal position on a
laboratory table below the window opening. The laser beam
from the PE laser was directed through the opened lab window
with the use of a flat, front surfaced mirror placed in the
beam path. The mirror angle was adjusted so as to reflect
the beam through the window and atmosphere at an angle suf
ficient for the beam to clear all buildings and trees in the
near vicinity. Objects could not be in the laser beam path,
otherwise unwanted reflections of the beam would be observed
by the detector. Location of the invisible CO 2 beam was
established by using a copper pipe (approx, 8 feet in length)
to which was attached a piece of heat sensitive paper. The
paper charred and burned upon contact with the laser beam.
The path of the laser beam was kept well above eye level
over the monitoring site as any eye contact would have been
hazardous, resulting in possible eye damage.
The collecting mirror was placed on the
side of the front of the laser and coarsely adjusted vertically
so as to view a portion of the laser path. The small focusing
mirror was then placed in the focusing volume of the collect
ing mirror. The filter/detector assembly faced the focusinj
mirror and consequently was made to fare the opened window.
Fine adjustment of the system was attempted by placing a
small piece of asbestos in the laser path a short distance
beyond the window. The asbestos was supported by the copper
rod used to locate the laser beam. The laser beam heated
the asbestos causing it to glow; thereby, emitting radiation
in the infrared region which would be the alignment source.
89
Signals were observed with this apparatus
configuration on all filters. However, the signals were
lostdue to an adjustment made to the beam reflecting mirror.
Many attempts were made in order to regain the signal detec
tion. The height and horizontal position of the focusing
mirror was systematically adjusted as well as the collecting
mirror. At each height and horizontal position of the focus
ing mirror, the mirror's focal volume was swept across the
face of the detector in an attempt to regain proper align
ment and therefore signal detection. Signals were detected
but found to be invalid as the laser beam was discovered to
be striking the upper position of the lab window site.
Valid signals were never obtained as the systematic align
ment approach was never completed.
The initial remote sensing attempt using
this system was evaluated. Any mirror surface used in the
transport of the laser beam caused a loss in laser power.
Losses of laser power resulted in a decrease in the amount
of induced fluorescence. Therefore, modification of the
system was needed.b . First Modification of the Remote Sensing
Configuration
Modification of the firs t apparatus con
figuration consisted of eliminating the flat mirror used to
reflect the laser beam through the lab window (Fig. 9).
The laser was mounted on a small desk placed upon a labora
tory bench. The laser was tilted in order for the beam to
pass a few feet above a neighboring building approximately
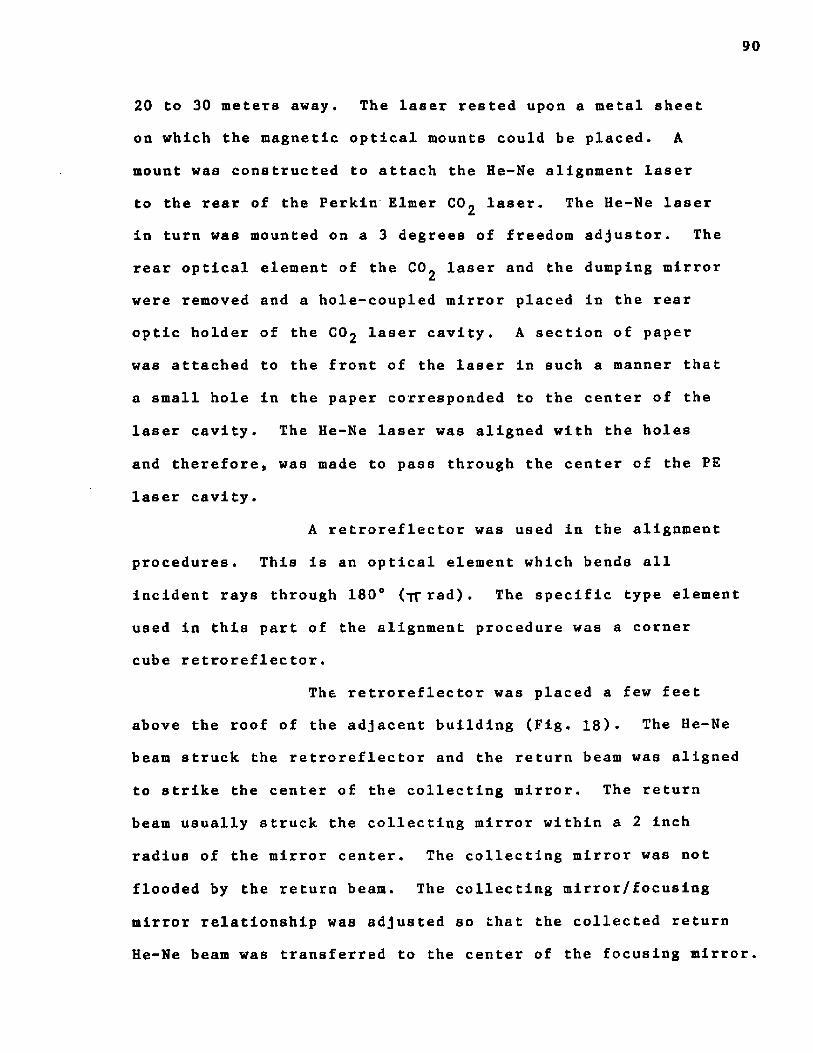
90
20 to 30 meters away. The laser rested upon a metal sheet
on which the magnetic optical mounts could be placed. A
mount was constructed to attach the He-Ne alignment laser
to the rear of the Perkin Elmer CO 2 laser. The He-Ne laser In turn was mounted on a 3 degrees of freedom adjustor. The
rear optical element of the C0 2 laser and the dumping mirror
were removed and a hole-coupled mirror placed in the rear
optic holder of the CO 2 laser cavity. A section of paper
was attached to the front of the laser In such a manner that
a small hole In the paper corresponded to the center of the
laser cavity. The He-Ne laser was aligned with the holes
and therefore, was made to pass through the center of the PE
laser cavity.
A retroreflector was used In the alignment
procedures. This Is an optical element which bends all
Incident rays through 180° (-n-rad). The specific type element
used in this part of the alignment procedure was a corner
cube retroreflector.
The retroreflector was placed a few feet
above the roof of the adjacent building (Fig. 18). The He-Ne
beam struck the retroreflector and the return beam was aligned
to strike the center of the collecting mirror. The return
beam usually struck the collecting mirror within a 2 inch
radius of the mirror center. The collecting mirror was not
flooded by the return beam. The collecting mirror/focusing
mirror relationship was adjusted so that the collected return
He-Ne beam was transferred to the center of the focusing mirror.
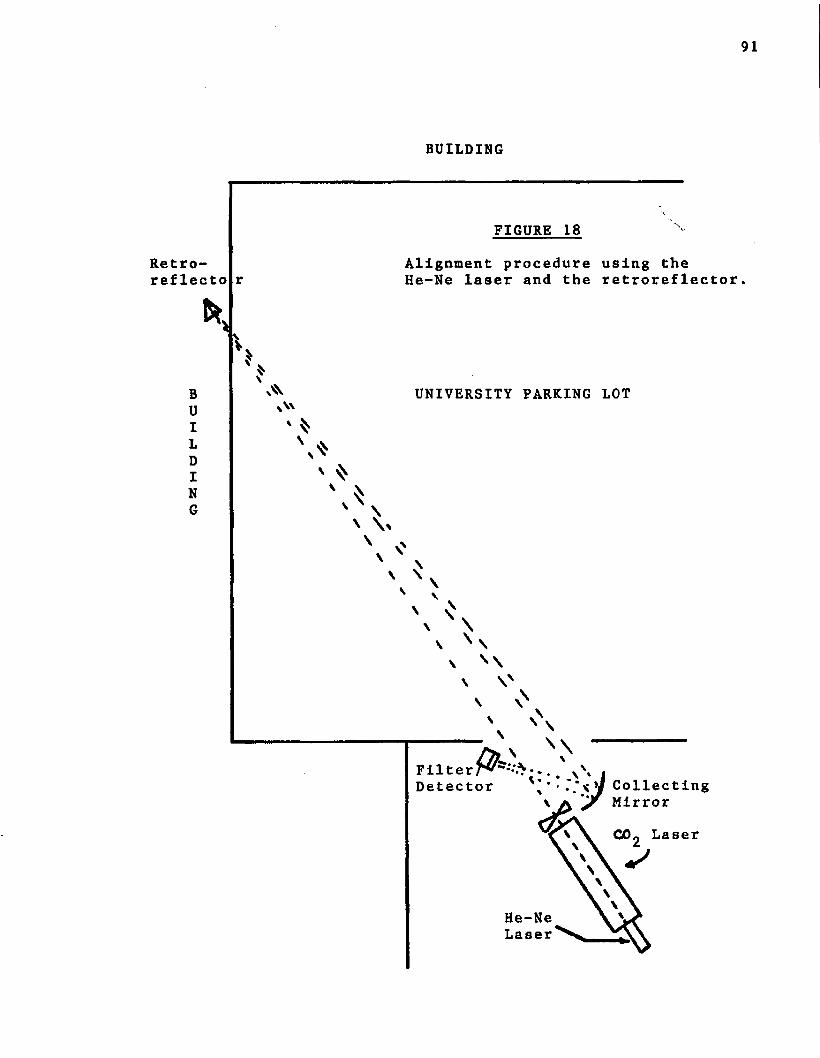
os
iM
Of
Hd
w
91
BUILDING
FIGURE 18
Alignment procedure using the He-Ne laser and the retroreflector
Retroref lecto
UNIVERSITY PARKING LOT
Filter Detector X y Collecting
y Mirror
CO- Laser
He-NeLaser
92
The detector/fliter system was then positioned at the focal point of the focusing mirror. The filter wheel was set to
the open slot so the detector could be positioned such that the He-Ne beam struck the detector element.
A further refinement in the alignment
procedure consisted of replacing the retroreflector with a
flat front surfaced mirror. The objective of the exercise
was to use the mirror as a scatter site for the CO 2 laser
beam placed a great distance from the collection system. The
laser scatter would diverge enough so that the return scatter
would flood the collection mirror. The collector/detector
system could then be optimized by observing the signal inten
sity with the detector. With the mirror in the laser beam
path, one would expect to observe a signal with filter #4,
as was the case. This signal was primarily due to reflection
of the 10.6^tlaser line. However, a signal was observed with
filter #3 (3.3 - 1 0 . ^ 1) which disappeared upon covering the
mirror in the laser beam path. This raised a question con
cerning the scatter signal.The PE laser could operate on lines in the
9.5^< envelope although this was not frequently observed.
From Fig. 16 it Is seen that filter #3 cuts off at 10^a and
is 20% transmitting in the 9 . 5 ^ region. Therefore, a check
of the laser scatter versus filter transmittance was neces
sary in order to validate filter if3 as an appropriate material
for laser scatter elimination.
93
c . Laser Scatter Studies for Output Characterizationi . Scatter from Asbestos
A piece of asbestos was placed
1.33 meters from the front of the PE laser housing. It
was to function as a source of emission. Signals were
obtained using filter #4 (7.0 - 15.0/i), filter #3 (3.3 -
lO.O/i) and filter #2 (1.7 - 5.(^u). The signal seen using
filter #4 was much larger than those observed with filters
#3 and #2. It was felt that organic materials on the asbestos
became excited by the laser radiation and fluoresced. This
induced fluorescence produced the signals seen when using
filter #2 and perhaps those seen with filter #3. The
asbestos did not resolve the scatter question and other
methods were employed.
i i . Scatter from Glass
A disposable pipette cleaned in
chromic acid and rinsed with distilled water was placed in
the laser beam path. The purpose of the pipette was to be
a scatter site for the laser beam. Strong signals were
seen when using filter #4. Periodic signals were observed
when using filter #3 and no signals were seen with filter
#2. The signals seen with filter #3 (3.3 - 10.Qw) could
have been due to laser scatter if the laser operated on
the 9.5/u envelope. However, this was not established and
a different scatter site was proposed.
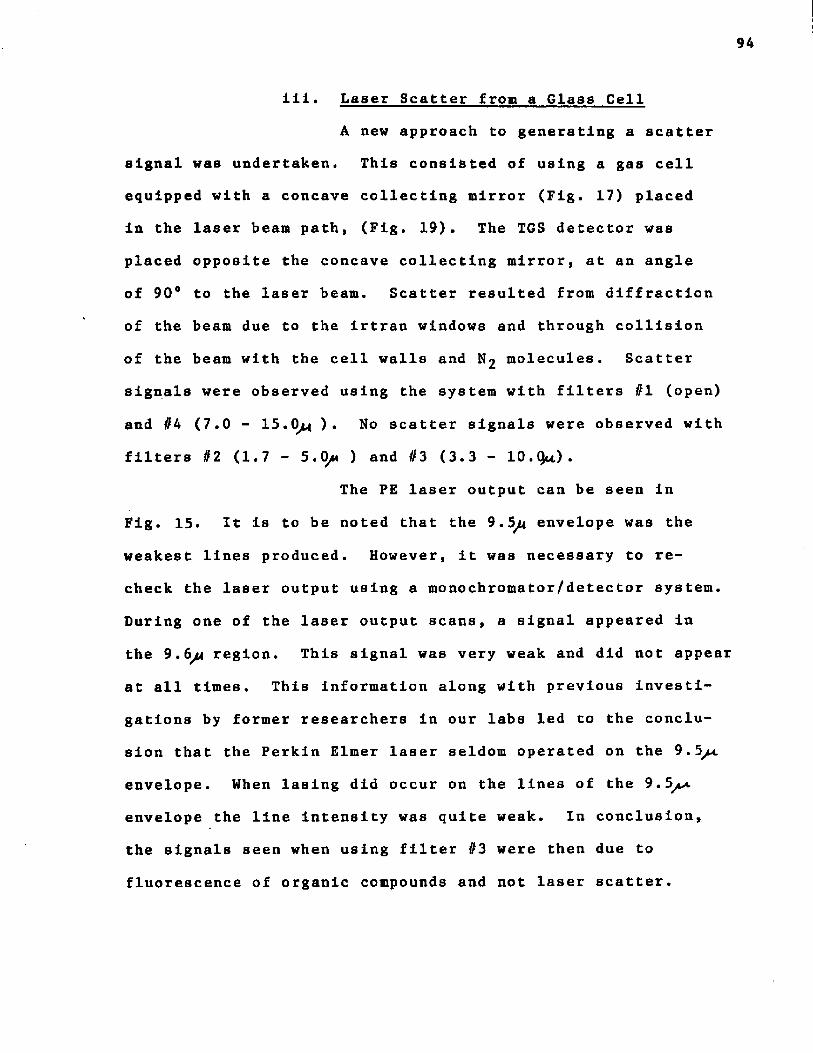
94
iii. Laser Scatter from a Glass Cell
A new approach to generating a scatter
signal was undertaken. This consisted of using a gas cell
equipped with a concave collecting mirror (Fig. 17) placed
in the laser beam path, (Fig. 19). The T6S detector was
placed opposite the concave collecting mirror, at an angle
of 90° to the laser beam. Scatter resulted from diffraction
of the beam due to the irtran windows and through collision
of the beam with the cell walls and N 2 molecules. Scatter
signals were observed using the system with filters #1 (open)
and #4 (7.0 - 15.0^ ). No scatter signals were observed with
filters #2 (1.7 - 5.0^ ) and #3 (3.3 - 10.Qu).
The PE laser output can be seen in
Fig. 15. It is to be noted that the 9.5/* envelope was the
weakest lines produced. However, it was necessary to re
check the laser output using a monochromator/detector system.
During one of the laser output scans, a signal appeared in
the 9.6/a region. This signal was very weak and did not appear
at all times. This information along with previous investi
gations by former researchers in our labs led to the conclu
sion that the Perkin Elmer laser seldom operated on the 9 . 5 ^
envelope. When lasing did occur on the lines of the 9.5^*.
envelope the line intensity was quite weak. In conclusion,
the signals seen when using filter #3 were then due to
fluorescence of organic compounds and not laser scatter.
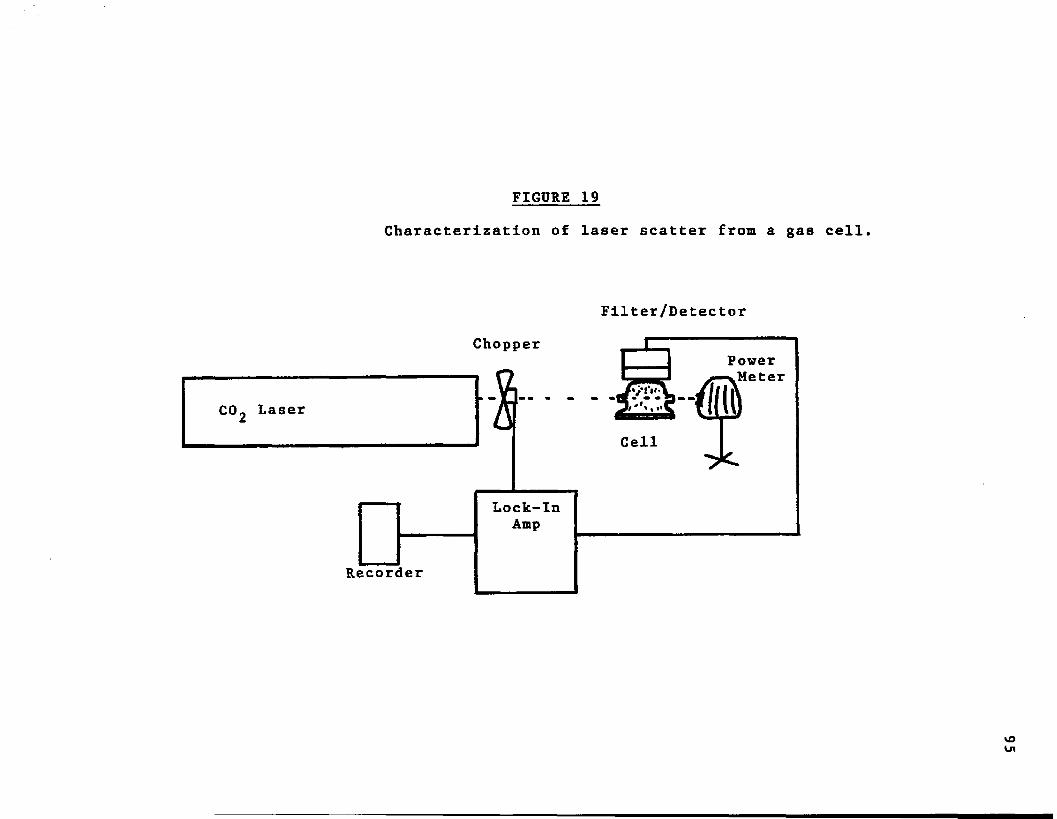
FIGURE 19Characterization of laser scatter from a gas cell.
Filter/Detector
ChopperPowerMeter
((
Lock-In
Recorder
96
d . Further System Modification
The equipment arrangement was still not optimized. The fluorescence Intensity was degraded due to
the use of several mirrors In the collection system. In
addition, the detector faced the radiation generated
externally to the lab window. These factors described
the S/N ratio and therefore reduced the sensitivity of
the system.
Further refinement to the system was
accomplished by placing the filter/detector assembly in the
focusing volume of the 16" diameter collecting mirror. The
small focusing mirror was therefore eliminated. The removal
of the focusing mirror not only eliminated a surface from
which radiation can be scattered, but removed one variable
in the alignment procedure. Thus, the alignment procedure
was made simpler. In addition, the filter/detector assembly
now faced the large collecting mirror and no longer faced
the lab window.Alignment of the system again consisted
of removing the PE laser cavity optics in order for the He-Ne
beam to pass through the PE laser cavity. (The T-^-Ne laser
was mounted on the rear of the PE laser.) The He-Ne beam
propagated through the opened lab window and was reflected
from a flat mirror placed above the roof of an adjacent
building. The return beam was centered on the collecting
mirror and then focused onto the detector. The return beam
did not flood the collecting mirror. Several different
97
lenses were placed In the return beam path In an attempt to
cause the return beam to diverge. It was hoped that the
beam could be diverged to the extent that the He-Ne beam
flooded the collecting mirror. However, none of the lenses
tried satisfactorily accomplished the task.
For proper optical alignment it ves neces
sary that the CO 2 laser beam, center of the collecting mirror
and the detector lie in the same plane. In order for this
to be accomplished a flat mirror was placed approximately
1.7 meters from the FE laser along the laser beam path. The
angle of the mirror was adjusted to be such that the He-Ne
beam returned upon Itself. The height of the laser beam
was measured at a certain distance from the flat mirror.
The mirror was then swung horizontally to reflect the
He-Ne beam onto the collecting mirror. In order to assure
that the correct mirror angle was maintained, the beam height
at the chosen distance from the mirror was measured. The
angle of the mirror was readjusted until the slope was the
same as before if necessary. The collecting mirror was
adjusted such that the beam struck the mirror center. The
collecting mirror was swung horizontally while projecting
the He-Ne beam at the same slope as the beam existing between
the laser cavity and the flat mirror. An optical rail was
positioned in such a manner that the detector could be moved
towards and away from the collecting mirror. This meant
that the slope of the optical rail must be the same as that
of the He-Ne beam. The system components now were all placed
98
in the same plane. Final adjustments were to be made during
fluorescence signal observation.
A truncation cone was made of aluminum foiland placed over the filter/detector entrance port. The cone
restricted the detector field of vision to the radiation col
lected by the collecting mirror. Background radiation emitted
from objects In the lab were eliminated by attaching the cone
(Fig. 10).
e. Final System Modification
The alignment procedure was still not
acceptable for several reasons. One problem involved the
small He-Ne spot diameter used in the alignment. The beam
was not sufficiently large to cover or flood the collecting
mirror. Therefore, the alignment could very easily have
been in great error due to improper positioning of the small
spot on the concave collecting mirror. In addition, a source
of infrared emission would be a more suitable alignment tool.
The source would need to be placed very near to the laser and
the optics of the collection system optimized so as to view
that portion of the laser beam very close to the laser. This
was due to the inverse relationship of the fluorescence
intensity to the square of the distance (l/d^). In earlier
alignment procedures, a mirror scattering the laser beam
had been used for alignment but the mirror was placed on
the roof of an adjacent building. This optimized the
optical alignment to a point far removed from the excitation
source, the laser, and therefore, the fluorescenct signal
intensity was quite small.
99
In order to refine the alignment, a flood
lamp was chosen to simulate an Isotropic fluorescence source.
The lamp was placed approximately 1.6 meters from the center
of the collecting mirror. This distance was felt to be
acceptable for observing strong fluorescence signals yet
far enough removed from the laser source in order to be a
remote sensing experiment. The flood lamp was aligned in
the CO^ laser beam path by using the He-Ne laser beam
passing through the CO^ laser cavity. The lamp was then
positioned such that the He-Ne beam struck the center of
the lamp face. The lamp was quite intense and the radiation
flux could have damaged the detector. Therefore, a box with
a pinhole was placed over the lamp face to attenuate the
radiation. The collecting mirror was adjusted to be parallel
with the front of the laser. Thus its field of vision was
in the same plane as the laser beam. The collected lamp
radiation was then focused onto the fliter/detector system.
The truncation cone was used to restrict the detector's
field of vision and filter #2 (1.7 - 5.0/0 was used to
attenuate further the lamp radiation. The chopper was placed
in front of the truncation cone and the filter/detector was
positioned by observing the signal Intensity from the lamp.
The chopper was repositioned, after the alignment, to chop
the laser beam and the experiments were performed. Signals
were observed for both filter //3 (3.3 - 10.0/0 and filter
#4 (7.0 - 15.0*0 .
100
A comparison study was made between two
detectors using the equipment arrangement. The triglycine
sulfate detector was used for most of the signal observation.
However, it was removed and a cryogenic detector was placed
on the detector stand. The position of the cryogenic detector
was not adjusted or optimized as this would have interfered
with the comparison of the two detectors. It is to be noted
that the exact distance between the collecting mirrors and
the detector elements may not have been the same. The dis
tances from the collecting mirror to the detector housings
were the same; however, the distances from the detector
housing faces to the detector elements were slightly different.
This equipment arrangement and optical align
ment was used in the phase shifting studies as well as the
diurnal studies (Figure 10).The final system used exhibited several
advantages over earlier work and therefore it is felt that a
contribution has been made. The advantages include: (1) the
system viewed the first portion of the laser beam path in
which the fluorescence signals were strongest due to the
1 /d^ relationship and beam divergence was lower, (2) the
number of mirror surfaces were decreased thus yielding
less radiation loss from such surfaces and a simpler, easier-
to-allgn system, and (3) phase shifting was incorporated in
order to eliminate laser scatter. The system did suffer a
disadvantage over the Cassegrainian system as the collecting
system did not view the entire laser beam path but rather the
101
section where the solid angle of the mirror overlapped the
laser beam. However, the advantages are felt to have out
weighed the disadvantages and laser Induced Infrared fluores
cence was shown to be feasible for remote sensing of atmo
spheric organic pollutants.
B . Laser Intracavity Absorption
1. Equipment and Reagents
a . Lasers
1. Perkin Elmer Model 6200 quasl-
contlnuous gas laser. Output power of 7 to 9 watts/cm^.
Principal laslng line: 10.6yu. Total output spectrum as
shown in Fig. 15.
11. Metrological Instruments Model 210Ohelium-neon laser. Output power of 0.5 milliwatts at 6328A.
111. JG laser: quasl-continuous C02 laser.
Nontunable when equipped with totally reflecting mirror as
the rear optical elements. Tunable when using a grating.
Cavity length was variable: 2 electrode-1 piece laser
cavity or 3 electrode-2 piece laser cavity. Power output:
7 to 9 watts/cm^ with the totally reflecting mirror. With
the grating, laser power observed depended on laser line
selection. Maximum power observed was approximately 5 watts.
b. Laser Gas Mixing System (LSU System)
LSU gas mixing system consisting of a
bellows regulatory valve and a fine metering valve for each
of the three gases used: CO 2 , N 2 and He. Mixing of the gases
was made in the system before transference to the laser cavity.
c . Chopper
Princeton Applied Research Model 125
mechanical chopper. Two chopping frequencies available:
1.3 and 26.6K&*d . Power Monitor
Coherent Radiation Model 201 power meter.
e . Monochromator
GCA McPherson Instrument Corporation
Model 218 0.3 meter scanning monochromater equipped with a
75 line/mm grating.
f . Scatter Site
Aluminum rod #4043, diameter: 3/32",
length: 41cm.
g . DetectorBeckman Thermocouple Detector with a KBr
window.
h . Amplif ier
P.A.R. Model 124 Lock-In Amplifier with a
P.A.R. Model 116 differential pre-amplifier.
i . Recorder
Beckman, 10-inch, potentiometric, single
pen recorder.j . Optics
i . Dumping MirrorGallium Arsenide output reflector for
the C02 laser. 25ram in diameter, 3mm thick, concave with a
radius of curvature: 20 meters. 80% reflective ut 10.6^.
103
ii. WindowGermanium window, 25mm in diameter,
3mm thick, flat surface.
il l . Mirrors
Two-inch diameter gold coated flat
mirrorj front surfaced,
i v • Gratings0- Jobin Yvon grating, 122 lines/mm,
diameter: 1cm
Two-inch gold coated grating,
75 lines/mm,Blaze angle = 22°.
k . Syringe
Gas, Precision Sampling Corp., 150cc.
1. Sample Mixing Chamber
Glass flask with a 29/42 ground glass joint
fitted with a top equipped with a septum port and a stopcock
port. Fig . 20 .
m . Sample Cell
Glass cell twenty centimeters in length
and two centimeters in diameter. Cell ends are fitted with
0 ring grooves.
n . Reagentsi. Ethyl Acetate: Fisher Scientific Co.
ii. Acetone: Spectrophotometry Reagent
Grade, Matheson Coleman and Bell.iii. Benzene: (Thiophene Free) Analytical
Reagent Grade, Mallinckrodt.
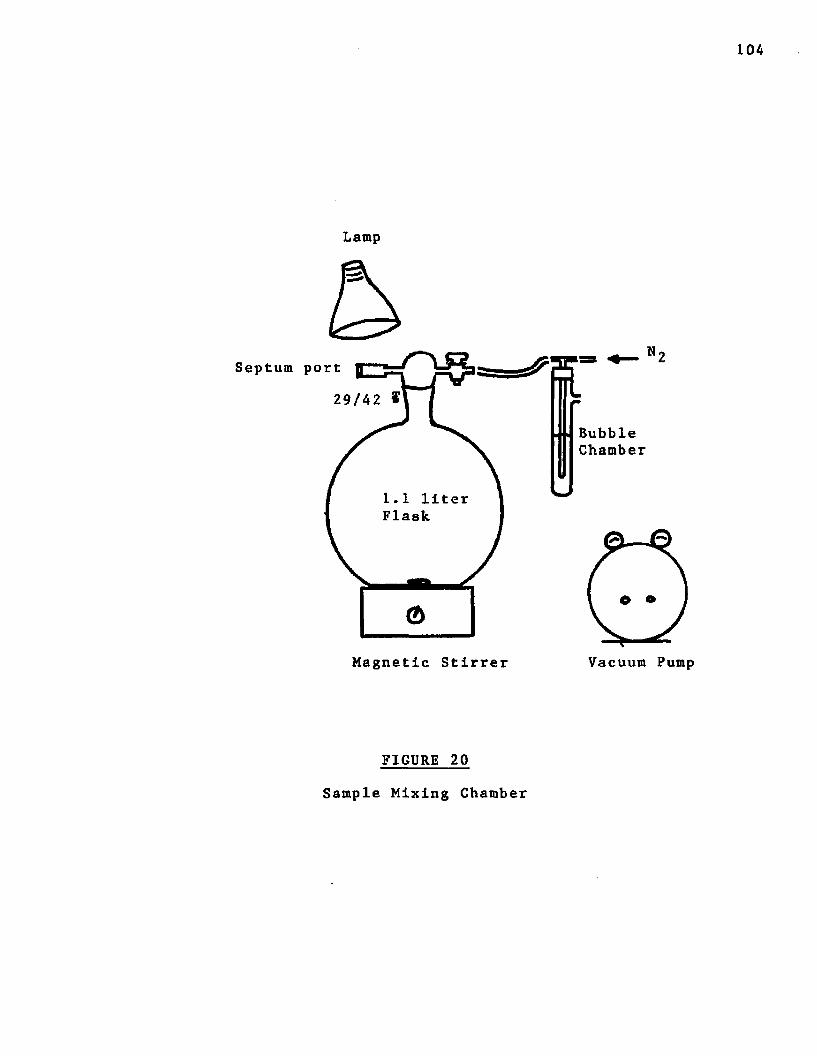
104
Lamp
Septum port
29/42 *
BubbleChamber
Flask
Vacuum PumpMagnetic Stirrer
FIGURE 20
Sample Mixing Chamber
105
lv. Methane: (C.P.), Matheson Co.
v. 1-Butene: Matheson Co.
vl. Ethyl Chloride: Matheson Co.
vli. Ethylene: (C.P.), Matheson Co.
vlii. Propylene: Matheson Co.
lx. Vinyl Chloride
2. System Configuration and Alignment
Various system components and configurations
were tried In attempts to construct the proper laser system
for the Intracavity absorption studies. Inherent with the
various equipment configurations were the alignment procedures,
a . Initial System Configuration
The initial system configuration consisted
of the one-piece, 2-electrode JG laser with a grating as the
rear optical element (Fig. 14). The grating used was a
75 line/mm grating. System alignment consisted of two basic
steps: (1) alignment of the laser cavity and (2) alignment
of the grating.
Alignment of the laser cavity was accompl '.shed
by using the He-Ne laser. The first step necessary in the
alignment procedures was to position the He-Ne laser such that
its beam was parallel to the laboratory bench which supported
the equipment. The optical rail which supported the laser
cavity and the laser cavity were then positioned such that
the He-Ne beam passed through the center of the cavity. In
order for this to be accomplished it was necessary to remove0
the CO 2 laser optics as they were opaque to the 6328A line of
106
the alignment laser. The alignment of the laser cavity was
accomplished by placing a hole-coupled mirror In the dumping
mirror holder and a similar hole-coupled object at the rear
window holder of the laser. The He-Ne laser faced the C02
laser cavity and the system was aligned so the He-Ne beam
passed through the holes in the front and rear of the C02
laser.
The grating was to be used in order to
make the C02 laser tunable. Therefore, the rear optical
element of the laser was the grating. The grating had to
be oriented in such a manner that the diffraction pattern
of the laser beam was projected in a horizontal fashion.
Thus, as the grating holder was rotated horizontally dif
ferent diffracted lines could be reflected back through the
laser media. To adjust the grating properly in the grating
holder, a reference line was made on a wall with which to
align the He-Ne diffraction pattern from the grating. The
grating was rotated circularly until the diffraction pattern
w e b leveled with the reference lines on the wall. The rulings
of the grating were then vertically oriented and the grating
holder was tightened to secure the position of the grating
in the holder.It was noted from experience that the
output laser power was critically dependent upon proper
dumping mirror alignment. The alignment of the dumping
mirror was made using the He-Ne laser but the optimum
adjustment was performed with the adjustment screws while
107
the laser was lasing. If the dumping mirror was grossly
out of alignment there was no lasing action. In order to
adjust the dumping mirror properly, a gold front surfaced
mirror was placed In front of the grating. The system was
adjusted until the He-Ne beam struck the center of the mirror.
The mirror was then adjusted so that the reflected He-Ne beam
returned on itself. The rear optical element of the plasma,
the germanium window, was installed and aligned such that
the beam reflection from its surface returned to the He-Ne
laser. The dumping mirror was Installed and the laser cavity
placed under vacuum. The dumping mirror was first adjusted
using the He-Ne beam but refined when the laser was opera
ting. The alignment procedure was accomplished.
The laser lased with the gold mirror as the
rear optical element and the front dumping mirror position
was optimized. The gold mirror was removed thus making the
grating the rear optical element.
It was expected to observe lasing action as
the grating was horizontally tuned. However, all attempts
at horizontal adjustment of the grating failed to produce
lasing action.Many procedures were tried in order to
produce lasing with the 75 line/mm grating. Alignment
procedures were performed and repeated. The grating was
swept in a horizontal manner as well as in a vertical fashion
in case the alignment procedures were not perfect. A power
meter was not only placed in a position to monitor the laser
output but a second power meter was placed next to the
grating. The second power meter was used to detect any laser beam diffracted or dumped off the grating. The concave GaAs dumping mirror was temporarily substituted by
a flat Ge dumping mirror but to no avail. A transformer
of higher current carrying capacity was substituted for
the previously used one. All attempts failed to produce
lasing action with the 75 lines/mm grating.
The grating alignment was carried one
step further. Succeeding the grating alignment with the
He-Ne laser, the grating was aligned using the CO 2 laser.
The gold mirror was placed as the rear element of the laser
cavity. The laser output was impinged upon the grating and
the diffraction pattern of the CO^ laser beam was observed.
The total output of the CO2 laser was 11.5 watts with the
two major resulting diffraction beams observed being 5-
5-1/2 watts and 3-1/2 watts, respectively. The strongest
diffracted beam position was then monitored by heat sensitiv
paper as the grating was horizontally turned. The diffract
beam was made to return upon the front of the CC>2 laser.
The grating was at a definite angle to the laser face. The
grating holder was then moved to the rear of the CC>2 laser
replacing the gold mirror. The angle of the grating was
maintained with respect to the CO 2 laser. The laser still
failed to lase^
Considerable time and effort had been
expended in attempting to produce lasing action with the
109
grating as the rear optical element. No positive
results were seen; therefore, a different approach to
the alignment of the equipment to be used In laser lntra- cavity absorption spectroscopy was undertaken.
b . First System Modification
Modification to the first experimental
configuration basically consisted of utilizing a totally
reflecting mirror as the rear optical element and a grating/
detector system to observe the individual laser lines.
Optical alignment of the system again
utilized the He-Ne laser. The He-Ne laser was placed at
the rear of the C0^ laser and the CO 2 laser optics were
removed. The laser beam was aligned with the center of the
CO 2 laser cavity and struck the center of the grating which
was on the output side of the laser cavity. The vertical
position of the grating was determined by returning the
He-Ne beam upon itself. The grating was then rotated such
that one of the beams struck the scatter site. The reflection
from the scatter site was then used to align the monochromator
properly. The optics of the C(>2 laser were reinserted into
the cavity and aligned.Later the grating was replaced by a 2"
diameter copper coated mirror as the resolution obtained
by the grating was not necessary for the experiment. The
McPherson monochromator system provided sufficient resolution
to separate the individual laser lines of the laser envelopes.
The use of the diffraction grating only led to a decrease in
110
the amount of laser output transmitted to the scatter site
due to the diffraction pattern.
The scatter site function was to transfer
a portion of the laser output to the monochromator and
therefore to the detector. A 2" diameter lrtran 2 window
mounted in a holder was first used as the scatter site. It
was found to be difficult to align properly. A 1/2" diameter
aluminum rod was substituted for the lrtran scatter site.
In order for the optical alignment to be made with the rod,
a quartz window was attached to produce sufficient He-Ne
beam reflection. This rod was later substituted by a smaller
diameter aluminum rod (0.092" in diameter) which was the
scatter site used for the intracavity absorption studies.
Alignment of the monochromator was
refined from the previously mentioned method. The detector
was removed from the exit port of the monochromator and the
hole-coupled mirror placed in the window holder. The He-Ne
laser was placed next to the exit port and adjusted such
that the beam height was the same as the height used in the
laser cavity alignment procedure. The monochromator height
was successively adjusted so the He-Ne beam passed through
the hole-coupled mirror and struck the center of the opposite
monochromator mirror. The beam was then traced from the
mirror to the grating and then to a second mirror. The
reflected beam from the second mirror then passed through
the entrance slit and emerged from the monochromator. The
scatter site was placed in the emerging beam path at a
distance of only a millimeter from the entrance port.
Ill
Detector alignment was accomplished by
positioning the detector for maximum signal when the CO^ laser was on.
A crude partition was constructed of
translte In order to prevent the laser from scattering from
unwanted objects and to prevent laser scatter, from the
aluminum rod, from being a hazard.
The choice of the sample cell and sample
cell alignment were extremely important. It was necessary
to place the sample cell in the optical path of the laser.
In addition, the cell had to be a sealed system not only to
contain hazardous samples but to prevent the lab atmosphere
from interfering with the absorption phenomenon exhibited
by the sample. Any trace gas contaminants in the laboratory
air that exhibited absorption in the laser region were
potential Interfering species.
c . Sample CellsThe first cell chosen had 29/42 ground
glass joint window holders. The windows first tried were
irtran 2 windows. These attenuated the wavetrain to the
point where no lasing occurred. Removal of one window
allowed the laser to lase but the laser power was greatly
attenuated. Germanium and irtran 6 windows were tried and
found to also attenuate the laser beam power. It was
obvious that the sealing of the cell could not be with
windows. Therefore, a second cell was obtained.
The second cell was open at both ends but
the ends were flared due to 0-ring slots. The cell was
112
positioned close to the rear germanium window of the CO^
laser and the rear mirror mount. Two latex sleeves were
used to connect the cell to the laser optics and affect a
seal.
The cell was aligned in the system by
adjusting its position such that the He-Ne beam passed
through the cell center just as it passed through the
laser cavity center.
d . Injection System
A rigid injection system was constructed
(Fig. 21). Nitrogen passed through the cell before and after
introduction of the sample through the septum port. The two
stopcocks allowed the injected gas sample to be contained in
a static system for the studies.
e . Gas Scrubber System
Gas scrubbers were constructed and installed
for the three laser gases as well as the N 2 flush gas. Each
scrubber system contained Tel-Tale for moisture removal,
activated charcoal to remove organic materials and a suit
able oxygen scrubber.Oxygen scrubbers can be classified as either
wet or dry methods. A dry scrubber, which was used, has
the advantage that the gas stream is not contaminated by sol
vent vapors as in the case of a liquid scrubber system. Dry
scrubbers generally involve passage of the gas through a bed
of reactive metal or metal oxide. Heat is usually applied
in order to provide a reasonable reaction rate.
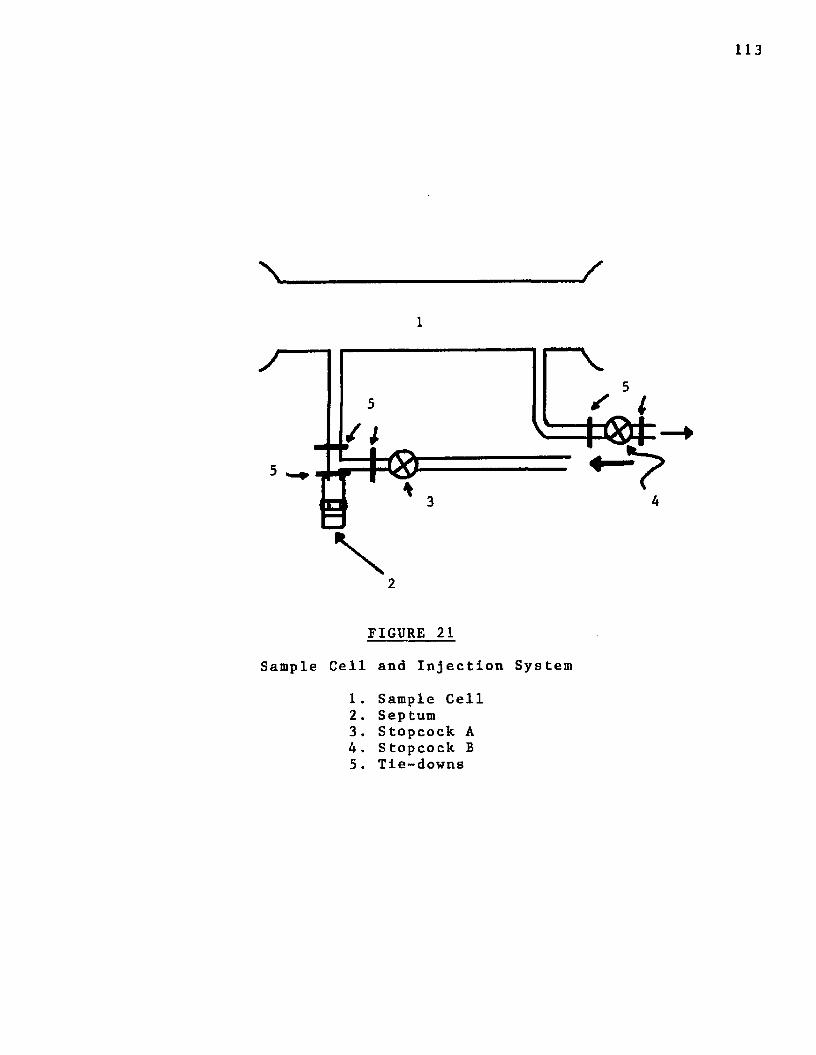
FIGURE 21
Sample Cell and Injection System
1. Sample Cell2. Septum3. Stopcock A4. Stopcock B5. Tie-downs
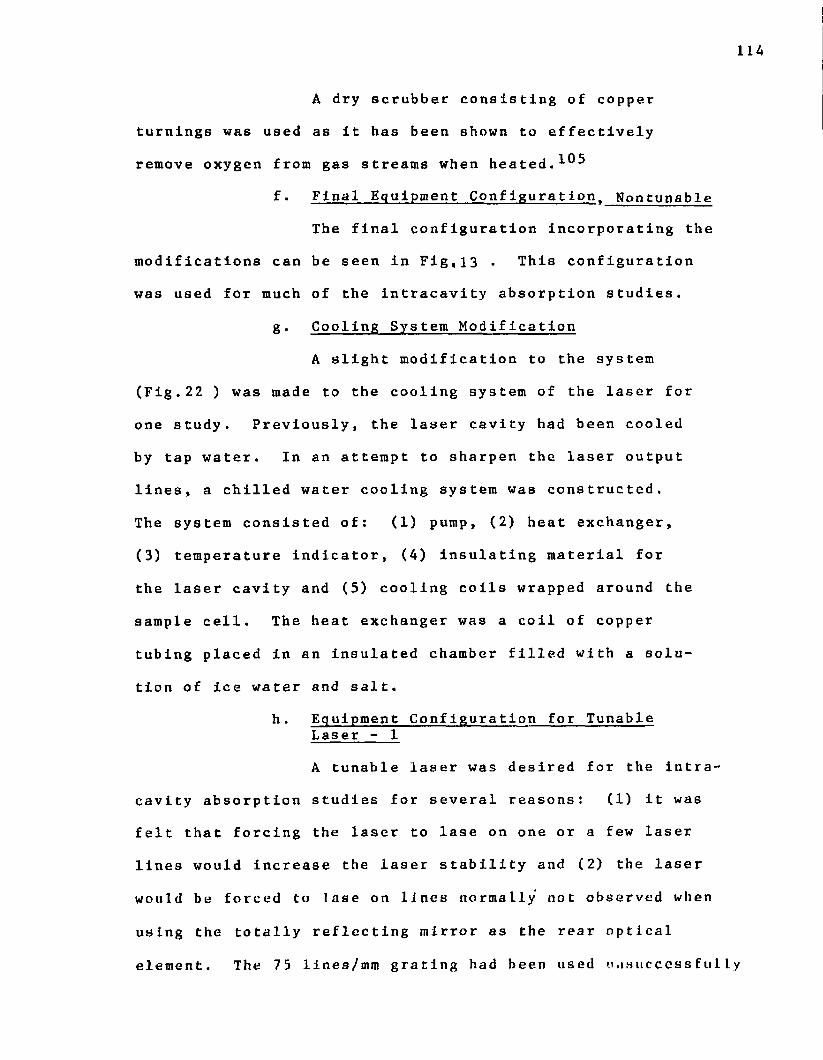
11A
A dry scrubber consisting of copper
turnings was used as it has been shown to effectively
remove oxygen from gas streams when heated.
f , Final Equipment Configuration. Nontunable The final configuration incorporating the
modifications can be seen in Fig,i3 . This configuration
was used for much of the intracavity absorption studies,
g . Cooling System Modification
A slight modification to the system
(Fig.22 ) was made to the cooling system of the laser for
one study. Previously, the laser cavity had been cooled
by tap water. In an attempt to sharpen the laser output
lines, a chilled water cooling system was constructed.
The system consisted of: (1) pump, (2) heat exchanger,
(3) temperature indicator, (A) insulating material for
the laser cavity and (5) cooling coils wrapped around the
sample cell. The heat exchanger was a coil of copper
tubing placed in an insulated chamber filled with a solu
tion of ice water and salt.h . Equipment Configuration for Tunable
Laser - 1A tunable laser was desired for the intra
cavity absorption studies for several reasons: (1) it was
felt that forcing the laser to lase on one or a few laser
lines would increase the laser stability and (2) the laser
would be forced to lase on lines normally not observed when
using the totally reflecting mirror as the rear optical
element. The 75 lines/mm grating had been used unsuccessfully
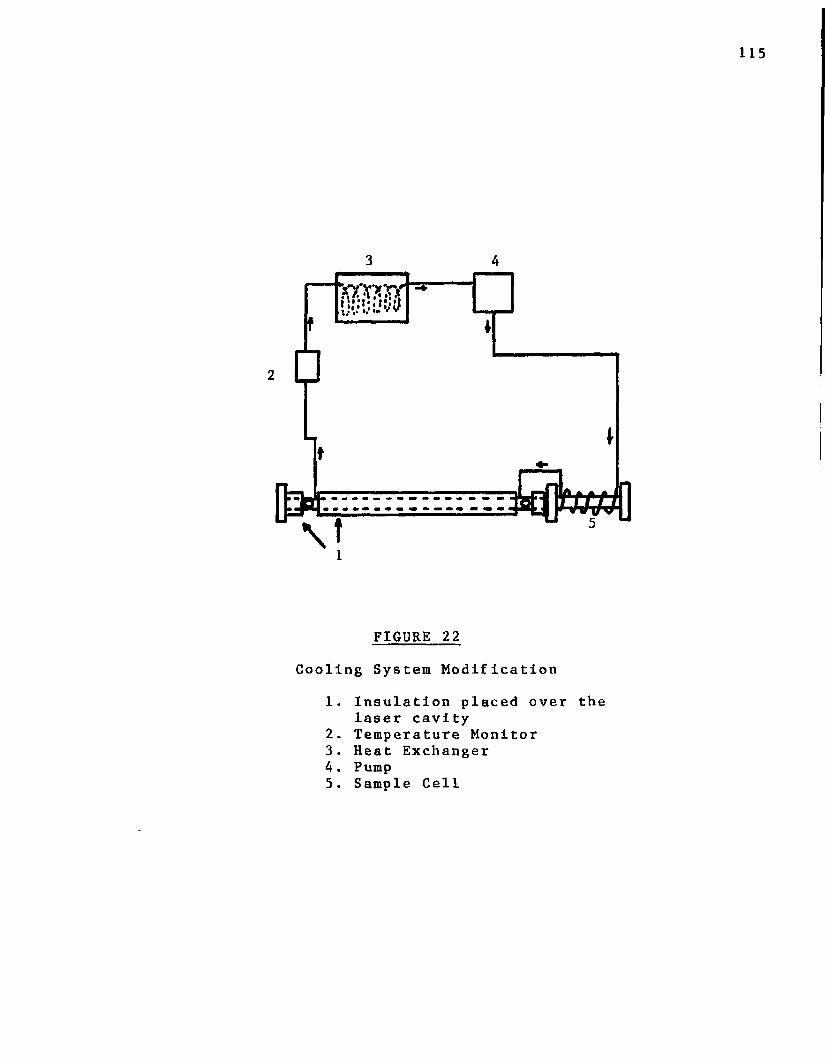
115
xmvc
FIGURE 22
Cooling System Modification1. Insulation placed over the
laser cavity2. Temperature Monitor3. Heat Exchanger4. Pump5. Sample Cell
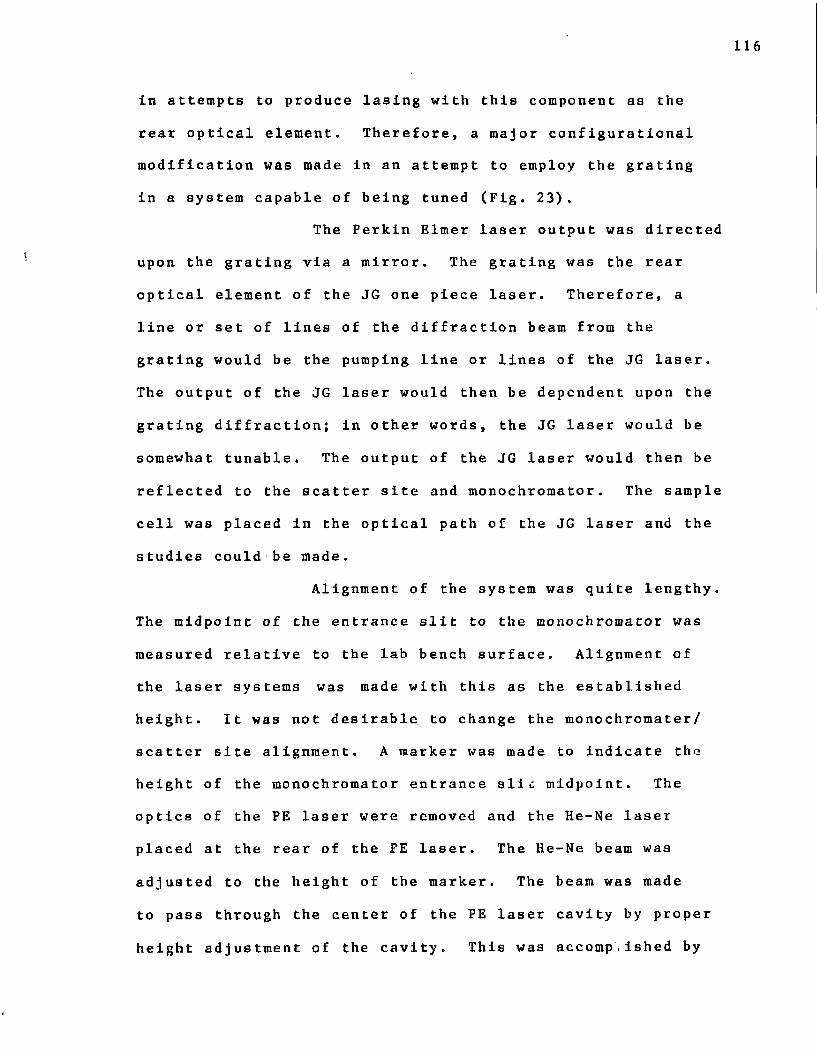
116
in attempts to produce lasing with this component as the
rear optical element. Therefore, a major configurational modification was made in an attempt to employ the grating
in a system capable of being tuned (Fig. 23).
The Perkin Elmer laser output was directed
upon the grating via a mirror. The grating was the rear
optical element of the JG one piece laser. Therefore, a
line or set of lines of the diffraction beam from the
grating would be the pumping line or lines of the JG laser.
The output of the JG laser would then be dependent upon the
grating diffraction; in other words, the JG laser would be
somewhat tunable. The output of the JG laser would then be
reflected to the scatter site and monochromator. The sample
cell was placed in the optical path of the JG laser and the
studies could be made.
Alignment of the system was quite lengthy.
The midpoint of the entrance slit to the monochromator was
measured relative to the lab bench surface. Alignment of
the laser systems was made with this as the established
height. It was not desirable to change the monochromater/
scatter site alignment. A marker was made to indicate the
height of the monochromator entrance sli.: midpoint. The
optics of the PE laser were removed and the He-Ne laser
placed at the rear of the PE laser. The He-Ne beam was
adjusted to the height of the marker. The beam was made
to pass through the center of the PE laser cavity by proper
height adjustment of the cavity. This was accomplished by
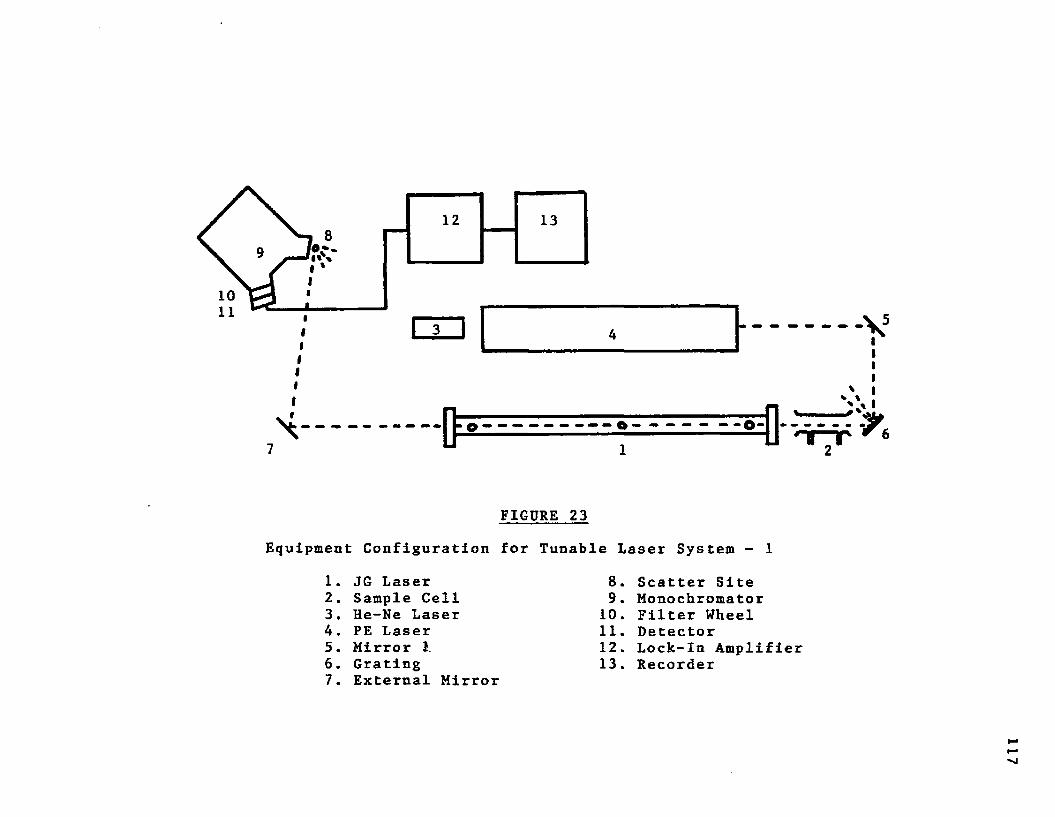
m
1312
FIGURE 23
Equipment Configuration for Tunable Laser System - 1
1. JG Laser 8. Scatter Site2. Sample Cell 9. Monochromator3. He-Ne Laser 10. Filter Wheel4. PE Laser 11. Detector5. Mirror 1. 12. Lock-In Amplifier6. Grating 13. Recorder7. External Mirror
117
118
using the hole-coupled materials. Mirror 1 was adjusted
so the emerging alignment beam struck the mirror center.
The reflection of the mirror was transferred to a second
mirror temporarily placed in the grating position. The
reflection from this mirror was then passed through the
center of the JG laser cavity. The height of the He-Ne
beam was checked with the marker placed at the opposite end
of the JG laser cavity. The laser systems and the scatter
site were now in the same plane.
The JG laser had to be properly oriented
to the adjacent PE laser. The distance between the two
laserswas kept to a minimum. Proper orientation of the
two laser systems was achieved in the following manner.
The PE laser optics were installed and the laser output was
directed onto the grating via the mirror at the PE laser
output. The grating was horizontally rotated until the
diffraction beam passed through the sample cell of the JG
laser. The JG laser was then horizontally positioned such
that the laser was centered around the diffraction beam.
This laser system was still in the
development and testing stage when a better system was
constructed.
1. Equipment Configuration for TunableLaser - 2
A new grating, the Jobin Yvon grating,
was made available and found to produce lasing when placed
as the rear optical element. Therefore the three electrode,
119
two piece laser was assembled U3lng this grating to yield
a tunable laser (Fig.24).
The alignment procedure consisted of removing the laser optics and placing the He-Ne laser at
the front of the CO 2 laser. The diffraction grating was adjusted to return the He-Ne beam upon Itself. A mirror
was placed at the rear of the second cavity and the cavity
centered around the beam. The front cavity was likewise
centered. The germanium window was placed in the holder
and properly aligned as well as the dumping mirror/
The laser lased; however, it was not
satisfactory and a better system was assembled.
j . Equipment Configuration for Tunable Laser - 3
The one piece, two electrode JG laser
was again assembled but with the new grating as the rear
optical element (Fig.14).
Alignment procedures were the same as
those used in the previous operation.A shield was made and attached to the
rear of the sample cell. The cell had to be sealed with
the grating holder through the use of a latex sleeve.
However, part of the diffraction pattern from the grating
was dumped instead of reflected down the laser cavity.
Therefore, the dumped portion of the beam impinged upon
the shield placed Inside the latex wall preventing destruc
tion of the latex.
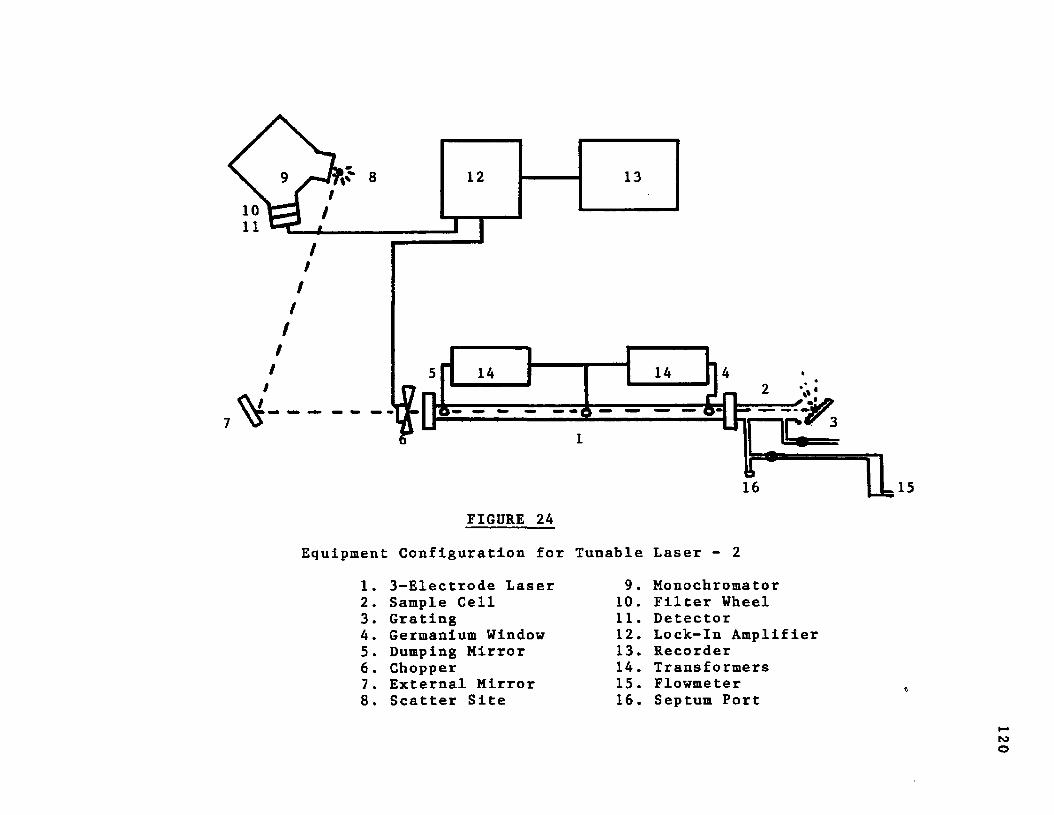
5f 14 | 14 *| 4--■.olbrCra^16
FIGURE 24
Equipment; Configuration for Tunable Laser - 2
1. 3-Electrode Laser 9 . Monochromator2. Sample Cell 10. Filter Wheel3. Grating 11. Detector4. Germanium Window 12. Lock-In Amplifier5. Dumping Mirror 13. Recorder6. Chopper 14. Transformers7. External Mirror 15. Flowmeter8. Scatter Site 16. Septum Port
U
3. Sample Preparationa . Gaseous Samples
Each gas sample was prepared by serial dilution, using a gas syringe. One milliliter of puregas
was diluted to lOOcc with scrubbed ^ • (The source was
the same as that used to flush the sample cavity before
and after sample injection.) This yielded a 1:100 sample
mixture. Lower concentrations were achieved by exhausting
the diluted sample to lcc then increasing the volume to
lOOcc with more Care was taken to ensure proper dilu
tion by slowly filling with N 2 and allowing the mixture to
set for at least 10 minutes before Introduction into the
sample cavity.
b . Liquid Samples
Several compounds were studied which were
liquids Instead of gases at room temperature. Therefore,
a system was built in order to prepare known mixtures of
vaporized samples. The apparatus can be seen in Fig.20).
The sample preparation involved a number
of steps. First, the flask was evacuated for 2 minutes
using the vacuum pump. The stopcock was closed and the
flood lamp turned on to heat the injection port. The
desired amount of liquid compound was injected into the
flask with a Hamilton jul syringe. The liquid vaporized
upon injection or shortly thereafter. The N 2 flow through
the sample cell was re-routed by the 3 way stopcock and
the N 2 supply tube was connected to the stopcock 0.1 the flask
122
The stopcock was slowly opened until the bubbling In the
water chamber ceased. When the flask was filled with N^>
the Ng began to bubble through the water once again. The
stopcock on the flaak was closed. The gas mixture was
stirred for 10 minutes with the stirring bar. An amount
of gas sample would then be drawn Into the gas syringe
mentioned In part (a) and further dilutions made If desired.
4. Sample Injection and Study
a , Laser System with a Totally ReflectingMirror
The sample cavity was flushed with N 2 *
Stopcock A (Fig.21 ), was then closed and 50cc of sample
Introduced at the septum port. Stopcock B was closed,
thus trapping the sample In the cavity for the study. Upon
completion of the study, stopcock B was opened and an
additional 50cc of sample was injected and the study
repeated.
A two part study was made with each gas
mixture occupying the sample cavity. The Initial part con
sisted of scanning the laser output while the latter part
was a study of the effect of the sample on the intensity of
a particular line.b . Laser System with a Grating
The sample cavity was flushed with N 2
prior to sample injection. The flush gas flow was stopped
and 50cc of sample introduced at the septum port. The rear
stopcock was closed in order to trap the sample for a static
analysis. Upon completion of the study the sample cell was

123
flushed with N£. The study was then repeated by the intro
duction of a second volume of the sample.The study consisted of obtaining detection
limits for the gas samples using the most sensitive laser line for each sample as was previously determined in the
intracavity absorption experiments employing the totally
reflecting mirror.
RESULTS
A. Remote Sensing
Laser Induced Infrared fluorescence has been shown
to be feasible for remote sensing of pollutants in the atmo
sphere. The experimental results obtained and reported in
this dissertation described the detection of organic mole
cular compounds by this phenomenon. Many parameters were
considered in the study. Some of the parameters were control
lable and were varied in attempts to develop the method into
a valid remote sensing technique. These parameters included
(a) laser power, (b) selection of monitored wavelength range,
(,c) detector selection, (d) phase angle between the laser
scatter and the time-delayed fluorescence signals (phase
shifting), and (e) time constant of the amplifier.
1. The Effect of Laser Power on FluorescenceIntensity
The power of the laser output was an important
factor which had a direct effect upon the signal intensity
of the Induced molecular fluorescence. The strength of the
10.6yA CO2 laser beam was attenuated by the atmosphere due to
scattering and turbulence and the laser beam power density
was greatly decreased due to beam divergence. Therefore, the
range of excitation of pollutants was severely limited. The
fluorescence intensity was dependent upon the number of
excited molecules relaxing through photon emission. The
number of excited molecules was, in turn, dependent upon the
strength of the excitation source, the laser. The stronger
124
125
the laser beam, the greater the effective path of the laser
beam. For these experiments the laser power was not greater
than 14 watts/cm ; therefore, the effective distance was
quite limited to perhaps only a few meters.
The stability of the Perkin Elmer laser was of
great concern. The laser beam intensity had to be constant
in order for the signal intensities to correspond to rela
tive concentrations of pollutants giving rise to the signals.
This parameter had to be constant during all the experiments.
Phase shifting, diurnal, filter comparison, and detector
comparison studies could not have yielded meaningful data
if the laser power had fluctuated.
In order to achieve laser stability, the PE
laser was put in operation for approximately two hours before
the experiments were begun. The gas mixture and rear mirror
position both had to be fine tuned during the warm-up period
In order to achieve maximum power. During this stabiliza
tion time, the laser cavity reached thermal equilibrium.
The PE laser was air cooled in an enclosed casing, therefore,
the laser cavity was partially shielded from thermal effects
of the laboratory.
Table 2 and Figure 25 show the unchopped laser
power versus time over a period of four hours. The laser
had been turned on at 9:15 a.m. and the final rear mirror
and gas mixture adjustment was made at 11:00 a.m.
Table 3 shows the unchopped laser power over
a longer period of time. In this particular study the laser
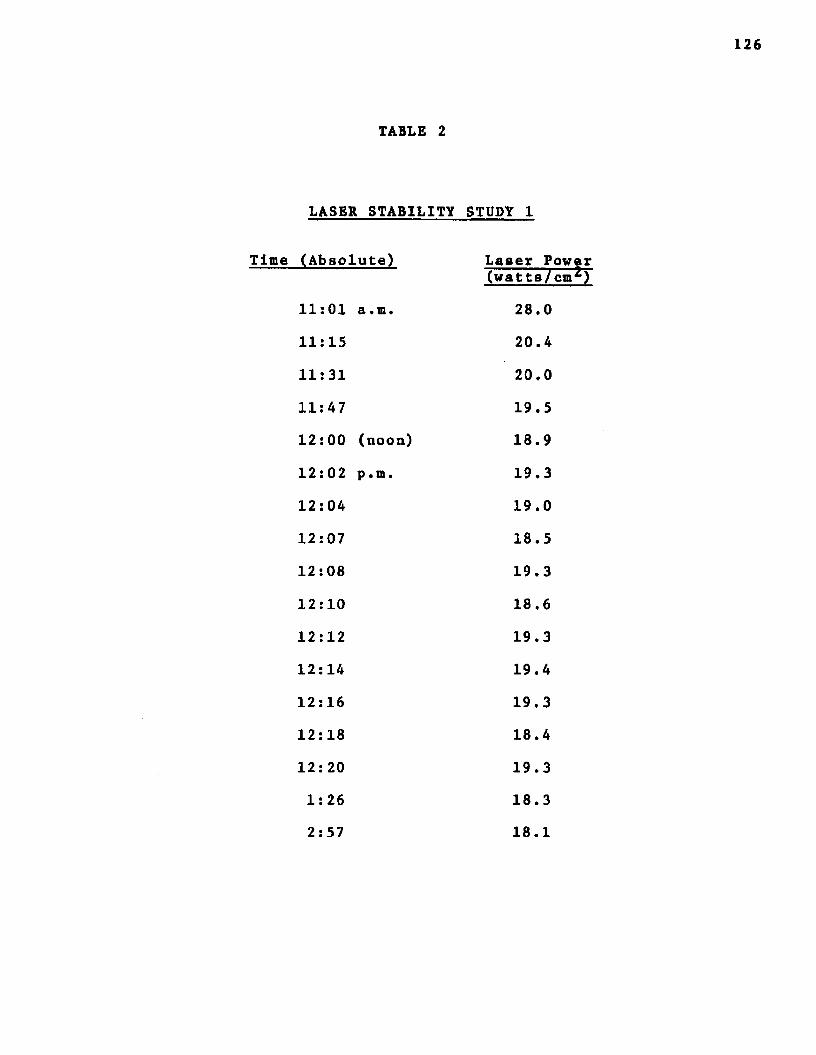
126
TABLE 2
LASER STABILITY STUDY 1
Time (Absolute) Laser PowerTwatts/cm^)
11:01 a.m. 28.0
11:15 20.4
11:31 20.0
11:47 19.5
12:00 (noon) 18.9
12:02 p.m. 19.3
12:04 19.0
12:07 18.5
12:08 19.3
12:10 18.6
12:12 19.3
12:14 19.4
12:16 19.3
12:18 18.4
12:20 19.3
1:26 18.32:57 18.1
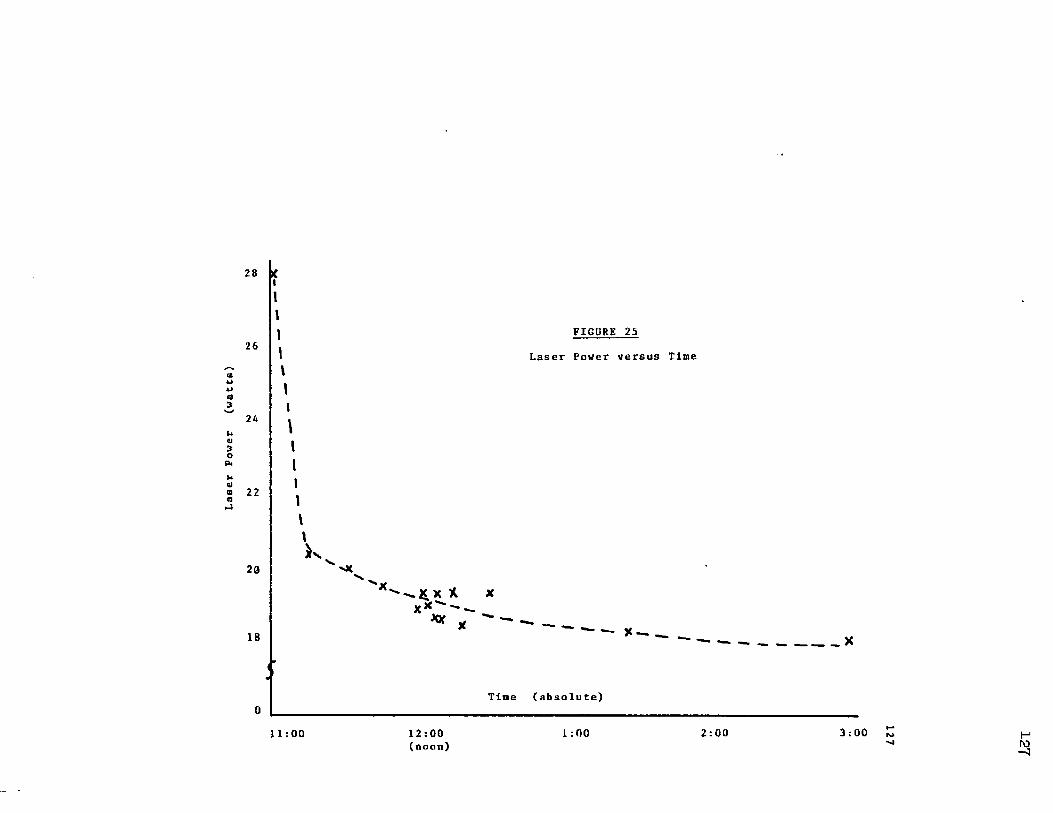
Laser
Power
(watts)
28
FIGURE 2526
Laser Power versus Time
24
22
20£ x X
XX ,
18
Time (absolute)0
11:00 12:00 1:00 2:00 3:00(noon)
127
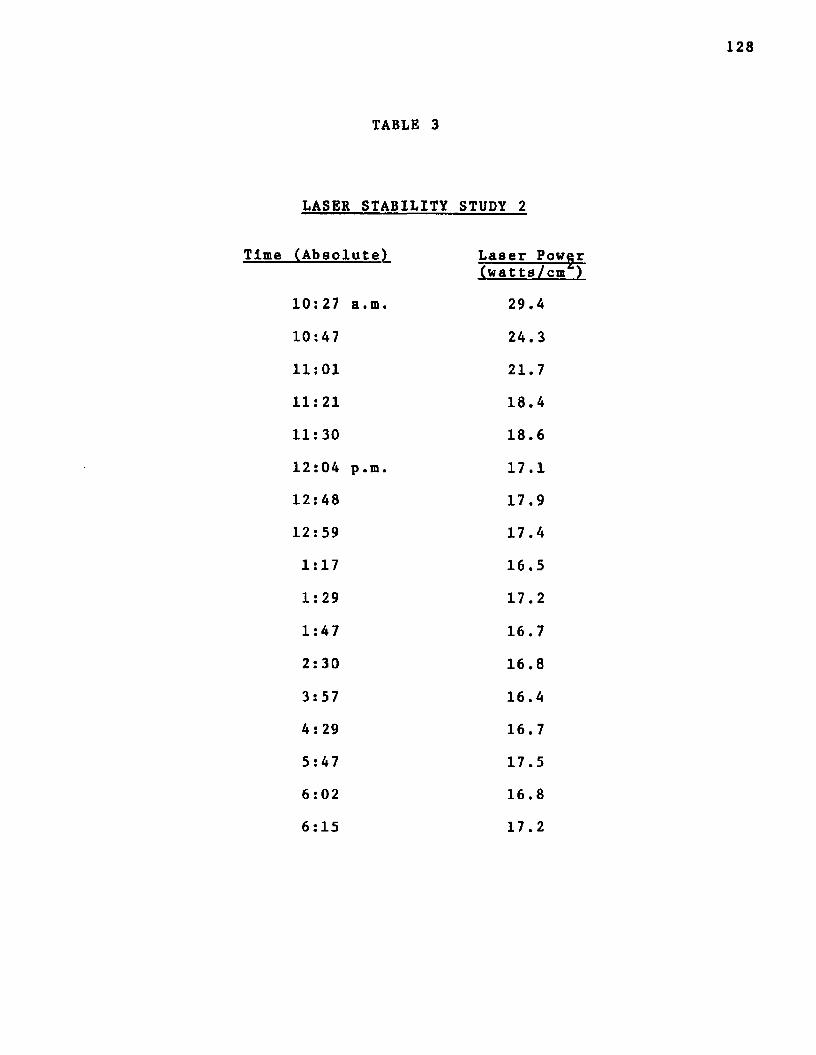
128
TABLE 3
LASER STABILITY STUDY 2
Time (Absolute) Laser Pow^(watts/cm*)
10:27 a.m. 29.4
10:47 24.311:01 21.7
11: 21 18.4
11:30 18.6
12:04 p.m. 17.112:48 17.9
12:59 17.4
1:17 16.5
1:29 17.2
1:47 16.7
2:30 16.8
3:57 16.4
4:29 16. 7
5:47 17.5
6:02 16.8
6:15 17.2
129
was turned on at 9:25 a.m. and the last fine tuning of the
laser was made at 10:24 a.m. Figure 26 shows the laser output power during the study.
For all the studies the laser beam was blocked
to simulate "laser off" and unblocked to simulate "laser on."
A piece of translte was used In this procedure. The laser
could not be turned off and on as the laser cooled or heated
as these manipulations were made. As the laser cavity
changed temperaturet the laser cavity length changed. This
resulted In a fluctuation in the intensity of the laser out
put. It was Imperative that the laser output power remain
constant throughout the experiments so as not to monitor
power fluctuations instead of valid signals.
2. Spectral Regions Observed
The spectral regions of the various filter
wheel positions used in the experiments were shown in Table 1
and Figure 16. Signals were seen at each wavelength range
selected by the filter positions. Figures 27, 28, and 29
show the signals observed with the first monitoring system
using filters 2, 3, and 4, respectively. Filter //I was used
In the later work in conjunction with the detector comparison
studies and can be seen in Fig. 31.
The sensitivity of the amplifier used to record
the signal shown in Fig. 27 for filter #2 was ^uv. In compari
son, the amplifier sensitivities for the signals as shown in
Figures 28 and 29 , with filter #3 and #4, were 500/tv and 50mv,
20mv, respectively. An accurate numerical comparison of
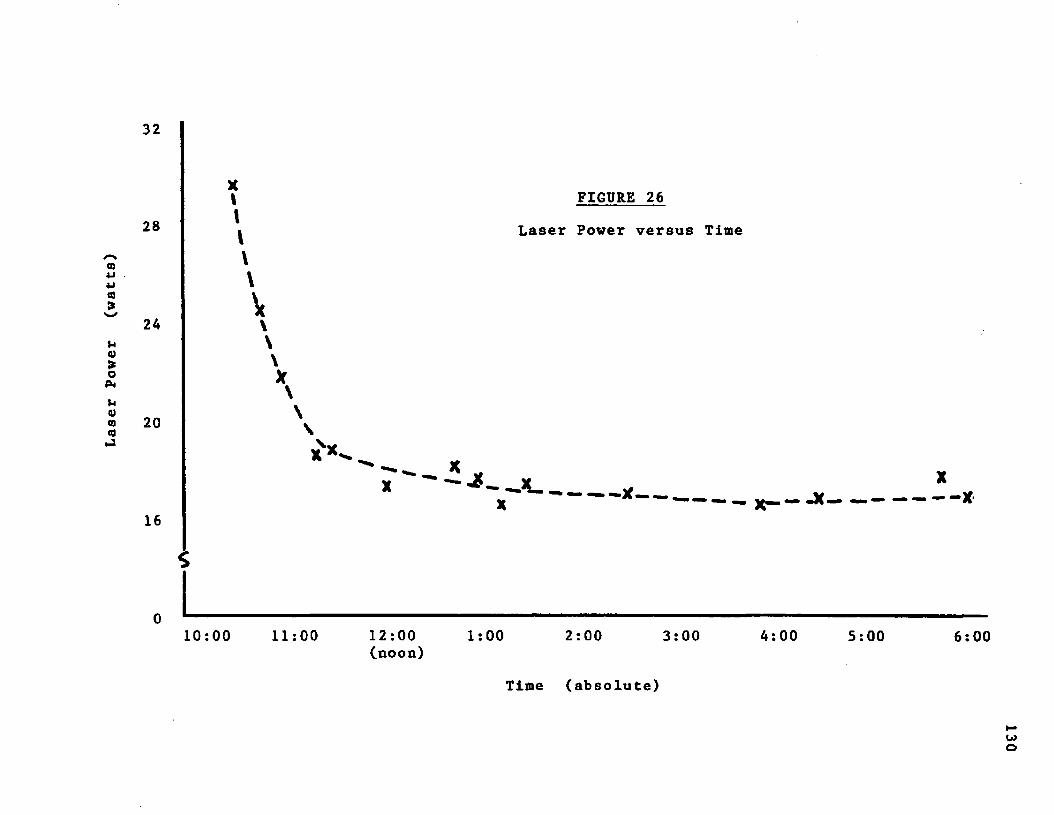
Lase
r Power
(wat
ts)
32
X\ FIGURE 26
28 Laser Power versus Time\\\X24 \\\X \
20
16
\\
x '"■*— X _______________ _________
10:00 11:00 12:00 1:00 2:00 3:00 4:00 5:00(noon)
Time (absolute)
X— — X
6:00
130
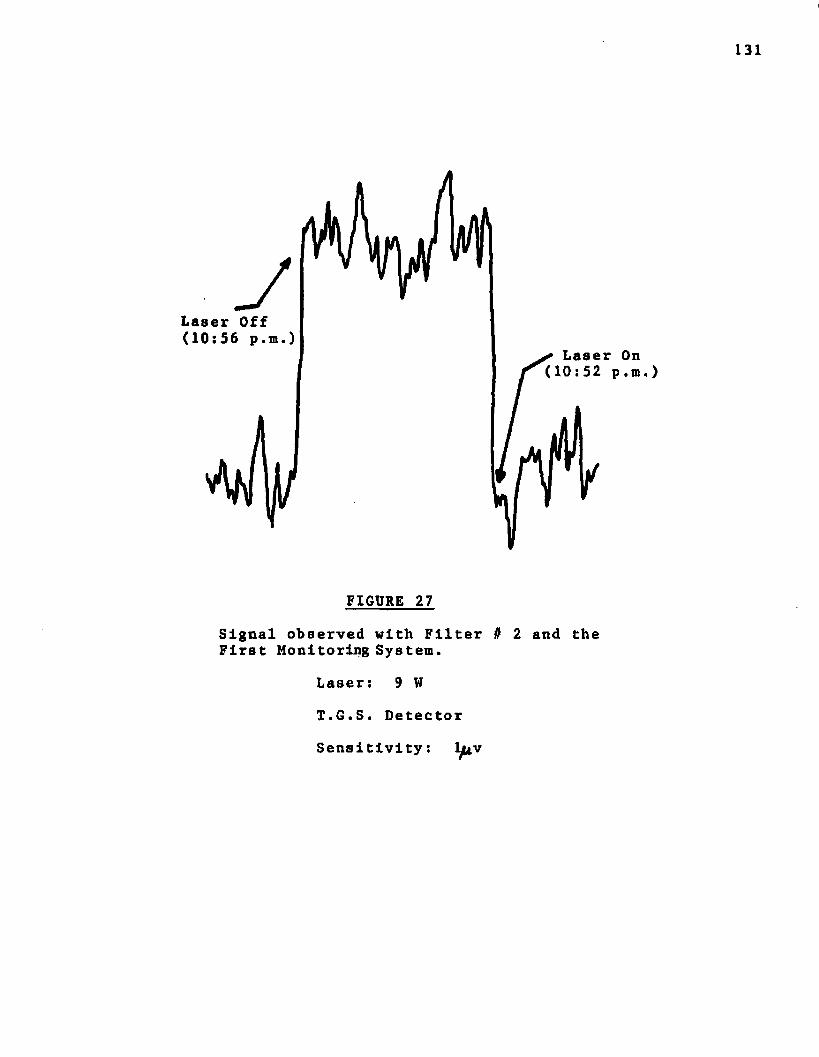
131
Laser Off (10:56 p.m.)
Laser On (10:52 p.m.)
FIGURE 27
Signal observed with Filter # 2 and the First Monitoring System.
Laser: 9 W
T.G.S. Detector
Sensitivity: Ij v
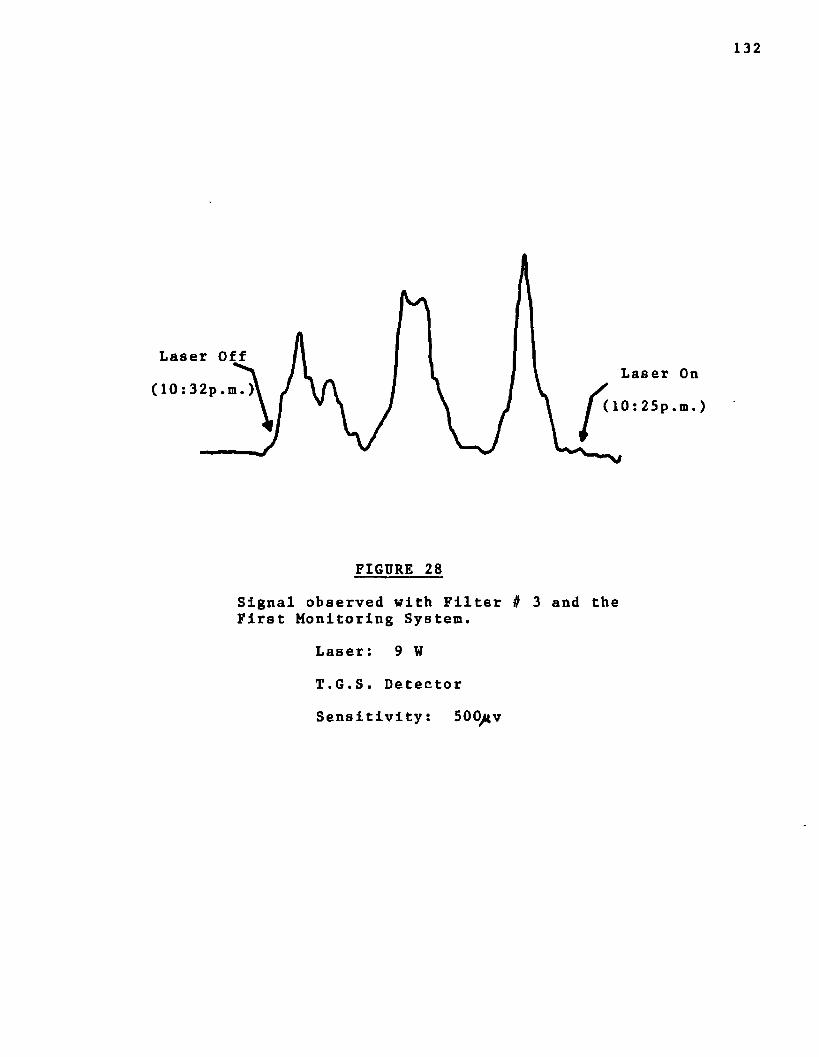
132
Laser OffLaser
(10:32p.m(10:25p
FIGURE 28
Signal observed with Filter 9 3 and the First Monitoring System.
Laser: 9 W
T.G.S. Detector
Sensitivity: 500^v
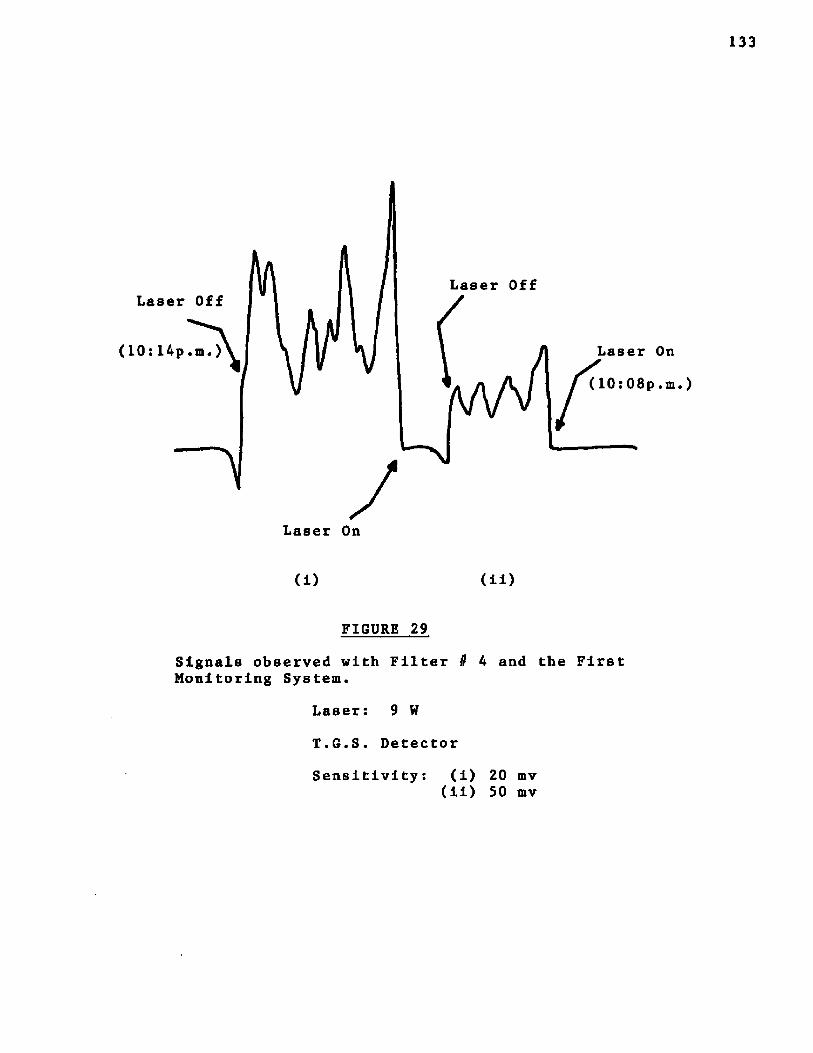
133
Laser OffLaser Off
(10:14p Laser On
10:0 8 p . m . )
Laser On
(i) (li)
FIGURE 29
Signals observed with Filter # 4 and the First Monitoring System.
Laser: 9 W
T.G.S. Detector
Sensitivity: (i) 20 mv(li) 50 mv
these signal intensities cannot be made due to the
lnhomogenelty of the atmosphere. However, it can be stated that, in general, the fluorescence observed when using
filter #2 was several orders of magnitude less than the
fluorescence Intensity in the filter if3 spectral region.
This was as expected. In addition, fluorescence observed
when using filter if3 was several orders of magnitude less
than the signal observed when employing filter if4. This
decrease was due to several facts. Scatter of the 10.6ju.
laser envelope was observed with filter #4 (7.0 - 15.tyu),
whereas filter if3 did not allow the laser scatter to pass
to the detector. Also, shorter wavelength fluorescence as
observed with filter #3 (as well as filter if2) was not as
intense as resonance fluorescence. This fact has been
previously observed and reported. ^
Figure 28 which shows a fluorescence signal
observed using filter #3 was quite interesting. The signal
intensity not only fluctuated but the signal was observed
to return to baseline while the laser was "on." This
reflected the inhomogeneity of the sample which was being
monitored; that is, the atmosphere. Obviously, during the
"laser on" period the organic molecular pollutants giving
rise to the signal drifted in and out of the laser beam path
3. Detector Selection
A vital component of any remote sensing appara
tus is the detector. The greater the detection ability, the
more sensitive the remote sensing. Thus the qualities desir
135
in any detector used for remote sensing operations include:
(1) large detector element surface area, (2) high detectivity, (3) fast response time, (4) low noise level, (5) thermal stability and, (6) ease of maintenance.
Two detectors were compared and evaluated with
respect to each other in view of the criteria mentioned
above. A Triglycine Sulfate pyroelectric detector, (TGS),
was used for most of the remote sensing work due primarily_ o 2to the large surface area of the detector element: 4 x 10 cm .
The surface area of the photoconductive Mercury-Cadmium-
Telluride detector (Hg-Cd-Telluride) was several orders of
magnitude smaller being 4.9 x 10~^cm^. However, the detec
tivity of the Hg-Cd-Telluride detector, 2.3 x 10®, was greater than that of the TGS, 8.1 x 10®. According to the
specifications of the manufacturers of the detectors, the
response times of the two detectors were quite different:
0.25 to 1 microsecond and 1 to 5 milliseconds for the Hg-Cd-
Tellurlde and TGS detectors, respectively. The noise levels
of the detectors were compared by observing the time constants
used to record the fluorescence signals. It can be seen
from Figures 30 and 31 that a much longer time constant was
needed when using the TGS detector than when using the Hg-
Cd-Tellurlde. This will be further discussed in Section 5.
The TGS detector housing was wrapped with cloth towels in
an attempt to reduce thermal fluctuations of the detector
due to the environment in which the detector operated. In
contrast, the Hg-Cd-Telluride detector was kept at liquid
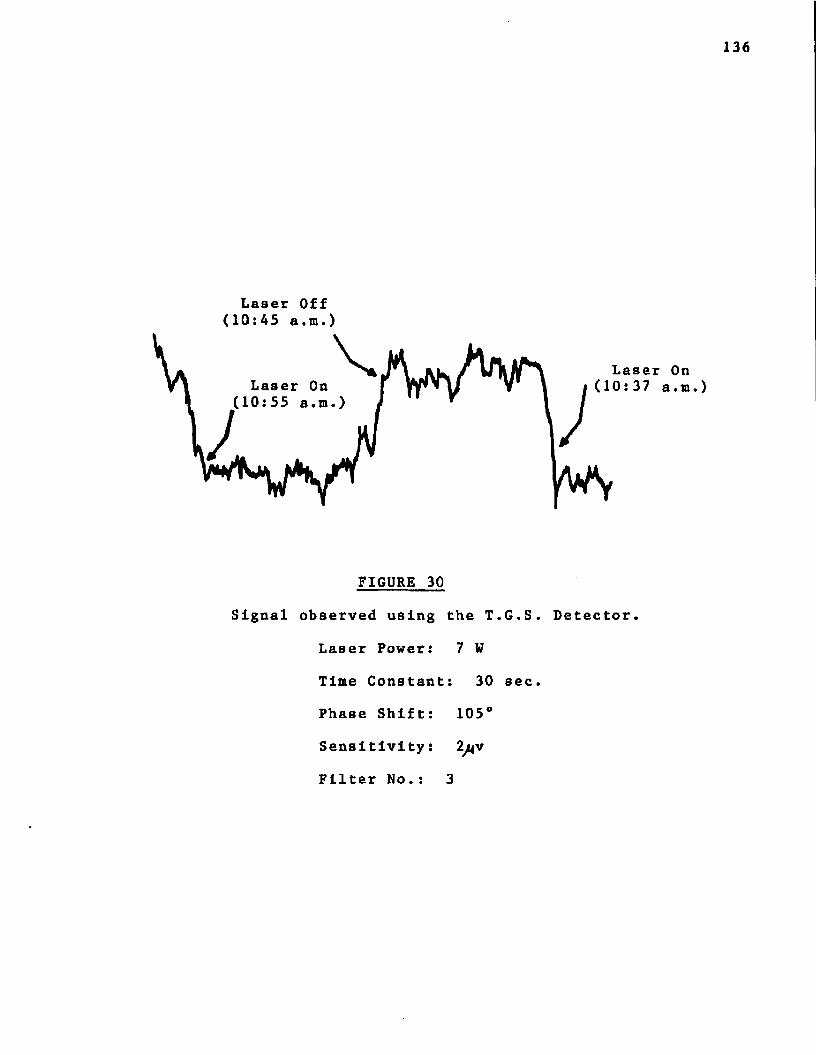
136
Laser Off (10:45 a.m.)
Laser OnLaser On
(10:55 a.m.)
FIGURE 30
Signal observed using the T.G.S. Detector.
Laser Power: 7 W
Time Constant: 30 sec.
Phase Shift: 105°
Sensitivity: Ij v
Filter N o . : 3
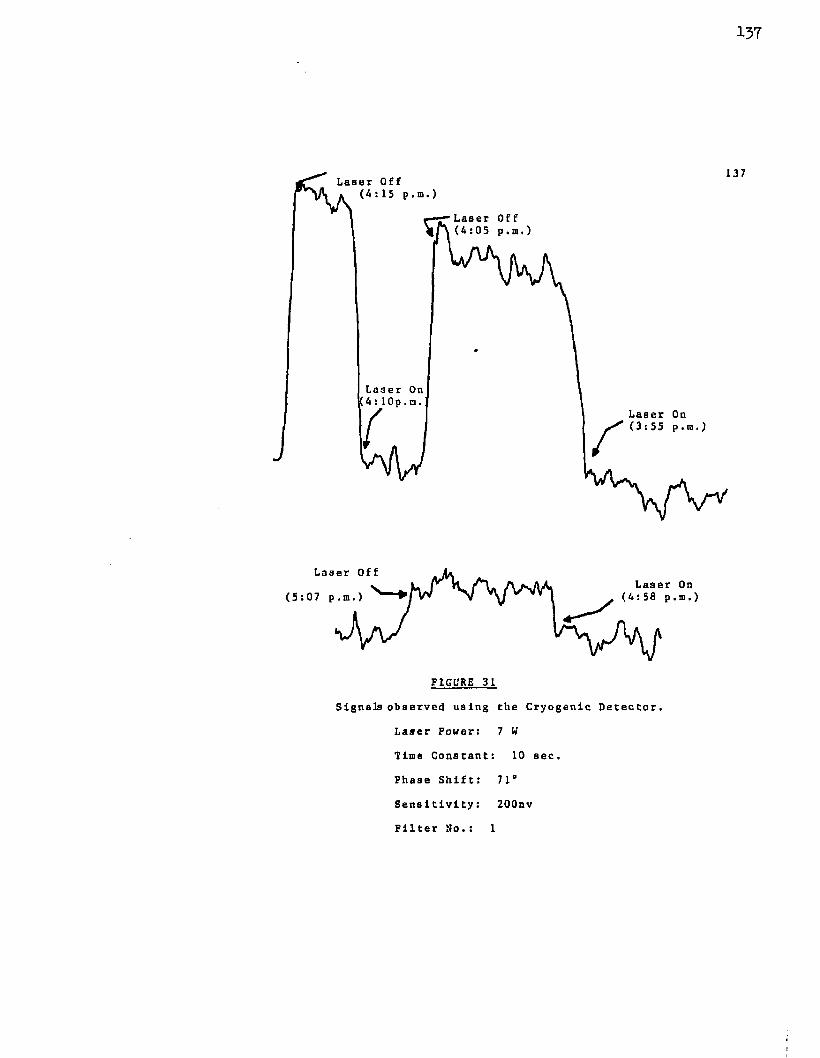
137
1 3 7ser Off
Laser Off
Laser Off
5:
FIGURE 31
Signals observed using the Cryogenic Detector.
Laser Power: 7 W
Time Constant: 10 sec.
Phase Shift: 71"
Sensitivity: 200nvFilter No.: 1
138
nitrogen temperatures. Therefore, the thermal stability
was greater than that of the TGS and was not affected by the thermal fluctuations of the environment. ThlB fact on
the other hand, was a disadvantage when the maintenance of
the detector was considered. The Hg-Cd-Telluride detector
was not allowed to warm to room temperature while operating.
This meant the liquid nitrogen dewar had to be checked
periodically and filled. The TGS did not require this amount
of maintenance.
Figures 30 and 31 illustrate signals observed
with the TGS and Hg-Cd-Telluride detectors. The TGS detector
was more sensitive in that the signal was monitored using an
amplifier setting of 2yuV. The amplifier was adjusted to
200nv when the cryogenic detector was used. The signals
were observed on the same day; therefore, the pollutant
level should not have varied to a great extent. The filters
used for the signal monitoring shown in Figures 30 and 31
were different. Filter #3 (3.3 - lO.Qtc) was used along with
the TGS detector and filter #1 (open) was used with the Hg-
Cd-Tellurlde detector for these signals shown. In both
cases laser scatter was eliminated due to phase shifting
(Section 4), thus the signals observed were due to fluores
cence in both cases. However, shorter wavelength fluores
cence has been shown to be weaker than resonance fluorescence,
thus one would have expected the signal observed to be more
intense when using filter #1. Filter #1 not only passed the
shorter wavelength fluorescence but also any resonance
139
fluorescence. Thus, It can be concluded that the TGS
detector proved to be the more sensitive detector.
It is felt that the TGS detector was more sensitive than the Hg-Cd-Telluride due to the larger sur
face area of the TGS element. The collecting mirror used
in the experlements did not produce a focusing point but
rather a focusing volume which was quite large. The larger
surface area of the detector element was definitely an
advantage as it was exposed to more of the radiation
gathered by the collecting mirror.
4. Phase Shift Study
Phase shifting was used during the remote
sensing studies to discriminate against the scatter signals
from the CO^ laser. Scatter is instantaneous and therefore
has a phase shift virtually equal to zero. On the other
hand, relaxation of organic molecules by fluorescence
involves a time delay. It has been established that the
vibrational/rotational lifetime of ethylene is in the milli
second r a n g e . T h e r e f o r e , such time delays lead to a
shift in phase.The optimum phase shift should not be the same
for all molecules because the relaxation lifetimes involved
are different. However, ethylene fluorescence was observed
from 3 static sample and found to be a maximum at a phase
shift of 90° of the phase sensitive detector used for signal
processing.Figure 32 shows the effect of phase shifting
on the fluorescence signal observed when using filter #3.
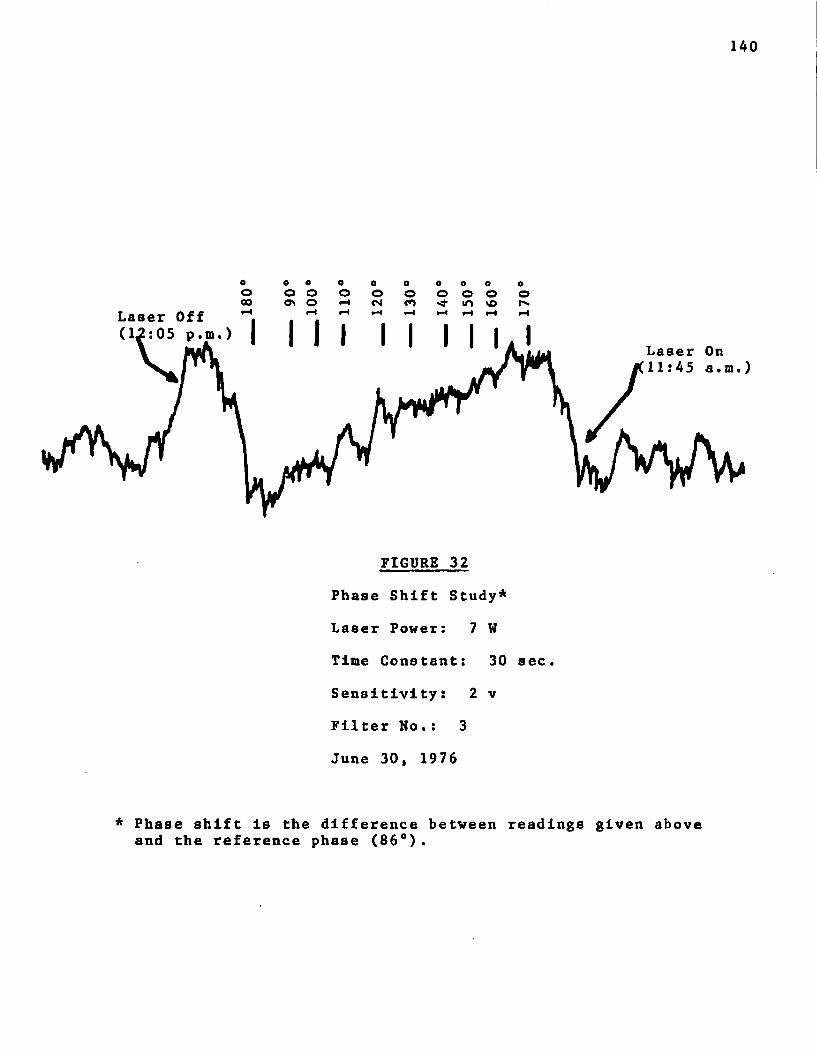
140
o O O O O O O O O 0o o o o o o o o o ooo o x o ^ c M r o < 4 , m v 0 i ^ <Laser Off
Laser On
FIGURE 32
Phase Shift Study*
Laser Power: 7 W
Time Constant: 30 sec.
Sensitivity: 2 vFilter N o .: 3
June 30, 1976
* Phase shift is the difference between readings given above and the reference phase (86°).
141
All laser scatter was eliminated by choosing this filter.
It can be seen that the strongest signals were observed with a phase shift between 76 and 96 degrees. The phase was quickly readjusted to the Initial value in order to regain
the signal Intensity after it decreased to zero. This was
done in order to prove the decrease in the fluorescence
signal observed was due to phase shifting and not a loss of
signal strength due to the sample drifting out of the laser
beam.For remote sensing of the atmosphere, the
phase shift was maintained between 71° and 106°. An optimum
phase shift value was not known prior to signal observation
as the monitored atmosphere was not qualitatively identified.
A number of compounds could have produced the fluorescence;
therefore, the optimum phase shift could not be predicted.
Phase shifting was only one of the techniques
used to distinguish fluorescence from laser scatter. However,
it made possible the use of monitoring fluorescence with
filter #1 (open) and Filter #4 (7.0 - 15.(Ju).
5. Time Constant
The output of the phase sensitive detector in
the lock-in amplifier was into an RC filter. The time con
stant of the filter was determined by the value of the
resistor (R) and the capacitor (C) used. Hence,
Time Constant * RC (2fl)
Thus the higher the resistor and/or capacitor
values, the longer the time constant of the circuit.
142
The time constant was used to dampen signal
fluctuations. The sensitive ir detectors were exposed to tremendous amounts of high background radiation, thus much
signal fluctuation occurred. Proper choice of the circuit
time constant dampened much of this fluctuation while
leaving the system sufficiently sensitive to the change in
signal intensity when the laser was unblocked and fluores
cence observed.
A long time constant was needed when the TGS
detector was used due to its thermal instability and noise
level. The time constant was usually 30 seconds. A
shorter time constant was used when the Hg-Cd-Telluride
detector was employed as it was less noisy and more immune
to thermal fluctuations of the lab environments. A time
constant of 10 seconds was commonly used.
The dampening of the signal fluctuations due
to the background radiation by using large time constants
slowed the response of the detector system. Large time
constants smoothed the wild fluctuations but caused slow
response of the system to signal changes produced by block
ing and unblocking the laser beam.
6. Diurnal Studies
Two diurnal studies were attempted and the
results can be seen in Figure 33. The two monitored periods
were in June with the monitoring parameters of the equipment
much the same. However, June 2 was clear and sunny while
June 6 was overcast. The other differences included a
slight phaBe shift difference used for the two studies.
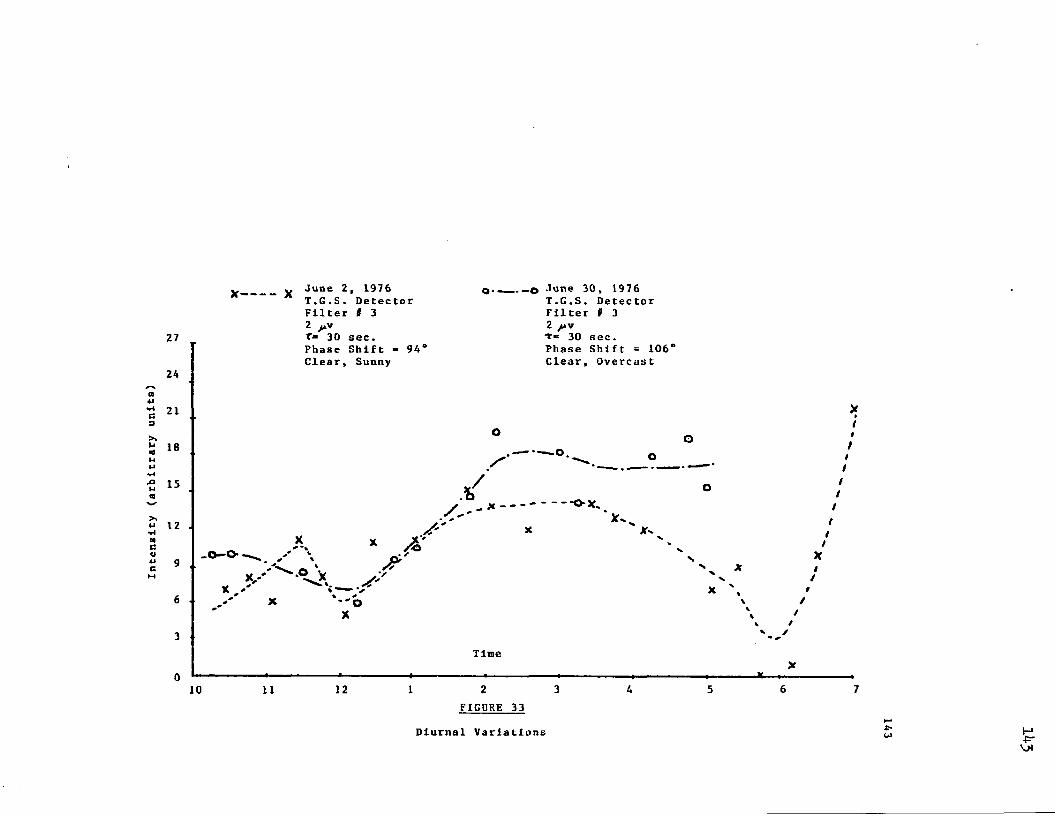
Intensity
(arbitrary
unit
s)
X — — — — X •*une 1376 o -__ o June 30, 1976T.G.S. Detector T.G.S. DetectorFilter # 3 Filter # 32 jiv 2 j a v
27 f* 30 sec. t= 30 sec.10694 Phase Shift
Clear, OvercastPhase Shift Clear, Sunny
21
15
12
Tine
2 3 4 6 712 1 510FIGURE 33
Diurnal Variations
143
At this point it is sufficient to state that
these were the patterns observed for laser induced ir fluores
cence of atmospheric pollutants used as a remote sensing
technique. Although the monitored area was over a car
parking lot (Fig. 18), there will be no attempt to cor
relate the observed data with traffic patterns. In order
for proper correlation of diurnal studies with atmospheric
pollutant sources to be made, much more data is required. Temperature, humidity, wind direction, wind speed and other
meterological data is needed in order to support speculations
based on the present observations.
8• Laser Intracavity Absorption Spectroscopy
In order to utilize the laser Intracavity absorptio
phenomenon as a technique for the study of organic molecular
compounds certain experimental parameters must be considered.
The laser output characteristics and sample effects on the
laser output wavelength and power of the laser output lines
must be evaluated. The number and wavelength of the laser
lines as well as the gain and stability of each line must be
investigated. The number and wavelength of the laser lines
determine the samples which can be studied by the technique.
One or more laser lines must exist in a region which the
sample exhibits vibrational/rotational fine structure of
broad band absorption. If there exists an overlap of a
sample vibrational/rotational line with a laser line, the
laser line must operate near the threshold level. In other
words, the gain of the laser line of interest should be close
145
to unity in order to be sensitive to dilute samples of
the absorber when introduced into the optical cavity of
the laser. However, the gain of the laser line must remain
above unity prior to sample introduction or the line will disappear naturally.
The appearance of laser lines, which are not
normally emitted by the laser, upon the introduction of a
concentrated absorber sample accompanying disappearance of
lines in the normal region of operation is known as laser
moding. The lines which appear must be investigated as to
the number of lines and the wavelengths of the lines.
Interference studies must also be made in order
to determine the validity of the technique for specific
pollutant monitoring in the presence of other compounds.
1. Laser Output Characteristics
a . Laser Gain
The gain of the CO^ laser is dependent
upon the partial pressure of the COj gas as well as the
relative ratios of all three gases used for the laser media:
C02» N 2 , and He. Throughout the intracavity absorption
experiments the relative ratio of the gas mixture ratio was:
C02-'2.4, N2:3.3, and He:9. The pressure of the CO 2 gas in
the flowing system was 2.4 torr.
The gain of the CC>2 laser is also depen
dent upon the temperature of the gas media. The greater
the temperatures, the lower the gain and therefore, the
lower the laser output power. One of the purposes for the
14 6
presence of helium was to utilize its high thermal con
ductivity in order to reduce the gas temperature in the
plasma. Some concern developed over the use of the oxygen
scrubber system as the Influent gas passed through the
heated copper (300°C) before entering the laser plasma.
This effect of the increase in laser gas temperature on
the laser gain was investigated. Table 4 shows the in
tensity of the laser output versus time as the oxygen
scrubber system was turned on.
During the "off" mode the copper traps
were in the gas inlet system but the current through the
resistive heater of the traps was off.
Approximately 5.8 amps were used in order
to heat the scrubbers to around 300°C during the "on" mode.
From Table 4 it can be seen that the
gain of the laser and hence the laser output intensity was
not affected by the heated 0£ scrubbers.
b . Number of Laser Output Lines and theCorresponding Wavelengths
The number of laser lines emitted by the
CO 2 laser was primarily dependent upon the optical arrange
ment of the laser system. The laser output consisted of
only one laser line when the grating was employed. However,
several lines were emitted simultaneously when the gold
coated mirror was employed as the rear optical element.
Therefore, the laser was not tunable and only certain laser
lines were observed of those which were theoretically
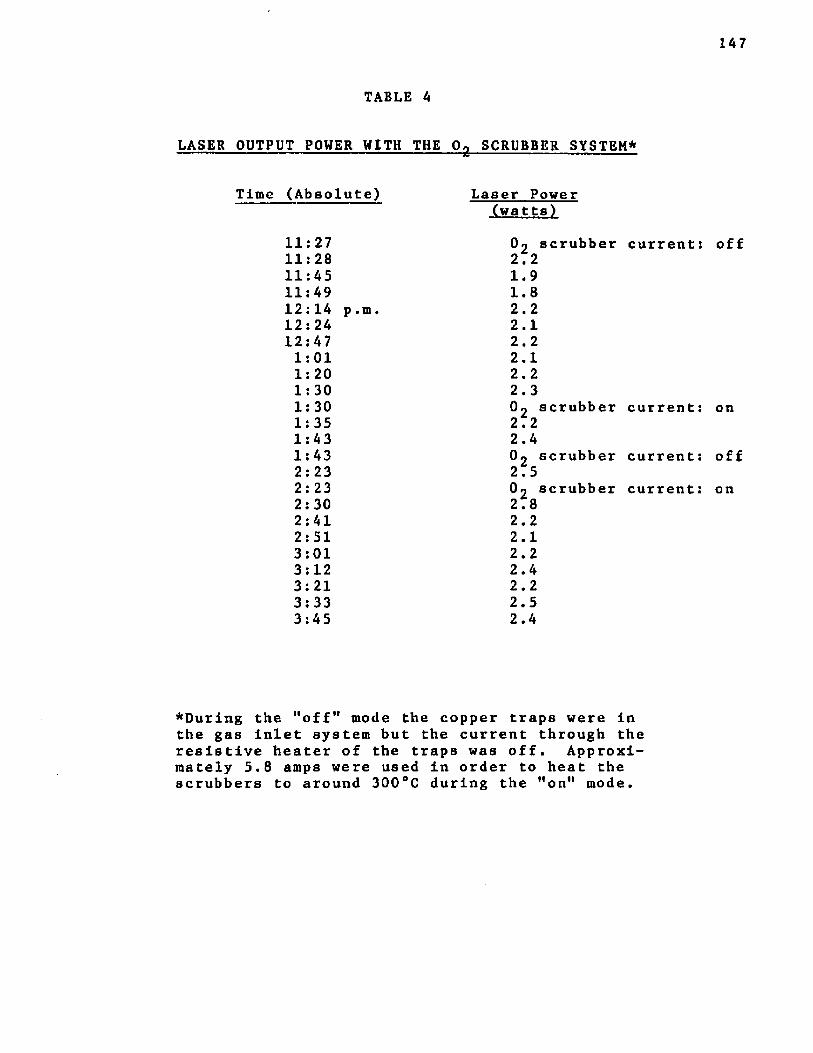
147
TABLE 4
LASER OUTPUT POWER WITH THE 0^ SCRUBBER SYSTEM*
Time (Absolute) Laser Power(watts)
11:27 0 9 scrubber current: off11:28 2 . 211:45 1.911:49 1.812:14 p.m. 2.212:24 2.112:47 2.21:01 2.11:20 2.21:30 2.31:30 0, scrubber current: on1:35 2.21:43 2.41:43 O^ scrubber current: off2:23 2.52:23 O 9 scrubber current: on2:30 2.82:41 2.22:51 2.13:01 2.23:12 2.43:21 2.23:33 2.53:45 2.4
*During the "off" mode the copper traps were in the gas inlet system but the current through the resistive heater of the traps was off. Approximately 5.8 amps were used in order to heat the scrubbers to around 300°C during the "on" mode.
148
possible. Typically, the output of the laser consisted of
the lines listed in Table 5 when the totally reflecting mirror was used.
It is noted that all the lines observed
generally did not appear at one time. The laser was modlng,
thus some lines appeared and disappeared with time. Tables 6
and 7 show the results observed on two different occasions
of multiple scans of the wavelength range in which the laser
normally operated with the totally reflecting mirror. The
gas mixture was: 002^2.4 torr; N 2 :3.3 torr and He;9 torr.
Natural moding of the laser with the totally
reflecting mirror was evident since all of the output lines
did not appear all the time.Figure 34 shows some of the laser output
scans which are tabulated in Table 7. It can be seen that
the Intensity of the lines which appeared varied from scan
to scan.
In order to compare the results obtained
from the study of various gases with the system employing
the totally reflecting mirror, a grating was employed as
the rear optical element of the laser. With the grating the
laser was forced to lase on only one selectable line. The
laser output was scanned as the grating was rotated hori
zontally and the various output lines recorded. Table 8
lists the number of lasing lines produced with the grating
system in each laser envelope.
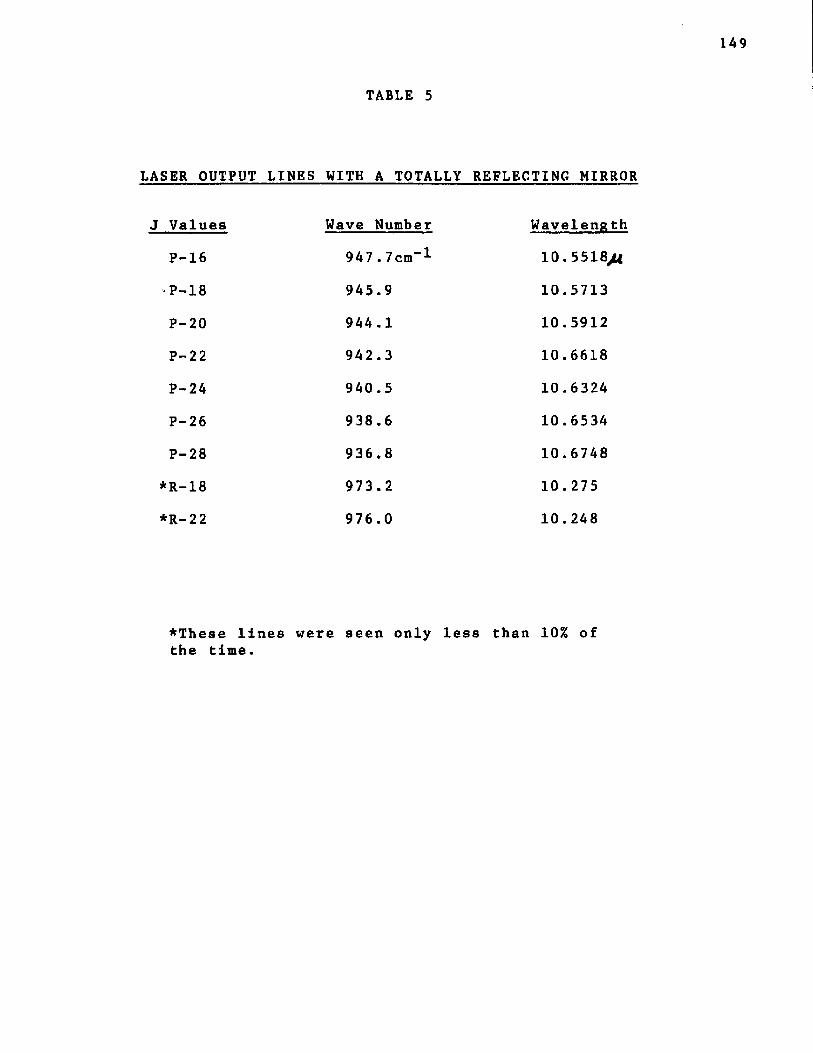
TABLE 5
LASER OUTPUT LINES WITH A TOTALLY REFLECTING MIRROR
J Values Wave Number Wavelength
P-16 947 .7cm"1 10.5518,44
-P-18 945.9 10.5713
P-20 944.1 10.5912
P-22 942.3 10.6618
P-24 940.5 10.6324
P-26 938.6 10.6534
P-28 936.8 10.6748
*R-18 973.2 10.275
*R-2 2 976.0 10.248
*These lines were seen only less than 10% of the time.
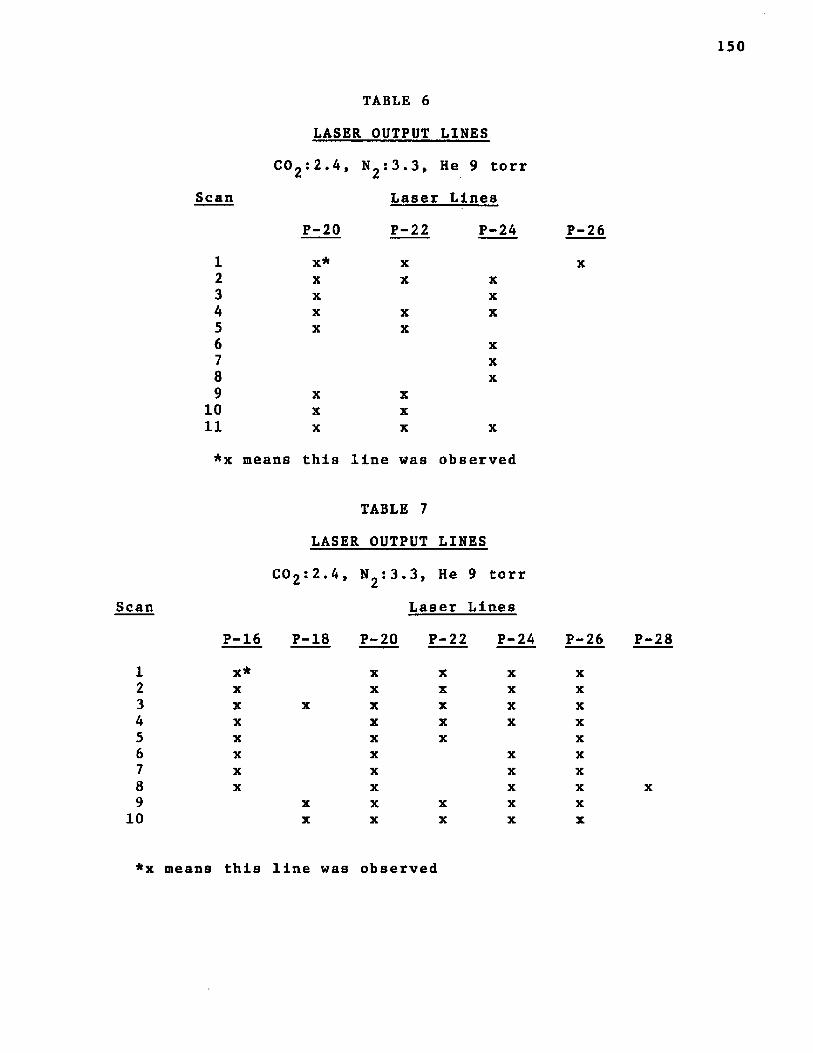
150
TABLE 6
LASER OUTPUT LINES
^ 1 3 . 3 , He 9 torr Scan Laser Lines
P-20 P-22 P-24 P-26
1 X * X X2 x x x3 x x4 x x x5 x x6 x7 x8 x9 x x
10 x x11 x x x
*x means this line was observed
TABLE 7
LASER OUTPUT LINES
C02 :2.4, N2:3.3, He 9 torr
Scan Laser Lines
P-16 P-18 P-20 P-22 P-24 P-26
1 X * X X X X2 x x x x x3 x x x x x x4 x x x x x5 x x x x6 x x x x7 x x x x8 x x x x9 x x x x x
10 x x x x x
P-28
x
*x means this line was observed
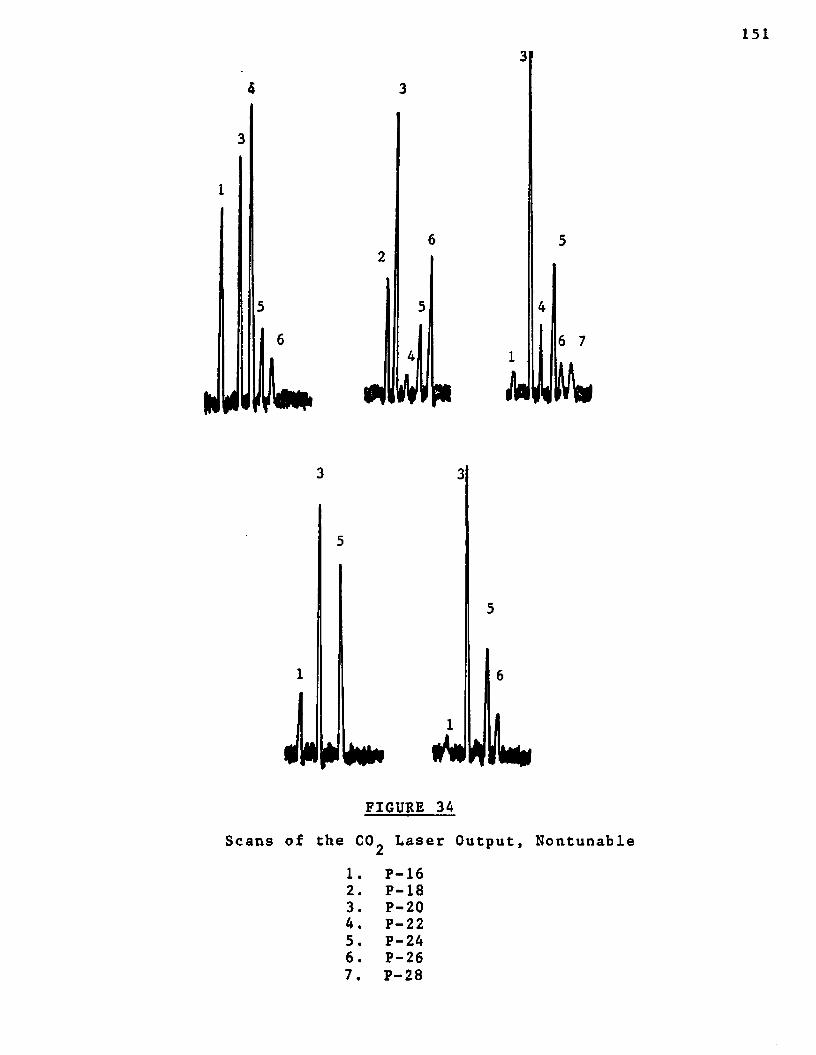
151
*IP»6 7
J.
in FW k»
FIGURE 34
Scans of the CO. Laser Output, Nontunable
1.2 .3.4.5.6. 7.
P - 16 P - 18 P-20 P-22 P-24 P-26 P-28
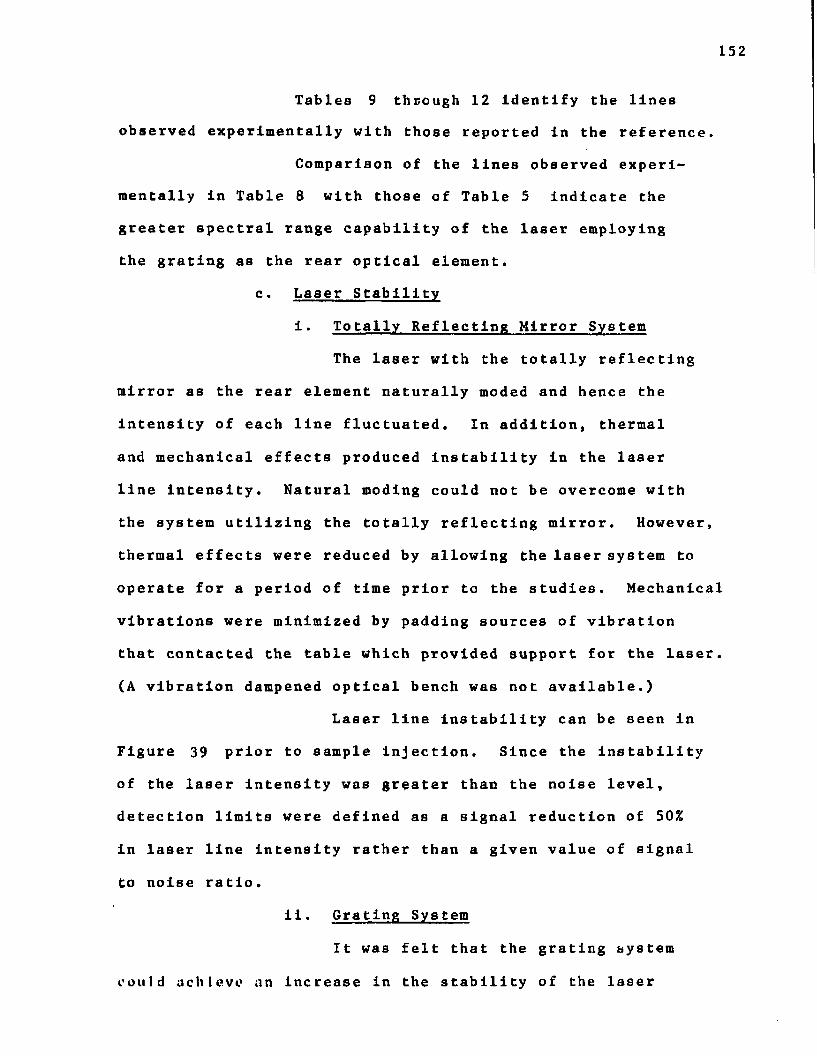
152
Tables 9 through 12 identify the lines observed experimentally with those reported in the reference.
Comparison of the lines observed experimentally in Table 8 with those of Table 5 indicate the
greater spectral range capability of the laser employing
the grating as the rear optical element.
c . Laser Stability
i . Totally Reflecting Mirror System
The laser with the totally reflecting
mirror as the rear element naturally moded and hence the
intensity of each line fluctuated. In addition, thermal
and mechanical effects produced instability in the laser
line intensity. Natural moding could not be overcome with
the system utilizing the totally reflecting mirror. However,
thermal effects were reduced by allowing the laser systern to
operate for a period of time prior to the studies. Mechanical
vibrations were minimized by padding sources of vibration
that contacted the table which provided support for the laser.
(A vibration dampened optical bench was not available.)
Laser line instability can be seen in
Figure 39 prior to sample injection. Since the instability
of the laser intensity was greater than the noise level,
detection limits were defined as a signal reduction of 50%
in laser line intensity rather than a given value of signal
to noise ratio.
i i . Grating System
It was felt that the grating system
could achieve an increase in the stability of the laser
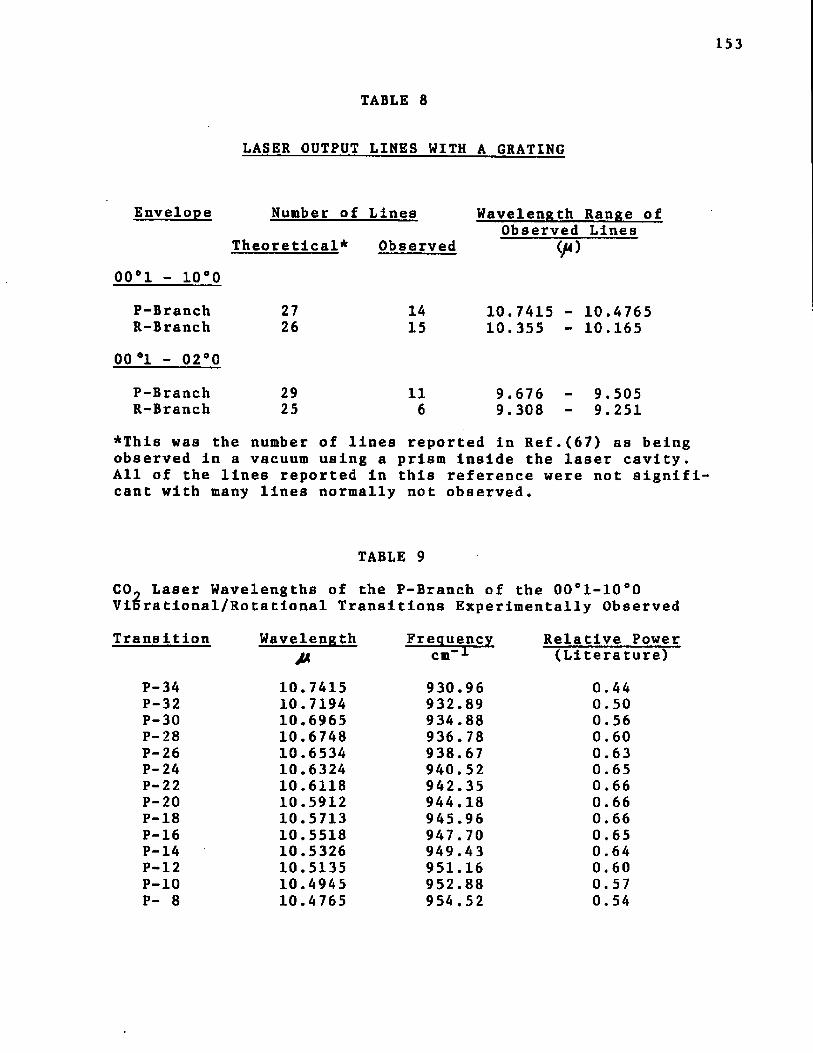
TABLE 8
LASER OUTPUT LINES WITH A GRATING
Envelope
00°1 - 10°0
Number of Lines
Theoretical* Observed
Wavelength Range of Observed Lines
</->
P-BranchR-Branch
2726
1415
10.7415 - 10.4765 10.355 - 10.165
00 °1 - 02°0P-BranchR-Branch
2925
116
9.6769.308
9.5059.251
*This was the number of lines reported in Ref.(67) as being observed in a vacuum using a prism inside the laser cavity. All of the lines reported in this reference were not signifl cant with many lines normally not observed.
TABLE 9
C0„ Laser Wavelengths of the P-Branch of the 00°1-10°0 Vibrational/Rotational Transitions Experimentally Observed
Transition WavelengthM
Frequencycm’1
Relative Powe (Literature)
P-34 10.7415 930.96 0.44P-32 10.7194 932.89 0.50P-30 10.6965 934.88 0.56P- 28 10.6748 936.78 0.60P-26 10.6534 938.67 0.63P-24 10.6324 940.52 0.65P-22 10.6118 942.35 0.66P-20 10.5912 944.18 0.66P-18 10.5713 945.96 0.66P-16 10.5518 947.70 0.65P-14 10.5326 949.43 0.64P-12 10.5135 951.16 0.60P-10 10.4945 952.88 0.57P- 8 10.4765 954.52 0.54
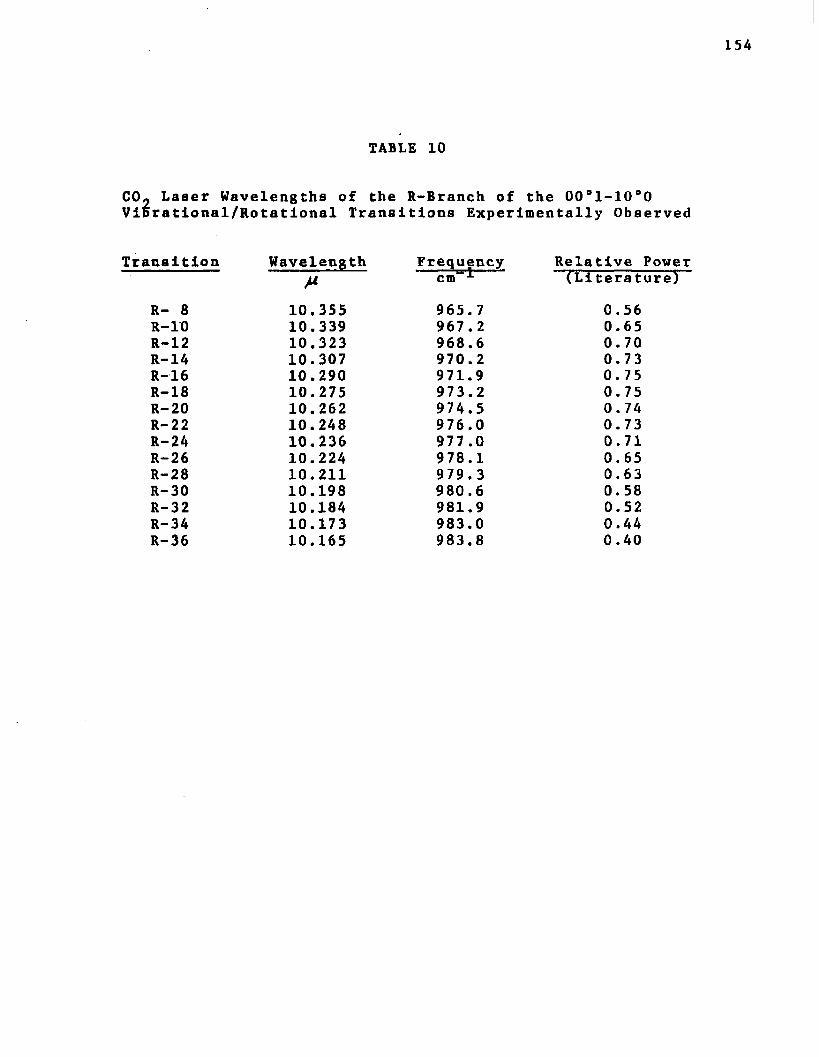
154
TABLE 10
CO» Laser Wavelengths of the R~Branch of the 00°1-10°0 Vibrational/Rotational Transitions Experimentally Observed
Transition WavelengthM
Frequencycm-1
Relative Power (Literature)
R- 8 10.355 965. 7 0.56R-10 10.339 967.2 0.65R-12 10.323 968.6 0.70R-14 10.307 970.2 0.73R-16 10.290 971.9 0.75R-18 10.275 973.2 0.75R-20 10.262 974.5 0.74R-22 10.248 976.0 0.73R-24 10.236 977 .0 0.71R-26 10.224 978.1 0.65R-28 10.211 979.3 0.63R-30 10.198 980.6 0. 58R-32 10.184 981.9 0.52R-34 10.173 983.0 0.44R-36 10.165 983.8 0.40
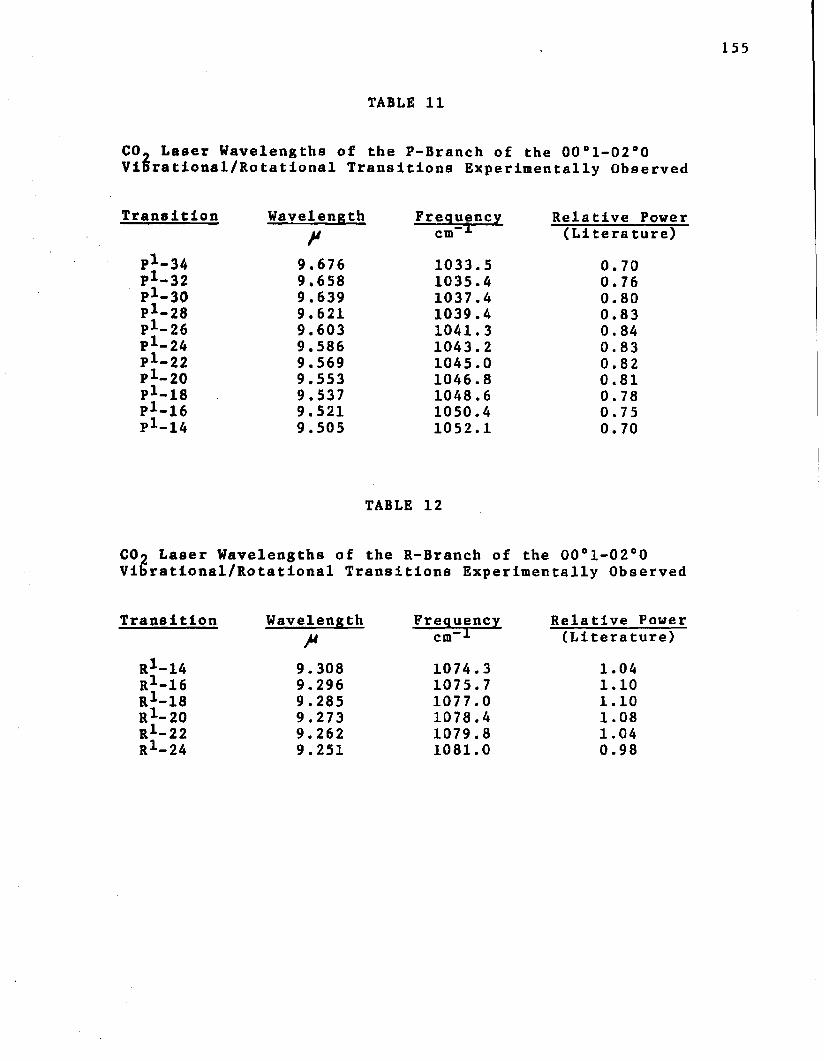
TABLE 11
CO. Laser Wavelengths of the P-Branch of the 00°l-02“0 Vibrational/Rotational Transitions Experimentally Observed
Transition Wavelength Frequencycm"^
P1-34 9.676 1033.5P 1-32 9.658 1035.4P 1-30 9.639 1037.4P1-28 9.621 1039.4P 1-26 9.603 1041.3P a-24 9.586 1043.2P1-22 9.569 1045.0pl-20 9.553 1046.8P 1-18 9.537 1048.6P x-16 9.521 1050.4pl_14 9.505 1052.1
Relative Power (Literature)
0.700.760.800.830.840.830.820.810.780.750.70
TABLE 12
COj Laser Wavelengths of the R-Branch of the 00°l-02°0 Vibrational/Rotational Transitions Experimentally Observed
Transition Wavelength Frequency Relative Powerj4 cm”! (Literature)
R 1-14 9.308 1074.3 1.04R ^ i e 9.296 1075.7 1.10R 1- ^ 9.285 1077.0 1.10R 1-20 9.273 1078.4 1.08R 1-22 9.262 1079.8 1.04R 1-24 9.251 1081.0 0.98
156
line intensity. The laser could no longer mode naturally
aa the grating forced the laser to operate on the desired laser line. The stability of the laser line intensity was
improved as natural moding was restricted. Therefore, less
stringent detection limit criteria was needed. The detection
limit was defined as a reduction in line intenstly of 20%
or more. In Figure 40 it is seen that the laser line inten
sity before injection was much more stable than when the
totally reflecting mirror was used in the rear of the laser
cavity.
2. Sample and Sample Concentration
A series of gases were introduced separately
into the sample cavity and the effect on the wavelength of
the laser line as well as the laser line intensity was
recorded. The compounds were chosen because their ir
absorption spectra overlapped a laser envelope and/or
because they are environmentally important compounds. The
results of these studies are Bhown below,
a . Vinyl Chloride
Vinyl chloride was studied due to the
fact that it exhibited broad band absorption in the region
of operation of both tunable and non-tunable laser systems
employed (Figure 48). In addition, vinyl chloride may pose
a health problem to man. A monitoring system for vinyl
chloride in an industrial manufacturing process would be
most valuable.
157
In the initial part of the experiments, the laser employed a totally reflecting mirror as the rear
optical element. The laser output was scanned to deter
mine the normal output wavelengths and their intensities.
The laser output was then scanned as increasing concentrations
of vinyl chloride in were introduced into the sample cell.
Table 13 shows the appearance of the laser lines as various
concentrations of vinyl chloride samples were Introduced
into the wavetrain of the laser. Nitrogen was flushed
through the cell between injection and a scan of the laser
output was made in order to observe the natural moding of
the laser.
Although the laser moded naturally it was
determined that vinyl chloride selectively decreased the
P-22 line. Figure 35 shows the scans of the laser output
as several sample concentrations were introduced into the
wavetrain of the laser.
All normal laser lines in the 1 0 .6^ region
were completely quenched upon injection of a 1% mixture of
vinyl chloride in N 2 > However, the laser continued to lase.
(This will be discussed in Section 3.)
The F-22 line was shown to be the most
sensitive to absorption by vinyl chloride; therefore, the
intensity of this line was monitored as various concentra
tions of vinyl chloride were introduced into the sample
cell. Figures 36 - 39 show the effect of vinyl chloride
samples on the P-22 laser line Intensity. The detection
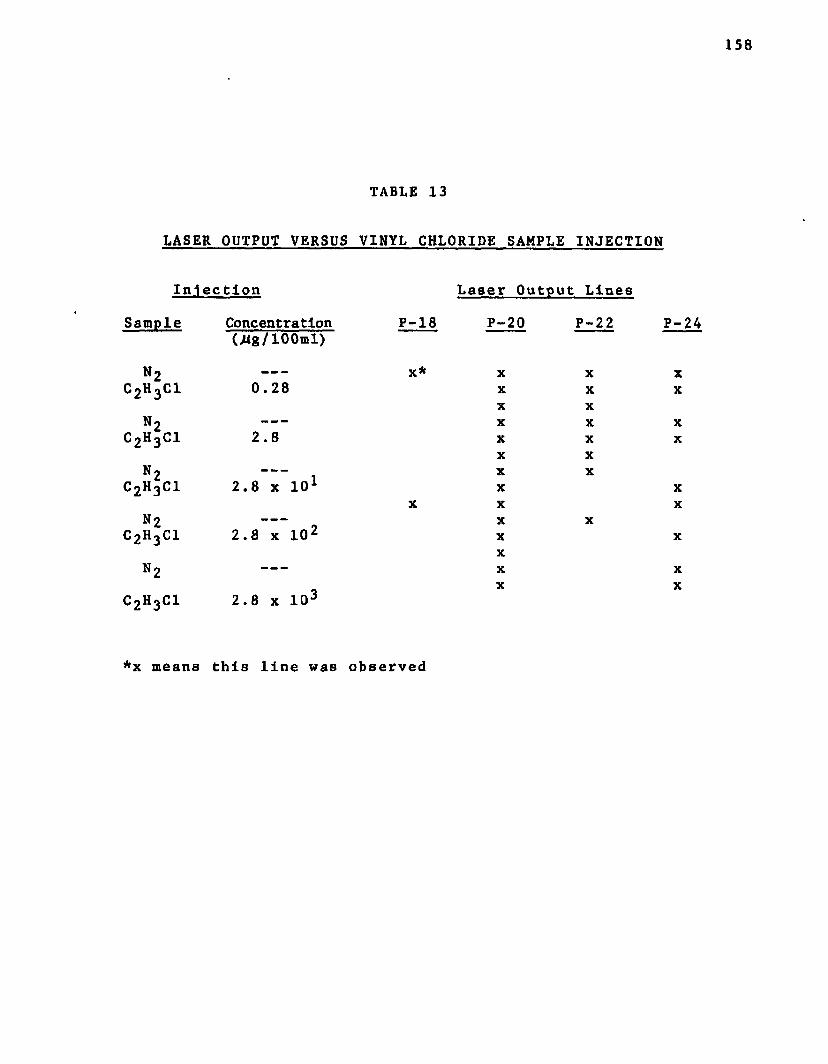
158
TABLE 13
LASER OUTPUT VERSUS VINYL CHLORIDE SAMPLE INJECTION
Injection Laser Output Lines
n 2c 2h 3c i
n 2c 2h 3c i
n 2c 2h 3 c i
n 2c 2h 3ci
No
c 2h 3c i
Concentration P-18 P-20 P-22 p -(jUg/ 1 0 0 m l )
--- X * X X X0.28 X X X
X X--- X X X
2.8 X X XX X
--- X X2.8 x 1 0 1 X X
X X X--- X X
2.8 x 1 0 2 X XX
--- X XX X
2.8 x 10-
*x means this line was observed
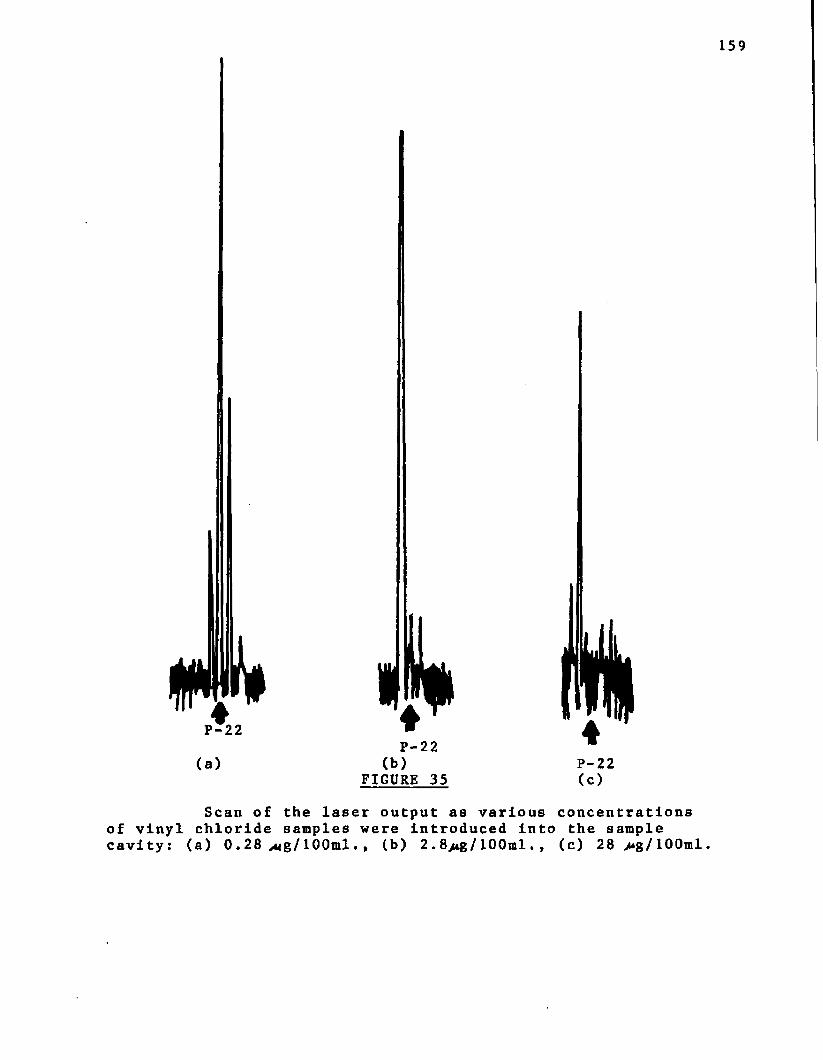
159
P-22
(a)P-22
(b) FIGURE 35
P-22
Scan of the laser output as various concentrations of vinyl chloride samples were Introduced Into the sample cavity: (a) 0. 28 m %! 100ml. , (b) 2 . 8/tg/ 100ml. , (c) 28 >*g/100ml
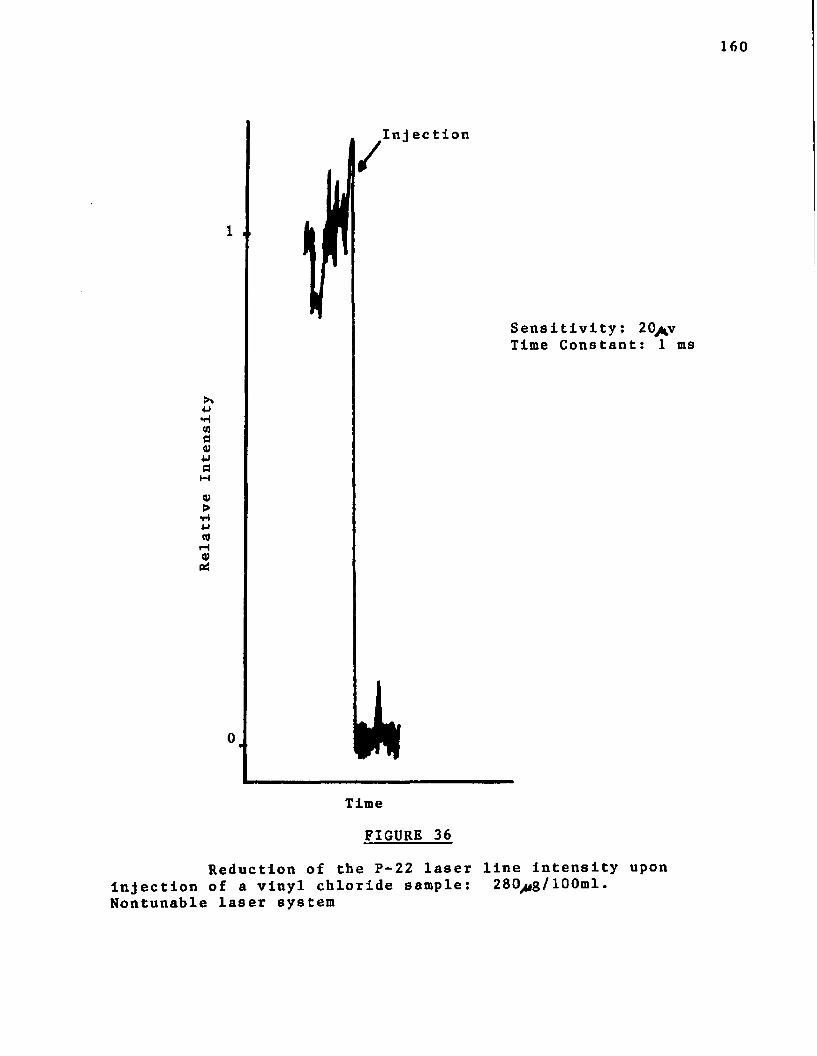
160
Inj ectlon
Sensitivity: 20A v Time Constant: 1 ms
4->•H(0fl<u4Jaa)>
a>Pi
y»Time
FIGURE 36
Reduction of the P-22 laser line intensity upon Injection of a vinyl chloride sample: 280>ug/100ml.Nontunable laser system
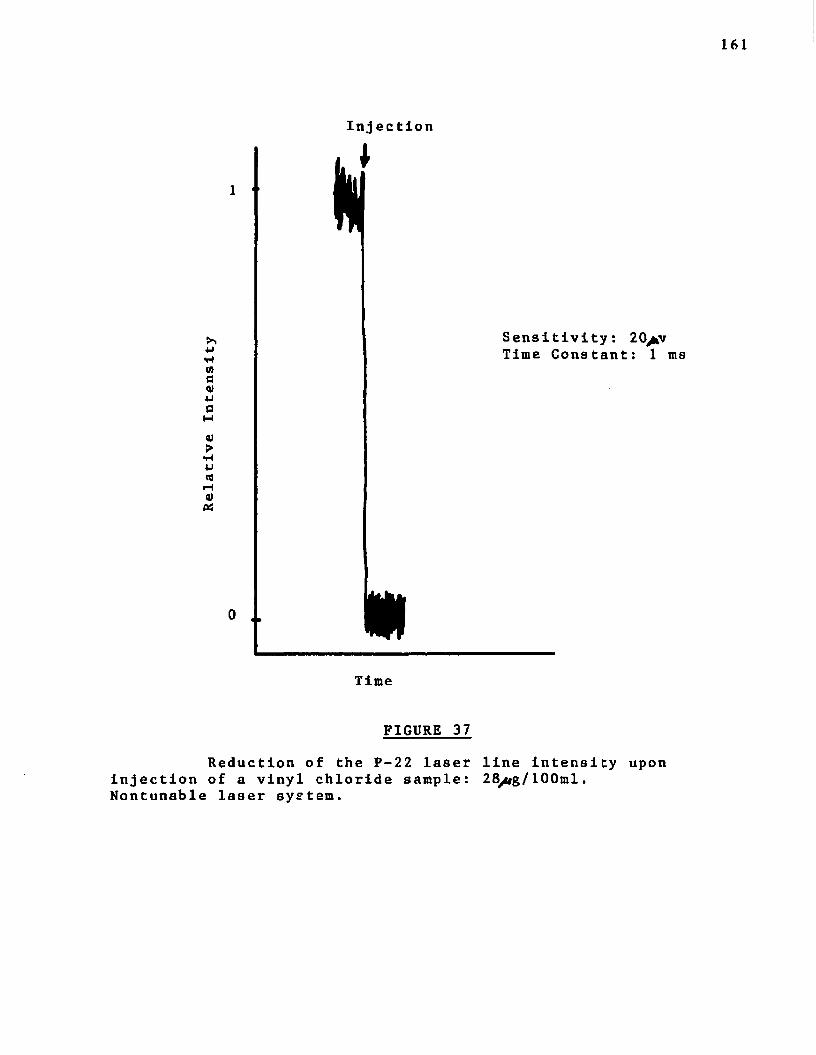
161
Injec tion
mc<ua0)>•H<di—i<ueS
0 ..
Sensitivity: Time Constant
m
Time
FIGURE 37
20>v : 1 ms
Reduction of the P-22 laser line intensity uponinjection of a vinyl chloride sample: 28yiig/ 100ml.Nontunable laser system.
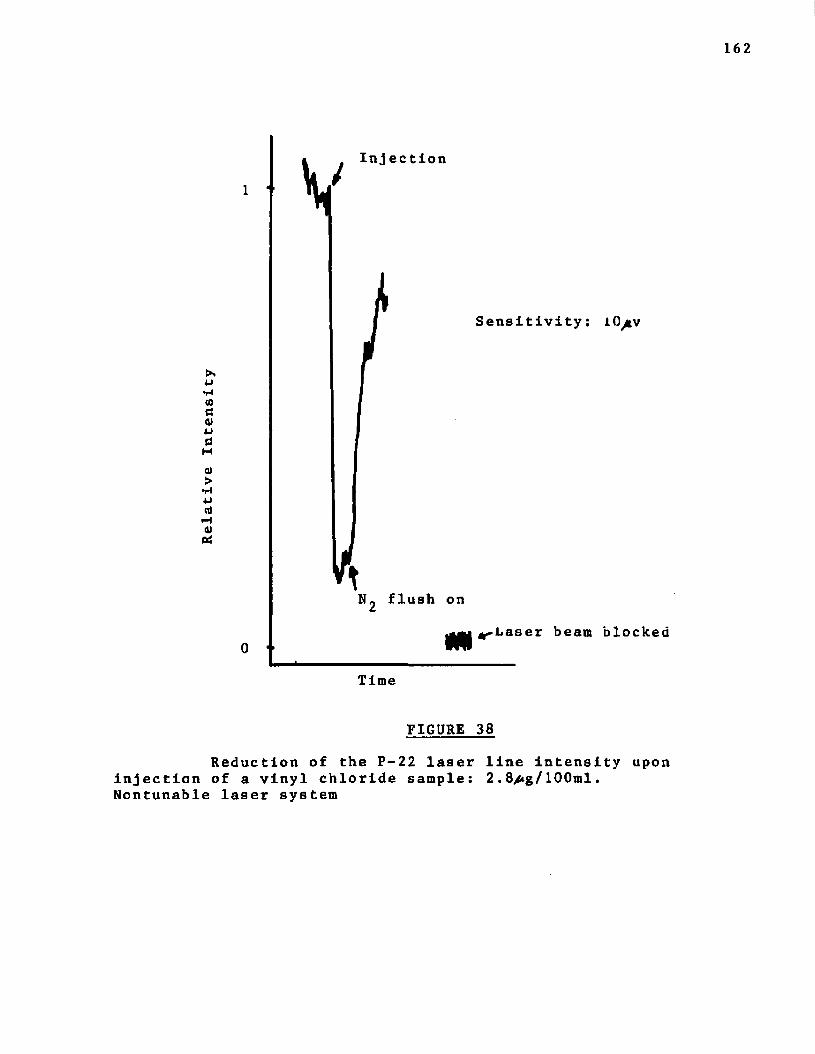
162
to0Q)
01>•H4J0tHa)&
Inj ection1
Sensitivity: lO/iv
on
Laser beam blocked0
Time
FIGURE 38
Reduction of the P-22 laser line intensity uponinjection of a vinyl chloride sample: 2 .8/*g/ 100ml.Nontunable laser system
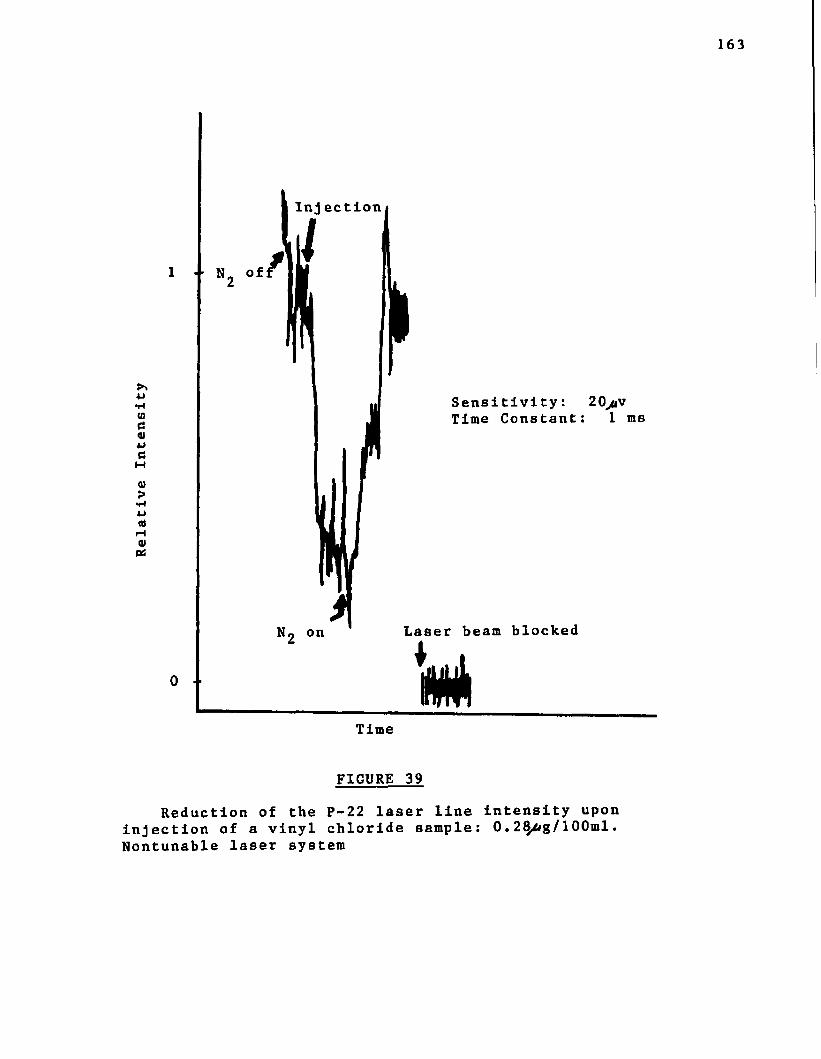
Rela
tive
In
tens
ity
163
1 ■> N„ of
Ini ectlon
0 ■■
Sensitivity: Time Constant
Laser beam blocked
Time
FIGURE 39
20>iv 1 ms
Reduction of the P-22 laser line intensity uponinjection of a vinyl chloride sample: 0 . 1 00ml.Nontunable laser system
164
limit was found to be O.l^ig or 0.2^»g/100ml. This limit
was based on a 50% or greater reduction in the line intensity upon sample Introduction.
For the latter portion of the study, the
grating was employed in the laser system and tuned to the
most sensitive laser line determined for the compound. For
vinyl chloride the laser was tuned to the P-22 line. The
laser intensity of the line was monitored as various con
centrations of vinyl chloride were again Introduced into
the cell. The detection limit was then defined as a
reduction in power of 20% or greater. The type signals
observed with injection of various sample concentrations
can be seen in Figure 40.
For vinyl chloride using the grating system,
a detection limit was found to be lUOjug or 280/«g/100ral.
This was a significant drop in sensitivity compared to the
system using a totally reflecting mirror. It was proposed
that when a grating is used, quenching was brought about by
interfering with wavetrain formation thus preventing lasing
action. However, when a mirror was used, slight inter
ference (absorption) at one wavelength caused moding to
another wavelength rather than total loss of lasing action,
b . Propylene
Propylene was studied as it also exhibited
Strong absorption in the 10.6/4 region (Figure 48). Table 14
shows the laser output lines during introduction of various
propylene samples as well as when only M£ flowed through
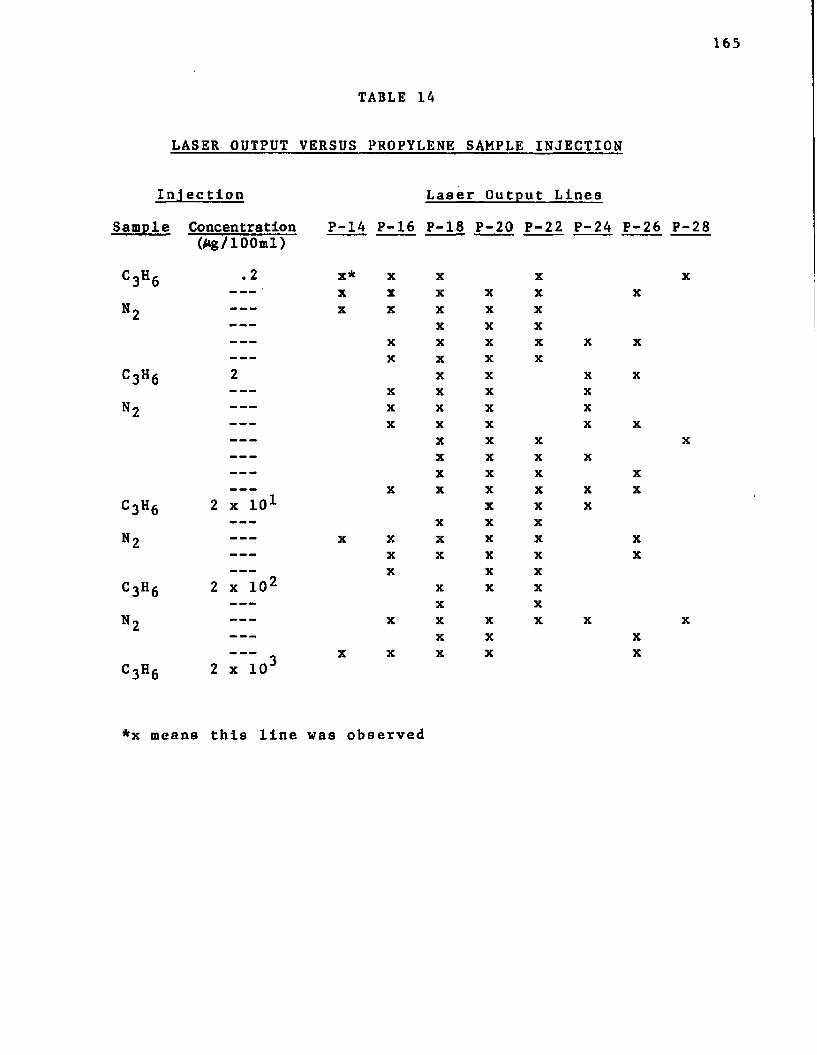
165
TABLE 14
LASER OUTPUT VERSUS PROPYLENE SAMPLE INJECTION
In.1 ection Laser Output Lines
C 3H 6n 2
c 3»6n 2
c 3h6n 2
c 3h 6
n 2
Concentration P-1A P-16 P-18 P-20 P-22 P-24 P-26(Ag/lOOml)
.2 X * X X X---■ X X X X X X--- X X X X X--- X X X--- X X X X X X--- X X X X2 X X X X--- X X X X--- X X X X--- X X X X X--- X X X--- X X X X--- X X X X--- X X X X X X
2 x 101 X X XX X X
--- X X X X X X--- X X X X X--- X X X
2 x 10² X X X--- X X--- X X X X X--- X X X
X X X X XC 3H 6 2 x 10'
*x means this line was observed
x
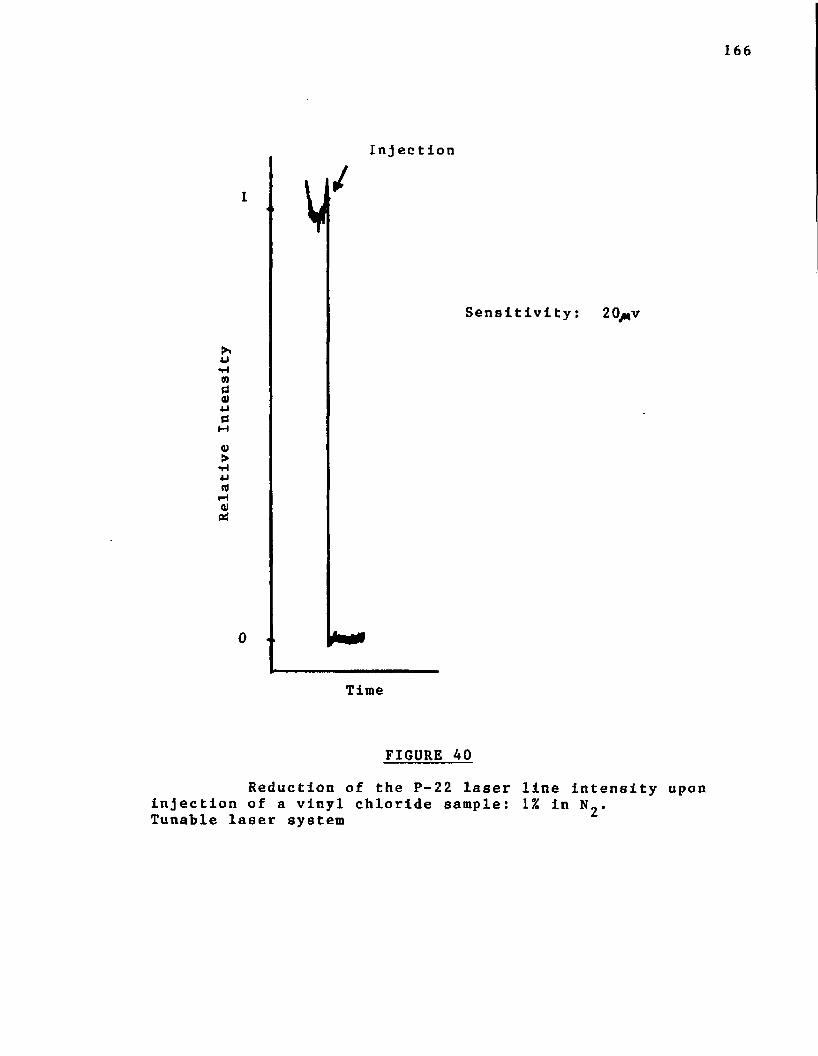
Rela
tive
In
tens
ity
166
In j ec tion
I
0
Time
Sensitivity:
FIGURE 40
20>|V
Reduction of the P-22 laser line intensity uponinjection of a vinyl chloride sample: 1% in N„.Tunable laser system
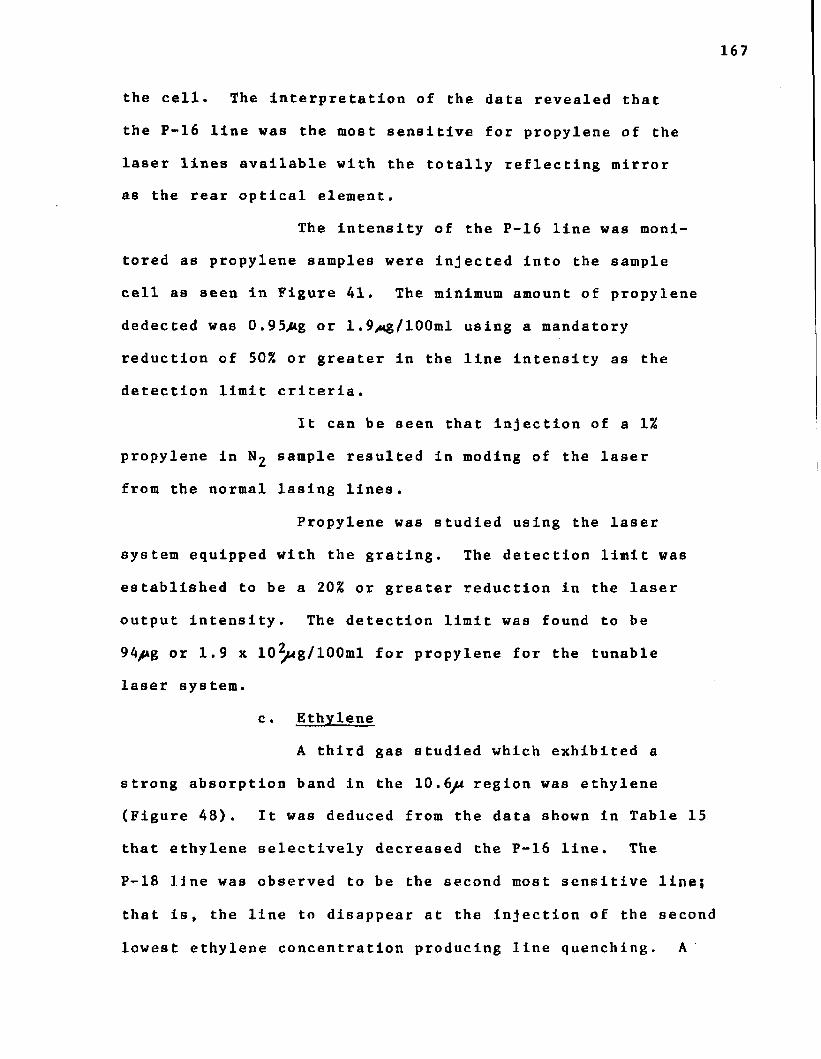
167
the cell. The Interpretation of the data revealed that
the P-16 line was the most sensitive for propylene of the
laser lines available with the totally reflecting mirror as the rear optical element.
The Intensity of the P-16 line was moni
tored as propylene samples were injected Into the sample
cell as seen in Figure 41. The minimum amount of propylene
dedected was 0.95/ig or 1.9xg/100ml using a mandatory
reduction of 50% or greater in the line intensity as the
detection limit criteria.
It can be seen that injection of a 1%
propylene in N 2 sample resulted in moding of the laser
from the normal lasing lines.
Propylene was studied using the laser
system equipped with the grating. The detection limit was
established to be a 20% or greater reduction in the laser
output intensity. The detection limit was found to be
94/tg or 1.9 x 10^ug/100ml for propylene for the tunable
laser system.
c . Ethylene
A third gas studied which exhibited a
strong absorption band in the 10.6^4 region was ethylene
(Figure 48). It was deduced from the data shown in Table 15
that ethylene selectively decreased the P-16 line. The
P-18 line was observed to be the second most sensitive line}
that is, the line to disappear at the injection of the second
lowest ethylene concentration producing line quenching. A
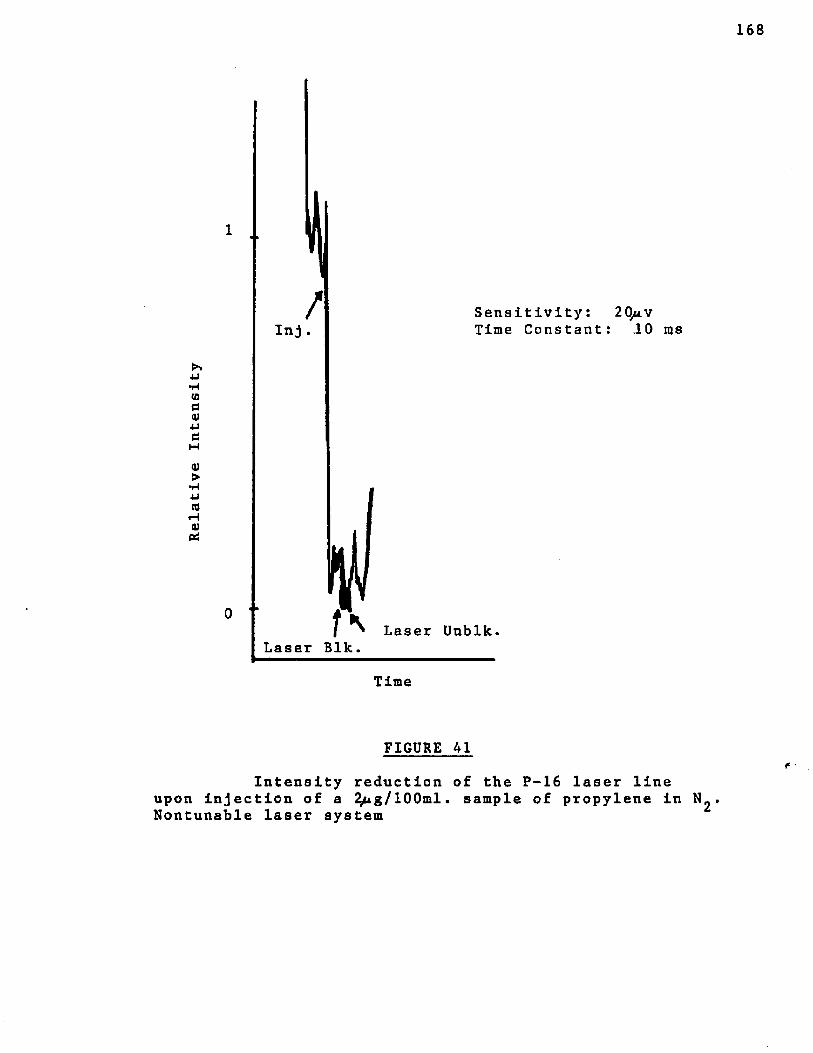
4J■Ha0<u4J0
a)>•H4-1nfiHa) 0A
I
/Inj .Sensitivity: 2Qh.vTime Constant: 10 ms
Laser Unblk.Laser Blk.
Time
FIGURE 41
Intensity reduction of the P-16 laser lineupon injection of a 2/*g/100ml. sample of propylene inNontunable laser system
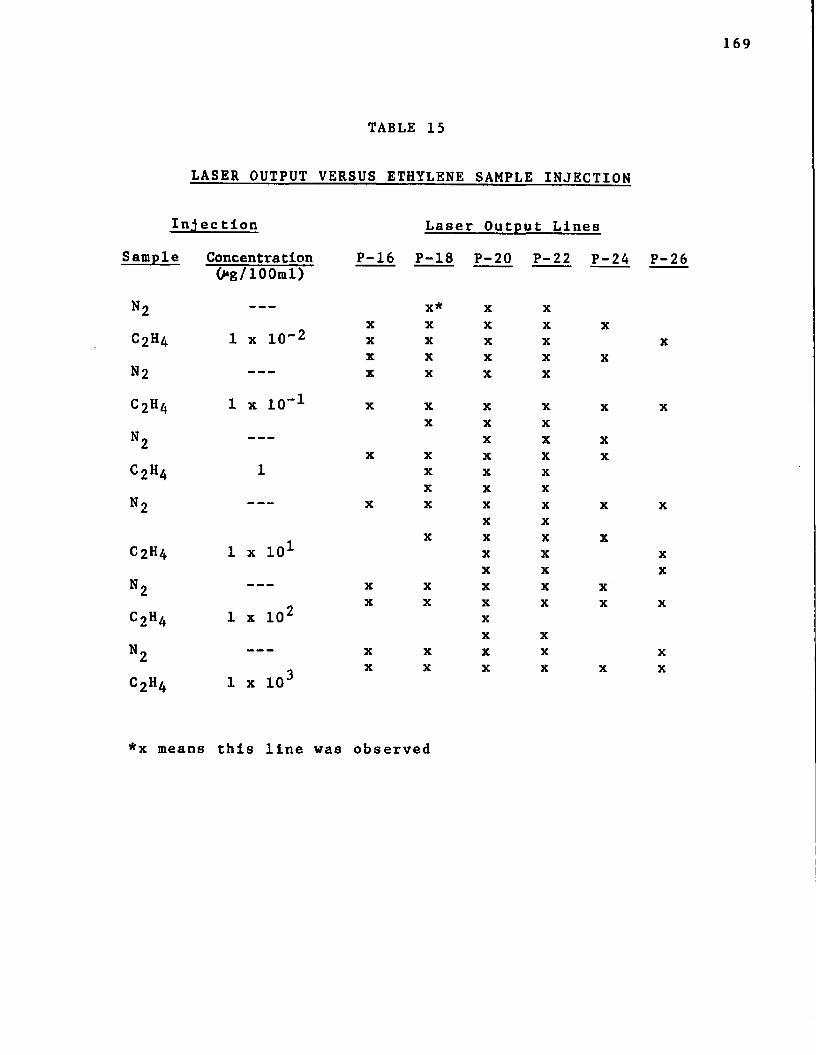
169
TABLE 15
LASER OUTPUT VERSUS ETHYLENE SAMPLE INJECTION
Infection Laser Output LinesSample Concentration P- 16 P-18 P-20 P-22 P- 24 p -
0*g/100ml)
n 2 - - - - - - - X * X XX X X X X
c 2h 4 1 x 10"2 X X X X XX X X X X
n 2 — — — X X X X
C 2H 4 1 x 10'1 X X X X X XX X X
N 2 --- X X XX X X X X
c 2h a 1 X X XX X X
n 2 --- X X X X X XX X
X X X Xc 2h 4 1 x 101 X X X
X X Xn 2 --- X X X X X
r> X X X X X Xc 2h 4 1 x 10l X
X X
N 2 --- X X X X XX X X X X X
C 2H4 1 x 10-
*x means this line was observed
1% ethylene In sample also quenched all normal lasing
lines producing moding to other CO^ laser envelopes. (See Section 3.)
Figure 42 shows the effect of one of the
various ethylene samples on the P-16 line. The detection
limits calculated for these lines were 0.6Q#.g or 1.3^tg/100ml
and 60/tg or 130/jg/ 100ml for the P-16 and P-18 lines,
respec tively.
The detection limit calculation for ethylen
for the P-16 laser line employing the grating in the system2was 63/tg or 1.3 x 10 yug/100m. Figure 43 shows a signal for
the injection of an ethylene sample using the grating system,
d . Ethyl Chloride
A 1% ethyl chloride in ^ mixture did not
quench the normal lasing lines as listed in Table 5, nor
force the appearance of moded lines. Thus, ethyl chloride
seemed to be transparent to the lasing lines produced with
the totally reflecting mirror as the rear optical element.
However, when the grating system was used in the studies, it
was found that ethyl chloride exhibited absorption effects
upon the R-22 and R-36 lines. These lines were chosen as
ethyl chloride exhibited broad band absorption (Figure 48)
in the region of the laser output when the grating was used.
It was not possible to scan the laser output as before in
order to observe the more sensitive line. This was due to
the fact that the laser only operated on one line, simul
taneously, with the grating instead of the three or more line
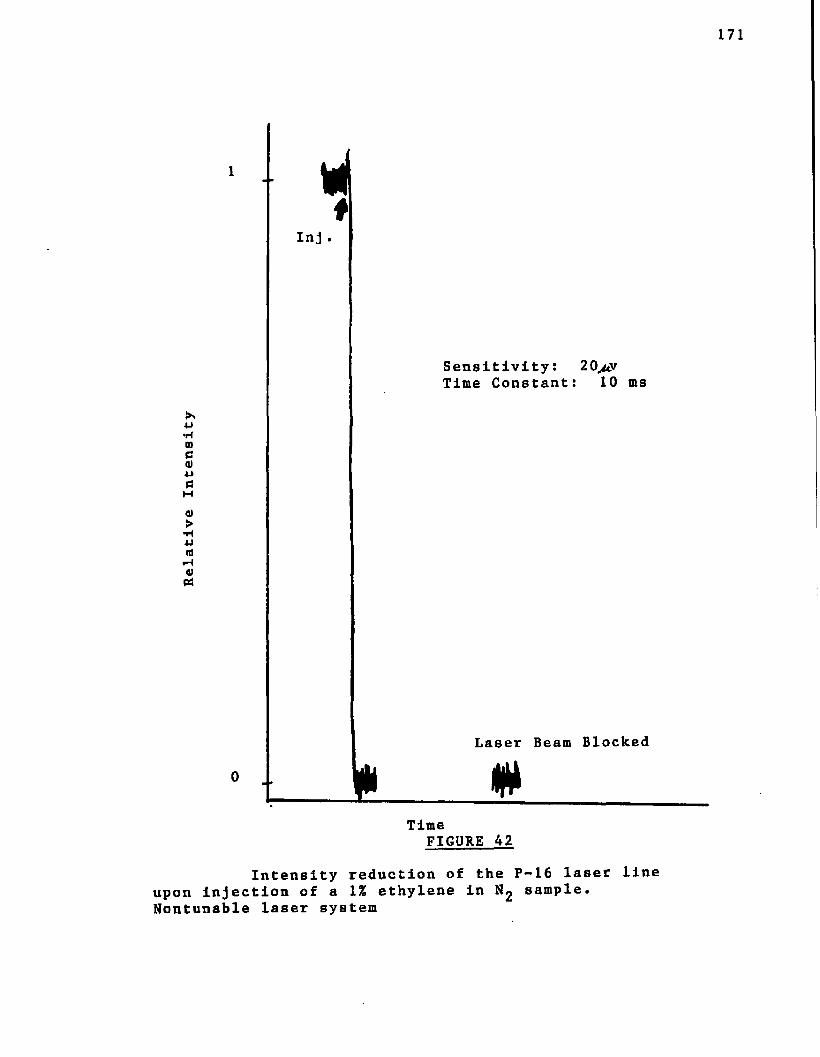
Rela
tive
In
tens
ity
171
H i
Inj
Sensitivity: 20,a vTime Constant: 10 ms
Laser Beam Blocked
00
TimeFIGURE 42
Intensity reduction of the P-16 laser line upon injection of a 1% ethylene in N 2 sample. Nontunable laser system
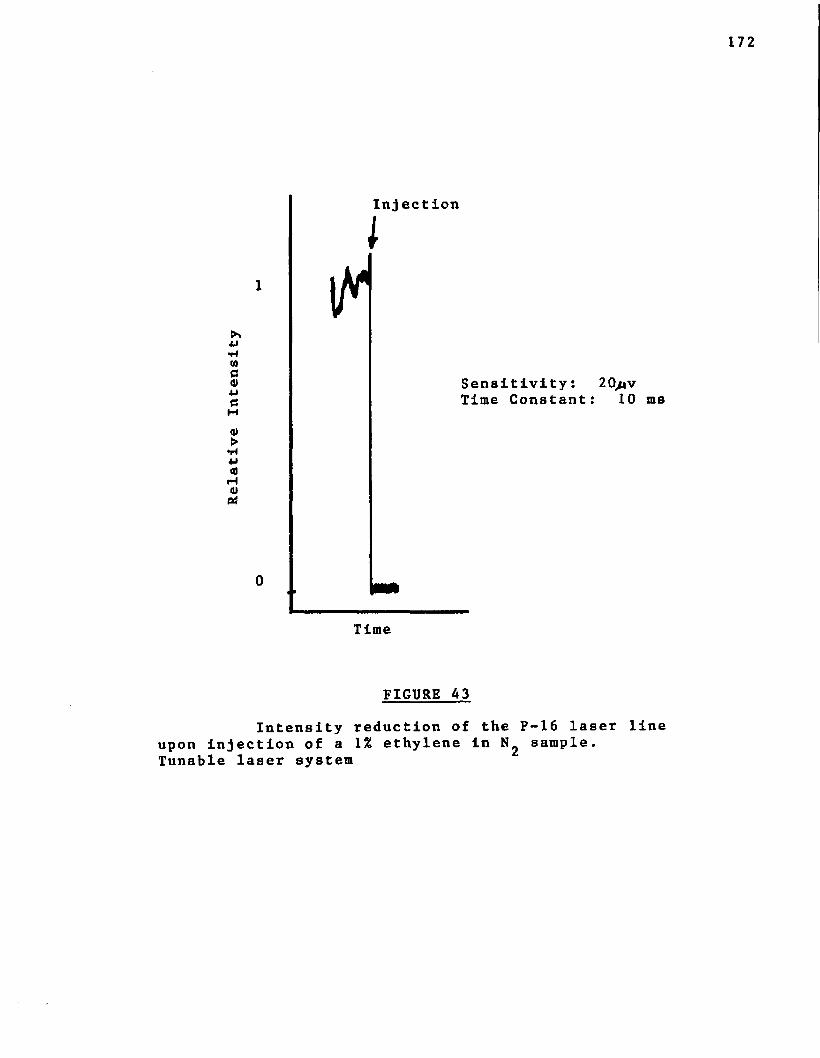
►»4J■H(0ao>
41>(0Ha>PS
Inj ection
Sensitivity: Time Constant
0 PHITime
10
FIGURE A3
ms
Intensity reduction of the P-16 laser line upon injection of a 1% ethylene in sample.Tunable laser system
173
with the mirror. Detection limits found for ethyl chloride
were: 2.6^ig or 2.^i*g/100ml and 0.26^ig or 0.29^g/100ml for
the R-22 and R-36 lines, respectively,
e . 1-Butene
A fourth gas studied which exhibited broad
band absorption in the 10.hj* region was 1-butene. Several
attempts were made to determine the most sensitive line for
1-butene. However, 1-butene did not appear to exhibit selec
tive laser line absorption as deduced from the data presented in Table 16.
It was observed that injection of a 1%
1-butene in N sample caused the laser to mode from the lines2
on which it normally operated.
3. Moded Laser Lines
The shifting of the lines, emitted by the
laser, to other lines is known as moding. Vinyl chloride,
propylene, ethylene and 1-butene caused the laser to mode
to a different set of lines when the sample concentrations
were quite high. Introduction of a 1% vinyl chloride in
Nj mixture produced several moded lines normally not seen
with the laser system employing the totally reflecting mirror.
The moded lines are shown in Table 17.
The laser was observed to mode to a number of
lines upon injection of 1% propylene in N^« As in the case
of vinyl chloride, all of the lines did not appear simultane
ously as can be seen in Table 18.
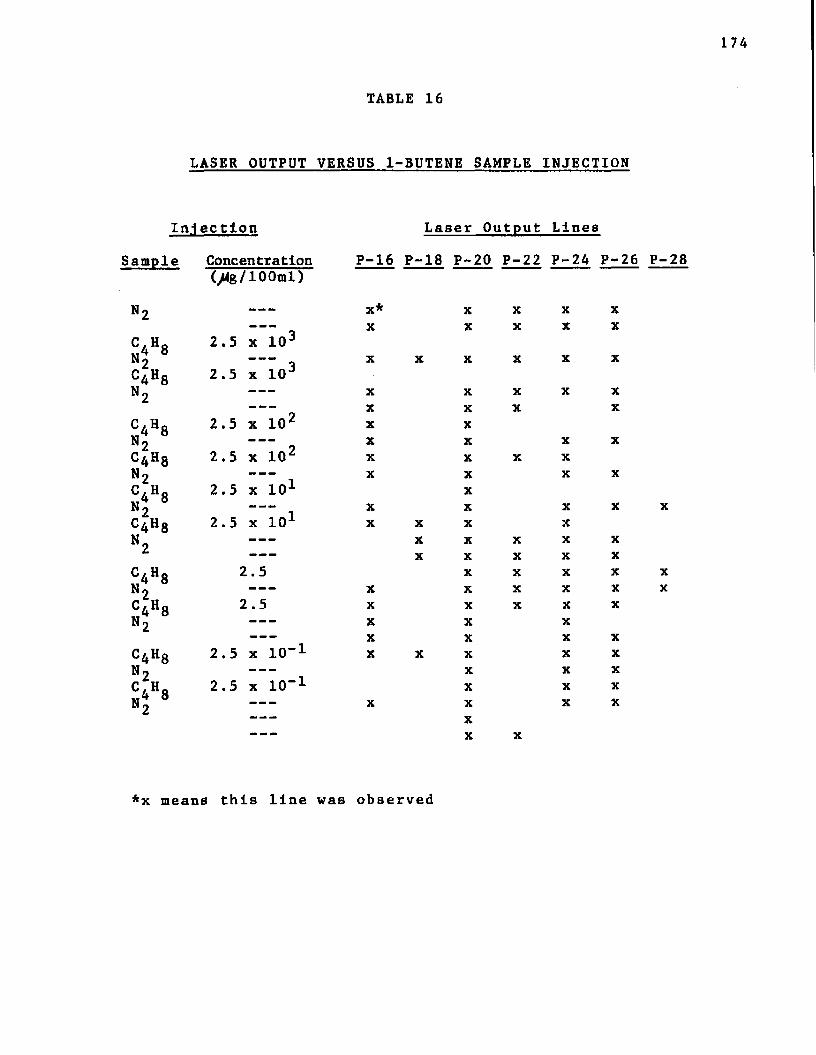
174
TABLE 16
LASER OUTPUT VERSUS 1-BUTENE SAMPLE INJECTION
Iniectlon Laser Output Lines
Sample Concentration P-16 P-18 P-20 P-22 P-24 P-26(/<g/100ml)
X * X X X X--- X X X X X
2.5 x 10³X X X X X X
2.5 x 10J--- x X X X X--- X X X X
2 . 5 x 10² X X--- X X X X
2.5 x 10² X X X X--- X X X X
2.5 x 101 X--- X X X X
2.5 x 101 X X X X--- X X X X X--- X X X X X
2.5 X X X X--- X X X X X
2.5 X X X X X--- X X X--- X X X X
2.5 x 10"1 X X X X X--- X X X
2.5 x 10"1 X X X--- X X X X--- X--- X X
n 2
m 4 8 2
c 4h 8 n 2
C4H 8n 2c 4h 8 n 2C4H 8 N 2c 4h 8 N 2C^Hg 2.5 x x x x xN 2 x x x x x x
c 4h 8 n 2<4*8 2
*x means this line was observed
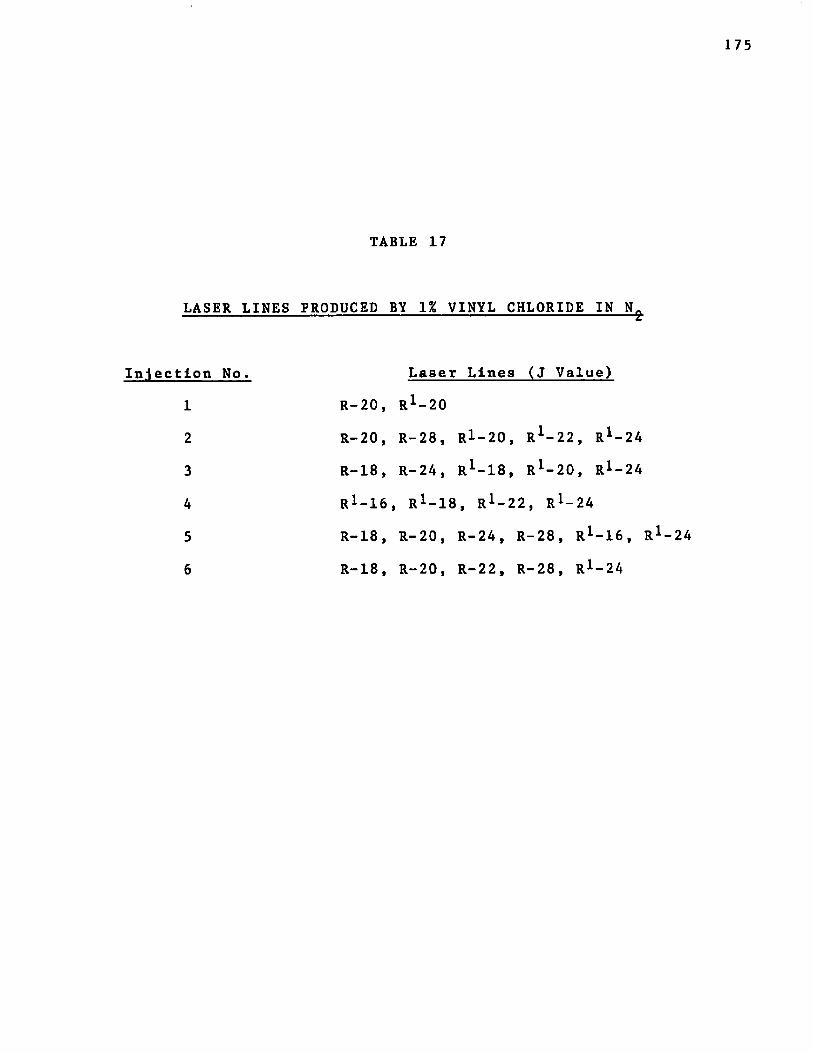
175
TABLE 17
LASER LINES PRODUCED BY 1% VINYL CHLORIDE IN N„_ _ _ _ _ _ — -------------------------------------------------------g.
Injection No. Laser Lines (J Value)
1 R - 2 0 , R 1-20
2 R-20, R-28, Rl-20, R 1-22, R 1-24
3 R-18, R - 2 4 , R 1- 1 8 , R 1-20, R*-24
4 r !-16, R 1- ^ , R 1- 22, R 1-24
5 R-18, R-20, R-24, R-28, R 1- ^ , R X-24
6 R-18, R-20, R-22, R-28, r !-24
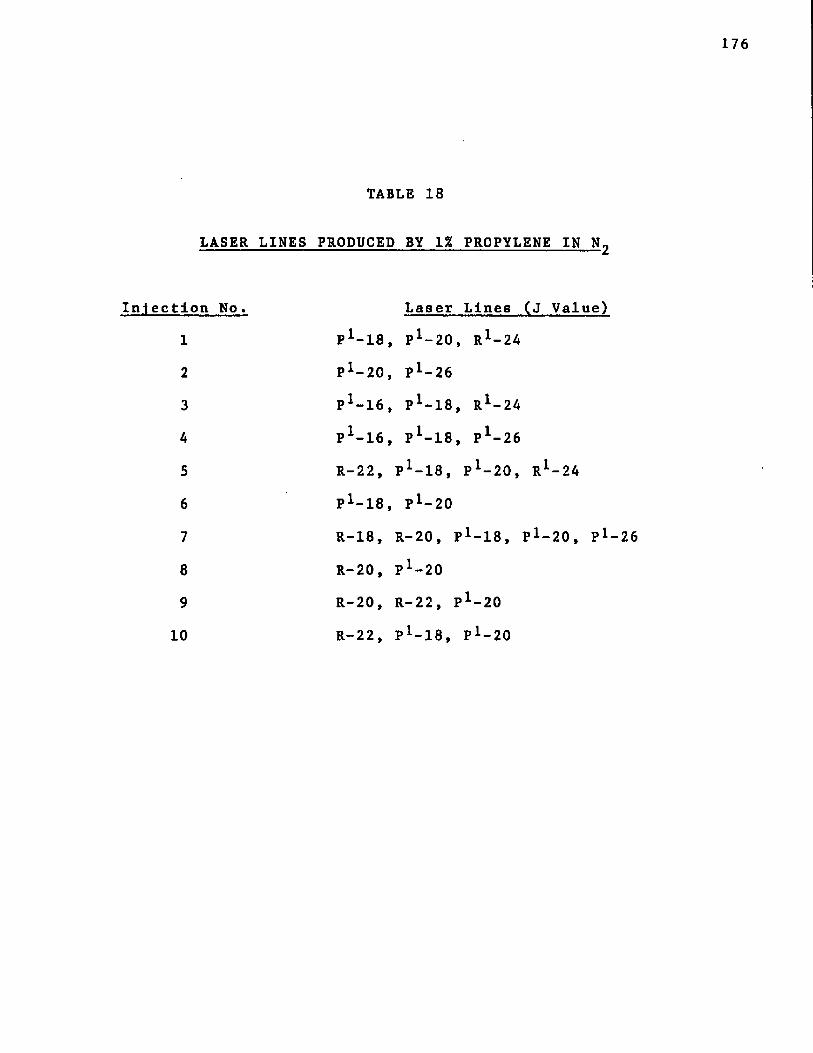
176
TABLE 18
LASER LINES PRODUCED BY 1% PROPYLENE IN N 2
Injection No. Laser Lines (J Value)
1 P 1-18, P*-20, R*-24
2 P*-20, P 1-26
3 P*-16, P*-18, R l-24
4 P 1-16, P*-18, P*-26
5 R-22, P 1- 1 8 , P *-20, R*-24
6 P 1-18, P *-20
7 R-18, R-20, P*-18, P 1-20, P 1-26
8 R-20, P*~20
9 R-20, R-22, P*-20
10 R-22, P*-18, P *-20
177
The laser moded to various lines upon Injection
of 1% mixture of ethylene In Various Injections of the
1% mixture produced the appearance of the lines shown In
Table 19.Injection of a sample of 1% ethyl chloride In
N 2 mixture did not cause the laser to mode.
The lines to which the laser moded upon injection
of a mixture of 1% 1-butene in are shown in Table 20.
4. Interferences
In order for intracavity absorption to be useful
in the analysis of a specific compound, for instance, vinyl
chloride, it is necessary to Investigate possible inter
ferences. A study was made to determine the effect of a
number of compounds on the P-22 laser line. The P-22 line
had been determined to be the most sensitive laser line for
the detection of vinyl chloride. The compounds studied as
possible interferents were: propylene, ethylene, ethyl
chloride, 1-butene, methane, acetone, ethyl acetate and
benzene. The interference study was conducted using the
laser with the totally reflecting mirror as this was a
more sensitive system than the one employing the grating.
The P-22 laser line intensity response to the injection
of some of the above compounds can be seen in Figures 44
through 46. The results of the study are shown in
Table 21 which indicated the levels at which the various
compounds affected the P-22 laser line intensity.
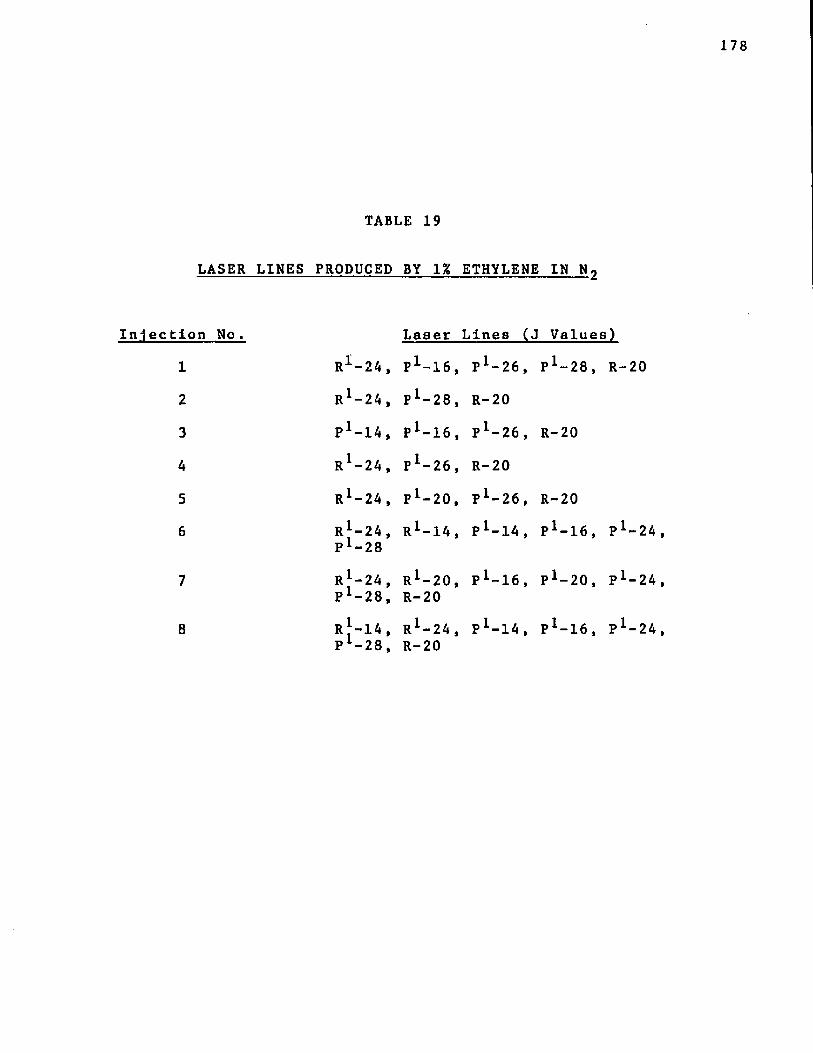
178
TABLE 19
LASER LINES PRODUCED BY 1% ETHYLENE IN N o
Injection No. Laser Lines (J Values)
1 R1-24, P^’-ie, P 1-26, P 1-28, R-20
2 R -24, P 1-28, R-20
3 P -1A, P 1-16, P 1-26 , R-20
4 R -24, P 1-26, R-20
5 R -24, P 1- 2 0 , P 1- 2 6 , R-20
6 R -24, R ^ U , P *-14, P 1- 1 6 , P 1-24,P -28
7 R -24 , R 1- 2 0 , p*-i6, P 1-20, P *-24,P -28, R-20
8 R -14, R 1- 2 4 , P*-14 , P 1- ^ , P 1-24,P -28, R-20
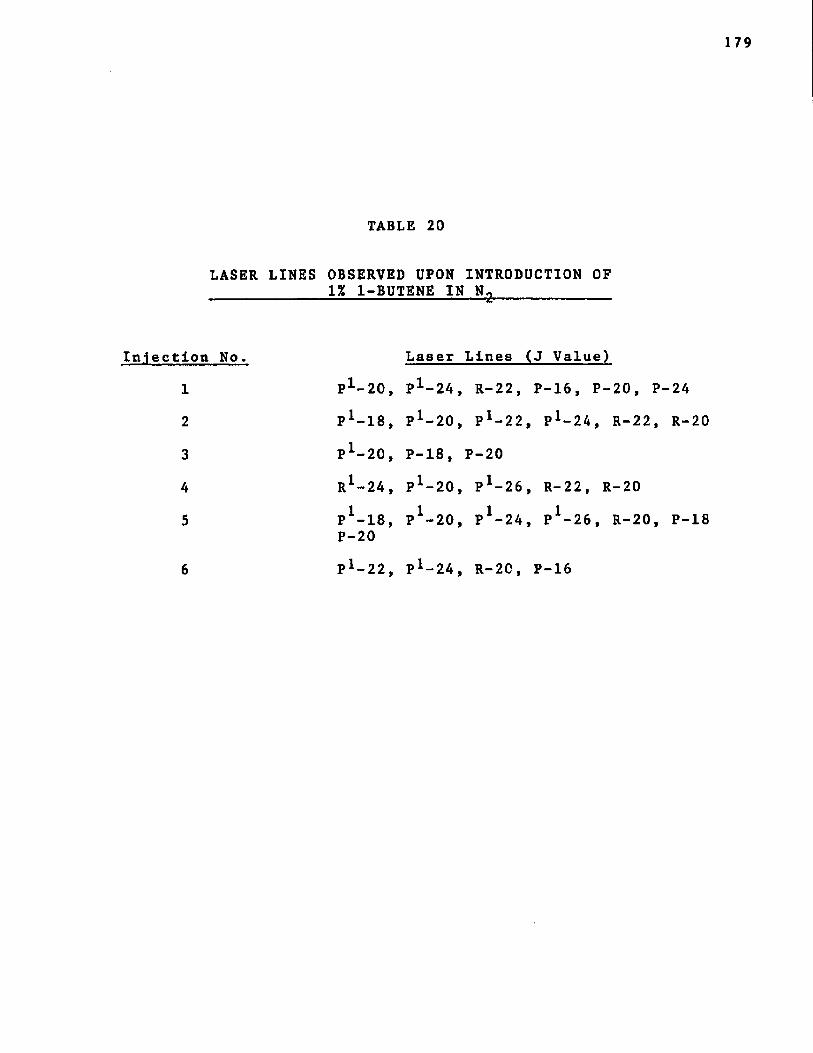
179
TABLE 20
LASER LINES OBSERVED UPON INTRODUCTION OF 1% 1-BUTENE IN N„ ..
Injection No. Laser Lines (J Value)
1 P 1- 20, P 1-24, R-22, P-16, P-20, P-24
2 P 1- 1 8 , P 1- 2 0 , P 1-22, P X- 2 4 , R-22, R-20
3 P 1- 2 0 , P-18 , P-20
4 R 1-24, P X-20, P 1-26, R-22, R-20
5 P 1- ^ , P 1- 2 0 , P 1-24, P 1-26, R-20, P-18P-20
6 P l- 2 2 , P 1-24, R-20, P-16
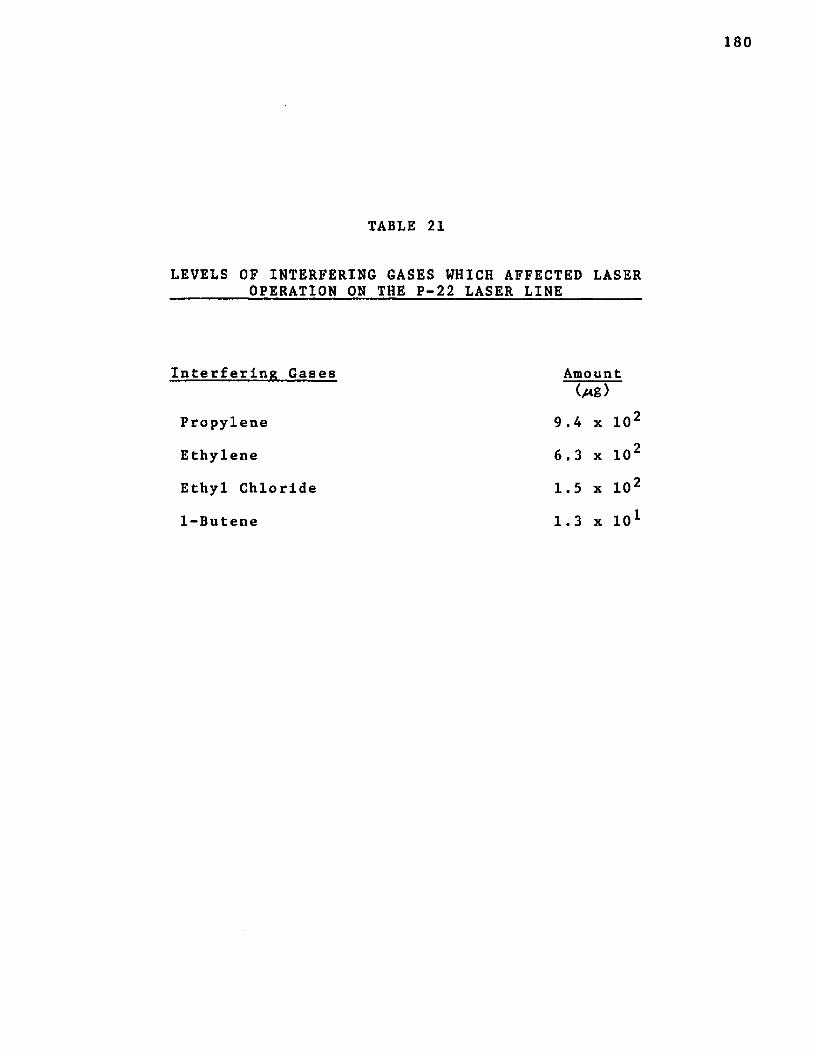
TABLE 21
LEVELS OF INTERFERING GASES WHICH AFFECTED LASER __________OPERATION ON THE P-22 LASER LINE
Interfering Gases AmountU g >
Propylene 9.4 x 10²
Ethylene 6.3 x 10²
Ethyl Chloride 1.5 x 10²
1-Butene 1.3 x 1 0 1
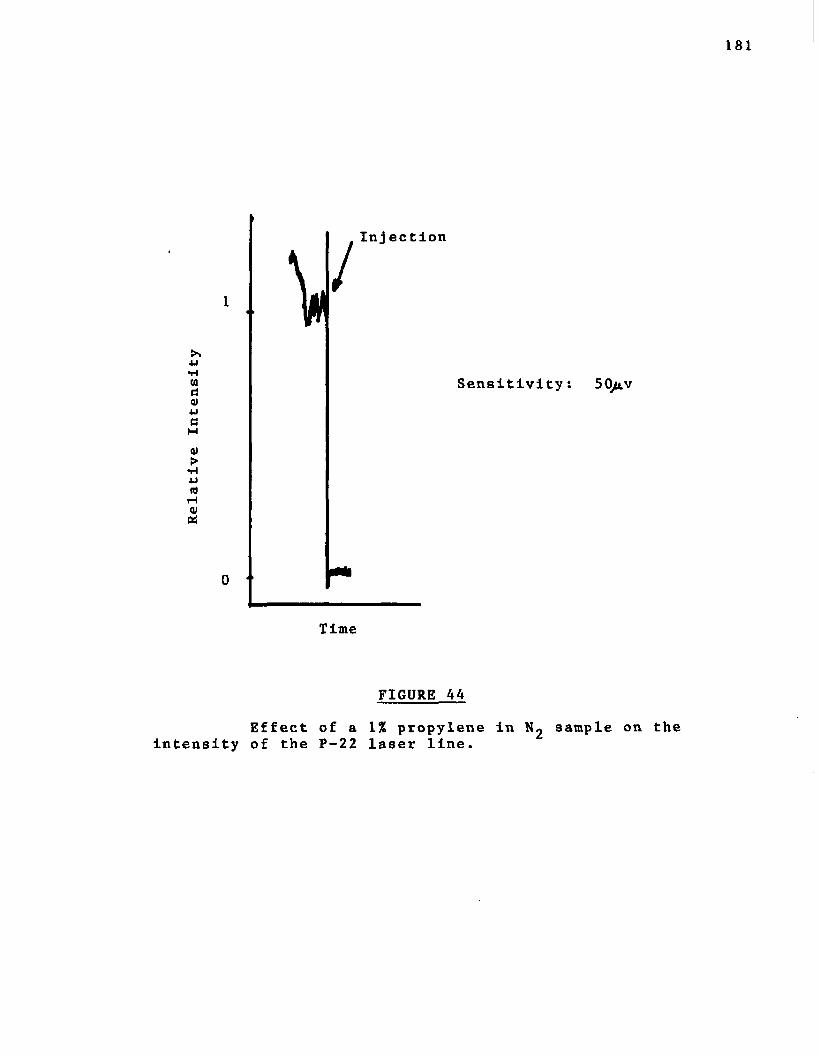
181
01ti0)4Ja
01>•H4J(0rH01Pi
Inj ection
1
0
Time
Sensitivity: 50j*.v
FIGURE 44
Effect of a 1% propylene in N 2 sample on the intensity of the P-22 laser line.
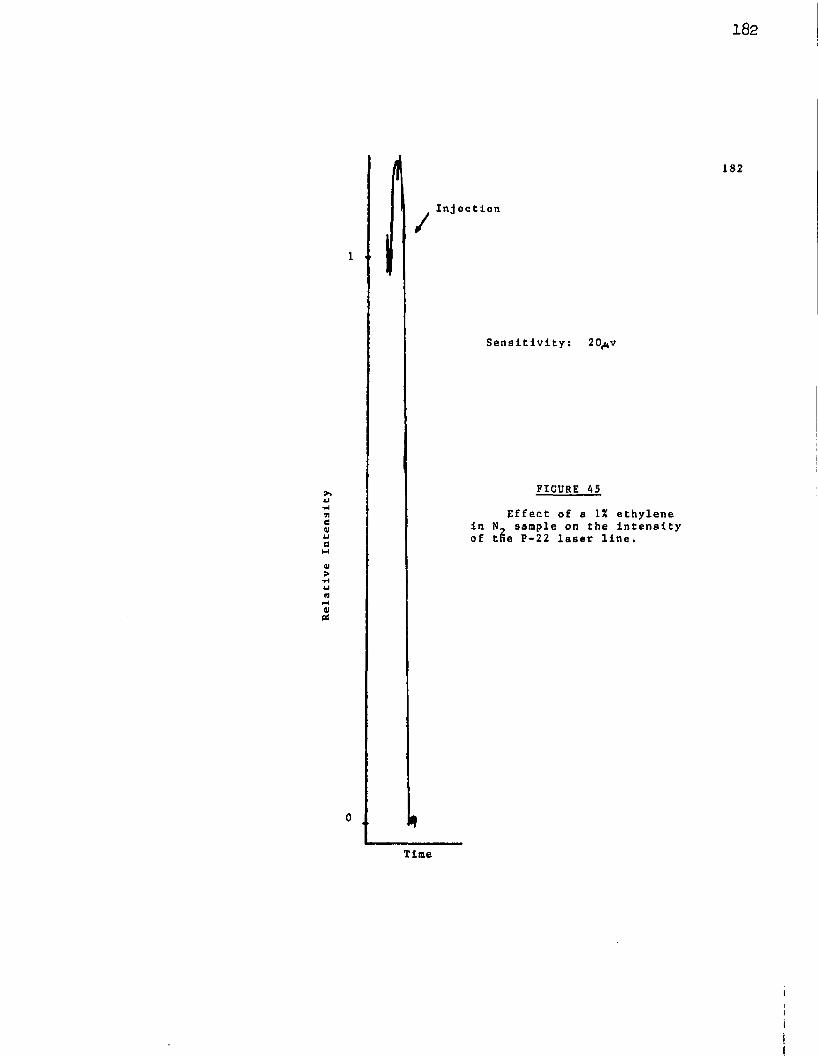
182
Injection
1
Sensitivity: 2 0 ^
FIGURE 45
Effect of a IX ethylene in N_ sample on the Intensity of tne P-22 laser line.
0
Time
iJiiii
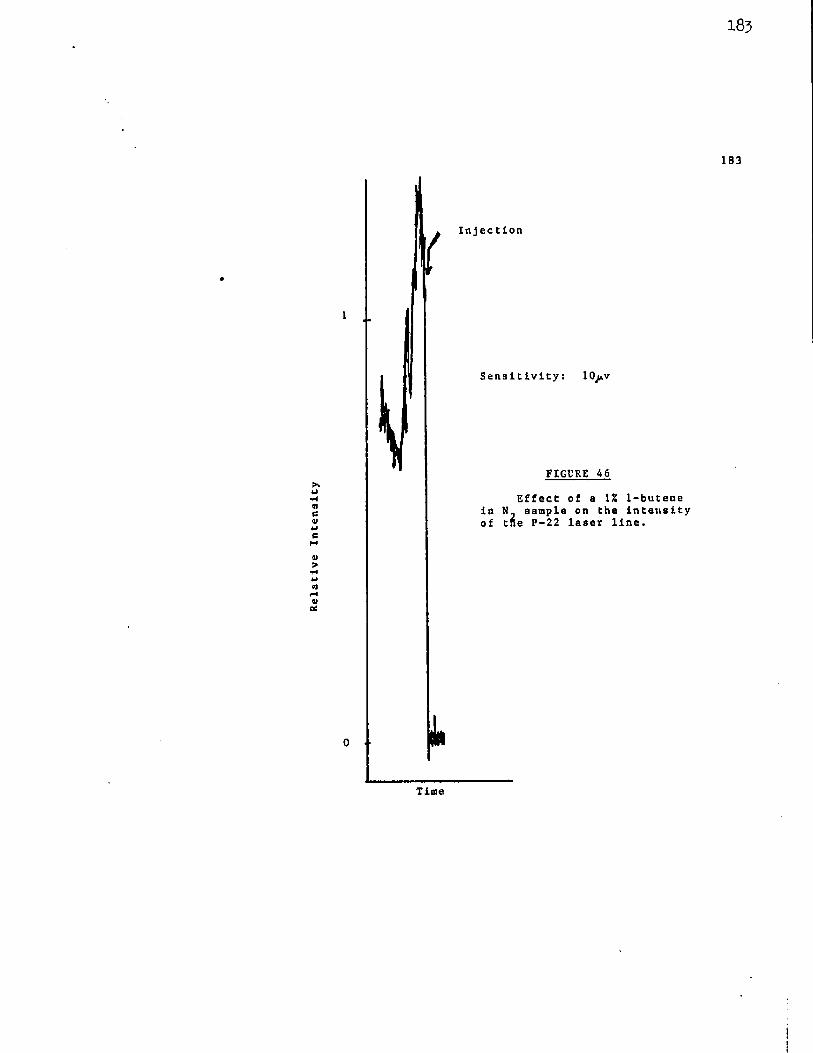
Relative
Inte
nsit
y
185
183
Injection
1
Sensitivity: 10 »v
FIGURE 46
Effect of a 1% 1-butene in sample on the intensity of the P-22 laser line.
0
Time
184
Methane did not exhibit an effect upon the P-22 line at concentration levels as high as 10% in
Ethyl acetate, benzene and acetone were investigated at
amounts of 99>tg, 98>ug and 87/ug, respectively, which did
not affect the P-22 laser line.
A mixture of 0.1% vinyl chloride and 1% ethyl
chloride was injected while monitoring the P-22 laser line
Intensity. From Figure 47 it is observed that ethyl chloride
did not interfere with the vinyl chloride quenching effect
on the P-22 line.
5. JG Amplifier
In an attempt to construct a tunable laser
system, the PE laser with a totally reflecting mirror was
used to pump the JG laser. A grating placed in the output
beam path of the PE formed the rear optical element for the
JG laser (Figure 23). One of the laser lines emitted by the
PE laser was selected by rotation of the grating such that
the desired line was projected through the JG laser system.
The purpose was to use the JG laser as an amplifier for the
laser line selected by the grating orientation. The end
result would be a tuning of the JG laser. The results
obtained with the system can be seen in Table 22.
The system was not pursued as a better system
was tried; as mentioned in the experimental section.
6. Temperature Study
It was felt that the laser lines were broadened
due to the high temperature of the laser plasma. The plasma
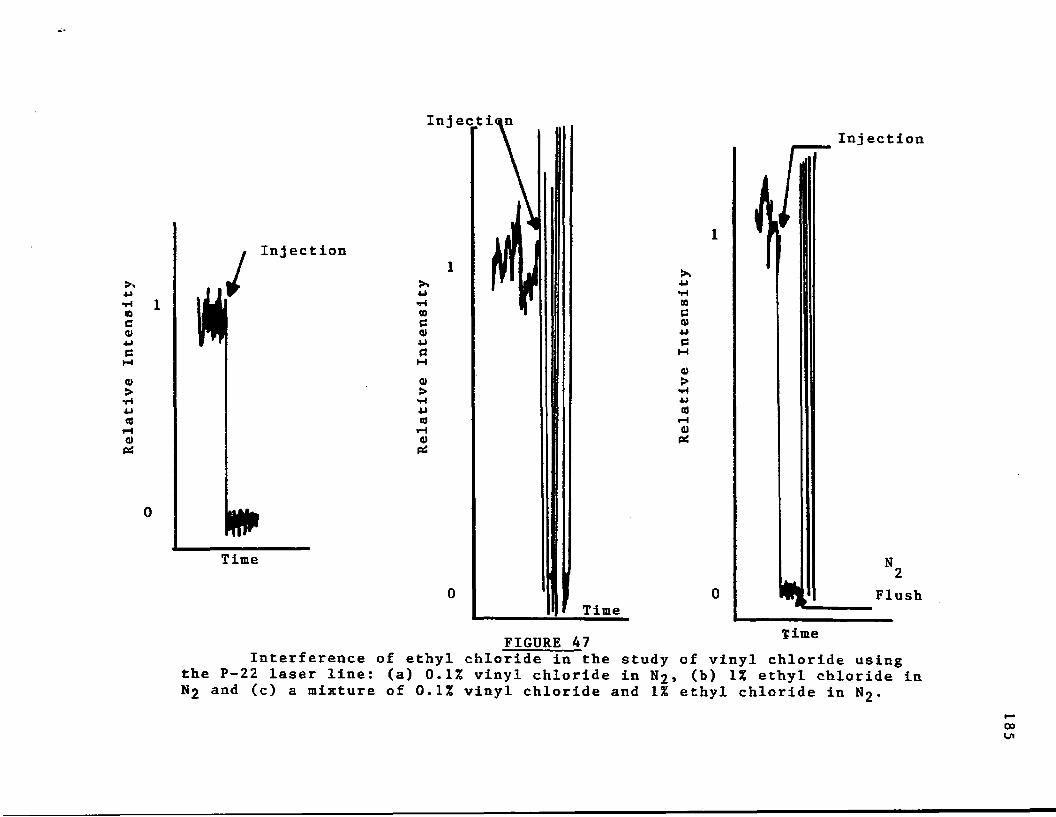
Rela
tive
In
tens
ity N/ Inj ection
f llF
Time
Inj ectian
M
Time
■Ul•Htoe0)4JtsHa>>•HtOH<Uei
FIGURE 47
Inj ection
1
0 Flush
TimeInterference of ethyl chloride in the study of vinyl chloride using
the P-22 laser line: (a) 0.1% vinyl chloride in N 2 » (b) 1% ethyl chloride inN2 and (c) a mixture of 0.1% vinyl chloride and 1% ethyl chloride in N 2 •
185
186
FIGURE 48Infrared Absorption Spectra
The spectra are reproductions of those found In Sadtler Catalog of Infrared Spectra.
1. Vinyl Chloride
2. Propylene
3. Ethylene
4. Ethyl Chloride
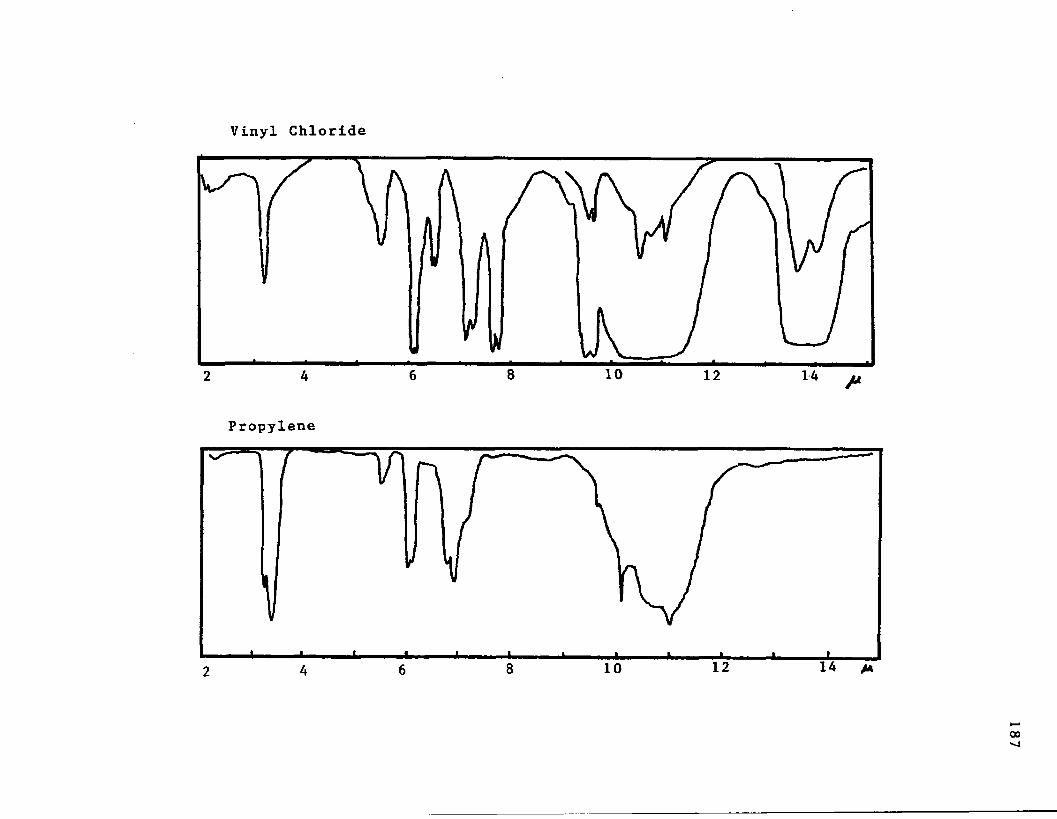
Vinyl Chloride
108 146 1242
Propylene
1210864
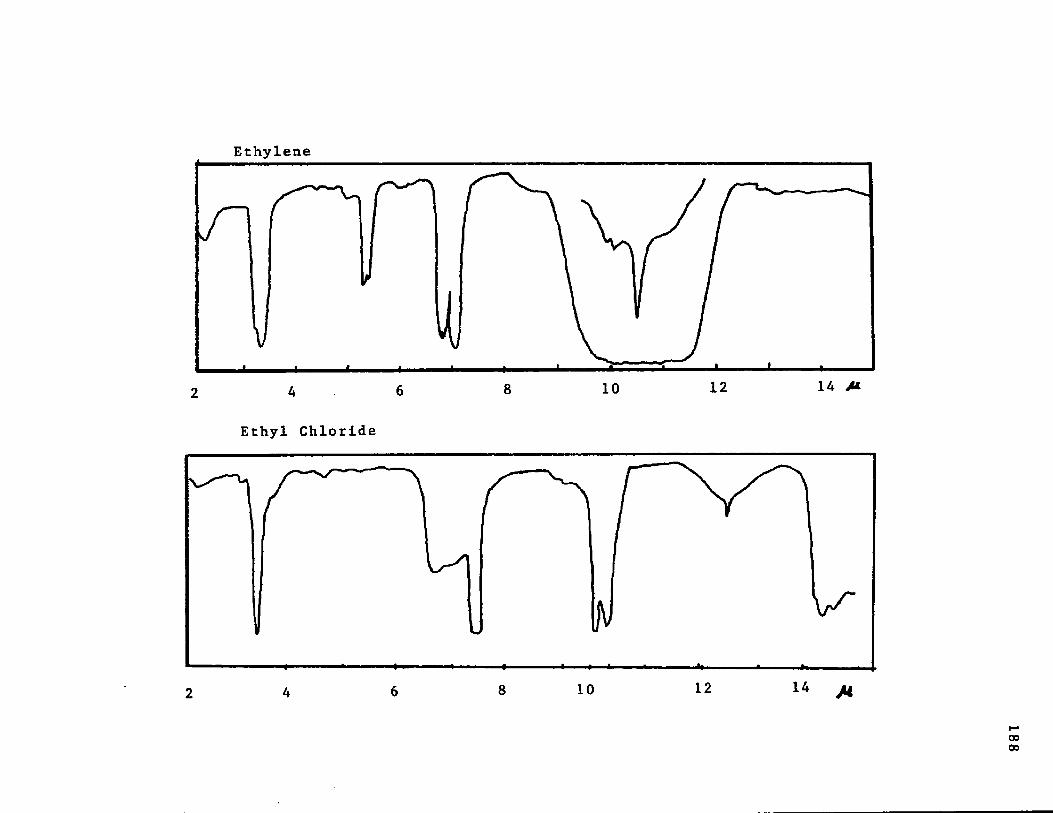
Ethylene
14 M1210864
Ethyl Chloride
141210864
189
tube of the JG laser was water cooled in order to reduce
the temperature. A constant flow of the tap water was
circulated through the cooling jacket at a rate of
approximately 1 liter/minute. This effluent cooling
water was monitored over a period of time as can be seen
in Table 23.
A closed circuit cooling system with a heat
exchanger was assembled for the JG laser system (Figure 22
Table 24 lists the cooling water temperature as the laser
was operating.
A study was made using the cooled system
in order to compare the detection limit data with the tap
water cooled system for propylene. The output of the
laser was scanned as samples of propylene in N 2 were
injected into the laser wavetrain (Table 25).
It appeared that little could be concluded
as the laser did not operate in the P-16 line for most of
the study. Therefore, an insight into the effect of peak
sharpening could not be gained from the results of this
study.
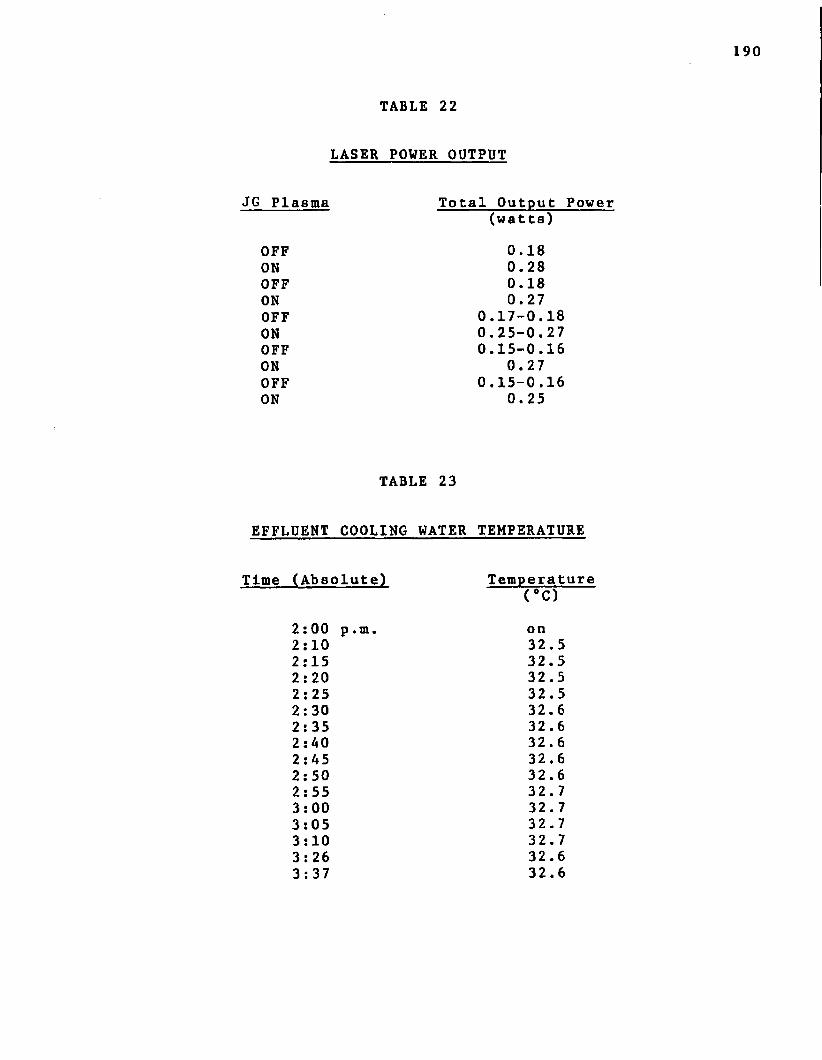
190
TABLE 22
LASER POWER OUTPUT
JG Plasma Total Output Power(watts)
OFF 0.18ON 0.28OFF 0.18ON 0.27OFF 0.17-0.18ON 0.25-0.27OFF 0.15-0.16ON 0.27OFF 0.15-0.16ON 0.25
TABLE 23
EFFLUENT COOLING WATER TEMPERATURE
Time (Absolute) Temperature(°C)
2:00 p.m. on2:10 32.52:15 32.52:20 32.52:25 32.52:30 32.62:35 32.62:40 32.62:45 32.62:50 32.62:55 32.73:00 32.73:05 32.73:10 32.73:26 32.63: 37 32.6
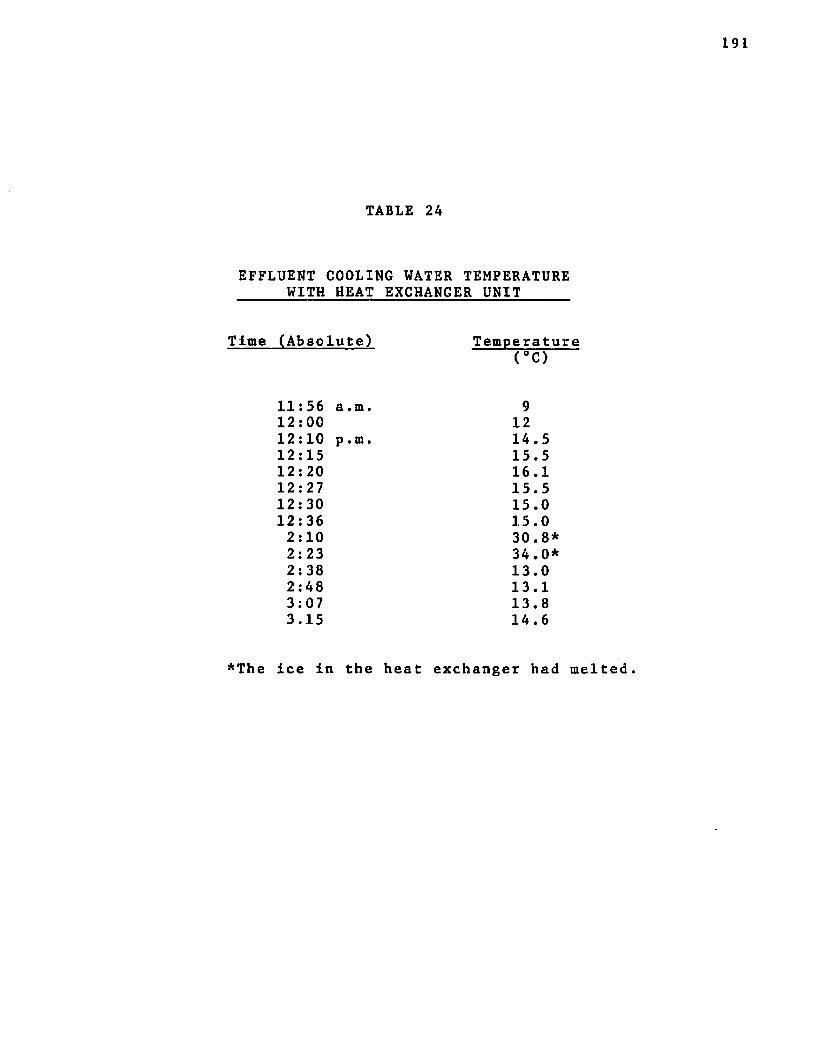
TABLE 24
EFFLUENT COOLING WATER TEMPERATURE ______WITH HEAT EXCHANGER UNIT
Time (Absolute) Temperature(°C)
11:56 a.m. 12:0012:10 p.m. 12:15 12:20 12:27 12:30 12:36 2:10 2:23 2:38 2:48 3:07 3.15
91214.515.5 16 .115.515.015.0 30.8* 34.0*13.013.1 13.8 14 .6
*The ice in the heat exchanger had melt
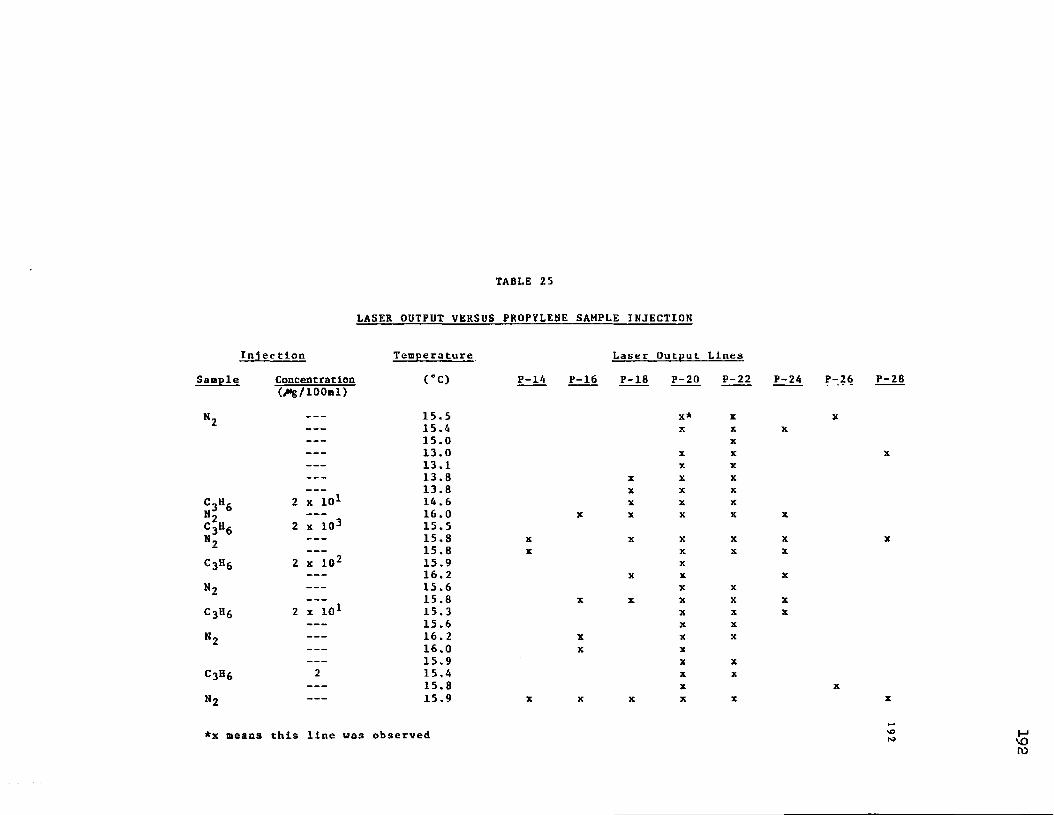
TABLE 25
LASER OUTPUT VERSUS PROPYLENE SAMPLE INJECTION
Inlec tlon
Sample Concentration(^*B/100ml)
N, --
S *Sf6C3h6»2C3ll6
K,
c3h6n2
2 x 10J
2 x 10-
2 x 10J
2 x 101
Temperature
rc)
15.515.415.013.013.113.813.814.6 16.015.515.815.815.9 16.215.615.815.315.6 16.2 16.015.915.415.815.9
P-14
Laser Output Lines P-16 P-18 P-20 P-22 P-24 P-26
xxXX
XX
X*X
XXXXXX
XXXXXXXXXXXXXX
XXXXXXXXX
XX
XXXXX
XX
P- 28
X
X
*x means this line was observed VOto VOro
DISCUSSION
A . Remote Sensing
The results of the remote sensing study by laser
Induced Infrared fluorescence Illustrated the tremendous
potential of the technique for atmospheric monitoring. Real
time monitoring of organic molecular compounds in the atmo
sphere was achieved with the technique. Fluorescence signals
were observed to vary in intensity during the day as was
shown by diurnal studies made on several occasions. This
variation in signal intensity was expected and resulted from
changes in the pollution level in the monitored area. The
laser beam path extended over a university parking lot and
the signal variation may have been affected by the traffic
movement, wind directions, wind speed and other meterological
parameters also contributing to the pattern of observed signals.
It is felt that the technique provided a more accurate
pollutant level indication than conventional air sampling
methods due to the rapid response of the system to the
pollutant level changes. The technique was selective to a
certain degree as only compounds capable of absorbing the
10.6^ laser radiation or compounds capable of being excited
through collisions with already excited compounds produced
fluorescence and sensitized fluorescence signals, respectively.
Scatter from the laser beam caused by particulate material
was eliminated from the analyzed signal by several methods.
In one method, band pass filers were used which did not pass
the 10.6y(A laser scatter signal to the detector. A phase193
194
shifting technique was a second method used to distinguish
the time delayed fluorescence signals from the instantaneous scatter signals regardless of the filter choice. Backscatter
radiation was also minimized by placing a truncation cone
over the detector allowing it to only view the collecting
mirror. In addition, the laser beam was modulated, thus making
the fluorescence an a.c. signal which was electronically
distinguished from the constant d.c. background radiation.
Improvements to the system could lead to the solution
of remaining unsolved difficulties. These difficulties
primarily Involve: specificity, greater sensitivity and quan
titation. The selectivity of the technique was not as great
as needed for qualitative determination of the pollutnant
compounds. A tunable laser system is necessary in order to
select a laser line which would be specifically absorbed by
the compound of interest in the presence of other atmospheric
pollutants. An increase in the sensitivity of the system could
be achieved by certain system improvements. A number of
commercially available lasers are much more intense and have
much less laser beam divergence than the PE laser used in these
studies. Employment of better laser sources would extend the
range of the remote sensing capability as well as improve
detection limits as more laser beam power would be available
for excitation of pollutant molecules. The collection
mirror used in the studies was of very poor quality. Thus
it is felt that a higher optical quality mirror would gather
195
light more efficiently and focus the radiation to a point
rather than a volume as In the case of the one employed.This would Increase the amount of light striking the detector.
Detectors were also available with much larger detector element surface area and therefore were consequently more
sensitive. At this stage of development there was no easy
quantitation of the technique. A quantative method could
be developed from fluroescence intensity data obtained from
controlled samples.
1. Mechanisms of Excitation
There are several explanations available for
the mechanism involved in the generation of fluorescence.
The mechanisms generally proposed are: (1) ground state
absorption, (2) thermal excitation, (3) excited state
absorption, (4) collision activation and (5) stepwise
multiphoton absorption. A sixth mechanism proposed is
simultaneous multiphoton absorption which will be discussed
separately in section 2.
a . Ground State Absorption
Ground state absorption is also known as
resonance absorption, direct or continuous absorption. In
this process a molecule in the ground state absorbs a photon
of energy equal to the energy difference between the ground
state and an excited level. The excited molecule then can
relax by emission of a photon of the same wavelength as that
absorbed. This fluorescence occurs without an intramolecular
redistribution. On the other hand, the molecule may undergo
196
a redistribution of its energy and re-emit photons of
different wavelengths.
Ethylene fluorescence can be explainedby this mechanism.
b . Thermal Excitation
Fluorescence can be achieved by the
population of an excited state of a molecule by thermal
effects. Once in the upper state, the molecule relaxes.
The relaxation process may involve the emission of a photon
thus giving rise to the fluorescence signal.
Thermal excitation is very important
especially in the monitoring of hot gases emitted from
stacks. However, it is always present in the techniques
involving a laser beam as the laser beam heats the sample.
Thermally induced fluorescence can be minimized by a modula
tion procedure in which the laser beam is chopped. In this
manner, the fluorescence signals due to laser beam absorption
are a.c. while thermally induced fluorescence is constant,
after a warm-up period, and therefore is d.c.
c . Excited State Absorption
Excited state absorption is also known as
hot band absorption. In this process a molecule in the
ground state is raised to an excited level by a nonradiational
process. Such a process may be thermal in nature as discussed
above. The molecule in the excited state may absorb a photon
of the required energy to promote the molecule to a second,
higher, excited state. Relaxation of the excited molecule
197
to the ground state by a radiational process then results
In emission of a photon of higher energy (shorter wavelength) than the excitation photon.
This mechanism has been used in the
explanation of the shorter wavelength fluorescence observed
from excitation of fluoromethane and possibly acetone and
ethylene.
d • Collision ActivationCollision activation is also known as
sensitized fluorescence, induced fluorescence or intra
molecular vibrational energy transfer. In this process
molecule B may be excited although the energy of the laser
photon may not equal the energy level difference of the
ground state and an excited state of molecule B. However,
molecule A can absorb the laser photon and become excited
to A*. Collision of the excited molecule A* with a mole
cule of B in the ground state may result in a transference
of energy from A* to B. The energy transference will excite
B provided there exists a common vibrational mode between
A and B. A photon can then be emitted by B* as the molecule
B relaxes to its ground state.
A + V\V (laser) = A*
B + K*\J ( laser) » no excitation
A* + B - A + B*
B* = V"\ V BThis mechanism can explain collislonal
deactivation as molecule A relaxes in a nonradiational fashion.
198
e . Stepwise Multiphoton Absorption
Stepwise multiphoton absorption isanother mechanism proposed for shorter wavelength fluores
cence. Several laser photons are absorbed promoting the
molecule from its ground state to successively higher states.
This process Involves emission of a photon.
It is felt that this proposed mechanism
is not the best explanation of laser induced shorter wave
length fluorescence. It is possible for relaxation of the
various excited levels to occur through collisional deactiva
tion due to the time elapsed before absorption of a successive
laser photon.
2. Simultaneous Multiphoton Absorption
Shorter wavelength infrared fluorescence has
been observed on numerous occasions and as yet the mechanism
is not understood although several proposals have been made.
Fluorescence at 3 . 3 (C — ♦H) has been observed
upon absorption of the 10.6^ laser beam by certain organic
molecules. This suggests at least a four photon absorption
is necessary to satisfy the energy requirements. The step
wise multiphoton absorption mechanism proposes the absorp
tion of a single photon raising the molecules to the first
excited energy level. A second photon is absorbed by the
excited molecule in order to promote the molecule to a second
excited energy level. Successive one photon absorption
process ultimately leads to an excited state from which the
molecule relaxes. This is not felt to occur as the molecule
199
would most likely fall to reach the level from which It
relaxes due to the time spent In each excited level. The
time spent In the excited levels exposes the molecule to
collisional deactivation processes. Therefore, in contrast
a simultaneous multiphoton absorption mechanism has been
proposed.
Simultaneous multiphoton absorption involves
the absorption of more than one photon by a ground state
molecule. This absorption results in the population of a
higher molecular state. Several criteria must be satisfied
in order for this to occur. A small amount of energy must
be lost in order to maintain the balance between energy
absorbed (10.6^4) and energy emitted (3.3ju )• The vibra
tional levels of a molecule are anharmonic, thus the energy
difference between successive levels are not equal. Therefore,
the excess energy is believed to be distributed to various
other parts of the molecule. Secondly, the molecule must
experience the jump in one step, i.e., VD — » vx .
It is conceivable that a simultaneous multi
photon absorption process could occur provided a coherent
light source such as a laser is used. The laser differs
from conventional light sources in that the photons from
the laser are in the form of a wavetrain and are all cor
rectly oriented relative to the molecule for absorption.
The time between successive photons in a CO^ laser operating
at 10.6^t can be calculated.10.6 , -14 — „ 3x10 sec, (29)
200
It can then be deduced that within a very
short period of tine, for Instance 10“13 sec., several
10.6/*, photons can be absorbed by the molecule. During
absorption of the photons, the energy Is redistributed to various vibrational modes from which fluorescence is
observed.
It is reiterated that the mechanism of shorter
wavelength fluorescence in the ir region is not understood
as of yet. However, simultaneous multiphoton absorption
appears to be an explanation of the mechanism to be seriously
considered.
B . Laser Intracavity Absorption Spectroscopy
A sample must exhibit broad band absorption in
the region of laser operation for the phenomenon known as
laser intracavity absorption to occur. This can be seen as
vinyl chloride, propylene, ethylene and 1-butene greatly
affected the laser output power at 10.6/4. when introduced
into the wavetrain. The Ir absorption spectra revealed
that vinyl chloride, propyl'ene, ethylene and 1-butene had
a strong absorption band in the region of 10.6/4 . Ethyl
chloride showed only a small amount of broad band absorption
at 10.6/a and did not appear to affect lasing action. Ethyl
chloride did interfere with lasing action when the laser was
made to operate in the 10.2/< region where ethyl chloride
exhibited strong band absorption. However, it should be
noted that one is not dealing with broad band absorption
but rather an overlap of the narrow vibrational/rotational

201
lines, which are superimposed upon broad band absorption,
of the sample with a laser transition line. It is this overlap that produces wavelength dependent quenching or
partial quenching of the laser output. Different laser
lines were selectively decreased by different samples
although the samples exhibited broad band absorption over
the total range of the normal laser output. This led to
the conclusion that vibrational/rotational overlap with the
laser lines is the criteria for the technique.
Methane did not exhibit absorption in the 10.6/u
region, therefore, the introduction of a high concentration
of methane did not affect the laser line.
1. Selectivity of Laser Intracavity Absorption
The absorption phenomenon was somewhat selective
in that the sample introduced laser power losses at specific
wavelengths. The data indicated a strong overlap of vib
rational/rotational lines of vinyl chloride with the P-22
line (10.611§£<). Likewise, the strongest overlap exhibited
for ethylene and propylene occurred with the P-16 line
(10.5518/*). Detection limit data for ethylene for the P-16
and P-18 (10.5713^) lines clearly indicated there is more
overlap with the P-16 laser line than with the P-18 laser
line. In addition, ethyl chloride detection limits were
orders of magnitude different when the laser was made to lase
on different lines. This supported the premise that the
extent of vibra t ional/rotational overlap with a laser tran
sition line was the basis of the selectivity of the technique.
202
2. Moding of the C0„ Laser
The laser can freely shift from one set of
lines to another set as the gain of the lines change. The shift can be made to take place by Introducing a sample of
sufficient concentration to completely quench a normal
lasing line. This shifting of the lines, which the laser
emits, to other lines is referred to as moding. Moding was
induced by an Introduction of 1% vinyl chloride, 1% propylene,
1% ethylene, and 1% 1-butene. It is this aspect that may
enhance the selectivity of the technique, especially in
cases where two or more compounds selectively decrease the
same laser line. The moded lines of vinyl chloride were
the R'-16, R'-18, R ’-20, R'-22, R'-24, R-18, R-20, R-22,
R-24, and R-28, while those of propylene were P ’-18, P'-20,
P'-22, P'-26, R-18, and R-22. Ethylene produced the fol
lowing lines: R'-14, R'-20, R'-24, P'-14, P'-16, P'-20,
P'-24, P'-26, P ,-28, and R-20. The moded lines of 1-butene
were: R'-24, P'-18, P'-20, P ’-22, P*-24, P'-26, R-20, and
R-22. Although there did not appear to be a single line
which was unique for each sample, certain samples could be
distinguished from each other by their moded lines. Propy
lene and 1-butene produced similar groups of moded lines;
however, each could be readily distinguished from the moded
lines of vinyl chloride.
3. Interference Study for Vinyl Chloride Monitoring
In order for the technique to be a valid monitor
of a particular sample such as vinyl chloride, an interference
study was made. Ethylene, propylene, ethyl chloride,
ethyl acetate, acetone, 1-butene, methane, and benzene were studied to determine their effect on th P-22 line used to monitor vinyl chloride.
The reaction of the laser Intensity to a
1% ethyl chloride in Nj mixture can be seen In Fig. 47.
The intensity fluctuated wildly upon Injection of the
sample. It was felt that the response was due to some
absorption by an Insufficient amount of ethyl chloride
molecules. This absorption momentarily caused the decrease
in the laser intensity. Due to the insufficient extent of
absorption, the laser began to lase on the line and its
intensity exceeded that of the initial value due perhaps
to a Q switching effect. In other words, the built up
energy of the line was released. The 1% sample did not
appear to be an lnterferent as a mixture of 0.1% vinyl
chloride and 1% ethyl chloride in yielded a quench of the
P-22 line just as in the case of 0.1% vinyl chloride in N 2 «
A 1% ethylene in Nj mixture did interfere with the P-22
line as well as a 1% propylene in Ng and a 1% 1-butene in
Nj mixture. Thus if either ethylene, propylene, or 1-butene
were present in 1% or greater the detection of vinyl chlorid
would be masked. It was also found that ethyl acetate,
acetone, benzene, and methane did not interfere with detect!
of vinyl chloride.
4. Tunable Laser Systems
The grating was used in hopes of achieving
two goals. One of these goals was the possibility of
204
forcing the laser to lase at more wavelengths than achieved
with the totally reflecting mirror. This indeed was accom
plished as seen in Tables 9 - 12. With the new range of
laser lines, studies of many more compounds became feasible.
One example of the broadened capability of the system was
the study and calculation of detection limits of ethyl
chloride. The other purpose for employing the grating was
to attain greater laser stability in order to accurately
detect smaller intensity shifts in the laser output thus
lowering detection limits. The stability of the laser line
intensity was greatly improved as natural moding was re
stricted and therefore less stringent detection limit criteria
needed. However, the absolute detection limits were orders
of magnitude greater than those achieved with the totally
reflecting mirror for vinyl chloride, propylene, and ethylene.
It was felt that the laser was operating further from the
critical threshold level. In other words, all of the avail
able energy was being concentrated on the single allowed
lasing line. This led to an increase in the gain of the laser line thus more concentrated samples were necessary to
achieve line interruption and ultimate line intensity de
crease.A grating of lower resolution may be needed to
improve the stability of the laser while retaining the sen
sitivity. This system would prevent much of the natural
moding while allowing the forced moding and operating nearer
the laser threshold level.
205
The JG laser amplifier system (Fig. 2 3) was constructed earlier in the experiments in an attempt to
obtain a tunable laser. This study showed that amplification of a line was achieved by the second laser in the
system, the JG laser. (The idea was not pursued as the high
resolution grating was incorporated into the system.)
Although a 55% increase in laser power was achieved when
using the amplifier laser, the total output power was a
mere 0.3 watts. It was felt that this output intensity was
too low to successfully conduct the intracavity absorption
studies.
The goal of using a grating system was two
fold as mentioned earlier. Both goals could not have been
attained using this apparatus configuration (Fig. 23). The
laser line stability could have increased to a certain degree
as the second laser, the amplifier, could not have moded as
the grating forced it to lase on the selected line or lines.
However, any fluctuation in the pumping laser, the PE laser,
resulting from moding would have affected the line stability of the amplified line. Secondly, the grating system was
desired in order to force the laser to operate on lines not
normally seen when using a totally reflecting mirror. The
JG amplifier system would only have chosen one or more lines
available in the output of the pumping laser. The PE laser
which was the pumping laser normally operated on the 1 0 .6/4
envelope; therefore, the JG laser would still not have lased
on lines in the other three envelopes.
206
5. Laser Cavity Coolant Temperature Study
A temperature study was briefly attempted but
not pursued due to lack of equipment needed for the study.
The effluent coolant frcunthe laser plasma cooling jacket
was monitored before and after installation of a chilled
cooling system. The temperature difference before and after
the installation was not great as the temperatures were
approximately 15°C and 31“C for the chilled system and
tap water system, respectively. The lowest temperature of
the effluent achieved with the laser operating was approxi
mately 13°C with the chilled system.
The effluent cooling water was the only
temperature monitored. This was not a direct temperature
measurement of the laser plasma cavity. However, it was
felt that there was a decrease in the cavity wall temper
ature of the plasma tube when the coolant water temperature
decreased. Thus, it was hoped that there would be a
sharpening of the laser lines which would be used to gain
a further insight into the degree of overlap of the laser
line with a sample vibrational/rotational line. It was
felt that a substantial sharpening of the laser line would
lead to the distinguishing between compounds which appeared to selectively absorb the same line when the laser lines
were broadened. A proper amount of laser line sharpening
should cause the laser line to become transparent to one
sample while being absorbed by the sample which exhibited
more overlap.
207
The study did not yield any useful information
as an indepth study was not made. With proper cooling
equipment, the laser lines as well as sample vibrational/
rotational lines should be sharpened and the intracavity
studies continued.
CONCLUSIONS
A . Remote SensingLaser induced ir fluroescence has been shown to
be feasible for the remote sensing of atmospheric organic
molecular pollutants. Identification of the pollutants was
not attempted nor was a quantitative study conducted.
Improvement in the sensitivity of the system could
be made by upgrading the equipment used. A more intense laser
source with less beam divergence, better quality collecting
mirror and a detector with a large cross-sectional area would
significantly increase the sensitivity of the system.
The technique could be made to be a qualitative
method by employment of a tunable laser source such that
selective excitation could be achieved.
A quantative method could be developed from
fluorescence intensity data obtained from studies utilizing
the fluorescence from controlled systems enclosed in a cell.
Laser induced ir fluorescence as a remote sensing
technique is sensitive, single-ended, requires no sample
handling and is capable of ranging. In addition, one of the
main advantages of the technique is the potential of real
time analysis of atmospheric pollutant levels.
B . Laser Intracavity Absorption Spectroscopy
When an organic gas sample is introduced into 4
sample cavity in a laser optical system the lasing action
is greatly disturbed. This phenomenon has great potential
208
as an analytical technique for the detection of small
quantities of organic compounds.
Using a totally reflecting mirror rather than a
high resolution grating enhanced the analytical sensitivity of the system in that lower sample concentrations inter
rupted lasing action at certain specific wavelengths causing
moding rather than loss of power. Detection limits of 0.14/*g
0.95*ig and 0.60y«g for vinyl chloride, propylene and ethylene,
respectively, were found using a totally reflecting mirror.
When employing the grating system, vinyl chloride, propylene,
ethylene and ethyl chloride detection limits were 1.4 x 10^» g
94^ig, 63,ug and 0.2£t«g, respectively.
It was felt that the sensitivity of the system was
enhanced due to the position of the sample cell between the
laser cell and reflecting mirror rather than between the
laser cell and dumping mirror.
The procedure seemed to be selective in that
compounds with similar broad band absorption in the 10.6^4.
region had very different effects on lasing lines at specific
wavelengths because of differences in their fine structures.
Interferences from other compounds were observed
only at high concentrations.The technique was continuous, needed no sample
preparation and was remarkably sensitive.
Finally, the method could be developed into a
sensitive selective analytical technique capable of continu
ous monitoring. For example, air samples could be introduced
into the sample cavity and specific compounds studied.
REFERENCES
1. L. 0. Ledbetter, Air Pollution. Part A; Analysis, (Marcel Dekker, Inc., New York, 1972), p. 4-5.
2. Ibid., p. 31.3. R. B. Engdahl, "Stationary Combustion Sources,"
In Air Pollution, Vol. Ill, ed. by A. C. Stern (Academic Press, New York, London, 1968), p. 4.
4. H. F. Elkin, "Petroleum Refinery Emission," InAir Pollution, Vol. Ill, ed. by A. C. Stern (AcademicPress, New York, London, 1968), p. 97.
5. V. H. Sussman, "Nonmetalllc Mineral Products Industries," in Air Pollution. Vol. Ill, ed. by A. C. Stern (Academic Press, New York, London,1968), p. 123.
6. W. Sebesta, "Ferrous Metallurgical Process," inAir Pollution, Vol. Ill, ed. by A. C. Stern (AcademicPress, New York, London, 1968), p. 143.
7. K. W. Nelson, "Nonferrous Metallurgical Operation," in Air Pollution, Vol. Ill, ed. by A. C. Stern (Academic Press, New York, London, 1968), p. 171.
8. A. N. Heller, S. T. Cuffe, and D. R. Goodwin, "Inorganic Chemical Industry, in Air Pollution,Vol. Ill, ed. by A. C. Stern (Academic Press,New York, London, 1968), p. 191.
9. D. F. Adams, "Pulp and Paper Industry," in Air Pollution, Vol. Ill, ed. by A. C. Stern (Academic Press, New York, London, 1968), p. 243.
10. W, L. Faith, "Food and Feed Industries," in Air Pollution, Vol. Ill, ed. by A. C. Stern (Academic Press, New York, London, 1968), p. 269.
11. R. W. Hurn, "Mobile Combustion Sources," in Air Pollution, Vol. Ill, ed. by A. C. Stern (Academic Press, New York, London, 1968), p. 55.
12. Peter L. H. Jowett, "The Remote Sensing of Air Pollutants by Induced Infrared Fluorescence with a C02 Laser: Suggested Mechanism for ObservedShorter Wavelength Light Shifts," Thesis, LSU (1977).
210
211
13. M. Corn, "Noviable Particles in the Air," in AirPollution. Vol. I, ed. by A. C. Stern (AcademicPress, New York, London, 1968), p. 57.
14. E. Robinson, "Effects on the Physical Properties of the Atmosphere," in Air Pollution. Vol. II, e d , byA. C. Stern (Academic Press, New York, San Francisco, London, 1977), p. 1.
15. J. 0. Ledbetter, Air Pollution. Part A; Analysis,(Marcel Dekker, Inc., New York, 1972), p. 368.
16. W. W. Heck and C. S. Brandt, "Effects on Vegetation:Native, Crops, Forests," in Air Pollution, Vol. II, ed. by A. C. Stern (Academic Press, New York, SanFrancisco, London, 1977), p. 158.
17. J. R. Goldsmith and L. T. Friberg, "Effects of AirPollution on Human Health," in Air Pollution. Vol. II,ed. by A. C. Stern (Academic Press, New York, SanFrancisco, London, 1977), p. 457.
18. M. B. Jacobs, The Chemical Analysis of Air Pollutants, (Interscience Publishers, Inc., New York, 1960), p. 7.
19. J. 0. Ledbetter, Air Pollution, Part B: Preventionand Control, (Marcel Dekker, Inc., New York, 1974), p. 189.
20. J. 0. Ledbetter, Air Pollution, Part B: Preventionand Control, (Marcel Dekker, Inc., New York, 1974), p. 167.
21. K. Iinoya and C. Orr, Jr., "Source Control by Filtration," in Air Pollution. Vol. Ill, ed. by A. C. Stern (Academic Press, New York, San Francisco, London,1977), p. 409.
22. P. 0. Warner, Analysis of Air Pollutants, (John Wileyand Sons, New York, London, Sydney and Toronto, 1976),p. 234,
23. J. 0. Ledbetter, Air Pollution. Part B: Prevention andControl, (Marcel Dekker, Inc., New York, 1960), p. 123,
24. P. 0. Warner, Analysis of Air Pollutants, (John Wileyand Sons, New York, London, Sydney and Toronto, 1976),p . 223.
25. P. L. Hanst, A p p l . Spec. , 24(2), 161 (1970).
26. W. E. Scott, E. R. Stephens, P. L. Hanst, R. C. Doerr, Proc. A P I , 3J, 171 (1957).
212
27. G. W. Ewing, Instrumental Methods of Chemical Analysis. (3rd Ed., McGraw-Hill Book Co., New York, etc., 1969), p. 125.
28. J. W. Robinson, Scl. Total Environ.. J3, 169, (1970).
29. M. J. D. Low and F. K. Clancy, Environ. Sc. and T e c h .,1(1), 73, (1967).
30. R. T. H. Collis, Appl. O p t .. 9(8), 1782, (1970).
31. R. T. H. Collis and P. B. Russel, "Lldar Measurement ofParticles and Gases by Elastic Backscatterlng and Differential Absorption," In Topics In Applied Physics, Vol. 14, ed. by E. D. Hinkley (Springer-Verlag Berlin Heidelberg, 1976).
32. H. Kildal and R. L. Byer, P r o c . IEEE. 59(12), 1647, (1971)
33. H. Inaba, "Detection of Atoms and Molecules by RamanScattering and Resonance Fluorescence," in Topics In Applied Physics, Vol. 14, ed. by E. D. Hinkley (Springer- Verlag Berlin Heidelberg, 1976).
34. S. H. Melfl, M. L. Brumfield, and R. W. Storey, Jr.,Appl. Phy. L e t t .. .22(8), 402,(1973).
35. S. H. Melfl, Appl. O p t .. 11(7), 1605, (1972).
36. P. L. Hanst and J. A. Morreal, J. Air Poll. ControlA s s o c ., 18(11), 754, (1968).
37. E. D. Hinkley, R. T. Ku, and P. L. Kelley, "Techniques for Detection of Molecular Pollutants by Absorption of Laser Radiation," in Topics in Applied Physics, Vol. 14, ed. by E. D. Hinkley (Springer-Verlag Berlin Heidelberg, 1976) .
38. R. T. Ku, E. D. Hinkley, and J. 0. Sample, Appl. O p t ., 14(4), 854, (1975).
39. E. D. Hinkley, R. T, K u , K. W. Nill, and J. F. Butler,Appl. O p t ., JL5(7), 1653, (1976).
40. J. A. Hodgeson, W. A. McClenny, and P. L. Hanst, Science,187, 248, (1973).
41. R. T. Menzles and M. S. Shumate, A p p l . O p t .. 1^(9), 2080,(1976)
42. K. W. Rothe and H, Walther, "Remote Sensing Using TunableLasers," in Tunable Lasers and Applications, e d . byA. Mooradlan, T. Jaeger and P. Stokseth (Springer-Verlag Heidelberg, New York, 1976).
213
A3.44.
45.
46.
47 .
48.
49 .
50.
51.
52.
53.
54.
55.
56.
57.
58.
J. I. Davis, Appl. O p t . . _5, 139, (1966).
J. M. Hoell, Jr., and W. R. Wade, "Remote Sensing of Atmospheric S02 Using the Differential Absorption LIDAR Technique," IEEE. Annals //75CH1004-1 10-6, p. 1.H. H. Willard, L. L. Merritt, Jr., and J. A. Dean, Instrumental Methods of Analysis. (5th Ed., D. Van Nostrand Co., New York, 1974), p. 133.J. W. Robinson, H. M. Barnes, and C. Woodward, Spec.L e t t ., 1(3), 109, (1968).
William M. Reid, "Laser Induced Reactions of Propylene and a Study of the Feasibility of Determining Sulfuric Acid Aerosol by Laser Induced Infrared Emission," Dissertation, LSU (1974).
Nobuki Katayama, "A Study of the Application of Laser Induced Fluorescence in Analytical Chemistry," Dissertation, LSU (1974).
J. W. Robinson, C. Woodward, and H. M. Barnes, A n a l .Chim. A c t a ., 43, 119, (1968).
Harold M. Barnes, Jr., "Laser Stimulated IR Emission of Gaseous Organic Compounds," Dissertation, LSU (1969).
Charles M. Christian, "Methods for the Determination of Selected Atmospheric Pollutants," Dissertation, LSU(1971).J. W. Robinson and J. D. D a k e , Spec. L e t t ., 6/11), 685, (1973) .J. W. Robinson and N. Katayama, Spec. L e t t ., 8/1), 61 (1975) .James D. Dake, "Analytical Parameters in Remote Sensing of Air Pollutants Using Laser Induced Infrared Fluorescence," Dissertation, LSU (1973).
J. W. Robinson and N. Katayama, Anal. Chim. A c t a ., 79 243, (1975).J. W. Robinson and N. Katayama, S p e c . Lett. , 7/12),581, (1975).
J. W. Robinson and J. L. Guegliardo, Spec. L e t t ., .6(5), 271, (1973).
J. W. Robinson, P. J. Moses and N. Katayama, Spec. L e t t ., 5(10), 333, (1973).
214
59.
60.
61.
62.
63.
64.
65.
66.
67.
68.
69.
70.
71.
72.
73.
74.
75.
76.
J. W. Robinson, P. J. Moses and P. M. Boyd, Spec. Lett.. 7(8), 395, (1974).
J. W. Robinson and J. Guagliardo, Spec. L e t t . . 7.(2),121, (1974).
J. W. Robinson and J. D. Dake, Anal. Chim. A c t a .. 71, 277, (1974).
J. W. Robinson, D. Nettles, and P. L. H. Jowett, A n a l . Chim. A c t a .. 9 2 , 13, (1977).
R. L. Yuan and G. W. Flynn, J . Chem. P h y s ., 5 7 , 1316,(1972)
F. G. Gebhardt and D. C. Smith, Appl. Phys. L e t t .. 1 4 ,52 (1969).
R. N. Schwartz, Z. 1. Slawsky and K. F. Herzfeld, J . Chem. Phys.. 2 0 , 1591, (1952).
J. W. Robinson and J. D. Dake, Spec. Lett. , 6.(7), 377,(1973).
C. K. N. Patel, "Gas Lasers," in Lasers, Vol. 2, ed. by A. K. Levine (Marcel Dekker, Inc., New York, 1968).
D. N. Kendall, "Infrared Radiation: Description andSimple Theory of Absorption by Molecules," in Applied Infrared Spectroscopy, ed. by D. N. Kendall, (Reinhold Publishing Corp., London, 1966).E. Brannen, "Reflection Gratings as Elements in Far- Infrared Lasers," Proc. IEEE, 5 3 . 2134, (1965).
W. M. Lipchak, Optics Commun. , 19^(2), 205, (1976).
H. Hirose and S. Kon, Japan J. Appl. P h y s ., 16(3) ,533, (1977).
A. Yamagishi and A. Szabo, Applied Optics, lj>(3), 691, (1977).
H. Sato and K. Toda, Appl. O p t .. 16(5), 1280, (1977).
J. A. Giordmaine and W. Kaiser, J . A p p l . Phys.. 3 5 .3446, (1964).P. L. Hanst, J. A. Morreal, W. J. Henson, App. Phys. L e t t ., 12, 58, (1968).
J. T. Yardley, Appl. Phys. Lett.. 1 2 , 120, (1968).
215
77.
78.
79 .
80.
81.
82 .
83.
84.
85.
86 .
87 .
88.
89.
90.
91.
92.
93.
94 .
G. A. Fisk and G. N. Hays, J . A p p l . Phys. , 47(9) ,4044, (1976).
G. B. Jacobs and H. C. Bowers, J . A p p . Phys . , 3 8 ,2692, (1967).
J. C. Slddoway, J . A p p l . P h y s ., 39 , 4854 , (1968).
G. J. Ernst, Rev. Scl. Instrum.. 4_8(10), 1281,(1977) .
W. H. Thomason and D. C. Elbers, Rev. Scl. Instrum., 46, 409, (1975) .
W. J. Childs, M. S. Fred, and L. 5. Goodman, A p p l .O p t . . 13(10), 2297, (1974).
H. W. Latz, H. F. Wyles, and R. B. Green, A n a l , Chem., 45(14), 2405, (1973).
R. J. Thrash, H. Von Weyssenhoff, and J. S. Shirk,J . Chem. Phys. . 5J5(9), 4659 , (1971).
R. Konjevic and N. Konjevlc, Spec. L e t t . , J3(3) , 177,(1973).
J. P. Reilly and G. Pimentel, A p p l . O p t ., 15(10),2376, (1976).R. B. Green and H. W. Latz, Spec. L e t t . , .7(9), 419,(1974) .
N. C. Peterson, et al., J . Op t . So c . A m . , jil(6) , 746, (1971).
M. Maeda, et a l . , A p p l . O p t ., ij>(2) , 403, (1977).
G. Atkinson, A. H. Laufer, and M. J. Kurylo, J. Chem.P h y s ., 59(1), 350,(1973).T. W. Harsch, A. L. Schawlow, and P. E. Toschek, IEEE J. Quantum Electron., QE-8(10), 80 2, (19/2).
R. A. Keller, J. D. Simmons, and D. A. Jennings,J . Opt. S o c . A m . , 6_3(12), 1552, (1973).
F. Crescenzi and J. S. Shirk, Chem. P h y . , 2 0 , 331,(1977) ,
R. C. Spiker, Jr. and J. S. Shirk, A n a l . Chem., 46(4) 572, (1974).
216
95. R. A. Keller, E. F. Zalensky, and N. C. Peterson,J. Opt. Soc. A m ., 62(3), 319, (1972).
96. J. R. Eyler, Rev. Scl. Instrum.. .45(9) , 1154, (1974).
97. E. N . Antonov, V. G. Koloshnikov and V. R. Mironenko,Op t . Comm . , 1_5(1) » 99 , (1975).
98. N. Konjevic, M. Orlov, and M. Trltlca, Spec. Lett..10(5), 311, (1977).
99. J. W. Robinson, D. Nettles, paper submitted forpublication.
100. J. W. Robinson and D. Nettles, paper submitted forpublication.
101. C. Chackerlan, Jr., and M. F. Welsbach, J . Opt. S o c .A m . , 63(3), 342, (1973).
102. B. K. Garside, et al., A p p l . O p t ., ]J3(2), 398, (1977).
103. N. Djeu, J . Chem. P h y s . , 60^(11), 4109 , (1974).
104. D. F. Shriver, The Manipulation of Air-SensitiveCompounds, (McGraw-Hill, New York, 1969), p. 195.
105. D. S. Gibbs, H. J. Svec, and R. E. Harrington, Ind.E n g . Chem., 4 8 , 289, (1956).
VITA
Donald E. Nettles was born In Oak Grove, Louisiana
on October 22, 1949. Upon graduation from Warren Easton High School In New Orleans In 1967, he attended Lee College
In Cleveland, Tennessee for two years. He transferred to
Louisiana State University In New Orleans in 1969 from which
he received a B.S. in chemistry in 1972. He was employed
by Gulf South Research Institute as a chemist from mid-1972
to August, 19L73. He then entered Louisiana State University
in Baton Rouge and currently is a candidate for the degree
of Doctor of Philosophy.
217
EXAMINATION AND THESIS REPORT
Candidate: Donald E. N e tt le s
Major Field: Analytical Chemistry
Air Pollution Studies by Laser Induced Title of Thesis: IR Fluorescence and Laser Intracavity Absorption Spectroscopy
Approved:
lessor and ChairmanMajor
Dea0 of the Graduate Satuxool
EXAMINING COMMITTEE:
Date of Examination:
June 3°> 1978
Related Documents


