Air pollution and noise as large public health problems Francesco Forastiere Barcelona June 5, 2015

Air pollution and noise as large public health problems by Francesco Forastiere
Jul 30, 2015
Welcome message from author
This document is posted to help you gain knowledge. Please leave a comment to let me know what you think about it! Share it to your friends and learn new things together.
Transcript
Air pollution and noise as large
public health problems
Francesco Forastiere
Barcelona June 5, 2015
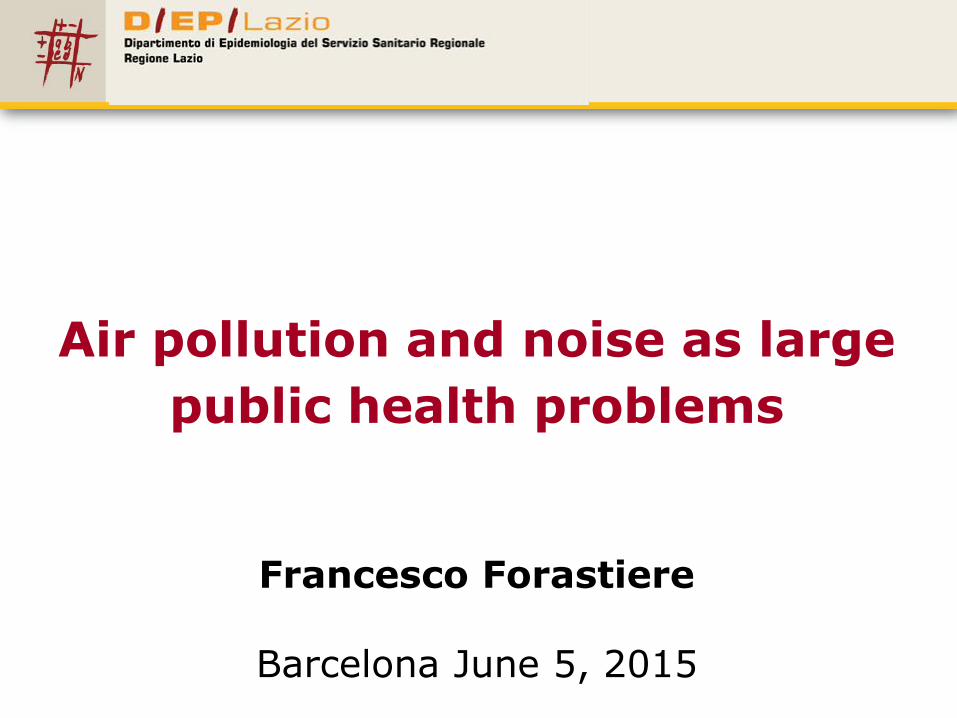
68th World Health Assembly
May 26, 2015
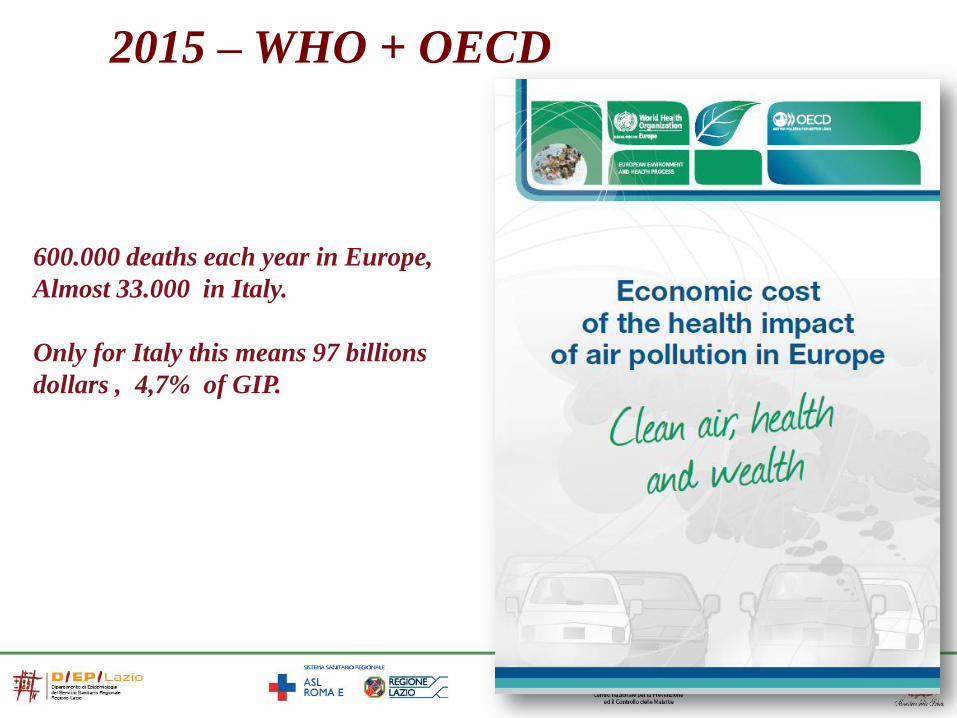
2015 – WHO + OECD
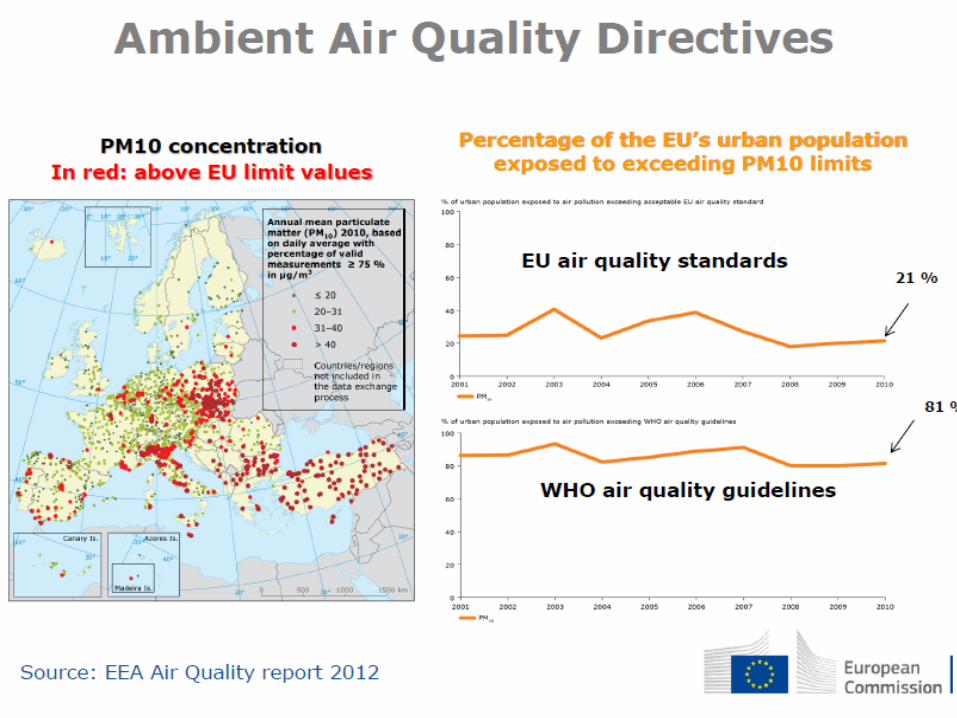
600.000 deaths each year in Europe,
Almost 33.000 in Italy.
Only for Italy this means 97 billions
dollars , 4,7% of GIP.

Fonte: Lancet 2012
GBD 2010: Air pollution is a major risk factor for public health
Lancet, 2012
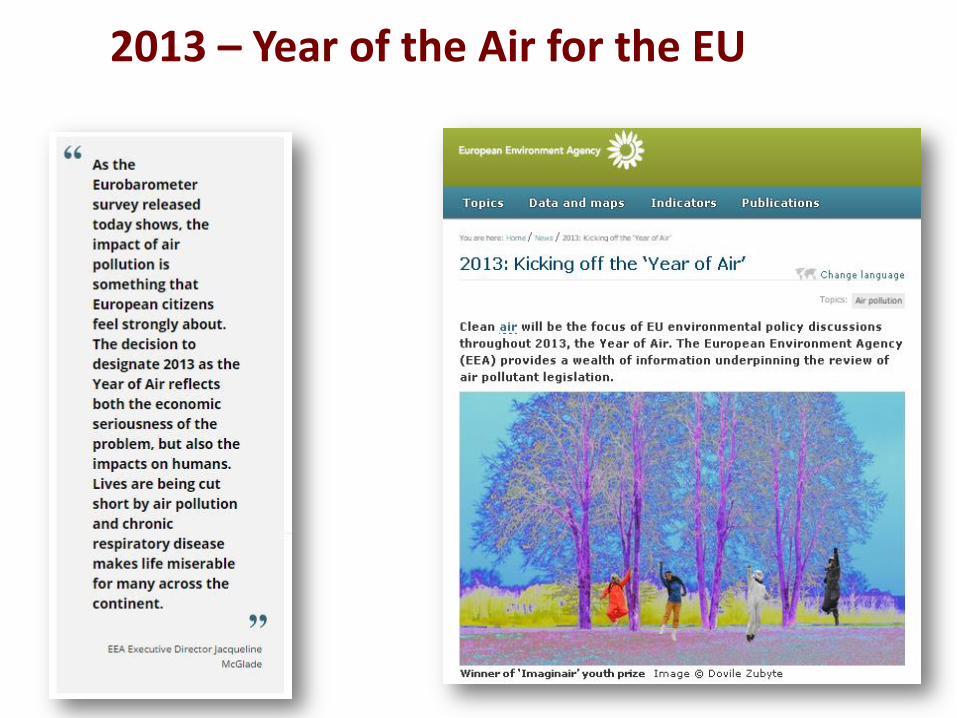
2013 – Year of the Air for the EU
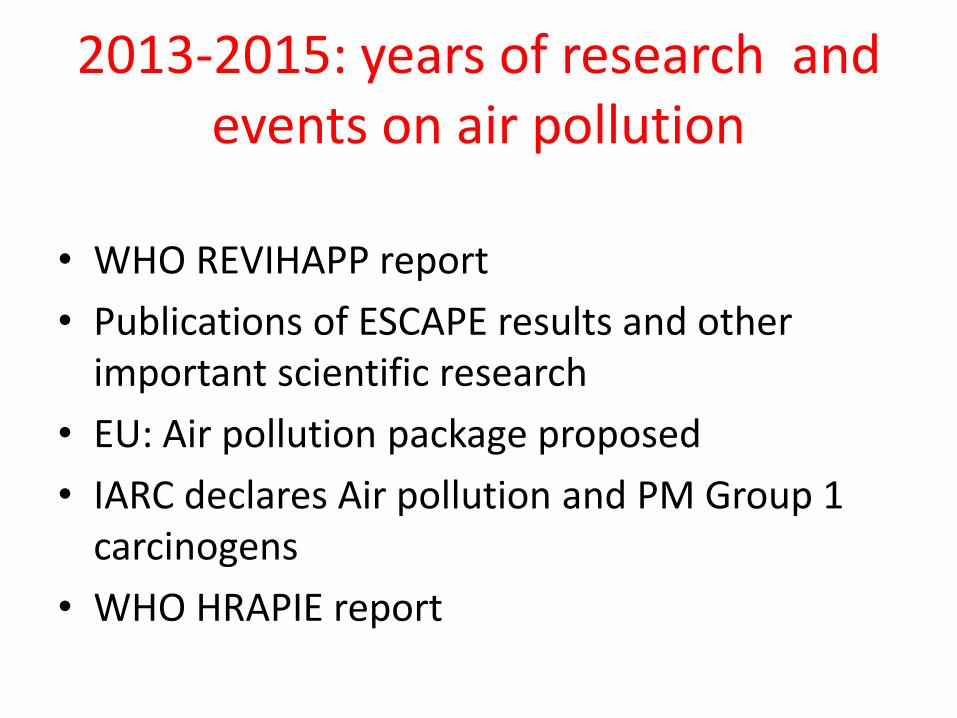
2013-2015: years of research and events on air pollution
• WHO REVIHAPP report
• Publications of ESCAPE results and other important scientific research
• EU: Air pollution package proposed
• IARC declares Air pollution and PM Group 1 carcinogens
• WHO HRAPIE report
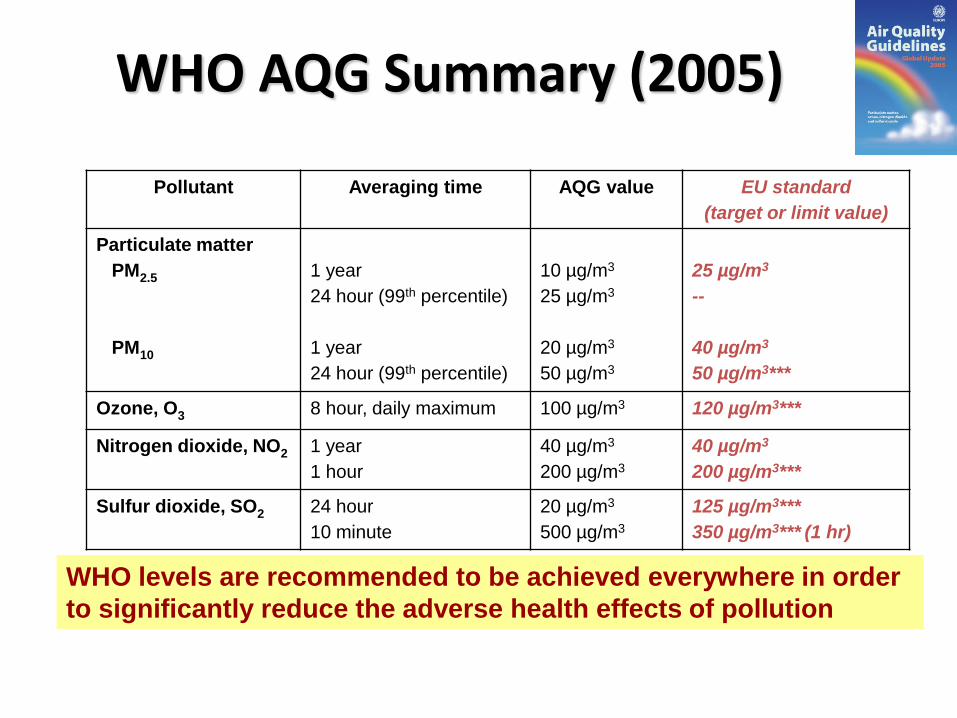
WHO AQG Summary (2005)
Pollutant Averaging time AQG value EU standard
(target or limit value)
Particulate matter
PM2.5
PM10
1 year
24 hour (99th percentile)
1 year
24 hour (99th percentile)
10 µg/m3
25 µg/m3
20 µg/m3
50 µg/m3
25 µg/m3
--
40 µg/m3
50 µg/m3***
Ozone, O3 8 hour, daily maximum 100 µg/m3 120 µg/m3***
Nitrogen dioxide, NO2 1 year
1 hour
40 µg/m3
200 µg/m3
40 µg/m3
200 µg/m3***
Sulfur dioxide, SO2 24 hour
10 minute
20 µg/m3
500 µg/m3
125 µg/m3***
350 µg/m3*** (1 hr)
WHO levels are recommended to be achieved everywhere in order
to significantly reduce the adverse health effects of pollution
***Permitted exceedances each year
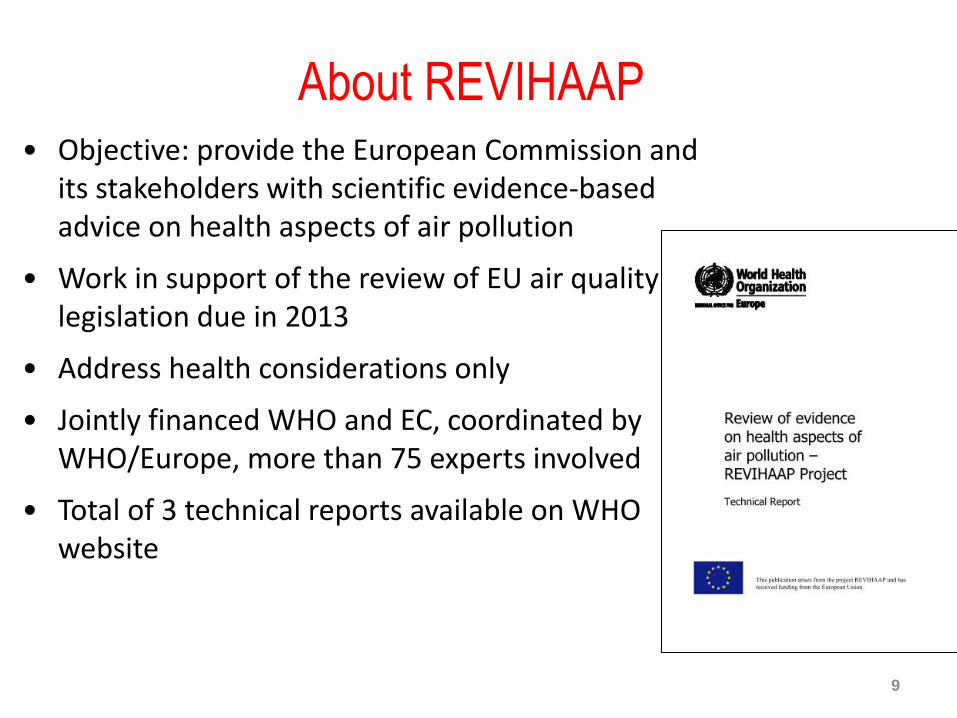
About REVIHAAP
9
• Objective: provide the European Commission and its stakeholders with scientific evidence-based advice on health aspects of air pollution
• Work in support of the review of EU air quality legislation due in 2013
• Address health considerations only
• Jointly financed WHO and EC, coordinated by WHO/Europe, more than 75 experts involved
• Total of 3 technical reports available on WHO website
26 Key policy-relevant questions for the EU
10
• Covers regulated air pollutants at EU level:
• Mainly PM, ozone, NO2, SO2, metals (As, Cd, Hg, Pb, Ni), PAHs
• New findings regarding health effects
• Concentration-response functions and thresholds, use for health
impact assessment and cost-benefit analysis
• Air pollution constituents and sources
• Integration of evidence and policy implications
• WHO air quality guidelines
• EU policies
• Critical data gaps

Evidence on health effects of PM
• The scientific conclusions of the 2005 WHO Guidelines about the evidence for a causal link between PM2.5 and adverse health outcomes in humans have been confirmed and strengthened and, thus, clearly remain valid
• New studies on short- and long-term effects
• Studies linking long-term exposure to PM2.5 to several new health outcomes (e.g. atherosclerosis, adverse birth outcomes, childhood respiratory disease, neurodevelopment and cognitive function, diabetes)
• Associations between long-term exposure to PM2.5 and mortality at levels below the current annual WHO AQ 11
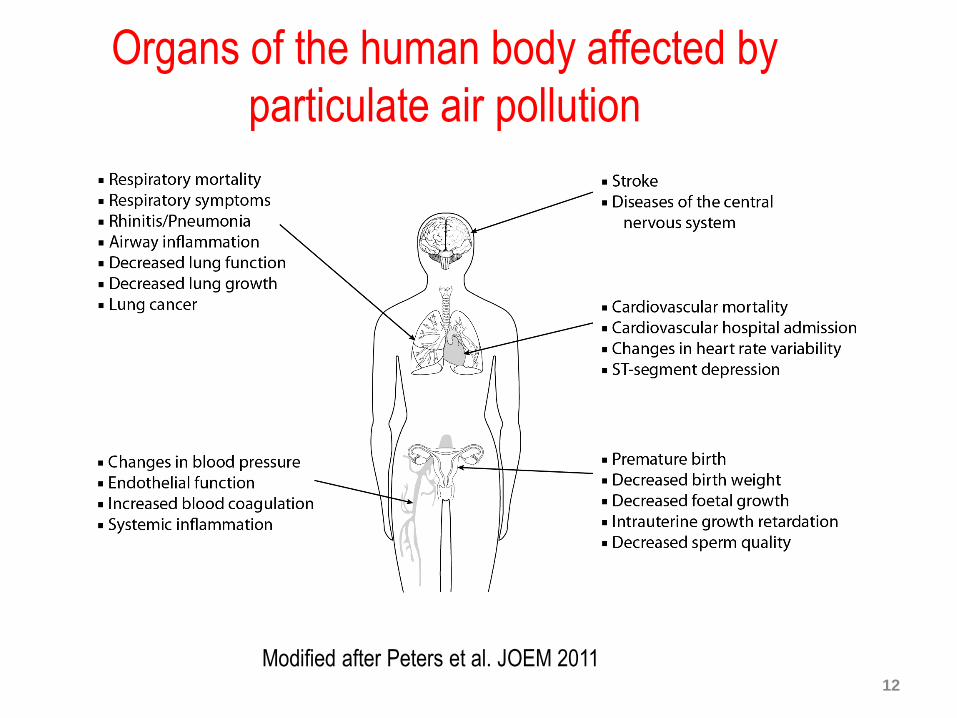
Organs of the human body affected by
particulate air pollution
12
Modified after Peters et al. JOEM 2011
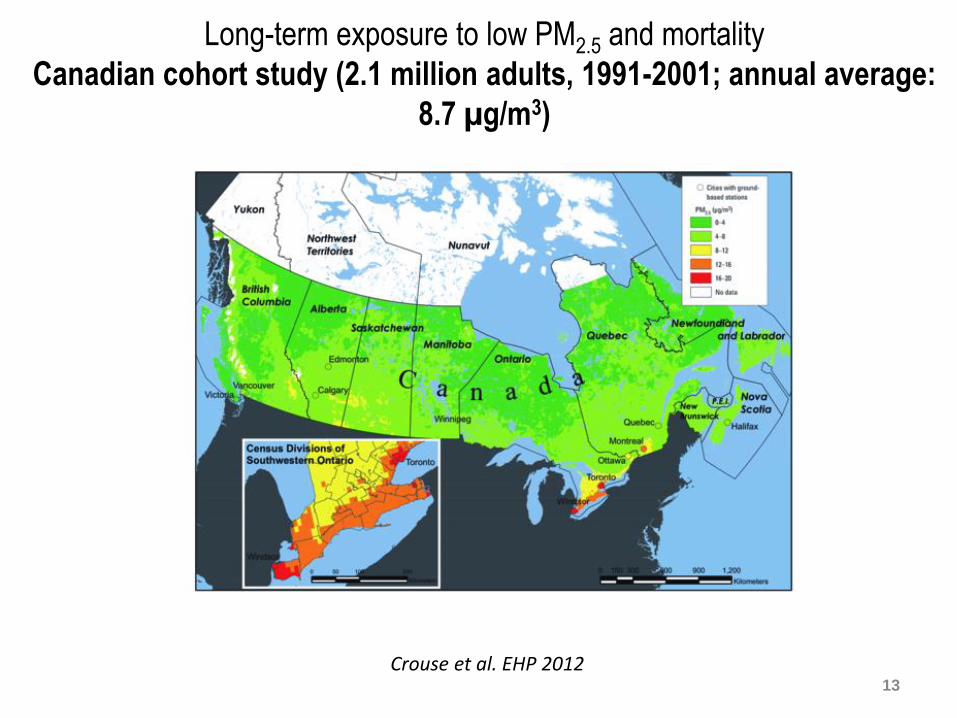
Long-term exposure to low PM2.5 and mortality
Canadian cohort study (2.1 million adults, 1991-2001; annual average:
8.7 µg/m3)
13
Crouse et al. EHP 2012
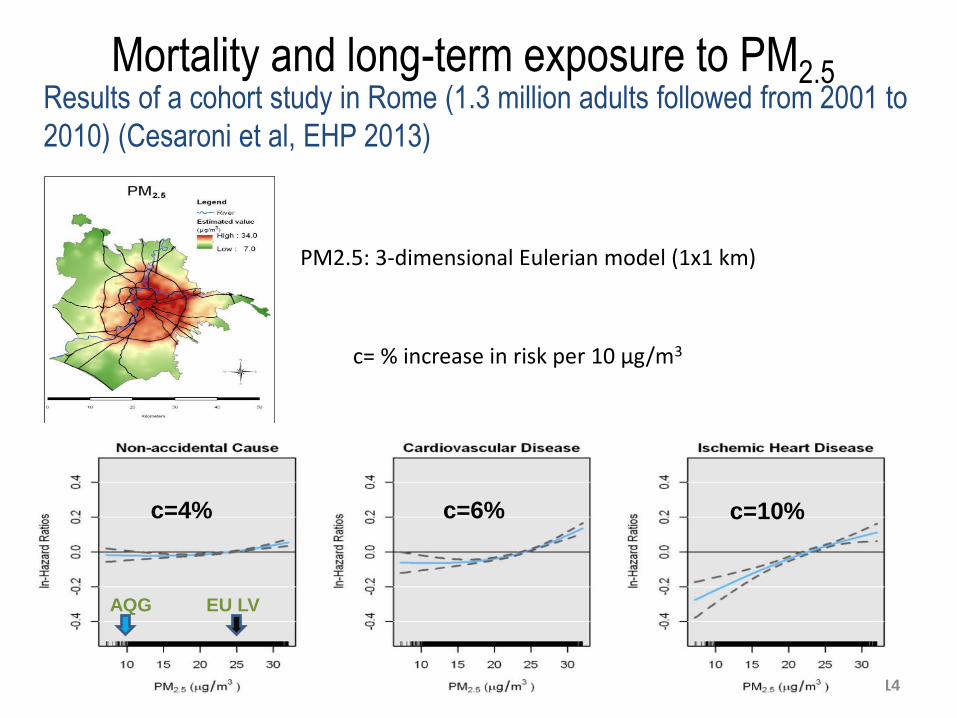
Mortality and long-term exposure to PM2.5
14
Cesaroni et al. EHP 2013
c=10% c=6% c=4%
AQG EU LV
Results of a cohort study in Rome (1.3 million adults followed from 2001 to
2010) (Cesaroni et al, EHP 2013)
PM2.5: 3-dimensional Eulerian model (1x1 km)
c= % increase in risk per 10 µg/m3
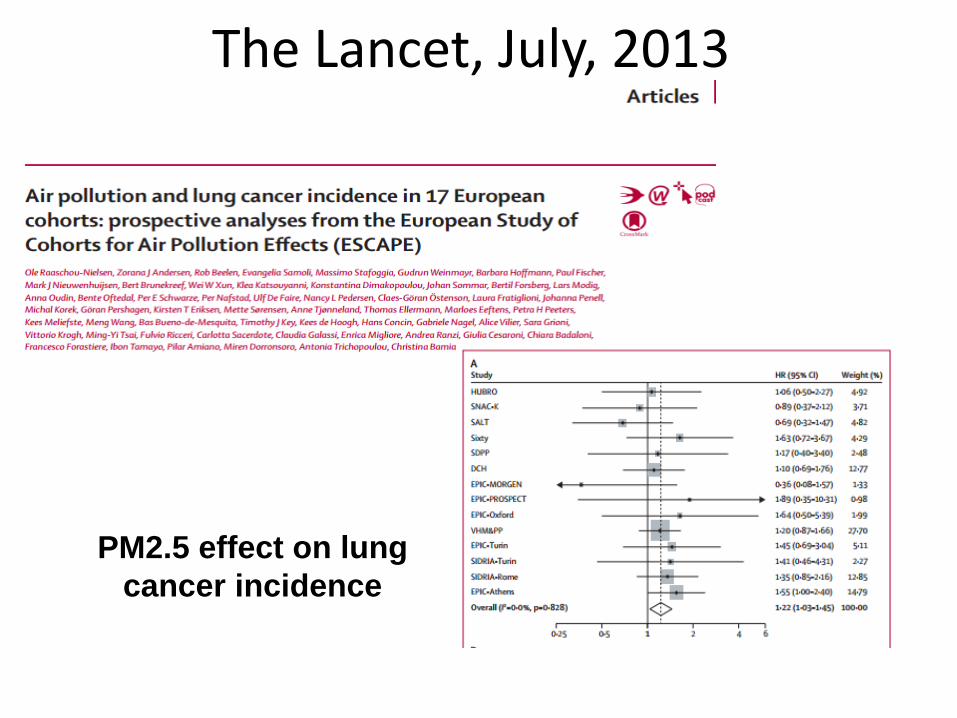
The Lancet, July, 2013
PM2.5 effect on lung
cancer incidence
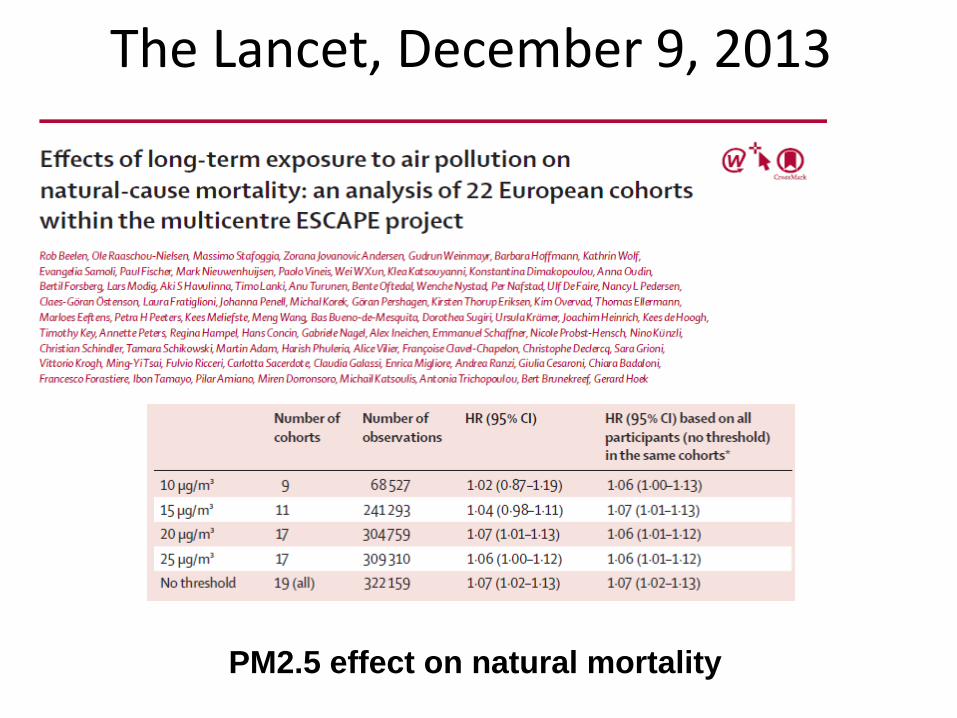
The Lancet, December 9, 2013
PM2.5 effect on natural mortality
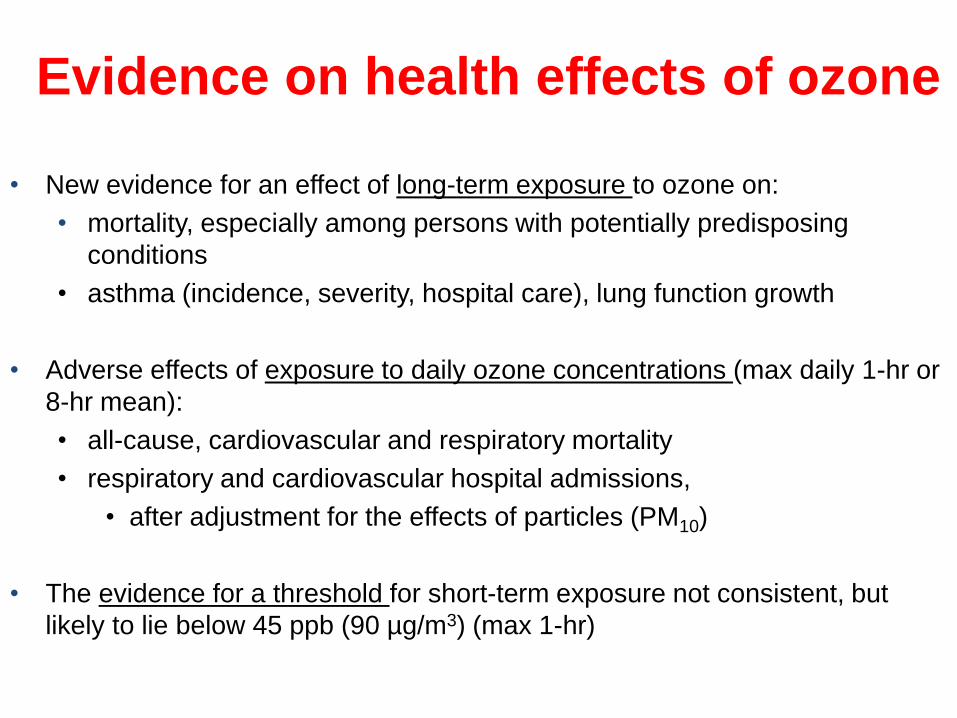
Evidence on health effects of ozone
• New evidence for an effect of long-term exposure to ozone on:
• mortality, especially among persons with potentially predisposing
conditions
• asthma (incidence, severity, hospital care), lung function growth
• Adverse effects of exposure to daily ozone concentrations (max daily 1-hr or
8-hr mean):
• all-cause, cardiovascular and respiratory mortality
• respiratory and cardiovascular hospital admissions,
• after adjustment for the effects of particles (PM10)
• The evidence for a threshold for short-term exposure not consistent, but
likely to lie below 45 ppb (90 µg/m3) (max 1-hr)

Evidence on health effects of NO2
• New studies on associations between day-to-day variations in NO2 and
variations in mortality, hospital admissions, and respiratory symptoms.
• New studies on associations between long-term exposure to NO2 and
mortality and morbidity.
• Both short- and long-term studies found these adverse associations at
concentrations at or below the current EU LV (= WHO AQG).
• Associations (short-term NO2) remain after adjustment for other pollutants
(including PM10, PM2.5, black smoke).
– … it is reasonable to infer that NO2 has some direct effects.
– No health evidence to suggest changing the averaging time for
the short-term EU limit value (1-hour).

REVIHAAP Main conclusions
• Considerable amount of new scientific information on health effects of mainly PM, ozone and NO2 has been published in the recent years
– Evidence has strengthened
– Effects observed at levels commonly present in Europe
– Supports the scientific conclusions of the WHO Air Quality Guidelines, last updated in 2005
– Indicates that the effects can occur at air pollution concentrations lower than those serving to establish the 2005 Guidelines
• Provides scientific arguments for the decisive actions to improve air quality and reduce the burden of disease associated with air pollution in Europe. 20

IARC Monographs

Health Impact Assessment (HIA)
A combination of procedures, methods and tools by which a policy, programme or project may be judged as to its potential effects on the health of a population, and the distribution of those effects within the
population
WHO, European Centre for Health Policy. Gothenburg Consensus Paper,
Health Impact Assessment- main concepts and suggested approach. Brussels, 1999.
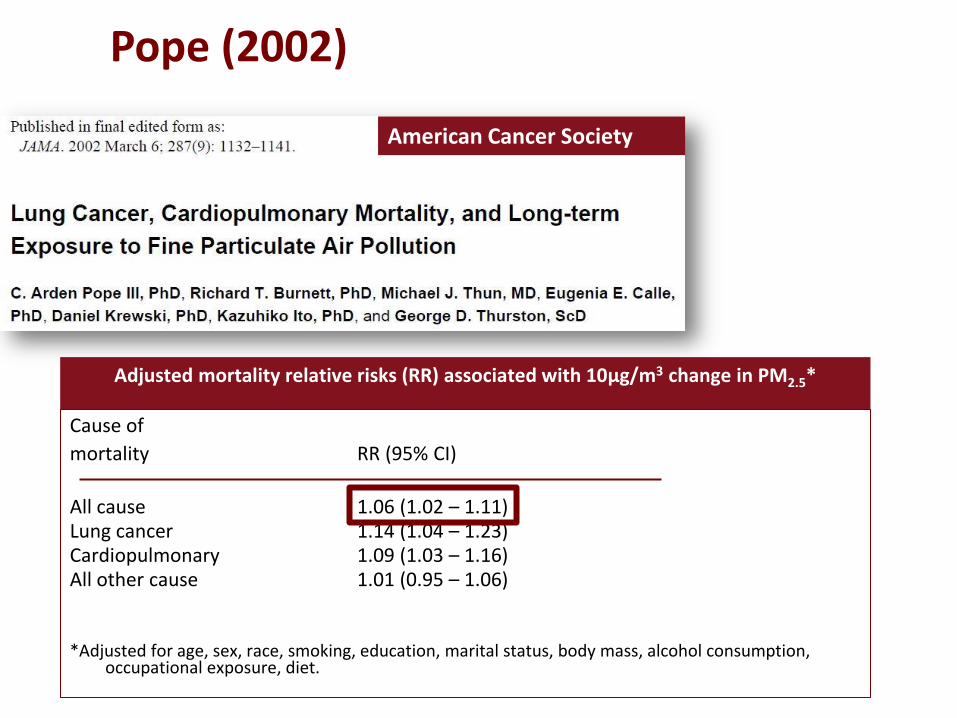
Pope (2002)
American Cancer Society
Adjusted mortality relative risks (RR) associated with 10μg/m3 change in PM2.5*
Cause of
mortality RR (95% CI)
All cause 1.06 (1.02 – 1.11) Lung cancer 1.14 (1.04 – 1.23) Cardiopulmonary 1.09 (1.03 – 1.16) All other cause 1.01 (0.95 – 1.06) *Adjusted for age, sex, race, smoking, education, marital status, body mass, alcohol consumption,
occupational exposure, diet.
Available systematic review: January 2013
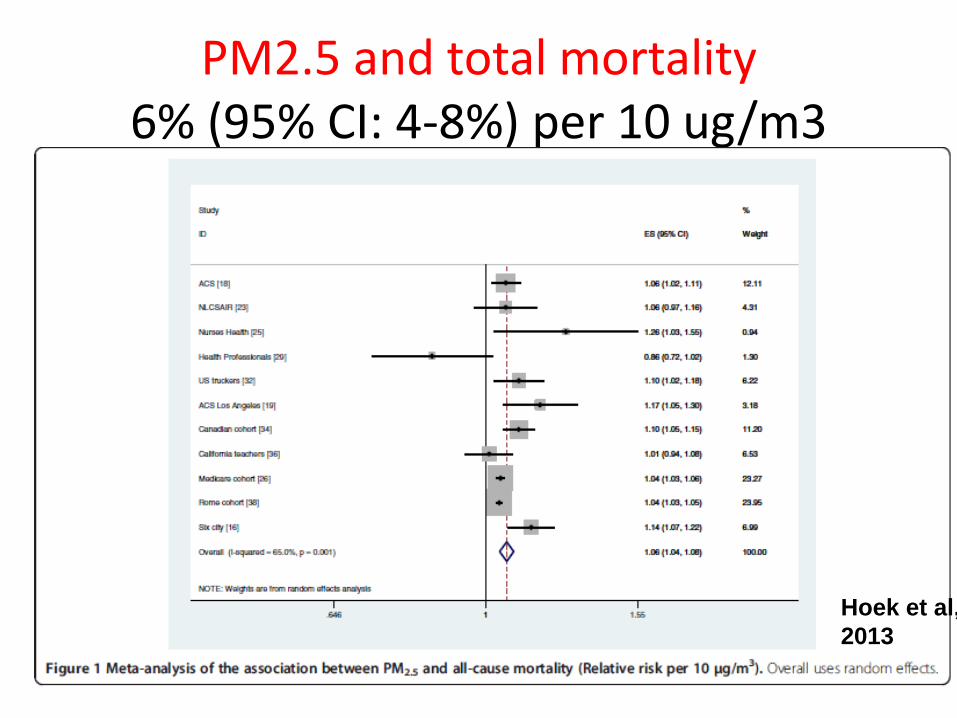
PM2.5 and total mortality 6% (95% CI: 4-8%) per 10 ug/m3
Hoek et al,
2013

Studies after Hoek 2013
• ACS California subcohort (Jerrett, 2013)
73,711 subjects living in California, 1982 – 2000
• National English cohort (Carey, 2013) 835,607 patients from general practice, 2003-2007
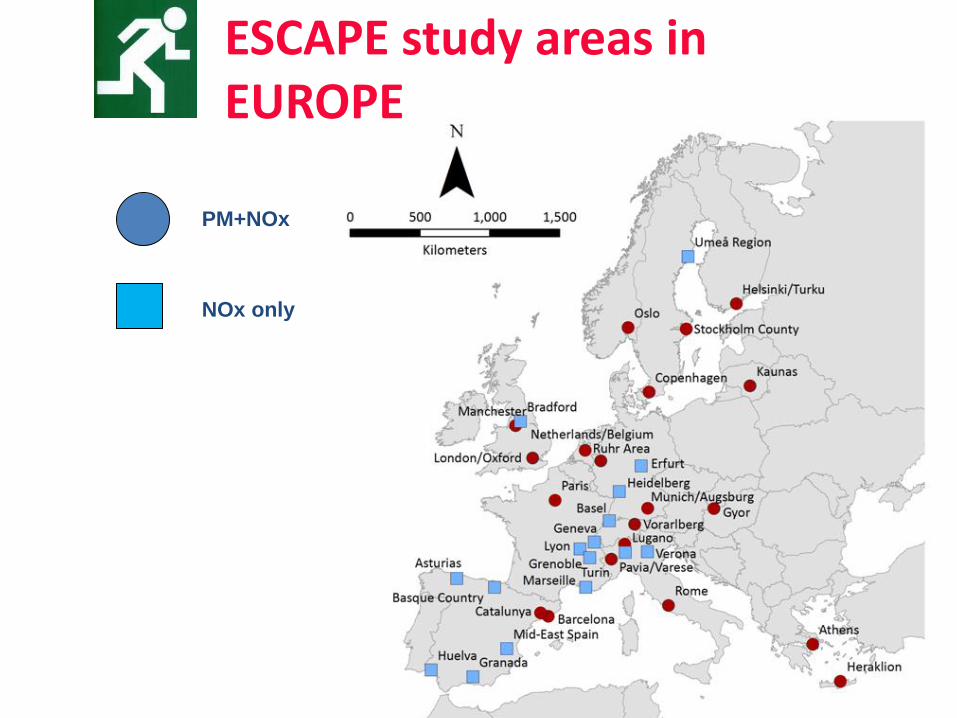
• Escape (Beelen, 2014)
367,251 participants from 22 European cohorts 1985-2008
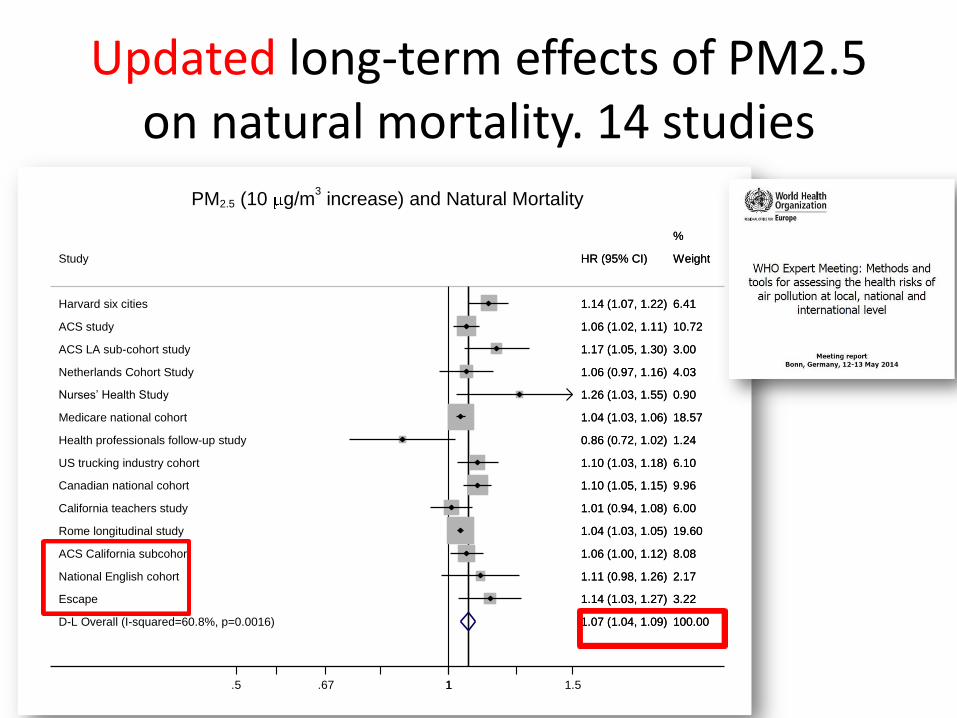
Updated long-term effects of PM2.5 on natural mortality. 14 studies
D-L Overall (I-squared=60.8%, p=0.0016)
US trucking industry cohort
Nurses’ Health Study
Study
Medicare national cohort
ACS LA sub-cohort study
Escape
Canadian national cohort
Harvard six cities
California teachers study
ACS study
Netherlands Cohort Study
ACS California subcohort
Rome longitudinal study
Health professionals follow-up study
National English cohort
1.07 (1.04, 1.09)
1.10 (1.03, 1.18)
1.26 (1.03, 1.55)
HR (95% CI)
1.04 (1.03, 1.06)
1.17 (1.05, 1.30)
1.14 (1.03, 1.27)
1.10 (1.05, 1.15)
1.14 (1.07, 1.22)
1.01 (0.94, 1.08)
1.06 (1.02, 1.11)
1.06 (0.97, 1.16)
1.06 (1.00, 1.12)
1.04 (1.03, 1.05)
0.86 (0.72, 1.02)
1.11 (0.98, 1.26)
100.00
6.10
0.90
Weight
18.57
3.00
3.22
%
9.96
6.41
6.00
10.72
4.03
8.08
19.60
1.24
2.17
1.5 .67 1 1.5
PM2.5 (10 g/m3 increase) and Natural Mortality
The Impact of Air Pollution in Italy: PM2.5 and NO2
Roma, 4 giugno 2015
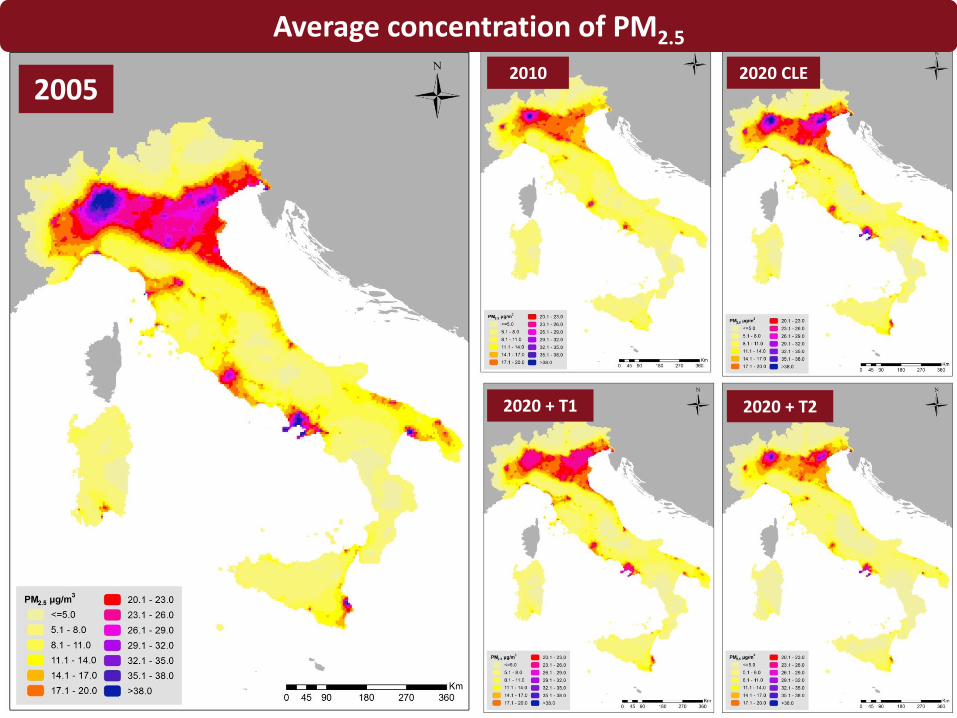
2005 2010 2020 CLE
Average concentration of PM2.5
2020 + T1 2020 + T2

2005
2010 2020 CLe
Mortality rate attributable to PM2.5
2020 + T1 2020 + T2

Months of life lost due to PM2.5
Noise and CVD diseases
Cardiovascular diseases (CVD) leading cause of death in Europe
Increasing evidence that environmental noise may increase the risks of cardiovascular diseases and hypertension
WHO: Burden of disease from environmental noise: quantification of healthy life years
lost in Europe. Copenhagen, Denmark: WHO Regional Office for Europe; 2011.
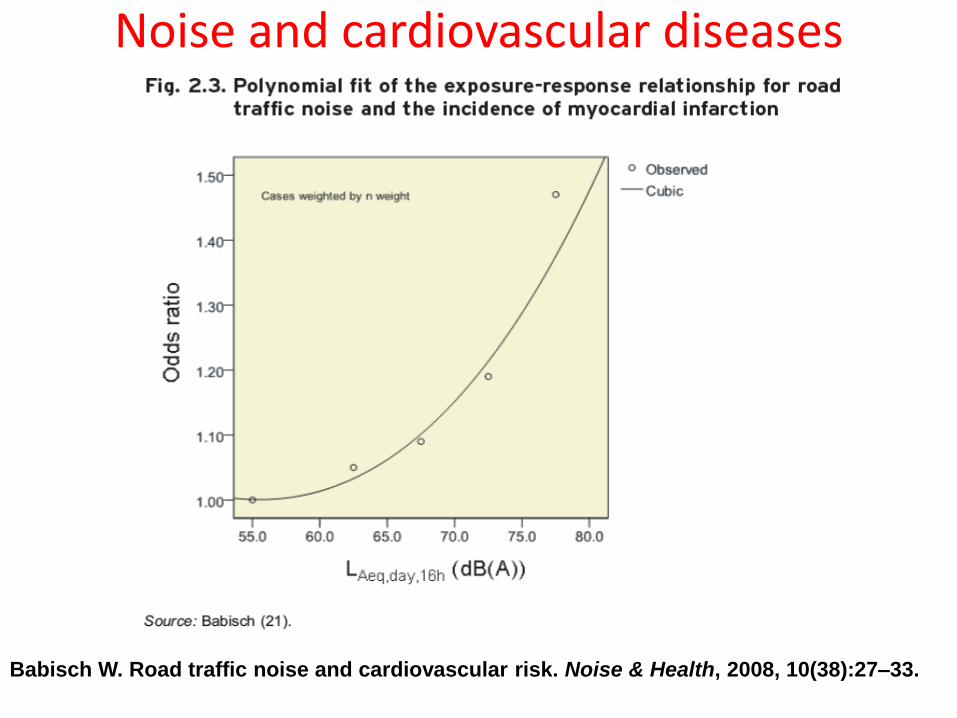
Noise and cardiovascular diseases
Babisch W. Road traffic noise and cardiovascular risk. Noise & Health, 2008, 10(38):27–33.
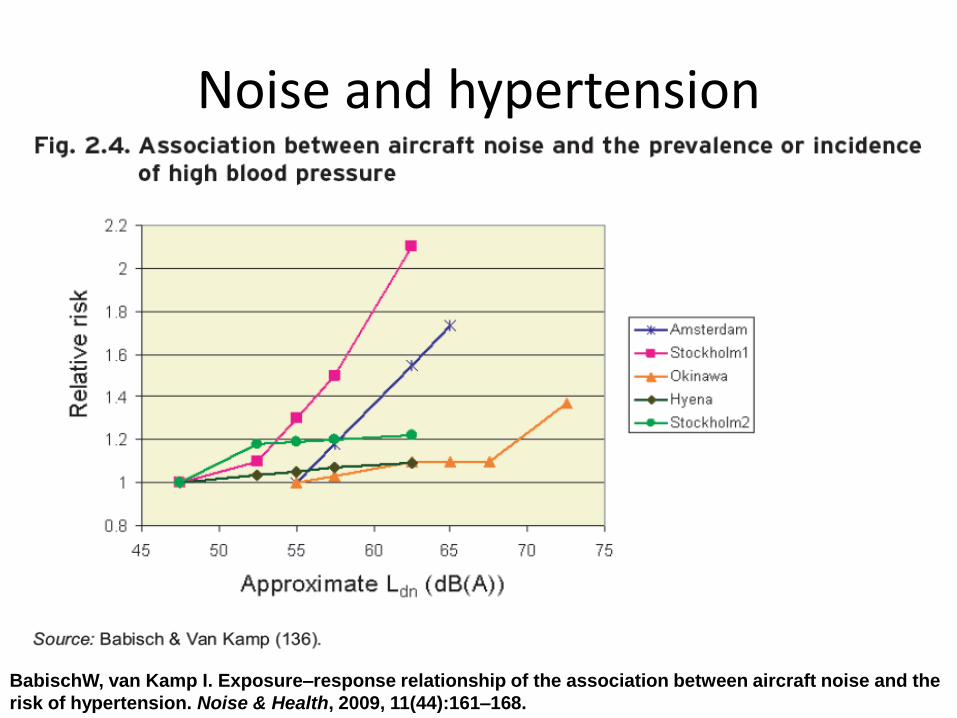
Noise and hypertension
BabischW, van Kamp I. Exposure–response relationship of the association between aircraft noise and the
risk of hypertension. Noise & Health, 2009, 11(44):161–168.

Future studies on noise Future epidemiological noise research will need to focus on: •vulnerable groups •sensitive hours of the day •coping mechanisms •differences between noise sources •possible confounding with air pollution •differences between objective (noise level) and subjective (noise perception) exposure •multiple exposures (home, work and leisure environments) •New outcomes (stroke, respiratory illnesses)
Babisch W. WHO, 2011

THANK YOU FOR YOUR
ATTENTION!
Related Documents