Research AIR P OF G INFO C. RAVET Paper 27 POLLU GOVER RMAT TTI, Y.POP | 2014 UTION RNME TION PP JIN, M N IN U ENT-CO . QUAN, Z RBAN ONTR Z. SHIQIU, N BEIJ ROLLE , T.SWANS ING: T ED SON THE R ROLE

Welcome message from author
This document is posted to help you gain knowledge. Please leave a comment to let me know what you think about it! Share it to your friends and learn new things together.
Transcript
Research
AIR POF GINFO
C. RAVET
Paper 27
POLLUGOVER
RMAT
TTI, Y.POP
| 2014
UTIONRNMETION
PP JIN, M
N IN UENT-CO
. QUAN, Z
RBANONTR
Z. SHIQIU,
N BEIJROLLE
, T.SWANS
ING: TED
SON
THE RROLE
Air pollution in urban Beijing: the role ofgovernment-controlled information
Chiara Ravetti∗† Yana Popp Jin‡ Mu Quan† Zhang Shiqiu†Tim Swanson∗
September 12, 2014
Abstract
This paper looks at the problem of information control behind the unsustainablelevels of air pollution in Chinese cities. In particular, it focuses on a large urban area,Beijing, and it examines the role of the public information and the adaptation choices ofhouseholds in response to high pollution. Our analysis is based on an empirically analysisof two air pollution indexes from different sources, one public and one foreign. We alsoexamine agents’ behaviour in response to pollution peaks in an original household surveycollected in Beijing. We find that the official air pollution values are systematicallydistorted, creating perverse incentives for households to react to bad air quality, especiallyfor people who rely on government-controlled sources of information.
Keywords: Air Pollution; Government; Information; Averting Behaviour; Sustainability.
JEL Classification: Q53, Q56, Q58.
This research has received funding from the EU Seventh Framework Programme (FP7/2007-2013) under the grant agreement n. 266992 (GLOBAL IQ). All comments welcome.
∗Corresponding author.†Centre for International Environmental Studies (CIES), Graduate Institute of Geneva (IHEID), Maison
de la Paix, Ch. . Eugène-Rigot 2, CH-1211, Geneva, Switzerland [email protected].‡Peking University, College of Environmental Sciences and Engineering, Beijing, China.

Introduction
Air quality affects in many different ways a country’s economy and society, including itsecosystems, productive capacity and human health. However, many developing countries are stillfar from ensuring a sustainable amount of clean air,1 especially in their urban centres. Chinais a striking example of this problem, as it prioritized over the years economic growth overpollution reduction, and has not managed insofar to ensure sustainable environmental quality.2In addition to the challenges of rapid urbanization and industrialization, however, Chinese peopleface a further difficulty in their path towards sustainability, since they live in a country tightlycontrolled by a single party, which may not have incentives to reduce air pollution. In particular,in China we observe that information about pollution is under the control that the CommunistParty, through the national media. Any private effort to demand cleaner air or to defend againstpollution could be diverted using information controls by the government. In this research,we analyse how this creates large difficulties in achieving sustainable air quality, i.e. at levelsthat are not beyond thresholds of significant health damage. To do so, we explore why thegovernment may want to release misleading pollution data, if indeed there is evidence for thisdistorted signal, and how it can affects households’ adaptive choices with respect to this crucialenvironmental issue in urban China.
Air quality is a key problem for Chinese cities: 7 out of 10 of the most polluted cities in theworld are in China, Beijing being one of them (Bank, 2007). Moreover, air pollution is notonly a significant issue for the population of Chinese cities, but it also affects the surroundingecosystems and can even be relevant at the global level for international actions such as climatechange mitigation. 3Nonetheless, it is fundamental to consider that the incentives that anautocratic government faces in dealing with local air pollution are quite different from thoseof a democratic country. In a single party regime with virtually full control of the media, thegovernment may act as a stumbling block between environmental sustainability and the demandof the population, rather than as a solution.
In this study, we first model the behaviour of the (autocratic) social planner when choosingpollution levels and information about it, and that of households when choosing about labourprovision in polluted cities and adaptation to bad air quality. Then we analyse how the Chinesegovernment deals with pollution information: we examine the discrepancy between Chinese
1 The concept of sustainability applied to air pollution relates mostly to its harmful effect on human health, i.e.a concentration of particulates and chemical substances sufficiently low not to cause in the population hazardousrates of airborne diseases. This concentration is usually measured in terms of air quality indexes, which arediscussed in detail in section 2.1.
2Consider for instance the fact that, for the 10th Five-Year Plan period (2001 − 2005), almost half of theenvironmental protection targets set were not met. Some significant pollution indicators, such as sulfur dioxide(SO2) and particulate emissions, rose instead of falling as required by the plan (Bank, 2007).
3Since there exist many complementarities in the policies that reduce local and global pollutants (Pittel andRubbelke (2008)), China could reap some tangible and localized benefits from reducing global emissions. Thiscould provide a significant incentive for a developing country like China to participate in international climatechange negotiation, while improving the domestic environment.
2

reported levels of pollution and those indicated by the US embassy in Beijing and we find thatthe two differ substantially, especially around important thresholds. Afterwards, we analyse thehousehold dimension of the problem, focusing on the choice of various self-protecting measures,such as wearing a mask, reducing leisure time outdoor, or changing means of transportation.We identify the role of the information signal on those people who rely on the governmentinformation and consider it sufficient, as opposed to those who prefer to use the internet, thosewho do not care, and those who would like more information. We find that most households relyon the public (government controlled) media, and those who fully trust it are then those who,during high pollution days, take less protective actions.
The rest of the paper is organized as follows: the Background section contextualizes this researchwithin the existing literature; next, the section on Government explores the evidence about datadistortions in Beijing’s air pollution index; and then the section on Households moves to theprivate dimension and proposes some empirical findings about averting behaviour with differentsources of information.
1 Background
The problem of air pollution damages to humans has been well studied from an environmentaland health perspective. In the epidemiological literature, a positive relationship between airpollutants and adverse health outcomes has been identified consistently across a variety ofstudies in developed countries (Ren and Tong, 2008). In the developing world, the research onmortality and morbidity outcomes of air pollution is scarcer, but to date a number of studieselicit exposure-response functions specific to poorer countries.4 In mainland China, the keyepidemiological studies have been summed up in a comprehensive meta-analysis by Aunan andPan (2004), to which we can add some recent cohort studies, such as Qiu et al. (2012) or Zhanget al. (2012) . Although the magnitude of the air-pollution effects varies across studies andpollutants, the literature mostly agrees that exposure to air pollution is damaging for healtheven in the short run.
This medical literature, however, assumes no adaptation mechanisms from the side of economicagents, and this can be problematic whenever the exact individual exposure to pollutants cannotbe measured - as it is often the case in developing country’s studies. Depending on people’sawareness of the problem, there can be different attempts to avoid the negative consequencesof bad outdoor air. Therefore, building on the well-established epidemiological relationshipbetween pollution and airborne diseases, a number of papers have explored the socio-economicmechanisms that surround this relation. The key question is to what extent people can and wantto defend themselves against the damages of pollution, and therefore would “buy” air quality.
4See, for example, El-Fadel and Massoud (2000) for Lebanon, Sakulniyomporn et al. (2011) for Thailand,Braga et al. (2001) for Brazil, Foster and Kumar (2011) for India.
3

For this purpose, two strands of microeconomic research have developed, tackling the problem indifferent, interlinked ways: a) the rich literature on stated willingness to pay for a public goodsand for avoiding incurring the cost of illness, and b) various measures of averting behaviour andaverting expenditures. The former can also be extended to the determinants of the value ofa statistical life, and usually exploit an experimental approach focused on individual choices.Prominent examples in developing countries include Alberini et al. (1997) for Taiwan, Cifuenteset al. (2001) for Chile, Viscusi and Aldy (2003) for a cross country comparison.
The literature on averting behaviour studies self-protective measures against environmentalhazards: beginning with Ehrlich and Becker (1972), it diffused the idea that people could allocatepart of their income or efforts to risk-reduction. This is especially important whenever insurancemarkets are not perfect and in the presence of intangible values which have no market substitutes,such as good health (Simmons and Kruse (2000), Cook and Graham (1977b)). Empiricalresearch in this direction finds that indeed people combine market and non-market strategiesto avoid uncertain damages (Simmons and Kruse (2000), Talberth et al. (2006), Whitehead(2005)). However this empirical literature encounters several methodological difficulties, due tothe endogeneity of averting behaviour.
A small fraction of these studies focuses on aspects concerning the level of information thatpeople can obtain regarding the risks and damages of a pollutant. This can be a substantial issuefor developing countries, where the flow of information and data to the general population mightbe, for various reasons, less efficient (Somanathan, 2010). For example, Jalan and Ravallion(2003) noted that clean water can be effective in improving children’s health (reducing diarrhoea),but it requires a level of knowledge and awareness of the mothers to reach the poorest children.5
The case of China is particularly interesting for the peculiar interplay between an environmentalproblem, air pollution, information regarding it, and household adaptation. In a context oftightly controlled data and media communication by the Communist Party, Beijing offers aninteresting case study for the comparison between the official Chinese data on air pollution fromthe Ministry of Environmental Protection (MEP) and an alternative source of information aboutair quality, provided by the hourly tweet from the US embassy in Beijing. People living in thecapital can therefore choose whether to trust the government or to look for alternative sourcesof information, such as the internet, self-perception of air pollution, word of mouth from otherpeople, etc.
The contribution of our research is twofold: firstly, we want to explain why an autocraticgovernment should decide to distort information about pollution, and then identify in the dataif indeed the Chinese government manipulates air pollution information, by contrasting it withthe US index. Secondly, we would like to examine how this distorted signal can reflect intohousehold behavioural choices and attitudes towards pollution. In order to d that, we motivateour empirical analysis with a simple theory explaining the choices of households and of thegovernment.
5See also Jalan and Somanathan (2008) for the importance of information about environmental risks foraverting behaviour, again in the case of water.
4
2 Government
First of all, what measures and tools does the government use to communicate to a publicaudience the monitored levels of pollutants’ concentration at a given point in time? Typically,public agencies monitor and diffuse the information about a city’s pollution parameters throughair quality indexes, providing a public good which otherwise is likely to be under-supplied bythe private sector. The government has a pivotal role in determining the population’s awarenessof pollution risks, even on a daily basis.
2.1 Indexes of air pollution
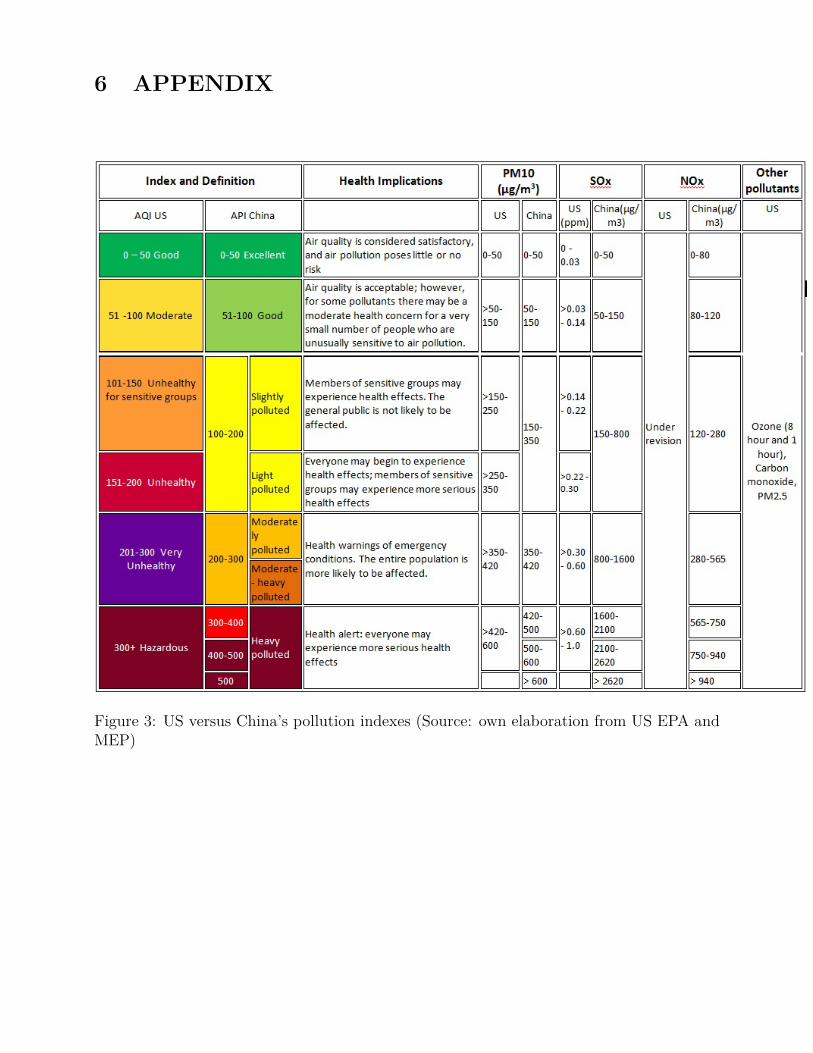
The standard tools used in the USA, Canada, the European Union and many other countriesto communicate to the general public the level of pollution are standardized indexes - AirQuality Indexes or AQI - that can easily convey information about the level of pollution througha simple rating of air quality. This is more understandable than reporting concentration ofindividual pollutants. The index score reported is then associated with the potential healthdamages that can derive from it. Generally cities and municipalities are required to report asimple scale, coloured to highlight the gravity of the environmental situation. China has alsoan Air Pollution Index (API) that is in many aspects similar to the one developed by the USEnvironmental Protection Agency (EPA). Both US AQI and Chinese API are non-linear inpollution concentration. A comparison is presented in Figure 3 in the Appendix.
The Chinese Air Pollution Index or the US Air Quality index on a given day corresponds to thehighest index value given by any of the pollutants which compose it.
API = max(I1, I2, ...In) (1)
In order to construct the index for an observed concentration C of pollutant i, the followingformula is used:
Ii = (C − Clow) Ihigh − Ilow
Chigh − Clow
+ Ilow (2)
where high and low indicate the boundaries of each category mentioned in Fig. 3 (BeijingMunicipal Environment Monitoring Centre and US-EPA 2006). While the construction of theindex is identical between the two countries, the boundaries of concentration for some of thepollutants are sometimes different (see for instance SOx), and between 100 and 300 some of thecategories are defined differently. But generally, it is clear that a scale above 100 indicates thepresence of pollution, and anything above 300 is highly polluted and hazardous.
5
2.2 Local incentives to distort information
The literature suggests that some incentive to manipulate data may occur at the local level. Theinstitutional framework of Chinese politics presents a strongly hierarchical relationship betweenlocal and central government. 6 This structure is based on a system of vertical bureaucraticcontrol, which allows some flexibility at the local level, but no true decentralization (Tsui andWang, 2004). Local government officers are responsible for economic targets and, more recently,also for some environmental performance evaluations, which however still represent a secondaryconcern (Xu, 2011).
It is therefore important to consider that there can be also local incentives for distortinginformation about environmental problems, to make them appear less significant to the centralgovernment. A clear incentive for such distortions comes from the National EnvironmentalProtection Model City award, started in 2003, which prizes cities that, among other things, canachieve more than 85% of “ blue sky days” in a year (API less than 100). Some evidence ofthis local effects has been found by Andrews (2008) and Chen et al. (2013), who analysed APIdata and found that air pollution data had been manipulated in various ways: from shiftingmonitoring stations to less polluted areas, to discontinuities just around the threshold of bluesky days .
2.3 Comparing the US AQI with Chinese API
Beijing is an excellent case study to search for distortions in the API, since it has the uniquefeature of having one useful counter-check to official data: the United States Embassy, whichhas its own monitor for particulate matter. Therefore, it is possible to conduct a comparativeanalysis of the two indexes produced by the Chinese and the US for the same time period,and see if the discrepancy between the two presents any pattern. Fig. 1 below shows a simplecomparison of the two daily indexes during some months of 2008.
Even from such a stylized graphical comparison, it is clear that the two indexes can take verydifferent values in the same day. This could be due to some measurement error, but we noticethat a pattern seems to exist. The Chinese index, in red, tends to be lower than the US one(blue) and rarely surpasses the blue sky day limit of an API of 100. Moreover, the Chinese indextends to be downward biased especially in highly polluted days, when the difference from the USAQI becomes greater, while for not so polluted days the two become more similar. Nonetheless,this the image depicts only a short period of time, so we extend our analysis to a longer time
6The observation that organization and hierarchy can generate different incentives and outcomes is not new,Maskin et al. (2000) for instance test this hypothesis with Chinese data on managers’ incentives, using a broadermodel applicable to government structures.
6
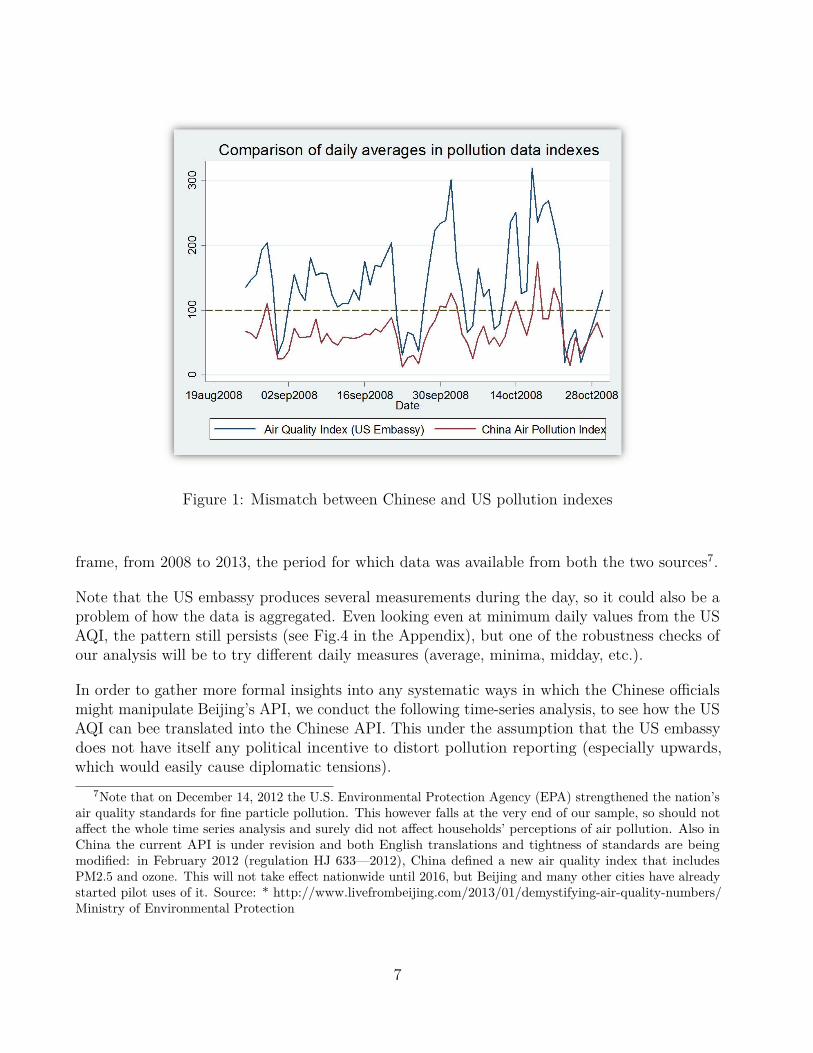
Figure 1: Mismatch between Chinese and US pollution indexes
frame, from 2008 to 2013, the period for which data was available from both the two sources7.
Note that the US embassy produces several measurements during the day, so it could also be aproblem of how the data is aggregated. Even looking even at minimum daily values from the USAQI, the pattern still persists (see Fig.4 in the Appendix), but one of the robustness checks ofour analysis will be to try different daily measures (average, minima, midday, etc.).
In order to gather more formal insights into any systematic ways in which the Chinese officialsmight manipulate Beijing’s API, we conduct the following time-series analysis, to see how the USAQI can bee translated into the Chinese API. This under the assumption that the US embassydoes not have itself any political incentive to distort pollution reporting (especially upwards,which would easily cause diplomatic tensions).
7Note that on December 14, 2012 the U.S. Environmental Protection Agency (EPA) strengthened the nation’sair quality standards for fine particle pollution. This however falls at the very end of our sample, so should notaffect the whole time series analysis and surely did not affect households’ perceptions of air pollution. Also inChina the current API is under revision and both English translations and tightness of standards are beingmodified: in February 2012 (regulation HJ 633—2012), China defined a new air quality index that includesPM2.5 and ozone. This will not take effect nationwide until 2016, but Beijing and many other cities have alreadystarted pilot uses of it. Source: * http://www.livefrombeijing.com/2013/01/demystifying-air-quality-numbers/Ministry of Environmental Protection
7
The time series model specification is the following:
APIt
AQIt
= α+ β1AQIt + β2Politicst +p∑
i=1γiThresholdsi +
q∑i=1
φiAPIt−i
AQIt−i
+r∑
i=1θiεt−i + ηm + σy + εt
We take the two pollution indexes as logarithms, so to be able to measure the responsiveness ofone to the other in terms of elasticities. Particularly we consider whether the AQI affects theratio API/AQI in any significant ways. If the two indexes are very similar,8 the ratio will takevalues close to one and the effect should be insignificant; the more discrepancy between the two,however, and the more of a (negative) significant impact we should observe.
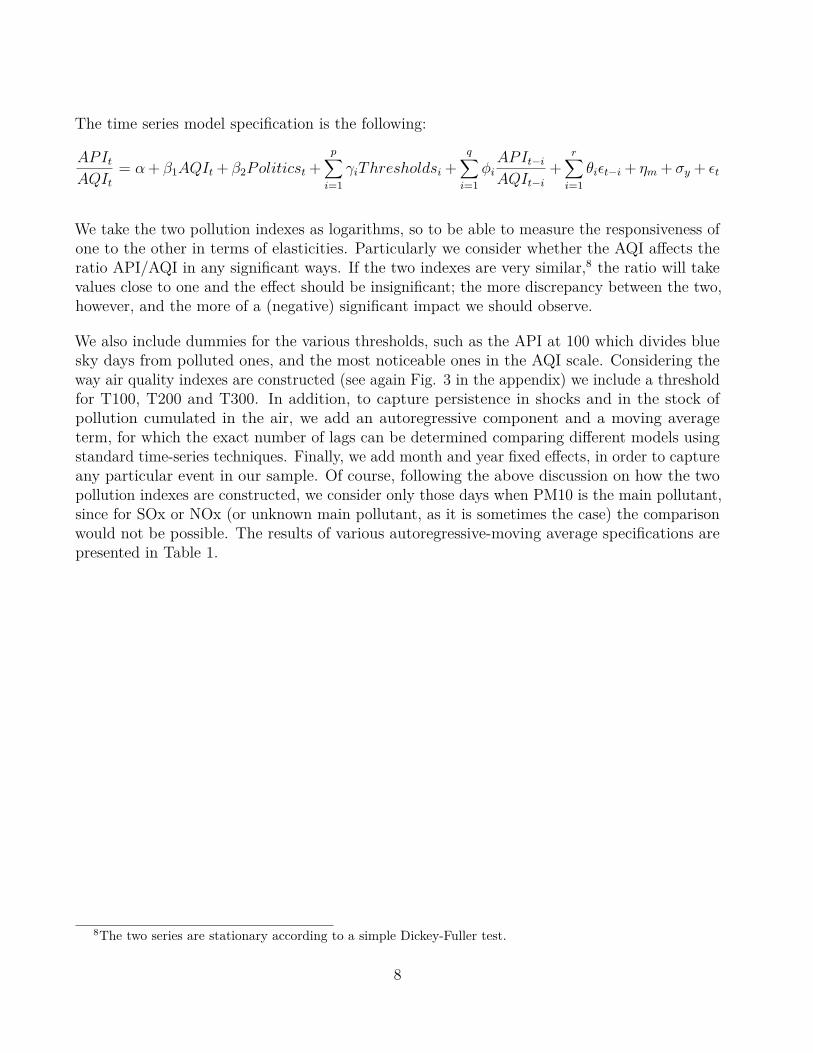
We also include dummies for the various thresholds, such as the API at 100 which divides bluesky days from polluted ones, and the most noticeable ones in the AQI scale. Considering theway air quality indexes are constructed (see again Fig. 3 in the appendix) we include a thresholdfor T100, T200 and T300. In addition, to capture persistence in shocks and in the stock ofpollution cumulated in the air, we add an autoregressive component and a moving averageterm, for which the exact number of lags can be determined comparing different models usingstandard time-series techniques. Finally, we add month and year fixed effects, in order to captureany particular event in our sample. Of course, following the above discussion on how the twopollution indexes are constructed, we consider only those days when PM10 is the main pollutant,since for SOx or NOx (or unknown main pollutant, as it is sometimes the case) the comparisonwould not be possible. The results of various autoregressive-moving average specifications arepresented in Table 1.
8The two series are stationary according to a simple Dickey-Fuller test.
8
Table 1: Chinese/US air pollution indexes.
(1) (2) (3) (4) (5) (6) (7)
AQI -0.79*** -0.79*** -0.79*** -0.79*** -0.79*** -0.79*** -0.79***(0.02) (0.02) (0.02) (0.02) (0.02) (0.02) (0.02)
AQI threshold(100) -1.58*** -1.59*** -1.53*** -1.60*** -1.59*** -1.59*** -1.58***(0.30) (0.30) (0.31) (0.30) (0.30) (0.30) (0.31)
AQI threshold(200) 0.10 0.03 0.15 0.07 0.03 0.02 0.03(0.89) (0.90) (0.91) (0.90) (0.90) (0.90) (0.90)
AQI threshold(300) -2.14** -2.02* -2.35** -2.07* -2.02* -2.02* -2.04*(1.05) (1.06) (1.06) (1.06) (1.07) (1.07) (1.07)
T100*avg. AQI 0.33*** 0.33*** 0.32*** 0.34*** 0.33*** 0.33*** 0.33***(0.06) (0.06) (0.06) (0.06) (0.06) (0.06) (0.06)
T200*avg. AQI 0.00 0.02 -0.01 0.01 0.02 0.02 0.02(0.16) (0.17) (0.17) (0.17) (0.17) (0.17) (0.17)
T300*avg. AQI 0.38** 0.36* 0.41** 0.36* 0.35* 0.36* 0.36*(0.19) (0.19) (0.19) (0.19) (0.19) (0.19) (0.19)
Constant 3.05*** 3.04*** 3.04*** 3.06*** 3.04*** 3.04*** 3.04***(0.14) (0.14) (0.14) (0.14) (0.14) (0.14) (0.15)
ARMAL.ar 0.34*** 0.32*** 0.41* 0.34 -0.15
(0.03) (0.03) (0.22) (0.79) (3.10)L2.ar 0.05 0.04 0.29
(0.03) (0.27) (1.36)L.ma 0.30*** 0.31*** -0.09 -0.02 0.47
(0.03) (0.03) (0.22) (0.80) (3.10)L2.ma 0.14*** 0.02 -0.10
(0.03) (0.08) (0.36)sigmaConstant 0.21*** 0.21*** 0.21*** 0.21*** 0.21*** 0.21*** 0.21***
(0.00) (0.00) (0.00) (0.00) (0.00) (0.00) (0.00)Observations 876 876 876 876 876 876 876AIC -197.63 -197.29 -183.31 -193.82 -195.32 -195.29 -193.30BIC -73.47 -68.35 -59.15 -64.89 -61.61 -61.58 -54.81Standard errors in parentheses* p < 0.10, ** p < 0.05, *** p < 0.01
9

The average value over the time period 2008-2013 of the dependent variable is 0.87, indicatingthat the Chinese API tends to be slightly smaller, on average, than the US index. Thenegative and significant coefficient of AQI indicates that, whenever pollution (as registered bythe US AQI) rises, the effect on the ratio is unambiguously downwards: a 1% increase in theAQI causes a fall in the Chinese/US ratio of 0.8%. This result could be foreseen given thegraphs showed before: the Chinese pollution index does not increase as much as the US one,so whenever pollution increases the ration between the two indexes goes down.
But perhaps more interestingly, thresholds play an important role in moving the asymmetricrelation between the Chinese API and the US AQI. This gives a stronger indication of politicalwill than the previous result, which could come from some differences in the measurements ofthe US Embassy. Both the 100 and 300 points thresholds are significant and large, as onecould expect given the blue sky days policy and the dangerous health zone above 300. Asforeseeable, the effect of being above 100 or 300 diminishes as the AQI increases (see thepositive and significant effect of the interaction between thresholds and AQI): it is easier todownplay pollution levels just above the threshold (e.g. 101 or 302), to move to the categorybelow, than values way above the threshold. Anyway, the interaction terms do not fullyoutweigh the negative coefficients of the thresholds T100 and T300, so there is always atemptation to reduce reported pollution when entering the dangerous levels of the scale.
The various specifications can be compared on the basis of the Akaike Information Criterion(AIC) and the Bayesian Information Criterion (BIC), which are used for model selection byindicating the relative goodness of fit of various statistical models9. Choosing the two modelswith lowest information criteria, i.e. the MA (1) and the MA(2) models, we can computein-sample forecasts to see which of the specified models performs best in terms of predictivepower. Comparing the mean squared errors of our forecasts (or alternatively the absolutevalue of the predicted errors), we can select the most suitable model among all the onesexamined, which is the moving average with one period lag, MA(1).
Overall, this analysis shows that the relationship between the Chinese reported Air QualityIndex and the actual levels of pollution in Beijing during a given day do not match, and thissuggests that, as hypothesized in the model, the benefits for the government of declaring thatthe air is cleaner outweigh the costs. The next section will then be dedicated to the analysisof household responses to this air pollution information for averting the health damages ofpollution exposure.
9Note that these criteria are only interpretable as relative measures to compare different models, they haveno absolute meaning relative to goodness of fit, as the classical R squared would have.
10

3 Households
Individuals who decide to live and work in Beijing can choose if and how to respond tothe environmental and health hazard presented by air pollution, by virtue of incurring acost (monetary or in terms of time) for protecting themselves and their families from thedamages of pollution. 10 Furthermore, agents can decide how to obtain information about airpollution, either by relying on government controlled sources (TV, newspapers, radio), ontheir own perception of pollution (for instance basing their judgement on the visibility), or onalternative sources of information, which are still relatively less popular in China, such as theinternet. Note that, for example, the US Embassy measurements are available hourly throughan online tweet, which can even be downloaded on a mobile device as an application. Theinternet is quite restricted in China, but young people are nowadays able to access this sortof information through the web.
In order to examine the behaviour of households with respect to air pollution and health,we collected a household survey in urban Beijing, which elicits the expenditure and timeallocation to averting activities. Particular attention is dedicated to information effects, inorder to identify which groups are more capable of adapting during peak pollution days.The data is described below and an English version11 of the questionnaire is included in theAppendix.
3.1 Household Survey
The household survey was administered in three districts of Beijing, Haidian, Chaoyan andDongcheng, for a total of 1672 individuals (578 households). Due to time and financialconstraints we could naturally survey only some districts, and within each district only somestreets and some communities. Hence sample selection was designed to ensure representative-ness using probability proportional to size (PPS) at the district and street level and randomselection at the community and household level, so that all households in Beijing had equalchances of selection (see Equation 3).
p0[NH ]D1
[Nh]T OT
District choice (PPS)
∗ p1[[NH ]S1]D1
[Nh]D1
Street choice (PPS)
∗ p21
[[NC1]S1]D1Community choice (Random)
∗ x
[[[NH ]C1]S1]D1Household choice (Random)
= c (3)
10This decision is here conceptualized as an individual decision, but it could be extended to an andintra-household allocation of a public good, clean air, which can then translate into better health for thewhole family. Each household member faces a trade-off between income and non-market activities (leisure,averting behaviour, taking care of children or elderly people, etc.). Within the household, agents bargain forwho should dedicate more time to income or non-market tasks, depending on relative opportunity costs. Fora formal analysis of the possible bargaining solutions inside the household, see a review of intra-householdallocation model by Browning et al. (2010)
11The survey was administered in Chinese, after numerous pilot tests for its understandability and repeatedchecks that the Chinese and English version corresponded exactly.
11
The questionnaire inquired in detail about a) the socio-economic characteristics of thehousehold, b) various habits and averting behaviours (wearing masks, reducing time outdoor,changing means of transportation, doing preventive health checks - more detail about thesebelow), c) how the family gathered information about air pollution and d) health of familymembers and particularly airborne diseases, cost of illness and insurance. The respondents(one per household) could only answer for themselves and for close family members whospent most of the time in the household. The average household size is around 3, which isreasonable given the one child policy. We also compare various demographic characteristics ofour sample with data from the Statistics Bureau of Beijing (gender, age, education) and thesample is in line with the characteristics of the total population of those districts.
The data from the household survey varies over three dimensions: across individuals, withinhouseholds and somewhat over time. We asked to the respondents to recall their avertingbehaviour choices in periods of extreme pollution peaks and over the rest of the year, whichgives us variation between normal times and extreme pollution events. To define extremeand normal times, we asked the respondents if they could recall the two worst episodes ofair pollution in Beijing in the previous year, and if they could locate them in time. In theyear before the survey, in fact, there were two pollution alerts during extremely hazardousdays. We defined an extremely polluted days those situations. Hence averting behaviourcould optimally shift in such extreme circumstances, even if normally a person would notavert air pollution. The use of recall data to introduce this artificial time dimension is notfree from limitations, but allows us to at least get a general sense of people’s variation inbehaviour in relation to pollution.
3.2 Stylized facts
3.2.1 Health and pollution
Preliminary analysis of the data indicates that for our sample we can observe the standardepidemiological correlation between air pollution and illness episodes outcomes (Fig. 2). Thisis interesting to observe, however it could be driven by a number of different factors, as medicalexperiments showed with more precise exposure data and physiological parameters. What ismore interesting for the purpose of this study is to examine how the adaptive behaviour ofthe household comes into play and what is the role of information access.
Overall there seems to be scope for averting behaviour, given that the private cost of illnessobtained for our sample was quite high: from airborne diseases, the average annual expenditureincluding medical costs, medicines and foregone wage12 was more than 3000 yuan, almost amonth of average salary. Table 2 illustrates the breakdown of costs.
12 Wage loss is computed multiplying the wage by the days at home, net of those covered by sick-leave:wage x (days lost-sick leave).
12
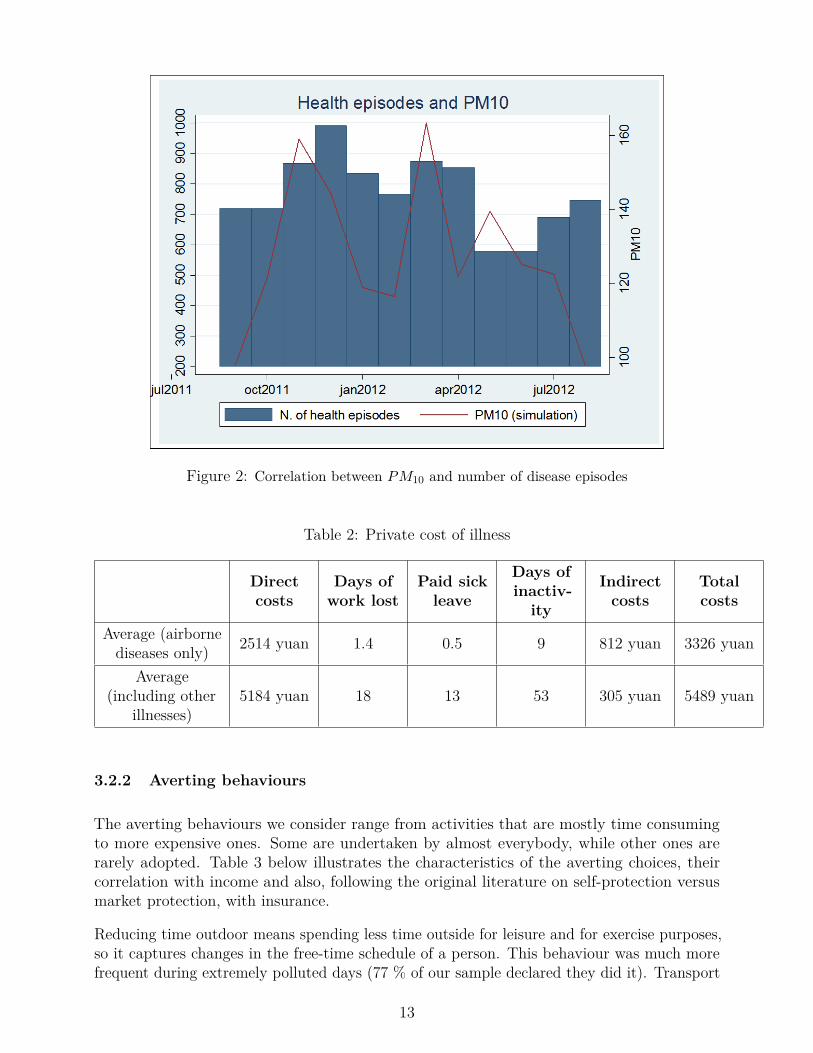
Figure 2: Correlation between PM10 and number of disease episodes
Table 2: Private cost of illness
Directcosts
Days ofwork lost
Paid sickleave
Days ofinactiv-
ity
Indirectcosts
Totalcosts
Average (airbornediseases only) 2514 yuan 1.4 0.5 9 812 yuan 3326 yuan
Average(including other
illnesses)5184 yuan 18 13 53 305 yuan 5489 yuan
3.2.2 Averting behaviours
The averting behaviours we consider range from activities that are mostly time consumingto more expensive ones. Some are undertaken by almost everybody, while other ones arerarely adopted. Table 3 below illustrates the characteristics of the averting choices, theircorrelation with income and also, following the original literature on self-protection versusmarket protection, with insurance.
Reducing time outdoor means spending less time outside for leisure and for exercise purposes,so it captures changes in the free-time schedule of a person. This behaviour was much morefrequent during extremely polluted days (77 % of our sample declared they did it). Transport
13
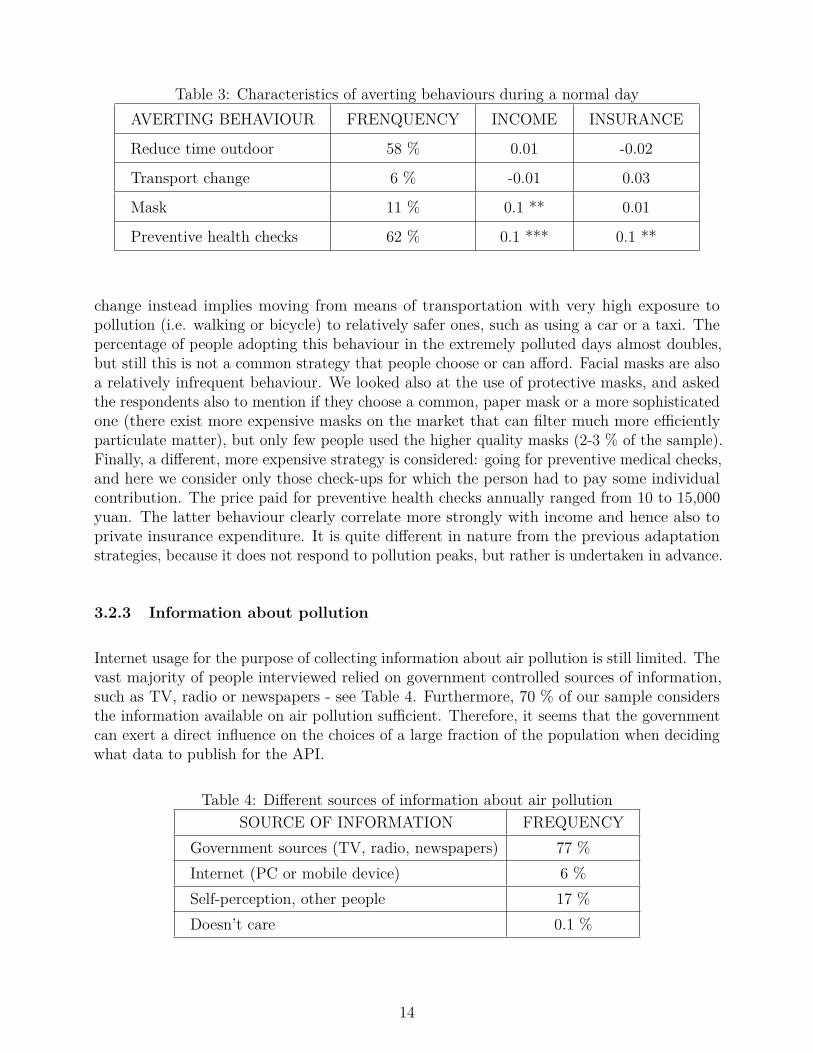
Table 3: Characteristics of averting behaviours during a normal dayAVERTING BEHAVIOUR FRENQUENCY INCOME INSURANCE
Reduce time outdoor 58 % 0.01 -0.02
Transport change 6 % -0.01 0.03
Mask 11 % 0.1 ** 0.01
Preventive health checks 62 % 0.1 *** 0.1 **
change instead implies moving from means of transportation with very high exposure topollution (i.e. walking or bicycle) to relatively safer ones, such as using a car or a taxi. Thepercentage of people adopting this behaviour in the extremely polluted days almost doubles,but still this is not a common strategy that people choose or can afford. Facial masks are alsoa relatively infrequent behaviour. We looked also at the use of protective masks, and askedthe respondents also to mention if they choose a common, paper mask or a more sophisticatedone (there exist more expensive masks on the market that can filter much more efficientlyparticulate matter), but only few people used the higher quality masks (2-3 % of the sample).Finally, a different, more expensive strategy is considered: going for preventive medical checks,and here we consider only those check-ups for which the person had to pay some individualcontribution. The price paid for preventive health checks annually ranged from 10 to 15,000yuan. The latter behaviour clearly correlate more strongly with income and hence also toprivate insurance expenditure. It is quite different in nature from the previous adaptationstrategies, because it does not respond to pollution peaks, but rather is undertaken in advance.
3.2.3 Information about pollution
Internet usage for the purpose of collecting information about air pollution is still limited. Thevast majority of people interviewed relied on government controlled sources of information,such as TV, radio or newspapers - see Table 4. Furthermore, 70 % of our sample considersthe information available on air pollution sufficient. Therefore, it seems that the governmentcan exert a direct influence on the choices of a large fraction of the population when decidingwhat data to publish for the API.
Table 4: Different sources of information about air pollutionSOURCE OF INFORMATION FREQUENCY
Government sources (TV, radio, newspapers) 77 %Internet (PC or mobile device) 6 %Self-perception, other people 17 %Doesn’t care 0.1 %
14

3.2.4 Awareness of the problem
Despite not being a primary goal of the survey (e.g. we did not use any experimental settingto elicit the exact value that our interviewees give to clean air), from a number of answerswe can get a sense about their level of awareness of the environmental problem posed by airpollution and how much people give importance to it. For instance, the fact that only 66 % ofrespondents had noticed and remembered the extremely polluted haze days in Beijing alreadyindicates that the individual perception and interest in the issue might be still relativelylimited. For those who did recognize the bad haze days, Table 5 shows how people reactedafterwards:
Table 5: What did you do after the peak pollution days last year?Nothing 38 %
I started worrying more about air pollution 25 %
I look for more information 9 %
I worry more about air pollution and look for more information about it 27 %
Other 1 %
3.3 Empirical model
Starting from these stylized facts, we can analyse the determinants of averting behaviour andof the choice of source of information.
3.3.1 Information
First of all, we want to characterize the agents that use government media as opposed tothe internet or neither of the two. This can tell us what groups are more affected by thegovernment’s signal. We set a general empirical model of information, as follows:
Infoh = β0 + Individual Xiβ1 +Household Xhβ2 + β3Incomeh + εit (4)
and we test this using as a dependent variable different types of information sources. Such aspecification may pose some problems in terms of reverse causality, so we prefer a parsimoniousmodel that uses only exogenous observables. Overall, we will be cautious in making any causalstatement, since there could be biases arising also from potential omitted variables. Theindividual controls are age, gender, education level and smoking status (to capture somehowrisk attitude towards pollution and lung diseases). At the household level we have incomeand household size.
15

First of all, we consider as left-hand-side variable the binary choice between using or notgovernment controlled media to check air pollution information. The dependent variable isthen a dummy equals to 1 if the respondent said that (s)he use TV, radio or newspapers asa source of information, and zero otherwise (so if he uses internet or no information aboutpollution at all, or self-perception). Then we distinguish between government media versusinternet users, and government media versus self-perception users, to see what is driving theresults. We also look at internet users versus everyone else.13
The results are displayed in Table ??. People who use government media are generally older,and this is driven by the internet users, who are generally younger, and more educated(but this is instead determined by those who prefer to use self-perception to know about airpollution, as they tend to have lower education status). Interestingly, smokers declare touse the internet more than anything else. Larger households (families) rely a lot more ongovernment sources than on the internet. Finally, income is strongly correlated with internetusage. This gives us an initial picture of those people who typically rely on the government’sinformation.
Table 6: Internet vs Government information.
Government media Govt vs. Internet Govt vs. Self InternetAge 0.01*** 0.04*** 0.00 -0.03***
(0.00) (0.01) (0.00) (0.01)Male 0.06 0.13 0.03 -0.15
(0.10) (0.17) (0.11) (0.15)Education 0.15** -0.08 0.22*** 0.13
(0.06) (0.12) (0.07) (0.11)Smoker -0.48*** -0.69*** -0.41* 0.56**
(0.18) (0.27) (0.21) (0.25)Migrant -0.46 0.16 -0.61 -0.30
(0.35) (0.89) (0.37) (0.80)Household size 0.25** 0.69** 0.12 -0.67**
(0.11) (0.32) (0.12) (0.29)Household Income -2.13 -5.66*** -0.10 5.45***
(1.45) (1.93) (1.90) (1.63)Constant -0.76 -0.51 -0.04 -0.13
(0.50) (0.96) (0.57) (0.84)Observations 1490 1260 1408 1490Standard errors in parentheses. * p < 0.10, ** p < 0.05, *** p < 0.01
13For the determinants of internet, since the occurrence of a 1 is quite rare, we use a complementary log-logspecification to account for the asymmetric nature of the dependent variable (Hilbe (1996)).
16
3.3.2 Averting behaviour
In order to analyse averting behaviours, we can specify a similar model as the one above, butas soon as we include information sources we might introduce an endogeneity problem, as it isnot clear whether it’s the information source that determines the averting choice, or viceversathose who, for some unobserved reason, prefer to avert more use a particular information tool.Therefore we try to overcome this problem through a two stage model, with the determinantsof information sources in the first stage (Eq. 6) identifying those who not only use the publicmedia, but also consider it sufficient (i.e. fully rely on it).
Avertik = α0 + Individual Xiα1 +Household Xhα2 + α3Mediah + ηit (5)
Mediah = β0 + Individual Xiβ1 +Household Xhβ2 + β3Sufficienth + εit (6)
Averting behaviours vary over k, covering masks, transport, time outdoor and preventivehealth checks. With the exception of the latter, the dependent variable is measured in changes(i.e. if a person switches to more averting behaviour in extremely polluted days compared tonormal days). Beyond the controls used in the previous specification, we add other controls:a dummy for workers, to distinguish individuals with more time flexibility from those withless; a control for car ownership in the transport specification, which may be particularlyimportant as a sunk investment in averting; and a dummy for households with children, whichcould be possibly more careful about the health damages of pollution. Moreover we need tocontrol for whether the person was the survey respondent or not, because when talking aboutfamily members, respondent knew less and tended to downplay their capacity to avert.
Table 7 shows that, first of all, the first stage probit predicts quite well whether a person usespublicly controlled public media, thanks to the sufficiency variable. Then those who use TV,radio and newspapers controlled by the Communist Party are less likely to switch to moreaverting behaviours during peak pollution days, both in terms of time spent outdoors and forwearing masks. In the case of transport, information does not play a significant role, but wecan see that car ownership is a very strong determinant of this behaviour. It is harder forpeople to adopt safer means of transport if they do not own a car. A different story appliesto preventive health checks: those do not respond to the information signal negatively, buton the contrary correlate positively and significantly to it. This is not surprising, however:preventive checks do not need to be done distinguishing between peak pollution days andcleaner ones.
These results fit well with what was suggested in section 2 about government reportingoptimistic values for pollution: since we identify here people who use such information andconsider it sufficient for their choices, clearly these people will not be alerted much in highpollution days, and therefore, even for those behaviours they can easily modify, such as timeoutdoor and masks, they will be less likely to implement them.
17
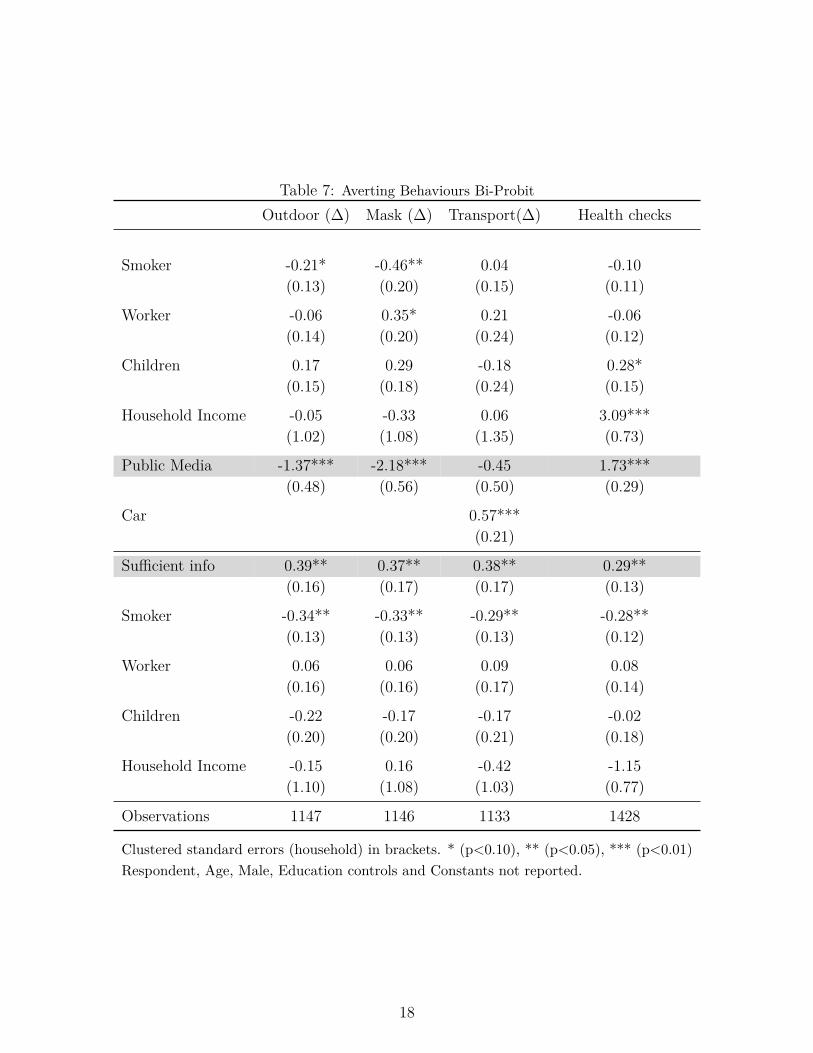
Table 7: Averting Behaviours Bi-ProbitOutdoor (∆) Mask (∆) Transport(∆) Health checks
Smoker -0.21* -0.46** 0.04 -0.10(0.13) (0.20) (0.15) (0.11)
Worker -0.06 0.35* 0.21 -0.06(0.14) (0.20) (0.24) (0.12)
Children 0.17 0.29 -0.18 0.28*(0.15) (0.18) (0.24) (0.15)
Household Income -0.05 -0.33 0.06 3.09***(1.02) (1.08) (1.35) (0.73)
Public Media -1.37*** -2.18*** -0.45 1.73***(0.48) (0.56) (0.50) (0.29)
Car 0.57***(0.21)
Sufficient info 0.39** 0.37** 0.38** 0.29**(0.16) (0.17) (0.17) (0.13)
Smoker -0.34** -0.33** -0.29** -0.28**(0.13) (0.13) (0.13) (0.12)
Worker 0.06 0.06 0.09 0.08(0.16) (0.16) (0.17) (0.14)
Children -0.22 -0.17 -0.17 -0.02(0.20) (0.20) (0.21) (0.18)
Household Income -0.15 0.16 -0.42 -1.15(1.10) (1.08) (1.03) (0.77)
Observations 1147 1146 1133 1428
Clustered standard errors (household) in brackets. * (p<0.10), ** (p<0.05), *** (p<0.01)Respondent, Age, Male, Education controls and Constants not reported.
18
4 Conclusion
The above analysis shows that the Chinese government does not have much incentive toimprove air quality to sustainable levels, as it can give an information signal about pollutionthat is lower than actual values. In particular, we find that it can simply reduce the AirQuality index some points below certain critical thresholds for human health. As a result,those urban dwellers who rely fully on this government controlled source of information adoptless averting measures to protect themselves during peak pollution days. We propose that themechanism behind government’s choice of distorting information is a simple social planner’sproblem, in which the government tries to attract workers to polluted cities. Announcingthat the air is clean might be costly if people avert less and total medical costs rise, but thishappens only indirectly and for a fraction of the population, while the migrant workforcedirectly contributes to output. Therefore it is optimal for an autocratic government to usethis information tool, even if this induces less averting behaviour.
These results indicates that, whenever an autocratic country can exercise ample governmentcontrol over the media, it is not unlikely that this will sacrifice environmental sustainabilityin order to achieve higher output production. This in turn will spill onto the households thattake less self-protective actions. Unless there is some process of learning about pollution, thissituation is just going to perpetrate itself, as long as urban production requires immigrantcheap workers and pollution emissions. In this system, as there is no pressure from below tostart tackling pollution, the cycle of incorrect information and distorted adaptation incentivescontinues, similarly to a snake (or better in this case a dragon) eating its own tail. In thefuture, it is likely that the Chinese population will pressure more the government to disclosethe true levels of pollution, so to increase the credibility cost to the Communist Party ofmanipulating information. But as we have shown here, it will require quite a substantial effortto overcome the benefits that the government can currently reap from this information tool.
For further extensions of this analysis, it would be interesting to model and to exploreempirically a mechanism for interaction between several cities and rural areas, rather thanfocusing just on one city, Beijing, and an urban versus rural model. If some migrantscommunicate back to rural areas the true level of pollution, the cost of cheating aboutpollution might increase over time for the government; or people could move across citiesdepending on their income levels and job opportunities, coupled with air quality. It couldeven be that the role of the government not only consist of allocating migrants, but also firmsand productive activities. Furthermore, it would also be interesting as a future extension ofthis work to consider a general equilibrium framework, in which migration flows can affectwages as well, so that the government could trade pollution off for income payments, andmaybe even for different levels of health insurance. But for this, a different set of data wouldbe needed, possibly about a wider range of rural and urban dwellers.
19

5 BibliographyAnna Alberini, Maureen Cropper, Tsu-Tan Fu, Alan Krupnick, Jin-Tan Liu, Daigee Shaw,and Winston Harrington. Valuing health effects of air pollution in developing countries:The case of Taiwan. Journal of Environmental Economics and Management, 34(2):107–126,October 1997.
Steven Q. Andrews. Inconsistencies in air quality metrics: ‘blue sky’ days and PM10concentrations in Beijing. Environmental Research Letters, 3(3), 2008.
Patricia F. Apps and Ray Rees. Collective labor supply and household production. Journalof Political Economy, 105(1):pp. 178–190, 1997. ISSN 00223808.
Kenneth Arrow, Bert Bolin, Robert Costanza, Partha Dasgupta, Carl Folke, C.S. Holling,Bengt-Owe Jansson, Simon Levin, Karl-Göran Mäler, Charles Perrings, and David Pimentel.Economic growth, carrying capacity, and the environment. Environment and DevelopmentEconomics, 1:104–110, 2 1996. ISSN 1469-4395. doi: 10.1017/S1355770X00000413.
Kristin Aunan and Xiao-Chuan Pan. Exposure-response functions for health effects of ambientair pollution applicable for china – a meta-analysis. Science of The Total Environment, 329(1–3):3 – 16, 2004. ISSN 0048-9697. doi: 10.1016/j.scitotenv.2004.03.008.
Asian Development Bank. Country environmental analysis for thePeople’s Republic of China.Country Environmental Analysis Series, 2007.
Scott Barrett and Kathryn Graddy. Freedom, growth, and the environment. Environmentand Development Economics, 4:433–456, 10 2000.
Timothy J. Bartik. Evaluating the benefits of non-marginal reductions in pollution us-ing information on defensive expenditures. In Joseph Herriges and Catherine L. Kling,editors, Revealed Preference Approaches to Environmental Valuation, volume 0 of Bookchapters suthored by Upjohn Institute researchers, pages 459–475. W.E. Upjohn Institutefor Employment Research, June 2008.
Gary S. Becker. A theory of the allocation of time. The Economic Journal, 75(299):pp.493–517, 1965. ISSN 00130133.
Alok K. Bohara, Michael McKee, Robert P. Berrens, Hank Jenkins-Smith, Carol L. Silva, andDavid S. Brookshire. Effects of total cost and group-size information on willingness to payresponses: Open ended vs. dichotomous choice. Journal of Environmental Economics andManagement, 35(2):142–163, March 1998.
J. Bousquet, N.G. Khaltaev, A.A. Cruz, and World Health Organization. Global Surveillance,Prevention And Control Of Chronic Respiratory Diseases: A Comprehensive Approach.Nonserial Publication. World Health Organization, 2007. ISBN 9789241563468.
Alfesio L.F. Braga, Paulo H.N. Saldiva, Luiz A.A. Pereira, Joaquim J.C. Menezes, Gle-ice M.S. Conceição, Chin A. Lin, Antonella Zanobetti, Joel Schwartz, and Douglas W.Dockery. Health effects of air pollution exposure on children and adolescents in sãopaulo, brazil. Pediatric Pulmonology, 31(2):106–113, 2001. ISSN 1099-0496. doi:10.1002/1099-0496(200102)31:2<106::AID-PPUL1017>3.0.CO;2-M.
20

Brian W. Bresnahan, Mark Dickie, and Shelby Gerking. Averting behavior and urban airpollution. Land Economics, 73(3):pp. 340–357, 1997. ISSN 00237639.
B.W. Bresnahan and M. Dickie. Averting behavior and policy evaluation. Journal ofEnvironmental Economics and Management, (397e), 1995.
Martin Browning and Mette Gortz. Spending time and money within the household. TheScandinavian Journal of Economics, 114(3):681–704, 2012. ISSN 1467-9442. doi: 10.1111/j.1467-9442.2012.01711.x.
Martin Browning, Francois Bourguignon, Pierre-Andre Chiappori, and Valerie Lechene.Income and outcomes: A structural model of intrahousehold allocation. Journal of PoliticalEconomy, 102(6):1067–96, December 1994.
Martin Browning, Pierre-Andre Chiappori, and Valerie Lechene. Distributional effects inhousehold models: Separate spheres and income pooling. The Economic Journal, 120(545):786–799, 2010. ISSN 1468-0297. doi: 10.1111/j.1468-0297.2009.02311.x.
Edward Calthrop and David Maddison. The dose-response function approach to modellingthe health effects of air pollution. Energy Policy, 24(7):599 – 607, 1996. ISSN 0301-4215.doi: 10.1016/0301-4215(96)00047-X. <ce:title>Valuing air pollution damage</ce:title>.
M. Carter and E. Katz. Intrahousehold Resource Allocation in Developing Countries: Methods,Models and Policies., chapter Separate Spheres and the Conjugal Contract: Understandingthe Impact of Gender-Biased Development. 1997.
Yuyu Chen, Ginger Zhe Jin, Naresh Kumar, and Guang Shi. Gaming in air pollution data?lessons from china. NBER Working Paper No. 18729, (18729), January 2013.
Pierre-Andre Chiappori. Collective labor supply and welfare. Journal of Political Economy,100(3):437–67, June 1992.
Luis A. Cifuentes, Jose Joaquin Prieto, and Jorge Escobari. Valuing mortality risk reductionsat present and at an advanced age: preliminary results from a contingent valuation studyin chile. Mimeo, Pontifical Catholic University of Chile, Santiago, 2001.
Roger D. Congleton. Political institutions and pollution control. The Review of Economicsand Statistics, 74(3):pp. 412–421, 1992. ISSN 00346535.
Philip J. Cook and Daniel A. Graham. The demand for insurance and protection: The case ofirreplaceable commodities. The Quarterly Journal of Economics, 91(1):pp. 143–156, 1977a.ISSN 00335533.
Philip J. Cook and Daniel A. Graham. The demand for insurance and protection: The case ofirreplaceable commodities. The Quarterly Journal of Economics, 91(1):pp. 143–156, 1977b.ISSN 00335533.
Brian R. Copeland and M. Scott Taylor. Trade, growth, and the environment. Journal ofEconomic Literature, 42(1):7–71, March 2004.
Paul N. Courant and Richard C. Porter. Averting expenditure and the cost of pollution.Journal of Environmental Economics and Management, 8(4):321–329, December 1981.
21
M. L. Cropper. Measuring the benefits from reduced morbidity. The American EconomicReview, 71(2):pp. 235–240, 1981. ISSN 00028282.
Susmita Dasgupta, Benoit Laplante, Hua Wang, and David Wheeler. Confronting theenvironmental kuznets curve. Journal of Economic Perspectives, 16(1):147–168, 2002. doi:10.1257/0895330027157.
Robert. Deacon. The political economy of environment-development relationships: A prelimi-nary framework. FEEM Working Paper, 3, 2000.
RobertT. Deacon. Public good provision under dictatorship and democracy. Public Choice,139(1-2):241–262, 2009. ISSN 0048-5829. doi: 10.1007/s11127-008-9391-x.
Stefano DellaVigna and Ethan Kaplan. The fox news effect: Media bias and voting. WorkingPaper 12169, National Bureau of Economic Research, April 2006.
Avinash K. Dixit. Optimization in Economic Theory. Number 9780198772101 in OUPCatalogue. Oxford University Press, 1990.
Isaac Ehrlich and Gary S Becker. Market insurance, self-insurance, and self-protection. Journalof Political Economy, 80(4):623–48, July-Aug. 1972.
M. El-Fadel and M. Massoud. Particulate matter in urban areas: health-based economic assess-ment. Science of The Total Environment, 257:133–146, 2000. doi: 10.1016/S0048-9697(00)00503-9.
US Environmental Protection Agency (EPA). Guideline for reporting of daily air quality - airquality index (aqi). EPA-454/B-06-001, May 2006, 2006.
Andrew Foster and Naresh Kumar. Health effects of air quality regulations in delhi, india.Atmospheric Environment, 45:1675–1683, 2011.
G. M. Grossman. The Economics of Sustainable Development, chapter Pollution and growth:what do we know?, pages 19–47. Cambridge University Press, Cambridge, 1995.
Michael Grossman. On the concept of health capital and the demand for health. Journal ofPolitical Economy, 80(2):pp. 223–255, 1972. ISSN 00223808.
James Hammitt and Kevin Haninger. Valuing fatal risks to children and adults: Effects ofdisease, latency, and risk aversion. Journal of Risk and Uncertainty, 40(1):57–83, February2010.
John R Harris and Michael P Todaro. Migration, unemployment & development: A two-sectoranalysis. American Economic Review, 60(1):126–42, March 1970.
Jerry A. Hausman and William E. Taylor. Panel data and unobservable individual effects.Econometrica, 49(6):pp. 1377–1398, 1981. ISSN 00129682.
J. M. Hilbe. Maximum-likelihood complementary log-log regression. Stata Technical BulletinReprints, Stata Press, 6:129–131, 1996.
22
Bryan Hubbell and Jeffrey L. Jordan. Joint production and averting expenditure measuresof willingness to pay: Do water expenditures really measure avoidance costs? AmericanJournal of Agricultural Economics, 82(2):427–437, 2000.
Jyotsna Jalan and Martin Ravallion. Does piped water reduce diarrhea for children in ruralindia? Journal of Econometrics, 112(1):153–173, 2003. URL http://EconPapers.repec.org/RePEc:eee:econom:v:112:y:2003:i:1:p:153-173.
Jyotsna Jalan and E. Somanathan. The importance of being informed: Experimental evidenceon demand for environmental quality. Journal of Development Economics, 87(1):14 – 28,2008. ISSN 0304-3878. doi: 10.1016/j.jdeveco.2007.10.002.
Peter W. Kennedy, Benoit Laplante, and John Maxwell. Pollution policy: the role for publiclyprovided information. Journal of Environmental Economics and Management, 26(1):31 –43, 1994.
V. Kerry Smith and William H. Desvousges. Averting behavior: Does it exist? EconomicsLetters, 20(3):291–296, 1986.
Michael J. Lamla and Samad Sarferaz. Updating inflation expectations. KOF Working papers12-301, KOF Swiss Economic Institute, ETH Zurich, March 2012.
Jia Li, Sarath K Guttikunda, Gregory R Carmichael, David G Streets, Young-Soo Chang,and Virginia Fung. Quantifying the human health benefits of curbing air pollution inshanghai. Journal of Environmental Management, 70(1):49 – 62, 2004. ISSN 0301-4797.doi: 10.1016/j.jenvman.2003.10.007.
Ramon Lopez and Siddhartha Mitra. Corruption, pollution, and the kuznets environmentcurve. Journal of Environmental Economics and Management, 40(2):137–150, September2000.
Malgosia Madajewicz, Alexander Pfaff, Alexander van Geen, Joseph Graziano, IftikharHussein, Hasina Momotaj, Roksana Sylvi, and Habibul Ahsan. Can information alonechange behavior? response to arsenic contamination of groundwater in bangladesh. Journalof Development Economics, 84(2):731 – 754, 2007. ISSN 0304-3878. doi: http://dx.doi.org/10.1016/j.jdeveco.2006.12.002.
Eric Maskin, Yingyi Qian, and Chenggang Xu. Incentives, information, and organizationalform. The Review of Economic Studies, 67(2):pp. 359–378, 2000. ISSN 00346527.
Martin C. McGuire and Mancur Olson. The economics of autocracy and majority rule: Theinvisible hand and the use of force. Journal of Economic Literature, 34(1):72–96, March1996.
Curtis J. Milhaupt and Wentong Zheng. Beyond ownership: State capitalism and the chinesefirm . Georgetown Law Journal, 103:(forthcoming), 2014.
Enrico Moretti and Matthew Neidell. Pollution, health, and avoidance behavior: Evidencefrom the ports of los angeles. Journal of Human Resources, 46(1):154–175, 2011.
Stephen Morris and Hyun Song Shin. Social value of public information. American EconomicReview, 92(5):1521–1534, 2002.
23
Giuseppe Moscarini. Competence implies credibility. American Economic Review, 97(1):37–63, March 2007.
Matthew J. Neidell. Information, avoidance behavior, and health: The effect of ozone onasthma hospitalizations. NBER Working Papers 14209, National Bureau of EconomicResearch, Inc, July 2008.
T. Panayotou. Demystifying the environmental kuznets curve: turning a black box into apolicy tool. Environment and Development Economics, 2:465–484, 1997.
Nicola Persico and Alessandro Lizzeri. The provision of public goods under alternativeelectoral incentives. American Economic Review, 91(1):225–239, March 2001.
Mark M Pitt and Mark R. Rosenzweig. Estimating the intrahousehold incidence of illness:Child health and gender-inequality in the allocation of time. International Economic Review,31(4):969–80, 1990.
Mark M. Pitt, Mark R. Rosenzweig, and Md. Nazmul Hassan. Productivity, health, andinequality in the intrahousehold distribution of food in low-income countries. The AmericanEconomic Review, 80(5):pp. 1139–1156, 1990. ISSN 00028282.
Karen Pittel and Dirk T.G. Rubbelke. Climate policy and ancillary benefits: A survey andintegration into the modelling of international negotiations on climate change. EcologicalEconomics, 68(1-2):210–220, December 2008.
Hong Qiu, Ignatius Tak sun Yu, Linwei Tian, Xiaorong Wang, Lap Ah Tse, Wilson Tam, andTze Wai Wong. Effects of coarse particulate matter on emergency hospital admissions forrespiratory diseases: A time-series analysis in hong kong. Environmental Health Perspectives,120(4):572 – 576, 2012.
John Quiggin. Risk, self-protection and ex ante economic value–some positive results. Journalof Environmental Economics and Management, 23(1):40–53, July 1992.
John Quiggin. Risk and self-protection: A state-contingent view. Journal of Risk andUncertainty, 25(2):133–45, September 2002.
Cizao Ren and Shilu Tong. Health effects of ambient air pollution - recent research developmentand contemporary methodological challenges. Environmental Health, 7(1):56, 2008. ISSN1476-069X. doi: 10.1186/1476-069X-7-56.
Bjorn Saetterstrom, Marie Kruse, Henrik Bronnum-Hansen, Jakob Hjort Bonlokke, Esben Meu-lengracht Flachs, and Jan Sorensen. A method to assess the potential effects of air pollutionmitigation on healthcare costs. Journal of Environmental and Public Health, 2012.
Songsak Sakulniyomporn, Kuskana Kubaha, and Chullapong Chullabodhi. External costs offossil electricity generation: Health-based assessment in thailand. Renewable and SustainableEnergy Reviews, 15(8):3470–3479, 2011.
Jason F. Shogren and Thomas D. Crocker. Risk and its consequences. Journal of EnvironmentalEconomics and Management, 37(1):44–51, January 1999.
24

Kevin M. Simmons and Jamie Brown Kruse. Market value of mitigation and perceived risk:Empirical results. The Journal of Economics, 26(1):41–51, 2000.
E. Somanathan. Effects of information on environmental quality in developing countries.Review of Environmental Economics and Policy, 2010. doi: 10.1093/reep/req012.
Jon Strand. Public-good valuation and intra-family allocation. Environmental and ResourceEconomics, 38:527–543, 2007. ISSN 0924-6460. doi: 10.1007/s10640-007-9098-3.
John Talberth, Robert P. Berrens, Michael Mckee, and Michael Jones. Averting and insurancedecisions in the wildland-urban interface: Implications of survey and experimental data forwildfire risk reduction policy. Contemporary Economic Policy, 24(2):203–223, 04 2006.
Kai-yuen Tsui and Youqiang Wang. Between separate stoves and a single menu: Fiscaldecentralization in china. The China Quarterly, 177:71–90, 2 2004. ISSN 1468-2648. doi:10.1017/S0305741004000050.
Mi-Jung Um, Seung-Jun Kwak, and Tai-Yoo Kim. Estimating willingness to pay forimproved drinking water quality using averting behavior method with perception mea-sure. Environmental and Resource Economics, 21:285–300, 2002. ISSN 0924-6460. doi:10.1023/A:1014537330423.
W Kip Viscusi and Joseph E Aldy. The value of a statistical life: A critical review of marketestimates throughout the world. Journal of Risk and Uncertainty, 27(1):5–76, August 2003.
Wentao Wang, Toby Primbs, Shu Tao, and Staci L. Massey Simonich. Atmospheric particulatematter pollution during the 2008 beijing olympics. Environmental Science & Technology,43(14):5314–5320, 2009. doi: 10.1021/es9007504.
John Whitehead. Environmental risk and averting behavior: Predictive validity of jointlyestimated revealed and stated behavior data. Environmental & Resource Economics, 32(3):301–316, November 2005.
WHO. Air quality guidelines for particulate matter, ozone, nitrogen dioxide and sulfur dioxide.Global update 2005. Summary of risk assessment. World Health Organization, 2005.
Jing Wu, Yongheng Deng, Jun Huang, Randall Morck, and Bernard Yeung. Incentivesand outcomes: China’s environmental policy. Working Paper 18754, National Bureau ofEconomic Research, February 2013.
Chenggang Xu. The fundamental institutions of china’s reforms and development. Journal ofEconomic Literature, 49(4):1076–1151, 2011. doi: doi:10.1257/jel.49.4.1076.
Pengfei Zhang, Guanghui Dong, Baijun Sun, Liwen Zhang, Xi Chen, Nannan Ma, FeiYu, Huimin Guo, Hui Huang, Yungling Leo Lee, Naijun Tang, and Jie Chen. Long-term exposure to ambient air pollution and mortality due to cardiovascular disease andcerebrovascular disease in shenyang, china. Respiration, 84 (5)(6):360–368, 06 2012. doi:10.1371/journal.pone.0020827.
25
6 APPENDIX
Figure 3: US versus China’s pollution indexes (Source: own elaboration from US EPA andMEP)

Robustness: minima
Since the US air pollution index is constructed from hourly observations, we might want tocheck if the official Chinese air quality index is somehow closer to the US Embassy one whenusing daily minima, or other forms of aggregation. A graph of comparison between the USminimum value and the usual Beijing index is shown in figure 4.
Figure 4: Mismatch even with daily minima
The results are also robust when we use instead the maximum daily observation for the USEmbassy data.
27

Table 8: Chinese/USA air pollution indexes (minimum of US hourly observations)(1) (2) (3) (4) (5) (6) (7)
min. AQI -0.92*** -0.92*** -0.92*** -0.92*** -0.92*** -0.92*** -0.92***(0.01) (0.01) (0.01) (0.01) (0.01) (0.01) (0.01)
AQI threshold(100) -1.86*** -1.86*** -1.81*** -1.86*** -1.86*** -1.86*** -1.85***(0.29) (0.30) (0.30) (0.30) (0.30) (0.30) (0.30)
AQI threshold(200) 0.41 0.35 0.47 0.37 0.34 0.34 0.35(0.87) (0.87) (0.88) (0.88) (0.87) (0.88) (0.88)
AQI threshold(300) -2.56** -2.48** -2.78*** -2.52** -2.48** -2.48** -2.49**(1.04) (1.05) (1.05) (1.05) (1.05) (1.05) (1.05)
T100*avg. AQI 0.40*** 0.40*** 0.39*** 0.40*** 0.40*** 0.40*** 0.40***(0.06) (0.06) (0.06) (0.06) (0.06) (0.06) (0.06)
T200*avg. AQI -0.05 -0.04 -0.06 -0.05 -0.04 -0.04 -0.04(0.16) (0.16) (0.16) (0.16) (0.16) (0.16) (0.16)
T300*avg. AQI 0.45** 0.44** 0.49*** 0.44** 0.44** 0.44** 0.44**(0.18) (0.19) (0.19) (0.19) (0.19) (0.19) (0.19)
Constant 3.69*** 3.69*** 3.68*** 3.70*** 3.69*** 3.69*** 3.69***(0.11) (0.11) (0.10) (0.11) (0.11) (0.11) (0.11)
ARMAL.ar 0.34*** 0.32*** 0.44 0.43* -0.15
(0.03) (0.03) (0.97) (0.23) (2.22)
L2.ar 0.04 -0.00 0.27(0.03) (0.32) (0.91)
L.ma 0.30*** 0.32*** -0.11 -0.11 0.47(0.03) (0.03) (0.97) (0.23) (2.22)
L2.ma 0.12*** -0.00 -0.09(0.03) (0.08) (0.21)
sigmaConstant 0.21*** 0.21*** 0.21*** 0.21*** 0.21*** 0.21*** 0.21***
(0.00) (0.00) (0.00) (0.00) (0.00) (0.00) (0.00)
Observations 876 876 876 876 876 876 876AIC -159.64 -158.62 -147.24 -155.81 -156.64 -156.64 -154.73BIC -35.48 -29.68 -23.08 -26.87 -22.93 -22.93 -16.25Standard errors in parentheses* p < 0.10, ** p < 0.05, *** p < 0.01
28
Related Documents

![CAMBIAR EL RUMBO QUE LLEVAMOS DEPENDE DE TODOS · RNM & RNME (Sector 1 ) RNM & RNME (Sector 2 ) 0 1 0 2 Santa Cruz TDF Chubut B A N C O B U R D W O O D I [ 28. 973 km 2 ] BAN C O](https://static.cupdf.com/doc/110x72/601db25a56b8841273747c13/cambiar-el-rumbo-que-llevamos-depende-de-todos-rnm-rnme-sector-1-rnm-.jpg)