Air Force Institute of Technology Air Force Institute of Technology AFIT Scholar AFIT Scholar Theses and Dissertations Student Graduate Works 3-12-2004 Air Force Materiel Command: A Survey of Performance Measures Air Force Materiel Command: A Survey of Performance Measures Marcia Leonard Follow this and additional works at: https://scholar.afit.edu/etd Part of the Operations and Supply Chain Management Commons, and the Strategic Management Policy Commons Recommended Citation Recommended Citation Leonard, Marcia, "Air Force Materiel Command: A Survey of Performance Measures" (2004). Theses and Dissertations. 4007. https://scholar.afit.edu/etd/4007 This Thesis is brought to you for free and open access by the Student Graduate Works at AFIT Scholar. It has been accepted for inclusion in Theses and Dissertations by an authorized administrator of AFIT Scholar. For more information, please contact richard.mansfield@afit.edu. brought to you by CORE View metadata, citation and similar papers at core.ac.uk provided by AFTI Scholar (Air Force Institute of Technology)

Welcome message from author
This document is posted to help you gain knowledge. Please leave a comment to let me know what you think about it! Share it to your friends and learn new things together.
Transcript
Air Force Institute of Technology Air Force Institute of Technology
AFIT Scholar AFIT Scholar
Theses and Dissertations Student Graduate Works
3-12-2004
Air Force Materiel Command: A Survey of Performance Measures Air Force Materiel Command: A Survey of Performance Measures
Marcia Leonard
Follow this and additional works at: https://scholar.afit.edu/etd
Part of the Operations and Supply Chain Management Commons, and the Strategic Management
Policy Commons
Recommended Citation Recommended Citation Leonard, Marcia, "Air Force Materiel Command: A Survey of Performance Measures" (2004). Theses and Dissertations. 4007. https://scholar.afit.edu/etd/4007
This Thesis is brought to you for free and open access by the Student Graduate Works at AFIT Scholar. It has been accepted for inclusion in Theses and Dissertations by an authorized administrator of AFIT Scholar. For more information, please contact [email protected].
brought to you by COREView metadata, citation and similar papers at core.ac.uk
provided by AFTI Scholar (Air Force Institute of Technology)
AIR FORCE MATERIEL COMMAND: A SURVEY OF PERFORMANCE MEASURES
THESIS
Marcia Leonard, Capt, USAF
AFIT/GLM/ENS/04-10
DEPARTMENT OF THE AIR FORCE AIR UNIVERSITY
AIR FORCE INSTITUTE OF TECHNOLOGY Wright-Patterson Air Force Base, Ohio
APPROVED FOR PUBLIC RELEASE; DISTRIBUTION UNLIMITED

The views expressed in this thesis are those of the author and do not reflect the official policy or position of the United States Air Force, Department of Defense, or the United States Government.
AFIT/GLM/ENS/04-10
AIR FORCE MATERIEL COMMAND: A SURVEY OF PERFORMANCE MEASURES
THESIS
Presented to the Faculty
Department of Operational Sciences
Graduate School of Engineering and Management
Air Force Institute of Technology
Air University
Air Education and Training Command
In Partial Fulfillment of the Requirements for the
Degree of Master of Science in Logistics Management
Marcia Leonard, BS
Capt, USAF
March 2004
APPROVED FOR PUBLIC RELEASE; DISTRIBUTION UNLIMITED.
AFIT/GLM/ENS/04-10
AIR FORCE MATERIEL COMMAND: A SURVEY OF PERFORMANCE MEASURES
Marcia Leonard, BS Capt, USAF
Approved: //signed// 12 March 2004
_____________________________________ ______________ Stanley E. Griffis, Maj, USAF (Chairman) Date //signed// 12 March 2004 _____________________________________ ______________ Stephan P. Brady, Lt Col, USAF (Member) Date
AFIT/GLM/ENS/04-10
Abstract
Performance measurement has long been a matter of debate in logistics.
However, in the recent past, there has been a renewed emphasis as AF leaders continue to
seek funding for weapon system spares despite marginal improvements in mission
capability. The Chief’s Logistics Review, Logistics Transformation Program, AFMC
Constraints Assessment Program, the Spares Requirement Review Board, the Spares
Campaign, and the Depot Maintenance Reengineering and Transformation all represent
efforts to find and implement effective answers (RAND, 2003:ix). And, while there
appears to be a consensus that better performance measures are needed, there is little
agreement on exactly what should be measured, and how.
Many performance management plans have been developed and recommended.
In 1999, the Logistics Management Institute (LMI) published Supply Chain
Management: A Recommended Performance Measurement Scorecard to guide senior
DoD logistics managers. Then, in 2001, the AF Logistics Management Agency
developed an set of aggregate or strategic level metrics, Measuring the Health of USAF
Supply, at the request of AF/ILS. Most recently, in November of 2003, the Supply
Management Division published the AFMC Supply Chain Metrics Guide. However, each
of these performance measurement plans each is distinctly different.
This research seeks to determine how and why these performance measurements
plans differ, and to examine what such differences might reveal about the nature of
performance measurement in AF logistics systems.
iv

Acknowledgements
It is good to have an end to journey towards; but it is the journey that matters in the end.
~ Ursula K. LeGuin
To my advisor, Major Stanley Griffis, I sincerely appreciated your guidance and
patience in this effort. Hindsight is 20/20, and I can only imagine how this would have
turned out if I had just been a better listener.
To my class leader, Captain Steve Gray, your support, guidance and
encouragement have been invaluable over the last 18 months. You took the role of
surrogate supervisor to unprecedented heights. I can only hope to be as smart as you are
someday, but I am sure there are not enough days left. You are truly an officer and a
gentleman.
To my family, there are not enough words. Despite the abstract concepts and
application, you continued to ask and listen with every call of support. Rachel, your
unwavering confidence, despite your wavering interest, meant the most. Just so you
know I’m not done whining, “are we there yet?” We have a few years left on this
journey.
My sincerest gratitude,
Marcia E
v
Table of Contents
Page
Abstract .............................................................................................................................. iv
Acknowledgements............................................................................................................. v
List of Figures .................................................................................................................... ix
List of Tables ...................................................................................................................... x
I. Introduction .................................................................................................................... 1
Overview........................................................................................................................ 1 Background .................................................................................................................... 1 Problem Statement ......................................................................................................... 2 Research Questions ........................................................................................................ 3 Investigative Questions .................................................................................................. 3 Methodology .................................................................................................................. 3 Scope.............................................................................................................................. 4 Significance.................................................................................................................... 4 Thesis Overview ............................................................................................................ 4
II. Literature Review........................................................................................................... 5
Government Performance and Results Act (GPRA)...................................................... 5 Strategic Planning .......................................................................................................... 6 Linking Strategy and Performance................................................................................. 8
Strategic Management System ................................................................................8 Vertical Alignment ................................................................................................10
Developing Performance Measures ............................................................................. 12 Measurement Models ................................................................................................... 15
Family of Measures ...............................................................................................16 Supply Chain Operational Reference (SCOR) ......................................................17 Balanced Score Card..............................................................................................18
Categories of Performance Measures........................................................................... 20 Process Measures: Economy ................................................................................22 Productivity Measures: Efficiency .......................................................................23 Effectiveness: Output versus Outcomes ...............................................................23 Capability Measures ..............................................................................................25 Lagging versus Leading Indicators........................................................................26
Characteristics of Measure Systems............................................................................. 26 How Many .............................................................................................................27 Frequency ..............................................................................................................29 Accountability........................................................................................................29
vi
Page
Validity ..................................................................................................................30 Reliability ..............................................................................................................31 Comparatives .........................................................................................................31
Supply Chain Management (SCM).............................................................................. 33 Systems Approach .................................................................................................34 Trade-Offs..............................................................................................................35 Funding Differences ..............................................................................................36
Chapter Review............................................................................................................ 36
III. Methodology .............................................................................................................. 37
Qualitative Research .................................................................................................... 37 Case Study Strategy ..................................................................................................... 37 Case Study Design ....................................................................................................... 39
Multiple-Case Method ...........................................................................................41 Four Design Tests ..................................................................................................42
Data Collection ............................................................................................................ 45 Case and Data Selection Criteria ...........................................................................46 Case Study Protocol...............................................................................................49
Data Analysis Procedures ............................................................................................ 50 Chapter Review............................................................................................................ 51
IV. Analysis ...................................................................................................................... 52
Chapter Overview ........................................................................................................ 52 Research Findings ........................................................................................................ 52
Strategic Planning and Vertical Alignment ...........................................................52 Business Process Models .......................................................................................55 Measurement Models and “Line of Sight” ............................................................57 Supply Chain Management....................................................................................61
Investigative Questions ................................................................................................ 62 Managerial Implications .............................................................................................. 63
V. Discussion, Conclusions and Recommendations........................................................ 64
Limitations ................................................................................................................... 64 Researcher as an ‘Instrument’ ...............................................................................64
Recommendations for Future Research ....................................................................... 65 Research Summary....................................................................................................... 65
vii
Page
Appendix A: AFMC Supply Chain Metrics Guide.......................................................... 68
Appendix B: Measuring the Health of USAF Supply ..................................................... 76
Appendix C: Supply Chain Management ........................................................................ 82
Bibliography ..................................................................................................................... 90
viii
List of Figures
Figure Page
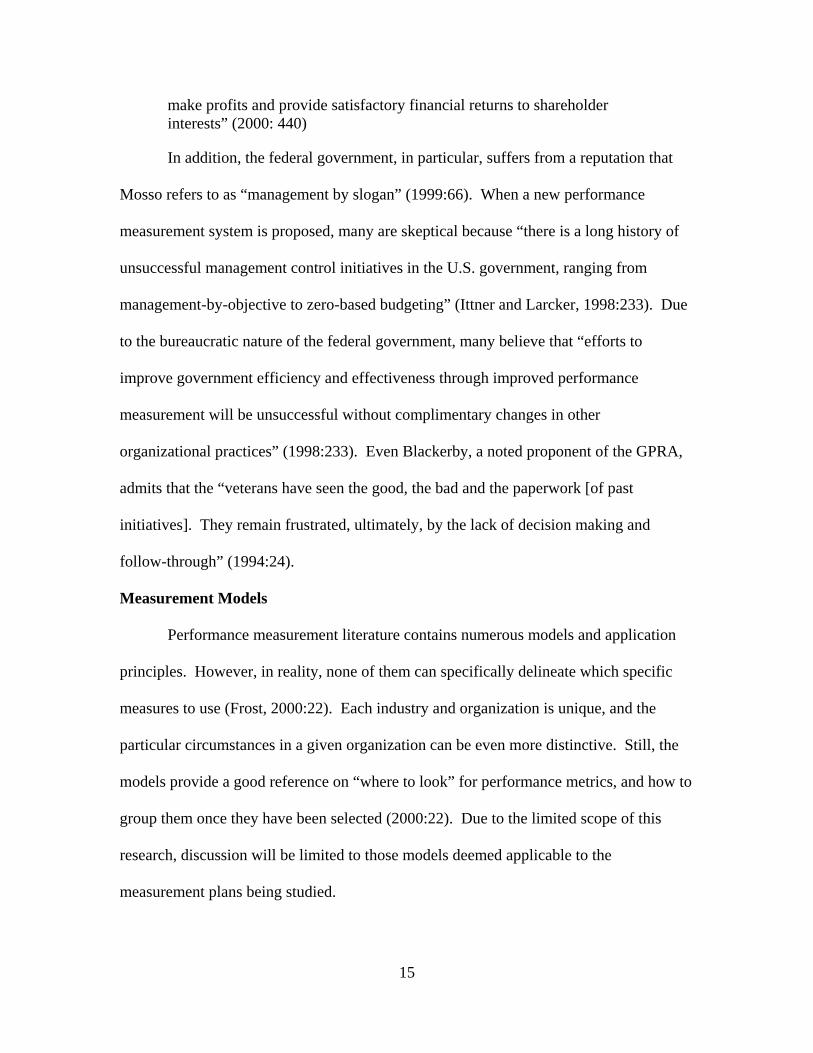
1. Managing Strategy: Four Processes.............................................................................. 9
2. DoD Levels of Performance Measurement................................................................. 11
3. SCOR Model Supply Chain Thread ........................................................................... 17
4. Financial/Customer Perspective for the Public Sector................................................ 19
5. Relationship between Alternative Performance Measures ......................................... 22
6. Multiple Case Study Method ...................................................................................... 41
7. DoD Levels of Performance Measurement................................................................. 53
8. Aircraft Availability Metrics Cycle ............................................................................ 56
9. Supply Model Outline (AFLMA, 2001) ..................................................................... 56
10. DoD Supply Chain Performance Metrics ................................................................... 58
11. Supply Segment Balanced Scorecard ......................................................................... 59
ix
List of Tables Table Page
1. Comparison of Research Strategies ............................................................................ 38
2. Matching Objectives to Strategy................................................................................. 39
3. Case Study Tactics for Four Design Tests.................................................................. 43
4. Sources of Evidence.................................................................................................... 45
5. DoD Configured Alignment ....................................................................................... 54
6. Implied Measurement Alignment ............................................................................... 54
7. Business Process Model Summary ............................................................................. 57
8. Collective Overview of AFMC’s Measurement Model.............................................. 60
x
AIR FORCE MATERIEL COMMAND: A SURVEY OF PERFORMANCE MEASURES
I. Introduction
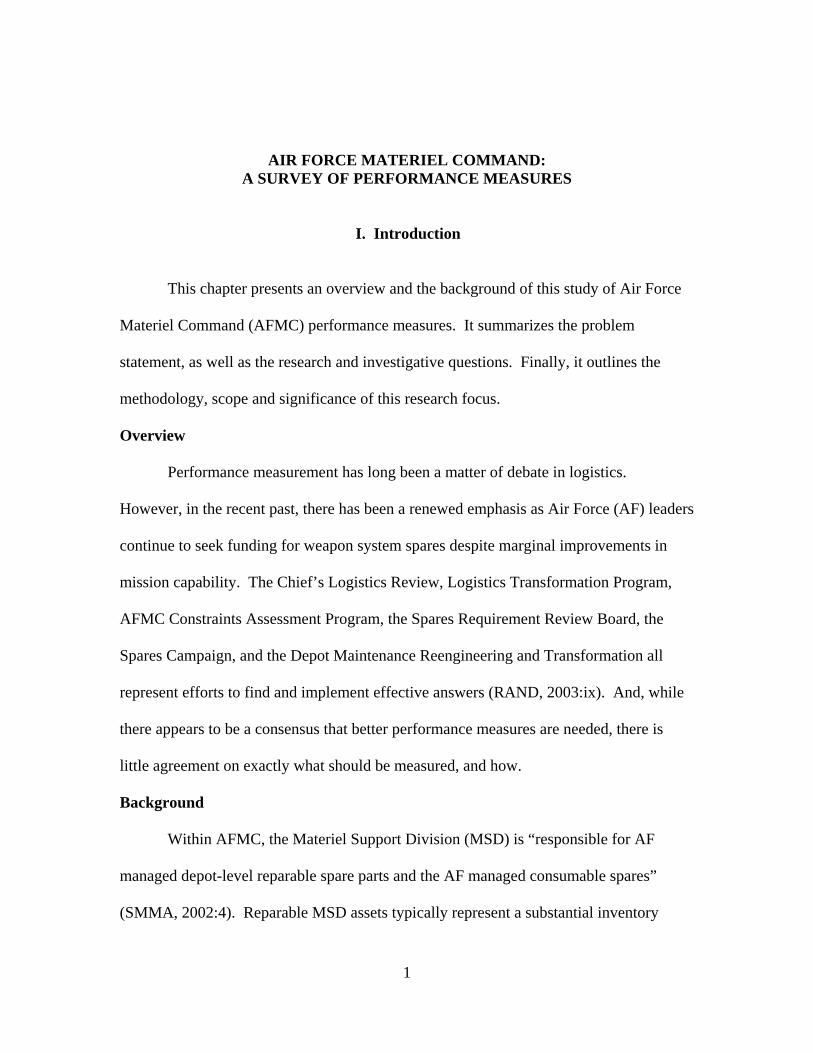
This chapter presents an overview and the background of this study of Air Force
Materiel Command (AFMC) performance measures. It summarizes the problem
statement, as well as the research and investigative questions. Finally, it outlines the
methodology, scope and significance of this research focus.
Overview
Performance measurement has long been a matter of debate in logistics.
However, in the recent past, there has been a renewed emphasis as Air Force (AF) leaders
continue to seek funding for weapon system spares despite marginal improvements in
mission capability. The Chief’s Logistics Review, Logistics Transformation Program,
AFMC Constraints Assessment Program, the Spares Requirement Review Board, the
Spares Campaign, and the Depot Maintenance Reengineering and Transformation all
represent efforts to find and implement effective answers (RAND, 2003:ix). And, while
there appears to be a consensus that better performance measures are needed, there is
little agreement on exactly what should be measured, and how.
Background Within AFMC, the Materiel Support Division (MSD) is “responsible for AF
managed depot-level reparable spare parts and the AF managed consumable spares”
(SMMA, 2002:4). Reparable MSD assets typically represent a substantial inventory
1
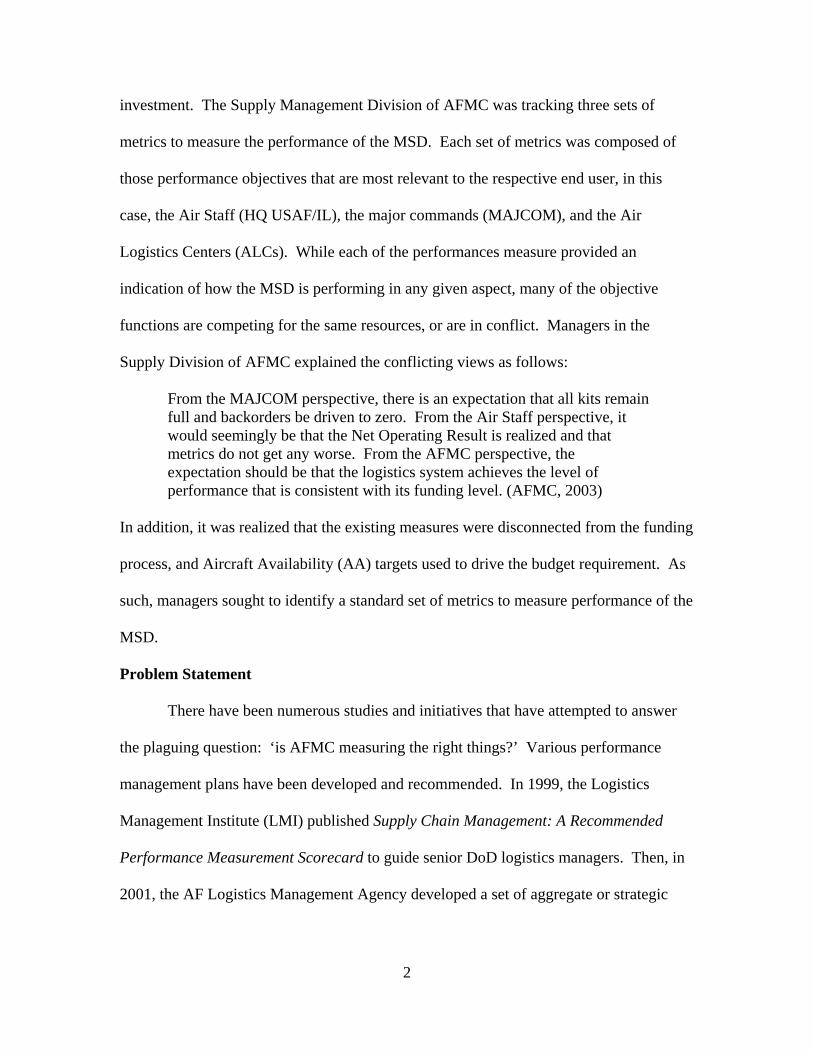
investment. The Supply Management Division of AFMC was tracking three sets of
metrics to measure the performance of the MSD. Each set of metrics was composed of
those performance objectives that are most relevant to the respective end user, in this
case, the Air Staff (HQ USAF/IL), the major commands (MAJCOM), and the Air
Logistics Centers (ALCs). While each of the performances measure provided an
indication of how the MSD is performing in any given aspect, many of the objective
functions are competing for the same resources, or are in conflict. Managers in the
Supply Division of AFMC explained the conflicting views as follows:
From the MAJCOM perspective, there is an expectation that all kits remain full and backorders be driven to zero. From the Air Staff perspective, it would seemingly be that the Net Operating Result is realized and that metrics do not get any worse. From the AFMC perspective, the expectation should be that the logistics system achieves the level of performance that is consistent with its funding level. (AFMC, 2003)
In addition, it was realized that the existing measures were disconnected from the funding
process, and Aircraft Availability (AA) targets used to drive the budget requirement. As
such, managers sought to identify a standard set of metrics to measure performance of the
MSD.
Problem Statement
There have been numerous studies and initiatives that have attempted to answer
the plaguing question: ‘is AFMC measuring the right things?’ Various performance
management plans have been developed and recommended. In 1999, the Logistics
Management Institute (LMI) published Supply Chain Management: A Recommended
Performance Measurement Scorecard to guide senior DoD logistics managers. Then, in
2001, the AF Logistics Management Agency developed a set of aggregate or strategic
2
level metrics, Measuring the Health of USAF Supply, at the request of AF/ILS. Most
recently, in November of 2003, the Supply Management Division published the AFMC
Supply Chain Metrics Guide. However, each of these performance measurement plans
each is distinctly different.
While each performance plan recommends some new measures, there is also a
repeated trend of continuing to use the same measures, with disclaimers as to their value
and application. To date, however, there has been no consideration given to the differing
content of each of the initiatives. Although three learned organizations have attempted to
answer the same question about performance management, there are three distinct, yet
seemingly compelling recommendations.
Research Questions
The focus of this research effort is to determine what a comparative analysis of
three performance measurement plans may reveal about the nature of performance
measurement in AF logistics systems.
Investigative Questions
As such, the following investigative questions will be used to guide the
researcher’s efforts:
1. How do the performance measurement recommendations of the LMI, the AFLMA and AFMC differ?
2. Why do the performance measures differ?
Methodology
This research effort applies a case study design to compare the performance
measurement recommendations of the LMI, the AFLMA, and AFMC initiatives.
3
Utilizing a multiple-case method, the performance plans were analyzed individually and
the results were compared to identify common themes and draw cross-case conclusions.
Scope This thesis examines the underlying assumptions of three performance
measurement initiatives in order to provide a better understanding of AF logistics
systems. However, AFMC is a complex organization, composed of several inter-related
functions and processes. As such, this study will focus on AFMC processes as defined
by the performance plans.
Significance
As noted, there have been numerous initiatives to improve the performance and
measurement of the MSD processes. It would be presumptuous to suggest that one set of
metrics would provide a better assessment of AFMC performance, however, since the
question persists, it is reasonable to assume that there are still differing views of how
performance should be measured. Findings of this research may identify concepts that
provide a foundation of consensus that would make the measures more relevant and
meaningful to the all users.
Thesis Overview
This chapter presents the background, purpose, research questions, and
assumptions under study. Chapter II provides a review of the literature pertaining to
performance measurement. Chapter III explains the methodology used for this research
effort, and Chapter IV summarizes the results of those efforts. Finally, Chapter V
outlines the research limitations, and provides recommended future research.
4
II. Literature Review
This chapter begins with an explanation of the reporting requirements contained
in the Government Performance and Results Act. Pursuant to those requirements, it
discusses strategic planning, performance measurement and characteristics of
measurement systems. Finally, it provides an overview of supply chain management as it
pertains to subsequent research and discussion.
Government Performance and Results Act (GPRA)
As early as 1971, a DoD task force recommended “increased uniformity,
standardization, and/or integration on an inter-functional or inter-Component basis,” as a
means to improve efficiency and responsiveness (1998:5-1). It was noted in the Senate
Committee on Government Affairs GPRA Report (Report 103-58) that the GAO had
“produced over 70 reports on performance measures” since 1973 (1993:5). With passage
of the GPRA in 1993, performance measurement within federal agencies was mandated
by public law. By requiring the submission of formalized strategic plans, federal
agencies were now required to set goals, measure their performance, and self report. In
accordance with issued guidance, and with an increased emphasis on accountability in
government, strategic plans must include:
1. a comprehensive mission statement covering the major functions and operations of the agency;
2. general goals and objectives, including outcome-related goals and objectives, for the major functions and operations of the agency;
3. a description of how the goals and objectives are to be achieved, including a description of the operational processes, skills and technology, and the human, capital, information and other resources required to meet those goals and objectives;
5
4. a description of how the performance goals included in the plan…shall be related to the general goals and objectives in the strategic plan;
5. an identification of those key factors external to the agency and beyond its control that could significantly affect the achievement of the general goals and objectives; and
6. a description of the program evaluations used in establishing or revising general goals and objectives, with a schedule for future program evaluations. (Report 103-58, 1993:44)
Although the act was passed in 1993, submission of formal plans was not
mandatory until 1997. Nonetheless, “in [fiscal year] 1994, the Deputy Assistant
Secretary of Defense (Logistics) began an initiative to publish an annual DoD logistics
strategic plan” (LMI, 1998:5-3). With that, each military service and the Defense
Logistics Agency began publishing subordinate plans as well, and a formalized planning
process took root. Although it has been nearly ten years since the first logistics strategic
plan was published, many federal agencies continue to struggle with the strategic
planning process.
Strategic Planning The word ‘strategy’ literally means ‘general of the army.’ Greek Strategoi “were
elected political leaders, who left battlefield tactics to troop leaders, but ruled on policy
issues as a group” (Blackerby, 1994:21). Similarly, AF Doctrine Document 1 states that
“strategy originates in policy and addresses broad objectives and the plans for achieving
them” (1997:4). AF Policy Directive 20-1 adds that “long range strategic planning is a
necessity… [that] demands a disciplined, yet flexible process capable of identifying
crucial logistics goals and developing a road maps to achieve them” (1993:1). The
common concept in all of these definitions is the presence of a goal, or objective, and the
development of a plan to achieve it. Accordingly, Blackerby, a former GAO planner,
6
defined strategic planning as “a continuous and systematic process where people make
decisions about intended future outcomes, how outcomes are to be accomplished, and
how success is measured and evaluated” (1994:21).
Although it would appear to be a straightforward process, there are pitfalls to
strategic planning. Frost warns that organizational managers should “be wary of using
lofty statements if they are just there for PR [public relations] purposes” (2000:28).
Developed appropriately, well-defined goals can “compel [the] organization to develop a
consensual vision of the future” (Blackerby, 1994:23). In fact, many planners agree that
“the most valuable benefits of any strategic planning effort lie in the process, rather than
the product,…[because it] unifies the entire organization behind a single set of marching
orders” (1994:23). This view is shared by AFMC in command policy which states that
“the strategic plan is the glue (not the metrics) which cements the command’s long range
vision together from command level to the worker level” (1995:5).
Porter warns of another potential difficulty that occurs when “rather than seeing
the company as a whole, managers [turn] to ‘core’ competencies, ‘critical’ resources, and
‘key’ success factors” (1996:70). By failing to realize the interdependent relationship of
discrete activities, managers overlook “one of the oldest ideas in strategy,…[which is] the
importance of fit among functional policies” (1996:70). He explains that:
“There are three types of fit, although they are not mutually exclusive. First-order fit is simple consistency between each activity (function) and the overall strategy…Second-order fit occurs when activities are reinforcing…Third-order fit goes beyond activity reinforcement…to optimization of effort” (1996:71-72)
This notion not only cautions again disjointed policy developments, but also highlights
the potential synergy that can occur when strategy and policy are properly aligned.
7
Linking Strategy and Performance
In order to link strategy to performance, the strategy should include some form of
goals, objectives, or mission statements—“all the key things [that the organization] is
committed to accomplishing” (Frost, 2000:28). Kaplan and Norton refer to this as
“translating the vision,” and believe that it is a key element in “build[ing] a consensus
around the organization’s vision and strategy” (1996:75). And, since every organization
is different, strategic performance measures should be “truly unique and relevant to…the
organization,” in that, they “should be closely focused around a line of sight” (Frigo,
2002:15).
Kaplan and Norton share Frost’s view on lofty statement, saying they “don’t
translate easily into operational terms…[or] provide useful guides to action at the local
level” (1996:76). In fact, in a survey conducted by the Institute of Management
Accountants, over half of the participants believed that their company’s performance
measures failed to adequately communicate the company’s strategy (Frigo, 2002:10).
The suspected cause of this phenomenon is that very often the “strategy-development
processes and performance measurement (strategy-execution) processes” are conducted
independently (2002:10). Kaplan and Norton propose that organizations using a
“Balanced Scorecard” (to be discussed later) can use it to initiate “four new management
processes, that separately and in combination, contribute to linking long-term strategic
objectives with short-term actions” (1996:75).
Strategic Management System
As noted above, Kaplan and Norton’s model begins with translating the vision.
The second process, as shown in the model below, is communicating and linking, which
8
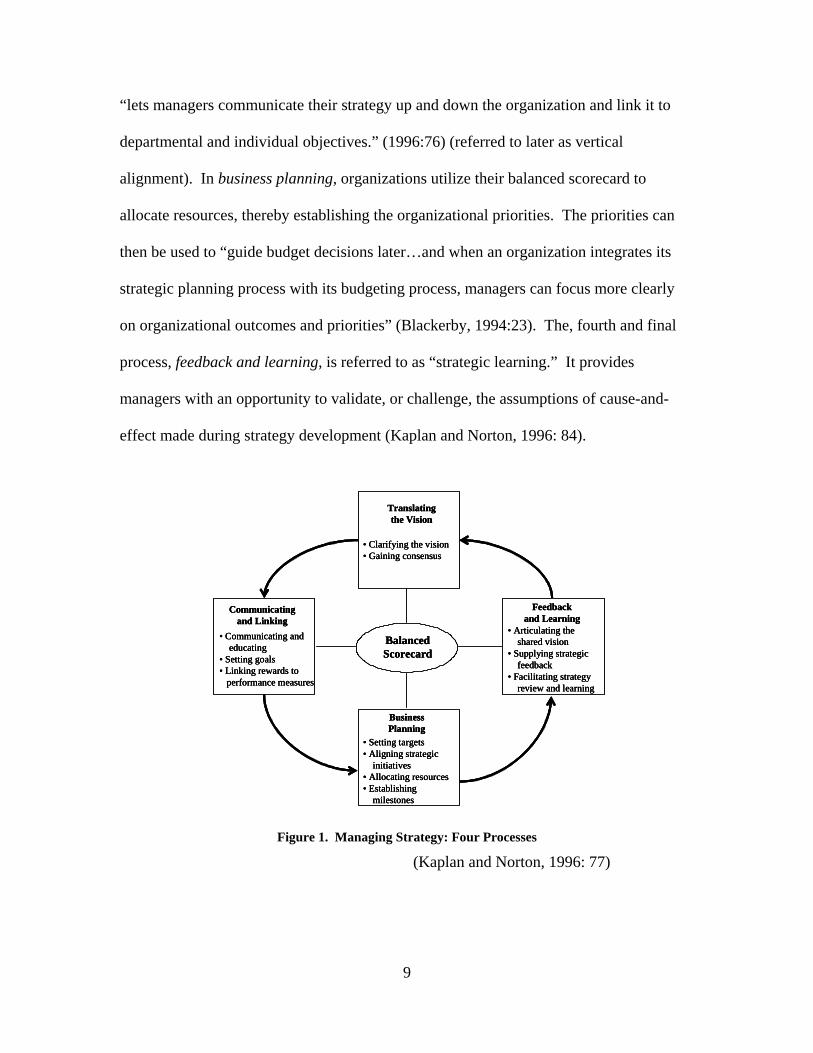
“lets managers communicate their strategy up and down the organization and link it to
departmental and individual objectives.” (1996:76) (referred to later as vertical
alignment). In business planning, organizations utilize their balanced scorecard to
allocate resources, thereby establishing the organizational priorities. The priorities can
then be used to “guide budget decisions later…and when an organization integrates its
strategic planning process with its budgeting process, managers can focus more clearly
on organizational outcomes and priorities” (Blackerby, 1994:23). The, fourth and final
process, feedback and learning, is referred to as “strategic learning.” It provides
managers with an opportunity to validate, or challenge, the assumptions of cause-and-
effect made during strategy development (Kaplan and Norton, 1996: 84).
BalancedScorecard
• Clarifying the vision• Gaining consensus
Communicatingand Linking
• Communicating andeducating
• Setting goals• Linking rewards to
performance measures
BusinessPlanning
• Setting targets• Aligning strategic
initiatives• Allocating resources• Establishing
milestones
Feedbackand Learning
• Articulating theshared vision
• Supplying strategicfeedback
• Facilitating strategyreview and learning
Translatingthe Vision
BalancedScorecard
• Clarifying the vision• Gaining consensus
Communicatingand Linking
• Communicating andeducating
• Setting goals• Linking rewards to
performance measures
BusinessPlanning
• Setting targets• Aligning strategic
initiatives• Allocating resources• Establishing
milestones
Feedbackand Learning
• Articulating theshared vision
• Supplying strategicfeedback
• Facilitating strategyreview and learning
Translatingthe Vision
Translatingthe Vision
Figure 1. Managing Strategy: Four Processes
(Kaplan and Norton, 1996: 77)
9
Vertical Alignment
Due to the hierarchical nature of organizational management, the concept of
vertical alignment recognizes that different levels of management within an organization
require different kinds of information to make decisions or monitor internal processes.
To ensure vertical alignment, Frost recommends translating strategy factors into
“performance topics” (2000:29). As each area of responsibility identifies the activities
that are necessary to support the broader “performance topic,” objectives and measures
will naturally ‘cascade’ from level to level and “get everyone pulling in the same
direction” (2000:29). DoD’s guidance on vertical alignment is vary similar to Frost’s
concept of ‘cascading’ measures.
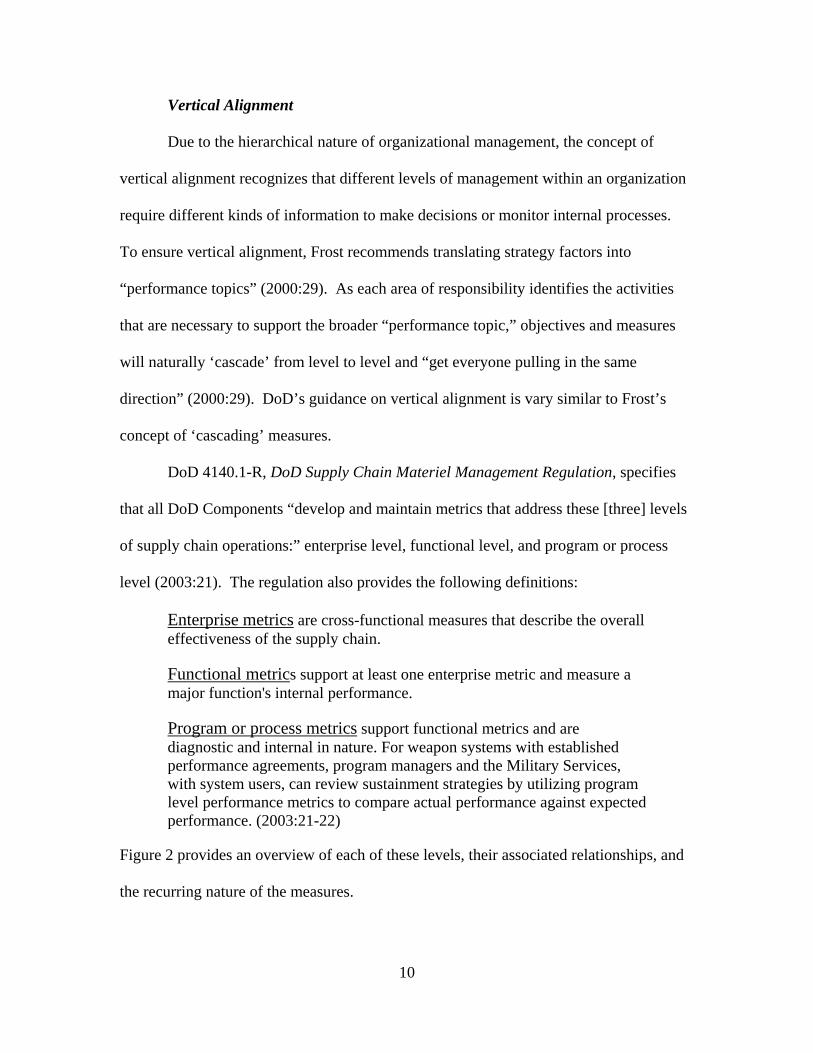
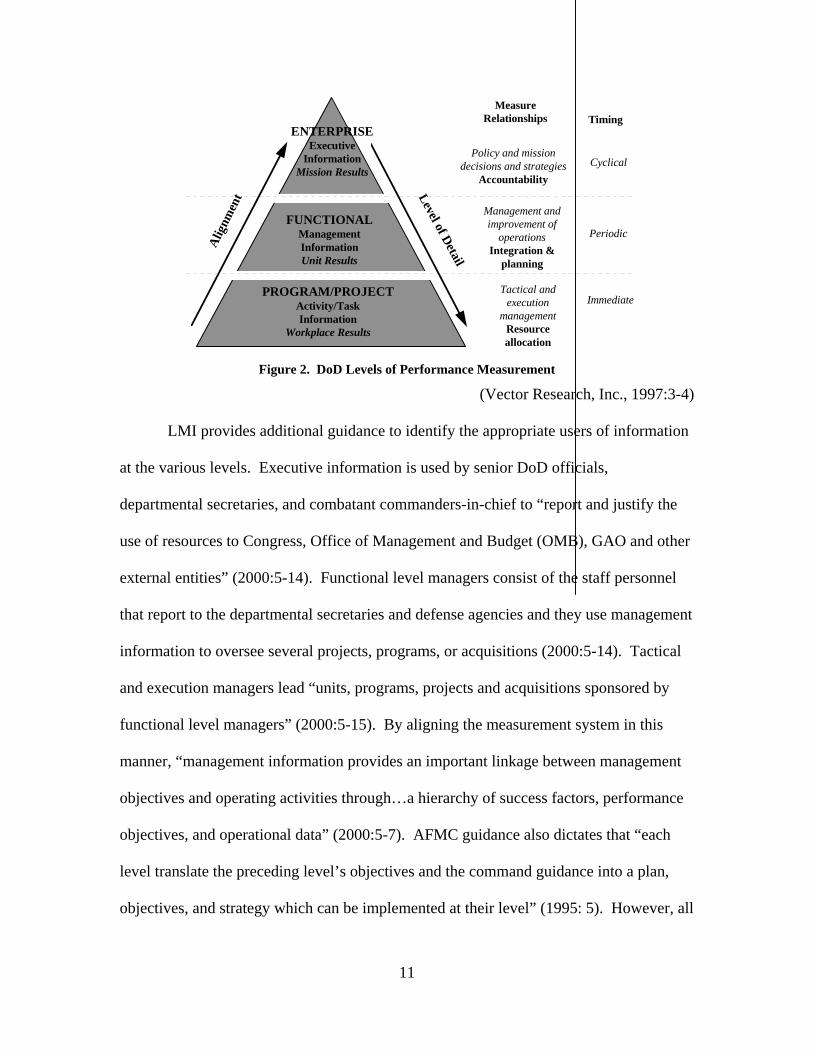
DoD 4140.1-R, DoD Supply Chain Materiel Management Regulation, specifies
that all DoD Components “develop and maintain metrics that address these [three] levels
of supply chain operations:” enterprise level, functional level, and program or process
level (2003:21). The regulation also provides the following definitions:
Enterprise metrics are cross-functional measures that describe the overall effectiveness of the supply chain.
Functional metrics support at least one enterprise metric and measure a major function's internal performance.
Program or process metrics support functional metrics and are diagnostic and internal in nature. For weapon systems with established performance agreements, program managers and the Military Services, with system users, can review sustainment strategies by utilizing program level performance metrics to compare actual performance against expected performance. (2003:21-22)
Figure 2 provides an overview of each of these levels, their associated relationships, and
the recurring nature of the measures.
10
ENTERPRISEExecutive
InformationMission Results
FUNCTIONALManagementInformationUnit Results
PROGRAM/PROJECTActivity/TaskInformation
Workplace Results
Alig
nmen
t Level of Detail
MeasureRelationships Timing
Policy and missiondecisions and strategies
AccountabilityCyclical
Management andimprovement of
operationsIntegration &
planning
Periodic
ImmediateTactical and
executionmanagement
Resourceallocation
Figure 2. DoD Levels of Performance Measurement
(Vector Research, Inc., 1997:3-4)
LMI provides additional guidance to identify the appropriate users of information
at the various levels. Executive information is used by senior DoD officials,
departmental secretaries, and combatant commanders-in-chief to “report and justify the
use of resources to Congress, Office of Management and Budget (OMB), GAO and other
external entities” (2000:5-14). Functional level managers consist of the staff personnel
that report to the departmental secretaries and defense agencies and they use management
information to oversee several projects, programs, or acquisitions (2000:5-14). Tactical
and execution managers lead “units, programs, projects and acquisitions sponsored by
functional level managers” (2000:5-15). By aligning the measurement system in this
manner, “management information provides an important linkage between management
objectives and operating activities through…a hierarchy of success factors, performance
objectives, and operational data” (2000:5-7). AFMC guidance also dictates that “each
level translate the preceding level’s objectives and the command guidance into a plan,
objectives, and strategy which can be implemented at their level” (1995: 5). However, all
11
users should understand that “this generally means less detail for senior managers and
greater detail for functional and operational managers” (LMI, 1998:5-22).
However, some would disagree that managers can so readily identify the
associated measures. Eccles and Pyburn contend that “before a comprehensive system of
performance measurement can be developed, senior management needs to agree on the
business performance model of the firm—their understanding of the relationships
between management actions and results, which are often implicit, that affect important
decisions” (1992:42). Furthermore, Ittner and Larker, believe that
“ although establishing a firm’s business model prior to selecting measures has the advantage of sharpening strategic focus and organizational priorities, it can be difficult to establish the reliability and predictive validity of the multiple measures in the business model without having done a great deal of measurement and analysis in the first place” (1998: 226).
Any differences abut an appropriate business model held by senior managers or
management-planning teams need to be discovered and resolved “in order to develop an
effective performance management system” (Eccles and Pyburn, 1992:44). In addition,
they must develop a model that “works in terms of capturing the empirical relationships
that exist while being credible to the people in the company” (1992:43). The desired end
state is that when an organization develops a performance measurement system, the
selected measures all contribute in some meaningful way to the overall strategy of the
organization.
Developing Performance Measures
Prior to developing a performance measurement system, managers must be aware
of the potential implications of their undertaking because “what you measure is what you
12
get” (Kaplan and Norton, 1992:71). In addition, “relatively few studies have examined
the…measures’ economic relevance, the implementation issues arising from their
adoption, or the performance consequences from their use” (Ittner and Larcker,
1998:205). So, generally, “the choice of performance measures is one of the most critical
challenges facing organizations” (1998:205). Generically, most would agree that selected
“measures should be those that help… improve output—make [the] organization’s
deliverables better, faster, and cheaper” (Frost, 2000:22). However, as previously
discussed, “the range of measures must be structured to provide a clear view of the causes
of the results and the drivers of future performance” (McAdam and Bailie, 2002:975).
Without such alignment, “it is possible that any performance consequences are simply
due to a Hawthorne Effect, with the specific measure [chosen] having minimal
importance” (Ittner and Larcker, 1998:234). In addition, “for metrics to be
motivational…there must be a line of sight between the actions employees can take and
the changes that occur in the measure.” (Frost, 2000:43).
Due precaution is necessary because once a measurement system is in place, it
can be extremely difficult to change. Very often, changing the measures used to evaluate
a system requires that “traditional measures…be discarded, at great risk and under
significant duress, in order to proceed with…change” (Sink, 1991:23). Not only are
personnel resistant to change, but also many may feel challenged or uneasy about the
prospect of how their work will be evaluated. In addition, “numerous counter-intuitive
and counter-tradition actions [have] to be taken” to allow time for the new management
emphasis to ‘settle in’ (Sink, 1991:23). So, while “some past practices may still be
useful,…everything should be strenuously challenged” (Eccles, 1991:137).
13
“A good performance measurement system does not by itself produce good
performance” which is why Mosso refers to it instead as “performance management”
(1999:69). And, it is a responsibility of management to “translate performance measures
into value-added” activities (1999:69). There are four critical elements of effective
performance management:
First, a comprehensive measurement system that integrates financial and nonfinancial measures of the costs and consequences of an entity’s operations, and analyzes and reports results internally and externally.
Second, a management process that focuses on maximizing value added and bases planning, budgeting and operating decision making on information provided by the measurement system.
Third, an incentive structure that reinforces the measurement system and fosters innovation and prudent risk taking.
Fourth, an independent audit facility that tests the credibility of the measurement system and critiques the effectiveness and efficiency of the operations. (1999:70)
Incorporating these elements into a performance management system helps managers
elicit the desired performance.
However, performance measurement in the public sector presents some unique
challenges. Eccles noted that “what is most effective for a given [organization] will
depend on its history, culture, and management style” (1991:137). Federal agencies, and
the military, in particular, are often characterized by their history and deeply ingrained
cultures. This leads managers in government agencies to question “whether private
sector notions of performance measurement and accountability are applicable in the
public sector” (Ittner and Larcker, 1998:233). Boland and Fowler found that
“performance management in the [public] sector is relatively more complicated due to the absence of the single overriding goal which ultimately dominates private sector companies. That is, the motivation to
14
make profits and provide satisfactory financial returns to shareholder interests” (2000: 440)
In addition, the federal government, in particular, suffers from a reputation that
Mosso refers to as “management by slogan” (1999:66). When a new performance
measurement system is proposed, many are skeptical because “there is a long history of
unsuccessful management control initiatives in the U.S. government, ranging from
management-by-objective to zero-based budgeting” (Ittner and Larcker, 1998:233). Due
to the bureaucratic nature of the federal government, many believe that “efforts to
improve government efficiency and effectiveness through improved performance
measurement will be unsuccessful without complimentary changes in other
organizational practices” (1998:233). Even Blackerby, a noted proponent of the GPRA,
admits that the “veterans have seen the good, the bad and the paperwork [of past
initiatives]. They remain frustrated, ultimately, by the lack of decision making and
follow-through” (1994:24).
Measurement Models
Performance measurement literature contains numerous models and application
principles. However, in reality, none of them can specifically delineate which specific
measures to use (Frost, 2000:22). Each industry and organization is unique, and the
particular circumstances in a given organization can be even more distinctive. Still, the
models provide a good reference on “where to look” for performance metrics, and how to
group them once they have been selected (2000:22). Due to the limited scope of this
research, discussion will be limited to those models deemed applicable to the
measurement plans being studied.
15
Family of Measures
Although none of the recommended performance plans under study specifically
refer to a ‘family of measures,’ this concept is common to all of the measurement models.
Essentially, it suggests that most organizations require more than one measure of
performance, and implies that to be effective measures should be interrelated. This
concept is conveyed by comparing performance measurement with a trip to the
emergency room (Provost and Leddick , 1993:477). Suppose upon admittance, the
doctors chose to use temperature as the only indicator of a patient’s well-being. They
would take the patient’s temperature often and from different areas of the body,
meticulously recording every reading, but they take no other measures. Most would
agree that the notion is ludicrous and insist upon other measures, such as blood pressure,
heart rate and reflexes. However, many organizations do just this. Many organizations
“often measure only one or two dimensions or aspects of their performance [and] by
doing so…blind themselves to how the entire organization is functioning” (1993:477-
478). It is important that managers view “the organization as a whole, as a single,
complex, and dynamic system” to ensure that they are “optimizing the performance of the
whole system, not just its parts taken individually and summed” (1993:478).
Another common analogy compares a family of measures to a vector. By
definition, “a vector is composed of components that individually may not provide useful
information, but, taken as a whole, the components provide information on both the
magnitude and direction” (Provost and Leddick, 1993:478). As such, a family of
measures should not only be an indication of current performance, magnitude, but also
provide a realistic forecast of future performance, direction (1993: 479). Again, the
16
overarching premise is that managers must “develop a holistic view of the system, rather
than an analysis of each component or each individual period’s set of measures” (1993:
485).
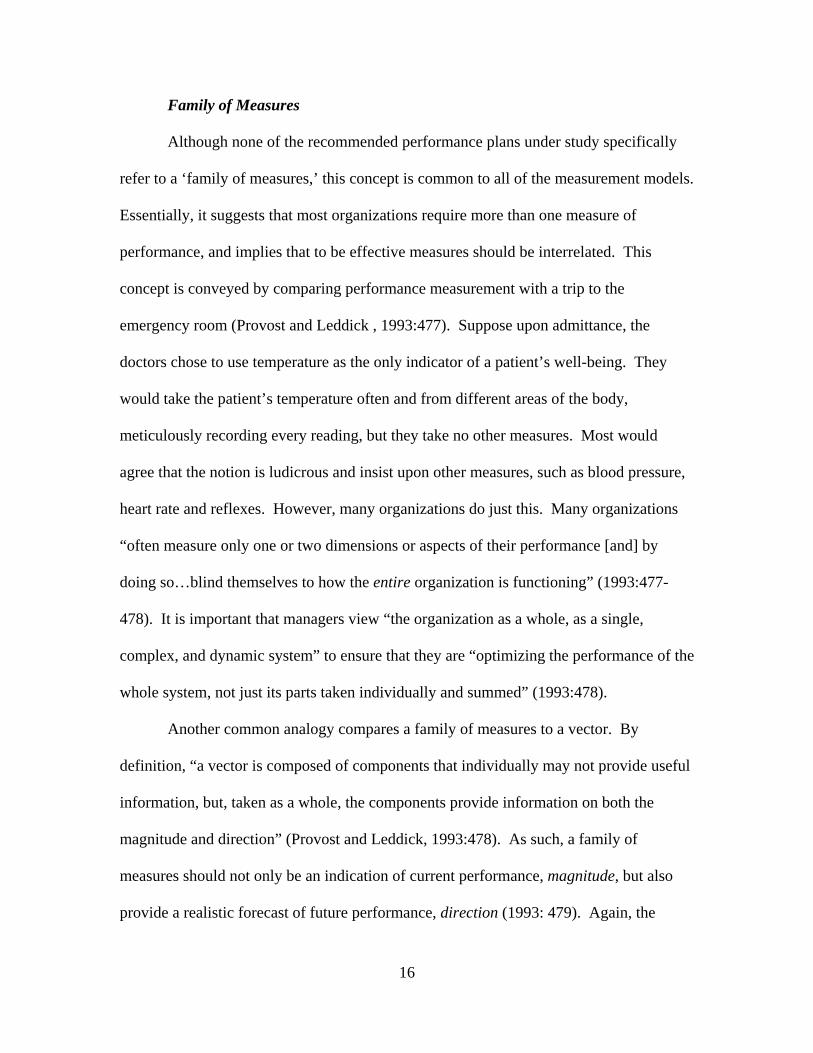
Supply Chain Operational Reference (SCOR) The SCOR Model (shown below), developed by the Supply-Chain Council, is “a
business process reference model which provides a comprehensive toolset linking
business process to metrics, best practices and technology” (Stephens, 2001:471). The
SCC is an independent, not-for-profit corporation that joins together a broad range of
industries to advance state-of-the-art supply-chain management systems and practices
(Stephens, 2001:471). By defining the activities that make up an organization’s ‘plan,’
‘source,’ ‘make,’ and ‘deliver’ processes, this analytical tool “integrates the concepts of
business process reengineering, benchmarking, and process measurement into a
structured approach” (LMI, 2000: 108).
Figure 3. SCOR Model Supply Chain Thread
(Supply-Chain Council, Inc, 2000: 3)
17
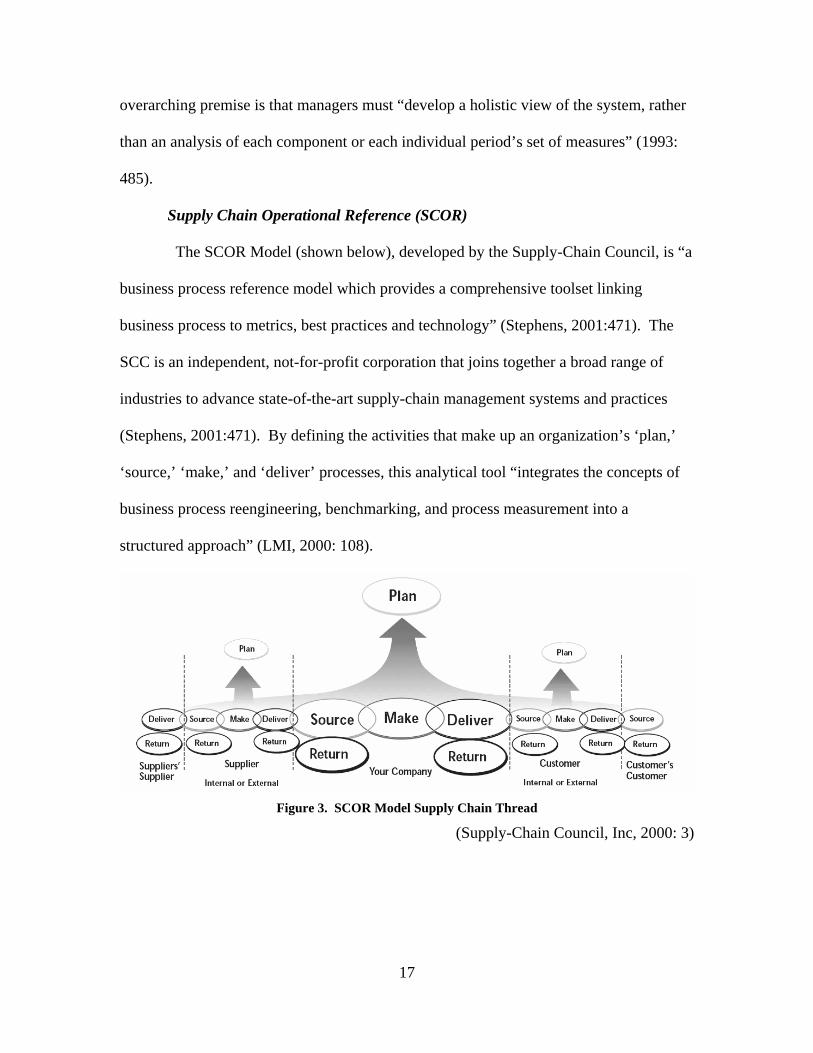
Balanced Score Card
Kaplan and Norton introduced the ‘balanced scorecard’ as “a set of measures that
gives top managers a fast but comprehensive view of the business” (1992:71). As
company’s looked for performance indicators beyond the traditional accounting
measures, the model was designed to “complement the financial measures with
operational measures on customer satisfaction, internal processes, and the organization’s
innovation and improvement activities—operational measures that are the drivers of
future financial performance” (1992:71). The assumption is that improvements in the
operational measures create excess capacity, and managers are encouraged to redirect this
excess capacity to ensure that the improvements translate into financial savings, or profits
(1992:78). However, the financial aspect of the model focuses on “how do we look to
shareholders?” (1992:77). As shown below, the original scorecard of measures was
designed for the ‘for-profit’ organization.
How do customers see us?
Customer Perspective
What must we excel at?
Internal Business Perspective
How do we look to shareholders?
Financial Perspective
Can we continue to improve and create value?
Innovation and Learning
Perspective
How do customers see us?
Customer Perspective
What must we excel at?
Internal Business Perspective
How do we look to shareholders?
Financial Perspective
Can we continue to improve and create value?
Innovation and Learning
Perspective
Figure 4. Balanced Scorecard Performance Measures (Kaplan and Norton, 1992:72)
18
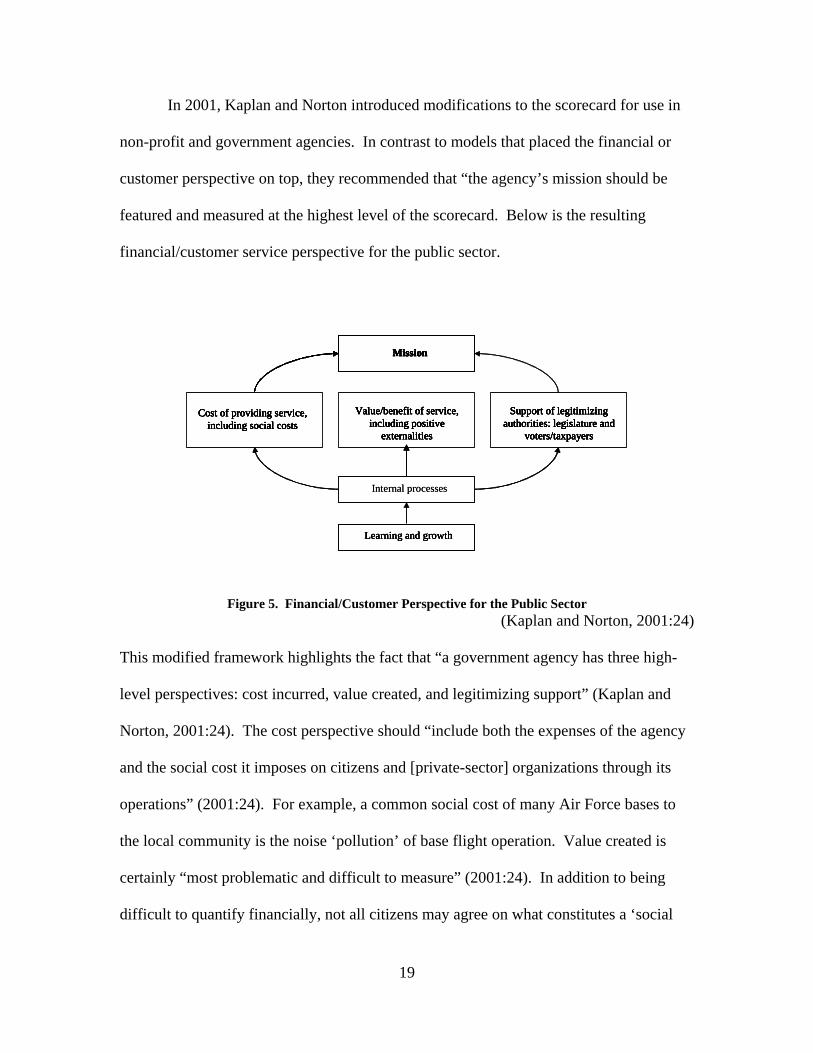
In 2001, Kaplan and Norton introduced modifications to the scorecard for use in
non-profit and government agencies. In contrast to models that placed the financial or
customer perspective on top, they recommended that “the agency’s mission should be
featured and measured at the highest level of the scorecard. Below is the resulting
financial/customer service perspective for the public sector.
Internal processes
Learning and growth
Cost of providing service,including social costs
Value/benefit of service,including positive
externalities
Support of legitimizingauthorities: legislature and
voters/taxpayers
Mission
Internal processes
Learning and growth
Cost of providing service,including social costs
Value/benefit of service,including positive
externalities
Support of legitimizingauthorities: legislature and
voters/taxpayers
Mission
Learning and growth
Cost of providing service,including social costs
Value/benefit of service,including positive
externalities
Support of legitimizingauthorities: legislature and
voters/taxpayers
Mission
Learning and growth
Cost of providing service,including social costs
Value/benefit of service,including positive
externalities
Support of legitimizingauthorities: legislature and
voters/taxpayers
Mission
Cost of providing service,including social costs
Value/benefit of service,including positive
externalities
Support of legitimizingauthorities: legislature and
voters/taxpayers
Mission
Cost of providing service,including social costs
Value/benefit of service,including positive
externalities
Support of legitimizingauthorities: legislature and
voters/taxpayers
Mission
Figure 5. Financial/Customer Perspective for the Public Sector
(Kaplan and Norton, 2001:24)
This modified framework highlights the fact that “a government agency has three high-
level perspectives: cost incurred, value created, and legitimizing support” (Kaplan and
Norton, 2001:24). The cost perspective should “include both the expenses of the agency
and the social cost it imposes on citizens and [private-sector] organizations through its
operations” (2001:24). For example, a common social cost of many Air Force bases to
the local community is the noise ‘pollution’ of base flight operation. Value created is
certainly “most problematic and difficult to measure” (2001:24). In addition to being
difficult to quantify financially, not all citizens may agree on what constitutes a ‘social
19
good.’ Nonetheless, “the citizens and their representatives—elected officials and
legislators—will eventually make the judgments about the benefits from these outputs
versus their costs” (2001:24). Finally, since most government agencies rely on
appropriated funding, very often agency officials are compelled to legitimize such
support. As indicated by the modified scorecard, when an organization focuses on the
learning and growth that facilitate its internal processes, these support the three high-level
objectives that can ultimately lead to mission accomplishment.
Categories of Performance Measures
Performance metrics are a way of “providing [managers with] the gauges, levers
and handles to move [the] organization in the right direction” (Frost, 2000:14).
Organizations often develop them in a hierarchal manner. “Primary metrics” measure the
intended production results and the expected value output. These include financial
measures, “customer service results, production achievements, and results on specific
goals such as cost savings” (2000:24). These primary metrics facilitate early attempts to
align efforts and manage accountability, while reporting improvements and results.
“Advanced metrics” address the work processes or organizational capabilities (2000:24).
These measures should facilitate activities that prevent inertia, manage waste, improve
efficiency, and “prepare for the future.” The assumption is that organizations generally
need to understand and improve their primary measure before they can move on to
advanced initiatives that would address processes and capabilities.
However, as strategy would dictate, there should be a consensus on the direction
of the organization, and as the previous discussion of measurement models would
suggest, the associated framework selected will imply the relative significance of the
20
strategic priorities in the organization. For example, the SCOR model emphasizes
process metrics, highlighting customer interactions, product transactions, and market
interactions (SCOR, 2002:3). The balanced scorecard, on the other hand, reinforces the
importance of calculated trade-offs in attempt to minimize suboptimization (Kaplan and
Norton, 1992:73). Again, performance measurement literature offers many varied ways
to classify and categorize measures. And, in order to establish a robust family of
measures, it is imperative that managers are aware of the type of measures they are
employing to ensure they are not misinterpreted, or worse, misapplied.
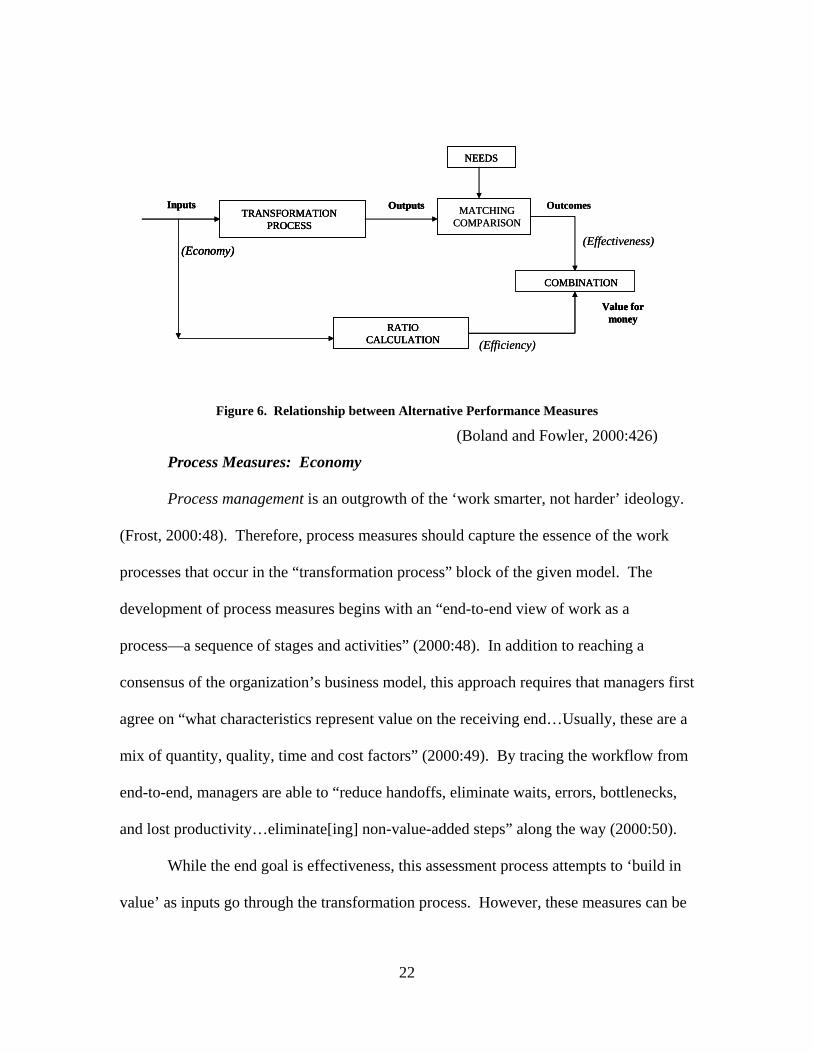
However, there must be a consensus on the organizational business model that
would produce such results. The Governmental Accounting Standards Board (GASB)
suggests that there are three broad categories of indicators: those that measure efforts,
those that measure accomplishments—outputs and outcomes, and those relate efforts to
accomplishments. As a generic point of reference, Boland and Fowler developed the
following model to demonstrate the most frequent applications of the “three Es.” They
believe that “it is common practice in public sector performance management literature to
talk about the three Es of: (1) economy, (2) efficiency; and (3) effectiveness, based upon
a simple input, process, and output model of organizations” (2000:419).
21
TRANSFORMATIONPROCESS
OutputsInputs
RATIOCALCULATION
COMBINATION
NEEDS
(Economy)
Value formoney
MATCHINGCOMPARISON
Outcomes
(Efficiency)
(Effectiveness)
TRANSFORMATIONPROCESS
OutputsInputs
RATIOCALCULATION
COMBINATION
NEEDS
(Economy)
Value formoney
TRANSFORMATIONPROCESS
OutputsInputs
RATIOCALCULATION
COMBINATION
NEEDS
(Economy)
Value formoney
MATCHINGCOMPARISON
Outcomes
(Efficiency)
(Effectiveness)
Figure 6. Relationship between Alternative Performance Measures
(Boland and Fowler, 2000:426)
Process Measures: Economy
Process management is an outgrowth of the ‘work smarter, not harder’ ideology.
(Frost, 2000:48). Therefore, process measures should capture the essence of the work
processes that occur in the “transformation process” block of the given model. The
development of process measures begins with an “end-to-end view of work as a
process—a sequence of stages and activities” (2000:48). In addition to reaching a
consensus of the organization’s business model, this approach requires that managers first
agree on “what characteristics represent value on the receiving end…Usually, these are a
mix of quantity, quality, time and cost factors” (2000:49). By tracing the workflow from
end-to-end, managers are able to “reduce handoffs, eliminate waits, errors, bottlenecks,
and lost productivity…eliminate[ing] non-value-added steps” along the way (2000:50).
While the end goal is effectiveness, this assessment process attempts to ‘build in
value’ as inputs go through the transformation process. However, these measures can be
22
difficult to determine since “process metrics should conform to the line-of-sight principle
wherever possible….[So], it [may be] necessary to balance this requirement against the
fact that the ideal process metrics are broad measures tied directly to what the end user
values” (Frost, 2000:50). Managers should regard economy measures as incomplete
because “any change in these performance measures simply reflects the ‘economy’ with
which the organization is using its resources and provides little information about the
operational processes within the organization, apart from some crude benchmarking”
(Boland and Fowler, 2000:419).
Productivity Measures: Efficiency
Brinkerhoff and Dressler suggest that “productivity reflects results as a function
of effort. When productivity improves, it means that more results are being gained for a
given amount of effort” (1990:16). Early measurement initiatives focused strictly on
measures of productivity—input/output ratios, utilization, and performance ratios (A. T.
Kearney , 1984:37). However, managers must use caution when applying ratio measures
because they are susceptible to a phenomenon known as “denominator management”
(Frost, 2000:76). That is, when productivity appears to have reached a peak in
performance, there is a tendency to redefine the process in order to continue showing
improvement in the measure. When observed, managers should seek new aspects of
performance to improve upon (2000:76).
Effectiveness: Output versus Outcomes
The issue of defining “effectiveness” has long been a challenge in performance
measurement literature. At times, it is important “to differentiate between performance
measures and performance indicators…[because the] focus has switched…to using
23
quantifiable indicators of performance” (Boland and Fowler, 2000:420). In this context,
indicators generally represent those quantifiable levels of activity, while measures
describe the intended results or consequences of those indicators. This switch in focus:
“represents an attempt to recognize the intangibility of outcomes while still providing useful data defining the extent to which public organizations are meeting their aims and making the best use of their resources. However, the distinction between the two is imprecise” (2000:420)
Furthermore, since “effectiveness is concerned with the extent to which outputs meet
organizational needs and requirements, [it] is…much more difficult to assess, let alone
measure” (2000:420). Since it appears “impossible” to manage results directly,
organizations can only attempt to “manage the systems and processes that produce them”
(Provost and Leddick, 1993:485). As such, “the resulting focus on quantifiable indicators
of economy and efficiency may be not only misleading but dangerous” (Boland and
Fowler, 2000:420).
Similarly, much of the debate in federal agencies centers on the ability to
distinguish between ‘output’ and ‘outcome,’ and their appropriate use. The guidance
issued in the GPRA provides the following definitions:
An “outcome measure” assesses the actual results, effects or impact of a program activity compared to its intended purpose…An “output measure” records the actual level of activity or effort that was realized and can be expressed in a quantitative or qualitative manner. (Report 103-58, 1993: 30)
For the purpose of government reporting, however, the Senate Committee recognized that
“outcome measurement cannot be done until a program or project reaches either a point
of maturity…or at completion” (1993:30). Nonetheless, the guidance becomes rather
vague obscure, noting
24
“Performance goals may relate to either ‘outputs’ or ‘outcomes,’ the latter usually being the most important for policy purposes, but the former often being a useful management tool. A common weakness in program performance plans is an over-reliance on output measures, to the neglect of outcomes” (1993:15)…While recognizing that outcome measurement is often difficult, and is infeasible for some program activities, the Committee views outcome measures as the most important and desirable measures, because they gauge the ultimate success of government activities.” (1993:30)
In fact, GASB direction concurs that “there is often not a clear cause-and-effect
relationship between the service provided and the resulting outcome…Numerous
explanatory factors, completely or partially beyond the control of the entity, that also
have a significant effect on results” (1994, 16). Perhaps, then, “it is [the] value added—
the excess of output value over input value—that should be the gauge of performance.
The concept of value added is identical for business and government. The difference is
that there are more intangible values in the government equation” (Mosso, 1999: 68).
While it may be extremely difficult to quantify effectiveness, it is critically important to
gaining support in the public sector.
Capability Measures
Capability measures are “advanced metrics” (Frost, 2000:24). In the balanced
scorecard model, capability measures are similar to the organization’s learning and
growth measures. These measures attempt to measure and manage “organization-wide
capabilities, or core competencies” (Frost, 2000:52). They should enable managers to
“gauge and improve in broad areas like agility, scientific excellence, rapid product
development, or any topic that represents either a competitive advantage or an ability to
create better results in the future” (2000:52). Much like measures of effectiveness,
measurement methods for these capabilities can be very challenging to develop due to the
25
intangible nature of the desired results. Nonetheless, using comparatives and best
practices (discussed later) to judge the organization’s performance can guide the
organizational efforts (Frost, 2000:52).
Lagging versus Leading Indicators
Lagging indicators are performance measures that represent the consequences of
actions previously taken. They frequently focus on results at the end of a time period and
characterize historical performance, such as employee satisfaction (Niven, 2003:295).
The most common criticism of lagging indicators is that they lack predictive power
(2003:190). Conversely, leading indicators are “considered the ‘drivers’ of lagging
indicators. The assumed relationship between the two…suggests that improved
performance in the leading indicator will drive performance in the lagging indicator”
(2003: 295). Leading indicators are often difficult to identify, and even more challenging
to quantify (2003:190). For example, lowering absenteeism, a leading indicator, is
hypothesized to drive improvements in employee satisfaction, a lagging indicator
(2003:295). Measurement systems composed entirely of lagging indicators will provide
very little indication of how the organization achieved a given level of performance.
Conversely, a measurement system composed totally of leading indicators “will not
reveal whether improvements are leading to improved process or customer results”
(2003:190).
Characteristics of Measure Systems
There are many and varied views on the characteristics that make up the most
comprehensive, or reliable measurement system. Generic characteristics of information
quality that always emerge are things such as “timely, complete, accurate, and consistent
26
with management responsibility” (LMI, 1998: 5-7). This review will be limited to some
theories for determining the number of measurements to use and the measurement
frequency. It will also address the additional concerns of accountability, reliability, and
validity. Finally, it will cover the use of comparatives.
How Many
An airplane cockpit is a common analogy used to describe performance
measurement systems and the process for determining the appropriate number of
measures in a given organization. While there are many ‘dials and gauges’ in a cockpit,
only a few are important at any given time. The pilot will use different measurement
instruments at cruising altitude than during take-off or landing, however, the full
complement of gauges is required. (Frost, 2000:57). So, it is in a large organization. Due
to the size and complexity of modern organizations, “managing with a keyhole view can
lead to disaster” (2000:57). Much like the pilot, “not all of [the] metrics will demand
focused attention all the time, but if a few key ones are missing,” it could be detrimental
to the organization (2000:57). However, there are purported “experts [who may] make
compelling arguments for the critical few metrics” (2000:33). Organizations that are
large and complex are usually quite unique as well, and performance measures are not
like accounting standards in which ‘one size fits all.’ Developing a measurement system
that “spotlights the critical few but includes the critical many” is a more balanced
approach (2000: 33). Another common solution it to develop foreground and background
metrics; “tiers of metrics available by drill-down links; and designs that distinguish
between strategic metrics and monitored metrics” (2000:59).
27
While Kaplan and Norton agree that “reliance on one instrument can be fatal,”
they contend that the “balanced scorecard minimizes information overload by limiting the
number of measures used” (1992:72). They have found that managers gain two distinct
benefits from such an approach. The scorecard consolidates many of the “seemingly
disparate elements” of the organization’s strategy, and “guards against suboptimization”
(1992:73). However, others contend that in limiting the number of measures,
organizations risk the implication that those measures that are not included are not
important (Frost, 2000:33, and Provost and Leddick, 1993:484). In fact, “in contrast to
the information overload hypothesis, an experiment by Lipe and Salterio (1998) found
that performance evaluations were not affected by increasing the number of measures
when these measures were organized into four balanced scorecard categories” (Ittner and
Larcker, 1998: 226). By attempting to limit the number of measures, managers “may not
include what is really important, [and] lose sight of [other] key processes in the
organization” (Provost and Leddick, 1993:484).
Artificially limiting the number of measures may cause organizations to overlook
“snoozing alligators” (Frost, 2000:33). These are measures that may be outside of the
immediate realm of strategic focus, but that prudent management should not ignore.
“Depending on the industry or circumstances, examples might include nearly anything”
(2000: 33). In the military industrial complex, it could include things such as
technological obsolescence, industry-wide production capability, or advancing
technology. While these may not affect current operations, the potential to impact future
operations is profound. Even when no current change may be anticipated, these are
28
issues that the organization would want to know about “even if gradual changes were
occurring” (2000: 33).
Frequency
There are a number of practical suggestions for measurement frequency as well.
Depending on the type of process under consideration, measurement frequency should be
comparable to the expected rate of change in the results (Frost, 2000:60). In addition, the
importance of the particular process in the overall organization would dictate frequency.
As such, managers may decide to err on the side of caution when deviation of particular
measure has the potential to significantly impact the organization’s output. (Frost,
2000:60). Another consideration is the lead-time required to change course of action,
once a process is set in motion. The longer it takes to implement corrective action, the
more closely managers should monitor the measure. In contrast, if short-term variability
is of little significance to the overall process, measuring too frequently could cause
incidents of over-correction (2000:61). Finally, and perhaps, most applicably,
administrative and political pressures may dictate that organizations “report results more
frequently than [they] would otherwise feel the need to measure” (2000:61).
Accountability
Performance measures without accountability are merely operational statistics,
however, in large organizations, it is often very difficult to establish such direct
relationships. Distinguishing between authority, responsibility, and accountability can
help to explain the expectations of performance (Frost, 2000:62). The following
definitions provide such distinctions:
29
“Authority is the right to act without prior approval from higher management and without challenge from peers. Responsibility…is an obligation to perform. Accountability is the liability one assumes for ensuring that an obligation to perform—a responsibility—is fulfilled. In this system, then: responsibility can be delegated; authority is assigned; and accountability cannot be delegated, but can be shared. (2000:62-63)
While organizational planners and senior management may find “purely informational
measures (that is, metrics with no line of sight)” useful, it is important that they are
identified as such, because those who may be held accountable for such “measures with
no clear means to affect them is de-motivating at any level” (Frost, 2000:44). Due to the
large bureaucratic nature of many federal organizations, it is often difficult to establish
such lines of accountability. In fact,
“a major difference between business and government is that most government entities are subjected to much more oversight and regulation by external bodies. Executive oversight bodies, such as the central budget and human resources offices, and legislative oversight bodies, such as appropriation committees, intrude so much into the workings of an entity that they are essentially a part of the entity’s management process—they preempt many management decisions” (Mosso, 1999:71).
Under these circumstance, where the ability of the organization to manage its’ own
operations is ‘legislated,’ liability for the results is then questionable, at best.
Validity
The accuracy of a performance measure’s ‘line of sight,’ discussed earlier,
determines the measures validity. This means that “a measure tracks what it’s supposed
to and is not contaminated by other factors that render [the] conclusions uncertain or
invalid” (Frost, 2000:64). Under certain circumstances, manager must use caution to
ensure that measures are not subject to external influences, like inflation. (2000:64).
GASB refers to this characteristic as ‘reliability’ (see definition of consistency below, as
30
related to reliability), explaining that “information should be verifiable and free from bias
and should faithfully represent what it purports to represent…derived from systems that
produce controlled and verifiable data” (1994:16).
Reliability
Briefly, reliability of an indicator ensures that it “produces the same result every
time, given the same circumstances” (Frost, 2000:66). GASB refers to this as
‘consistency,’ adding that “performance information should [also] be reported
consistently from period to period to allow users to have a basis for comparing
performance over time” (1994:15).
Comparatives
Comparatives are the “benchmarks and anchors as standards by which to judge”
what the performance indicators reveal (Frost, 2000:70). Generically, there are three
types of such comparatives: internal, external and theoretical. Internal comparatives, the
most commonly used, generally compare current performance to some other standard
inside the organization (2000:71). A common internal method used to set performance
targets is “baselining.” As its’ name implies, baselining utilizes current performance as
the initial standard, and then “incremental improvement goals are established based on
improved operational performance or cost reduction” (LMI, 1998:5-21). It is also
common for organizations to ‘benchmark’ internally, between operating locations or
business units (Neely, 1995: 96). External comparatives “might include the performance
of competitors, or vendors who perform similar services” (Frost, 2000: 71). Although
external benchmarking may not always result in “fully comparable” measures, they “are
of great value in a business sense,” particularly when they are selected from “similar
31
world-class organizations” (Frost, 2000:71; LMI, 1998:5-22). Theoretical comparisons
are useful in measuring work processes, and can be derived two ways. Managers can
study each work activity in the process, total the individual work times, and “this
becomes the minimum possible time for the process—a theoretical standard” (Frost,
2000:71). Another method of establishing this type of comparative is to find a functional
comparison, however, this only applies to “truly generic business processes, like order
entry” (Neely, 1995:96).
GASB also endorses the use of comparatives. They suggest that “when presented
alone, [performance measures] do not provide a basis for assessing or understanding the
level of performance” (1994:14). In addition to the comparatives previously discussed,
GASB recommends a fourth type of comparative: targets established as part of the
budgetary process. Although fiscal targets are not unique to the governmental agencies,
there are additional concerns regarding fiscal restraint in light of antideficiency laws.
Just as there are implications of selecting certain performance measures,
managers should take precautions when selecting comparatives. First, the comparatives
selected can “have an immense impact on the accuracy and fairness” of subsequent
judgments about an organizations performance (Frost, 2000: 72). When performance
exceeds or fails to meet an expected target, managers may take unnecessary action, or
inappropriate actions, if all things are ‘assumed equal’ in the compared operations when
indeed they are not. A second concern regarding comparative is the range and diversity
of measures considered. It is possible that “better comparatives might lead to better
understanding of performance” (2000: 72). Finally, when presenting performance
measures, the use of multiple comparatives, such as a current trend line, an internal
32
target, and an external benchmark, can “paint a richer picture of performance,” by
facilitating the visual comparison of all three comparatives simultaneously (2000: 72). In
fact, “it is the interaction among the metrics and goals that results in excellent
performance. Evaluation of their ‘individual’ merits is a meaningless endeavor because it
negates the integrated effect they have” (Perez, 1997: 291). When carefully selected and
properly used, comparatives can lead to “dramatic quantitative improvements in
performance” (LMI, 1998: 5-21).
Supply Chain Management (SCM)
There are many definitions of SCM. The Council of Logistics Management
suggests the following definition:
The process of planning, implementing, and controlling the efficient, cost effective flow and storage of raw materials, in-process inventory, finished goods, and related information from point-of-origin to point-of-consumption for the purpose of conforming to customer requirements. (Simchi-Levi et al, 2003:2)
More simply, the SCC defines SCM as “the management of internal logistics functions
and the relationships between [the] enterprise and its customers and suppliers” (LMI,
2000:13). However, this definition does little to illustrate the true complexity of the
concept. In fact, SCM “continues to be a poorly understood, badly explained and
wretchedly implemented concept” (Monczka and Morgan, 1997:69). The difficulty
generally lies in one, or both, of the two underlying principles. First, effective SCM
requires that managers consider the entire system when attempting to minimize costs, a
concept known as global optimization (Simchi-Levi et al, 2003:2). Second, supply
chains must be devised “to eliminate as much uncertainty as possible and to deal
effectively with the uncertainly that remains” (2003:3). Despite these challenges, DoD
33
logistics vision, as stated in the 2000 DoD Logistics Strategic Plan, is to develop “an
efficient, integrated supply chain of private sector and organic providers that ensures full
customer-oriented support to personnel and weapon systems” (LMI, 2000:12).
In 1998, the Logistics Functional Requirements Guide likened the SCM concept
to “logistics pipeline management” for DoD (LMI, 1998:7-1). Regardless of its title, “the
fundamental premise of SCM remains the operation of a continuous, unbroken,
comprehensive, and all-inclusive logistics process” (LMI, 2000:13). However, in 2000,
LMI recognized that there were “several influencing elements” that differentiated the
concept for DoD. These added considerations included: “mission responsibilities, legal
requirements imposed by statue, acquisitions regulations, organizational arrangements,
[and] management policies” (2000:14). Nonetheless, acknowledgement of the ‘systems
approach’ is a prerequisite for implementing needed changes.
Systems Approach
In contrast to models that depict the supply chain as a simple linear model,
“systems thinking” reinforces the notion that the sum of the parts is, indeed, greater than
the whole. Managers must realize that “in organizations, interactions are highly
nonlinear—which accounts for the complexity inherent in trying to manage them” (Perez,
1997:290). However, systems management in the public sector is complicated even
further because it involves “several nominally independent stakeholders, coupled with
informational and resource material flows and behavior that is characterized by inertia
and multiple feedback loops” (Boland and Fowler, 2000:424). Under these
circumstances, “unexpected behavioral outcomes” result from “a structure which, at face
34
value may look deceptively simple” (2000:424). This is due to three characteristics of
the system:
1. When there are several closed-loop subsystems (output from one system become input in a subsequent system), “the issue of causality becomes problematic…It is not possible to define a finite chain of cause and effect.”
2. “Because of all the transformation processes associated with each successive subsystem take time to perform, the system possesses dynamic characteristics.”
3. Due to the first two characteristics, “it is not possible meaningfully to understand behavior in one part of the system without also understanding all the other parts since they all interact dynamically” (2000:425)
Trade-Offs
There are many situations “in which the implicit belief was that quality, customer
service, profitability, and so forth can be increased simultaneously in each period”
(Eccles and Pyburn, 1992:43). Under the systems management approach, managers must
recognize that, “simply put, a trade-off means that more of one thing necessitates less of
another” (Porter, 1996:68). However, managers often approach trade-offs with
trepidation, and find that “making no choice is sometimes preferred to risking blame for a
bad choice” (1996:75). Nonetheless,
“it is important to understand that the relationships and trade-offs among the different measures in the family are fixed by the present organization (system). Any procedure that breaks up the family of measures into independent measurements, without understanding how…the processes in the system that produced them are related, will lead to sub-optimization” (Provost and Leddick, 1993:484).
And, very often, it is viewed as the “rob-Peter-to-pay-Paul” problem, “anything not
measured is subject to being sacrificed for the things that are measured” (Frost, 2000:58).
Unfortunately, due to the outcomes expected of government agencies, sometimes “the
35
implication is that it is more important to achieve the outcomes that people want, rather
than becoming optimally efficient in delivery” (Boland and Fowler, 2000:427).
Funding Differences
As DoD logistics managers attempt to implement SCM initiatives, the reality is
that “the planning staff and the budget staff tend to give mixed messages,” encouraging
ambitious planning pitted against limited budgets (Blackerby, 1994:26). As managers
attempt to establish integrated supply chains and their associated performance measures,
“specific goals should be set based on knowledge of the means that will be used to
achieve them. Yet the means are rarely known at the time goals are set” (Schneiderman,
1999:8). In addition, “the appropriation process is stacked with negative incentives.
Appropriations tend to focus on inputs rather than outputs, so operating performance is
obscured and good or bad performance often has little to do with the amount
appropriated” (Mosso, 1999:72). The assessment system in place reinforces the notion
that “those organizations ‘measured’ as performing ‘well’ will be rewarded through
additional resource allocation, whilst ‘bad’ organizations will have to demonstrate
improvement in order to gain any additional resources” (Boland and Fowler, 2000:421).
The implication is that “under-performance is the result of mismanagement of resources
leading to inefficiency” (2000:422). Nonetheless, this often leads to a ‘death spiral,’ as
the lack of additional resources only causes the ‘performance gap’ to widen (2000:430).
Chapter Review
Pursuant to the reporting requirements contained in the GPRA, the concepts of
strategic planning and performance measurement discussed in this chapter provide the
foundation for the case study protocol developed in Chapter III.
36
III. Methodology
This chapter provides the rationale for selecting the qualitative research method
employed in this research, and the attributes that lend the study to case study design. It
explains the data collection and analysis procedures. Finally, it introduces the case study
protocol used to guide the researcher’s effort.
Qualitative Research
Traditionally, quantitative research involves measurable variables, while
qualitative research is comprised of descriptive or verbal data. According to Leedy,
qualitative research is “typically used to answer questions about the nature of
phenomena, often with the purpose of describing and understanding the phenomena from
the participants’ point of view” (2001:101). To that end, Yin suggests that “the first and
most important condition for differentiating among the various research strategies is to
identify the type of research question being asked” (1994:7). In an iterative process, the
type of question will reveal the “nature of the data that will be collected in the resolution
of the problem,” and to that end, “the data [will] dictate the research method” (Leedy and
Ormond, 2001:100). Since this research will compare the performance measures
recommended for AFMC, asking ‘how’ and ‘why’ questions, a qualitative research
design is appropriate for this study. Further, while there are many approaches to
qualitative research, a case study strategy, explained below, will be used for this research.
Case Study Strategy
Selecting the appropriate research strategy is generally dependent on three
conditions: “the type of research question posed, the extent of control [the researcher] has
37
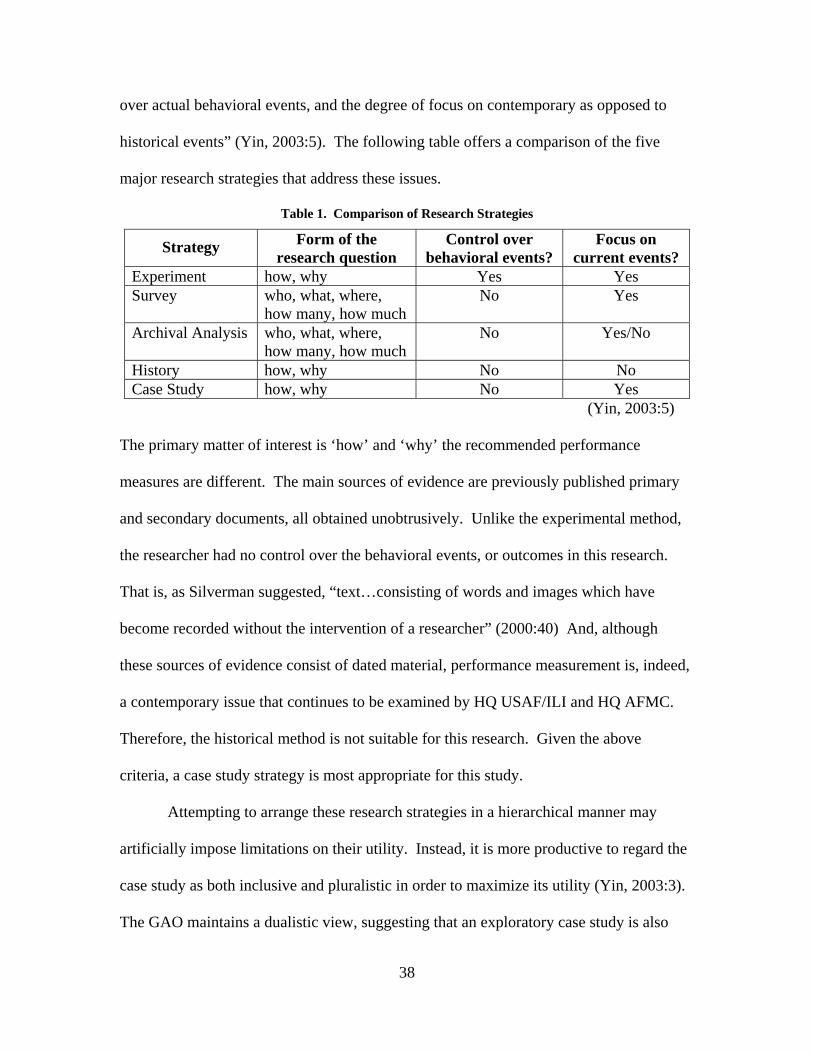
over actual behavioral events, and the degree of focus on contemporary as opposed to
historical events” (Yin, 2003:5). The following table offers a comparison of the five
major research strategies that address these issues.
Table 1. Comparison of Research Strategies
Strategy Form of the research question
Control over behavioral events?
Focus on current events?
Experiment how, why Yes Yes Survey who, what, where,
how many, how much No Yes
Archival Analysis who, what, where, how many, how much
No Yes/No
History how, why No No Case Study how, why No Yes
(Yin, 2003:5)
The primary matter of interest is ‘how’ and ‘why’ the recommended performance
measures are different. The main sources of evidence are previously published primary
and secondary documents, all obtained unobtrusively. Unlike the experimental method,
the researcher had no control over the behavioral events, or outcomes in this research.
That is, as Silverman suggested, “text…consisting of words and images which have
become recorded without the intervention of a researcher” (2000:40) And, although
these sources of evidence consist of dated material, performance measurement is, indeed,
a contemporary issue that continues to be examined by HQ USAF/ILI and HQ AFMC.
Therefore, the historical method is not suitable for this research. Given the above
criteria, a case study strategy is most appropriate for this study.
Attempting to arrange these research strategies in a hierarchical manner may
artificially impose limitations on their utility. Instead, it is more productive to regard the
case study as both inclusive and pluralistic in order to maximize its utility (Yin, 2003:3).
The GAO maintains a dualistic view, suggesting that an exploratory case study is also
38
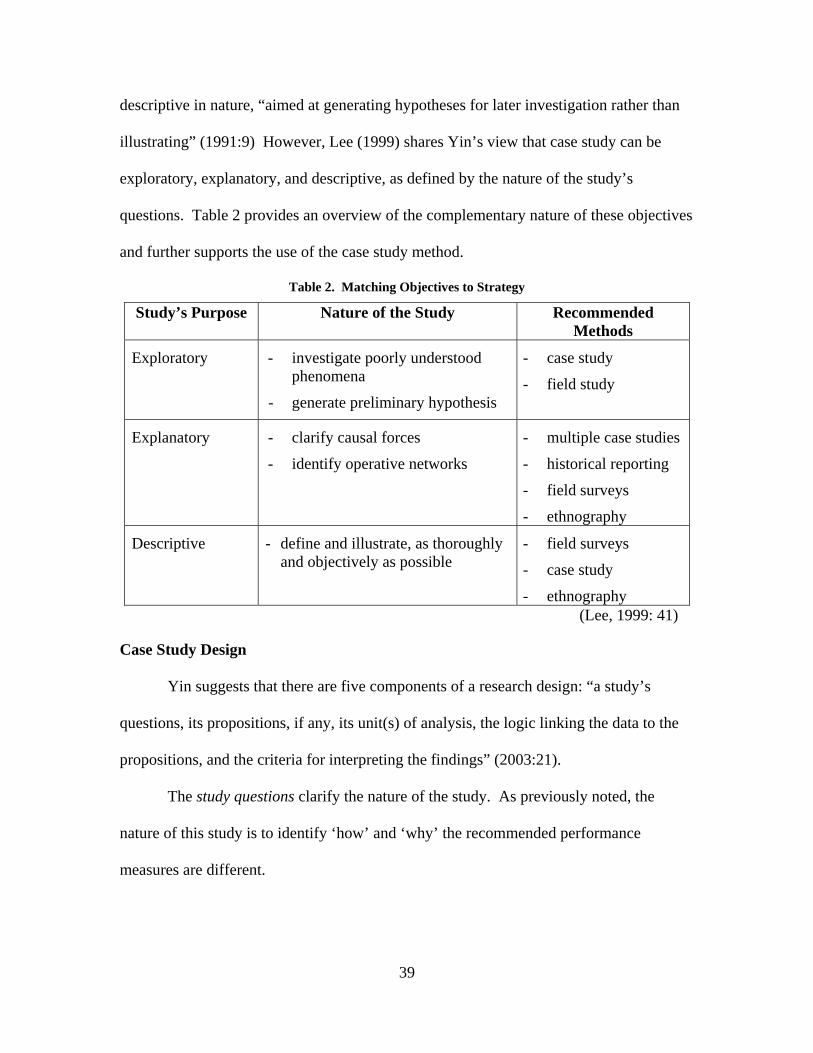
descriptive in nature, “aimed at generating hypotheses for later investigation rather than
illustrating” (1991:9) However, Lee (1999) shares Yin’s view that case study can be
exploratory, explanatory, and descriptive, as defined by the nature of the study’s
questions. Table 2 provides an overview of the complementary nature of these objectives
and further supports the use of the case study method.
Table 2. Matching Objectives to Strategy
Study’s Purpose Nature of the Study Recommended Methods
Exploratory - investigate poorly understood phenomena
- generate preliminary hypothesis
- case study
- field study
Explanatory - clarify causal forces
- identify operative networks
- multiple case studies
- historical reporting
- field surveys
- ethnography
Descriptive - define and illustrate, as thoroughly and objectively as possible
- field surveys
- case study
- ethnography (Lee, 1999: 41)
Case Study Design
Yin suggests that there are five components of a research design: “a study’s
questions, its propositions, if any, its unit(s) of analysis, the logic linking the data to the
propositions, and the criteria for interpreting the findings” (2003:21).
The study questions clarify the nature of the study. As previously noted, the
nature of this study is to identify ‘how’ and ‘why’ the recommended performance
measures are different.
39
Since the study questions do not indicate exactly what the research should
examine, the propositions direct the researcher’s attention to the relevant evidence within
the scope of the study. Yin suggests that researchers use the literature review as a means
“to develop sharper and more insightful questions about the topic” (2000:9). This
research utilized the concepts discussed in Chapter II to develop the theoretical
framework applied in this study. The case study protocol will provide a thorough
discussion of the propositions.
The units of analysis define exactly what a “case” is (Yin, 2003:22). For this
research, the units of analysis are the individual measurement plans. This approach,
referred to as a multiple or collective case study, is often used “to make comparisons,
build theory, or propose generalizations” (Leedy and Ormond, 2001:149). In addition,
when, “within a single case, attention is given also given to a subunit, or subunits,” it is
referred as an embedded case study design (Yin, 2003:42). Within each case, or
measurement plan under study in this research, there are several individual measures, or
subunits.
Linking data to propositions and criteria for interpreting the findings are “the
least well developed [components] in case studies” (Yin, 2003:26). While there are many
possible approaches for linking data to the propositions, the “most preferred strategy is to
follow the theoretical propositions that led to [the] case study” (Yin, 2003:111). The
following discussion of the multiple-case method, in conjunction with the case study
protocol, maps this strategy. Finally, although this research effort applies many of the
recommended case study tactics, “there is no precise way of setting the criteria for
40
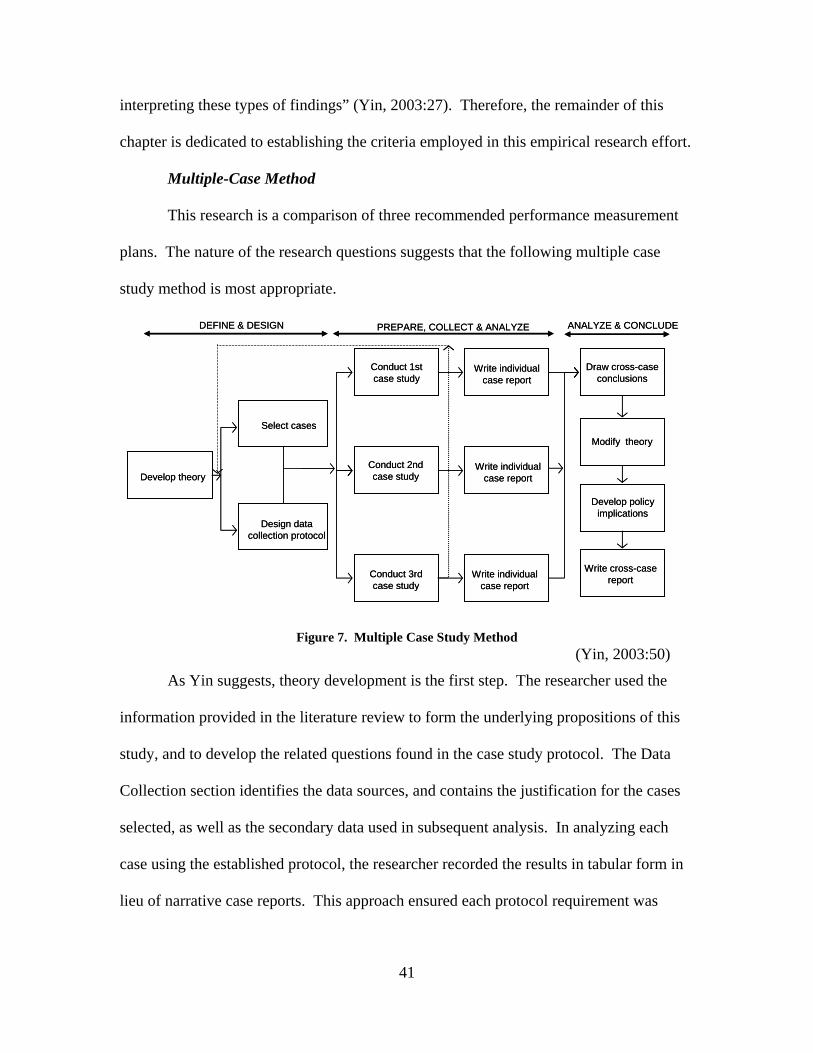
interpreting these types of findings” (Yin, 2003:27). Therefore, the remainder of this
chapter is dedicated to establishing the criteria employed in this empirical research effort.
Multiple-Case Method
This research is a comparison of three recommended performance measurement
plans. The nature of the research questions suggests that the following multiple case
study method is most appropriate.
Develop theory
Select cases
Design datacollection protocol
Conduct 1stcase study
Conduct 2ndcase study
Conduct 3rdcase study
Write individualcase report
Write individualcase report
Write individualcase report
Draw cross-caseconclusions
Modify theory
Develop policyimplications
Write cross-casereport
DEFINE & DESIGN PREPARE, COLLECT & ANALYZE ANALYZE & CONCLUDE
Figure 7. Multiple Case Study Method (Yin, 2003:50)
As Yin suggests, theory development is the first step. The researcher used the
information provided in the literature review to form the underlying propositions of this
study, and to develop the related questions found in the case study protocol. The Data
Collection section identifies the data sources, and contains the justification for the cases
selected, as well as the secondary data used in subsequent analysis. In analyzing each
case using the established protocol, the researcher recorded the results in tabular form in
lieu of narrative case reports. This approach ensured each protocol requirement was
41
addressed and facilitated cross-case analysis. As previously noted, the researcher has no
control over actual behavioral events in the current research. In addition, she has no
authority or participatory role in subsequent policy development. The goal of this
research is that discoveries made during the data analysis will provide insight to assist
decision-makers in future performance measurement efforts.
Four Design Tests
Case study research and qualitative research, in general, is often criticized for a
lack of rigor. Therefore, Yin suggests a number of methods to reinforce the quality of
research design (2003:10). Four tests common to all social science research are relevant
to case study research as well. The table below summarizes the four tests and the
associated research tactics, followed by a discussion of each test.
42
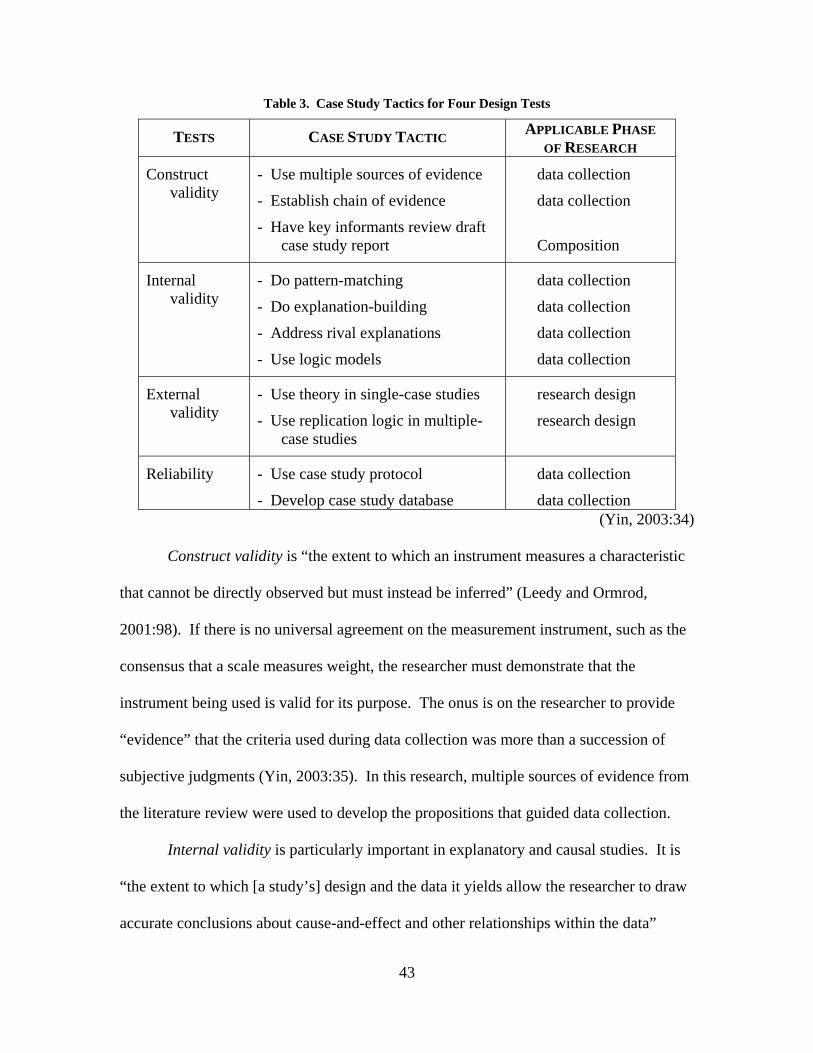
Table 3. Case Study Tactics for Four Design Tests
TESTS CASE STUDY TACTIC APPLICABLE PHASE OF RESEARCH
Construct validity
- Use multiple sources of evidence
- Establish chain of evidence
- Have key informants review draft case study report
data collection
data collection
Composition
Internal validity
- Do pattern-matching
- Do explanation-building
- Address rival explanations
- Use logic models
data collection
data collection
data collection
data collection
External validity
- Use theory in single-case studies
- Use replication logic in multiple- case studies
research design
research design
Reliability - Use case study protocol
- Develop case study database
data collection
data collection (Yin, 2003:34)
Construct validity is “the extent to which an instrument measures a characteristic
that cannot be directly observed but must instead be inferred” (Leedy and Ormrod,
2001:98). If there is no universal agreement on the measurement instrument, such as the
consensus that a scale measures weight, the researcher must demonstrate that the
instrument being used is valid for its purpose. The onus is on the researcher to provide
“evidence” that the criteria used during data collection was more than a succession of
subjective judgments (Yin, 2003:35). In this research, multiple sources of evidence from
the literature review were used to develop the propositions that guided data collection.
Internal validity is particularly important in explanatory and causal studies. It is
“the extent to which [a study’s] design and the data it yields allow the researcher to draw
accurate conclusions about cause-and-effect and other relationships within the data”
43
(Leedy and Ormrod, 2003:103-104). Generically, this gives credence to the researcher’s
conclusion that “x causes y.” The literature review provided the foundation for
explanation building during the data collection, and pattern matching was conducted
during the cross-case analysis where applicable.
External validity is the “extent to which [the study’s] results apply to situations
beyond the study itself—in other words…generalized to other contexts” (Leedy and
Ormrod, 2001:105). Although qualitative research is often criticized for its “limited
generalizability,” it is not usually understood that “the intent of qualitative research is not
to generalize findings, but to form a unique interpretation of events” (Creswell,
1994:159). The GAO concurs that “generalizability depends less on the number of sites
and more on the right match between the purpose of the study and how the instances were
selected” (1991:76). Indeed, case study research should not be compared to survey
research because in the former, the goal is “to expand and generalize theories (analytic
generalization) and not to enumerate frequencies (statistical generalizations)” (Yin,
2003:10). Alasuutari suggests that “what can be analyzed instead is how the researcher
demonstrates that the analysis relates to things beyond the material at hand, [therefore]…
extrapolation better captures the typical procedure in qualitative research” (1995:156-
157).
Reliability is “extent to which [a measurement instrument] yields consistent
results when the characteristic being measured has not changed” (Leedy and Ormrod,
2001:99). However, Yin cautions that in case study research “the emphasis is on doing
the same case over again, not on ‘replicating’ the results of one case by doing another
case study” (2003:37). He compares reliability to the question of generalizability, in that,
44
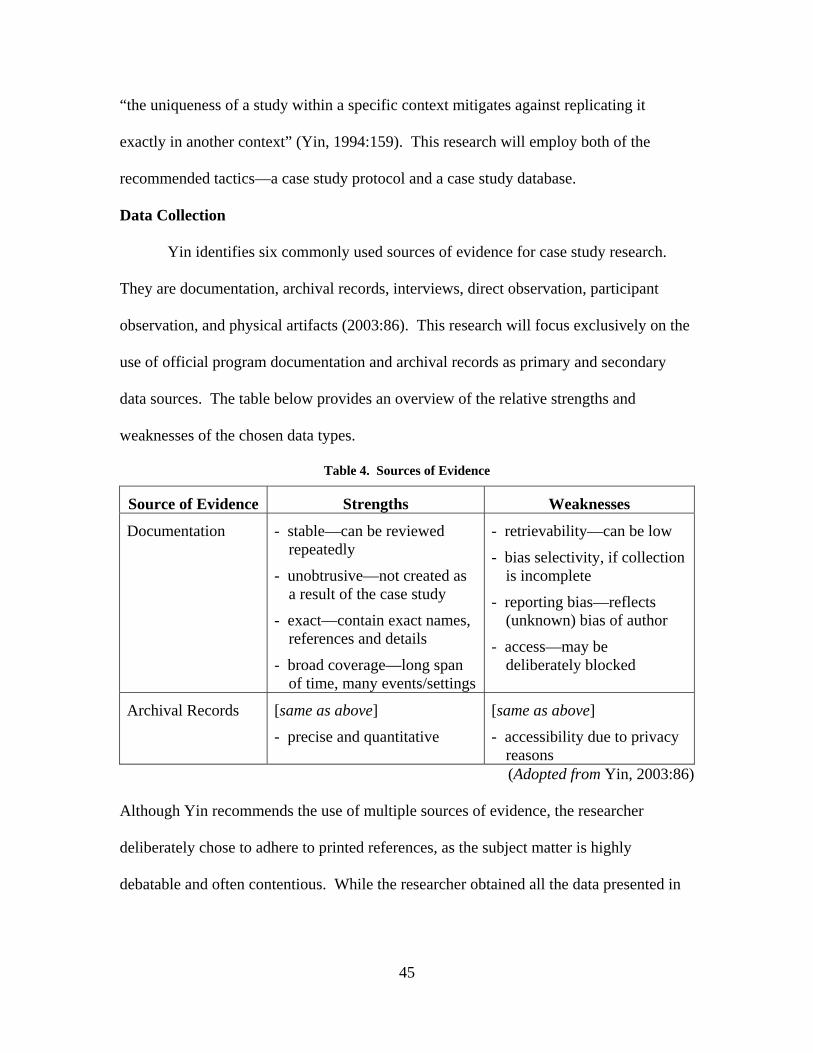
“the uniqueness of a study within a specific context mitigates against replicating it
exactly in another context” (Yin, 1994:159). This research will employ both of the
recommended tactics—a case study protocol and a case study database.
Data Collection
Yin identifies six commonly used sources of evidence for case study research.
They are documentation, archival records, interviews, direct observation, participant
observation, and physical artifacts (2003:86). This research will focus exclusively on the
use of official program documentation and archival records as primary and secondary
data sources. The table below provides an overview of the relative strengths and
weaknesses of the chosen data types.
Table 4. Sources of Evidence
Source of Evidence Strengths Weaknesses
Documentation - stable—can be reviewed repeatedly
- unobtrusive—not created as a result of the case study
- exact—contain exact names, references and details
- broad coverage—long span of time, many events/settings
- retrievability—can be low
- bias selectivity, if collection is incomplete
- reporting bias—reflects (unknown) bias of author
- access—may be deliberately blocked
Archival Records [same as above]
- precise and quantitative
[same as above]
- accessibility due to privacy reasons (Adopted from Yin, 2003:86)
Although Yin recommends the use of multiple sources of evidence, the researcher
deliberately chose to adhere to printed references, as the subject matter is highly
debatable and often contentious. While the researcher obtained all the data presented in
45
this case study from printed resources, the researcher made every attempt to seek the
independent assessments from multiple institutional sources, as noted below.
There are three principles of data collection that can enhance the construct
validity and reliability of case study evidence: use of multiple sources of evidence,
creation of a case study database, and maintenance of a chain of evidence (Yin, 2003:97).
Multiple data sources help to ensure that “a full picture will be obtained and that bias
associated with self-protection or self-interests will be reduced” (GAO, 1991:24). In
addition, multiple sources facilitate triangulation, that is, “the development of converging
lines of inquiry” (Yin, 2003:98). This approach, discussed further in Data Analysis, is
not limited to the use of multiple data gathering techniques, but can be a means of
validating findings by brining together varieties of data, a range of investigators, multiple
perspectives, or a combination of methodologies (Berg, 1998:5). A case study database
requires that the researcher maintain “two separate collections,” a catalogue of
evidentiary records and an independent narrative report. The database of case study
records in this study are contained in Appendices A through C. Finally, maintaining a
chain of evidence enables a critical reader “to follow the derivation of any evidence,
ranging from initial research questions to ultimate case study conclusions” (Yin,
2003:105). The protocol questions were used to develop to findings from each
performance plan in order to maintain the chain of evidence.
Case and Data Selection Criteria
The selection of cases for this study was straightforward as there were unique
cases that the researcher immediately discovered at the outset of the inquiry (Yin,
2003:78). While performance measurement has long been a matter of debate in logistics,
46
there are few published plans. In the recent past, various improvement teams, such as the
Spares Campaign and Depot Maintenance and Reengineering Teams, had initiated
several efforts, however, none resulted in published efforts. And, while there appeared to
be a consensus that better performance measures were needed, there was little agreement
on exactly what should be measured, and how. In August of 2003, the researcher
discovered that the Materiel Support Division was preparing to publish a new AFMC
Supply Chain Metrics Guide. However, the measures contained in the guide were the
same measures already in use. On further investigation, the researcher discovered that
LMI and AFLMA had recommended alternative measurement plans in 1999 and 2001. A
comparison revealed that each plan was distinctly different, and led the researcher to this
effort. The data sources are cited below, with a brief overview of the organizational
authors.
Headquarters Air Force Materiel Command. AFMC Supply Chain Metrics Guide. Wright-Patterson AFB: HQ AFMC, 25 November 2003.
The Materiel Support Division of the Supply Management Mission Area is
responsible for a wide range of logistics services to include requirements determination,
acquisition, provisioning, cataloguing, data management, disposal and supply chain
management (SMMA, 2002:2). As the supply chain focal point for the air logistics
centers and worldwide AF customers, the division’s mission is to provide their customers
with the policy and responsive assistance necessary to achieve readiness through
effective materiel support.
Logistics Management Institute. Supply Chain Management: A Recommended Performance Measurement Scorecard. McLean, VA: LMI, June 1999.
47
LMI is a private, non-profit organization dedicated to improving management of
the nation’s public sector through research, analysis, education, and counsel. Under
contract through the General Services Administration (GSA), LMI’s Logistics
Management operating unit provides innovative logistics and supply chain solutions that
promote efficient processes, industry best practices, and well-placed technology
investments. The performance report cited above was derived from an earlier publication
sponsored by the Supply Chain Integration Office, Assistant Deputy Under Secretary of
Defense, DoD Supply Chain Management Implementation Guide (2000).
Air Force Logistics Management Agency. Measuring the Health of USAF Supply. Report LS199929101. Maxwell AFB: AFLMA, January 2001.
AFLMA is a field operating agency of the Air Staff—HQ USAF/IL. Their stated
mission is “to increase AF readiness and combat capability by developing, analyzing,
testing, evaluating, and recommending new or improved concepts, methods, systems,
policies, and procedures to enhance logistics efficiency and effectiveness” (AFMAN 23-
110:1-7). In 1999, the Director of Supply (AF/ILS) tasked AFLMA “to develop a set of
performance measures or metrics that represent the health of supply at an aggregate
level” (AFLMA, 1999:i). The result was the above referenced report.
In addition to the sources above, the researcher used reports and secondary data
from the following sources: DoD, AFMC and Air Force regulations, GAO reports, and
RAND studies. Often referred to as the “investigative arm of Congress,” the GAO
provides auditing and reporting services to help improve performance and ensure the
accountability of the federal government for the American people. And, the RAND
Corporation is a non-profit organization that helps improve policy and decision-making
48
through research and analysis. Established in 1946, Project AIR FORCE (PAF) includes
a resource management research agenda that analyzes policies and practices in the areas
of logistics and readiness.
Case Study Protocol
As noted, a case study protocol is a research tactic to enhance the reliability of
case study research. It should contain a project overview, field procedures, case study
questions and a guide for the case study report (Yin, 2003:69). In addition to increasing
the reliability of case study research, it is “intended to guide the investigator in carrying
out the data collection” (Yin, 2003:67). Chapters I and II of this thesis provide the
project overview, covering the background information, the issues under investigation
and the relevant literature. Chapter III contains the ‘field procedures’ that will be used to
collect the case study data. The AFIT Style Guide contains the applicable format for
completing the case study report. Therefore, the “protocol,” as utilized in this thesis, will
emphasize the case study questions.
Referred to the “heart of the protocol,” the case study questions are “a set of
substantive questions reflecting [the] actual line of inquiry” (Yin, 2003:73). The
researcher will use the case study questions to link the literature review, the propositions,
and the data. Developed in this manner with appropriate cross-references, the researcher
will use table shells “to identify exactly what data are being sought…[and] ensure that
parallel information will be collected…where a multiple-case design is being used” (Yin,
2003:75). Table 5 contains the study propositions and the associated questions used in
the conduct of this research.
49
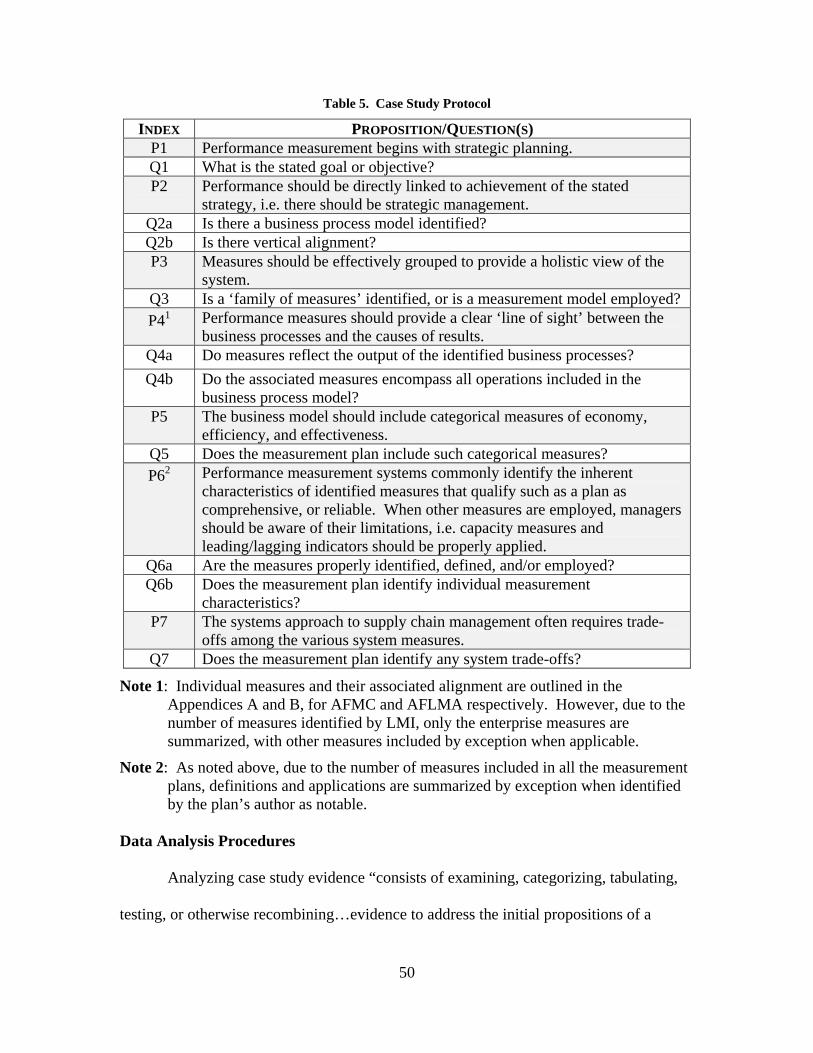
Table 5. Case Study Protocol
INDEX PROPOSITION/QUESTION(S) P1 Performance measurement begins with strategic planning. Q1 What is the stated goal or objective? P2 Performance should be directly linked to achievement of the stated
strategy, i.e. there should be strategic management. Q2a Is there a business process model identified? Q2b Is there vertical alignment? P3 Measures should be effectively grouped to provide a holistic view of the
system. Q3 Is a ‘family of measures’ identified, or is a measurement model employed? P41 Performance measures should provide a clear ‘line of sight’ between the
business processes and the causes of results. Q4a Do measures reflect the output of the identified business processes? Q4b Do the associated measures encompass all operations included in the
business process model? P5 The business model should include categorical measures of economy,
efficiency, and effectiveness. Q5 Does the measurement plan include such categorical measures? P62 Performance measurement systems commonly identify the inherent
characteristics of identified measures that qualify such as a plan as comprehensive, or reliable. When other measures are employed, managers should be aware of their limitations, i.e. capacity measures and leading/lagging indicators should be properly applied.
Q6a Are the measures properly identified, defined, and/or employed? Q6b Does the measurement plan identify individual measurement
characteristics? P7 The systems approach to supply chain management often requires trade-
offs among the various system measures. Q7 Does the measurement plan identify any system trade-offs?
Note 1: Individual measures and their associated alignment are outlined in the Appendices A and B, for AFMC and AFLMA respectively. However, due to the number of measures identified by LMI, only the enterprise measures are summarized, with other measures included by exception when applicable.
Note 2: As noted above, due to the number of measures included in all the measurement plans, definitions and applications are summarized by exception when identified by the plan’s author as notable.
Data Analysis Procedures Analyzing case study evidence “consists of examining, categorizing, tabulating,
testing, or otherwise recombining…evidence to address the initial propositions of a
50
study” (Yin, 2003:109). In the initial phase of this case study, the literature review was
“aimed at surfacing salient concepts or themes” (Yin, 2003:110). These served as the
foundation for developing the study’s propositions and subsequently, the protocol
questions. As previously noted, triangulation was used to reinforce this research by
providing “assurance that reasons given for events properly reflect influences from many
different sources” (GAO, 1991:24). However, the researcher employed addition analytic
techniques to develop internal and external validity in this case. These included pattern
matching, explanation building, and logic models (Yin, 2003:139). In addition, this study
employed cross-case analysis to determine if the performance plans share common
thematic characteristics and what insight those characteristics could possibly provide for
future decision makers.
Chapter Review
This chapter provided the justification for a case study research design and
explained the use of a multiple-case method. In addition, it explained the techniques used
in data collection and analysis. Finally, it provided the case study protocol used for data
collection.
51
IV. Analysis Chapter Overview
This chapter summarizes the research findings based on the literature review and
the results of the case study protocol through a comparative analysis of the three
performance measurement plans. Since the individually referenced findings from each
plan are cited in the attached appendices, this section is intended to provide only an
overview of the most distinguishing characteristics noted. It then addresses the
investigative questions, in addition to the associated managerial implications.
Research Findings This research posed the following questions: how do the performance
measurement recommendations of the LMI, the AFLMA and AFMC differ, and why do
the performance measurement recommendations differ. In the course of exercising the
case study protocol, the researcher discovered that these questions were very symbiotic in
nature. At times, it was difficult to distinguish whether the content was driving the cause,
or the cause was driving the content. Nonetheless, the following provides an overview of
the performance plans’ distinguishing characteristics.
Strategic Planning and Vertical Alignment As defined in the literature review, strategic planning is “a continuous and system
process where people make decisions about intended future outcomes, how outcomes are
to be accomplished and how success is measured and evaluated” (Blackerby, 1994:21).
However, in initial comparison of the performance plans, it was noted that the intended
level of enterprise reporting differed, and as a result, the scope of the measurement
52
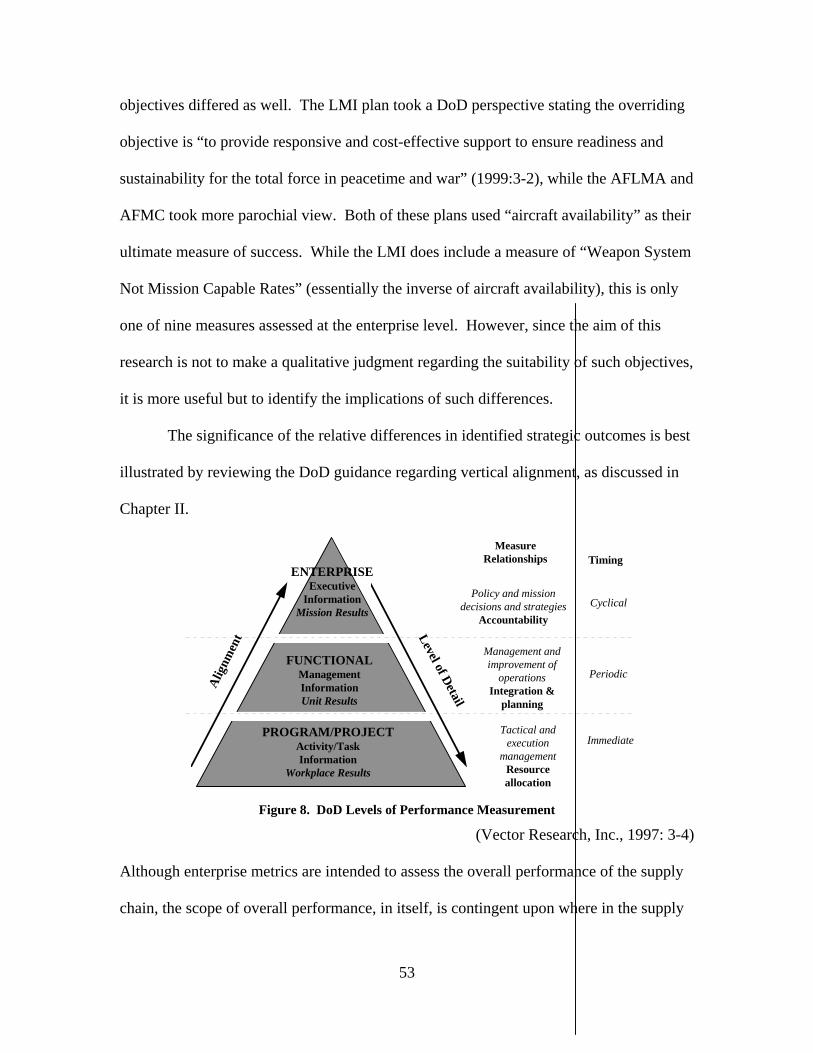
53
objectives differed as well. The LMI plan took a DoD perspective stating the overriding
objective is “to provide responsive and cost-effective support to ensure readiness and
sustainability for the total force in peacetime and war” (1999:3-2), while the AFLMA and
AFMC took more parochial view. Both of these plans used “aircraft availability” as their
ultimate measure of success. While the LMI does include a measure of “Weapon System
Not Mission Capable Rates” (essentially the inverse of aircraft availability), this is only
one of nine measures assessed at the enterprise level. However, since the aim of this
research is not to make a qualitative judgment regarding the suitability of such objectives,
it is more useful but to identify the implications of such differences.
The significance of the relative differences in identified strategic outcomes is best
illustrated by reviewing the DoD guidance regarding vertical alignment, as discussed in
Chapter II.
ENTERPRISEExecutive
InformationMission Results
FUNCTIONALManagementInformationUnit Results
PROGRAM/PROJECTActivity/TaskInformation
Workplace Results
Alig
nmen
t Level of Detail
MeasureRelationships Timing
Policy and missiondecisions and strategies
AccountabilityCyclical
Management andimprovement of
operationsIntegration &
planning
Periodic
ImmediateTactical and
executionmanagement
Resourceallocation
Figure 8. DoD Levels of Performance Measurement
(Vector Research, Inc., 1997: 3-4) Although enterprise metrics are intended to assess the overall performance of the supply
chain, the scope of overall performance, in itself, is contingent upon where in the supply
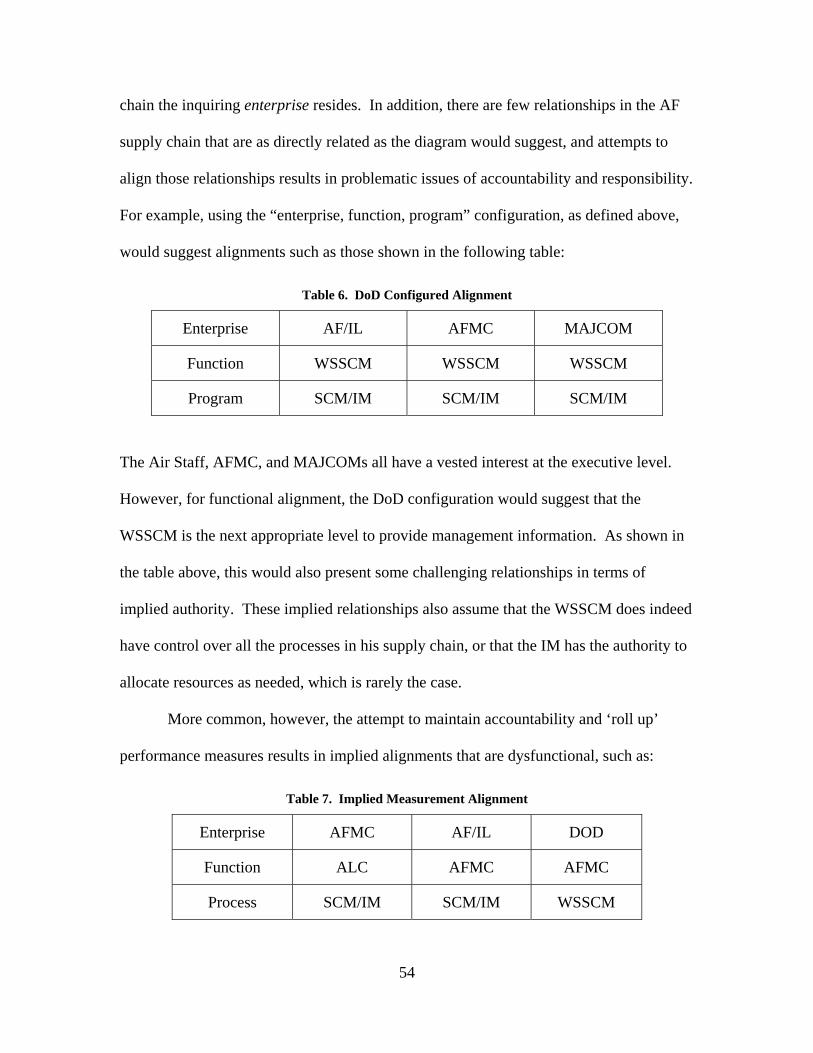
chain the inquiring enterprise resides. In addition, there are few relationships in the AF
supply chain that are as directly related as the diagram would suggest, and attempts to
align those relationships results in problematic issues of accountability and responsibility.
For example, using the “enterprise, function, program” configuration, as defined above,
would suggest alignments such as those shown in the following table:
Table 6. DoD Configured Alignment
Enterprise AF/IL AFMC MAJCOM
Function WSSCM WSSCM WSSCM
Program SCM/IM SCM/IM SCM/IM
The Air Staff, AFMC, and MAJCOMs all have a vested interest at the executive level.
However, for functional alignment, the DoD configuration would suggest that the
WSSCM is the next appropriate level to provide management information. As shown in
the table above, this would also present some challenging relationships in terms of
implied authority. These implied relationships also assume that the WSSCM does indeed
have control over all the processes in his supply chain, or that the IM has the authority to
allocate resources as needed, which is rarely the case.
More common, however, the attempt to maintain accountability and ‘roll up’
performance measures results in implied alignments that are dysfunctional, such as:
Table 7. Implied Measurement Alignment
Enterprise AFMC AF/IL DOD
Function ALC AFMC AFMC
Process SCM/IM SCM/IM WSSCM
54
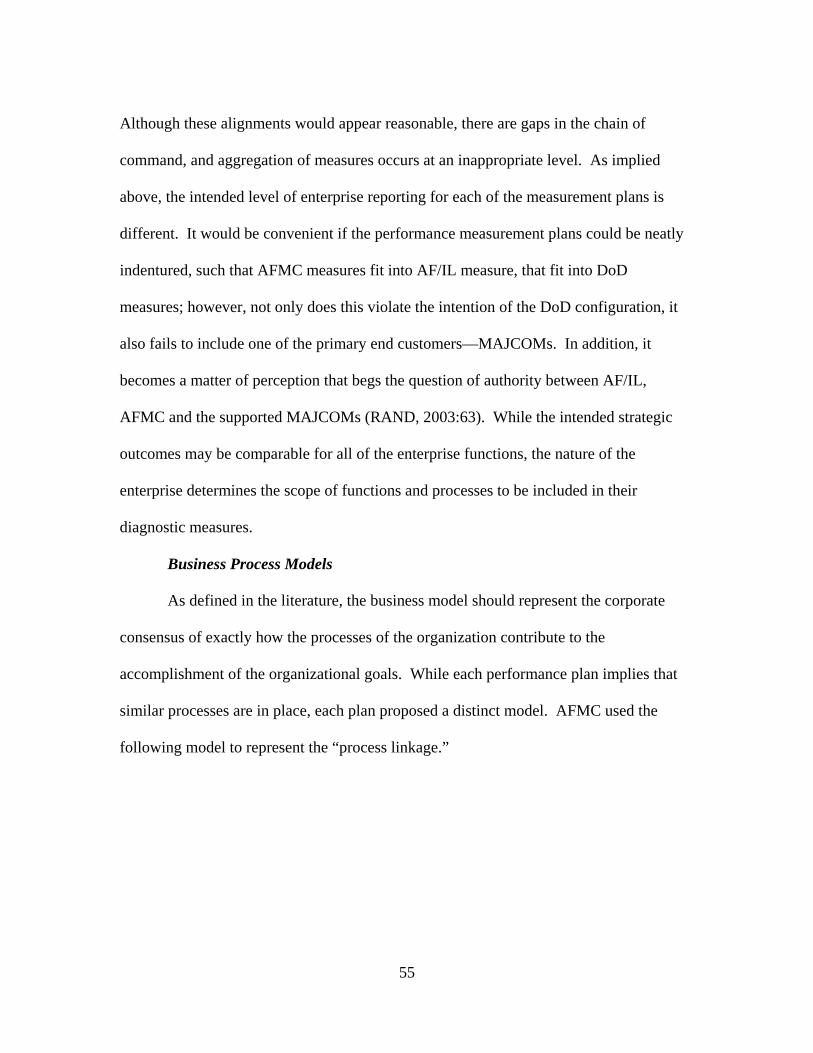
Although these alignments would appear reasonable, there are gaps in the chain of
command, and aggregation of measures occurs at an inappropriate level. As implied
above, the intended level of enterprise reporting for each of the measurement plans is
different. It would be convenient if the performance measurement plans could be neatly
indentured, such that AFMC measures fit into AF/IL measure, that fit into DoD
measures; however, not only does this violate the intention of the DoD configuration, it
also fails to include one of the primary end customers—MAJCOMs. In addition, it
becomes a matter of perception that begs the question of authority between AF/IL,
AFMC and the supported MAJCOMs (RAND, 2003:63). While the intended strategic
outcomes may be comparable for all of the enterprise functions, the nature of the
enterprise determines the scope of functions and processes to be included in their
diagnostic measures.
Business Process Models As defined in the literature, the business model should represent the corporate
consensus of exactly how the processes of the organization contribute to the
accomplishment of the organizational goals. While each performance plan implies that
similar processes are in place, each plan proposed a distinct model. AFMC used the
following model to represent the “process linkage.”
55
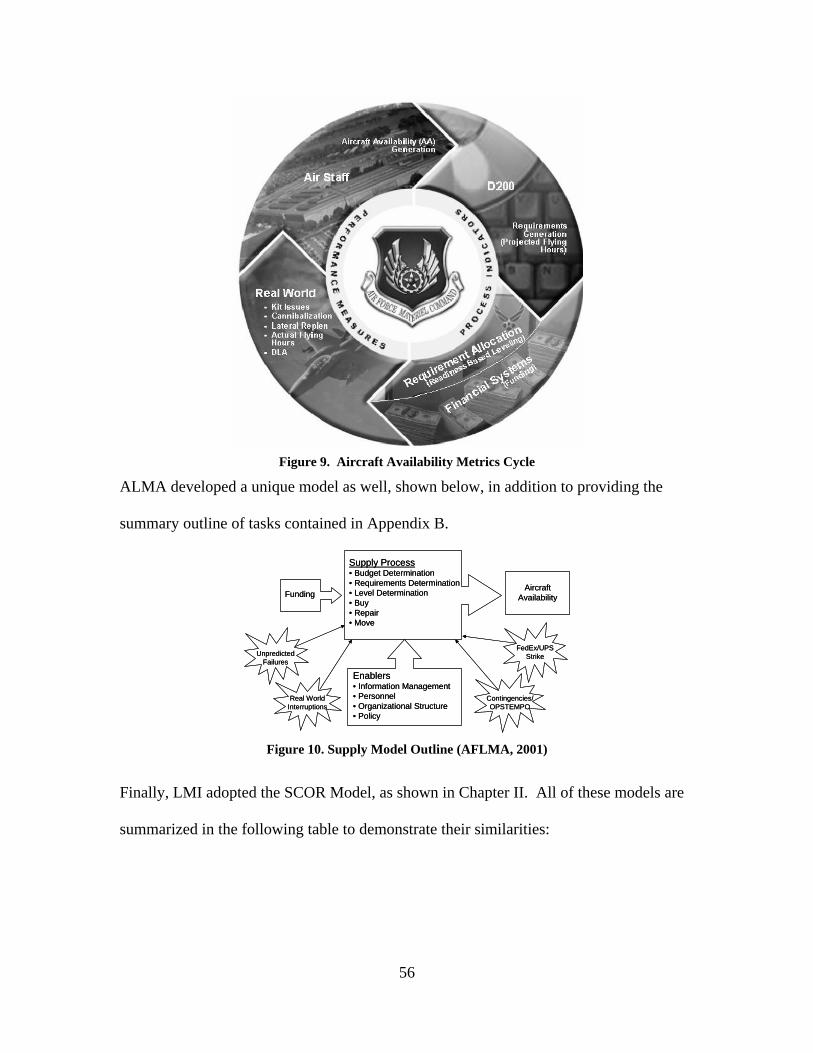
Figure 9. Aircraft Availability Metrics Cycle
ALMA developed a unique model as well, shown below, in addition to providing the
summary outline of tasks contained in Appendix B.
Figure 10. Supply Model Outline (AFLMA, 2001)
Finally, LMI adopted the SCOR Model, as shown in Chapter II. All of these models are
summarized in the following table to demonstrate their similarities:
Funding
Supply Process• Budget Determination• Requirements Determination• Level Determination• Buy• Repair• Move
AircraftAvailability
Enablers• Information Management• Personnel• Organizational Structure• Policy
UnpredictedFailures
Real WorldInterruptions
Contingencies/OPSTEMPO
FedEx/UPSStrike
Funding
Supply Process• Budget Determination• Requirements Determination• Level Determination• Buy• Repair• Move
AircraftAvailability
Enablers• Information Management• Personnel• Organizational Structure• Policy
UnpredictedFailures
Real WorldInterruptions
Contingencies/OPSTEMPO
FedEx/UPSStrike
56
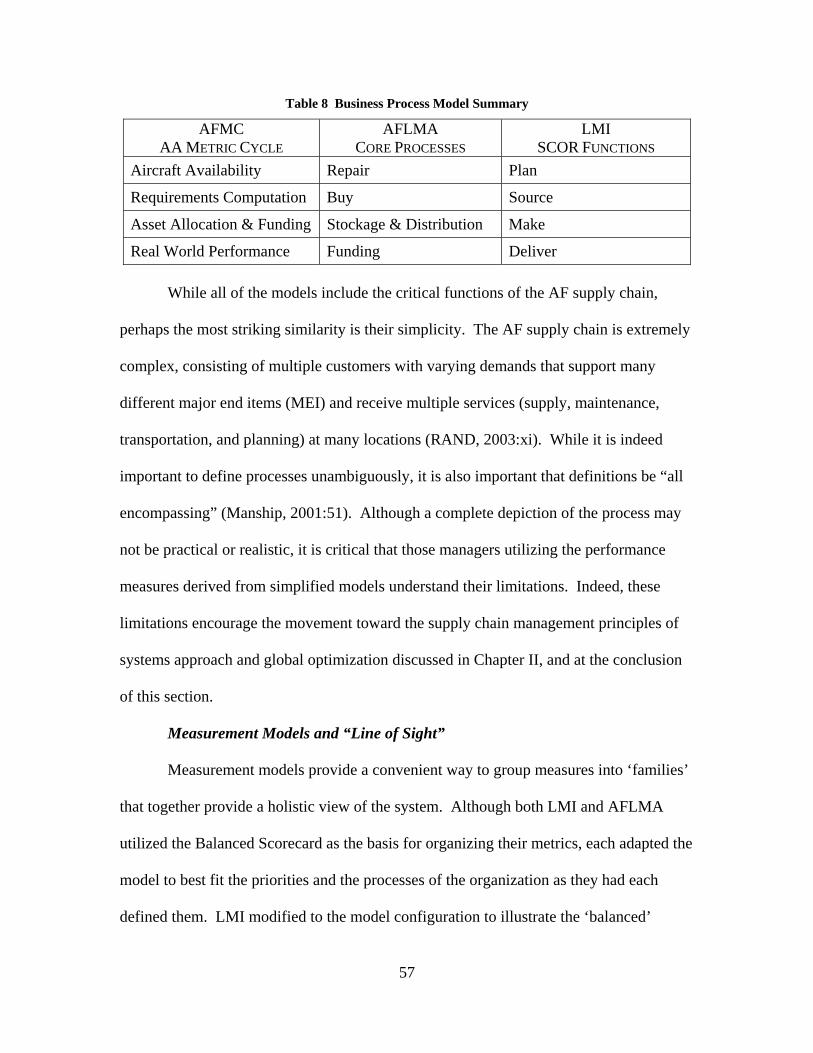
Table 8 Business Process Model Summary
AFMC AA METRIC CYCLE
AFLMA CORE PROCESSES
LMI SCOR FUNCTIONS
Aircraft Availability Repair Plan
Requirements Computation Buy Source
Asset Allocation & Funding Stockage & Distribution Make
Real World Performance Funding Deliver While all of the models include the critical functions of the AF supply chain,
perhaps the most striking similarity is their simplicity. The AF supply chain is extremely
complex, consisting of multiple customers with varying demands that support many
different major end items (MEI) and receive multiple services (supply, maintenance,
transportation, and planning) at many locations (RAND, 2003:xi). While it is indeed
important to define processes unambiguously, it is also important that definitions be “all
encompassing” (Manship, 2001:51). Although a complete depiction of the process may
not be practical or realistic, it is critical that those managers utilizing the performance
measures derived from simplified models understand their limitations. Indeed, these
limitations encourage the movement toward the supply chain management principles of
systems approach and global optimization discussed in Chapter II, and at the conclusion
of this section.
Measurement Models and “Line of Sight” Measurement models provide a convenient way to group measures into ‘families’
that together provide a holistic view of the system. Although both LMI and AFLMA
utilized the Balanced Scorecard as the basis for organizing their metrics, each adapted the
model to best fit the priorities and the processes of the organization as they had each
defined them. LMI modified to the model configuration to illustrate the ‘balanced’
57
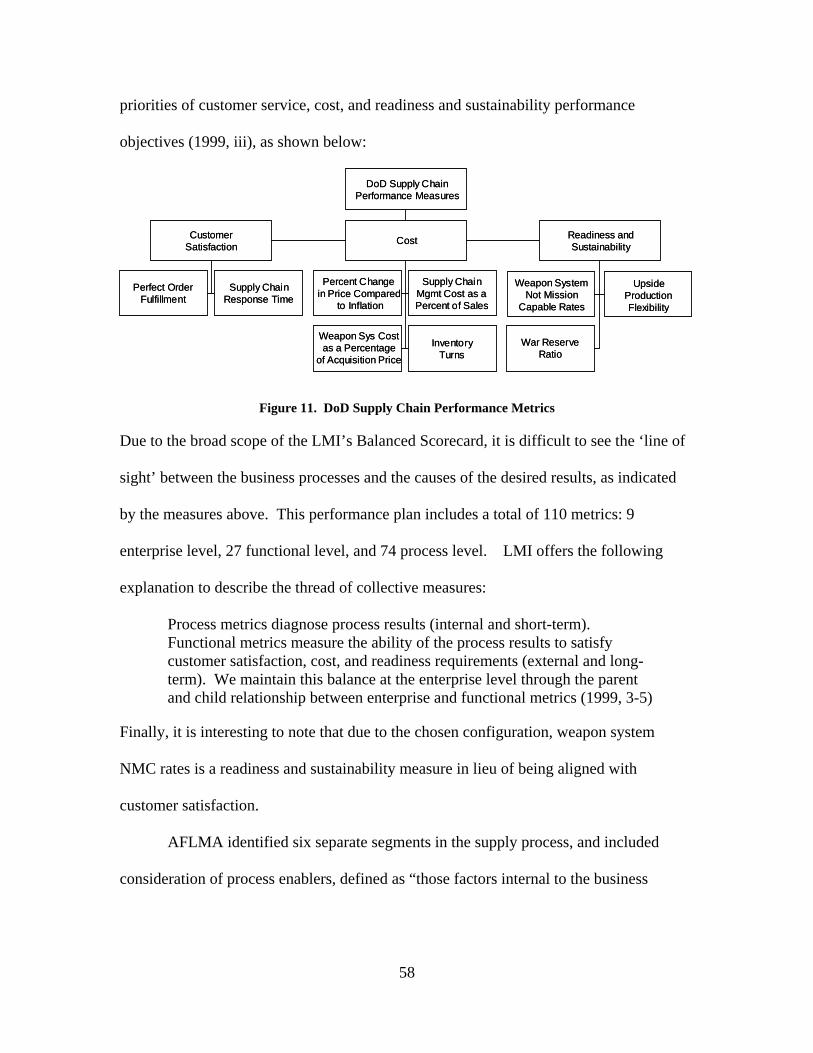
priorities of customer service, cost, and readiness and sustainability performance
objectives (1999, iii), as shown below:
DoD Supply ChainPerformance Measures
Weapon SystemNot Mission
Capable Rates
CustomerSatisfaction Cost Readiness and
Sustainability
Perfect OrderFulfillment
Supply ChainResponse Time
Percent Changein Price Compared
to Inflation
Supply ChainMgmt Cost as aPercent of Sales
Weapon Sys Costas a Percentage
of Acquisition Price
InventoryTurns
War ReserveRatio
UpsideProductionFlexibility
Figure 11. DoD Supply Chain Performance Metrics
Due to the broad scope of the LMI’s Balanced Scorecard, it is difficult to see the ‘line of
sight’ between the business processes and the causes of the desired results, as indicated
by the measures above. This performance plan includes a total of 110 metrics: 9
enterprise level, 27 functional level, and 74 process level. LMI offers the following
explanation to describe the thread of collective measures:
Process metrics diagnose process results (internal and short-term). Functional metrics measure the ability of the process results to satisfy customer satisfaction, cost, and readiness requirements (external and long-term). We maintain this balance at the enterprise level through the parent and child relationship between enterprise and functional metrics (1999, 3-5)
Finally, it is interesting to note that due to the chosen configuration, weapon system
NMC rates is a readiness and sustainability measure in lieu of being aligned with
customer satisfaction.
AFLMA identified six separate segments in the supply process, and included
consideration of process enablers, defined as “those factors internal to the business
58
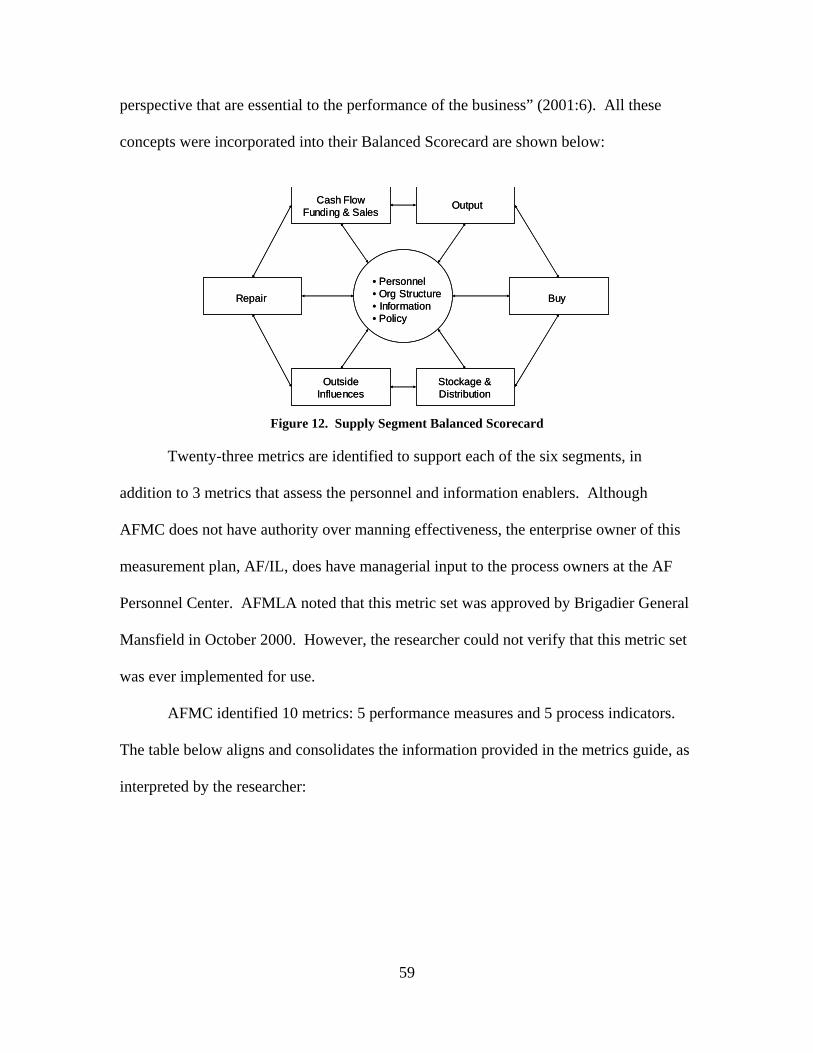
perspective that are essential to the performance of the business” (2001:6). All these
concepts were incorporated into their Balanced Scorecard are shown below:
• Personnel • Org Structure• Information• Policy
Repair
OutsideInfluences
Stockage &Distribution
Buy
OutputCash FlowFunding & Sales
• Personnel • Org Structure• Information• Policy
Repair
OutsideInfluences
Stockage &Distribution
Buy
OutputCash FlowFunding & Sales
Figure 12. Supply Segment Balanced Scorecard
Twenty-three metrics are identified to support each of the six segments, in
addition to 3 metrics that assess the personnel and information enablers. Although
AFMC does not have authority over manning effectiveness, the enterprise owner of this
measurement plan, AF/IL, does have managerial input to the process owners at the AF
Personnel Center. AFMLA noted that this metric set was approved by Brigadier General
Mansfield in October 2000. However, the researcher could not verify that this metric set
was ever implemented for use.
AFMC identified 10 metrics: 5 performance measures and 5 process indicators.
The table below aligns and consolidates the information provided in the metrics guide, as
interpreted by the researcher:
59
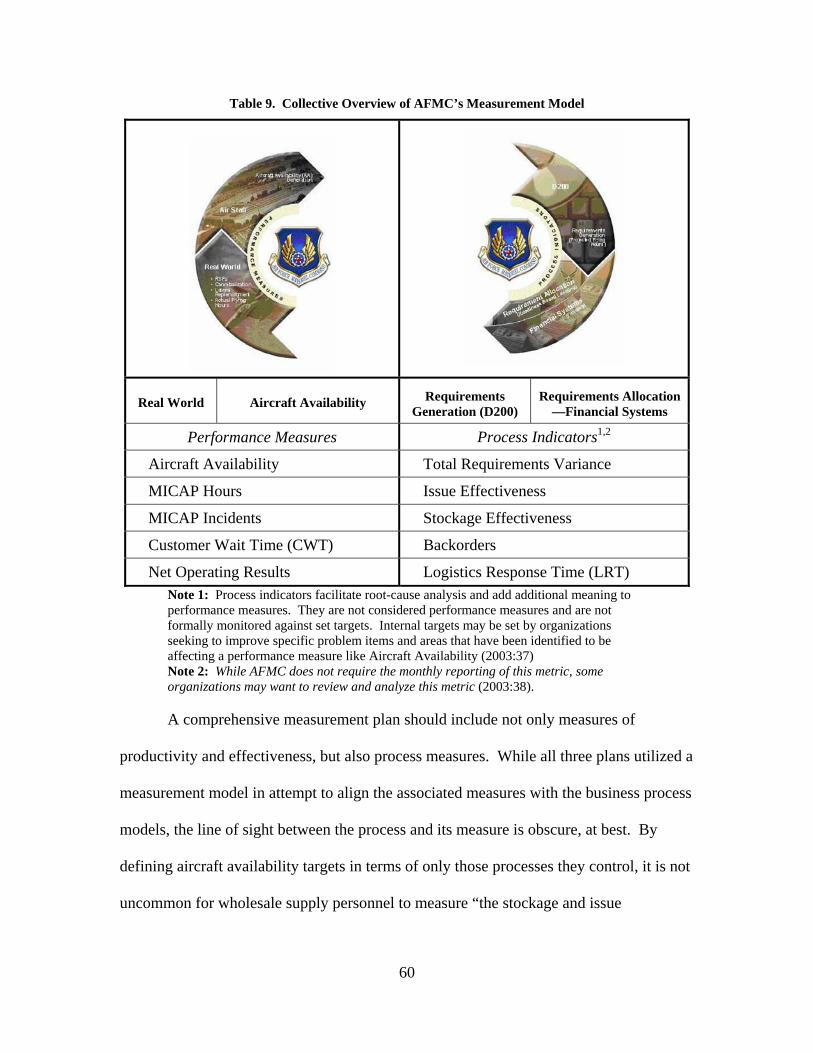
Table 9. Collective Overview of AFMC’s Measurement Model
Real World Aircraft Availability Requirements Generation (D200)
Requirements Allocation—Financial Systems
Performance Measures Process Indicators1,2
Aircraft Availability Total Requirements Variance
MICAP Hours Issue Effectiveness
MICAP Incidents Stockage Effectiveness
Customer Wait Time (CWT) Backorders
Net Operating Results Logistics Response Time (LRT) Note 1: Process indicators facilitate root-cause analysis and add additional meaning to performance measures. They are not considered performance measures and are not formally monitored against set targets. Internal targets may be set by organizations seeking to improve specific problem items and areas that have been identified to be affecting a performance measure like Aircraft Availability (2003:37) Note 2: While AFMC does not require the monthly reporting of this metric, some organizations may want to review and analyze this metric (2003:38).
A comprehensive measurement plan should include not only measures of
productivity and effectiveness, but also process measures. While all three plans utilized a
measurement model in attempt to align the associated measures with the business process
models, the line of sight between the process and its measure is obscure, at best. By
defining aircraft availability targets in terms of only those processes they control, it is not
uncommon for wholesale supply personnel to measure “the stockage and issue
60
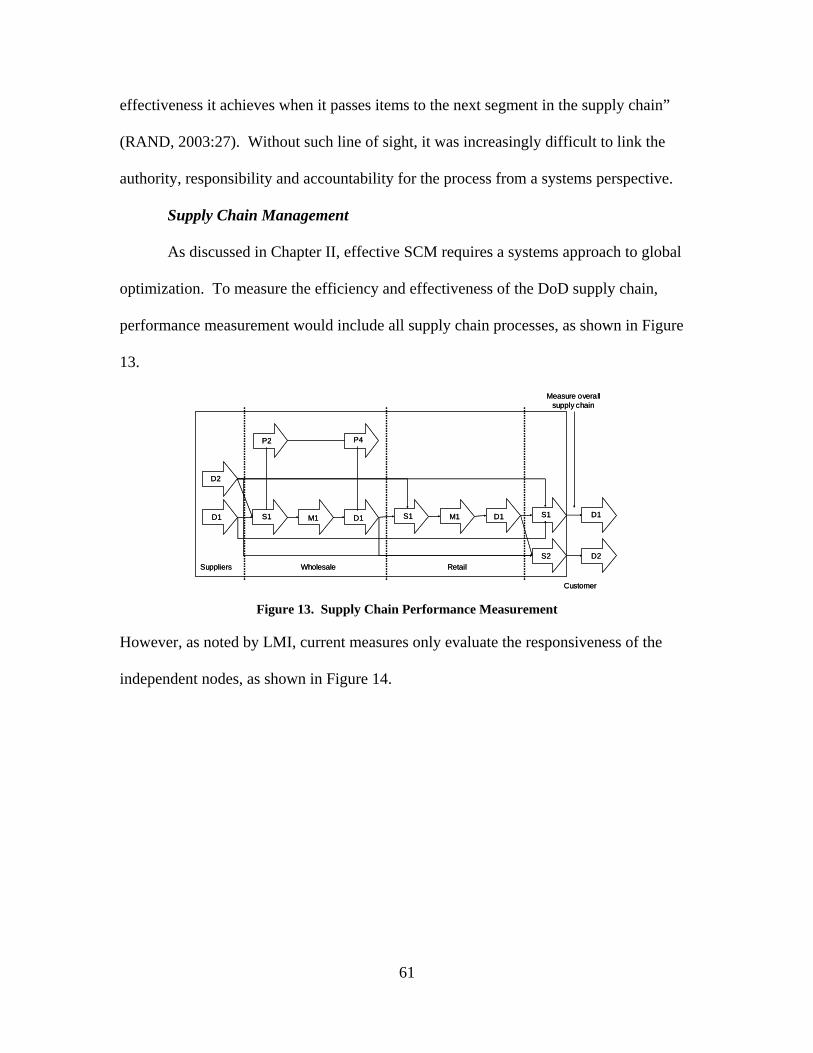
effectiveness it achieves when it passes items to the next segment in the supply chain”
(RAND, 2003:27). Without such line of sight, it was increasingly difficult to link the
authority, responsibility and accountability for the process from a systems perspective.
Supply Chain Management As discussed in Chapter II, effective SCM requires a systems approach to global
optimization. To measure the efficiency and effectiveness of the DoD supply chain,
performance measurement would include all supply chain processes, as shown in Figure
13.
D1
D2
P2
S1 M1 D1
P4
S1 M1 D1 S1 D1
D2S2Suppliers Wholesale Retail
Customer
Measure overallsupply chain
D1
D2
P2
S1 M1 D1
P4
S1 M1 D1 S1 D1
D2S2Suppliers Wholesale Retail
Customer
Measure overallsupply chain
Figure 13. Supply Chain Performance Measurement
However, as noted by LMI, current measures only evaluate the responsiveness of the
independent nodes, as shown in Figure 14.
61
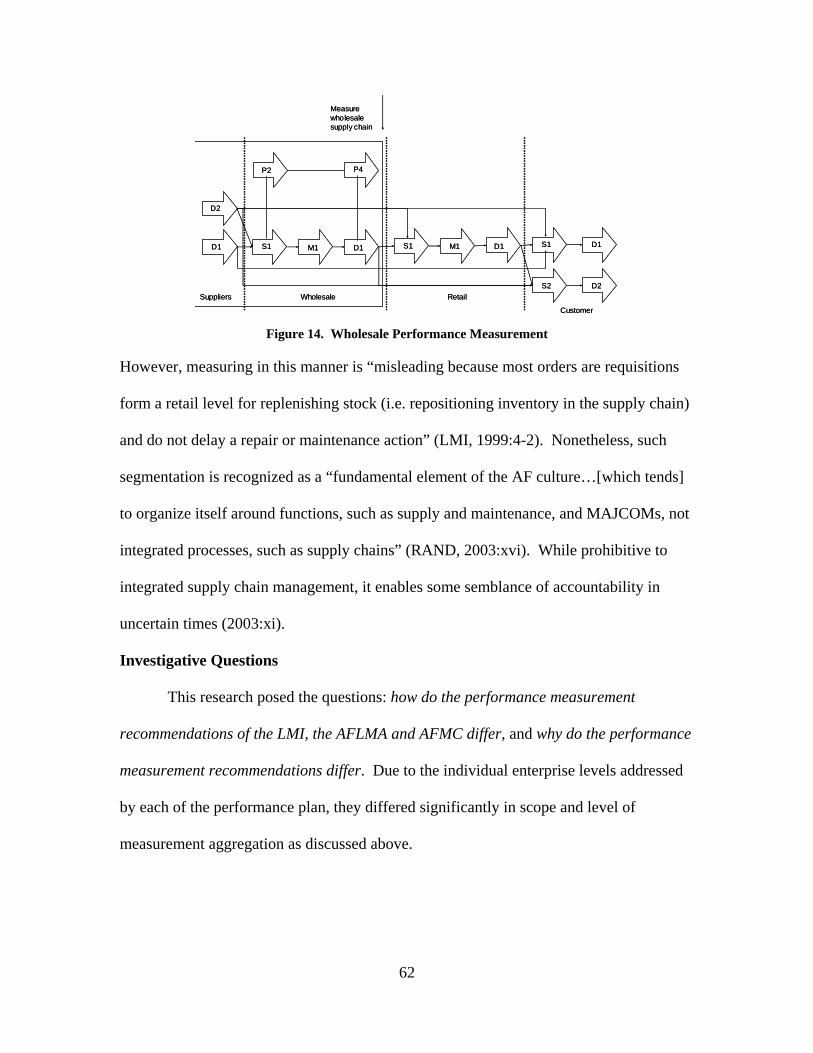
D1
D2
P2
S1 M1 D1
P4
S1 M1 D1 S1 D1
D2S2Suppliers Wholesale Retail
Customer
Measurewholesalesupply chain
D1
D2
P2
S1 M1 D1
P4
S1 M1 D1 S1 D1
D2S2Suppliers Wholesale Retail
Customer
Measurewholesalesupply chain
Figure 14. Wholesale Performance Measurement
However, measuring in this manner is “misleading because most orders are requisitions
form a retail level for replenishing stock (i.e. repositioning inventory in the supply chain)
and do not delay a repair or maintenance action” (LMI, 1999:4-2). Nonetheless, such
segmentation is recognized as a “fundamental element of the AF culture…[which tends]
to organize itself around functions, such as supply and maintenance, and MAJCOMs, not
integrated processes, such as supply chains” (RAND, 2003:xvi). While prohibitive to
integrated supply chain management, it enables some semblance of accountability in
uncertain times (2003:xi).
Investigative Questions
This research posed the questions: how do the performance measurement
recommendations of the LMI, the AFLMA and AFMC differ, and why do the performance
measurement recommendations differ. Due to the individual enterprise levels addressed
by each of the performance plan, they differed significantly in scope and level of
measurement aggregation as discussed above.
62
Managerial Implications
AF organizational structure and supply chain segmentation is not conducive to
‘one-size-fits-all’ performance measures. The segmentation between functional authority
and system responsibility represent significant challenges to implementing a coherent
supply chain. As such, attempting to measure performance from a supply chain
perspective has limited application. Leading to the conclusion that
in assessing the case for a performance-standards system, it is important not to confuse a focused effort with a productive one. When the output is difficult to measure, as is true in most government bureaucracies and many private ones, installation of specific goals may focus effort but may send the bureaucrats marching in the wrong direction. (Heckman, etal, 1997:394)
63
V. Discussion, Conclusions and Recommendations
This chapter summarizes this research effort. It briefly discusses some of the
limitations of this thesis, and presents some suggestions for future research. Finally, it
concludes by summarizing the research.
Limitations
Chapter II presented some of the difficulties of performance measurement in the
public sector. Segmentation of the supply chain, sub-optimizing trade-offs, and funding
differences all present unique challenges in government organizations. At the crux of
these challenges is the apparent division of authority, responsibility, and accountability.
Without such line of sight, performance measures represent little more than operational
statistics. However, no one organization can address these challenges independently, and
overcoming the apparent segmentation of the supply chain would require significant
changes to organizational policy and operating concepts.
Researcher as an ‘Instrument’
In qualitative research, it is common to refer to the researcher as an instrument
(Yin, 2003; Leedy and Ormrod, 2001:162). Since the interpretation of data is vulnerable
to researcher bias, Creswell and others recommend that the researcher identify “personal
values, assumptions and biases at the outset of the study” (Creswell, 1994:163). The
researcher in this case study is a Logistics Readiness Officer. Prior to realignment of the
officer career paths in logistics, the researcher was a Supply Officer, with fifteen years of
experience in AF supply systems, however, all at the retail level. Readers should note
that it is not the intention of the researcher to make value judgments of the reviewed
64
performance measurement plans, as ‘good’ or ‘bad’. The researcher’s objective in
undertaking this effort was to compare the contributions of various agencies on the
subject, and perhaps discover some thematic commonalities or differences that would
benefit decision makers in future efforts to establish performance measurements.
Recommendations for Future Research
During this study, the researcher noted the following opportunities for future
research.
To facilitate the organizational policy changes required to facilitate SCM within
the AF, a future research effort could conduct a case study focused on determining the
exact delineation of authority, responsibility, and accountability within the various supply
chain processes. For example, while SCM/IMs have responsibility of item management,
they do not have the authority to prioritize repair at the shop level.
A statistical analysis could be conducted utilizing the performance measurements
recommended by AFLMA. Since these measures were never employed, there is no data
to support or refute the viability of their effectiveness to result in improved aircraft
availability.
Finally, future research could explore more advanced methods for disaggregation
of metrics to enhance their application. Current methods of aggregation limit their value
in application, however, obvious methods of disaggregation, such as by weapon system,
would yield an unwieldy number of measures to prove useful at the corporate level.
Research Summary
Despite the abundance of literature available and the efforts of many AF
initiatives, performance measurement continues to be a matter of debate in logistics. The
65
objective of this research was not to identify yet another of set of measures in attempt to
assess the performance of AF logistics systems, but to identify some characteristics about
the nature of performance measurement in such systems that would enable future
managers to develop better measures. To that end, this research identified three
performance measurement plans, and assessed them qualitatively.
Through a review of the literature, the researcher developed propositions
regarding performance measurement systems. These propositions generically described
the characteristics of the developmental components that result in comprehensive
measurement systems. From strategic planning to ultimately identifying system trade-
offs, this building block approach enables managers identify corporate objectives, key
processes, and organizational priorities. Using these propositions, the researcher
developed a line of inquiry to assess each of the performance plans. The findings were
used to conduct cross-case analysis and develop the salient themes identified in Chapter
IV.
Due to the organizational structure and governing policy in AF logistics systems,
there are, indeed, some unique challenges to establishing effective and comprehensive
performance measures. The multiple layers of authority and the nature of executive
relationships at the command level make vertical alignment of performance measures
difficult, at best. As a result, many measures can only capture the performance of various
segments in the supply chain, and are of limited use from a system perspective. The
segmentation of functional authority and system responsibility prevent the development
of true ‘corporate’ measures. Performance measurement will continue to challenge AF
66

logisticians; however, reapplying ineffective measures or attempting to utilize supply
chain measures within the current structure is of limited value.
67
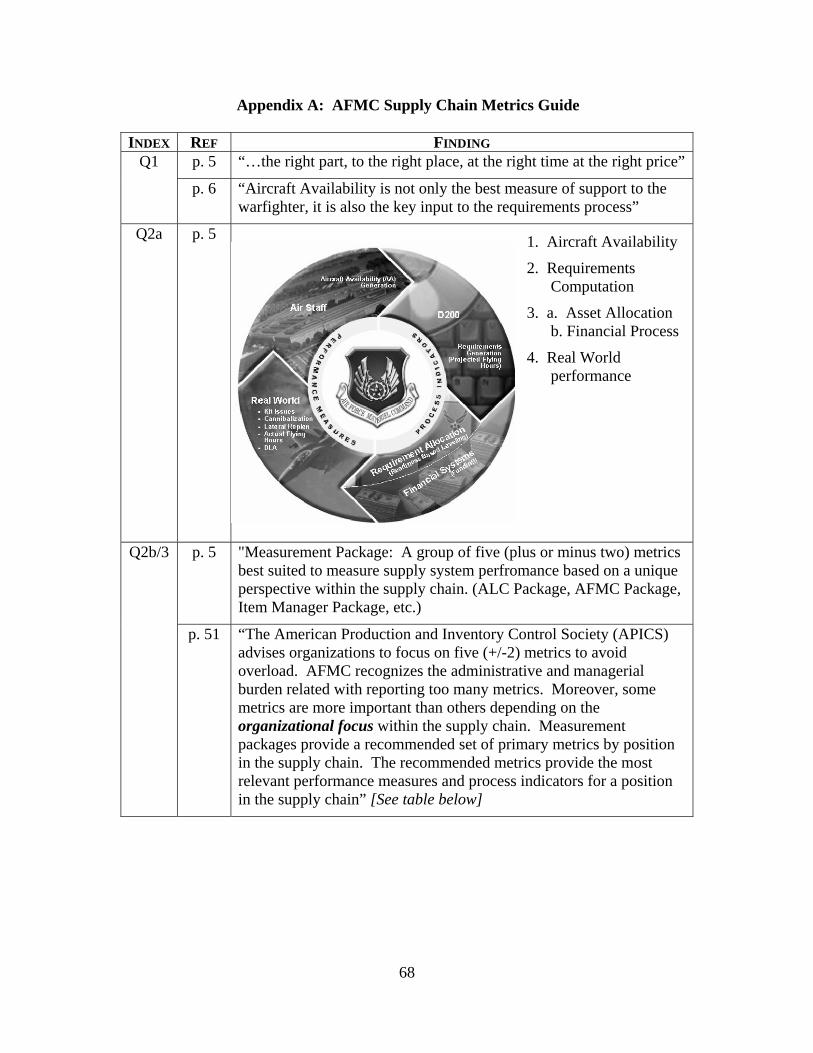
Appendix A: AFMC Supply Chain Metrics Guide
INDEX REF FINDING Q1 p. 5 “…the right part, to the right place, at the right time at the right price”
p. 6 “Aircraft Availability is not only the best measure of support to the warfighter, it is also the key input to the requirements process”
Q2a p. 5 1. Aircraft Availability
2. Requirements Computation
3. a. Asset Allocation b. Financial Process
4. Real World performance
Q2b/3 p. 5 "Measurement Package: A group of five (plus or minus two) metrics best suited to measure supply system perfromance based on a unique perspective within the supply chain. (ALC Package, AFMC Package, Item Manager Package, etc.)
p. 51 “The American Production and Inventory Control Society (APICS) advises organizations to focus on five (+/-2) metrics to avoid overload. AFMC recognizes the administrative and managerial burden related with reporting too many metrics. Moreover, some metrics are more important than others depending on the organizational focus within the supply chain. Measurement packages provide a recommended set of primary metrics by position in the supply chain. The recommended metrics provide the most relevant performance measures and process indicators for a position in the supply chain” [See table below]
68
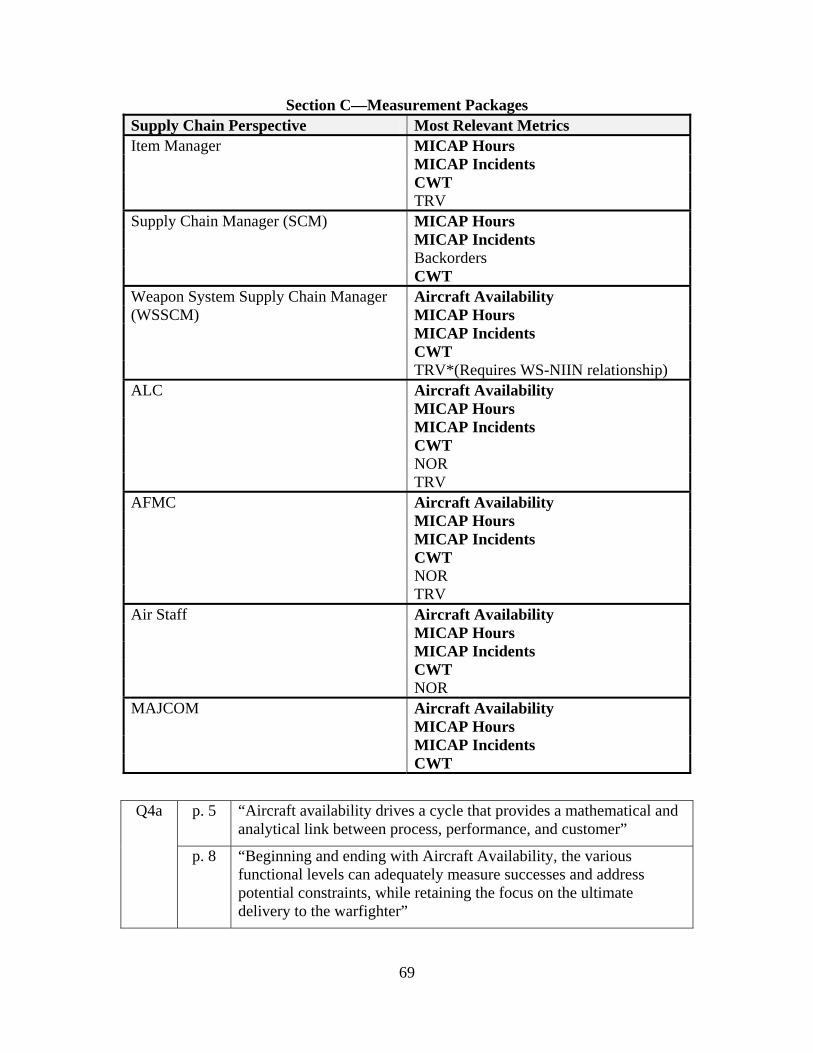
Section C—Measurement Packages Supply Chain Perspective Most Relevant Metrics Item Manager MICAP Hours MICAP Incidents CWT TRV Supply Chain Manager (SCM) MICAP Hours MICAP Incidents Backorders CWT Weapon System Supply Chain Manager Aircraft Availability (WSSCM) MICAP Hours MICAP Incidents CWT TRV*(Requires WS-NIIN relationship) ALC Aircraft Availability MICAP Hours MICAP Incidents CWT NOR TRV AFMC Aircraft Availability MICAP Hours MICAP Incidents CWT NOR TRV Air Staff Aircraft Availability MICAP Hours MICAP Incidents CWT NOR MAJCOM Aircraft Availability MICAP Hours MICAP Incidents CWT
Q4a p. 5 “Aircraft availability drives a cycle that provides a mathematical and analytical link between process, performance, and customer”
p. 8 “Beginning and ending with Aircraft Availability, the various functional levels can adequately measure successes and address potential constraints, while retaining the focus on the ultimate delivery to the warfighter”
69
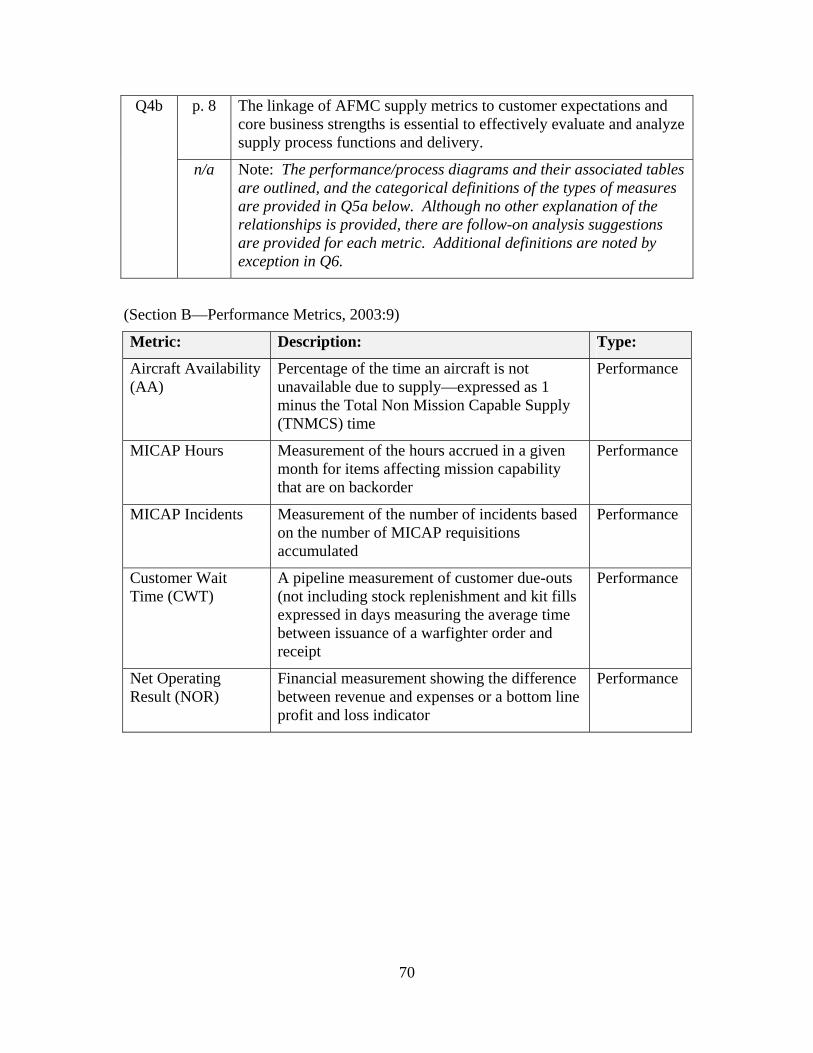
Q4b p. 8 The linkage of AFMC supply metrics to customer expectations and core business strengths is essential to effectively evaluate and analyze supply process functions and delivery.
n/a Note: The performance/process diagrams and their associated tables are outlined, and the categorical definitions of the types of measures are provided in Q5a below. Although no other explanation of the relationships is provided, there are follow-on analysis suggestions are provided for each metric. Additional definitions are noted by exception in Q6.
(Section B—Performance Metrics, 2003:9)
Metric: Description: Type:
Aircraft Availability (AA)
Percentage of the time an aircraft is not unavailable due to supply—expressed as 1 minus the Total Non Mission Capable Supply (TNMCS) time
Performance
MICAP Hours Measurement of the hours accrued in a given month for items affecting mission capability that are on backorder
Performance
MICAP Incidents Measurement of the number of incidents based on the number of MICAP requisitions accumulated
Performance
Customer Wait Time (CWT)
A pipeline measurement of customer due-outs (not including stock replenishment and kit fills expressed in days measuring the average time between issuance of a warfighter order and receipt
Performance
Net Operating Result (NOR)
Financial measurement showing the difference between revenue and expenses or a bottom line profit and loss indicator
Performance
70
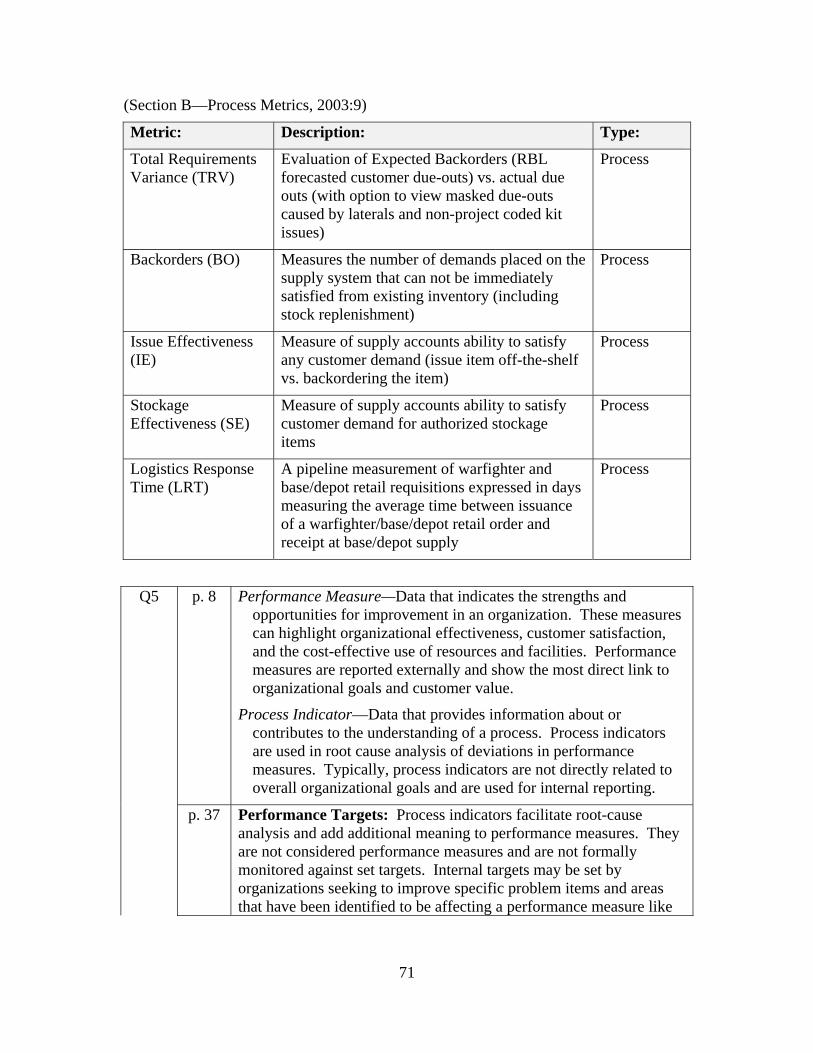
(Section B—Process Metrics, 2003:9)
Metric: Description: Type:
Total Requirements Variance (TRV)
Evaluation of Expected Backorders (RBL forecasted customer due-outs) vs. actual due outs (with option to view masked due-outs caused by laterals and non-project coded kit issues)
Process
Backorders (BO) Measures the number of demands placed on the supply system that can not be immediately satisfied from existing inventory (including stock replenishment)
Process
Issue Effectiveness (IE)
Measure of supply accounts ability to satisfy any customer demand (issue item off-the-shelf vs. backordering the item)
Process
Stockage Effectiveness (SE)
Measure of supply accounts ability to satisfy customer demand for authorized stockage items
Process
Logistics Response Time (LRT)
A pipeline measurement of warfighter and base/depot retail requisitions expressed in days measuring the average time between issuance of a warfighter/base/depot retail order and receipt at base/depot supply
Process
Q5 p. 8 Performance Measure—Data that indicates the strengths and opportunities for improvement in an organization. These measures can highlight organizational effectiveness, customer satisfaction, and the cost-effective use of resources and facilities. Performance measures are reported externally and show the most direct link to organizational goals and customer value.
Process Indicator—Data that provides information about or contributes to the understanding of a process. Process indicators are used in root cause analysis of deviations in performance measures. Typically, process indicators are not directly related to overall organizational goals and are used for internal reporting.
p. 37 Performance Targets: Process indicators facilitate root-cause analysis and add additional meaning to performance measures. They are not considered performance measures and are not formally monitored against set targets. Internal targets may be set by organizations seeking to improve specific problem items and areas that have been identified to be affecting a performance measure like
71
Aircraft Availability.
p. 38 Analysis: While AFMC does not require the monthly reporting of this metric, some organizations may want to review and analyze this metric. [this exception is noted on all process indicators]
Q6 p. 12 It is important to note that the distribution relating Aircraft Availability and funding can be precipitous. Even the slightest reduction in funding can result in a significant drop in Aircraft Availability. Likewise, if Aircraft Availability is low, the distribution forecasts a significant increase in Aircraft Availability with only a modest increase in funding.
p. 15 MICAP Hours: Only transactions where AFMC is the primary source of supply are considered. [same exception noted for MICAP incidents, p. 20]
p. 16 MICAP Hours: The targets shown above are the results of the FY02 target-setting exercise and will be adjusted during the FY03 target-setting process. [same exception noted for MICAP incidents, p. 22]
p. 17 Analysis should be summarized with enough detail to explain trends, spikes, or dips reflected by the data. Analysis should include drill downs, which help isolate areas that are influencing trends, spikes and dips. [same guidance provided for MICAP incidents, p. 22]
p. 18 Avoid explaining trends by simply identifying top driver NSNs. Instead, try identifying NSNs that have a significant total requirements variance (ADO + Laterals + Non-Project-Coded Kit Issues versus EBO).
p. 23 MICAP Incidents: Avoid explaining trends by identifying top driver NSNs. Often, they represent various problems, but not necessarily the problem(s) that caused the trend. They may indeed have been contributors of many MICAP incidents, but they may have been for months, even when the total number of MICAP incidents was low.
p. 24 CWT: Unlike LRT, requisitions for RSP or replenishment of base stock levels are not included. This is the AF mandated measure of pipeline performance.
p. 27 When the CWT metric reveals a negative trend, problems have typically already been resolved. That is because CWT measures are determined when orders are filled. So, CWT may look good, even though numerous old backorders are amassing, and not until they are filled does it adversely impact the CWT. [admittedly lagging]
p. 28 Avoid explaining trends by identifying top driver NSNs. Often, they represent various problems, but not necessarily the problem(s) that
72
caused the trend. They indeed may have significantly contributed to long CWT, but they may have been for months, even when CWT was short [aggregation problem].
p. 47 CWT is the congressionally mandated pipeline metric (and is intended to replace LRT)
p. 30 NOR: NOR is used as a performance indicator of how activity groups perform in relation to the standard established.
Calculation Formula: [Total revenue and total expenses include JV] JV = Journal Variance. Miscellaneous Account Ledger used for accounting purposes to record expenses and revenues that are not adequately captured in other accounts. For example, the expenses lost from a warehouse roof collapsing.
The DoD and AF objective for the Supply Management Activity Group (SMAG) is to break even over a two-year budget cycle.
p. 31 NOR: Follow-on analysis should be performed on all NORs including those equal to or near zero. Aggregation of the NOR may mask problems that are more readily apparent at a granular level…The process of drilling through aggregate results to actual findings by NIIN can produce results that differ greatly, in terms of variance, from reported levels as shown by the following example…In this example, $21M of $25M variance is explained by the top two NIINs.
p. 39 TRV: This chart and many similar reports in the Total Requirements Variance Tool (currently in development at AFMC), provides a mechanism for Supply Chain Managers (SCMs) to reconcile internal processes that are generating critical spares shortages for warfighters. It also allows for the identification of over-allocated items that may be diverting needed funds from critical spares.
p. 40 IE: While this metric is traditionally a reported MSD metric, it does not correlate directly to Aircraft Availability and can drive the wrong behavior if used inappropriately.
p. 43 SE: While this metric is traditionally a reported MSD metric, it does not correlate directly to Aircraft Availability and can drive the wrong behavior if used inappropriately.
p. 45 BO: While this metric is traditionally a reported MSD metric, it does not correlate directly to Aircraft Availability and can drive the wrong behavior if used inappropriately.
The AFMC Backorders metric measures the number of demands placed on the supply system that cannot be immediately satisfied from existing inventory—expressed as either units or requisitions in a
73
snapshot view (2nd day of each month).
The Spares Priority Release Sequence (SPRS) provides an effective method of stratifying backorders for analysis. SPRS categorizes backorders according to their impact on warfighter readiness not just the requisition’s priority. Analysis of SPRS backorders will focus on those backorders that may provide high readiness payback.
p. 46 Avoid explaining trends by identifying top driver NSNs. Often, they represent various problems, but not necessarily the problem(s) that caused the trend. They indeed may have been large backorder quantity contributors, but they may have been for months, even when total backorder quantities were low [aggregation problem].
p. 48 LRT: Any record that has a negative value for any segment or is missing more than one segment after the above scrub will be included in the LMARS table but will be excluded from all computations and reports.
p. 49 Explain whether [long/short] LRT is a function of a problem or good things happening. Is it getting longer because we are struggling in some areas (e.g., fewer backorders are being filled quickly, causing overall age of backorders to increase), or we are doing a better job (e.g., consistently filling new backorders, while filling even more old backorders)?
p. 50 Avoid explaining trends by identifying top driver NSNs. Often, they represent various problems, but not necessarily the problem(s) that caused the trend. They indeed may have significantly contributed to long LRT, but they may have been for months, even when LRT was short [aggregation problem].
p. 60 The EXPRESS Supportability Summary provides an additional method for conducting root cause constraints analysis of MICAP data.
These are the symptoms of bigger issues…
• What was the funding vs. requirement? Are we executing the buy program on schedule?
• Is transportation expediting critical spares that are “carcass short”?
• What was the flying hour program vs. executed?
• What is the level of bit n’ piece support from DLA?
• Was capacity (labor hours, test station throughput, etc) correctly sized to requirement?
74
p. 61 Further analysis incorporating NIIN level MICAP hours reveals the asset accounting for the majority of the problem. These highest-ranking assets would provide the greatest return on AA. Note that not all carcass-constrained items cause MICAP hours. The focus needs to be placed on those that do.
Q7 p. 12 It is important to note that the distribution relating Aircraft Availability and funding can be precipitous. Even the slightest reduction in funding can result in a significant drop in Aircraft Availability. Likewise, if Aircraft Availability is low, the distribution forecasts a significant increase in Aircraft Availability with only a modest increase in funding.
p. 13 A/A Variance from Target: Banding includes yellow and red bands for performance below target and a dark green band for performance that significantly exceeds target (which may indicate resources are being directed to the weapon system to the detriment of other systems).
75
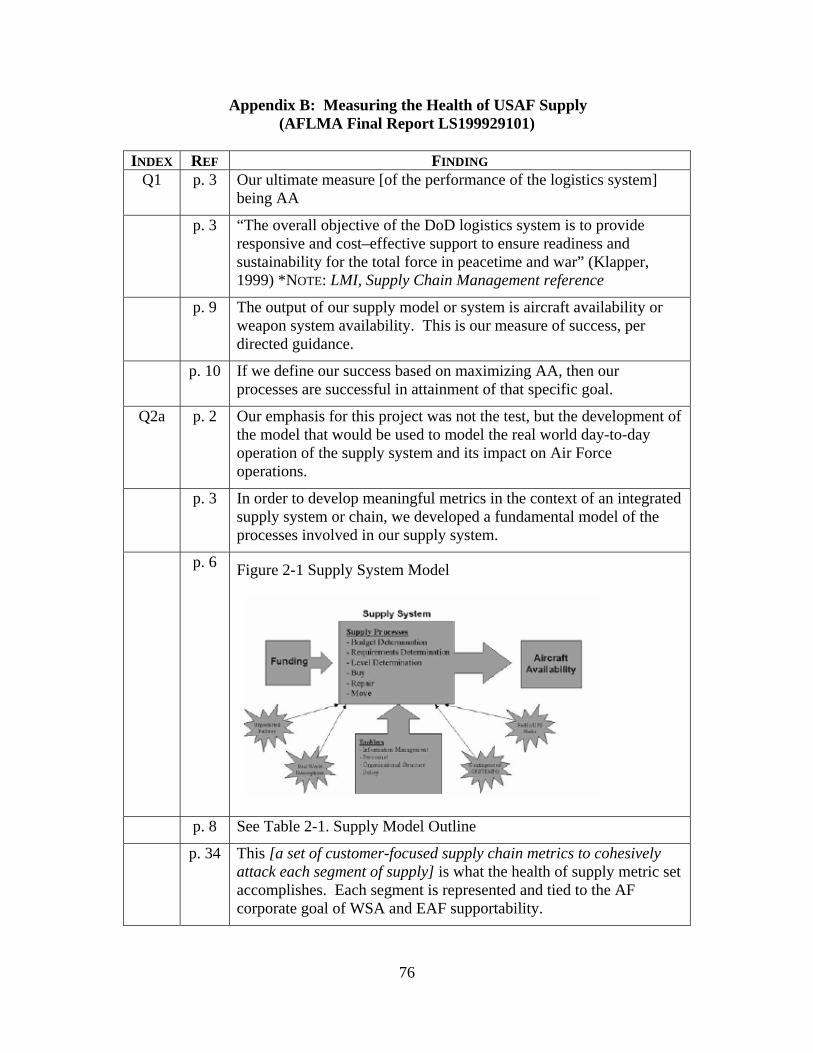
Appendix B: Measuring the Health of USAF Supply (AFLMA Final Report LS199929101)
INDEX REF FINDING
Q1 p. 3 Our ultimate measure [of the performance of the logistics system] being AA
p. 3 “The overall objective of the DoD logistics system is to provide responsive and cost–effective support to ensure readiness and sustainability for the total force in peacetime and war” (Klapper, 1999) *NOTE: LMI, Supply Chain Management reference
p. 9 The output of our supply model or system is aircraft availability or weapon system availability. This is our measure of success, per directed guidance.
p. 10 If we define our success based on maximizing AA, then our processes are successful in attainment of that specific goal.
Q2a p. 2 Our emphasis for this project was not the test, but the development of the model that would be used to model the real world day-to-day operation of the supply system and its impact on Air Force operations.
p. 3 In order to develop meaningful metrics in the context of an integrated supply system or chain, we developed a fundamental model of the processes involved in our supply system.
p. 6 Figure 2-1 Supply System Model
p. 8 See Table 2-1. Supply Model Outline
p. 34 This [a set of customer-focused supply chain metrics to cohesively attack each segment of supply] is what the health of supply metric set accomplishes. Each segment is represented and tied to the AF corporate goal of WSA and EAF supportability.
76
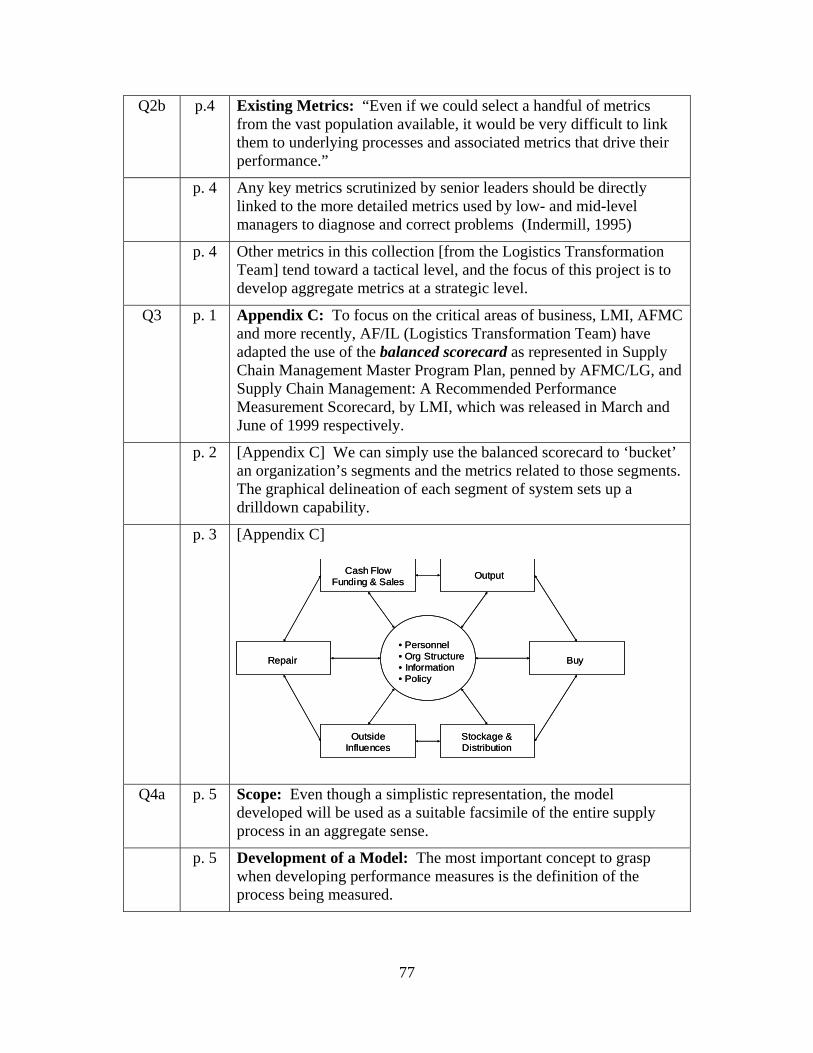
Q2b p.4 Existing Metrics: “Even if we could select a handful of metrics from the vast population available, it would be very difficult to link them to underlying processes and associated metrics that drive their performance.”
p. 4 Any key metrics scrutinized by senior leaders should be directly linked to the more detailed metrics used by low- and mid-level managers to diagnose and correct problems (Indermill, 1995)
p. 4 Other metrics in this collection [from the Logistics Transformation Team] tend toward a tactical level, and the focus of this project is to develop aggregate metrics at a strategic level.
Q3 p. 1 Appendix C: To focus on the critical areas of business, LMI, AFMC and more recently, AF/IL (Logistics Transformation Team) have adapted the use of the balanced scorecard as represented in Supply Chain Management Master Program Plan, penned by AFMC/LG, and Supply Chain Management: A Recommended Performance Measurement Scorecard, by LMI, which was released in March and June of 1999 respectively.
p. 2 [Appendix C] We can simply use the balanced scorecard to ‘bucket’ an organization’s segments and the metrics related to those segments. The graphical delineation of each segment of system sets up a drilldown capability.
p. 3 [Appendix C]
• Personnel • Org Structure• Information• Policy
Repair
OutsideInfluences
Stockage &Distribution
Buy
OutputCash FlowFunding & Sales
• Personnel • Org Structure• Information• Policy
Repair
OutsideInfluences
Stockage &Distribution
Buy
OutputCash FlowFunding & Sales
Q4a p. 5 Scope: Even though a simplistic representation, the model developed will be used as a suitable facsimile of the entire supply process in an aggregate sense.
p. 5 Development of a Model: The most important concept to grasp when developing performance measures is the definition of the process being measured.
77
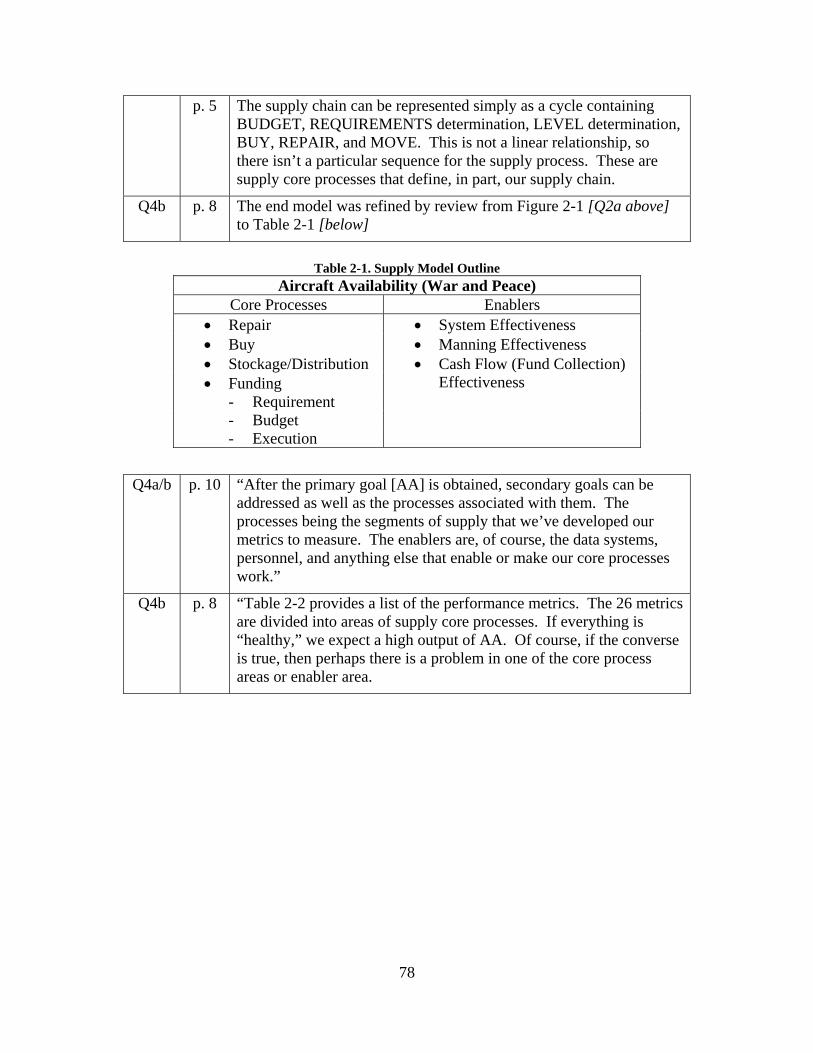
p. 5 The supply chain can be represented simply as a cycle containing BUDGET, REQUIREMENTS determination, LEVEL determination, BUY, REPAIR, and MOVE. This is not a linear relationship, so there isn’t a particular sequence for the supply process. These are supply core processes that define, in part, our supply chain.
Q4b p. 8 The end model was refined by review from Figure 2-1 [Q2a above] to Table 2-1 [below]
Table 2-1. Supply Model Outline
Aircraft Availability (War and Peace) Core Processes Enablers
• Repair • System Effectiveness • Buy • Manning Effectiveness • Stockage/Distribution • Cash Flow (Fund Collection) • Funding Effectiveness
- Requirement - Budget - Execution
Q4a/b p. 10 “After the primary goal [AA] is obtained, secondary goals can be
addressed as well as the processes associated with them. The processes being the segments of supply that we’ve developed our metrics to measure. The enablers are, of course, the data systems, personnel, and anything else that enable or make our core processes work.”
Q4b p. 8 “Table 2-2 provides a list of the performance metrics. The 26 metrics are divided into areas of supply core processes. If everything is “healthy,” we expect a high output of AA. Of course, if the converse is true, then perhaps there is a problem in one of the core process areas or enabler area.
78
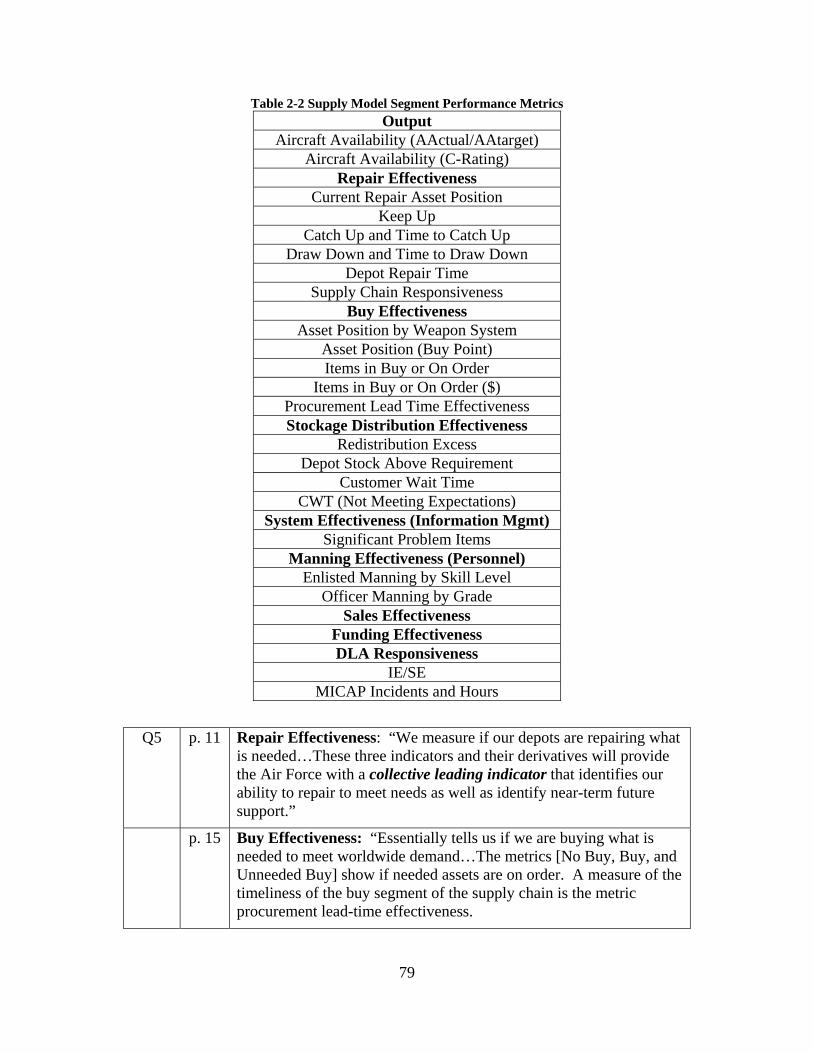
Table 2-2 Supply Model Segment Performance Metrics Output
Aircraft Availability (AActual/AAtarget) Aircraft Availability (C-Rating)
Repair Effectiveness Current Repair Asset Position
Keep Up Catch Up and Time to Catch Up
Draw Down and Time to Draw Down Depot Repair Time
Supply Chain Responsiveness Buy Effectiveness
Asset Position by Weapon System Asset Position (Buy Point) Items in Buy or On Order
Items in Buy or On Order ($) Procurement Lead Time Effectiveness Stockage Distribution Effectiveness
Redistribution Excess Depot Stock Above Requirement
Customer Wait Time CWT (Not Meeting Expectations)
System Effectiveness (Information Mgmt) Significant Problem Items
Manning Effectiveness (Personnel) Enlisted Manning by Skill Level
Officer Manning by Grade Sales Effectiveness
Funding Effectiveness DLA Responsiveness
IE/SE MICAP Incidents and Hours
Q5 p. 11 Repair Effectiveness: “We measure if our depots are repairing what is needed…These three indicators and their derivatives will provide the Air Force with a collective leading indicator that identifies our ability to repair to meet needs as well as identify near-term future support.”
p. 15 Buy Effectiveness: “Essentially tells us if we are buying what is needed to meet worldwide demand…The metrics [No Buy, Buy, and Unneeded Buy] show if needed assets are on order. A measure of the timeliness of the buy segment of the supply chain is the metric procurement lead-time effectiveness.
79
p. 18 Stockage/Distribution Effectiveness: Redistributable Excess…is the stock at the right location?
p. 20 System Effectiveness: “The D200A worldwide requirement should always at least equal (within rounding) the expected pipeline. Incomplete data due to data capture, transmission, or receipt errors (dirty data) could be the cause for those cases where the D200A requirement fails to meet the expected pipeline…so, requirement problems represent those cases where ‘dirty data’ could be the cause for worldwide requirement not meeting the worldwide pipeline and require some external action to correct.”
p. 20 Significant Problems Items: “There are two groups of problem items (‘N’ and ‘Z’ items) where the base and D200A databases are so inconsistent (the data is suspect) that RBL does not push levels to the bases. These problem items usually mean inadequate requirements and need immediate AFMC item manager action.”
p. 21 Manning Effectiveness: “The most important enabler of our supply chain is the human factor. We measure supply manning levels for war-tasked, traditional supply, as well as other significant areas. We look at assigned versus authorizations by skill level in supply, outside supply and UTC tasked.”
p. 22 Sales Effectiveness: “We measure sales compared to forecasted requirement. This can be done by weapon system, supply chain manager, or MAJCOM.
p. 23 Funding Effectiveness: We measure the cost per flying hour requirement to the D200A requirement against available funding. This identifies the total requirement compared to the O&M budget and the actual funding. Of course, in an ideal world, all three would match.
p. 23 DLA Responsiveness: To measure DLA and their commitment to the AF as supply chain partner and customer, we measure supply availability and issue and stockage effectiveness based on commodity and by base, including D035K accounts. Supply availability measures the percentage of orders filled. Another traditional measure to gage DLA’s support is MICAP incidents and hours by acquisition advice code.
Q6 p. 11 Current Repair Asset Position: We focus only on NSNs with a positive repair requirement to prevent the biasing of the statistics by including the zero requirement.
p. 13 Draw Down: We must adjust the daily repair rate by NSN to be less than the daily demand rate. Just as important, the AF should not be repairing items in an “excess” position.
80
p. 24 DLA Responsiveness [IE, SE, MICAP Incidents and Hours]: These may not be the best measures to gauge DLA support; however, these are traditional measures that the Air Force uses as measures of internal support. To establish meaningful dialog between each organization, DLA and the AF, measures need to be the same.
Q7 p. 3 “Changes to the input will be real-world budgetary constraints. However, the resultant output, aircraft availability (AA) or weapon system availability does not change purely because of the budget. There are other influencing factors both controllable and uncontrollable that will either degrade or enhance the performance of the system (our ultimate measure being AA).”
p. 10 Aircraft Availability: Ideally, the Air Force supply system is designed to obtain set aircraft availability goals. The attainment of that number is a true account of the overall success of all the processes and enablers involved in our supply system. Of course, there are instances when you’re working your people 16 hours a day, over cannabilization, and spending beyond your budget on spares. The goal is obtained, but at a very high price.
p. 10 AA Actual/AA Target: Notice that it is possible to have more than 100%. It is possible that the actual AA could be greater than the targeted AA. This may be good for a particular weapon system, but not the overall system AA.
p. 34 Conclusions: As pointed out by each team in the Spares Campaign, the AF has disconnected metrics that drive independent and suboptimal behavior. Of course, this generates disconnects which negatively affect our corporate goals. These disconnects can be corrected by a set of customer-focused supply chain metrics to cohesively attack each segment of supply.
81
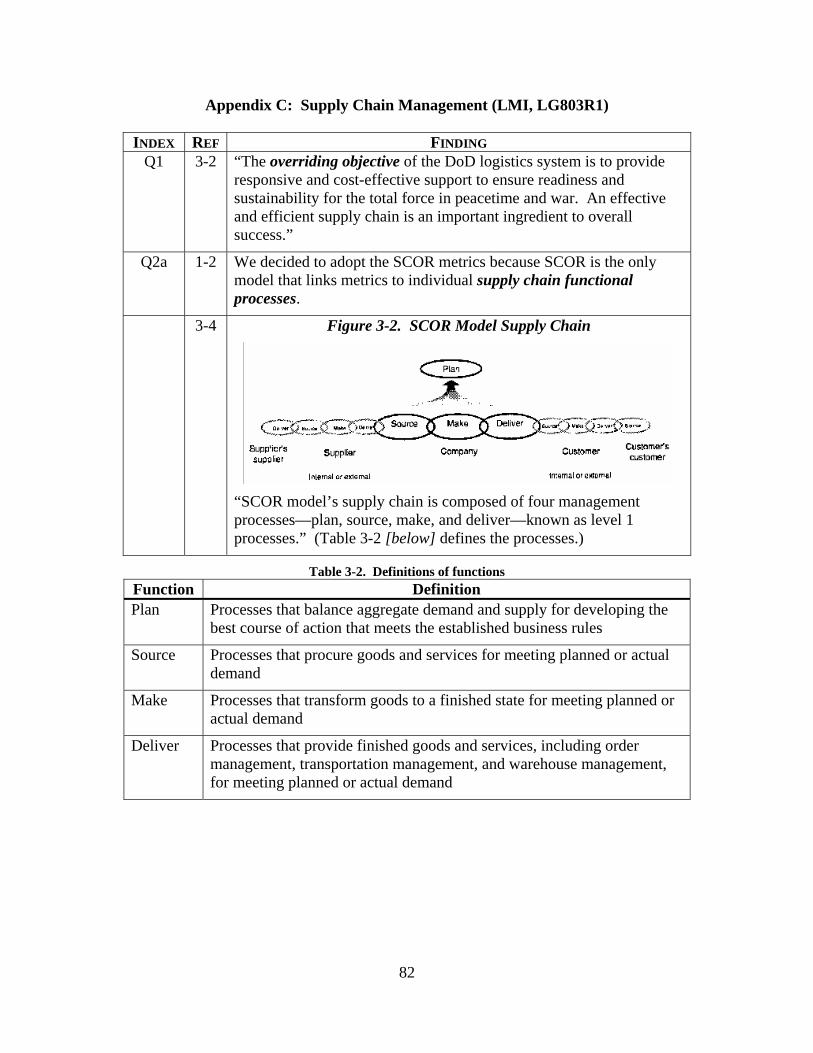
Appendix C: Supply Chain Management (LMI, LG803R1)
INDEX REF FINDING Q1 3-2 “The overriding objective of the DoD logistics system is to provide
responsive and cost-effective support to ensure readiness and sustainability for the total force in peacetime and war. An effective and efficient supply chain is an important ingredient to overall success.”
Q2a 1-2 We decided to adopt the SCOR metrics because SCOR is the only model that links metrics to individual supply chain functional processes.
3-4 Figure 3-2. SCOR Model Supply Chain
“SCOR model’s supply chain is composed of four management processes—plan, source, make, and deliver—known as level 1 processes.” (Table 3-2 [below] defines the processes.)
Table 3-2. Definitions of functions Function Definition Plan Processes that balance aggregate demand and supply for developing the
best course of action that meets the established business rules
Source Processes that procure goods and services for meeting planned or actual demand
Make Processes that transform goods to a finished state for meeting planned or actual demand
Deliver Processes that provide finished goods and services, including order management, transportation management, and warehouse management, for meeting planned or actual demand
82
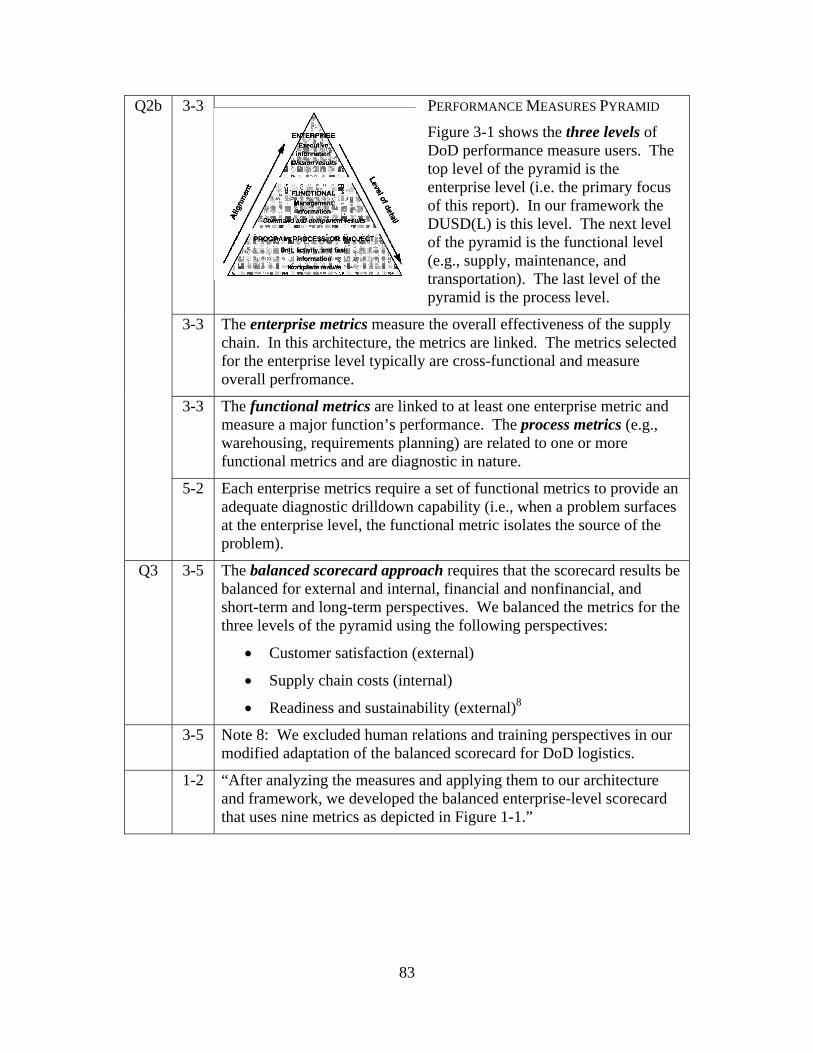
Q2b 3-3 PERFORMANCE MEASURES PYRAMID
Figure 3-1 shows the three levels of DoD performance measure users. The top level of the pyramid is the enterprise level (i.e. the primary focus of this report). In our framework the DUSD(L) is this level. The next level of the pyramid is the functional level (e.g., supply, maintenance, and transportation). The last level of the pyramid is the process level.
3-3 The enterprise metrics measure the overall effectiveness of the supply chain. In this architecture, the metrics are linked. The metrics selected for the enterprise level typically are cross-functional and measure overall perfromance.
3-3 The functional metrics are linked to at least one enterprise metric and measure a major function’s performance. The process metrics (e.g., warehousing, requirements planning) are related to one or more functional metrics and are diagnostic in nature.
5-2 Each enterprise metrics require a set of functional metrics to provide an adequate diagnostic drilldown capability (i.e., when a problem surfaces at the enterprise level, the functional metric isolates the source of the problem).
Q3 3-5 The balanced scorecard approach requires that the scorecard results be balanced for external and internal, financial and nonfinancial, and short-term and long-term perspectives. We balanced the metrics for the three levels of the pyramid using the following perspectives:
• Customer satisfaction (external)
• Supply chain costs (internal)
• Readiness and sustainability (external)8
3-5 Note 8: We excluded human relations and training perspectives in our modified adaptation of the balanced scorecard for DoD logistics.
1-2 “After analyzing the measures and applying them to our architecture and framework, we developed the balanced enterprise-level scorecard that uses nine metrics as depicted in Figure 1-1.”
83
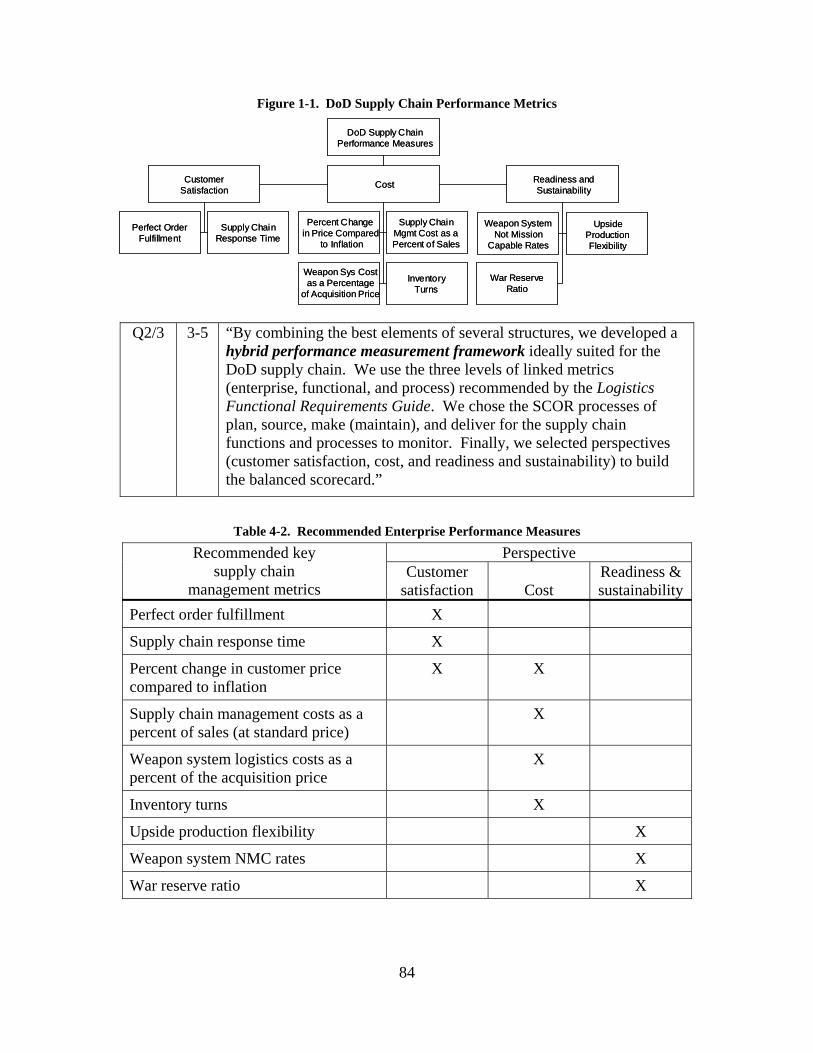
Figure 1-1. DoD Supply Chain Performance Metrics
DoD Supply ChainPerformance Measures
Weapon SystemNot Mission
Capable Rates
CustomerSatisfaction Cost Readiness and
Sustainability
Perfect OrderFulfillment
Supply ChainResponse Time
Percent Changein Price Compared
to Inflation
Supply ChainMgmt Cost as aPercent of Sales
Weapon Sys Costas a Percentage
of Acquisition Price
InventoryTurns
War ReserveRatio
UpsideProductionFlexibility
Q2/3 3-5 “By combining the best elements of several structures, we developed a hybrid performance measurement framework ideally suited for the DoD supply chain. We use the three levels of linked metrics (enterprise, functional, and process) recommended by the Logistics Functional Requirements Guide. We chose the SCOR processes of plan, source, make (maintain), and deliver for the supply chain functions and processes to monitor. Finally, we selected perspectives (customer satisfaction, cost, and readiness and sustainability) to build the balanced scorecard.”
Table 4-2. Recommended Enterprise Performance Measures
Perspective Recommended key supply chain
management metrics Customer
satisfaction
Cost Readiness &sustainability
Perfect order fulfillment X
Supply chain response time X
Percent change in customer price compared to inflation
X X
Supply chain management costs as a percent of sales (at standard price)
X
Weapon system logistics costs as a percent of the acquisition price
X
Inventory turns X
Upside production flexibility X
Weapon system NMC rates X
War reserve ratio X
84
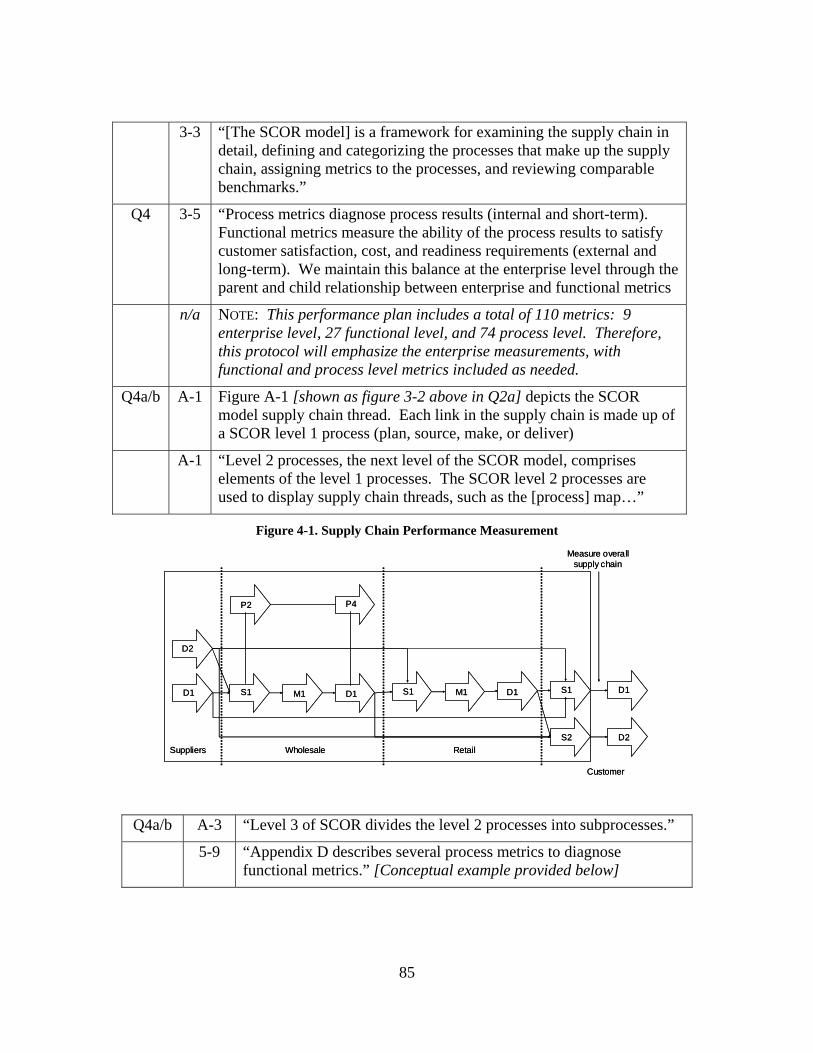
3-3 “[The SCOR model] is a framework for examining the supply chain in detail, defining and categorizing the processes that make up the supply chain, assigning metrics to the processes, and reviewing comparable benchmarks.”
Q4 3-5 “Process metrics diagnose process results (internal and short-term). Functional metrics measure the ability of the process results to satisfy customer satisfaction, cost, and readiness requirements (external and long-term). We maintain this balance at the enterprise level through the parent and child relationship between enterprise and functional metrics
n/a NOTE: This performance plan includes a total of 110 metrics: 9 enterprise level, 27 functional level, and 74 process level. Therefore, this protocol will emphasize the enterprise measurements, with functional and process level metrics included as needed.
Q4a/b A-1 Figure A-1 [shown as figure 3-2 above in Q2a] depicts the SCOR model supply chain thread. Each link in the supply chain is made up of a SCOR level 1 process (plan, source, make, or deliver)
A-1 “Level 2 processes, the next level of the SCOR model, comprises elements of the level 1 processes. The SCOR level 2 processes are used to display supply chain threads, such as the [process] map…”
Figure 4-1. Supply Chain Performance Measurement
D1
D2
P2
S1 M1 D1
P4
S1 M1 D1 S1 D1
D2S2Suppliers Wholesale Retail
Customer
Measure overallsupply chain
D1
D2
P2
S1 M1 D1
P4
S1 M1 D1 S1 D1
D2S2Suppliers Wholesale Retail
Customer
Measure overallsupply chain
Q4a/b A-3 “Level 3 of SCOR divides the level 2 processes into subprocesses.”
5-9 “Appendix D describes several process metrics to diagnose functional metrics.” [Conceptual example provided below]
85
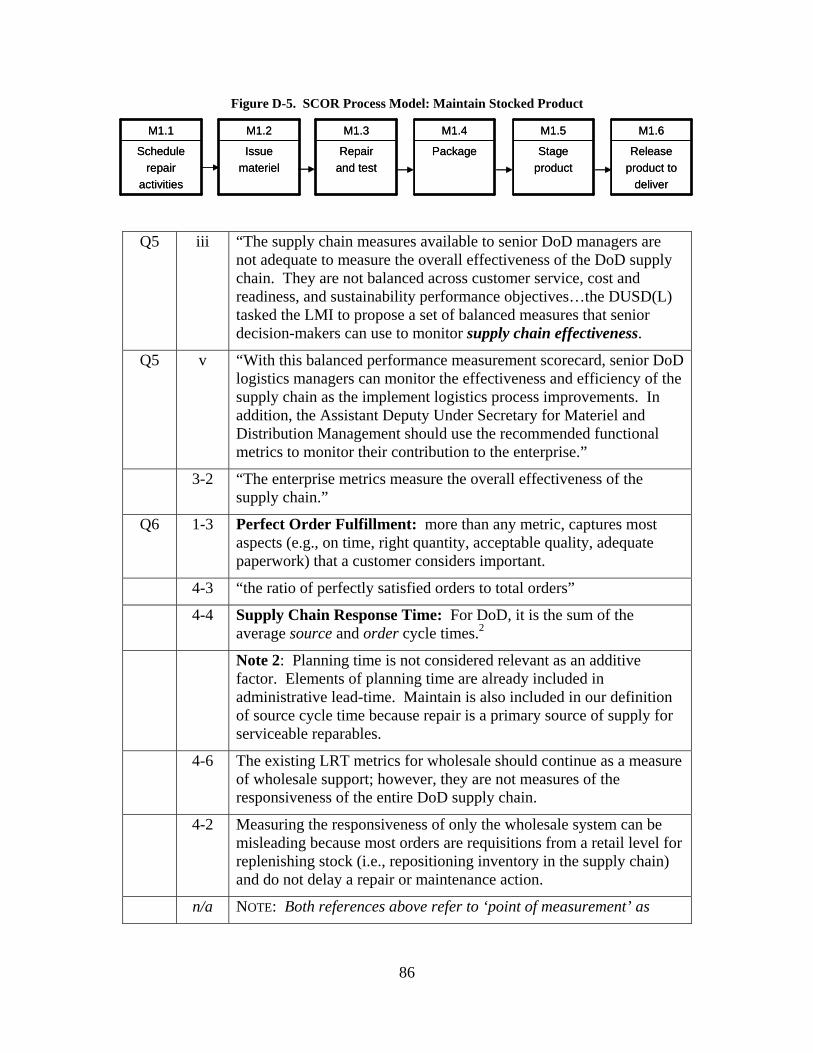
Figure D-5. SCOR Process Model: Maintain Stocked Product
Package
M1.4
Releaseproduct to
deliver
M1.6
Repairand test
M1.3
Schedulerepair
activities
M1.1
Issuemateriel
M1.2
Stageproduct
M1.5
Package
M1.4
Releaseproduct to
deliver
M1.6
Repairand test
M1.3
Schedulerepair
activities
M1.1
Issuemateriel
M1.2
Stageproduct
M1.5
Q5 iii “The supply chain measures available to senior DoD managers are not adequate to measure the overall effectiveness of the DoD supply chain. They are not balanced across customer service, cost and readiness, and sustainability performance objectives…the DUSD(L) tasked the LMI to propose a set of balanced measures that senior decision-makers can use to monitor supply chain effectiveness.
Q5 v “With this balanced performance measurement scorecard, senior DoD logistics managers can monitor the effectiveness and efficiency of the supply chain as the implement logistics process improvements. In addition, the Assistant Deputy Under Secretary for Materiel and Distribution Management should use the recommended functional metrics to monitor their contribution to the enterprise.”
3-2 “The enterprise metrics measure the overall effectiveness of the supply chain.”
Q6 1-3 Perfect Order Fulfillment: more than any metric, captures most aspects (e.g., on time, right quantity, acceptable quality, adequate paperwork) that a customer considers important.
4-3 “the ratio of perfectly satisfied orders to total orders”
4-4 Supply Chain Response Time: For DoD, it is the sum of the average source and order cycle times.2
Note 2: Planning time is not considered relevant as an additive factor. Elements of planning time are already included in administrative lead-time. Maintain is also included in our definition of source cycle time because repair is a primary source of supply for serviceable reparables.
4-6 The existing LRT metrics for wholesale should continue as a measure of wholesale support; however, they are not measures of the responsiveness of the entire DoD supply chain.
4-2 Measuring the responsiveness of only the wholesale system can be misleading because most orders are requisitions from a retail level for replenishing stock (i.e., repositioning inventory in the supply chain) and do not delay a repair or maintenance action.
n/a NOTE: Both references above refer to ‘point of measurement’ as
86
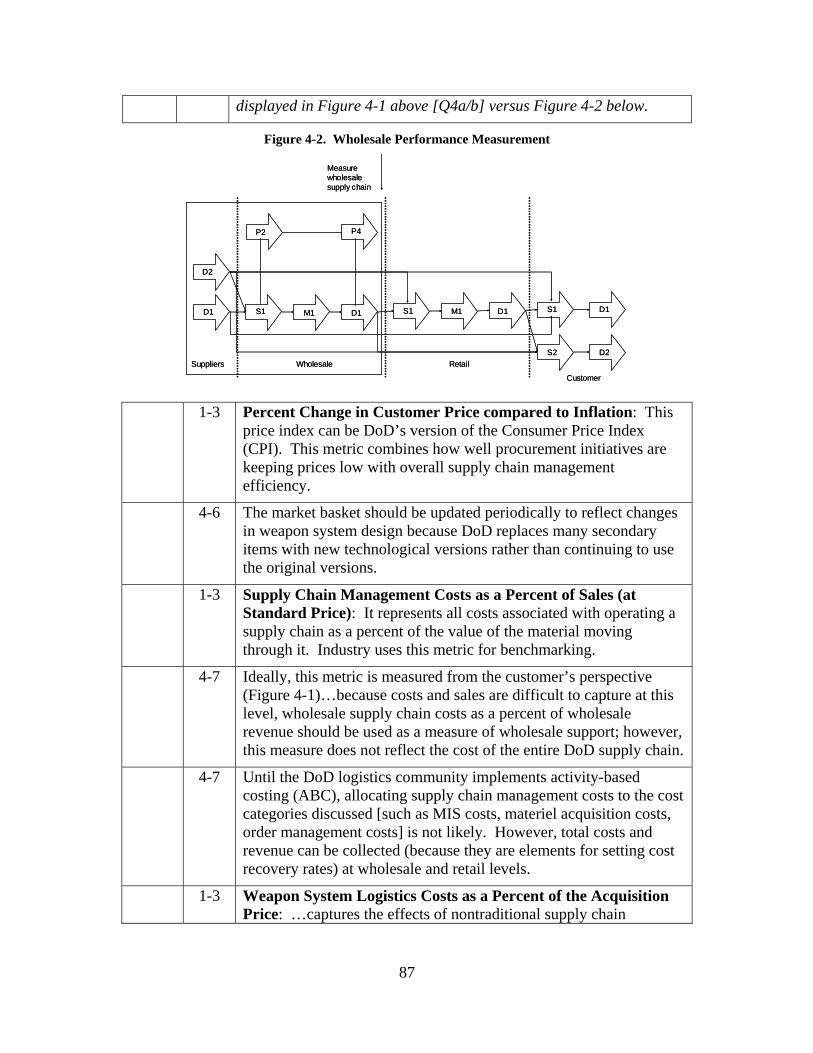
displayed in Figure 4-1 above [Q4a/b] versus Figure 4-2 below.
Figure 4-2. Wholesale Performance Measurement
D1
D2
P2
S1 M1 D1
P4
S1 M1 D1 S1 D1
D2S2Suppliers Wholesale Retail
Customer
Measurewholesalesupply chain
D1
D2
P2
S1 M1 D1
P4
S1 M1 D1 S1 D1
D2S2Suppliers Wholesale Retail
Customer
Measurewholesalesupply chain
1-3 Percent Change in Customer Price compared to Inflation: This price index can be DoD’s version of the Consumer Price Index (CPI). This metric combines how well procurement initiatives are keeping prices low with overall supply chain management efficiency.
4-6 The market basket should be updated periodically to reflect changes in weapon system design because DoD replaces many secondary items with new technological versions rather than continuing to use the original versions.
1-3 Supply Chain Management Costs as a Percent of Sales (at Standard Price): It represents all costs associated with operating a supply chain as a percent of the value of the material moving through it. Industry uses this metric for benchmarking.
4-7 Ideally, this metric is measured from the customer’s perspective (Figure 4-1)…because costs and sales are difficult to capture at this level, wholesale supply chain costs as a percent of wholesale revenue should be used as a measure of wholesale support; however, this measure does not reflect the cost of the entire DoD supply chain.
4-7 Until the DoD logistics community implements activity-based costing (ABC), allocating supply chain management costs to the cost categories discussed [such as MIS costs, materiel acquisition costs, order management costs] is not likely. However, total costs and revenue can be collected (because they are elements for setting cost recovery rates) at wholesale and retail levels.
1-3 Weapon System Logistics Costs as a Percent of the Acquisition Price: …captures the effects of nontraditional supply chain
87
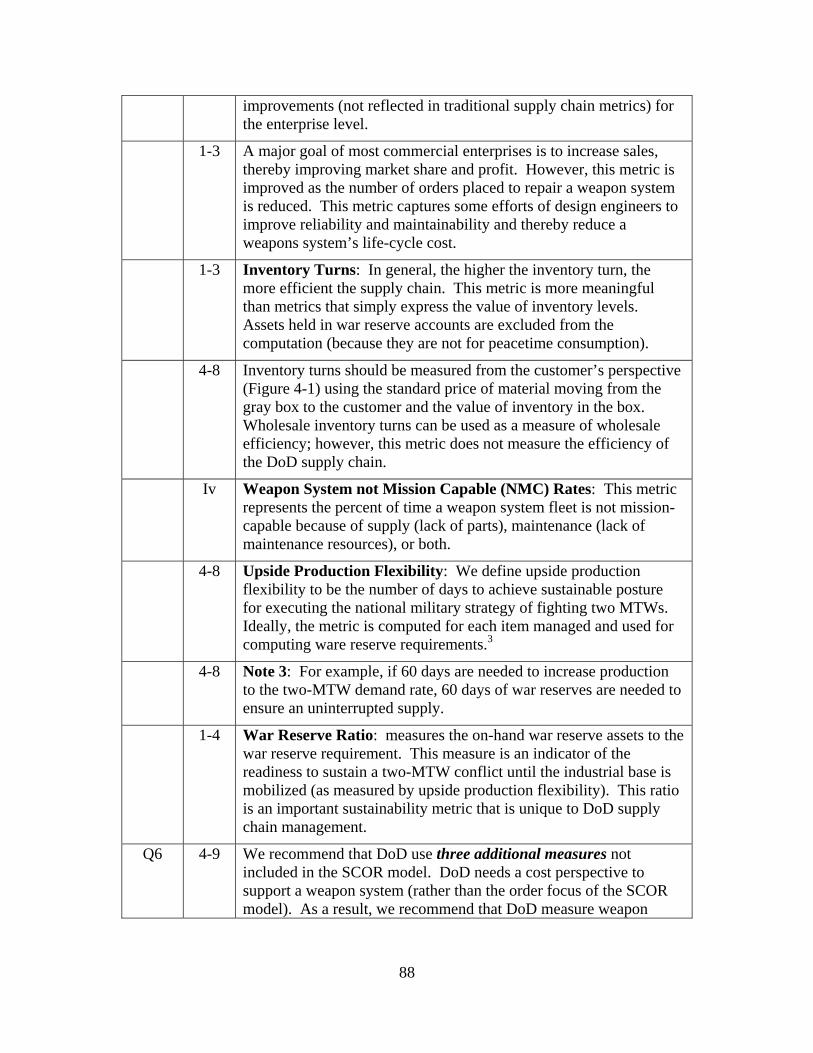
improvements (not reflected in traditional supply chain metrics) for the enterprise level.
1-3 A major goal of most commercial enterprises is to increase sales, thereby improving market share and profit. However, this metric is improved as the number of orders placed to repair a weapon system is reduced. This metric captures some efforts of design engineers to improve reliability and maintainability and thereby reduce a weapons system’s life-cycle cost.
1-3 Inventory Turns: In general, the higher the inventory turn, the more efficient the supply chain. This metric is more meaningful than metrics that simply express the value of inventory levels. Assets held in war reserve accounts are excluded from the computation (because they are not for peacetime consumption).
4-8 Inventory turns should be measured from the customer’s perspective (Figure 4-1) using the standard price of material moving from the gray box to the customer and the value of inventory in the box. Wholesale inventory turns can be used as a measure of wholesale efficiency; however, this metric does not measure the efficiency of the DoD supply chain.
Iv Weapon System not Mission Capable (NMC) Rates: This metric represents the percent of time a weapon system fleet is not mission-capable because of supply (lack of parts), maintenance (lack of maintenance resources), or both.
4-8 Upside Production Flexibility: We define upside production flexibility to be the number of days to achieve sustainable posture for executing the national military strategy of fighting two MTWs. Ideally, the metric is computed for each item managed and used for computing ware reserve requirements.3
4-8 Note 3: For example, if 60 days are needed to increase production to the two-MTW demand rate, 60 days of war reserves are needed to ensure an uninterrupted supply.
1-4 War Reserve Ratio: measures the on-hand war reserve assets to the war reserve requirement. This measure is an indicator of the readiness to sustain a two-MTW conflict until the industrial base is mobilized (as measured by upside production flexibility). This ratio is an important sustainability metric that is unique to DoD supply chain management.
Q6 4-9 We recommend that DoD use three additional measures not included in the SCOR model. DoD needs a cost perspective to support a weapon system (rather than the order focus of the SCOR model). As a result, we recommend that DoD measure weapon
88
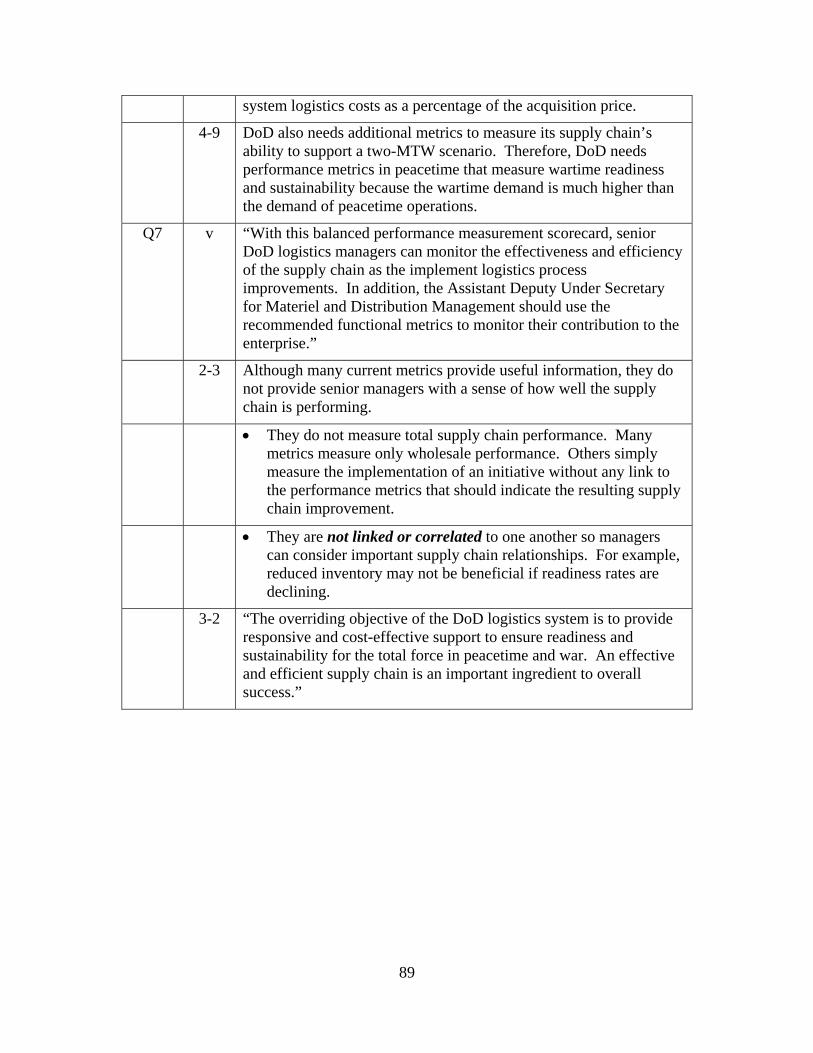
system logistics costs as a percentage of the acquisition price.
4-9 DoD also needs additional metrics to measure its supply chain’s ability to support a two-MTW scenario. Therefore, DoD needs performance metrics in peacetime that measure wartime readiness and sustainability because the wartime demand is much higher than the demand of peacetime operations.
Q7 v “With this balanced performance measurement scorecard, senior DoD logistics managers can monitor the effectiveness and efficiency of the supply chain as the implement logistics process improvements. In addition, the Assistant Deputy Under Secretary for Materiel and Distribution Management should use the recommended functional metrics to monitor their contribution to the enterprise.”
2-3 Although many current metrics provide useful information, they do not provide senior managers with a sense of how well the supply chain is performing.
• They do not measure total supply chain performance. Many metrics measure only wholesale performance. Others simply measure the implementation of an initiative without any link to the performance metrics that should indicate the resulting supply chain improvement.
• They are not linked or correlated to one another so managers can consider important supply chain relationships. For example, reduced inventory may not be beneficial if readiness rates are declining.
3-2 “The overriding objective of the DoD logistics system is to provide responsive and cost-effective support to ensure readiness and sustainability for the total force in peacetime and war. An effective and efficient supply chain is an important ingredient to overall success.”
89
Bibliography A.T. Kearney, Inc. Measuring and Improving Productivity in Physical Distribution.
Chicago: National Council of Physical Distribution Management, 1984.
Air Force Logistics Management Agency. Measuring the Health of USAF Supply. Report LS199929101. Maxwell AFB: AFLMA, January 2001.
Air Force Materiel Command. AFMC Supply Chain Metrics Guide. Wright-Patterson AFB: HQ AFMC, 25 November 2003.
Air Force Materiel Command. The Metrics Handbook. AFMC Pamphlet 90-102. Wright-Patterson AFB, OH: HQ AFMC, 1 May 1995.
Air Force Materiel Command. FY 2002 – FY 2009 Supply Management Mission Area Strategic Plan. Wright-Patterson AFB, OH: HQ AFMC, 11 January 2002.
Alasuutari, Pertti. Researching Culture: Qualitative Methods and Cultural Studies. London: Sage Publications, Inc., 1995.
Berg, Bruce L. Qualitative Research Methods for the Social Sciences (3rd Edition). Boston: Allyn & Bacon, 1998.
Blackerby, Phillip. “GPRA Strategic Planning: Start Here,” Armed Forces Comptroller Magazine, Vol. 39: 21-26 (Spring 1994)
Boland, Tony and Alan Fowler. “A Systems Perspective of Performance Management in Public Sector Organizations,” International Journal of Public Sector Management, Vol 13: 417-446 (2000).
Brewer, Peter C. and Thomas W. Speh. “Using the Balanced Scorecard to Measure Supply Chain Performance,” Journal of Business Logistics, Vol 21: 75-93 (2000)
Brunell, Tom. “Measuring the One That Got Away—Gauging SCM’s Benefits is Tricky When Most Have Yet to Implement It,” EBN, Issue 1254: 65 (19 March 2001)
Camm, Frank, and Leslie Lewis. Effective Treatment of Logistics Resource Issues in the Air Force Planning, Programming, and Budgeting System (PPBS) Process. RAND Project AIR FORCE, F49642-01-C-0003, MR-1611, 2003.
Committee on Governmental Affairs. Senate Committee on Government Affairs GPRA Report. 103d Congress, 1st Session, Report 103-58, 1993. Washington: OMB, 1993.
Creswell, John W. Research Design: Qualitative and Quantitative Approaches. Thousand Oaks, CA: Sage Publications, Inc., 1994.
90
Department of the Air Force. Air Force Basic Doctrine. AFDD 1. Washington: GPO, September 1997.
Department of the Air Force. Logistics Strategic Planning. AFPD 20-1. Washington: GPO, 22 April 1993.
Department of Defense. DoD Supply Chain Materiel Management Regulation. DOD Regulation 4140.1-R. Fort Belvoir, VA: DTIC, 23 May 2003.
-----. Department of Defense Dictionary of Military and Associated Terms. JP 1-02. Washington: GPO, 12 April 2001.
Eccles, Robert G. “The Performance Measurement Manifesto,” Harvard Business Review, 69: 131-137 (January-February 1991).
Eccles, Robert G. and Philip J. Pyburn. “Creating a Comprehensive System to Measure Performance,” Strategic Finance, Vol 74: 41-44 (October 1992).
Frigo, Mark L. “Strategy-Focused Performance Measures,” Strategic Finance, 83: 10-15 (September 2002).
Frost, Bob. Measuring Performance: Using the New Metrics to Deploy Strategy and Improve Performance. Dallas: Measurement International, 2000.
Governmental Accounting Standards Board. Concepts Statement No. 2, Service Efforts and Accomplishments Reporting. Washington: GASB, April 1994.
Heckman, James, Carolyn Heinrich, and Jeffery Smith. “Assessing the Performance of Performance Standards in Public Bureaucracies,” The American Economic Review, Vol 87:389-395 (May 1997).
Kaplan, Robert and David P. Norton. “The Balanced Scorecard—Measures that Drive Performance,” Harvard Business Review, Vol 70: 71-79 (January-February 1992).
-----. “Balance without Profit,” Financial Management, 23-26 (Jan 2001).
-----. “Strategic Learning & the Balanced Scorecard,” Strategy and Leadership, Vol 24: 19-24 (October 1996).
-----. “Using the Balanced Scorecard as a Strategic Management System,” Harvard Business Review, Vol 74: 75-85 (January-February 1996)
Lee, Thomas W. Using Qualitative Methods in Organizational Research. Thousand Oaks, CA: Sage Publications, Inc., 1999.
Leedy, Paul D. and Jeanne Ellis. Ormrod. Practical Research: Planning and Design (7th Edition). Upper Saddle River, NJ: Prentice Hall, Inc., 2001.
91
Logistics Management Institute. DoD Supply Chain Management Implementation Guide. McLean, VA: LMI, 2000.
-----. Logistics Functional Requirements Guide, Report LG806S2, August 1998.
-----. Supply Chain Management: A Recommended Performance Measurement Scorecard. McLean, VA: LMI, June 1999.
Manship, Wesley E. Capt. “Air Force Supply: Measures, Metrics and Health,” Today’s Logistics: Selected Readings and Analysis, Maxwell AFB, Gunter Annex, AL: AF Logistics Management Agency, 2001.
McAdam, Rodney and Brian Bailie. “Business performance measures and alignment impact on strategy: The role of business improvement models,” International Journal of Operations & Production Management, Vol 22:972-996 (2002).
Monczka, Robert M. Dr. and Jim Morgan. “What’s Wrong with Supply Chain Management?” Purchasing, Vol. 122: 69-72 (16 January 1997).
Neely, Andy, Mike Gregory, and Ken Platts. “Performance Measurement System Design,” International Journal of Operations & Production, Vol. 15: 80-117 (1995).
Niven, Paul R. Balanced Scorecard Step-by-Step for Government and Nonprofit Agencies. Hoboken, NJ: John Wiley & Sons, Inc, 2003.
Porter, Michael E. “What is Strategy?” Harvard Business Review, Vol 74: 61-78 (November-December 1996).
Porter, M. E. “The Importance of Being Strategic,” Balanced Scorecard Report. Boston: Harvard Business School Publishing Corporation (2002).
Provost, Lloyd, and Susan Leddick. “How to Take Multiple Measures to Get a Complete Picture of Organizational Performance,” National Productivity Review, Vol. 12: 477-490 (Autumn 1993).
Schiederman, Arthur M. “Why Balanced Scorecards Fail,” Journal of Strategic Performance Measurement, Special Edition: 6-11 (January 1999).
Silverman, David. Doing Qualitative Research: A Practical Handbook. London: Sage Publications, Inc., 2000.
Simchi-Levi, David, Philip Kaminsky, and Edith Simchi-Levi. Designing & Managing the Supply Chain. Singapore: McGraw-Hill Education, 2003.
Sink, D. Scott. “The Role of Measurement in Achieving World Class Quality and Productivity Management,” Industrial Engineering, Vol 26: 23-27 (June 1991).
92
Administrator
JOL rehash of official report above
Stephens, Scott. “Supply Chain Operations Reference Model Version 5.0: A New Tool to Improve Supply Chain Efficiency and Achieve Best Practices,” Information Systems Frontiers, Vol 3: 471.
Supply-Chain Council, Inc. Supply-Chain Operations Reference-model: Overview of SCOR Version 5.0. Pittsburgh: SCC, 2002.
United States General Accounting Office. Air Force Plans and Initiatives to Mitigate Spare Parts Shortages Need Better Implementation. GAO-03-706. Washington DC: GAO, June 2003.
United States General Accounting Office. Defense Inventory: Air Force Item Manager Views of Repair Parts Issues Consistent With Issues Reported in the Past. GAO-03-684R. Washington DC: GAO, May 2003.
United States General Accounting Office. The Department Needs a Focused Effort to Overcome Critical Spare Parts. GAO-03-707. Washington DC: GAO, June 2003.
United States General Accounting Office, Program Evaluation and Methodology Division. Case Study Evaluations. GAO/PEMD-91-10.1.9. Washington DC: GPO, November 1990.
Vector Research, Inc. Department of Defense Guide for Managing Information Technology (IT) as an Investment and Measuring Performance. Version 1.0, Arlington: Vector Research, Inc., 10 February 1997.
Yin, Robert K. Case Study Research: Design and Methods (3rd Edition). Thousand Oaks, CA: Sage Publications, Inc., 2003.
93
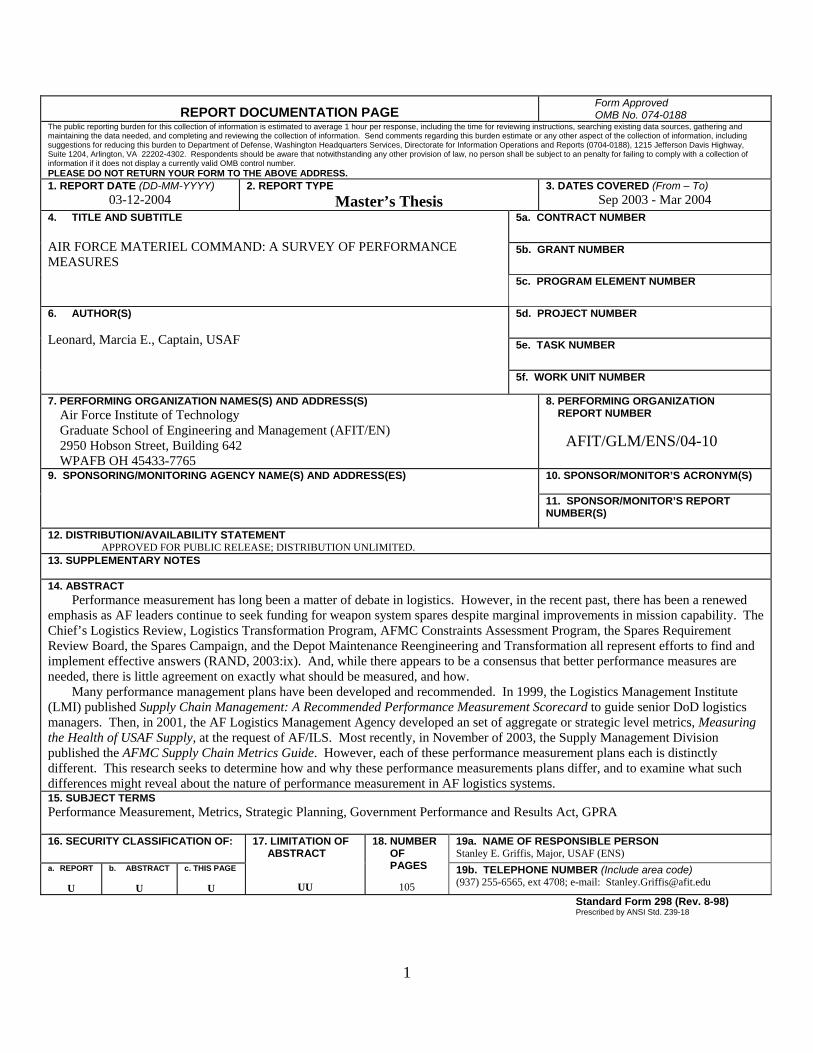
1
REPORT DOCUMENTATION PAGE Form Approved OMB No. 074-0188
The public reporting burden for this collection of information is estimated to average 1 hour per response, including the time for reviewing instructions, searching existing data sources, gathering and maintaining the data needed, and completing and reviewing the collection of information. Send comments regarding this burden estimate or any other aspect of the collection of information, including suggestions for reducing this burden to Department of Defense, Washington Headquarters Services, Directorate for Information Operations and Reports (0704-0188), 1215 Jefferson Davis Highway, Suite 1204, Arlington, VA 22202-4302. Respondents should be aware that notwithstanding any other provision of law, no person shall be subject to an penalty for failing to comply with a collection of information if it does not display a currently valid OMB control number. PLEASE DO NOT RETURN YOUR FORM TO THE ABOVE ADDRESS. 1. REPORT DATE (DD-MM-YYYY)
03-12-2004 2. REPORT TYPE
Master’s Thesis 3. DATES COVERED (From – To)
Sep 2003 - Mar 2004 5a. CONTRACT NUMBER
5b. GRANT NUMBER
4. TITLE AND SUBTITLE AIR FORCE MATERIEL COMMAND: A SURVEY OF PERFORMANCE MEASURES 5c. PROGRAM ELEMENT NUMBER
5d. PROJECT NUMBER 5e. TASK NUMBER
6. AUTHOR(S) Leonard, Marcia E., Captain, USAF 5f. WORK UNIT NUMBER
7. PERFORMING ORGANIZATION NAMES(S) AND ADDRESS(S) Air Force Institute of Technology Graduate School of Engineering and Management (AFIT/EN) 2950 Hobson Street, Building 642 WPAFB OH 45433-7765
8. PERFORMING ORGANIZATION REPORT NUMBER AFIT/GLM/ENS/04-10
10. SPONSOR/MONITOR’S ACRONYM(S)
9. SPONSORING/MONITORING AGENCY NAME(S) AND ADDRESS(ES) 11. SPONSOR/MONITOR’S REPORT
NUMBER(S)
12. DISTRIBUTION/AVAILABILITY STATEMENT APPROVED FOR PUBLIC RELEASE; DISTRIBUTION UNLIMITED.
13. SUPPLEMENTARY NOTES 14. ABSTRACT
Performance measurement has long been a matter of debate in logistics. However, in the recent past, there has been a renewed emphasis as AF leaders continue to seek funding for weapon system spares despite marginal improvements in mission capability. The Chief’s Logistics Review, Logistics Transformation Program, AFMC Constraints Assessment Program, the Spares Requirement Review Board, the Spares Campaign, and the Depot Maintenance Reengineering and Transformation all represent efforts to find and implement effective answers (RAND, 2003:ix). And, while there appears to be a consensus that better performance measures are needed, there is little agreement on exactly what should be measured, and how.
Many performance management plans have been developed and recommended. In 1999, the Logistics Management Institute (LMI) published Supply Chain Management: A Recommended Performance Measurement Scorecard to guide senior DoD logistics managers. Then, in 2001, the AF Logistics Management Agency developed an set of aggregate or strategic level metrics, Measuring the Health of USAF Supply, at the request of AF/ILS. Most recently, in November of 2003, the Supply Management Division published the AFMC Supply Chain Metrics Guide. However, each of these performance measurement plans each is distinctly different. This research seeks to determine how and why these performance measurements plans differ, and to examine what such differences might reveal about the nature of performance measurement in AF logistics systems. 15. SUBJECT TERMS Performance Measurement, Metrics, Strategic Planning, Government Performance and Results Act, GPRA
16. SECURITY CLASSIFICATION OF: 19a. NAME OF RESPONSIBLE PERSON Stanley E. Griffis, Major, USAF (ENS)
a. REPORT
U
b. ABSTRACT
U
c. THIS PAGE
U
17. LIMITATION OF ABSTRACT
UU
18. NUMBER OF PAGES
105 19b. TELEPHONE NUMBER (Include area code) (937) 255-6565, ext 4708; e-mail: [email protected]
Standard Form 298 (Rev. 8-98) Prescribed by ANSI Std. Z39-18
Related Documents