Air based atmospheric pressure plasma jet removal of FreKote 710-NC prior to composite-to-composite adhesive bonding Victor J. Law, Joseph Mohan, Feidhlim T. O’Neill, Alojz Ivankovic, Denis P. Dowling n School Mechanical and Materials Engineering, University College Dublin, Belfield, Dublin 4, Ireland article info Article history: Accepted 20 April 2014 Available online 9 May 2014 Keywords: Atmospheric plasma jet Composite Thermal measurement Adhesive bonding Lap-shear pull test abstract This paper evaluates the use of an air based atmospheric pressure plasma jet for the activation of carbon fibre epoxy composites. In addition the performance of the jet in the removal of a 5–8 nm thick layer of FreKote 710-NC from the composite surface prior to heat-cured epoxy adhesive bonding was also investigated. The plasma treated composites were examined using thermal infra-red imaging, WCA, profilometry and SEM. A reflectance-IR technique was used to monitor the removal of FreKote as well as changes in the functional chemistry of the plasma treated composite surface. The optimised plasma pre- treatment conditions were identified which help to maximise composite-to-composite adhesive bond strength based on LST. This involved a treatment at a 14 mm nozzle to composite distance and scan rate of 30 mm/s. The air plasma process was bench marked against a manual methanol solvent wipe process, for the removal of FreKote. Both the plasma and the solvent wipe treatments yielded similar composite to composite bond strengths, demonstrating that both were successful in the removal of the FreKote. A comparison was also made between the plasma treated composite and a composite which had been grit blasted using 50 μm aluminium oxide grit. A 7% enhancement in lap-shear strength was achieved with the plasma treatment compared to grit blasting. & 2014 Elsevier Ltd. All rights reserved. 1. Introduction Over the last 60 years military and commercial aircraft manu- factures have steadily replaced traditional heavier metal materials using lightweight carbon composites. More recently there has been a more rapid increase in the rate of composite usage particularly in the aerospace, wind and marine sectors, with a 4–5 fold increase between 1985 and 2012 alone [1]. The major advantage of incorporating composites being weight reduction, thereby increasing fuel efficiency and thus decreased environ- mental pollution [2], designers are considering the use of compo- sites in ever increasingly critical parts of the aircraft. Composites have a number of disadvantages however particularly associated with applications in the aerospace, wind and marine sectors, some of which are (a) high raw material, fabrication and assembly costs; (b) anisotropic strength (i.e. in-plane and out-of-plane strength); (c) susceptibility to delamination due to temperature cycling, surface moisture ingress and chemical attack; (d) manufacturing defects. If there is chemical contamination of a surface prior to adhesive bonding of the composite it can significantly reduce the resultant bond strength of a joint due to the incorporation of interfacial defects [3], or incorrect curing, both of which can result in the failure of the bond under critical stress conditions. Even under strict assembly protocols an assortment of organic and inorganic surface contaminates may be present. These include, but are not limited to contaminants from the manufacturing process such as mould release agents [4,5], lubricants, rubber and silicon based synthetic adhesives from pressure sensitive tapes; as well as accidental contaminates from human handling, for example fin- gerprints [6] and barrier hand creams. FreKote, a widely used mould release agents, is the subject of the present work. In a manufacturing environment, it is quite possible for a composite part to be contaminated with FreKote prior to adhesive bonding. This would clearly have a detrimental effect on any subsequent adhesive bonding operation. This type of contamination (i.e., after the part has been cured) would not be as difficult to remove as if FreKote had been transferred from the mould to the part during the curing operation, as is normally the case. However, it repre- sents a starting point for investigating the jet for contamination removal. The manual cleaning of these contaminants may usually involve grit-blasting, acid etch or wiping the contaminated surface with non-chlorinated solvent (i.e. methanol) or indeed corona discharge [7,8]. Recently a reel-to-reel atmospheric pressure dielectric barrier (DBD) discharge reactor has been used to treat Contents lists available at ScienceDirect journal homepage: www.elsevier.com/locate/ijadhadh International Journal of Adhesion & Adhesives http://dx.doi.org/10.1016/j.ijadhadh.2014.05.001 0143-7496/& 2014 Elsevier Ltd. All rights reserved. n Corresponding author. E-mail address: [email protected] (D.P. Dowling). International Journal of Adhesion & Adhesives 54 (2014) 72–81

Welcome message from author
This document is posted to help you gain knowledge. Please leave a comment to let me know what you think about it! Share it to your friends and learn new things together.
Transcript
Air based atmospheric pressure plasma jet removal of FreKote 710-NCprior to composite-to-composite adhesive bonding
Victor J. Law, Joseph Mohan, Feidhlim T. O’Neill, Alojz Ivankovic, Denis P. Dowling n
School Mechanical and Materials Engineering, University College Dublin, Belfield, Dublin 4, Ireland
a r t i c l e i n f o
Article history:Accepted 20 April 2014Available online 9 May 2014
Keywords:Atmospheric plasma jetCompositeThermal measurementAdhesive bondingLap-shear pull test
a b s t r a c t
This paper evaluates the use of an air based atmospheric pressure plasma jet for the activation of carbonfibre epoxy composites. In addition the performance of the jet in the removal of a 5–8 nm thick layer ofFreKote 710-NC from the composite surface prior to heat-cured epoxy adhesive bonding was alsoinvestigated. The plasma treated composites were examined using thermal infra-red imaging, WCA,profilometry and SEM. A reflectance-IR technique was used to monitor the removal of FreKote as well aschanges in the functional chemistry of the plasma treated composite surface. The optimised plasma pre-treatment conditions were identified which help to maximise composite-to-composite adhesive bondstrength based on LST. This involved a treatment at a 14 mm nozzle to composite distance and scan rateof 30 mm/s. The air plasma process was bench marked against a manual methanol solvent wipe process,for the removal of FreKote. Both the plasma and the solvent wipe treatments yielded similar compositeto composite bond strengths, demonstrating that both were successful in the removal of the FreKote.A comparison was also made between the plasma treated composite and a composite which had beengrit blasted using 50 μm aluminium oxide grit. A 7% enhancement in lap-shear strength was achievedwith the plasma treatment compared to grit blasting.
& 2014 Elsevier Ltd. All rights reserved.
1. Introduction
Over the last 60 years military and commercial aircraft manu-factures have steadily replaced traditional heavier metal materialsusing lightweight carbon composites. More recently there hasbeen a more rapid increase in the rate of composite usageparticularly in the aerospace, wind and marine sectors, with a4–5 fold increase between 1985 and 2012 alone [1]. The majoradvantage of incorporating composites being weight reduction,thereby increasing fuel efficiency and thus decreased environ-mental pollution [2], designers are considering the use of compo-sites in ever increasingly critical parts of the aircraft. Compositeshave a number of disadvantages however particularly associatedwith applications in the aerospace, wind and marine sectors, someof which are (a) high raw material, fabrication and assembly costs;(b) anisotropic strength (i.e. in-plane and out-of-plane strength);(c) susceptibility to delamination due to temperature cycling,surface moisture ingress and chemical attack; (d) manufacturingdefects. If there is chemical contamination of a surface prior toadhesive bonding of the composite it can significantly reduce the
resultant bond strength of a joint due to the incorporation ofinterfacial defects [3], or incorrect curing, both of which can resultin the failure of the bond under critical stress conditions. Evenunder strict assembly protocols an assortment of organic andinorganic surface contaminates may be present. These include, butare not limited to contaminants from the manufacturing processsuch as mould release agents [4,5], lubricants, rubber and siliconbased synthetic adhesives from pressure sensitive tapes; as well asaccidental contaminates from human handling, for example fin-gerprints [6] and barrier hand creams. FreKote, a widely usedmould release agents, is the subject of the present work. In amanufacturing environment, it is quite possible for a compositepart to be contaminated with FreKote prior to adhesive bonding.This would clearly have a detrimental effect on any subsequentadhesive bonding operation. This type of contamination (i.e., afterthe part has been cured) would not be as difficult to remove as ifFreKote had been transferred from the mould to the part duringthe curing operation, as is normally the case. However, it repre-sents a starting point for investigating the jet for contaminationremoval. The manual cleaning of these contaminants may usuallyinvolve grit-blasting, acid etch or wiping the contaminated surfacewith non-chlorinated solvent (i.e. methanol) or indeed coronadischarge [7,8]. Recently a reel-to-reel atmospheric pressuredielectric barrier (DBD) discharge reactor has been used to treat
Contents lists available at ScienceDirect
journal homepage: www.elsevier.com/locate/ijadhadh
International Journal of Adhesion & Adhesives
http://dx.doi.org/10.1016/j.ijadhadh.2014.05.0010143-7496/& 2014 Elsevier Ltd. All rights reserved.
n Corresponding author.E-mail address: [email protected] (D.P. Dowling).
International Journal of Adhesion & Adhesives 54 (2014) 72–81

composite prepreg in an attempt to improve the fracture tough-ness of co-cured joint systems [9], along with the development ofreal-time monitoring [10]. However the DBD design does notprovide sufficient flexibility for processing of 3-dementionalcomposite structures.
Atmospheric pressure plasma linear-beam design jets that usehelium as the carrier gas have also been used to treat composites[11–13]. These helium jets are a close analogue to the air based jetsas they produce a high concentration of oxygen radicals but theyuse high cost non-renewable gas resource. Admixtures of oxygenor the use of argon as the carrier gas largely mitigate the heliumuse consumption.
In this study the use of atmospheric pressure air plasma jet isinvestigated as a means of removing organic contaminants fromthe surface of composites prior to adhesive bonding – theobjective being to determine the effectiveness of the plasmacleaning treatment of the contaminated composites on the result-ing adhesive bond strength. A critical issue is to determine theconditions for the successful removal of the contaminant whileavoiding thermal damage of the composite surfaces. Previousstudies have investigated the use of air plasmas for the activationof temperature sensitive polymers prior to adhesive bonding[14–16] and textile polymer treatment [17]. The effect of theplasma is to bombard the surface with free radicals, electronsand ions resulting in the decomposition of organic molecules withlower-molecular-weight polymer chains that can vaporise off(ablate) from the surface.
A close analogue to atmospheric pressure plasma (APPJ) isflame treatment of composites, to this extent the U.S. Departmentof Transportation Federal Aviation Administration has reported theflammability of composites [18] and Stoik has investigated non-destructive terahertz time-domain spectrometry for analysis offlame burnt composites [18]. In addition the used moving flame[7,19] for improving the adhesive bonding characteristics ofcomposite has been studied. In these three publications the sur-face temperatures were above the glass transition (Tg) for a fewminutes to a few hours in the range of 400–900 1C. It was foundthat resin decomposition and outgassing of trapped volatile gaseslead to swelling of the composites material. Composite damagedue to long-term thermo-oxidation has also been reported byTsotsis [20] and Wolfrum [21]. In their experiments compositesamples were exposed to temperatures of 117 1C for 10,000 h andit was found that due to an oxidative diffusion process thatultimately delamination failure occurred between the resin andthe underlying weave.
These flame and thermal studies have generally focused onthermal exposure times of between less than 1 h, to hundreds ofhours; in contrast this work focused on air plasmas treatmenttimes of o2 s. The goal of this study is for the first time toevaluate the effectiveness of plasma cleaning/removal of a mouldrelease ‘contaminant’ from a carbon fibre composite surface. Theeffectiveness of the air plasma treatment is based on evaluatingthe surface temperature, changes in functional chemistry at thesurface and also lap-shear strength of the bonded joint.
2. Experimental section
2.1. Materials
Composite – the composite is a Hexplys 8552/5H Aerospacegrade prepreg that consists of 5-harness carbon fibre (AS4) weavepre-impregnated with a toughened epoxy resin. The cured com-posite laminate has a dry glass temperature of Tg¼200 1C [22].A total of 48 composite coupons were prepared for the plasma
cleaning and the subsequent lap-shear test (LST). The 2 mm thickcomposite laminate was cut into test samples 100 mm long�25 mm – after cutting the edges of these samples were de-burredand then washed in flowing water to remove loose fibres, andfinally washed in methanol followed by air jet drying.
FreKote 710-NC is produced by Henkel [23] and is widely usedas semi-permanent mould release agent. The compound is asolvent base polymeric transparent liquid that contains a highlyelastic and transparent silicone elastomer – polydimethylsiloxane(PDMS). The PDMS elastomer has a long silicon–oxygen–siliconbackbone with side-branched carbon atoms that are fully satu-rated with hydrogen atoms and terminated with trimethylsiloxy(Me3SiO) groups [24]. Upon room temperature air curing (60 min)there is a loss of light molecular solvents from FreKote leading to achange in the compound hydrophobicity and fluid propertieswhen applied to a surface [25] – it is these properties that makeFreKote act as a semi-permanent release agent. This wiped thick-ness (3–8 nm: averaged over 25 sampling points) was determinedusing spectroscopic ellipsometry (J. A Woollam M-200F1 system)based on FreKote wiped silicon wafers. Because of the difference inwetting and absorption behaviour of silicon, the thickness estima-tion may be considered to be at the upper limit on the composite.
For test groups 4–8 FreKotes were wiped onto the compositesurface using an aerospace grade cleanroom packaged lint-freecloth obtained from PT technologies Europe. In the case of testgroup wipes 5, methanol (499.8% pure as supplied by Sigma-Aldrich) was used to clean the FreKote wiped surface after plasmatreatment and prior to adhesive bonding.
Aerospace grade FM 300 film adhesive was obtained fromCytec Engineered Materials and was used to bond the lap-shearjoints, the bonded area was 25�25 mm2. The joints where pressand heat-cured using the following temperature and pressureconditions: 2 h ramp up to 177 1C and held there for 1 h under45 psig and then allowed to cool overnight before the LST wasperformed. Once cooled the bond line thickness of the adhesivewas measured (0.270.002 mm) after which the bonded jointswere cleaned, and labelled prior to the destructive LST.
The composite test samples were divided into 8 groups eachcontaining 6 coupons, and these were treated with either of thefollowing two protocols:
1. 5–8 nm film of FreKote 710-NC was applied onto the compositesurface by wiping using the lint-free cloth. The treated compo-sites were then air cured for 1 h then plasma treated. Prior toadhesive bond tests the water contact angle (WCA) of thetreated surface were measured.
2. 5–8 nm layer of FreKote 710-NC was applied and immediatelyafter the application of this ‘fresh’ FreKote layer the surface wasplasma treated.
2.2. Surface treatment equipment
2.2.1. Atmospheric pressure plasma jetThe atmospheric plasma treatment was carried out using the
PlasmaTreat™ Open air atmospheric plasma system [13–16,26–28].This jet system is an example of the blown arc type and uses dryand filtered compressed air as the ionised working gas at apressure of 700–300 mbar. For a fixed air pressure of 3000 mbar(76.6 l/min) the 5 mm diameter nozzle used produced a force ofapproximately 6 N (6 kg m/s2). Previous optical emission spectro-scopy (OES) studies of arc have shown a nitrogen rotational gastemperature of 1700 K [26–29]. Thermal and spectroscopic ima-gings of the discharge have also shown that the discharge flux andtemperature decrease with afterglow axial distance, whilst thethermal diameter has a Gaussian temperature profile which can
V.J. Law et al. / International Journal of Adhesion & Adhesives 54 (2014) 72–81 73
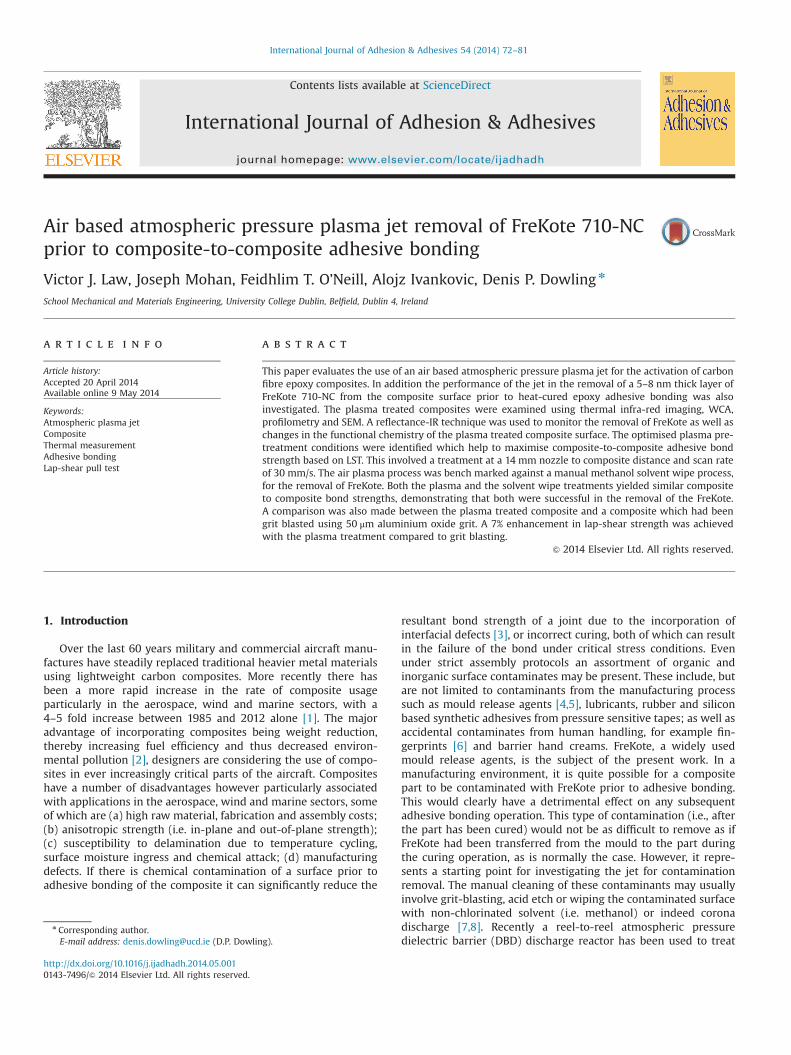
extend up to 40 mm [25]. In this work the PlasmaTreat parametersselected were treatment frequency 23 kHz, 80% voltage, 80%plasma cycle time (PCT) and 3000 mbar air pressure. The PCTprovides a measure of the plasma electrical power [28]. A plasmajet scan rate of 30 mm/s with a step size of 2 mm is used to applythe cleaning treatment to the composite surface. The cleaningexperiments were performed over a fixed nozzle to surface gapdistance ranges of 19, 16 and 14 mm; photographs of these threeplasma treatments are shown in Fig. 1. The photographs show howthe plasma plume interacts and conforms to the composite surfaceas the gap distance is decreased. The plasma expands out radiallyover the surface with decreasing gap distance, with the result thatthere is an increase in treatment area per pass.
2.2.2. Grit blastingIn this work, a comparison is made between the air plasma
treated composite surfaces and grit blast treated surfaces. The gritblasting was carried out using 50 mm grit aluminium oxide, at a jetnozzle to substrate height of 11.5 cm, a scan rate of 12 cm/s (stepsize was set to one half of the wide of the blast width) and apressure of 621 kPa (90 psi). This process was used as it could becompared and contrasted with reference [8]. Six composite cou-pons were grit blasted using a microblasting system as describedpreviously [30,31]. The microblasting jet was mounted on a CNCrobotic. After grit blasting, the coupons were ultrasonicallycleaned and air dried. The dried coupons yielded a water contactangle of 53–591.
2.3. Materials analysis
2.3.1. Infrared thermal tomographyInfrared thermal imaging of the composite surface during
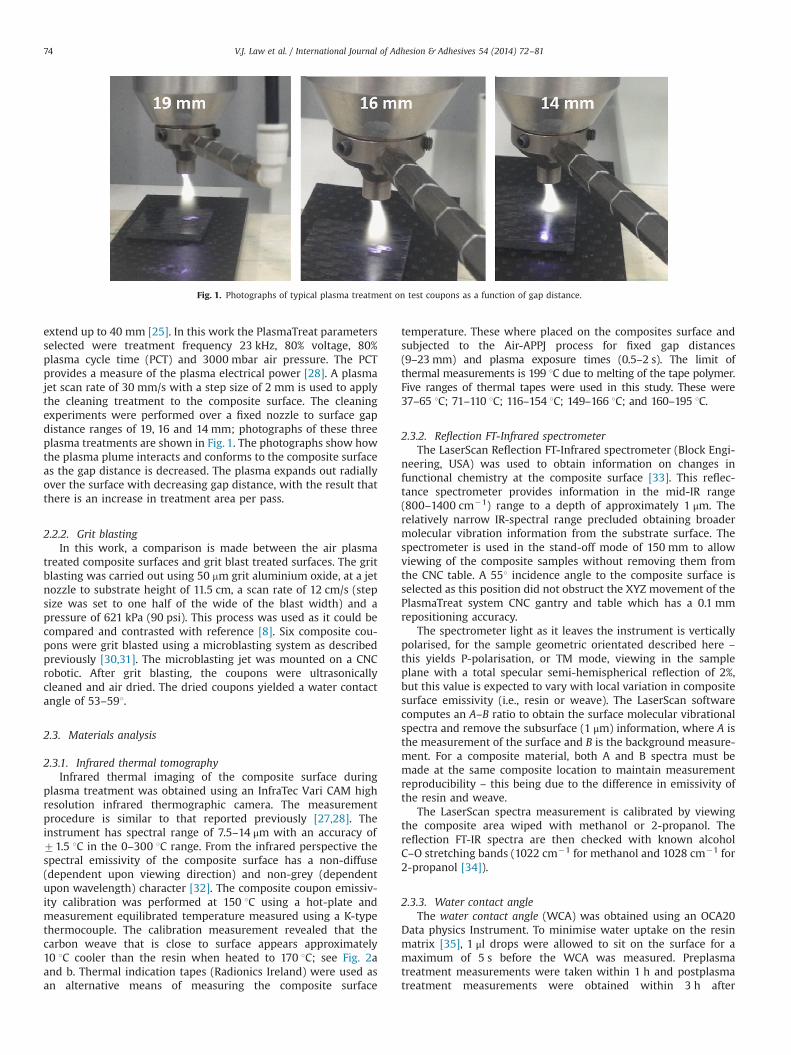
plasma treatment was obtained using an InfraTec Vari CAM highresolution infrared thermographic camera. The measurementprocedure is similar to that reported previously [27,28]. Theinstrument has spectral range of 7.5–14 μm with an accuracy of71.5 1C in the 0–300 1C range. From the infrared perspective thespectral emissivity of the composite surface has a non-diffuse(dependent upon viewing direction) and non-grey (dependentupon wavelength) character [32]. The composite coupon emissiv-ity calibration was performed at 150 1C using a hot-plate andmeasurement equilibrated temperature measured using a K-typethermocouple. The calibration measurement revealed that thecarbon weave that is close to surface appears approximately10 1C cooler than the resin when heated to 170 1C; see Fig. 2aand b. Thermal indication tapes (Radionics Ireland) were used asan alternative means of measuring the composite surface
temperature. These where placed on the composites surface andsubjected to the Air-APPJ process for fixed gap distances(9–23 mm) and plasma exposure times (0.5–2 s). The limit ofthermal measurements is 199 1C due to melting of the tape polymer.Five ranges of thermal tapes were used in this study. These were37–65 1C; 71–110 1C; 116–154 1C; 149–166 1C; and 160–195 1C.
2.3.2. Reflection FT-Infrared spectrometerThe LaserScan Reflection FT-Infrared spectrometer (Block Engi-
neering, USA) was used to obtain information on changes infunctional chemistry at the composite surface [33]. This reflec-tance spectrometer provides information in the mid-IR range(800–1400 cm�1) range to a depth of approximately 1 μm. Therelatively narrow IR-spectral range precluded obtaining broadermolecular vibration information from the substrate surface. Thespectrometer is used in the stand-off mode of 150 mm to allowviewing of the composite samples without removing them fromthe CNC table. A 551 incidence angle to the composite surface isselected as this position did not obstruct the XYZ movement of thePlasmaTreat system CNC gantry and table which has a 0.1 mmrepositioning accuracy.
The spectrometer light as it leaves the instrument is verticallypolarised, for the sample geometric orientated described here –
this yields P-polarisation, or TM mode, viewing in the sampleplane with a total specular semi-hemispherical reflection of 2%,but this value is expected to vary with local variation in compositesurface emissivity (i.e., resin or weave). The LaserScan softwarecomputes an A–B ratio to obtain the surface molecular vibrationalspectra and remove the subsurface (1 μm) information, where A isthe measurement of the surface and B is the background measure-ment. For a composite material, both A and B spectra must bemade at the same composite location to maintain measurementreproducibility – this being due to the difference in emissivity ofthe resin and weave.
The LaserScan spectra measurement is calibrated by viewingthe composite area wiped with methanol or 2-propanol. Thereflection FT-IR spectra are then checked with known alcoholC–O stretching bands (1022 cm�1 for methanol and 1028 cm�1 for2-propanol [34]).
2.3.3. Water contact angleThe water contact angle (WCA) was obtained using an OCA20
Data physics Instrument. To minimise water uptake on the resinmatrix [35], 1 μl drops were allowed to sit on the surface for amaximum of 5 s before the WCA was measured. Preplasmatreatment measurements were taken within 1 h and postplasmatreatment measurements were obtained within 3 h after
Fig. 1. Photographs of typical plasma treatment on test coupons as a function of gap distance.
V.J. Law et al. / International Journal of Adhesion & Adhesives 54 (2014) 72–8174
treatment and at 5 days. These measurements were carried out toprovide a comparative measurement of the surface treatment, andnot to provide a means of surface energy measurement or find therate of hydrophobic recovery [36]. Each WCA value presented hereis based on at least three measurements at different points on thesample. Hence, no advancing and receding WCA measurementswere made.
2.3.4. Scanning electron microscope imagesScanning electron microscope (SEM) images of the composite
surfaces were obtained using a dual-beam FEI™ Quanta 3D FEGsystem. Before viewing the composite samples were gold sputtercoated to reduce charging effects. A Taylor Hobson Talysurf contactprofilometer measurement was used to obtain the line profile ofthe variation in surface height.
2.3.5. Lap-shear testComposite-to-composite lap-shear strength was assessed using
an Instron 8502 servo-hydraulic tensile test machine employingBluehill software. The lap-shear test (LST) were conducted in accor-dance with the ASTM D5868-01 test protocol [37]. The lap-shearstrength in megapascals (MPa) of the bonded joints was defined asthe peak load divided by the overlap area (25�25 mm2).
3. Results and discussion
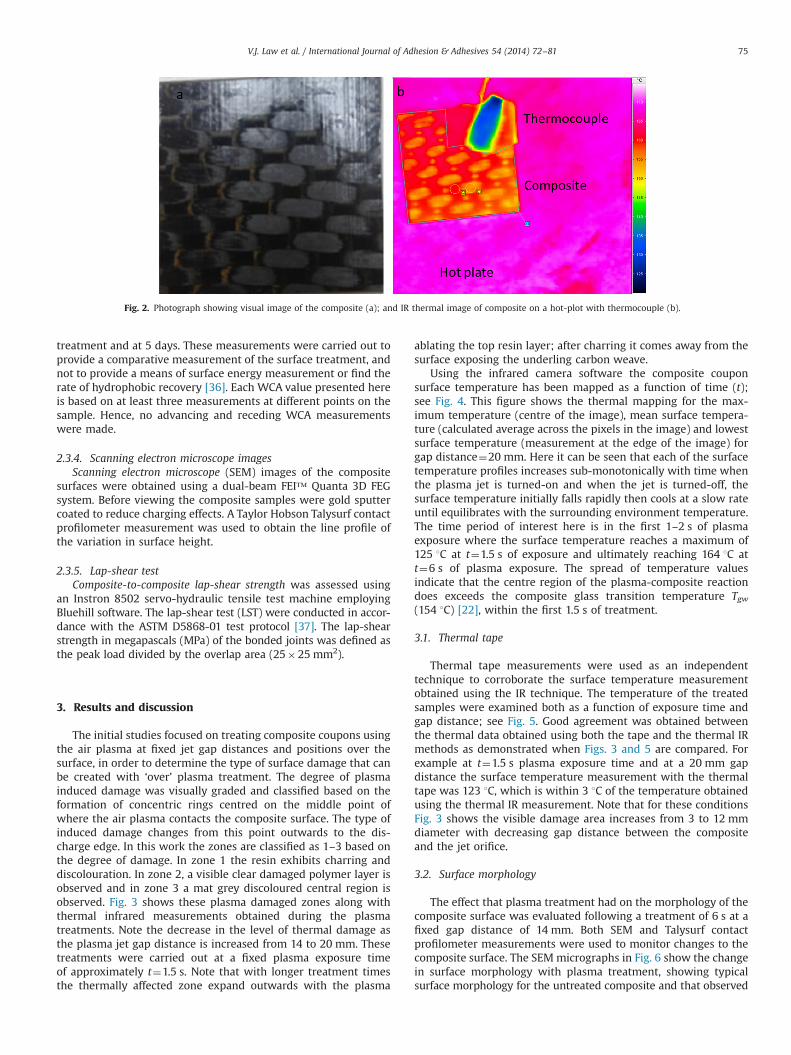
The initial studies focused on treating composite coupons usingthe air plasma at fixed jet gap distances and positions over thesurface, in order to determine the type of surface damage that canbe created with ‘over’ plasma treatment. The degree of plasmainduced damage was visually graded and classified based on theformation of concentric rings centred on the middle point ofwhere the air plasma contacts the composite surface. The type ofinduced damage changes from this point outwards to the dis-charge edge. In this work the zones are classified as 1–3 based onthe degree of damage. In zone 1 the resin exhibits charring anddiscolouration. In zone 2, a visible clear damaged polymer layer isobserved and in zone 3 a mat grey discoloured central region isobserved. Fig. 3 shows these plasma damaged zones along withthermal infrared measurements obtained during the plasmatreatments. Note the decrease in the level of thermal damage asthe plasma jet gap distance is increased from 14 to 20 mm. Thesetreatments were carried out at a fixed plasma exposure timeof approximately t¼1.5 s. Note that with longer treatment timesthe thermally affected zone expand outwards with the plasma
ablating the top resin layer; after charring it comes away from thesurface exposing the underling carbon weave.
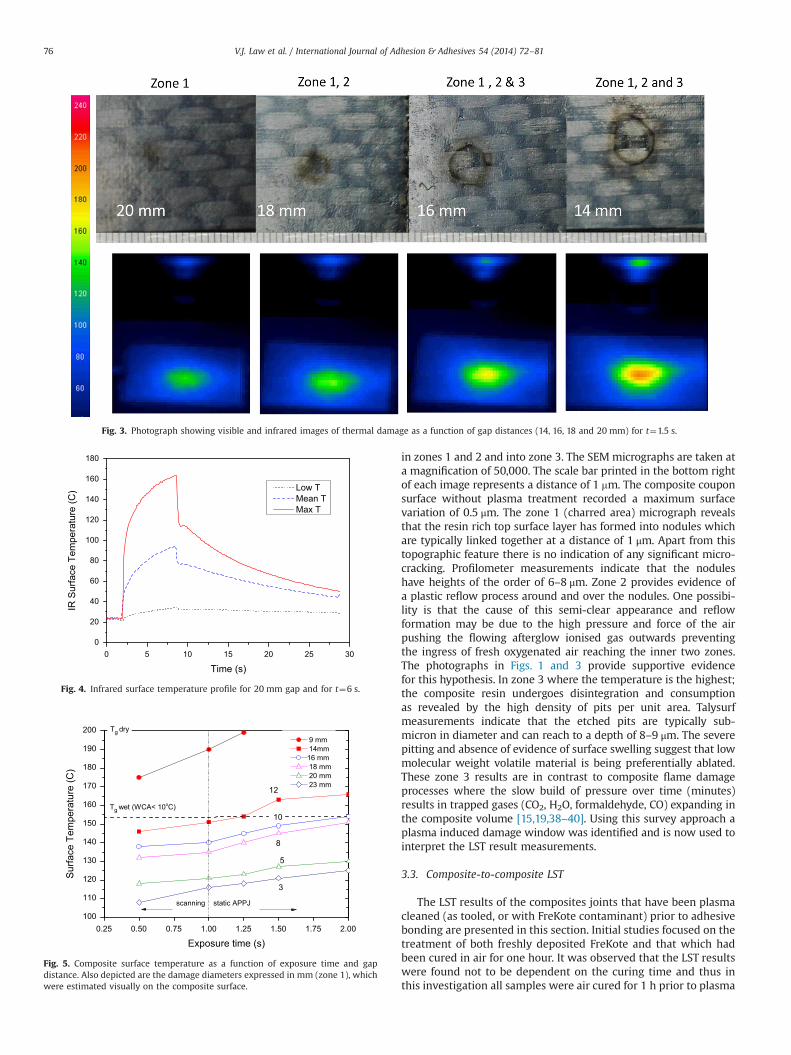
Using the infrared camera software the composite couponsurface temperature has been mapped as a function of time (t);see Fig. 4. This figure shows the thermal mapping for the max-imum temperature (centre of the image), mean surface tempera-ture (calculated average across the pixels in the image) and lowestsurface temperature (measurement at the edge of the image) forgap distance¼20 mm. Here it can be seen that each of the surfacetemperature profiles increases sub-monotonically with time whenthe plasma jet is turned-on and when the jet is turned-off, thesurface temperature initially falls rapidly then cools at a slow rateuntil equilibrates with the surrounding environment temperature.The time period of interest here is in the first 1–2 s of plasmaexposure where the surface temperature reaches a maximum of125 1C at t¼1.5 s of exposure and ultimately reaching 164 1C att¼6 s of plasma exposure. The spread of temperature valuesindicate that the centre region of the plasma-composite reactiondoes exceeds the composite glass transition temperature Tgw(154 1C) [22], within the first 1.5 s of treatment.
3.1. Thermal tape
Thermal tape measurements were used as an independenttechnique to corroborate the surface temperature measurementobtained using the IR technique. The temperature of the treatedsamples were examined both as a function of exposure time andgap distance; see Fig. 5. Good agreement was obtained betweenthe thermal data obtained using both the tape and the thermal IRmethods as demonstrated when Figs. 3 and 5 are compared. Forexample at t¼1.5 s plasma exposure time and at a 20 mm gapdistance the surface temperature measurement with the thermaltape was 123 1C, which is within 3 1C of the temperature obtainedusing the thermal IR measurement. Note that for these conditionsFig. 3 shows the visible damage area increases from 3 to 12 mmdiameter with decreasing gap distance between the compositeand the jet orifice.
3.2. Surface morphology
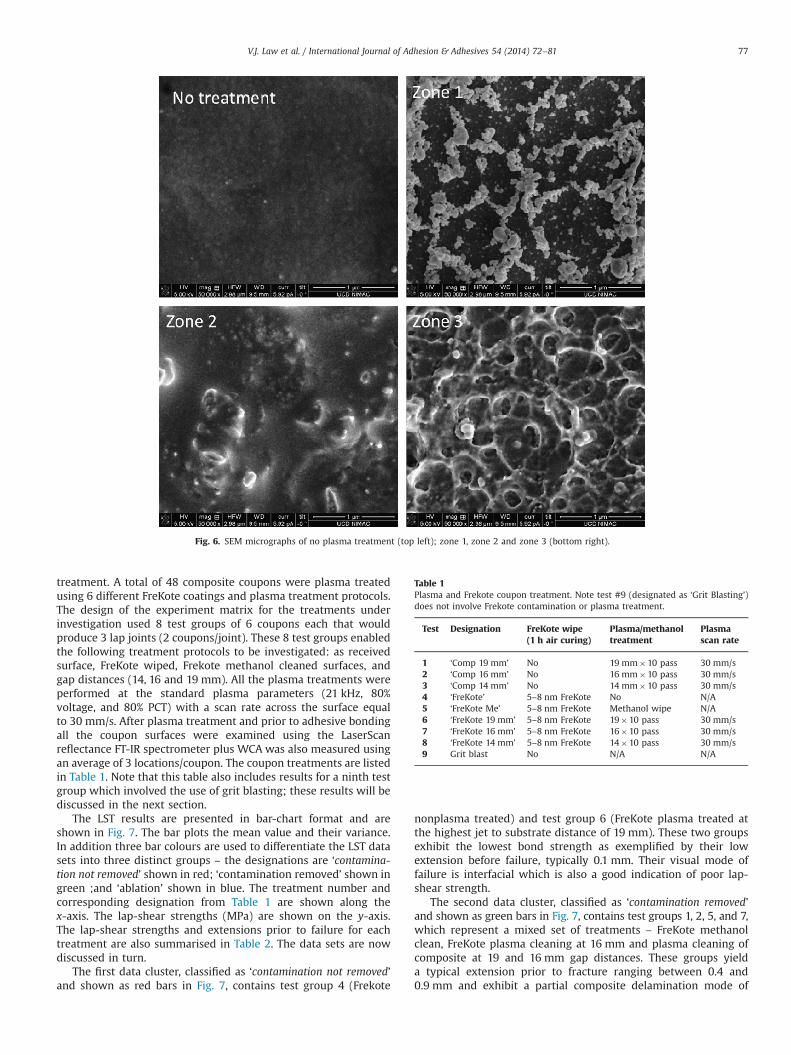
The effect that plasma treatment had on the morphology of thecomposite surface was evaluated following a treatment of 6 s at afixed gap distance of 14 mm. Both SEM and Talysurf contactprofilometer measurements were used to monitor changes to thecomposite surface. The SEM micrographs in Fig. 6 show the changein surface morphology with plasma treatment, showing typicalsurface morphology for the untreated composite and that observed
Fig. 2. Photograph showing visual image of the composite (a); and IR thermal image of composite on a hot-plot with thermocouple (b).
V.J. Law et al. / International Journal of Adhesion & Adhesives 54 (2014) 72–81 75
in zones 1 and 2 and into zone 3. The SEM micrographs are taken ata magnification of 50,000. The scale bar printed in the bottom rightof each image represents a distance of 1 mm. The composite couponsurface without plasma treatment recorded a maximum surfacevariation of 0.5 μm. The zone 1 (charred area) micrograph revealsthat the resin rich top surface layer has formed into nodules whichare typically linked together at a distance of 1 μm. Apart from thistopographic feature there is no indication of any significant micro-cracking. Profilometer measurements indicate that the noduleshave heights of the order of 6–8 μm. Zone 2 provides evidence ofa plastic reflow process around and over the nodules. One possibi-lity is that the cause of this semi-clear appearance and reflowformation may be due to the high pressure and force of the airpushing the flowing afterglow ionised gas outwards preventingthe ingress of fresh oxygenated air reaching the inner two zones.The photographs in Figs. 1 and 3 provide supportive evidencefor this hypothesis. In zone 3 where the temperature is the highest;the composite resin undergoes disintegration and consumptionas revealed by the high density of pits per unit area. Talysurfmeasurements indicate that the etched pits are typically sub-micron in diameter and can reach to a depth of 8–9 μm. The severepitting and absence of evidence of surface swelling suggest that lowmolecular weight volatile material is being preferentially ablated.These zone 3 results are in contrast to composite flame damageprocesses where the slow build of pressure over time (minutes)results in trapped gases (CO2, H2O, formaldehyde, CO) expanding inthe composite volume [15,19,38–40]. Using this survey approach aplasma induced damage window was identified and is now used tointerpret the LST result measurements.
3.3. Composite-to-composite LST
The LST results of the composites joints that have been plasmacleaned (as tooled, or with FreKote contaminant) prior to adhesivebonding are presented in this section. Initial studies focused on thetreatment of both freshly deposited FreKote and that which hadbeen cured in air for one hour. It was observed that the LST resultswere found not to be dependent on the curing time and thus inthis investigation all samples were air cured for 1 h prior to plasma
Fig. 3. Photograph showing visible and infrared images of thermal damage as a function of gap distances (14, 16, 18 and 20 mm) for t¼1.5 s.
0 5 10 15 20 25 300
20
40
60
80
100
120
140
160
180
IR S
urfa
ce T
empe
ratu
re (C
)
Time (s)
Low T Mean T Max T
Fig. 4. Infrared surface temperature profile for 20 mm gap and for t¼6 s.
0.25 0.50 0.75 1.00 1.25 1.50 1.75 2.00100
110
120
130
140
150
160
170
180
190
200
3
12
8
Tg dry
Sur
face
Tem
pera
ture
(C)
Exposure time (s)
9 mm 14mm16 mm 18 mm 20 mm 23 mm
Tg wet (WCA< 10 C)
scanning static APPJ
10
5
Fig. 5. Composite surface temperature as a function of exposure time and gapdistance. Also depicted are the damage diameters expressed in mm (zone 1), whichwere estimated visually on the composite surface.
V.J. Law et al. / International Journal of Adhesion & Adhesives 54 (2014) 72–8176
treatment. A total of 48 composite coupons were plasma treatedusing 6 different FreKote coatings and plasma treatment protocols.The design of the experiment matrix for the treatments underinvestigation used 8 test groups of 6 coupons each that wouldproduce 3 lap joints (2 coupons/joint). These 8 test groups enabledthe following treatment protocols to be investigated: as receivedsurface, FreKote wiped, Frekote methanol cleaned surfaces, andgap distances (14, 16 and 19 mm). All the plasma treatments wereperformed at the standard plasma parameters (21 kHz, 80%voltage, and 80% PCT) with a scan rate across the surface equalto 30 mm/s. After plasma treatment and prior to adhesive bondingall the coupon surfaces were examined using the LaserScanreflectance FT-IR spectrometer plus WCA was also measured usingan average of 3 locations/coupon. The coupon treatments are listedin Table 1. Note that this table also includes results for a ninth testgroup which involved the use of grit blasting; these results will bediscussed in the next section.
The LST results are presented in bar-chart format and areshown in Fig. 7. The bar plots the mean value and their variance.In addition three bar colours are used to differentiate the LST datasets into three distinct groups – the designations are ‘contamina-tion not removed’ shown in red; ‘contamination removed’ shown ingreen ;and ‘ablation’ shown in blue. The treatment number andcorresponding designation from Table 1 are shown along thex-axis. The lap-shear strengths (MPa) are shown on the y-axis.The lap-shear strengths and extensions prior to failure for eachtreatment are also summarised in Table 2. The data sets are nowdiscussed in turn.
The first data cluster, classified as ‘contamination not removed’and shown as red bars in Fig. 7, contains test group 4 (Frekote
nonplasma treated) and test group 6 (FreKote plasma treated atthe highest jet to substrate distance of 19 mm). These two groupsexhibit the lowest bond strength as exemplified by their lowextension before failure, typically 0.1 mm. Their visual mode offailure is interfacial which is also a good indication of poor lap-shear strength.
The second data cluster, classified as ‘contamination removed’and shown as green bars in Fig. 7, contains test groups 1, 2, 5, and 7,which represent a mixed set of treatments – FreKote methanolclean, FreKote plasma cleaning at 16 mm and plasma cleaning ofcomposite at 19 and 16 mm gap distances. These groups yielda typical extension prior to fracture ranging between 0.4 and0.9 mm and exhibit a partial composite delamination mode of
Fig. 6. SEM micrographs of no plasma treatment (top left); zone 1, zone 2 and zone 3 (bottom right).
Table 1Plasma and Frekote coupon treatment. Note test #9 (designated as ‘Grit Blasting’)does not involve Frekote contamination or plasma treatment.
Test Designation FreKote wipe(1 h air curing)
Plasma/methanoltreatment
Plasmascan rate
1 ‘Comp 19 mm’ No 19 mm�10 pass 30 mm/s2 ‘Comp 16 mm’ No 16 mm�10 pass 30 mm/s3 ‘Comp 14 mm’ No 14 mm�10 pass 30 mm/s4 ‘FreKote’ 5–8 nm FreKote No N/A5 ‘FreKote Me’ 5–8 nm FreKote Methanol wipe N/A6 ‘FreKote 19 mm’ 5–8 nm FreKote 19�10 pass 30 mm/s7 ‘FreKote 16 mm’ 5–8 nm FreKote 16�10 pass 30 mm/s8 ‘FreKote 14 mm’ 5–8 nm FreKote 14�10 pass 30 mm/s9 Grit blast No N/A N/A
V.J. Law et al. / International Journal of Adhesion & Adhesives 54 (2014) 72–81 77
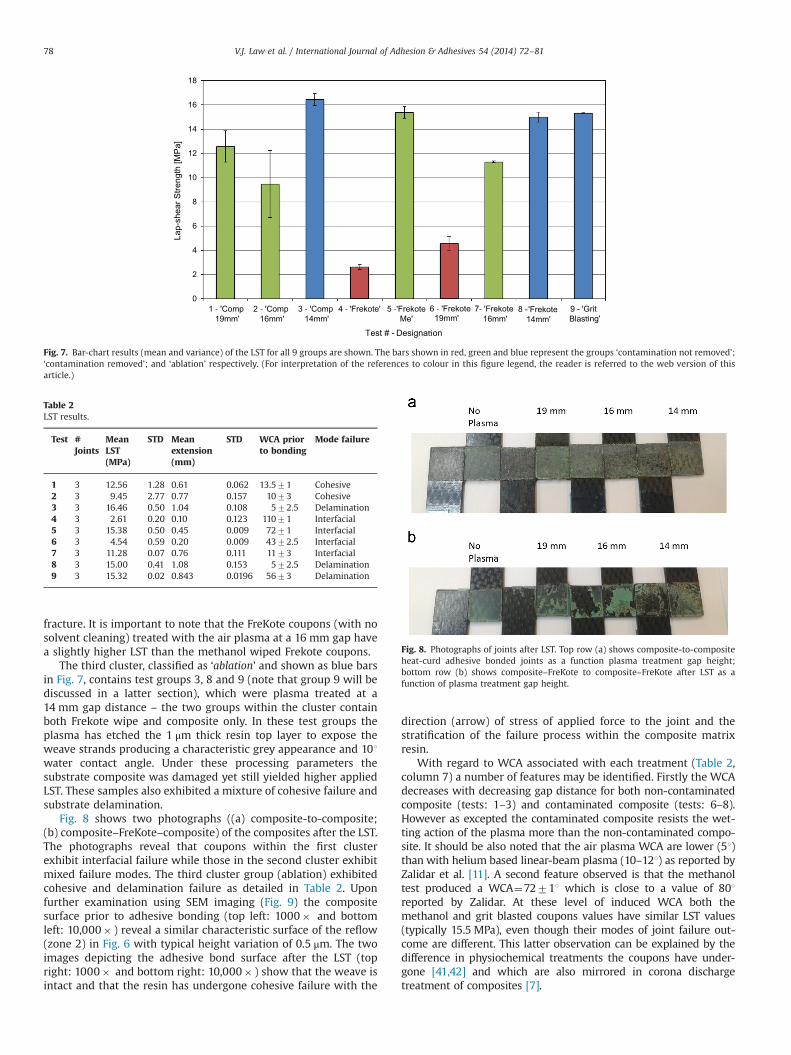
fracture. It is important to note that the FreKote coupons (with nosolvent cleaning) treated with the air plasma at a 16 mm gap havea slightly higher LST than the methanol wiped Frekote coupons.
The third cluster, classified as ‘ablation’ and shown as blue barsin Fig. 7, contains test groups 3, 8 and 9 (note that group 9 will bediscussed in a latter section), which were plasma treated at a14 mm gap distance – the two groups within the cluster containboth Frekote wipe and composite only. In these test groups theplasma has etched the 1 μm thick resin top layer to expose theweave strands producing a characteristic grey appearance and 101water contact angle. Under these processing parameters thesubstrate composite was damaged yet still yielded higher appliedLST. These samples also exhibited a mixture of cohesive failure andsubstrate delamination.
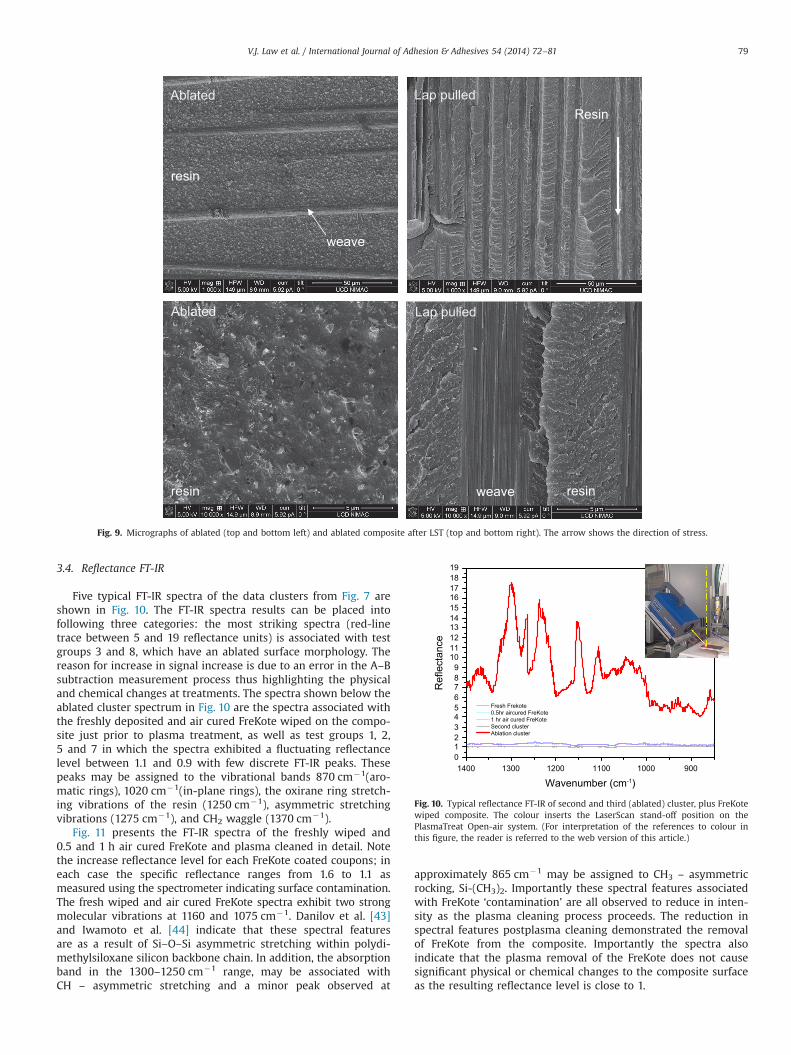
Fig. 8 shows two photographs ((a) composite-to-composite;(b) composite–FreKote–composite) of the composites after the LST.The photographs reveal that coupons within the first clusterexhibit interfacial failure while those in the second cluster exhibitmixed failure modes. The third cluster group (ablation) exhibitedcohesive and delamination failure as detailed in Table 2. Uponfurther examination using SEM imaging (Fig. 9) the compositesurface prior to adhesive bonding (top left: 1000� and bottomleft: 10,000� ) reveal a similar characteristic surface of the reflow(zone 2) in Fig. 6 with typical height variation of 0.5 μm. The twoimages depicting the adhesive bond surface after the LST (topright: 1000� and bottom right: 10,000� ) show that the weave isintact and that the resin has undergone cohesive failure with the
direction (arrow) of stress of applied force to the joint and thestratification of the failure process within the composite matrixresin.
With regard to WCA associated with each treatment (Table 2,column 7) a number of features may be identified. Firstly the WCAdecreases with decreasing gap distance for both non-contaminatedcomposite (tests: 1–3) and contaminated composite (tests: 6–8).However as excepted the contaminated composite resists the wet-ting action of the plasma more than the non-contaminated compo-site. It should be also noted that the air plasma WCA are lower (51)than with helium based linear-beam plasma (10–121) as reported byZalidar et al. [11]. A second feature observed is that the methanoltest produced a WCA¼72711 which is close to a value of 801reported by Zalidar. At these level of induced WCA both themethanol and grit blasted coupons values have similar LST values(typically 15.5 MPa), even though their modes of joint failure out-come are different. This latter observation can be explained by thedifference in physiochemical treatments the coupons have under-gone [41,42] and which are also mirrored in corona dischargetreatment of composites [7].
0
2
4
6
8
10
12
14
16
18
1 'Comp 19mm'
2 'Comp16mm'
3 'Comp 14mm'
4 'Frekote' 5 'Frekote Me'
6 'Frekote19mm'
7 'Frekote16mm' 14mm'
9 'Grit 'Frekote 8Blas ng'
Lap-
shea
r Stre
ngth
[MP
a]
Test # - Designa on
Fig. 7. Bar-chart results (mean and variance) of the LST for all 9 groups are shown. The bars shown in red, green and blue represent the groups ‘contamination not removed’;‘contamination removed’; and ‘ablation’ respectively. (For interpretation of the references to colour in this figure legend, the reader is referred to the web version of thisarticle.)
Table 2LST results.
Test #Joints
MeanLST(MPa)
STD Meanextension(mm)
STD WCA priorto bonding
Mode failure
1 3 12.56 1.28 0.61 0.062 13.571 Cohesive2 3 9.45 2.77 0.77 0.157 1073 Cohesive3 3 16.46 0.50 1.04 0.108 572.5 Delamination4 3 2.61 0.20 0.10 0.123 11071 Interfacial5 3 15.38 0.50 0.45 0.009 7271 Interfacial6 3 4.54 0.59 0.20 0.009 4372.5 Interfacial7 3 11.28 0.07 0.76 0.111 1173 Interfacial8 3 15.00 0.41 1.08 0.153 572.5 Delamination9 3 15.32 0.02 0.843 0.0196 5673 Delamination
Fig. 8. Photographs of joints after LST. Top row (a) shows composite-to-compositeheat-curd adhesive bonded joints as a function plasma treatment gap height;bottom row (b) shows composite–FreKote to composite–FreKote after LST as afunction of plasma treatment gap height.
V.J. Law et al. / International Journal of Adhesion & Adhesives 54 (2014) 72–8178
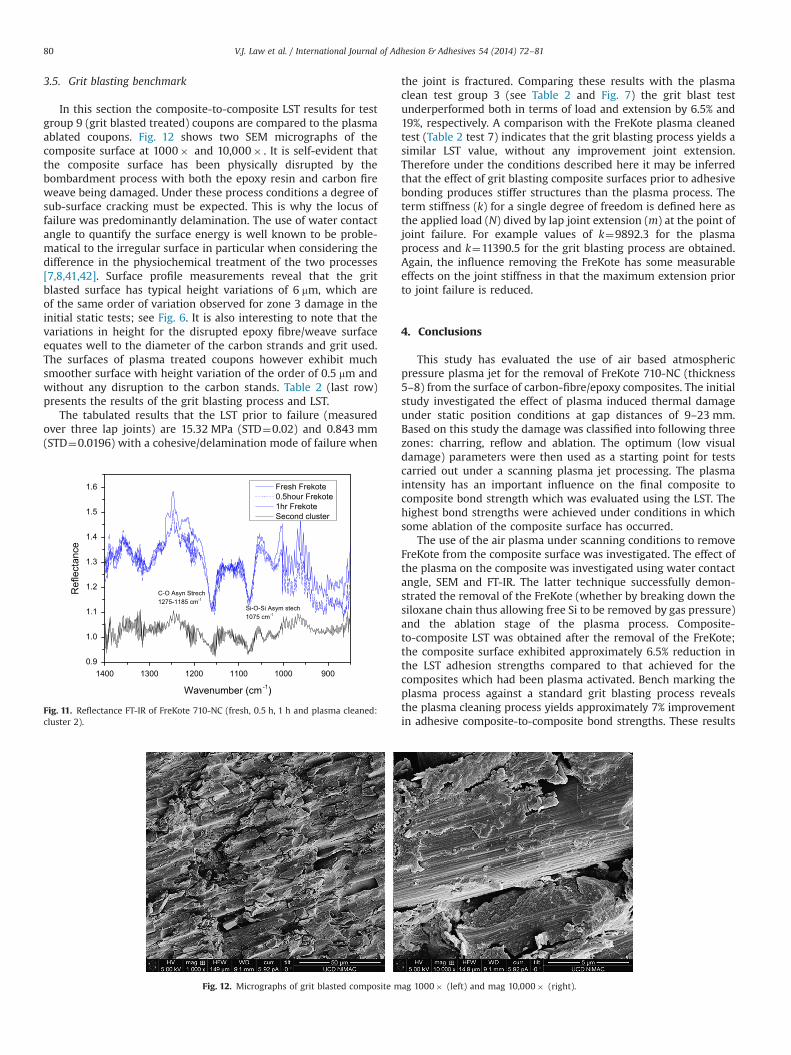
3.4. Reflectance FT-IR
Five typical FT-IR spectra of the data clusters from Fig. 7 areshown in Fig. 10. The FT-IR spectra results can be placed intofollowing three categories: the most striking spectra (red-linetrace between 5 and 19 reflectance units) is associated with testgroups 3 and 8, which have an ablated surface morphology. Thereason for increase in signal increase is due to an error in the A–Bsubtraction measurement process thus highlighting the physicaland chemical changes at treatments. The spectra shown below theablated cluster spectrum in Fig. 10 are the spectra associated withthe freshly deposited and air cured FreKote wiped on the compo-site just prior to plasma treatment, as well as test groups 1, 2,5 and 7 in which the spectra exhibited a fluctuating reflectancelevel between 1.1 and 0.9 with few discrete FT-IR peaks. Thesepeaks may be assigned to the vibrational bands 870 cm�1(aro-matic rings), 1020 cm�1(in-plane rings), the oxirane ring stretch-ing vibrations of the resin (1250 cm�1), asymmetric stretchingvibrations (1275 cm�1), and CH2 waggle (1370 cm�1).
Fig. 11 presents the FT-IR spectra of the freshly wiped and0.5 and 1 h air cured FreKote and plasma cleaned in detail. Notethe increase reflectance level for each FreKote coated coupons; ineach case the specific reflectance ranges from 1.6 to 1.1 asmeasured using the spectrometer indicating surface contamination.The fresh wiped and air cured FreKote spectra exhibit two strongmolecular vibrations at 1160 and 1075 cm�1. Danilov et al. [43]and Iwamoto et al. [44] indicate that these spectral featuresare as a result of Si–O–Si asymmetric stretching within polydi-methylsiloxane silicon backbone chain. In addition, the absorptionband in the 1300–1250 cm�1 range, may be associated withCH – asymmetric stretching and a minor peak observed at
approximately 865 cm�1 may be assigned to CH3 – asymmetricrocking, Si-(CH3)2. Importantly these spectral features associatedwith FreKote ‘contamination’ are all observed to reduce in inten-sity as the plasma cleaning process proceeds. The reduction inspectral features postplasma cleaning demonstrated the removalof FreKote from the composite. Importantly the spectra alsoindicate that the plasma removal of the FreKote does not causesignificant physical or chemical changes to the composite surfaceas the resulting reflectance level is close to 1.
Ablated Lap pulled
resin
weave
Resin
resin
Ablated Lap pulled
weave resin
Fig. 9. Micrographs of ablated (top and bottom left) and ablated composite after LST (top and bottom right). The arrow shows the direction of stress.
1400 1300 1200 1100 1000 9000123456789
10111213141516171819
Ref
lect
ance
Wavenumber (cm-1)
Fresh Frekote 0.5hr aircured FreKote 1 hr air cured FreKote Second cluster Ablation cluster
Fig. 10. Typical reflectance FT-IR of second and third (ablated) cluster, plus FreKotewiped composite. The colour inserts the LaserScan stand-off position on thePlasmaTreat Open-air system. (For interpretation of the references to colour inthis figure, the reader is referred to the web version of this article.)
V.J. Law et al. / International Journal of Adhesion & Adhesives 54 (2014) 72–81 79
3.5. Grit blasting benchmark
In this section the composite-to-composite LST results for testgroup 9 (grit blasted treated) coupons are compared to the plasmaablated coupons. Fig. 12 shows two SEM micrographs of thecomposite surface at 1000� and 10,000� . It is self-evident thatthe composite surface has been physically disrupted by thebombardment process with both the epoxy resin and carbon fireweave being damaged. Under these process conditions a degree ofsub-surface cracking must be expected. This is why the locus offailure was predominantly delamination. The use of water contactangle to quantify the surface energy is well known to be proble-matical to the irregular surface in particular when considering thedifference in the physiochemical treatment of the two processes[7,8,41,42]. Surface profile measurements reveal that the gritblasted surface has typical height variations of 6 mm, which areof the same order of variation observed for zone 3 damage in theinitial static tests; see Fig. 6. It is also interesting to note that thevariations in height for the disrupted epoxy fibre/weave surfaceequates well to the diameter of the carbon strands and grit used.The surfaces of plasma treated coupons however exhibit muchsmoother surface with height variation of the order of 0.5 mm andwithout any disruption to the carbon stands. Table 2 (last row)presents the results of the grit blasting process and LST.
The tabulated results that the LST prior to failure (measuredover three lap joints) are 15.32 MPa (STD¼0.02) and 0.843 mm(STD¼0.0196) with a cohesive/delamination mode of failure when
the joint is fractured. Comparing these results with the plasmaclean test group 3 (see Table 2 and Fig. 7) the grit blast testunderperformed both in terms of load and extension by 6.5% and19%, respectively. A comparison with the FreKote plasma cleanedtest (Table 2 test 7) indicates that the grit blasting process yields asimilar LST value, without any improvement joint extension.Therefore under the conditions described here it may be inferredthat the effect of grit blasting composite surfaces prior to adhesivebonding produces stiffer structures than the plasma process. Theterm stiffness (k) for a single degree of freedom is defined here asthe applied load (N) dived by lap joint extension (m) at the point ofjoint failure. For example values of k¼9892.3 for the plasmaprocess and k¼11390.5 for the grit blasting process are obtained.Again, the influence removing the FreKote has some measurableeffects on the joint stiffness in that the maximum extension priorto joint failure is reduced.
4. Conclusions
This study has evaluated the use of air based atmosphericpressure plasma jet for the removal of FreKote 710-NC (thickness5–8) from the surface of carbon-fibre/epoxy composites. The initialstudy investigated the effect of plasma induced thermal damageunder static position conditions at gap distances of 9–23 mm.Based on this study the damage was classified into following threezones: charring, reflow and ablation. The optimum (low visualdamage) parameters were then used as a starting point for testscarried out under a scanning plasma jet processing. The plasmaintensity has an important influence on the final composite tocomposite bond strength which was evaluated using the LST. Thehighest bond strengths were achieved under conditions in whichsome ablation of the composite surface has occurred.
The use of the air plasma under scanning conditions to removeFreKote from the composite surface was investigated. The effect ofthe plasma on the composite was investigated using water contactangle, SEM and FT-IR. The latter technique successfully demon-strated the removal of the FreKote (whether by breaking down thesiloxane chain thus allowing free Si to be removed by gas pressure)and the ablation stage of the plasma process. Composite-to-composite LST was obtained after the removal of the FreKote;the composite surface exhibited approximately 6.5% reduction inthe LST adhesion strengths compared to that achieved for thecomposites which had been plasma activated. Bench marking theplasma process against a standard grit blasting process revealsthe plasma cleaning process yields approximately 7% improvementin adhesive composite-to-composite bond strengths. These results
1400 1300 1200 1100 1000 9000.9
1.0
1.1
1.2
1.3
1.4
1.5
1.6
Si-O-Si Asym stech1075 cm
Ref
lect
ance
Wavenumber (cm-1)
Fresh Frekote 0.5hour Frekote 1hr Frekote Second cluster
C-O Asyn Strech1275-1185 cm
Fig. 11. Reflectance FT-IR of FreKote 710-NC (fresh, 0.5 h, 1 h and plasma cleaned:cluster 2).
Fig. 12. Micrographs of grit blasted composite mag 1000� (left) and mag 10,000� (right).
V.J. Law et al. / International Journal of Adhesion & Adhesives 54 (2014) 72–8180
suggest that the plasma treatment improves the bond strength ofthe boned joint. In addition a significant further advantage is thatthe plasma treatment is an environmentally friendlier process ascompared to the use of aluminium oxide grits.
A comparative study was also carried out with the use of amethanol wipe treatment for the removal of the FreKote. The LSTadhesion of the composites bonded after these cleaning tests werefound to be similar to those treated using the air plasma, againdemonstrating that the FreKote had been successfully removed.Significant potential advantages of the air plasma compared withthe methanol wipe treatment are that the former will avoid theretransfer of the removed Frekote onto the fresh compositesurfaces. In addition the plasma treatment can be automated forthe treatment of long sections of composite and also for geome-trically complex shapes. Thus this should facilitate a higher level ofreproducible process control for contaminant removal in a man-ufacturing environment.
Acknowledgements
This work is partially funded by the Clean SKY Eco DesignAirframe, in the frame of call for proposal for WP 221-: JTI-CS2010-5-ECO-01-016 – PLASMACLEAN, and by the ICOMP Compo-sites Technology Centre Programme.
References
[1] Status of FAA's actions to oversee the safety of composite airplanes. UnitedStates Government Accountability Office, GAO-11-849; 2011.
[2] Beck AR, Hodzic A, Soutis CS, Wilson CW. Influence of implementation ofcomposite materials in civil aircraft industry on the reduction of environ-mental pollution and greenhouse effects. IOP Conf Ser: Mater Sci Eng2011;26:012015.
[3] Jeenjitkaew C, Luklinska Z, Guild F. Morphology and surface chemistry ofkissing bonds in adhesive joints produced by surface contamination. Int JAdhes Adhes 2010;30:643–53.
[4] Kim J, Chaudhury MK, Owen MJ. Modeling hydrophobic recovery of electri-cally discharged polydimethylsiloxane elastomers. J Colloid Interface Sci2006;293:364–75.
[5] Product description sheet Frekote 710-NC mould release agent. ⟨http:/www.nfgsales.com/files/active/0/FREK770-NC.pdf⟩; September 2003.
[6] Grant A, Wilkinson TJ, Holman DR, Martion MC. Latent human fingerprintsusing infrared spectromicroscopy. Appl Spectrosc 2005;59:1182–7.
[7] Wingfield JRJ. Treatment of composite surfaces for adhesive bonding. Int JAdhes Adhes 1993;13(3):151–6.
[8] Boerio FJ, Roby B, Dillingham RG, Bossi RH, Crane RL. Effect of grit-blasting onthe surface energy of graphite/epoxy composites. J Adhes 2006;82:19–37.
[9] Mohan J, Ramamoorthy A, Ivankovic A, Dowling DP, Murphy N. Effect of anatmospheric pressure plasma treatment on the mode I fracture toughness of aco-cured composite joint. J Adhes 2014;90(9):735–54.
[10] Law VJ, Ramamoorthy A, Dowling DP. Real-time process monitoring duringthe plasma treatment of carbon weave composite materials. J Mater Sci Eng B2011;2:164–9.
[11] Zaldivar RJ, Nokes J, Steckel GL, Kim HI, Morgan BA. The Effect of Atmosphericplasma treatment on the chemistry, morphology and resultant bondingbehavior of a pan-based carbon fiber-reinforced epoxy composite. J ComposMater 2010;44(2):137–56.
[12] Zaldivar RJ, Salfity J, Steckel G, morgan B, Patel D, Nokes JP, et al. Bondabilityof TC410 composites: the surface analysis and wetting properties of anatmospheric plasma-treated siloxane-modified cyanate ester composite.J Compos Mater 2011;46(16):1925–36.
[13] Pulpytel J, Kumar V, Peng P, Micheli V, Laidani N, Arefi-Khonsari F. Depositionof organosilicon coatings by a non-equilibrium atmospheric pressure plasmajet: design, analysis and macroscopic scaling law of the process. PlasmaProcess Polym 2011;8(7):664–75.
[14] Lommatzsch U, Pasedag D, Baalmann A, Ellinghorst G, Wagner Hans-Erich.Atmospheric pressure plasma jet treatment of polyethylene surfaces foradhesion improvement. Plasma Process Polym 2007;4:S1041–5.
[15] Bismarck A, Brostow W, Chiu R, Hagg Lobland HE, Ho KKC. Effects of surfaceplasma treatment on tribology of thermoplastic polymers. Polym Eng Sci2008:1971–6.
[16] Baltazar-y-Jimenez A, Bistritz M, Schulz E, Bismarck A. Atmospheric airpressure plasma treatment of lignocellulosic fibres: impact on mechanicalproperties and adhesion to cellulose acetate butyrate. Compos Sci Technol2008;68:215–27.
[17] Quintiere JG, Walters RN, Crowley S. Flammability properties of aircraftcarbon-fiber structural composite. Final report. U.S. Department of Transpor-tation Federal Aviation Administration. DOT/FAA/AR-07/57; 2007.
[18] Stoik CD, Bohnand MJ, Blackshire JL. Nondestructive evaluation of aircraftcomposites using transmissive terahertz time domain spectroscopy. OptExpress 2008;16(21):17039.
[19] Kim JG, Choi I, Le DG, Seo I. Flame and silane treatments for improving theadhesive bonding characteristics of aramid/epoxy composites. Compos Struct2011;93:2696–705.
[20] Tsotsis TK, Lee SM. Long-term thermo-oxidative aging in composite material:failure mechanisms. Compos Sci Technol 1998;58:355–68.
[21] Wolfrum J, Eibl S, Lietch L. Rapid evaluation of long-term thermal degradationof carbon fibre epoxy composites. Compos Sci Technol 2009;69:523–30.
[22] Information on the Hexply material can be found at: ⟨http:/www.hexcel.com⟩.[23] Product description sheet FreKote 710-NC mould release agent. ⟨http:/www.
nfgsales.com/files/active/0/FREK770-NC.pdf⟩; September 2003.[24] Li B, Chen J, Wang JH-C. J Biomed Mater Res Part A 2012;79A(4):989–98.[25] Kim J, Chaudhury MK, Owen MJ, Orbeck T. The mechanisms of hydrophobic
recovery of polydimethylsiloxane elastomers exposed to partial electricaldischarges. J Colloid Interface Sci 2001;244:200–7.
[26] Kubota Y, Ichiki R, Hara T, Yamaguchi N, Takemura Y. Spectroscopic analysis ofnitrogen atmospheric plasma jet. J Plasma Fusion Res 2009;8:740–2.
[27] Dowling DP, O’Neill FT, Langlais SJ, Law VJ. Influence of dc pulsed atmosphericpressure plasma jet processing conditions on polymer activation. PlasmaProcess Polym 2011;8(8):718–7278.
[28] Dowling DP, O’Neill FT, Milosavljević V, Law VJ. DC pulsed atmospheric-pressure plasma jet image information. IEEE Trans Plasma Sci 2010;39(11):2326–7.
[29] Takemura Y, Kubota Y, Yamaguchi N, Hara T. Development of atmosphericplasma jet with long flame. IEEE Trans Plasma Sci 2009;37(8):1604–6.
[30] McDonnell1 KA, English NJ, Stallard CP, Rahman M, Dowling DP. Fabrication ofnano-structured photo-catalytic TiO2 coatings using a microblast depositiontechnique. Appl Surf Sci 2013;275:316–23.
[31] Kim J, Chaudhury MK, Owen MJ, Orbeck T. The mechanisms of hydrophobicrecovery of polydimethylsiloxane elastomers exposed to partial electricaldischarges. J Colloid Interface Sci 2001;244:200–7.
[32] Cengel YA. Introduction to thermodynamics and heat transfer. Boston, USA:McGraw-Hill;1997. p. 625–700. ISBN: 0073380172.
[33] Shelly PH, LaReviere DR. USA 0124074 A1. INS; 2005.[34] Coates J. In: Meyers RA, editor. Encyclopedia of analytical chemistry. Chiche-
ster: Ó John Wiley & Sons Ltd.; 2000. p. 10815–37.[35] Zhou J, Lucas JP. Hygrothermal effects of epoxy resin. Part I: the nature of
water in epoxy. Polymer 1999;40:5505–12.[36] Hillborg H, Gedde UW. Hydrophobicity recovery of polydimethylsiloxane after
exposure to corona discharge. Polymer 1998;39(10):1991–8.[37] ASTM D5868-01. Standard test method for lap shear adhesion for fiber
reinforced plastic (FRP) bonding.[38] Hancox NL. Thermal effects on polymer matrix composites: Part 1. Thermal
cycling. Mater Des 1998;19:85–91.[39] Cvelbara U, Pejovnikb S, Mozetiè M, Zalara A. Increased surface roughness by
oxygen plasma treatment of graphite/polymer composite. Appl Surf Sci2003;210:255–61.
[40] Ahamad T, Alshehri SM. Thermal degradation and evolved gas analysis ofepoxy (DGEBA)/novolac resin blends (ENB) during pyrolysis and combustion.J Therm Anal Calorim 2013;111:445–51.
[41] Bascom W, Cottingham R, Singletterry D. Contact angle, wettability, and adhe-sion. In: Gould RF, editor. Advances in chemistry series, vol. 43. Washington:American Chemical Society; 1964. p. 355.
[42] Dillingham RG, Oakley BR. Surface energy and adhesion in composite–composite adhesive bonds. J Adhes 2006;82:407–26.
[43] Danilvo V, Wagner H-E, Meichsner J. Modification of polydimethylsiloxanethin films in H2 radio-frequency plasma investigated by infrared reflectionabsorption spectroscopy. Plasma Process Polym 2011;8:1059–67.
[44] Iwamoto R. Infrared study on molecular conformations of dialkoxyethanesand related. Spectrochim Acta Part A: Mol Spectrosc 1971;27(11):2385–99.
V.J. Law et al. / International Journal of Adhesion & Adhesives 54 (2014) 72–81 81
Related Documents