Aim: How do humans impact the environment? December 2, 2013 Catalyst: Ch. 43 Reading Comprehension Quiz Answer the following question in your notebooks: Why is the minimum viable population size smaller for a population that is more genetically diverse than it is for a less genetically diverse population?

Welcome message from author
This document is posted to help you gain knowledge. Please leave a comment to let me know what you think about it! Share it to your friends and learn new things together.
Transcript
Aim: How do humans impact the environment?
December 2, 2013Catalyst:Ch. 43 Reading Comprehension QuizAnswer the following question in your notebooks:Why is the minimum viable population size smaller for a population that is more genetically diverse than it is for a less genetically diverse population?

Reminders
• HW 3 due tomorrow
• I still do not have all character survey forms back. Extra copies are available at northsidescience.weebly.com

Agenda
• Easter Island Case Study
• Ch. 43 Comprehension and Review
• Nutrients and Eutrophication


What message do you think this movie is trying to send? How do you think humans influence the environment?

Easter Island
Easter Island
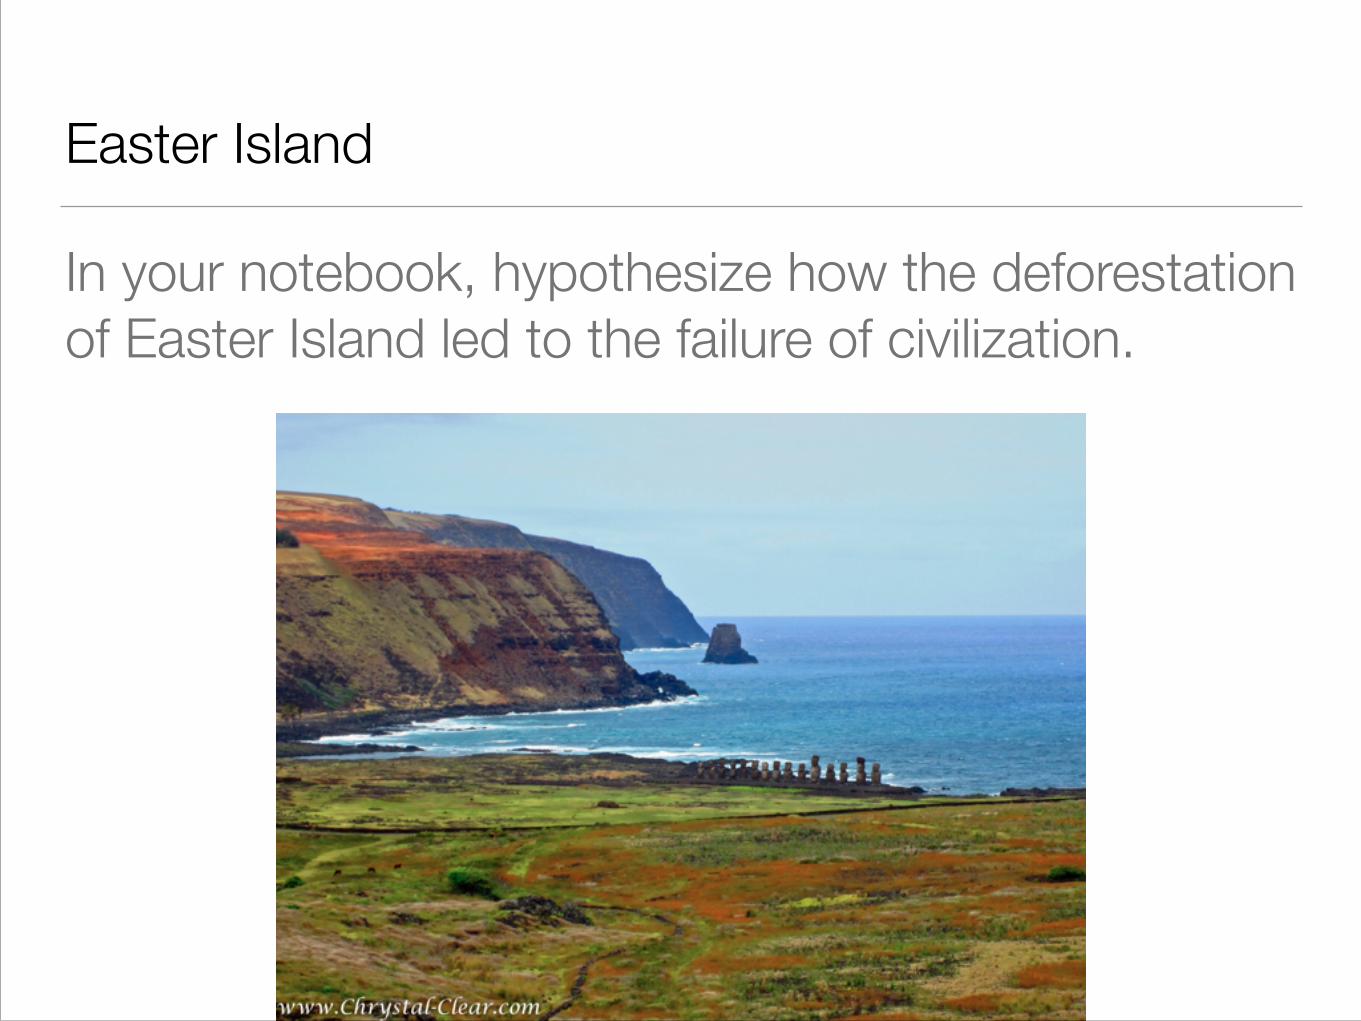
In your notebook, hypothesize how the deforestation of Easter Island led to the failure of civilization.

Easter Island
© 2014 Pearson Education, Inc.
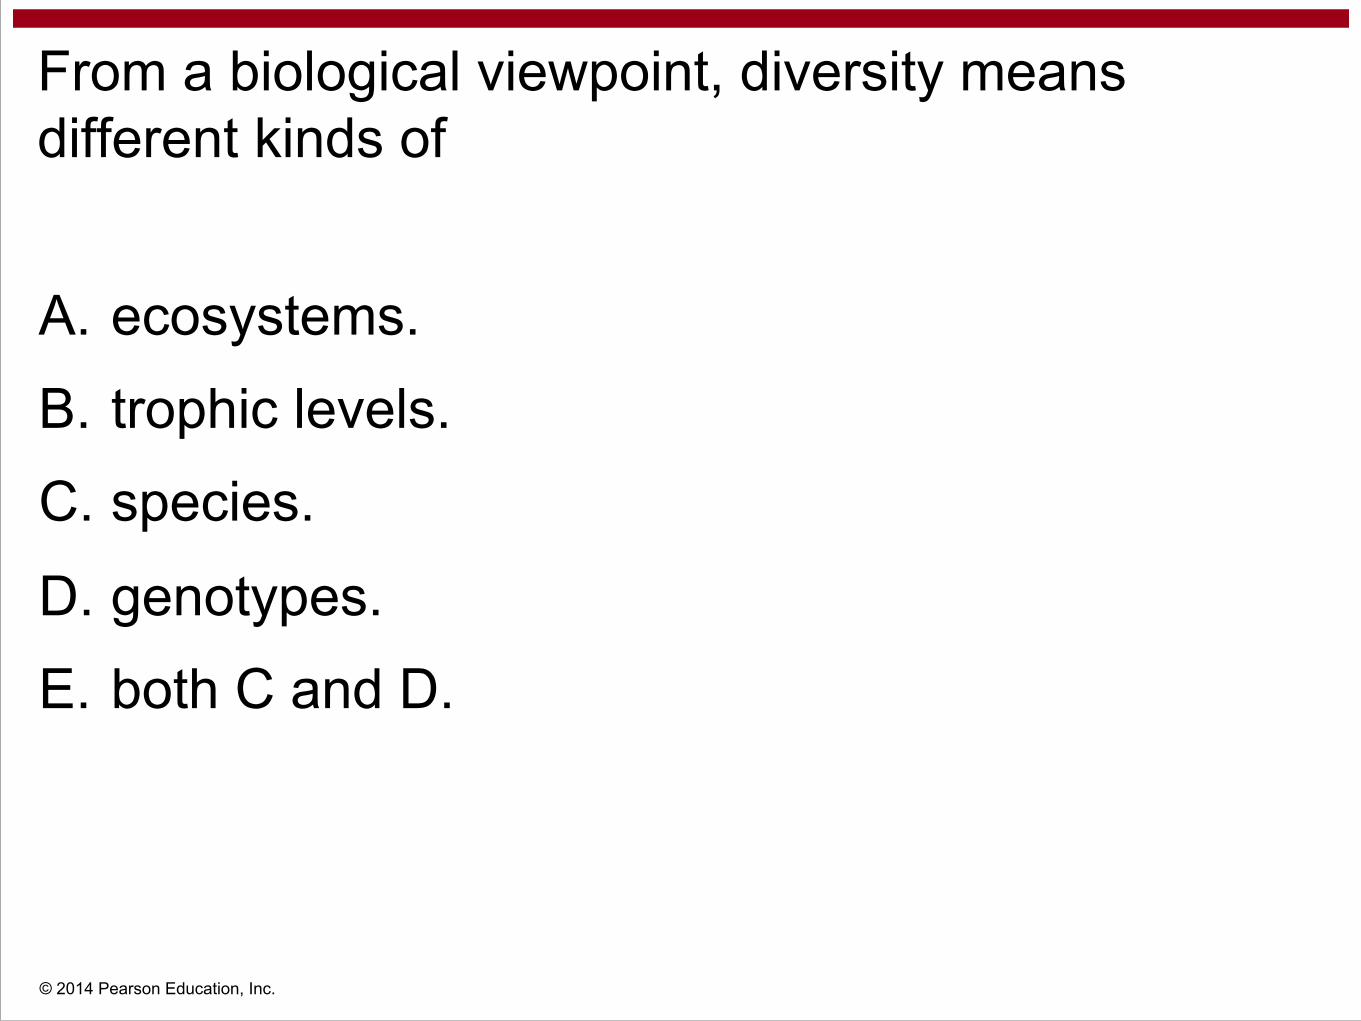
From a biological viewpoint, diversity means different kinds of
A. ecosystems.
B. trophic levels.
C. species.
D. genotypes.
E. both C and D.
© 2014 Pearson Education, Inc.
From a biological viewpoint, diversity means different kinds of
A. ecosystems.
B. trophic levels.
C. species.
D. genotypes.
E. both C and D.
© 2014 Pearson Education, Inc.
Introduced species are sometimes a problem because they usually
A. are predators.
B. are better competitors.
C. displace mutualists.
D. exploit unused resources.
E. are omnivores.
© 2014 Pearson Education, Inc.
Introduced species are sometimes a problem because they usually
A. are predators.
B. are better competitors.
C. displace mutualists.
D. exploit unused resources.
E. are omnivores.
© 2014 Pearson Education, Inc.
Many endangered or extinct species live in freshwater habitats, such as along the Mississippi River. Eutrophication has been one major source of freshwater destruction and damage. Since nitrogen is a major contributor to eutrophication, one good solution would be to
A. breed varieties of duckweed that absorb lots of phosphorus.
B. fertilize cornfields during the summer instead of in spring.
C. prevent runoff of nitrogen fertilizers from agricultural land.
D. require all wastewater dumped in the Mississippi River to go through a wastewater treatment facility first.
E. build more levees so the river runs to the Gulf of Mexico faster.
© 2014 Pearson Education, Inc.
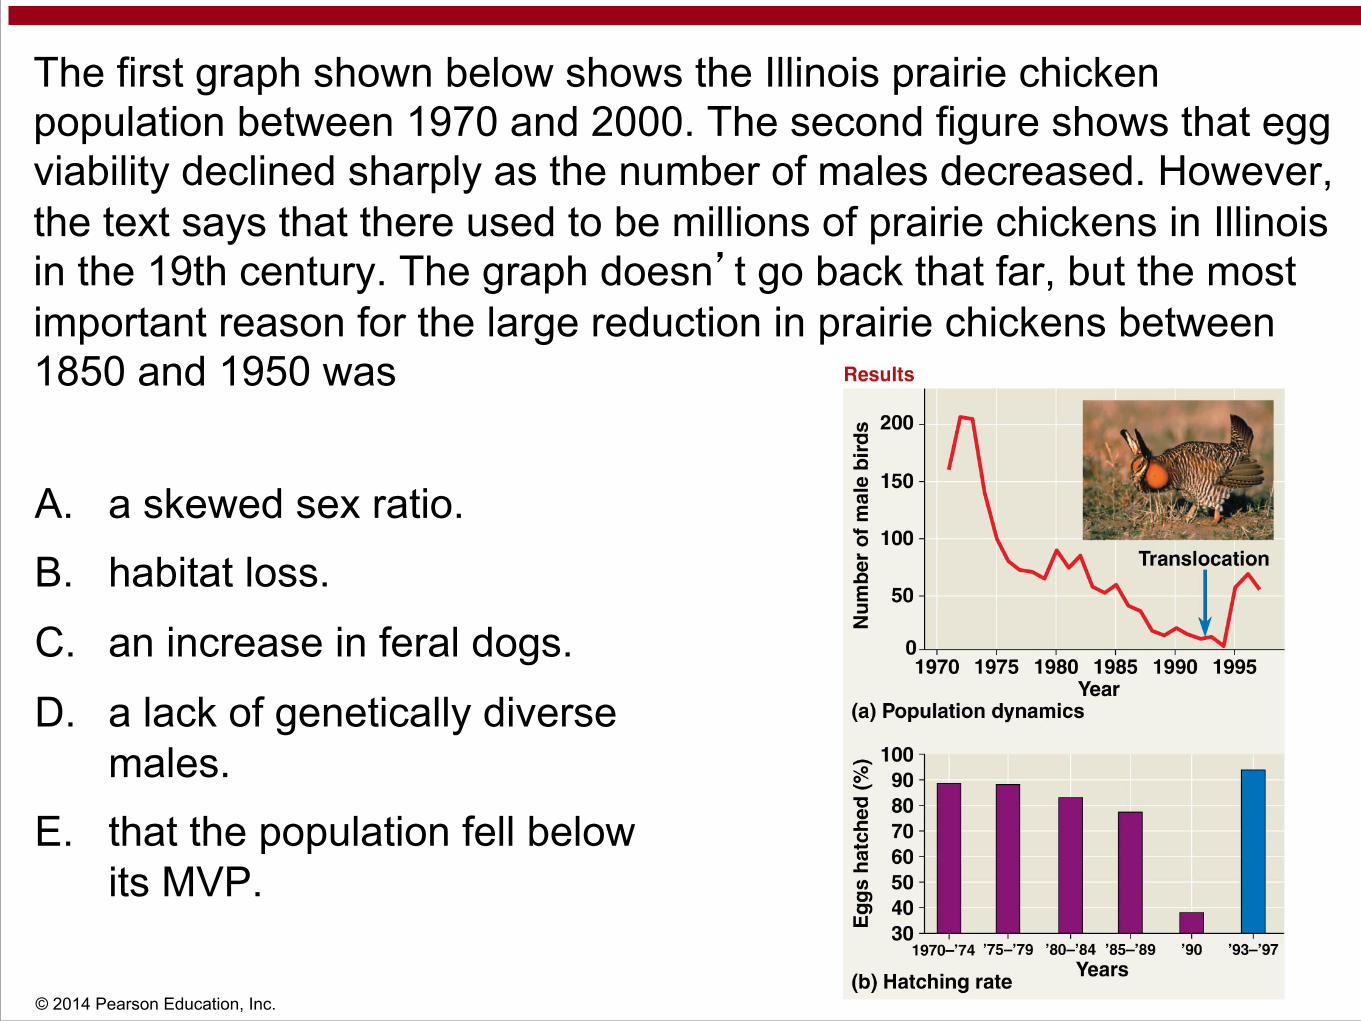
The first graph shown below shows the Illinois prairie chicken population between 1970 and 2000. The second figure shows that egg viability declined sharply as the number of males decreased. However, the text says that there used to be millions of prairie chickens in Illinois in the 19th century. The graph doesn�t go back that far, but the most important reason for the large reduction in prairie chickens between 1850 and 1950 was
A. a skewed sex ratio. B. habitat loss.
C. an increase in feral dogs.
D. a lack of genetically diverse males.
E. that the population fell below its MVP.
© 2014 Pearson Education, Inc.
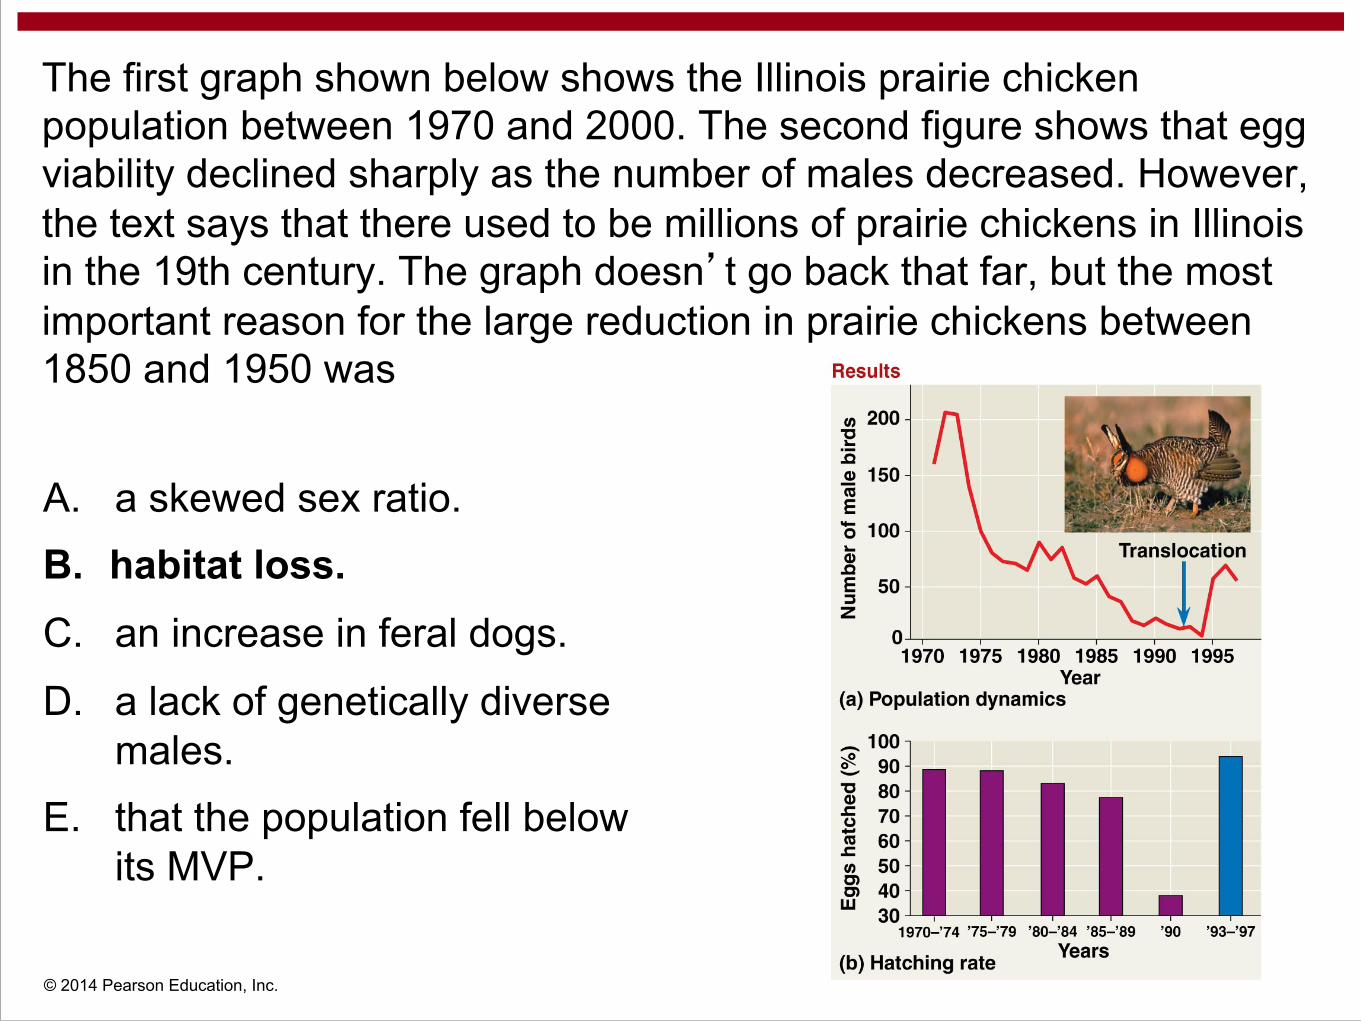
The first graph shown below shows the Illinois prairie chicken population between 1970 and 2000. The second figure shows that egg viability declined sharply as the number of males decreased. However, the text says that there used to be millions of prairie chickens in Illinois in the 19th century. The graph doesn�t go back that far, but the most important reason for the large reduction in prairie chickens between 1850 and 1950 was
A. a skewed sex ratio. B. habitat loss.
C. an increase in feral dogs.
D. a lack of genetically diverse males.
E. that the population fell below its MVP.
© 2014 Pearson Education, Inc.
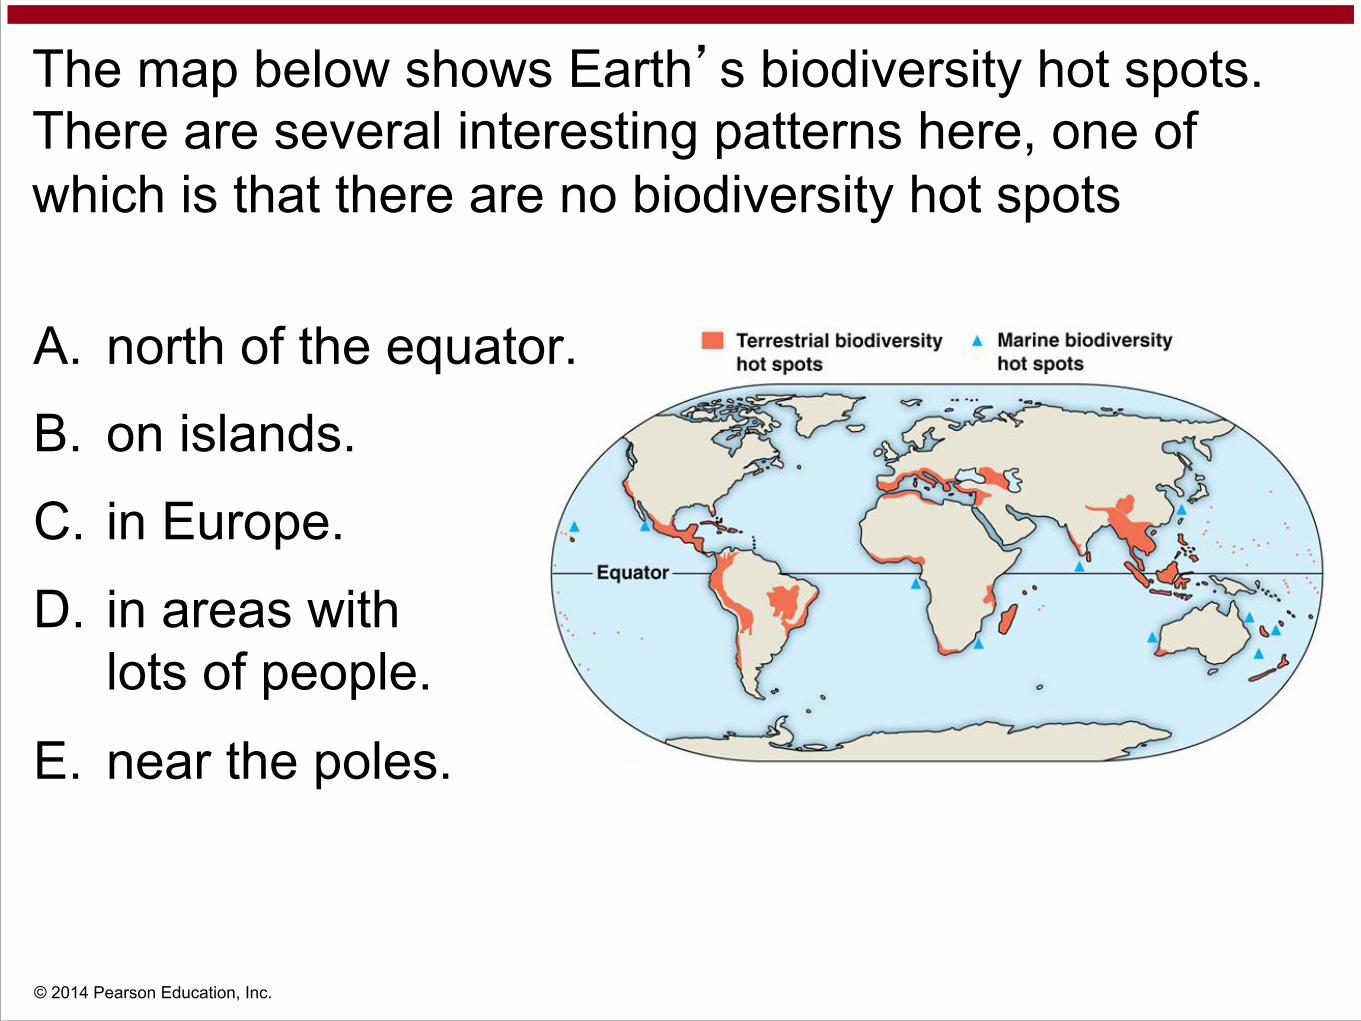
The map below shows Earth�s biodiversity hot spots. There are several interesting patterns here, one of which is that there are no biodiversity hot spots
A. north of the equator.
B. on islands.
C. in Europe.
D. in areas with lots of people.
E. near the poles.
© 2014 Pearson Education, Inc.
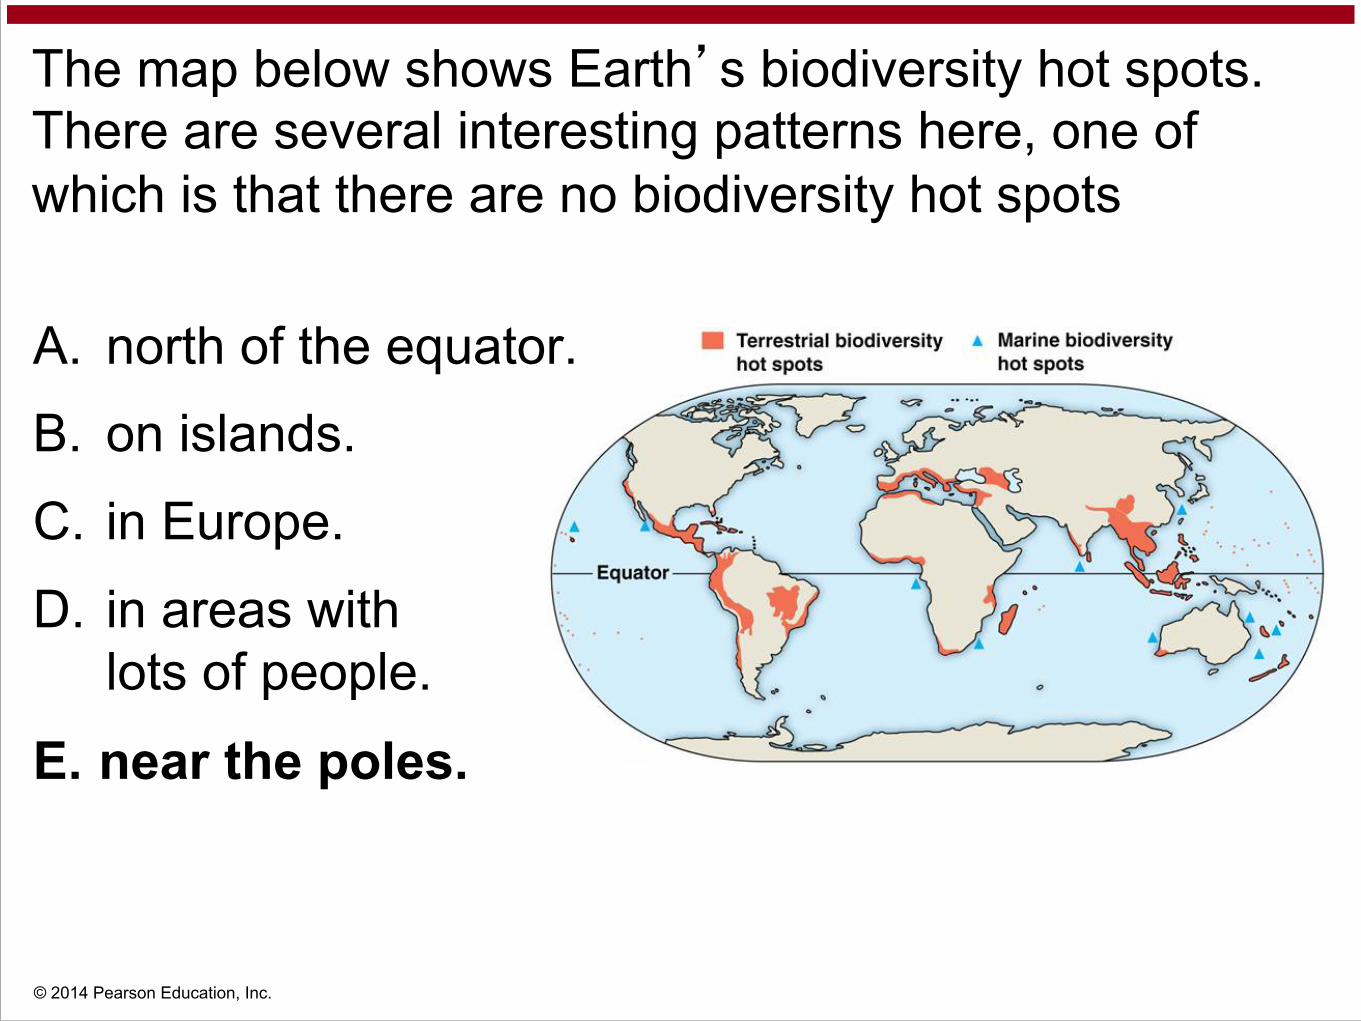
The map below shows Earth�s biodiversity hot spots. There are several interesting patterns here, one of which is that there are no biodiversity hot spots
A. north of the equator.
B. on islands.
C. in Europe.
D. in areas with lots of people.
E. near the poles.
© 2014 Pearson Education, Inc.
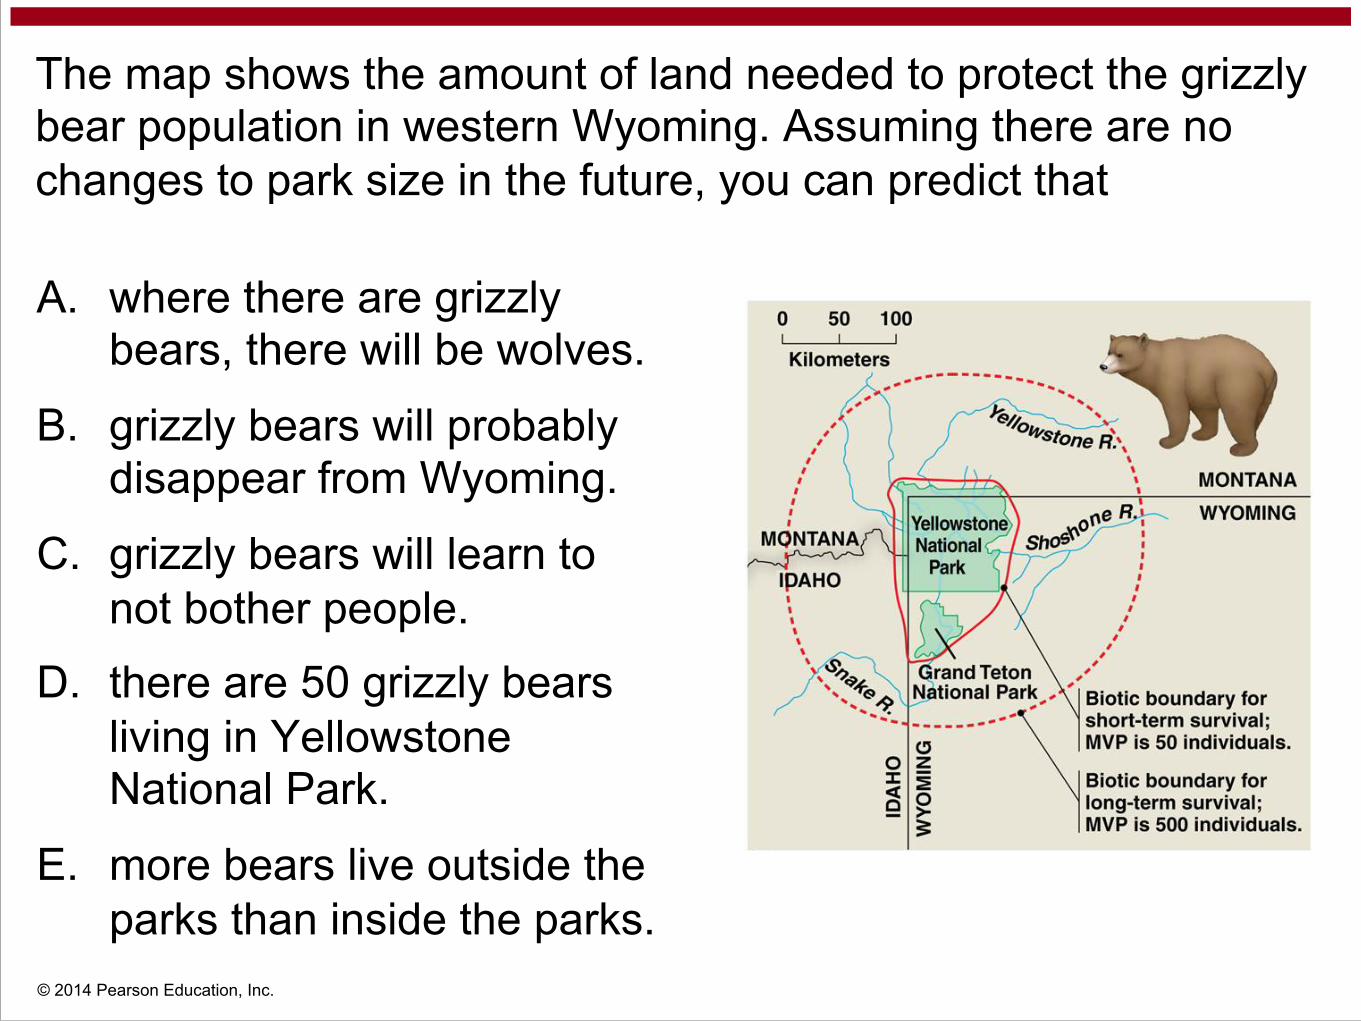
The map shows the amount of land needed to protect the grizzly bear population in western Wyoming. Assuming there are no changes to park size in the future, you can predict that
A. where there are grizzly bears, there will be wolves.
B. grizzly bears will probably disappear from Wyoming.
C. grizzly bears will learn to not bother people.
D. there are 50 grizzly bears living in Yellowstone National Park.
E. more bears live outside the parks than inside the parks.
© 2014 Pearson Education, Inc.
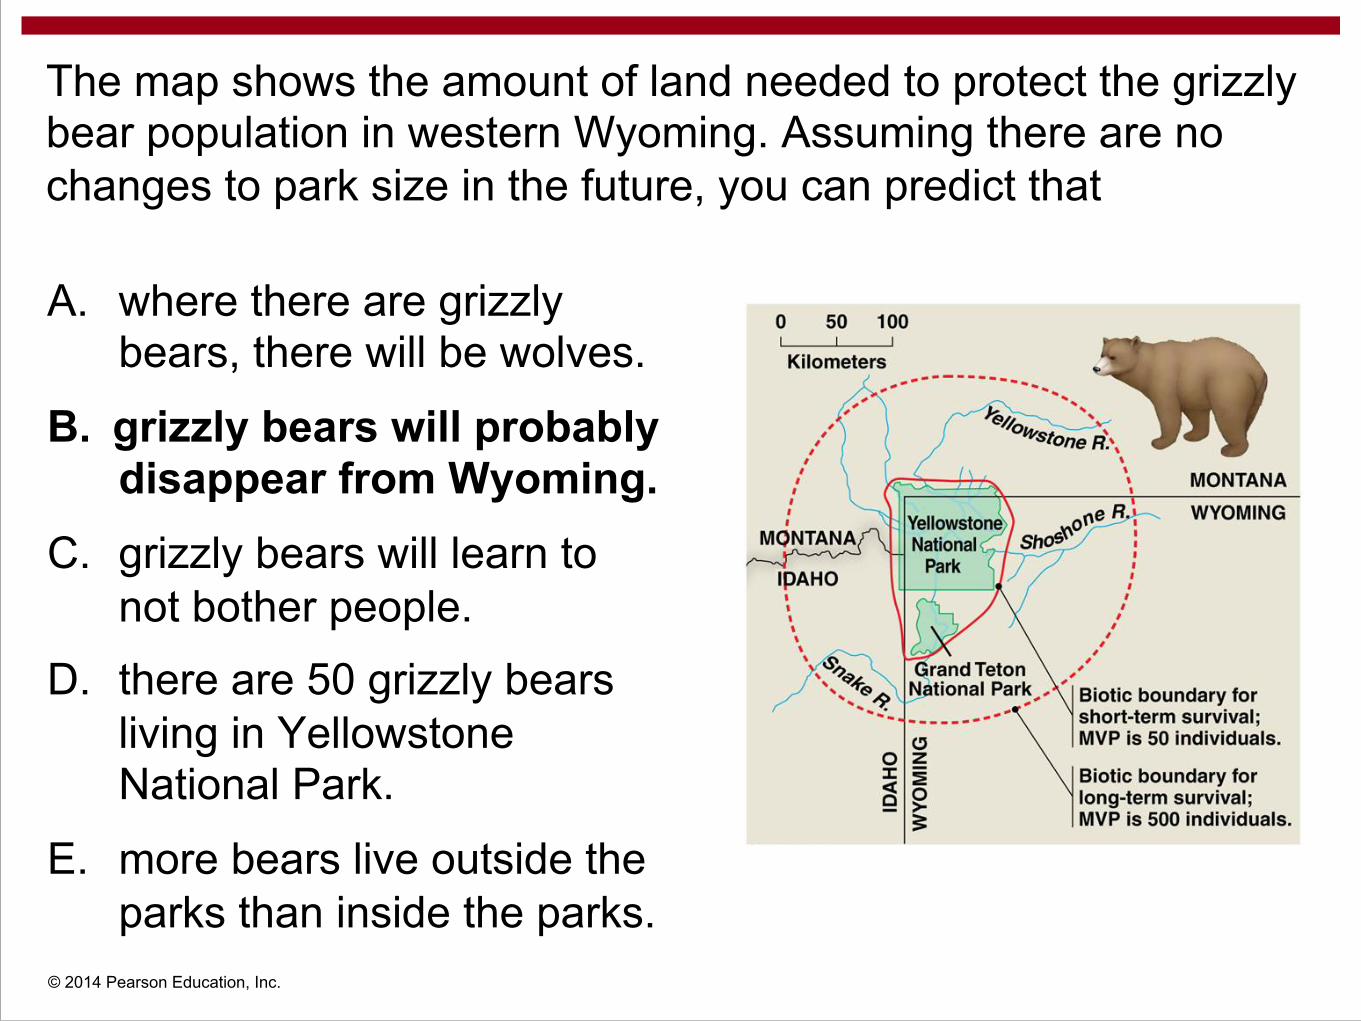
The map shows the amount of land needed to protect the grizzly bear population in western Wyoming. Assuming there are no changes to park size in the future, you can predict that
A. where there are grizzly bears, there will be wolves.
B. grizzly bears will probably disappear from Wyoming.
C. grizzly bears will learn to not bother people.
D. there are 50 grizzly bears living in Yellowstone National Park.
E. more bears live outside the parks than inside the parks.
© 2014 Pearson Education, Inc.
Costa Rica has established an extensive network of national parks and buffer zones to protect its biodiversity. However, a recent study showed that habitat loss outside these zones is significant. This shows that
A. Costa Rica is too small.
B. habitat zones don�t work.
C. biodiversity can take care of itself.
D. protecting biodiversity is difficult.
E. the laws need to be enforced better.
© 2014 Pearson Education, Inc.
We are concerned about carbon dioxide increases in our global atmosphere. Imagine that we planted trees to grow into a forest, over a large area perhaps the size of Australia. Would this be a good way to stop or slow the accumulation of carbon dioxide in the atmosphere?
A. No, because plants release carbon dioxide when they do photosynthesis.
B. Yes, because the trees would convert carbon dioxide into wood.
C. Perhaps, but when the trees died and decayed, the carbon dioxide would be returned to the atmosphere.
D. It is unlikely that plants could make much difference in global air concentrations.
E. Yes, because it would show the world we were serious about stopping global warming.
© 2014 Pearson Education, Inc.
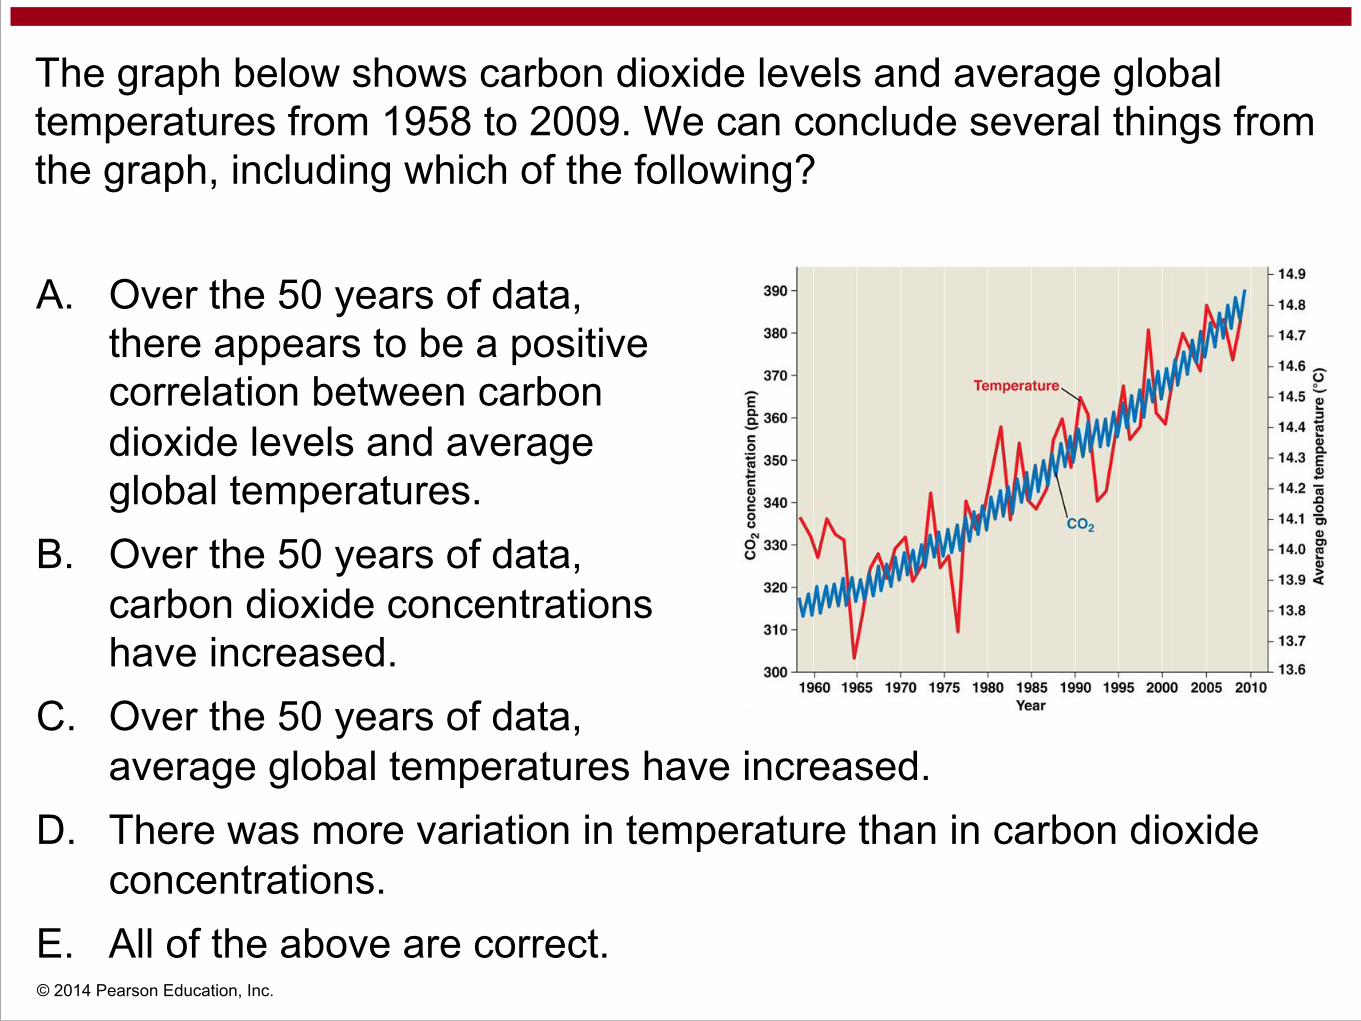
The graph below shows carbon dioxide levels and average global temperatures from 1958 to 2009. We can conclude several things from the graph, including which of the following?
A. Over the 50 years of data, there appears to be a positive correlation between carbon dioxide levels and average global temperatures.
B. Over the 50 years of data, carbon dioxide concentrations have increased.
C. Over the 50 years of data, average global temperatures have increased.
D. There was more variation in temperature than in carbon dioxide concentrations.
E. All of the above are correct.

© 2014 Pearson Education, Inc.
The graph below shows carbon dioxide levels and average global temperatures from 1958 to 2009. We can conclude several things from the graph, including which of the following?
A. Over the 50 years of data, there appears to be a positive correlation between carbon dioxide levels and average global temperatures.
B. Over the 50 years of data, carbon dioxide concentrations have increased.
C. Over the 50 years of data, average global temperatures have increased.
D. There was more variation in temperature than in carbon dioxide concentrations.
E. All of the above are correct.
© 2014 Pearson Education, Inc.
Which of the following is the biggest reason for the massive decline in biodiversity?
A. habitat destruction B. introduced species
C. overhunting
D. disruption of the food chain
© 2014 Pearson Education, Inc.
Which of the following is the biggest reason for the massive decline in biodiversity?
A. habitat destruction B. introduced species
C. overhunting
D. disruption of the food chain
© 2014 Pearson Education, Inc.
Which of the following is an example of biomagnification?
A. increased productivity due to fertilizer runoff B. toxins accumulating in tissues in higher
trophic levels
C. creating reserves and parks to protect wildlife
D. linking together a previously fragmented habitat
Solve this problem!
In order to improve species richness, you decide to add phosphate to a pond. How might you determine how much phosphate to add in order to avoid
eutrophication? Draw your proposal on a whiteboard.

Global Warming
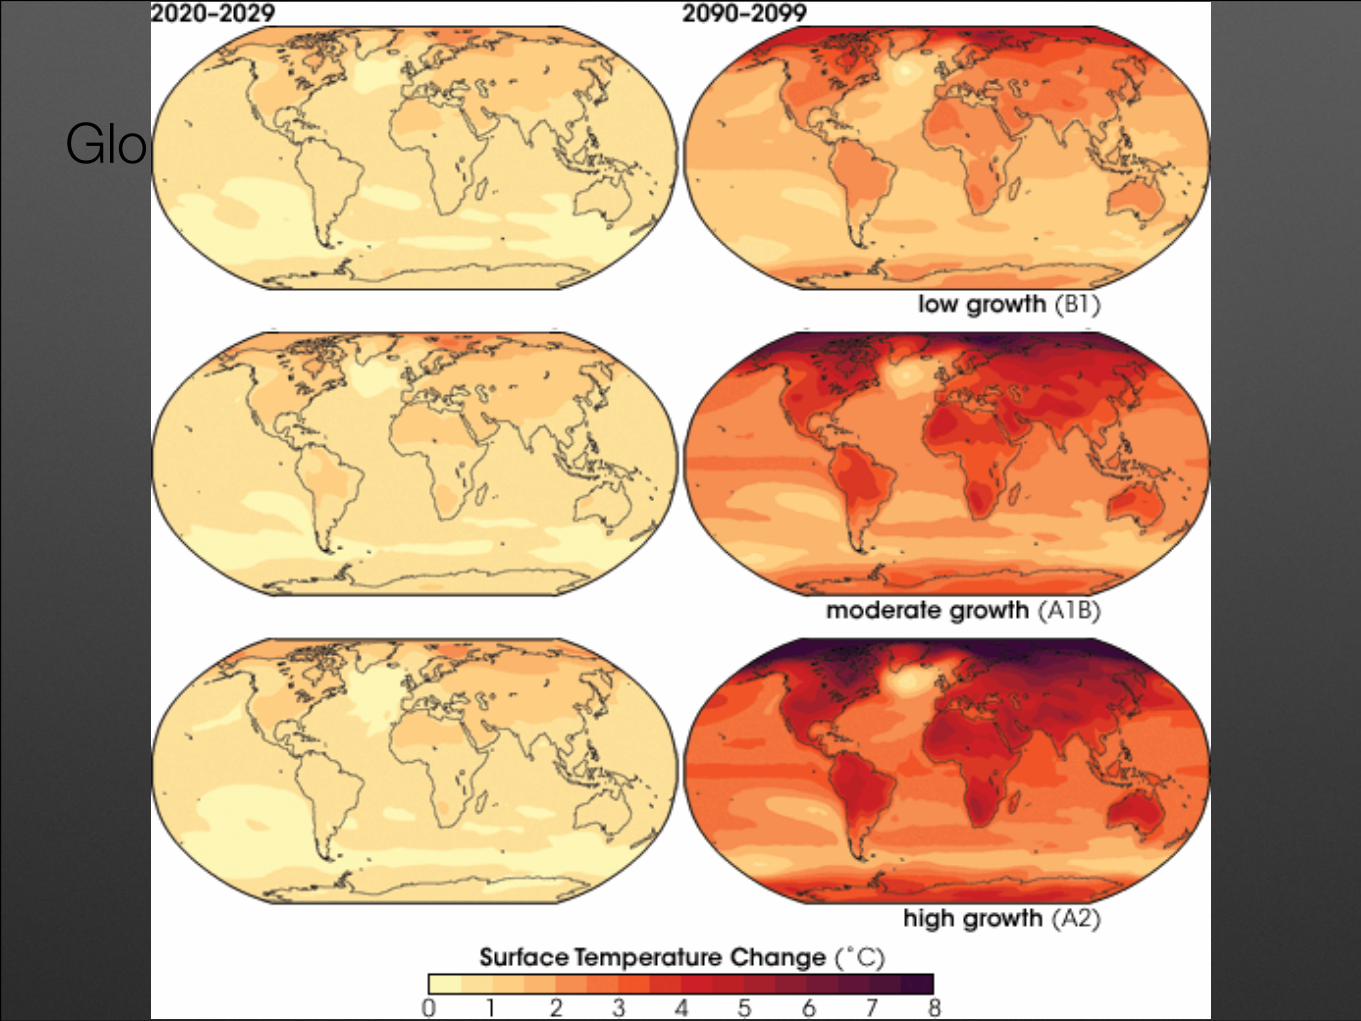
Global Warming
Endangered Species
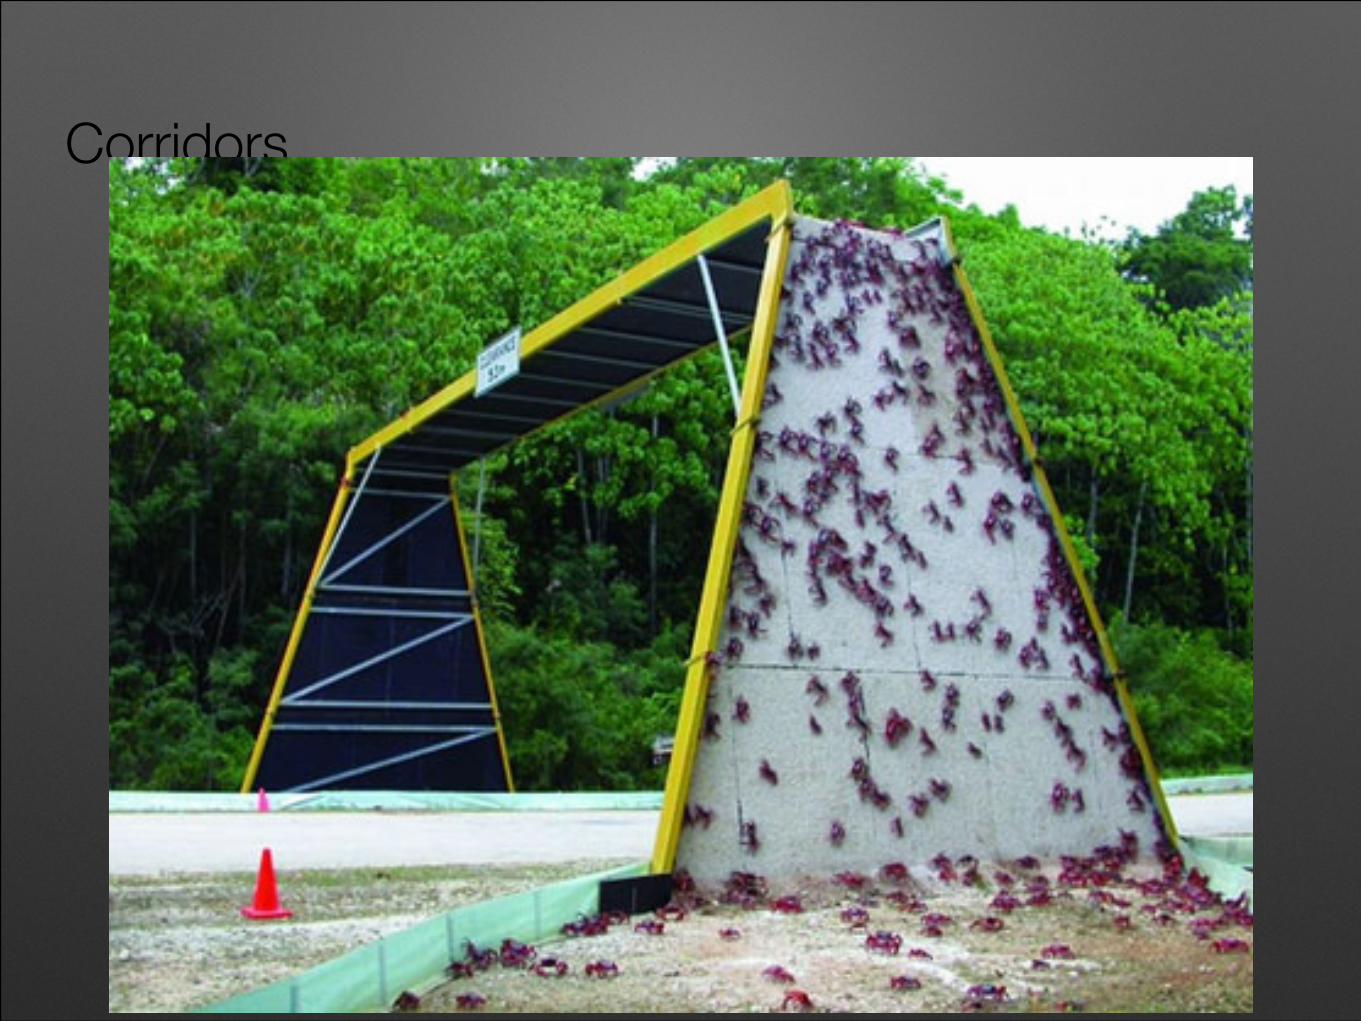
Corridors
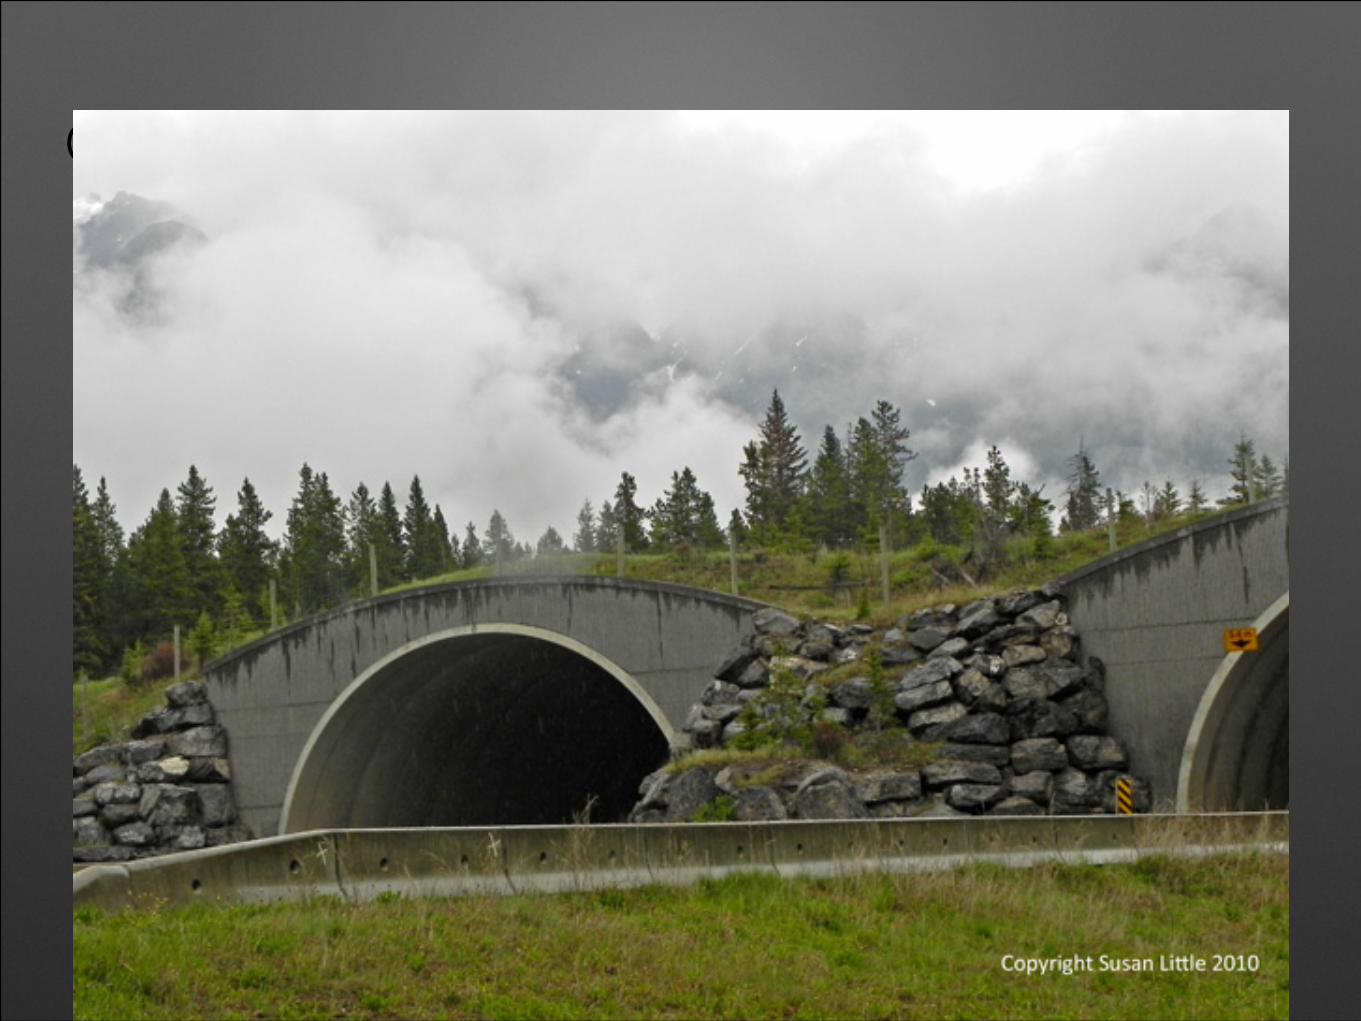
Corridors
Related Documents