AIDS AIDS impact impact Wim Van Damme Wim Van Damme Department of Public Health Department of Public Health ITM, November 2006 ITM, November 2006

AIDS impact Wim Van Damme Department of Public Health ITM, November 2006.
Dec 27, 2015
Welcome message from author
This document is posted to help you gain knowledge. Please leave a comment to let me know what you think about it! Share it to your friends and learn new things together.
Transcript

AIDSAIDSimpactimpact
Wim Van DammeWim Van Damme
Department of Public HealthDepartment of Public Health
ITM, November 2006ITM, November 2006


AIDS = political issueAIDS = political issue
Why?Why?
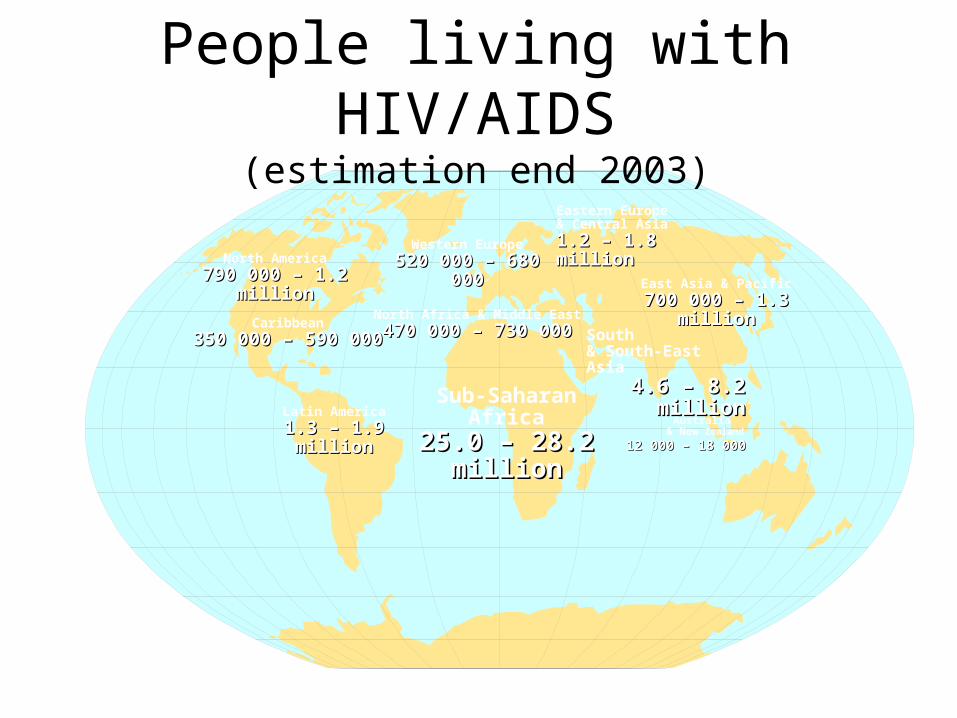
People living with HIV/AIDS(estimation end 2003)
Total: 34 – 46 million
Western Europe520 000 – 680 000520 000 – 680 000
North Africa & Middle East470 000 – 730 000470 000 – 730 000
Sub-Saharan Africa25.0 – 28.2 25.0 – 28.2
millionmillion
Eastern Europe & Central Asia1.2 – 1.8 million1.2 – 1.8 million
South & South-East Asia
4.6 – 8.2 million4.6 – 8.2 million
Australia & New Zealand
12 000 – 18 00012 000 – 18 000
North America790 000 – 1.2 million790 000 – 1.2 million
Caribbean350 000 – 590 000350 000 – 590 000
Latin America1.3 – 1.9 million1.3 – 1.9 million
East Asia & Pacific700 000 – 1.3 million700 000 – 1.3 million

A global view of HIV infectionA global view of HIV infection38.6 million people [33.4‒46.0 million] living with HIV, 2005
2.4
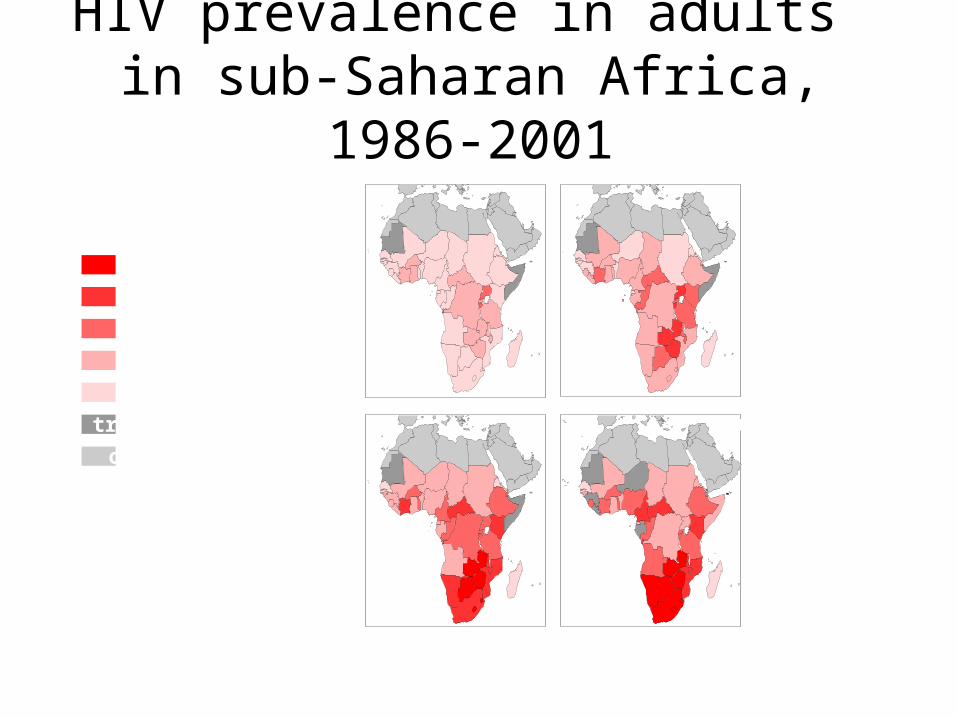
HIV prevalence in adults in sub-Saharan Africa, 1986-
2001
20 – 39%
10 – 20%
5 – 10%
1 – 5%
0 – 1%
trend data unavailable
outside region
1986 1991
1996 2001

HIV prevalence (%) in adults in Africa, 2005HIV prevalence (%) in adults in Africa, 2005
2.5
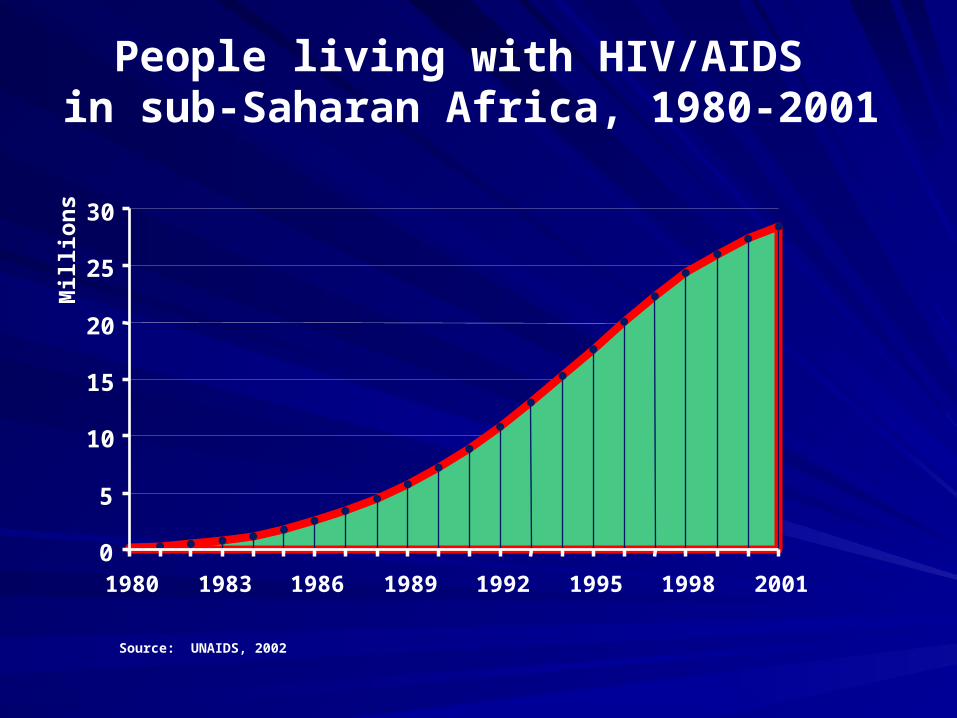
People living with HIV/AIDS in sub-Saharan Africa, 1980-2001
0
5
10
15
20
25
30
1980 1983 1986 1989 1992 1995 1998 2001
Mill
ion
s
Source: UNAIDS, 2002

People who died from HIV/AIDSin sub-Saharan Africa, 1980-2001
0
500
1,000
1,500
2,000
2,500
1980 1983 1986 1989 1992 1995 1998 2001
Th
ou
san
ds
Source: UNAIDS, 2002

HIV prevalence rate,HIV prevalence rate,adults 15-49 (%), end 2003adults 15-49 (%), end 2003
Selected countries in Southern AfricaSelected countries in Southern Africa
SwazilandSwaziland 37-40%37-40%
BotswanaBotswana 36-39%36-39%
ZimbabweZimbabwe 22-28%22-28%
NamibiaNamibia 18-25%18-25%
South-AfricaSouth-Africa 19-25%19-25%
ZambiaZambia 14-20%14-20%
MalawiMalawi 11-18%11-18%
MozambiqueMozambique 9-16%9-16%
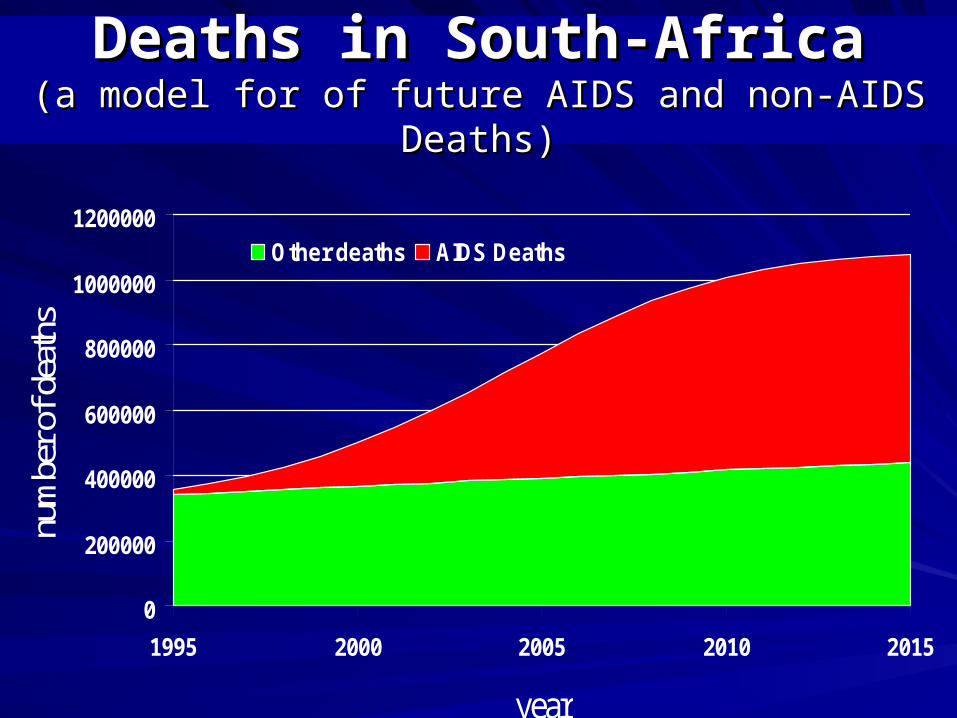
Deaths in South-AfricaDeaths in South-Africa(a model for of future AIDS and non-AIDS Deaths)(a model for of future AIDS and non-AIDS Deaths)
0
200000
400000
600000
800000
1000000
1200000
1995 2000 2005 2010 2015
year
num
ber o
f dea
ths
Other deaths AIDS Deaths

Deaths at ages 15-34Deaths at ages 15-34South Africa: 1980-2025South Africa: 1980-2025
(Estimated and projected )(Estimated and projected )
0
400
800
1,200
1,600
2,000
Dea
ths
(th
ou
san
ds)
Without AIDS
With AIDS
1980-1985 1985-1990 1990-1995 1995-2000 2000-2005 2005-2010 2010-2015 2015-2020 2020-2025

Population Structure in 2020 (Projected)Thousands
150 100 50 0 50 100 150
Males Females
With AIDS Without AIDS
Age80+757065605550454035302520151050
AIDS’ Toll on Population Structure, BotswanaAIDS’ Toll on Population Structure, Botswana
Source: U.S. Census Bureau demographic estimates and projections, 2002.
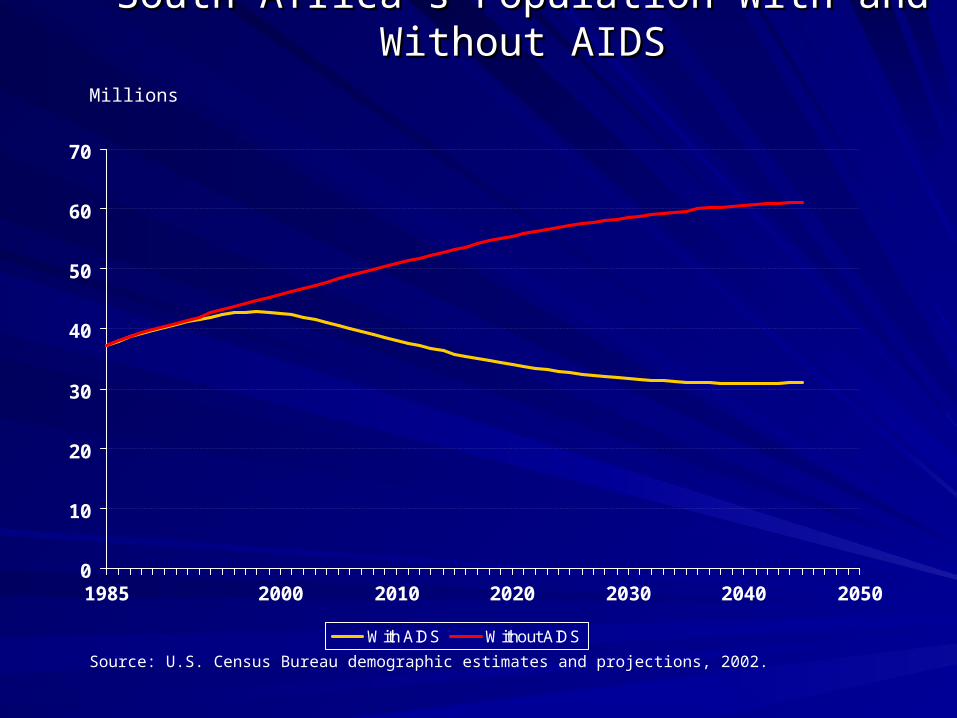
Millions
South Africa’s Population With and Without AIDSSouth Africa’s Population With and Without AIDS
0
10
20
30
40
50
60
70
1985 2000 2010 2020 2030 2040 2050
With AIDS Without AIDS
Source: U.S. Census Bureau demographic estimates and projections, 2002.

Changes in life expectancyChanges in life expectancyin selected African countries in selected African countries
with high and low HIV prevalence: 1950-2005with high and low HIV prevalence: 1950-2005
with high HIV prevalence:ZimbabweSouth AfricaBotswana
with low HIV prevalence:MadagascarSenegalMali
30
35
40
45
50
55
60
65
Lif
e e
xp
ecta
ncy
(y
ears
)
1950– 1955
1955- 1960
1960-1965
1965-1970
1970-1975
1975-1980
1980-1985
1985-1990
1990-1995
1995-2000
2000-2005

Lifetime risk of AIDS death for 15-year-old Lifetime risk of AIDS death for 15-year-old boys, boys,
(assuming unchanged or halved risk of becoming infected with (assuming unchanged or halved risk of becoming infected with HIV)HIV)
Source: Zaba B, 2000 (unpublished data)
Current adult HIV prevalence rate
Burkina Faso
Cambodia
Côte d’Ivoire
Kenya
South Africa
Zambia
Zimbabwe
Botswana
Burkina FasoCambodia
Côte d’Ivoire
Kenya
South AfricaZambia
Zimbabwe
Botswana
0%
20%
40%
60%
80%
100%
0% 5% 10% 15% 20% 25% 30% 35% 40%
Ris
k o
f d
yin
g o
f A
IDS
risk halved over next 15 years current level of risk maintained

Reduction in production in a Reduction in production in a household household
with an AIDS death, Zimbabwewith an AIDS death, Zimbabwe
Source: Stover & Bollinger, 1999
•
•
•
•
•
Crops Reduction in output
Maize
Cotton
Vegetables
Groundnuts
Cattle owned
49%
37%
29%
47%
61%

AIDS AIDS famine?? famine??Lancet article: October 2003Lancet article: October 2003

AIDS orphans in South Africa
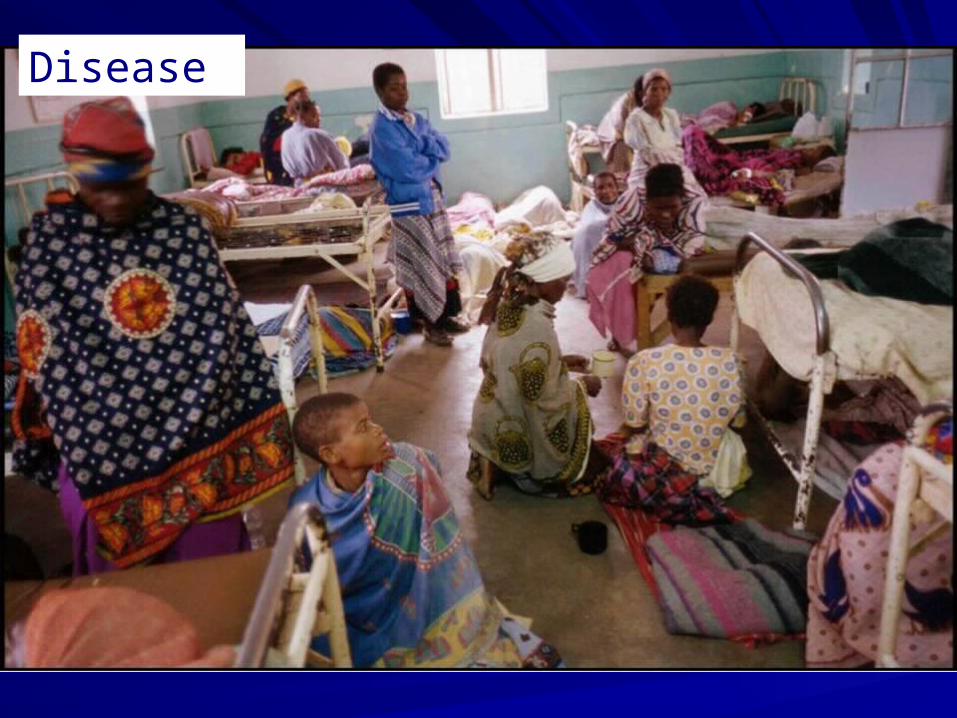
Disease

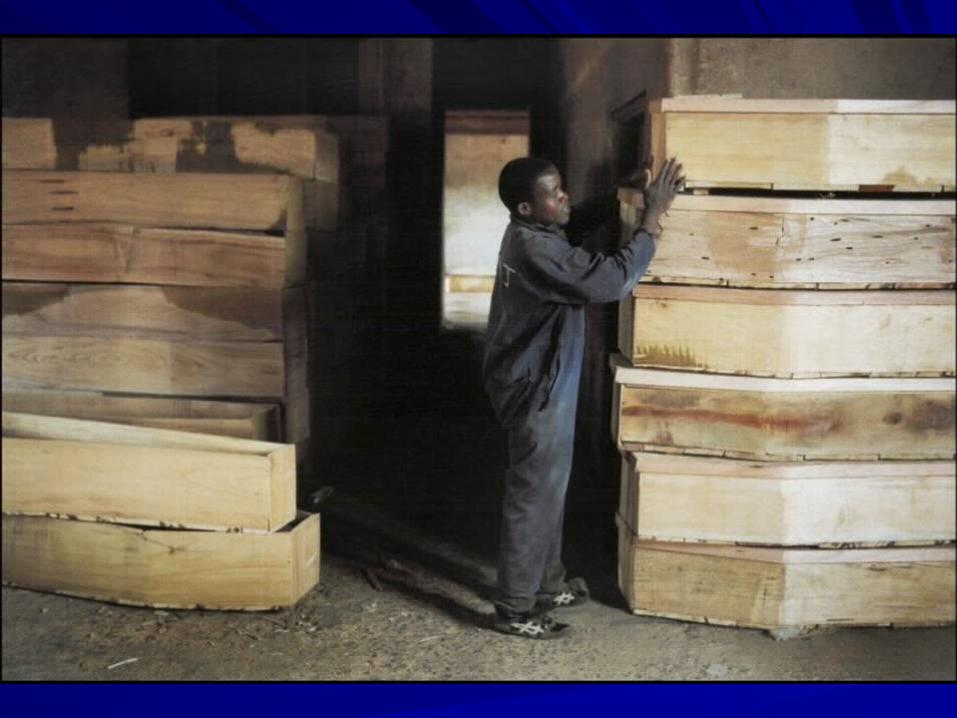
Dead

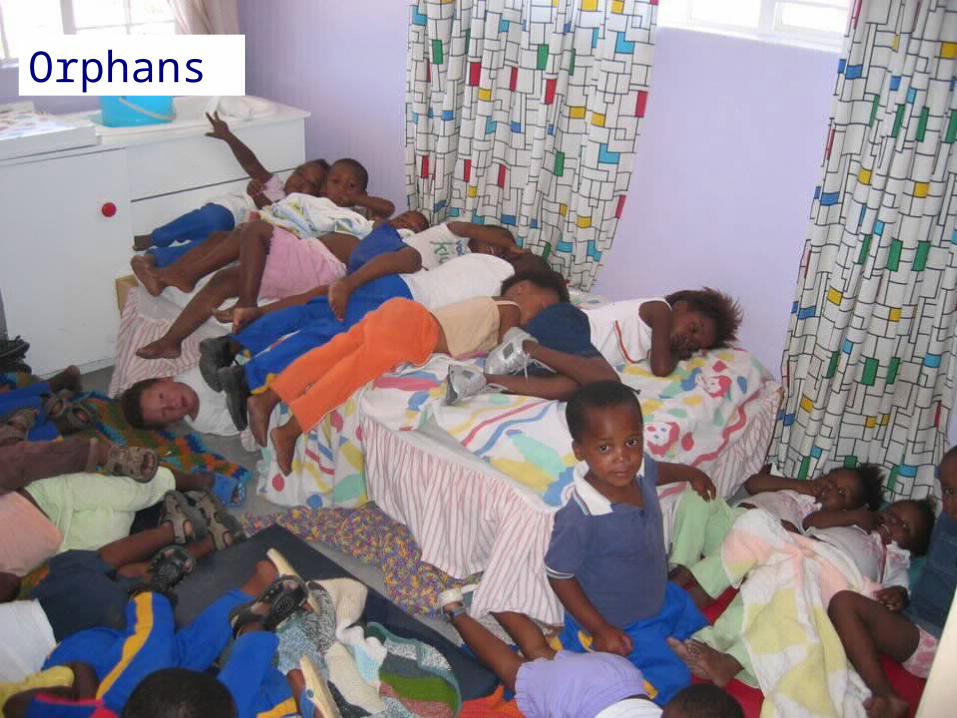
Orphans

Malawi 2004Malawi 2004

Malawi 2006Malawi 2006

Related Documents