AIB Group preliminary interim results announcement June 2012 Embargo 9.45am Friday 27 July 2012, Allied Irish Banks, p.l.c.

Welcome message from author
This document is posted to help you gain knowledge. Please leave a comment to let me know what you think about it! Share it to your friends and learn new things together.
Transcript
AIB Group preliminary interimresults announcement
June 2012
Embargo 9.45am Friday 27 July 2012, Allied Irish Banks, p.l.c.
Headlines
2
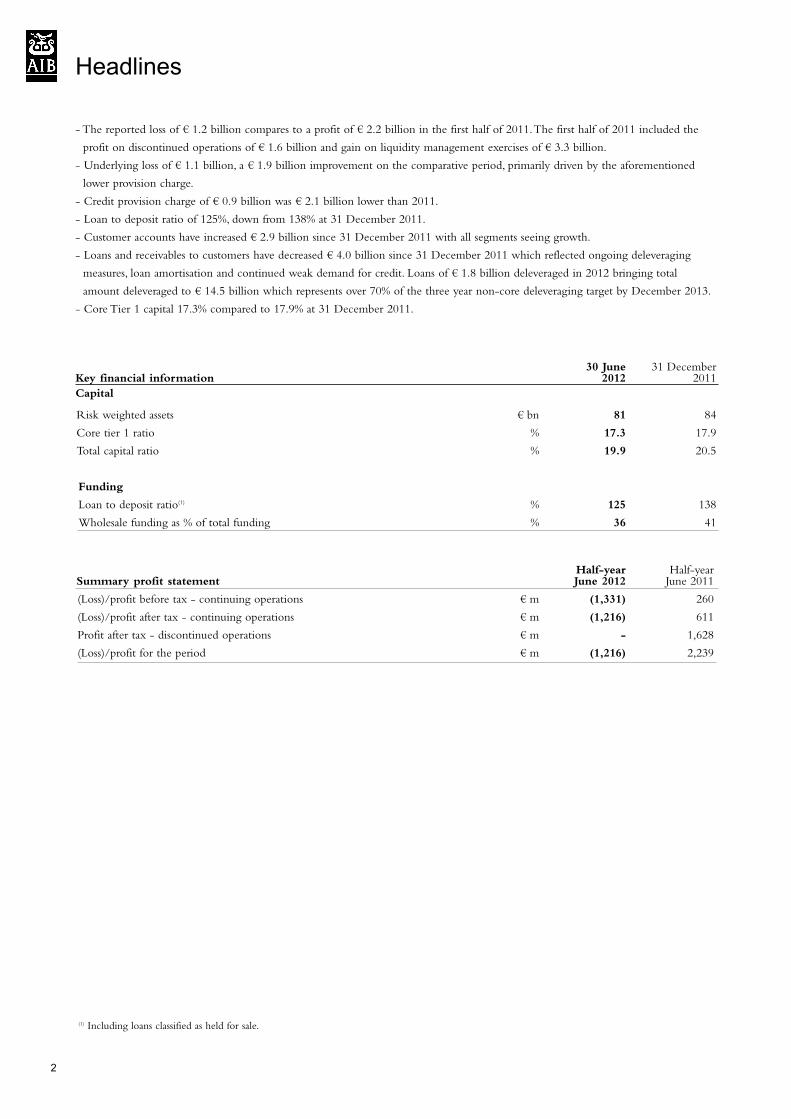
- The reported loss of € 1.2 billion compares to a profit of € 2.2 billion in the first half of 2011. The first half of 2011 included the
profit on discontinued operations of € 1.6 billion and gain on liquidity management exercises of € 3.3 billion.
- Underlying loss of € 1.1 billion, a € 1.9 billion improvement on the comparative period, primarily driven by the aforementioned
lower provision charge.
- Credit provision charge of € 0.9 billion was € 2.1 billion lower than 2011.
- Loan to deposit ratio of 125%, down from 138% at 31 December 2011.
- Customer accounts have increased € 2.9 billion since 31 December 2011 with all segments seeing growth.
- Loans and receivables to customers have decreased € 4.0 billion since 31 December 2011 which reflected ongoing deleveraging
measures, loan amortisation and continued weak demand for credit. Loans of € 1.8 billion deleveraged in 2012 bringing total
amount deleveraged to € 14.5 billion which represents over 70% of the three year non-core deleveraging target by December 2013.
- Core Tier 1 capital 17.3% compared to 17.9% at 31 December 2011.
30 June 31 DecemberKey financial information 2012 2011
Capital
Risk weighted assets € bn 81 84
Core tier 1 ratio % 17.3 17.9
Total capital ratio % 19.9 20.5
Funding
Loan to deposit ratio(1) % 125 138
Wholesale funding as % of total funding % 36 41
Half-year Half-yearSummary profit statement June 2012 June 2011
(Loss)/profit before tax - continuing operations € m (1,331) 260
(Loss)/profit after tax - continuing operations € m (1,216) 611
Profit after tax - discontinued operations € m - 1,628
(Loss)/profit for the period € m (1,216) 2,239
(1) Including loans classified as held for sale.

3
Allied Irish Banks, p.l.c. (“AIB”) today announces preliminary results for the half-year ended 30 June 2012.
Today’s announcement sets out the following:
1. Strategy
2. Operating and financial review
3.Asset quality
4. Consolidated income statement and consolidated statement of financial position
Basis of preparation
The information included in this Preliminary Announcement (which is based on unaudited interim financial statements to be
included in the June 2012 Half-Yearly Financial Report) was approved by the Board of Directors on 26 July 2012.
This Preliminary Announcement does not comply with the requirements of International Accounting Standard 34 - Interim
Financial Reporting (“IAS 34”), however, interim financial statements, which form the basis of information contained in this
Preliminary Announcement, will comply with IAS 34 when published in due course. The interim financial statements for the half-
year to 30 June 2012, prepared on a going concern basis having considered the matters as set out in the Accounting Policies section of
the Annual Financial Report 2011 on pages 229 and 230, have not yet been finalised and will be unaudited, but will be reviewed by
the auditors. The summary financial statements for the year ended 31 December 2011 as presented in this Preliminary Announcement,
represent an abbreviated version of the Group’s full accounts for that year, on which the independent auditor issued an unqualified audit
report and which are not annexed to this Preliminary Announcement, have been filed in the Companies Registration Office. The
financial information presented herein does not amount to statutory financial statements.
For the purpose of this Preliminary Announcement for the half-year ended 30 June 2012, the performance of the Group has been
presented on a total Group basis. EBS Limited (“EBS”) was acquired on 1 July 2011 and was consolidated into AIB Group financial
statements with effect from that date and accordingly, EBS is not included in the comparative period, i.e. to 30 June 2011. Segmental
information, based on the segments disclosed in the Annual Financial Report 2011, will be presented in the interim financial
statements.
Introduction
4
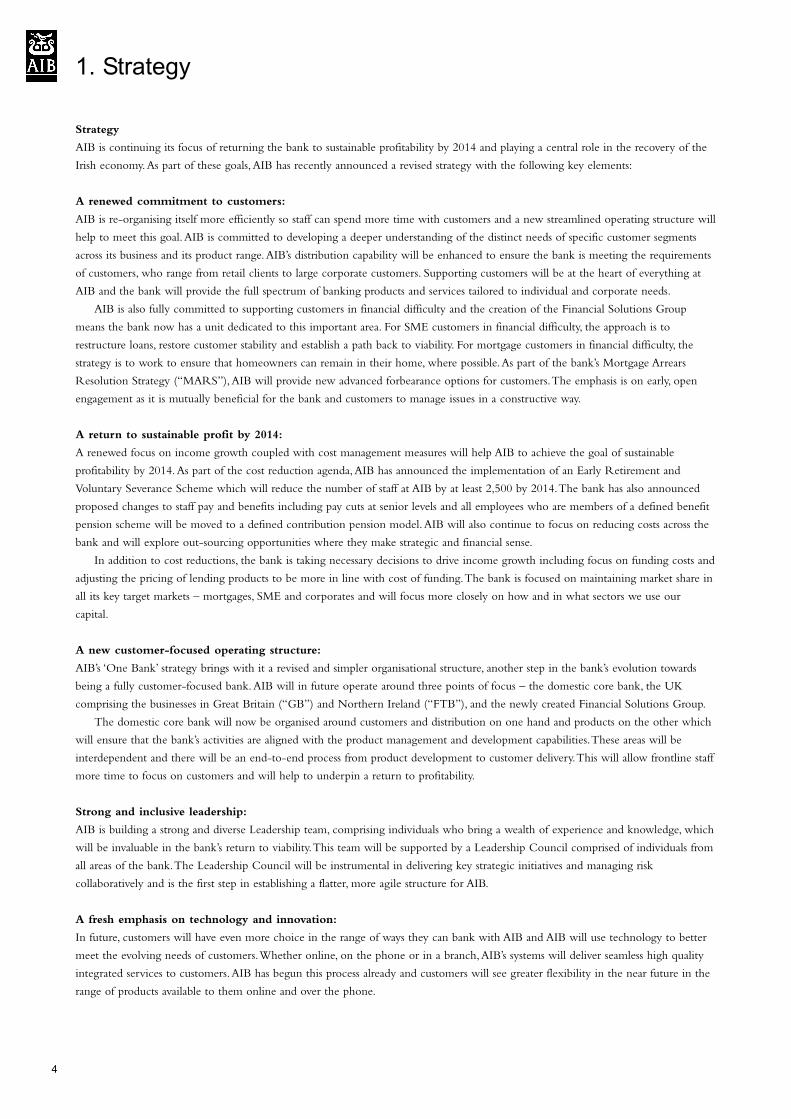
Strategy
AIB is continuing its focus of returning the bank to sustainable profitability by 2014 and playing a central role in the recovery of the
Irish economy. As part of these goals, AIB has recently announced a revised strategy with the following key elements:
A renewed commitment to customers:
AIB is re-organising itself more efficiently so staff can spend more time with customers and a new streamlined operating structure will
help to meet this goal. AIB is committed to developing a deeper understanding of the distinct needs of specific customer segments
across its business and its product range. AIB’s distribution capability will be enhanced to ensure the bank is meeting the requirements
of customers, who range from retail clients to large corporate customers. Supporting customers will be at the heart of everything at
AIB and the bank will provide the full spectrum of banking products and services tailored to individual and corporate needs.
AIB is also fully committed to supporting customers in financial difficulty and the creation of the Financial Solutions Group
means the bank now has a unit dedicated to this important area. For SME customers in financial difficulty, the approach is to
restructure loans, restore customer stability and establish a path back to viability. For mortgage customers in financial difficulty, the
strategy is to work to ensure that homeowners can remain in their home, where possible. As part of the bank’s Mortgage Arrears
Resolution Strategy (“MARS”), AIB will provide new advanced forbearance options for customers. The emphasis is on early, open
engagement as it is mutually beneficial for the bank and customers to manage issues in a constructive way.
A return to sustainable profit by 2014:
A renewed focus on income growth coupled with cost management measures will help AIB to achieve the goal of sustainable
profitability by 2014. As part of the cost reduction agenda, AIB has announced the implementation of an Early Retirement and
Voluntary Severance Scheme which will reduce the number of staff at AIB by at least 2,500 by 2014. The bank has also announced
proposed changes to staff pay and benefits including pay cuts at senior levels and all employees who are members of a defined benefit
pension scheme will be moved to a defined contribution pension model. AIB will also continue to focus on reducing costs across the
bank and will explore out-sourcing opportunities where they make strategic and financial sense.
In addition to cost reductions, the bank is taking necessary decisions to drive income growth including focus on funding costs and
adjusting the pricing of lending products to be more in line with cost of funding. The bank is focused on maintaining market share in
all its key target markets – mortgages, SME and corporates and will focus more closely on how and in what sectors we use our
capital.
A new customer-focused operating structure:
AIB’s ‘One Bank’ strategy brings with it a revised and simpler organisational structure, another step in the bank’s evolution towards
being a fully customer-focused bank. AIB will in future operate around three points of focus – the domestic core bank, the UK
comprising the businesses in Great Britain (“GB”) and Northern Ireland (“FTB”), and the newly created Financial Solutions Group.
The domestic core bank will now be organised around customers and distribution on one hand and products on the other which
will ensure that the bank’s activities are aligned with the product management and development capabilities. These areas will be
interdependent and there will be an end-to-end process from product development to customer delivery. This will allow frontline staff
more time to focus on customers and will help to underpin a return to profitability.
Strong and inclusive leadership:
AIB is building a strong and diverse Leadership team, comprising individuals who bring a wealth of experience and knowledge, which
will be invaluable in the bank’s return to viability. This team will be supported by a Leadership Council comprised of individuals from
all areas of the bank. The Leadership Council will be instrumental in delivering key strategic initiatives and managing risk
collaboratively and is the first step in establishing a flatter, more agile structure for AIB.
A fresh emphasis on technology and innovation:
In future, customers will have even more choice in the range of ways they can bank with AIB and AIB will use technology to better
meet the evolving needs of customers. Whether online, on the phone or in a branch, AIB’s systems will deliver seamless high quality
integrated services to customers. AIB has begun this process already and customers will see greater flexibility in the near future in the
range of products available to them online and over the phone.
1. Strategy

5
A redefined distribution network:
AIB is repositioning its physical network as part of a wider integration of branch and direct channels. This will help to deliver seamless
banking to our customers in a more cost efficient way. AIB’s branches remain a central part of our overall distribution strategy and will
continue to be the main channel for customers to purchase products and services. However, AIB and An Post have now agreed to
work together to extend the current banking services available at 1,100 post offices nationwide in Ireland and to include enhanced
banking services at 90 selected post offices. This initiative with An Post will support AIB in making changes to the current branch
footprint, including a reduction in the number of branches and sub-offices over time. EBS will continue to operate as a separate brand
with its own distribution network, however, work will continue to streamline operations to remove duplication with AIB’s systems.
The customer proposition at FTB is also being aligned with the integrated channels approach and a number of branch closures will
occur in the network as part of this process. Amalgamations and closures have already been announced at AIB GB as part of the
strategy for this business. AIB GB will focus on SMEs, owner managed businesses, and professional firms with a significant emphasis
on facilitating trade in both directions between Ireland and Britain.
Continued development of key stakeholder relationships:
A relationship framework is now in place with the Minister for Finance which allows the bank to move the business forward and to
manage the bank commercially. AIB is also in ongoing dialogue with the Department of Finance, the Central Bank of Ireland and the
EU/IMF/ECB Troika as it seeks to rebuild the reputation of the bank and return it to profitability.
1. Strategy
Half-year Half-yearJune 2012 June 2011
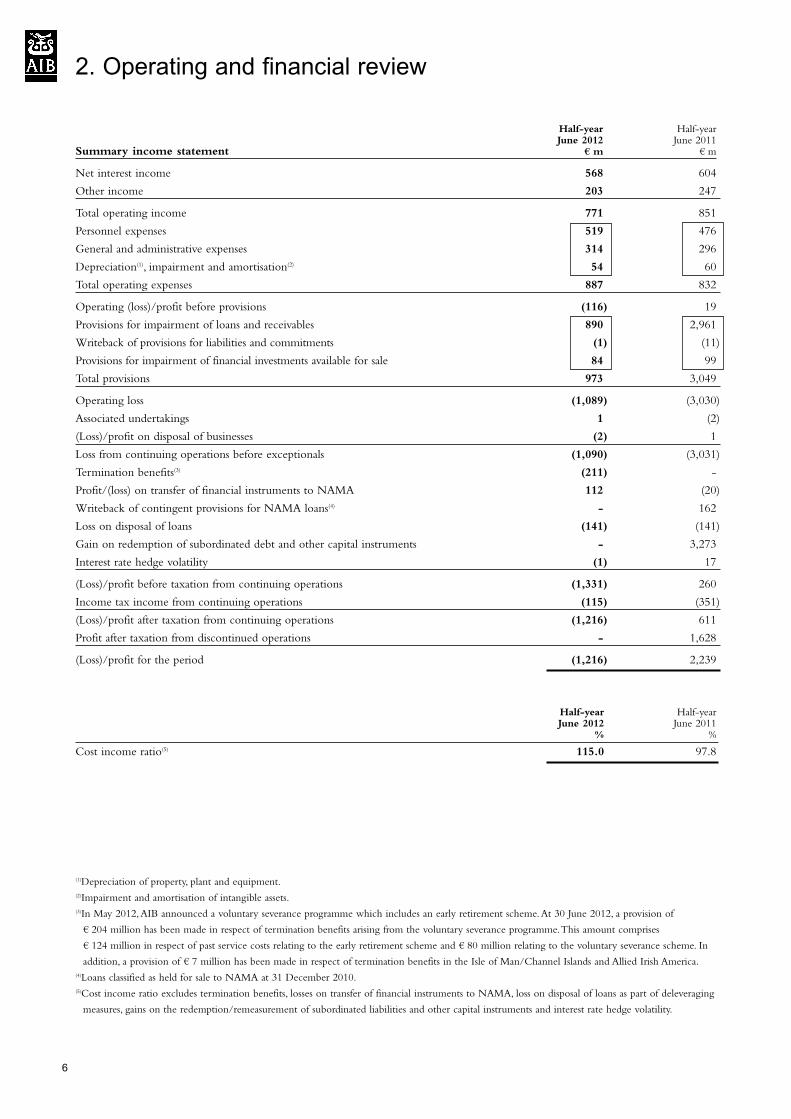
Summary income statement € m € m
Net interest income 568 604
Other income 203 247
Total operating income 771 851
Personnel expenses 519 476
General and administrative expenses 314 296
Depreciation(1), impairment and amortisation(2) 54 60
Total operating expenses 887 832
Operating (loss)/profit before provisions (116) 19
Provisions for impairment of loans and receivables 890 2,961
Writeback of provisions for liabilities and commitments (1) (11)
Provisions for impairment of financial investments available for sale 84 99
Total provisions 973 3,049
Operating loss (1,089) (3,030)
Associated undertakings 1 (2)
(Loss)/profit on disposal of businesses (2) 1
Loss from continuing operations before exceptionals (1,090) (3,031)
Termination benefits(3) (211) -
Profit/(loss) on transfer of financial instruments to NAMA 112 (20)
Writeback of contingent provisions for NAMA loans(4) - 162
Loss on disposal of loans (141) (141)
Gain on redemption of subordinated debt and other capital instruments - 3,273
Interest rate hedge volatility (1) 17
(Loss)/profit before taxation from continuing operations (1,331) 260
Income tax income from continuing operations (115) (351)
(Loss)/profit after taxation from continuing operations (1,216) 611
Profit after taxation from discontinued operations - 1,628
(Loss)/profit for the period (1,216) 2,239
Half-year Half-yearJune 2012 June 2011
% %
Cost income ratio(5) 115.0 97.8
(1)Depreciation of property, plant and equipment.(2)Impairment and amortisation of intangible assets.(3)In May 2012, AIB announced a voluntary severance programme which includes an early retirement scheme. At 30 June 2012, a provision of
€ 204 million has been made in respect of termination benefits arising from the voluntary severance programme. This amount comprises
€ 124 million in respect of past service costs relating to the early retirement scheme and € 80 million relating to the voluntary severance scheme. In
addition, a provision of € 7 million has been made in respect of termination benefits in the Isle of Man/Channel Islands and Allied Irish America.(4)Loans classified as held for sale to NAMA at 31 December 2010.(5)Cost income ratio excludes termination benefits, losses on transfer of financial instruments to NAMA, loss on disposal of loans as part of deleveraging
measures, gains on the redemption/remeasurement of subordinated liabilities and other capital instruments and interest rate hedge volatility.
6
2. Operating and financial review
7
Overview of results
The Group recorded a loss from continuing operations before exceptionals of € 1.1 billion in the half-year to June 2012 compared to
a loss of € 3.0 billion in the half-year to June 2011.
The performance reflected a reduction in the credit provision charge, although provisions still remained at a high level. Provisions
for impairments of loans and receivables reduced from € 3.0 billion in the half-year to June 2011 to € 0.9 billion in the half-year to
June 2012, a level which reflected the continued weak economic environment.
An operating loss before provisions of € 116 million excluding exceptional items was recorded in the half-year to June 2012
compared to a profit of € 19 million in the half-year to June 2011. Net interest income reduced € 36 million or 6% over the
comparative period in 2011 but excluding EBS, which contributed € 68 million, net interest income in the half year to June 2012
reduced by € 104 million or 17%. This was primarily due to increased funding costs through the customer deposit base. This impact
was partly offset by the benefit of holding higher levels of capital following the recapitalisation of AIB in 2011, by reductions in
Eligible Liabilities Guarantee (“ELG”) and by increases in performing loan margins.
Other income before exceptionals was lower in the half-year to June 2012 primarily due to lower fee and commission income as
a result of the sales of AIB Investment Managers (“AIBIM”) and AIB International Financial Services (“AIBIFS”) and lower trading
and other income which was impacted by negative fair value movements on credit derivative contracts and loan breakage costs.
Total operating expenses before termination benefit expenses increased by € 55 million compared to the half-year to June 2011.
When EBS is excluded from 2012, costs increased by € 12 million over the comparative period, representing a 1% increase.
The loss before taxation from continuing activities after exceptional items amounted to € 1.3 billion as compared to € 0.3 billion
profit for the comparative period in 2011. Exceptional items in 2011 included gains on redemption of subordinated debt and other
capital instruments of € 3.3 billion. Exceptionals in 2012 included termination benefit expenses of € 211 million predominantly in
respect of the estimated cost of the Group’s voluntary severance and early retirement schemes which were announced in May 2012
and are expected to be concluded by March 2014. Other exceptional items are detailed in the commentary on other income on page
9 of this announcement.
AIB’s core tier 1 capital ratio at 17.3% was in excess of minimum target levels as set out in the Central Bank of Ireland’s Financial
Measures Programme 2011.
Substantial progress was made on improving the Group’s funding position with the Loan to Deposit ratio (including loans held for
sale) falling from 138% at year end to 125% at 30 June 2012. All segments recorded higher customer deposits contributing to a total
increase of € 2.9 billion over the six month period.
2. Operating and financial review
Income statement commentary
Half-year Half-yearJune 2012 June 2011
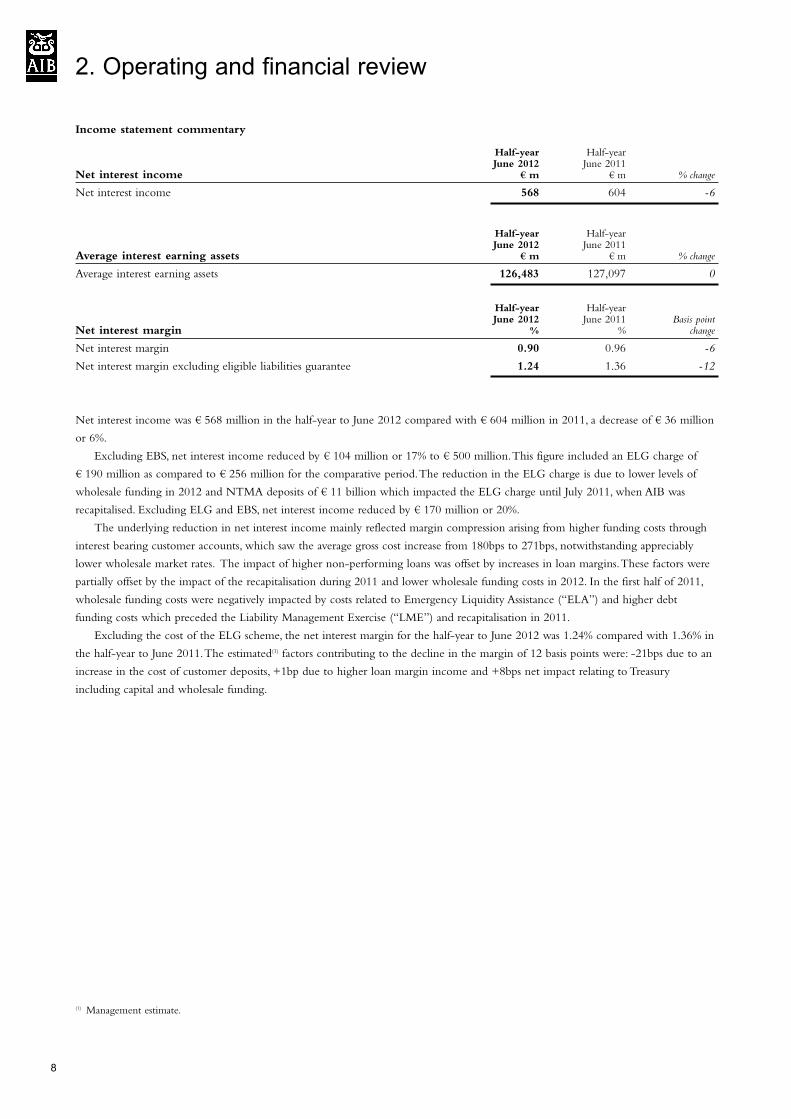
Net interest income € m € m % change
Net interest income 568 604 -6
Half-year Half-yearJune 2012 June 2011
Average interest earning assets € m € m % change
Average interest earning assets 126,483 127,097 0
Half-year Half-yearJune 2012 June 2011 Basis point
Net interest margin % % change
Net interest margin 0.90 0.96 -6
Net interest margin excluding eligible liabilities guarantee 1.24 1.36 -12
Net interest income was € 568 million in the half-year to June 2012 compared with € 604 million in 2011, a decrease of € 36 million
or 6%.
Excluding EBS, net interest income reduced by € 104 million or 17% to € 500 million. This figure included an ELG charge of
€ 190 million as compared to € 256 million for the comparative period. The reduction in the ELG charge is due to lower levels of
wholesale funding in 2012 and NTMA deposits of € 11 billion which impacted the ELG charge until July 2011, when AIB was
recapitalised. Excluding ELG and EBS, net interest income reduced by € 170 million or 20%.
The underlying reduction in net interest income mainly reflected margin compression arising from higher funding costs through
interest bearing customer accounts, which saw the average gross cost increase from 180bps to 271bps, notwithstanding appreciably
lower wholesale market rates. The impact of higher non-performing loans was offset by increases in loan margins. These factors were
partially offset by the impact of the recapitalisation during 2011 and lower wholesale funding costs in 2012. In the first half of 2011,
wholesale funding costs were negatively impacted by costs related to Emergency Liquidity Assistance (“ELA”) and higher debt
funding costs which preceded the Liability Management Exercise (“LME”) and recapitalisation in 2011.
Excluding the cost of the ELG scheme, the net interest margin for the half-year to June 2012 was 1.24% compared with 1.36% in
the half-year to June 2011. The estimated(1) factors contributing to the decline in the margin of 12 basis points were: -21bps due to an
increase in the cost of customer deposits, +1bp due to higher loan margin income and +8bps net impact relating to Treasury
including capital and wholesale funding.
(1) Management estimate.
8
2. Operating and financial review
9
Other income
Half-year Half-yearJune 2012 June 2011
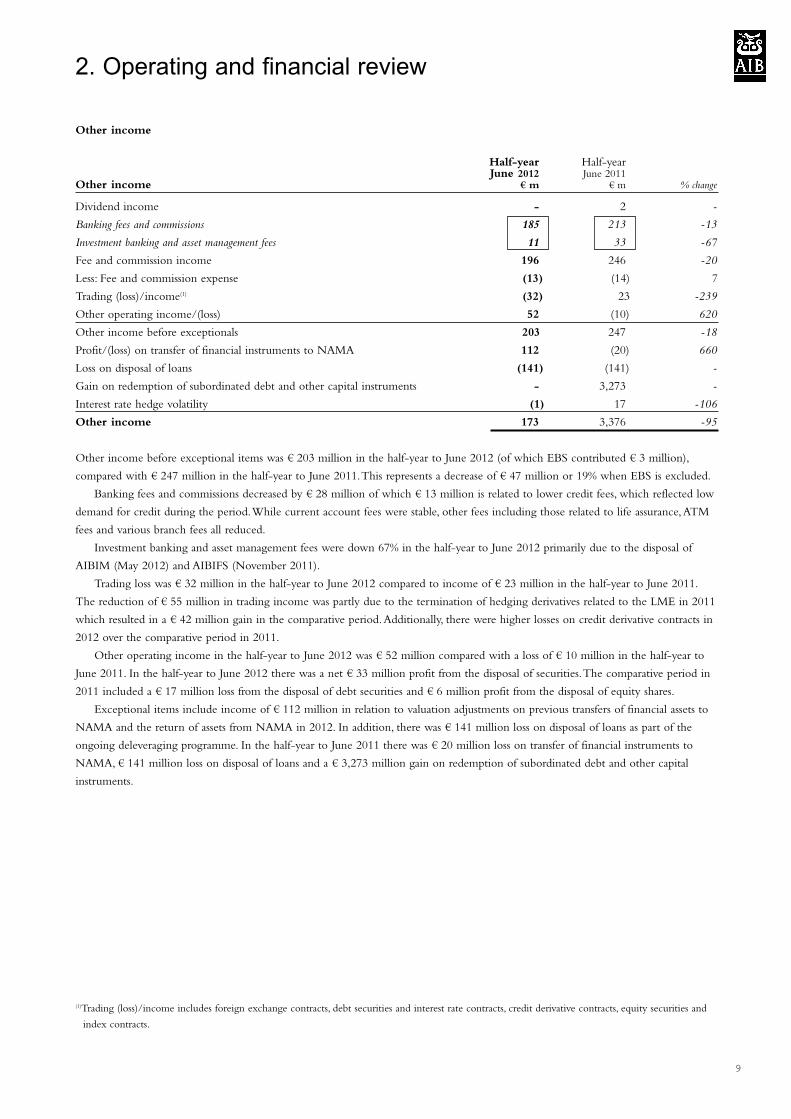
Other income € m € m % change
Dividend income - 2 -
Banking fees and commissions 185 213 -13
Investment banking and asset management fees 11 33 -67
Fee and commission income 196 246 -20
Less: Fee and commission expense (13) (14) 7
Trading (loss)/income(1) (32) 23 -239
Other operating income/(loss) 52 (10) 620
Other income before exceptionals 203 247 -18
Profit/(loss) on transfer of financial instruments to NAMA 112 (20) 660
Loss on disposal of loans (141) (141) -
Gain on redemption of subordinated debt and other capital instruments - 3,273 -
Interest rate hedge volatility (1) 17 -106
Other income 173 3,376 -95
Other income before exceptional items was € 203 million in the half-year to June 2012 (of which EBS contributed € 3 million),
compared with € 247 million in the half-year to June 2011. This represents a decrease of € 47 million or 19% when EBS is excluded.
Banking fees and commissions decreased by € 28 million of which € 13 million is related to lower credit fees, which reflected low
demand for credit during the period. While current account fees were stable, other fees including those related to life assurance, ATM
fees and various branch fees all reduced.
Investment banking and asset management fees were down 67% in the half-year to June 2012 primarily due to the disposal of
AIBIM (May 2012) and AIBIFS (November 2011).
Trading loss was € 32 million in the half-year to June 2012 compared to income of € 23 million in the half-year to June 2011.
The reduction of € 55 million in trading income was partly due to the termination of hedging derivatives related to the LME in 2011
which resulted in a € 42 million gain in the comparative period. Additionally, there were higher losses on credit derivative contracts in
2012 over the comparative period in 2011.
Other operating income in the half-year to June 2012 was € 52 million compared with a loss of € 10 million in the half-year to
June 2011. In the half-year to June 2012 there was a net € 33 million profit from the disposal of securities. The comparative period in
2011 included a € 17 million loss from the disposal of debt securities and € 6 million profit from the disposal of equity shares.
Exceptional items include income of € 112 million in relation to valuation adjustments on previous transfers of financial assets to
NAMA and the return of assets from NAMA in 2012. In addition, there was € 141 million loss on disposal of loans as part of the
ongoing deleveraging programme. In the half-year to June 2011 there was € 20 million loss on transfer of financial instruments to
NAMA, € 141 million loss on disposal of loans and a € 3,273 million gain on redemption of subordinated debt and other capital
instruments.
(1)Trading (loss)/income includes foreign exchange contracts, debt securities and interest rate contracts, credit derivative contracts, equity securities and
index contracts.
2. Operating and financial review
10
Operating expenses
Half-year Half-yearJune 2012 June 2011
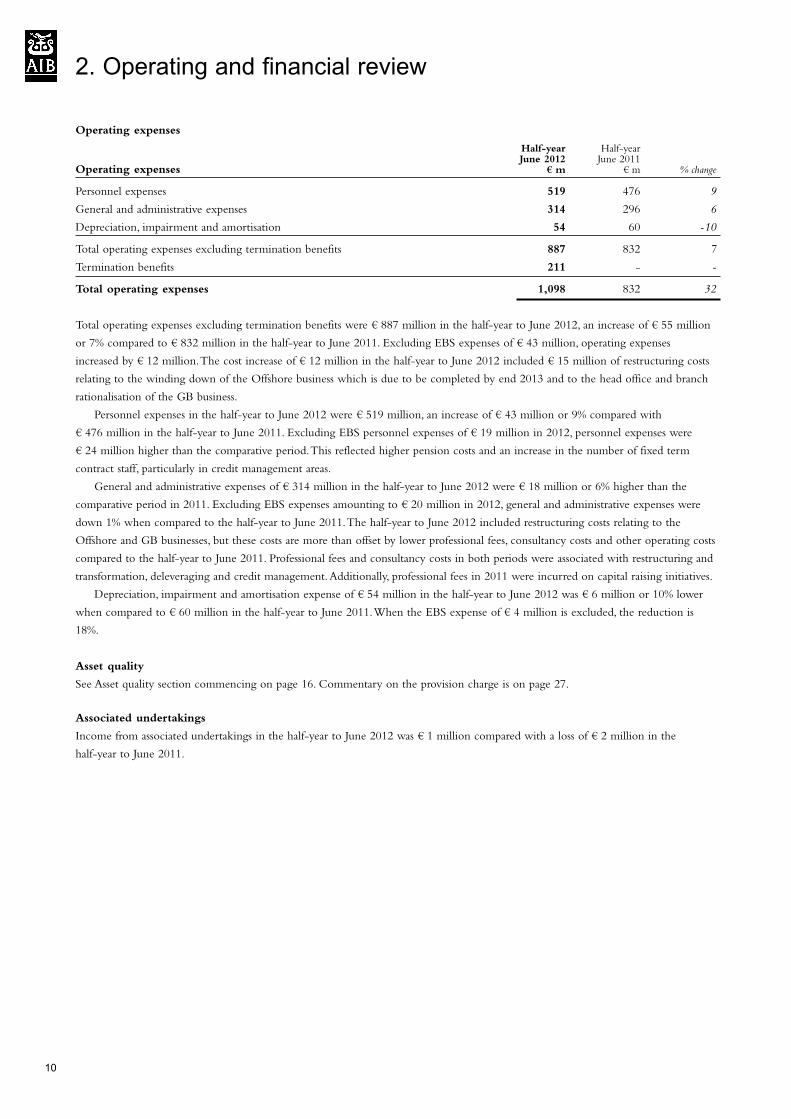
Operating expenses € m € m % change
Personnel expenses 519 476 9
General and administrative expenses 314 296 6
Depreciation, impairment and amortisation 54 60 -10
Total operating expenses excluding termination benefits 887 832 7
Termination benefits 211 - -
Total operating expenses 1,098 832 32
Total operating expenses excluding termination benefits were € 887 million in the half-year to June 2012, an increase of € 55 million
or 7% compared to € 832 million in the half-year to June 2011. Excluding EBS expenses of € 43 million, operating expenses
increased by € 12 million. The cost increase of € 12 million in the half-year to June 2012 included € 15 million of restructuring costs
relating to the winding down of the Offshore business which is due to be completed by end 2013 and to the head office and branch
rationalisation of the GB business.
Personnel expenses in the half-year to June 2012 were € 519 million, an increase of € 43 million or 9% compared with
€ 476 million in the half-year to June 2011. Excluding EBS personnel expenses of € 19 million in 2012, personnel expenses were
€ 24 million higher than the comparative period. This reflected higher pension costs and an increase in the number of fixed term
contract staff, particularly in credit management areas.
General and administrative expenses of € 314 million in the half-year to June 2012 were € 18 million or 6% higher than the
comparative period in 2011. Excluding EBS expenses amounting to € 20 million in 2012, general and administrative expenses were
down 1% when compared to the half-year to June 2011. The half-year to June 2012 included restructuring costs relating to the
Offshore and GB businesses, but these costs are more than offset by lower professional fees, consultancy costs and other operating costs
compared to the half-year to June 2011. Professional fees and consultancy costs in both periods were associated with restructuring and
transformation, deleveraging and credit management. Additionally, professional fees in 2011 were incurred on capital raising initiatives.
Depreciation, impairment and amortisation expense of € 54 million in the half-year to June 2012 was € 6 million or 10% lower
when compared to € 60 million in the half-year to June 2011. When the EBS expense of € 4 million is excluded, the reduction is
18%.
Asset quality
See Asset quality section commencing on page 16. Commentary on the provision charge is on page 27.
Associated undertakings
Income from associated undertakings in the half-year to June 2012 was € 1 million compared with a loss of € 2 million in the
half-year to June 2011.
2. Operating and financial review
11
Income tax
The taxation credit for the half-year to June 2012 was €115 million (including a € 107 million credit relating to deferred taxation),
compared with a taxation credit of € 351 million in the half-year to June 2011 (including a credit of € 356 million relating to
deferred taxation). The credit is influenced by the geographic mix of profits and losses, which are taxed at the rates applicable in the
jurisdictions where the Group operates. With specific exceptions consistent with the year ended 31 December 2011, deferred tax
credit continues to be recognised in full for the value of tax losses arising in Group companies, as it is expected that the tax losses will
be utilised in full against future profits.
Discontinued operations
There were no discontinued operations in the half-year to June 2012. The results for the half-year to June 2011 included the
consolidated results of BZWBK for the quarter to 31 March 2011 and the profit on sale of BZWBK completed on 1 April 2011.
Half-year Half-yearJune 2012 June 2011
Profit from discontinued operations € m € m
BZWBK - 99
BACB - -
Profit before taxation - 99
Income tax expense - 17
Profit after taxation - 82
Profit on disposal of business - 1,546
Profit for the period from discontinued operations - 1,628
2. Operating and financial review
12
Balance sheet commentary
The balance sheet identifies loans classified as held for sale as part of deleveraging measures (included in ‘Disposal groups and
non-current assets held for sale’) separately from other customer loans. Loan balances in the following tables include these balances in
order to reflect the full movement in customer loans.
30 June 31 December2012 2011
Gross loans € bn € bn % change
Gross loans to customers 93.4 97.5 -4
Other gross loans held for sale 2.0 1.2 67
Total 95.4 98.7 -3
Gross customer loans were down 3% or € 3.3 billion since 31 December 2011. This reduction reflected ongoing deleveraging
measures, loan amortisation and continued weak demand for credit in the half-year to June 2012.
30 June 31 December2012 2011
Net loans € bn € bn % change
Net loans to customers 78.0 82.5 -5
Other net loans held for sale 1.7 1.2 42
Total 79.7 83.7 -5
Net loans decreased by € 4.0 billion or 5% to € 79.7 billion at 30 June 2012. The overall reduction reflected the aforementioned
ongoing deleveraging measures, loan amortisation, weaker credit demand and loan loss provisions.
Deleveraging
The bank achieved net loan reduction of € 1.8 billion in the six months to June 2012 in relation to its deleveraging objectives. This
brings the total amount deleveraged by the bank to € 14.5 billion which represents over 70% of the three year non-core deleveraging
target of € 20.5 billion by December 2013.
30 June 31 December2012 2011
Customer accounts € bn € bn % change
Customer accounts 63.6 60.7 5
Total customer accounts increased by almost 5% or € 2.9 billion to € 63.6 billion since December 2011. While markets remain
challenging, confidence levels improved enabling the bank to grow its deposit base appreciably since December 2011.
2. Operating and financial review
13
The Group’s core tier 1 ratio decreased from 17.9% at 31 December 2011 to 17.3% at 30 June 2012. The total capital ratio decreased
from 20.5% to 19.9% for the same period. The following table summarises the Group’s capital position.
30 June 31 December2012 2011
Risk weighted assets € m € m
Credit 74,357 77,863
Market 526 560
Operational 5,952 5,856
Total 80,835 84,279
30 June 31 December2012 2011
Capital € m € m
Core tier 1 13,994 15,065
Total capital 16,062 17,302
30 June 31 December2012 2011
Capital ratios % %
Core tier 1 17.3 17.9
Total capital 19.9 20.5
Risk weighted assets reduced by € 3.4 billion in the period. The reduction is mainly due to the effects of deleveraging and increased
provisions, which are offset to a degree by deterioration in credit quality, particularly in the mortgage portfolio.
Core tier 1 capital has reduced by € 1.1 billion in the period. This is due to an attributable loss for the period of € 1.2 billion,
partially offset by an increase in other eligible reserves.
The net impact of these movements together with the decrease in risk weighted assets is a reduction in the core tier 1 capital ratio
from 17.9% at 31 December 2011 to 17.3% at 30 June 2012.
Total capital reduced by € 1.2 billion during the period due to the movements in core tier 1 described above, in addition to a
€ 0.2 billion reduction in tier 2 capital due mainly to a regulatory restriction on the amount of subordinated debt which may be
included in tier 2 capital for an instrument that is within five years to maturity. This restriction applies to the € 1.6 billion contingent
capital instrument.
The total capital ratio decreased from 20.5% as at 31 December 2011 to 19.9% as at 30 June 2012 which reflected the reduction
in risk weighted assets and the reduction in total capital.
2. Operating and financial review
14
Funding30 June 2012 31 December 2011
Sources of funds - total AIB Group basis € bn % € bn %
Customer accounts 64 52 61 47
Deposits by central banks and banks - secured 30 25 36 28
- unsecured 1 1 1 1
Asset covered securities 4 3 4 3
Securitisation 1 1 1 1
Senior debt 7 6 11 8
Capital(1) 15 12 15 12
Total source of funds 122 100 129 100
Other(2) 8 8
Total liabilities and shareholders funds 130 137
Customer deposits contributed 52% of the total funding requirement at 30 June 2012, up from 47% at 31 December 2011, largely due
to an increase in deposit volumes of almost € 3 billion over the period. Strong growth was experienced across all business areas during
this period, as sentiment towards Ireland and Irish banks improved. In addition, Allied Irish Bank (GB) and First Trust Bank in
Northern Ireland will withdraw from the Eligible Liabilities Guarantee scheme on 17 August 2012. This is consistent with the bank’s
wish to ultimately operate without the Guarantee.
Secured funding has decreased by € 6 billion due to asset deleveraging and the sale of securities held in AIB’s available for sale
(“AFS”) portfolio. At 30 June 2012, AIB availed of € 25 billion Central Bank secured funding down from € 31 billion at
31 December 2011. AIB extended its debt maturity by increasing its participation in the 3 year Long Term Refinancing Operation
(“LTRO”) from € 3 billion at December 2011 to € 11 billion by 30 June 2012. Reducing the bank’s reliance on ECB funding will
continue to be a key objective of management. Senior debt as a percentage of funding sources decreased by 2% in 2012 to 6% at
30 June 2012 reflecting the maturity of € 3 billion in Medium Term Notes. Asset covered securities (“ACS”) as a percentage of
funding sources has remained flat at 3% as at 30 June 2012. The bank has an objective to increase the available liquidity collateral from
balance sheet assets. In the half-year to 30 June 2012, AIB issued a £ 0.3 billion Residential Mortgage Backed Securitisation
(“RMBS”) collateralised by UK assets.
The Group’s loan deposit ratio decreased from 138% at 31 December 2011 to 125% at 30 June 2012 (including loans and
receivables held for sale). The Group is managing to interim targets agreed with the Central Bank of Ireland for the Liquidity
Coverage Ratio (“LCR”) and Net Stable Funding Ratio (“NSFR”) pending their formal introduction as regulatory standards in 2015
and 2018 respectively.
Wholesale funding markets continued to be challenging in 2012. This is a symptom of the difficult fiscal position which gave rise
to the EU/ECB/IMF financial support package, the Europe-wide uncertainty in the first half of 2012 and the Group’s credit rating.
AIB’s restructuring plan targets reductions in the bank’s wholesale funding dependency, while maintaining its deposit franchise. The
performance of the economy and the retention and gathering of stable customer accounts in a challenging and competitive market
environment will be the key factors influencing the bank’s capacity for asset growth. Coupled with the action to deleverage non-core
assets, this is paramount to increasing the pool of available liquid assets and to the Group’s overall funding/liquidity strategy.
(1) Includes total shareholders’ equity, subordinated liabilities and other capital instruments.(2) Non-funding liabilities including derivative financial instruments, other liabilities, retirement benefits and accruals and other deferred income.
2. Operating and financial review
15
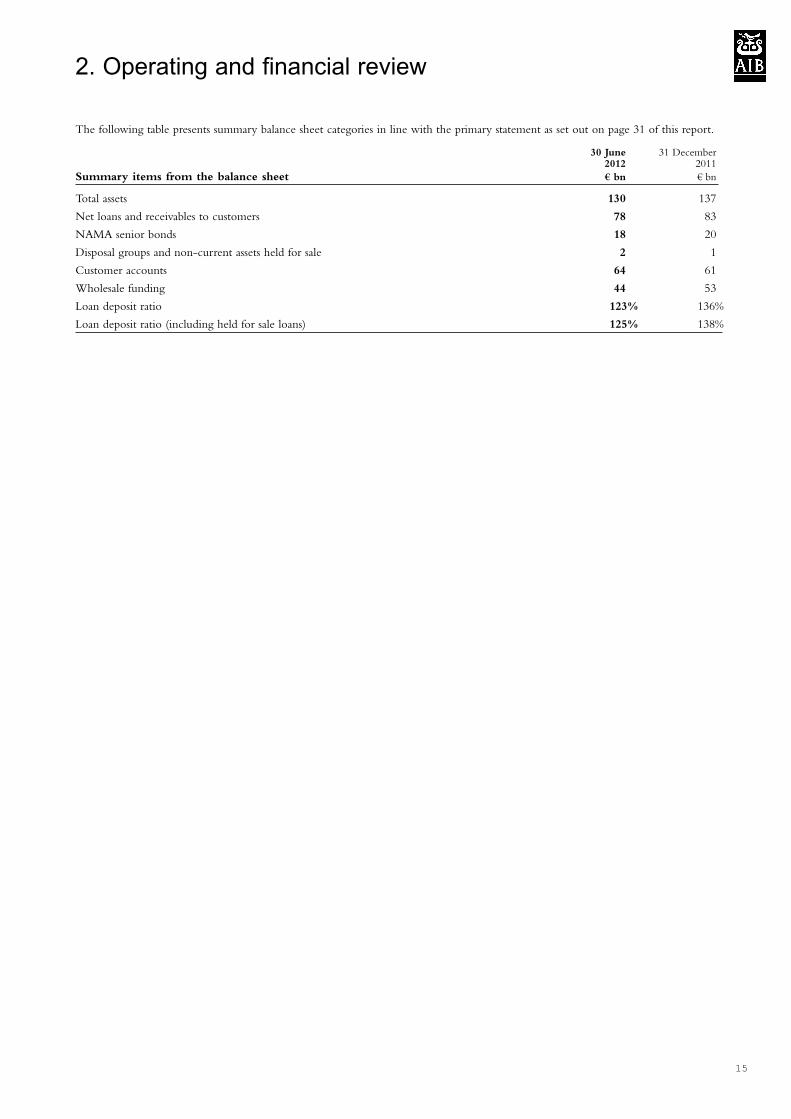
The following table presents summary balance sheet categories in line with the primary statement as set out on page 31 of this report.
30 June 31 December2012 2011
Summary items from the balance sheet € bn € bn
Total assets 130 137
Net loans and receivables to customers 78 83
NAMA senior bonds 18 20
Disposal groups and non-current assets held for sale 2 1
Customer accounts 64 61
Wholesale funding 44 53
Loan deposit ratio 123% 136%
Loan deposit ratio (including held for sale loans) 125% 138%
2. Operating and financial review
16
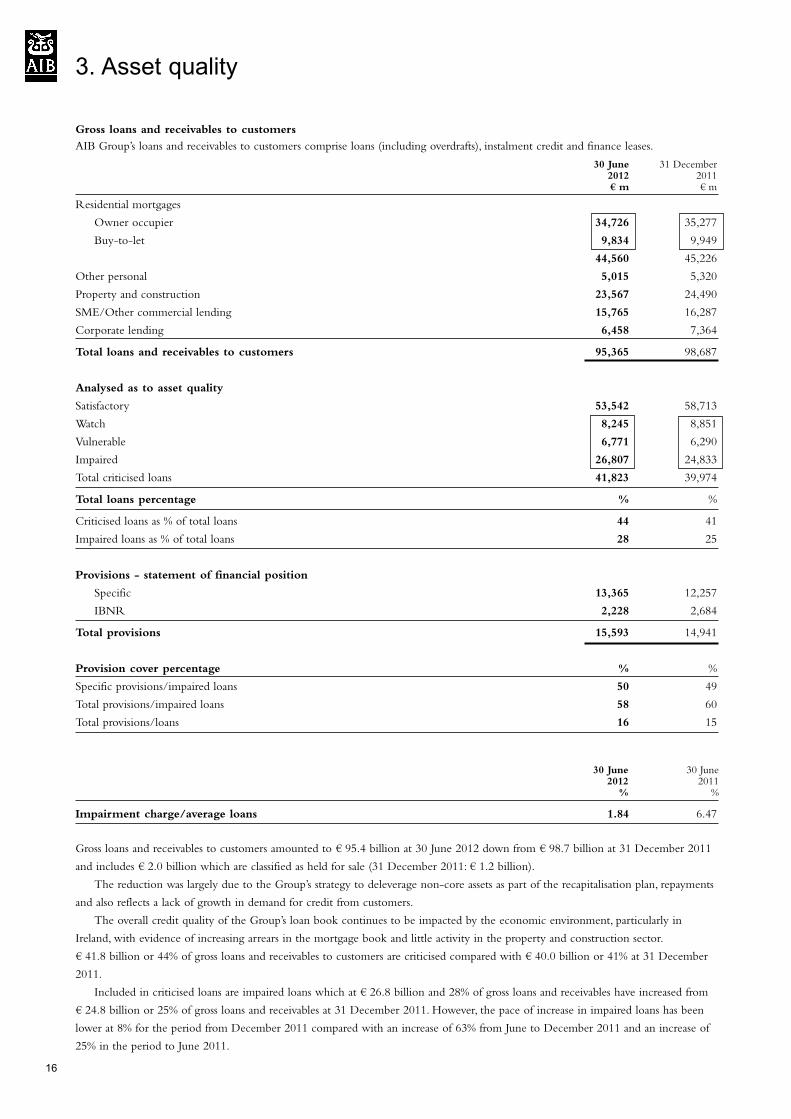
Gross loans and receivables to customers
AIB Group’s loans and receivables to customers comprise loans (including overdrafts), instalment credit and finance leases.
30 June 31 December2012 2011€ m € m
Residential mortgages
Owner occupier 34,726 35,277
Buy-to-let 9,834 9,949
44,560 45,226
Other personal 5,015 5,320
Property and construction 23,567 24,490
SME/Other commercial lending 15,765 16,287
Corporate lending 6,458 7,364
Total loans and receivables to customers 95,365 98,687
Analysed as to asset quality
Satisfactory 53,542 58,713
Watch 8,245 8,851
Vulnerable 6,771 6,290
Impaired 26,807 24,833
Total criticised loans 41,823 39,974
Total loans percentage % %
Criticised loans as % of total loans 44 41
Impaired loans as % of total loans 28 25
Provisions - statement of financial position
Specific 13,365 12,257
IBNR 2,228 2,684
Total provisions 15,593 14,941
Provision cover percentage % %
Specific provisions/impaired loans 50 49
Total provisions/impaired loans 58 60
Total provisions/loans 16 15
30 June 30 June2012 2011% %
Impairment charge/average loans 1.84 6.47
Gross loans and receivables to customers amounted to € 95.4 billion at 30 June 2012 down from € 98.7 billion at 31 December 2011
and includes € 2.0 billion which are classified as held for sale (31 December 2011: € 1.2 billion).
The reduction was largely due to the Group’s strategy to deleverage non-core assets as part of the recapitalisation plan, repayments
and also reflects a lack of growth in demand for credit from customers.
The overall credit quality of the Group’s loan book continues to be impacted by the economic environment, particularly in
Ireland, with evidence of increasing arrears in the mortgage book and little activity in the property and construction sector.
€ 41.8 billion or 44% of gross loans and receivables to customers are criticised compared with € 40.0 billion or 41% at 31 December
2011.
Included in criticised loans are impaired loans which at € 26.8 billion and 28% of gross loans and receivables have increased from
€ 24.8 billion or 25% of gross loans and receivables at 31 December 2011. However, the pace of increase in impaired loans has been
lower at 8% for the period from December 2011 compared with an increase of 63% from June to December 2011 and an increase of
25% in the period to June 2011.
3. Asset quality
Gross loans and receivables to customers (continued)
Statement of financial position specific provisions of € 13.4 billion are held for impaired loans providing cover of 50%, up slightly from
49% at 31 December 2011.
The Group has € 2.2 billion in statement of financial position incurred but not reported (“IBNR”) provisions representing 3.25%
of the non-impaired book compared with € 2.7 billion or 3.63% at the end of 2011.
The income statement provision charge for the half-year to 30 June 2012 was € 890 million or 1.84% (annualised) compared with
€ 2,907 million or 6.47% (annualised) of average non-NAMA loans and receivables to customers for the same period in 2011. The
provision charge comprised € 1,355 million in specific provisions and a writeback of IBNR provisions of € 465 million (30 June 2011:
€ 2,766 million in specific provisions and a provision charge of € 141 million in IBNR provisions).
While credit quality continues to deteriorate and the environment in Ireland remains uncertain for borrowers, the reduced income
statement provision charge reflects the extent to which impaired loans had already been recognised and provisions, particularly for
more vulnerable portfolios, had been raised in 2011.The 2011 full year income statement provision charge for non-NAMA loans and
receivables to customers was € 7,774 million.
Criticised loans include Watch(1), Vulnerable(2) and Impaired(3) loans and receivables to customers.
(1)Watch: credit exhibiting weakness but with the expectation that existing debt can be fully repaid from normal cashflow.
(2)Vulnerable: credit where repayment is in jeopardy from normal cashflow and may be dependent on other sources.
(3)Impaired: a loan is impaired if there is objective evidence of impairment as a result of one or more events that occurred after the initial recognition of
the assets (a ‘loss event’) and that loss event (or events) has an impact such that the present value of future cashflows is less than the gross carrying
value of the financial asset or group of assets i.e. requiring a provision to be raised through the income statement.
3. Asset quality
17
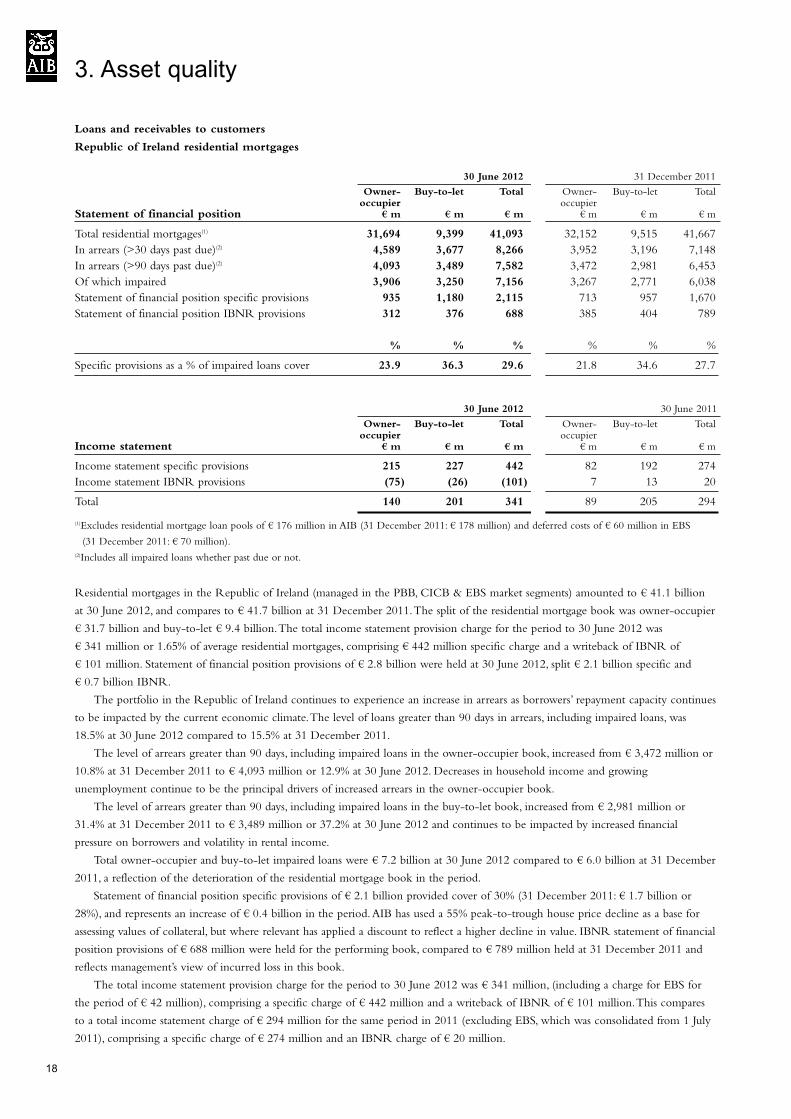
Loans and receivables to customers
Republic of Ireland residential mortgages
30 June 2012 31 December 2011
Owner- Buy-to-let Total Owner- Buy-to-let Totaloccupier occupier
Statement of financial position € m € m € m € m € m € m
Total residential mortgages(1) 31,694 9,399 41,093 32,152 9,515 41,667
In arrears (>30 days past due)(2) 4,589 3,677 8,266 3,952 3,196 7,148
In arrears (>90 days past due)(2) 4,093 3,489 7,582 3,472 2,981 6,453
Of which impaired 3,906 3,250 7,156 3,267 2,771 6,038
Statement of financial position specific provisions 935 1,180 2,115 713 957 1,670
Statement of financial position IBNR provisions 312 376 688 385 404 789
% % % % % %
Specific provisions as a % of impaired loans cover 23.9 36.3 29.6 21.8 34.6 27.7
30 June 2012 30 June 2011
Owner- Buy-to-let Total Owner- Buy-to-let Totaloccupier occupier
Income statement € m € m € m € m € m € m
Income statement specific provisions 215 227 442 82 192 274
Income statement IBNR provisions (75) (26) (101) 7 13 20
Total 140 201 341 89 205 294
(1)Excludes residential mortgage loan pools of € 176 million in AIB (31 December 2011: € 178 million) and deferred costs of € 60 million in EBS
(31 December 2011: € 70 million).(2)Includes all impaired loans whether past due or not.
Residential mortgages in the Republic of Ireland (managed in the PBB, CICB & EBS market segments) amounted to € 41.1 billion
at 30 June 2012, and compares to € 41.7 billion at 31 December 2011. The split of the residential mortgage book was owner-occupier
€ 31.7 billion and buy-to-let € 9.4 billion. The total income statement provision charge for the period to 30 June 2012 was
€ 341 million or 1.65% of average residential mortgages, comprising € 442 million specific charge and a writeback of IBNR of
€ 101 million. Statement of financial position provisions of € 2.8 billion were held at 30 June 2012, split € 2.1 billion specific and
€ 0.7 billion IBNR.
The portfolio in the Republic of Ireland continues to experience an increase in arrears as borrowers’ repayment capacity continues
to be impacted by the current economic climate. The level of loans greater than 90 days in arrears, including impaired loans, was
18.5% at 30 June 2012 compared to 15.5% at 31 December 2011.
The level of arrears greater than 90 days, including impaired loans in the owner-occupier book, increased from € 3,472 million or
10.8% at 31 December 2011 to € 4,093 million or 12.9% at 30 June 2012. Decreases in household income and growing
unemployment continue to be the principal drivers of increased arrears in the owner-occupier book.
The level of arrears greater than 90 days, including impaired loans in the buy-to-let book, increased from € 2,981 million or
31.4% at 31 December 2011 to € 3,489 million or 37.2% at 30 June 2012 and continues to be impacted by increased financial
pressure on borrowers and volatility in rental income.
Total owner-occupier and buy-to-let impaired loans were € 7.2 billion at 30 June 2012 compared to € 6.0 billion at 31 December
2011, a reflection of the deterioration of the residential mortgage book in the period.
Statement of financial position specific provisions of € 2.1 billion provided cover of 30% (31 December 2011: € 1.7 billion or
28%), and represents an increase of € 0.4 billion in the period. AIB has used a 55% peak-to-trough house price decline as a base for
assessing values of collateral, but where relevant has applied a discount to reflect a higher decline in value. IBNR statement of financial
position provisions of € 688 million were held for the performing book, compared to € 789 million held at 31 December 2011 and
reflects management’s view of incurred loss in this book.
The total income statement provision charge for the period to 30 June 2012 was € 341 million, (including a charge for EBS for
the period of € 42 million), comprising a specific charge of € 442 million and a writeback of IBNR of € 101 million. This compares
to a total income statement charge of € 294 million for the same period in 2011 (excluding EBS, which was consolidated from 1 July
2011), comprising a specific charge of € 274 million and an IBNR charge of € 20 million.
3. Asset quality
18
Loans and receivables to customers (continued)
Credit profile of residential mortgages
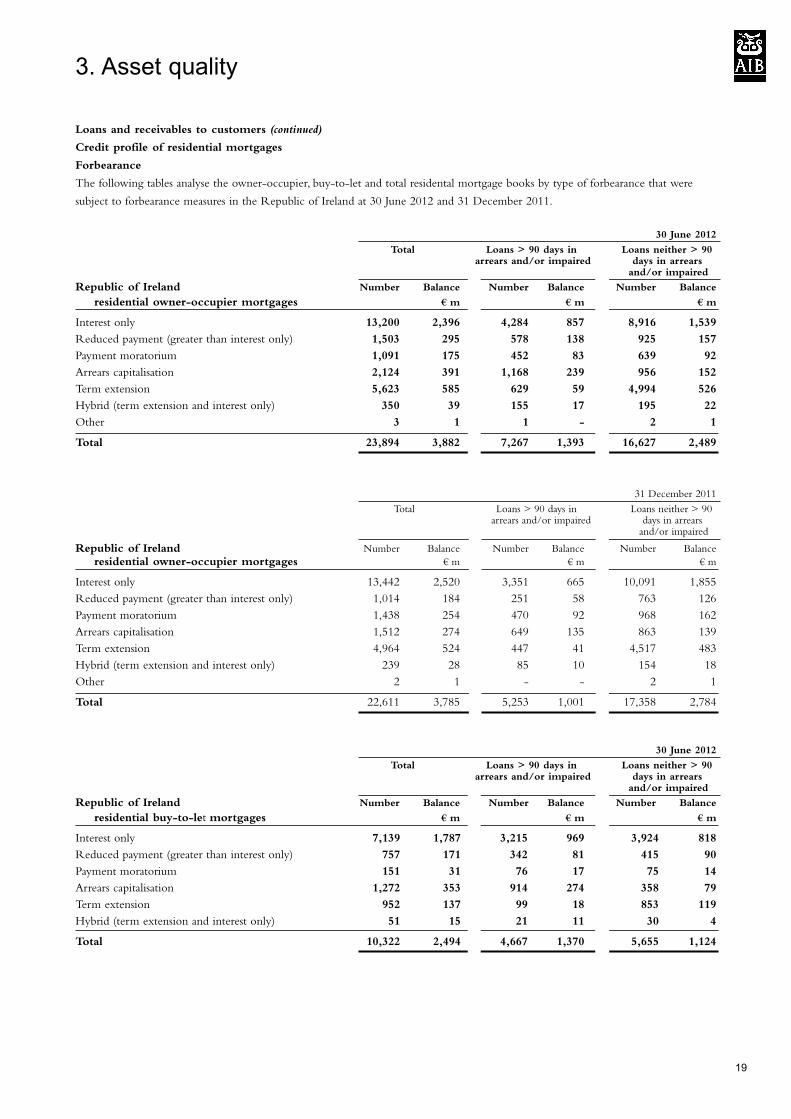
Forbearance
The following tables analyse the owner-occupier, buy-to-let and total residental mortgage books by type of forbearance that were
subject to forbearance measures in the Republic of Ireland at 30 June 2012 and 31 December 2011.
30 June 2012
Total Loans > 90 days in Loans neither > 90arrears and/or impaired days in arrears
and/or impaired
Republic of Ireland Number Balance Number Balance Number Balance
residential owner-occupier mortgages € m € m € m
Interest only 13,200 2,396 4,284 857 8,916 1,539
Reduced payment (greater than interest only) 1,503 295 578 138 925 157
Payment moratorium 1,091 175 452 83 639 92
Arrears capitalisation 2,124 391 1,168 239 956 152
Term extension 5,623 585 629 59 4,994 526
Hybrid (term extension and interest only) 350 39 155 17 195 22
Other 3 1 1 - 2 1
Total 23,894 3,882 7,267 1,393 16,627 2,489
31 December 2011
Total Loans > 90 days in Loans neither > 90arrears and/or impaired days in arrears
and/or impaired
Republic of Ireland Number Balance Number Balance Number Balance
residential owner-occupier mortgages € m € m € m
Interest only 13,442 2,520 3,351 665 10,091 1,855
Reduced payment (greater than interest only) 1,014 184 251 58 763 126
Payment moratorium 1,438 254 470 92 968 162
Arrears capitalisation 1,512 274 649 135 863 139
Term extension 4,964 524 447 41 4,517 483
Hybrid (term extension and interest only) 239 28 85 10 154 18
Other 2 1 - - 2 1
Total 22,611 3,785 5,253 1,001 17,358 2,784
30 June 2012
Total Loans > 90 days in Loans neither > 90arrears and/or impaired days in arrears
and/or impaired
Republic of Ireland Number Balance Number Balance Number Balance
residential buy-to-let mortgages € m € m € m
Interest only 7,139 1,787 3,215 969 3,924 818
Reduced payment (greater than interest only) 757 171 342 81 415 90
Payment moratorium 151 31 76 17 75 14
Arrears capitalisation 1,272 353 914 274 358 79
Term extension 952 137 99 18 853 119
Hybrid (term extension and interest only) 51 15 21 11 30 4
Total 10,322 2,494 4,667 1,370 5,655 1,124
3. Asset quality
19
3. Asset quality
Loans and receivables to customers (continued)
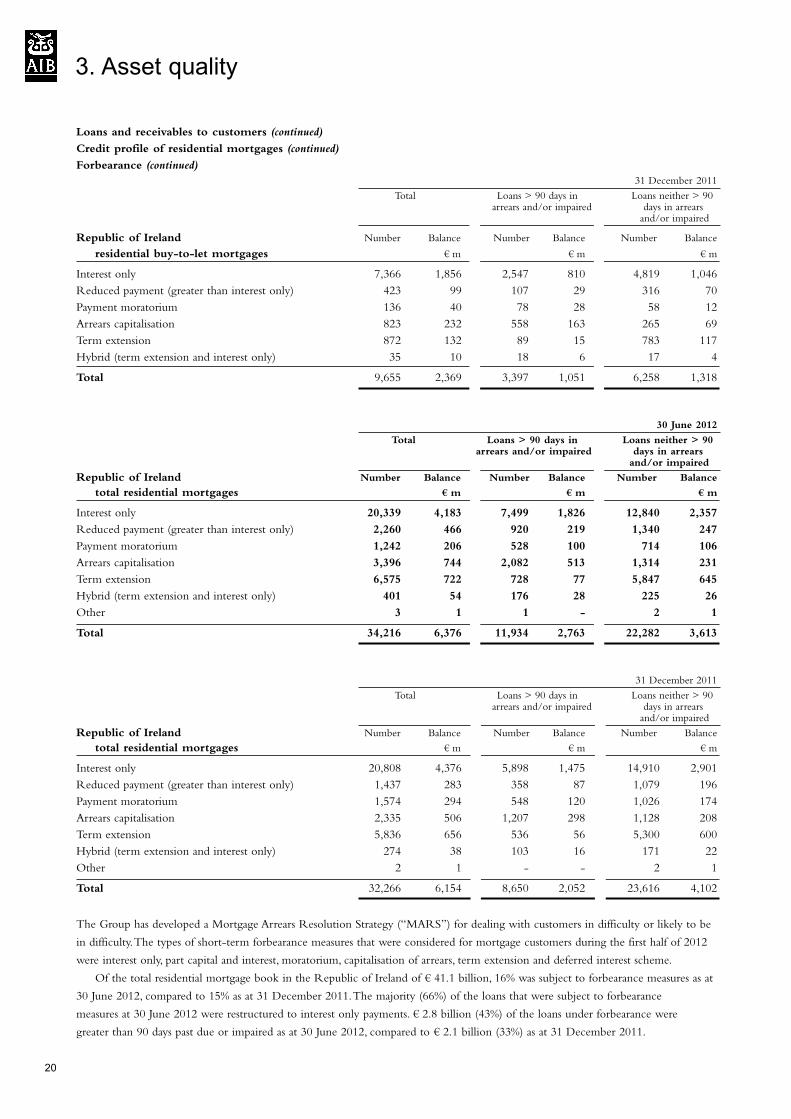
Credit profile of residential mortgages (continued)
Forbearance (continued)
31 December 2011
Total Loans > 90 days in Loans neither > 90arrears and/or impaired days in arrears
and/or impaired
Republic of Ireland Number Balance Number Balance Number Balance
residential buy-to-let mortgages € m € m € m
Interest only 7,366 1,856 2,547 810 4,819 1,046
Reduced payment (greater than interest only) 423 99 107 29 316 70
Payment moratorium 136 40 78 28 58 12
Arrears capitalisation 823 232 558 163 265 69
Term extension 872 132 89 15 783 117
Hybrid (term extension and interest only) 35 10 18 6 17 4
Total 9,655 2,369 3,397 1,051 6,258 1,318
30 June 2012
Total Loans > 90 days in Loans neither > 90arrears and/or impaired days in arrears
and/or impaired
Republic of Ireland Number Balance Number Balance Number Balance
total residential mortgages € m € m € m
Interest only 20,339 4,183 7,499 1,826 12,840 2,357
Reduced payment (greater than interest only) 2,260 466 920 219 1,340 247
Payment moratorium 1,242 206 528 100 714 106
Arrears capitalisation 3,396 744 2,082 513 1,314 231
Term extension 6,575 722 728 77 5,847 645
Hybrid (term extension and interest only) 401 54 176 28 225 26
Other 3 1 1 - 2 1
Total 34,216 6,376 11,934 2,763 22,282 3,613
31 December 2011
Total Loans > 90 days in Loans neither > 90arrears and/or impaired days in arrears
and/or impaired
Republic of Ireland Number Balance Number Balance Number Balance
total residential mortgages € m € m € m
Interest only 20,808 4,376 5,898 1,475 14,910 2,901
Reduced payment (greater than interest only) 1,437 283 358 87 1,079 196
Payment moratorium 1,574 294 548 120 1,026 174
Arrears capitalisation 2,335 506 1,207 298 1,128 208
Term extension 5,836 656 536 56 5,300 600
Hybrid (term extension and interest only) 274 38 103 16 171 22
Other 2 1 - - 2 1
Total 32,266 6,154 8,650 2,052 23,616 4,102
The Group has developed a Mortgage Arrears Resolution Strategy (“MARS”) for dealing with customers in difficulty or likely to be
in difficulty. The types of short-term forbearance measures that were considered for mortgage customers during the first half of 2012
were interest only, part capital and interest, moratorium, capitalisation of arrears, term extension and deferred interest scheme.
Of the total residential mortgage book in the Republic of Ireland of € 41.1 billion, 16% was subject to forbearance measures as at
30 June 2012, compared to 15% as at 31 December 2011. The majority (66%) of the loans that were subject to forbearance
measures at 30 June 2012 were restructured to interest only payments. € 2.8 billion (43%) of the loans under forbearance were
greater than 90 days past due or impaired as at 30 June 2012, compared to € 2.1 billion (33%) as at 31 December 2011.
20
Loans and receivables to customers (continued)
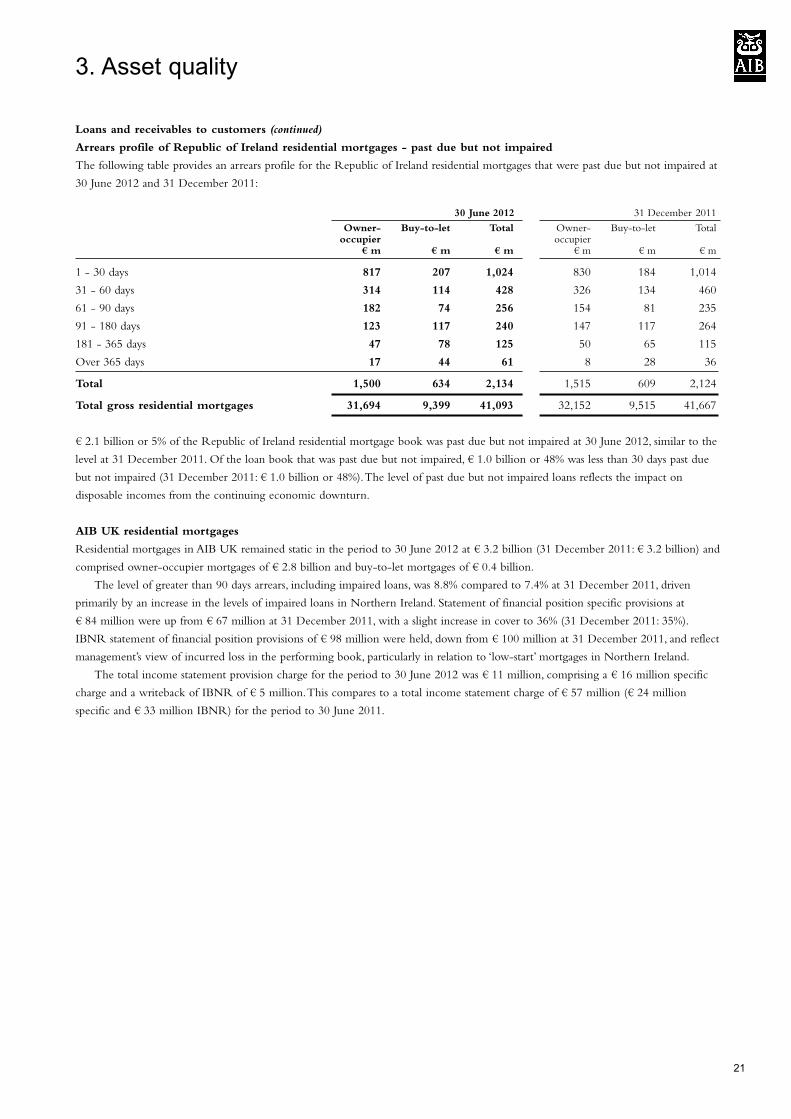
Arrears profile of Republic of Ireland residential mortgages - past due but not impaired
The following table provides an arrears profile for the Republic of Ireland residential mortgages that were past due but not impaired at
30 June 2012 and 31 December 2011:
30 June 2012 31 December 2011
Owner- Buy-to-let Total Owner- Buy-to-let Totaloccupier occupier
€ m € m € m € m € m € m
1 - 30 days 817 207 1,024 830 184 1,014
31 - 60 days 314 114 428 326 134 460
61 - 90 days 182 74 256 154 81 235
91 - 180 days 123 117 240 147 117 264
181 - 365 days 47 78 125 50 65 115
Over 365 days 17 44 61 8 28 36
Total 1,500 634 2,134 1,515 609 2,124
Total gross residential mortgages 31,694 9,399 41,093 32,152 9,515 41,667
€ 2.1 billion or 5% of the Republic of Ireland residential mortgage book was past due but not impaired at 30 June 2012, similar to the
level at 31 December 2011. Of the loan book that was past due but not impaired, € 1.0 billion or 48% was less than 30 days past due
but not impaired (31 December 2011: € 1.0 billion or 48%). The level of past due but not impaired loans reflects the impact on
disposable incomes from the continuing economic downturn.
AIB UK residential mortgages
Residential mortgages in AIB UK remained static in the period to 30 June 2012 at € 3.2 billion (31 December 2011: € 3.2 billion) and
comprised owner-occupier mortgages of € 2.8 billion and buy-to-let mortgages of € 0.4 billion.
The level of greater than 90 days arrears, including impaired loans, was 8.8% compared to 7.4% at 31 December 2011, driven
primarily by an increase in the levels of impaired loans in Northern Ireland. Statement of financial position specific provisions at
€ 84 million were up from € 67 million at 31 December 2011, with a slight increase in cover to 36% (31 December 2011: 35%).
IBNR statement of financial position provisions of € 98 million were held, down from € 100 million at 31 December 2011, and reflect
management’s view of incurred loss in the performing book, particularly in relation to ‘low-start’ mortgages in Northern Ireland.
The total income statement provision charge for the period to 30 June 2012 was € 11 million, comprising a € 16 million specific
charge and a writeback of IBNR of € 5 million. This compares to a total income statement charge of € 57 million (€ 24 million
specific and € 33 million IBNR) for the period to 30 June 2011.
3. Asset quality
21
Loans and receivables to customers (continued)
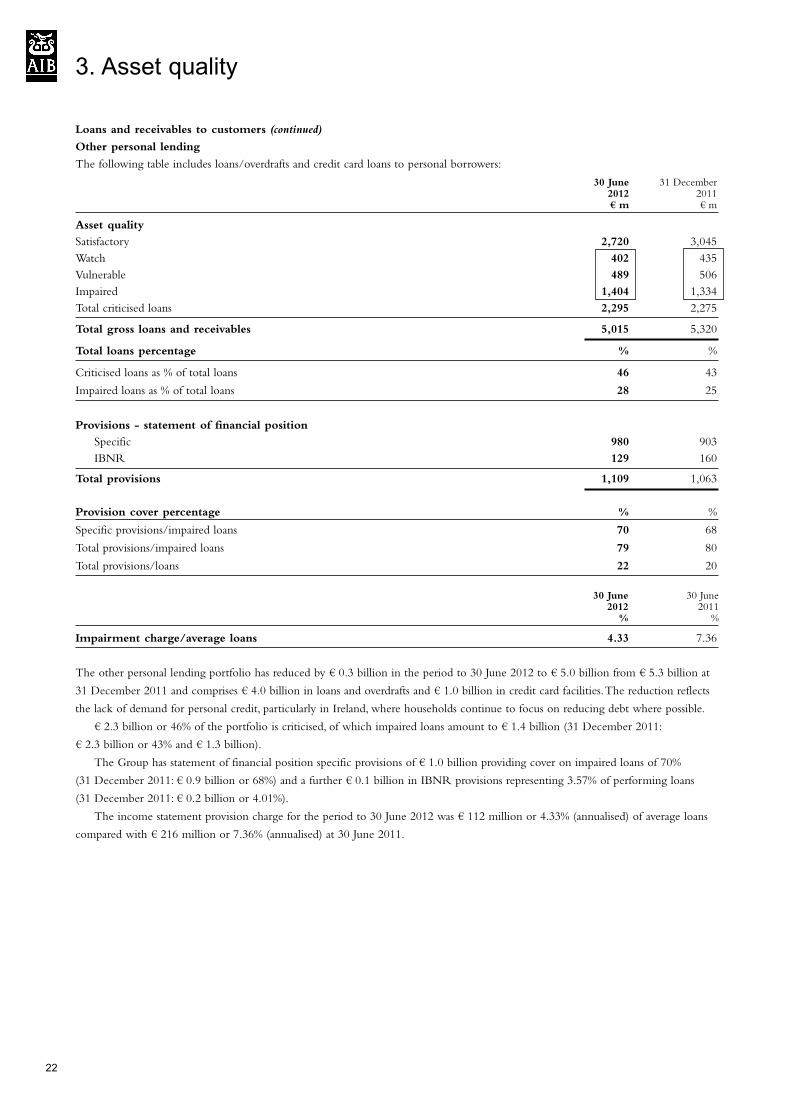
Other personal lending
The following table includes loans/overdrafts and credit card loans to personal borrowers:
30 June 31 December2012 2011€ m € m
Asset quality
Satisfactory 2,720 3,045
Watch 402 435
Vulnerable 489 506
Impaired 1,404 1,334
Total criticised loans 2,295 2,275
Total gross loans and receivables 5,015 5,320
Total loans percentage % %
Criticised loans as % of total loans 46 43
Impaired loans as % of total loans 28 25
Provisions - statement of financial position
Specific 980 903
IBNR 129 160
Total provisions 1,109 1,063
Provision cover percentage % %
Specific provisions/impaired loans 70 68
Total provisions/impaired loans 79 80
Total provisions/loans 22 20
30 June 30 June2012 2011% %
Impairment charge/average loans 4.33 7.36
The other personal lending portfolio has reduced by € 0.3 billion in the period to 30 June 2012 to € 5.0 billion from € 5.3 billion at
31 December 2011 and comprises € 4.0 billion in loans and overdrafts and € 1.0 billion in credit card facilities. The reduction reflects
the lack of demand for personal credit, particularly in Ireland, where households continue to focus on reducing debt where possible.
€ 2.3 billion or 46% of the portfolio is criticised, of which impaired loans amount to € 1.4 billion (31 December 2011:
€ 2.3 billion or 43% and € 1.3 billion).
The Group has statement of financial position specific provisions of € 1.0 billion providing cover on impaired loans of 70%
(31 December 2011: € 0.9 billion or 68%) and a further € 0.1 billion in IBNR provisions representing 3.57% of performing loans
(31 December 2011: € 0.2 billion or 4.01%).
The income statement provision charge for the period to 30 June 2012 was € 112 million or 4.33% (annualised) of average loans
compared with € 216 million or 7.36% (annualised) at 30 June 2011.
22
3. Asset quality
Loans and receivables to customers (continued)
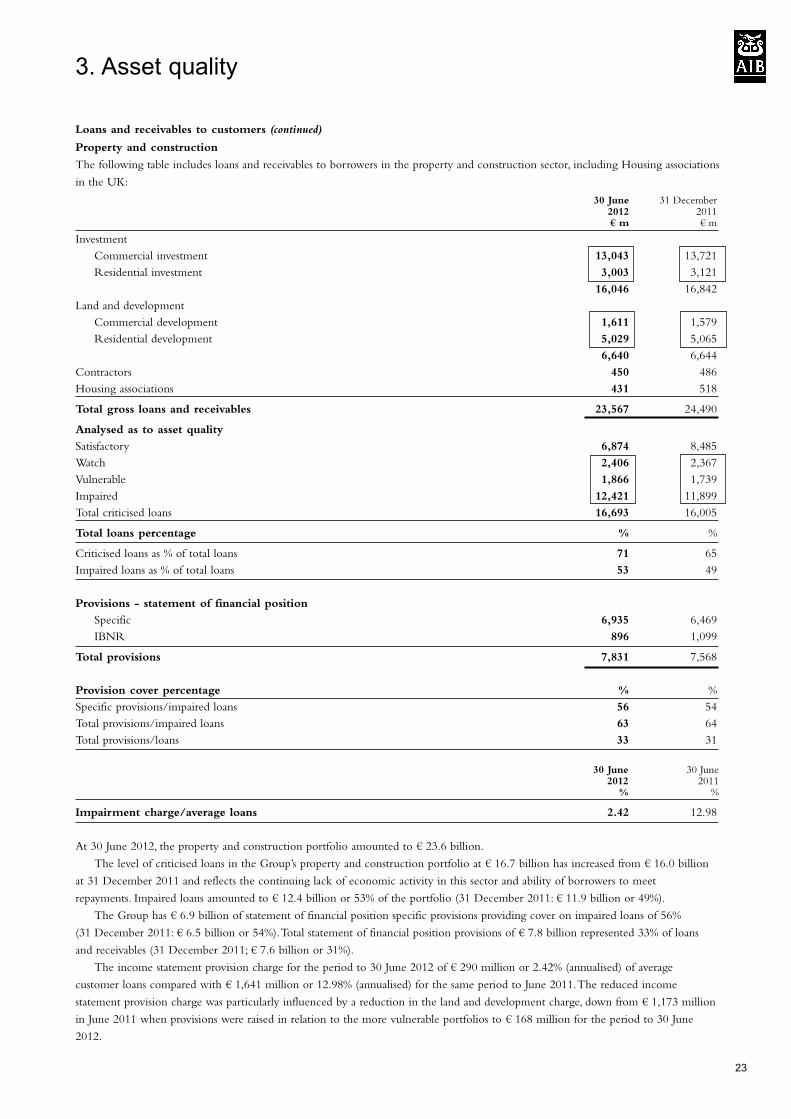
Property and construction
The following table includes loans and receivables to borrowers in the property and construction sector, including Housing associations
in the UK:
30 June 31 December2012 2011€ m € m
Investment
Commercial investment 13,043 13,721
Residential investment 3,003 3,121
16,046 16,842
Land and development
Commercial development 1,611 1,579
Residential development 5,029 5,065
6,640 6,644
Contractors 450 486
Housing associations 431 518
Total gross loans and receivables 23,567 24,490
Analysed as to asset quality
Satisfactory 6,874 8,485
Watch 2,406 2,367
Vulnerable 1,866 1,739
Impaired 12,421 11,899
Total criticised loans 16,693 16,005
Total loans percentage % %
Criticised loans as % of total loans 71 65
Impaired loans as % of total loans 53 49
Provisions - statement of financial position
Specific 6,935 6,469
IBNR 896 1,099
Total provisions 7,831 7,568
Provision cover percentage % %
Specific provisions/impaired loans 56 54
Total provisions/impaired loans 63 64
Total provisions/loans 33 31
30 June 30 June2012 2011% %
Impairment charge/average loans 2.42 12.98
At 30 June 2012, the property and construction portfolio amounted to € 23.6 billion.
The level of criticised loans in the Group’s property and construction portfolio at € 16.7 billion has increased from € 16.0 billion
at 31 December 2011 and reflects the continuing lack of economic activity in this sector and ability of borrowers to meet
repayments. Impaired loans amounted to € 12.4 billion or 53% of the portfolio (31 December 2011: € 11.9 billion or 49%).
The Group has € 6.9 billion of statement of financial position specific provisions providing cover on impaired loans of 56%
(31 December 2011: € 6.5 billion or 54%). Total statement of financial position provisions of € 7.8 billion represented 33% of loans
and receivables (31 December 2011; € 7.6 billion or 31%).
The income statement provision charge for the period to 30 June 2012 of € 290 million or 2.42% (annualised) of average
customer loans compared with € 1,641 million or 12.98% (annualised) for the same period to June 2011. The reduced income
statement provision charge was particularly influenced by a reduction in the land and development charge, down from € 1,173 million
in June 2011 when provisions were raised in relation to the more vulnerable portfolios to € 168 million for the period to 30 June
2012.
3. Asset quality
23
Loans and receivables tocustomers (continued)
Property and construction (continued)
Investment:
Property investment loans amounted to € 16.0 billion at 30 June 2012 (31 December 2011: € 16.8 billion) of which € 13.0 billion
related to commercial investment. The reduction was largely as a result of deleveraging in the portfolio. € 8.8 billion of the
investment property portfolio related to loans for the purchase of property in the Republic of Ireland, € 6.3 billion in the United
Kingdom, € 0.3 billion in the United States of America and € 0.6 billion in other geographical locations.
€ 10.3 billion or 64% of the investment property portfolio was criticised at 30 June 2012 compared with € 9.7 billion or 58% at
31 December 2011. Included in criticised loans were € 6.7 billion of loans which were impaired (31 December 2011: € 6.3 billion)
on which the Group had € 2.9 billion in statement of financial position specific provisions, providing cover of 43% (31 December
2011: € 2.6 billion or 41%). Total provisions as a percentage of total loans was 22%, up from 21% at December 2011 for this sector.
The income statement provision charge for the period to 30 June 2012 was € 106 million or 1.14% (annualised) of average
property investment customer loans compared with € 435 million or 5.13% (annualised) for the same period to June 2011.
Land and development
At 30 June 2012, Group land and development loans amounted to € 6.6 billion (31 December 2011: € 6.6 billion). € 4.7 billion of
this portfolio related to loans in the Republic of Ireland and € 1.9 billion in the United Kingdom.
€ 6.1 billion of the land and development portfolio was criticised at 30 June 2012 unchanged from 31 December 2011. Included
in criticised loans were € 5.5 billion of loans which were impaired (31 December 2011: € 5.4 billion) on which the Group had
€ 3.9 billion in statement of financial position specific provisions providing cover of 71% (31 December 2011: 69%). Total provisions
as a percentage of total loans was 61%, up from 58% at 31 December 2011 for this sector.
The income statement provision charge for the period to 30 June 2012 was € 168 million or 4.88% (annualised) of average land
and development customer loans compared with € 1,173 million or 33.13% (annualised) for the same period to June 2011.
3. Asset quality
24
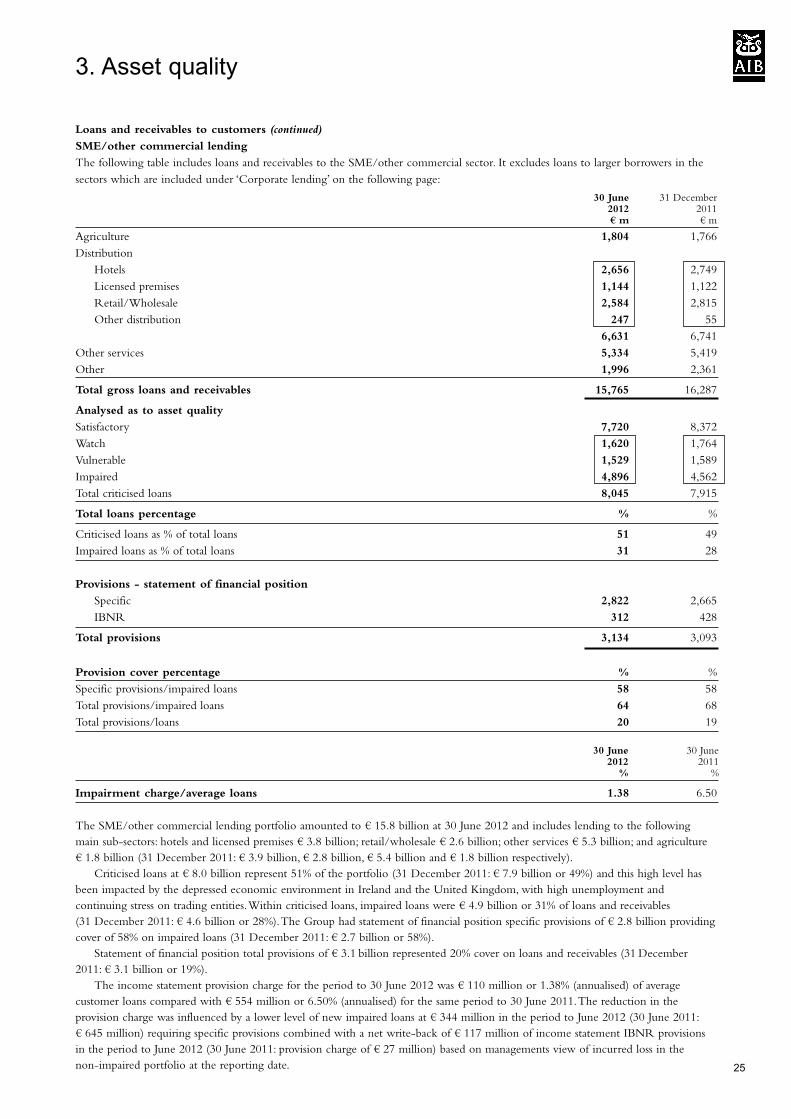
Loans and receivables to customers (continued)
SME/other commercial lending
The following table includes loans and receivables to the SME/other commercial sector. It excludes loans to larger borrowers in the
sectors which are included under ‘Corporate lending’ on the following page:
30 June 31 December2012 2011€ m € m
Agriculture 1,804 1,766
Distribution
Hotels 2,656 2,749
Licensed premises 1,144 1,122
Retail/Wholesale 2,584 2,815
Other distribution 247 55
6,631 6,741
Other services 5,334 5,419
Other 1,996 2,361
Total gross loans and receivables 15,765 16,287
Analysed as to asset quality
Satisfactory 7,720 8,372
Watch 1,620 1,764
Vulnerable 1,529 1,589
Impaired 4,896 4,562
Total criticised loans 8,045 7,915
Total loans percentage % %
Criticised loans as % of total loans 51 49
Impaired loans as % of total loans 31 28
Provisions - statement of financial position
Specific 2,822 2,665
IBNR 312 428
Total provisions 3,134 3,093
Provision cover percentage % %
Specific provisions/impaired loans 58 58
Total provisions/impaired loans 64 68
Total provisions/loans 20 19
30 June 30 June2012 2011% %
Impairment charge/average loans 1.38 6.50
The SME/other commercial lending portfolio amounted to € 15.8 billion at 30 June 2012 and includes lending to the following
main sub-sectors: hotels and licensed premises € 3.8 billion; retail/wholesale € 2.6 billion; other services € 5.3 billion; and agriculture
€ 1.8 billion (31 December 2011: € 3.9 billion, € 2.8 billion, € 5.4 billion and € 1.8 billion respectively).
Criticised loans at € 8.0 billion represent 51% of the portfolio (31 December 2011: € 7.9 billion or 49%) and this high level has
been impacted by the depressed economic environment in Ireland and the United Kingdom, with high unemployment and
continuing stress on trading entities.Within criticised loans, impaired loans were € 4.9 billion or 31% of loans and receivables
(31 December 2011: € 4.6 billion or 28%).The Group had statement of financial position specific provisions of € 2.8 billion providing
cover of 58% on impaired loans (31 December 2011: € 2.7 billion or 58%).
Statement of financial position total provisions of € 3.1 billion represented 20% cover on loans and receivables (31 December
2011: € 3.1 billion or 19%).
The income statement provision charge for the period to 30 June 2012 was € 110 million or 1.38% (annualised) of average
customer loans compared with € 554 million or 6.50% (annualised) for the same period to 30 June 2011.The reduction in the
provision charge was influenced by a lower level of new impaired loans at € 344 million in the period to June 2012 (30 June 2011:
€ 645 million) requiring specific provisions combined with a net write-back of € 117 million of income statement IBNR provisions
in the period to June 2012 (30 June 2011: provision charge of € 27 million) based on managements view of incurred loss in the
non-impaired portfolio at the reporting date.
3. Asset quality
25
26
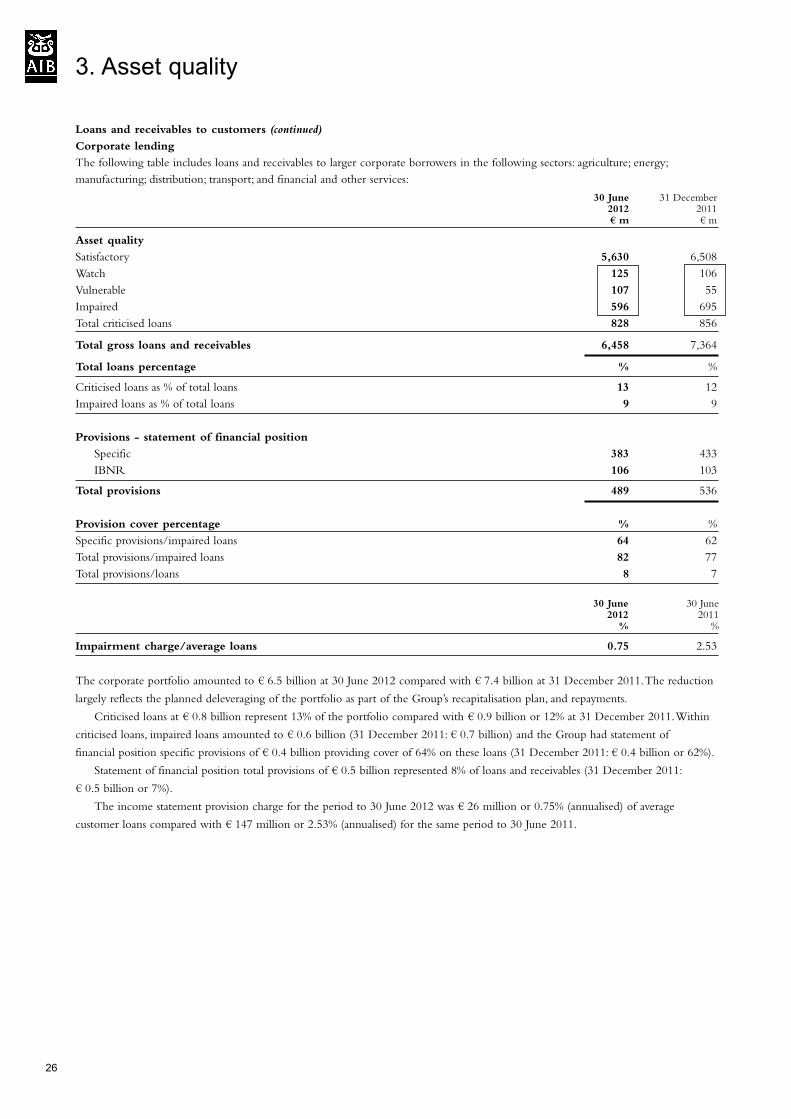
Loans and receivables to customers (continued)
Corporate lending
The following table includes loans and receivables to larger corporate borrowers in the following sectors: agriculture; energy;
manufacturing; distribution; transport; and financial and other services:
30 June 31 December2012 2011€ m € m
Asset quality
Satisfactory 5,630 6,508
Watch 125 106
Vulnerable 107 55
Impaired 596 695
Total criticised loans 828 856
Total gross loans and receivables 6,458 7,364
Total loans percentage % %
Criticised loans as % of total loans 13 12
Impaired loans as % of total loans 9 9
Provisions - statement of financial position
Specific 383 433
IBNR 106 103
Total provisions 489 536
Provision cover percentage % %
Specific provisions/impaired loans 64 62
Total provisions/impaired loans 82 77
Total provisions/loans 8 7
30 June 30 June2012 2011% %
Impairment charge/average loans 0.75 2.53
The corporate portfolio amounted to € 6.5 billion at 30 June 2012 compared with € 7.4 billion at 31 December 2011. The reduction
largely reflects the planned deleveraging of the portfolio as part of the Group’s recapitalisation plan, and repayments.
Criticised loans at € 0.8 billion represent 13% of the portfolio compared with € 0.9 billion or 12% at 31 December 2011. Within
criticised loans, impaired loans amounted to € 0.6 billion (31 December 2011: € 0.7 billion) and the Group had statement of
financial position specific provisions of € 0.4 billion providing cover of 64% on these loans (31 December 2011: € 0.4 billion or 62%).
Statement of financial position total provisions of € 0.5 billion represented 8% of loans and receivables (31 December 2011:
€ 0.5 billion or 7%).
The income statement provision charge for the period to 30 June 2012 was € 26 million or 0.75% (annualised) of average
customer loans compared with € 147 million or 2.53% (annualised) for the same period to 30 June 2011.
3. Asset quality
Loans and receivables to customers (continued)
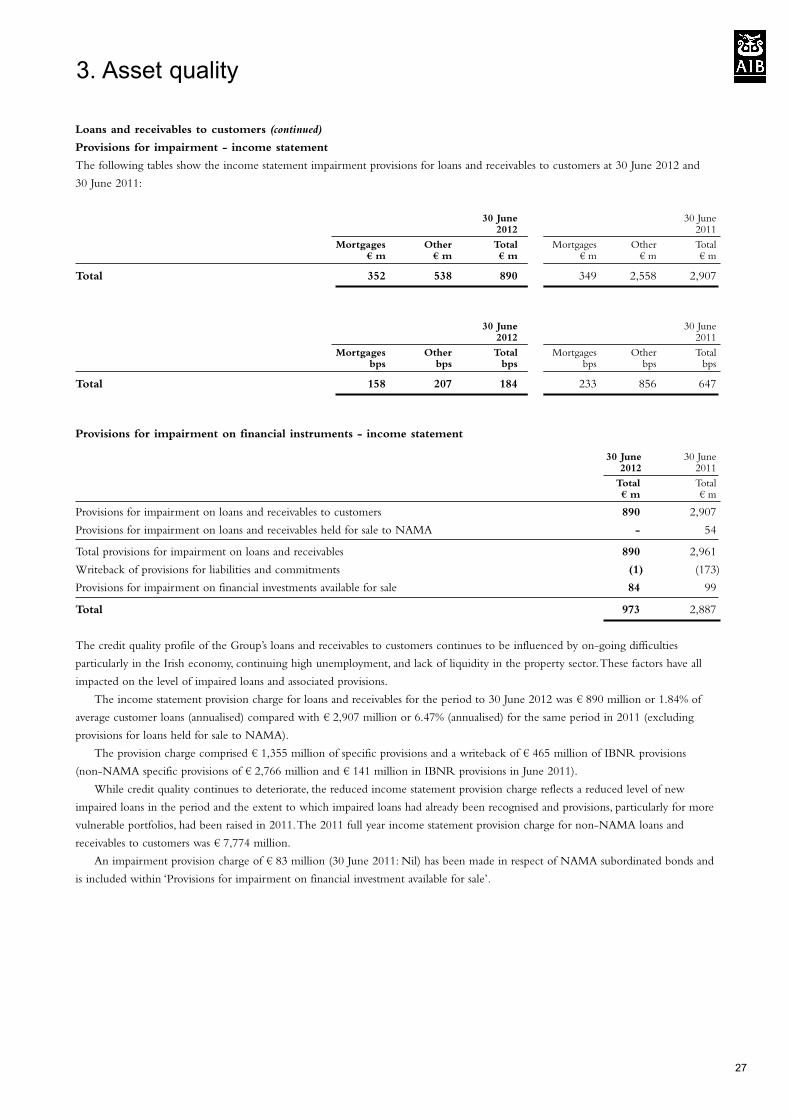
Provisions for impairment - income statement
The following tables show the income statement impairment provisions for loans and receivables to customers at 30 June 2012 and
30 June 2011:
30 June 30 June2012 2011
Mortgages Other Total Mortgages Other Total€ m € m € m € m € m € m
Total 352 538 890 349 2,558 2,907
30 June 30 June2012 2011
Mortgages Other Total Mortgages Other Totalbps bps bps bps bps bps
Total 158 207 184 233 856 647
Provisions for impairment on financial instruments - income statement
30 June 30 June2012 2011
Total Total€ m € m
Provisions for impairment on loans and receivables to customers 890 2,907
Provisions for impairment on loans and receivables held for sale to NAMA - 54
Total provisions for impairment on loans and receivables 890 2,961
Writeback of provisions for liabilities and commitments (1) (173)
Provisions for impairment on financial investments available for sale 84 99
Total 973 2,887
The credit quality profile of the Group’s loans and receivables to customers continues to be influenced by on-going difficulties
particularly in the Irish economy, continuing high unemployment, and lack of liquidity in the property sector. These factors have all
impacted on the level of impaired loans and associated provisions.
The income statement provision charge for loans and receivables for the period to 30 June 2012 was € 890 million or 1.84% of
average customer loans (annualised) compared with € 2,907 million or 6.47% (annualised) for the same period in 2011 (excluding
provisions for loans held for sale to NAMA).
The provision charge comprised € 1,355 million of specific provisions and a writeback of € 465 million of IBNR provisions
(non-NAMA specific provisions of € 2,766 million and € 141 million in IBNR provisions in June 2011).
While credit quality continues to deteriorate, the reduced income statement provision charge reflects a reduced level of new
impaired loans in the period and the extent to which impaired loans had already been recognised and provisions, particularly for more
vulnerable portfolios, had been raised in 2011.The 2011 full year income statement provision charge for non-NAMA loans and
receivables to customers was € 7,774 million.
An impairment provision charge of € 83 million (30 June 2011: Nil) has been made in respect of NAMA subordinated bonds and
is included within ‘Provisions for impairment on financial investment available for sale’.
3. Asset quality
27
28
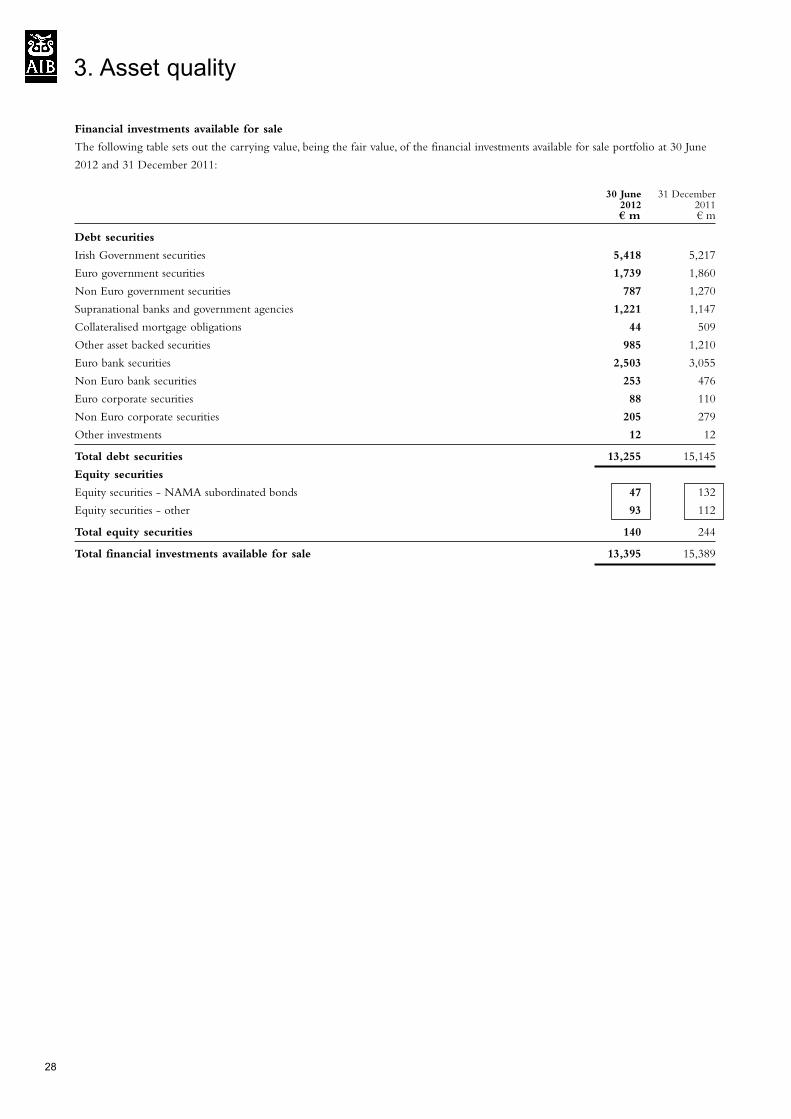
Financial investments available for sale
The following table sets out the carrying value, being the fair value, of the financial investments available for sale portfolio at 30 June
2012 and 31 December 2011:
30 June 31 December2012 2011€ m € m
Debt securities
Irish Government securities 5,418 5,217
Euro government securities 1,739 1,860
Non Euro government securities 787 1,270
Supranational banks and government agencies 1,221 1,147
Collateralised mortgage obligations 44 509
Other asset backed securities 985 1,210
Euro bank securities 2,503 3,055
Non Euro bank securities 253 476
Euro corporate securities 88 110
Non Euro corporate securities 205 279
Other investments 12 12
Total debt securities 13,255 15,145
Equity securities
Equity securities - NAMA subordinated bonds 47 132
Equity securities - other 93 112
Total equity securities 140 244
Total financial investments available for sale 13,395 15,389
3. Asset quality
Financial investments available for sale (continued)
Debt securities
Available for sale debt securities have reduced from € 15.1 billion at 31 December 2011 to € 13.3 billion at 30 June 2012 driven by
net sales and maturities of € 3.5 billion in the period. Disposals reflect a reduction in credit appetite for assets domiciled in selected
Eurozone countries and also a decision to reduce other holdings which were considered sub-optimal from a liquidity perspective for
the Group.
The portfolio is rated 96% investment grade (31 December 2011: 97%), with 26% AAA (31 December 2011: 35%); 12% AA
(31 December 2011: 10%); 10% rated A (31 December 2011: 11%); and 48% rated BBB (31 December 2011: 41%).
The Irish Government securities portfolio increased from € 5.2 billion at 31 December 2011 to € 5.4 billion at 30 June 2012,
principally due to an increase in the fair value (average price increasing from 87.02 at 31 December 2011 to 94.66 at 30 June 2012)
and a reduction in the nominal position held by € 275 million.
In relation to Government securities, euro bank securities and other securities from Portugal, Italy, Greece, and Spain, the
combined carrying value has reduced by € 438 million from € 1,793 million to € 1,355 million. Of the € 1,355 million, Spanish
covered bonds, and Spanish residential mortgage backed securities account for € 465 million and € 572 million respectively with the
Italian sovereign accounting for € 186 million.
Impairment charge in the period to 30 June 2012 amounted to € 1 million (30 June 2011: € 93 million).
Equity securities
NAMA subordinated bonds, included in available for sale equity securities, are recorded at 30 June 2012 at a fair value of
€ 47 million (nominal holding of € 471 million) compared with 31 December 2011 fair value of € 132 million (nominal holding of
€ 478 million). The reduction in fair value results primarily from an impairment provision of € 83 million, following further updated
disclosures by NAMA and the continuing uncertainties surrounding any recovery in the Irish property market in the medium term.
3. Asset quality
29
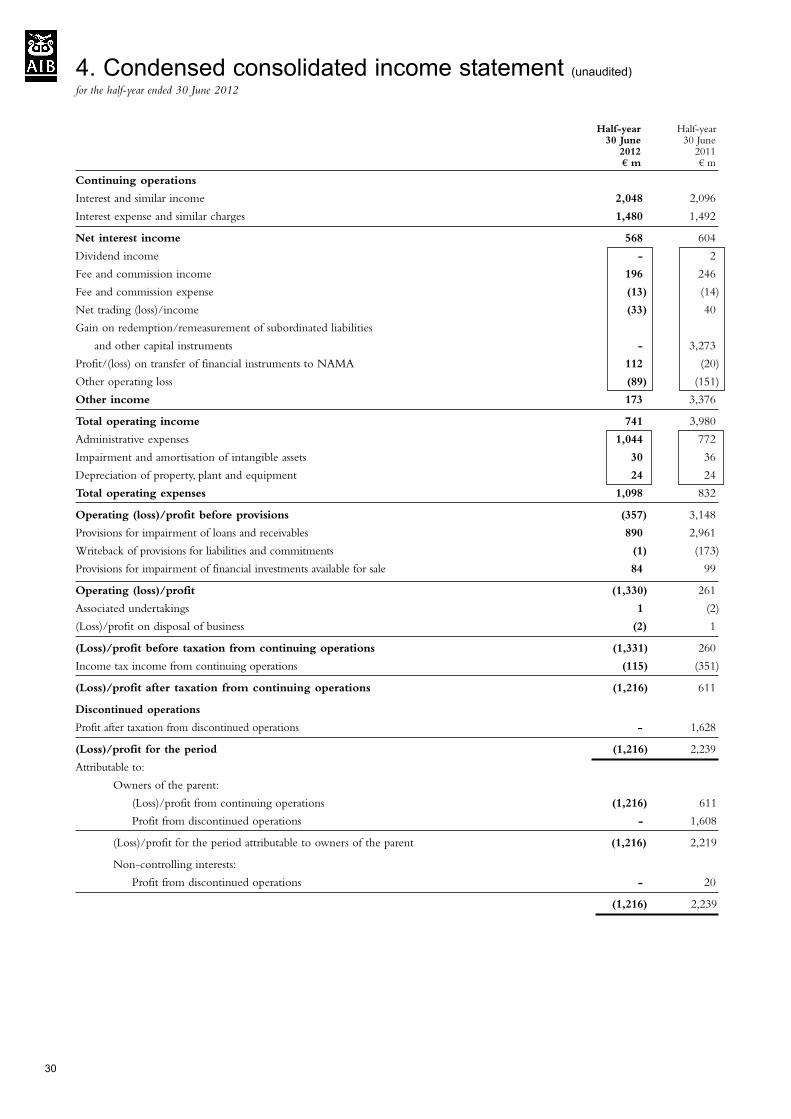
Half-year Half-year30 June 30 June2012 2011€ m € m
Continuing operations
Interest and similar income 2,048 2,096
Interest expense and similar charges 1,480 1,492
Net interest income 568 604
Dividend income - 2
Fee and commission income 196 246
Fee and commission expense (13) (14)
Net trading (loss)/income (33) 40
Gain on redemption/remeasurement of subordinated liabilities
and other capital instruments - 3,273
Profit/(loss) on transfer of financial instruments to NAMA 112 (20)
Other operating loss (89) (151)
Other income 173 3,376
Total operating income 741 3,980
Administrative expenses 1,044 772
Impairment and amortisation of intangible assets 30 36
Depreciation of property, plant and equipment 24 24
Total operating expenses 1,098 832
Operating (loss)/profit before provisions (357) 3,148
Provisions for impairment of loans and receivables 890 2,961
Writeback of provisions for liabilities and commitments (1) (173)
Provisions for impairment of financial investments available for sale 84 99
Operating (loss)/profit (1,330) 261
Associated undertakings 1 (2)
(Loss)/profit on disposal of business (2) 1
(Loss)/profit before taxation from continuing operations (1,331) 260
Income tax income from continuing operations (115) (351)
(Loss)/profit after taxation from continuing operations (1,216) 611
Discontinued operations
Profit after taxation from discontinued operations - 1,628
(Loss)/profit for the period (1,216) 2,239
Attributable to:
Owners of the parent:
(Loss)/profit from continuing operations (1,216) 611
Profit from discontinued operations - 1,608
(Loss)/profit for the period attributable to owners of the parent (1,216) 2,219
Non-controlling interests:
Profit from discontinued operations - 20
(1,216) 2,239
4. Condensed consolidated income statement (unaudited)for the half-year ended 30 June 2012
30
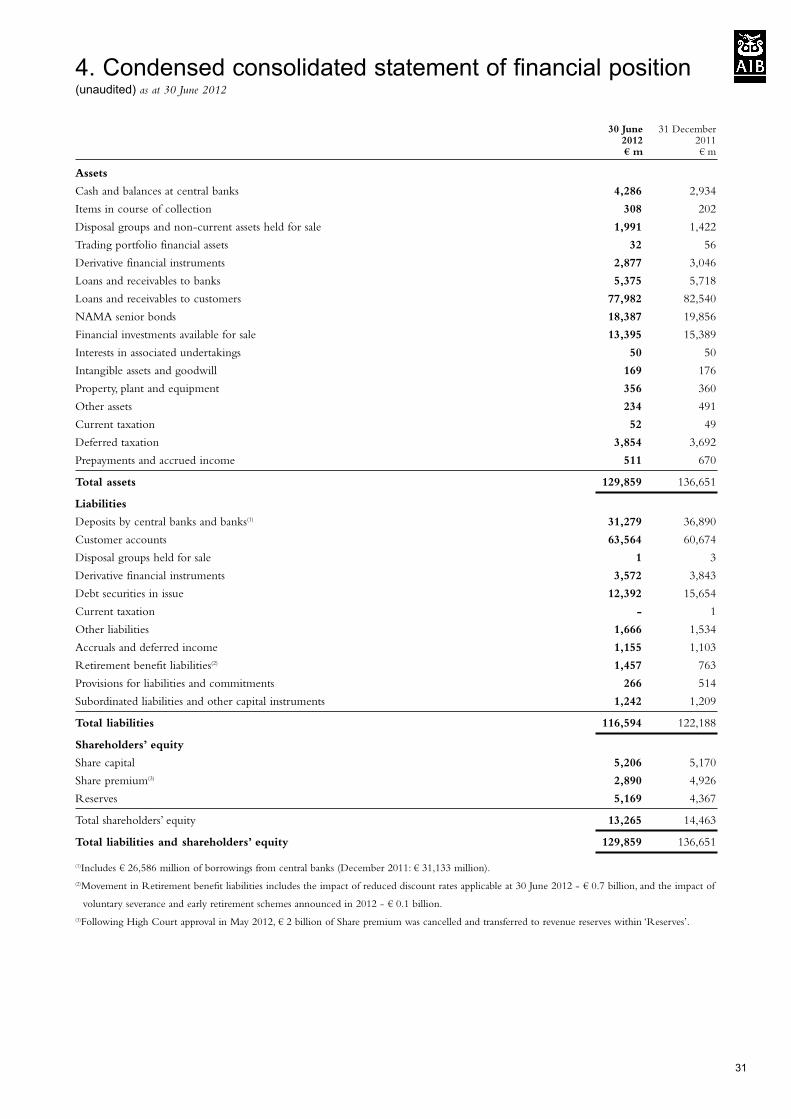
30 June 31 December2012 2011€ m € m
Assets
Cash and balances at central banks 4,286 2,934
Items in course of collection 308 202
Disposal groups and non-current assets held for sale 1,991 1,422
Trading portfolio financial assets 32 56
Derivative financial instruments 2,877 3,046
Loans and receivables to banks 5,375 5,718
Loans and receivables to customers 77,982 82,540
NAMA senior bonds 18,387 19,856
Financial investments available for sale 13,395 15,389
Interests in associated undertakings 50 50
Intangible assets and goodwill 169 176
Property, plant and equipment 356 360
Other assets 234 491
Current taxation 52 49
Deferred taxation 3,854 3,692
Prepayments and accrued income 511 670
Total assets 129,859 136,651
Liabilities
Deposits by central banks and banks(1) 31,279 36,890
Customer accounts 63,564 60,674
Disposal groups held for sale 1 3
Derivative financial instruments 3,572 3,843
Debt securities in issue 12,392 15,654
Current taxation - 1
Other liabilities 1,666 1,534
Accruals and deferred income 1,155 1,103
Retirement benefit liabilities(2) 1,457 763
Provisions for liabilities and commitments 266 514
Subordinated liabilities and other capital instruments 1,242 1,209
Total liabilities 116,594 122,188
Shareholders’ equity
Share capital 5,206 5,170
Share premium(3) 2,890 4,926
Reserves 5,169 4,367
Total shareholders’ equity 13,265 14,463
Total liabilities and shareholders’ equity 129,859 136,651
(1)Includes € 26,586 million of borrowings from central banks (December 2011: € 31,133 million).
(2)Movement in Retirement benefit liabilities includes the impact of reduced discount rates applicable at 30 June 2012 - € 0.7 billion, and the impact of
voluntary severance and early retirement schemes announced in 2012 - € 0.1 billion.
(3)Following High Court approval in May 2012, € 2 billion of Share premium was cancelled and transferred to revenue reserves within ‘Reserves’.
4. Condensed consolidated statement of financial position (unaudited) as at 30 June 2012
31
Allied Irish Banks, p.l.c.
For further information please contact:
Paul Stanley Enda Johnson Catherine Burke
Acting Chief Financial Officer Head of Corporate Affairs & Strategy Head of Internal Communications
Bankcentre Bankcentre Bankcentre
Dublin Dublin Dublin
353-1-660-0311 353-1-660-0311 353-1-660-0311
Ext. 14982 Ext. 26010 Ext. 13894
This announcement and a detailed presentation can be viewed on our internet site at
www.aibgroup.com/investorrelations
Forward-looking statements
This document contains certain forward-looking statements within the meaning of Section 27A of the US Securities Act of 1933 and
Section 21E of the US Securities Exchange Act of 1934, with respect to the financial condition, results of operations and business of
the Group and certain of the plans and objectives of the Group. In particular, among other statements in this preliminary results
announcement, with regard to management objectives, trends in results of operations, margins, risk management, competition and the
impact of changes in International Financial Reporting Standards are forward-looking in nature. These forward-looking statements can
be identified by the fact that they do not relate only to historical or current facts. Forward-looking statements sometimes use words
such as ‘aim’, ‘anticipate’, ‘target’, ‘expect’, ‘estimate’, ‘intend’, ‘plan’, ‘goal’, ‘believe’, ‘may’, ‘could’, ‘will’, ‘seek’, ‘continue’, ‘should’,
‘assume’, or other words of similar meaning. Examples of forward-looking statements include among others, statements regarding the
Group’s future financial position, income growth, loan losses, business strategy, projected costs, capital ratios, estimates of capital
expenditures, and plans and objectives for future operations. Because such statements are inherently subject to risks and uncertainties,
actual results may differ materially from those expressed or implied by such forward-looking information. By their nature,
forward-looking statements involve risk and uncertainty because they relate to events and depend on circumstances that will occur in
the future. There are a number of factors that could cause actual results and developments to differ materially from those expressed or
implied by these forward-looking statements. These factors include, but are not limited to the effects of the challenging economic
environment, both domestically and internationally, the impact of the Irish Government’s relationship with AIB through both its
ordinary and preference share investments, the impact of the Irish Government’s austerity measures arising from the EU/IMF financial
support package, constraints on liquidity and the challenging liquidity environment for the Group created by market reaction to factors
affecting Ireland and the Irish economy, the impact of further downgrades to the Irish sovereign ratings and other country ratings, or the
Group’s credit ratings, the uncertainty of further extensions of the ELG Scheme, systemic risks in the markets the Group operates in, the
ability to access capital to meet targeted and minimum capital requirements for the Group, customer and counterparty credit quality, the
National Pensions Reserve Fund Commission investments, the National Asset Management Agency programme and the ELG Scheme,
conditions that may be imposed by the European Commission following consideration of the Group’s restructuring plan, market risk,
including non-trading interest rates, operational and reputational risks, the success of the Group’s deleveraging plan, the effects of
continued volatility in credit markets, the effects of changes in valuation of credit market exposures, changes in fiscal or other policies
adopted by various governments and regulatory authorities, the effects of changes in taxation or accounting standards and practices,
acquisitions and disposals, the risks relating to the Group’s deferred tax assets, future exchange and interest rates and the success of the
Group in managing these events. Any forward-looking statements made by or on behalf of the Group speak only as of the date they
are made. AIB cautions that the foregoing list of important factors is not exhaustive. Investors and others should carefully consider the
foregoing factors and other uncertainties and events when making an investment decision based on any forward-looking statement. In
light of these risks, uncertainties and assumptions, the forward-looking events discussed in this announcement may not occur. The Group
does not undertake to release publicly any revision to these forward-looking statements to reflect events, circumstances or unanticipated
events occurring after the date hereof.
32
Related Documents