Compiled by Ed Bartholomew, Research Manager July, 2015 Hospital-Owned Home Health Services: Impacting Hospital Quality, Outcomes and Patient Satisfaction TRANSFORMING HEALTH CARE THROUGH RESEARCH AND EDUCATION

Welcome message from author
This document is posted to help you gain knowledge. Please leave a comment to let me know what you think about it! Share it to your friends and learn new things together.
Transcript
Compiled by Ed Bartholomew, Research Manager
July, 2015
Hospital-Owned Home Health Services: Impacting Hospital Quality, Outcomes and Patient Satisfaction
TRANSFORMING HEALTH CARE THROUGH RESEARCH AND EDUCATION

• Compare general medical and surgical hospitals with home health services to hospitals without this service.
• Correlate the presence of home health services with hospital size, type, region and other characteristics.
• Create hospital-level and system-level composite performance measures and study the impact of the presence of home health services.
• Examine Medicare cost for the two cohorts of system-hospitals.
• Compare performance at the system level.
Objectives

Methodology
• Populations studied:• General medical and surgical hospitals with and
without Home Health• System-based hospitals with and without Home
Health• Systems with and without Home Health
• Inclusion Criteria• AHA Registered general medical and surgical
hospitals• Home Health present/not present as indicated by
the 2013 AHA survey.• System-level inclusion required at least 2 hospitals
per system

Data
• 2013 AHA Annual Survey Data• CMS Hospital Compare Data
• 2013 Q3 – 2014 Q2• Dartmouth Atlas of Healthcare
• 2012 Medicare spending
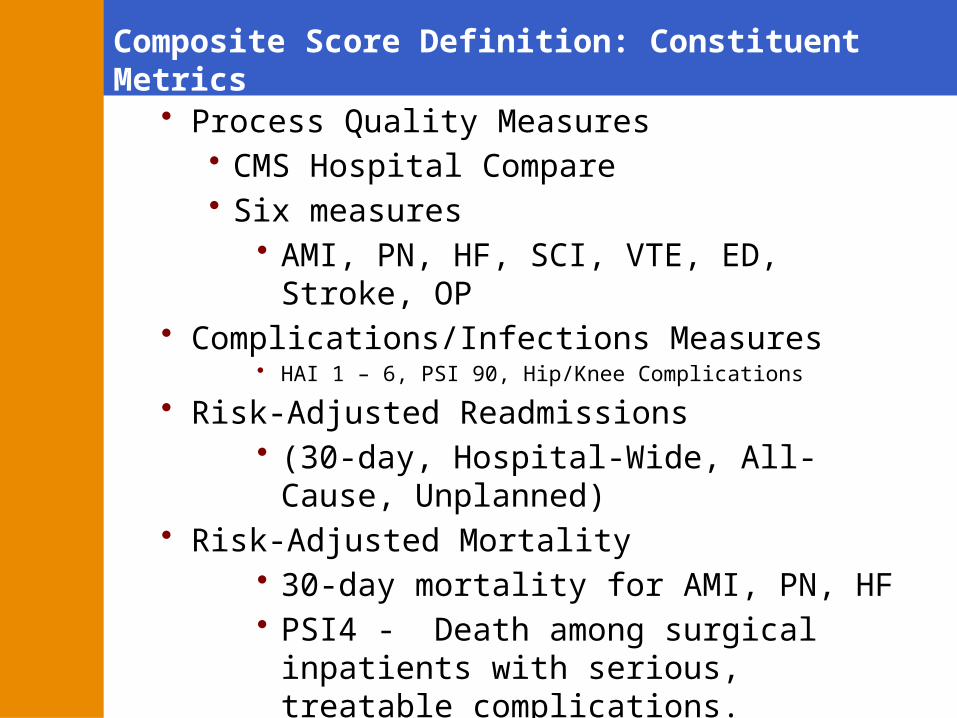
Composite Score Definition: Constituent Metrics
• Process Quality Measures• CMS Hospital Compare• Six measures
• AMI, PN, HF, SCI, VTE, ED, Stroke, OP• Complications/Infections Measures
• HAI 1 – 6, PSI 90, Hip/Knee Complications
• Risk-Adjusted Readmissions • (30-day, Hospital-Wide, All-Cause,
Unplanned)• Risk-Adjusted Mortality
• 30-day mortality for AMI, PN, HF• PSI4 - Death among surgical inpatients
with serious, treatable complications.
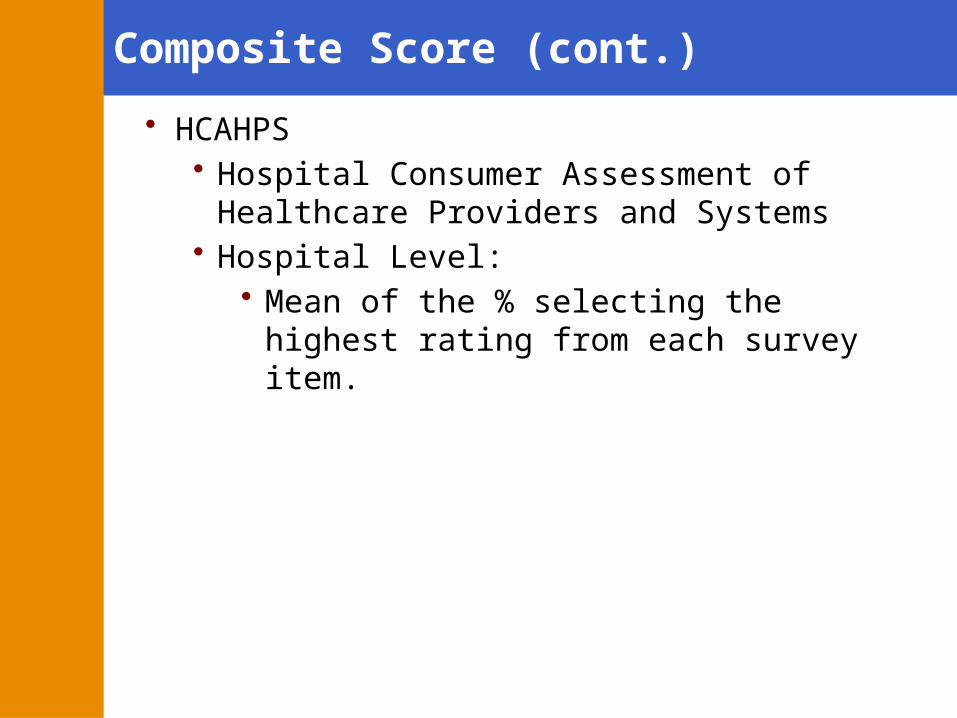
Composite Score (cont.)
• HCAHPS • Hospital Consumer Assessment of Healthcare
Providers and Systems• Hospital Level:
• Mean of the % selecting the highest rating from each survey item.

Composite Score: Definition
• Overall Composite Score• Composed of the mean of the process,
complications/infections, patient satisfaction high score, readmissions avoidance and mortality avoidance scores.
• Increasingly positive values indicate better performance. Therefore, some scores need to be reversed e.g.
• Inverse Readmission Rate =1-(% readmitted)• Inverse Mortality Rate =1-(% mortality)
• Overall Clinical Score• Composed of the mean of the process,
complications/infections, readmissions avoidance and mortality avoidance scores. Excludes HCAHPS.

System-Level Measures
System-Level: Weighted average is determined by dividing the Hospital Compare denominators for each system-hospital by the sum of all denominators for a given system.

Hospital Population
Source: 2013 AHA Survey of Hospitals.
Fifty-one percent of the AHA registered hospitals in the U.S. indicate that they provide home health services. Thirty-eight percent of hospitals providing home health are non-profit hospitals. For-profit hospitals are less likely to provide home health themselves, although they may refer to private home health agencies.
Hospitals
Home Health 2363 51.0%
No Home Health 2273 49.0%
Total 4636 100.0%
All Hospitals Home Health No Home Health
Non-Profit 58.8% 37.7% 21.1%
For-Profit 15.2% 3.2% 12.0%
Non-Federal Govt. 21.7% 8.9% 12.8%
Other 4.3% 1.2% 3.2%
total 100.0% 51.0% 49.1%

Hospital Characteristics
Hospitals with home health services are more prevalent in metropolitan areas, but only about half of the metro hospitals provide home health. Overall, greater percentages of home-health hospitals are in the Midwest and West. Both the West and South have a greater balance of non-home-health hospitals compared to home-health hospitals. Both the Midwest and Northeast have home health hospitals at a rate of about 1.5 times the number of non-home health. Hospitals that have greater than 100 beds make up a greater proportion of organizations with home health relative to those without this service.
All Hospitals Home Health No Home HealthRural 25.1% 10.3% 14.8%Micro 18.5% 9.6% 8.9%Division 13.7% 7.7% 6.0%Metro 42.7% 23.4% 19.4%
All Hospitals Home Health No Home HealthWest 33.2% 14.6% 18.6%Midwest 29.6% 18.3% 11.3%Northeast 12.5% 7.5% 4.9%South 23.6% 10.4% 13.2%
All Hospitals Home Health No Home HealthLess than 100 49.1% 21.3% 27.8%100-299 33.6% 17.6% 15.9%300-499 11.2% 7.4% 3.8%500+ 6.2% 4.6% 1.5%
Source: 2013 AHA Survey of Hospitals.
Bartholomew, Edward
Do teaching hospitals have a greater focus on training physicians than on patient case management?

Hospital Characteristics: Safety Net
All Hospitals Home Health No Home Health
Safety Net 33.6% 14.7% 18.9%
Not Safety Net 66.4% 36.3% 30.1%
A greater share of the hospitals that were identified as safety net hospitals did not have home health services. In contrast, a larger percentage of non-safety-net hospitals does provide home health services.
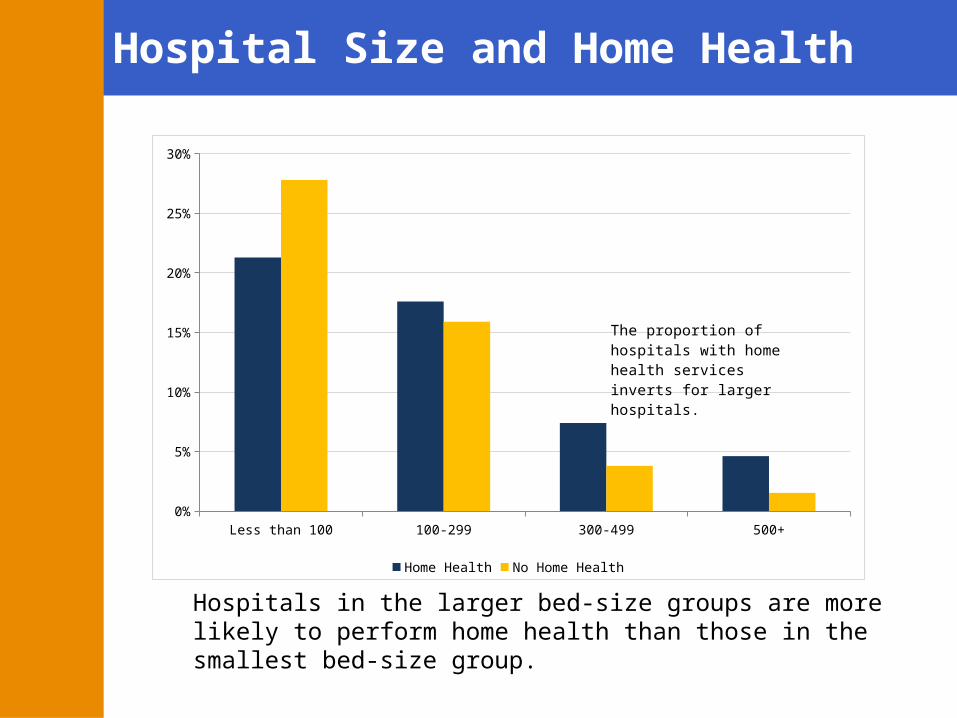
Hospital Size and Home Health
Less than 100 100-299 300-499 500+0%
5%
10%
15%
20%
25%
30%
Home Health No Home Health
The proportion of hospitals with home health services in-verts for larger hospitals.
Hospitals in the larger bed-size groups are more likely to perform home health than those in the smallest bed-size group.

Home Health Service by Hospital Type
A higher percentage of non-profit hospitals provide home health services than any of the other hospital types. This contrasts with those in the for-profit or non-federal government categories.
Non-Profit For-Profit Non-Federal Govt. Other0%
5%
10%
15%
20%
25%
30%
35%
40%
Home Health No Home Health
Non-Profit hospitals have the highest proportion of home health services.
Principal Findings: All Hospitals
Hospital Characteristics and Composite Measures
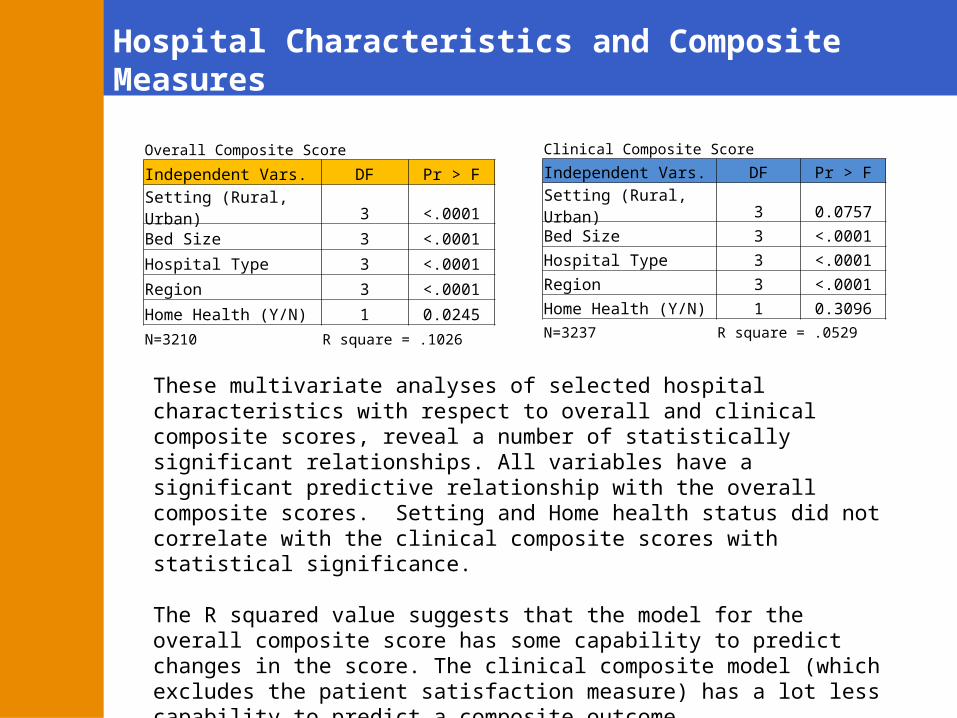
These multivariate analyses of selected hospital characteristics with respect to overall and clinical composite scores, reveal a number of statistically significant relationships. All variables have a significant predictive relationship with the overall composite scores. Setting and Home health status did not correlate with the clinical composite scores with statistical significance.
The R squared value suggests that the model for the overall composite score has some capability to predict changes in the score. The clinical composite model (which excludes the patient satisfaction measure) has a lot less capability to predict a composite outcome.
Overall Composite Score
Independent Vars. DF Pr > F
Setting (Rural, Urban) 3 <.0001
Bed Size 3 <.0001
Hospital Type 3 <.0001
Region 3 <.0001
Home Health (Y/N) 1 0.0245
N=3210 R square = .1026
Clinical Composite Score
Independent Vars. DF Pr > FSetting (Rural, Urban) 3 0.0757Bed Size 3 <.0001Hospital Type 3 <.0001Region 3 <.0001Home Health (Y/N) 1 0.3096N=3237 R square = .0529
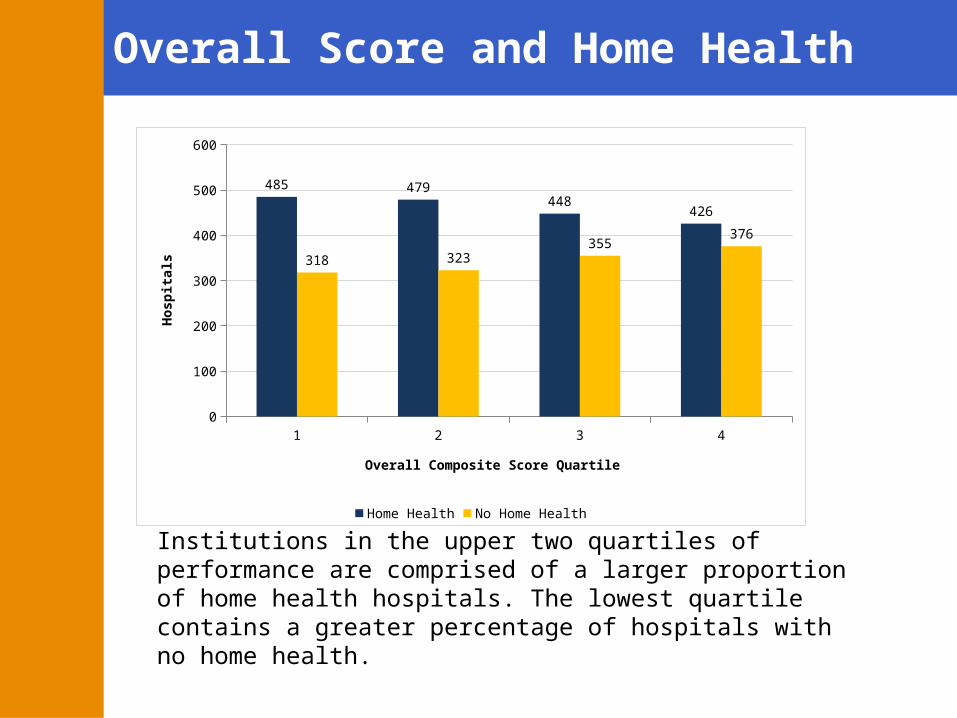
Overall Score and Home Health
Institutions in the upper two quartiles of performance are comprised of a larger proportion of home health hospitals. The lowest quartile contains a greater percentage of hospitals with no home health.
1 2 3 40
100
200
300
400
500
600
485 479448
426
318 323355
376
Home Health No Home Health
Overall Composite Score Quartile
Hosp
itals

Overall Score and Home Health
0
10
20
30
40
50
60
70
80
90
f(x) = − 0.00741097827729298 x + 74.7873693975433R² = 0.930809883321492f(x) = − 0.0106090027450828 x + 74.6864122490935R² = 0.926737934025577
Home Health Linear (Home Health) No Home Health Linear (No Home Health)
Hospitals sorted in descending order by overall composite score.
The negative slope of the trend line for the composite score of hospitals without home health services is greater than the slope of the trend line for home health hospitals (.011 vs .007). This suggests a tendency for the cohort without home health services to perform more poorly on the overall outcome of care.
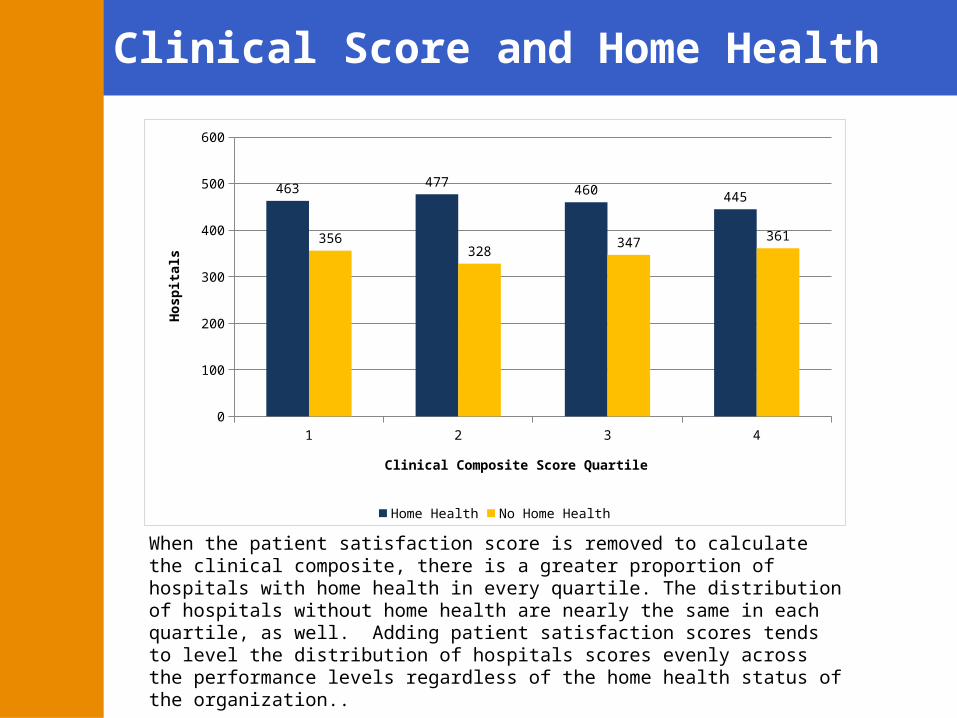
Clinical Score and Home Health
When the patient satisfaction score is removed to calculate the clinical composite, there is a greater proportion of hospitals with home health in every quartile. The distribution of hospitals without home health are nearly the same in each quartile, as well. Adding patient satisfaction scores tends to level the distribution of hospitals scores evenly across the performance levels regardless of the home health status of the organization..
1 2 3 40
100
200
300
400
500
600
463 477460 445
356328
347 361
Home Health No Home Health
Clinical Composite Score Quartile
Hosp
itals
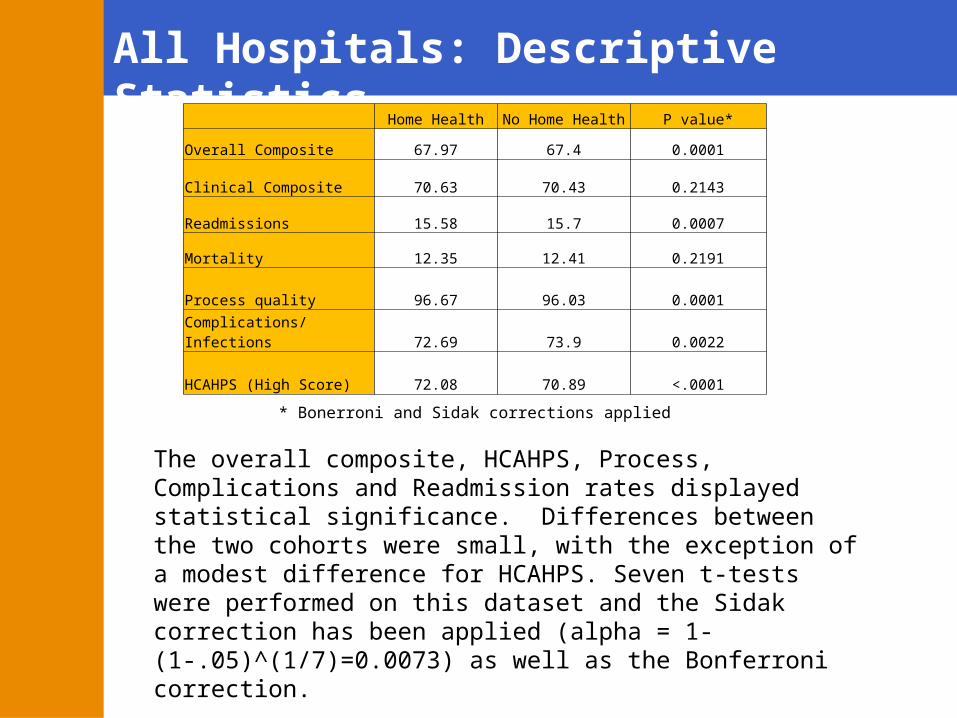
All Hospitals: Descriptive Statistics
The overall composite, HCAHPS, Process, Complications and Readmission rates displayed statistical significance. Differences between the two cohorts were small, with the exception of a modest difference for HCAHPS. Seven t-tests were performed on this dataset and the Sidak correction has been applied (alpha = 1-(1-.05)^(1/7)=0.0073) as well as the Bonferroni correction.
Home Health No Home Health P value*
Overall Composite 67.97 67.4 0.0001
Clinical Composite 70.63 70.43 0.2143
Readmissions 15.58 15.7 0.0007
Mortality 12.35 12.41 0.2191
Process quality 96.67 96.03 0.0001
Complications/Infections 72.69 73.9 0.0022
HCAHPS (High Score) 72.08 70.89 <.0001
* Bonerroni and Sidak corrections applied

Overall Score by Hospital Type
A chi-square analysis revealed material differences in the performance of hospitals based on hospital type. Non-profit hospitals had a larger representation in the two highest performing groups, compared to for-profit and non-federal government organizations. Conversely, For-Profit hospitals have a larger proportion in the two lower quartiles in comparison to their distribution in the top two quartiles.
Score categories based on quintiles (25th, 50th, 75th, 99th)
1 2 3 40%
2%
4%
6%
8%
10%
12%
14%
16%
18%
20%18%
17%
15% 15%
3%
5%6% 5%
4% 4%4% 5%
0.1% 0.1% 0.2% 0.2%
Overall Score: Quartiles
Non-Profit For-Profit Non-Federal Govt OTHER
Hosp
itals
Bartholomew, Edward
Add the quintile values
Principal Findings: System-Based Hospitals

System-Based Hospitals
Fifty-five percent of the system hospitals indicate that they provide home health services, compared to 51% in the all-hospital cohort. The majority of these system hospitals with home health are non-profits (44%).
SYSTEM HOSPITALS
Home Health 1591 45%
No Home Health 1276 55%
Total 2867 100%
Total Home Health No Home Health
Non-Profit 63% 44% 19%
For-Profit 21% 5% 16%
Non-Federal Govt. 9% 4% 5%
Other 7% 2% 5%
Total 100% 55% 45%
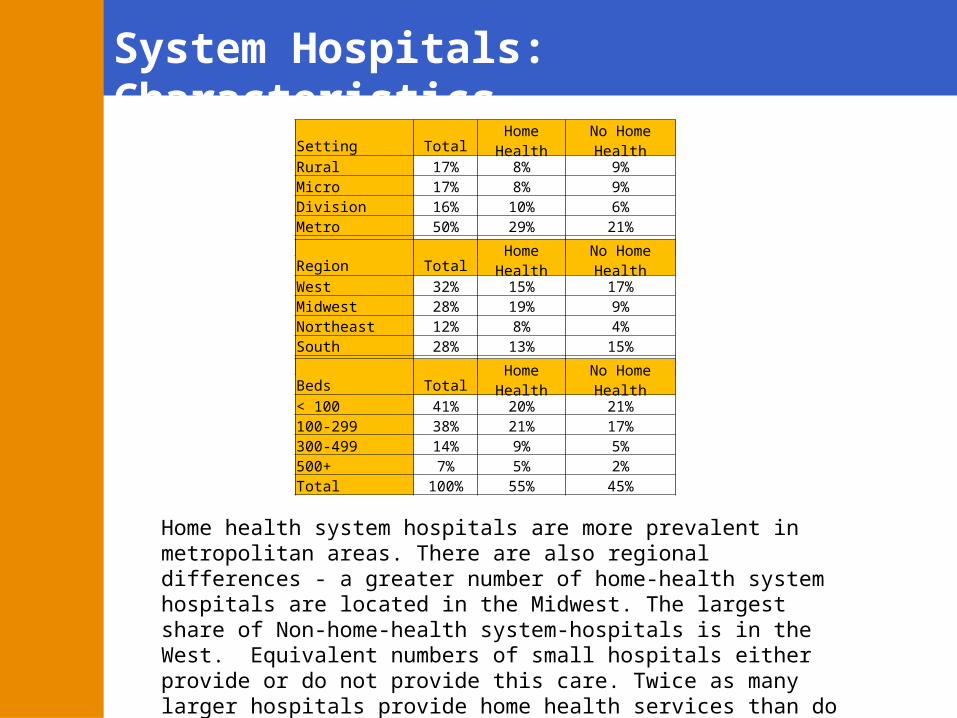
System Hospitals: Characteristics
Home health system hospitals are more prevalent in metropolitan areas. There are also regional differences - a greater number of home-health system hospitals are located in the Midwest. The largest share of Non-home-health system-hospitals is in the West. Equivalent numbers of small hospitals either provide or do not provide this care. Twice as many larger hospitals provide home health services than do not.
Setting Total Home Health No Home HealthRural 17% 8% 9%Micro 17% 8% 9%Division 16% 10% 6%Metro 50% 29% 21%Total 100% 55% 45%Region Total Home Health No Home HealthWest 32% 15% 17%Midwest 28% 19% 9%Northeast 12% 8% 4%South 28% 13% 15%Total 100% 55% 45%Beds Total Home Health No Home Health< 100 41% 20% 21%100-299 38% 21% 17%300-499 14% 9% 5%500+ 7% 5% 2%Total 100% 55% 45%

System Hospital Size and Home Health
As the size of system hospitals increases, there is a greater balance of system hospitals with home health. Twice as many hospitals with 500+ beds provide home health services compared to those without the service.
< 100 100-299 300-499 500+ Total0%
10%
20%
30%
40%
50%
60%
20% 21%
9%5%
55%
21%17%
5%2%
45%
Home Health No Home Health
Beds

System Hospitals: Safety Net
Only one quarter of the system-hospitals are safety net facilities.
Approximately equal amounts of safety net hospitals provide or do not provide home health services. Eleven percent more non-safety-net system hospitals provide home health than do not. Over two-thirds of the hospitals that provide home health services are not safety net hospitals.
Safety Net Hospitals Total Home Health No Home Health
Safety Net 25% 12% 13%
Not Safety Net 75% 43% 32%
Total 100% 55% 45%

System Hospitals: Descriptive Statistics
At the system hospital level, independent paired t-tests revealed small differences in the means of the home health/no home health cohorts for the overall score and each of the constituent measure scores. These differences are not practically significant, although there is a 1.58% difference in the cohort means for HCAHPS in favor of the home health group. The Bonferoni and Sidak corrections were applied.
Measure Status N Mean p value CorrectionsOverall Composite HH NOT PRESENT 880 67.51 0.0043 BON, SIDAK HH PRESENT 1278 68.02 Clinical Composite HH NOT PRESENT 885 70.496 0.98 BON, SIDAK HH PRESENT 1275 70.747 Process Rate HH NOT PRESENT 885 96.73 0.35 BON, SIDAK HH PRESENT 1279 96.88 Complications HH NOT PRESENT 885 74.26 0.0008 BON, SIDAK HH PRESENT 1279 72.66 Readmissions HH NOT PRESENT 885 15.67 0.0472 BON, SIDAK HH PRESENT 1279 15.58 Mortality HH NOT PRESENT 885 12.42 0.0366 BON, SIDAK HH PRESENT 1279 12.29 HCAHPS HH NOT PRESENT 880 70.36 < .0001 BON, SIDAK HH PRESENT 1278 71.94

System Hospitals: Cohort Distributions
Home health system hospitals have a slightly higher mean for their overall composite score. This is statistically significant (p=.0043), however the R squared value is only 0.004. Both median and mean are slightly higher for the home health cohort.

System Hospital Overall Score and Home Health
A higher percentage of system hospitals that provide home health services are in the top quartile for overall composite score. In contrast, the lowest quartile has a greater balance of system hospitals that do not provide this service.
Score categories based on quartiles (25th, 50th, 75th, 99th)
HH PRESENT HH NOT PRESENT0%
2%
4%
6%
8%
10%
12%
14%
16%
18%
16%
9%
15%
10%
14%
11%
14%
11%
Top Quartile 2 3 4

System Hospitals: Overall Score by Hospital Type
Twenty percent of all system hospitals are non-profits. In addition to having a higher percentage of home health services, they are leaders among the hospitals with the best overall composite scores. In contrast,15% of the system hospitals in the lower performance quartiles are for-profit organizations.
1 2 3 40%
5%
10%
15%
20%
25%
For-Profit Non-Federal Govt Non-Profit Other
Quartile
Score categories based on quartiles (25th, 50th, 75th, 99th)

System Hospitals: Medicare Cost
SYSTEM HOSPITALS: Medicare Spend per Enrollee
SPEND/ENROLLEE HOME HEALTH MEAN NO HOME HEALTH MEAN P VALUE R sqr
TOTAL MEDICARE $ 9,503 $ 9,942 <.0001 0.021
HOSPITAL AND SNF $ 4,429 $ 4,595 <.0001 0.009
PHYSICIAN $ 2,493 $ 2,587 0.0002 0.005
OUTPATIENT $ 1,451 $ 1,442 0.6177 0.000
HOME HEALTH $ 502 $ 649 <.0001 0.038
HOSPICE $ 389 $ 425 <.0001 0.009
DME $ 250 $ 265 <.0001 0.016
Sidak correction applied. Source: Dartmouth Atlas of Healthcare - 2012
Medicare cost per enrollee was less in system hospitals that provided home health care. Although this was true in each spend category, with the exception of physician charges, the R squared values are quite small. Total Medicare spend and Home Health spend had slightly higher R squared values, however they are still low with respect to explanation of the differences in spending.
Principal Findings: System Level

Systems and Regions
The highest percentages of home health services within systems are in the Midwest and West. (Because some systems have hospitals in multiple regions, one system may appear in more than one region’s volume. The Mayo Clinical, for example, has hospitals in the Midwestern, Southern and Western regions.)
N Home Health No Home Health
SYSTEMS (Total) 378
SYSTEMS (AT LEAST 2 HOSPITALS) 345
SYSTEM HOSPITALS (QUALIFYING) 2905 1612 1293
SYSTEM HOSPITALS (Status) 55% 45%
HH PRESENT HH NOT PRESENT TOTALMIDWEST 557 252 809 19% 9% 28%NORTHEAST 230 115 345 8% 4% 12%SOUTH 389 426 815 13% 15% 28%US TERRITORIES 0 9 9 0% 0% 0%WEST 436 491 927 15% 17% 32%Total 1612 1293 2905 55% 45% 100%

System-Level Performance
Independent sample t-tests revealed small differences between home health/no home health cohorts, though these differences are not practically significant. The difference between cohorts is largest for patient satisfaction. The Sidak correction was applied to each of these analyses.
Source: 2013 AHA Survey of Hospitals. Systems must have at least one hospital indicating home health to be counted as a “Home Health – System”* A lower score indicates better performance.
Measure HH PRESENT HH NOT PRESENT p value
Overall Composite 68.06 67.53 0.003
Overall Composite 70.78 70.76 0.952
Process Measures 96.89 96.73 0.317Complications 72.75 74.29 0.001
Readmissions * 15.57 15.67 0.031
Mortality * 12.30 12.41 0.057
HCAHPS 71.97 70.39 <.0001
Conclusions
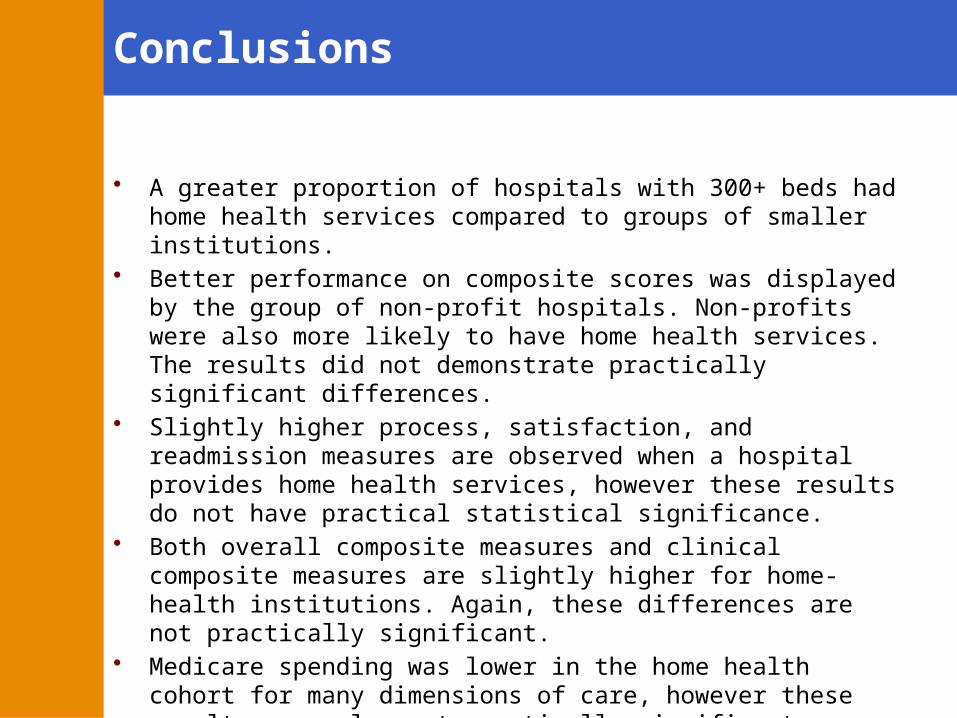
• A greater proportion of hospitals with 300+ beds had home health services compared to groups of smaller institutions.
• Better performance on composite scores was displayed by the group of non-profit hospitals. Non-profits were also more likely to have home health services. The results did not demonstrate practically significant differences.
• Slightly higher process, satisfaction, and readmission measures are observed when a hospital provides home health services, however these results do not have practical statistical significance.
• Both overall composite measures and clinical composite measures are slightly higher for home-health institutions. Again, these differences are not practically significant.
• Medicare spending was lower in the home health cohort for many dimensions of care, however these results were also not practically significant.

Study Limitations
• As each data source is integrated, there’s a corresponding decrease in the sample size. Missing data may result in a number of hospitals being excluded.
• Although statistically significant, the small differences in measures of central tendency cannot be interpreted as meaningful differences between the home-health and non- home-health cohorts.
• A number of t-tests were performed and this may cause a compounding risk of a type I error. The Sidak or Bonferroni corrections make this less likely to occur. Some t-tests performed did not meet this more stringent criterion to reject differences that could occur due to chance alone.
Opportunities for Further Study
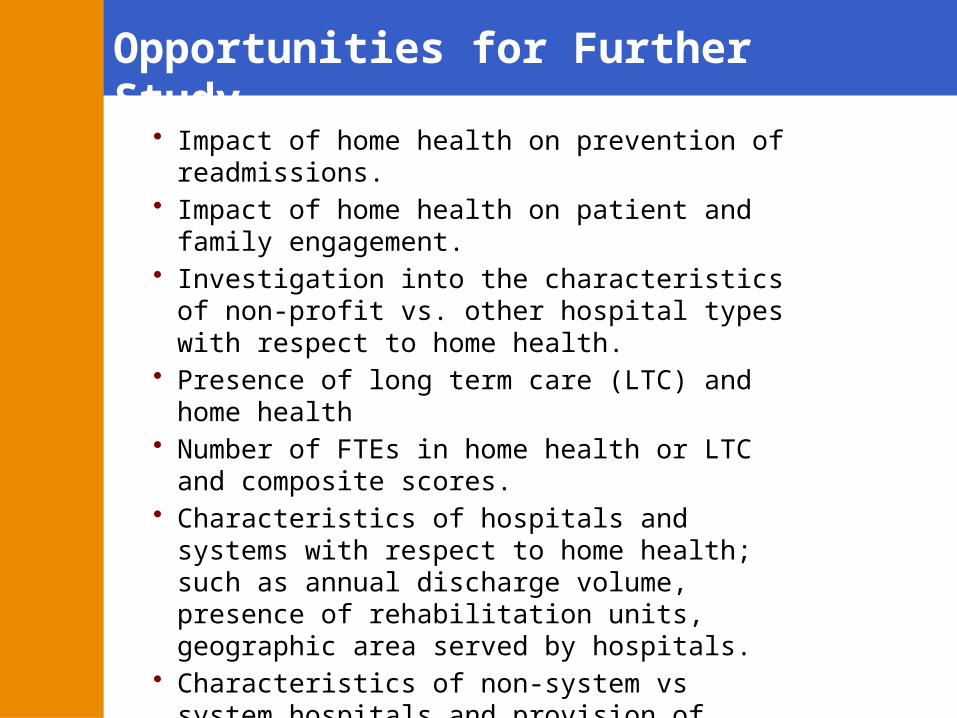
• Impact of home health on prevention of readmissions.
• Impact of home health on patient and family engagement.
• Investigation into the characteristics of non-profit vs. other hospital types with respect to home health.
• Presence of long term care (LTC) and home health• Number of FTEs in home health or LTC and
composite scores.• Characteristics of hospitals and systems with
respect to home health; such as annual discharge volume, presence of rehabilitation units, geographic area served by hospitals.
• Characteristics of non-system vs system hospitals and provision of home-health services.