COUPLING RESIDENTIAL END USE AND UTILITY WATER-ENERGY MODELS by Alvar Escriva-Bou, Jay R. Lund, Manuel Pulido-Velazquez, Edward Spang and Frank Loge AGU 2014 FALL MEETING SAN FRANCISCO, DECEMBER 15 TH 2014 ALVAR ESCRIVA-BOU [email protected] @alesbou notjustwater.wordpress.com

AGU2014: Coupling residential end use and utility water energy models
Jul 20, 2015
Welcome message from author
This document is posted to help you gain knowledge. Please leave a comment to let me know what you think about it! Share it to your friends and learn new things together.
Transcript

COUPLING RESIDENTIAL END USEAND UTILITY WATER-ENERGY MODELS
by Alvar Escriva-Bou, Jay R. Lund, Manuel Pulido-Velazquez, Edward Spang and Frank Loge
AGU 2014 FALL MEETING SAN FRANCISCO, DECEMBER 15TH 2014
ALVAR ESCRIVA-BOU
@alesbou
notjustwater.wordpress.com
Water
Energy
Food
Environment
Climate
Industry
OUTLINE
• Residential Water-Energy-CO2 optimization model. Household minimize their bills and conservation costs
facing water and energy price shocks.
• Utility-scale hourly Water-Energy simulation model. Based on actual data we build a model that can simulate
demand changes.
3

RESIDENTIAL END-USE OPTIMIZATION MODEL
• Based on a previous water-energy-GHG assessment study.
• Using probability distribution functions based on a water end-use survey.
• 10,000 MC simulations for 10 different cities in CA.
4
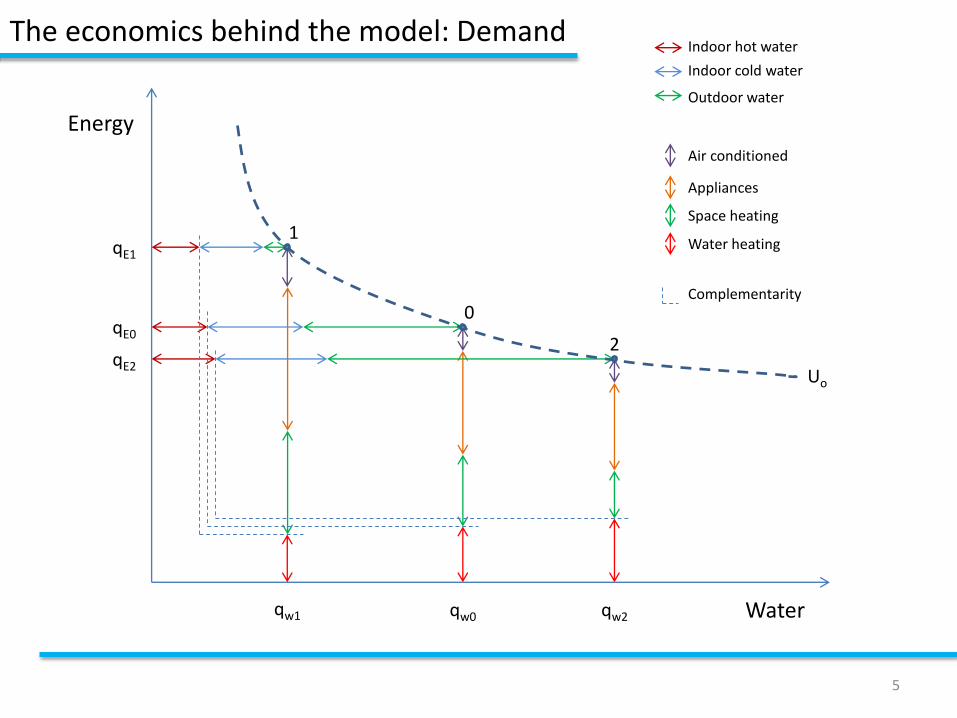
Water
Energy
Uo
Indoor hot water
Indoor cold water
Outdoor water
Air conditioned
Appliances
Space heating
Water heating
Complementarity0
1
2
qw0 qw2qw1
qE1
qE0
qE2
The economics behind the model: Demand
5
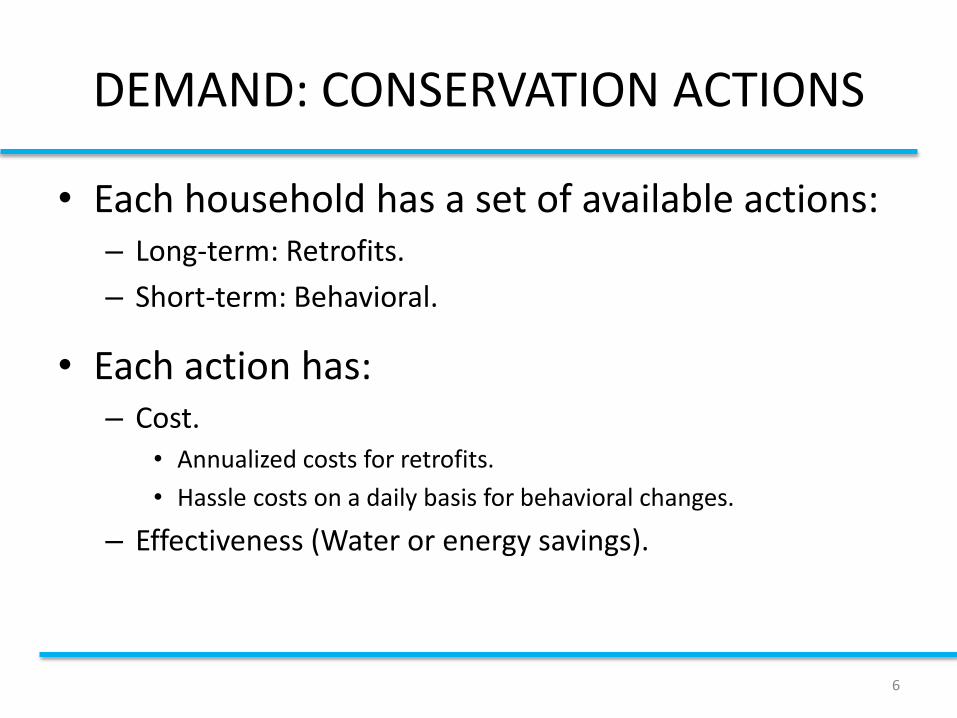
DEMAND: CONSERVATION ACTIONS
6
• Each household has a set of available actions:– Long-term: Retrofits.
– Short-term: Behavioral.
• Each action has:– Cost.
• Annualized costs for retrofits.
• Hassle costs on a daily basis for behavioral changes.
– Effectiveness (Water or energy savings).

Conservation Actions: Savings - Technological
0
0.05
0.1
0.15
0.2
0.25
0.3
0.35
0.4
0.45
0.5
0 1 2 3 4 5 6 7 8 9 10
Flow (GPM)
Retrofitted Appliance
Normal Appliance
7
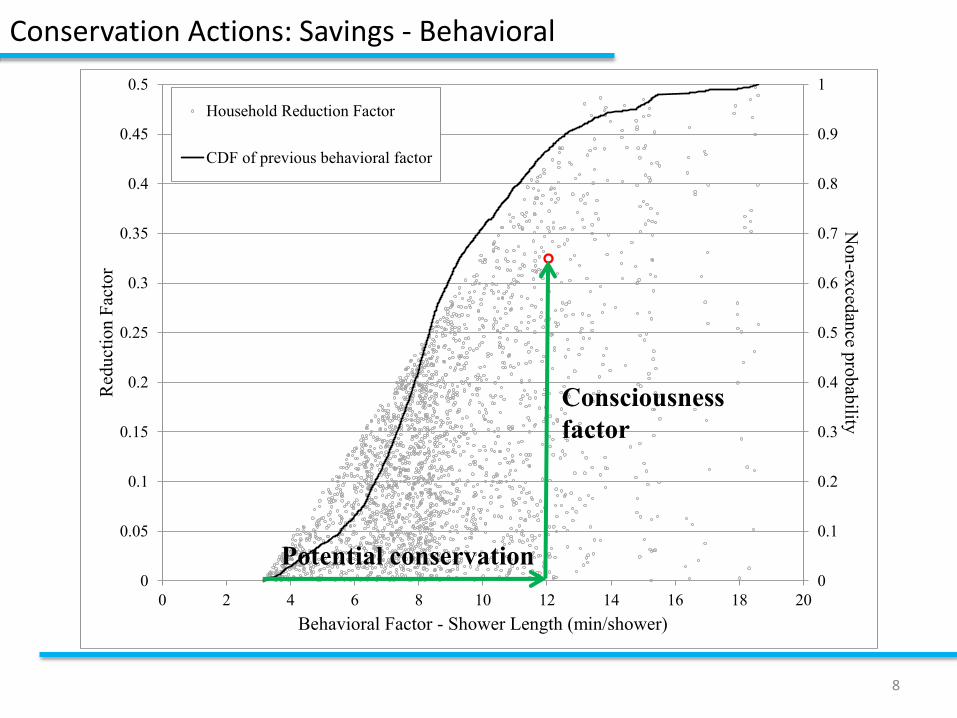
Conservation Actions: Savings - Behavioral
0
0.1
0.2
0.3
0.4
0.5
0.6
0.7
0.8
0.9
1
0
0.05
0.1
0.15
0.2
0.25
0.3
0.35
0.4
0.45
0.5
0 2 4 6 8 10 12 14 16 18 20
No
n-ex
cedan
ce pro
bab
ilityR
edu
ctio
n F
acto
r
Behavioral Factor - Shower Length (min/shower)
Household Reduction Factor
CDF of previous behavioral factor
Potential conservation
Consciousness
factor
8

Quantity
Price
D
Supply0
Q0
Supply ‘
Supply ‘’
Q’Q’’
P0
P’
P’’
The economics behind the model: Water Supply
Pw=120% (ρ=0.1)
Pw=110%(ρ=0.2)
Pw=100%(ρ=0.7)
9

The economics behind the model: Energy Supply
8
8.5
9
9.5
10
10.5
11
11.5
12
Jan
-09
Mar
-09
May
-09
Jul-
09
Sep
-09
No
v-09
Jan
-10
Mar
-10
May
-10
Jul-
10
Sep
-10
No
v-10
Jan
-11
Mar
-11
May
-11
Jul-
11
Sep
-11
No
v-11
Jan
-12
Mar
-12
May
-12
Jul-
12
Sep
-12
No
v-12
Jan
-13
Mar
-13
May
-13
Jul-
13
Sep
-13
No
v-13
Jan
-14
Mar
-14
Residential Natural Gas Price
Mean
110%
90%
10
Pe=115%(ρ=0.1)
Pe=100%(ρ=0.8)
Pe=85%(ρ=0.1)
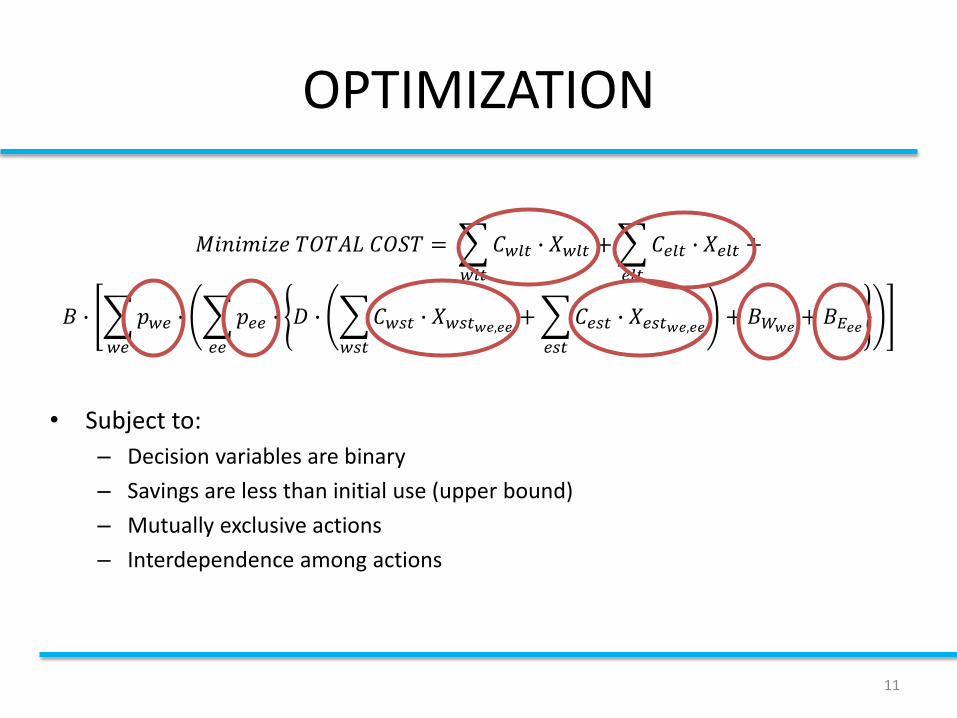
OPTIMIZATION
𝑀𝑖𝑛𝑖𝑚𝑖𝑧𝑒 𝑇𝑂𝑇𝐴𝐿 𝐶𝑂𝑆𝑇 =
𝑤𝑙𝑡
𝐶𝑤𝑙𝑡 ∙ 𝑋𝑤𝑙𝑡 +
𝑒𝑙𝑡
𝐶𝑒𝑙𝑡 ∙ 𝑋𝑒𝑙𝑡 +
𝐵 ∙
𝑤𝑒
𝑝𝑤𝑒 ∙
𝑒𝑒
𝑝𝑒𝑒 ∙ 𝐷 ∙
𝑤𝑠𝑡
𝐶𝑤𝑠𝑡 ∙ 𝑋𝑤𝑠𝑡𝑤𝑒,𝑒𝑒 +
𝑒𝑠𝑡
𝐶𝑒𝑠𝑡 ∙ 𝑋𝑒𝑠𝑡𝑤𝑒,𝑒𝑒 + 𝐵𝑊𝑤𝑒 + 𝐵𝐸𝑒𝑒
• Subject to:
– Decision variables are binary
– Savings are less than initial use (upper bound)
– Mutually exclusive actions
– Interdependence among actions
11

Results: Adoption rate and water savings for long-term actions
12
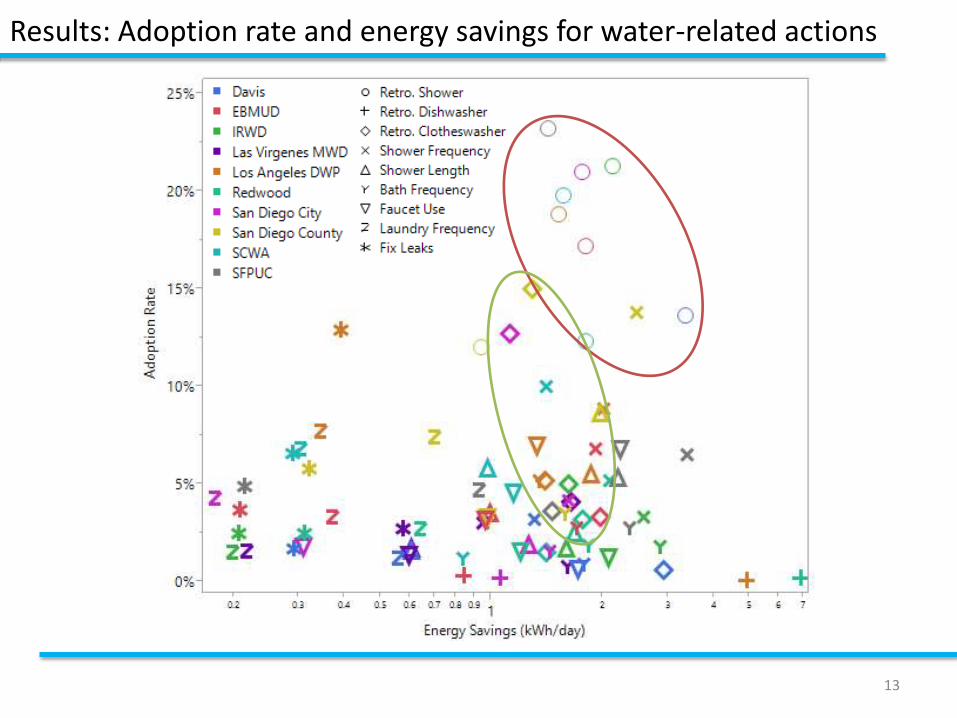
Results: Adoption rate and energy savings for water-related actions
13

Results: When energy cost is included (respect the only-water scenario)
14
• Adoption rate:• Retrofit shower: +7.9%
• Retrofit clotheswasher: +1.7%
• Reduce shower length: +3.2%
• …
• Increased savings:• Indoor water savings: +24%
• Energy savings: +30%
• GHG savings: +53%

Results: Demand function and elasticities
15

Results: Own- and cross-price elasticities (averages)
16
• Water own-price elasticity Ɛww = -0.05
• Energy own-price elasticity Ɛee = -0.03
• Energy water-price elasticity Ɛew = -0.02
• Water energy-price elasticity Ɛwe = -0.004
• Own-price values are relatively low.
• Water price affects energy consumption more than energy price affects water use.
• Literature about cross-price elasticities reviewed: Only 1 paper!! Lars Garn Hansen (Land Economics, 1996) obtained a Ɛwe = -0.2, but none obtained Ɛew.

UTILITY-SCALE HOURLY WATER-ENERGY SIMULATION MODEL
• Based on a real data from EBMUD water utility.
• We select a only a part that represents 27% of total EBMUD water use.
• We want to simulate real operation to obtain results for different scenarios.
17

EBMUD: Selected scheme of study
WTPWWTP
PP
PP
PP
LelandPop. ≈ 130,0006,391 MG/year
Elevation:150 feet – 45 m
Danville Pop. ≈ 75,0003661 MG/year
Elevation:350 feet – 107 m
San RamonPop. ≈ 150,0007553 MG/year
Elevation:550 feet – 168 m
Total Supply:17604 MG/year
(out of 64868 MG/year)
Pardee and Camanche Reservoirs
18

Water utilityWater users
Assembling the model
19
Total AnnualWater Use
Energy Utility
Hourly water demand
Hourly water supply
Water-related energy
GHG Emissions
Shares of use by customer category
Indoor vs. Outdoor
Hourly distribution of end uses
Irrigation Necessities (P-ET)
Pumping and treatment patterns
Water regulation
Water treatment
Pumping and distribution
Wastewater treatment
Water-related energy
Regressions and pumping
patternsEnd-uses energy
intensity
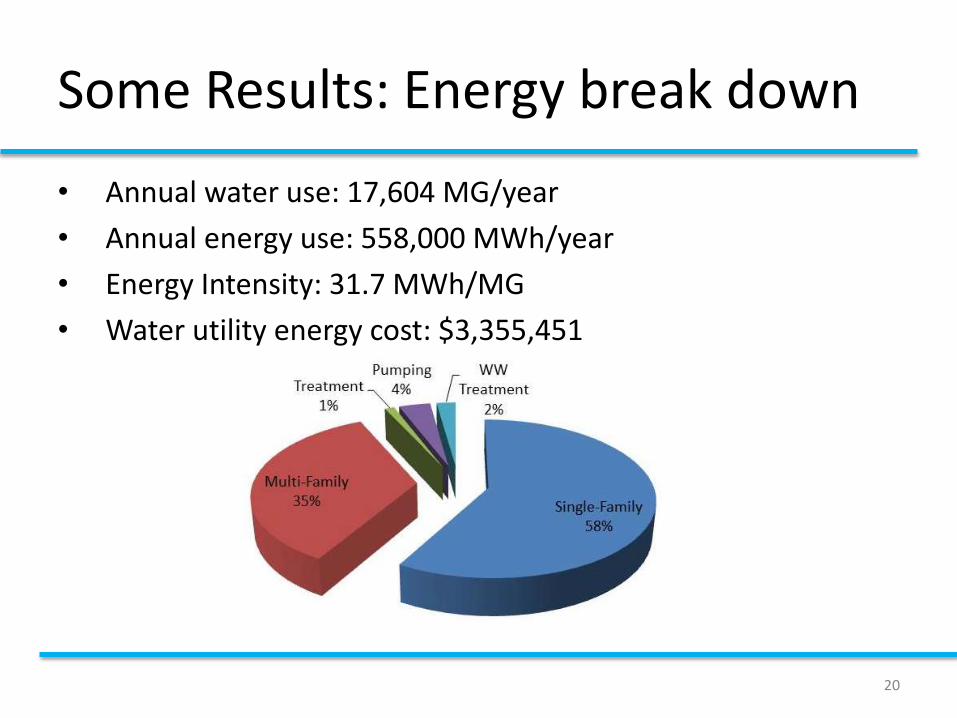
Some Results: Energy break down
20
• Annual water use: 17,604 MG/year
• Annual energy use: 558,000 MWh/year
• Energy Intensity: 31.7 MWh/MG
• Water utility energy cost: $3,355,451

Simulating scenarios
21
• Scenario 1: Residential optimal conservation
• Annual water use: 16,541 MG/year (-6%)
• Reduction Energy Use: 36,940 MWh/year (-6.6%)
• Water utility energy savings: $115,493 (3.5%)
• GHG savings: 7023 metric tons / year (93.5% residential and 6.5% Utility)
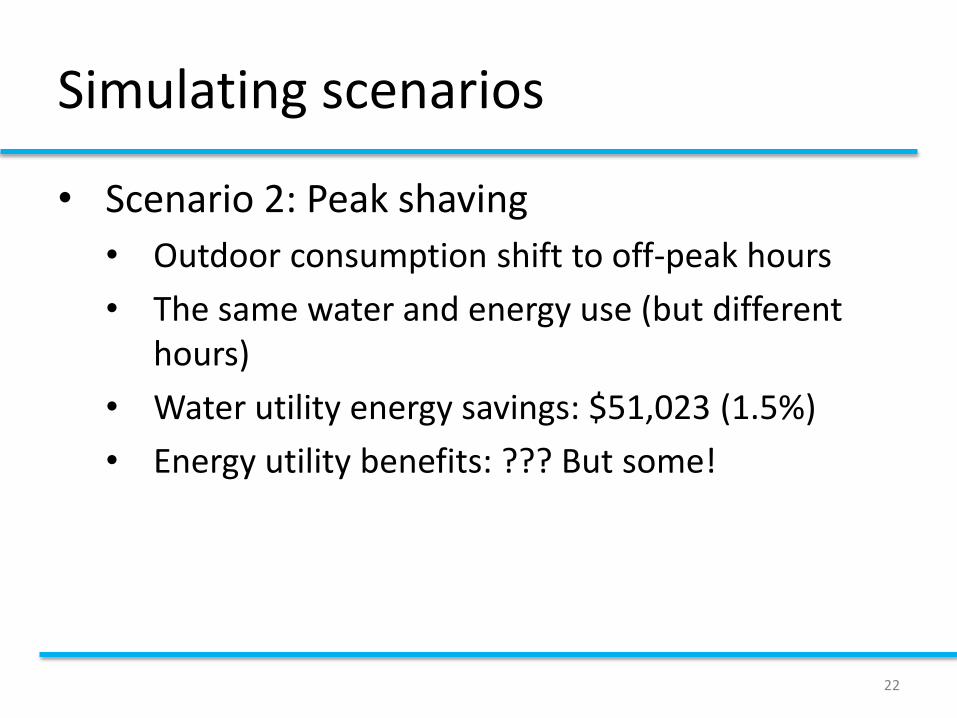
Simulating scenarios
22
• Scenario 2: Peak shaving
• Outdoor consumption shift to off-peak hours
• The same water and energy use (but different hours)
• Water utility energy savings: $51,023 (1.5%)
• Energy utility benefits: ??? But some!

TAKE HOME MESSAGES
• Increased water (and water-related energy and GHG emissions) conservation when energy is included.
• Most of water-related energy is from water heating in households.
• There are gains for water and energy utilities working together.
23
Thanks ;)
AGU 2014 FALL MEETING SAN FRANCISCO, DECEMBER 15TH 2014
ALVAR ESCRIVA-BOU [email protected]
@alesbou
notjustwater.wordpress.com
Related Documents