Agriculture in the Appalachian Region: 1965-2000 Dale Colyer West Virginia University Abstract: Agriculture in the Appalachian region has progressed since the ARC was established in 1965 when it was characterized by small farms with low incomes that contributed to the Region’s high rate of poverty. However, the region’s agriculture remains relatively small compared to that of the United States with an average farm size of 152 compared with 487 acres. The area is more dependent on animal agriculture with three fourths of it income compared to half for the nation. Farm operators obtain a large share of their income from work off-farm. However, farms in the region have become more specialized and oriented more toward market activities. Keywords: Agriculture, Appalachia, Farm Size, Farm Income JEL Codes: Q10 Agriculture, R11 Regional Analysis, Growth, Development and Change Agricultural and Resource Economics 2040 Agricultural Sciences P.O. Box 6108 Morgantown, WV 26506-6108 Phone: 304-293-4832 x 4472 FAX: 304-293-3752 email: [email protected] Copyright © 2001 by Dale Colyer. All rights reserved. Readers may take verbatim copies of this document for non-commercial purposes by any means, provided that this copyright notice appears on all such copies.

Welcome message from author
This document is posted to help you gain knowledge. Please leave a comment to let me know what you think about it! Share it to your friends and learn new things together.
Transcript

Agriculture in the Appalachian Region: 1965-2000
Dale ColyerWest Virginia University
Abstract: Agriculture in the Appalachian region has progressed since the ARC was established in1965 when it was characterized by small farms with low incomes that contributed to the Region’shigh rate of poverty. However, the region’s agriculture remains relatively small compared to thatof the United States with an average farm size of 152 compared with 487 acres. The area is moredependent on animal agriculture with three fourths of it income compared to half for the nation.Farm operators obtain a large share of their income from work off-farm. However, farms in theregion have become more specialized and oriented more toward market activities.
Keywords: Agriculture, Appalachia, Farm Size, Farm Income
JEL Codes: Q10 Agriculture, R11 Regional Analysis, Growth, Development and Change
Agricultural and Resource Economics2040 Agricultural SciencesP.O. Box 6108Morgantown, WV 26506-6108Phone: 304-293-4832 x 4472FAX: 304-293-3752email: [email protected]
Copyright © 2001 by Dale Colyer. All rights reserved. Readers may take verbatim copies of thisdocument for non-commercial purposes by any means, provided that this copyright noticeappears on all such copies.

2
Agriculture in the Appalachian Region: 1965-2000
Dale ColyerWest Virginia University
The Appalachian Regional Commission (ARC) was established in 1965, an era when boththe area and its agricultural sector were characterized by persistent poverty and lagging economies. Coltrane and Baum (1965) analyzed Appalachia’s agriculture of the area and concluded that“agricultural development has not occurred on a wide scale...” (p. viii). Characteristics of the area’sagriculture included small sizes of farms, low incomes, low percentages of land in farms, a lack ofcropland–especially high quality land, high rates of off-farm work, and a concentration on livestockproduction. They found that only 31 percent of the nonfederal land in the region was suitable forcrop production, compared to 44 percent for the U.S. The agricultural situation was derived froman earlier era of relative isolation and subsistence farming and was compounded by a rough terrainthat hinders the development of large scale mechanized farming operations.
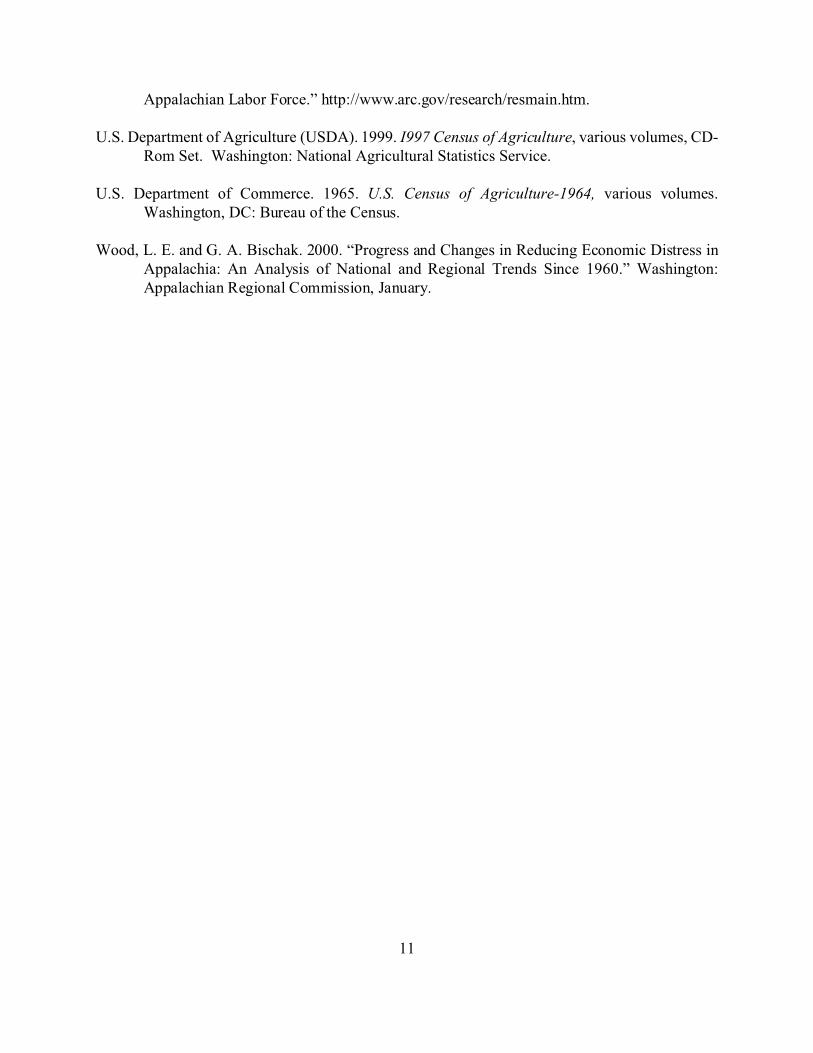
Although having a comparable growth rate to that of the U.S., Appalachian agriculturaloperations have remained relatively small with a 1997 average farm size of 152 acres compared withthe U.S. average of 487 acres (USDA 1999). The area also remains more dependent on animalagriculture with 75 percent of its income dependent on livestock compared to 50 percent for the U.S.While the region’s agricultural sector plays a less significant role in its economy than in the past, itis still an important source of income and other benefits for a large number of households, as wellas providing clients for agribusiness and other firms that service the sector and amenities for manyurban area residents. Furthermore, agriculture continues to be important in the cultural and socialinstitutions of the region.
Despite its importance, relatively little attention has been given to the sector in recenteconomic and other analyses of the Appalachian Region. No information about agriculture appearson the ARC website and there have been no articles on agriculture in recent issues of the Journal ofAppalachian Studies (JAS 2000). Isserman (1996a, 1996b), Rogers and Cushing (1996), Lewis andBillings (1997), and Wood and Bischak (2000) reviewed the socioeconomic progress, culture andpoverty in Appalachia with analyses of changes in the region over a thirty-year period. These studiesindicate substantial progress, but agriculture was not included in the analyses. This paper helps toremedy that situation by analyzing the region’s agriculture, examining and evaluating changes duringthe existence of the ARC. Agriculture in the region is compared with that of other regions and theUnited States and implications are developed for the future of agriculture and agricultural researchneeds in the region.
The Appalachian Region
According to Coltrane and Baum (1965), 55.7 percent of Appalachia’s land area is notsuitable for agricultural production, while another 13.5 percent has very limited potential. Evenwithin the remaining 30.8 percent, a large share is not suitable for intensive crop production. Thus,forage and livestock production are appropriate for much of the area’s limited land resources

3
although many crops are produced in commercially significant quantities. Agriculture in the regionis quite varied, as might be expected for an area that stretches from New York to Alabama.
A relatively large proportion of the Appalachian Region’s population is located in rural ratherthan urban areas, although urbanization has increased and several cities have grown rapidly whilerural populations have tended to decline (Isserman 1996a, 1996b, Rogers and Cushing 1996). In thecentral part of Appalachia, however, there are no large urban centers and a major share of thepopulation remains rural. Thus, while the majority of the population is located in urban settings, theregion is more rural than for the U.S. although much of the Plains and Mountain States west of theMississippi River also is very rural.
Data Sources
The primary sources of data for this analysis of Appalachian agriculture are the 1997 and1964 of the Censuses of Agriculture. Additional information was obtained from publications byColtrane and Baum (1965), Colyer (1976), Maher (1967), Economic Research Service, USDA (ERS2000), and Appalachian Regional Commission (ARC 2000). Census data are reported for states andcounties, but not for the Appalachian Region or for that part of each state. Thus, the county data hadto be aggregated for the Appalachian portion of each state and then combined to get regional totalsand averages. All regional averages are weighted by number of farms, acres of land, or otherappropriate measures to obtain regional averages.
Results and Discussion
This section is divided into four parts. First, overall changes in the region are analyzed andcompared with those for the U.S. Then, patterns and changes within the individual state parts of theAppalachian are examined. In the following subsection, attention is given to county level changesand patterns on the Region’s agricultural characteristics followed by an examination of productivityand specialization. Then niche/specialty crops and other sources of farm income are reviewed.Finally, off-farm work and its impacts on the agriculture of the region are examined.
Regional Patterns and Changes in Agriculture
The census data indicate that progress has been made in the agriculture of the region,although today’s Appalachian farms retain some of the characteristics reported by Coltrane andBaum (1965). Between 1964 and 1997, the average size and value of products produced by farmsin Appalachia both increased substantially (Figure 1 and Table 1). The average size of farmincreased from 122 acres in 1964 to 152 acres in 1997. Cash receipts from farm marketings per farmalso increased, in both nominal and real terms, with the real value in 1997 dollars being $25,193 in1965 compared with $44,751 in 1997 (Figure 2). However, when compared with the U.S.,agriculture in the Appalachian Region continues to be characterized by smaller size farms and lowerincomes; average farm size for the U.S. in 1997 was 497 acres with per farm sales of over $102,000.
In 1997, there were 230,050 farms in Appalachia consisting of a total of 34.9 million acres,a 36.5 percent decline from the nearly 55.0 million acres reported for 1964. For the U.S., land infarms also declined but only by 16.1 percent, dropping from 1,110 million acres in 1964 to about 932million in 1997. In Appalachia, more than 75 percent of the farms are under 180 acres while only

4
50 percent of the farms in the U.S. are in that category. The land in Appalachia is less suitable forintensive crop production than in most other regions because of the rough terrain that characterizesterrain; about half of the cropland was used to produce hay and much of the land in farms is onlyused for pasture. In 1997, nearly 30 percent of the land in farms was woodland while some 38percent was used for pasture, including woodland pastured.
About three fourths of Appalachian cash receipts are obtained from livestock sales comparedwith only half for all U.S. farms (Figure 3). Historically, beef and dairy production were the moreimportant sources, but poultry production has accounted for an increasing proportion of the valueof farm production in Appalachia, especially in Alabama, Georgia, North Carolina, Tennessee,Virginia and West Virginia; the number broilers sold increased from 578 million 1964 to over 1.7billion in 1.7 (1.3 billion in Alabama and Georgia); the region accounted for one fourth of thebroi8lers produced in the nation. However, most small farms receive more income from off-farmthan from farm sources; in 1997 over 135,000, 58.9 percent, of the farm operators in Appalachiareported that their primary occupations were ‘other’, i.e., not farming (49.7 percent of farm operatorsin the U.S. reported ‘other’ as their primary occupation).
Although average farm size is relatively small in Appalachia, substantial numbers of largerfarms are found in the region (Table 2). Some 8.3 percent of farms in Appalachia reported the valueof 1997 farm sales of over $100,000. For the U.S., this percentage was 12.7, which is consistentwith the generally larger sizes fo the nation. While the patterns of the distributions of sizes basedon sales are similar for Appalachia and the U.S., the region has more farms in the three categoriesfor farms with sales under $10,000 per year while the U.S. has higher proportions of its farms in thethree categories with sales of over $25,000. Within the Appalachian region, operations with largersales values exist for farms with beef, dairy, pork, poultry, orchards, and tobacco as the primarycommodities produced and sold.
Productivity and Specialization
Average crop yields in the Appalachian Region tend to be lower than for the U.S. (Table 3).A comparison for selected crops of U.S. yields with those for the Appalachian region indicates thatfor the U.S. average corn yield was 122 bushels per acre compared with 87 for the Appalachianregion; wheat was 37.5 bushels versus 35, tobacco averaged 2,085 pounds per acre and 1,817, whilehay yields averaged 2.3 tons per acre compared with 1.9. Appalachia’s yields were also less in 1964,except for wheat and tobacco, and in 1997 for all four crops analyzed; yields generally increased inboth the U.S. and the region. Farm production has become more specialized in both the U.S. and Appalachia. This is atrend that became notable in the post World War II period as farmers turned increasingly towardcommercial operations producing for the market. While the census does not report information onspecialization, an examination of the percentages of total farms producing a wide range of productsindicates that substantially smaller percentages produce most the crops and livestock enterprises(Table 5). Except for cattle and calves in Appalachia, a much smaller percentage of farms produceeach of the major products than in the past. In addition, fewer farms seem to be producing productsexclusively for home consumption. Production per unit for farms producing a particular product alsohas increased in both the U.S. and Appalachia, but output per farm in Appalachia still lagsconsiderably behind those of the U.S. This, of course, is consistent with the continued existence of

5
smaller sizes of farms in the region.The census no longer reports information on home consumption, but the degree of production
for home use can be inferred from comparing the percentages of farms with inventories of aparticular livestock enterprise with those selling some of the product. For example, in 1964, only 74percent of the U.S. farms with hog and pig inventories sold one or more animals, but by 1997 theproportion selling hogs or pigs increased to 93 percent. Appalachian farms appeared to be moreoriented toward producing for home use in 1964, with only 42 percent of the farms reportinginventories of hogs and pigs selling one or more of those animals; by 1997 this had increased to 75percent but was still lower than for the U.S.
Intraregional Variations
While all the Appalachian portions of the states in the region have some similarcharacteristics, there are sufficient differences to merit examination of variations among them.Farms in all the state parts within the Appalachian Region are relatively small but considerablevariation exists among the states, with relatively larger farms existing in New York, Mississippi andWest Virginia (Tables 1 and 4, Figure 4). In Mississippi, the 1997 average size of farm in theAppalachian counties was 276 acres compared with 323 for the state. The smallest average size wasin North Carolina, about 100 acres (compared with 185 for the entire state), with the Appalachianparts of Tennessee and South Carolina also having relatively small average sizes. With exceptionof Pennsylvania, the Appalachian portions of the states comprising the region had smaller sizes offarms than was typical of the entire state. In Georgia and South Carolina the states’ averages wereover twice the sizes in their Appalachian areas. For the Appalachian region, the average farm sizewas 152 acres compared with 196 for the total farm areas of the 13 states.
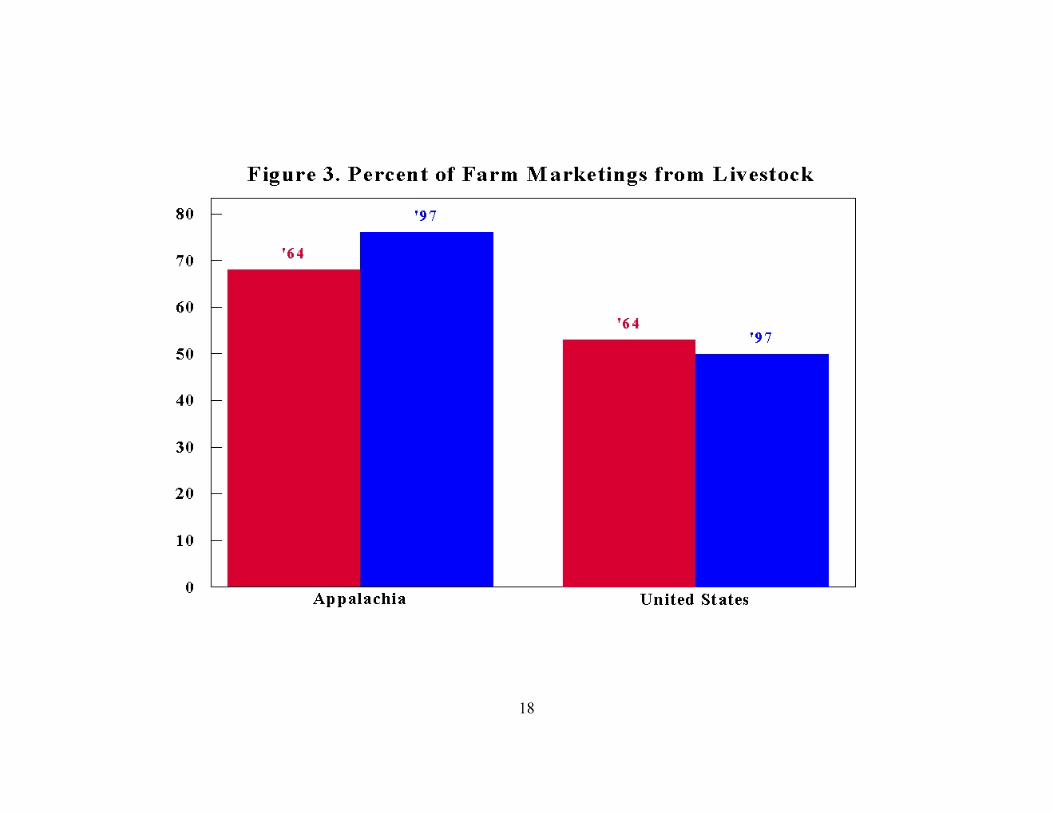
Livestock account for the major share of farm income in nearly all the ARC parts of theAppalachian states (Figure 5). Poultry has become a leading source of cash receipts from farmmarketings in Appalachia, although beef and dairy enterprises remain important sources of farmproduction and are dominant on a much larger number of farms than poultry, where relatively fewlarge contract operations account for most of the value of production. In 1997, poultry accounted fornearly 95 percent of cash receipts in the Appalachian part of Georgia and over 80 percent in thoseparts of Alabama and West Virginia. In these three states, poultry production has become the majorlivestock’s enterprise. However, livestock accounted for only 50 percent of farm receipts inKentucky where tobacco is an important crop along with corn and soybeans; some 18,800 farms inthe Appalachian area of Kentucky produced over 155 million pounds of tobacco, over one third ofthe state’s total. In Mississippi, about 60 percent of the value of farm sales was from crops withcorn, cotton, and soybeans being the more important sources. Nearly six million acres of hay wereharvested from a total of 10.9 million acres of cropland harvested. Much of the rest of the cropland,another 10 million acres were in pasture as well as substantial areas of permanent and woodlandpastures; of 34.9 million acres in farms in the region only 19.2 million acres were cropland.
County Level Agricultural Patterns and Changes
Examination of agricultural characteristics at the county level results in a more refined viewof the Region’s agricultural production patterns. This is accomplished by plotting a number of

6
characteristics by county for the entire region (Figures 6-11)–these figures have the counties dividedinto quartiles with respect to each of the characteristics analyzed. Other analyses of Appalachiahave divided the region into northern, central and southern subregions (Isserman 1996a, 1996b,Cushing and Rogers1996) and the distribution of agricultural characteristics tends to follow a similarpattern, but with many exceptions. The central area consists mostly of southern counties in WestVirginia, and eastern counties in Kentucky and Tennessee which tend to be coal producing and theleast favorably situated for agricultural purposes (see Cushing and Rogers 1996 for the definition ofthe subregions).
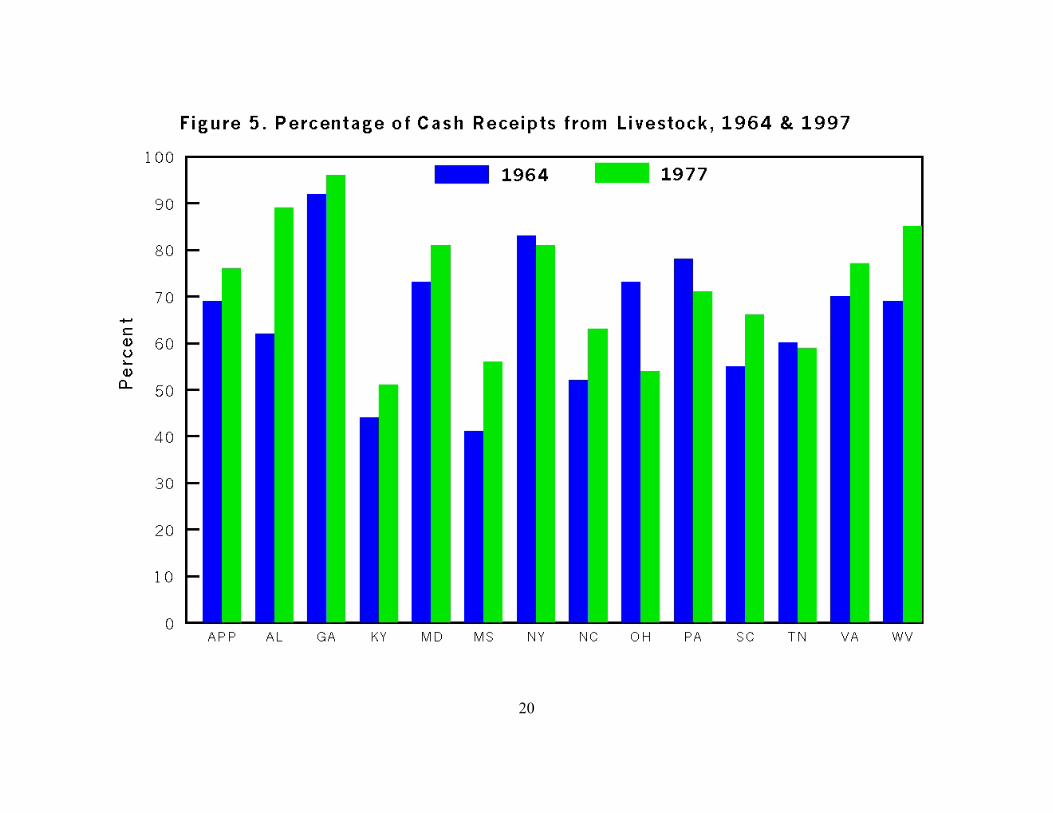
The percentage of land in farms is low in many of the counties in the central area but is alsolow in northern Pennsylvania, North Carolina, South Carolina, northern Georgia, and the southernhalf of the Alabama portion of the Appalachian region (Figure 6). The larger percentages are in thewestern parts of the Region from Ohio southward as well as in southwestern Virginia andnortheastern Tennessee. Average sizes of farms are lower in Appalachian portions of southwesternWest Virginia, eastern Tennessee, North Carolina, South Carolina, Georgia, and the central part ofAlabama; larger sizes are in New York, the northeast and southeast part of AppalachianPennsylvania, Virginia, eastern West Virginia, southern Alabama, and Mississippi (Figure 7). Thevalue of land and buildings per acre are lower in New York and an adjacent area of Pennsylvania,northern West Virginia, eastern Kentucky and Mississippi; the larger values per acre are in thecentral portion of Pennsylvania, eastern portion of Tennessee, North Carolina, South Carolina,Georgia and a few counties in central Alabama (Figure 8). The larger values per acre tend tocorrespond to the areas with smaller sizes of farms.
Values of farm marketings per farms seem to be lower in West Virginia (except the easternpanhandle), Kentucky, a few counties in the western area of North Carolina, and eastern Tennesseewhile larger values tend to be in New York, Pennsylvania, the eastern part of North Carolina, Geogiaand Alabama (Figure 9). The lower percentages of farmers working off farm (under 60 percent) areconcentrated in New York and Pennsylvania with scattered counties in the other areas while thecounties with the larger shares tend to be concentrated in Ohio, the western portion of Tennessee,South Carolina, Alabama and Mississippi (Figure 10). Farm population as a percent of totalpopulation is relatively, generally under 5 percent but with a few counties with higher percentages,up to 24 percent (Figure 11). The lower percentages tend to be in the center of the region fromPennsylvania southwestward through Alabama; these tend to be in coal producing areas althoughthere are many exceptions. The higher concentrations tend to be in the western counties of Ohio,Kentucky, Tennessee and Mississippi together with some eastern counties in West Virginia,Virginia, Tennessee and northern North Carolina.
Niche, Specialty, and other Farm Income Enterprises
The rough nature of its agricultural resource base makes Appalachia relativelynoncompetitive in the production of large scale crop enterprises such as food and feed grains or otherenterprises requiring large and relatively flat areas amenable to cultivation with the large equipmentused for efficient production. This is a primary reason that animal agriculture has been of suchimportance to the region’s agriculture. However, high value specialty, niche or specialty crops andother sources of income that require relatively little land area due to the intensity of productionand/or that can be spread over larger areas where mechanical intervention is not required can be

7
produced and can add significantly to farm incomes. Historically, tobacco has been such a crop ina large part of Appalachia (Kentucky, North Carolina, Tennessee, Virginia, and West Virginia). In1997, 304 million pounds were produced in the region compared with 216 million pounds in 1987(although 314 million pounds had been produced in 1964). Nursery and greenhouse production alsohave been increasing with $673.1 million of products sold in 1997 versus $49.4 million in 1964; thenumbers of farms selling such products nearly doubled, from 4,912 in 1964 to 8,468 in 1997.Production of vegetables, however, has declined and the acreage in orchards also has decreased,although much of this latter decline has been offset by increased yields. Other specialty cropsinclude Christmas trees and forest products.
The rough terrain of the region results in a relatively large share of the land in farms beingin woodlands, 38.5 percent in 1964. Thus, farms in the region are able to derive considerableamounts of income from the sale of forest products. In 1964, some 55,690 farms sold over $27.7million of forest products including standing timber, logs, fence posts, firewood, etc. By 1997, thesales of such products totaled over $60.2 million although from only 8,606 farms. In addition, salesof Christmas trees have become more important as a source of income for many farms. In 1964,sales of 1.5 million trees from 1,844 farms in six states were reported in the Census of Agriculture(no sales were reported for the southern states of the region). By 1997, Christmas tree sales werereported by 3,511 farms from all states in the region except Mississippi; these amounted to a valueof nearly $26.5 million. In addition, many persons in the region harvest and sell ginseng, goldensealand other forest products.
Recreational enterprises and other forms of service activities also provide significant numbersof farms in the region with opportunities to enhance their incomes, although data on such activitiesare not readily available. Among these are activities such as fee fishing, renting access to land tohunters, leasing land to hunting clubs, appreciative (nonconsumptive) use of wildlife, nature study,bed and breakfast or other lodging facilities, etc. (Grafton et al. 1990). Such enterprises correspond,to some extent, with areas that have developed tourism as sources of income and tend to be in areascloser to population centers or that have prominent tourist attractions. In 1964, the Census ofAgriculture reported that 2,505 farms in Appalachia received an average of $1,273 from recreationalenterprises. In 1997, this income was included in “other sources of a farm related income” whichincluded patronage refunds and cooperative dividends with an average of $1,535 for 19,758 farms;thus, income from recreational enterprises probably increased but it cannot be separated from theother sources.
Off-Farm Work and Income
Farm income is not an adequate indicator of the well being of farm families since a majorityof the farms in both the U.S. and Appalachia receive much of their incomes from off-farm sourcesincluding wages and salaries, business profits, investment income, social security, welfare, and/orother payments. In 1998, for example, the average total household income of farm families for theUnited States was $59,734 of which $52,734 (88 percent) came from nonfarm sources (ERS 2000).These data are based on a national survey by ERS and are not available at county or even state levels.However, since 1991, this information has been reported for agricultural production regionsincluding an Appalachian region consisting of the entire states of West Virginia, Kentucky,Tennessee, Virginia and North Carolina. While not strictly comparable to the ARC, the data do

1This negative income is often misleading since many of these small farms have positivecash flows, i.e., those where the values of sales exceed cash expenditures. They become negativewhen all costs, including imputed land and labor cost, are considered.
8
provide a basis for comparing a part of Appalachia with the Nation. In 1997, the 290,455 farms inthose five states were reported as having an average total farm household income of $48,743 ofwhich $44,392 (91 percent) were from nonfarm sources. Thus, total household income was about$11,000 less in Appalachia than in the U.S. However, the average farm household in Appalachiahad an income only 2 percent less than the average U.S. household (farm and nonfarm householdscombined) income of $49,692.
In the U.S., small farms received both a higher proportion and, on average, a larger dollarvalue from off-farm income than did larger farms. This, however, is somewhat misleading since alarge share of the off-farm income was received by small farms that are classified by ERS as“residential style farms,” those where, while producing $1,000 or more in farm products, the primaryuse of the property is for a residence by a household that has a nonfarm occupation. The averagenonfarm income received by the households owning these farms was $76,390 while their net farmincome averaged -$4,309.1 In contrast, limited resource small farms had an off-farm income of$13,153 and farm income of -$3,229. Only farms with relatively high farm sales (over $100,000)had average farm incomes that were positive. Since many of the small farms in Appalachia arelimited resource farms, the level of off-farm income for that category may be typical for the region.
Comparable data for farm/nonfarm incomes in the Appalachian Region are not available forthe 1960s when the Commission was formed. However, information on days worked off the farmis available, although the categories reported in the Census of Agriculture have changed–in 1959 offfarm work was reported for any and 100 days or more while the categories are now any and 200 daysor more of off-farm work. In 1964, 38.3 percent of Appalachian farmers worked off the farm for 100or more days and 50.6 percent worked off their farms at least some of the time. For the U.S., thecorresponding figures were 26.1 and 46.3 percent. For Appalachia in 1997, over 58.9 percent of thefarm operators reported some off-farm work and 42.3 percent reported 200 or more day’s off-farmwork; for the U.S. the comparable figures were 54 and 37 percent. Thus, while off-farm workincreased in Appalachia, it increased more rapidly for the rest of the country which now has only aslightly smaller percentage of farmers reporting off farm work than in Appalachia. It should benoted that these data are only for the farm operator and do not include off farm work by other familymembers.
Conclusions and Implications
Appalachian agriculture is characterized by smaller farms and lower farm incomes than forthe averages of the U.S., although the average sizes of farms have increased in both Appalachia andthe United States. Farms in Appalachia are about one third the size of the average for the nation andless of the area’s land is in farms due to steeply sloping land, thin or rocky soils and similarconditions that preclude large scale, mechanized agricultural production systems. Because ofrelatively poor quality of the land, farm numbers and land in farms have declined substantially duringthe last or four or five decades. While the numbers of farms and land in farms also have declined

9
nationally, these changes have been more pronounced in the Appalachian region. Although the sizes of farms, farm incomes, and related characteristics are relatively small in
Appalachia, the agriculture of the region has followed trends similar to those elsewhere in the U.S.Thus, farms have become more specialized and are now more commercially oriented; relatively lessof the farms and farm enterprises are devoted to production for home consumption although thatprobably remains more important in Appalachia than for most of the U.S. Comparisons of 1997 and1964 (and other censuses) Census of Agriculture data for areas of Appalachia and the U.S. indicatethat much smaller percentages of the farms in the region (and nation) have small pork, poultry, dairyor orchard enterprises; those that continue with such activities tend to have larger enterprises thanin the past and a larger proportion of farms with those enterprises also sell products produced bythose enterprises. In 1964, for example, relatively large numbers of Appalachian farms hadinventories of hogs and pigs, chickens (especially layers), and dairy cows but did not report any salesfrom those enterprises. Those farms that now report inventories of livestock have substantiallylarger numbers and a high proportion report sales of the animals or their products. In addition, thenumbers of farms reporting grain production have declined significantly in the region, but those thatremain in production produce larger amounts, although less than national averages on a per farmbasis.
A smaller portion of Appalachian land in farms is cropland due largely to the hilly terrain thattypifies the region; much of the land is best suited to use as pastures and woodlands. Thus, theregion’s agriculture is more oriented toward livestock production with a much larger share ofregion’s cash receipts from farm marketings derived from livestock sales than for the U.S. Dairycattle tend to dominate in northern part of the region, beef cattle in the center, and poultry in thesouth although poultry production has increased in the central area as well, especially in Virginia andWest Virginia. Beef cattle and the sale of feeder calves is the predominant agricultural enterprisein much of the region. Since the resource base for the region’s agriculture does not permit thedevelopment of large scale mechanized operations, especially for grain and other crops, the regionwill continue to depend on animal agriculture, with specialty crops, recreational enterprises, andother tourist/service related activities growing in importance as sources of additional income.
Farmers in the region, especially those with smaller sizes of operations, depend increasinglyon off-farm sources for an important portion of their incomes, often for most or all of the incomesince the net incomes of small sized operations tend to be negative when all of the costs are takeninto account–these may, however, provide a low-cost residence as well as lower cost food fromconsumption of farm raised products and amenities from country living. For the U.S. as well asAppalachia, incomes from nonfarm sources tend to exceed those from farming in all farm sizegroups except for large size farms, those with a value farm production of over $100,000 per farm.While limited resource farms that are typical in many areas of the Appalachian Region earn most oftheir incomes from nonfarm sources, their total earnings are substantially less than those of largerfarms which tend to have incomes equal to or greater than those of the average incomes for thenonfarm population. Operators from limited resource farms often earn far less than operators fromlarger farms who work off the farm for at least two reasons. One they are often in areas whereemployment opportunities are relatively limited which is typical of more isolated and more ruralareas such as exist in much of the Appalachian region. The other is that more of the operators oflimited resource farms also have limitations from the standpoint of their human capital endowments,i.e., their education, training and experience tend to be more limited than is true for many of the

10
operators of larger farms. Thus, programs to promote rural development and to improve educationalopportunities are essential to help overcome the low income problems that result from this situation.
References
Appalachian Regional Commission (ARC). 2000. “Poverty Rates in Appalachia, 1990.”http://www.arc.gov/research/poverty/provmain.htm, accessed August 10, 2000.
Coltrane, R.I. and E. L. Baum. 1965. An Economic Survey of the Appalachian Region, with SpecialReference to Agriculture. Agr. Econ. Report No. 69, ERS, USDA, Washington.
Colyer, D. K. 1976. “Land Use Patterns in Appalachia.” pp. 297-300, in J. Luchok, J. D. Cawthorn,and M. J. Breslin, eds., Hill Lands: Proceedings of an International Symposium.Morgantown, WV: West Virginia University.
Economic Research Service (ERS). 2000. “Farm Structure Program - Farm Operator HouseholdIncome Data.” http://www.ers.usda.gov/briefing/FarmStructure/QA/Text/hh_inc.htm,accessed August 23, 2000.
Grafton, W. N., A. Ferrise, D. Colyer, D. K. Smith and J. E. Miller. 1990. Income Opportunities forthe Private Landowner Through Management of Natural Resources and RecreationalAccess. Morgantown, WV: West Virginia University Extension Service.
Isserman, A. M. 1996a “Socio-Economic Review of Appalachia: Appalachia Then and Now, AnUpdate of ‘The Realities of Deprivation’ Report to the President in 1964.”http://www.arc.gov/research/resmain.htm.
Isserman, A. M. 1996b. “Socio-Economic Review of Appalachia: The Evolving AppalachianEconomy.” http://www.arc.gov/research/resmain.htm.
Journal of Appalachian Studies. 2000. “Contents of the Journal.” http://www.wvu.edu/~regional/jascontents.htm, accessed February 8, 2001.
Maher, J. F. 1967. Appalachia–A Reference Book, First Edition. Appalachian Regional Commission,Washington.
Lewis, R. L. and D. B. Billings. n.d. “Appalachian Culture and Economic Development.”http://www.rri.wvu.edu/pdffiles/lewisarc.pdf, accessed February 8, 2001.
Lewis, R.L. and D. B. Billings. 1997. “Appalachian Culture and Economic Development: ARetrospective View on the Theory and Literature.” Journal of Appalachian Studies3(Spring):3-42.
Rogers, Cynthia and Brian Cushing. 1996. “Socio-Economic Review of Appalachia: The
11
Appalachian Labor Force.” http://www.arc.gov/research/resmain.htm.
U.S. Department of Agriculture (USDA). 1999. I997 Census of Agriculture, various volumes, CD-Rom Set. Washington: National Agricultural Statistics Service.
U.S. Department of Commerce. 1965. U.S. Census of Agriculture-1964, various volumes.Washington, DC: Bureau of the Census.
Wood, L. E. and G. A. Bischak. 2000. “Progress and Changes in Reducing Economic Distress inAppalachia: An Analysis of National and Regional Trends Since 1960.” Washington:Appalachian Regional Commission, January.

Table 1. Characteristics of Appalachian and U.S. Agriculture, 1964 & 1997
State (ARC Area)
Land in Farms 1000 acres
Number of Farms Percent of LandArea in Farms
Average Farm Size, Acres
Average Value$ per Acre
1964 1997 1964 1997 1964 1997 1964 1997 1964 1997
Alabama 7,029 4,380 54,400 27,365 42.1 27.8 129 160 144 1,692
Georgia 2,793 1,504 25,167 12,743 38.1 21.7 111 118 158 2,795
Kentucky 5,194 3,864 51,987 28,689 46.5 35.6 100 135 146 1,141
Maryland 430 275 2,543 1,656 43.4 27.8 169 167 164 1,499
Mississippi 4,451 2,428 31,993 8,808 61.0 36.8 139 276 103 883
New York 4,062 2,055 20,292 9,464 54.2 27.2 200 217 112 953
North Carolina 2,868 1,490 38,175 14,866 36.6 19.6 75 100 220 2,457
Ohio 5,108 3,691 36,550 21,989 56.3 42.0 140 168 139 1,441
Pennsylvania 7,875 5,015 55,057 29,009 33.6 21.4 143 173 150 1,672
South Carolina 925 458 9,725 4,083 36.5 18.3 106 112 214 2,362
Tennessee 5,982 4,118 65,298 40,069 48.3 33.4 92 103 187 2,127
Virginia 2,954 2,176 24,484 13,537 44.4 36.2 121 161 139 1,428
West Virginia 5,279 3,456 34,504 17,272 34.2 22.4 153 194 91 1,090
Appalachia 54,951 34,916 449,176 230,050 42.8 28.0 122 152 144 1,564
United States 1,110,187 931,795 3,157,857 1,911,859 49.0 41.1 352 487 144 993
Sources: Census of Agriculture, 1965 & 1998

13
Table 2. Distribution of Farms by Value of Farm Sales, 1997 Appalachia U. S.
Value of Total Farm Sales Number Percent Number PercentLess than $2,500 74,487 32.4 496,514 27.7
$2,500 to $4,999 40,036 17.4 228,447 12.7
$5,000 to $9,999 38,119 16.6 237,975 13.3
$10,000 to $24,999 33,752 14.7 274,040 15.3
$25,000 to $49,999 14,250 6.2 170,705 9.5
$50,000 to $99,999 10,422 4.5 158,160 8.8
$100,000 or more 18,984 8.3 227,194 12.7
Totals 230,050 100.0 1,793,035 100.0
Table 3. Per Acre Yields of Crops in 1965 and 1997
United States Appalachia
Crop 1964 1997 1964 1997
Corn-bu. 62.3 122 51.1 87.1
Wheat-bu. 23.4 37.5 26.0 35.0
Tobacco-lb. 1939 2085 1987 1817
Hay-tons 1.8 2.3 NA 1.88

14
Table 4. Farm Numbers, Acres and Sizes in Appalachia, 1997Appalachian Region Entire State % in
App.State Number Acres Size Number Acres SizeAlabama 27,365 4,380,390 160 41,384 8,704,385 210 50.3Georgia 12,743 1,504,460 118 42,334 10,671,246 265 14.1Kentucky 28,689 3,864,397 135 82,273 13,334,234 162 29.0Maryland 1,656 275,915 167 12,084 2,154,875 178 12.8Mississippi 8,808 2,428,303 276 31,318 10,124,822 323 24.0New York 9,464 2,055,034 217 49,406 9,122,379 228 22.5North Carolina 14,866 1,490,784 100 31,757 7,254,470 185 20.6Ohio 21,989 3,691,420 168 68,591 14,103,085 206 26.2Pennsylvania 29,009 5,015,985 173 45,457 7,167,906 158 70.0South Carolina 4,083 458,607 112 20,189 4,593,452 228 10.0Tennessee 40,069 4,118,555 103 76,818 11,122,363 145 37.0Virginia 13,537 2,176,561 161 41,095 7,167,906 200 30.4West Virginia 17,272 3,455,532 194 17,272 3,455,532 194 100.0Totals 230,050 34,915,943 152 559,978 108,976,655 195 32.0Source: 1997 Census of Agriculture

15
Table 5. Sales/Production per Farm and Percent of Farms with Enterprise, 1964 and 1997
Enterprise
United States Appalachia
1964 1997 1964 1997
Value % Value % Value % Value %
Cattle & Calves Sold, Number 31.6 63.1 73.2 52.9 12.0 62.0 24.9 62.0
Hogs & Pigs Sold, Number 104.1 25.4 1396.7 5.3 49.7 14.4 382.7 2.5
Layers & Pullets, Number 283 38.3 5054 3.8 281 40.2 2967 4.4
Corn Produced, Bushels 4544 43.8 19917 22.5 549 43.3 4527 13.0
Wheat Produced. Bushels 1646 23.4 9048 12.7 314 9.0 1656 3.2
Tobacco Produced, Pounds 5999 10.5 19483 4.7 2511 27.9 7778 17.1


17
18

19
20


Related Documents


