Welcome message from author
This document is posted to help you gain knowledge. Please leave a comment to let me know what you think about it! Share it to your friends and learn new things together.
Transcript

Agriculture and Forestry, Volume 66. Issue 2: 1-242, Podgorica, 2020 2
Agriculture and Forestry - Poljoprivreda i šumarstvo PUBLISHER - IZDAVAČ
University of Montenegro – Univerzitet Crne Gore Biotechnical faculty (BTF), Podgorica - Biotehnički fakultet, Podgorica Bul. M. Lalića 1, 81000 Podgorica, Crna Gora (Montenegro), P.Box 97,
Tel.: +382 20 268434; +382 20 268437; Fax: +382 20 268432 Web: www.agricultforest.ac.me; E-mail: [email protected]
EDITORIAL BOARD - REDAKCIJA
Milić ČUROVIĆ, Editor in chief - glavni i odgovorni urednik (BTF),
Miomir JOVANOVIĆ, Co-Editor, Secretary General - sekretar redakcije (BTF), Igor PAJOVIĆ, Co-Editor, Technical editor - tehički urednik (BTF),
Juan Antonio Ballesteros Canovas (CH), Joachim Müller (GER), Hubert Hasenauer (AUT), Che Fauziah ISHAK (MYS), Renzo MOTTA (ITA),
Sead Šabanadžović (USA), Guangyu Sun (CHN), Dušan Petrić (SRB), Gordan Karaman (MNE), Paraskevi Londra (GRE), Peter Dovč (SLO),
Reinhard Eder (AUT), Jelena Latinović (BTF), Emil Erjavec (SLO), Božidarka Marković (BTF), Aleksandra Despotović (BTF), Franc Bavec (SLO),
Svetislav Popović (MNE), Vojislav Trkulja (BIH), Milan Medarević (SRB), Shkelqim Karaj (GER), Ana Topalović (BTF), Radmila Pajović (BTF),
Nataša Mirecki (BTF), Vjekoslav Tanaskovik (MKD), Goran Barović (MNE),
Paolo Billi (JPN), Drago Cvijanović (SRB), Siniša Berjan (BIH), Naser Sabaghnia (IRI), Elazar Fallik (ISR), Vlatka Vajs (SRB),
Paul Sestras (ROU), Slavko Mijović (BTF), Momčilo Radulović (BTF) Luka FILPOVIĆ, Technical editor - tehički urednik (CIS, UCG),
Technical design: Jovana Zvizdić
Indexed in (by alphabethical order): AGRICOLA, AGRIS, CAB Abstracts, CAB Direct, CABI full text, COBISS, CrossRef, DOI, DOAJ, EBSCO (currently included in EDS EBSCO Discovery Service), Elektronische Zeitschriftenbibliothek EZB (Electronic Journals Library), Genamics JournalSeek, Global impact factor (GIF), Google Scholar, HathiTrustt, Index Copernicus, International Scientific Indexing (ISI), Israel Union List of Electronic Journals (ULE), JournalRate (Academic journal search tool), Journals Impact factor (JIF) by Global Society for Scientific Research (GSSR), KoBSON, MALMAD, National Agricultural Library – USA, Open Academic Journals Index (OAJI), ProQuest, Research bible, RoMEO, Regional Information Center for Science and Technology (RICeST) – Iran, Rubriq database, SCOPUS, The Open University Library, The Rudjer Bošković Institute Library, Ulrichsweb, Universal Impact Factor, WorldCat, XML, Zeitschriftendatenbank (ZDB), Zoological Record of the Clarivate Analitics Master Jouurnal List, ... The journal “Agriculture and Forestry” is funded by the Biotechnical faculty, Co-funded by the Ministry of Science & the Ministry of Agriculture and Rural Development of Montenegro
CIP – Каталогизација у публикацији Централна народна библиотека Црне Горе, Цетиње ISSN 0554-5579 COBIS.CG-ID 3758082
Agriculture and Forestry, Volume 66. Issue 2: 1-242, Podgorica, 2020 3
CONTENT Alexandra D. SOLOMOU, Elpiniki SKOUFOGIANNI, Kyriakos D. GIANNOULIS, George CHARVALAS, Nicholaos G. DANALATOS EFFECTS OF ENVIRONMENTAL FACTORS ON HERBACEOUS PLANT DIVERSITY IN AN ORGANIC CULTIVATION OF SAGE (Salvia officinalis L.) IN A TYPICAL MEDITERRANEAN CLIMATE ............... 007-017 Drago CVIJANOVIĆ, Tanja STANIŠIĆ, Miljan LEKOVIĆ and Marija KOSTIĆ INDICATORS OF AGRICULTURAL AND RURAL DEVELOPMENT IN THE EAST CENTRAL AND SOUTH-EAST EUROPEAN COUNTRIES ...... 019-032 Mile MARKOSKI, Tatjana MITKOVA, Vjekoslav TANASKOVIK, Stojanče NECHKOVSKI and Velibor SPALEVIC THE INFLUENCE OF SOIL TEXTURE AND ORGANIC MATTER ON THE RETENTION CURVES AT SOIL MOISTURE IN THE HUMIC CALCARIC REGOSOL OF THE OVCHE POLE REGION, NORTH MACEDONIA .............. 033-044 Guilherme Henrique Expedito LENSE , Rodrigo Santos MOREIRA, Fernanda Almeida BÓCOLI, Taya Cristo PARREIRAS, Alexandre Elias de Miranda TEODORO, Velibor SPALEVIC, Ronaldo Luiz MINCATO SOIL ORGANIC MATTER LOSS BY WATER EROSION IN A COFFEE ORGANIC FARM ................................................................................ 045-050 Andreja KOMNENIĆ, Zoran JOVOVIĆ, Ana VELIMIROVIĆ IMPACT OF DIFFERENT ORGANIC FERTILIZERS ON LAVENDER PRODUCTIVITY (Lavandula officinalis Chaix) .................................................... 051-056 Tihana SUDARIĆ, Luka SAMARDŽIJA, Ružica LONČARIĆ VITICULTURE AND WINE AS EXPORT POTENTIAL OF CROATIA ............ 057-066
Agriculture and Forestry, Volume 66. Issue 2: 1-242, Podgorica, 2020 4 Milena MLADENOVIĆ GLAMOČLIJA, Vera POPOVIĆ, Snežana JANKOVIĆ, Đorđe GLAMOČLIJA, Milić ČUROVIĆ, Marko RADOVIĆ and Milorad ĐOKIĆ NUTRITION EFFECT TO PRODUCTIVITY OF BIOENERGY CROP MISCANTHUS X GIGANTEUS IN DIFFERENT ENVIRONMENTS ................ 067-077 Selman Edi KALOPER, Sabrija ČADRO, Mirza UZUNOVIĆ, Salwa CHERNI-ČADRO DETERMINATION OF EROSION INTENSITY IN BRKA WATERSHED, BOSNIA AND HERZEGOVINA ........................................................................... 079-092 Dragana POPOVIĆ, Jelena VITOMIR, Maja JOKIĆ, Ivan ARNAUTOVIĆ, Dražen VRHOVAC, Nemanja BAROVIĆ, Ksenija VUJINOVIĆ, Slobodan POPOVIĆ IMPLEMENTATION OF INTERNAL AUDIT IN COMPANIES INTENDING TO OPERATE ON THE PRINCIPLES OF GREEN ECONOMY IN THE REPUBLIC OF SERBIA........................................ 093-098 Ivan ŠIMUNIĆ, Marija VUKELIĆ-SHUTOSKA, Velibor SPALEVIĆ, Goran ŠKATARIĆ, Vjekoslav TANASKOVIK, Mile MARKOSKI AMELIORATIVE MEASURES AIMED AT PREVENTION/MITIGATION CONSEQUENCES OF CLIMATE CHANGE IN AGRICULTURE IN CROATIA ............................................................................. 099-107 Novo PRŽULJ, Zoran JOVOVIĆ, Ana VELIMIROVIĆ BREEDING SMALL GRAIN CEREALS FOR DROUGHT TOLERANCE IN A CHANGING CLIMATE ........................................................ 109-123 Zvezda BOGEVSKA, Sinisa BERJAN, Roberto CAPONE, Philipp DEBS, Hamid EL BILALI, Francesco BOTTALICO, Margarita DAVITKOVSKA HOUSEHOLD FOOD WASTAGE IN NORTH MACEDONIA............................ 125-135 Enver KENDAL EVALUATION OF SOME BARLEY GENOTYPES WITH GEOTYPE BY YIELD* TRAIT (GYT) BIPLOT METHOD ................................................... 137-150
Agriculture and Forestry, Volume 66. Issue 2: 1-242, Podgorica, 2020 5 Radisav DUBLJEVIĆ, Nenad ĐORĐEVIĆ, Dušica RADONJIĆ, Milena ĐOKIĆ QUALITY OF SILAGE OF MIXED SUNCHOKE AND LUCERNE FORAGE ..................................................................................... 151-156 Zvonko PACANOSKI, Dana Dina KOLEVSKA, Arben MEHMETI TOLERANCE OF BLACK LOCUST (Robinia pseudoacacia L.) SEEDLINGS TO PRE APPLIED HERBICIDES .................................................... 157-165 Željko VAŠKO, Ivan KOVAČEVIĆ COMPARISON OF ECONOMIC EFFICIENCY OF ORGANIC VERSUS CONVENTIONAL FARMING IN THE CONDITIONS OF BOSNIA AND HERZEGOVINA ............................................................................ 167-178 Hazal Merve BALLI, Cumali ÖZASLAN WEED FLORA OF LENTIL IN DIYARBAKIR PROVINCE, TURKEY ............. 179-190 Slađana KRIVOKAPIĆ, Tijana PEJATOVIĆ, Svetlana PEROVIĆ CHEMICAL CHARACTETIZATION, NUTRITIONAL BENEFITS AND SOME PROCESSED PRODUCTS FROM CARROT (Daucus carota L.) ... 191-216 Nataša LJUBIČIĆ, Marko RADOVIĆ, Marko KOSTIĆ, Vera POPOVIĆ, Mirjana RADULOVIĆ, Dragana BLAGOJEVIĆ, Bojana IVOŠEVIĆ THE IMPACT OF ZnO NANOPARTICLES APPLICATION ON YIELD COMPONENTS OF DIFFERENT WHEAT GENOTYPES ................................... 217-227 Radisav DUBLJEVIĆ, Dušica RADONJIĆ, Milan MARKOVIĆ PRODUCTION TRAITS OF MAJOR TYPES OF GRASSLANDS IN THE DURMITOR AREA ................................................................................... 229-236 Srećko ČOLIĆ, Marko NIKOLIĆ, Vukosava ČOLIĆ THE FIRST RECORD OF BLACKFISH, Centrolophus niger (GMELIN, 1788) IN MONTENEGRIN COASTAL WATERS .......................................................... 237-239 INSTRUCTIONS TO AUTHORS ........................................................................... 241-242

Agriculture & Forestry, Vol. 66 Issue 2: 7-17, 2020, Podgorica 7
Solomou, D.A., Skoufogianni, E., Giannoulis, D. K., Charvalas, G., Danalatos, G. N. (2020): Effects of
environmental factors on herbaceous plant diversity in an organic cultivation of sage (Salvia officinalis L.) in a
typical Mediterranean climate. Agriculture and Forestry, 66 (2): 7-17.
DOI: 10.17707/AgricultForest.66.2.01
Alexandra D. SOLOMOU1*, Elpiniki SKOUFOGIANNI
2, Kyriakos D.
GIANNOULIS2, George CHARVALAS
2, Nicholaos G. DANALATOS
2
EFFECTS OF ENVIRONMENTAL FACTORS ON HERBACEOUS
PLANT DIVERSITY IN AN ORGANIC CULTIVATION OF SAGE
(SALVIA OFFICINALIS L.) IN A TYPICAL MEDITERRANEAN
CLIMATE
SUMMARY Sage (Salvia officinalis L.) is a perennial aromatic-medicinal plant that is
commonly cultivated for pharmaceutical uses through the Mediterranean basin.
The purpose of this study was to examine the herbaceous plant diversity (plant
species richness), composition and their utilization as well as the relationships
between herbaceous plant species richness and driving factors (e.g. soil pH,
organic matter, temperature, minerals etc) in the organic cultivation of Sage in
central Greece. The results showed that the most frequently occurring species
were: Papaver rhoeas L., Chenopodium album L., Fumaria officinalis L. and
Urtica dioica L. Our data suggested that these plants constitute important soil
indicators which could be used to monitor the state of soils along with assessing
the role of soil in environmental interactions. According to Principal Component
Analysis (PCA), herbaceous plant species richness was positively correlated to
soil organic matter, temperature and moisture, P and K in the organic cultivation
of Sage. The results of this study highlight the ecological value of the organic
sage cultivation and how it can be a useful tool for the ecosystem’s environmental
protection, the wider scientific community and the general public during the
current economic crisis.
Keywords: aromatic plants; environment; Greece; sage; utilization.
INTRODUCTION It is a well-known fact that Greece has a vast plant biodiversity, amongst
the highest in Europe and the Mediterranean region. Greece counts 5828 species
1Alexandra D. Solomou (corresponding author: [email protected]), Institute of
Mediterranean and Forest Ecosystems, Hellenic Agricultural Organization "DEMETER", N.
Chlorou 1, Ilisia, 11528, Athens, GREECE. 2Elpiniki Skoufogianni, Kyriakos D. Giannoulis, George Charvalas, Nicholaos G. Danalatos,
Department of Agriculture, Crop Production and Rural Environment, University of Thessaly,
Fytokou Str., 38446, N. Ionia, Magnesia, Volos, GREECE.
Paper presented at the GEA (Geo Eco-Eco Agro) International Conference 2020, Podgorica
Notes: The authors declare that they have no conflicts of interest. Authorship Form signed online.
Received:21/04/2020 Accepted:30/05/2020
Solomou et al. 8
and 1982 subspecies (either native or naturalized) which consequently represent
6695 taxa belonging to 1083 genera and 185 families. Therefore, that’s the reason
why Greece is considered to be a very important spot of endemism in Europe and
the Mediterranean basin (Dimopoulos et al., 2013; 2016). A very important fact is
the existence of aromatic medicinal plants having renowned pharmaceutical
values (Solomou et al., 2017). In fact, there are 1683 species and subspecies
which represent 25% of the Greek flora. Greek microclimatic conditions together
with the country's topography are ideal for the development and progress of
aromatic and medicinal plants (Bogers et al., 2006; Solomou et al., 2016).
Recent studies have underlined the importance of these plants in the fields
of environmental protection, sustainable development and of course, public
health. Their use has been widely known since antiquity and their pharmaceutical,
cosmetic and culinary values are currently being acclaimed once more. In the
mid-nineties there was a serious decline concerning the cultivation of these plants
but over the last few years their properties are the subject of extensive research.
Fortunately, at present, there is a tendency to "re-discover" their importance and
capitalize on their cultivation. Species such as Dictamus (Origanum dictamus),
Oregano (Origanum vulgare) (Skoufogianni et al., 2019), Mountain Tea (Sideritis
sp.) (Solomou et al., 2019), Chamomile (Chamomilla sp.), Aloysia (Lippia
citriodora) (Solomou et al., 2020) and Sage (Salvia officinalis) are nowadays
being cultivated- while it must be noted that especially sage cultivation is on the
increase (Stefanou et al., 2015; Skoufogianni et al., 2017).
Sage belongs to the Lamiaceae family which includes nearly 900 species.
Being rich in essential oils, phenolic compounds and vitamins, sage is one of the
stars of medicinal plants. Its properties are highly ranked ranging from
antibacterial/antiviral to anti-inflamatory, antidiabetic and even anti-tumor
(Christopoulou-Geoyiannaki and Masouras, 2015). A high quality raw material
can be provided by organic cultivation which also boosts the crop diversity an
important element concerning organic farming (Verma et al., 2017). Sage has
recently been the subject of several studies (Bradley, 2006; Russo et al., 2013;
Russo et al., 2015; Ravlic et al., 2016). However, there is still a lack of available
data which would specify the utilization, dynamics and environmental
determinants of its diversity in organic cultivation. The role of herbaceous plants
in the ecosystem is paramount and they should be further studied.
Hence, the objectives of this research were to determine: a) the richness
and composition of herbaceous plant species, b) the plant species utilization and
c) the correlation of the species richness with specific environmental factors (e.g.
soil pH, organic matter, temperature, minerals etc) in the organic cultivation of
Sage.
MATERIAL AND METHODS Study area
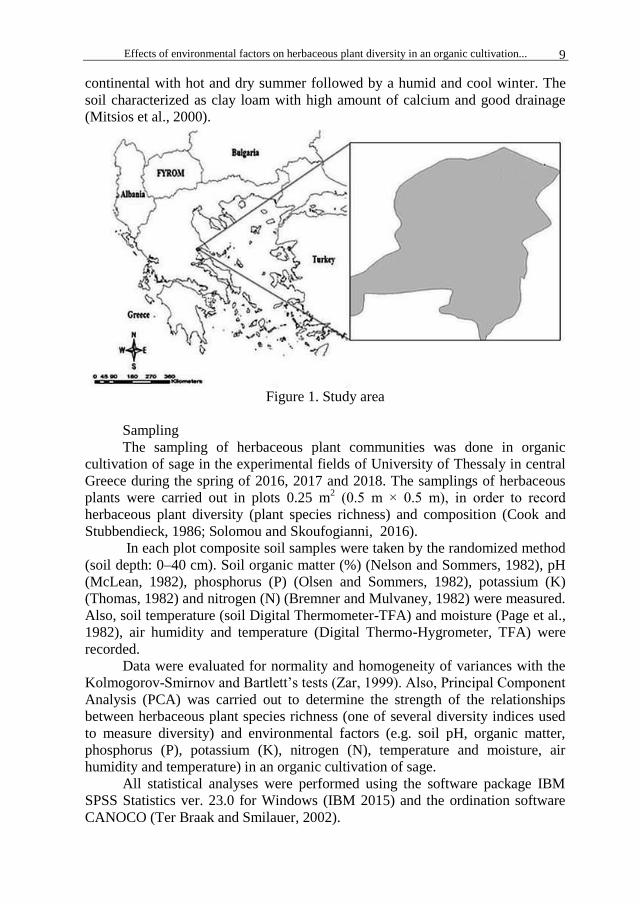
The study was conducted in a Thessaly plain (Velestino, central Greece)
(Fig.1). The climate of the area is characterized as typical Mediterranean and
Effects of environmental factors on herbaceous plant diversity in an organic cultivation... 9
continental with hot and dry summer followed by a humid and cool winter. The
soil characterized as clay loam with high amount of calcium and good drainage
(Mitsios et al., 2000).
Figure 1. Study area
Sampling
The sampling of herbaceous plant communities was done in organic
cultivation of sage in the experimental fields of University of Thessaly in central
Greece during the spring of 2016, 2017 and 2018. The samplings of herbaceous
plants were carried out in plots 0.25 m2 (0.5 m × 0.5 m), in order to record
herbaceous plant diversity (plant species richness) and composition (Cook and
Stubbendieck, 1986; Solomou and Skoufogianni, 2016).
In each plot composite soil samples were taken by the randomized method
(soil depth: 0–40 cm). Soil organic matter (%) (Nelson and Sommers, 1982), pH
(McLean, 1982), phosphorus (P) (Olsen and Sommers, 1982), potassium (K)
(Thomas, 1982) and nitrogen (N) (Bremner and Mulvaney, 1982) were measured.
Also, soil temperature (soil Digital Thermometer-TFA) and moisture (Page et al.,
1982), air humidity and temperature (Digital Thermo-Hygrometer, TFA) were
recorded.
Data were evaluated for normality and homogeneity of variances with the
Kolmogorov-Smirnov and Bartlett’s tests (Zar, 1999). Also, Principal Component
Analysis (PCA) was carried out to determine the strength of the relationships
between herbaceous plant species richness (one of several diversity indices used
to measure diversity) and environmental factors (e.g. soil pH, organic matter,
phosphorus (P), potassium (K), nitrogen (N), temperature and moisture, air
humidity and temperature) in an organic cultivation of sage.
All statistical analyses were performed using the software package IBM
SPSS Statistics ver. 23.0 for Windows (IBM 2015) and the ordination software
CANOCO (Ter Braak and Smilauer, 2002).
Solomou et al. 10
RESULTS AND DISCUSSION Herbaceous plant communities, composition and utilization
The study recorded 36 herbaceous plant species richness which belong to
15 families (Table 1) in the organic cultivation of sage. The most frequently
occurring species were: Chenopodium album L. (16%) (Family:
Chenopodiaceae), Papaver rhoeas L. (15%) (Family: Papaveraceae), Fumaria
officinalis L. (12%) (Family: Fumariaceae) and Urtica dioica L. (11%) (Family:
Urticaceae). The study recorded 36 herbaceous plant species richness belonging
to 15 families (Table 1) in the organic cultivation of sage. Frequently occurring
species were: Chenopodium album L. (16%) (Family: Chenopodiaceae), Papaver
rhoeas L. (15%) (Family: Papaveraceae), Fumaria officinalis L. (12%) (Family:
Fumariaceae) and Urtica dioica L. (11%) (Family: Urticaceae). Agroecosystems
support a large number of plant species and are considered high nature-valued
farming systems, enhancing/promoting biodiversity.
According to literature (Bengtsson and Weibull, 2005) organic agriculture
is a farming system which promotes ecosystem protection and its produce is free
from substances such as chemicals and pesticides. Tuamisto et al. (2012) reported
the positive environmental effects of organic farming, not to mention its
contribution to diversity and soil quality. As an example of the increase regarding
diversity we have vascular plants (Hyvönen and Salonen, 2002) and a general
total (Ahnström, 2002; Bengtsson and Weibull, 2005). We should also note that
the composition and the diversity of native flora are influenced by factors such as
(a) agricultural practices, (b) landscape structure, (c) current crops, (d) crop size,
(e) herbivores which may affect (Fischer et al., 2011) and f) age, an important
factor explaining about 8-10% of the change in the composition and diversity of
the flora (Cordeau et al., 2010).
Dimopoulos et al. (2013) report in their study that the above plant species
that were recorded in the organic cultivation of sage are characteristics of rural
ecosystems and could contribute significantly to their protection. It is important
to mention that the above most frequently occurring plant species constitute
important indicators of the state, productivity and the health of the soil
(Chenopodium album: indicator of good nutritional status of the soil), Papaver
rhoeas (indicator of non-acid soil), Fumaria officinalis (indicator of ventilated
and wet soils) and Urtica dioica (indicator of soil nitrogen). Also, these plants
have medicinal uses which could be utilized and described below:
Hence, Chenopodium album is an indicator of the soil's good nutritional
status, Papaver rhoeas indicates a non-acidic soil, Fumaria officinalis reflects a
well ventilated and wet soil and lastly, Urtica dioica signals the soil's nitrogen.
Furthermore, we should also mention the medicinal uses of these plants. More
specifically:
- Chenopodium album presents antirheumatic and anti-inflammatory
properties. The leaves can be used not only as an infusion but also as a poultice
on bug bites/ sore areas of the body (http1).
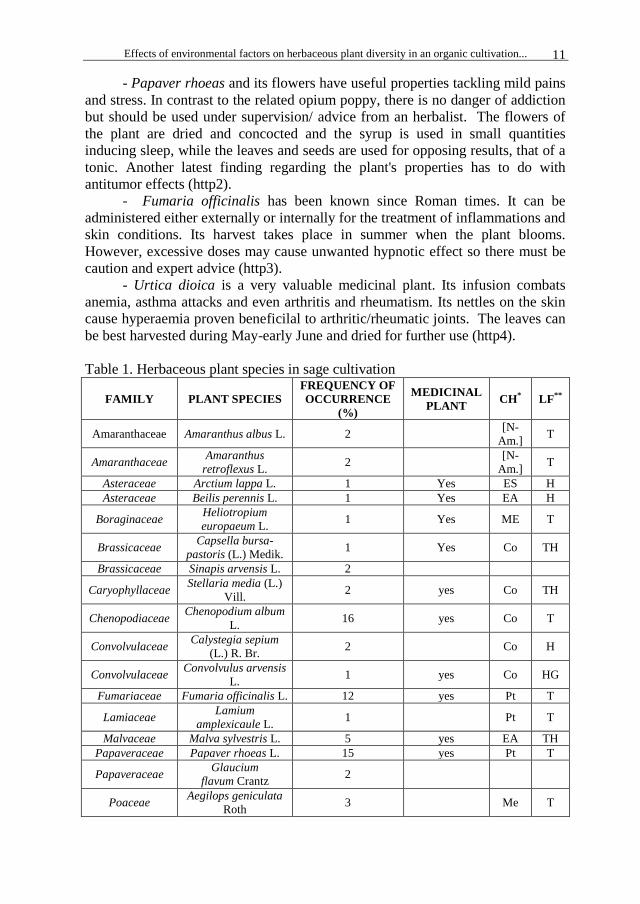
Effects of environmental factors on herbaceous plant diversity in an organic cultivation... 11
- Papaver rhoeas and its flowers have useful properties tackling mild pains
and stress. In contrast to the related opium poppy, there is no danger of addiction
but should be used under supervision/ advice from an herbalist. The flowers of
the plant are dried and concocted and the syrup is used in small quantities
inducing sleep, while the leaves and seeds are used for opposing results, that of a
tonic. Another latest finding regarding the plant's properties has to do with
antitumor effects (http2).
- Fumaria officinalis has been known since Roman times. It can be
administered either externally or internally for the treatment of inflammations and
skin conditions. Its harvest takes place in summer when the plant blooms.
However, excessive doses may cause unwanted hypnotic effect so there must be
caution and expert advice (http3).
- Urtica dioica is a very valuable medicinal plant. Its infusion combats
anemia, asthma attacks and even arthritis and rheumatism. Its nettles on the skin
cause hyperaemia proven beneficilal to arthritic/rheumatic joints. The leaves can
be best harvested during May-early June and dried for further use (http4).
Table 1. Herbaceous plant species in sage cultivation
FAMILY PLANT SPECIES
FREQUENCY OF
OCCURRENCE
(%)
MEDICINAL
PLANT CH* LF**
Amaranthaceae Amaranthus albus L. 2 [N-
Am.] T
Amaranthaceae Amaranthus
retroflexus L. 2
[N-
Am.] T
Asteraceae Arctium lappa L. 1 Yes ES H
Asteraceae Beilis perennis L. 1 Yes EA H
Boraginaceae Heliotropium
europaeum L. 1 Yes ME T
Brassicaceae Capsella bursa-
pastoris (L.) Medik. 1 Yes Co TH
Brassicaceae Sinapis arvensis L. 2
Caryophyllaceae Stellaria media (L.)
Vill. 2 yes Co TH
Chenopodiaceae Chenopodium album
L. 16 yes Co T
Convolvulaceae Calystegia sepium
(L.) R. Br. 2 Co H
Convolvulaceae Convolvulus arvensis
L. 1 yes Co HG
Fumariaceae Fumaria officinalis L. 12 yes Pt T
Lamiaceae Lamium
amplexicaule L. 1 Pt T
Malvaceae Malva sylvestris L. 5 yes EA TH
Papaveraceae Papaver rhoeas L. 15 yes Pt T
Papaveraceae Glaucium
flavum Crantz 2
Poaceae Aegilops geniculata
Roth 3 Me T

Solomou et al. 12
Poaceae Avena barbata Link
in Schrad. 1 yes Me T
Poaceae Avena sterilis L. 1 MS T
Poaceae Briza maxima L. 1 ST T
Poaceae Bromus rigidus Roth 1 ST T
Poaceae Bromus tectorum L. 1 Pt T
Poaceae Cynodon dactylon
(L.) Pers. 2 yes Co G
Poaceae Cynosurus echinatus
L. 1 Me T
Poaceae Echinochloa crus-
galli (L.) P. Beauv. 1 yes Co T
Poaceae Hordeum murinum
L. 2 MS T
Poaceae Lagurus ovatus L. 1 Me T
Poaceae Lolium perenne L. 1 ES H
Poaceae Melica ciliata L. 1 MS H
Poaceae Piptatherum
miliaceum (L.) Coss. 1 Me CH
Poaceae Poa bulbosa L. 1 Pt H
Poaceae Setaria viridis (L.) P.
Beauv. 1 Co T
Poaceae Sorghum halepense
(L.) Pers. 1 [Co] G
Urticaceae Urtica dioica L. 11 yes Co H
Veronicaceae Veronica persica
Poir. in Lam. & Poir. 1
[W-
As.] T
Zygophyllaceae Tribulus terrestris L. 1 yes Co T *Bk: Balkan, BI: Balkan-Italy, BA: Balkan-Anatolia, BC: Balkan-Central Europe, EM: East
Mediterranean, Me: Mediterranean,
MA: Mediterranean-Atlantic, ME: Mediterranean-European, MS: Mediterranean-SW Asian, EA:
European-SW Asian, ES: Euro-Siberian, Eu:European, Pt: Paleotemperate, Ct: Circumtemperate,
IT: Irano-Turanian, SS: Saharo-Sindian, ST: Subtropical-tropical,
Bo: (Circum-) Boreal, AA:Arctic-Alpine, Co:Cosmopolitan, [trop., subtrop., paleotrop., neotrop.,
pantrop., N-Am., S-Am., E-As., SE-As., S-Afr., Arab., Arab. NE-Afr., Caucas., Pontic, Europ.,
Austral.]: Origin of the alien taxa in [tropical, subtropical, paleotropical, neotropical, pantropical, N
American, S American, E Asian, SE Asian, S African, Arabian, Arabian NE African, Caucasian,
Pontic, European, Australian, unknown, etc., optionally a combination of these]. **P: Phanerophyte, C: Chamaephyte, H: Hemicryptophyte, G: Geophyte (Cryptophyte), T:
Therophyte, A: Aquatic (Dimopoulos 2013, 2016).
Relationships between Plant Species Richness and Environmental
Variables
According to the results of the Principal Component Analysis (PCA), the
first two components interpret together 89.0% of the variance of the relationships
between plant species richness and environmental factors (component 1 = 60.0%,
component 2 = 29%). More specifically, it was detected that there is a positive
correlation among plant species richness and phosphorus (P), potassium (K),
organic matter (OM), temperature (T) and moisture (M) of the soil in the organic
cultivation of sage (Figure 2).

Effects of environmental factors on herbaceous plant diversity in an organic cultivation... 13
Figure 2. Principal Component Analysis (PCA). (Abbreviations: AT: Air
Temperature, AIH: Air Humidity, SpH: Soil pH, N: Nitrogen, P: Phosphorus, K:
Potassium, HPSR: Herbaceous Plant Species Richness, OM: Organic matter, M:
Moisture, T: Temperature)
Ecology studies focus mostly on the determination of factors controlling
the distribution patterns within the plant communities. Several studies on species
richness have found a humped curve which has to do with a productivity gradient
when productivity is often influenced by the level of an environmental variable.
More specifically, organic soil provides important nutrients such as phosphorus
and potassium used by plants in large quantities for their growth and survival.
Phosphorus is omnipresent in all forms of life being a key element in the
physiological and biochemical process. Phosphorus in plants has a major role in
photosynthesis, this vital process which converts light energy into a chemical one,
necessary for fueling the plants' activities. Potassium also promotes
photosynthesis by accelerating the transport of metabolites and by enhancing
storage substances. Moreover, it is known to favour protein production, improve
the efficiency of nitrogen supplies and its fixation and benefit the efficiency of
water management.
All the above could be attributed to the theory based on the model of Al-
Mufti et al (1977) and Grime (1979) ("humped-back curve"). This model has to
do with low species richness where the nutrient availability is low and subsequent
increase at intermediate levels. Many scientists through their research point out
that environmental factos directly affect soil properties albeit in various scales.
So, nutrients, soil humus, rainfall and temperature affect the synthesis and plant
diversity both in agricultural and natural ecosystems (Peng et al., 2012; Solomou
and Sfougaris 2015).
Solomou et al. 14
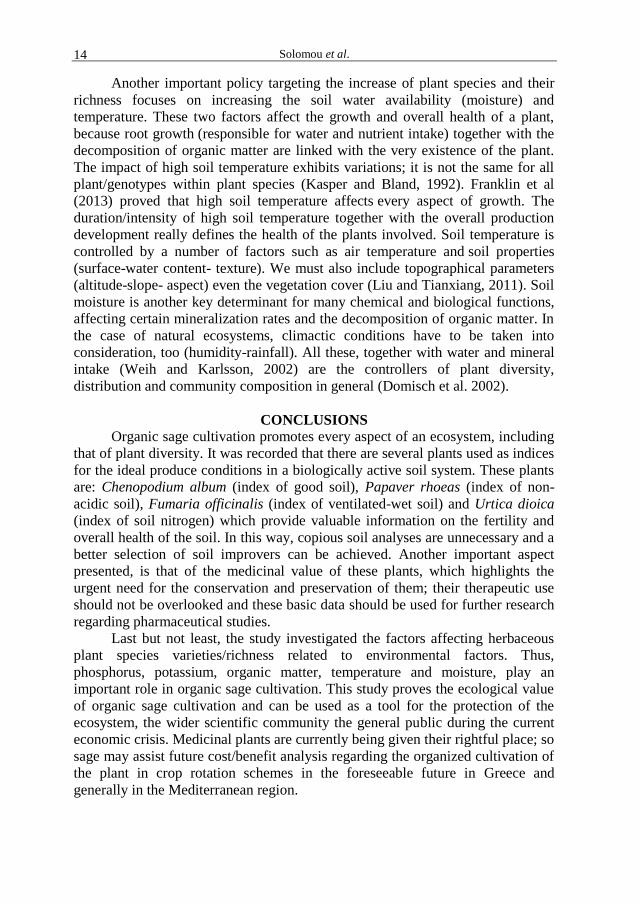
Another important policy targeting the increase of plant species and their
richness focuses on increasing the soil water availability (moisture) and
temperature. These two factors affect the growth and overall health of a plant,
because root growth (responsible for water and nutrient intake) together with the
decomposition of organic matter are linked with the very existence of the plant.
The impact of high soil temperature exhibits variations; it is not the same for all
plant/genotypes within plant species (Kasper and Bland, 1992). Franklin et al
(2013) proved that high soil temperature affects every aspect of growth. The
duration/intensity of high soil temperature together with the overall production
development really defines the health of the plants involved. Soil temperature is
controlled by a number of factors such as air temperature and soil properties
(surface-water content- texture). We must also include topographical parameters
(altitude-slope- aspect) even the vegetation cover (Liu and Tianxiang, 2011). Soil
moisture is another key determinant for many chemical and biological functions,
affecting certain mineralization rates and the decomposition of organic matter. In
the case of natural ecosystems, climactic conditions have to be taken into
consideration, too (humidity-rainfall). All these, together with water and mineral
intake (Weih and Karlsson, 2002) are the controllers of plant diversity,
distribution and community composition in general (Domisch et al. 2002).
CONCLUSIONS Organic sage cultivation promotes every aspect of an ecosystem, including
that of plant diversity. It was recorded that there are several plants used as indices
for the ideal produce conditions in a biologically active soil system. These plants
are: Chenopodium album (index of good soil), Papaver rhoeas (index of non-
acidic soil), Fumaria officinalis (index of ventilated-wet soil) and Urtica dioica
(index of soil nitrogen) which provide valuable information on the fertility and
overall health of the soil. In this way, copious soil analyses are unnecessary and a
better selection of soil improvers can be achieved. Another important aspect
presented, is that of the medicinal value of these plants, which highlights the
urgent need for the conservation and preservation of them; their therapeutic use
should not be overlooked and these basic data should be used for further research
regarding pharmaceutical studies.
Last but not least, the study investigated the factors affecting herbaceous
plant species varieties/richness related to environmental factors. Thus,
phosphorus, potassium, organic matter, temperature and moisture, play an
important role in organic sage cultivation. This study proves the ecological value
of organic sage cultivation and can be used as a tool for the protection of the
ecosystem, the wider scientific community the general public during the current
economic crisis. Medicinal plants are currently being given their rightful place; so
sage may assist future cost/benefit analysis regarding the organized cultivation of
the plant in crop rotation schemes in the foreseeable future in Greece and
generally in the Mediterranean region.
Effects of environmental factors on herbaceous plant diversity in an organic cultivation... 15
ACKNOWLEDGEMENTS This work was supported by the Institute of Mediterranean and Forest
Ecosystems, Hellenic Agricultural Organization "DEMETER" and Department of Agriculture, Crop Production and Rural Environment, University of Thessaly.
REFERENCES Ahnström J. 2002. Ekologiskt Lantbruk Och Biologisk Mångfald: En
Litteraturgenomgång [Organic farming and biodiversity: a literature review]. Centre for Sustainable Agriculture, Swedish University of Agricultural Sciences, Uppsala, Sweden [in Swedish].
Al-Mufti MM, Sydes CL, Furness SB, Grime JP, and Band SR. 1977. A quantitative analysis of shoot phenology and dominance in herbaceous vegetation. Journal of Ecology, 65;759-791.
Bengtsson JA, Weibull AC. 2005. The effects of organic agriculture on biodiversity and abundance: a meta-analysis. Journal of Applied Ecology, 42; 261–269
Bogers RJ, Craker LE, and Lange D. 2006. Medicinal and aromatic plants: Agricultural, commercial, ecological, legal, pharmacological and social aspects (Wageningen UR Frontis Series). Netherlands: Springer.
Bradley P. 2006. Sage Leaf. British Herbal Compendium, a handbook of scientific information on widely used plant drugs. Companion to the British Herbal Pharmacopoeia. Bournemouth, 2; 339-344.
Bremner JM, Mulvaney CS. 1982. Nitrogen, in: A.L. Page, R.M. Miller, D.R. Keeney (Eds.). Methods of soil analysis, part 2: Chemical and microbiological properties. Madison, Wisc.: Agron. Soc. of America and Soil Sci. Soc. of America.
Christopoulou-Geoyiannaki M, and Masouras T. 2015. Comparison of Aroma Compounds in Distilled and Extracted Products of Sage (Salvia officinalis L.). Agriculture and Forestry, 61;79-84.
Cordeau S, Reboud X, and Chauvel B. 2010. The relative importance of farmer practices and landscape structure on the weed flora of sown grass strips. Agriculture Ecosystem and Environment, 139; 595–602.
Dimopoulos P, Raus T, Bergmeier E, Constantinidis T, Iatrou G, Kokkini S, Strid A, and Tzanoudakis D. 2016. Vascular plants of Greece: An annotated checklist. Supplement. Willdenowia, 46; 301–347.
Dimopoulos P, Raus T, Bergmeier E, Constantinidis T, Iatrou G, Kokkini S, Strid A, and Tzanoudakis D. 2013. Vascular Plants of Greece: An Annotated Checklist. Berlin, Botanic Garden and Botanical Museum Berlin-Dahlem, Athens, Hellenic Botanical Society.
Domisch T, Leena F, and Tarja L. 2002. Growth, carbohydrate and nutrient allocation of Scots pine seedlings after exposure to simulated low soil temperature in spring. Plant and Soil, 246;75-86.
Fischer C, Flohre A, Clement LW, Batáry P, Weisser WW, Tscharntke T, and Thies C. 2011. Mixed effects of landscape structure and farming practice on bird diversity. Agriculture Ecosystem and Environment, 141; 119–125
Franklin K, Philip W. 2013. Temperature and plant development: John Wiley & Sons. Grime JP. 1979. Plant strategies and vegetation processes. Wiley, Chichester, U.K. http1://www.naturalmedicinalherbs.net/include/searchherb.php?herbsearch=Chenopodiu
m+album&x=8&y=9 (accessed February 17, 2019). http2://www.naturalmedicinalherbs.net/include/searchherb.php?herbsearch=Papaver+rhoe
as+&x=13&y=7 (accessed February 17, 2019). http3://www.naturalmedicinalherbs.net/include/searchherb.php?herbsearch=Fumaria+offi
cinalis&x=3&y=6 (accessed February 19, 2019)
Solomou et al. 16
http4://www.naturalmedicinalherbs.net/include/searchherb.php?herbsearch=Urtica+dioica+&x=17&y=8 (accessed February 19, 2019)
Hyvönen T, Salonen J. 2002. Weed species diversity and community composition in cropping practices at two intensity levels: a six year experiment. Plant Ecology 154; 73–81.
IBM Corp. IBM® SPSS® Statistics for Windows, Version 23.0.0.0. (2015). Armonk, NY: IBM Corp.
Kasper TC, Bland WL. 1992. Soil temperature and root growth. Soil Science, 154; 290–299.
Liu X, Tianxiang L. 2011. Spatiotemporal variability of soil temperature and moisture across two contrasting timberline ecotones in the Sergyemla Mountains, Southeast Tibet. Arctic, Antarctic, and Alpine Research, 43;229- 238
McLean EO. 1982. Soil pH and lime requirement, pp. 199-224, in: A.L. Page et al., (Eds.), Methods of soil analysis. Chemical and microbiological properties. Madison: Agronomy Society of America, Soil Sci. Soc. of America.
Mitsios J, Toulios M, Charoulis Α, Gatsios F, and Floras S. 2000. Soil study and soil Chart of the Experimental field of the University of Thessaly in Velestino area. Publications Zymel, Athens (in Greek).
Nelson DW, Sommers LE. 1982. Total carbon, organic carbon and organic matter, pp. 539-579, in: A.L. Page, et al., (Eds.). Methods of soil analysis. Chemical and microbiological properties. Madison: Agronomy Soc. of America, Soil Sci. Soc. of America.
Olsen SR, Sommers LE. 1982. Phosphorus, in: A.L. Page, R.M. Miller, D.R. Keeney (Eds). Methods of soil analysis, part 2: Chemical and microbial properties. Madison, Wisc.: Agronomy Soc. of America and Soil Sci. Soc. of America.
Page AL, Miller HR, and Keeney RD. 1982. Methods of soil analysis, part 2: Chemical and microbiological properties, Madison, Wisc: Agronomy Society of America and Soil Science Society of America.
Peng W, Song T, Zeng F, Wang K, Du H, and Lu S. 2012. Relationships between woody plants and environmental factors in karst mixed evergreen-deciduous broadleaf forest, southwest China. Journal of Food Agriculture and Environment, 10;890–896.
Ravlic M, Balicevic R, Nikolic M, and Sarajlic A. 2016. Assessment of allelopathic potential of fennel, rue and sage on weed species hoary cress (Lepidium draba). Notulae Botanicae Horti Agrobotanici Cluj-Napoca, 44; 48-52.
Russo A, Formisano C, Rigano D, Senetore F, Delfine S, Cardile V, Rosselli S, and Bruno M. 2013. Chemical composition and anticancer activity of essential oils of Mediterranean sage (Salvia officinalis L.) grown in different environmental conditions. Food and Toxicology, 55; 42-47.
Solomou AD, Skoufogianni E, and Danalatos NG. 2020. Exploitation of soil properties for controlling herbaceous plant communities in an organic cultivation of lippia citriodora in the mediterranean landscape. Bulgarian Journal of Agricultural Science 26; 79-83.
Solomou AD, Skoufogianni E, Mylonas C, Germani R, and Danalatos NG. 2019. Cultivation and utilization of "Greek mountain tea" (Sideritis spp.): Current knowledge and future challenges. Asian Journal of Agriculture and Biology, 7; 289-299.
Skoufogianni Elpiniki, Solomou A.D., Kamperllari1 F., Nicholaos G. Danalatos. 2017. Ecology, Cultivation, Composition and Utilization of Salvia Officinalis L. In Greece: A Review. Global Advanced Research Journal of Agricultural Science (ISSN: 2315-5094) Vol. 6(12) pp. 449-455, December, 2017. Special Anniversary Review Issue. Available online http://garj.org/garjas/home
Effects of environmental factors on herbaceous plant diversity in an organic cultivation... 17
Skoufogianni E, Solomou AD, and Danalatos NG. 2019. Ecology, cultivation and utilization of the aromatic Greek oregano (Origanum vulgare L.): A review. Notulae Botanicae Horti Agrobotanici Cluj-Napoca, 47; 545-552.
Solomou A, Skoufogianni E, and Kamperllari F. 2017. Patterns of Herbaceous Plant Species Richness, Composition and Soil Properties in an Organic Cultivation "Lemon Verbena" and Abandoned Agroecosystems of Greece. Agriculture and Forestry, 63; 35-42.
Solomou A, and Skoufogianni E. 2016. Alpha and Beta Plant Diversity in Multispecies Agroecosystems of Central Greece. Agriculture and Forestry, 62; 19-25.
Solomou A, Martinos K, Skoufogianni E, and Danalatos N. 2016. Medicinal and Aromatic Plants Diversity in Greece and Their Future Prospects: A Review. Agricultural Science 4; 9-20.
Solomou AD, and Sfougaris AI. 2015. Determinants of Woody Plant Species Richness in Abandoned Olive Grove Ecosystems and Maquis of Central Greece. Communications in Soil Science and Plant Analysis, 46; 317–325
Stefanou P, Baloutas D, Katsinikas D, Avraam E, Kyriazopoulos A, Parisi Z, and Arabatzis G. 2015. Cultivation and production of aromatic plants in Greece: present situation, possibilities and prospects, Proceedings of the 8th Panhellenic Rangeland Congress, At Thessaloniki-Greece.
Ter Braak CJF, Smilauer P. 2002. CANOCO reference manual and Canoco Draw for Windows user’s guide: Software for canonical community ordination (version 4.5). Ithaca, N.Y.: Microcomputer Power.
Thomas GW. 1982. Exchangeable cations, pp. 159-165, in: A.L. Page, R.M. Miller, D.R. Keeney (Eds.), Methods of soil analysis. Part 2. Chemical and microbiological properties. Second edition. Agronomy Monograph Number 9, Madison, Wisconsin, USA: Agron. Soc. of America, Soil Sci. Soc. of America.
Verma RS, Padalia RC, and Chauhan A. 2015. Harvesting season and plant part dependent variations in the essential oil composition of Salvia officinalis L. grown in northern India. Journal of Herbal Medicine, 5; 165-171.
Weih M, Karlsson PS. 2002. Low winter soil temperature affects summertime nutrient uptake capacity and growth rate of mountain birch seedlings in the subarctic, Swedish lapland. Arctic, Antarctic, and Alpine Research, 34;434-439.
Zar JH. 1999. Biostatistical analysis (Fourth Edition). Upper Saddle River, N.J.: Prentice Hall.


Agriculture & Forestry, Vol. 66 Issue 2: 19-32, 2020, Podgorica 19
Cvijanović, D., Stanišić, T., Leković, M., Kostić, M. (2020): Indicators of agricultural and rural development in
the East Central and South-East European countries. Agriculture and Forestry, 66 (2): 19-32
DOI: 10.17707/AgricultForest.66.2.02
Drago CVIJANOVIĆ, Tanja STANIŠIĆ,
Miljan LEKOVIĆ and Marija KOSTIĆ 1
INDICATORS OF AGRICULTURAL AND RURAL DEVELOPMENT IN
THE EAST CENTRAL AND SOUTH-EAST EUROPEAN COUNTRIES
SUMMARY
Rural development is largely determined by the available resources and
competitiveness of agriculture. The results achieved in agriculture are a
significant factor that affects the improvement of the life quality in rural areas and
the efficiency of the rural economy. Hence the indicators of agriculture and rural
development are common and inseparable. The main purpose of the paper is
systemic analysis of indicators of agriculture and rural development in the East
Central and South-East European countries. The heterogeneous structure of the
analysed group of countries enables their further division into the European
Union (EU) Member States and non-EU countries and consideration of
differences in the results achieved in these two subgroups. The methods applied
in the paper are descriptive statistics, analysis of variance, cluster analysis and
correlation analysis. The results of the research enable evaluation of the relative
position of the countries according to the analysed indicators, identification of the
countries with relatively better performance, but also the direction and intensity
of the link between selected indicators of agricultural and rural development in
the analysed group of countries.
Keywords: agriculture; rural development; results; indicators.
INTRODUCTION
Rural areas have a great natural, demographic, economic and cultural
potential (Despotović et al., 2017; Dimitrovski et al., 2019; Filipović, 2018), so
the rational utilization of that wealth can potentially provide diversified
development, full employment, and high living standards and quality of life for
the rural population (Erokhin et al., 2014; Podovac et al., 2019). Nevertheless,
most of the world's poorest people live in rural areas and this situation is not
expected to change for some years. In the past few decades rural areas have
experienced major economic and social changes: agriculture and forestry
1Miljan Leković (corresponding author: [email protected]), Drago Cvijanović, Tanja Stanišić,
Marija Kostić, University of Kragujevac, Faculty of Hotel Management and Tourism in Vrnjačka
Banja, SERBIA
Paper presented at the GEA (Geo Eco-Eco Agro) International Conference 2020, Podgorica.
Notes: The authors declare that they have no conflicts of interest. Authorship Form signed online.
Received:15/04/2020 Accepted:02/06/2020
Cvijanović et al 20
(traditionally strong primary industries) have decreased dramatically in many
countries (Saarinen, 2007). But still, 77% of the area of the EU member countries
are dominated by agriculture and forestry (Piorr, 2003).
The production system such as agriculture is crucially dependent on the
environment and impact on it. The environmental impact of agriculture is directly
dependent on the land use (Spalevic et al., 2017a), and the land use also reflects
the development trends of agriculture and the overall vitality of rural areas (Yli-
Viikari et al., 2002). At the same time rural areas are often economically
backward (Trišić, 2019), so economic revitalization of rural areas is a priority of
national development (Mickovic et al., 2020; Spalević et al., 2017b; Zekić et al.,
2017). For this reason, sustainability of rural areas in general terms means the
retention of rural inhabitants in their traditional environment by means of the
provision of sustainable employment and income (Kiseleva et al., 2013).
In the context of the efforts of countries in modern conditions to define and
implement an adequate rural development strategy and ensure the well-being of
the rural population, it is important to monitor indicators and measure the
achieved level of rural development. Agriculture, which provides socio-economic
development of rural areas, plays important role in this process (Despotović et al.,
2016; Katić et al., 2011, Gajić et al., 2017). Many indicators and variables are
used for examining the agricultural and rural development level in a particular
community or country. Indicators are an area of growing interest. They help to
transform the raw data into a form that facilitates the decision-making and the
managing the complex issues such is rural development. The UN Commission on
Sustainable Development (CSD), European Centre for Nature Conservation
(ECNC), World Bank, Food and Agriculture Organization (FAO) and several
single nations have contributed to development of the agri-environmental and
rural indicators (Bryden 2001; Bryden et al., 2000; FAO, 1998; Ilić et al., 2017;
MAFF, 2000; McRae et al., 2000; Wascher, 2000; World Bank, 2000; WWF,
2000). There are several studies that are based on the analyses with some of these
indicators. The study of Pierangeli et al. (2008) describes the functions of rural
development for the EU-25 using indicators and their results show the difference
between Southern and Northern European countries. Research of Hossain et al.
(2015) shows the significance of rural development multidimensionality, actually
an integrated approach when choosing variables. Ciutacu et al. (2015) show the
difference in agriculture development between Western and Eastern European
countries, where agricultural production was structured on the principles of
collective ownership. Agricultural and rural development indicators prescribed by
the World Bank are the subject of analysis in this paper.
The main focus of the paper is on the analysis of selected indicators of
agricultural and rural development in the East Central and South-East European
countries. The group of the East Central and South-East European countries
consists of countries that differ not only in economic strength and potential for
agricultural and rural development, but also from countries with different policies
and strategies of this development. Some of them have recently redefined their
Indicators of agricultural and rural development in the East Central and... 21
attitude towards agriculture and rural development and understand their
importance in modern conditions. In others, rural development is still
overshadowed by agricultural development. There are countries in this group in
which agriculture is one of the most important economic activities or the
population is predominantly rural. Some of the countries, not all, are members of
the EU. All above mentioned allows the analysis of indicators of agricultural and
rural development of the East Central and South-East European countries in order
to draw conclusions about the results of the group as a whole, but also to identify
subgroups and individual countries that achieve relatively better performance.
The results of the research are divided into several segments. Primarily, a
cross-country comparison of selected indicators in the analysed group of
countries is presented, within which the minimum, maximum and mean values
are also determined, as well as the variability of indicator values by subgroups of
countries (EU and non-EU countries) within the analysed group. After that, the
countries are classified into two clusters according to the achieved performance in
agricultural and rural development. Finally, the direction of the relationship
between the selected indicators in the East Central and South-East European
countries is examined. This structuring of research results is in the function of
realizing the defined goals of the research, i.e., comparing the performance of
subgroups of countries, examining the homogeneity of countries according to the
analysed indicators within the defined subgroups and examining the
interdependence of analysed indicators.
In accordance with the defined research objectives, the following initial
hypotheses are tested: a) East Central and South-East European countries that are
not members of the EU record relatively better results (relative values of
agricultural and rural development indicators) compared to a subgroup of EU
countries; b) there is homogeneity of countries according to the analysed
indicators within the defined subgroups of East Central and South-East European
countries (EU and non-EU countries) and c) there is a statistically significant
relationship between the analysed indicators of agricultural and rural
development in East Central and South-East European countries.
MATERIAL AND METHODS The information basis of the research represent indicators of agricultural
and rural development of the World Bank. In order to ensure comparability of
data, indicators given in relative values, i.e., indices, are selected. Also, in order
to uniformise the data, the data from 2016 are analysed, since this is the last year
in which data on all selected indicators are available. The following indicators are
included in the analysis: Agricultural land (% of land area), Arable land (% of
land area), Forest area (% of land area), Agriculture, forestry, and fishing, value
added (% of GDP), Food production index (2004-2006 = 100), Livestock
production index (2004-2006 = 100), Crop production index (2004-2006 = 100),
Rural population (% of total population), Employment in agriculture (% of total

Cvijanović et al 22
employment), Employment in agriculture, female (% of female employment) and
Employment in agriculture, male (% of male employment)“ (World Bank, 2020).
The data for the group of East Central and South-East Europe Countries,
according to the classification of the United Nations Group of Experts on
Geographical Names (UNGEGN) are analysed in the paper. According to this
classification, group of the East Central and South-East Europe Division
Countries includes the following countries: Albania, Bosnia and Herzegovina,
Bulgaria, Croatia, Cyprus, Czech Republic, Georgia, Greece, Hungary,
Montenegro, North Macedonia, Poland, Romania, Serbia, Slovakia, Slovenia and
Ukraine (UNGEGN, 2020). The heterogeneous group of countries enabled their
further division into two subgroups: EU countries and non-EU countries, which is
used in certain segments of the analysis. The methods applied in the paper are:
descriptive statistics, analysis of variance, cluster analysis and correlation
analysis. Descriptive statistics are used to answer the question of whether better
relative results are recorded in the subgroup of the non-EU countries compared to
the subgroup of the EU countries. Analysis of variance is used to examine the
significance of the difference in the analysed indicators between the defined
subgroups of countries. The homogeneity of countries within the defined
subgroups according to indicators of agricultural and rural development is
examined using cluster analysis. Correlation analysis is used to examine the
interdependence of selected indicators of agricultural and rural development in
the East Central and South-East Europe Countries.
RESULTS AND DISCUSSION
The results of the research are divided into three segments:
1. Cross-country comparison,
2. Examination of homogeneity of countries within defined subgroups
according to indicators of agricultural and rural development, and
3. Examination of the interdependence of agricultural and rural development
indicators in the East Central and South-East Europe Countries.
Cross-country comparison
Selected indicators of agricultural and rural development in the East
Central and South-East European countries are shown in Table 1. For the purpose
of further analysis, the results for the subgroup of EU countries and the subgroup
of non-EU countries are presented separately.
When it comes to "Agricultural land (% of land area)", the highest
percentage share is recorded in Ukraine, followed by Romania, Hungary and
Northern Macedonia as countries where more than half of the land area is
agricultural land. Montenegro and Cyprus are the countries with the lowest
relative value of this indicator.
According to "Arable land (% of land area)", in addition to Ukraine,
countries with a high percentage share are Hungary, Poland and Romania, while
the lowest are recorded in Montenegro, Cyprus and Slovenia.
Indicators of agricultural and rural development in the East Central and... 23
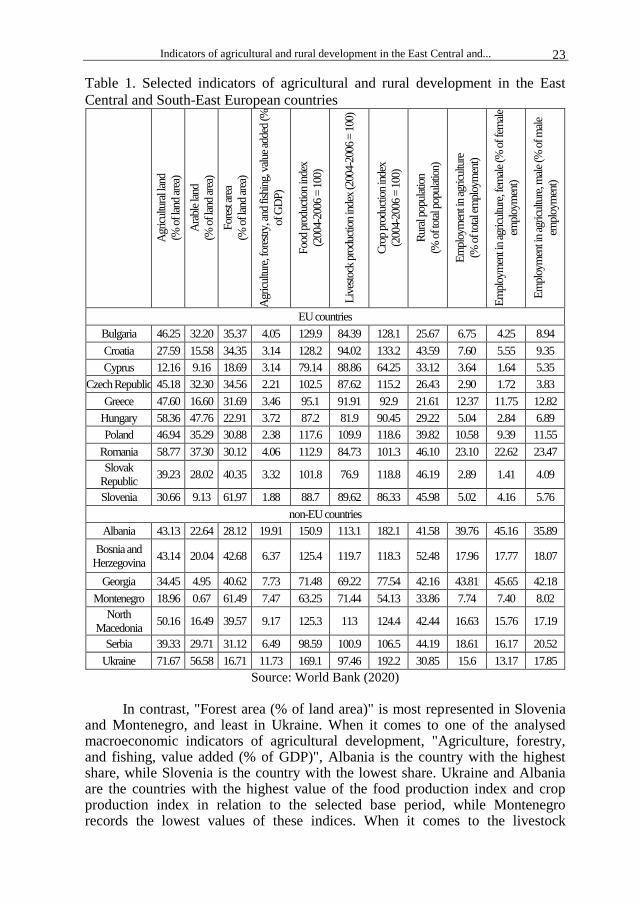
Table 1. Selected indicators of agricultural and rural development in the East
Central and South-East European countries
Agr
icul
tura
l lan
d
(% o
f lan
d ar
ea)
Ara
ble
land
(% o
f lan
d ar
ea)
For
est a
rea
(% o
f lan
d ar
ea)
Agr
icul
ture
, for
estry,
and
fish
ing,
val
ue a
dded
(%
of G
DP)
Foo
d pr
oduc
tion
inde
x
(200
4-20
06 =
100
)
Liv
esto
ck p
rodu
ctio
n in
dex
(200
4-20
06 =
100
)
Cro
p pr
oduc
tion
inde
x
(200
4-20
06 =
100
)
Rur
al p
opul
atio
n
(% o
f tot
al p
opul
atio
n)
Em
ploy
men
t in
agricu
lture
(% o
f tot
al e
mpl
oym
ent)
Em
ploy
men
t in
agricu
lture
, fem
ale
(% o
f fem
ale
empl
oym
ent)
Em
ploy
men
t in
agricu
lture
, mal
e (%
of m
ale
empl
oym
ent)
EU countries
Bulgaria 46.25 32.20 35.37 4.05 129.9 84.39 128.1 25.67 6.75 4.25 8.94
Croatia 27.59 15.58 34.35 3.14 128.2 94.02 133.2 43.59 7.60 5.55 9.35
Cyprus 12.16 9.16 18.69 3.14 79.14 88.86 64.25 33.12 3.64 1.64 5.35
Czech Republic 45.18 32.30 34.56 2.21 102.5 87.62 115.2 26.43 2.90 1.72 3.83
Greece 47.60 16.60 31.69 3.46 95.1 91.91 92.9 21.61 12.37 11.75 12.82
Hungary 58.36 47.76 22.91 3.72 87.2 81.9 90.45 29.22 5.04 2.84 6.89
Poland 46.94 35.29 30.88 2.38 117.6 109.9 118.6 39.82 10.58 9.39 11.55
Romania 58.77 37.30 30.12 4.06 112.9 84.73 101.3 46.10 23.10 22.62 23.47
Slovak
Republic 39.23 28.02 40.35 3.32 101.8 76.9 118.8 46.19 2.89 1.41 4.09
Slovenia 30.66 9.13 61.97 1.88 88.7 89.62 86.33 45.98 5.02 4.16 5.76
non-EU countries
Albania 43.13 22.64 28.12 19.91 150.9 113.1 182.1 41.58 39.76 45.16 35.89
Bosnia and
Herzegovina 43.14 20.04 42.68 6.37 125.4 119.7 118.3 52.48 17.96 17.77 18.07
Georgia 34.45 4.95 40.62 7.73 71.48 69.22 77.54 42.16 43.81 45.65 42.18
Montenegro 18.96 0.67 61.49 7.47 63.25 71.44 54.13 33.86 7.74 7.40 8.02
North
Macedonia 50.16 16.49 39.57 9.17 125.3 113 124.4 42.44 16.63 15.76 17.19
Serbia 39.33 29.71 31.12 6.49 98.59 100.9 106.5 44.19 18.61 16.17 20.52
Ukraine 71.67 56.58 16.71 11.73 169.1 97.46 192.2 30.85 15.6 13.17 17.85
Source: World Bank (2020)
In contrast, "Forest area (% of land area)" is most represented in Slovenia and Montenegro, and least in Ukraine. When it comes to one of the analysed macroeconomic indicators of agricultural development, "Agriculture, forestry, and fishing, value added (% of GDP)", Albania is the country with the highest share, while Slovenia is the country with the lowest share. Ukraine and Albania are the countries with the highest value of the food production index and crop production index in relation to the selected base period, while Montenegro records the lowest values of these indices. When it comes to the livestock
Cvijanović et al 24
production index, the highest base index is recorded in Bosnia and Herzegovina, and the lowest in Georgia. Bosnia and Herzegovina is also the country with the highest share of rural population in the total, while this share is the lowest in Greece. Georgia stands out as the country with the largest share of employment in agriculture (total, female and male), while the Slovak Republic, the Czech Republic and Cyprus can stand out as the countries with the lowest percentages of these indicators.
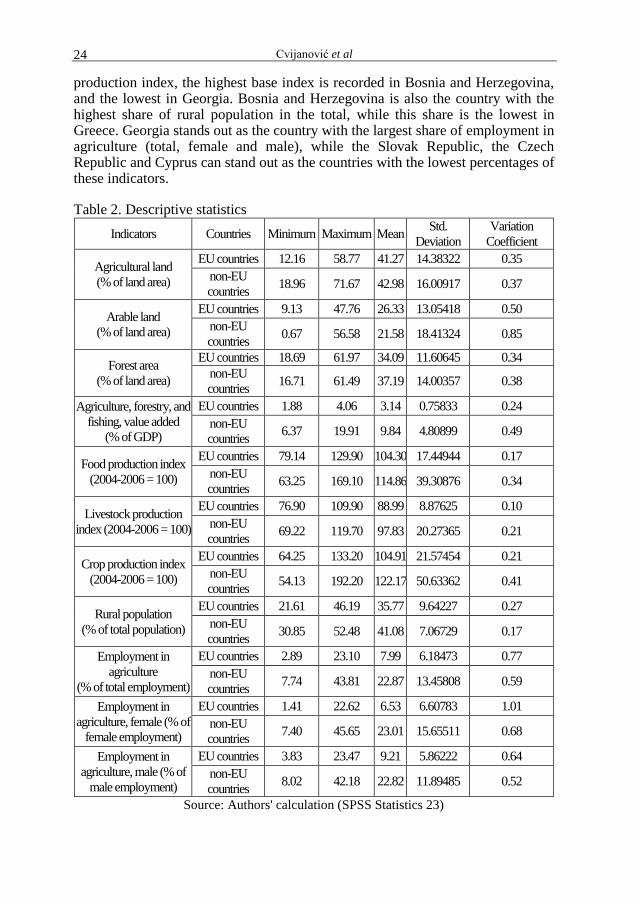
Table 2. Descriptive statistics
Indicators Countries Minimum Maximum Mean Std.
Deviation
Variation
Coefficient
Agricultural land
(% of land area)
EU countries 12.16 58.77 41.27 14.38322 0.35
non-EU
countries 18.96 71.67 42.98 16.00917 0.37
Arable land
(% of land area)
EU countries 9.13 47.76 26.33 13.05418 0.50
non-EU
countries 0.67 56.58 21.58 18.41324 0.85
Forest area
(% of land area)
EU countries 18.69 61.97 34.09 11.60645 0.34
non-EU
countries 16.71 61.49 37.19 14.00357 0.38
Agriculture, forestry, and
fishing, value added
(% of GDP)
EU countries 1.88 4.06 3.14 0.75833 0.24
non-EU
countries 6.37 19.91 9.84 4.80899 0.49
Food production index
(2004-2006 = 100)
EU countries 79.14 129.90 104.30 17.44944 0.17
non-EU
countries 63.25 169.10 114.86 39.30876 0.34
Livestock production
index (2004-2006 = 100)
EU countries 76.90 109.90 88.99 8.87625 0.10
non-EU
countries 69.22 119.70 97.83 20.27365 0.21
Crop production index
(2004-2006 = 100)
EU countries 64.25 133.20 104.91 21.57454 0.21
non-EU
countries 54.13 192.20 122.17 50.63362 0.41
Rural population
(% of total population)
EU countries 21.61 46.19 35.77 9.64227 0.27
non-EU
countries 30.85 52.48 41.08 7.06729 0.17
Employment in
agriculture
(% of total employment)
EU countries 2.89 23.10 7.99 6.18473 0.77
non-EU
countries 7.74 43.81 22.87 13.45808 0.59
Employment in
agriculture, female (% of
female employment)
EU countries 1.41 22.62 6.53 6.60783 1.01
non-EU
countries 7.40 45.65 23.01 15.65511 0.68
Employment in
agriculture, male (% of
male employment)
EU countries 3.83 23.47 9.21 5.86222 0.64
non-EU
countries 8.02 42.18 22.82 11.89485 0.52
Source: Authors' calculation (SPSS Statistics 23)
Indicators of agricultural and rural development in the East Central and... 25
Descriptive statistics of the analysed indicators are shown in Table 2. For
comparison, the results of descriptive statistics are presented separately for the
EU and non-EU countries.
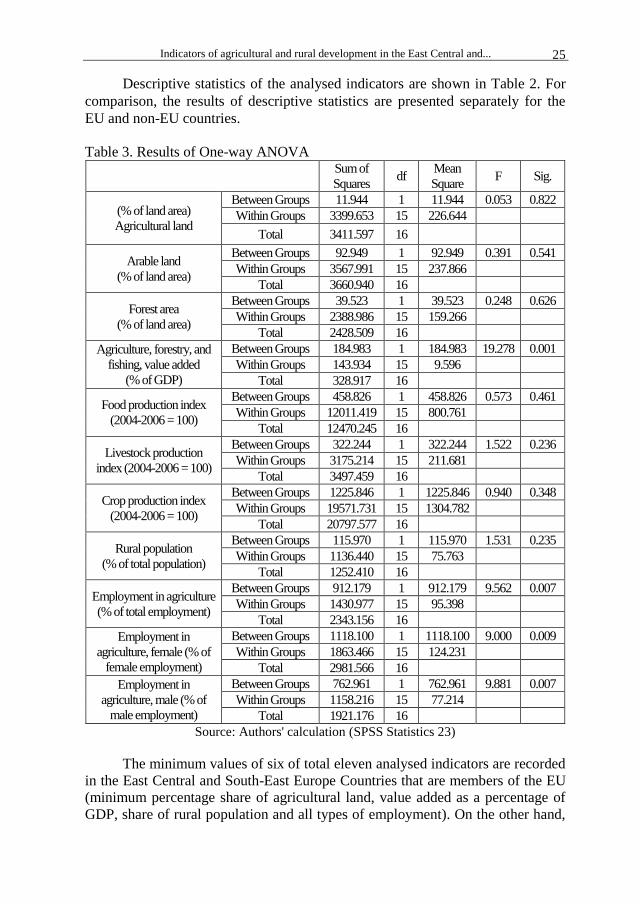
Table 3. Results of One-way ANOVA
Sum of
Squares df
Mean
Square F Sig.
(% of land area)
Agricultural land
Between Groups 11.944 1 11.944 0.053 0.822
Within Groups 3399.653 15 226.644
Total 3411.597 16
Arable land
(% of land area)
Between Groups 92.949 1 92.949 0.391 0.541
Within Groups 3567.991 15 237.866
Total 3660.940 16
Forest area
(% of land area)
Between Groups 39.523 1 39.523 0.248 0.626
Within Groups 2388.986 15 159.266
Total 2428.509 16
Agriculture, forestry, and
fishing, value added
(% of GDP)
Between Groups 184.983 1 184.983 19.278 0.001
Within Groups 143.934 15 9.596
Total 328.917 16
Food production index
(2004-2006 = 100)
Between Groups 458.826 1 458.826 0.573 0.461
Within Groups 12011.419 15 800.761
Total 12470.245 16
Livestock production
index (2004-2006 = 100)
Between Groups 322.244 1 322.244 1.522 0.236
Within Groups 3175.214 15 211.681
Total 3497.459 16
Crop production index
(2004-2006 = 100)
Between Groups 1225.846 1 1225.846 0.940 0.348
Within Groups 19571.731 15 1304.782
Total 20797.577 16
Rural population
(% of total population)
Between Groups 115.970 1 115.970 1.531 0.235
Within Groups 1136.440 15 75.763
Total 1252.410 16
Employment in agriculture
(% of total employment)
Between Groups 912.179 1 912.179 9.562 0.007
Within Groups 1430.977 15 95.398
Total 2343.156 16
Employment in
agriculture, female (% of
female employment)
Between Groups 1118.100 1 1118.100 9.000 0.009
Within Groups 1863.466 15 124.231
Total 2981.566 16
Employment in
agriculture, male (% of
male employment)
Between Groups 762.961 1 762.961 9.881 0.007
Within Groups 1158.216 15 77.214
Total 1921.176 16
Source: Authors' calculation (SPSS Statistics 23)
The minimum values of six of total eleven analysed indicators are recorded
in the East Central and South-East Europe Countries that are members of the EU
(minimum percentage share of agricultural land, value added as a percentage of
GDP, share of rural population and all types of employment). On the other hand,
Cvijanović et al 26
the maximum values of almost all analysed indicators (except the share of forest
area in land area) are recorded in the East Central and South-East Europe
Countries that are not members of the EU. Also, the mean values of almost all
analysed indicators (except the share of arable land in the land area) are higher in
the subgroup of non-EU countries. There is slightly higher variability between
countries within the subgroup of non-EU countries according to seven of the
eleven observed indicators (higher variability within the subgroup of EU
countries is recorded only in the participation of the rural population in total and
participation of all types of employment (total, female and male) in total
employment.
Difference in mean values of the analysed indicators between defined
subgroups of countries is tested by using analysis of variance (One-way
ANOVA). The results are shown in Table 3.
The results presented in Table 3 show that the defined subgroups of the
East Central and South-East Europe Countries (EU and non-EU countries) differ
significantly according to “Agriculture, forestry, and fishing, value added (% of
GDP)”, “Employment in agriculture (% of total employment)”, “Employment in
agriculture, female (% of female employment)” and “Employment in agriculture,
male (% of male employment)”. On the other hand, variations in other analysed
indicators between defined subgroups of countries are not statistically significant.
Examination of homogeneity of countries within defined subgroups
according to indicators of agricultural and rural development
The previous segment of the analysis leads to the conclusion that the East
Central and South-East Europe Countries that are not EU members generally
record higher relative values of the analysed indicators compared to those that are
EU members. Consequently, it can be concluded that non-EU countries in their
overall development rely more on agriculture and rural development than those
East Central and South-East Europe Countries that are members of the EU. The
question is whether such a conclusion is valid for each country within the
analysed subgroups. In order to answer this question, the analysed East Central
and South-East Europe Countries are divided into two clusters by respecting and
combining the values of all analysed indicators.
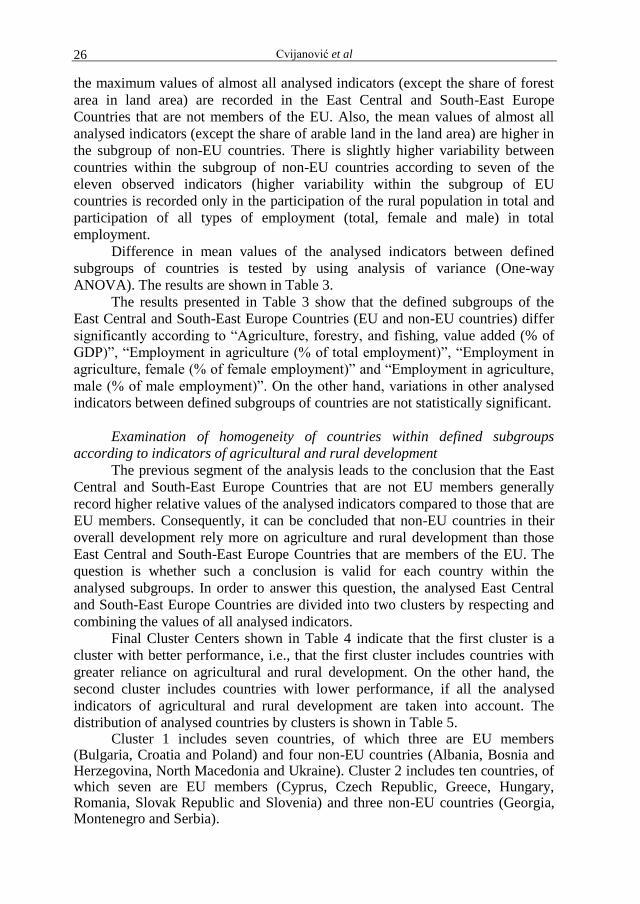
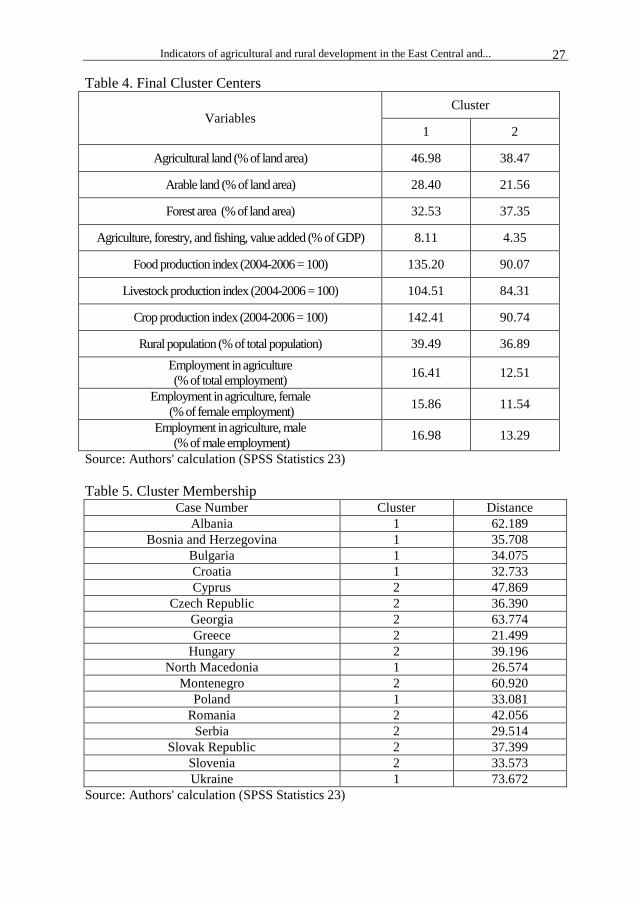
Final Cluster Centers shown in Table 4 indicate that the first cluster is a
cluster with better performance, i.e., that the first cluster includes countries with
greater reliance on agricultural and rural development. On the other hand, the
second cluster includes countries with lower performance, if all the analysed
indicators of agricultural and rural development are taken into account. The
distribution of analysed countries by clusters is shown in Table 5. Cluster 1 includes seven countries, of which three are EU members
(Bulgaria, Croatia and Poland) and four non-EU countries (Albania, Bosnia and Herzegovina, North Macedonia and Ukraine). Cluster 2 includes ten countries, of which seven are EU members (Cyprus, Czech Republic, Greece, Hungary, Romania, Slovak Republic and Slovenia) and three non-EU countries (Georgia, Montenegro and Serbia).
Indicators of agricultural and rural development in the East Central and... 27
Table 4. Final Cluster Centers
Variables Cluster
1 2
Agricultural land (% of land area) 46.98 38.47
Arable land (% of land area) 28.40 21.56
Forest area (% of land area) 32.53 37.35
Agriculture, forestry, and fishing, value added (% of GDP) 8.11 4.35
Food production index (2004-2006 = 100) 135.20 90.07
Livestock production index (2004-2006 = 100) 104.51 84.31
Crop production index (2004-2006 = 100) 142.41 90.74
Rural population (% of total population) 39.49 36.89
Employment in agriculture
(% of total employment) 16.41 12.51
Employment in agriculture, female
(% of female employment) 15.86 11.54
Employment in agriculture, male
(% of male employment) 16.98 13.29
Source: Authors' calculation (SPSS Statistics 23)
Table 5. Cluster Membership Case Number Cluster Distance
Albania 1 62.189
Bosnia and Herzegovina 1 35.708
Bulgaria 1 34.075
Croatia 1 32.733
Cyprus 2 47.869
Czech Republic 2 36.390
Georgia 2 63.774
Greece 2 21.499
Hungary 2 39.196
North Macedonia 1 26.574
Montenegro 2 60.920
Poland 1 33.081
Romania 2 42.056
Serbia 2 29.514
Slovak Republic 2 37.399
Slovenia 2 33.573
Ukraine 1 73.672
Source: Authors' calculation (SPSS Statistics 23)
Cvijanović et al 28
Examination of the interdependence of agricultural and rural development
indicators in the East Central and South-East Europe Countries
This segment of the analysis is based on the group (East Central and South-
East Europe Countries) level data. In order to examine the interdependence of the
analysed indicators of agricultural and rural development, Spearman's rank
Correlation Coefficients are calculated.
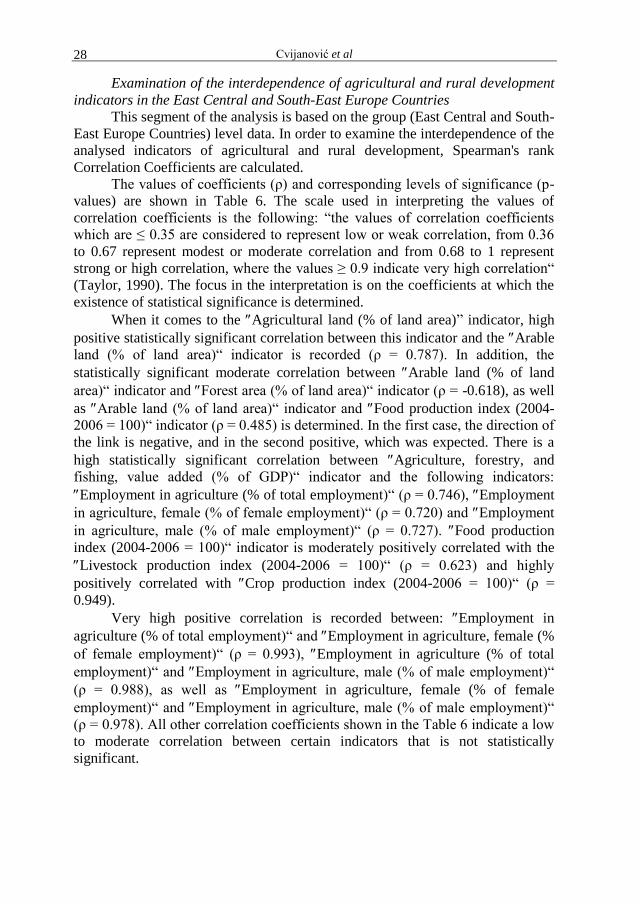
The values of coefficients (ρ) and corresponding levels of significance (p-
values) are shown in Table 6. The scale used in interpreting the values of
correlation coefficients is the following: “the values of correlation coefficients
which are ≤ 0.35 are considered to represent low or weak correlation, from 0.36
to 0.67 represent modest or moderate correlation and from 0.68 to 1 represent
strong or high correlation, where the values ≥ 0.9 indicate very high correlation“
(Taylor, 1990). The focus in the interpretation is on the coefficients at which the
existence of statistical significance is determined.
When it comes to the Agricultural land (% of land area)” indicator, high
positive statistically significant correlation between this indicator and the Arable
land (% of land area)“ indicator is recorded (ρ = 0.787). In addition, the
statistically significant moderate correlation between Arable land (% of land
area)“ indicator and Forest area (% of land area)“ indicator (ρ = -0.618), as well
as Arable land (% of land area)“ indicator and Food production index (2004-
2006 = 100)“ indicator (ρ = 0.485) is determined. In the first case, the direction of
the link is negative, and in the second positive, which was expected. There is a
high statistically significant correlation between Agriculture, forestry, and
fishing, value added (% of GDP)“ indicator and the following indicators:
Employment in agriculture (% of total employment)“ (ρ = 0.746), Employment
in agriculture, female (% of female employment)“ (ρ = 0.720) and Employment
in agriculture, male (% of male employment)“ (ρ = 0.727). Food production
index (2004-2006 = 100)“ indicator is moderately positively correlated with the
Livestock production index (2004-2006 = 100)“ (ρ = 0.623) and highly
positively correlated with Crop production index (2004-2006 = 100)“ (ρ =
0.949).
Very high positive correlation is recorded between: Employment in
agriculture (% of total employment)“ and Employment in agriculture, female (%
of female employment)“ (ρ = 0.993), Employment in agriculture (% of total
employment)“ and Employment in agriculture, male (% of male employment)“
(ρ = 0.988), as well as Employment in agriculture, female (% of female
employment)“ and Employment in agriculture, male (% of male employment)“
(ρ = 0.978). All other correlation coefficients shown in the Table 6 indicate a low
to moderate correlation between certain indicators that is not statistically
significant.
Indicators of agricultural and rural development in the East Central and... 29
Table 6. Correlation matrix
A
gric
ultu
ral l
and
(% o
f lan
d ar
ea)
Ara
ble
land
(% o
f lan
d ar
ea)
For
est a
rea
(% o
f lan
d ar
ea)
Agr
icul
ture
, for
estry,
and
fish
ing,
valu
e ad
ded
(% o
f GD
P)
Foo
d pr
oduc
tion
inde
x
(200
4-20
06 =
100
)
Liv
esto
ck p
rodu
ctio
n in
dex
(200
4-20
06 =
100
)
Cro
p pr
oduc
tion
inde
x
(200
4-20
06 =
100
)
Rur
al p
opul
atio
n
(% o
f tot
al p
opul
atio
n)
Em
ploy
men
t in
agricu
lture
(% o
f tot
al e
mpl
oym
ent)
Em
ploy
men
t in
agricu
lture
, fem
ale
(% o
f fem
ale
empl
oym
ent)
Em
ploy
men
t in
agricu
lture
, mal
e
(% o
f mal
e em
ploy
men
t)
Agricultural
land
(% of land area)
1.000
Arable land
(% of land area) 0.787
(**) 1.000
Forest area
(% of land area)
-0.434
(0.082)
-0.618
(**) 1.000
Agriculture,
forestry, and
fishing, value
added
(% of GDP)
0.255
(0.323)
0.013
(0.959)
-0.119
(0.649) 1.000
Food
production
index (2004-
2006 = 100)
0.451
(0.069) 0.485
(*)
-0.275
(0.286)
0.256
(0.321) 1.000
Livestock
production
index (2004-
2006 = 100)
0.225
(0.384)
0.145
(0.580)
-0.223
(0.390)
0.173
(0.507) 0.623
(**) 1.000
Crop
production
index (2004-
2006 = 100)
0.395
(0.117)
0.466
(0.060)
-0.257
(0.319)
0.256
(0.321) 0.949
(**)
0.537
(*) 1.000
Rural
population
(% of total
population)
-0.252
(0.328)
-0.201
(0.439)
0.380
(0.133)
0.056
(0.830)
0.059
(0.823)
0.213
(0.411)
0.049
(0.852) 1.000
Employment in
agriculture (%
of total
employment)
0.262
(0.309)
-0.015
(0.955)
-0.096
(0.715) 0.746
(**)
0.223
(0.390)
0.360
(0.155)
0.130
(0.619)
0.250
(0.333) 1.000
Employment in
agriculture,
female (% of
female
employment)
0.262
(0.309)
-0.032
(0.903)
-0.022
(0.933) 0.720
(**)
0.255
(0.323)
0.380
(0.133)
0.150
(0.567)
0.277
(0.282) 0.993
(**) 1.000
Employment in
agriculture,
male (% of
male
employment)
0.284
(0.269)
0.042
(0.874)
-0.145
(0.580) 0.727
(**)
0.299
(0.244)
0.373
(0.141)
0.213
(0.411)
0.267
(0.300) 0.988
(**)
0.978
(**) 1.000
** Correlation is significant at the 0.01 level (2-tailed).
* Correlation is significant at the 0.05 level (2-tailed).
Source: Authors' calculation (SPSS Statistics 23)

Cvijanović et al 30
CONCLUSIONS
Indicators of agricultural and rural development in the East Central and
South-East European countries were the subject of the analysis in the paper. The
heterogeneity of this group of countries enabled their further division into EU and
non-EU countries, which is used in certain segments of research in order to
provide answers to research questions, i.e., hypotheses. In this regard, the results
of descriptive statistics given separately for EU and non-EU countries from the
group of the East Central and South-East European countries showed that the
maximum values of almost all analysed indicators (except Forest area (% of land
area)”), as well as the higher mean values of almost all analysed indicators
(except Arable land (% of land area)”), have been observed in one of the non-
EU countries. Based on this, the first initial assumption of the research was
confirmed. Namely, East Central and South-East European countries that are not
members of the EU record relatively better results (relative values of indicators of
agricultural and rural development) compared to a subgroup of EU countries. The
importance of agricultural and rural development for the overall development is
higher in the non-EU countries of the analysed group. The analysis of variance
found that a statistically significant difference between the defined subgroups of
countries exists when it comes to Agriculture, forestry, and fishing, value added
(% of GDP)”, Employment in agriculture (% of total employment)”,
Employment in agriculture, female (% of female employment)” and
Employment in agriculture, male (% of male employment)”, hence,
macroeconomic indicators of agricultural and rural development.
The first segment of the analysis was the basis for examining the
homogeneity of countries within defined subgroups. Two groups of countries
were singled out by cluster analysis, cluster 1, as a cluster with better
performance according to the analysed indicators and cluster 2, as a cluster with
weaker performance, taking into account the values of all analysed indicators. It
was expected that the distribution of countries by clusters would coincide with
the previous division into non-EU and EU countries, i.e., that the structure of
countries in cluster 1 would correspond to the structure of countries in the
subgroup of non-EU countries, and in cluster 2 to the structure of countries in the
EU subgroup. However, that did not happen. In this way, the second assumption
of the research was rejected. Three non-EU countries (Georgia, Montenegro and
Serbia) belong to the second cluster, i.e., the cluster with weaker performance.
Also, three EU countries (Bulgaria, Croatia and Poland) belong to cluster 1, a
cluster with better performance.
The research assumption tested by correlation analysis was that there is a
statistically significant relationship between all analysed indicators of agricultural
and rural development in East Central and South-East European countries. As a
statistically significant relationship was found between a relatively small number
of analysed indicators, it can be concluded that this assumption is not valid for the
observed group of countries.
Indicators of agricultural and rural development in the East Central and... 31
The main limitation of the research is reflected in the static approach and
analysis of the data from one year. The analysis of selected indicators of
agricultural and rural development in East Central and South-East European
countries in the dynamics of time may be the subject of future research. In this
way, it would be possible to more accurately identify countries of good practice,
but also to systemize critical indicators by the analysed countries that require
improvement in the coming period and greater attention of agricultural and rural
development policy makers.
ACKNOWLEDGEMENTS
The authors declare no conflict of interest.
REFERENCES Bryden, J., & Shucksmith, M. (2000). The Concept of Sustainability in relation to
agriculture and rural development in the European Union. Rural and Regional Development in Northern Periphery, Report, 4(00).
Bryden, J., Copus, A., & Macleod, M. (2001). Rural development. Landsis geie Luxembourg: Proposal on Agri-Environmental Indicators PAIS.
Ciutacu, C., Chivu, L., & Andrei, J. V. (2015). Similarities and dissimilarities between the EU agricultural and rural development model and Romanian agriculture. Challenges and perspectives. Land Use Policy, 44, 169–176. https://doi.org/10.1016/j.landusepol.2014.08.009
Despotović, A., Joksimović, M., & Jovanovic, M. (2016). Socio-economic development requirements for agrotourism in Montenegro. Agriculture and Forestry, 62(4), 277-286. https://doi.org/10.17707/agricultforest.62.4.28
Despotović, A., Joksimović, M., Svržnjak, K., & Jovanović, M. (2017). Rural areas sustainability: Agricultural diversification and opportunities for agri-tourism development. Agriculture and Forestry, 63(3), 47–62. https://doi.org/10.17707/agricultforest.63.3.06
Dimitrovski, D., Leković, M., & Joukes, V. (2019). A bibliometric analysis of Crossref agritourism literature indexed in Web of Science. Menadžment u hotelijerstvu i turizmu – Hotel and Tourism Management, 7(2), 25–37. https://doi.org/10.5937/menhottur1902025d
Erokhin, V., Heijman, W., & Ivolga, A. (2014). Sustainable rural development in Russia through diversification: The case of the Stavropol Region. Visegrad journal on bioeconomy and sustainable development, 3(1), 20–25. https://doi.org/10.2478/vjbsd-2014-0004
Filipović, N. (2018). Intangible cultural heritage as a motive for choosing the tourist destination Aranđelovac, Menadžment u hotelijerstvu i turizmu – Hotel and Tourism Management, 6(1), 53–62. https://doi.org/10.5937/menhottur1801053f
Gajić, T., Vujko, A., Cvijanović, D., Penić, M., & Gagić, S. (2017). The state of agriculture and rural development in Serbia. R-Economy, 3(4), 196-202. https://doi.org/10.15826/recon.2017.3.3.022
Hossain, M., Begum, E., & Papadopoulou, E. (2015). Factors of rural development driver in Southeastern Bangladesh. American Journal of Rural Development, 3(2), 34–40.
Ilić, I., Krstić, B., & Jovanović, S. (2017). Environmental performances of agriculture in the European Union countries. Economics of Agriculture, 64(1), 41–55.
Katić, B., Cvijanović, D., & Pejanović, R. (2011). The agriculture as a real assumption of regional and rural development in Serbia. Rural Areas and Development, 8(3), 77-89.
MAFF (2000). Towards sustainable agriculture: A pilot set of indicators. (available at http://www.adlib.ac.uk/resources/000/015/650/pilotindicators.pdf).
Cvijanović et al 32
McRae, T., Smith, C. S., & Gregorich, L. J. (2000). Environmental sustainability of Canadian agriculture: Report of the agri-environmental indicator project: A summary. Agriculture and Agri-Food Canada.
Mickovic, B., Mijanovic, D., Spalevic, V., Skataric, G., & Dudic, B. (2020). Contribution to the analysis of depopulation in rural areas of the Balkans: Case study of the Municipality of Niksic, Montenegro. Sustainability, 12(8), 3328. https://doi.org/10.3390/su12083328
Pierangeli, F., Henke, R., & Coronas, M. G. (2008). Multifunctional agriculture: An analysis of country specialization and regional differentiation. 12th Congress of the European Association of Agricultural Economists – EAAE 2008, 1–6.
Piorr, H. P. (2003). Environmental policy, agri-environmental indicators and landscape indicators. Agriculture, Ecosystems & Environment, 98(1-3), 17–33. https://doi.org/10.1016/s0167-8809(03)00069-0
Podovac, M., Đorđević, N., & Milićević, S. (2019). Rural tourism in the function of life quality improvement of rural population on Goč mountain. Economics of Agriculture, 66(1), 205–220. https://doi.org/10.5937/ekopolj1901205p
Rischkowsky, B., & Pilling, D. (2007). The state of the world's animal genetic resources for food and agriculture. Food & Agriculture Organization.
Saarinen, J. (2007). Contradictions of rural tourism initiatives in rural development contexts: Finnish rural tourism strategy case study. Current Issues in Tourism, 10(1), 96–105. https://doi.org/10.2167/cit287.0
Spalevic, V., Lakicevic, M., Radanovic, D., Billi, P., Barovic, G., Vujacic, D., Sestras, P., & Khaledi Darvishan, A. (2017a). Ecological-Economic (Eco-Eco) modelling in the river basins of mountainous regions: Impact of land cover changes on sediment yield in the Velicka Rijeka, Montenegro. Notulae Botanicae Horti Agrobotanici Cluj-Napoca, 45(2), 602–610. https://doi.org/10.15835/nbha45210695
Spalevic, V., Radanovic, D., Skataric, G., Billi. P., Barovic, G., Curovic, M., Sestras, P., & Khaledi Darvishan, A. (2017b). Ecological-economic (eco-eco) modelling in the mountainous river basins: Impact of land cover changes on soil erosion. Agriculture and Forestry, 63(4), 9–25. https://doi.org/10.17707/agricultforest.63.4.01
Taylor, R. (1990). Interpretation of the correlation coefficient: A basic review. Journal of Diagnostic Medical Sonography, 6(1), 35–39. https://doi.org/10.1177/875647939000600106
Trišić, I. (2019). Opportunities for sustainable tourism development and nature conservation in Special Nature Reserve “Deliblatska peščara.” Menadžment u hotelijerstvu i turizmu – Hotel and Tourism Management, 7(1), 83–93. https://doi.org/10.5937/menhottur1901083t
UNGEGN (2020). UNGEGN Divisions (available at https://unstats.un.org/unsd/geoinfo/ungegn/divisions.html).
Wackernagel, M., Linares, A. C., Deumling, D., Schulz, N. B., Sanchez, M. A. V., & Falfan, I. S. L. (2000). Living Planet Report 2000. WWF Worldwide Network (available at http://www.panda.org/livingplanet).
Wascher, D. M. (2000). Agri-environmental indicators for sustainable agriculture in Europe. European Centre for Nature Conservation.
World Bank (2020). Indicators. Agriculture & Rural Development (available at https://data.worldbank.org/indicator?tab=all).
Yli-Viikari, A., Risku-Norja, H., Nuutinen, V., Heinonen, E., Hietala-Koivu, R., Huusela-Veistola, E., ... & Seppälä, A. (2002). Agri-environmental and rural development indicators: a proposal. Agrifood Research Reports, No. 5. MTT Agrifood Research Finland.
Zekić, S., Kleut, Ž., & Matkovski, B. (2017). An analysis of key indicators of rural development in Serbia: A comparison with EU countries. Economic Annals, 62(214), 107–120. https://doi.org/10.2298/eka1714107z

Agriculture & Forestry, Vol. 66 Issue 2: 33-44, 2020, Podgorica 33
Markoski, M., Mitkova, T., Tanaskovik, V., Nechkovski, S., Spalević, V. (2020): The influence of soil texture and
organic matter on the retention curves at soil moisture in the humic Calcaric Regosol of the ovche pole region,
North Macedonia. Agriculture and Forestry, 66 (2): 33-44.
DOI: 10.17707/AgricultForest.66.2.03
Mile MARKOSKI1*, Tatjana MITKOVA
1, Vjekoslav TANASKOVIK
1,
Stojanče NECHKOVSKI1 and Velibor SPALEVIC
2
THE INFLUENCE OF SOIL TEXTURE AND ORGANIC MATTER ON
THE RETENTION CURVES AT SOIL MOISTURE IN THE HUMIC
CALCARIC REGOSOL OF THE OVCHE POLE REGION,
NORTH MACEDONIA
SUMMARY
This paper is a result of field and laboratory research of the soils (Rendzina
Calcaric Regosol) in Ovche Pole region in the Republic of North Macedonia. The
field research of the soils has been done according to methods described by
Mitrikeski & Mitkova (2013). In laboratory, the following analyses have been
carried with the soil samples: hygroscopic moisture, mechanical composition
(soil texture), pH value of the soil solution, humus content and content of
carbonates. The soil texture and chemical properties of the soils have been
determined by standard methods described by Mitrikeski & Mitkova (2013). The
soil moisture retention at pressures of 0.33, 6.25 and 15 bars was determined by
bar extractor (Townend, et al., 2001; ICARDA 2001; Marinčić, 1971). The
average content of physical sand and clay fractions was 59.50% and 40.50%
respectively. The average content of individual soil separates is: coarse sand
20.85%, fine sand 38.65%, silt 18,29% and clay 22.21%. The content of humus in
horizon Ap ranges from 1.87 to 2.2 with an average of 2.1% and this percentage
decreases with depth in all examined profiles. In horizon Amo is 1.36%, in AC
horizon 0.89% and the smallest is in parent material C, 0.69%. The moisture
content of the soil at 0.33 bar is high in all horizons. The highest retention has
horizon Amo 31.25% (higher content of humus and clay). The horizons AC, Ap
and the parent material C have similar values (26.74%, 26.72 and 24.51%). The
wilting point is not high (average 15.71% in Amo horizon). The results suggested
a positive correlation in horizon Amo between the moisture retention at 0.33 and
15.00 bars and the content of physical clay and clay, as well as high negative
correlation between the moisture retention at 0.33 and 15.00 bars and the content
1Mile Markovski (corresponding author: [email protected]), Tatjana Mitkova, Vjekoslav
Tanaskovik, Stojanče Nechkovski, “Ss. Cyril and Methodius” University, Faculty of Agricultural
Sciences and Food, Skopje, Republic of NORTH MACEDONIA. 2Velibor Spalević, University of Montenegro, Faculty of Philosophy Niksic, Department of
Geography, MONTENEGRO.
Paper presented at the GEA (Geo Eco-Eco Agro) International Conference 2020, Podgorica
Notes: The authors declare that they have no conflicts of interest. Authorship Form signed online.
Received:02/04/2020 Accepted:27/05/2020
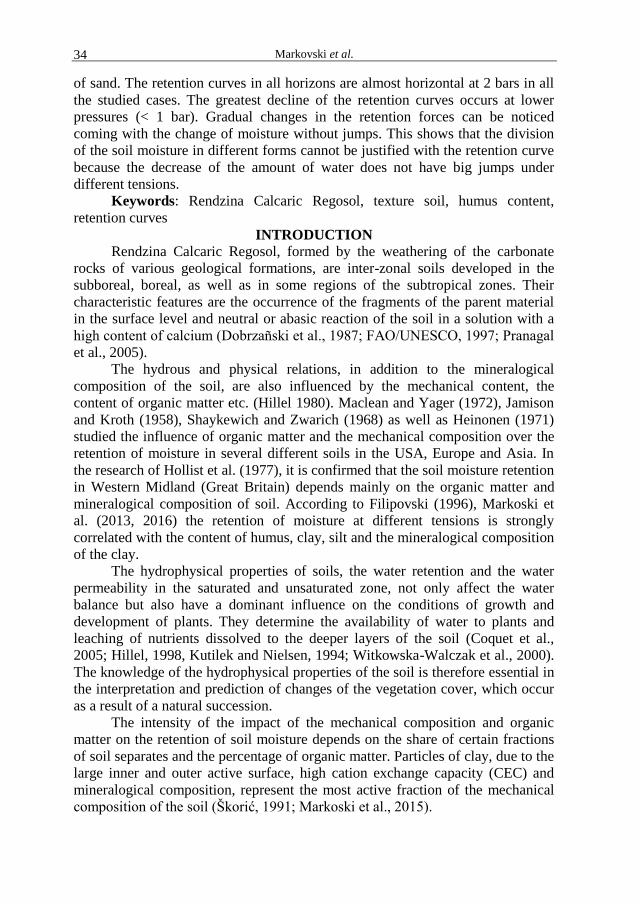
Markovski et al. 34
of sand. The retention curves in all horizons are almost horizontal at 2 bars in all
the studied cases. The greatest decline of the retention curves occurs at lower
pressures (< 1 bar). Gradual changes in the retention forces can be noticed
coming with the change of moisture without jumps. This shows that the division
of the soil moisture in different forms cannot be justified with the retention curve
because the decrease of the amount of water does not have big jumps under
different tensions.
Keywords: Rendzina Calcaric Regosol, texture soil, humus content,
retention curves
INTRODUCTION
Rendzina Calcaric Regosol, formed by the weathering of the carbonate
rocks of various geological formations, are inter-zonal soils developed in the
subboreal, boreal, as well as in some regions of the subtropical zones. Their
characteristic features are the occurrence of the fragments of the parent material
in the surface level and neutral or abasic reaction of the soil in a solution with a
high content of calcium (Dobrzañski et al., 1987; FAO/UNESCO, 1997; Pranagal
et al., 2005).
The hydrous and physical relations, in addition to the mineralogical
composition of the soil, are also influenced by the mechanical content, the
content of organic matter etc. (Hillel 1980). Maclean and Yager (1972), Jamison
and Kroth (1958), Shaykewich and Zwarich (1968) as well as Heinonen (1971)
studied the influence of organic matter and the mechanical composition over the
retention of moisture in several different soils in the USA, Europe and Asia. In
the research of Hollist et al. (1977), it is confirmed that the soil moisture retention
in Western Midland (Great Britain) depends mainly on the organic matter and
mineralogical composition of soil. According to Filipovski (1996), Markoski et
al. (2013, 2016) the retention of moisture at different tensions is strongly
correlated with the content of humus, clay, silt and the mineralogical composition
of the clay.
The hydrophysical properties of soils, the water retention and the water
permeability in the saturated and unsaturated zone, not only affect the water
balance but also have a dominant influence on the conditions of growth and
development of plants. They determine the availability of water to plants and
leaching of nutrients dissolved to the deeper layers of the soil (Coquet et al.,
2005; Hillel, 1998, Kutilek and Nielsen, 1994; Witkowska-Walczak et al., 2000).
The knowledge of the hydrophysical properties of the soil is therefore essential in
the interpretation and prediction of changes of the vegetation cover, which occur
as a result of a natural succession.
The intensity of the impact of the mechanical composition and organic
matter on the retention of soil moisture depends on the share of certain fractions
of soil separates and the percentage of organic matter. Particles of clay, due to the
large inner and outer active surface, high cation exchange capacity (CEC) and
mineralogical composition, represent the most active fraction of the mechanical
composition of the soil (Škorić, 1991; Markoski et al., 2015).

The influence of soil texture and organic matter on the retention... 35
In our research, the main emphasis was on the dependence and impact of
organic matter and mechanical composition on the retention of water in the
surveyed Rendzina Calcaric Regosol. Due to the stated importance of the
mechanical composition and organic matter of the other properties of soil, this
paper investigates the impact on retention of soil moisture at different points of
tension, ranging from 0.33 up to 15 bars, which correspond to the water constant,
which is called permanent wilting point (PWP). The remaining moisture above 15
bars is unavailable to plants (Bogdanović 1973; Markoski et al., 2013; Markoski
et al., 2015; Markoski et al., 2016).
MATERIAL AND METHODS The influence of the mechanical composition and organic matter of the soil
to the retention curves of soil moisture has been investigated in the Rendzina
Calcaric Regosol spread around the in Ovche Pole region in Republic of North
Macedonia (Figure 1).
Figure 1. Study area of the Ovche Pole region in Republic of North Macedonia
In this region seven basic pedological profiles were excavated and 28 soil
samples were taken for further analysis. We analysed: the mechanical
composition of the soil, determined by dispersing the soil using a 1 M solution of
Na4P2O7 x 10 H2O. The fractioning of mechanical elements was carried out using
the International Classification; the textured classes with the American Triangle,
described by Mitrikeski and Mitkova (2013); Determinates in mechanical
composition and chemical properties in soils with standard methods described by
Bogdanović et al (1966), Mitrikeski & Mitkova (2006); Džamić et.al. (1996).
The determination of moisture retention at a pressure of 0.33 bar, 0.5 bar
and 1 bar, was performed applying pressure with a Bar extractor. To determine
the retention of soil moisture at higher pressures, the method of Richards (1982),
Porous plate extractor, 4.0 bar 6.25 bar and 15 bar was applied, described by
Townend et al. (2001; ICARDA 2001; Marinčić, 1971). There has been
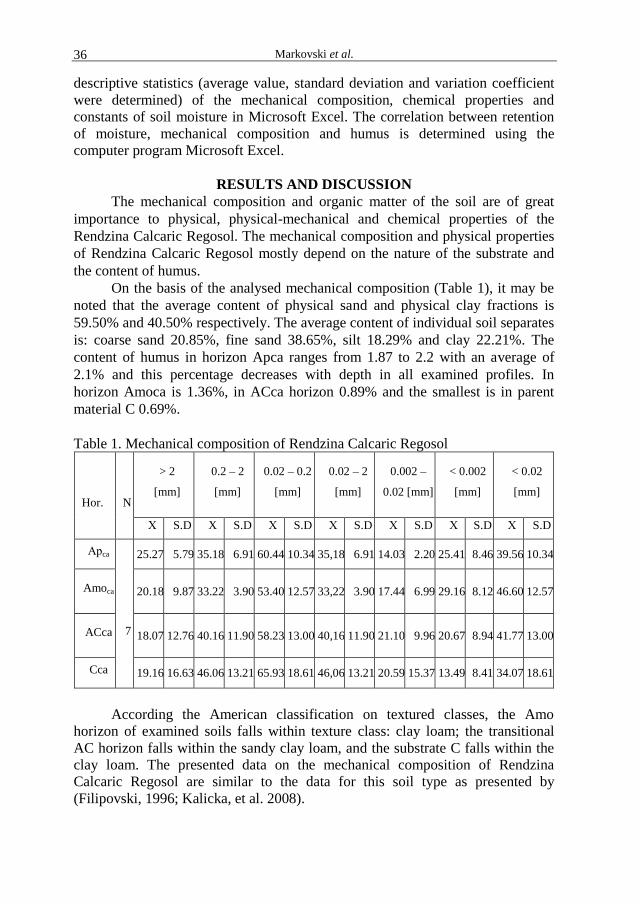
Markovski et al. 36
descriptive statistics (average value, standard deviation and variation coefficient
were determined) of the mechanical composition, chemical properties and
constants of soil moisture in Microsoft Excel. The correlation between retention
of moisture, mechanical composition and humus is determined using the
computer program Microsoft Excel.
RESULTS AND DISCUSSION
The mechanical composition and organic matter of the soil are of great
importance to physical, physical-mechanical and chemical properties of the
Rendzina Calcaric Regosol. The mechanical composition and physical properties
of Rendzina Calcaric Regosol mostly depend on the nature of the substrate and
the content of humus.
On the basis of the analysed mechanical composition (Table 1), it may be
noted that the average content of physical sand and physical clay fractions is
59.50% and 40.50% respectively. The average content of individual soil separates
is: coarse sand 20.85%, fine sand 38.65%, silt 18.29% and clay 22.21%. The
content of humus in horizon Apca ranges from 1.87 to 2.2 with an average of
2.1% and this percentage decreases with depth in all examined profiles. In
horizon Amoca is 1.36%, in ACca horizon 0.89% and the smallest is in parent
material C 0.69%.
Table 1. Mechanical composition of Rendzina Calcaric Regosol
Hor.
N
> 2
[mm]
0.2 – 2
[mm]
0.02 – 0.2
[mm]
0.02 – 2
[mm]
0.002 –
0.02 [mm]
< 0.002
[mm]
< 0.02
[mm]
Х S.D X S.D Х S.D Х S.D Х S.D Х S.D Х S.D
Аpca
7
25.27 5.79 35.18 6.91 60.44 10.34 35,18 6.91 14.03 2.20 25.41 8.46 39.56 10.34
Amoca 20.18 9.87 33.22 3.90 53.40 12.57 33,22 3.90 17.44 6.99 29.16 8.12 46.60 12.57
ACca 18.07 12.76 40.16 11.90 58.23 13.00 40,16 11.90 21.10 9.96 20.67 8.94 41.77 13.00
Cca 19.16 16.63 46.06 13.21 65.93 18.61 46,06 13.21 20.59 15.37 13.49 8.41 34.07 18.61
According the American classification on textured classes, the Amo
horizon of examined soils falls within texture class: clay loam; the transitional
AC horizon falls within the sandy clay loam, and the substrate C falls within the
clay loam. The presented data on the mechanical composition of Rendzina
Calcaric Regosol are similar to the data for this soil type as presented by
(Filipovski, 1996; Kalicka, et al. 2008).

The influence of soil texture and organic matter on the retention... 37
Besides the mechanical properties, the retention of soil moisture in the Rendzina
Calcaric Regosol is strongly influenced by the chemical properties. The average
values of the chemical properties are shown in Table 2.
Table 2. Chemical properties of Rendzina Calcaric Regosol
Hor.
N
pH in
H2O
Humus
[%] N [%]
P2O5
[mg/100 g
soil]
K2O [mg/100
g soil]
CaCO3
[%]
X S.D Х S.D Х S.D Х S.D Х S.D Х S.D
Аpca
7
7.47 0.75 2.1 0.13 0.12 0.01 17.83 8.78 30.31 7.58 3.52 3.62
Amoca 7.79 1.0 1.36 0.21 0.1 0.01 7.73 6.07 17.67 5.98 6.47 7.2
ACca 8.48 0.89 0.89 0.25 0.03 0.03 4.88 3.6 13.48 5.68 16.67 11.91
Cca 8.73 0.91 0.69 0.19 0.02 0.02 4.74 4.51 8.59 2.52 19.2 16.0
These properties in the surveyed Rendzina Calcaric Regosol depend on the
properties of the substrate (parent material) and its mechanical and mineralogical
composition and content of carbonates in it and of the intensity of pedogenetic
processes (accumulation of humus and translocation of CaCO3).
For the content of organic matter, it is of great importance for Rendzina
Calcaric Regosol to be under natural (grassland or forest) vegetation. The average
content of humus in the humus accumulative horizon Аpca is 2.1%, in the
transitional horizon Amoca - 1.36%, ACca – 0.89 % and it is the lowest in the
substrate C, with average of 0.69%. According to Filipovski (1996) the average
content of humus in the horizon Amo analysed for 481 profiles of Rendzina
Calcaric Regosol in Macedonia is 2.63%.
The retention of water in the soil is the result of two forces: adhesion
(attraction of water molecules by soil particles) and cohesion (water molecules
attract each other). Adhesion is much stronger than cohesion. The force with
which water is retained in the soil is called capillary potential and is closely
related to water content. Free water in the soil has capillary potential equal to
zero, a condition when all the soil pores, capillary and non-capillary, are filled
with water. Soil water potential can be determined indirectly by recourse to
measurements of soil water content and soil water release or soil moisture
characteristic curves that relate volumetric or gravimetric content to soil water
potential. The measurement of water potential is widely accepted as fundamental
to quantifying both the water status in various media and the energy of water
movement in the soil-plant-atmospheric continuum (Livingston, N. J, 1993). In
the research of Markoski, et al. (2009) it was confirmed that by reducing the
moisture content in the soil, the value of the capillary potential is increasing.
For assessment of soil moisture by means of capillary potential, quantified
by Schofield, quoted by Vucić (1987), he suggested pF values, where the force of
water in the soil was expressed by the height of the water column in cm (1 bar =
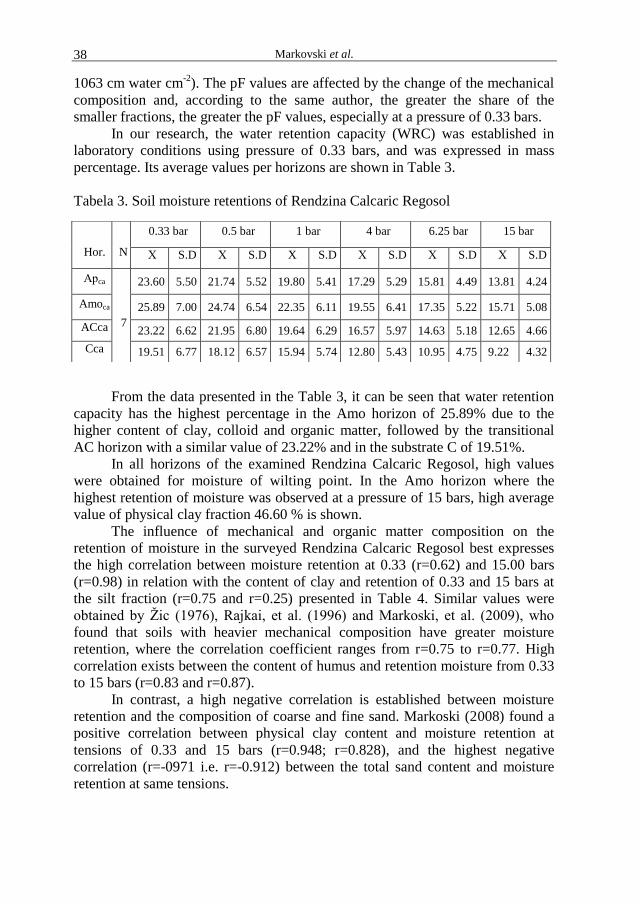
Markovski et al. 38
1063 cm water cm-2
). The pF values are affected by the change of the mechanical
composition and, according to the same author, the greater the share of the
smaller fractions, the greater the pF values, especially at a pressure of 0.33 bars.
In our research, the water retention capacity (WRC) was established in
laboratory conditions using pressure of 0.33 bars, and was expressed in mass
percentage. Its average values per horizons are shown in Table 3.
Tabela 3. Soil moisture retentions of Rendzina Calcaric Regosol
From the data presented in the Table 3, it can be seen that water retention
capacity has the highest percentage in the Amo horizon of 25.89% due to the
higher content of clay, colloid and organic matter, followed by the transitional
AC horizon with a similar value of 23.22% and in the substrate C of 19.51%.
In all horizons of the examined Rendzina Calcaric Regosol, high values
were obtained for moisture of wilting point. In the Amo horizon where the
highest retention of moisture was observed at a pressure of 15 bars, high average
value of physical clay fraction 46.60 % is shown.
The influence of mechanical and organic matter composition on the
retention of moisture in the surveyed Rendzina Calcaric Regosol best expresses
the high correlation between moisture retention at 0.33 (r=0.62) and 15.00 bars
(r=0.98) in relation with the content of clay and retention of 0.33 and 15 bars at
the silt fraction (r=0.75 and r=0.25) presented in Table 4. Similar values were
obtained by Žic (1976), Rajkai, et al. (1996) and Markoski, et al. (2009), who
found that soils with heavier mechanical composition have greater moisture
retention, where the correlation coefficient ranges from r=0.75 to r=0.77. High
correlation exists between the content of humus and retention moisture from 0.33
to 15 bars (r=0.83 and r=0.87).
In contrast, a high negative correlation is established between moisture
retention and the composition of coarse and fine sand. Markoski (2008) found a
positive correlation between physical clay content and moisture retention at
tensions of 0.33 and 15 bars (r=0.948; r=0.828), and the highest negative
correlation (r=-0971 i.e. r=-0.912) between the total sand content and moisture
retention at same tensions.
Hor.
N
0.33 bar 0.5 bar 1 bar 4 bar 6.25 bar 15 bar
Х S.D Х S.D X S.D Х S.D Х S.D Х S.D
Аpca
7
23.60 5.50 21.74 5.52 19.80 5.41 17.29 5.29 15.81 4.49 13.81 4.24
Amoca 25.89 7.00 24.74 6.54 22.35 6.11 19.55 6.41 17.35 5.22 15.71 5.08
ACca 23.22 6.62 21.95 6.80 19.64 6.29 16.57 5.97 14.63 5.18 12.65 4.66
Cca 19.51 6.77 18.12 6.57 15.94 5.74 12.80 5.43 10.95 4.75 9.22 4.32

The influence of soil texture and organic matter on the retention... 39
Table 4. Correlation between soil texture humus and soil moisture retention Fraction Soil moisture retention
0.33 0.5 1 4 6.26 15
Clay 0.62 0.74 0.86 0.99 0.99 0.98
Silt 0.75 0.71 0.56 0.13 0.19 0.25
Coarse sand -0.49 -0.84 -0.93 -0.99 -0.99 -0.99
Fine sand -0.60 -0.76 -0.87 -0.99 -0.99 -0.98
Humus 0.83 0.50 0.66 0.93 0.90 0.87
If tension of soil moisture is measured, and for each tension, content of
moisture is measured, expressed in volume percentage and the data obtained are
applied to the coordinate system for each horizon, retention curves will be
obtained. They reflect the ratio between attracting forces (tension) and the
amount of moisture in the soil.
The knowledge of the essence of the retention and retention curves of
Rendzina Calcaric Regosol is of great importance to the availability of water for
the plant and the movement of water in the soil. Matula et al. (2007) emphasize
that soil hydraulic characteristics, especially the soil water retention curve, are
essential for many agricultural, environmental, and engineering applications.
Their measurement is time-consuming and thus costly.
The data in the following graphs (1, 2, 3, 4, 5, 6 and 7) show lowering of
the retention curves, which is most significant at lower pressures. The influence
of mechanical composition on the retention of soil moisture can be seen from all
graphs, where there is a large retention in humus accumulative horizon due to the
amount of clay and humus compared to other horizons.
Graphic 1. Soil moisture retention curves (profile 1)
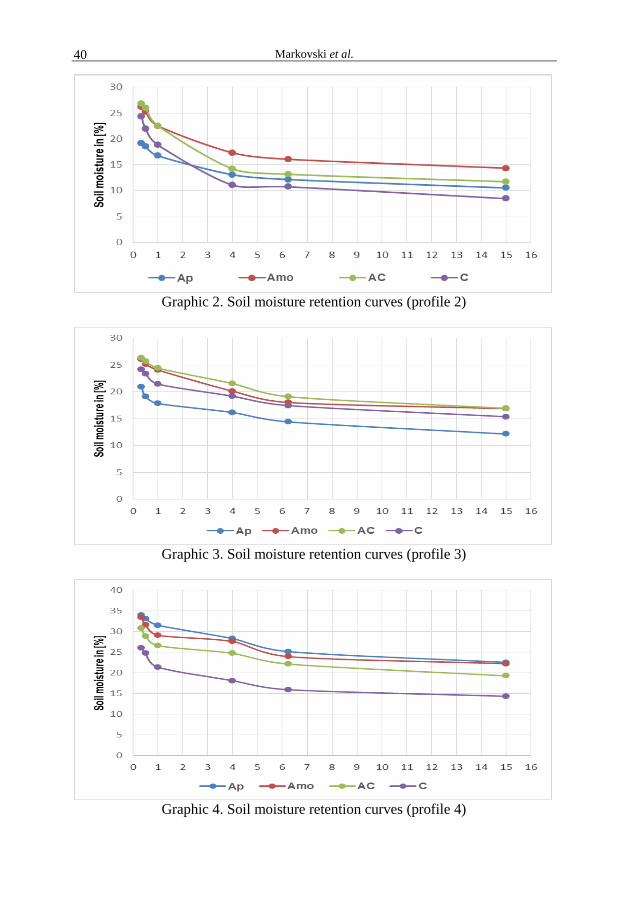
Markovski et al. 40
Graphic 2. Soil moisture retention curves (profile 2)
Graphic 3. Soil moisture retention curves (profile 3)
Graphic 4. Soil moisture retention curves (profile 4)

The influence of soil texture and organic matter on the retention... 41
Graphic 5. Soil moisture retention curves (profile 5)
Graphic 6. Soil moisture retention curves (profile 6)
Graphic 7. Soil moisture retention curves (profile 7)
Markovski et al. 42
The highest curve is the retention curve of the Amoca horizon due to the
high content of humus and physical clay.
It can also be noted that the retention curves in all the horizons, ranging
in tension from 2 to 15 tension bars, in almost all the cases are nearly horizontal
and show a small decline since the content of clay and silt is not large. According
to Filipovski (1996), the higher retention in Rendzinas can be explained by the
higher content of Montmorillonite and Allophanes and higher content of CaCO3
in the silt fraction. Filipovski et al (1980) give data on the retention curves of a
profile of a Rendzina in the region of Kocani, where lower values of moisture at
all applied pressures have been noted. The soil is characterized with lighter
mechanical composition. The highest retention is present in the Amo horizon, as
a result of the presence of organic matter and the influence of the mechanical
composition (clay and silt). Similar values of retention curves for two horizons A
and AC in rendzinas are presented by Wolińska, et al. (2010).
From the presented charts we can notice gradual changes in retention
forces with the change of moisture without oscillations. It tells us that the
distribution of soil moisture in various forms fails to find justification in the
retention curve, as the reduction of the amount of water has no large oscillations
at different tensions.
CONCLUSIONS
Based on the obtained results, the following conclusions can be drawn on
the impact of mechanical composition of soil and humus content on the retention
curves:
- The mechanical composition of the studied soils is characterized by
domination of fractions of physical clay (clay + silt) and clay in soil separates,
which strongly affect retention curves of soil moisture;
- In the humus accumulative Apca and Amoca horizon, the average content
of humus is the largest (2.1% and 1.36%) where we have the highest retention of
soil moisture;
- Moisture content that is retained at pressure of 0.33 bars is high in all
horizons. The highest retention of Amoca 25.89% (presence of clay, physical clay
and organic matter) is present in the Apca horizon, followed by the transitional
ACca and the substrate Cca;
- Values obtained for the wilting point (pressure of 15 bars) are high in all
horizons of rendzinas. This is due to the high content of physical clay and content
of CaCO3.
- Positive correlation has been established between the retention of
moisture at 0.33 and 15 bars and the content of clay, silt, humus, and high
negative correlation between retention of moisture at 0.33 and 15 bars.
REFERENCES Bogdanović, J. (1973): Usporedna ispitivanja metoda za određivanje vlažnosti venuća
kod različitih tipova tala. Zemljište i biljka, Vol 22, No 3.
The influence of soil texture and organic matter on the retention... 43
Coquet Y., Vachier P., and Labat C. (2005): Vertical variation of near-saturated hydraulic conductivity in three soil profiles. Geoderma, 126, p.p.181-191.
Džamić et.al. (1996): Prakticum iz agrohemije, Poljoprivredni fakultet, Beograd – Zemun. Dobrzañski, B.,Konecka-Betley, K., Ku Ÿnicki, F., and Turski, R. (1987): Polish
rendzinas (in Polish). Roczn. Nauk Roln., (D). 12, 5-208. Филиповски, Ѓ., Прадан, К.С. (1980): Карактеристики на ретенцијата на влага во
почвите на СР Македонија, МАНУ, Скопје. стр. 1-87. Филиповски, Ѓ. (1996): Почвите на Република Македонија. Том II. МАНУ. Скопје. FAO/UNESCO. (1997): Soil map of the world.Published by IRSC,Wageningen.p.p 1-
146. Heinonen, R. (1971): Soil management and crop water supply. Lantbruk - shögskolans
kompendienämnd. Hollis, J. M., Jones, R. J. A., Palmer, R. C. (1977): The effects of organic matter and
particle size on the water retention properties of some soil in the west Midland of England. Geoderma. 17. p. p. 225-238.
Hillel, D. (1980): Application of Soil Physics. Department of Plant and Soil Sciences. Massachusetts, Academic press.
Hillel, D. (1998): Environmental Soil Physics. Academic Press, San Diego-London-New York-Tokyo.
ICARDA International Center for Agricultural Research in the Dry Areas (2001). Soil and Plant Analysis Laboratory Manual. Second Edition. Edited by Ryan J., George Estefan and Abdul Rashid.
Jamison, V. C., Kroth E. M. (1958): Available moisture storage capacity in relation to textural composition and organic content of several Missouri soils. Soil Sciences. Am. Poc. 22. p.p. 189-192.
Kutilek, M., Nielsen, D. (1994): Soil Hydrology. GeoEcology. Catena Verlag, Cremlingen-Destedt, Germany.
Kalicka, M., Witkowska-Walczak, B., Sawiñski, C., Dêbicki, R. (2008): Impact of land use on water properties of rendzinas. International Agrophysics, 22, p.p. 333-338.
Livingston, N. J. (1993): Soil water potential. Soil sampling and methods of analysis. Canadian Society of Soil Sciences. p. p. 559-567.
Marinčić, J. (1971). Određivanje pF-vrijednosti I pF-Krivulja, Priručnik za ispitivanje zemljišta, Knjiga V, Metode istraživanja fizičkih svojstva zemljišta Resulović H. (redaktor),. JDPZ, Beograd, pp. 44-51.
Maclean, A. H., Yager, T. V. (1972): Available water capacities of Zambian soils in relation to pressureplate measurments and particle size analysis. Soil Scinces.113. p.p. 23-29.
Mitrikeski J., Mitkova T. (2013): Practicum in Pedology, Faculty of Agricultural Sciences and Food University of Ss Cyril and Methodius in Skopje 1 - 164.
Matula S., Mojrová M., Špongrová K. (2007): Estimation of the soil water retention curve (SWRC) using pedotransfer functions (PTFs). Soil & Water Res., 2 113-122.
Маркоски, М. (2008): Физички и физичко – механички својства на черноземите рапространети во Овче Поле. Магистерска работа. Факултет за земјоделски науки и храна, Скопје, стр. 1-64.
Markoski, M., Mitkova, T., Mitrikeski, J., Čukaliev, O., Tanasković, V. (2009): The influence of mechanical composition on the retention curves at soil moisture in the Chernozems. Soil and Plant. Beograd. 58(2): 119 – 127.
Markoski, M., Mitkova, T., Tanasković, V., Vasilevski, K., Nečkovski, S. 2013: The influence of mechanical composition and organic matter on the retention curves at soil moisture in the humic calcaric regosol. 1st International congress for soil-water-plants XIII Congress in soil sciences. p.p. 589-600.
Markoski, M., Mitkova, T., Vasilevski, K., Tomić, Z., Andreevski, M., Tanaskovik, V. (2015): Mechanical composition of the soils formed on limestones and dolomites in the Republic of Macedonia. CONTRIBUTIONS, Section of Natural, Mathematical and Biotechnical Sciences, MASA, 36(1): 43–50.
Markovski et al. 44
Markoski, M., Mitkova, T., Tanaskovik, V., Spalevic, V., Zgorelec, Z. (2016): The influence of the parent material on the texture and water retention curves in the soil formed upon limestones and dolomites. Agriculture and Forestry, 62 (4): 175-192. DOI: 10.17707/AgricultForest.62.4.20.
Pranagal, J., J. Lipiec, and H. Domzal. (2005): Changes in pore size distribution and aggregate stability of two soils under long term tillage systems. IntI. Agrophysics 19: 165-174.
Richards, L.A. (1982): Soil water and planth grow. Soil pyisical conditions, New York. Rajkai, K., Kabos, S., Genuchten, M., Jansson, P. (1996): Estimation of water-retention
characteristics from bulk density and particle-size distribution of swedish soils. Soil Science, Vol 161, No. 12.
Shaykewich, C. F. Zwarich, M. A. (1968): Relationships between soil physical constants and soil physical components of some Manitoba soils. Can. J. Soil Sciences. 48: 199-204.
Townend, J., Malcolm, J. R., Carter, A. (2001). Water Release Characteristic. Soil and Environmental Analysis. Physical methods. Second edition, revised and expanded. Edited by Keith A. Smith and Chris E. Mullins. Marcel Dekker.
Vučić, N. (1987): Vodni, vazdušni i toplotni režim zemljišta, VANU. Matica srpska. Novi Sad, str. 1 - 320.
Witkowska-Walczak B., Walczak, R.T., and Sławiñski C. (2000): Water retention of Polish rendzinas (in Polish). Acta Agrophysica, 38: 247-258.
Wolińska, A., Bennicelli., R. P. (2010): Dehydrogenase Activity Response to Soil Reoxidation Process Described as Varied Conditions of Water Potential, Air Porosity and Oxygen Availability. Polish J. of Environ. Stud. 19 (3): 651-657.
Žic, M. (1976): Neke metode određivanja vodnih osobina tla i njihova ovisnost o drugim fizikalnim svojstvima. Poljoprivredna znanstvena smotra, 37 (47): 107-114.
Škorić, A. (1991): Sastav i svojstva tla. Udžbenik, Fakultet poljoprivrednih znanosti Sveučilišta u Zagrebu.
Agriculture & Forestry, Vol. 66 Issue 2: 45-50, 2020, Podgorica 45
Lense, G. H. E., Moreira, R. S., Bócoli, F. A., Parreiras, T. C., Teodoro, A. E. de M., Spalević, V., Mincato, R. L.
(2020): Soil organic matter loss by water erosion in a coffee organic farm. Agriculture and Forestry, 66 (2): 45-
50.
DOI: 10.17707/AgricultForest.66.2.04
Guilherme Henrique Expedito LENSE1, Rodrigo Santos MOREIRA
1,
Fernanda Almeida BÓCOLI2, Taya Cristo PARREIRAS
1, Alexandre Elias de
Miranda TEODORO1, Velibor SPALEVIC
3, Ronaldo Luiz MINCATO
1
SOIL ORGANIC MATTER LOSS
BY WATER EROSION IN A COFFEE ORGANIC FARM
SUMMARY
In tropical regions, water erosion is the process responsible for the
redistribution and the loss of soil organic matter (SOM). Modelling can provide a
diagnosis of the dynamics of SOM in agricultural production systems, and assist
the proposing of conservationist measures. Therefore, this work aimed to estimate
SOM losses due to water erosion in an agricultural production system, through
the use of modelling techniques. The study area corresponding to the Santo André
Farm, located in south-eastern Brazil.
The area of the farm is around 75 ha, and the main agricultural product is
coffee (78%). The modelling was performed based on the SOM content of the
area, and the estimated soil losses, according to the Revised Universal Soil Loss
Equation.
To the SOM determination, soil samples were collected at 20 points,
distributed over the area, in the surface layer (0-20 cm), in March 2018.
The parameter acquiring and the data analysis were performed using
remote sensing techniques and a Geographic Information System, which was also
used to interpolate the SOM content, through the use of the ordinary kriging. The
organic matter content on the farm ranged from 1.20 to 2.46%, while the average
soil loss was 25.70 Mg ha-1
year-1
, with higher erosion rates in steepest sites. The
estimated loss of total organic matter at 31.87 Mg year-1
, with an average of 0.42
Mg ha-1
year-1
. The observed results reveal the need to implement conservationist
management measures to reduce soil losses, and the consequent SOM losses.
1Ronaldo Luiz Mincato (corresponding author: [email protected]), Guilherme
Henrique Expedito Lense, Rodrigo Santos Moreira, Taya Cristo Parreiras, Alexandre Elias de
Miranda Teodoro, Universidade Federal de Alfenas - UNIFAL-MG, Alfenas, Minas Gerais,
BRAZIL. 2Fernanda Almeida Bócoli, Universidade Federal de Lavras – UFLA, Lavras, Minas Gerais,
BRAZIL. 3Velibor Spalević, University of Montenegro, Faculty of Philosophy, Geography, Niksic,
MONTENEGRO.
Paper presented at the GEA (Geo Eco-Eco Agro) International Conference 2020, Podgorica.
Notes: The authors declare that they have no conflicts of interest. Authorship Form signed online.
Received:17/04/2020 Accepted:25/05/2020

Lense et al. 46
Keywords: Soil conservation, Soil losses, RUSLE, Agricultural
sustainability, Kriging
INTRODUCTION
Soil organic matter (SOM) improves the structure and fertility of the soil
and, consequently, increases agricultural productivity. Moreover, changes in
SOM contents result in a significant variation in soil carbon stock and can affect
the CO2 atmospheric concentration (Lal, 2004; 2006).
Soil erosion by water is considered as a serious environmental threat
(Spalevic, 2011; Spalevic et al. 2012; Nikolic et al. 2019; Chalise et al., 2019;
Khaledi Darvishan et al., 2019; Ouallali et al., 2020). Water erosion can
breakdown the soil structure and expose the SOM to the climatic conditions and
the attack of microbial enzymes (Hancock et al., 2019; Lal, 2019). For this
reason, it is an important process responsible for the carbon losses, especially in
tropical and subtropical soils, due to the rainfall and temperature conditions.
In this context, the assessment of SOM dynamics in agricultural production
systems is necessary to propose conservationist practices capable of mitigating
the carbon losses by water erosion and, consequently, decrease the greenhouse
gas emissions from agricultural soils.
Water erosion modeling can be used to simulate the erosion process and to
measure the SOM losses based on factors such as climate, relief, physical
characteristics of the soil, and vegetation cover with the advantages of being a
simple and inexpensive method. Modeling reduces the limitations found in the
direct quantification of water erosion and SOM loss, which is an expensive
process that requires field experiments with continuous long-term data collections
(Starr et al., 2000; Barros et al., 2018).
Based on this information, the objective of this work was to estimate the
soil organic matter loss by water erosion in a coffee agricultural production
system.
MATERIAL AND METHODS The prevailing odour from an established production unit was detected
from Study area. The study area was located at Santo André Farm in the
Municipality of Divisa Nova, south of Minas Gerais, at coordinates UTM 377066
at 378515 m O and 7621721 at 7622954 m S, zone 23K, Datum SIRGAS 2000
(Figure 1).
The farm has an area of 75 ha, predominantly cultivated with coffee
(78%), followed by pasture (12%), access roads (6%), drainage (2%), and
facilities (2%). Coffee is grown under organic cultivation system, with
conservationist practices, such as the management of spontaneous vegetation
between the coffee tree rows and level planting. The land use map was prepared
using ArcMap 10.5 software (ESRI, 2015), based on high-resolution images from
the Basemap tool (ESRI, 2015) and field surveys. The soil was classified as
Ferralsol (WRB, 2015) and the climate according to the Köppen classification as
Tropical Mesothermal (Cwb), with annual precipitation of 1500 mm and an
average temperature around 22°C (Alvares et al., 2013).
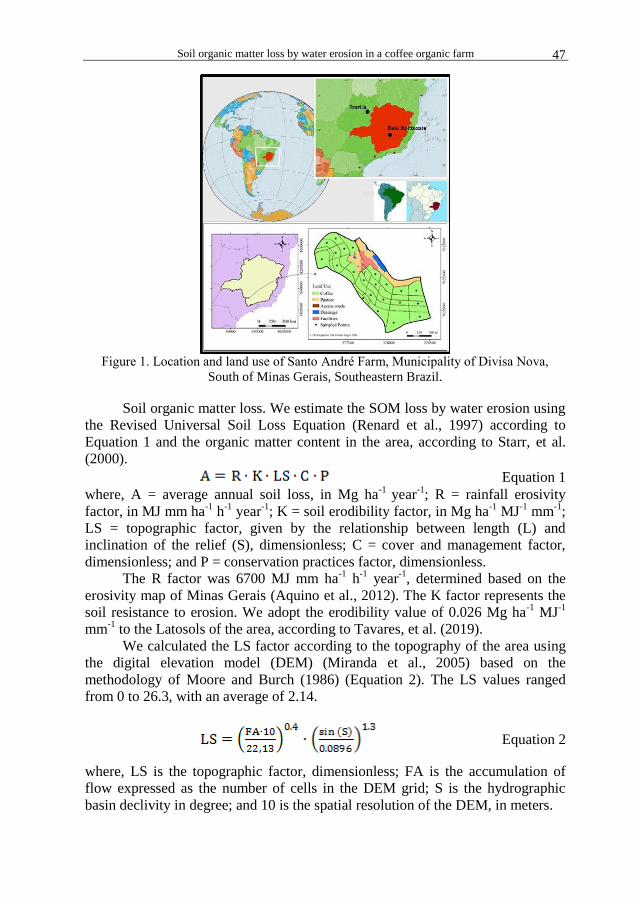
Soil organic matter loss by water erosion in a coffee organic farm 47
Figure 1. Location and land use of Santo André Farm, Municipality of Divisa Nova,
South of Minas Gerais, Southeastern Brazil.
Soil organic matter loss. We estimate the SOM loss by water erosion using
the Revised Universal Soil Loss Equation (Renard et al., 1997) according to
Equation 1 and the organic matter content in the area, according to Starr, et al.
(2000).
Equation 1
where, A = average annual soil loss, in Mg ha-1
year-1
; R = rainfall erosivity
factor, in MJ mm ha-1
h-1
year-1
; K = soil erodibility factor, in Mg ha-1
MJ-1
mm-1
;
LS = topographic factor, given by the relationship between length (L) and
inclination of the relief (S), dimensionless; C = cover and management factor,
dimensionless; and P = conservation practices factor, dimensionless.
The R factor was 6700 MJ mm ha-1
h-1
year-1
, determined based on the
erosivity map of Minas Gerais (Aquino et al., 2012). The K factor represents the
soil resistance to erosion. We adopt the erodibility value of 0.026 Mg ha-1
MJ-1
mm-1
to the Latosols of the area, according to Tavares, et al. (2019).
We calculated the LS factor according to the topography of the area using
the digital elevation model (DEM) (Miranda et al., 2005) based on the
methodology of Moore and Burch (1986) (Equation 2). The LS values ranged
from 0 to 26.3, with an average of 2.14.
Equation 2
where, LS is the topographic factor, dimensionless; FA is the accumulation of
flow expressed as the number of cells in the DEM grid; S is the hydrographic
basin declivity in degree; and 10 is the spatial resolution of the DEM, in meters.

Lense et al. 48
The average C factor was 0.17, indicating good vegetation cover. This
parameter ranges from 0 to 1 according to the vegetation cover of the area, with
higher values associated with sites with low vegetation density. The C factor was
determined using the Durigon, et al. (2014), which is based on the normalized
difference vegetation index (NDVI) (Equation 3).
Equation 3
where Cr = soil covered factor e NDVI = normalized difference vegetation index,
both dimensionless.
NDVI is a widely used indicator of vegetation vigor. This index ranges
from -1 to +1, where the closer the value is to +1 the higher the plant density. The
index was calculated according to Tucker (1979); using images from the Landsat-
8 Operational Land Imager (OLI) satellite, bands 4 and 5, orbit/point 219/75,
obtained from the Image Generation Division (INPE, 2019).
Finally, the P factor, which represents the influence of management
practices on the erosion process, ranges from 0 to 1. Due to the conservationist
practices, we adopted a value of 0.5.
To determine soil organic matter (SOM) contents, we collected soil from
the superficial layer (0-20 cm) in 20 points distributed in the subbasin (Figure
1A), and both SOM and soil density (Ds) were estimated according to Embrapa
(2017). The collection of the samples was carried out in March 2018. The SOM
contents were interpolated by the ordinary kriging method using the
Geostatistical Analyst tool from the ArcMap 10.5 software (ESRI, 2015).
RESULTS AND DISCUSSION
The soil organic matter showed spatial dependence in the area, with the
exponential model fitted, generating an R2 of 0.92. The SOM contents ranged
from 1.20 to 2.46%, with higher levels founded mainly in coffee (Figure 1B). The
management of spontaneous vegetation and organic fertilization may have been
the reason for the high SOM content in areas with coffee cultivation.
The average soil loss was quantified at 25.70 Mg ha-1
year-1
, with higher
water erosion intensity in slope areas, and sites with low plant density (Figure
2A). The average soil loss is considered high for the study conditions (> 15.00
Mg ha-1
year-1
), according to Avanzi, et al. (2013), indicating the necessity for a
comprehensive management plan seeking to reduce erosion rates at Santo André
Farm. It is worth mentioning that, in the short term, areas with higher levels of
erosion (Figure 1A) should be prioritized to the adoption of mitigation measures.
The total SOM loss was 31.87 Mg year-1
, with an average of 0.42 Mg ha-1
year-1
. As expected, the highest rates of SOM loss occurred in areas with severe
erosion (Figure 2C). Considering that coffee is cultivated in an organic system,
any SOM loss results in several damages to the soil and causes additional costs to
the producer by replacing the nutrients and organic matter lost contents, seeking
to guarantee a satisfactory soil fertility level.
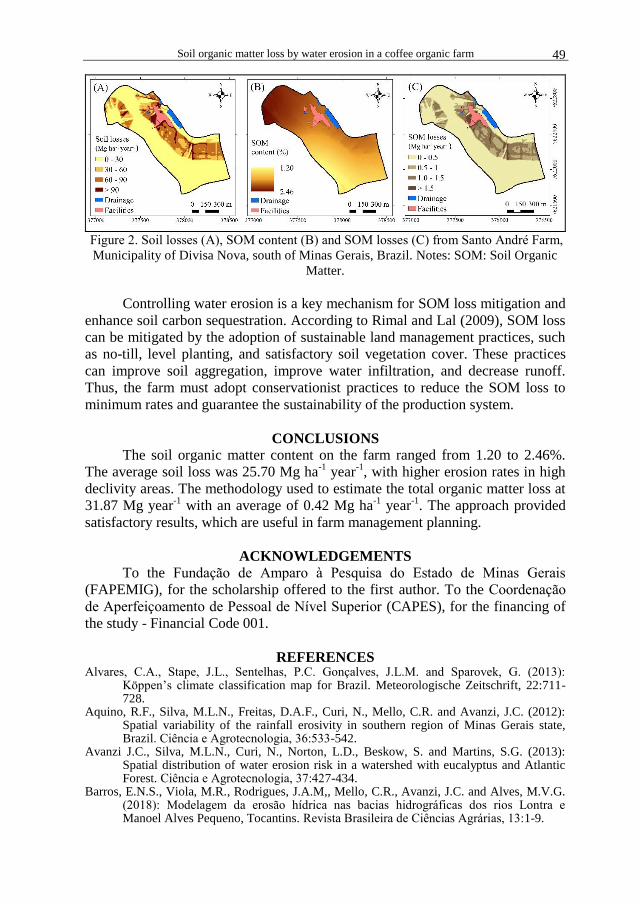
Soil organic matter loss by water erosion in a coffee organic farm 49
Figure 2. Soil losses (A), SOM content (B) and SOM losses (C) from Santo André Farm,
Municipality of Divisa Nova, south of Minas Gerais, Brazil. Notes: SOM: Soil Organic
Matter.
Controlling water erosion is a key mechanism for SOM loss mitigation and
enhance soil carbon sequestration. According to Rimal and Lal (2009), SOM loss
can be mitigated by the adoption of sustainable land management practices, such
as no-till, level planting, and satisfactory soil vegetation cover. These practices
can improve soil aggregation, improve water infiltration, and decrease runoff.
Thus, the farm must adopt conservationist practices to reduce the SOM loss to
minimum rates and guarantee the sustainability of the production system.
CONCLUSIONS
The soil organic matter content on the farm ranged from 1.20 to 2.46%.
The average soil loss was 25.70 Mg ha-1
year-1
, with higher erosion rates in high
declivity areas. The methodology used to estimate the total organic matter loss at
31.87 Mg year-1
with an average of 0.42 Mg ha-1
year-1
. The approach provided
satisfactory results, which are useful in farm management planning.
ACKNOWLEDGEMENTS
To the Fundação de Amparo à Pesquisa do Estado de Minas Gerais
(FAPEMIG), for the scholarship offered to the first author. To the Coordenação
de Aperfeiçoamento de Pessoal de Nível Superior (CAPES), for the financing of
the study - Financial Code 001.
REFERENCES Alvares, C.A., Stape, J.L., Sentelhas, P.C. Gonçalves, J.L.M. and Sparovek, G. (2013):
Köppen’s climate classification map for Brazil. Meteorologische Zeitschrift, 22:711-728.
Aquino, R.F., Silva, M.L.N., Freitas, D.A.F., Curi, N., Mello, C.R. and Avanzi, J.C. (2012): Spatial variability of the rainfall erosivity in southern region of Minas Gerais state, Brazil. Ciência e Agrotecnologia, 36:533-542.
Avanzi J.C., Silva, M.L.N., Curi, N., Norton, L.D., Beskow, S. and Martins, S.G. (2013): Spatial distribution of water erosion risk in a watershed with eucalyptus and Atlantic Forest. Ciência e Agrotecnologia, 37:427-434.
Barros, E.N.S., Viola, M.R., Rodrigues, J.A.M,, Mello, C.R., Avanzi, J.C. and Alves, M.V.G. (2018): Modelagem da erosão hídrica nas bacias hidrográficas dos rios Lontra e Manoel Alves Pequeno, Tocantins. Revista Brasileira de Ciências Agrárias, 13:1-9.
Lense et al. 50
Chalise, D.; Kumar, L.; Spalevic, V.; Skataric, G. (2019): Estimation of Sediment Yield and Maximum Outflow Using the IntErO Model in the Sarada River Basin of Nepal. Water 2019, 11, 952. doi:10.3390/w11050952
Durigon, V.L., Carvalho, D.F., Antunes, M.A.H., Oliveira, P.T.S. and Fernandes, M.M. (2014): NDVI time series for monitoring RUSLE cover management factor in a tropical watershed. International Journal of Remote Sensing, 35:441-453.
Embrapa (2017): Manual de métodos de análise do solo. Empresa Brasileira de Pesquisa Agropecuária. 3. ed. rev. Brasília, Embrapa.
ESRI (2015): ARCGIS Professional GIS for the desktop version 10.3. Environmental Systems Research Institute. Redlands, Califórnia, EUA, Software.
Hancock, G.R., Kunkel, T., Wells, T. and Martinez, C. (2019): Soil organic carbon and soil erosion - Understanding change at the large catchment scale. Geoderma, 343:60-71.
INPE (2019): Divisão de Geração de Imagens (DIDGI). Instituto Nacional de Pesquisas Espaciais, Ministério da Ciência, Tecnologia, Inovações e Comunicações. (also available at www.dgi.inpe.br/catalogo/).
Khaledi Darvishan, A., Mohammadi, M., Skataric, G., Popovic, S., Behzadfar, M., Rodolfo
Ribeiro Sakuno, N., Luiz Mincato, R., Spalevic, V. (2019): Assessment of soil erosion,
sediment yield and maximum outflow, using IntErO model (Case study: S8-IntA
Shirindarreh Watershed, Iran). Agriculture and Forestry, 65 (4), 203-210 Lal, R. (2004): Soil carbon sequestration to mitigate climate change. Geoderma, 123:1-22. Lal, R. (2006): Enhancing crop yields in the developing countries through restoration of the
soil organic carbon pool in agricultural lands. Land Degradation & Development, 17:197-209.
Lal, R. (2019): Accelerated Soil erosion as a source of atmospheric CO2. Soil Tillage Research, 188:35-40.
Miranda, E.E. (2005): Brasil em Relevo. Campinas: Embrapa Monitoramento por Satélite. Moore, I.D., Burch, G.J. (1986): Physical basis of the length slope factor in the Universal Soil
Loss Equation. Soil Science Society of America, 50:1294-1298. Nikolic, G., Spalevic, V., Curovic, M., Khaledi Darvishan, A., Skataric, G., Pajic, M., Kavian,
A., & Tanaskovik, V. (2019): Variability of Soil Erosion Intensity Due to Vegetation Cover Changes: case Study of Orahovacka Rijeka, Montenegro. Notulae Botanicae Horti Agrobotanici Cluj-Napoca, 47 (1), 237–248. doi:10.15835/nbha47111310
Ouallali, A., Aassoumi, H., Moukhchane, M., Moumou, A., Houssni, M., Spalevic, V., & Keesstra, S. (2020): Sediment mobilization study on Cretaceous, Tertiary and Quaternary lithological formations of an external Rif catchment, Morocco. Hydrological Sciences Journal. doi:10.1080/02626667.2020.1755435
Renard, K.G., Foster, G.R., Weesier, G.A., Mccool, D.K., Yoder, D.C. (1997): Predicting soil erosion by water: a guide to conservation planning with the Revised Universal Soil Loss Equation (RUSLE). Washington, United States Department of Agriculture.
Rimal, B.K., Lal, R. (2009): Soil and carbon losses from five different land management areas under simulated rainfall. Soil and Tillage Research, 106:62-70.
Spalevic, V., (2011): Impact of land use on runoff and soil erosion in Polimlje. Doctoral thesis. Faculty of Agriculture of the University of Belgrade, Serbia, p. 1-260.
Spalevic, V., Curovic, M., Borota, D., Fustic, B. (2012): Soil erosion in the river basin Zeljeznica, area of Bar, Montenegro.Agriculture and Forestry, 54(1–4), 5–24
Starr, G.C., Lal, R., Malone, R., Hothem, D., Owens, L., Kimble, J. (2000). Modeling soil carbon transported by water erosion processes. Land degradation & Development, 11:83-91.
Tavares, A.S., Spalevic, V., Avanzi, J.C., Nogueira, D.A., Silva, M.L.N., Mincato, R.L. (2019): Modeling of water erosion by the erosion potential method in a pilot subbasin in southern Minas Gerais. Semina-Ciências Agrárias, 40:555-572.
Tucker, C.J. (1979): Red e Photographic infravermelho l, combinações próximas para monitorar a vegetação. Sensoriamento Remoto do Meio Ambiente, 8:127-150.
WRB (2015): International soil classification system for naming soils and creating legends for soil maps. World reference base for soil resources, Update. Rome, Food and Agriculture Organization of the United Nations. 203p.
Agriculture & Forestry, Vol. 66 Issue 2: 51-56, 2020, Podgorica 51
Komnenić, A., Jovović, Z., Velimirović, A. (2020): Impact of different organic fertilizers on lavender
productivity (Lavandula officinalis Chaix). Agriculture and Forestry, 66 (2): 51-56.
DOI: 10.17707/AgricultForest.66.2.05
Andreja KOMNENIĆ, Zoran JOVOVIĆ, Ana VELIMIROVIĆ 1
IMPACT OF DIFFERENT ORGANIC FERTILIZERS ON LAVENDER
PRODUCTIVITY (Lavandula officinalis Chaix)
SUMMARY
The impact of four organic fertilizers (Chap liquid, Guano, Slavol and
Vermicompost) on the productivity of lavender was carried out at the organic
lavender plantation "Sunny Valley" in Danilovgrad during 2019. Non-fertilized
control variant was included in the experiment. The efficiency of the nutrition
systems applied is monitored through the most important productivity parameters
of lavender: plant height, number of flower shoots and herb yield.
The highest average height of the lavender plant was measured on variants
using Slavol (59.5 cm), Shap liquid (58.8 cm) and Vermicompost (58.0 cm),
while the lowest plants were measured on the control variant (49.8 cm). All
fertilizer variants applied had a significant effect on increasing the height of the
lavender plant.
The largest number of flower shoots was measured in variants fertilized
with Vermicompost - 444.5 and Slavol - 405.8, while the smallest number was
determined on the control variant - 292. Differences in the number of flower
shoots between all studied organic fertilizers and controls were statistically
justified.
All fertilizer variants resulted in a significant increase in the herb yield of
lavender. The highest yield of the herb was achieved by applying the organic
fertilizer Slavol - 337.3 g. This variant showed a significant increase in herb
weight compared to the control - 225.3 g, but also to the variant fertilized with
Chap liquid - 284.8 g.
Keywords: lavender, organic fertilizer, productivity.
INTRODUCTION
Lavender (Lavandula officinalis Chaix) is an evergreen perennial shrub
that has long been used in traditional medicine, cosmetics and the food industry
(Biswas et al., 2009). Lavender is grown for its fresh flowers or inflorescences,
from which essential oil is obtained by distillation. The main ingredients of
1Andreja Komnenić (corresponding author: [email protected]), Zoran Jovović, Ana
Velimirović, University of Montenegro, Biotehnical faculty, Mihaila Lalića 1, 81000, Podgorica,
MONTENEGRO.
Paper presented at the GEA (Geo Eco-Eco Agro) International Conference 2020, Podgorica.
Notes: The authors declare that they have no conflicts of interest. Authorship Form signed online.
Received:25/04/2020 Accepted:15/06/2020
Komnenić et al. 52
lavender oil are linalyl acetate (25-46%) and linalool (20-45%). Due to its high
terpenes content, lavender essential oil has sedative, carminative, antiseptic,
analgesic and antimicrobial properties (Biesiada et al., 2008). Lavender is an
important part of the essential oil industry. Thanks to great technological and
industrial advances, lavender is increasingly being used in other industries. As a
regular ingredient in a large number of personal care products, its share is
increasing in the global herbal market. Due to increased global demand, lavender
has been increasingly grown in plantations lately (Touati et al., 2011). The annual
production of lavender oil in the world is about 200 tons (Curtis, 2005). Apart
from its commercial importance, its aesthetic value is also gaining in importance.
Although Montenegro has a long tradition of growing lavender, it has been
introduced into the culture recently. The current area under lavender is only a few
hectares, but due to its growing popularity in the coming period, a more
significant growth of areas should be expected. In the coastal areas of
Montenegro, lavender is an indispensable part of urban decorative flora (Stešević
et al., 2014).
Appropriate cultivation methods are necessary for the successful
production of lavender, which include optimal mineral nutrition systems (Klados
and Tzortzakis, 2014). Since the number of literature data on lavender production
and the effect of fertilization on antioxidant properties, composition and yield of
essential oil are rather scarce, it is not surprising that there is a growing demand
for such information.
Lavender does not have excessive requirements for nutrients, so it grows
well on the types of soil where the cultivation of most other crops is not
profitable. However, for obtaining high yields of herb and satisfactory quality of
essential oil, fertilization is one of the most important agrotechnical measures.
The synthesis of essential oil depends on the type of fertilizer and the applied
dose. Of all the essential nutrients, nitrogen, phosphorous, and potassium have the
greatest impact on lavender growth and essential oil synthesis. Lavender has the
highest requirements for nitrogen, while the needs for phosphorus and potassium
are small, and vary depending on the type of soil and nutritional status. However,
it should be borne in mind that increased amounts of nitrogen negatively affect
the production of essential oil, so precausation is essential in nitrogen application.
These elements have a very positive effect on the function and level of enzymes
involved in terpene biosynthesis (Hafsi et al., 2014).
Increased global demand has also conditioned increased demands for raw
lavender from organic production. For these reasons, this experiment was
performed to study the influence of different organic fertilizers on some
important parameters of lavender productivity.
MATERIAL AND METHODS The study of the impact of various organic fertilizers on the productivity of
lavender was performed in 2019 in the organic lavender plantation "Sun Valley"

Impact of different organic fertilizers on lavender productivity (Lavandula officinalis Chaix) 53
in the vicinity of Danilovgrad. Lavender was planted at a distance of 1.5x0.5 m,
providing density of 13,300 plants/ha.
The experiment was performed in a randomized block system in 4
replications, and the size of the experimental plot was 7.5 m2. In the experiment,
4 organic fertilizers were studied: Chap liquid (Ch), Guano (G), Slavol (S) and
Vermicompost (apple pulp 60% and beef manure 40%) (V). Fertilization was
done twice during the lavender growing season. The first time on March 27, at
the beginning of the lavender growing season, and the second, 15 days after the
first - April 10. A non-fertilized control variant (K) was also included in the
experiment. Fertilization was performed by watering the plants with 200 ml of
water solution of fertilizers in the following concentrations: Chap liquid - 150 ml
of fertilizer in 10 l of water, Guano - 150 g of fertilizer in 10 l of water, Slavol -
150 ml of fertilizer in 10 l of water and Vermicompost - 1 kg fertilizer in 10
litters of water. Basic data on applied fertilizers are given in Table 1.
Table 1. Basic characteristics of the studied fertilizers
Fertilizer
Chemical composition
Organic
matter
content in
dry
matter
(%)
Total
Nitrogen
%
P2O5
(%)
K2O
(%)
Ca
(%)
Mg
(%)
pH
Chap liquid
(Ch)
70,5 3,62 0,95 4,67 0,75 0,40 7,5
Guano
(G)
21-26 3-5 9-12 1-2 23-28 0,5-1 6,5-7,5
Slavol
(S)
Slavol is a liquid microbiological fertilizer growth stimulator,
certified for use in organic and conventional agricultural production.
It contains microorganisms that produce auxins (indole 3 acetic acid)
during the fermentation process. It contains nitrogen fixator and
phosphomineralizators.
Vermicompost
(V)
(Apple pulp
60% and beef
manure 40%)
Vermicompost is an organic fertilizer that is obtained from manure,
biological and communal waste and compost with the help of
California worms. It contains a higher concentration of micro and
macro biogenic elements than the substrate. Composition: organic
matter 62, 3%, P2O5 0, 89%, K2O 0, 5%, Ca 4, 40% and Mg 1, 09%.
Ph of Vermicompost is 6, 8.
The efficiency of the studied fertilizers was monitored through the
following parameters: plant height, number of flower shoots and herb yield. The
measurement of these parameters was performed on the day of harvest - June 15.
The soil in the experimental field belongs to the type of rendzina. It is low
acidic (pH in water is 6.72, and in nKCl 5.77) and insufficiently supplied with
plant nutrients (P2O5 3.5 mg/100 grams of soil and K2O 11.3 mg/100 grams of
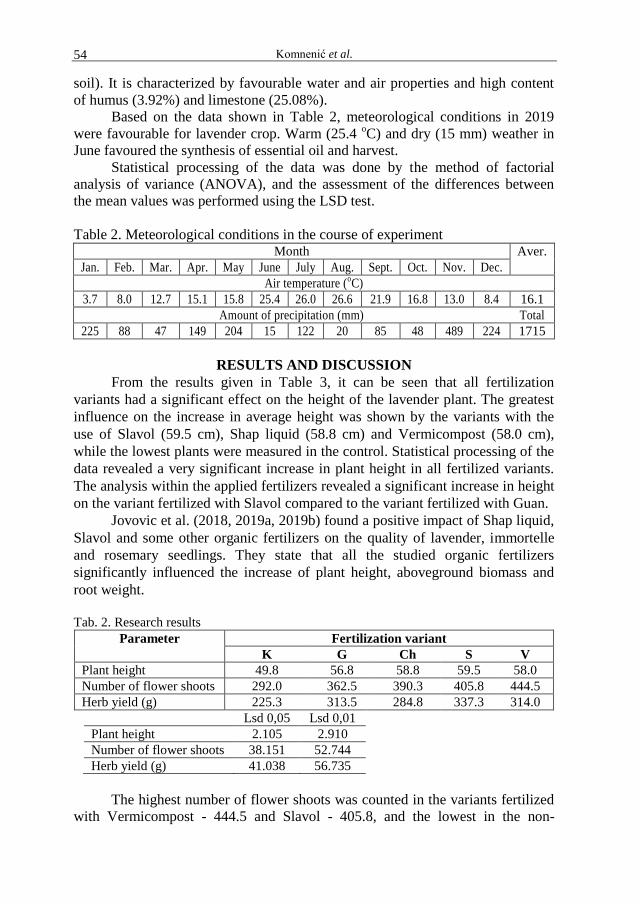
Komnenić et al. 54
soil). It is characterized by favourable water and air properties and high content
of humus (3.92%) and limestone (25.08%).
Based on the data shown in Table 2, meteorological conditions in 2019
were favourable for lavender crop. Warm (25.4 oC) and dry (15 mm) weather in
June favoured the synthesis of essential oil and harvest.
Statistical processing of the data was done by the method of factorial
analysis of variance (ANOVA), and the assessment of the differences between
the mean values was performed using the LSD test.
Table 2. Meteorological conditions in the course of experiment Month Aver.
Jan. Feb. Mar. Apr. May June July Aug. Sept. Oct. Nov. Dec.
Air temperature (oC)
3.7 8.0 12.7 15.1 15.8 25.4 26.0 26.6 21.9 16.8 13.0 8.4 16.1
Amount of precipitation (mm) Total
225 88 47 149 204 15 122 20 85 48 489 224 1715
RESULTS AND DISCUSSION
From the results given in Table 3, it can be seen that all fertilization
variants had a significant effect on the height of the lavender plant. The greatest
influence on the increase in average height was shown by the variants with the
use of Slavol (59.5 cm), Shap liquid (58.8 cm) and Vermicompost (58.0 cm),
while the lowest plants were measured in the control. Statistical processing of the
data revealed a very significant increase in plant height in all fertilized variants.
The analysis within the applied fertilizers revealed a significant increase in height
on the variant fertilized with Slavol compared to the variant fertilized with Guan.
Jovovic et al. (2018, 2019a, 2019b) found a positive impact of Shap liquid,
Slavol and some other organic fertilizers on the quality of lavender, immortelle
and rosemary seedlings. They state that all the studied organic fertilizers
significantly influenced the increase of plant height, aboveground biomass and
root weight. Tab. 2. Research results
Parameter Fertilization variant
K G Ch S V
Plant height 49.8 56.8 58.8 59.5 58.0
Number of flower shoots 292.0 362.5 390.3 405.8 444.5
Herb yield (g) 225.3 313.5 284.8 337.3 314.0
Lsd 0,05 Lsd 0,01
Plant height 2.105 2.910
Number of flower shoots 38.151 52.744
Herb yield (g) 41.038 56.735
The highest number of flower shoots was counted in the variants fertilized
with Vermicompost - 444.5 and Slavol - 405.8, and the lowest in the non-
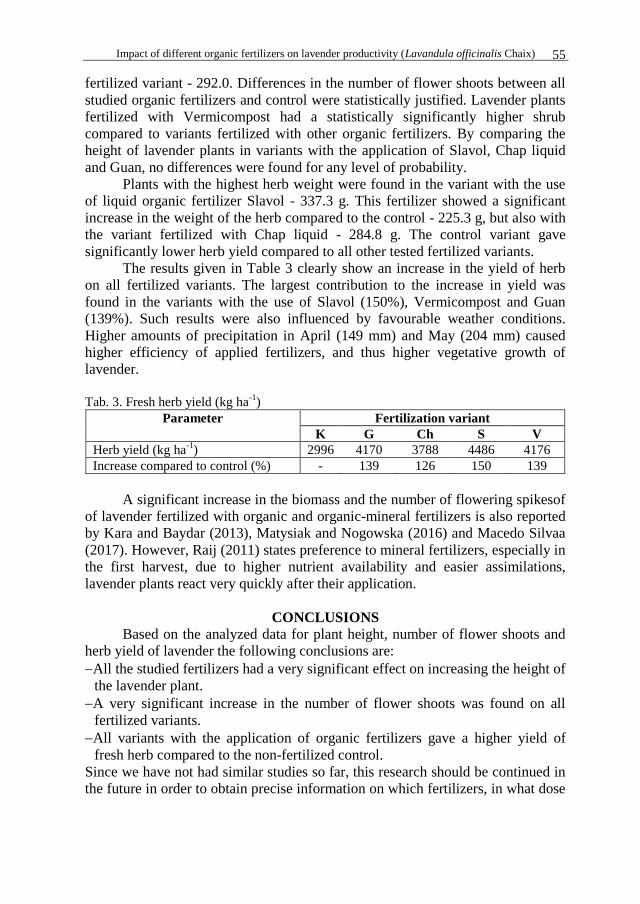
Impact of different organic fertilizers on lavender productivity (Lavandula officinalis Chaix) 55
fertilized variant - 292.0. Differences in the number of flower shoots between all
studied organic fertilizers and control were statistically justified. Lavender plants
fertilized with Vermicompost had a statistically significantly higher shrub
compared to variants fertilized with other organic fertilizers. By comparing the
height of lavender plants in variants with the application of Slavol, Chap liquid
and Guan, no differences were found for any level of probability.
Plants with the highest herb weight were found in the variant with the use
of liquid organic fertilizer Slavol - 337.3 g. This fertilizer showed a significant
increase in the weight of the herb compared to the control - 225.3 g, but also with
the variant fertilized with Chap liquid - 284.8 g. The control variant gave
significantly lower herb yield compared to all other tested fertilized variants.
The results given in Table 3 clearly show an increase in the yield of herb
on all fertilized variants. The largest contribution to the increase in yield was
found in the variants with the use of Slavol (150%), Vermicompost and Guan
(139%). Such results were also influenced by favourable weather conditions.
Higher amounts of precipitation in April (149 mm) and May (204 mm) caused
higher efficiency of applied fertilizers, and thus higher vegetative growth of
lavender.
Tab. 3. Fresh herb yield (kg ha
-1)
Parameter Fertilization variant
K G Ch S V
Herb yield (kg ha-1
) 2996 4170 3788 4486 4176
Increase compared to control (%) - 139 126 150 139
A significant increase in the biomass and the number of flowering spikesof
of lavender fertilized with organic and organic-mineral fertilizers is also reported
by Kara and Baydar (2013), Matysiak and Nogowska (2016) and Macedo Silvaa
(2017). However, Raij (2011) states preference to mineral fertilizers, especially in
the first harvest, due to higher nutrient availability and easier assimilations,
lavender plants react very quickly after their application.
CONCLUSIONS
Based on the analyzed data for plant height, number of flower shoots and
herb yield of lavender the following conclusions are:
All the studied fertilizers had a very significant effect on increasing the height of
the lavender plant.
A very significant increase in the number of flower shoots was found on all
fertilized variants.
All variants with the application of organic fertilizers gave a higher yield of
fresh herb compared to the non-fertilized control.
Since we have not had similar studies so far, this research should be continued in
the future in order to obtain precise information on which fertilizers, in what dose
Komnenić et al. 56
and with how many treatments the lavender crop should be fertilized in this and
climatically similar areas.
REFERENCES Biesiada, A., Sokol-Letowska, A., Kucharska, A. (2008). The effect of nitrogen
fertilization on yielding and antioxidant activity of lavender (Lavandula angustifolia Mill.). Acta Sci. Pol. 7, 33-40.
Biswas, K.K., Foster, A.J., Aung, T., Mahmoud, S.S. (2009). Essential oil production: relationship with abundance of glandular trichomes in aerial surface of plants. Acta Physiol. Plant. 31, 13-19.
Curtis, B. (2005). Lavender production and marketing. Washington State University (WSU) Cooperative Extension Bulletin. Online: http://www.smallfarms.wsu.edu/crops/lavender.html.
Hafsi, C., Debez, A., Abdelly, C. (2014). Potassium deficiency in plants: effects and signaling cascades. Acta Physiol. Plant. 36, 1055-1070
Kara, N., Baydar, H., (2013). Determination of lavender and lavandin cultivars (Lavandula sp.) containing high quality of essential oil in Isparta, Turkey. Turk. J. Field Crops 18, 58–65.
Klados, Ε., Tzortzakis, Ν. (2014). Effects of substrate and salinity in hydroponically grown Cichorium spinosum. J. Soil Sci. Plant Nutr. 14, 211-222.
Jovović Z., Salkić B., Velimirović A , Vukićević P., Salkić A. (2018). Production of immortelle seedlings according to the principles of organic production. International Journal of Plant & Soil Science, 21(6): 1-5, 2.
Jovović, Z., Popović, V., Dolijanović, Ž., Velimirović, A., Iličković, M. (2019a). Influence of different organic fertilizers on the quality of lavender (Lavandula officinalis Chaix) seedlings. 8th International symposium on agricultural sciences, 16-18 May, 2019. Trebinje, Bosnia and Herzegovina, Book of abstracts, 68.
Jovović, Z., Velimirović, A., Popović, V., Dolijanović, Ž., Jovović, M. (2019b). Influence of organic pelleted fertilizers on the quality of rosemary (Rosmarinus officinalis L.) Seedlings. XXIV Symposium on biotechnology with International Participation, Čačak 15-16. 03. 2019., Book of Proceedings 1, 227-231.
Matysiak, B., Nogowska, A. (2016): Impact of fertilization strategies on the growth of lavender and nitrates leaching to environment. Horticultural Science 43(No. 2):76-83
Macedo Silvaa, S., Magno Queiroz Luza, J., Augusto Menezes Nogueiraa, P., Fitzgerald Blankb, A., Santos Sampaiob, T., Andreza Oliveira Pintob, J., Wisniewski Juniorb, A. (2017). Organo-mineral fertilization effects on biomass and essential oil of lavender (Lavandula dentata L.). Industrial Crops & Products, 103.
Raij, B. (2011). Fertilidade do solo e manejo de nutrientes. International Plant Nutrition Institute, Piracicaba, Brazil.
Stešević, D., Caković, D., Jovanović, S. (2014). The Urban Flora Of Podgorica (Montenegro, SE Europe): Annotated Checklist, Distribution Atlas, Habitats And Life-Forms, Taxonomic, Phytogeographical And Ecological Analysis, Ecol. Mont., Suppl. 1., 1-171.
Touati, B., Chograni, H., Hassen, I., Boussaïd, M., Toumi, L., Brahim, N.B. (2011). Chemical composition of the leaf and flower of essential oils of tunisian Lavandula dentata L. (Lamiaceae). Chem. Biodivers. 8, 1560–1570.
Agriculture & Forestry, Vol. 66 Issue 2: 57-66, 2020, Podgorica 57
Sudarić, T., Samardžija, L., Lončarić, R. (2020): Viticulture and wine as export potential of Croatia. Agriculture
and Forestry, 66 (2): 57-66.
DOI: 10.17707/AgricultForest.66.2.06
Tihana SUDARIĆ1,
Luka SAMARDŽIJA2, Ružica LONČARIĆ
1
VITICULTURE AND WINE AS EXPORT
POTENTIAL OF CROATIA
SUMMARY
This paper analyzes export potential of viticulture and winemaking in
Republic of Croatia. Based on quantitative research methods applied by using
Relative Trade Advantages (RTA) index, Export Competitiveness Index (XC),
Comparative Advantage Index (RCA) and Relative Trade Advantage Index
(RTA) in relation to EU countries. The 2015.-2016. study provided by the
National Bureau of Statistics. The research results show negative macroeconomic
indicators related to the potential of wine exports and lack of comparative
advantage (0.25020853), negative trend of export competitiveness (0.753189),
lack of export specialization (0.103778589) as well as negative trade advantage
(-2.0).
Keywords: viticulture, winemaking, exports, imports, index.
INTRODUCTION
Viticulture and winemaking of the Republic of Croatia can be presented as
strategic activities of particular importance, because where the grapevine grows,
it means a great deal of life and labor-intensive employment for the population
(Milat, 2005). According to the data of the Croatian Chamber of Economy
(2016), department responsible for agriculture, fisheries, forestry, wood and food
industry in Republic of Croatia 1.5 million hectares of utilized agricultural land
54% refers to arable land and gardens, 5% refers to orchards, vineyards and olive
groves and 41% on permanent lawns. The importance of the food processing
industry in relation to the total manufacturing industry is reflected in the fact that
about a quarter of the indicator value relates to the food processing industry
namely: number of persons employed (24%), turnover (32%), added value (26%)
and gross surplus (30%). Food processing companies hold 16% share in the total
1Tihana Sudarić (corresponding author: [email protected]), Ružica Lončarić University of
Josip Juraj Strossmayer in Osijek, Faculty of Agrobiotechnical Sciences Osijek, Department of
Bioeconomics and Rural Development, Vladimira Preloga 1., Osijek, Republic of CROATIA. 2 Luka Samardžija, University of Josip Juraj Strossmayer in Osijek, Faculty of Agrobiotechnical
Sciences Osijek, PhD student, study program Agroeconomics, Vladimira Preloga 1., Osijek,
Republic of CROATIA.
Paper presented at the GEA (Geo Eco-Eco Agro) International Conference 2020, Podgorica.
Notes: The authors declare that they have no conflicts of interest. Authorship Form signed online.
Received:07/04/2020 Accepted:20/05/2020
Sudarić et al. 58
processing industry (www.hgk.hr). Industry of agriculture, forestry and fisheries
account for 3.7% of total GDP. Viticulture and winemaking in Croatia has a long
tradition, a high level of production knowledge and producers experience which,
in addition to favorable natural conditions and a developed market of demand,
give stimulating conditions for sustainable production development. It is
necessary to emphasize that there is also a high level of competition (domestic
and foreign), relevant level of gray economy, and a high level of administrative
legislation and, in comparison with other countries, a relatively small production
capacity of manufacturers. Looking from quantity point of view Croatian
vineyards and wine production, in relation to the international market, are
consider small (Alpeza, 2014). However, according to Jelic Milkovic (2019), the
wine industry has become more competitive than ever before.
With an annual wine production of 36 billion bottles worldwide and with
more than a million different wine labels, winemakers are struggling to stand out
and secure a position on a market. A large number of competitors and fierce
competition among the winemakers characterizes bought Croatian and European
wine markets. Therefore, according to the study (Del Vechio et al., 2017) buyers
give primary importance to the quality of the product and if the domestic product
is equal in this parameter with the foreign product, there is a strong motivation to
purchase the product produced by the domestic industry. Wine is characterized as
a highly complex product and the possibility of segmentation is extremely large
(Samardzija et al., 2017). Considering all the above, aim of this paper is to
analyze the export potential of viticulture and winemaking in Republic of Croatia
according to quantitative methods for exploring comparative export advantages.
MATERIAL AND METHODS Research in this paper is based on the analysis of secondary data sources
provided by the National Bureau of Statistics (2015. /2016.), as well as data from
the European Commission (EC, 2016). Analyzed data, quantitative methods for
the research of comparative advantages and disadvantages of viticulture in the
Republic of Croatia are applied based on the Relative Trade Advantages (RTA)
index, Export Competitiveness Index (XC), Comparative Advantage Index
(RCA) and Relative Index trade advantages (RTA) and relation to EU countries.
Relative Trade Advantage (RTA) was developed by Vollrath (1991) and is
calculated as the difference between relative export advantage (RXA) or Balassa
index and relative import advantage (RMA):
RTA = RXA – RMA
where,
RXA = ;
RMA = ( ) ;
M – import, i – a country; j – a commodity; t – a set of commodities; n - a set of
countries.
Viticulture and wine as export potential of Croatia 59
The positive value of the RTA index indicates comparative trade
advantages, while negative values reveals comparative trade disadvantages.
When RTA is greater than zero, then a comparative advantage is revealed, which
means that a sector of the country is relatively more competitive in terms of trade
(Cimpoies, L. 2017). Synthesis and descriptive methods have been applied in the
interpretation of the results obtained and the formation of conclusions.
RESULTS AND DISCUSSION
Selected quantitative methods of analysis are used to understand the
benefits of an economy in goods exchange process with the ultimate goal of
meeting the stakeholder’s needs. Initially assuming that economy resources are
scarce and needs are unlimited, the analyzed theoretical framework operates
within the production capabilities of each economy separately and opens
opportunities to maximize benefits through exchange and specialization. The
theoretical setting of Production Possibility Frontier (PPF) explains what are the
maximum quantities of production that an economy can achieve with current
technological knowledge and the available amount of resources.
PPF represents the output of goods and/or services available to the
company at a given moment, opens options for decisions between production and
exchange of goods using the calculation of opportunity cost. This theoretical
model, although practical, is not always realistically usable. There are a large
number of producers in the economy with different business plans, individual
approaches to product management, and they do not have to (but can) participate
in the international exchange of goods. Although reality is more complex for
macroeconomic policy stakeholders, results of analysis and quantitative methods
studies can stimulate and discourage specialization and exchange of agricultural
products. In order to achieve as relevant research as possible, the analysis of
secondary data sources makes the basis for applying quantitative methods to
explore comparative export advantage through:
Revealed comparative advantage (RCA)
This index measures comparative advantage in exports of goods "I" of
country "Y". If the value is greater than 1, then the analyzed country has
pronounced comparative advantages in the export in specific goods. Conversely,
if the value is less than 1, then there is a clear lack of comparative advantage in
the export of specific goods (Balassa, 1965). The author of this index is Béla
Balassa, who (with the basic condition of the exception of the costs of production
factors), by analyzing the results of export opportunities, sets comparative
advantages among different economic systems. By comparing the advantages of
two or more systems, one can see the potential for the exchange of goods. By
analyzing the potential and adequately distributing the use of resources, in theory
(even without increasing individual productivity) all participants can benefit.
Eventually, the RCA index may show unreliable data due to the impact of the
state on the economy, ie the impact of customs, incentives, export subsidies,
which may affect the analysis of this index.

Sudarić et al. 60
Export Competitiveness Index (XC)
Export Competitiveness Index indicates a measure of the export
performance of a product or group of products. The competitiveness of the
economy is viewed through the analysis of the vital elements that make the
economy productive. Purpose of this analysis is to compare across economies and
the ultimate success is to increase the level of environmental quality, economic
and social conditions to stimulate economic development. The export
competitiveness of product "I" of country "Y" can be explained by the ratio of the
share of the world market of country "Y" to product "I" in the observed period (t)
with the ratio of share in the previous period. If the export competitiveness index
is more than 1, increasing export competitiveness is present. On the contrary, the
realized value of less than 1 implies a negative trend of export competitiveness.
The XC index can also be interpreted as the ratio of the growth rate of exports of
products "I" to country "Y" and the rate of growth of products "I" to the world
(Stojanov et al., 2011).
Export Specialization Index (ES)
Export Specialization Index (ES) is partly different from the Revealed
comparative advantage (RCA), in which the denominator is usually measured by
specific markets or partners. ES provides product information in the analyzed
specialization in the country's export sector and is calculated as the ratio of the
product's share of total country's exports to the share of that product in imports to
specific markets or partners, rather than its share of world exports. ES is similar
to RCA in that an index value of less than 1 indicates a comparative disadvantage
and a value above 1 represents a specialization in this market
(https://worldbank.org).
Relative Trade Advantage Index (RTA)
RTA is calculated as the difference between the Relative Export Advantage
(RXA) (equivalent to the Balassa index) and the Relative Import Advantage
(RMA). Results with an RTA index greater than 0 indicate the comparative
advantage of the analyzed economy, while negative results indicate a lack of
comparative advantage (Bezić et al., 2011).
Table 1 provides explanations for the RCA, XC, ES and RTA calculations
in order to investigate the comparative export advantage. When applying
quantitative methods, data for European Union countries were used instead of
'World' labels. Due to the inability to collect relevant and measurable data for
World imports and exports, research is restricted to the European Union market
only.
Analysis of viticulture in Republic of Croatia
According to the Ordinance on geographical areas of grapevine cultivation
entire economic sector of viticulture and winemaking, from a territorial-
geographical point of view (on a national level) is divided into 4 regions, 16 sub-
regions and 66 appeals (NN 32/19 2019.)

Viticulture and wine as export potential of Croatia 61
Table 1. Overview of quantitative methods for exploring comparative export
advantage Relative
Comparative
Advantage Index
(RCA)
Export
Competitiveness Index
(XC)
Export Specialization
Index
(ES)
Relative Trade
Advantage Index
(RTA)
RCA = [(Xij/
Xnj) / (Xit/Xnt)]
(XC 0)= (Xij / Xit) t/
(Xij / Xit) t-1
ES = (xij / Xit) / (mkj
/ Mkt)
RTA=RXA-RMA=(
Xij/Xit) / (Xnj/ Xnt) –
(Mij/Mit)/ (Mnj/Mnt)
Xij – export
country “I”
product “Y”,
Xit – total export
of product “I”,
Xnj – total export
of country “Y”,
Xnt – total world
export.
Xij - export country “I”
product “Y”,
Xit - total export of
product “I”,
t- time,
t-1- base time.
Xij - export country
“I” product “Y”,
Xit - total export of
product “I”,
mkj - the import
values of product "y"
in market "k",
mkt - total market
imports „k“
RXAi: Relative export
comparative advantage
for product "I"
RMAi: Relative
import comparative
advantage for product
"I"
X: Total economy
exports
Xw: Total world
exports
M: Total economy
imports
Mw: Total world
imports
*Balassa, 1978.
According to the data of the Agency for Payments in Agriculture, Fisheries
and Rural Development (2019), the total sum of agricultural parcels in the
Republic of Croatia was 2.695.037 hectares, of which 1.113.520 hectares have
been cultivated. There are 19.022.08 hectares of vineyards, 73.670 vineyards and
37.913 agricultural holdings under permanent vineyard plantations
(www.apprrr.hr, 2019). The share of viticulture is 1.70% of the total agricultural
area.
Season 2015/2016 was analysed as base year, in which according to the
APPRRR, the total area of permanent vineyards was 20.709 ha (cumulative of all
sub-regions combined), and in 2015, a there was total of 98.857.66 tons of grapes
was produced, from which it was obtained 690.787.39 liters of wine
(www.apprrr.hr, 2016). An analysis of the available data shows that the total area
under permanent vineyard planting has decreased. Area under vineyards was
3.48% lower than base year. The average grape yield was 4.7 tonnes/ha and 0.65
liters of wine was obtained from one kg of grapes. Despite many years of
tradition and experience, the fact remains that the average utilization of
production is relatively low (in line with the potential of maximum production).
The utilization of production during grape cultivation has a direct impact on the
quality of the finished product - wine.
Biodiversity of the vines in the territory of the Republic of Croatia is
notable. By looking at the available data of APPRRR (2016) summing up units of
area (ha) in agriculture at the level of the entire Republic of Croatia, the most
Sudarić et al. 62
represented grapevine variety was Graševina with 4,454.13 ha (over 22% of total
production), followed by Istrian Malvasia 1,635.63 ha (over 8%) and Plavac Mali
1.562.63 ha (over 7%). The three leading varieties make up over 38% of the total
utilized agricultural area under the vineyard, while none of the other varieties
exceed 1.000 ha (cumulatively on the entire territory of the Republic of Croatia).
In addition to the Law on Wines (NN 32/19), the market is regulated by
regulations and inspection system of supervision. All administrative legal acts
were adopted in accordance with the doctrine and practice of the European
Union. Transparency of the production, promotion, consumption system (ban on
sales to persons under 18 years), quality standards is responsibility of the
competent legal authorities and the economy is regulated in detail.
Macroeconomically speaking, it is the state that, through its institutions, must
continually work to educate consumers about wine and to create the image of
Croatia as a country of quality and diverse wine, both domestically and
internationally. Only then will the foreign trade balance improve and exports
become a strategic determinant of all winemakers in the Republic of Croatia
(Kristić et al., 2012). According to information available from the Ministry of
Agriculture, agricultural policy measures distinguish:
direct grants,
market measures and
rural development measures.
Direct support includes measures under the Direct Payments Program
regulated by the Common Agricultural Policy of the European Union and
national measures for payments in extremely sensitive sectors and for the
conservation of native and protected species and cultivars of agricultural plants
(IEC). Direct payments under the Common Agricultural Policy of the European
Union are an annual support to farmers' income. The direct payments program is
financed by funds from the European Agricultural Guarantee Fund (EAGF) and
by the State Budget of the Republic of Croatia for supplementary national direct
payments (additional payment of direct payments from the state budget until
2022, when 100% of the amount will be financed by the EAGF
(http://www.mps.hr/). According to the National Wine Sector Assistance Program
2014-2018, which is part of the sector specific support system under the Council
Regulation (EC) establishing a common organization of the agricultural market
and making specific provisions for certain agricultural products, the programs of
promotion of the wine sector are recognized:
promotion in third-country markets,
restructuring and conversion of vineyards and
investments in wineries and wine marketing.
Also, each county has the opportunity to adopt its own strategy for the
development of viticulture and winemaking with the aim of maximizing capacity
and utilizing resources, assuming that the strategy is adopted in accordance with
national and EU strategies. In line with these strategies, the possibility of
additional project financing opens with the funds from the common funds of the

Viticulture and wine as export potential of Croatia 63
European Union. 26% of the funds available for the development of Croatian
agriculture have been contracted out of a total of EUR 2.38 billion available
through the Rural Development Program (2014-2020) to the Republic of Croatia
for the promotion of agricultural production and rural development
(http://www.mps.hr). As a member of the European Union, the Republic of
Croatia implements all obligations but have benefits of belonging to the Union. In
accordance with the common regulations and norms, a customs system for the
export and import of wine and grapes is implemented. In accordance with the
relevant laws and standards, inspection standards are implemented and there is no
particular protectionism against this production segment.
According to Kalazić et al. (2010), there are 1.032 registered winemakers
in Croatia. The ten largest have a combined market share of 70% and the
remaining 1.000 small winemakers hold 10% of the market. The average
vineyard surface in Croatia is below 1 ha. About 14% of winemakers have a
vineyard surface of up to 10 ha, and only 25 winemakers have a vineyard surface
above 50 ha. Looking at the spectrum of legislation, economic entities operating
in the agricultural production branch can be divided into family farm, craft, Trade
Company, cooperative. In the Republic of Croatia, there are 39.429 holdings
registered for grapevine cultivation. According to the data available from the
Central Bureau of Statistics related to the balance of the wine market, from total
wine consumption in 2015, 50.48% came from domestic production, 15.49%
from imports 34.03% from earlier stocks. According to the results the majority of
producers in the region use international varieties for production of wine
(Pajović-Šćepanović et al., 2017).
Table 2. Foreign Trade Balance of Wine 2015. /2016. Import 2016. Import 2015. Index
CT Product ton EUR ton EUR 16. /15. EUR
2204 Fresh
grape wine 30.908 30.769.499 28.920
29.006.7
54 106
Export 2016. Export 2015. Index
CT Product ton EUR ton EUR 16. /15. EUR
2204 Fresh
grape wine 3.608 10.531.686 4.932
12.398.3
28 85
CT Product Import 2016. Export 2016. Import over
export
2204 Fresh
grape wine 30.908 30.769.499 3.608
10.531.6
86 -20.237.813 34%
Source: Croatian Chamber of Economy 2015. /2016. www.hgk.hr
According to data available from the Croatian Chamber of Economy
related to the import and export of wine in the 2015/2016 season a negative
balance is evident. The natural conditions, the level of knowledge and experience
of the producers as well as the quality of the final products are not in question,
but the presence of Croatian producers' wines on the international markets is.
Although the export/import ratio was only 34%. According to research by Kristić
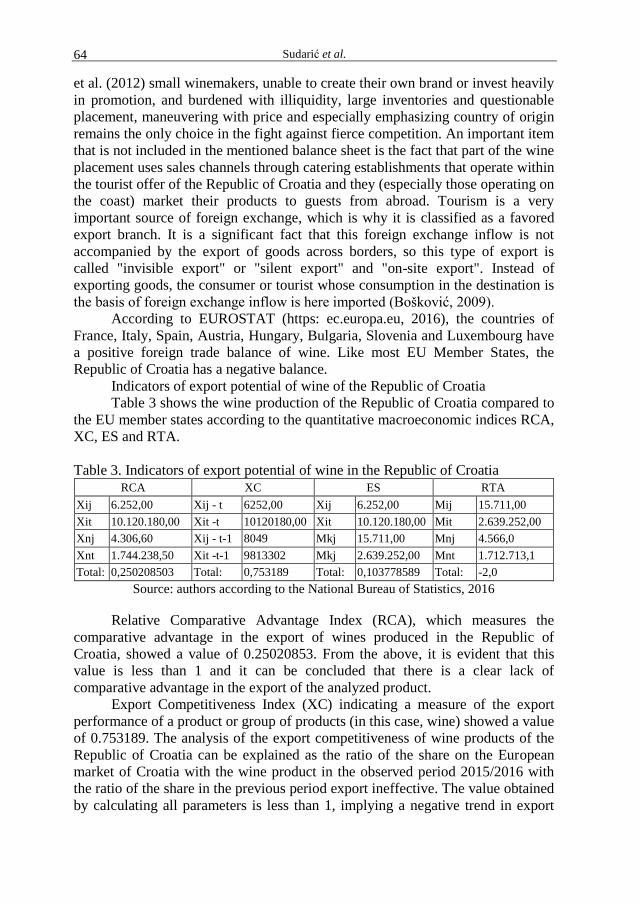
Sudarić et al. 64
et al. (2012) small winemakers, unable to create their own brand or invest heavily
in promotion, and burdened with illiquidity, large inventories and questionable
placement, maneuvering with price and especially emphasizing country of origin
remains the only choice in the fight against fierce competition. An important item
that is not included in the mentioned balance sheet is the fact that part of the wine
placement uses sales channels through catering establishments that operate within
the tourist offer of the Republic of Croatia and they (especially those operating on
the coast) market their products to guests from abroad. Tourism is a very
important source of foreign exchange, which is why it is classified as a favored
export branch. It is a significant fact that this foreign exchange inflow is not
accompanied by the export of goods across borders, so this type of export is
called "invisible export" or "silent export" and "on-site export". Instead of
exporting goods, the consumer or tourist whose consumption in the destination is
the basis of foreign exchange inflow is here imported (Bošković, 2009).
According to EUROSTAT (https: ec.europa.eu, 2016), the countries of
France, Italy, Spain, Austria, Hungary, Bulgaria, Slovenia and Luxembourg have
a positive foreign trade balance of wine. Like most EU Member States, the
Republic of Croatia has a negative balance.
Indicators of export potential of wine of the Republic of Croatia
Table 3 shows the wine production of the Republic of Croatia compared to
the EU member states according to the quantitative macroeconomic indices RCA,
XC, ES and RTA.
Table 3. Indicators of export potential of wine in the Republic of Croatia RCA XC ES RTA
Xij 6.252,00 Xij - t 6252,00 Xij 6.252,00 Mij 15.711,00
Xit 10.120.180,00 Xit -t 10120180,00 Xit 10.120.180,00 Mit 2.639.252,00
Xnj 4.306,60 Xij - t-1 8049 Mkj 15.711,00 Mnj 4.566,0
Xnt 1.744.238,50 Xit -t-1 9813302 Mkj 2.639.252,00 Mnt 1.712.713,1
Total: 0,250208503 Total: 0,753189 Total: 0,103778589 Total: -2,0
Source: authors according to the National Bureau of Statistics, 2016
Relative Comparative Advantage Index (RCA), which measures the
comparative advantage in the export of wines produced in the Republic of
Croatia, showed a value of 0.25020853. From the above, it is evident that this
value is less than 1 and it can be concluded that there is a clear lack of
comparative advantage in the export of the analyzed product.
Export Competitiveness Index (XC) indicating a measure of the export
performance of a product or group of products (in this case, wine) showed a value
of 0.753189. The analysis of the export competitiveness of wine products of the
Republic of Croatia can be explained as the ratio of the share on the European
market of Croatia with the wine product in the observed period 2015/2016 with
the ratio of the share in the previous period export ineffective. The value obtained
by calculating all parameters is less than 1, implying a negative trend in export
Viticulture and wine as export potential of Croatia 65
competitiveness. It is possible to make an indicative conclusion that the ratio of
the growth rate of export of wine produced in Croatia to the rate of growth of
wine products on the European market is inadequate in this case.
Export Specialization Index (ES) is 0.103778589 indicates a comparative
lack of specialization in the European market. In the analyzed specialization, the
export spectrum of Croatia in the wine segment (calculated as the ratio of the
share of wine in total country exports) relative to the share of that wine in imports
into the European Union markets.
Relative Trade Preference Index (RTA) is -2.0. The negative RTA index
indicates the lack of comparative advantage of wine production in the Republic of
Croatia compared to the production of wines of other EU Member States. is -2.0.
The negative RTA index indicates the lack of comparative advantage of wine
production in the Republic of Croatia compared to the production of wines of
other EU Member States.
CONCLUSIONS
Viticulture and winemaking in the Republic of Croatia is characterized by
a long tradition, a high level of knowledge and experience of producers as well as
favorable natural conditions. Wine is undoubtedly a strategic agricultural food
product of the Republic of Croatia, and the total domestic consumption of wine is
about 1 002 000 hectoliters, while the self-sufficiency of wine production is 80%.
Although the Republic of Croatia is an interesting market for an increasing
number of importers, it has the potential to export individual wines, ie grape
varieties (Graševina, Istrian Malvasia, Plavac Mali etc.). The results of the survey
show production of wine of Republic of Croatia, in comparison with the EU
member states, according to the quantitative macroeconomic indices RCA, XC,
ES and RTA. The input variables for measurable comparative advantage in the
export of wines produced in the Republic of Croatia are based on secondary data
sources (CBS, APPPR, HGK, MP). The obtained results induce negative
macroeconomic indices related to the potential of wine exports, that is, to the
European Union market. The conclusions obtained from the analysis and
processing of the available secondary data are only indicative and can be used as
guidance for improving the strategy of economic activity of the export potential
of viticulture and winemaking in the Republic of Croatia.
REFERENCES Alpeza I, Prša I, Mihaljević B. 2014. Viticulture and Enology of the Republic of Croatia
in the World, Journal of Plant Protection, 37, 4; 6-13.
Balassa B. 1965. Trade Liberalization and Revealed Comparative Advantage, The
Manchester School of Economic and Social Studies, Vol. 119, 93-123.
Balassa B. 1978. Export and economic growth, Journal of Development Economics,
North-Holland Publishing Company, No. 5, pp. 203.
Bezić H, Cerović Lj, Galović T. 2011. Changes in the competitive advantages of
Croatia’s manufacturing industry, Zbornik radova, Ekonomski fakultet u Rijeci,
Vol. 29 (2), 465-487.
Sudarić et al. 66
Bošković T. 2009. Turizam kao faktor privrednog razvoja, Visoka poslovna škola
strukovnih studija, Škola biznisa, br. 2/2009, Novi Sad, 23–28.
Cimpoies L. 2017. The competitiveness of agricultural foreign trade commodities: the
case of the Republic of Moldova, 52nd Croatian and 12th International
Symposium on Agriculture, University of Zagreb, Faculty of Agriculture,
Dubrovnik, 129-133.
Del Vechio M, Samardžija L, Kuzmanović S. 2017. Analiza percepcije odabira između
domaćih i inozemnih vina istog cjenovnog razreda, 52nd Croatian and 12th
International Symposium on Agriculture, University of Zagreb, Faculty of
Agriculture, Dubrovnik, 136-139.
Jelić Milković S. 2019. Market orientation and entrepreneurial effect of winemakers,
Ekonomski Vjesnik; Osijek Vol. 32, Iss. 1, 83-92.
Kalazić Z, Leko-Šimić M, Horvat J. 2010. Wine market segmentation in continental
Croatia, Journal of Food Products Marketing, Vol. 16, No. 3, 325-335. 6.
Kristić J, Sudarić T, Lončarić R. 2012. Zemlja podrijetla vina kao determinirajući
čimbenik pri odlučivanju o kupnji, in Pospišil, M. (Ed.), 47th Croatian and 7th
International Symposium on Agriculture, University of Zagreb, Faculty of
Agriculture, Opatija, 198-201.
Milat V. 2005. Stanje u vinogradarstvu i vinarstvu Republike Hrvatske, Glasnik zaštite
bilja, Vol. 28, No. 6, 5-15.
Pajović-Šćepanović R., Savković S., Raičević D., Popović T. 2017. Characteristics of the
Montenegrin rose wine. Agriculture and Forestry, 63 (4): 131-139.
DOI:10.17707/AgricultForest.63.4.15
Samardžija L, Soukup D., Kuzmanović S. 2017. Analysis of buying habits – wine
segment, International Journal – VALLIS AUREA, Vol. 3, No. 2, 103-110.
Stojanov D, Bezić H, Galović T. 2011. Izvozna konkurentnost Primorsko -goranske
županije, Ekonomski vjesnik, Ekonomski fakultet u Osijeku. XXIV, 1; 33-46,
UDK 339.137. 497-537.
Vollrath T L. 1991. A theoretical evaluation of alternative trade intensity measures of
revealed comparative advantage, Weltwirtschaftliches Archiv, Volume 127(2),
265-280.
Wine Law NN 32/19 in force since 01.04.2019. https://www.zakon.hr/z/277/Zakon-o-vinu; (accessed January 21 2019)
https://wits.worldbank.org/wits/wits/witshelp/Content/Utilities/e1.trade_indicators.htm
(accessed September 05, 2016).
https://www.hgk.hr/documents/republikahrvatska2016hrweb5824783267fa1.pdf
(accessed September 07, 2016).
https://narodne-novine.nn.hr/clanci/sluzbeni/2012_07_74_1723.html
(accessed September 07, 2016).
Commission Européenne; (2016) Direction générale de l'agriculture et du développement
rural Direction C. Économie des marchés agricoles (et OCM) Comext Wine Trade
results
https://ec.europa.eu/agriculture/sites/agriculture/files/wine/statistics/wine-trade-
2015_en.pdf (accessed January 17, 2017).
Agriculture & Forestry, Vol. 66 Issue 2: 67-77, 2020, Podgorica 67
Glamočlija, M. M., Popović, V., Janković, S., Glamočlija, Đ., Čurović, M., Radović M., Đokić, M. (2020):
Nutrition effect to productivity of bioenergy crop miscanthus x giganteus in different environments. Agriculture
and Forestry, 66 (2): 67-77.
DOI: 10.17707/AgricultForest.66.2.07
Milena MLADENOVIĆ GLAMOČLIJA1, Vera POPOVIĆ
2*,
Snežana JANKOVIĆ1, Đorđe GLAMOČLIJA
3, Milić ČUROVIĆ
4
Marko RADOVIĆ5and Milorad ĐOKIĆ
6
NUTRITION EFFECT TO PRODUCTIVITY OF BIOENERGY CROP
MISCANTHUS X GIGANTEUS IN DIFFERENT ENVIRONMENTS
SUMMARY
Miscanthus x giganteus Greef et Deu is a perennial C4 grass, originally
from East Asia. Morphological productive characteristics of miscanthus were
analyzed in this study: plant height in the tasseling period, number of leaves on
stalk in the tasseling period, number of stalk in tiller, number of stalk with tassel,
dry plant yields, stalk moisture in harvest time and cellulose content. The
miscanthus achieves high yields and excellent performance in summer drought
conditions because it has a well-developed root system. In the period April-
October 2018-2019 there was less precipitation (428 mm and 431 mm) than the
optimal needs of the plants (550 mm). In the two-year average the miscanthus
had a stalk height of 342.4 cm and achieved a yield of 31.4 t ha-1
. To these
morphologically productive traits significantly affected weather conditions,
nitrogen nutrients as well as the interaction of the factors studied.
Keywords: Miscanthus, nitrogen top dressing, morphological and
productive traits, environments
INTRODUCTION
Miscanthus x giganteus Greef et Deu is a perennial C4 grass, originally
from East Asia. It has high production potential and is ecologically very
acceptable species suitable for the production of solid biofuels (Živanović et al,
2014; Đurić et al., 2019). Generates high biomass yield, in the period to 20 years,
has good energy performance and relatively low investment in production
(Acikel, 2011). Miscanthus (or Elephant Grass) is a popular choice for biofuel
production, because it produces a crop every year without the need for replanting
1Milena Mladenović Glamočlija (corresponding author: [email protected]), Snežana
Janković, IPN Institute of Applied Sciences, Belgrade, SERBIA; 2 Vera Popović, Institute of Field and Vegetable Crops, Maksima Gorkog 30, Novi Sad, SERBIA; 3Đorđe Glamočlija, University of Belgrade, Faculty of Agriculture, Zemun-Belgrade, SERBIA; 4Milić Čurović, University of Montenegro, Biotechnical Faculty, Podgorica, MONTENEGRO; 5Marko Radović, BioSens Institute, Dr Zorana Djindjica 1, Novi Sad, SERBIA; 6Milorad Đokić, University of Megatrend, Faculty of Biofarming, BačkaTopola, SERBIA;
Paper presented at the GEA (Geo Eco-Eco Agro) International Conference 2020, Podgorica.
Notes: The authors declare that they have no conflicts of interest. Authorship Form signed online.
Received:01/04/2020 Accepted:12/06/2020

Glamočlija et al. 68
and due to the rapid growth, low mineral content, and high biomass yield,
outperforming maize and other alternatives. It is an excellent choice for our
environment, our economy, and our future security of energy supply. It also
complements forestry as it sits easily alongside to help even out supply chain
needs.During the multi-year life cycle, miscanthus develops a strong deep root
system of high suction power and the plants are tolerant to less favorable agro-
ecological conditions. However, the highest biomass yield is obtained only under
conditions of favorable water regime (550 mm of precipitation during the
vegetation cycle) as stated by Clifton-Brown et al. (2002).
This study has shown that summer precipitation amounts are the most
important for achieving high and stable yields. This has been confirmed by other
researchers, for example Mont and Zatta (2009); Dželetović et al. (2013);
Ikanović et al. (2015) and others. In the year of the most favorable water regime
and monthly rainfall, a significant yield of dry stalks, 31,533 kg ha-1
, was
obtained. In the year of the most favorable water regime and monthly schedule
precipitation was obtained a significant yield of dry stalks, 31,533 kg ha-1
.
By studying the properties of miscanthus production in the environmental
conditions of Northern Europe, Lewandowski and Heinz (2003) have concluded
that favorable water and air temperature regimes have the largest effect on
biomass yield. In the aforementioned research, nitrogen opdressing had a
significant influence in the first year and in two-year average. Overall, nitrogen
topdressing increased dry stalks yield by 5%.
The aim of this research was the study of the influence of the environment
and nutrition, i.e. nitrogen top dressing and the on the morphological and
production properties. The aim of this study was to investigate the influence of
the environment and nutrition, i.e. nitrogen top dressing on the morphological and
production properties of determine the impact of nitrogen top dressing of crops
on miscanthus production in divergent years, influence of the environment and
nutrition on the morphological and production properties.
MATERIAL AND METHODS The subject of the research is mischantus, a clone imported from Germany
for introduction to energy crops production. The experiment was performed in
Surduk (Serbia), on chernozem soil type. At the beginning of the research the
crop was seven years old, and was in years to achieve maximum yield for
commercial production. In the period 2018-2019 two variants were tested –
control (no nitrogen topdressing), and variant with 30 kg ha-1
nitrogen top
dressing, Due to well-developed root system, even in summer drought conditions,
miscanthus gives high yields and excellent performance on fertile soils with good
physical qualities. In the period April-October 2018-2019 there was less
precipitation (428 mm and 431 mm) compared to the optimal needs of the plants
(550 mm). In the two-year average the miscanthus had a stalk height of 342.4 cm
and achieved a yield of 31.4 t ha-1
. These morphological and productive traits
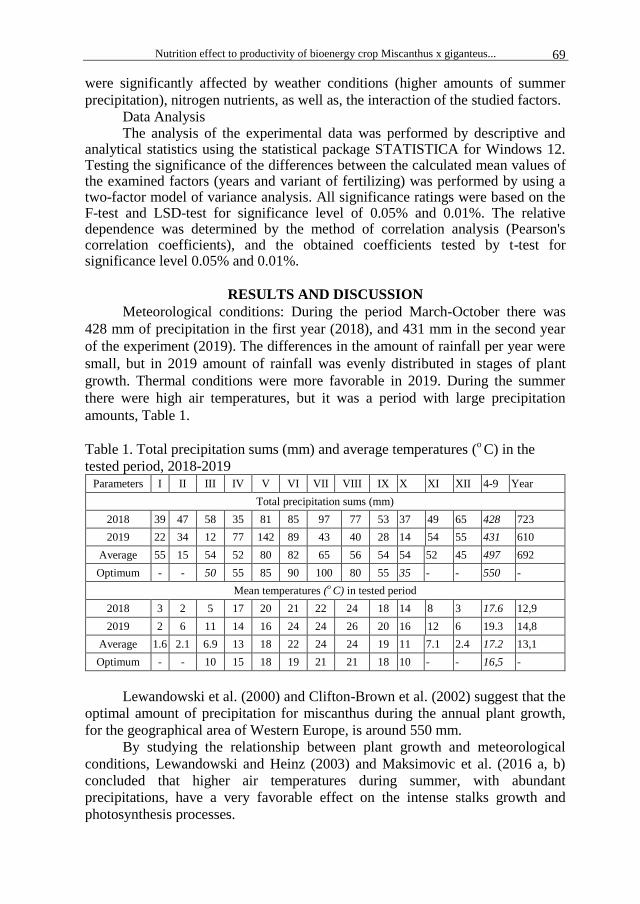
Nutrition effect to productivity of bioenergy crop Miscanthus x giganteus... 69
were significantly affected by weather conditions (higher amounts of summer
precipitation), nitrogen nutrients, as well as, the interaction of the studied factors.
Data Analysis The analysis of the experimental data was performed by descriptive and
analytical statistics using the statistical package STATISTICA for Windows 12. Testing the significance of the differences between the calculated mean values of the examined factors (years and variant of fertilizing) was performed by using a two-factor model of variance analysis. All significance ratings were based on the F-test and LSD-test for significance level of 0.05% and 0.01%. The relative dependence was determined by the method of correlation analysis (Pearson's correlation coefficients), and the obtained coefficients tested by t-test for significance level 0.05% and 0.01%.
RESULTS AND DISCUSSION
Meteorological conditions: During the period March-October there was
428 mm of precipitation in the first year (2018), and 431 mm in the second year
of the experiment (2019). The differences in the amount of rainfall per year were
small, but in 2019 amount of rainfall was evenly distributed in stages of plant
growth. Thermal conditions were more favorable in 2019. During the summer
there were high air temperatures, but it was a period with large precipitation
amounts, Table 1.
Table 1. Total precipitation sums (mm) and average temperatures (
o C) in the
tested period, 2018-2019 Parameters I II III IV V VI VII VIII IX X XI XII 4-9 Year
Total precipitation sums (mm)
2018 39 47 58 35 81 85 97 77 53 37 49 65 428 723
2019 22 34 12 77 142 89 43 40 28 14 54 55 431 610
Average 55 15 54 52 80 82 65 56 54 54 52 45 497 692
Optimum - - 50 55 85 90 100 80 55 35 - - 550 -
Mean temperatures (o C) in tested period
2018 3 2 5 17 20 21 22 24 18 14 8 3 17.6 12,9
2019 2 6 11 14 16 24 24 26 20 16 12 6 19.3 14,8
Average 1.6 2.1 6.9 13 18 22 24 24 19 11 7.1 2.4 17.2 13,1
Optimum - - 10 15 18 19 21 21 18 10 - - 16,5 -
Lewandowski et al. (2000) and Clifton-Brown et al. (2002) suggest that the
optimal amount of precipitation for miscanthus during the annual plant growth,
for the geographical area of Western Europe, is around 550 mm.
By studying the relationship between plant growth and meteorological
conditions, Lewandowski and Heinz (2003) and Maksimovic et al. (2016 a, b)
concluded that higher air temperatures during summer, with abundant
precipitations, have a very favorable effect on the intense stalks growth and
photosynthesis processes.
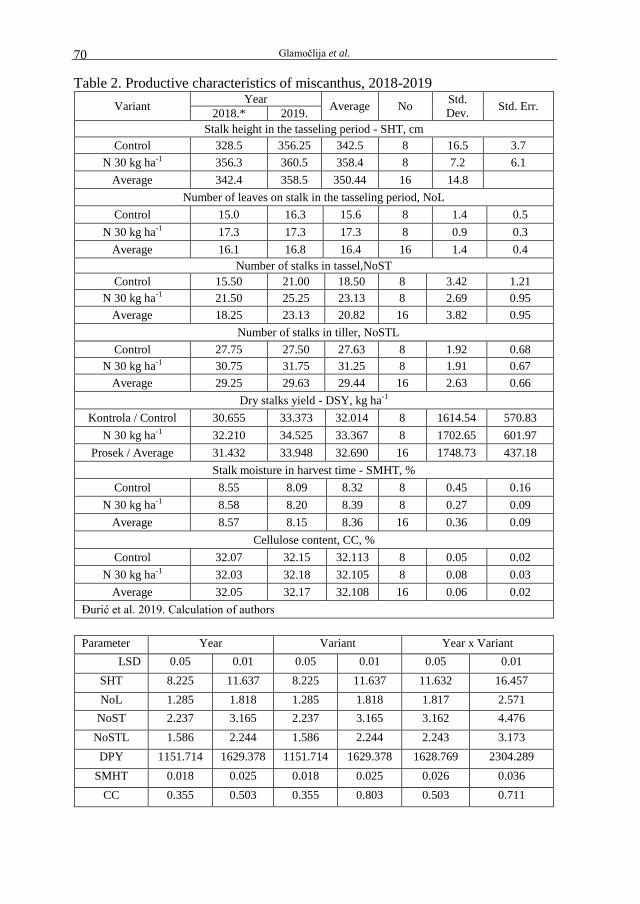
Glamočlija et al. 70
Table 2. Productive characteristics of miscanthus, 2018-2019
Variant Year
Average No Std.
Dev. Std. Err.
2018.* 2019.
Stalk height in the tasseling period - SHT, cm
Control 328.5 356.25 342.5 8 16.5 3.7
N 30 kg ha-1 356.3 360.5 358.4 8 7.2 6.1
Average 342.4 358.5 350.44 16 14.8
Number of leaves on stalk in the tasseling period, NoL
Control 15.0 16.3 15.6 8 1.4 0.5
N 30 kg ha-1 17.3 17.3 17.3 8 0.9 0.3
Average 16.1 16.8 16.4 16 1.4 0.4
Number of stalks in tassel,NoST
Control 15.50 21.00 18.50 8 3.42 1.21
N 30 kg ha-1 21.50 25.25 23.13 8 2.69 0.95
Average 18.25 23.13 20.82 16 3.82 0.95
Number of stalks in tiller, NoSTL
Control 27.75 27.50 27.63 8 1.92 0.68
N 30 kg ha-1 30.75 31.75 31.25 8 1.91 0.67
Average 29.25 29.63 29.44 16 2.63 0.66
Dry stalks yield - DSY, kg ha-1
Kontrola / Control 30.655 33.373 32.014 8 1614.54 570.83
N 30 kg ha-1 32.210 34.525 33.367 8 1702.65 601.97
Prosek / Average 31.432 33.948 32.690 16 1748.73 437.18
Stalk moisture in harvest time - SMHT, %
Control 8.55 8.09 8.32 8 0.45 0.16
N 30 kg ha-1 8.58 8.20 8.39 8 0.27 0.09
Average 8.57 8.15 8.36 16 0.36 0.09
Cellulose content, CC, %
Control 32.07 32.15 32.113 8 0.05 0.02
N 30 kg ha-1 32.03 32.18 32.105 8 0.08 0.03
Average 32.05 32.17 32.108 16 0.06 0.02
Đurić et al. 2019. Calculation of authors
Parameter Year Variant Year x Variant
LSD 0.05 0.01 0.05 0.01 0.05 0.01
SHT 8.225 11.637 8.225 11.637 11.632 16.457
NoL 1.285 1.818 1.285 1.818 1.817 2.571
NoST 2.237 3.165 2.237 3.165 3.162 4.476
NoSTL 1.586 2.244 1.586 2.244 2.243 3.173
DPY 1151.714 1629.378 1151.714 1629.378 1628.769 2304.289
SMHT 0.018 0.025 0.018 0.025 0.026 0.036
CC 0.355 0.503 0.355 0.803 0.503 0.711
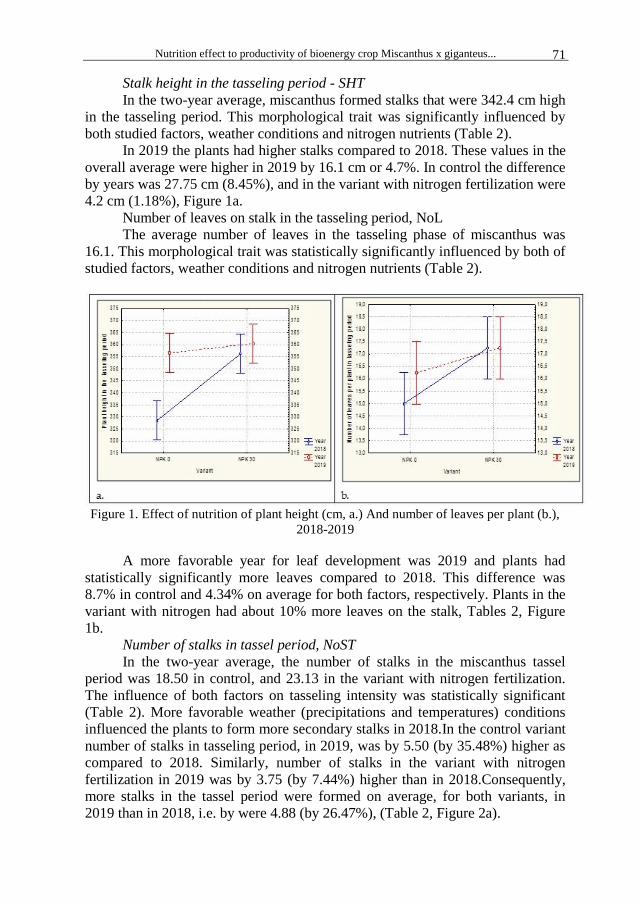
Nutrition effect to productivity of bioenergy crop Miscanthus x giganteus... 71
Stalk height in the tasseling period - SHT
In the two-year average, miscanthus formed stalks that were 342.4 cm high
in the tasseling period. This morphological trait was significantly influenced by
both studied factors, weather conditions and nitrogen nutrients (Table 2).
In 2019 the plants had higher stalks compared to 2018. These values in the
overall average were higher in 2019 by 16.1 cm or 4.7%. In control the difference
by years was 27.75 cm (8.45%), and in the variant with nitrogen fertilization were
4.2 cm (1.18%), Figure 1a.
Number of leaves on stalk in the tasseling period, NoL
The average number of leaves in the tasseling phase of miscanthus was
16.1. This morphological trait was statistically significantly influenced by both of
studied factors, weather conditions and nitrogen nutrients (Table 2).
Figure 1. Effect of nutrition of plant height (cm, a.) And number of leaves per plant (b.),
2018-2019
A more favorable year for leaf development was 2019 and plants had
statistically significantly more leaves compared to 2018. This difference was
8.7% in control and 4.34% on average for both factors, respectively. Plants in the
variant with nitrogen had about 10% more leaves on the stalk, Tables 2, Figure
1b.
Number of stalks in tassel period, NoST
In the two-year average, the number of stalks in the miscanthus tassel
period was 18.50 in control, and 23.13 in the variant with nitrogen fertilization.
The influence of both factors on tasseling intensity was statistically significant
(Table 2). More favorable weather (precipitations and temperatures) conditions
influenced the plants to form more secondary stalks in 2018.In the control variant
number of stalks in tasseling period, in 2019, was by 5.50 (by 35.48%) higher as
compared to 2018. Similarly, number of stalks in the variant with nitrogen
fertilization in 2019 was by 3.75 (by 7.44%) higher than in 2018.Consequently,
more stalks in the tassel period were formed on average, for both variants, in
2019 than in 2018, i.e. by were 4.88 (by 26.47%), (Table 2, Figure 2a).
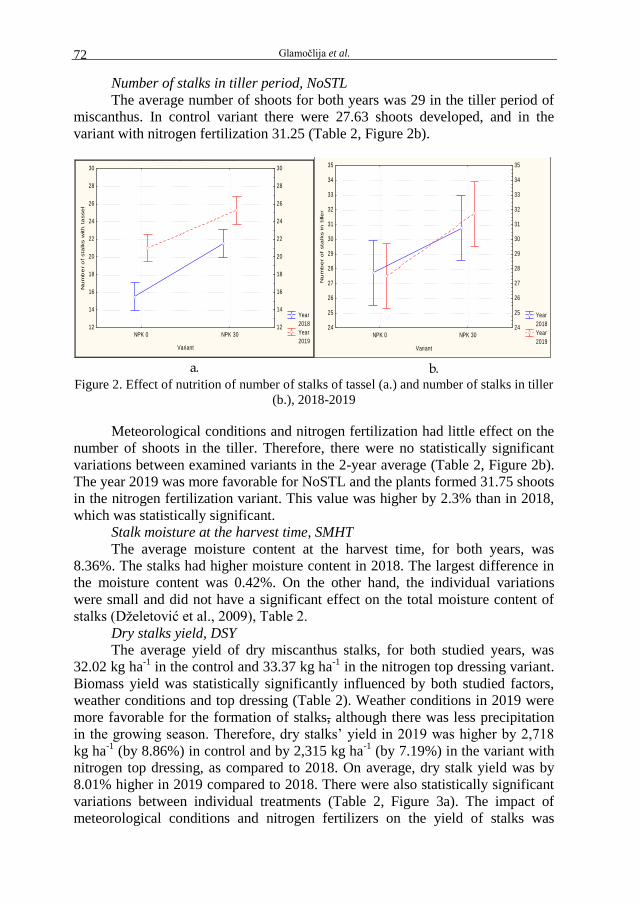
Glamočlija et al. 72
Number of stalks in tiller period, NoSTL
The average number of shoots for both years was 29 in the tiller period of
miscanthus. In control variant there were 27.63 shoots developed, and in the
variant with nitrogen fertilization 31.25 (Table 2, Figure 2b).
Year*Variant; LS Means
Current effect: F(1, 12)=1,4848, p=,24643
Effective hypothesis decomposition
Vertical bars denote 0,95 confidence intervals
Year
2018
Year
2019NPK 0 NPK 30
Variant
12
14
16
18
20
22
24
26
28
30
Nu
mb
er
of
sta
lks w
ith
ta
sse
l
12
14
16
18
20
22
24
26
28
30
a.
Year*Variant; LS Means
Current effect: F(1, 12)=,38071, p=,54875
Effective hypothesis decomposition
Vertical bars denote 0,95 confidence intervals
Year
2018
Year
2019NPK 0 NPK 30
Variant
24
25
26
27
28
29
30
31
32
33
34
35
Nu
mb
er
of
sta
lks in
tille
r
24
25
26
27
28
29
30
31
32
33
34
35
b.
Figure 2. Effect of nutrition of number of stalks of tassel (a.) and number of stalks in tiller
(b.), 2018-2019
Meteorological conditions and nitrogen fertilization had little effect on the
number of shoots in the tiller. Therefore, there were no statistically significant
variations between examined variants in the 2-year average (Table 2, Figure 2b).
The year 2019 was more favorable for NoSTL and the plants formed 31.75 shoots
in the nitrogen fertilization variant. This value was higher by 2.3% than in 2018,
which was statistically significant.
Stalk moisture at the harvest time, SMHT
The average moisture content at the harvest time, for both years, was
8.36%. The stalks had higher moisture content in 2018. The largest difference in
the moisture content was 0.42%. On the other hand, the individual variations
were small and did not have a significant effect on the total moisture content of
stalks (Dželetović et al., 2009), Table 2.
Dry stalks yield, DSY
The average yield of dry miscanthus stalks, for both studied years, was
32.02 kg ha-1
in the control and 33.37 kg ha-1
in the nitrogen top dressing variant.
Biomass yield was statistically significantly influenced by both studied factors,
weather conditions and top dressing (Table 2). Weather conditions in 2019 were
more favorable for the formation of stalks, although there was less precipitation
in the growing season. Therefore, dry stalks’ yield in 2019 was higher by 2,718
kg ha-1
(by 8.86%) in control and by 2,315 kg ha-1
(by 7.19%) in the variant with
nitrogen top dressing, as compared to 2018. On average, dry stalk yield was by
8.01% higher in 2019 compared to 2018. There were also statistically significant
variations between individual treatments (Table 2, Figure 3a). The impact of
meteorological conditions and nitrogen fertilizers on the yield of stalks was
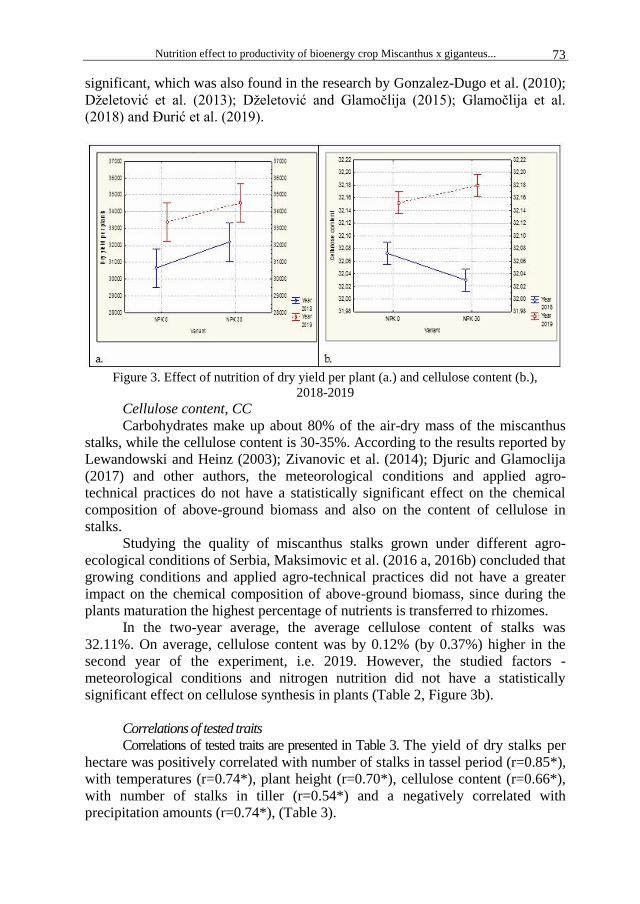
Nutrition effect to productivity of bioenergy crop Miscanthus x giganteus... 73
significant, which was also found in the research by Gonzalez-Dugo et al. (2010);
Dželetović et al. (2013); Dželetović and Glamočlija (2015); Glamočlija et al.
(2018) and Đurić et al. (2019).
Figure 3. Effect of nutrition of dry yield per plant (a.) and cellulose content (b.),
2018-2019
Cellulose content, CC
Carbohydrates make up about 80% of the air-dry mass of the miscanthus
stalks, while the cellulose content is 30-35%. According to the results reported by
Lewandowski and Heinz (2003); Zivanovic et al. (2014); Djuric and Glamoclija
(2017) and other authors, the meteorological conditions and applied agro-
technical practices do not have a statistically significant effect on the chemical
composition of above-ground biomass and also on the content of cellulose in
stalks.
Studying the quality of miscanthus stalks grown under different agro-
ecological conditions of Serbia, Maksimovic et al. (2016 a, 2016b) concluded that
growing conditions and applied agro-technical practices did not have a greater
impact on the chemical composition of above-ground biomass, since during the
plants maturation the highest percentage of nutrients is transferred to rhizomes.
In the two-year average, the average cellulose content of stalks was
32.11%. On average, cellulose content was by 0.12% (by 0.37%) higher in the
second year of the experiment, i.e. 2019. However, the studied factors -
meteorological conditions and nitrogen nutrition did not have a statistically
significant effect on cellulose synthesis in plants (Table 2, Figure 3b).
Correlations of tested traits
Correlations of tested traits are presented in Table 3. The yield of dry stalks per
hectare was positively correlated with number of stalks in tassel period (r=0.85*),
with temperatures (r=0.74*), plant height (r=0.70*), cellulose content (r=0.66*),
with number of stalks in tiller (r=0.54*) and a negatively correlated with
precipitation amounts (r=0.74*), (Table 3).
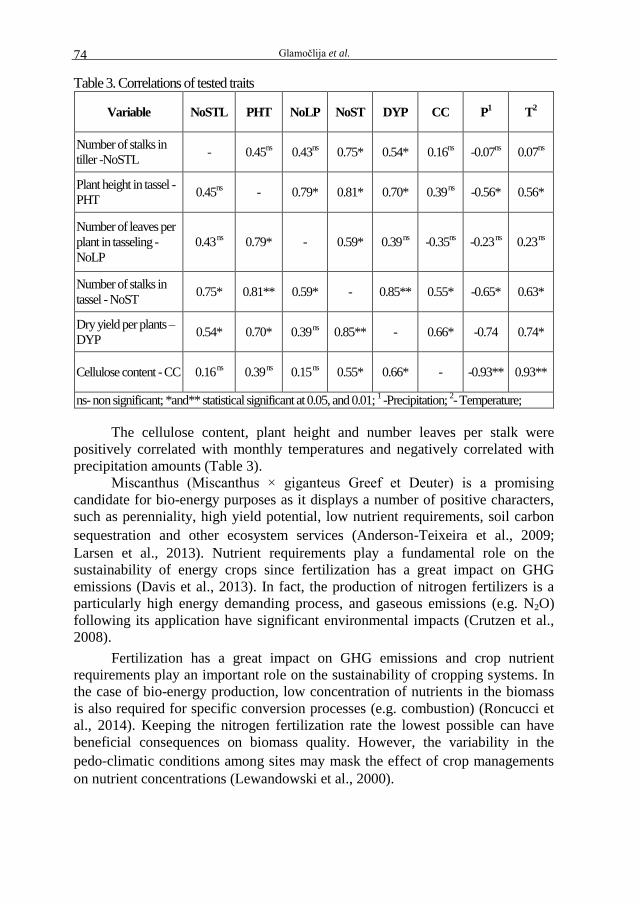
Glamočlija et al. 74
Table 3. Correlations of tested traits
Variable NoSTL PHT NoLP NoST DYP CC P1 T
2
Number of stalks in
tiller -NoSTL - 0.45
ns 0.43
ns 0.75* 0.54* 0.16
ns -0.07
ns 0.07
ns
Plant height in tassel -
PHT 0.45
ns - 0.79* 0.81* 0.70* 0.39
ns -0.56* 0.56*
Number of leaves per
plant in tasseling -
NoLP
0.43 ns
0.79* - 0.59* 0.39 ns
-0.35ns -0.23
ns 0.23
ns
Number of stalks in
tassel - NoST 0.75* 0.81** 0.59* - 0.85** 0.55* -0.65* 0.63*
Dry yield per plants –
DYP 0.54* 0.70* 0.39
ns 0.85** - 0.66* -0.74 0.74*
Cellulose content - CC 0.16 ns
0.39 ns
0.15 ns
0.55* 0.66* - -0.93** 0.93**
ns- non significant; *and** statistical significant at 0.05, and 0.01; 1 -Precipitation;
2- Temperature;
The cellulose content, plant height and number leaves per stalk were
positively correlated with monthly temperatures and negatively correlated with
precipitation amounts (Table 3).
Miscanthus (Miscanthus × giganteus Greef et Deuter) is a promising
candidate for bio-energy purposes as it displays a number of positive characters,
such as perenniality, high yield potential, low nutrient requirements, soil carbon
sequestration and other ecosystem services (Anderson‐Teixeira et al., 2009;
Larsen et al., 2013). Nutrient requirements play a fundamental role on the
sustainability of energy crops since fertilization has a great impact on GHG
emissions (Davis et al., 2013). In fact, the production of nitrogen fertilizers is a
particularly high energy demanding process, and gaseous emissions (e.g. N2O)
following its application have significant environmental impacts (Crutzen et al.,
2008).
Fertilization has a great impact on GHG emissions and crop nutrient
requirements play an important role on the sustainability of cropping systems. In
the case of bio-energy production, low concentration of nutrients in the biomass
is also required for specific conversion processes (e.g. combustion) (Roncucci et
al., 2014). Keeping the nitrogen fertilization rate the lowest possible can have
beneficial consequences on biomass quality. However, the variability in the
pedo‐climatic conditions among sites may mask the effect of crop managements
on nutrient concentrations (Lewandowski et al., 2000).
Nutrition effect to productivity of bioenergy crop Miscanthus x giganteus... 75
CONCLUSIONS Based on the results of studied morphological and productive features of
miscanthus in different and meteorological specific years, the following can be concluded:
•Miscanthus is a perennial plant. After the second or third year, depending on weather conditions, forms a stalk yield that covers production costs;
•This research have shown that seven years old miscanthus crops, planted on chernozem, can thrive under variable water regimes during the growing season. Therefore, in 2018, which was a year with variable precipitation amounts, satisfactory dry stalk yield was achieved;
•The average two-year yield of dry miscanthus stalks was 32.02 kg ha-1
in the control and 33.37 kg ha
-1 in the variant with nitrogen fertilization. Yield
differences indicate that weather conditions and nitrogen fertilizers had a statistically significant effect on yield levels;
•The studied miscanthus population has high genetic potential for biomass yield. High commercial biomass yields can be obtained under favorable water conditions (irrigation during critical water periods);
•Meteorological conditions and nitrogen fertilization did not affect the cellulose content of the stalks.
ACKNOWLEDGEMENTS Research was supported by the Ministry of Education, Science and
Technological Development of the Republic of Serbia (agreement number 451-03-68/2020-14/200032 and 200045) and bilateral project (Montenegro-Serbia; 2019-2020): Alternative cereals and oil crops as a source of healthcare food and an important raw material for the production of biofuel.
REFERENCES Acikel, H., (2011): The use of Miscanthus x giganteus as a plant fiber in concrete
production. Scientific Research and Essays, 6 (13): 2660-2667.
Anderson‐Teixeira KJ, Davis SC, Masters MD, Delucia EH (2009) Changes in soil
organic carbon under biofuel crops. Global Change Biology Bioenergy, 1: 75– 96.
Clifton-Brown, J.C., Lewandowski, I., Anderson, B., Basch, G., Dudley, G.C., Kjeldsen,
J.B., Jørgensen U., Mortensen, J.V., Riche, A., Schwarz, K.U., Tayebi, K.,
Teixwira, F. (2001): Performance of 15 Miscanthus genotypes at five sites in
Europe. Agronomy Journal. 93: 1013-1019.
Clifton Brown, J.C., Lewandowski, I., Bangerth, F., Jones, M.B. (2002): Comparative
responses to water stress in stay green, rapid and slow senescing genotypes of the
biomass crop, Miscanthus. 42NewPhytologist Symposium, Lake Tahoe, CA.
Crutzen, P.J., Mosier, A.R., Smith, K.A., Winiwarter, W. (2008): N2O release from
agro‐biofuel production negates global warming reduction by replacing fossil
fuels. Atmospheric Chemistry and Physics, 8: 389– 395.
Davis, S.C., Boddey, R.M., Alves, B.J.R. (2013) Management swing potential for
bioenergy crops. Global Change Biology Bioenergy, 5: 623– 638.
Djuric, N., Glamoclija, Đ. (2017): Introduction of mischantus in agricultural production
in Serbia and the potential for using biomass for obtaining alternative fuels.
Thematic Proceedings; 453-470. International Scientific Conference, Sustainable
Glamočlija et al. 76
agriculture and rural development in terms of the Republic of Serbia strategic
goals realization within the Danube region - support programs for the
improvement of agricultural and rural development.
Đurić, N., Popović, V., Tabaković, M., Ćurović, M., Jovović, Z., Mladenović Glamočlija,
M., Rakašćan, N., Glamočlija, Đ. (2019): Morphological and productive properties
of miscanthus in a variable water regime. Journal of PKB Agroeconomic,
Belgrade. 25, 1-2:
Dželetović, Ž., N. Mihajlović, Đ. Glamočlija, G. Dražići S. Đorđević (2009): Harvesting
and storage Miscanthus×giganteus Greef et Deu. Agricultural Machinery. 34 (3):
9-16. UDK: 631.147, 633.2.
Dželetović, Ž., I. Živanović, R. Pivić and J. Maksimović (2013): Water supply and
biomass production Miscanthus × giganteus Greef et Deu. Proceedings, 435-450.
The 1st International Congress on Soil Science, XIII National Congress in Soil
Science, Soil-Water-Plant, Belgrade, Serbia, 23-26.09.2013.
Dželetović, Ž. S and Đ. N. Glamočlija (2015): Effect of nitrogen on the distribution of
biomass and element composition of the root system of Miscanthus × giganteus.
Archives of Biological Sciences (Belgrade), 67, 2: 547-560. DOI:
10.2298/ABS141010017D.
Fowler, P.A., McLauchlin, A.R., Hall, L.M. (2003): The potential industrial uses of
forage grasses including miscanthus. BioComposites Centre, University of Wales,
Bangor, 1-37.
Glamočlija, Đ., N. Đurić, M. Spasić (2018): The influence of agro-ecological conditions
on the production properties of miscanthus. 8th
International Symposium on
Natural Resources Managment, 173-178. 19.09.2019. Megatrend University,
Faculty of Managment. Zaječar, Republic of Serbia.
Gonzalez-Dugo, V., Durand, J.-L., Gastal, F. (2010). Water deficit and nitrogen nutrition
of crops. A review. Agron. Sustain. Dev., 30: 529-544; DOI:
10.1051/agro/2009059
Ikanović, J., Popović, V., Janković, S., Rakić, S., Drazić, G., Živanović, Lj., Kolarić, Lj.,
Lakić, Ž. (2015): Production of biomass of miscanthus cultivated on degraded soil.
Journal of Institute PKB Agroekonomik, Belgrade, Serbia. 20, 1-2: 115-123.
Larsen S, Jørgensen U, Kjeldsen J, Lærke P (2013): Long‐term miscanthus yields
influenced by location, genotype, row distance, fertilization and harvest
season. Bioenergy Research, 7: 620–635.
Lewandowski, I., Clifton-Brown, J.C., Scurlock, J.M.O., Huisman, W. (2000).
Miscanthus: European experience with a novel energy crop. Biomass and
Bioenergy, 19: 209–227. DOI: 10.1016/S0961-9534(00)00032-5.
Lewandowski, I. and Heinz, A. (2003): Delayed harvest of miscanthus - influences on
biomass quantity and quality and environmental impacts of energy production.
European Journal of Agronomy, 19, 1: 45-63. DOI: 10.1016/S1161-
0301(02)00018-7.
Maksimović, J., Dželetović, Ž., Dinić, Z., Stanojković- Sebić, A., Pivić, R. (2016a):
Quality analysis of the Miscanthus x giganteus biomass cultivated in agro-
ecological conditions of the R. of Serbia. VII Scien. Agriculture Symposium,
Agrosym, Jahorina, 2008-2014. DOI: 10.7251/AGRENG1607300.
Maksimović, J., Pivić, R., Stanojković-Sebić, A., Vučić-Kišgeci, M., Kresović, B., Dinić,
Z., Glamočlija, Đ. (2016b): Planting density impact on weed infestation and the
yield of Miscanthus grown on two soil types. Plant, Soil and Environment, 62(8):
384-388. DOI: 10.17221/234/2016-PSE.

Nutrition effect to productivity of bioenergy crop Miscanthus x giganteus... 77
Monti, A., Zatta A. (2009): Root distribution and soil moisture retrieval in perennial and
annual energy crops in Northern Italy. Agr. Ecosyst. Environ. 132, 252-259. DOI:
10.1016/j.agee.2009.04.007.
Roncucci N., Nassi O Di Nasso N., Tozzini C., Bonari E., Ragaglini G. (2014).
Miscanthus × giganteus nutrient concentrations and uptakes in autumn and winter
harvests as influenced by soil texture, irrigation and nitrogen fertilization in the
Mediterranean. Bioenergy. doi.org/10.1111/gcbb.12209
Živanović, Lj., Ikanović, J., Popović, V., Simić, D., Kolarić, Lj., Bojović, R., Stevanović,
P. (2014): Effect of planting density and supplemental nitrogen nutrition on the
productivity of miscanthus. Romanian Agricultural Research, No. 31:291-298; DII
2067-5720 RAR 428.


Agriculture & Forestry, Vol. 66 Issue 2: 79-92, 2020, Podgorica 79
Kaloper, S. E., Čadro, S., Uzunović, M., Cherni-Čadro, S. (2020): Determination of erosion intensity in Brka
watershed, Bosnia and Herzegovina. Agriculture and Forestry, 66 (2): 79-92.
DOI: 10.17707/AgricultForest.66.2.08
Selman Edi KALOPER1, Sabrija ČADRO
1,
Mirza UZUNOVIĆ1, Salwa CHERNI-ČADRO
DETERMINATION OF EROSION INTENSITY IN BRKA WATERSHED,
BOSNIA AND HERZEGOVINA
SUMMARY
The Bosnia and Herzegovina (BiH) erosion map was made in 1985, however, over a period of 35 years, there has been a substantial change in the values of most erosion factors, resulting in the change of the erosion intensity. Changes relate to demographics, urbanization and land use as well as climate. The increase in temperature and the occurrence of extremes caused significant environmental and economic consequences (May 2014 floods). This situation is more pronounced in the northern part of the country, especially in the lower parts of the larger basins. Risk assessment procedures using modern software and hardware solutions can help decision-makers to recognize sites where forest should not be cut down, certain crops should not be grown or soil conversation measures are necessary. Therefore, the aim of this research is to estimate the intensity of erosion processes in one such watershed in BiH - the Brka watershed, taking into consideration current conditions and using modern hardware and software solutions. To calculate erosion intensity the Gavrilovic method supported with GIS techniques was used. The soil protection (x), soil erodibility (y) and type and extent of erosion (ϕ) coefficients were calculated using digital maps: CORINE 2018 (grid size 100 m x 100 m) land cover, soil map of BiH and open-source satellite images. The slope was calculated from the BiH digital elevation model (25 m x 25 m). The Brka watershed area (184.09 km
2) was
divided into four basins: Maočka Rijeka (51.56 km2), Rahička Rijeka (24.26
km2), Zovičica (75.30 km
2) and direct basin of Brka (32.94 km
2). The highest
average erosion intensity was determined for Zovičica basin, where Z=0.56. The calculated mean annual production of sediment per basin varies from 5,746 for Rahička Rijeka to 57,089 m
3 year
-1 for Zovičica, with total Brka river watershed
sediment yield of 120,754 m3 year
-1.
Keywords: Gavrilovic method; Erosion intensity; Brka watershed; CORINE; GIS
1Sabrija Čadro (corresponding author: [email protected]), Selman Edi Kaloper, Mirza
Uzunović, University of Sarajevo, Sarajevo, BOSNIA AND HERZEGOVINA 2Salwa Cherni-Čadro, Hydro-Engineering Institute Sarajevo (HEIS), BOSNIA AND
HERZEGOVINA
Paper presented at the GEA (Geo Eco-Eco Agro) International Conference 2020, Podgorica.
Notes: The authors declare that they have no conflicts of interest. Authorship Form signed online.
Received:10/04/2020 Accepted:03/06/2020
Čadro et al. 80
INTRODUCTION
Soil erosion has been considered as the primary cause of soil degradation
and loss. Lately, erosion has become a growing problem when it comes to
environmental and biodiversity protection in the Balkans (Spalevic et al., 2015).
In Bosnia and Herzegovina (BiH), soil erosion intensifies with the negative
effects of man from the time of the ancient Illyrians, Romans, Slavs, etc. to this
day. Logging and burning of forests and converting these areas to arable land
resulted in the occurrence of excessive soil erosion (Sarić et al., 1999). Soil water
erosion is one of the most important causes of soil degradation in BiH, this is
especially true for agricultural land and smallholder farms that are often located
in marginal areas, where the soil quality is poor and the topography is complexed
(J. Žurovec et al., 2017a). With its complex relief, geological and pedological
structure, hydrography, precipitation regime and land use, BiH is highly
vulnerable to destructive processes of erosion and floods, especially in the
northern part of the country (Čadro et al., 2019; O. Žurovec et al., 2017b).
According to Lazarević (1985b), as much as 83% of the total area of BiH is
threatened by water erosion.
When it comes to the analysis of erosion processes in BiH in addition to
local surveys at the parcel level (J. Žurovec & Čadro, 2008; J. Žurovec et al.,
2017a) the Gavrilovic method (Gavrilović, 1972) was used to map and analyze
erosion at the larger-areas. An erosion map of the FR of Bosnia and Herzegovina
was made in the period 1980-1985 (Lazarević, 1985b). Recently, in 2012 an
erosion map of the Entity Republika Srpska in scale 1:25,000 (Radislav Tošić et
al., 2012a; Radislav Tošić et al., 2012b) was made as well as in 2018 the erosion
map of the Vrbas River Basin at a scale of 1:25,000 (Lovrić & Tošić, 2018).
Latterly, there has been a substantial change in the values of most erosion
factors, resulting in the change of erosion intensity. Changes relate to
demographics, urbanization and land use as well as climate (Čadro et al., 2018;
Čadro et al., 2019; Popov et al., 2018; Trbic et al., 2017; O. Žurovec et al.,
2017b). The increase in temperature and the occurrence of extremes caused
significant environmental and economic consequences (May 2014 floods). This
situation is more pronounced in the northern part of the country, especially in the
lower parts of the larger watersheds.
A map of the spatial distribution of the intensity of erosion processes
should be the first step towards a better understanding of the situation in an area
of a basin, as well as a more realistic view of the risks of natural disasters,
especially erosion, floods and landslides. Such a map is essentially a measure for
disaster risk reduction (DRR), a systematic approach to identifying, assessing and
reducing the risks of disaster (Jamieson, 2016).
Therefore, the main objective of this study was to analyze the basic soil
erosion factors and estimate the intensity of erosion processes in the River Brka
watershed, taking into consideration current conditions and using modern
hardware and software solutions.
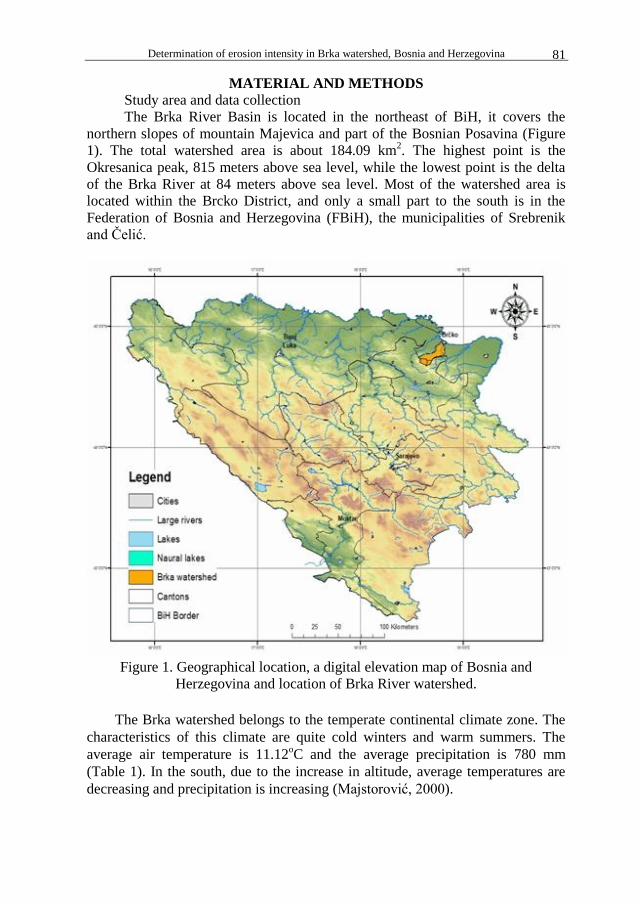
Determination of erosion intensity in Brka watershed, Bosnia and Herzegovina 81
MATERIAL AND METHODS
Study area and data collection
The Brka River Basin is located in the northeast of BiH, it covers the
northern slopes of mountain Majevica and part of the Bosnian Posavina (Figure
1). The total watershed area is about 184.09 km2. The highest point is the
Okresanica peak, 815 meters above sea level, while the lowest point is the delta
of the Brka River at 84 meters above sea level. Most of the watershed area is
located within the Brcko District, and only a small part to the south is in the
Federation of Bosnia and Herzegovina (FBiH), the municipalities of Srebrenik
and Čelić.
Figure 1. Geographical location, a digital elevation map of Bosnia and
Herzegovina and location of Brka River watershed.
The Brka watershed belongs to the temperate continental climate zone. The
characteristics of this climate are quite cold winters and warm summers. The
average air temperature is 11.12oC and the average precipitation is 780 mm
(Table 1). In the south, due to the increase in altitude, average temperatures are
decreasing and precipitation is increasing (Majstorović, 2000).
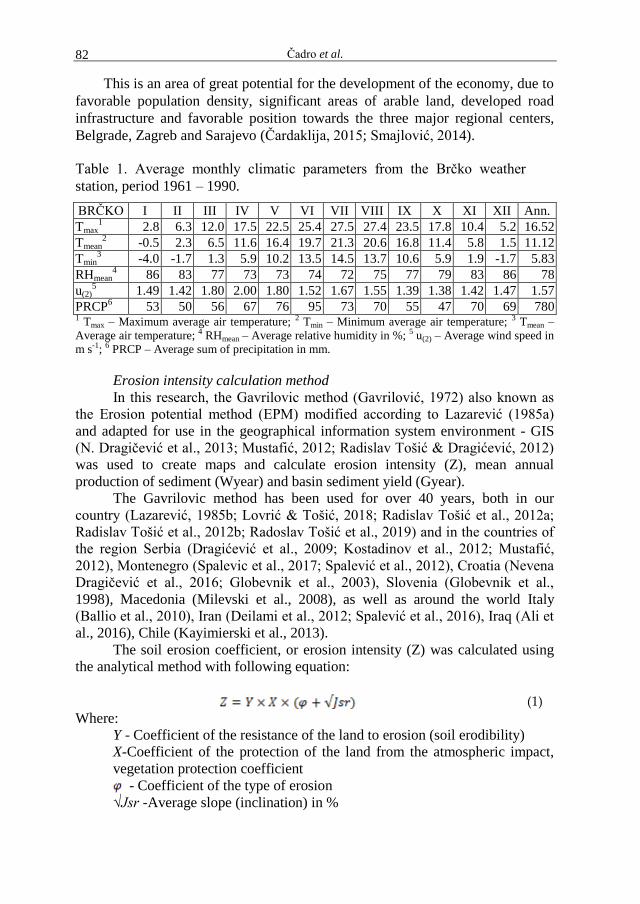
Čadro et al. 82
This is an area of great potential for the development of the economy, due to
favorable population density, significant areas of arable land, developed road
infrastructure and favorable position towards the three major regional centers,
Belgrade, Zagreb and Sarajevo (Čardaklija, 2015; Smajlović, 2014).
Table 1. Average monthly climatic parameters from the Brčko weather
station, period 1961 – 1990.
BRČKO I II III IV V VI VII VIII IX X XI XII Ann.
Tmax1 2.8 6.3 12.0 17.5 22.5 25.4 27.5 27.4 23.5 17.8 10.4 5.2 16.52
Tmean2 -0.5 2.3 6.5 11.6 16.4 19.7 21.3 20.6 16.8 11.4 5.8 1.5 11.12
Tmin3 -4.0 -1.7 1.3 5.9 10.2 13.5 14.5 13.7 10.6 5.9 1.9 -1.7 5.83
RHmean4 86 83 77 73 73 74 72 75 77 79 83 86 78
u(2)5 1.49 1.42 1.80 2.00 1.80 1.52 1.67 1.55 1.39 1.38 1.42 1.47 1.57
PRCP6 53 50 56 67 76 95 73 70 55 47 70 69 780
1 Tmax – Maximum average air temperature; 2 Tmin – Minimum average air temperature; 3 Tmean –
Average air temperature; 4 RHmean – Average relative humidity in %; 5 u(2) – Average wind speed in
m s-1; 6 PRCP – Average sum of precipitation in mm.
Erosion intensity calculation method
In this research, the Gavrilovic method (Gavrilović, 1972) also known as
the Erosion potential method (EPM) modified according to Lazarević (1985a)
and adapted for use in the geographical information system environment - GIS
(N. Dragičević et al., 2013; Mustafić, 2012; Radislav Tošić & Dragićević, 2012)
was used to create maps and calculate erosion intensity (Z), mean annual
production of sediment (Wyear) and basin sediment yield (Gyear).
The Gavrilovic method has been used for over 40 years, both in our
country (Lazarević, 1985b; Lovrić & Tošić, 2018; Radislav Tošić et al., 2012a;
Radislav Tošić et al., 2012b; Radoslav Tošić et al., 2019) and in the countries of
the region Serbia (Dragićević et al., 2009; Kostadinov et al., 2012; Mustafić,
2012), Montenegro (Spalevic et al., 2017; Spalević et al., 2012), Croatia (Nevena
Dragičević et al., 2016; Globevnik et al., 2003), Slovenia (Globevnik et al.,
1998), Macedonia (Milevski et al., 2008), as well as around the world Italy
(Ballio et al., 2010), Iran (Deilami et al., 2012; Spalević et al., 2016), Iraq (Ali et
al., 2016), Chile (Kayimierski et al., 2013).
The soil erosion coefficient, or erosion intensity (Z) was calculated using
the analytical method with following equation:
(1)
Where:
Y - Coefficient of the resistance of the land to erosion (soil erodibility)
X-Coefficient of the protection of the land from the atmospheric impact,
vegetation protection coefficient
- Coefficient of the type of erosion
√Jsr -Average slope (inclination) in %

Determination of erosion intensity in Brka watershed, Bosnia and Herzegovina 83
The quantitative values of the erosion coefficient (Z) have been used to
separate erosion intensity to 5 classes: Excessive erosion (I), Z > 1.00; Intensive
erosion, Z=0.71-1.00; Medium erosion (III), Z=0.41-0.70; Slight erosion (IV),
Z=0.21-0.40; Very slight erosion (V). Z=0.01-0.20 (Lazarević, 1985a).
To calculate mean annual production of sediment per basin - Wyear (m3
year-1
) the
following equations ware used:
(2)
(3)
Where:
T Temperature coefficient (°C)
t Mean annual air temperature (°C)
Hyear Mean annual sum of precipitation (mm)
F Area of the basin (km2)
Multiplying the mean annual production of sediment per basin (Wyear) with
Coefficient of the retention of sediment (Ru) we calculated the mean annual
volume of suspended and transported sediment per basin, or the basin sediment
yield – Gyear (m-3
year-1
). To do so the following equations were applied:
(4)
(5)
(6)
Where:
Ru Coefficient of the retention of sediment
O Basin perimeter (km)
D Average elevation difference of the basin (km)
Ip Length of the main watercourse (km)
Dd Density of the river network per basin (km km-2
)
L Total length of basin watercourse (km)
Ia Length of the secondary watercourse (km)
The boundary of the basin area was determined using Digital terrain model
(DEM: 25 m x 25 m) and Hydrographic network map of BiH; the soil protection
coefficient (X) from CORINE 2018 (grid size 100 m x 100 m) land cover map
based on the X values proposed by Globevnik et al. (2003). Soil erodibility (Y)
was determined on the basis of the BiH soil map (scale 1: 50,000), while for the
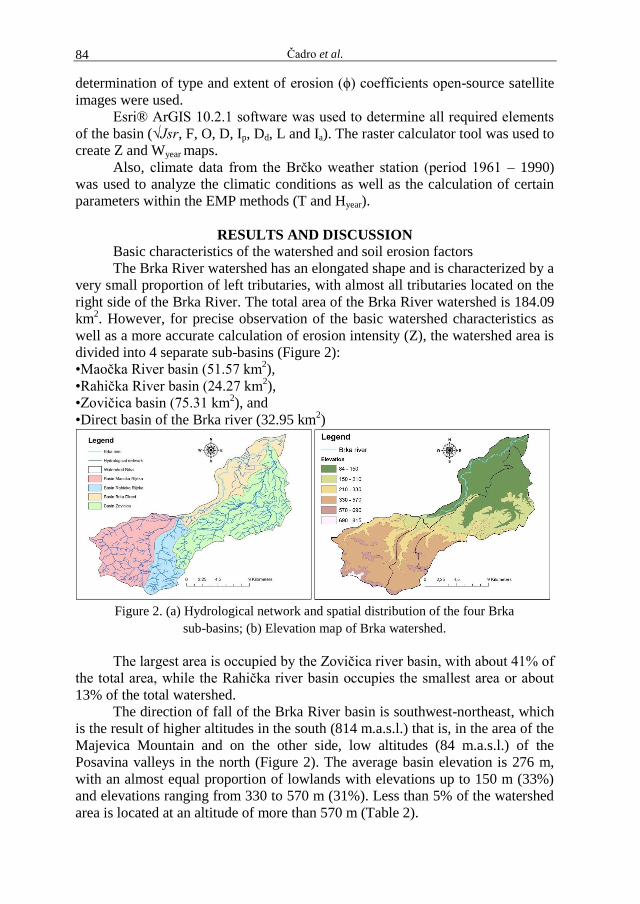
Čadro et al. 84
determination of type and extent of erosion (ϕ) coefficients open-source satellite
images were used.
Esri® ArGIS 10.2.1 software was used to determine all required elements
of the basin (√Jsr, F, O, D, Ip, Dd, L and Ia). The raster calculator tool was used to
create Z and Wyear maps.
Also, climate data from the Brčko weather station (period 1961 – 1990)
was used to analyze the climatic conditions as well as the calculation of certain
parameters within the EMP methods (T and Hyear).
RESULTS AND DISCUSSION
Basic characteristics of the watershed and soil erosion factors
The Brka River watershed has an elongated shape and is characterized by a
very small proportion of left tributaries, with almost all tributaries located on the
right side of the Brka River. The total area of the Brka River watershed is 184.09
km2. However, for precise observation of the basic watershed characteristics as
well as a more accurate calculation of erosion intensity (Z), the watershed area is
divided into 4 separate sub-basins (Figure 2):
•Maočka River basin (51.57 km2),
•Rahička River basin (24.27 km2),
•Zovičica basin (75.31 km2), and
•Direct basin of the Brka river (32.95 km2)
Figure 2. (a) Hydrological network and spatial distribution of the four Brka
sub-basins; (b) Elevation map of Brka watershed.
The largest area is occupied by the Zovičica river basin, with about 41% of
the total area, while the Rahička river basin occupies the smallest area or about
13% of the total watershed.
The direction of fall of the Brka River basin is southwest-northeast, which
is the result of higher altitudes in the south (814 m.a.s.l.) that is, in the area of the
Majevica Mountain and on the other side, low altitudes (84 m.a.s.l.) of the
Posavina valleys in the north (Figure 2). The average basin elevation is 276 m,
with an almost equal proportion of lowlands with elevations up to 150 m (33%)
and elevations ranging from 330 to 570 m (31%). Less than 5% of the watershed
area is located at an altitude of more than 570 m (Table 2).
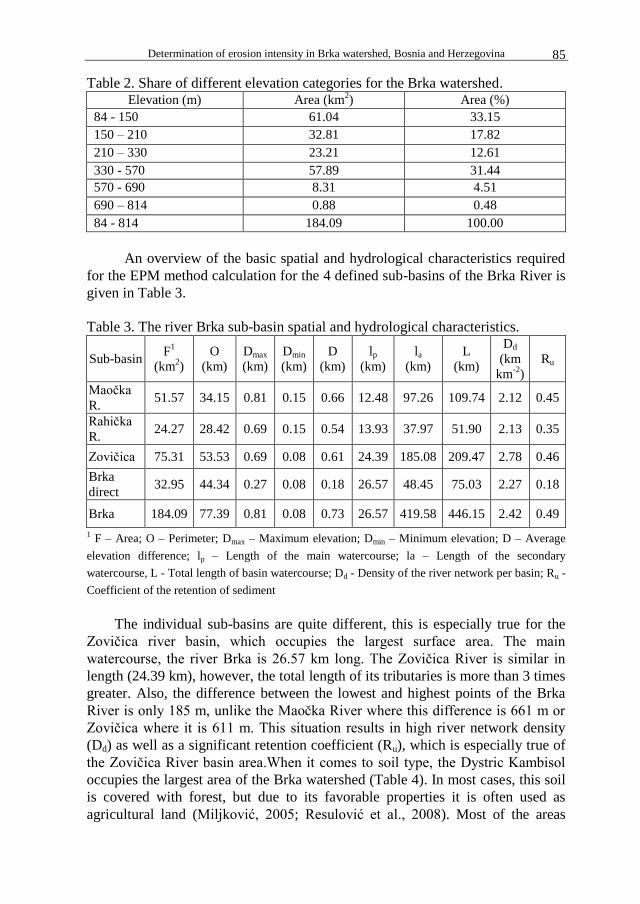
Determination of erosion intensity in Brka watershed, Bosnia and Herzegovina 85
Table 2. Share of different elevation categories for the Brka watershed. Elevation (m) Area (km
2) Area (%)
84 - 150 61.04 33.15
150 – 210 32.81 17.82
210 – 330 23.21 12.61
330 - 570 57.89 31.44
570 - 690 8.31 4.51
690 – 814 0.88 0.48
84 - 814 184.09 100.00
An overview of the basic spatial and hydrological characteristics required
for the EPM method calculation for the 4 defined sub-basins of the Brka River is
given in Table 3.
Table 3. The river Brka sub-basin spatial and hydrological characteristics.
Sub-basin F
1
(km2)
O
(km)
Dmax
(km)
Dmin
(km)
D
(km)
lp
(km)
la
(km)
L
(km)
Dd
(km
km-2
)
Ru
Maočka
R. 51.57 34.15 0.81 0.15 0.66 12.48 97.26 109.74 2.12 0.45
Rahička
R. 24.27 28.42 0.69 0.15 0.54 13.93 37.97 51.90 2.13 0.35
Zovičica 75.31 53.53 0.69 0.08 0.61 24.39 185.08 209.47 2.78 0.46
Brka
direct 32.95 44.34 0.27 0.08 0.18 26.57 48.45 75.03 2.27 0.18
Brka 184.09 77.39 0.81 0.08 0.73 26.57 419.58 446.15 2.42 0.49
1 F – Area; O – Perimeter; Dmax – Maximum elevation; Dmin – Minimum elevation; D – Average
elevation difference; lp – Length of the main watercourse; la – Length of the secondary
watercourse, L - Total length of basin watercourse; Dd - Density of the river network per basin; Ru -
Coefficient of the retention of sediment
The individual sub-basins are quite different, this is especially true for the
Zovičica river basin, which occupies the largest surface area. The main
watercourse, the river Brka is 26.57 km long. The Zovičica River is similar in
length (24.39 km), however, the total length of its tributaries is more than 3 times
greater. Also, the difference between the lowest and highest points of the Brka
River is only 185 m, unlike the Maočka River where this difference is 661 m or
Zovičica where it is 611 m. This situation results in high river network density
(Dd) as well as a significant retention coefficient (Ru), which is especially true of
the Zovičica River basin area.When it comes to soil type, the Dystric Kambisol
occupies the largest area of the Brka watershed (Table 4). In most cases, this soil
is covered with forest, but due to its favorable properties it is often used as
agricultural land (Miljković, 2005; Resulović et al., 2008). Most of the areas
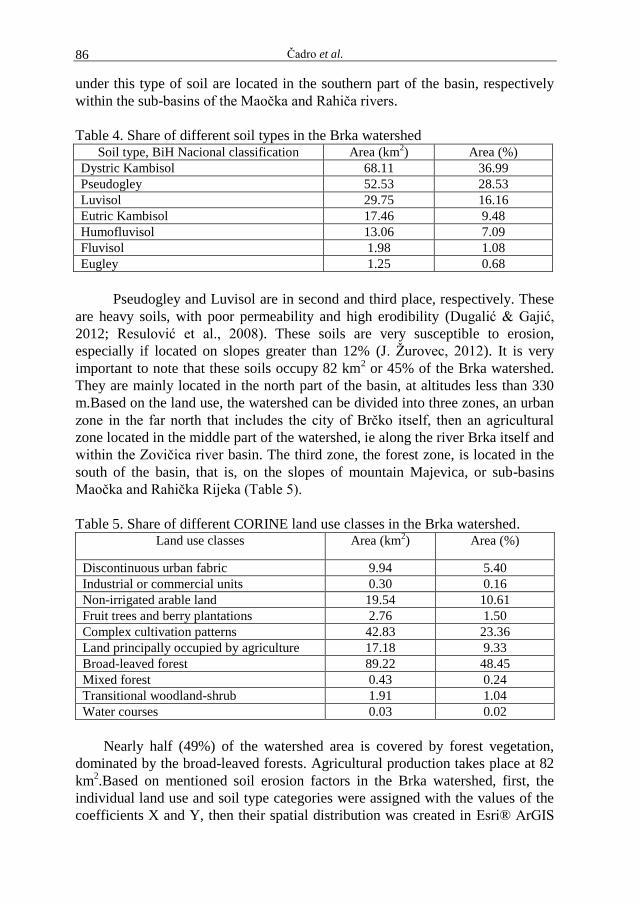
Čadro et al. 86
under this type of soil are located in the southern part of the basin, respectively
within the sub-basins of the Maočka and Rahiča rivers.
Table 4. Share of different soil types in the Brka watershed Soil type, BiH Nacional classification Area (km
2) Area (%)
Dystric Kambisol 68.11 36.99
Pseudogley 52.53 28.53
Luvisol 29.75 16.16
Eutric Kambisol 17.46 9.48
Humofluvisol 13.06 7.09
Fluvisol 1.98 1.08
Eugley 1.25 0.68
Pseudogley and Luvisol are in second and third place, respectively. These
are heavy soils, with poor permeability and high erodibility (Dugalić & Gajić,
2012; Resulović et al., 2008). These soils are very susceptible to erosion,
especially if located on slopes greater than 12% (J. Žurovec, 2012). It is very
important to note that these soils occupy 82 km2 or 45% of the Brka watershed.
They are mainly located in the north part of the basin, at altitudes less than 330
m.Based on the land use, the watershed can be divided into three zones, an urban
zone in the far north that includes the city of Brčko itself, then an agricultural
zone located in the middle part of the watershed, ie along the river Brka itself and
within the Zovičica river basin. The third zone, the forest zone, is located in the
south of the basin, that is, on the slopes of mountain Majevica, or sub-basins
Maočka and Rahička Rijeka (Table 5).
Table 5. Share of different CORINE land use classes in the Brka watershed. Land use classes Area (km
2) Area (%)
Discontinuous urban fabric 9.94 5.40
Industrial or commercial units 0.30 0.16
Non-irrigated arable land 19.54 10.61
Fruit trees and berry plantations 2.76 1.50
Complex cultivation patterns 42.83 23.36
Land principally occupied by agriculture 17.18 9.33
Broad-leaved forest 89.22 48.45
Mixed forest 0.43 0.24
Transitional woodland-shrub 1.91 1.04
Water courses 0.03 0.02
Nearly half (49%) of the watershed area is covered by forest vegetation,
dominated by the broad-leaved forests. Agricultural production takes place at 82
km2.Based on mentioned soil erosion factors in the Brka watershed, first, the
individual land use and soil type categories were assigned with the values of the
coefficients X and Y, then their spatial distribution was created in Esri® ArGIS
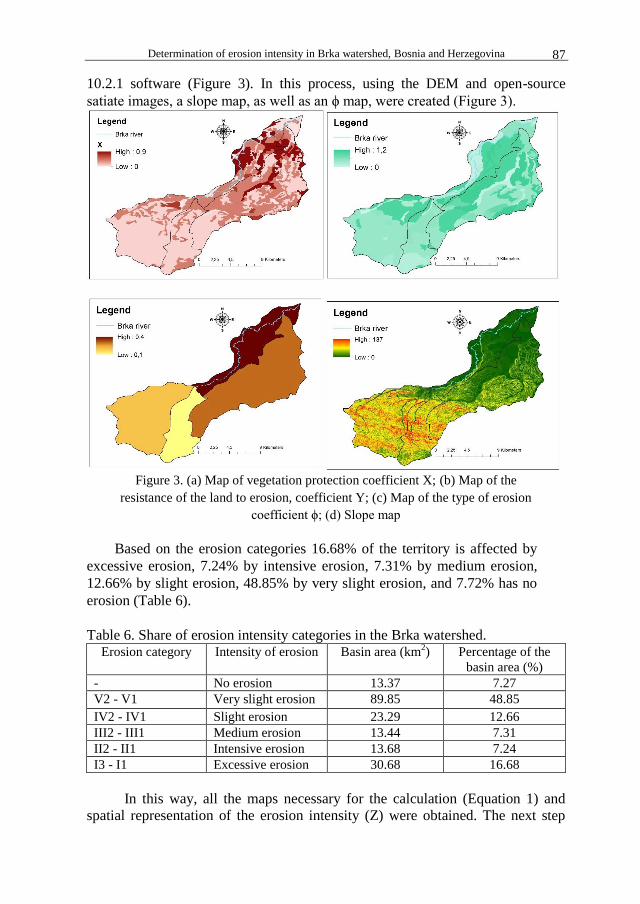
Determination of erosion intensity in Brka watershed, Bosnia and Herzegovina 87
10.2.1 software (Figure 3). In this process, using the DEM and open-source
satiate images, a slope map, as well as an ϕ map, were created (Figure 3).
Figure 3. (a) Map of vegetation protection coefficient X; (b) Map of the
resistance of the land to erosion, coefficient Y; (c) Map of the type of erosion
coefficient ϕ; (d) Slope map
Based on the erosion categories 16.68% of the territory is affected by
excessive erosion, 7.24% by intensive erosion, 7.31% by medium erosion,
12.66% by slight erosion, 48.85% by very slight erosion, and 7.72% has no
erosion (Table 6).
Table 6. Share of erosion intensity categories in the Brka watershed. Erosion category Intensity of erosion Basin area (km
2) Percentage of the
basin area (%)
- No erosion 13.37 7.27
V2 - V1 Very slight erosion 89.85 48.85
IV2 - IV1 Slight erosion 23.29 12.66
III2 - III1 Medium erosion 13.44 7.31
II2 - II1 Intensive erosion 13.68 7.24
I3 - I1 Excessive erosion 30.68 16.68
In this way, all the maps necessary for the calculation (Equation 1) and
spatial representation of the erosion intensity (Z) were obtained. The next step
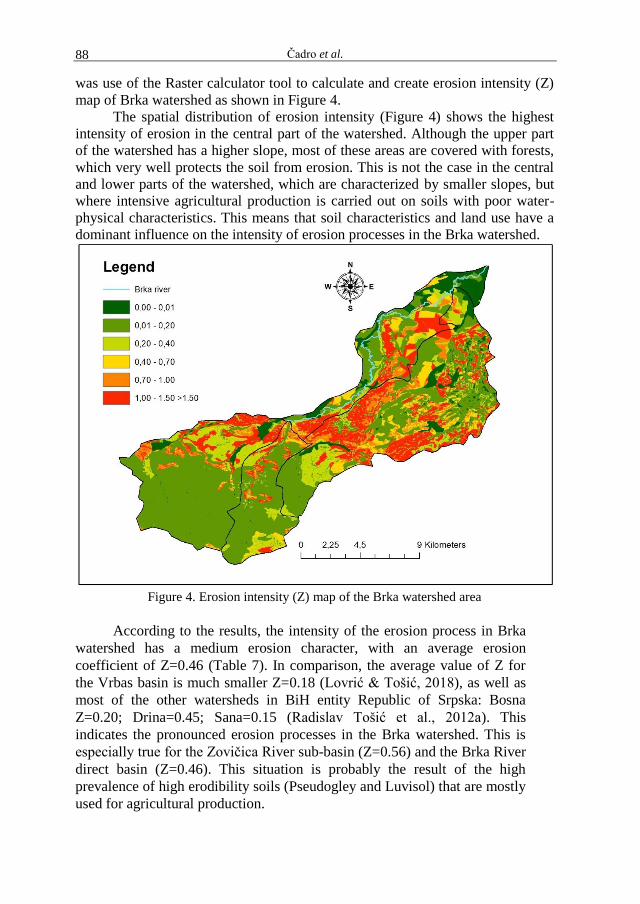
Čadro et al. 88
was use of the Raster calculator tool to calculate and create erosion intensity (Z)
map of Brka watershed as shown in Figure 4.
The spatial distribution of erosion intensity (Figure 4) shows the highest
intensity of erosion in the central part of the watershed. Although the upper part
of the watershed has a higher slope, most of these areas are covered with forests,
which very well protects the soil from erosion. This is not the case in the central
and lower parts of the watershed, which are characterized by smaller slopes, but
where intensive agricultural production is carried out on soils with poor water-
physical characteristics. This means that soil characteristics and land use have a
dominant influence on the intensity of erosion processes in the Brka watershed.
Figure 4. Erosion intensity (Z) map of the Brka watershed area
According to the results, the intensity of the erosion process in Brka
watershed has a medium erosion character, with an average erosion
coefficient of Z=0.46 (Table 7). In comparison, the average value of Z for
the Vrbas basin is much smaller Z=0.18 (Lovrić & Tošić, 2018), as well as
most of the other watersheds in BiH entity Republic of Srpska: Bosna
Z=0.20; Drina=0.45; Sana=0.15 (Radislav Tošić et al., 2012a). This
indicates the pronounced erosion processes in the Brka watershed. This is
especially true for the Zovičica River sub-basin (Z=0.56) and the Brka River
direct basin (Z=0.46). This situation is probably the result of the high
prevalence of high erodibility soils (Pseudogley and Luvisol) that are mostly
used for agricultural production.
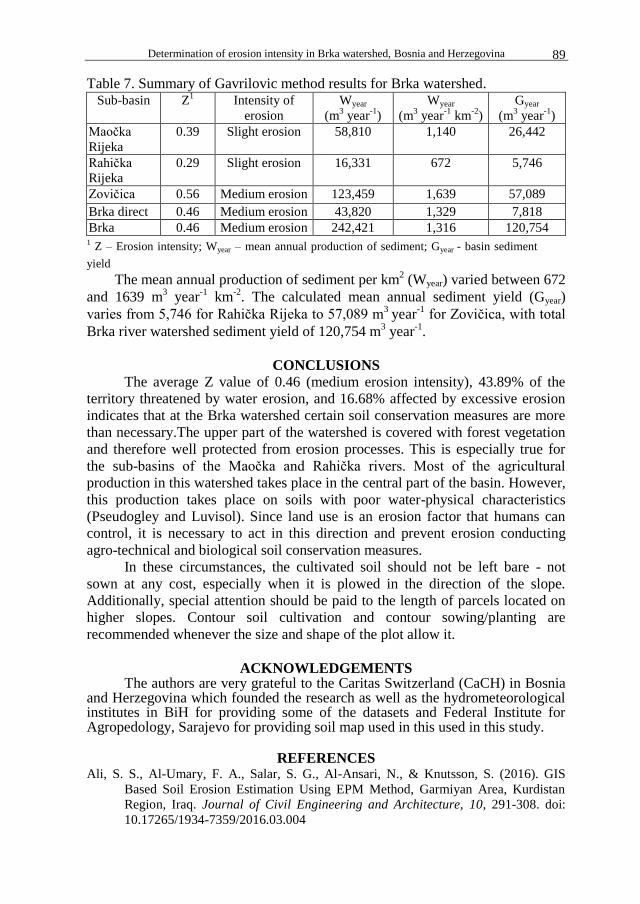
Determination of erosion intensity in Brka watershed, Bosnia and Herzegovina 89
Table 7. Summary of Gavrilovic method results for Brka watershed. Sub-basin Z
1 Intensity of
erosion
Wyear
(m3 year
-1)
Wyear
(m3 year
-1 km
-2)
Gyear
(m3 year
-1)
Maočka
Rijeka
0.39 Slight erosion 58,810 1,140 26,442
Rahička
Rijeka
0.29 Slight erosion 16,331 672 5,746
Zovičica 0.56 Medium erosion 123,459 1,639 57,089
Brka direct 0.46 Medium erosion 43,820 1,329 7,818
Brka 0.46 Medium erosion 242,421 1,316 120,754 1 Z – Erosion intensity; Wyear – mean annual production of sediment; Gyear - basin sediment
yield
The mean annual production of sediment per km2 (Wyear) varied between 672
and 1639 m3 year
-1 km
-2. The calculated mean annual sediment yield (Gyear)
varies from 5,746 for Rahička Rijeka to 57,089 m3
year-1
for Zovičica, with total
Brka river watershed sediment yield of 120,754 m3 year
-1.
CONCLUSIONS
The average Z value of 0.46 (medium erosion intensity), 43.89% of the
territory threatened by water erosion, and 16.68% affected by excessive erosion
indicates that at the Brka watershed certain soil conservation measures are more
than necessary.The upper part of the watershed is covered with forest vegetation
and therefore well protected from erosion processes. This is especially true for
the sub-basins of the Maočka and Rahička rivers. Most of the agricultural
production in this watershed takes place in the central part of the basin. However,
this production takes place on soils with poor water-physical characteristics
(Pseudogley and Luvisol). Since land use is an erosion factor that humans can
control, it is necessary to act in this direction and prevent erosion conducting
agro-technical and biological soil conservation measures.
In these circumstances, the cultivated soil should not be left bare - not
sown at any cost, especially when it is plowed in the direction of the slope.
Additionally, special attention should be paid to the length of parcels located on
higher slopes. Contour soil cultivation and contour sowing/planting are
recommended whenever the size and shape of the plot allow it.
ACKNOWLEDGEMENTS The authors are very grateful to the Caritas Switzerland (CaCH) in Bosnia
and Herzegovina which founded the research as well as the hydrometeorological institutes in BiH for providing some of the datasets and Federal Institute for Agropedology, Sarajevo for providing soil map used in this used in this study.
REFERENCES Ali, S. S., Al-Umary, F. A., Salar, S. G., Al-Ansari, N., & Knutsson, S. (2016). GIS
Based Soil Erosion Estimation Using EPM Method, Garmiyan Area, Kurdistan
Region, Iraq. Journal of Civil Engineering and Architecture, 10, 291-308. doi:
10.17265/1934-7359/2016.03.004

Čadro et al. 90
Ballio, F., Brambilla, D., Giorgetti, E., Longoni, L., Papini, M., & Radice, A. (2010).
Evaluation of sediment yield from valley slopes: a case study. Paper presented at
the the Monitoring, Simulation, Prevention and Remediation of Dense and Debris
Flows III, Milano, Italy.
Čadro, S., Miseckaite, O., Gavrić, T., Baublys, R., & Žurovec, J. (2018). Impact of
Climate Change on the Annual Water Balance in a Humid Climate Agriculture &
Forestry (Vol. 64, pp. 129-143). Podgorica.
Čadro, S., Uzunovic, M., Cherni-Čadro, S., & Žurovec, J. (2019). Changes in the Water
Balance of Bosnia and Herzegovina as a Result of Climate Change. Agriculture
and Forestry, 65(3).
Čardaklija, H. (2015). Ekološki status rijeke Brke (neposredni sliv save). (Bsc),
University in Sarajevo, Sarajevo.
Deilami, B. R., Sheikhi, M. L. A., Al-Saffar, M. R. A., & Barati, V. (2012). Estimation of
erosion and sedimentation in Karoon Basin using EPM with in geographic
information system. Engineering science and technology: An International
Journal, 2(5), 2250-3498.
Dragičević, N., Karleuša, B., & Ožanić, N. (2013). GIS based monitoring database for
Dubračina river catchment area as a tool for mitigation and prevention of flash
flood and erosion. Paper presented at the The thirteenth International Symposium
on Water Management and Hydraulic Engineering, Bratislava, Sovakia.
Dragičević, N., Karleuša, B., & Ožanić, N. (2016). Erosion Potential Method (Gavrilović
Method) Sensitivity Analysis. Soil & Water Res. doi: doi: 10.17221/27/2016-SWR
Dragićević, S., Novković, I., & Milutinović, M. (2009). The erosion intensity changes in
Zaječar municipality. Bulletin of the Serbian geographical society, 89(4), 3-10.
Dugalić, G., & Gajić, B. (2012). Pedologija. Čačak: Univerzitet u Kragujevcu,
Agronomski fakultet u Čačku.
Gavrilović, S. (1972). Inženjering u bujičnim tokovima i eroziji. Beograd: Časopis
"Izgradnja"
Globevnik, L., Holjevic, D., Petkovsek, G., & Rubinic, J. (2003). Applicability of the
Gavrilovic method in erosion calculation using spatial data manipulation
techniques, erosion prediction in Ungauged Basins: integrating methods and
techniques. Paper presented at the Symposium HS01, Sapporo.
Globevnik, L., Sovinc, A., & Fazarinc, R. (1998). Land degradation and environmental
changes in the Slovenian submediterranean (The Dragonja River Catchment).
Geoökodynamik, XIX, 281-291.
Jamieson, T. (2016). Disastrous measures: Conceptualizing and measuring disaster risk
reduction. International Journal of Disaster Risk Reduction, Volume 19(October
2016), Pages 399-412. doi: https://doi.org/10.1016/j.ijdrr.2016.09.010
Kayimierski, L. D., Irigoyen, M., Re, M., Menendey, A. N., Spalletti, P., & Brea, J. D.
(2013). Impact of climate change on sediment yield from the upper Plata basin.
International Journal of River Basin Management, 11(4), 1-11. doi:
http://dx.doi.org/10.1080/15715124.2013.82806
Kostadinov, S., Radić, B., Dragović, N., & Todosaljević, M. (2012). Unknown soil
erosion and the possibility of its control in the watershed of the water reservoir
“Prvonek”. Paper presented at the the 15th International Congress of ISCO.
Lazarević, R. (1985a). Novi postupak za određivanje koeficijenta erozije Erozija 12.
Beograd: Društvo bujičara Jugoslavije.
Determination of erosion intensity in Brka watershed, Bosnia and Herzegovina 91
Lazarević, R. (1985b). Soil erosion map of Bosnia and Herzegovina in scale 1:25000
Final Report for 1985 year (pp. 2-43). Sarajevo: Institute for water management
Sarajevo.
Lovrić, N., & Tošić, R. (2018). Assessment of soil erosion and sediment yield using
erosion potential method: Case study - Vrbas river basin (B&H). Bulletin of the
Serbian geographical society, 98(1). doi:
https://doi.org/10.2298/GSGD180215002L
Majstorović, Ž. (2000). Studija klimatoloških karakteristika sjevernog oboda Majevice.
Sarajevo: Federal Hidrometeorological Institute.
Milevski, I., Blinkov, I., & Trendafilov, A. (2008). Soil erosion processes and modelling
in the upper Bregalnica catchment. Paper presented at the the conference of the
Danubial countries on the hydrological forecasting and hydrological bases of
water management (XXIV), Bled, Slovenia.
Miljković, S. N. (2005). Meliorativna pedologija. Novi Sad, Srbija: Univerzitet u Novom
Sadu, Poljoprivredni fakultet. Javno vodoprivredno preduzeće "Vode Vojvodine".
Mustafić, S. (2012). Geografski faktori kao determinante intenziteta erozije na primjeru
sliva Nišave. (PhD), University of Belgrade, Belgrade.
Popov, T., Gnjato, S., Trbic, G., & Ivanisevic, M. (2018). Recent Trends in Extreme
Temperature Indices in Bosnia and Herzegovina. Carpathian Journal of Earth and
Environmental Sciences, 13(1), 211-224. doi: 10.26471/cjees/2018/013/019
Resulović, H., Čustović, H., & Čengić, I. (2008). Sistematika tla/zemljišta - Nastanak,
svojstva i plodnost. Sarajevo: Univerzitet u Sarajevu, Poljoprivredno-prehrambeni
Fakultet.
Smajlović, A. (2014). Fizičkogeografske karakteristike sliva rijeke Brke. (Master),
University in Tuzla, Tuzla.
Spalevic, V., Barovic, G., Mitrovic, M., Hodzic, R., Mihajlovic, G., & Frankl, A. (2015).
Assessment of sediment yield using the Erosion Potential Method (EPM) in the
Karlicica watershed of Montenegro. Paper presented at the International
Conference on Soil, Tirana, Albania.
Spalevic, V., Lakicevic, M., Radanovic, D., Billi, P., Barovic, G., Vujacic, D., . . .
Khaledi Darvishan, A. (2017). Ecological-Economic (Eco-Eco) Modelling in the
River Basins of Mountainous Regions: Impact of Land Cover Changes on
Sediment Yield in the Velicka Rijeka, Montenegro. Not Bot Horti Agrobo, 45(2),
602-610. doi: DOI:10.15835/nbha45210695
Spalević, V., Behzadfar, A., Tavares, A. S., Moteva, M., & Tanaskovik, V. (2016). Soil
loss estimation of s7-2 catchment of the shirindareh watershed, iran using the river
basin model. AGROFOR - International Journal. doi:
http://dx.doi.org/10.7251/AGRENG1601113S
Spalević, V., Moahoney, W., Djurovic, N., Uzen, N., & Čurović, M. (2012). Calculation
of soil erosion intensity and maximum outflow from the Rovacki River Basin,
Montenegro. Agriculture & Forestry,, 58(3), 7-21.
Sarić, T., Beus, V., Gadžo, D., & Đikić, M. (1999). Uništavanje i zaštita zemljišta.
Sarajevo: Garmond.
Tošić, R., & Dragićević, S. (2012). Methodology update for determination of the erosion
coeffitient (Z). Bulletin of the Serbian geographical society, XCII(1), 11-26. doi:
10.2298/GSGD1201011T
Tošić, R., Dragićević, S., & Lovrić, N. (2012a). Assessment of soil erosion and sediment
yield changes using erosion potential method - Case study: Republic of Srpska –
BiH. Carpathian Journal of Earth and Environmental Sciences, 7(4), 147-154.
Čadro et al. 92
Tošić, R., Dragićević, S., Zlatić, M., Todosiljević, M., & Kostadinov, S. (2012b). The
impact of socio-demographic changes on land use and soil erosion (case study:
Ukrina River catchment). Geographical Reviews, 46, 69-78.
Tošić, R., Lovrić, N., & Dragićević, S. (2019). Assessment of the impact of depopulation
on soil erosion: case study – republika srpska (bosnia and herzegovina).
Carpathian Journal of Earth and Environmental Sciences, 14(2), 505-518. doi:
10.26471/cjees/2019/014/099
Trbic, G., Popov, T., & Gnjato, S. (2017). Analysis of air temperature trends in Bosnia
and Herzegovina. Geographica Pannonica, 21(2), 68-84. doi: 10.18421/Gp21.02-
01
Žurovec, J. (2012). Melioracije i uređenje poljoprivrednog zemljišta. Sarajevo:
Univerzitet u Sarajevu, Poljoprivredno-prehrambeni fakultet.
Žurovec, J., & Čadro, S. (2008). Erosion Risk on the Arable Soils on the Hill Area of
Canton Sarajevo. Radovi Poljoprivrednog Fakulteta Univerziteta u Sarajevu,
59(2), 299-310.
Žurovec, J., Čadro, S., Sinanović, K., Husić, S., Sehić, D., & Mrkulić, A. (2017a).
Procjena erozije i moguće mjere konzervacije poljoprivrednog tla na području
Željeznog Polja-Assessment of Erosion and Possible Conservation Measures of
Agricultural Soil in the Area of Željezno Polje. Works of the Faculty of
Agriculture and Food Sciences, University of Sarajevo, LXII(67/2), 299-311.
Žurovec, O., Čadro, S., & Sitaula, B. K. (2017b). Quantitative Assessment of
Vulnerability to Climate Change in Rural Municipalities of Bosnia and
Herzegovina. Sustainability, 9(1208), 18. doi: 10.3390/su9071208
Agriculture & Forestry, Vol. 66 Issue 2: 93-98, 2020, Podgorica 93
Popović, D., Vitomir, J., Jokić, M., Arnautović, I., Vrhovac, D., Barović, N., Vujinović, K., Popović, S. (2020):
Implementation of internal audit in companies intending to operate on the principles of green economy in the
Republic of Serbia. Agriculture and Forestry, 66 (2): 93-98.
DOI: 10.17707/AgricultForest.66.2.09
Dragana POPOVIĆ1, Jelena VITOMIR
2, Maja JOKIĆ
3,
Ivan ARNAUTOVIĆ4, Dražen VRHOVAC
5, Nemanja BAROVIĆ
6,
Ksenija VUJINOVIĆ7, Slobodan POPOVIĆ
8
IMPLEMENTATION OF INTERNAL AUDIT IN COMPANIES
INTENDING TO OPERATE ON THE PRINCIPLES OF GREEN
ECONOMY IN THE REPUBLIC OF SERBIA
SUMMARY
Introduced international audit in the business of companies that want to
serve with respect for the principles of green economy can say that they will best
succeed in achieving results in the work of significant enterprises. One of the
important factors is the existence of professional staff leading the internal audit
business, which can reduce the overall risks in the management of the top
management of significant companies. Top management should serve as the
supreme organ of the company, which is of utmost importance for the continued
successful operation of the company. Establishing an internal audit mechanism is
done by external management and we need to make use of overall corporate
governance, that is, the results of the future are visible. Internal audit uses in its
work new knowledge of the internal audit profession and liaises with the adopted
central political enterprises, in this case companies interested in the popular
implementation of green policy.
Keywords: internal audit, process management, enterprise.
INTRODUCTION
Corporate governance requires company management to organize itself as
a team that will appreciate the expertise and assistance in managing all parts of
the enterprise. Therefore, it seeks to find new innovative approaches by which it
1Dragana Popović, University of Novi Sad, Economic Faculty of Subotica, Subotica, Republic of
SERBIA. 2Jelena Vitomir, Assistant Professor, Faculty of Business Studies Belgrade, Republic of SERBIA. 3Maja Jokić, University of Novi Sad, Faculty of Technical Sciences, Republic of SERBIA. 4Ivan Arnautović, High School of Entrepreneurship, Belgrade, Republic of SERBIA. 5Dražen Vrhovac, PIO Fund, Prijedor, BOSNIA AND HERZEGOVINA. 6Nemanja Barović, Tax administration of the Republic of Srpska, Prijedor, BOSNIA AND
HERZEGOVINA. 7Ksenija Vujinović, Vojvodjanska Bank doo, Novi Sad, Republic of SERBIA. 8Slobodan Popović, (corresponding author: [email protected]) JKP Gradsko
Zelenilo Novi Sad, Republic of SERBIA.
Paper presented at the GEA (Geo Eco-Eco Agro) International Conference 2020, Podgorica.
Notes: The authors declare that they have no conflicts of interest. Authorship Form signed online.
Received:25/04/2020 Accepted:15/06/2020
Popović et al. 94
will be able to make important business decisions, and one such way is the
introduction of internal audit in the business of the company (Wyatt, 2004). It is a
process by which valid business decisions can be made in companies that have
adopted business principles that are in line with green policy (Wyatt, 2004).
The management thus observed can bring many benefits (Lee, 2019) which
are reflected in the achievement of results of the enterprise business. In this paper,
the authors draw attention to the importance of obtaining top management
information from internal auditors who submit the results of their work in the
form of recommendations. In order for internal auditors to make
recommendations to top management, they must complete additional training in
internal audit, and at the same time have the level of knowledge, ability and
motivation to work in very specific conditions in the company.
Companies in their regular operations should use the recommendations of
internal auditors (Cantino, 2009), because their implementation can improve the
performance of companies (Damodaran, 2007; Popović et al., 2015; Endaya &
Hanefah, 2013) as a whole, which is visible in the form of achieved business
results.
Internal auditors submit recommendations to the top management after the
audit work has been done at the company (Daske et al., 2008; Gaetano and
Lamonaca, 2019) which have been largely done as standard reports (Bojović et
al., 2019; Terzić et al., 2019; Williams, 2010).
The aim of this research is to study the influence of the size of the
interstitial spacing at the same density of crops on the productivity of soybean
photosynthesis. Based on the results it will be given recommendation for modern
soybean technology.
MATERIAL AND METHODS To create the paper, the authors used commonly accepted management
models in enterprises, which has been highlighted in numerous papers such as
(Mihailović, 2005; Popović, 2015; Rodriguez et al., 2019; Radović et al., 2019).
The basis for the study was the analysis of recommendations received from
internal auditors who otherwise submit standard to top management in their work.
The aim was to view internal audit as an auxiliary factor in the work of top
management in companies that have embraced the principles of green economy.
RESULTS AND DISCUSSION
The internal audit organization model until a business decision is made
Respecting the above, the authors provided a possible model showing the
decision-making stages in companies in the Republic of Serbia (Figure 1).
The essential work of the internal auditor presupposes the independence of
the work of the internal auditor, and especially in this paper, the authors of the
study emphasize the importance of making audit reports according to top
management.

Implementation of internal audit in companies intending to operate on the principles... 95
Figure 1. A model that implements the work of internal auditors in the decision-making
process of top management in companies that have embraced green economy principles.
Security of the work of internal auditors in decision making process in the
company
The authors of the study have drawn up a possible account of the course of
professional training regarding the functioning of internal audit in companies that
accept the principles of green economy in the Republic of Serbia. The author's
view is given by the illustration in Figure 2.
Figure 2. Model that enables continuous training of internal auditors in companies that
accept the principles of green economy in Serbia.
Continuous training of internal auditors should include the following areas:
• Knowledge of how the management bodies operate in the company;
• Knowledge and understanding of the basic audit principles and practices that all
auditors should possess;
• Training related to accounting principles and accounting policies within an
enterprise;
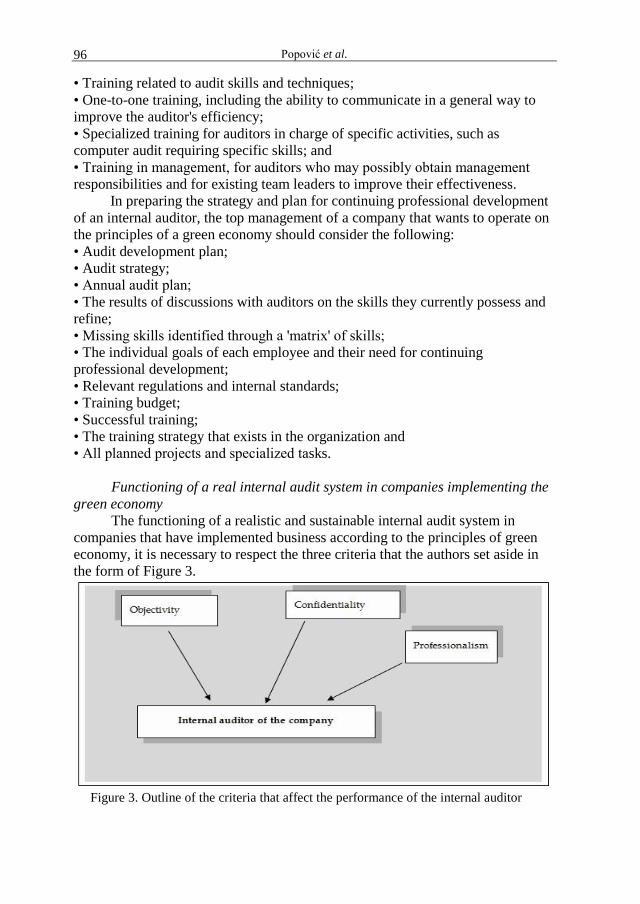
Popović et al. 96
• Training related to audit skills and techniques;
• One-to-one training, including the ability to communicate in a general way to
improve the auditor's efficiency;
• Specialized training for auditors in charge of specific activities, such as
computer audit requiring specific skills; and
• Training in management, for auditors who may possibly obtain management
responsibilities and for existing team leaders to improve their effectiveness.
In preparing the strategy and plan for continuing professional development
of an internal auditor, the top management of a company that wants to operate on
the principles of a green economy should consider the following:
• Audit development plan;
• Audit strategy;
• Annual audit plan;
• The results of discussions with auditors on the skills they currently possess and
refine;
• Missing skills identified through a 'matrix' of skills;
• The individual goals of each employee and their need for continuing
professional development;
• Relevant regulations and internal standards;
• Training budget;
• Successful training;
• The training strategy that exists in the organization and
• All planned projects and specialized tasks.
Functioning of a real internal audit system in companies implementing the
green economy
The functioning of a realistic and sustainable internal audit system in
companies that have implemented business according to the principles of green
economy, it is necessary to respect the three criteria that the authors set aside in
the form of Figure 3.
Figure 3. Outline of the criteria that affect the performance of the internal auditor
Implementation of internal audit in companies intending to operate on the principles... 97
The job of an internal auditor in a green company should be performed by
those persons who work according to the following principles:
• Work exclusively in jobs for which they have the necessary knowledge, skills
and experience;
• Conduct business in accordance with standards and methodologies for
collecting information on potential risks;
• Ensure that they acquire the necessary basic skills necessary to perform the
tasks entrusted to them;
• Take responsibility for the continuous improvement of their expertise in order to
raise the quality and effectiveness to a higher level.
CONCLUSIONS
The functioning of the work of an internal auditor in a company that
functions according to the adopted principles of green economy in companies in
the Republic of Serbia should be viewed as a process. It is of increasing
importance in companies that have introduced internal auditing in their regular
operations, and substantially top management needs to meet the objectivity,
expertise and responsibility expected of the appointed internal auditors.
Companies that have not yet implemented an internal audit should create
the conditions for it to be introduced, that is, they must have a motive to introduce
an internal audit in their work.
Introduced internal audit in green economy companies will only do so if
they expect the benefits of introduction. The study authors point out that only
professional, motivated staff performing internal audit tasks can improve
management by management.
REFERENCES Bojović, R., Popović, V., Ikanović, J., Živanović, Lj., Rakaščan, N., Popović, S.,
Ugrenović, V. & Simić, D. (2019): Morphological characterization of sweet
sorghum genotypes across environments, The Journal of Anim. Plant Sciences, 29
(3): 721-729.
Cantino, V. (2009): Korporativno uptravljanje, merenje performansi i normativna
usaglašenost sistema internih kontrola, Beograd, Data Status.
Damodaran, A. (2007): Korporativne finansije: teorija i praksa, Podgorica, Modus.
Daske, H., Hail, L., Leuz, C. and Verdi, R. (2008): Mandatory IFRS Reporting Around
the World: Early evidence on the economic consequences. Journal of Accounting
Research. 46: 1085-1142.
Gaetano, S. and Lamonaca, E. (2019): On the drivers of global grain price volatility: an
empirical investigation. Agric. Econ. – Czech, 65: 31-42.
Endaya, K. and Hanefah, M. (2013): Internal Audit Effectiveness: An Approach
Proposition to Develop the Theoretical Framework. Research Journal of Finance
and Accounting. 4(10): 92-102.
Lee, J. (2019): Regional heterogeneity among non-operating earnings quality, stock
returns, and firm value in biotech industry. Agric. Econ. – Czech, 65: 10-20.
Popović et al. 98
Mihailović B. (2005): Marketing. Book. Cetinje.
Popović S, (2015): Implementacija heterogenih rizika u radu interne revizije, Revizor
69/2015, Institut za ekonomiku i finansije, Beograd.
Popović, S., Ugrinović, M., Tomašević, S. (2015): Upravljanje menadžmenta
poljoprivrednog preduzeća preko praćenja ukupnih troškova održavanja traktora,
Poljoprivredna tehnika, 2: 101-106.
Radović, M., Vitomir, J., Laban, B., Jovin, S., Nastić, S., Popović, V. & Popović S.
(2019a): Management of joint-stock companies and farms by using fair value of
agricultural equipment in financial statements on the example of IMT 533 Tractor,
Economics of Agriculture, 1: 35-50
Radović, M., Vitomir, J. And Popović, S. (2019a): The Importance of Implementation of
Internal Audit in Enterprises Founded by the Republic of Serbia, LEX Localis-
Journal of Local Self-Government. 17 (4), 1001–1011.
Rodriguez, M., Miguel, Sanchez, L., Cejudo, E. and Antonio, C. (2019): Variety in local
development strategies and employment: LEADER programme in Andalusia.
Agric. Econ. Czech, 65: 43-50.
Terzić, D., Popović, V., Malić, N, Ikanović, J, Rajičić, V., Popović, S., Lončar, M. and
Lončarević. V. (2019): Effects of long-term fertilization on yield of siderates and
organic matter content of soil in the process of recultivation, The Journal of Anim.
Plant Sciences. 29 (3): 790-795.
Williams, C. (2010): Principi menadžmenta, Data Status, Beograd.
Wyatt A, (2004): Accounting professionalism: they just don’t get it! Accounting
Horizons, 18: 45–53.
Agriculture & Forestry, Vol. 66 Issue 2: 99-107, 2020, Podgorica 99
Šimunić, I., Vukelić-Sutoska, M., Spalević, V., Škatarić, G., Tanaskovik, V., Markoski, M. (2020): Ameliorative
measures aimed at prevention/mitigation consequences of climate change in agriculture in Croatia. Agriculture
and Forestry, 66 (2): 99-107.
DOI: 10.17707/AgricultForest.66.2.10
Ivan ŠIMUNIĆ1, Marija VUKELIĆ-SHUTOSKA2, Velibor SPALEVIĆ
3,
Goran ŠKATARIĆ4, Vjekoslav TANASKOVIK
2, Mile MARKOSKI
2
AMELIORATIVE MEASURES AIMED AT PREVENTION/MITIGATION
CONSEQUENCES OF CLIMATE CHANGE IN AGRICULTURE
IN CROATIA
SUMMARY
Climate change can be represented as a change in climate elements
(temperature, precipitation, humidity, wind, insolation) relative to average values,
or as a change in the distribution of climate events relative to average values.
Climate change causes more frequent occurrences of floods and droughts, which
can cause major damage to agriculture and the environment.
Ameliorative measures in hydrotechnical amelioration include protection
from flood and catchment waters, drainage of surplus water land and irrigation
(Soskic et al, 2001). Protection of a certain area from flooding and catchment
water implies hydrotechnical measures and solutions aimed at preventing or
diminishing harmful effects and consequences of surface runoff of large amounts
of precipitation or torrents water from higher elevations to lower parts, as well as
consequences of flooding events from watercourses and other water bodies in the
riparian and a wider area. Drainage of surplus water from a land area can be
achieved by designing an adequate drainage system (hydro‒ameliorative drainage
system) consisting of different technical solutions and structures: pumping
stations channels/pipes for various purposes, of different dimensions and shapes,
additional structures/equipment and infrastructures (roads, bridges). For the
purpose of preventing or mitigating droughts as a natural occurrence that causes a
shortage of water in the soil (rhizosphere), an amelioration measure of irrigation
should be provide favourable soil moisture condition for plant growth and
development where there is lack of precipitation in an area. Successful
agricultural production can be achieved if there is a favourable water-air ratio in
1Ivan Šimunić (corresponding author: [email protected]), University of Zagreb, Faculty of
Agriculture, Department of Soil Amelioration, CROATIA. 2Marija Vukelić-Shutoska, Vjekoslav Tanaskovik, Mile Markovski, Faculty of Agricultural
Sciences and Food, Ss. Cyril and Methodius University, Skopje, NORTH MACEDONIA. 3Velibor Spalević, University of Montenegro, Faculty of Philosophy, Geography, Danila Bojovica
bb, Niksic, MONTENEGRO. 4Goran Škatarić, National parks of Montenegro, Podgorica, MONTENEGRO.
Paper presented at the GEA (Geo Eco-Eco Agro) International Conference 2020, Podgorica.
Notes: The authors declare that they have no conflicts of interest. Authorship Form signed online.
Received:15/05/2020 Accepted:17/06/2020
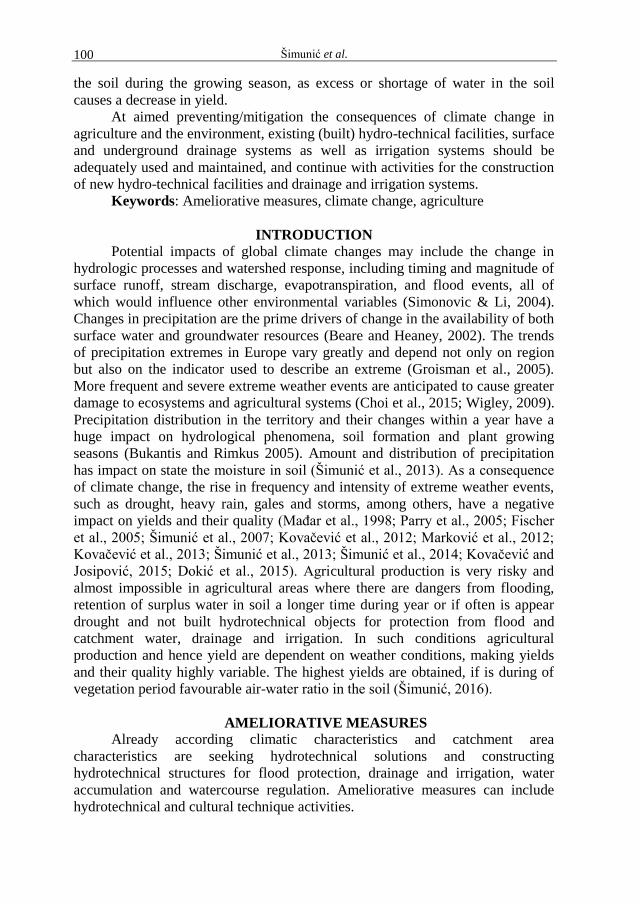
Šimunić et al. 100
the soil during the growing season, as excess or shortage of water in the soil
causes a decrease in yield.
At aimed preventing/mitigation the consequences of climate change in
agriculture and the environment, existing (built) hydro-technical facilities, surface
and underground drainage systems as well as irrigation systems should be
adequately used and maintained, and continue with activities for the construction
of new hydro-technical facilities and drainage and irrigation systems.
Keywords: Ameliorative measures, climate change, agriculture
INTRODUCTION
Potential impacts of global climate changes may include the change in
hydrologic processes and watershed response, including timing and magnitude of
surface runoff, stream discharge, evapotranspiration, and flood events, all of
which would influence other environmental variables (Simonovic & Li, 2004).
Changes in precipitation are the prime drivers of change in the availability of both
surface water and groundwater resources (Beare and Heaney, 2002). The trends
of precipitation extremes in Europe vary greatly and depend not only on region
but also on the indicator used to describe an extreme (Groisman et al., 2005).
More frequent and severe extreme weather events are anticipated to cause greater
damage to ecosystems and agricultural systems (Choi et al., 2015; Wigley, 2009).
Precipitation distribution in the territory and their changes within a year have a
huge impact on hydrological phenomena, soil formation and plant growing
seasons (Bukantis and Rimkus 2005). Amount and distribution of precipitation
has impact on state the moisture in soil (Šimunić et al., 2013). As a consequence
of climate change, the rise in frequency and intensity of extreme weather events,
such as drought, heavy rain, gales and storms, among others, have a negative
impact on yields and their quality (Mađar et al., 1998; Parry et al., 2005; Fischer
et al., 2005; Šimunić et al., 2007; Kovačević et al., 2012; Marković et al., 2012;
Kovačević et al., 2013; Šimunić et al., 2013; Šimunić et al., 2014; Kovačević and
Josipović, 2015; Dokić et al., 2015). Agricultural production is very risky and
almost impossible in agricultural areas where there are dangers from flooding,
retention of surplus water in soil a longer time during year or if often is appear
drought and not built hydrotechnical objects for protection from flood and
catchment water, drainage and irrigation. In such conditions agricultural
production and hence yield are dependent on weather conditions, making yields
and their quality highly variable. The highest yields are obtained, if is during of
vegetation period favourable air-water ratio in the soil (Šimunić, 2016).
AMELIORATIVE MEASURES
Already according climatic characteristics and catchment area
characteristics are seeking hydrotechnical solutions and constructing
hydrotechnical structures for flood protection, drainage and irrigation, water
accumulation and watercourse regulation. Ameliorative measures can include
hydrotechnical and cultural technique activities.

Ameliorative measures aimed at prevention/mitigation consequences of climate... 101
Protection from harmful flood and catchment water
Protection from harmful water activity is conducted by undertaking
different measures and intervention, the most important ones being regulation of
watercourse and construction of hydrotechnical facilities. Even though the basic
function of hydrotechnical facilities is protection from harmful water activity,
their impact on temporal and spatial water distribution in a certain area is
significant in that it enables more effective water management and protection.
There are different solutions for protection from harmful water activity, such as
regulation of watercourses, accumulations and retentions, protective
embankments, unloading channels and peripheral or lateral channels.
Regulation of a watercourse implies development of its bed and increase of
its ability to take up larger amounts of water. The method of regulation depends
on natural characteristics of the watercourse, notably on its size (river, stream), its
bed (straight or meandering) and mechanical stability of the waterside.
Watercourse regulation can involve simplest action, from cleaning, deepening
and widening of the bed, bank reinforcement to straightening of meanders. In
Croatia, there are a total of 3,935 km of national watercourses, of which 1,436 km
(36.5%) are completely regulated, 1,672 km (42.5%) are partially regulated, and
827 km (21%) are not regulated (Marušić, 2007).
Accumulations are usually parts of watercourse systems that include dams.
The size of the accumulation, that is, volume of collected water, depends on
several parameters, such as climate characteristics of the area, downstream flow
capacity, intended use and geomorphology of the area. During high water events,
surplus water is collected in the accumulation, water flow in the watercourse is
stabilized and this way flooding of the downstream area is prevented.
Accumulated water can be also used for other purposes. Mountain retentions are
parts of watercourse catchment areas where water from the watercourse is
accumulated only during high water events and this way flooding of downstream
is prevented and accumulated water are not used for other purposes. Up to now
built 58 multipurpose accumulations and 43 mountain retentions (Marušić, 2007).
In lowland areas is smaller water flow velocity in watercourses and hence
the danger from flooding higher and therefore are build other hydrotechnical
structures, such as embankments and unload channels. Protection from flooding
events which can follow after longer and heavy rain period is achieved by earthen
embankments, which are built along watercourses. In Croatia, 2,415 km of
embankments were built along larger (state) watercourses, and 1,642 km along
local watercourses (Marušić, 2007). Besides embankments in lowland areas can
be built unloading channels which purpose is to unload the main watercourse
from a part of high water inflow and in this way protect a certain area from
flooding. Unloading channels divert part of the inflow from main watercourse up
to recipient. Three large drainage channels have been partially built on the Sava
River Basin. Unloading the main watercourse from a part of high water inflow
because of danger from outflow and flooding, water from watercourse can be
diverted to lowland retentions which can hold large volumes of water, but after
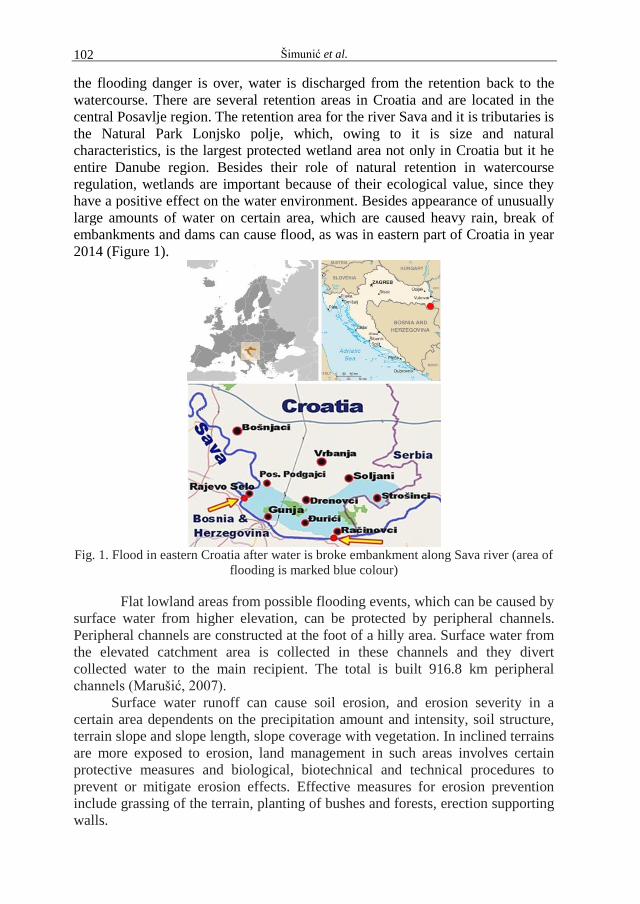
Šimunić et al. 102
the flooding danger is over, water is discharged from the retention back to the
watercourse. There are several retention areas in Croatia and are located in the
central Posavlje region. The retention area for the river Sava and it is tributaries is
the Natural Park Lonjsko polje, which, owing to it is size and natural
characteristics, is the largest protected wetland area not only in Croatia but it he
entire Danube region. Besides their role of natural retention in watercourse
regulation, wetlands are important because of their ecological value, since they
have a positive effect on the water environment. Besides appearance of unusually
large amounts of water on certain area, which are caused heavy rain, break of
embankments and dams can cause flood, as was in eastern part of Croatia in year
2014 (Figure 1).
Fig. 1. Flood in eastern Croatia after water is broke embankment along Sava river (area of
flooding is marked blue colour)
Flat lowland areas from possible flooding events, which can be caused by
surface water from higher elevation, can be protected by peripheral channels.
Peripheral channels are constructed at the foot of a hilly area. Surface water from
the elevated catchment area is collected in these channels and they divert
collected water to the main recipient. The total is built 916.8 km peripheral
channels (Marušić, 2007).
Surface water runoff can cause soil erosion, and erosion severity in a
certain area dependents on the precipitation amount and intensity, soil structure,
terrain slope and slope length, slope coverage with vegetation. In inclined terrains
are more exposed to erosion, land management in such areas involves certain
protective measures and biological, biotechnical and technical procedures to
prevent or mitigate erosion effects. Effective measures for erosion prevention
include grassing of the terrain, planting of bushes and forests, erection supporting
walls.
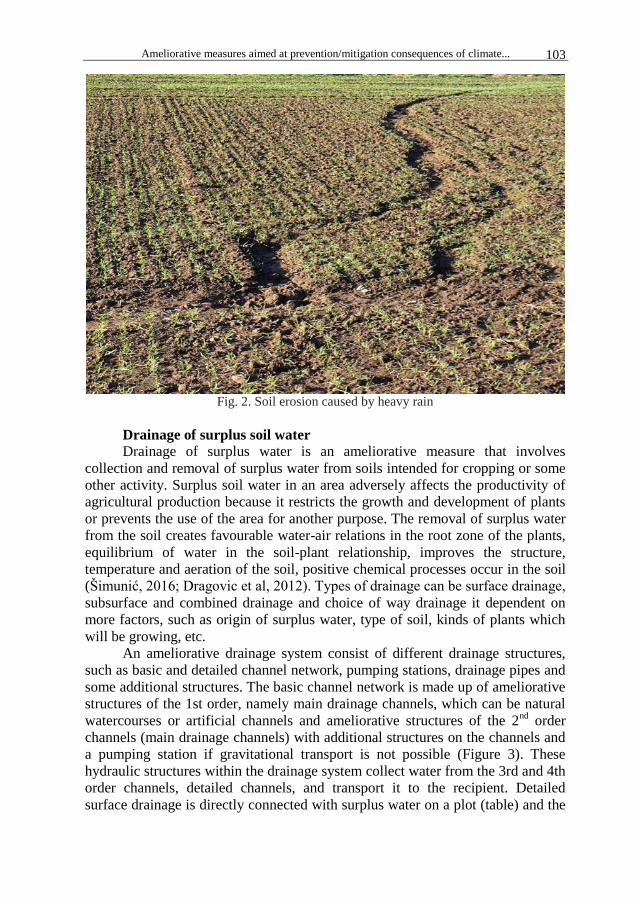
Ameliorative measures aimed at prevention/mitigation consequences of climate... 103
Fig. 2. Soil erosion caused by heavy rain
Drainage of surplus soil water
Drainage of surplus water is an ameliorative measure that involves
collection and removal of surplus water from soils intended for cropping or some
other activity. Surplus soil water in an area adversely affects the productivity of
agricultural production because it restricts the growth and development of plants
or prevents the use of the area for another purpose. The removal of surplus water
from the soil creates favourable water-air relations in the root zone of the plants,
equilibrium of water in the soil-plant relationship, improves the structure,
temperature and aeration of the soil, positive chemical processes occur in the soil
(Šimunić, 2016; Dragovic et al, 2012). Types of drainage can be surface drainage,
subsurface and combined drainage and choice of way drainage it dependent on
more factors, such as origin of surplus water, type of soil, kinds of plants which
will be growing, etc.
An ameliorative drainage system consist of different drainage structures,
such as basic and detailed channel network, pumping stations, drainage pipes and
some additional structures. The basic channel network is made up of ameliorative
structures of the 1st order, namely main drainage channels, which can be natural
watercourses or artificial channels and ameliorative structures of the 2nd
order
channels (main drainage channels) with additional structures on the channels and
a pumping station if gravitational transport is not possible (Figure 3). These
hydraulic structures within the drainage system collect water from the 3rd and 4th
order channels, detailed channels, and transport it to the recipient. Detailed
surface drainage is directly connected with surplus water on a plot (table) and the
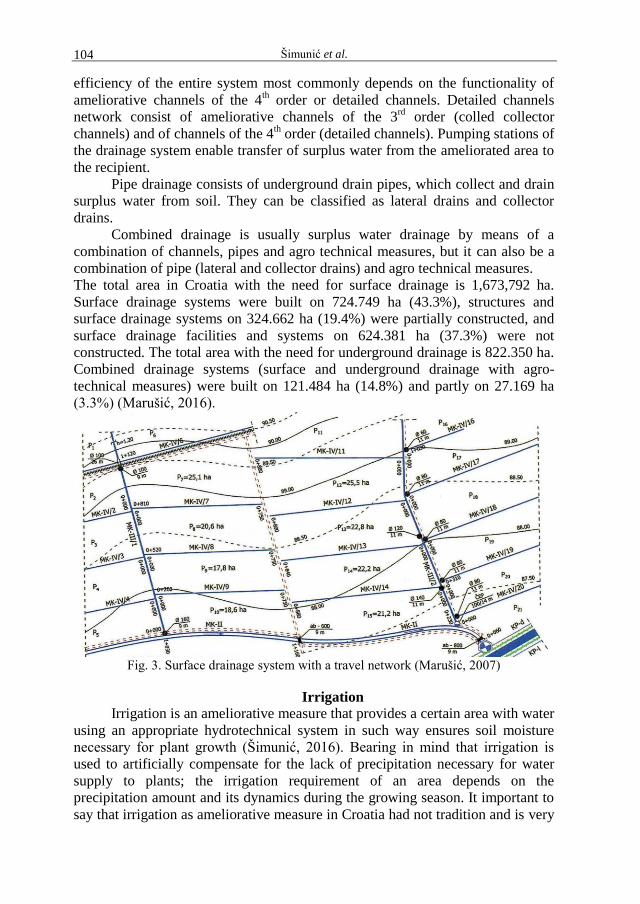
Šimunić et al. 104
efficiency of the entire system most commonly depends on the functionality of
ameliorative channels of the 4th order or detailed channels. Detailed channels
network consist of ameliorative channels of the 3rd
order (colled collector
channels) and of channels of the 4th order (detailed channels). Pumping stations of
the drainage system enable transfer of surplus water from the ameliorated area to
the recipient.
Pipe drainage consists of underground drain pipes, which collect and drain
surplus water from soil. They can be classified as lateral drains and collector
drains.
Combined drainage is usually surplus water drainage by means of a
combination of channels, pipes and agro technical measures, but it can also be a
combination of pipe (lateral and collector drains) and agro technical measures.
The total area in Croatia with the need for surface drainage is 1,673,792 ha.
Surface drainage systems were built on 724.749 ha (43.3%), structures and
surface drainage systems on 324.662 ha (19.4%) were partially constructed, and
surface drainage facilities and systems on 624.381 ha (37.3%) were not
constructed. The total area with the need for underground drainage is 822.350 ha.
Combined drainage systems (surface and underground drainage with agro-
technical measures) were built on 121.484 ha (14.8%) and partly on 27.169 ha
(3.3%) (Marušić, 2016).
Fig. 3. Surface drainage system with a travel network (Marušić, 2007)
Irrigation
Irrigation is an ameliorative measure that provides a certain area with water
using an appropriate hydrotechnical system in such way ensures soil moisture
necessary for plant growth (Šimunić, 2016). Bearing in mind that irrigation is
used to artificially compensate for the lack of precipitation necessary for water
supply to plants; the irrigation requirement of an area depends on the
precipitation amount and its dynamics during the growing season. It important to
say that irrigation as ameliorative measure in Croatia had not tradition and is very
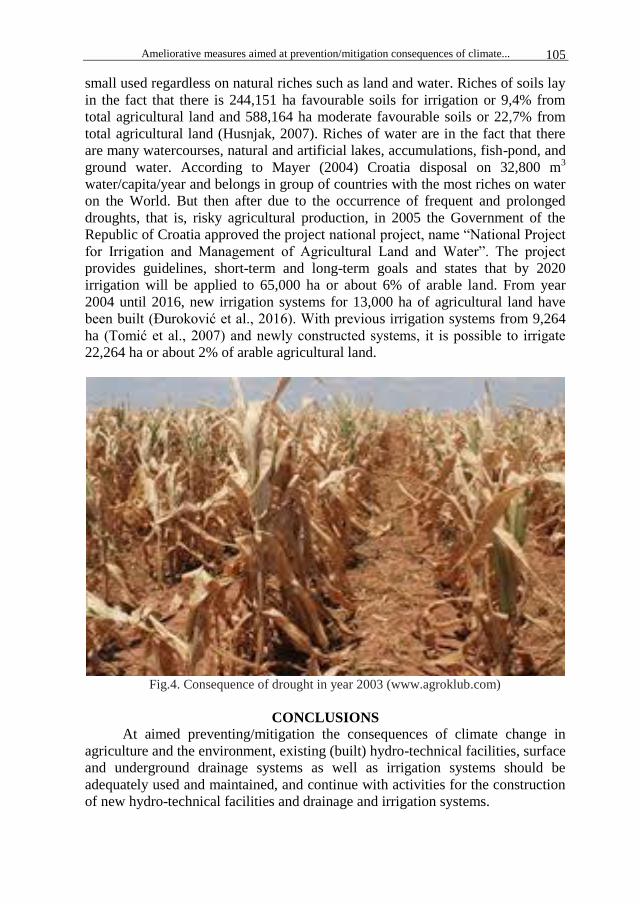
Ameliorative measures aimed at prevention/mitigation consequences of climate... 105
small used regardless on natural riches such as land and water. Riches of soils lay
in the fact that there is 244,151 ha favourable soils for irrigation or 9,4% from
total agricultural land and 588,164 ha moderate favourable soils or 22,7% from
total agricultural land (Husnjak, 2007). Riches of water are in the fact that there
are many watercourses, natural and artificial lakes, accumulations, fish-pond, and
ground water. According to Mayer (2004) Croatia disposal on 32,800 m3
water/capita/year and belongs in group of countries with the most riches on water
on the World. But then after due to the occurrence of frequent and prolonged
droughts, that is, risky agricultural production, in 2005 the Government of the
Republic of Croatia approved the project national project, name “National Project
for Irrigation and Management of Agricultural Land and Water”. The project
provides guidelines, short-term and long-term goals and states that by 2020
irrigation will be applied to 65,000 ha or about 6% of arable land. From year
2004 until 2016, new irrigation systems for 13,000 ha of agricultural land have
been built (Đuroković et al., 2016). With previous irrigation systems from 9,264
ha (Tomić et al., 2007) and newly constructed systems, it is possible to irrigate
22,264 ha or about 2% of arable agricultural land.
Fig.4. Consequence of drought in year 2003 (www.agroklub.com)
CONCLUSIONS
At aimed preventing/mitigation the consequences of climate change in
agriculture and the environment, existing (built) hydro-technical facilities, surface
and underground drainage systems as well as irrigation systems should be
adequately used and maintained, and continue with activities for the construction
of new hydro-technical facilities and drainage and irrigation systems.
Šimunić et al. 106
REFERENCES Beare, S., Heaney, A. (2002). Climate Change and Water Resources in the Murray
Darling Basin, Australia. Word Congress of Environmental and Resource Economists. p. 1-33.
Bukantis, A., Rimkus, E. (2005). Climate Variability and Change in Lithuania. Acta Zoologica Lituanica, 15(2):100‒104.
Choi, H.S., Schneider, U.A., Rasche, L., Cui, J., Schmid, E., Held, H. (2015). Potential Effects of Perfect Seasonal Climate Forecasting on Agricultural Markets, Welfare and Land Use: A Case Study of Spain. Agric. Syst., 133, 177‒189.
Dokić, N., Oršolić, R., Kovačević, V., Rstija, M., Iljkić, D. (2015). Weather characteristics with aspect of maize and sunflower growing in context of climatic changes. Zbornik radova 50. Hrvatskog i 10. Međunarodnog simpozija agronoma, Pospišil, M. (ur.). Sveučilište u Zagrebu Agronomski fakultet, 16. ‒20. 02. 2015, Opatija, Hrvatska, 383-343.
Dragovic, S. Spalevic, V., Radojevic, V., Cicmil, M, Usćcmlic, M. (2012): Importance of chemical and microbiological water quality for irrigation in organic food production. Agriculture and Forestry, 55 (1-4): 83-102
Đuroković, Z., Galiot, M., Holjević, D. (2016): Stanje provedbe nacionalnog projekta navodnjavanja i gospodarenja poljoprivrednim zemljištem i vodama i daljnje razvojne mogućnosti uz sufinanciranje sredstvima iz fondova Europske unije. Zbornik radova sa Okruglog stola „Hidrotehničke melioracije u Hrvatskoj-stanje i izazovi“, Biondić, D., Holjević, D., Vizner, M. (ur.). Hrvatsko društvo za odvodnju i navodnjavanje, Višnjica kod Slatine, 13-24.
Fischer, G., Shah, M., Tubiello, F.N., Velhuizen, H. (2005). Socio-economic and climate change impacts on agriculture: an intergrated assessment 1990-2080. Phil. Trans. R. Soc. B360 2067‒83.
Groisman, P., Ya., Knight, R.W., Easterling, D.R., Karl, T.R., Hegerl, G.C., Razuvaev, V.N. (2005). Trends in Intense Precipitation in the Climate Record. J. Climate, 18(9), 1343‒1367.
Husnjak, S. (2007): Poljoprivredna tla Hrvatske i potreba za melioracijskim mjerama. Hrvatska akademija znanosti i umjetnosti. Zbornik radova znanstvenog skupa: Melioracijske mjere u svrhu unapređenja ruralnog prostora, Zagreb, 21-37.
Kovačević, V., Rastija, M., Josipović, M. (2012). Precipitation and temperature regimes specifities for maize growing in the eastern Croatia since 2000. Proceedings of the Third International Scientific Symposium „ Agrosym Jahorina 2012“. 15‒17. Nov. 2012, Jahorina, RS, BiH, 81‒86.
Kovačević, V., Kovačević, D., Pepo, P., Marković, M. (2013). Climate change in Croatia, Serbia, Hungary and Bosnia and Herzegovina: comparison the 2010 and growing seasons. Poljoprivreda (Osijek), 19(2):16‒22.
Kovačević, V., Josipović, M. (2015). Aktualna pitanja uzgoja žitarica u istočnoj Hrvatskoj- Issues in cereal growing in the eastern Croatia. Zbornik radova sa znanstvenog skupa „Proizvodnja hrane i šumarstvo-temelj održivog razvoja istočne Hrvatske“, Matić, S., Tomić, F., Anić, I. (ur.). Hrvatska akademija znanosti i umjetnosti, Zagreb, 109‒120.
Mađar, S., Šoštarić, J., Tomić, F., Marušić, J. (1998). Neke klimatske promjene i njihov utjecaj na poljoprivredu istočne Hrvatske. Hrvatska akademija znanosti i umjetnosti. Znanstveni skup s međunarodnim sudjelovanjem: Prilagodba poljoprivrede i šumarstva klimi i njenim promjenama, Zagreb, 127‒135.
Marković, M., Péter, P., Sárvári, M., Kovačević, V., Šoštarić, J., Josipović, M. (2012). Irrigation Water Use efficiency in maize (Zea mays L.) producet with different irrigation intervals. Acta Agronomica Hungarica, 60(1):21‒27.

Ameliorative measures aimed at prevention/mitigation consequences of climate... 107
Marušić, J. (2007): Izgradnja, obnova i održavanje hidrotehničkih građevina za zaštitu od površinskih voda u Hrvatskoj. Hrvatska akademija znanosti i umjetnosti. Zbornik radova znanstvenog skupa: Melioracijske mjere u svrhu unapređenja ruralnog prostora, Zagreb, 77-97.
Marušić, J., Holjević, D. (2016): Stupanj izgrađenosti i problemi održavanja hidromelioracijskih sustava površinske odvodnje. Zbornik radova s Okruglog stola „Hidrotehničke melioracije u Hrvatskoj-stanje i izazovi“, Biondić, D., Holjević, D., Vizner, M. (ur.). Hrvatsko društvo za odvodnju i navodnjavanje, Višnjica kod Slatine, 55-68.
Mayer, D. (2004): Voda, od nastanka do upotrebe (knjiga). Prosvjeta, Zagreb. Parry, M., Rosenzweig, C., Livermore, M. (2005). Climate change, global food supply
and risk of hunger. Phil. Trans. R. Soc. B360 2125‒38. Simonovic, S.P., Li, L. (2004). Sensivity of the Red River Basin Flood Protection System
to Climate Variability and Change. Water Resources Management, 18(2), 89‒110.
Šimunić, I., Husnjak, S., Tomić, F. (2007). Utjecaj suše na smanjenje uroda poljoprivrednih kultura- Influence of drought on reduction of yields agricultural crops. Agronomski glasnik, 69(5):343‒354.
Šimunić, I., Spalević, V., Vukelić-Shutoska, M., Tanaskovic, V., Moteva, M., Uzen, N. (2013): Climate changes and water requirements in field crop production. Proceedings‒24th International Scientific-Expert Conference of Agriculture and Food Industry. Faculty of Agriculture and Food Sciences University of Sarajevo, B&H, Faculty of Agriculture Ege University, Izmir, Turkey. Sep. 25‒28, Sarajevo, 309-313.
Šimunić, I., Spalević, V., Vukelić-Shutoska, M., Šošzarić, J., Marković, M. (2014): The impact of the water deficit in the soil on crop yield. Hrvatske Vode: 09/2014; 22(89): 203-212.
Šimunić, I. (2016). Regulation and protection of water (book). Croatian university press, Zagreb.
Šimunić, I., Likso, T., Miseckaite, O., Orlović-Leko, P., Ciglenečki, I., Spalević, V. (2019): Climate changes and soil water regime. Agricultural and Forestry, 65(3):05-18.
Soskic, S., Spalevic, V., Kuzel, S. (2001): Analysis of exploitation of irrigation fields in irrigation condition by sprinkler system on Cemovsko polje. Agriculture and Forestry, 47 (1-2): 29-37.
Tomić, F., Romić, D., Mađar, S. (2007): Stanje i perspektive melioracijskih mjera u Hrvatskoj. Hrvatska akademija znanosti i umjetnosti. Zbornik radova znanstvenog skupa: Melioracijske mjere u svrhu unapređenja ruralnog prostora, Zagreb, 07-20.
Wigley, T.M.L. (2009). The Effect of Changing Climate on the Frequency of Absolute Extreme Events. Climate Change. 97, 67‒76.
Group of authors (2005): Nacionalni project navodnjavanja i gospodarenja poljoprivrednim zemljištem i vodama. Agronomski fakultet Sveučilišta u Zagrebu, Zagreb.

Agriculture & Forestry, Vol. 66 Issue 2: 109-123, 2020, Podgorica 109
Pržulj, N., Jovović, Z., Velimirović, A. (2020): Breeding small grain cereals for drought tolerance in a changing
climate. Agriculture and Forestry, 66 (2): 109-123.
DOI: 10.17707/AgricultForest.66.2.11
Novo PRŽULJ1, Zoran JOVOVIĆ, Ana VELIMIROVIĆ
2
BREEDING SMALL GRAIN CEREALS FOR DROUGHT TOLERANCE
IN A CHANGING CLIMATE
SUMMARY
Climate change, more intense in the 21st century, has and will have a
detrimental effect on food production and quality in many parts of the world. The
adverse effect of climate change will be the consequence of increased incidence
of abiotic stresses, such as high temperatures and water shortages, and increased
incidence of biotic stresses, such as pests and diseases. Climate change is
expected to cause a decrease in biodiversity, especially in marginal conditions.
Drought, as a yield-limiting factor, has become a major threat to food security.
Plant responses to drought are affected by various factors including growth
conditions, physiology, genotype, development stage, drought severity and
duration. Thus, drought tolerance mechanisms involve diverse gene expression
patterns and as complex signalling pathways. The complexity of inheriting
drought tolerance has limited the progress of small grain breeding by using only
the classical breeding methods. To accelerate yield improvement, physiological
traits at all levels of integration need to be considered in breeding. Physiological
breeding increases the probability of achieving cumulative gene action for yield
compared to crossing physiologically uncharacterized genotypes. In practice, it
differs from conventional breeding by considering a larger range of traits,
including genetically complex physiological characteristics and differs from
molecular breeding by encompassing both phenomic and genomic information.
Plant breeding is a complex process related to changing the genotype and
phenotype of cultivated plants, as well as their relation to abiotic and biotic
stresses. The climate change adaptation strategy, where photoperiod-temperature
response of the cultivated plant is used, seeks to synchronize more precisely the
dynamics of plant phenology with the dynamics of available water in the soil.
This method mainly influences the change in flowering time, which seeks to
avoid predictable occurrences of stress at critical periods in crop life cycles. So
far, breeding has done the least to alter the roots genetically, making modern
high-yielding varieties less effective than their predecessors in absorbing nitrogen
1Novo Pržulj, (corresponding author: [email protected]), Universitry of Banja Luka, Faculty
of Agriculture, Banja Luka, BOSNIA AND HERZEGOVINA. 2 Zoran Jovović, Ana Velimirović, University of Montenegro, Biotechnical Faculty, Podgorica,
MONTENEGRO.
Paper presented at the 10th International Scientific Agricultural Symposium "AGROSYM 2019".
Notes: The authors declare that they have no conflicts of interest. Authorship Form signed online.
Received:10/05/2020 Accepted:21/06/2020
Pržulj et al. 110
from the soil. Harvest index is a measure of success in partitioning assimilated
photosynthate. An improvement of harvest index means an increase in the
economic portion of the plant. In water-limited environments, biomass production
is a function of the water used by the crop and the efficiency with which it is
converted into biomass. Biomass production can be defined by the amount of
radiation intercepted and the radiation-use efficiency, i.e. the efficiency of the
conversion of this radiation to dry matter.
Keywords: conventional breeding, physiological approach, flowering time,
root, harvest index, grain filling period
INTRODUCTION
Climate change is a global phenomenon of climate transformation that
manifests itself in a deviations from the usual climate of an area or planet, and
which is especially triggered by human activity. Drought stress in the last two
decades has had a negative impact on total agricultural production and also on
grain production, indicating the uncertainty of this production and its high
dependence on weather conditions (Bindi and Olesen, 2011). Observed globally,
climate change has a negative impact on global food production, regardless of the
increase in primary production resulting from breeding and improved cultivation
technologies (Morgounov et al., 2018). Tripathi et al. (2016) state that since 1980,
climate change has reduced global maize and wheat production by 5%.
Water deficiency usually leads to decreased growth, decreased
photosynthesis intensity and metabolic disorders. The response of plants to
drought is complex because drought stress is most often associated with problems
of uptake of nutrients and transport of nutrients and assimilates, which is reflected
in the overall metabolism. Thus, a lower water deficiency causes an increase in
bound and a decrease in free water in the plant, which leads to a decrease in the
intensity of photosynthesis. A higher water deficiency causes drying, and if it
continues withering of plant.
Although it is generally accepted that small amounts of precipitation are
the most important factor in reducing yields in drought conditions, this may not
always be true (Kirkegaard et al., 2008). Other factors, such as disease, poor
physical and chemical properties of the soil, problems with soil nutrients, or even
flooding at some stage of plant development, can reduce yields (Suresh and
Nagesh, 2015). All these factors should be excluded, as far as possible, before the
analysis of the physiological traits in drought conditions relevant to yield
realization. The intensity of tillering in cereals can also be an indicator of the
external conditions or health of the plant (Akram, 2011). Grain cereals belong to
the grass family and in favorable conditions, they are tillering intensively,
whereas in conditions of severe drought only the main shoot is usually productive
and the secondary and tertiary are sterile.
By creating new varieties of cultivated plants whose genotype allows
greater tolerance to stress conditions, breeders seek to mitigate the effects of
climate change. Over the last 50 years, significant improvements in production
Breeding small grain cereals for drought tolerance in a changing climate 111
and productivity of all major crops have been achieved. Progress has been made
mainly through conventional breeding methods, improving the genetic basis for
yield and tolerance to abiotic and biotic factors. Despite efforts to produce
enough food in recent years, productivity has been reduced in cultivated plants
(Slafer and Peltonen-Sainio, 2001). With the aim of more efficient breeding as a
complementary method to traditional breeding for yield per se, plant physiology
and molecular biology in the identification, characterization and manipulation of
genetic variability are used. Some of these methods are presented in this paper.
MECHANISMS OF DROUGHT TOLERANCE
Biological stress is defined as an external factor affecting yield reduction
relative to the maximum genetic potential of the genotype (Salisbury and
Marineous,1985). Stress tolerance is the capacity of a plant to better adapt to
biotic or abiotic stresses, such as drought, high and low temperatures, saline soils,
the presence of toxic metals, harmful organisms, and more (Duvick, 1997).
Drought is considered to be one of the most significant factors that limit the yield
of cultivated plants worldwide. As climate change leads to warmer and drier
summers, the impact of drought limiting yield and yield components has
increased (Sareen et al., 2018; Mehraban et al., 2019). The use of genetics in
improving drought tolerance and ensuring yield stability is an important aspect of
stabilizing global crop production (Edmeades et al., 2003).
Drought tolerance consists of resistance to high temperatures and
resistance to water scarcity. Genotype tolerance to soil water scarcity is a
complex trait and cultivated plants can achieve it through one of the following
mechanisms: (1) drought avoidance, (2) dehydration reduction, and (3)
dehydration tolerance (Fang and Xiong, 2015).
Early ripening and fruiting is a physiological trait that ensures drought
avoidance in many areas (McKay et al., 2003). Early maturity involves timely
flowering, which is controlled by major genes that control photoperiod,
vernalisation and early maturity per se (Gomez et al., 2014). In breeding of
cultivated plants, genotype selection for traits that enable intensive growth and
rapid development, such as high stoma conductivity, high photosynthetic activity,
high water use efficiency, and early flowering, allow early maturity and drought
avoidance (Kereša et al., 2008).
Physiological adaptation of plants to soil water deficiency is achieved by
reducing dehydration (McKay et al., 2003). Low metabolic activity, slower
growth, and high water potential and turgor in cells during the drought period
distinguish genotypes that have a mechanism for reducing dehydration. The basis
of this mechanism is the progressive closure of the stoma, leading to a decrease in
transpiration as well as photosynthesis. Stoma closure is controlled not only by
available water in the soil but also by the interaction of leaf properties and
external factors (Medrano et al., 2002). As a reaction to drought, abscisic acid
(ABA) is synthesized at the root, which is transported by xylem to the leaf and
causes stoma closure (Schachtman and Goodger, 2008). ABA accumulation in

Pržulj et al. 112
plants induced by drought is under the control of the Quantitative Trait locus
(QTL) (Quarrie et al., 1994).
Dehydration tolerance is tolerance to the changes caused by drought at the
molecule and cell level, which the plant achieves by osmotic regulation or
adaptation (Živčák et al., 2009). Osmotic regulation is a decrease in cytosol
potential due to the accumulation of osmolytes during reduced water potential in
the leaf, which allows the maintenance of positive turgor and continuation of
processes that depend on the turgor to a certain level and under stressful
conditions. Organic and inorganic substances that allow osmotic regulation are
specific to different plant species. Osmotic adjustment is achieved by passive
concentration of the solution, trough the process of dehydration. In this way,
osmotic potential of root can reach lower values than osmotic potential of the
soil, thereby achieving movement of water from the soil in line with
concentration gradient (Stanković et al., 2006). The degree of osmotic adaptation
to drought conditions varies among plant species and can be used as one of the
criteria for selecting dehydration-tolerant species (Chaves et al., 2003). Due to
osmotic regulation in tolerant genotypes for drought, the stoma remains open
allowing photosynthesis to take place, leaves elongate, although with reduced
intensity, the root continues to grow and allows more efficient absorption of
water from the soil, delaying leaf wilting, more efficient accumulation of dry
matter and higher yield under stress conditions.
Saradadevi et al. (2017) point out that the ability to keep the stoma open in
water stress conditions is an agronomic form of drought tolerance. Guo et al.
(2019) state that potassium is particularly important inorganic ion in wheat.
Accumulation of potassium under stress conditions is controlled by a major locus,
located on the short end of chromosome 7A. Regardless of the importance of
potassium, organic osmolytes play a major role in osmotic regulation (Ahanger et
al., 2014). Organic osmolytes can be divided into two groups: (1) osmolytes
containing nitrogen such as free amino acids (e.g. proline) and quaternary
ammonium compounds such as betaine, polyamines and proteins and (2)
carbohydrate osmolytes such as sugars (mannitol, sorbitol), monosaccharides
(fructose, glucose), oligosaccharides (sucrose, trehalose) and polysaccharides
(fructan).
THE CONVENTIONAL VS. PHYSIOLOGICAL APPROACH IN
BREEDING TO DROUGHT
Breeding for yield in optimal conditions creates genotypes that produce
high yield in both favourable and stress conditions (Ceccarelli et al. 2004).
Genetic variation in traits contributing to high yield under all agro ecological
conditions, such as e.g. high harvest index is higher in optimal conditions, which
makes the selection of high yield genotypes more likely. Richards (2006) stated
that there was no reason for high yield genotypes not to express their genetic
potential under favourable conditions and under less favourable conditions if
selection was performed under normal conditions without irrigation. The large
Breeding small grain cereals for drought tolerance in a changing climate 113
number of specific adaptations that may be of particular importance for irrigation-
free conditions may also be important for achieving high yield in stress
conditions.
Breeding to specific physiological traits that are assumed to provide plants
with tolerance to drought conditions is difficult and relatively modest results have
been achieved so far (Luo et al., 2019). One of the reasons for these modest
results is the difficulty in evaluating these traits, their low heritability, and the fact
that breeding has been aimed at increasing productivity and quality. In addition,
some traits that provide adaptability to drought are negatively correlated with
yield or other traits. For example, early flowering in winter small grain cereals
provides partial avoidance of drought in the flowering period and the first half of
the grain filling, but leads to a decrease in aboveground biomass and yield, and
increases the risk of late spring frosts. Some features may be unsuited in another
region.
So far in breeding of small grain cereals, flowering time and plant height
have had the greatest influence on yield increase under irrigation conditions
(Mirosavljević et al., 2016). Genetic manipulations during flowering time were of
the greatest importance in the adaptation of vegetative and reproductive growth
and grain formation and filling with respect to available water, low temperatures
and evaporation. The decrease in plant height played a key role in increasing the
harvest index, which is, increasing the grain share in total aboveground biomass,
but without changing the total amount of biomass. Researchers around the world
have largely defined morphological and physiological traits that limit yield in
drought conditions, which opens up new directions and breeding methods for
stress conditions (Pržulj et al., 2004).
Grain yield and quality are the most important traits for breeding of
cultivated plants in most breeding programs. Yield continues to increase with
breeding, but to a lesser extent than in the past. The increase in yields of
cultivated plants under irrigation conditions has been achieved mainly through
conventional breeding. The increase in yields is largely the result of improved
resistance to stress, which is achieved by combining improved genetics and
appropriate agrotechnics. For example over the last 30 years, the continuous
increase in maize yields has been the result of more improved stress tolerance
than an increase in yield capacity. Increasing stress tolerance did not increase the
genetic potential of yield – the genotype of the varieties remained the same, but
plant tolerance to stress increased, thus enabling the realization of the genetic
potential for yield.
Drought is a limiting factor of intensive production that is permanently, to
a greater or lesser extent, constantly present. Since the effect of water scarcity and
high temperatures on the growth and development of plants is very complex, it is
also extremely complicated to enrich this complex trait. Regardless of the
achievements of modern techniques – molecular markers, secondary properties,
etc. – direct breeding by conventional methods under certain agro-ecological
conditions remains the main method of yield increase, primarily due to genetic
Pržulj et al. 114
adaptation of the genotype, manifested through grain weight, and efficient and
reliable field testing (Jonas and Koning, 2013). Particular attention must be paid
to the selection of the site for the experiment, the cultivation technology, the size
of the plots and the number of repetitions.
As the progress of increasing yields today by applying only conventional
breeding methods is more modest than in the second half of the last century, it is
expected that the use of other methods, especially the physiological approach, in
breeding will be increasingly used (Lee and Tollenaar, 2007). Better knowledge
and understanding of the factors that influence plant growth and development
under certain agroecological conditions, crop physiology and genotype response
to environmental conditions enables a more successful application of a
physiological approach to plant breeding. By defining the main limiting factors
for realizing the genetic potential for yield and knowing the physiological traits
that can change the effect of stress, it will increase the yield of cultivated plants.
The physiological approach to breeding can contribute to increasing yields in
many ways (Richards, 2006). Breeding should use physiological traits that have
high heritability and that contribute to the realization of yield potential more
effectively than direct selection for yield. In comparison to direct selection for
yield, selection based on physiological traits, especially in the younger
generations of separation, can be cheaper, very efficient and more productive in
the faster emergence of a variety or hybrid on the market (Richards, 2006).
BASIS FOR DROUGHT BREEDING
Drought management methods are numerous, complex and
complementary, but it is certainly that breeding and the creation of genotypes that
have the ability to generate yields under conditions of limited water supply is one
of the first and effective ways to combat drought. Thanks to new research, the
rapid development of new techniques and methods of research and cultivation in
recent decades, great progress has been made in drought breeding. However, new
knowledge about drought tolerance of cultivated plants is rather limited,
especially in answering the following questions: (1) how drought tolerance
develops in plants during domestication, (2) how to determine drought resistance
genes and evaluate their effectiveness in breeding and (3) how to use the results
and findings of theoretical research in practical plant breeding practice (Luo et
al., 2019).
Root architecture represents the trait of the plant that provides the most
opportunities in generating of drought tolerant genotypes (Wasson et al. 2012;
Meister et al. 2014). When studying drought resistance, the problem of accurately
assessing the response of many genotypes to drought under field conditions is
always raised. Therefore, it is necessary to use modern technologies more suited
to the requirements of researchers in the study of drought resistance. Condorelli et
al. (2018) proposed a new platform based on which, with the use of the
Normalized Difference Vegetation Index (NDVI), in 248 durum wheat
genotypes, they determined traits that were closely correlated with drought
Breeding small grain cereals for drought tolerance in a changing climate 115
tolerance. Based on the NDV index data using GWAS (genome-wide association
studies) method, QTLs related to drought tolerance were determined, which
confirmed the theoretical and breeding significance of the proposed platform.
PHYSIOLOGICAL METHODS OF BREEDING ON DROUGHT
STRESS
Flowering time. Studying wheat yield under conditions of water deficit,
Passioura (1977) states that yield depends on three factors: (1) the amount of
water available, (2) the efficiency of water utilization, that is, the amount of dry
matter produced per unit of transpired water, and (3) the harvest index. Since
there is no negative interaction between these parameters, increasing one of them
also increases the yield. In arid conditions, flowering time is the most significant
factor affecting the yield and adaptation to environmental conditions. As
cultivation technology changes with climate change, breeding programs focus on
genetic changes in flowering time (Langer et al., 2014). Modern mechanization
and pesticides allow early sowing, requiring that varieties to be adapted to
photoperiod and vernalisation.
WATER USAGE
Morphological characteristics of plants and roots significant for water
usage. So far, studies of cultivated plants were least related to root research, so
there is essentially no information as to whether the root system of modern
varieties is adapted to soil and environmental factors and whether is necessary to
make changes trough breeding (Zhu, 2019). A deep root system involves drought
tolerance and the ability to absorb more water from the soil. If it is assumed that it
is necessary to increase the capacity of the root system, its depth and distribution
in the soil, it is easiest to do so by using varieties of a longer vegetative period.
This can be achieved relatively easily – early sowing or sowing of late varieties.
In addition, selecting varieties with a larger early vigour can result in faster root
growth, deeper penetration into the soil, and a more developed system of
adventitious roots. In addition to the deep root system and the stronger vigour of
the young plant, greater water uptake and more developed root can be regulated
by plant phenology, reduced tillering and osmotic regulation (Atta et al., 201).
For varieties of reduced tillering, nutrients are not consumed for the development
of unproductive stems, but for the development of a stronger root system.
However, varieties with lower tillering capacity have a number of negative
characteristics, which is why they are not introduced into production (Mitchell et
al., 2013).
Lower temperature of canopy or higher stomata conductance is indication
of favourable soil water regime and deeper root system (Guo et al., 2019). As
these properties are easily measured, they can be used as selection criteria,
provided that the soil is absolutely uniform, to avoid misinterpretation due to the
variability of the soil. Stay-green leaves, especially in maize, can also be an
indicator of the favourable water regime of the soil, and indirectly of the deep
Pržulj et al. 116
root. Maintaining the photosynthetic capacity of the leaves is especially important
in conditions when after early dry period in second half of vegetation and grain
filling period wetter soil is expected, and, consequently, the photosynthetic
activity of the plant (Sarto et al., 2017). Leaf twisting in drought conditions may
also be an indicator of the adaptive capacity of the genotype to preserve the
photosynthetic ability of the plant, and to continue photosynthesis if later water is
available to the root.
Water efficiency. Water deficit during the growing season have a
significant limiting effect on achieving high, stable yields and quality. The term
water use efficiency (WUE) refers to the relationship between total dry matter
and evapotranspiration (Hatfield and Dold, 2019). An increase in transpiration
efficiency (TE), that is, the value of the dry matter/transpiration coefficient and/or
a decrease in the evaporation of water from the soil leads to an increase in WUE.
Both of these factors can be changed by breeding.
Plants of C-3 type of photosynthesis have low net photosynthesis, because
parallel to photosynthesis, they also undergo photorespiration (CO2 release in
light), which is often more intense than breathing in the dark (Long et al, 2006).
With C-4 plants, the CO2 release by photorespiration is insignificant, which is a
basic reason for much more net photosynthesis.
Transpiration efficiency is an important component of water efficiency.
Transpiration is the separation of water from plants in the form of water vapour
on surfaces confines to the atmosphere. It mainly occurs through the leaves,
through the stomata – stomata transpiration, and much less through the epidermis
(cuticle) – cuticular transpiration (Zhang et al., 1998). When the surface of the
plant, i.e. the transpiration surface, is higher and the saturation of the atmosphere
with water vapour is lower, the suction power of the atmosphere is higher, and
the potential for transpiration is higher. Transpiration depends on the ability of
the plant to make up for lost water by absorption from the soil, leaf structure,
openness of the stoma, etc. Transpiration is not only a physical process of water
evaporation but a significant physiological process. Because in many areas of the
soil there is insufficient water required for optimal transpiration, plants adapt in
various ways to reduce water loss (Turner and Begg, 1981).
There are various ways of increasing the efficiency of transpiration in
plants, but the most effective is the growing of genotypes where the period of
maximum biomass increase occurs during periods of moderate temperatures,
when less water is used for growth (Blum, 2009). By selecting the time of sowing
and the appropriate length of the phenophases of the variety, it is possible to
adjust the time of maximum biomass synthesis in relation to available soil
moisture (Pržulj and Momčilović, 2011; Ochagavía et al., 2018). Due to the large
influence of environmental factors and the small effect of individual traits and the
difficulty of measuring the influence of individual plant traits on transpiration, it
is usually difficult to determine the influence of specific plant traits on the
formation of higher biomass and the formation of higher yield (Reynolds et al.,
2001). However, sowing varieties of larger vigour develops a larger leaf area that

Breeding small grain cereals for drought tolerance in a changing climate 117
is able to absorb more light in the colder period, leading to more efficient
transpiration. Some progress has also been made with the growing of small cereal
varieties that have a waxy, blue-whitish coating on the surface of leaves, stems
and ears. Field studies have shown that isogenic barley lines with this coating
have an increase in grain yield of 7-16% and wheat lines of 7%, without changing
the harvest index (Parvathi et al., 2017).
The harvest index. In some crops, such as small grain cereals, significant
progress in breeding for higher yields is achieved mainly by increasing the
harvest index (HI), or by increasing the plant's capacity to allocate more
assimilates to formed reproductive organs (Austin et al., 1980; Calderini et al.
1,9; Mirosavljević et al., 2018). Slafer et al. (2005) found that the physiological
maximum of the harvest index in wheat was about 0.62. The maximum harvest
index of 0.56, obtained from the English winter wheat variety Consort, was
achieved by increasing the mass of the grain with reduce of the mass of the stem
and the leaf sheath. Modern varieties have a significantly higher grain yield
compared to the varieties grown before the Green Revolution, which is primarily
due to the redistribution of aboveground biomass between the vegetative part and
the grain in favour of the grain, and an increase in HI, respectively (Unkovich et
al., 2010). In one century of breeding, the harvest index for wheat has been
increased from 0.30-0.35 to 0.55. (Evans, 1993). Similar progress has been made
in barley and rice.
Further increase in grain yield in cereals through a change in harvest index
cannot produce significant results, which is why it is necessary to look for
alternative ways of increasing yield. Richards (1996), Fischer (2007) and
Reynolds et al. (2009; 2011) consider that nowadays is necessary to use modern
methods of plant breeding, where increasing above-ground biomass is one of the
main breeding goals. Breeding should also be directed at increasing
photosynthetic activity and the efficiency of using solar radiation. However, in
essence it can be considered that the variation of HI in modern semi-dwarf wheat
varieties is largely exploited and that the existing variability is more a result of
non-genetic than genetic factors. Aisawi et al. (2010) and Fischer (2011) state
that modern plant breeding does not only seek to increase HI but HI and
aboveground biomass at the same time, or only biomass.
Drought tolerant harvest index. Properties of plants that contribute to high
HI under optimal growing conditions also contribute to high yield under all
growing conditions, provided that there is no reduction in total biomass (Richards
et al., 2001). This is an advantage of semi-dwarf wheat varieties over tall varieties
and the basis of high yield of semi-dwarf varieties under favourable and less
favourable conditions. High drought tolerance in certain conditions is a
prerequisite for high yield in drought conditions, since it determines the genetic
potential under those conditions. Drought tolerant HI is the result of different
distribution of dry matter between vegetative and reproductive organs (Araus et
al., 2008). Therefore, the selection of wheat genotypes that carry stem height
reducer genes and early flowering genes is a simple and effective way of
Pržulj et al. 118
increasing HI, since their effect is manifested in a smaller increase in vegetative
mass.
Droughtdependent harvest index. When the HI of a genotype is high only
under the conditions of the required amount of water available, in the absence of
drought stress, it is a drought-sensitive, drought-dependent harvest index
(Richards et al., 2001). Drought sensitiveness depends on water uptake during the
grain filling period. If the water uptake during the grain filling period is high, the
harvest index will be high. If the amount of water in the soil is limited, stored
water before flowering, which can be used during grain filling, will increase HI.
In this case, achieving a high grain yield depends on the ratio and growth balance
before and after flowering. However, achieving this balance is very difficult. For
example, too low growth in the period before flowering will limit the total yield
of aboveground dry matter but will maximize HI, while a large growth before
flowering will allow high dry matter yield, but this can result in low HI.
The use of water is a function of the evaporation requirement and leaf area
(Pržulj et al., 2004). There is little ability to change the evaporation capacity,
although breeding can change the onset and duration of individual phenophases.
Also, there are a number of traits whose genetic changes can reduce the leaf area,
which is positively correlated with transpiration. In this way, the use of water can
be regulated and, on the basis of this, effectively increase the HI of cereals
(Richards et al., 2001; Pržulj and Momčilović, 2001a; 2001b). In this way, water
use can be regulated and, thus, effectively increase the value of drought-sensitive
HI. Genotypes that have earlier anthesis will have a higher efficiency of water
utilization under conditions where temperatures increase after flowering.
Combining early flowering with higher vigour or low temperature resistance may
be beneficial in breeding for higher HI and yield.
Due to the smaller number of sterile unproductive ears competing with the
fertile ears for water and nutrients, reduced tillering, i.e. reduced number of
sterile classes, can contribute to the formation of a higher HI, both in conditions
of optimally available water and in conditions of water deficit. Lower tillering
also contributes to the formation of higher HI under drought conditions due to the
formation of a smaller leaf area before flowering, which contributes to less
transpiration and the provision of more water for the grain filling period
(Richards et al., 2001).
The narrower water conductive xylem channels in the seminal root also
contribute to the formation of higher HI (Richards et al., 2001). In essence,
reducing the diameter of the conductive channels is an advantage in drought
stress conditions, while in favourable conditions it is of no particular importance,
since the nodal secondary root, located in the surface of the soil, provides the
plant with the required amount of water. Selection of plants of smaller upper
leaves, including flag leaves, or selection for lower stoma conductivity and/or
lower night-time leaf conductivity also reduces transpiration before flowering
(Magorokosho et al., 2003).

Breeding small grain cereals for drought tolerance in a changing climate 119
In addition to manipulating the amount of water absorbed before and after
flowering, there are other methods of increasing the drought-dependent harvest
index. In a large number of cultivated plant species, the excess assimilates, which
are synthesized until flowering, accumulates in the form of soluble carbohydrates
in the stem (Pržulj and Momčilović, 2001a; 2001b; 2003b). Depending on the
plant species and agro-ecological growing conditions, the excess assimilates can
be up to 25% of the total aboveground biomass in the flowering phase (Pržulj and
Momčilović, 2003b; Mirosavljević et al., 2018). During the irrigation phase, the
assimilates are translocated in the grain, and in extremely arid conditions can
participate 100% in the final grain mass (Pržulj and Momčilović, 2001b; Gutam
2011). In small grains, large genetic variation in the accumulation and
remobilization of assimilates synthesized until flowering was found. Although
effective selection techniques based on the accumulation and remobilization of
assimilates have not yet been developed, Pržulj and Momčilović (2001b) suggest
the use of data on the difference in stem mass between flowering and ripening.
Morphological features can also be used to determine the efficiency of assimilate
remobilization. Thus, for example, the presence of the tillering inhibitor gene
causes the formation of a thicker stem. Variation in the size and anatomy of
internode cavities has also been found to be important for the storage of
assimilates (Ehdaie et al., 2006).
CONCLUSIONS
In plant breeding for yield and yield stability in drought conditions, a
physiological approach can be extremely important support for empirical
breeding. The simultaneous application of both breeding methods will produce
drought-tolerant genotypes faster and more efficiently than using only one
method. In essence, a physiological approach in breeding plants involves a new,
more detailed and deeper way of thinking, linking plant development to
environmental factors, paying more attention to factors affecting yield, using
more diverse germplasm for breeding, and evaluating separation generations
more effectively. Like the empirical and physiological breeding program, it
requires considerable and long-lasting investment.
ACKNOWLEDGEMENTS
This work is a result of the research within the project Adaptive
management of the natural resources of the Republic of Srpska, № 19.032/961-
146/19, supported by the Ministry for Scientific and Technological Development,
Higher Education and Information Society of the Republic of Srpska.
REFERENCES Ahanger MA, Tyagi SR, Wani MR, Ahmad P (2014) Drought Tolerance: Role of Organic
Osmolytes, Growth Regulators, and Mineral Nutrients. In: Ahmad P, Wani M
(eds) Physiological Mechanisms and Adaptation Strategies in Plants Under
Changing Environment. Springer, New York, NY
Pržulj et al. 120
Aisawi K, Foukes J, Reynolds M, Mayes S (2010) The physiological basis of genetic
progress in yield potential of CIMMYT wheat varieties from1966 to 2009.
Abstracts 8th International Wheat Conference, 1-4 June 2010, St Petersburg,
Russia, pp 349-350
Akram M (2011) Growth And Yield Components Of Wheat Under Water Stress Of
Different Growth Stages. Bangladesh Journal of Agricultural Research 36:455-468
Araus JL, Slafer GA, Royo C, Dolores SM (2008) Breeding for yield potential and stress
adaptation in cereals. Critical Reviews in Plant Sciences 27:377-412
Austin RB, Bingham J, Blackwell RD, Evans LT, Ford MA, Morgan CL, Taylor M
(1980) Genetic improvement in winter wheat yields since 1900 and associated
physiological changes. The Journal of Agricultural Science 94:675-689
Atta BM , Mahmood T, Trethowan RM (2013) Relationship between root morphology
and grain yield of wheat in north-western NSW, Australia. Australian Journal of
Crop Science 7:2108-2115
Bindi M, Olesen JE (2011) The responses of agriculture in Europe to climate change.
Regional Environmental Change 11 (Suppl 1): 151
Blum A (2009) Effective use of water (EUW) and not water-use efficiency (WUE) is the
target of crop yield improvement under drought stress. Field Crops Research
112:119-123
Calderini DF, Reynolds MP, Slafer GA (1999) Genetic gains in wheat yield and main
physiological changes associated with them during the 20th century. In: Satorre
EH, Slafer GA (eds) Wheat: Ecology and Physiology of Yield Determination Food
Product. Haworth Press, New York, pp 351-377
Ceccarelli S, Grando S, Baum M, Udupa SM (2004) Breeding for Drought Resistance in a
Changing Climate. In: Rao SC, Ryan J (eds) Challenges and Strategies of Dryland
Agriculture. American Society of Agronomy, pp 167-190
Chaves MM, Maroco JP, Pereira JS (2003) Understanding plant responses to drought:
from genes to the whole plant. Functional Plant Biology 30:239-264
Condorelli GE,Maccaferri M, Newcomb M, Andrade-Sanchez P, White JW, French
AN, Sciara G, Ward R, Tuberosa R (2018) Comparative Aerial and Ground Based
High Throughput Phenotyping for the Genetic Dissection of NDVI as a Proxy for
Drought Adaptive Traits in Durum Wheat. Frontiers in Plant Science,Article 893
Duvick DN (1997) What Is Yield? In: Edmeades GO, Banziger M, Mickelson HR, Pena-
Valdivia CB (еds) Developing Drought and Low N-Tolerant Maize, CIMMYT,
Mexico, pp 332-335
Edmeades DC (2003) The long-term effects of manures and fertilisers on soil productivity
and quality: a review. Nutrient Cycling in Agroecosystems 66:165180
Ehdaie B, Alloush GA, Madore MA, Waines JG (2006) Genotypic Variation for Stem
Reserves and Mobilization in Wheat: I. Postanthesis Changes in Internode Dry
Matter. Crop Science 46:735-746
Evans LT (1993) Crop Evolution, Adaptation and Yield. Cambridge Univ. Press,
Cambridge, England
Fang Y, Xiong L(2015)General mechanisms of drought response and their application in
drought resistance improvement in plants. Cellular and Molecular Life Sciences
72:673-689
Fischer RA (2007) Understanding the physiological basis of yield potential in wheat.
Journal of Agricultural Science 145:99-113
Fischer RA (2011) Wheat physiology: a review of recent developments. Crop and Pasture
Science 62:95-114
Breeding small grain cereals for drought tolerance in a changing climate 121
Gomez D, Vanzetti L, Helguera M, Lombardo L, Fraschina J, Miralles DJ (2014) Effect
of Vrn-1, Ppd-1 genes and earliness per se on heading time in Argentinean
bread wheatcultivars. Field Crops Research 158:73-81
Gutam S (2011) Dry matter partitioning, grain filling and grain yield in wheat genotype.
Communications in Biometry and Crop Science 6:48-63
Guo J, Jia Y, Chen H, Zhang L, Yang J, Zhang J, Hu X, Ye X, Li Y, Zhou Y (2019)
Growth, photosynthesis, and nutrient uptake in wheat are afected by diferences in
nitrogen levels and forms and potassium supply. Scientific Reports 9:1248
Hatfield JL, Dold C (2019) Water-Use Efficiency: Advances and Challenges in a
Changing Climate. Frontiers in Plant Science 10: Article 103
Jonas Е, Koning DJ (2013) Does genomic selection have a future in plant breeding?
Trends in biotechnology 31:497-504
Jorgensen RB (2005) CO2 exploitation and genetic diversity in winter varieties of oilseed
rape (Brassica napus); varieties of tomorrow. Euphytica 128:75-86
Kereša S, Barić M, Horvat M, Habuš Jerčić I (2008) Mehanizmi tolerantnosti biljaka na
sušu i njihova genska osnova kod pšenice. Sjemenarstvo 25:35-45
Kirkegaard Ј, Christen О, Krupinsky Ј, Layzell D (2008) Break crop benefits in temperate
wheat production. Field Crops Research 107:185-195
Langer SM, Longin CFH, Würschum T (2014) Flowering time control in European
winter wheat. Frontiers in Plant Science, Article 537
Lee EA, Tollenaar M (2007) Physiological Basis of Successful Breeding Strategies for
Maize Grain Yield. Crop Science 47: Supplement_3, p S-202-S-215
Long SP, Zhu X-G, Naidu SL, Ort DR (2006) Can improvement in photosynthesis
increase crop yield? Plant, Cell and Environment 29:315-330
Luo L, Xia H, Lu BR (2019) Editorial: Crop Breeding for Drought Resistance. Frontiers
in Plant Science 10: Article 314
Magorokosho C, Pixley KV, Tongoona P (2003) Selection for drought tolerance in two
tropical maize populations. African Crop Science Journal 11:151-161
McKay JK, Richards JH, Mitchell-Olds T (2003) Genetics of drought adaptation in
Arabidopsis thaliana. I. Pleiotropy contributes to genetic correlations among
ecological traits. Molecular Ecology 12:1137-1151
Medrano H, Escalona JM, Bota J, Gulias J, Flexas J (2002) Regulation of photosinthesis
of C3 plants in response to progressve drought: stomatal conductance as a
reference parametar. Annals of Botany 89: 895-905
Mehraban A, Tobe A, Gholipouri A, Amiri E, Ghafari A, Rostaii M (2019) The Effects
of Drought Stress on Yield, Yield Components, and Yield Stability at Different
Growth Stages in Bread Wheat Cultivar (Triticum aestivum L.). Polish Journal of
Environmental Studies28:739-746
Meister R, Rajani MS, Ruzicka D, Schachtman DP (2014) Challenges of
modifying root traits in crops for agriculture.Trends in Plant Science 19:779-788
Mirosavljević M, Momčilović V, Pržulj N, Hristov N, Aćin V, Čanak P, Denčić S (2016)
The variation of agronomic traits associated with breeding progress in winter
barley cultivars. Zemdirbyste-Agriculture 103:267-272
Mirosavljević M, Momčilović V, Maksimović I, Putnik-Delić M, Pržulj N, Hristov N,
Mladenov N (2018) Pre-anthesis development of winter wheat and barley and
relationships with grain yield. Plant, Soil and Environment 64:310-316
Mitchell JH, Rebetzke GJ,Chapman SC, Fukai S (2013) Evaluation of reduced-tillering
(tin) wheat lines in managed, terminal water deficit environments. Journal of
Experimental Botany 64:3439-3451
Pržulj et al. 122
Morgounov A, Sonder K, Abugalieva A, Bhadauria V, Cuthbert RD, Shamanin V,
Zelenskiy Y, DePauw RM, Ronald M(2018) Effect of climate change on
spring wheat yields in North America and Eurasia in 1981-2015 and implications
for breeding. PLoS ONE 13:e0204932
Passioura JB (1977) Grain yield, harvest index and water use of wheat. The Journal of the
Australian Institute Agricultural Science 43:117-121
Parvathi RS, Sreekumar PM, Nataraja KN (2017) Leaf wax trait in crops for drought and
biotic stress tolerance: regulators of epicuticular wax synthesis and role of small
RNAs. Indian Journal of Plant Physiology 22:434-447
Pržulj N, Momčilović V (2001a) Genetic variation for dry matter and nitrogen
accumulation and translocation in two-rowed spring barley. I. Dry matter
translocation. European Journal of Agronomy 15:241-254
Pržulj N, Momčilović V (2001b) Genetic variation for dry matter and nitrogen
accumulation and translocation in two-rowed spring barley. II. Nitrogen
translocation. European Journal of Agronomy 15:255-265
Pržulj N, Momčilović V (2003b) Dry matter and nitrogen accumulation and use in spring
barley. Plant, Soil and Environment 49:36-47
Pržulj N, Momčilović V, Petrović N (2004) Fiziološka osnova prinosa ječma u
optimalnim uslovima i uslovima suše. Selekcija i semenarstvo 1-4:15-26
Pržulj N, Momčilović V (2011) Značaj faze organogeneze formiranja klasića u biologiji
prinosa ozimog dvoredog ječma. Ratarstvo i povrtarstvo 48:37-48
Quarrie SA, Gulli M, Calestani C, Steed A, Marmiroli N (1994) Location of a gene
regulating drought-induced abscisic acid production on the long arm of
chromosome 5A of wheat. Theoretical and Applied Genetics 89:794-800
Reynolds MP, Ortiz-Monasterio JI, McNab A (2001) Application of Physiology in Wheat
Breeding. CIMMYT, Mexico
Reynolds M, Foulkes MJ, Slafer GA, Berry P, Parry MAJ, Snape JW, Angus WJ (2009)
Raising yield potential in wheat. Journal of Experimental Botany 60:1899-1918
Reynolds M, Bonnett D, Chapman SC, Furbank RT, Manes Y, Mather DE, Parry MAJ
(2011) Raising yield potential of wheat. I. Overview of a consortium approach and
breeding strategies. Journal of Experimental Botany 62:439-452
Richards RA (1996) Increasing the yield potential in wheat: manipulating sources and
sinks. In: Reynolds MP, Rajaram S, McNab A (eds) Increasing Yield Potential in
Wheat. CIMMYT, Mexico, pp 134-149
Richards RA, Condon AG, Rebetzke GJ (2001) Traits to Improve Yield in Dry
Environments. In: Reynolds MP, Ortiz-Monasterio JI, McNab A (eds) Application
of Physiology in Wheat Breeding. Mexico, D.F.: CIMMYT, pp 87-100
Richards RA (2006) Physiological traits used in the breeding of new cultivars for water-
scarce environments. Agricultural Water Management 80:197-211
Salisbury FB, Marineous NG (1985) Encyclopedia of plant physiology 11, p 707 (Pharis
RP, Reid DM, еds), Heidelberg, Springer
Sareen S, Bhusal N, Singh G, Tyagi BS, Tiwari V, Singh GP, Sarial AK (2018) Genetics
of Grain Yield and its Components in Wheat under Heat Stress. Cereal Research
Communications 46:448-449
Saradadevi Р, Palta ЈА, Siddique КHМ (2017) ABA-Mediated Stomatal Response in
Regulating Water Use during theDevelopment of Terminal Drought in Wheat.
Frontiers in Plant Science 8:1251
Breeding small grain cereals for drought tolerance in a changing climate 123
Sarto MVM, Sarto JRW, Rampim L, Rosset JS, Bassegio D, da Costa PGF, Inagaki AM
(2017) Wheat phenology and yield under drought: A review. Australian Journal of
Crop Science 11:941-946
Schachtman DP, Goodger JQD (2008)Chemical root to shoot signaling under drought.
Trends in Plant Science 13:281-287
Slafer GA, Peltonen-Sainio P (2001) Yield trends of temperate cereals in high latitude
countries from 1940 to 1998. Agricultural and Food Science in Finland 10:121-
131
Slafer GA, Araus J, Royo C, Garcia del Moral LF (2005) Promising eco-physiological
traits for genetic improvement of cereal yields in Mediterranean environments.
Annals of Applied Biology 146:61-70
Stanković N, Petrović M, Krstić B, Erić Ņ (2006) Fiziologija biljaka. Prirodno-
matematiĉki fakultet, Departman za biologiju i ekologiju, Novi Sad
Suresh KR, Nagesh MA (2015) Experimental Studies on Effect of Water and Soil quality
on Crop Yield. Aquatic Procedia 4:1235-1242
Tripathi A, Tripathi DK, Chauhan D, Kumar N, Sing G (2016) Paradigms of climate
change impacts on some major food sources of the world: A review on current
knowledge and future prospects. Agriculture Ecosystems & Environment 216:356-
373
Turner NC, Begg JE (1981)Plant-water relations and adaptation to stress. Plant and Soil
58:97-131
Unkovich M, Baldock J, Forbes M (2010) Variability in Harvest Index of Grain Crops
and Potential Significance for Carbon Accounting: Examples from Australian
Agriculture. Advances in Agronomy 105:173-219
Wasson AP, Richards RA, Chatrath R, Misra SC, Prasad SV, Rebetzke GJ, Kirkegaard
JA, Christopher J, Watt M (2012) Traits and selection strategies to
improve root systems and water uptake in water-limited wheatcrops. Journal of
Experimental Botany 63:3485-3498
Zhu YH, Weiner J, Yu MX, Li FM (2019) Evolutionary Applications. Evolutionary
agroecology: Trends in root architecture during wheat breeding 19:733-743
Zhang H, Oweis TY, Garabet S, Pala M (1998) Water-use efficiency and transpiration
efficiency of wheat under rain-fed conditions and supplemental irrigation in a
Mediterranean-type environment. Plant and Soil 201:295-305
Živčák M, Repková J, Olšovská K, Brestič M (2009)Osmotic adjustment in
inter wheat varieties and its importance as a mechanism of drought tolerance
Cereal Research Communications 37:569-572

Agriculture & Forestry, Vol. 66 Issue 2: 125-135, 2020, Podgorica 125
Bogevska, Z., Berjan, S., Capone, R., Debs, P., El Bilali, H., Bottalico, F., Davitkovska, M. (2020): Household
food wastage in North Macedonia. Agriculture and Forestry, 66 (2): 125-135.
DOI: 10.17707/AgricultForest.66.2.12
Zvezda BOGEVSKA 1* Sinisa BERJAN
2, Roberto CAPONE
3,
Philipp DEBS3, Hamid EL BILALI
3, Francesco BOTTALICO
3, Margarita
DAVITKOVSKA1
HOUSEHOLD FOOD WASTAGE IN NORTH MACEDONIA
SUMMARY
In North Macedonia, there is no precise data about food waste (FW) at the
consumer level. For this reason, a survey was carried out in order to evaluate
attitude towards FW, knowledge of food labeling, and extent and economic value
of FW at households. The total number of the sample was 244. The result showed
that 46.1% of the respondents throw very little food while 23.7% do not throw
almost anything. Regarding how often the food is thrown per week, 57.1% of the
respondents do not throw away food that is still consumable. About 20% throw
less than 250 g followed by those who throw between 250 and 500 g (17.1%).
Most of the households throw less than 2% of purchased food. The most wasted
food groups are milk and dairy products, fruits and vegetables while fish and
seafood are the least wasted ones. For 55.5% of the respondents, FW value is less
than 5 euro while for 38.8% of them it is between 5 and 25 euro. North
Macedonian consumers are aware about FW but there is still a need for more
information, management practices, technologies, early childhood education and
behaviour change to reduce FW that has environmental and economic impacts.
Keywords: food waste, households, questionnaire survey, North
Macedonia.
INTRODUCTION
In the food sector, waste is a major social, nutritional and environmental
issue, affecting the sustainability of the food chain as a whole (Berjan et al., 2018;
Capone et al., 2014; FAO, 2019; El Bilali, 2019; El Bilali, 2020). The wastage of
food occurs at all stages of the food life cycle, starting from harvesting, through
manufacturing and distribution and finally consumption, but the largest
1Zvezda Bogevska (Corresponding author: [email protected]), Margarita Davitkovska
Faculty of Agricultural Sciences and Food, Ss. Cyril and Methodius University, Skopje, Republic of
NORTH MACEDONIA; 2Sinisa Berjan, Faculty of Agriculture, University of East Sarajevo, East Sarajevo, BOSNIA AND
HERZEGOVINA; 3Roberto Capone, Philipp Debs, Hamid El Bilali, Francesco Bottalico, International Centre for
Advanced Mediterranean Agronomic Studies in Bari (CIHEAM-Bari), Valenzano (Bari), ITALY.
Notes: The authors declare that they have no conflicts of interest. Authorship Form signed online.
Received:20/02/2020 Accepted:15/04/2020
Bogevska et al. 126
contribution to food waste in developed countries occur at home (Marangon et
al., 2014). One-third of food produced for human consumption is lost or wasted
globally, which amounts to about 1.3 billion tons per year (FAO, 2011; HLPE,
2014). Food waste is both a squandering of precious natural resources (Capone et
al., 2014; Scherhaufer et al., 2018) as well as a loss of money (FAO, 2011,
HLPE, 2014). The value of food lost or wasted annually at the global level is
estimated at US$ 1 trillion (FAO, 2015). About 40 percent of food in the United
States today goes uneaten (Gunders, 2012). Ninety million tons of food is wasted
in the EU every year (Cicatiello, 2016). The same authors indicate that in Italy,
during retailing, the total edible waste would sum up to as much as 40,000 t of
food every year. In Sweden, it is estimated that the food industry wastes 171,000
tons, retailers / wholesalers 39,000 tons, restaurants 99,000 tons, and households
674,000 tons for a total of 1,010,000 tons of food each year (Gjerris and Gaiani,
2013). The amount of food wasted per year in UK households is 25% of that
purchased (by weight) (Parfitt et al., 2010). Household size, packaging format,
price-awareness and marketing appear to influence the levels of food waste in UK
(Mallinson et al., 2016).
In North Macedonia, food is lost or wasted throughout the supply chain,
from initial agricultural production down to final household consumption.
According to the law on waste management (“Official Gazette” no.
68/2004, 71/2004, 107/2007, 102/2008, 143/2008, 124/2010, 51/2011, 123/2012,
147/2013, 163/2013, 51/2015, 146/2015, 156/2015, 192/2015 and 39/2016)
biodegradable waste is any waste which can be digested in anaerobic (absence of
oxygen) or aerobic (with oxygen) decomposition processes such as food waste
and garden waste, paper and paperboard. In the Strategy for Waste Management
of the Republic of Macedonia (2008-2020) and National Plan for Waste
Management (2009-2015), systematic and technical measures such as design and
construction of installations for reduction of biodegradable waste fractions in
landfills are provided. In the Rulebook about the amount of biodegradable
components in the waste (“Official Gazette” no. 108/2009), the goal is to achieve
a reduction of the amount of biodegradable components in the waste which are
disposed to landfill through the implementation of prevention, recycling,
composting, biogas production or other ways of use of biodegradable waste. In
North Macedonia, there is no precise data of wasted food even for biodegradable
waste. According to the National Plan for Waste Management, it is estimated that
the amount of biodegradable organic waste is about 150,000 t per year. This
amount represents 20% of total waste generated in North Macedonia.
The civil society pays attention and makes efforts in order to reduce food
waste. In 2011 was established “FOOD FOR ALL - Food Bank of Macedonia”
which is a nonprofit, charity and humanitarian organization that collects excess
food, food with tight expiration date, i.e. before the end of use - mainly
agricultural, agro-industrial and commercial products. This organization stores,
sorts and distributes the food to poor and socially vulnerable categories of
citizens, through humanitarian organizations, social organizations and institutions
Household food wastage in North Macedonia 127
that are fighting against poverty and hunger. In 2013, Food Bank of Macedonia
with others established the “Coalition Against Hunger” that participated in the
project “Common voice against hunger!” supported by USAID and the
Foundation Open Society. The project aimed to inform and encourage all
participants in the food chain to maximize the use of food, redistribution of
excess healthy and safe food to social vulnerable citizens before the expiry date
and reduction of the amount of food waste and losses of food.
In medium- and high-income countries, such as North Macedonia, food is
mainly wasted at consumer level (FAO, 2011). There is a growing body of
literature on household food waste in different countries and world regions (e.g.
Abiad & Meho, 2018; Mondéjar-Jiménez et al., 2016; Principato, 2018; Schanes
et al., 2018), but Balkan countries such as North Macedonia are largely
overlooked. Due to lack of food waste data, a survey was performed to evaluate
household food waste in North Macedonia. In particular, the survey addressed:
knowledge of and perceived relative importance of food waste; attitudes towards
food waste; impacts of behaviors regarding food and food management on food
wastage; quantity and value of food wasted; and barriers and willingness to
behavioral change.
MATERIAL AND METHODS During the last years the Department of Sustainable Agriculture, Food and
Rural Development of CIHEAM-Bari - in collaboration with FAO and other
Italian, Mediterranean and international institutions - has undertaken different
activities on the sustainability of the Mediterranean food system. In the
framework of these activities, a particular attention was devoted to the issue of
food waste in the Mediterranean and Balkan regions. Precise and accurate data
regarding food waste and losses should be enhanced. In the final declaration of
the 10th meeting of the CIHEAM member states’ agriculture ministers, held in
Algiers in February 2014, the relevance of food waste issue in the Mediterranean
countries was strongly stressed (CIHEAM, 2014).
The present paper is based on the results of a voluntary survey in North
Macedonia using a questionnaire that was adapted to the Mediterranean context
from previous questionnaires and studies on food waste (Last Minute Market,
2014). Moreover, a similar methodology was used in household food wastage
surveys in other Mediterranean (Elmenofi et al., 2015; Charbel et al., 2016; Sassi
et al., 2016; Ali Arous et al., 2017) and Balkan (Berjan et al., 2019; Preka et al.,
2020) countries. The tool used to conduct the food waste survey is a self-
administered questionnaire. It was designed and developed in Macedonian
language in December 2015 and was made available from March till June 2016
through the Survio website. Participation was entirely on a volunteer basis and
responses were analyzed only in aggregate.
The questionnaire consisted of 26 questions. It included a combination of
one-option and multiple-choice questions. The questionnaire was developed into
six sections. In the introductory part of the questionnaire, the concept of food
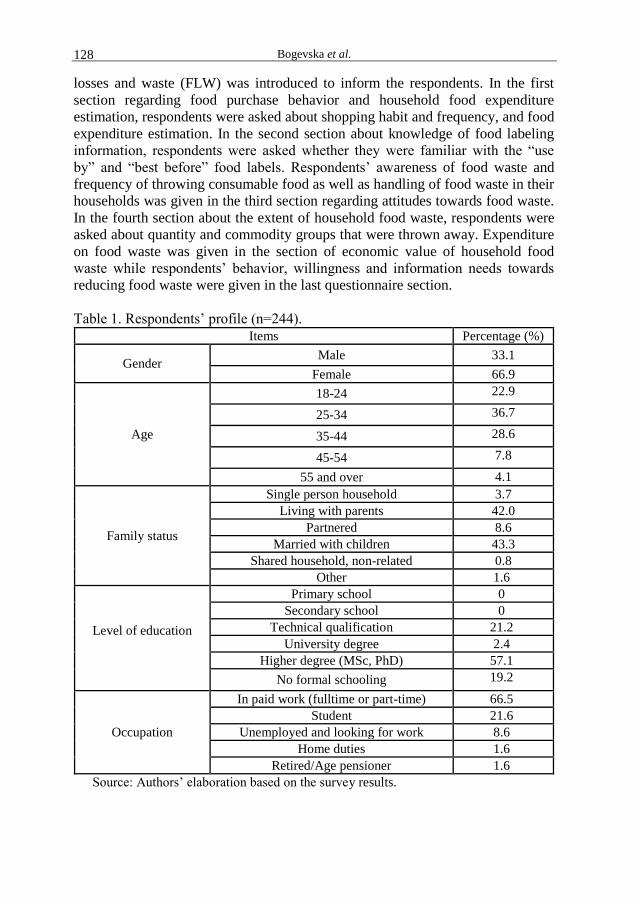
Bogevska et al. 128
losses and waste (FLW) was introduced to inform the respondents. In the first
section regarding food purchase behavior and household food expenditure
estimation, respondents were asked about shopping habit and frequency, and food
expenditure estimation. In the second section about knowledge of food labeling
information, respondents were asked whether they were familiar with the “use
by” and “best before” food labels. Respondents’ awareness of food waste and
frequency of throwing consumable food as well as handling of food waste in their
households was given in the third section regarding attitudes towards food waste.
In the fourth section about the extent of household food waste, respondents were
asked about quantity and commodity groups that were thrown away. Expenditure
on food waste was given in the section of economic value of household food
waste while respondents’ behavior, willingness and information needs towards
reducing food waste were given in the last questionnaire section.
Table 1. Respondents’ profile (n=244).
Items Percentage (%)
Gender Male 33.1
Female 66.9
Age
18-24 22.9
25-34 36.7
35-44 28.6
45-54 7.8
55 and over 4.1
Family status
Single person household 3.7
Living with parents 42.0
Partnered 8.6
Married with children 43.3
Shared household, non-related 0.8
Other 1.6
Level of education
Primary school 0
Secondary school 0
Technical qualification 21.2
University degree 2.4
Higher degree (MSc, PhD) 57.1
No formal schooling 19.2
Occupation
In paid work (fulltime or part-time) 66.5
Student 21.6
Unemployed and looking for work 8.6
Home duties 1.6
Retired/Age pensioner 1.6
Source: Authors’ elaboration based on the survey results.
Household food wastage in North Macedonia 129
Various institutional communication channels for dissemination of the
questionnaire were used, such as social media and mailing lists. Data were
analyzed using descriptive statistics (e.g. means, max, min), in order to get a
general picture of frequencies of variables, using Microsoft Excel.
Table 1 presents the profile of the respondents.
Out of 555 visits, 244 questionnaires were completed while 58 were
unfinished and 247 just visited the survey. Therefore, the total number of the
sample was 244. The sample was not gender-balanced (66.9% female and 33.1%
male). Most of the respondents were young (36.7% aged from 25 to 34 years).
More than a half of the respondents (57.1%) have high educational level.
Regarding family status, most of the respondents are married with children (43.3
%) followed by those who live with their parents (42.0%).
RESULTS AND DISCUSSION
Food purchase behavior and household food expenditure estimation
The survey showed that more than two thirds of the respondents (67.8%)
buy food products in supermarkets followed by those who buy their food in small
market (20.8%). The wide range of available food products at the same location
would be also a positive feature that persuades consumers to choose these
shopping locations. Only 1.6% of the respondents buy food directly from the
farm. About food shopping frequency, there were differences. Most of the
respondents (39.6%) buy food every day followed by those who buy it once every
2 days (25.3 %), twice a week (17.1%), once a week (14.3%), every 2 weeks
(3.3%) and once per month (0.4%).
Regarding expenses for food each month or food budget, most of North
Macedonian households spend more than 150 euro per month (44.5%), which is
relatively high, followed by those who spend 100-150 euro per month (29.8%).
The shopping list is sometimes used by most interviewees (48.6%). Only 31% of
the respondents use always a list for purchasing food. The remaining 20.4% do
not use shopping list. Much higher percentage of using the shopping list was
found in Karlsruhe (Germany) as well as in Ispra (Italy) where about 70% of
households use a shopping list (Priefer et al., 2013). Regarding attraction to
offers, more than a half of respondents (53.1%) are sometimes attracted while
37.6% are attracted by special offers. The influence of these offers would have
sometimes a great impact on the purchased quantity of food especially during
holidays.
Knowledge of food labelling information
Concerning “use by” food label, 68.6% of respondents understand and
have good knowledge about the meaning of this label as they think that food
should be consumed or discarded by this date. Some of them, about 26.9%,
consider that the food is still safe to eat after that date if it is not damaged or
spoiled while 4.5% think that food must be sold at a discount after this date. In
the case of “best before” label, it is surprising that 86.5% of respondents confuse
this label with “use by” as they think that food should be discarded after this date.
Bogevska et al. 130
Only 9% of the respondents showed good understanding of the meaning of this
label. The research in Greece showed better understanding of “best before” label
as 58.0% of the respondents answered that food can be consumed 1–2 days later,
while 38.5% believed it should be discarded immediately the day after (Abeliotis
et al., 2014).
Attitude towards food waste
Luckily, most of the respondents (92.7%) expressed a high awareness of
food waste and they worry about this issue and try to avoid food waste as much
as possible. This could be due to the fact that the North Macedonian culture,
customs and traditions, which are dominated by a religious character, make the
act of throwing food something outrageous. About 6.1% of them are aware of the
problems associated with food waste, but they do not think they will change their
behaviour in the near future. Nevertheless, a very low percentage (1.2%) did not
consider that food waste is a crucial problem.
Regarding how much food is wasted, 46.1% of the respondents answered
that the amount of food waste is very little while 23.7% do not throw almost
anything. A reasonable amount of food is thrown by 18.8% of the respondents.
About handling of uneaten food, more than a half of the respondents
(51.0%) feed animals while 42.9% of respondents answered that they throw it
away in the garbage bin. Very few of them (3.3%) do compost.
The frequency of throwing away leftovers or food considered as not good
has been also pointed out in the survey. The results showed that only 13.1% of
the respondents do not throw leftovers in comparison with 60% of them who
declared throwing food less than one time a week. On the other hand, 20% of the
respondents throw food leftovers 1 to 2 times a week while 6.9% throw away
food leftovers even more than 2 times a week which is considered not good.
As regards activities of respondents that affect the households’ food waste,
about 59.2% of the respondents eat store-purchased readymade meals (e.g. frozen
dinners) while 30.6% eat out or order a takeaway (as a main meal). Only 12.7%
of them eat a meal left over from a previous day. This result belongs relatively to
young sample of respondents with high education level, which can be highly
influenced by western food habit and consumption pattern. About frequency of
making a main meal from raw main ingredients, about 60.8% and 16.7% of the
respondents cook their meal three-six and seven-ten times per week respectively.
Similar results were obtained in Greece where on average people cook 4.7 times
per week (Stavros et al., 2017).
The results of the study showed that the main reasons for throwing food at
household level were that the food was not edible as result of expiration date
(48.6%), which is a result of bad food management at home. About 40.8% of the
respondents answered that food is thrown as it was left in the fridge for a long
time while 35.9% of them throw leftovers.
Extent of household food waste
Regarding how often food is thrown per week, 57.1% of the respondents
do not throw away food that is still consumable. About 20% of them throw less
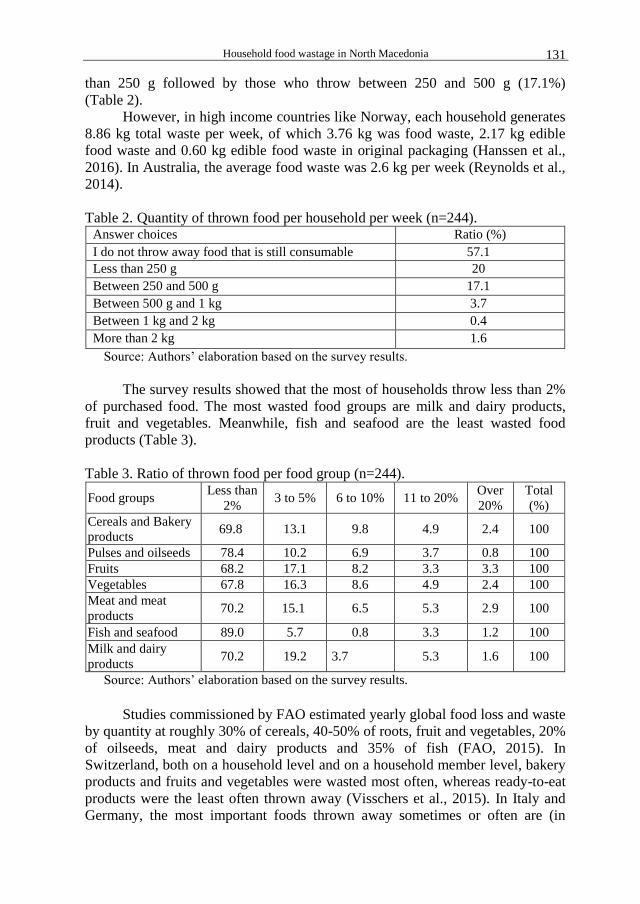
Household food wastage in North Macedonia 131
than 250 g followed by those who throw between 250 and 500 g (17.1%)
(Table 2).
However, in high income countries like Norway, each household generates
8.86 kg total waste per week, of which 3.76 kg was food waste, 2.17 kg edible
food waste and 0.60 kg edible food waste in original packaging (Hanssen et al.,
2016). In Australia, the average food waste was 2.6 kg per week (Reynolds et al.,
2014).
Table 2. Quantity of thrown food per household per week (n=244). Answer choices Ratio (%)
I do not throw away food that is still consumable 57.1
Less than 250 g 20
Between 250 and 500 g 17.1
Between 500 g and 1 kg 3.7
Between 1 kg and 2 kg 0.4
More than 2 kg 1.6
Source: Authors’ elaboration based on the survey results.
The survey results showed that the most of households throw less than 2%
of purchased food. The most wasted food groups are milk and dairy products,
fruit and vegetables. Meanwhile, fish and seafood are the least wasted food
products (Table 3).
Table 3. Ratio of thrown food per food group (n=244).
Food groups Less than
2% 3 to 5% 6 to 10% 11 to 20%
Over
20%
Total
(%)
Cereals and Bakery
products 69.8 13.1 9.8 4.9 2.4 100
Pulses and oilseeds 78.4 10.2 6.9 3.7 0.8 100
Fruits 68.2 17.1 8.2 3.3 3.3 100
Vegetables 67.8 16.3 8.6 4.9 2.4 100
Meat and meat
products 70.2 15.1 6.5 5.3 2.9 100
Fish and seafood 89.0 5.7 0.8 3.3 1.2 100
Milk and dairy
products 70.2 19.2 3.7 5.3 1.6 100
Source: Authors’ elaboration based on the survey results.
Studies commissioned by FAO estimated yearly global food loss and waste
by quantity at roughly 30% of cereals, 40-50% of roots, fruit and vegetables, 20%
of oilseeds, meat and dairy products and 35% of fish (FAO, 2015). In
Switzerland, both on a household level and on a household member level, bakery
products and fruits and vegetables were wasted most often, whereas ready-to-eat
products were the least often thrown away (Visschers et al., 2015). In Italy and
Germany, the most important foods thrown away sometimes or often are (in
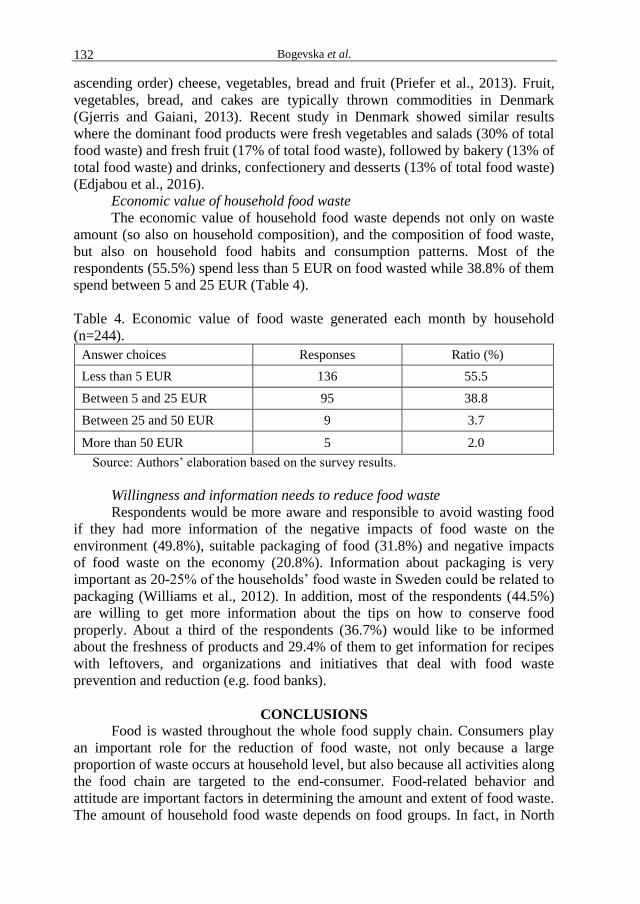
Bogevska et al. 132
ascending order) cheese, vegetables, bread and fruit (Priefer et al., 2013). Fruit,
vegetables, bread, and cakes are typically thrown commodities in Denmark
(Gjerris and Gaiani, 2013). Recent study in Denmark showed similar results
where the dominant food products were fresh vegetables and salads (30% of total
food waste) and fresh fruit (17% of total food waste), followed by bakery (13% of
total food waste) and drinks, confectionery and desserts (13% of total food waste)
(Edjabou et al., 2016).
Economic value of household food waste
The economic value of household food waste depends not only on waste
amount (so also on household composition), and the composition of food waste,
but also on household food habits and consumption patterns. Most of the
respondents (55.5%) spend less than 5 EUR on food wasted while 38.8% of them
spend between 5 and 25 EUR (Table 4).
Table 4. Economic value of food waste generated each month by household
(n=244).
Answer choices Responses Ratio (%)
Less than 5 EUR 136 55.5
Between 5 and 25 EUR 95 38.8
Between 25 and 50 EUR 9 3.7
More than 50 EUR 5 2.0
Source: Authors’ elaboration based on the survey results.
Willingness and information needs to reduce food waste
Respondents would be more aware and responsible to avoid wasting food
if they had more information of the negative impacts of food waste on the
environment (49.8%), suitable packaging of food (31.8%) and negative impacts
of food waste on the economy (20.8%). Information about packaging is very
important as 20-25% of the households’ food waste in Sweden could be related to
packaging (Williams et al., 2012). In addition, most of the respondents (44.5%)
are willing to get more information about the tips on how to conserve food
properly. About a third of the respondents (36.7%) would like to be informed
about the freshness of products and 29.4% of them to get information for recipes
with leftovers, and organizations and initiatives that deal with food waste
prevention and reduction (e.g. food banks).
CONCLUSIONS
Food is wasted throughout the whole food supply chain. Consumers play
an important role for the reduction of food waste, not only because a large
proportion of waste occurs at household level, but also because all activities along
the food chain are targeted to the end-consumer. Food-related behavior and
attitude are important factors in determining the amount and extent of food waste.
The amount of household food waste depends on food groups. In fact, in North
Household food wastage in North Macedonia 133
Macedonia the most wasted foods are milk and dairy products, fruit and
vegetables. It seems that there is still some confusion regarding food labels,
which increases the amount of food waste especially with the label “best before”.
The estimated economic value of food waste is rather low but still a source of
concern taking into consideration its share in the household food budget.
Awareness campaigns, early childhood education, economic incentives, sharing
networks for surplus food, last minute market and intelligent devices to
encourage responsible consumer behavior are measures to reduce waste at the end
of food chain (consumers).
REFERENCES Abeliotis, K., Lasaridi, K., Chroni, C. (2014). Attitudes and behavior of Greek households
regarding food waste prevention. Waste Management & Research, 32(3), pp. 237–240. DOI: 10.1177/0734242X14521681.
Abiad, M. G., & Meho, L. I. (2018). Food loss and food waste research in the Arab world: a systematic review. Food Security, 10(2), 311–322. https://doi.org/10.1007/s12571-018-0782-7
Ali Arous, S., Capone, R., Debs, P., Haddadi, Y., El Bilali, H., Bottalico, F., Hamidouche, M. (2017). Exploring household food waste issue in Algeria. AgroFor International Journal, Volume 2, Issue 1, pp. 55-67. https://doi.org/10.7251/AGRENG1701055A
Berjan, S., Capone, R., Debs, P. and El Bilali, H. (2018). Food losses and waste: a global overview with a focus on Near East and North Africa region. International Journal of Agricultural Management and Development 8(1): 1-16.
Berjan, S., Mrdalj, V., El Bilali, H., Velimirovic, A., Blagojevic, Z., Bottalico, F., Debs, P., Capone, R. (2019). Household food waste in Montenegro. Italian Journal of Food Science 31: 274-287. https://www.chiriottieditori.it/ojs/index.php/ijfs/article/view/1276
Capone, R., Debs, P., El Bilali, H., Cardone, G., Lamaddalena, N. (2014). Water Footprint in the Mediterranean Food Chain: Implications of Food Consumption Patterns and Food Wastage. International Journal of Nutrition and Food Sciences 3(2): 26-36. DOI: 10.11648/j.ijnfs.20140302.13.
Charbel, L., Capone, R., Grizi, L., Debs, P., Khalife, D., El Bilali, H., Bottalico, F. (2016). Preliminary insights on household food wastage in Lebanon. Journal of Food Security, 4, pp. 131-137. http://pubs.sciepub.com/jfs/4/6/2
Cicatiello, C., Franco, S., Pancino, B., Blasi, E. (2016). The value of food waste: An exploratory study on retailing. Journal of Retailing and Consumer Services 30, pp. 96–104. DOI:10.1016/j.jretconser.2016.01.004
CIHEAM (2014). 10th
meeting of the Ministers of Agriculture of CIHEAM’s Member Countries: Final declaration. February 6, Algiers (Algeria). http://www.ciheam.org/index.php/en/cooperation/ministerial-meetings
Edjabou, M. E., Petersen, C., Scheutz, C., Astrup, T. F. (2016). Food waste from Danish households: Generation and composition. Waste Management 52, pp. 256–268. DOI: 10.1016/j.wasman.2016.03.032.
El Bilali, H. (2019). Sustainable food consumption: Beyond promoting sustainable diets and reducing food wastage. In: Leal Filho W., Azul A., Brandli L., Özuyar P., Wall T. (Eds.), Encyclopedia of the UN Sustainable Development Goals. Zero Hunger. Springer, Cham. https://doi.org/10.1007/978-3-319-69626-3_51-1
El Bilali H. (2020). Improving supply chains to prevent food losses and waste: an overview. In, Elhadi Y. (Ed.), Preventing food losses and waste to achieve food security and sustainability, Burleigh Dodds Science Publishing, Cambridge (UK). http://dx.doi.org/10.19103/AS.2019.0053.08
Bogevska et al. 134
Elmenofi, A.G.G., Capone, R., Waked, S., Debs, P., Bottalico, F., El Bilali H. (2015). An exploratory survey on household food waste in Egypt. Book of Proceedings of the VI International Scientific Agriculture Symposium “Agrosym 2015”, Jahorina, Bosnia and Herzegovina; pp. 1298-1304.
FAO (2011). Global Food Losses and Food Waste – Extent, Causes and Prevention, FAO, Rome, Italy. http://www.fao.org/docrep/014/mb060e/mb060e.pdf
FAO (2013). Food wastage footprint: impacts on natural resources. Rome (Italy): Food and Agriculture Organization of the United Nation (FAO), 2013. http://www.fao.org/docrep/018/i3347e/i3347e.pdf
FAO (2015). Global initiative on food loss and waste reduction, 2015. http://www.fao.org/3/a-i4068e.pdf
FAO (2017). The future of food and agriculture – Trends and challenges. Rome (Italy): Food and Agriculture Organization of the United Nation (FAO), 2017. http://www.fao.org/3/a-i6583e.pdf
FAO (2019). The State of Food and Agriculture 2019 - Moving forward on food loss and waste reduction. Rome.
Gjerris, M., Gaiani, S. (2013). Household food waste in Nordic countries: Estimations and ethical implications. Nordic Journal of Applied Ethics, 7(1), pp. 6-23. DOI: 10.5324/eip.v7i1.1786
Gunders, D. (2012). Wasted: How America is Losing up to 40 Percent of its Food from Farm to Fork to Landfill. The Natural Resources Defense Council (NRDC). https://www.nrdc.org/sites/default/files/wasted-food-IP.pdf
Hanssen, O. J., Syversen, F., Stø, E. (2016). Edible food waste from Norwegian households—Detailed food waste composition analysis among households in two different regions in Norway. Resources Conservation and Recycling 109, 2016, pp. 146–154. DOI:10.1016/j.resconrec.2016.03.010
HLPE (2014). Food losses and waste in the context of sustainable food systems. A report by the High Level Panel of Experts on Food Security and Nutrition (HLPE) of the Committee on World Food Security. Rome (Italy): HLPE, 2014. http://www.fao.org/3/a-i3901e.pdf
Last Minute Market (2014). Last Minute Market - Trasformare lo spreco in risorse, Last Minute Market S.r.l., Bologna: Italy. http://www.lastminutemarket.it
Mallinson, L. J., Russell, J. M., Barker, M. E. (2016). Attitudes and behavior towards convenience food and food waste in the United Kingdom. Appetite 103, pp. 17-28. DOI:10.1016/j.appet. 2016.03.017
Marangon, F., Tempesta, T., Troiano, S., Vecchiato, D. (2014). Food waste, consumer attitudes and behaviour. A study in the North-Eastern part of Italy. Rivista di Economia Agraria, Anno LXIX, n. 2-3, pp. 201-209.
Mondéjar-Jiménez, J.A., Ferrari, G., Secondi, L. and Principato, L. (2016). From the table to waste: An exploratory study on behaviour towards food waste of Spanish and Italian youths. Journal of Cleaner Production 138: 8-18.
Parfitt, J., Barthel, M., Macnaughton, S. (2010). Food waste within food supply chains: quantification and potential for change to 2050. Philosophical Transactions of the Royal Society B, 365, pp. 3065–3081. DOI: 10.1098/rstb.2010.0126.
Preka, R., Berjan, S., Capone, R., El Bilali, H., Allahyari, M.S., Debs, P., Bottalico, F., Mrdalj, V. (2020). Household Food Wastage in Albania: Causes, Extent and Implications. Future of Food: Journal on Food, Agriculture and Society, 8(1): 1-20. DOI: 10.17170/kobra-202002281029
Priefer, C., Jörissen, J., Bräutigam, K. R. (2013). Technology options for feeding 10 billion people. Options for Cutting Food Waste. Study, Brussels, European Union. http://www.europarl.europa.eu/stoa
Principato, L. (2018). Food Waste at Consumer Level: A Comprehensive Literature Review. SpringerBriefs in Environmental Science, Springer, Cham. ISBN 978-3-319-78887-6.
Reynolds, C. J., Mavrakis, V., Davison, S., Høj, S. B., Vlaholias, E., Sharp, A., Thompson, K., Ward, P., Coveney, J., Piantadosi, J., Boland, J., Dawson, D.
Household food wastage in North Macedonia 135
(2014). Estimating informal household food waste in developed countries: The case of Australia. Waste Management & Research, 32(12), pp. 1254–1258. DOI: 10.1177/0734242X14549797.
Sassi, K., Capone, R., Abid, G., Debs, P., El Bilali, H., Daaloul Bouacha, O., Bottalico, F., Driouech, N., Terras Dorra, S. (2016). Food wastage by Tunisian households. AgroFor International Journal, 1, pp. 172-181. https://doi.org/10.7251/agreng1601172s
Schanes, K., Dobernig, K., & Gözet, B. (2018). Food waste matters - A systematic review of household food waste practices and their policy implications. Journal of Cleaner Production, 182, 978–991. https://doi.org/10.1016/j.jclepro.2018.02.030
Scherhaufer, S., Moates, G., Hartikainen, H., Waldron, K., & Obersteiner, G. (2018). Environmental impacts of food waste in Europe. Waste Management, 77, 98–113. https://doi.org/10.1016/j.wasman.2018.04.038
Stavros, T. P., Papanikolaou P.-A., Katimertzoglou, P., Athanasia C. N., Xenos, K.I. (2017). Household Food Waste in Greece: A Questionnaire Survey, Journal of Cleaner Production 149, 2017, pp. 1268-1277, DOI: 10.1016/j.jclepro.2017.02.165
Visschers, V. H. M., Wickli, N., Siegrist, M. (2016). Sorting out food waste behaviour: A survey on the motivators and barriers of self-reported amounts of food waste in households. Journal of Environmental Psychology 45, pp. 66-78. DOI:10.1016/j.jenvp.2015.11.007
Williams, H., Wikström, F., Otterbring, T., Löfgren, M., Gustafsson, A. (2012). Reasons for household food waste with special attention to packaging. Journal of Cleaner Production 24, pp. 141-148. DOI:10.1016/j.jclepro.2011.11.044.

Agriculture & Forestry, Vol. 66 Issue 2: 137-150, 2020, Podgorica 137
Kendal, E. (2020): Evaluation of some barley genotypes with genotype by yield* trait (GYT) biplot method.
Agriculture and Forestry, 66 (2): 137-150.
DOI: 10.17707/AgricultForest.66.2.13
Enver KENDAL1
EVALUATION OF SOME BARLEY GENOTYPES WITH GEOTYPE BY
YIELD* TRAIT (GYT) BIPLOT METHOD
SUMMARY
Determination of the most appropriate genotypes based on the multiple
trait index is a new method in plant breeding programs. Unpredictable climatic
conditions are altering the selection of genotypes based on multiple
environmental conditions and multiple traits. In barley breeding programs, some
traits (quality, earliness, lodging, etc.) can serve many of our primary breeding
purposes other than grain yield. For this reason, the genotype by yield*trait
(GYT) biplot approach was used to definite the best barley candidate among 12
barley genotypes based on multi (three) location and multi (nine)traits. In this
study, the strengths and weaknesses of each genotype were determined by
combining yield and other target traits with GYT biplot method. The general
adaptability of each genotype in terms of all features showed differences with
concerning for the average of years. On the other hand adaptability of genotypes
differed significantly in terms of GYT biplot and GT biplot methods. In the GT
biplot method, both the properties and the genotypes showed a wide distribution,
whereas in the GYT biplot method yield-feature combinations showed a narrower
variation and the most stable genotypes were identified more clearly. Besides, it
was concluded that GT biplot method GT bipot method is not very ideal for
determining the best genotypes, whereas GYT biplot showed that G4 genotype,
was the best; G3, G7, and G5 (Altıkat) variety were ideal genotypes for combined
traits. GYT biplot has shown that superior, ideal and stable genotypes can be
detected visually by combining all traits in breeding programs.
Keywords: Barley, genotypes, multi-location, trait, GYT.
INTRODUCTION
Barley (Hordeum vulgare L.) is a very considerable crop for different
industries (Animal feed, malt industries, human food, and biodiesel) and has been
produced nearly 135-145 million metric tons per year after corn, wheat, and rice
in the world. The production of barley, ranged between 5.5-7.5 million tons
depending on the year and it is the most produced after wheat in Turkey. Today,
the barley cultivated in the world, approximately 65-70% is used as animal feed,
33-35% as malt in beer, whiskey with biodiesel production and 2-3% as human
1Enver Kendal (corresponding author: [email protected]), Mardin Artuklu University,
Kızıltepe Vocational Training High School, Department of Crops and Animal Production, Mardin,
TURKEY.
Notes: The authors declare that they have no conflicts of interest. Authorship Form signed online.
Received:28/03/2020 Accepted:12/06/2020
Enver Kendal 138
food in food production. While in Turkey, 90-92% of barley consumption is used
as animal feed and the rest of it as malting in the brewing and food industry
(Anonymous 1).
Plant breeders have been working in all fields for many years in order feed
the developing world population and in recent years, they are focused on
developing high-quality varieties for a healthier diet. Since there is an inverse
relationship between grain yield and quality, it is very difficult to develop
varieties that are both high-yielding and high-quality. In addition, many
ecological and agronomic problems are encountered during breeding activities,
limiting the success of plant breeders and to develop different models to
overcome these problems. Evaluation of genotypes is confronted with two major
problems. The first is the negative interaction between the genotype and the
environmental interaction (GE) and the second, the basic traits (Kendal, 2019;
Yan and Frégeau-Reid, 2018).
The GT biplot technique has been used successfully by many researchers
for a long time to see the relationship between genotype by trait in different
plants, and effective selections were made in breeding programs according to the
interaction between genotype by trait. Despite the benefits of identifying the
relationships between the traits of genotypes and trait profiles, GT biplot, cannot
give enough results to the breeders about which genotype to be selected or
recommended and which genotype could not be selected or eliminated.
Therefore, GYT biplot technique was designed to complete the deficiencies
encountered in the GT biplot technique and to enable a more efficient selection of
plant breeders. GYT biplot is used to sort genotypes according to their general
advantages over yield by trait combinations and to show profiles of traits
(Mohammadi, 2019).
The first subjects for breeders; genotype x environment interactions (GEI)
have been studied for many years. Many different methods (GE, GEI, AMMI,
GET) have been developed to characterize the behavior of varieties under
different environmental conditions. In this regard, many researchers who work
with cereals in different years and environments (Kilic, 2014; Mohammadi et al.,
2014; Sayar and Han, 2015), reported that the interaction of genotype x year x
location (GYL) is very important, while Yan and Tinker (2006) suggested that the
number of locations should be increased because the GEI is smaller than the other
variance components and the genotype x location (GL) variance component is
also large.
The second subject is to develop varieties that can give good results (high
efficiency and quality, resistant to diseases and drought and temperature stress
and frost) in different environmental conditions. It is very difficult to improve the
best varieties in terms of all traits studied in different environments (Sayar, 2017;
Kendal, 2019). The reason is that the target traits are often negatively correlated
in such a way that the development in one trait usually leads to decreased levels
in one or more other traits. Therefore, the barley breeders understand the nature
of the correction of yield with related attributes. Some features (heading time and
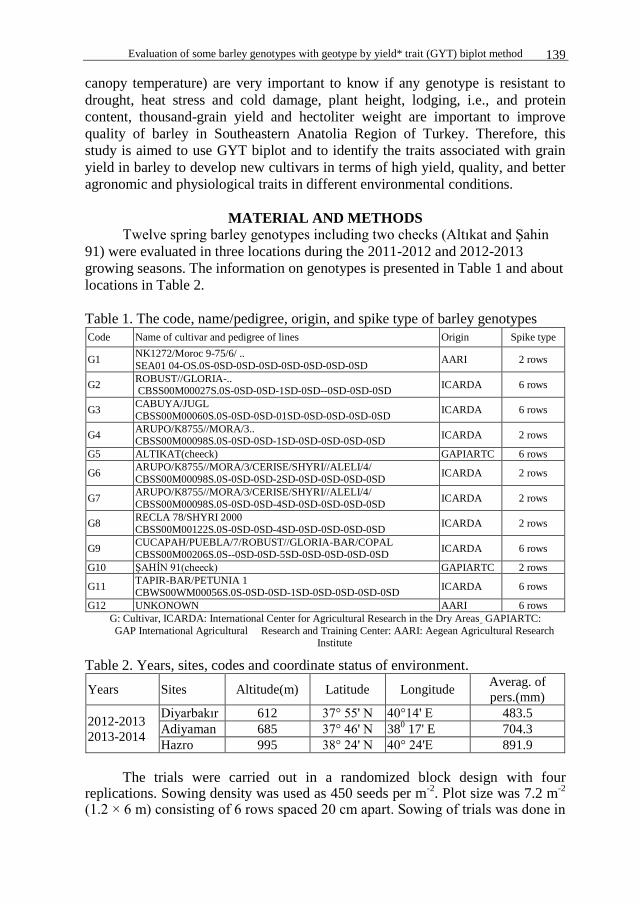
Evaluation of some barley genotypes with geotype by yield* trait (GYT) biplot method 139
canopy temperature) are very important to know if any genotype is resistant to
drought, heat stress and cold damage, plant height, lodging, i.e., and protein
content, thousand-grain yield and hectoliter weight are important to improve
quality of barley in Southeastern Anatolia Region of Turkey. Therefore, this
study is aimed to use GYT biplot and to identify the traits associated with grain
yield in barley to develop new cultivars in terms of high yield, quality, and better
agronomic and physiological traits in different environmental conditions.
MATERIAL AND METHODS Twelve spring barley genotypes including two checks (Altıkat and Şahin
91) were evaluated in three locations during the 2011-2012 and 2012-2013
growing seasons. The information on genotypes is presented in Table 1 and about
locations in Table 2.
Table 1. The code, name/pedigree, origin, and spike type of barley genotypes
Code Name of cultivar and pedigree of lines Origin Spike type
G1 NK1272/Moroc 9-75/6/ ..
SEA01 04-OS.0S-0SD-0SD-0SD-0SD-0SD-0SD-0SD AARI 2 rows
G2 ROBUST//GLORIA-.. CBSS00M00027S.0S-0SD-0SD-1SD-0SD--0SD-0SD-0SD
ICARDA 6 rows
G3 CABUYA/JUGL
CBSS00M00060S.0S-0SD-0SD-01SD-0SD-0SD-0SD-0SD ICARDA 6 rows
G4 ARUPO/K8755//MORA/3.. CBSS00M00098S.0S-0SD-0SD-1SD-0SD-0SD-0SD-0SD
ICARDA 2 rows
G5 ALTIKAT(cheeck) GAPIARTC 6 rows
G6 ARUPO/K8755//MORA/3/CERISE/SHYRI//ALELI/4/
CBSS00M00098S.0S-0SD-0SD-2SD-0SD-0SD-0SD-0SD ICARDA 2 rows
G7 ARUPO/K8755//MORA/3/CERISE/SHYRI//ALELI/4/
CBSS00M00098S.0S-0SD-0SD-4SD-0SD-0SD-0SD-0SD ICARDA 2 rows
G8 RECLA 78/SHYRI 2000
CBSS00M00122S.0S-0SD-0SD-4SD-0SD-0SD-0SD-0SD ICARDA 2 rows
G9 CUCAPAH/PUEBLA/7/ROBUST//GLORIA-BAR/COPAL
CBSS00M00206S.0S--0SD-0SD-5SD-0SD-0SD-0SD-0SD ICARDA 6 rows
G10 ŞAHİN 91(cheeck) GAPIARTC 2 rows
G11 TAPIR-BAR/PETUNIA 1 CBWS00WM00056S.0S-0SD-0SD-1SD-0SD-0SD-0SD-0SD
ICARDA 6 rows
G12 UNKONOWN AARI 6 rows
G: Cultivar, ICARDA: International Center for Agricultural Research in the Dry Areas GAPIARTC:
GAP International Agricultural Research and Training Center: AARI: Aegean Agricultural Research Institute
Table 2. Years, sites, codes and coordinate status of environment.
Years Sites Altitude(m) Latitude Longitude Averag. of
pers.(mm)
2012-2013
2013-2014
Diyarbakır 612 37° 55' N 40°14' E 483.5
Adiyaman 685 37° 46' N 380 17' E 704.3
Hazro 995 38° 24' N 40° 24'E 891.9
The trials were carried out in a randomized block design with four
replications. Sowing density was used as 450 seeds per m-2
. Plot size was 7.2 m-2
(1.2 × 6 m) consisting of 6 rows spaced 20 cm apart. Sowing of trials was done in
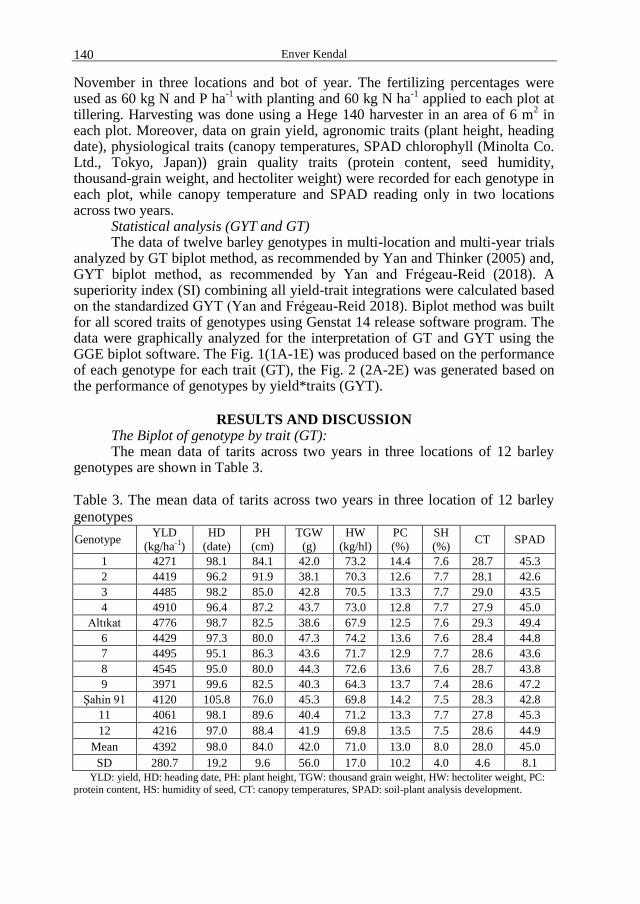
Enver Kendal 140
November in three locations and bot of year. The fertilizing percentages were used as 60 kg N and P ha
-1 with planting and 60 kg N ha
-1 applied to each plot at
tillering. Harvesting was done using a Hege 140 harvester in an area of 6 m2 in
each plot. Moreover, data on grain yield, agronomic traits (plant height, heading date), physiological traits (canopy temperatures, SPAD chlorophyll (Minolta Co. Ltd., Tokyo, Japan)) grain quality traits (protein content, seed humidity, thousand-grain weight, and hectoliter weight) were recorded for each genotype in each plot, while canopy temperature and SPAD reading only in two locations across two years.
Statistical analysis (GYT and GT) The data of twelve barley genotypes in multi-location and multi-year trials
analyzed by GT biplot method, as recommended by Yan and Thinker (2005) and, GYT biplot method, as recommended by Yan and Frégeau-Reid (2018). A superiority index (SI) combining all yield-trait integrations were calculated based on the standardized GYT (Yan and Frégeau-Reid 2018). Biplot method was built for all scored traits of genotypes using Genstat 14 release software program. The data were graphically analyzed for the interpretation of GT and GYT using the GGE biplot software. The Fig. 1(1A-1E) was produced based on the performance of each genotype for each trait (GT), the Fig. 2 (2A-2E) was generated based on the performance of genotypes by yield*traits (GYT).
RESULTS AND DISCUSSION The Biplot of genotype by trait (GT): The mean data of tarits across two years in three locations of 12 barley
genotypes are shown in Table 3.
Table 3. The mean data of tarits across two years in three location of 12 barley
genotypes
Genotype YLD
(kg/ha-1)
HD
(date)
PH
(cm)
TGW
(g)
HW
(kg/hl)
PC
(%)
SH
(%) CT SPAD
1 4271 98.1 84.1 42.0 73.2 14.4 7.6 28.7 45.3
2 4419 96.2 91.9 38.1 70.3 12.6 7.7 28.1 42.6
3 4485 98.2 85.0 42.8 70.5 13.3 7.7 29.0 43.5
4 4910 96.4 87.2 43.7 73.0 12.8 7.7 27.9 45.0
Altıkat 4776 98.7 82.5 38.6 67.9 12.5 7.6 29.3 49.4
6 4429 97.3 80.0 47.3 74.2 13.6 7.6 28.4 44.8
7 4495 95.1 86.3 43.6 71.7 12.9 7.7 28.6 43.6
8 4545 95.0 80.0 44.3 72.6 13.6 7.6 28.7 43.8
9 3971 99.6 82.5 40.3 64.3 13.7 7.4 28.6 47.2
Şahin 91 4120 105.8 76.0 45.3 69.8 14.2 7.5 28.3 42.8
11 4061 98.1 89.6 40.4 71.2 13.3 7.7 27.8 45.3
12 4216 97.0 88.4 41.9 69.8 13.5 7.5 28.6 44.9
Mean 4392 98.0 84.0 42.0 71.0 13.0 8.0 28.0 45.0
SD 280.7 19.2 9.6 56.0 17.0 10.2 4.0 4.6 8.1
YLD: yield, HD: heading date, PH: plant height, TGW: thousand grain weight, HW: hectoliter weight, PC:
protein content, HS: humidity of seed, CT: canopy temperatures, SPAD: soil-plant analysis development.
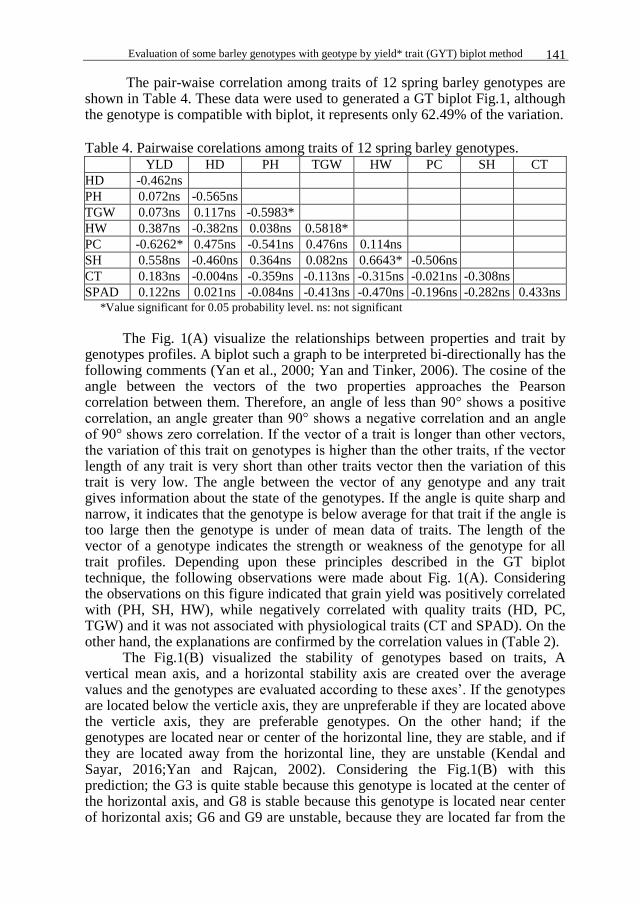
Evaluation of some barley genotypes with geotype by yield* trait (GYT) biplot method 141
The pair-waise correlation among traits of 12 spring barley genotypes are shown in Table 4. These data were used to generated a GT biplot Fig.1, although the genotype is compatible with biplot, it represents only 62.49% of the variation.
Table 4. Pairwaise corelations among traits of 12 spring barley genotypes. YLD HD PH TGW HW PC SH CT
HD -0.462ns
PH 0.072ns -0.565ns
TGW 0.073ns 0.117ns -0.5983*
HW 0.387ns -0.382ns 0.038ns 0.5818*
PC -0.6262* 0.475ns -0.541ns 0.476ns 0.114ns
SH 0.558ns -0.460ns 0.364ns 0.082ns 0.6643* -0.506ns
CT 0.183ns -0.004ns -0.359ns -0.113ns -0.315ns -0.021ns -0.308ns
SPAD 0.122ns 0.021ns -0.084ns -0.413ns -0.470ns -0.196ns -0.282ns 0.433ns *Value significant for 0.05 probability level. ns: not significant
The Fig. 1(A) visualize the relationships between properties and trait by
genotypes profiles. A biplot such a graph to be interpreted bi-directionally has the following comments (Yan et al., 2000; Yan and Tinker, 2006). The cosine of the angle between the vectors of the two properties approaches the Pearson correlation between them. Therefore, an angle of less than 90° shows a positive correlation, an angle greater than 90° shows a negative correlation and an angle of 90° shows zero correlation. If the vector of a trait is longer than other vectors, the variation of this trait on genotypes is higher than the other traits, ıf the vector length of any trait is very short than other traits vector then the variation of this trait is very low. The angle between the vector of any genotype and any trait gives information about the state of the genotypes. If the angle is quite sharp and narrow, it indicates that the genotype is below average for that trait if the angle is too large then the genotype is under of mean data of traits. The length of the vector of a genotype indicates the strength or weakness of the genotype for all trait profiles. Depending upon these principles described in the GT biplot technique, the following observations were made about Fig. 1(A). Considering the observations on this figure indicated that grain yield was positively correlated with (PH, SH, HW), while negatively correlated with quality traits (HD, PC, TGW) and it was not associated with physiological traits (CT and SPAD). On the other hand, the explanations are confirmed by the correlation values in (Table 2).
The Fig.1(B) visualized the stability of genotypes based on traits, A vertical mean axis, and a horizontal stability axis are created over the average values and the genotypes are evaluated according to these axes’. If the genotypes are located below the verticle axis, they are unpreferable if they are located above the verticle axis, they are preferable genotypes. On the other hand; if the genotypes are located near or center of the horizontal line, they are stable, and if they are located away from the horizontal line, they are unstable (Kendal and Sayar, 2016;Yan and Rajcan, 2002). Considering the Fig.1(B) with this prediction; the G3 is quite stable because this genotype is located at the center of the horizontal axis, and G8 is stable because this genotype is located near center of horizontal axis; G6 and G9 are unstable, because they are located far from the
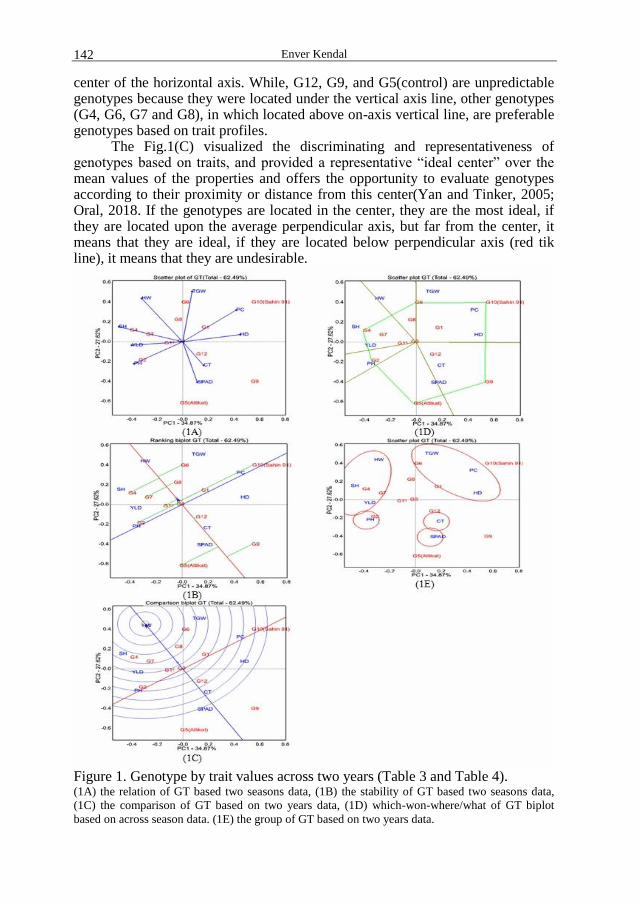
Enver Kendal 142
center of the horizontal axis. While, G12, G9, and G5(control) are unpredictable genotypes because they were located under the vertical axis line, other genotypes (G4, G6, G7 and G8), in which located above on-axis vertical line, are preferable genotypes based on trait profiles.
The Fig.1(C) visualized the discriminating and representativeness of genotypes based on traits, and provided a representative “ideal center” over the mean values of the properties and offers the opportunity to evaluate genotypes according to their proximity or distance from this center(Yan and Tinker, 2005; Oral, 2018. If the genotypes are located in the center, they are the most ideal, if they are located upon the average perpendicular axis, but far from the center, it means that they are ideal, if they are located below perpendicular axis (red tik line), it means that they are undesirable.
Figure 1. Genotype by trait values across two years (Table 3 and Table 4). (1A) the relation of GT based two seasons data, (1B) the stability of GT based two seasons data,
(1C) the comparison of GT based on two years data, (1D) which-won-where/what of GT biplot
based on across season data. (1E) the group of GT based on two years data.

Evaluation of some barley genotypes with geotype by yield* trait (GYT) biplot method 143
Considering the Fig.1(C) with this prediction; G6 is more ideal than G4, G7 and G8, because it is nearest to the “ideal center”, while G5(control) and G9 located under perpendicular axis, and also far from “ideal center, so this two genotype are undesirable.
The Fig.1(D) visualized the polygon of which-won-where/what of GT biplot based on across season data. The figure divided by thick axis from center, and each zone separated by two thick lines is referred to as the “sector” and is indicated by numbers 1, 2, 3, etc., starting from the lower right part of the graph, and if the genotypes and traits are located in the same sector, they are very close to each other (Yan and Tinker, 2006; Kendal and Sayar, 2016). Considering Fig.1(D) with this prediction; the figure is divided into 6 sectors (seperated each other by a tik line in the figure) and different traits are associated with different genotypes in each sector. The genotype G9 is a winner of the sector 1 located in the same sector with G12 and correlated to CT trait, G10 Şahin(control) is a winner of sector 2 located in the same sector with G1 with HD, PC, TGW. The genotype G6 is winning of sector 3 located in the same sector with G8 and did not correlate to any trait. The genotype G4 is winning of sector 4 located in same sector with G3, G7, and G11, YLD, SH, and HW. The genotype 2 is a winner of the sector 5 and correlated with PH, while G5 Altıkat(control) variety is a winner of the sector 6 with SPAD only.
The Fig.1(E) visualized the group of GT based on across season data and in
the figure, the traits and genotypes have relationship, If they are located in the
center a circle, it means that there is positive correlation among them (Kendal et
al., 2016; Kizilgeci et al., 2019). Considering Fig.1(E) In the light of these
explanations; traits were separated into 5 different groups (each one group
identified by a circle). The first group was included HD, PC, TGW, the second
group included GY, SH, HW, while PH, BT, and SPAD were included
independent groups (3, 4 and 5). The G6 is located in group 1(HD, PC, TGW),
G4 located in center group 2 (GY, SH, HW) and G2 located in the group of PH.
The results showed that the G6 is a winner for HD, PC, TGW, G4 for GY, SH,
HW, and G2 for PH.
The Biplot of genotype by yield trait combination (GYT):
The genotype by yield*trait (GYT) data for 12 spring barley genotypes
across two years in three locations shown in (Table 5). The data in the GYT table
(Table 5) was generated from the GT table (Table 3) and in GYT table, .the data
in each column consists of a combination of yield-trait. The standardized
genotype by yield*trait (GYT) data and superiority index for 12 spring barley
genotypes across two years in three locations shown in Table 6. The genotypes
were quite compatible with biplot, they represent 88.94% of the total variation
(PC1 %76.40, PC2 %12.54). GYT biplot, in the combination with the yield and
any trait, is used to measure how the grain yield is combined with that trait in
genotypes. When both the grain yield and the values of any trait are low or high,
the values will be either low or high and the genotypes will be evaluated
accordingly. On the other hand, the GYT biplot technique was developed to
determine where the value of a trait of any genotype is low, grain yield is high or
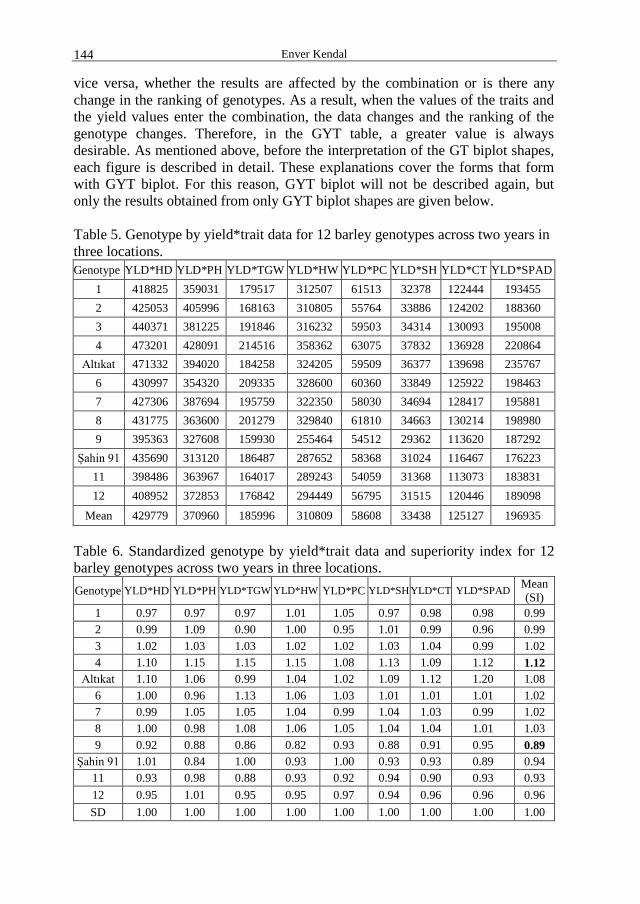
Enver Kendal 144
vice versa, whether the results are affected by the combination or is there any
change in the ranking of genotypes. As a result, when the values of the traits and
the yield values enter the combination, the data changes and the ranking of the
genotype changes. Therefore, in the GYT table, a greater value is always
desirable. As mentioned above, before the interpretation of the GT biplot shapes,
each figure is described in detail. These explanations cover the forms that form
with GYT biplot. For this reason, GYT biplot will not be described again, but
only the results obtained from only GYT biplot shapes are given below.
Table 5. Genotype by yield*trait data for 12 barley genotypes across two years in
three locations.
Genotype YLD*HD YLD*PH YLD*TGW YLD*HW YLD*PC YLD*SH YLD*CT YLD*SPAD
1 418825 359031 179517 312507 61513 32378 122444 193455
2 425053 405996 168163 310805 55764 33886 124202 188360
3 440371 381225 191846 316232 59503 34314 130093 195008
4 473201 428091 214516 358362 63075 37832 136928 220864
Altıkat 471332 394020 184258 324205 59509 36377 139698 235767
6 430997 354320 209335 328600 60360 33849 125922 198463
7 427306 387694 195759 322350 58030 34694 128417 195881
8 431775 363600 201279 329840 61810 34663 130214 198980
9 395363 327608 159930 255464 54512 29362 113620 187292
Şahin 91 435690 313120 186487 287652 58368 31024 116467 176223
11 398486 363967 164017 289243 54059 31368 113073 183831
12 408952 372853 176842 294449 56795 31515 120446 189098
Mean 429779 370960 185996 310809 58608 33438 125127 196935
Table 6. Standardized genotype by yield*trait data and superiority index for 12
barley genotypes across two years in three locations.
Genotype YLD*HD YLD*PH YLD*TGW YLD*HW YLD*PC YLD*SH YLD*CT YLD*SPAD Mean
(SI)
1 0.97 0.97 0.97 1.01 1.05 0.97 0.98 0.98 0.99
2 0.99 1.09 0.90 1.00 0.95 1.01 0.99 0.96 0.99
3 1.02 1.03 1.03 1.02 1.02 1.03 1.04 0.99 1.02
4 1.10 1.15 1.15 1.15 1.08 1.13 1.09 1.12 1.12
Altıkat 1.10 1.06 0.99 1.04 1.02 1.09 1.12 1.20 1.08
6 1.00 0.96 1.13 1.06 1.03 1.01 1.01 1.01 1.02
7 0.99 1.05 1.05 1.04 0.99 1.04 1.03 0.99 1.02
8 1.00 0.98 1.08 1.06 1.05 1.04 1.04 1.01 1.03
9 0.92 0.88 0.86 0.82 0.93 0.88 0.91 0.95 0.89
Şahin 91 1.01 0.84 1.00 0.93 1.00 0.93 0.93 0.89 0.94
11 0.93 0.98 0.88 0.93 0.92 0.94 0.90 0.93 0.93
12 0.95 1.01 0.95 0.95 0.97 0.94 0.96 0.96 0.96
SD 1.00 1.00 1.00 1.00 1.00 1.00 1.00 1.00 1.00
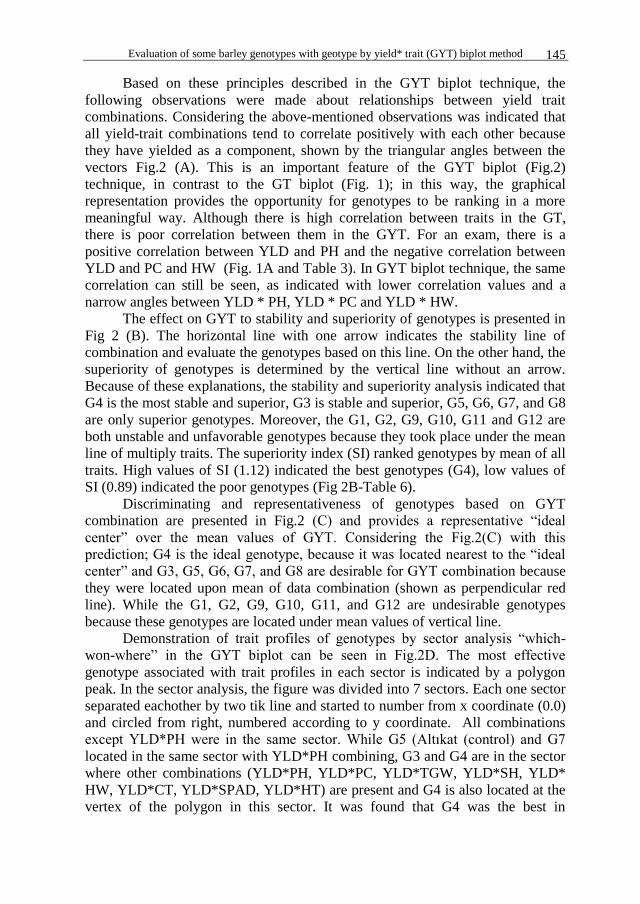
Evaluation of some barley genotypes with geotype by yield* trait (GYT) biplot method 145
Based on these principles described in the GYT biplot technique, the
following observations were made about relationships between yield trait
combinations. Considering the above-mentioned observations was indicated that
all yield-trait combinations tend to correlate positively with each other because
they have yielded as a component, shown by the triangular angles between the
vectors Fig.2 (A). This is an important feature of the GYT biplot (Fig.2)
technique, in contrast to the GT biplot (Fig. 1); in this way, the graphical
representation provides the opportunity for genotypes to be ranking in a more
meaningful way. Although there is high correlation between traits in the GT,
there is poor correlation between them in the GYT. For an exam, there is a
positive correlation between YLD and PH and the negative correlation between
YLD and PC and HW (Fig. 1A and Table 3). In GYT biplot technique, the same
correlation can still be seen, as indicated with lower correlation values and a
narrow angles between YLD * PH, YLD * PC and YLD * HW.
The effect on GYT to stability and superiority of genotypes is presented in
Fig 2 (B). The horizontal line with one arrow indicates the stability line of
combination and evaluate the genotypes based on this line. On the other hand, the
superiority of genotypes is determined by the vertical line without an arrow.
Because of these explanations, the stability and superiority analysis indicated that
G4 is the most stable and superior, G3 is stable and superior, G5, G6, G7, and G8
are only superior genotypes. Moreover, the G1, G2, G9, G10, G11 and G12 are
both unstable and unfavorable genotypes because they took place under the mean
line of multiply traits. The superiority index (SI) ranked genotypes by mean of all
traits. High values of SI (1.12) indicated the best genotypes (G4), low values of
SI (0.89) indicated the poor genotypes (Fig 2B-Table 6).
Discriminating and representativeness of genotypes based on GYT
combination are presented in Fig.2 (C) and provides a representative “ideal
center” over the mean values of GYT. Considering the Fig.2(C) with this
prediction; G4 is the ideal genotype, because it was located nearest to the “ideal
center” and G3, G5, G6, G7, and G8 are desirable for GYT combination because
they were located upon mean of data combination (shown as perpendicular red
line). While the G1, G2, G9, G10, G11, and G12 are undesirable genotypes
because these genotypes are located under mean values of vertical line.
Demonstration of trait profiles of genotypes by sector analysis “which-
won-where” in the GYT biplot can be seen in Fig.2D. The most effective
genotype associated with trait profiles in each sector is indicated by a polygon
peak. In the sector analysis, the figure was divided into 7 sectors. Each one sector
separated eachother by two tik line and started to number from x coordinate (0.0)
and circled from right, numbered according to y coordinate. All combinations
except YLD*PH were in the same sector. While G5 (Altıkat (control) and G7
located in the same sector with YLD*PH combining, G3 and G4 are in the sector
where other combinations (YLD*PH, YLD*PC, YLD*TGW, YLD*SH, YLD*
HW, YLD*CT, YLD*SPAD, YLD*HT) are present and G4 is also located at the
vertex of the polygon in this sector. It was found that G4 was the best in
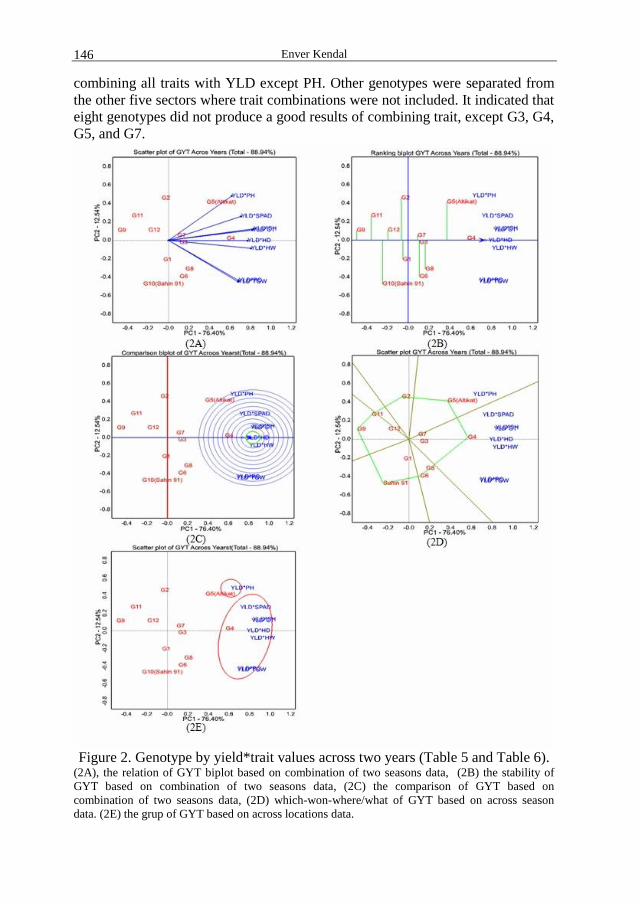
Enver Kendal 146
combining all traits with YLD except PH. Other genotypes were separated from
the other five sectors where trait combinations were not included. It indicated that
eight genotypes did not produce a good results of combining trait, except G3, G4,
G5, and G7.
Figure 2. Genotype by yield*trait values across two years (Table 5 and Table 6).
(2A), the relation of GYT biplot based on combination of two seasons data, (2B) the stability of
GYT based on combination of two seasons data, (2C) the comparison of GYT based on
combination of two seasons data, (2D) which-won-where/what of GYT based on across season
data. (2E) the grup of GYT based on across locations data.
Evaluation of some barley genotypes with geotype by yield* trait (GYT) biplot method 147
Fig.2 (E) visualized yield-trait combinations, which are in a close
relationship, located in the same circle. Considering Fig.1 (E) in the light of these
explanations; yield-trait combinations were separated 2 groups. The first group
were included all combinations with yield (HD, PC, TGW, GY, SH, HW PH, BT,
SPAD) except YLD*PH. İt indicated that there was a high correlation among all
traits with yield combination except PH. On the other hand, the figure showed
that G4 was located in the center group of yield-trait combination without
YLD*PH.
Since nearly 20 years, many studies have been conducted on GE, GEI and
GT in different plants and the results of these studies have been published by
many breeders (Dehghani et al., 2006;Yan and Tinker, 2006; Sayar, 2017;
Karaman, 2019; Kizilgeci et al., 2019). However, there are almost no publications
related to the evaluation of genotypes based on multiple traits (de Oliveira et al.,
2019; Kendal, 2019; Yan and Frégeau-Reid, 2018). When the genotypes are
evaluated for each trait separately or if the traits in each location are evaluated
separately, sometime, some tricks or general effects may be missed. Therefore,
breeders use different methods in breeding studies to make a calculation based on
the rating system based on the effect of each trait and try to select the best
genotypes. However, since the varieties registered are not registered with a
selection based on the multi-feature combination of all locations, they cannot
perform well due to the problem of agronomic properties, when they grow in
other regions with similar conditions outside the central region. However, when
the varieties are registered with a selection based on the combination of
properties obtained from multiple locations with yield, then they will be quite
stable in terms of all properties and yield for all similar regions. For this purpose;
GYT biplot methodology has been recently developed and has been used by a
few researchers for the evaluation of the data obtained from the combination of
the multiple traits with yield and multiple locations in the breeding studies. GYT
biplot approach has been reported to be a comprehensive and effective method
since it classifies genotypes according to their levels in combination with target
characteristics and graphically ranks the genotypes with their strengths and
weaknesses and in different plants (Yan et al., 2019). If the selection of genotypes
is based on one trait, it can be neglected in terms of other traits; therefore, it is
more advantageous to use GYT biplot instead of GT biplot in breeding studies. In
fact, in barley breeding studies, the yield is the only trait that can determine the
effectiveness of a genotype alone; other traits (agronomic characteristics, quality
characteristics or stress resistance) are valuable only for the breeders when
combined with high yield levels, and these properties alone do not mean anything
to growers. For example; a barley genotype is not valuable for breeders if it is
high quality, resistant to temperature stress and the yield is low. However, the
genotype is valuable if the genotype is both high yielding, and has good
agronomic and quality characteristics as well as. Kilic et al., (2018), reported that
GT biplot analysis permitted a meaningful and useful summary of GT interaction
data and assisted in examining the natural relationships and variations in
Enver Kendal 148
genotype performance on traits. Therefore, in selecting the best genotypes, the
combined effects of yield-trait are more meaningful than the effects of individual
traits. In the GT biplot technique, a great value (Table 3, Fig 1B) makes the ATC
appearance insignificant in some cases (Solonechnyi et al., 2018), while in the
GYT biplot technique it makes the ATC appearance a meaningful and effective
tool because it ranks genotypes based on various yield-trait combinations and
indicates the strengths and weaknesses of genotypes (Fig. 2(B), Table 5). The GT
biplot technique was used to construct Fig. 1 (A-E) using the data in Table 3,
while the GYT biplot technique was used in Fig.2 (A-E) using the data given in
Table 5 and genotypes were examined with different graphs according to both
techniques. While the barley producers strive to obtain maximum and high-
quality products from the unit area (Kendal and Dogan, 2015). Feed industrialists
also strive to obtain feeds that are easy to process and demand animal breeders.
All these needs can only be achieved by using GYT biplot methodology and the
products which are widely used in production areas. The genotypes were
examined depend on the superiority index (SI) and yield-trait combination (GYT)
and the result of Fig. 2 showed that the genotypes can be evaluate than GT biplot
in Fig 1.On the other hand, in GT biplot there is not clear of best genotype which
is very stable for all traits, while the G4 is stable and G3and G7 for all trait in
GYT biplot. Therefore, it was found in this study that GYT biplot technique is a
suitable method for determining the most suitable genotype for all properties in
barley breeding studies.
CONCLUSIONS
The objectives of genotypes by yield˟triats combination suggested that
there are more reason to use this method in multi-location, multi-years with
multi-traits studies. In GYT biplot technique, the total ratio of PC1 and PC2 in
total variation is higher than GT biplot technique. In GYT biplot technique, it is
seen that there is a special variation relationship between all traits and yield,
while general relationship in GT biplot technique. In terms of all traits, the GYT
biplot technique provides information on the general adaptability of genotypes,
while the GT biplot technique provides information on specific adaptability
capabilities. In terms of all traits, the stability of the genotypes and the best
genotype is clearly seen in the GYT biplot technique (G4), while the GT biplot
technique is more complex.
REFERENCES Anonymus 1. http://www.fao.org/faostat/en/#data/QC
Oliveira TRA, Amaral Gravina G, Moura Rocha M, Alcântara Neto F, Cruz DP, Oliveira
GHF., Rocha RS. 2019. GYT Biplot Analysis: A New Approach for Cowpea Line
Selection. Journal of Experimental Agriculture International, 41(5), 1-9.
Dehghani H, Ebadi A, Yousefi A. 2006. Biplot analysis of genotype by environment
interaction for barley yield in Iran. Agronomy Journal, 98(2), 388-393.
Evaluation of some barley genotypes with geotype by yield* trait (GYT) biplot method 149
Karaman M. 2019. Evaluation of bread wheat genotypes in irrigated and rainfed
conditions using biplot analysis. Applied Ecology and Environmental Res., 17(1),
1431-1450.
Kendal E and Sayar M.S. 2016. The stability of some spring triticale genotypes using
biplot analysis, The Journal of Animal & Plant Sciences, 26(3): 2016, Page:754-
765.
Kendal E. 2019. Comparing durum wheat cultivars with genotype×yield×trait (GYT) and
genotype× trait (GT) by biplot method. Chilean Journal of Agricultural Research,
79(04), 512-522.
Kendal E, Sayar MS, Tekdal S, Aktas H and Karaman M. 2016. Assessment of the impact
of ecological factors on yield and quality parameters in triticale using GGE biplot
and AMMI analysis. Pak. J. Bot., 48(5): 1903-1913.
Kendal E, Tekdal S, & Karaman M. 2019. Proficiency of biplot methods (AMMI and
GGE) in the appraisal of triticale genotypes in multiple environments. Applied
Ecology and Environmental Research, 17(3), 5995-6007.
Kendal, E., & Dogan, Y. 2015. Stability of a candidate and cultivars (Hordeum vulgare
L) by GGE biplot analysis of multi-environment yield trial in spring barley.
Agriculture & Forestry, 61(4), 307-318.
Kılıç H., Kendal E., Aktaş H. 2018 Evaluatıon of yield and some quality characters of
winter barley (Hordeum vulgare L.) genotypes using biplot analysis. Agriculture
& Forestry, 64(3) 101-111.
Kilic H. 2014. Additive main effect and multiplicative interactions (AMMI) Analysis of
grain yield in barley genotypes across environments, J. Agr. Sc. 20,337-344.
Kizilgeci F, Albayrak O, & Yildirim M. 2019. Evaluation of thirteen durum wheat
(Triticium durum Desf.) genotypes suitable for multiple environments using GGE
biplot analysis. Fresenius Environmental Bulletin, 28(9), 6873-6882.
Kizilgeci F, Albayrak O, Yildirim M, & Akinci C. 2019. Stability evaluation of bread
wheat genotypes under varying environments by AMMI model. Fresenius Env.
Bulletin, 28(9), 6865-6872.
Mohammadi R. 2019. Genotype by Yield* Trait Biplot for Genotype Evaluation and Trait
Profiles in Durum Wheat. Cereal Research Communications, 47(3), 541-551.
Mohammadi R, Haghparast R, Sadeghzadeh B, Ahmadi H, Solimani K, Amri. A. 2014.
Adaptation patterns and yield stability of durum wheat landraces to highland cold
rainfed areas of Iran. Crop Science 54: 944–954.
Oral E. 2018. Effect of nitrogen fertilization levels on graın yıeld and yield components in
triticale based on AMMI and GGE biplot analysis. Applied Ecology and
Environmental Research, 16(4), 4865-4878.
Sayar M.S. 2017. Additive Main Effects and Multiplicative Interactions (AMMI)
Analysis for Fresh Forage Yield in Common Vetch (Vicia sativa L.)
Genotypes. Agr. & For., 63 (1): 119-127.
Sayar MS and Han Y. 2015. Determination of seed yield and yield components of
grasspea (Lathyrus sativus L.) lines and evaluations using GGE Biplot analysis
method. Tarim Bilimleri Dergisi- J. Agric. Sci,, 21(1): 78-92.
Solonechnyi, P., Kozachenko, M., Vasko, N., Gudzenko, V., Ishenko, V., Kozelets, G.,
Usova, N., Logvinenko Y., Vinyukov, A. 2018: AMMI and GGE biplot analysis of
yield performance of spring barley (Hordeum vulgare L.) varieties in multi
environment trials. Agriculture and Forestry, 64 (1): 121-132.
DOI:10.17707/AgricultForest.64.1.15
Enver Kendal 150
Yan W, Tinker NA. 2005. An integrated biplot analysis system for displaying,
interpreting, and exploring genotype× environment interaction. Crop
Science, 45(3), 1004-1016.
Yan W, Tinker NA. 2006. Biplot analysis of multi-environment trial data: Principles and
applications. Canadian journal of plant science, 86(3), 623-645.
Yan W, Frégeau-Reid J. 2018. Genotype by Yield* Trait (GYT) Biplot: a Novel
Approach for Genotype Selection based on Multiple Traits. Sci Rep., 8:1-10.
Yan W, and Rajcan I.R. 2002. Biplot analysis of test sites and trait relations of soybean in
Ontario. Canadian Journal Plant Science. 42:11–20.
Yan W, Frégeau-Reid, J, Mountain N, & Kobler J. 2019. Genotype and management
evaluation based on genotype by yield* trait (GYT) analysis. Crop Breeding,
Genetics and Genomics, 1(2).
Yan W, Hunt LA, Sheng Q, Szlavnics Z. 2000. Cultivar evaluation and mega-
environment investigation based on the GGE biplot. Crop Science, 40(3), 597-605.
Agriculture & Forestry, Vol. 66 Issue 2: 151-156, 2020, Podgorica 151
Dubljević, R., Đorđević, N., Radonjić, D., Đokić, M. (2020): Quality of silage of mixed sunchoke and lucerne
forage. Agriculture and Forestry, 66 (2): 151-156.
DOI: 10.17707/AgricultForest.66.2.14
Radisav DUBLJEVIĆ1, Nenad ĐORĐEVIĆ
2,
Dušica RADONJIĆ1, Milena ĐOKIĆ
1
QUALITY OF SILAGE OF MIXED SUNCHOKE
AND LUCERNE FORAGE
SUMMARY
The paper presents the chemical composition, nutritional and usable value
of sunchoke (Helianthus tuberosus L.) and the possibility of using it for animal
nutrition in fresh and canned form. Tests show that sunchoke cut in mid-June
contains about 9.43% of crude protein, 2.49% of crude fat, 19.93% of crude
cellulose, 50.50% of NFE (nitrogen-free extractives) and 17.65% of ash in the dry
matter. Although lucerne biomass had a more favorable chemical composition
(18.13% crude protein, 6.72% crude fat, 25.24% crude cellulose, 39.35% BEM
and 10.56% ash), the benefits of sunchoke are in the more successful growing in
less favorable natural, primarily soil conditions, the more suitable it is for ensiling
and the longer it stays on one planted plot. Since it is predominantly an energy
(carbohydrate) nutrient, the possibility of ensiling the green biomass of sunchoke
in a mixture with 25, 50 and 75% fresh lucerne (25% dry matter) was
investigated. The obtained results show that with the increase of lucerne
participation, the nutritional value of silage increases, but the quality decreases.
In addition to its role in conventional feed production, sunchoke can be an
important plant in the system of organic production, production for industrial
processing and for extensive cultivation in hunting grounds.
Keywords: sunchoke, lucerne, nutritional value, silage, quality.
INTRODUCTION
Sunchoke (Helianthus tuberosus L.) is a plant related to sunflower and
potato, native to North America. It thrives in continental and warm climates, on
wetter loose soils, although it tolerates drought well. In Montenegro, sunchoke is
not grown in organized production, and according to its characteristics, it could
be a very important fodder plant for extensive livestock production in less
favorable natural conditions of rural areas. Due to its pronounced resistance to
diseases and pests, it can play an important role in organic livestock, using the
1Radisav Dubljević,(corresponding author; [email protected]), Dušica Radonjić, Milena Đokić
University of Montenegro, Biotechnical Fakulty, Mihaila Lalića 1, 81000 Podgorica,
MONTENEGRO. 2 Nenad Đorđević, University of Belgrade, Faculty of agryculture, Nemanjina 6, 11080 Zemun,
SERBIA
Notes: The authors declare that they have no conflicts of interest. Authorship Form signed online.
Received:14/04/2020 Accepted:03/06/2020
Dubljević et al. 152
underground (tubers) and aboveground part of the plant, fresh or as silage. Also,
sunchoke can be grown in an organized way due to the production of tubers for
industrial processing, in order to obtain an important medical item of inulin. This
polysaccharide contains several plant species, but this content (quantity) is cost-
effective for industrial extraction, of the plants known to us only in sunchoke and
chicory Chichorium intibus (Đorđević and Dinić 2007). Sunchoke can also be
grown in more orderly hunting grounds for game (Đorđević et al., 2009; 2010a,
b). Its production is quite economical because it has no pronounced requirements
in plant nutrients, and once planted, it remains for many years on that plot thanks
to vegetative self-reproduction. Recognizing the importance of the genetic
potential of sunchoke, more and more work is being done in the field of
inventory, collecting and selection. Thus, more than 150 autochthonous varieties
of Helianthus tuberosus are kept at the Institute of Field and Vegetable Crops in
Novi Sad, some of which are from Montenegro (Radovanović, 2013).
Basic characteristics of the chemical composition of sunchoke
The potential importance of sunchoke as a species for animal feed lies in
the fact that both the aboveground plant mass and the underground part-tubers
can be used efficiently, with high yields and modest agricultural techniques.
Yields of aboveground mass of sunchoke are 25-50 t/ha and tuber yields 30-60
t/ha. Sunchoke root (tubers) contains about 80% water and in dry matter about
15% carbohydrates and 1-2% crude protein, with 30-40% nitrogenous substances
of amide form. The amount of crude cellulose is about 1% and fat about 0.2%.
The main carbohydrate component of the dry matter of sunchoke root is inulin, a
linear polymer of D-fructose molecules). The amount of iron in sunchoke root is
about three times higher than in potatoes, and it also has relatively high amounts
of selenium (about 50 μg / 100 g). It is also a rich source of B complex vitamins,
C and β carotene. In previous studies, it has been proven that inulin shows
probiotic properties, participates in better mineral absorption and prevention of
some serious diseases.
Ways of using sunchoke in animal nutrition
Klimmer (1926) states that sunchoke can be mowed twice a year, and
Zdanovski (1945) states the possibility of sunchoke ensiling, at the stage when
the lower leaves begin to wither. Milošević (1971) and Đorđević (1975) point out
that the above-ground mass of sunchoke should be used only in autumn, just
before the first frosts, because earlier mowing significantly reduces tuber yields.
Zafren (1977) recommends mowing sunchoke for silage in the pre-flowering
phase, in order to increase the digestibility of dry matter. In any case, the earlier
use of aboveground mass of sunchoke has an extremely negative effect on root
yield, and it is difficult to reconcile these two ways of using this plant species (for
ruminant nutrition and industrial processing). Growing sunchoke for green mass
within the conveyor production of fresh fodder makes sense only if it is the only
product (no tuber yield is planned). In this case, thanks to regeneration, two to
three cuttings can be obtained from sunchoke, depending on the amount of
precipitation or the application of irrigation, similar to sorghum or Sudan grass.
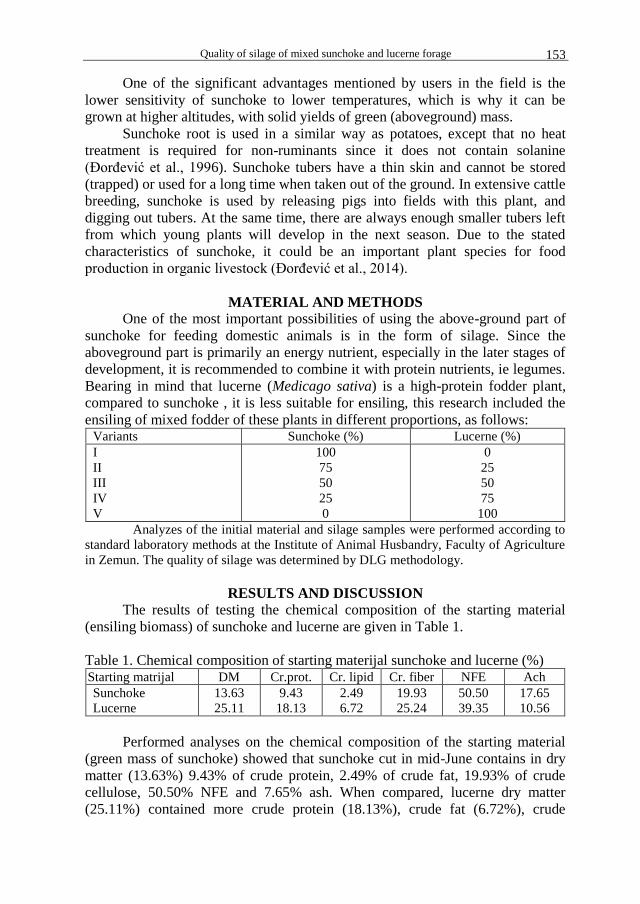
Quality of silage of mixed sunchoke and lucerne forage 153
One of the significant advantages mentioned by users in the field is the
lower sensitivity of sunchoke to lower temperatures, which is why it can be
grown at higher altitudes, with solid yields of green (aboveground) mass.
Sunchoke root is used in a similar way as potatoes, except that no heat
treatment is required for non-ruminants since it does not contain solanine
(Đorđević et al., 1996). Sunchoke tubers have a thin skin and cannot be stored
(trapped) or used for a long time when taken out of the ground. In extensive cattle
breeding, sunchoke is used by releasing pigs into fields with this plant, and
digging out tubers. At the same time, there are always enough smaller tubers left
from which young plants will develop in the next season. Due to the stated
characteristics of sunchoke, it could be an important plant species for food
production in organic livestock (Đorđević et al., 2014).
MATERIAL AND METHODS One of the most important possibilities of using the above-ground part of
sunchoke for feeding domestic animals is in the form of silage. Since the
aboveground part is primarily an energy nutrient, especially in the later stages of
development, it is recommended to combine it with protein nutrients, ie legumes.
Bearing in mind that lucerne (Medicago sativa) is a high-protein fodder plant,
compared to sunchoke , it is less suitable for ensiling, this research included the
ensiling of mixed fodder of these plants in different proportions, as follows: Variants Sunchoke (%) Lucerne (%)
I
II
III
IV
V
100
75
50
25
0
0
25
50
75
100
Analyzes of the initial material and silage samples were performed according to
standard laboratory methods at the Institute of Animal Husbandry, Faculty of Agriculture
in Zemun. The quality of silage was determined by DLG methodology.
RESULTS AND DISCUSSION
The results of testing the chemical composition of the starting material
(ensiling biomass) of sunchoke and lucerne are given in Table 1.
Table 1. Chemical composition of starting materijal sunchoke and lucerne (%) Starting matrijal DM Cr.prot. Cr. lipid Cr. fiber NFE Ach
Sunchoke
Lucerne
13.63
25.11
9.43
18.13
2.49
6.72
19.93
25.24
50.50
39.35
17.65
10.56
Performed analyses on the chemical composition of the starting material
(green mass of sunchoke) showed that sunchoke cut in mid-June contains in dry
matter (13.63%) 9.43% of crude protein, 2.49% of crude fat, 19.93% of crude
cellulose, 50.50% NFE and 7.65% ash. When compared, lucerne dry matter
(25.11%) contained more crude protein (18.13%), crude fat (6.72%), crude

Dubljević et al. 154
cellulose (25.24%), and less BEM (39.35%) and ash (10.56%). Chemical
composition and quality of silage mix by tested variants is presented in Table 2.
Table 2. Chemical composition and quality of silage sunchoke and lucerne (%) Parameter Silage mix of sunchoke and lucerne, ratio in %
I 100:0 II 75:25 III 50:50 IV 25:75 V 0:100
DM
Crude protein
Crude lipid
Crude fiber
NFE
Ach
Lactic acid
Acetic acid
Butiryc acid
Quality by DLG
11.54
10.12
2.77
21.24
49.62
16.25
4.70
2.51
019
II
13.80
10.59
3.45
21.87
48.57
15.52
3.58
2.68
0.38
II
16.57
12.44
5.66
22.94
43.05
15.91
4.06
3.01
0.52
III
18.50
14.94
5.84
22.78
42.28
14.13
2.55
3.39
0.86
IV
21.65
17.47
6.35
24.94
40.08
11.16
3.34
1.83
1.32
IV
The obtained results of chemical analyses of silage composed of sunchoke
and lucerne, show that lucerne participation increment also increase pH value of
silage and the content of butyric acid, while the production of lactic acid
decreases. At the same time, the quality of the silage, evaluated by the DLG
method, decreases from class II (100% sunchoke ) to class III (75:25 and 50:50%
- sunchoke: lucerne) and class IV (25% sunchoke and 75% lucerne). Therefore, it
is recommended to maximize the share of fresh lucerne in the mixture with
sunchoke up to 50% or pre-drying lucerne (Đorđević et al. 1996).
The disadvantage of this silage mixture is the fact that the starting material
of both plant species contain larger amounts of moisture, which indicates the need
to pass the initial material (lucerne), or add some dry nutrients (when ensiling
sunchoke in pure form). In the research of Adamović et al. (2014) the moisture
content in the aboveground mass of sunchoke ranged from 80.71 to 67.41% in the
period June-October. According to Đorđević and Dinić (2003), quality silage can
be prepared only from materials with less than 70% moisture, otherwise it must
be tested or combined with drier nutrients. According to these authors, in a
material with more than 80% moisture, buttery fermentation cannot be stopped
even when using chemical preservatives. If, for the above reasons, sunchoke was
ensiled in October, with a favorable moisture content (<70%), there would be a
decline in the quality and yield of silage.
CONCLUSIONS
Based on the results from our study and reviews of previous research, it
can be concluded that sunchoke in the changed continental climate can be an
important fodder plant for animal nutrition in conventional and organic livestock,
using underground organs (tubers) and the aboveground part of the plant fresh or
Quality of silage of mixed sunchoke and lucerne forage 155
ensiled. Also, this plant can be successfully used in the hunting economy, when
establishing perennial crops, for feeding and sheltering wild animals.
Beside deficiency in chemical composition (nutritional value) compared to
lucerne, sunchoke has advantages due to its lower agrotechnical requirements,
more economical production and better adaptability to less favorable natural
conditions.
In addition to its role in animal nutrition, sunchoke is also important as a
plant for industrial processing, for the extraction of polysaccharide inulin.
ACKNOWLEDGEMENTS
The paper is part of the results of a project funded by the Ministry of
Science of Montenegro.
REFERENCES Adamović, M., Milivojčević, D., Živanović, Č., Šorić, P. Vukosavljević, Z. 2014. Čičoka
(Helianthus tuberosus L) – hemijski sastav, prinos zelene mase i hranljivih materija u uslovima nepovoljnih klimatskih faktora. Zbornik naučnih radova, 20, 1-4: 187-194.
Đorđević, V. 1975. Hibrid čičoka-suncokret. Poljoprivreda, 251, 40-42.
Đorđević, N., Koljajić, V., Pavličević, A., Grubić, G., Jokić, Ž. 1996. Efekti siliranja čičoke i lucerke u različitim odnosima. VIII jugoslovenski simpozijum o krmnom bilju sa međunarodnim učešćem, Novi Sad, 28-31.05.1996. Zbornik radova, 26: 533-539.
Đorđević, N., Dinić, B. 2003. Siliranje leguminoza (monografija). Institut za istraživanja u poljoprivredi SRBIJA.
Đorđević, N., Dinić, B. 2007.Hrana za životinje (monografija). Cenzone Tech Europe – Aranđelovac.
Đorđević, N., Popović, Z., Grubić, G., Beuković, M. 2008. Ishrambeni potencijal lovišta Srbije. XVIII inovacije u stočarstvu, 27-28.11.2008., Poljoprivredni fakultet Zemun. Biotehnologija u stočarstvu, 24 (poseban broj), 529-537.
Đorđević, N., Grubić, G., Popović, Z., Stojanović, B., Božičković, A. 2009. Production of feeds and additional feeding of game as a measure of forest and wildlife protection. XIII International Feed Technology Symposium, September, 29
th -
October, 1th
, 2009, Novi Sad. Proceedings, 211-216.
Đorđević, N., Popović, Z., Grubić, G., Beuković, M. 2010a. Gazdovanje populacijama srna i divljih svinja u cilju smanjenja šteta u poljoprivredni i šumarstvu Srbije. Zbornik naučnih radova, 16, 3-4: 189-200.
Đorđević, N., Popović, Z., Grubić, G., Vučković, S., Simić, A. 2010b. Production of fooder in the hunting grounds for game feeding and decrease of damages in agriculture and forestry. XII international symposium on forage crops of Republika of Serbia - forage crops basis of the sustainable animal husbandry development. Biotecnologi in animal husbandry, vol. 26, book 2, 539-547.
Đorđević, N., Grubić, G., Stojanović, B., Božičković, A., Ivetić, A. 2011a. Savremene tehnologije siliranja kukuruza i lucerke. XXV savetovanje agronoma, veterinara i tehnologa, 23-24.02.2011, Institut PKB Agroekonomik, Beograd. Zbornik naučnih radova, 17, 3-4: 27-35.
Dubljević et al. 156
Đorđević, N., Grubić, G., Dinić, B., Stojanović, B., Božičković, A. 2011b. Forage quality as a part of a modern concept of ruminant nutrition. International Scientific Symposium of Agriculture „Agrosym Jahorina 2011“, Jahorina, 10-12. November. Proceedings, 218-225.
Đorđević, N., Dubljević, R., Damjanović, M., Mitrović, D., Milenković, N. 2012. The contemporary methods in the production of maize silage. The First International Symposium on Animal Science, Faculty of Agriculture, University of Belgrade, Serbia, 08-10. November, 2012. Proceedings, 480-487.
Đorđević, N., Stojanović, B., Grubić, G., Božičković, A. 2014. Proizvodnja voluminozne hrane po principima organskog stočarstva. Zbornik naučnih radova, 20, 1-4: 175-186.
Klimmer, M. 1926. Nauka o hranjenju korisnih životinja. Sarajevo.
Milošević, D. 1971. Posebno ratarstvo. Beograd.
Popović, Z., Đorđević, N. 2009. Ishrana divljači (monografija). Univerzitet u Beogradu, Poljoprivredni fakultet.
Radovanović, A. 2013. Utvrđivanje nutritivne vrednosti proizvoda koji sadrže Helianthus Tuberosus L., Asteraceae. Doktorska disertacija, Univerzitet u Kragujevcu, Fakultet medicinskih nauka.
Zafren, SJa. 1977. Tehnologia prigotovlenia kormov. Moskva „Kolos“.
Zdanovski, N. 1945. Silaža, Poljoprivredna naklada Zagreb. sv. 1.
Agriculture & Forestry, Vol. 66 Issue 2: 157-165, 2020, Podgorica 157
Pacanoski, Z., Kolevska, D. D., Mehmeti, A. (2020): Tolerance of black locust (Robinia pseudoacacia L.)
seedlings to PRE applied herbicides. Agriculture and Forestry, 66 (2): 157-165.
DOI: 10.17707/AgricultForest.66.2.15
Zvonko PACANOSKI1*, Dana Dina KOLEVSKA
2, Arben MEHMETI
3
TOLERANCE OF BLACK LOCUST (Robinia pseudoacacia L.)
SEEDLINGS TO PRE APPLIED HERBICIDES
SUMMARY
The field studies were conducted in the nursery of the PE "Macedonian
Forests", subsidiary "Karadžica" in Dračevo, Skopje region, during 2014 and
2015 on Fluvisol sandy loam. Tolerance of black locust seedlings to the PRE
application of imazethapyr, S-metolachlor, linuron and pendimethalin was
studied. The black locust seedlings differed in their response to PRE herbicides.
All applied PRE herbicides caused no significant visual injury (< 0.7%) in black
locust seedlings in 2014, but linuron and pendimethalin applied in 2015 caused
serious black locust seedlings injury which did not decrease over time (48.5% and
60.5% at 28 DAT, and 63.8% and 72.3% at 56 DAT, respectively). The high
precipitation which occurred immediately after herbicide application (28 L/m2)
probably was the most likely reason for serious black locust injury caused by
these herbicides. PRE application of herbicides in 2014 resulted in statistically
similar plant number per m2, plant height and root collar diameter to the weed-
free control. However, all black locust seedlings parameters were significantly
affected by linuron and pendimethalin in 2015. Their application resulted in
fewer plants per m2, minor plant height and smaller root collar diameter of black
locust seedlings in compare with those in weed-free control.
Keywords: black locust, PRE herbicides, injuries.
INTRODUCTION
Weed management is one of the major production problems for black
locust seedling producers and is essential to optimize the yield of this non-
competitive crop. Weeds left uncontrolled compete with black locust plants for
light, moisture, and nutrients and can drastically reduce black locust quality and
yield. In the past the black locust in North Macedonia was planted for
reforestation with support of government in areas where local people suffered
1Zvonko Pacanoski (corresponding author: [email protected].), University Ss. Cyril and
Methodius, Faculty of Agricultural Sciences and Food, 1000 Skopje, Republic of NORTH
MACEDONIA. 2Dana Dina Kolevska, University Ss. Cyril and Methodius, Faculty of Forestry, 1000 Skopje,
Republic of NORTH MACEDONIA. 3Arben Mehmeti, University of Prishtina, ,,HasanPrishtina,, Faculty of Agriculture and Veterinary,
Department of Plant Protection, 10000 Prishtinë, Republic of KOSOVO.
Notes: The authors declare that they have no conflicts of interest. Authorship Form signed online.
Received:27/02/2020 Accepted:12/06/2020
Pacanoski et al. 158
consequences of erosion flows and torrents, than later, refosteration gradually
turned into “national reforestation” performed by citizens (Kolevska et. al.,
2017). From the tree species, which were grown in forest nurseries in the past,
many broadleaf allochtonous species were represented including black locust
(Kolevska et. al., 2017).
Effective weed control in black locust nurseries is limited, because no one
herbicide is registered for this purpose in North Macedonia. Usually are used
herbicides for weed control in Fabaceae crops (Pacanoski et al., 2017).
Therefore, more research is needed to identify herbicides that provide consistent
annual grass and broadleaved weed control and are safe to use on black locust
nurseries.
Imazethapyr is an imidazolinone herbicide, which is absorbed by both the
roots and shoots. Imazethapyr can effectively control a broad spectrum of weeds
such as velvetleaf (Abutilon theophrasti Medic.), redroot pigweed (Amaranthus
retoflexus L.), smartweed (Polygonum spp.), lambsquarters (Chenopodium album
L.), wild mustard (Sinapis arvensis L.), common ragweed (Ambrosia
artemisiifolia L.) and foxtail (Setaria spp.) (Bauer et al., 1995; Ward and Weaver,
1996).
S-metolachlor is a chloracetanilide herbicide that is absorbed by
germinating grasses through the shoot just above the seed and in broadleaf weeds
through the root and shoot. Applications of S-metholachlor can effectively
control a number of annual grasses such as foxtail (Setaria spp.), large crabgrass
(Digitaria sanguinalis L. Scop.), barnyardgrass (Echinochloa crus-galli L.
Beauv.), fall panicum (Panicum dichotomiflorum Michx.), and witchgrass
(Panicum capillare L.) (Osborne et al., 1995; Vencill, 2002). It also provides
partial control of some small-seeded broadleaved weeds such as nightshade
(Solanum spp.), redwood pigweed (Amaranthus retroflexus L.), and common
lambsquarters (Chenopodium album L.) (Senseman, 2007).
Linuron is a substituted urea herbicide registered for use in a number of
crops including soybean and green beans (Pacanoski and Glatkova, 2014).
Linuron is readily absorbed through roots following a soil application (Senseman,
2007). Linuron applied pre-emergence (PRE) controls many broadleaf weeds
such as velvetleaf (Abutilon theophrasti Medic.), redwood pigweed (Amaranthus
retroflexus L.), common lambsquarters (Chenopodium album L.), common
ragweed (Ambrosia artemisiifolia L.), common chickweed (Stellaria media L.
Vill.), field pennycress (Thlaspi arvense L.), purslane (Portulaca oleracea L.),
shepherd’s purse (Capsella bursa-pastoris L.Medic.), smartweed (Polygonum
spp.), annual sowthistle (Sonchus oleraceus L.) (Pacanoski et al., 2014) and
wormseed mustard (Erysimum cheiranthoides L.), including acetolactate
synthaseand triazine-resistant biotypes (Van Gessel et al., 2000).
Pendimethalin is a dinitroaniline selective herbicide that can control
smooth crabgrass (Digitaria ischaemum (Schreb) Muhl.), barnyardgrass
(Echinochloa crus galli L. Beauv.), fall panicum (Panicum dichotomiflorum
Michx.), large crabgrass (Digitaria sanguinalis L. Scop), giant foxtail (Setaria
Tolerance of black locust (Robinia pseudoacacia L.) seedlings to pre applied herbicides 159
faberii Herrm.), green foxtail (Setaria viridis L. Beauv.), yellow foxtail (Setaria
glauca L. Beauv.), and certain annual broadleaved weeds such as common
lambsquarters (Chenopodium album L.) and redroot pigweed (Amaranthus
retroflexus L.) (Soltani et al., 2012). Pendimethalin is primarily absorbed by the
emerging coleoptile of grasses and hypocotyl/epicotyl of broadleaf weeds
(Shaner, 2014).
Tolerance of black locust to various soil applied herbicides should be
attributed to application method, herbicide rate, cultivar, environmental and soil
conditions. There is currently no registration for use of imazethapyr, S-
metolachlor, linuron and pendimethalin in black locust seedling production in
North Macedonia, and because of that sensitivity of black locust to these PRE
herbicides is not known for North Macedonia growing conditions.
Therefore, the objective of this research was to determine the tolerance of
black locust seedlings to imazethapyr, S-metolachlor, pendimethalin and linuron
PRE under North Macedonia environmental conditions.
MATERIAL AND METHODS Field studies were conducted in the nursery of the PE "Macedonian
Forests", subsidiary "Karadžica" in Dračevo, Skopje region, during 2014 and
2015 on Fluvisol sandy loam with 10.50% coarse, 63.10% fine sand, 26.40%
clay+silt, 3.1% organic matter and pH 7.0. The nursery is located at N41°56.140,
E21°30.745, altitude of 250 a.s.l., inclination of 4-50, north-west exposition. The
experiment method was set at randomized complete block design with four
replications, and the size of elementary plot was 15 m2 (3 x 5m).
Seedbed was prepared by moldboard plowing in the autumn followed by
two passes with a field cultivator in the spring. Before seeding in the spring,
fertilizer was incorporated at rates indicated by soil tests. One day prior sowing,
the black locust seeds were hydro-thermically treated in boiling water for 10
seconds, than cooled in cold water with 10 g Benomil 50 WP/10 kg of seed, and
left soaking for 24 hours. Germination of the seed was 65.5%. Black locust seeds
were seeded in a well-prepared seedbed at a seeding rate of 25 grams seeds/1
meter of row on May 5th, 2014 and May 14
th, 2015, respectively. The interrow
spacing was 25 cm and seeding depth was about 2 cm.
Herbicides were applied with a CO2-pressurized backpack sprayer
calibrated to deliver 300 L/ha aqueous solution at 220 kPa. PRE herbicide
treatments were applied one day after sowing, on May 6th, 2014 and May 15
th,
2015, respectively. PRE herbicide treatments were: imazethapyr (Pivot 100-E) at
1.0 L/ha, S-metolachlor (Dual Gold) at 1.0 kg/ha, linuron, (Linurex 50 SC) at 2.0
L/ha, and pendimethalin (Stomp Aqua) at 5.0 L/ha. Weed-free control, included
in the studies, was maintained by 2 hoeing + hand weeding to eliminate the
confounding factor of weed interference on black locust seedling crop. Black
locust injury was visually evaluated based on a 0% - 100% rating scale, where 0
is no injury to black locust plants, and 100 is complete death of black locust
plants (Frans et. al., 1986). The injury was visually rated by determining the
Pacanoski et al. 160
average percentage of delayed emergence, hypocotyl swelling, brittle stem at the
soil line, plant stunting, chlorosis, or necrosis (or all) occurring in treated black
locust plots when compared with nontreated plants. Black locust injury was
estimated 28 and 56 days after treatments (DAT). The black locust seedlings of
m2 per every plot were count 56 DAT. 25 plants of black locust seedlings selected
per plot, and height from soil surface to the highest point of each plant, as well as
root collar diameter were measured 180 DAT, i.e. in the end of black locust
vegetation period.
Total monthly rainfalls are shown in Table 1. Generally, 2014 was drier
than 2015. Precipitations in May 2014 were very low (20 mm). However, June,
and even July were unusually wet months. In August and September precipitation
occurred during the three days in the middle of August, and during the first 2 and
the last 4 days of September. Opposite, spring of 2015 was humid. Precipitation
occurred during May were a little bit above the 30ys average for the Skopje
locality; precipitation occurred in the first and at the middle of the second decade
of May. Particularly high precipitation occurred immediately after herbicide
application (28 L/m2). In June, precipitation occurred mainly in the second
decade of the month (40 L/m2). Summer months in 2014, particularly July and
September, were very humid, 61% above the 30ys average for the Skopje locality
(80 mm).
Table 1. Total monthly rainfall from May to October in 2014 and 2015 at the
experimental location. Precipitation (mm)
Month Skopje locality
2014 2015
May 20 49
June 51 58
July 48 54
August 10 22
September 23 75
The data were tested for homogeneity of variance and normality of
distribution (Ramsey and Schafer, 1997) and were log-transformed as needed to
obtain roughly equal variances and better symmetry before ANOVA were
performed. Data were transformed back to their original scale for presentation.
Means were separated by using LSD test at 5% of probability.
RESULTS AND DISCUSSION
Inconsistent weather patterns between the 2 years of the study likely
influenced the crop injury. The humid spring in 2015 (Table 1), particularly high
precipitation which occurred immediately after herbicide application (28 L/m2)
probably was the most likely reason for serious black locust injury particularly
caused by linuron and pendimethalin estimated at 28 and 56 DAT in 2015
compare with 2014 (Table 2). Because of that, there was a significant treatment-
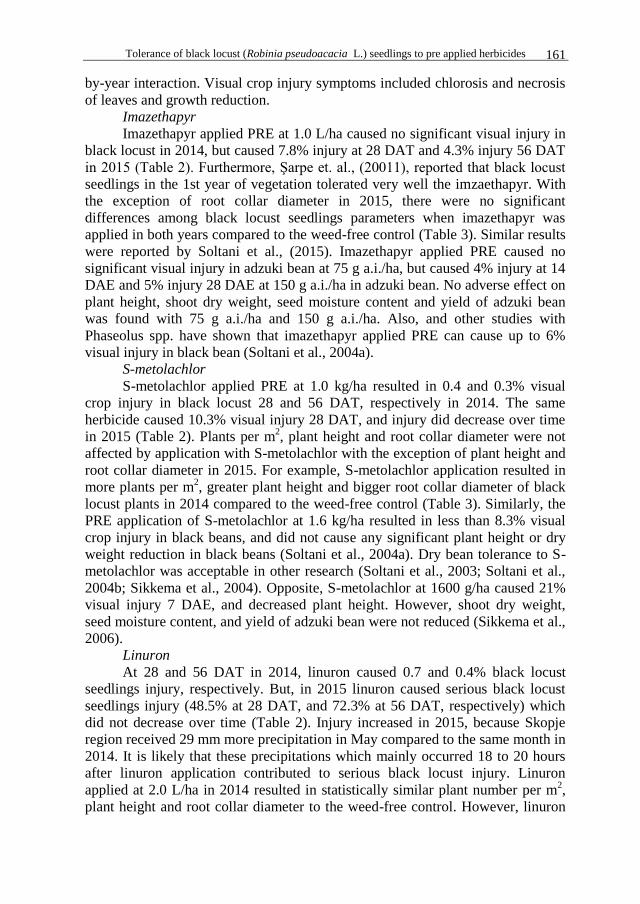
Tolerance of black locust (Robinia pseudoacacia L.) seedlings to pre applied herbicides 161
by-year interaction. Visual crop injury symptoms included chlorosis and necrosis
of leaves and growth reduction.
Imazethapyr
Imazethapyr applied PRE at 1.0 L/ha caused no significant visual injury in
black locust in 2014, but caused 7.8% injury at 28 DAT and 4.3% injury 56 DAT
in 2015 (Table 2). Furthermore, Şarpe et. al., (20011), reported that black locust
seedlings in the 1st year of vegetation tolerated very well the imzaethapyr. With
the exception of root collar diameter in 2015, there were no significant
differences among black locust seedlings parameters when imazethapyr was
applied in both years compared to the weed-free control (Table 3). Similar results
were reported by Soltani et al., (2015). Imazethapyr applied PRE caused no
significant visual injury in adzuki bean at 75 g a.i./ha, but caused 4% injury at 14
DAE and 5% injury 28 DAE at 150 g a.i./ha in adzuki bean. No adverse effect on
plant height, shoot dry weight, seed moisture content and yield of adzuki bean
was found with 75 g a.i./ha and 150 g a.i./ha. Also, and other studies with
Phaseolus spp. have shown that imazethapyr applied PRE can cause up to 6%
visual injury in black bean (Soltani et al., 2004a).
S-metolachlor
S-metolachlor applied PRE at 1.0 kg/ha resulted in 0.4 and 0.3% visual
crop injury in black locust 28 and 56 DAT, respectively in 2014. The same
herbicide caused 10.3% visual injury 28 DAT, and injury did decrease over time
in 2015 (Table 2). Plants per m2, plant height and root collar diameter were not
affected by application with S-metolachlor with the exception of plant height and
root collar diameter in 2015. For example, S-metolachlor application resulted in
more plants per m2, greater plant height and bigger root collar diameter of black
locust plants in 2014 compared to the weed-free control (Table 3). Similarly, the
PRE application of S-metolachlor at 1.6 kg/ha resulted in less than 8.3% visual
crop injury in black beans, and did not cause any significant plant height or dry
weight reduction in black beans (Soltani et al., 2004a). Dry bean tolerance to S-
metolachlor was acceptable in other research (Soltani et al., 2003; Soltani et al.,
2004b; Sikkema et al., 2004). Opposite, S-metolachlor at 1600 g/ha caused 21%
visual injury 7 DAE, and decreased plant height. However, shoot dry weight,
seed moisture content, and yield of adzuki bean were not reduced (Sikkema et al.,
2006).
Linuron
At 28 and 56 DAT in 2014, linuron caused 0.7 and 0.4% black locust
seedlings injury, respectively. But, in 2015 linuron caused serious black locust
seedlings injury (48.5% at 28 DAT, and 72.3% at 56 DAT, respectively) which
did not decrease over time (Table 2). Injury increased in 2015, because Skopje
region received 29 mm more precipitation in May compared to the same month in
2014. It is likely that these precipitations which mainly occurred 18 to 20 hours
after linuron application contributed to serious black locust injury. Linuron
applied at 2.0 L/ha in 2014 resulted in statistically similar plant number per m2,
plant height and root collar diameter to the weed-free control. However, linuron
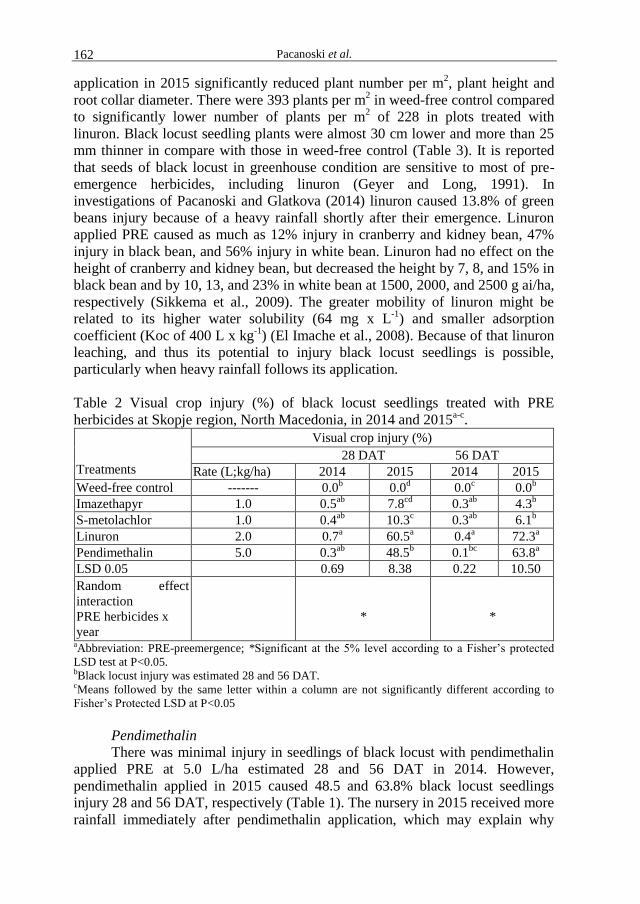
Pacanoski et al. 162
application in 2015 significantly reduced plant number per m2, plant height and
root collar diameter. There were 393 plants per m2 in weed-free control compared
to significantly lower number of plants per m2 of 228 in plots treated with
linuron. Black locust seedling plants were almost 30 cm lower and more than 25
mm thinner in compare with those in weed-free control (Table 3). It is reported
that seeds of black locust in greenhouse condition are sensitive to most of pre-
emergence herbicides, including linuron (Geyer and Long, 1991). In
investigations of Pacanoski and Glatkova (2014) linuron caused 13.8% of green
beans injury because of a heavy rainfall shortly after their emergence. Linuron
applied PRE caused as much as 12% injury in cranberry and kidney bean, 47%
injury in black bean, and 56% injury in white bean. Linuron had no effect on the
height of cranberry and kidney bean, but decreased the height by 7, 8, and 15% in
black bean and by 10, 13, and 23% in white bean at 1500, 2000, and 2500 g ai/ha,
respectively (Sikkema et al., 2009). The greater mobility of linuron might be
related to its higher water solubility (64 mg x L-1
) and smaller adsorption
coefficient (Koc of 400 L x kg-1
) (El Imache et al., 2008). Because of that linuron
leaching, and thus its potential to injury black locust seedlings is possible,
particularly when heavy rainfall follows its application.
Table 2 Visual crop injury (%) of black locust seedlings treated with PRE
herbicides at Skopje region, North Macedonia, in 2014 and 2015a-c
.
Treatments
Visual crop injury (%)
28 DAT 56 DAT
Rate (L;kg/ha) 2014 2015 2014 2015
Weed-free control ------- 0.0b 0.0
d 0.0
c 0.0
b
Imazethapyr 1.0 0.5ab
7.8cd
0.3ab
4.3b
S-metolachlor 1.0 0.4ab
10.3c 0.3
ab 6.1
b
Linuron 2.0 0.7a 60.5
a 0.4
a 72.3
a
Pendimethalin 5.0 0.3ab
48.5b 0.1
bc 63.8
a
LSD 0.05 0.69 8.38 0.22 10.50
Random effect
interaction
PRE herbicides x
year
*
*
aAbbreviation: PRE-preemergence; *Significant at the 5% level according to a Fisher’s protected
LSD test at P<0.05. bBlack locust injury was estimated 28 and 56 DAT. cMeans followed by the same letter within a column are not significantly different according to
Fisher’s Protected LSD at P<0.05
Pendimethalin
There was minimal injury in seedlings of black locust with pendimethalin
applied PRE at 5.0 L/ha estimated 28 and 56 DAT in 2014. However,
pendimethalin applied in 2015 caused 48.5 and 63.8% black locust seedlings
injury 28 and 56 DAT, respectively (Table 1). The nursery in 2015 received more
rainfall immediately after pendimethalin application, which may explain why
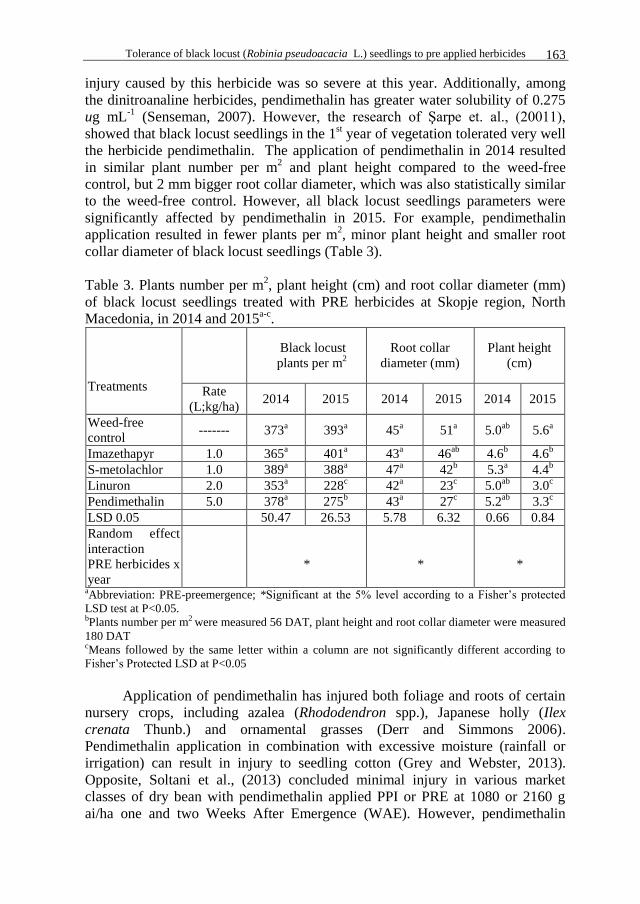
Tolerance of black locust (Robinia pseudoacacia L.) seedlings to pre applied herbicides 163
injury caused by this herbicide was so severe at this year. Additionally, among
the dinitroanaline herbicides, pendimethalin has greater water solubility of 0.275
ug mL-1
(Senseman, 2007). However, the research of Şarpe et. al., (20011),
showed that black locust seedlings in the 1st year of vegetation tolerated very well
the herbicide pendimethalin. The application of pendimethalin in 2014 resulted
in similar plant number per m2 and plant height compared to the weed-free
control, but 2 mm bigger root collar diameter, which was also statistically similar
to the weed-free control. However, all black locust seedlings parameters were
significantly affected by pendimethalin in 2015. For example, pendimethalin
application resulted in fewer plants per m2, minor plant height and smaller root
collar diameter of black locust seedlings (Table 3).
Table 3. Plants number per m2, plant height (cm) and root collar diameter (mm)
of black locust seedlings treated with PRE herbicides at Skopje region, North
Macedonia, in 2014 and 2015a-c
.
Treatments
Black locust
plants per m2
Root collar
diameter (mm)
Plant height
(cm)
Rate
(L;kg/ha) 2014 2015 2014 2015 2014 2015
Weed-free
control ------- 373
a 393
a 45
a 51
a 5.0
ab 5.6
a
Imazethapyr 1.0 365a 401
a 43
a 46
ab 4.6
b 4.6
b
S-metolachlor 1.0 389a 388
a 47
a 42
b 5.3
a 4.4
b
Linuron 2.0 353a 228
c 42
a 23
c 5.0
ab 3.0
c
Pendimethalin 5.0 378a 275
b 43
a 27
c 5.2
ab 3.3
c
LSD 0.05 50.47 26.53 5.78 6.32 0.66 0.84
Random effect
interaction
PRE herbicides x
year
*
*
*
aAbbreviation: PRE-preemergence; *Significant at the 5% level according to a Fisher’s protected
LSD test at P<0.05. bPlants number per m2 were measured 56 DAT, plant height and root collar diameter were measured
180 DAT cMeans followed by the same letter within a column are not significantly different according to
Fisher’s Protected LSD at P<0.05
Application of pendimethalin has injured both foliage and roots of certain
nursery crops, including azalea (Rhododendron spp.), Japanese holly (Ilex
crenata Thunb.) and ornamental grasses (Derr and Simmons 2006).
Pendimethalin application in combination with excessive moisture (rainfall or
irrigation) can result in injury to seedling cotton (Grey and Webster, 2013).
Opposite, Soltani et al., (2013) concluded minimal injury in various market
classes of dry bean with pendimethalin applied PPI or PRE at 1080 or 2160 g
ai/ha one and two Weeks After Emergence (WAE). However, pendimethalin
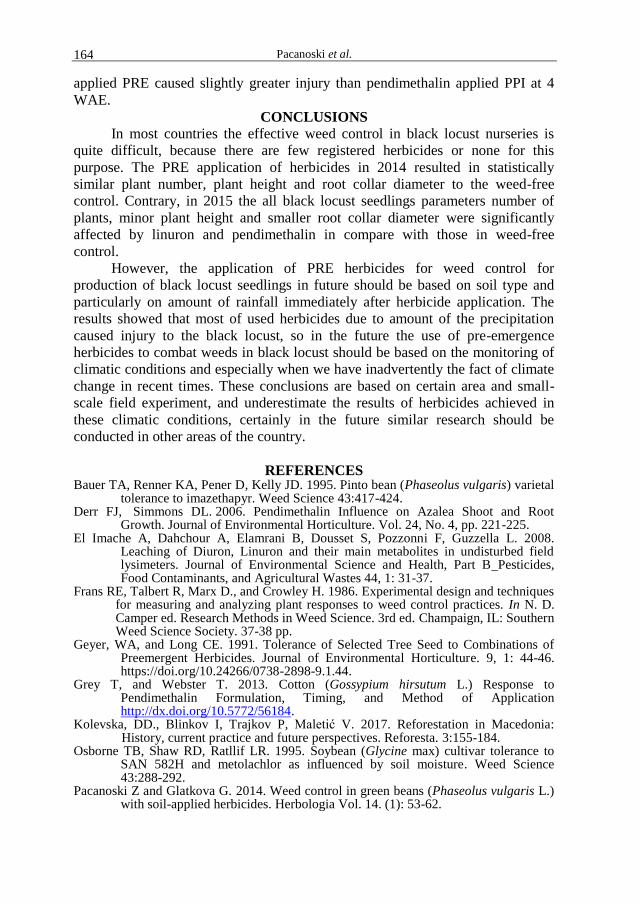
Pacanoski et al. 164
applied PRE caused slightly greater injury than pendimethalin applied PPI at 4
WAE.
CONCLUSIONS
In most countries the effective weed control in black locust nurseries is
quite difficult, because there are few registered herbicides or none for this
purpose. The PRE application of herbicides in 2014 resulted in statistically
similar plant number, plant height and root collar diameter to the weed-free
control. Contrary, in 2015 the all black locust seedlings parameters number of
plants, minor plant height and smaller root collar diameter were significantly
affected by linuron and pendimethalin in compare with those in weed-free
control.
However, the application of PRE herbicides for weed control for
production of black locust seedlings in future should be based on soil type and
particularly on amount of rainfall immediately after herbicide application. The
results showed that most of used herbicides due to amount of the precipitation
caused injury to the black locust, so in the future the use of pre-emergence
herbicides to combat weeds in black locust should be based on the monitoring of
climatic conditions and especially when we have inadvertently the fact of climate
change in recent times. These conclusions are based on certain area and small-
scale field experiment, and underestimate the results of herbicides achieved in
these climatic conditions, certainly in the future similar research should be
conducted in other areas of the country.
REFERENCES Bauer TA, Renner KA, Pener D, Kelly JD. 1995. Pinto bean (Phaseolus vulgaris) varietal
tolerance to imazethapyr. Weed Science 43:417-424. Derr FJ, Simmons DL. 2006. Pendimethalin Influence on Azalea Shoot and Root
Growth. Journal of Environmental Horticulture. Vol. 24, No. 4, pp. 221-225. El Imache A, Dahchour A, Elamrani B, Dousset S, Pozzonni F, Guzzella L. 2008.
Leaching of Diuron, Linuron and their main metabolites in undisturbed field lysimeters. Journal of Environmental Science and Health, Part B Pesticides, Food Contaminants, and Agricultural Wastes 44, 1: 31-37.
Frans RE, Talbert R, Marx D., and Crowley H. 1986. Experimental design and techniques for measuring and analyzing plant responses to weed control practices. In N. D. Camper ed. Research Methods in Weed Science. 3rd ed. Champaign, IL: Southern Weed Science Society. 37-38 pp.
Geyer, WA, and Long CE. 1991. Tolerance of Selected Tree Seed to Combinations of Preemergent Herbicides. Journal of Environmental Horticulture. 9, 1: 44-46. https://doi.org/10.24266/0738-2898-9.1.44.
Grey T, and Webster T. 2013. Cotton (Gossypium hirsutum L.) Response to Pendimethalin Formulation, Timing, and Method of Application http://dx.doi.org/10.5772/56184.
Kolevska, DD., Blinkov I, Trajkov P, Maletić V. 2017. Reforestation in Macedonia: History, current practice and future perspectives. Reforesta. 3:155-184.
Osborne TB, Shaw RD, Ratllif LR. 1995. Soybean (Glycine max) cultivar tolerance to SAN 582H and metolachlor as influenced by soil moisture. Weed Science 43:288-292.
Pacanoski Z and Glatkova G. 2014. Weed control in green beans (Phaseolus vulgaris L.) with soil-applied herbicides. Herbologia Vol. 14. (1): 53-62.
Tolerance of black locust (Robinia pseudoacacia L.) seedlings to pre applied herbicides 165
Pacanoski Z, Kolevska DD, Nikolovska S. 2017. Floristic Composition of the Weeds and
Efficacy of PRE Herbicides in Nurseries of Black Locust (Robinia pseudoacacia L.). Reforesta, (2): 22-31.
Pacanoski Z, Týr Š, Vereš T. 2014. Effects of herbicides and their combinations in carrots production regions in the Republic of Macedonia. Herbologia Vol. 14. (2): 47-61.
Ramsey FL and Schafer DW 1997. The Statistical Sleuth: A Course in Methods of Data Analysis. Belmont, CA: Duxbury. 91–97 pp.
Şarpe N, Borescu Floarea, Negrilă E. 2010. Chemical control of weeds from Acacia (Robinia pseudoacacia) tree nurseries. Journal of Horticulture, Forestry and Biotechnology Volume 14 (1): 96-98.
Senseman SA (2007). Herbicide Handbook, 9th Edition. Weed Science Society of America. Lawrence, KS. P. 493.
Shaner DL 2014. Herbicide Handbook. Lawrence, KS:Weed Science Society of America. Pp 343–345
Sikkema PH, Hekmat S, Shropshire C, Soltani N. 2009. Response of black, cranberry, kidney, and white bean to linuron. Weed Biology and Management 9, 173–178
Sikkema PH, Soltani N, Shropshire C, and Cowan T. 2004. Sensitivity of kidney beans (Phaseolus vulgaris) to soil applications of S-metolachlor and imazethapyr. Can. J. Plant Sci. 84: 405–407.
Sikkema PH, Soltani N, Shropshire C, and Robinson DE. 2006. Response of adzuki bean to pre-emergence herbicides. Can. J. Plant Sci. 86: 601–604.
Soltani N, Nurse RE, Christy S, Sikkema PH. 2015. Tolerance of adzuki bean to pre-emergence herbicides. Canadian Journal of Plant Science 95:5, 959-963.
Soltani N, Nurse RE, Shropshire C, Sikkema PH. 2012. Weed Control, Environmental Impact and Profitability of Pre-Plant Incorporated Herbicides in White Bean. American Journal of Plant Sciences, 3: 846-853.
Soltani N, Nurse RE, Shropshire C, Sikkema PH. 2013. Response of dry bean to pendimethalin applied preplant incorporated or preemergence African Journal of Agricultural Research 8(38): 4827-4832.
Soltani N, Shropshire C, Cowan T, and Sikkema, PH. 2003. Tolerance of cranberry beans (Phaseolus vulgaris) to soil applications of S-metolachlor and imazethapyr. Can. J. Plant Sci. 83: 645–648.
Soltani N, Shropshire C, Cowan T, and Sikkema, PH. 2004a. Tolerance of black beans (Phaseolus vulgaris) to soil applications of S-metolachlor and imazethapyr. Weed Technol. 18: 111–118.
Soltani N, Shropshire C, Cowan T, and Sikkema, PH. 2004b. White bean sensitivity to preemergence herbicides. Weed Technology, 18: 675-679.
Van Gessel, J.M., Monks, W.D. and Quintin, R.J. 2000. Herbicides for potential use in lima bean (Phaseolus lunatus) production. Weed Technology, 14, 279-286.
Vencill, WK. 2002. Herbicide handbook. 8th ed. Weed Science Society of America. Lawrence, KS. 493 pp.
Ward IK and Weaver ES. 1996. Wild mustard (Sinapis arvensis L.) competition with navy beans. Can.J.Plant Scie. 73:1309-1313.

Agriculture & Forestry, Vol. 66 Issue 2: 167-178, 2020, Podgorica
167
Vaško, Ž., Kovačević, I. (2020): Comparison of economic efficiency of organic versus conventional farming in
the conditions of Bosnia and Herzegovina. Agriculture and Forestry, 66 (2): 167-178.
DOI: 10.17707/AgricultForest.66.2.16
Željko VAŠKO, Ivan KOVAČEVIĆ 1
COMPARISON OF ECONOMIC EFFICIENCY OF ORGANIC VERSUS
CONVENTIONAL FARMING IN THE CONDITIONS OF
BOSNIA AND HERZEGOVINA
SUMMARY
Organic farming, which, as a modality of agricultural production,
responsibly treats natural resources and fits into the concept of sustainable
development, is increasingly prevalent, especially in developed countries.
However, reconciliation of the interest and benefits of organic food producers and
consumers is crucial for sustainability of that production. This adjustment is done
through market prices. Prices of organic food must be acceptable for consumers,
while at the same time should enable farmers to cover the cost of production and
to make a certain profit. Organic food production is in a very early stage in
Bosnia and Herzegovina (BiH). This paper is deducted to the analysis of the
economic efficiency of organic food production based on case studies of three
selected products, wheat, tomato and raspberry in the conditions of BiH. The aim
of research was to quantify and evaluate economic efficiency of organic farming
versus conventional farming. The obtained result confirmed the general trends,
that the yields and sale price of agricultural products produced on the principles
of organic farming are lower, and therefore revenues are higher. The expenses
were higher for two products while they were lower for one product. However, in
the end, gross profit in organic farming for all three products is higher than the
profit generated in conventional farming. Thus, it may be concluded that, from
the financial point of view, there is great chance and economic viability for
organic farming in BiH, if there is demand for organic food consumption or
conditions for its export.
Keywords: organic farming, organic food, economic efficiency.
INTRODUCTION
The need for food is one of the oldest human needs. Initially, humans
found food in nature, and later they started to produce it for their own needs.
After the first division of labour, there was a specialization in producing food and
its trading with those who specialized in making other products. Historically, it
was a very primitive way of production of food, but over time, the process of
1Željko Vaško (corresponding author: [email protected]), University of Banja Luka,
Faculty of Agriculture, Banja Luka; Ivan Kovačević, Agricultural Institute of the Republic of
Srpska, Banja Luka, BOSNIA AND HERZEGOVINA.
Notes: The authors declare that they have no conflicts of interest. Authorship Form signed online.
Received:25/04/2020 Accepted:14/06/2020
Vaško and Kovačević
168
production was modernized and the traditional method of production abandoned.
The modernization was happening in both different periods and directions, and
the period of so-called green revolution was one of the most fruitful periods. The
green revolution was driven by a technology revolution, comprising a package of
modern inputs – irrigation, improved seeds, fertilizers, and pesticides – that
together dramatically increased crop production (Hazell, 2009).
However, productivity and profit maximization are achieved through the
use of numerous agro-technical measures that have had many adverse side effects
on agro-systems (Sredojević et al., 2018) and questioned the viability of such a
mode of production. According to Njegovan (2018) today there are more and
more those who point out that the green revolution has had multiple negative
consequences. In response to the destruction of biological diversity and other
risks, primarily from a standpoint of security of food production and
consumption, the concept of organic farming appears. Thus, there are two
concepts of food production in the world, respectively conventional and organic
farming.
Due to increasing consumer demand and political support, the popularity of
organic food is increasing (Huang et. al., 2016) and it is produced in increasing
quantities. Organic agriculture has been seen also as one of the ways to diversify
agriculture (Jansky et al., 2003). Bosnia and Herzegovina is characterized by
increase of the area under organic crops growing, from 292 ha in 2013, to 659 in
2016 (MOFTER, 2018). The value of exported organic products from BiH in
2017 was EUR 4 million. Both figures confirm that organic farming, although
present, is still in its infancy. At the world level, Malek et al. (2019) mapped
112,724 certified organic crop farmers in 150 countries with estimation that there
are only 5 percent of total organic crop farmers and with conclusion that a higher
density of organic crop farmers is in high-income countries, and closer to larger
cities. According Kyrylov et al. (2018) organic production is being practiced in
178 countries and covering of 57.8 million ha of agriculture land while about 90
percent of organic food and drinks are consumed in North America and Europe.
Organic production is also present in the region. According to Zrakić et al.
(2017), 2,319 farmers on 50,054 ha were engaged in organic production in
Croatia in 2016 and compared to 2013, the agricultural area under organic
farming has increased by 23.1%. Montenegro has 285 registered producers of
organic food in 2017 (Melović at. al, 2018). Veličković and Golijan (2016) state
that 9.547 ha were in the status of organic production or conversion in the
Republic of Serbia in 2016. According to Vlahović et al. (2019), about 10% of
the land in Serbia is unpolluted and thus ideal for organic production, which can
be significantly increased. It is similar in other countries of the Western Balkans,
which have great potential for organic production, which, despite this, is still
undeveloped.
A good overview of the state of organic production in the Mediterranean
region can be found in MOAN (Mediterranean Organic Agriculture Network)
report (2019). According to these data, Serbia has the largest area under organic
Comparison of economic efficiency of organic versus conventional farming...
169
production, and Northern Macedonia has the largest share in the total agricultural
area.
Table 1. Area under organic farming in the Western Balkans (2017)
Alb
ania
BiH
Mo
nte
neg
ro
No
rth
Mac
edo
nia
Ser
bia
Organic agric. area (ha) 549 659 2,797 2,900 13,423
Share of total agric. land (%) 0.08 0.03 1.09 2.9 0.39
Organic farming is often suggested as an alternative for those who cannot
be profitable in conventional farming (Jouzi et al., 2017), although, due to the
capital and knowledge required, there are cases where organic farming is more
often undertaken by big farms (Bazylevych et al., 2017). Organic farming is also
a recommendation for farmers in BiH, especially those with traditional way of
production and small holdings. According to the BiH Strategic plan of rural
development (2018), organic farming for BiH farmers represents a significant
opportunity to expand production, inter alia because the traditional production
methods used in many ways correspond to organic farming principles and
represents advantage for many farmers who would be interested in developing
organic farming systems. The expectation was that many farmers would engage
in organic farming where, with smaller production capacities, they could produce
higher value products that would ensure greater profit (Vaško et al., 2009).
In the case of any farming, one of key commitments to engage in that
production is the ability to earn money, i.e. its profitability. In searching the
optimal cost-benefit ratio, farmers are considering different combinations of
production factors and their use, and one of the dillemas is whether to apply a
conventiona or organic farming system. Such a commitment to organic farming is
not only a matter of moral commitment and special social responsiblity, but also
finding a financial interest in that choice. Therfore, the researches of economic
efficiency of organic farming and commparing its financial results with results in
conventional farming are always actual and in the function of rational decisions-
making process.
MATERIAL AND METHODS The aim of research was to calculate and compare the economic efficiency
of organic and conventional farming in case of three selected agricultural
products: wheat, tomato and raspberry. The research hypothesis has been
formulated that organic farming is more economically efficient than
conventional. The research method is based on a mathematic calculation of the
profitability of selected products in the BiH market conditions, with a static
valuation the input-output variables. Data on production and marketing
Vaško and Kovačević
170
conditions were collected by surveying one producer for each of selected
products in both production systems. One product was taken as representative of
crop, one for vegetable and one for fruit production. The research was conducted
based on processing data from six case studies in which organic production
represent the first, while conventional production represented the second
production method.
Six mathematic models have been designed: organic (W1) and
conventional (W2) wheat in the open field, organic (T1) and conventional (T2)
tomato in greenhouse and organic (R1) and conventional (R2) raspberry in the
open field. Since both variants of production took place in the same geographical
area and in the same calendar year, the impact of climate conditions on yield is
identical and has not been considered as a factor influencing the results achieved.
In general, the first half of 2019 had a good distribution of rainfall, which resulted
in good yield of wheat. Production of tomato was realized under irrigations
conditions (in both variants). When it comes to raspberry, the year of 2019 is
characterized by low sales price, which influenced lower revenue and profit in
both models of production. The value of production (revenue), expenses and
gross profit were calculated in each of the six cases, applying full cost analytical
calculation method (formula (1)).
𝐺𝑟𝑜𝑠𝑠 𝑝𝑟𝑜𝑓𝑖𝑡 = 𝑅𝑒𝑣𝑒𝑛𝑢𝑒 − 𝐸𝑥𝑝𝑒𝑛𝑠𝑖𝑒𝑠 = � 𝑌 ∗ 𝑃 + 𝑆 − 𝑥𝑖
𝑛
𝑖=1
∗ 𝑝𝑖
(1)
where: Y – yield, P – sales price, S – subsidies, xi – inputs and pi – prices of
inputs. Additionally, a comparison of two production methods was performed
using partial budget analysis. The difference in gross profit (ΔGP) is determined
at the level of revenue (ΔR) and expenses (ΔE) differences of each of the
products in conventional and organic production system (formula (2)).
∆𝐺𝑃 = ∆𝑅 − ∆𝐸 = 𝑅1 − 𝑅2 − (𝐸1 − 𝐸2) (2)
The application of mentioned iterations and the calculation of the derived
indicators was mythologically performed according to Vaško (2019). All amounts
have been converted into € for the purpose of international comparison. Organic
producers selected for the case studies had certified organic production, and
conventional producers were selected to be at approximately the same location
and having approximately the same scope of production, to ensure the grater
possible comparability of yield, cost and revenue data. Production of all products
has been carried out in 2019, except in case of wheat, where it was autumn
sowing in 2018 and the harvest in 2019.
RESULTS AND DISCUSSION
Generally, organic farming is a production system that sustains the health
of soils, ecosystem and people. It relies on ecological processes, biodiversity and
cycles adapted to local conditions, rather than the use of inputs with adverse
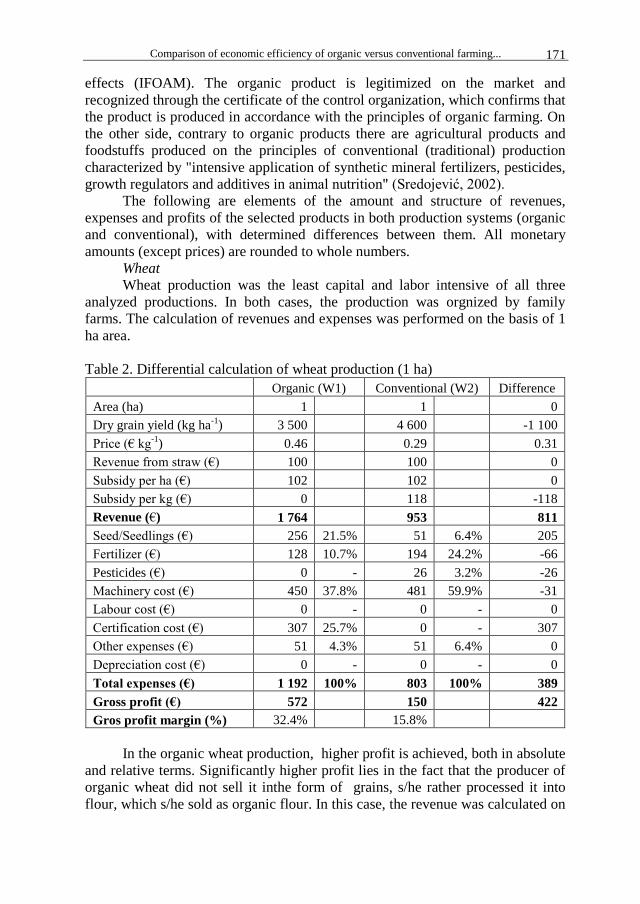
Comparison of economic efficiency of organic versus conventional farming...
171
effects (IFOAM). The organic product is legitimized on the market and
recognized through the certificate of the control organization, which confirms that
the product is produced in accordance with the principles of organic farming. On
the other side, contrary to organic products there are agricultural products and
foodstuffs produced on the principles of conventional (traditional) production
characterized by "intensive application of synthetic mineral fertilizers, pesticides,
growth regulators and additives in animal nutrition" (Sredojević, 2002).
The following are elements of the amount and structure of revenues,
expenses and profits of the selected products in both production systems (organic
and conventional), with determined differences between them. All monetary
amounts (except prices) are rounded to whole numbers.
Wheat
Wheat production was the least capital and labor intensive of all three
analyzed productions. In both cases, the production was orgnized by family
farms. The calculation of revenues and expenses was performed on the basis of 1
ha area.
Table 2. Differential calculation of wheat production (1 ha)
Organic (W1) Conventional (W2) Difference
Area (ha) 1
1
0
Dry grain yield (kg ha-1
) 3 500
4 600
-1 100
Price (€ kg-1
) 0.46
0.29
0.31
Revenue from straw (€) 100
100
0
Subsidy per ha (€) 102
102
0
Subsidy per kg (€) 0
118
-118
Revenue (€) 1 764
953
811
Seed/Seedlings (€) 256 21.5% 51 6.4% 205
Fertilizer (€) 128 10.7% 194 24.2% -66
Pesticides (€) 0 - 26 3.2% -26
Machinery cost (€) 450 37.8% 481 59.9% -31
Labour cost (€) 0 - 0 - 0
Certification cost (€) 307 25.7% 0 - 307
Other expenses (€) 51 4.3% 51 6.4% 0
Depreciation cost (€) 0 - 0 - 0
Total expenses (€) 1 192 100% 803 100% 389
Gross profit (€) 572
150
422
Gros profit margin (%) 32.4%
15.8%
In the organic wheat production, higher profit is achieved, both in absolute
and relative terms. Significantly higher profit lies in the fact that the producer of
organic wheat did not sell it inthe form of grains, s/he rather processed it into
flour, which s/he sold as organic flour. In this case, the revenue was calculated on
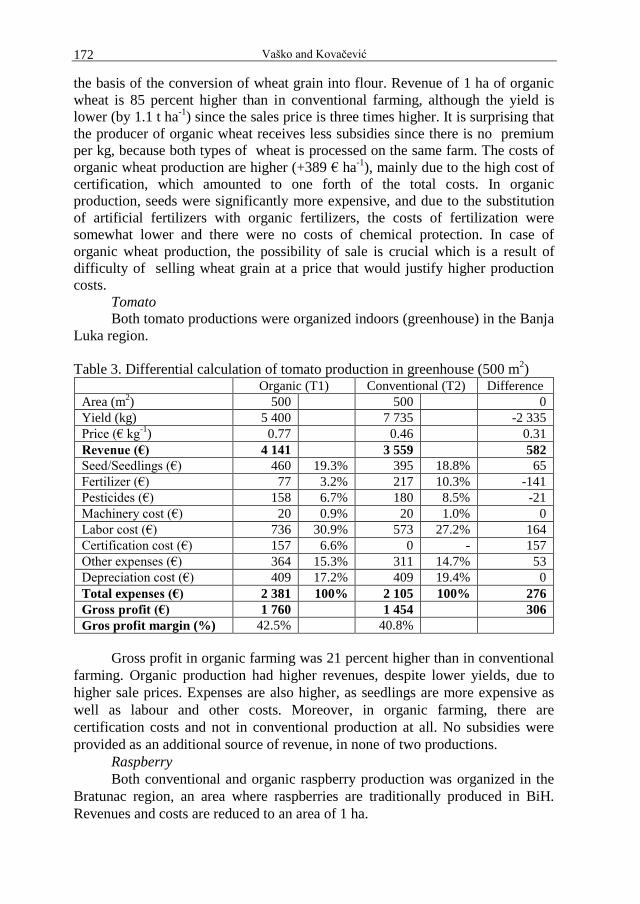
Vaško and Kovačević
172
the basis of the conversion of wheat grain into flour. Revenue of 1 ha of organic
wheat is 85 percent higher than in conventional farming, although the yield is
lower (by 1.1 t ha-1
) since the sales price is three times higher. It is surprising that
the producer of organic wheat receives less subsidies since there is no premium
per kg, because both types of wheat is processed on the same farm. The costs of
organic wheat production are higher (+389 € ha-1
), mainly due to the high cost of
certification, which amounted to one forth of the total costs. In organic
production, seeds were significantly more expensive, and due to the substitution
of artificial fertilizers with organic fertilizers, the costs of fertilization were
somewhat lower and there were no costs of chemical protection. In case of
organic wheat production, the possibility of sale is crucial which is a result of
difficulty of selling wheat grain at a price that would justify higher production
costs.
Tomato
Both tomato productions were organized indoors (greenhouse) in the Banja
Luka region.
Table 3. Differential calculation of tomato production in greenhouse (500 m2)
Organic (T1) Conventional (T2) Difference
Area (m2) 500
500
0
Yield (kg) 5 400
7 735
-2 335
Price (€ kg-1
) 0.77
0.46
0.31
Revenue (€) 4 141
3 559
582
Seed/Seedlings (€) 460 19.3% 395 18.8% 65
Fertilizer (€) 77 3.2% 217 10.3% -141
Pesticides (€) 158 6.7% 180 8.5% -21
Machinery cost (€) 20 0.9% 20 1.0% 0
Labor cost (€) 736 30.9% 573 27.2% 164
Certification cost (€) 157 6.6% 0 - 157
Other expenses (€) 364 15.3% 311 14.7% 53
Depreciation cost (€) 409 17.2% 409 19.4% 0
Total expenses (€) 2 381 100% 2 105 100% 276
Gross profit (€) 1 760
1 454
306
Gros profit margin (%) 42.5%
40.8%
Gross profit in organic farming was 21 percent higher than in conventional
farming. Organic production had higher revenues, despite lower yields, due to
higher sale prices. Expenses are also higher, as seedlings are more expensive as
well as labour and other costs. Moreover, in organic farming, there are
certification costs and not in conventional production at all. No subsidies were
provided as an additional source of revenue, in none of two productions.
Raspberry
Both conventional and organic raspberry production was organized in the
Bratunac region, an area where raspberries are traditionally produced in BiH.
Revenues and costs are reduced to an area of 1 ha.
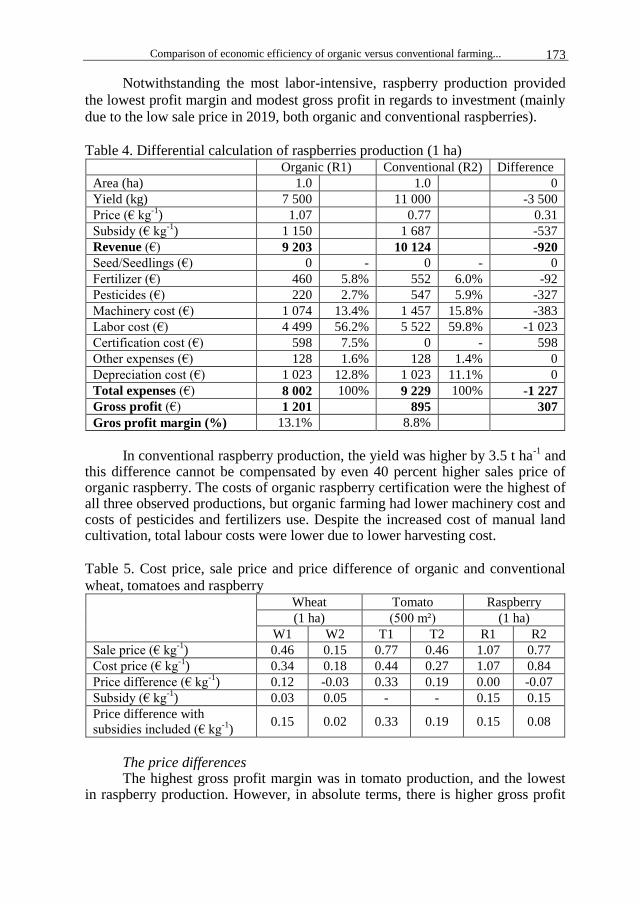
Comparison of economic efficiency of organic versus conventional farming...
173
Notwithstanding the most labor-intensive, raspberry production provided
the lowest profit margin and modest gross profit in regards to investment (mainly
due to the low sale price in 2019, both organic and conventional raspberries).
Table 4. Differential calculation of raspberries production (1 ha)
Organic (R1) Conventional (R2) Difference
Area (ha) 1.0 1.0 0
Yield (kg) 7 500 11 000 -3 500
Price (€ kg-1
) 1.07 0.77 0.31
Subsidy (€ kg-1
) 1 150 1 687 -537
Revenue (€) 9 203 10 124 -920
Seed/Seedlings (€) 0 - 0 - 0
Fertilizer (€) 460 5.8% 552 6.0% -92
Pesticides (€) 220 2.7% 547 5.9% -327
Machinery cost (€) 1 074 13.4% 1 457 15.8% -383
Labor cost (€) 4 499 56.2% 5 522 59.8% -1 023
Certification cost (€) 598 7.5% 0 - 598
Other expenses (€) 128 1.6% 128 1.4% 0
Depreciation cost (€) 1 023 12.8% 1 023 11.1% 0
Total expenses (€) 8 002 100% 9 229 100% -1 227
Gross profit (€) 1 201 895 307
Gros profit margin (%) 13.1% 8.8%
In conventional raspberry production, the yield was higher by 3.5 t ha
-1 and
this difference cannot be compensated by even 40 percent higher sales price of organic raspberry. The costs of organic raspberry certification were the highest of all three observed productions, but organic farming had lower machinery cost and costs of pesticides and fertilizers use. Despite the increased cost of manual land cultivation, total labour costs were lower due to lower harvesting cost.
Table 5. Cost price, sale price and price difference of organic and conventional
wheat, tomatoes and raspberry
Wheat Tomato Raspberry
(1 ha) (500 m²) (1 ha)
W1 W2 T1 T2 R1 R2
Sale price (€ kg-1
) 0.46 0.15 0.77 0.46 1.07 0.77
Cost price (€ kg-1
) 0.34 0.18 0.44 0.27 1.07 0.84
Price difference (€ kg-1
) 0.12 -0.03 0.33 0.19 0.00 -0.07
Subsidy (€ kg-1
) 0.03 0.05 - - 0.15 0.15
Price difference with
subsidies included (€ kg-1
) 0.15 0.02 0.33 0.19 0.15 0.08
The price differences The highest gross profit margin was in tomato production, and the lowest
in raspberry production. However, in absolute terms, there is higher gross profit
Vaško and Kovačević
174
in raspberry production than in wheat production. The production of tomatoes is not comparable, because it took place indoors, on a much smaller surface. Considering different production areas and intensity of production, comparative results of production of three selected products in two variants (organic and conventional farming) are appropriate to be summarized through production cost (average unit cost of production) per kg and the difference between sales price (with and without subsidy) and cost price.
Without subsidies, conventional wheat and raspberry production is not
profitable, and with the subsidies all production provides some positive difference
between sale price and cost price. The greatest difference in price was achieved in
production of tomatoes (both organic and conventional). Producers in 2018 did
not take any special incentives for organic production, thus organic farming did
not gain any advantage in terms of increased revenue or reduced expenses
compared to conventional farming. Profits in organic agriculture are the result of
higher sales prices of organic products, and in case of raspberries, lower cost.
At the beginning of the discussion of the obtained results, it should be kept
in mind that “comparing organic and conventional system is still not an easy task
because authors often adopt quite different methodologies, and different
geographical areas” (Gomiero et al., 2011). So e.g. Lakner et al. (2018) find and
point to quite different conditions and potentials of organic farms in Switzerland
Austria and Southern Germany. Therefore, in the discussion, the exact numbers
will not be compared from this and other researches obtained by reviewing the
literature, but only the general relations, directions and tendencies.
As expected and in accordance with the results of most other surveys (such
as in: Bavec, 2011; Bayramoglu and Gundogmus, 2008; Alaru et al., 2014;
Lakner and Breustedt, 2015), the yields in the system of organic farming were
lower than in the conventional. Summarizing metadata and compared 316
organic-to-conventional yields on 34 different crop species, Seufert et al. (2012)
found that overall, organic yields are 25 percent lower than conventional.
Sales pries of organic products were higher than those produced in the
conventional way, which is consistent with most other researces (e.g. Guesmi et
al., 2012; Prodanović and Babović, 2014; Torres et al., 2016). Due to higher sales
prices, despite lower yields, organic farming generates higher revenues than
conventional (Bayramoglu Z. and Gundogmus, 2008; Guesmi et al., 2012;
Prodanović and Babović, 2014; Lee et al., 2016). In this research, this was
confirmed in case of wheat and tomato, but not raspberry, wheere there were the
smallest difference in sales prices. Some researchers as Galnaityte et al. (2017) in
Lithuania point out that the production of organic food is not profitable due to the
fact that prices of organic products are not high enough, thus causing low
profitability of production .
The expenses in organic farming were higher in the production of wheat
and tomato. In organic raspberry production, expenses, despite more physical
work in pest management, were generally lower because of less engagement of
workers during harvest. Confirmations for these statements can be found in other
studies that have more frequently mentioned higher costs in organic production
Comparison of economic efficiency of organic versus conventional farming...
175
(Bayramoglu Z. and Gundogmus, 2008; Guesmi et al., 2012; Torres et al., 2016;
Lee et al., 2016), and rarely lower costs of organic production compared to
conventional (Bodiroga and Sredojevic, 2017).
According to this research, agricultural producers in the organic farming
system did not receive any subsidies for increased costs, especially its
certification, as it is common practice in the EU and elsewhere (e.g. in Spain the
subsidy covering 80 percent of the costs of registration and renovation with
organic produce (according to Torres et al., 2016). Robertson et al. (2014)
conclude that the reduction in income and profits of environmentally responsible
farmers must be compensated, either by the state through subsidies from collected
taxes or by consumers through the acceptance of higher prices of such food. In
the BiH context, both ways are debatable, obtaining a subsidy for organic
production is complicated, and few consumers are willing to consume more
expensive organic products. Vehapi (2019) states that the purchasing intentions of
Western Balkan consumers tend to fluctuate, i.e. to decline as organic food prices
rise. Jovanović et. al (2017) confirmed that the opinion of the respondents is that
the price of organic food in Montenegro is high, while at the same time Melović
et. al. (2018) claim that prices for organic products in Montenegro is lover,
compared to EU countries, are due to lower purchasing power. El Bilali et al.
(2014) concluded that in Macedonia domestic market for organic agro-food
products is still quite small.
The initial hypothesis that organic farming is economically more efficient
than conventional was confirmed in all three cases (what, tomato and raspberry).
This is consistent with the review provided by Nemes (2009) who, based on 44
studies representing 55 crops grown in 14 countries on five continents over 40
years, discovered that organic farming was actually from 22 to 35 percent more
profitable than conventional agriculture, and his three-year monitoring and
comparing the results of 204 conventional and organic farms in the Czech
Republic (2013).
CONCLUSIONS
In Bosnia and Herzegovina, organic farming, as a positive example of the
application of environmentally sustainable practices in agricultural sector, is in its
early stage and is still practiced by a small number of producers. Therefore, it was
not easy to find examples to compare the economic effects of organic versus
conventional farming. Through three case studies financial effects were analyzed
(revenues, expenses and profits) of production of wheat, tomato and raspberry in
conditions of both organic and conventional farming. The financial result was
determined by applying the analytical calculation of full costs and differential
calculation (differences in yields, prices, revenues, expensses and profits). In all
three cases, it was found that the yields in 2018 in organic farming were lower
from 24 to 32 percent. However, due to premium prices, organic production
revenues were higher for wheat and tomatoes and lower for raspberries, primarily
due to the smaller difference in organic and conventional raspberry sales prices
Vaško and Kovačević
176
and the largest difference in yield. The costs for wheat and tomatoes in organic
farming were higher than in conventional, mainly bacause of additional
certification cost, and for raspberries lower because of lower yields and
significantly lower harvesting costs than in conventional farming. All three
products in organic farming had a higher absolute gross profit than in
conventional farming.
The greatest difference in profit was acheived in wheat, primarily thanks to
farmers’ entrepreneurship, who did not sell organic wheat, than added value to it
through on-farm processing into organic flour. The lowest profit was gained with
raspberries due to the low sales price, regardless of the method of farming.
Although there were certain incentives for organic farming in Bosnia and
Herzegovina in 2018, organic farmers did not use them, thus receiving the same
or even smaller subsidies compared to conventional farming (the case of wheat).
The conclusion is that organic agricultural production is economically viable, if
the market, through a higher price, respects the specific conditions of production
of these products. Increasing profits, and therefore production of organic
products, can also be achieved by allocating additional or increasing existing
subsidies, as it is the case in developed countries.
ACKNOWLEDGEMENTS
Empirical data analyzed in this paper were collected for the purpose of
writing the masters' thesis of the candidate Ivan Kovačević, under the mentorship
of prof. dr Željko Vaško, defended at the Faculty of Agriculture in Banja Luka in
2019.
REFERENCES Alaru, M., Talgre, L., Eremeev, V., Tein, B., Luik, A., Nemvalts, A., & Loit, E. (2014):
Crop yields and supply of nitrogen compared in conventional and organic farming systems. Agricultural and food science, 23(4), 317-326. https://doi.org/10.23986/afsci.46422
Anonymus (2018): Strategic plan for rural development of Bosnia and Herzegovine (2018-2021) – framework document. p. 73.
Bavec, M., Narodoslawsky M., Bavec, M. & Turinek, M. (2011): Ecological impact of wheat and spelt production under industrial and alternative farming systems. Renewable agriculture and food systems, 27(3); 242-250. doi:10.1017/S1742170511000354
Bayramoglu, Z. & Gundogmus, E. (2008): Cost efficiency on organic farming: a comparison between organic and conventional raisin-producing households in Turkey. Spanish journal of agricultural research, 6(1): 3-11.
Bazylevych, V., Kupalova, G., Goncharenko, N., Murovana, T. & Grynchuk, Y. (2017): Improvement of the effectiveness of organic farming in Ukraine. Problems and perspectives in management, 15(3): 64-75.
Bodiroga, R. & Sredojevic, Z. (2017): Economic validity of organic raspberry production as a challenge for producers in Bosnia and Herzegovina. Economic insights – trends and challenge, VI(LXIX)(1): 5-15.
Brožova, I. & Vanek. J. (2013): Assessment of economic efficiency of conventional and organic agricultural enterprises in a chosen region. Acta univ. agric. silvic. mendelianae Brun, 61: 297-307. doi.org/10.11118/actaun201361020297

Comparison of economic efficiency of organic versus conventional farming...
177
El Bilali, H., Despotovic, A., Berjan, S., Driouech, N., Petrovic, J., Kulina, M. & Rusevski, K. (2014): Organic agriculture in the Republic of Macedonia: potential, governance, policy framework and market. Agriculture and Forestry, 60(1): 15-26.
Galnaityte, A., Kriščiukaitiene, I., Baležentis, T. & Namiotko, V. (2017): Evaluation of technological, economic and social indicators for different farming practices in Lithuania. Economics and sociology, 10(4): 189-202. doi:10.14254/2071-789X.2017/10-4/15
Gomiero, T., Pimentel, D. & Paoletti G.M. (2011): Environmental impact of different agricultural management practices: conventional vs. organic agriculture. Critical reviews in plant sciences, 30(1-2): 95-124. doi.org/10.1080/07352689.2011.554355
Guesmi, B., Serra, T., Kallas, Z. & Gil Roig, J.M. (2012): The productive efficiency of organic farming: the case of grape sector in Catalonia. Spanish journal of agricultural research, 10(3): 552-566. doi.org/10.5424/sjar/2012103-462-11
Hazell, P. (2009): The Asian green revolution. IFPRI duscussion paper 00911, International food policy research institute. p. 3.
Huang, L., Yang, J., Cui, X., Yang, H., Wang, S. & Zhuang, H. (2016): Synergy and transition of recovery efficiency of nitrogen fertilizer in various rice genotypes under organic farming. Sustainability, 8(9), 854: 1-14. doi:10.3390/su8090854
International federation of organic agriculture movements (IFOAM): Definition of organic agricultre (https://www.ifoam.bio/en/organic-landmarks/definition-organic-agriculture, accessed 10 January 2020).
Jansky, J., Živelova, I. & Novak, P. (2003): Economic efficency of agricultural enterprises in the system of organic farming. AGRIC. ECONOM. - CZCEH, 49(5): 242-246.
Jouzi, Z., Azadi, H., Taheri, F., Zarafshani, K., Gebrehiwot, K., Van Passel, S. & Lebailly, P. (2017): Organic farming and Small-scale farmers: main opportunities and challenges. Ecological economics, 132: 145-154. doi.org/10.1016/j.ecolecon.2016.10.016
Jovanović, M., Joksimović, M., Kašćelan, Lj. & Despotović, A. (2017): Consumer attitudes to organic foods: Evidence from Montenegrin market. Agriculture and Forestry, 63 (1): 223-234. doi: 10.17707/AgricultForest.63.1.26
Kyrylov, Y., Thompson, R.S., Hranovska, V. & Krykunova, V. (2018): The world trends of organic production and consumption. Management theory and studies for rural business and infrastructure development, Vol. 40, No. 4: 514-530. doi.org/10.15544/mts.2018.46
Lakner, S. & Breustedt, G. (2015): Productivity and technical efficiency of organic farming – a literature survey. Acta fytotechnica et zootechnica, 18 (special issue): 74-77. doi.org/10.15414/afz.2015.18.si.74-77
Lakner, S., Kirchweger, S., Hoop, D., Brümmer B. & Kantelhardt, J. (2018): The effects of diversification activities on the technical efficiency of organic farms in Switzerland, Austria, and southern Germany. Sustainability,10(4): 2-18. doi.org/10.3390/su10041304
Lee, S., Nguyen, T.T., Poppenborg, P., Shin, H-J. & Koellner, T. (2016): Conventional, partially converted and environmentally friendly farming in South Korea: profitability and factors affecting farmers’ choice. Sustainability, 8(8), 704: 1-18. doi:10.3390/su8080704
Madžarić, S., Al Bitar, L., Bteich, M.R. & Pugliese, P. (eds.) (2019): Mediterranean Organic Agriculture Network, Report 2019. CIHEAM, Bari, Valenzano (BA).
Malek, Ž., Tieskens, F.K. & Verburg, H.P. (2019): Explaining the global spatial distribution of organic crop producers, Agricultural systems, 176 (2019) 102680: 1-10. doi.org/10.1016/j.agsy.2019.102680
Melović, B., Đurišić, V. & Rogić, S. (2018): Business analysis of the financial support for organic production in Montenegro – technological and organizational aspects. MATEC Web Conf. Volume 170, 0100: 1-6. doi.org/10.1051/matecconf/201817001001
Vaško and Kovačević
178
Ministry of Foreign Trade and Economic Relations of BiH (MOFTER) (2018): Annual report in the field of agriculture, food and rural development of Bosnia and Herzegovina for 2017. p. 68.
Nemes, N. (2009): Comparative analysis of organic and non-organic farming system: a critical assessment of farm profitability. Natural resources management and environmental department food and agriculture of the United Nations, pp. 1-39. (www.fao.org/3/a-ak355e.pdf/, accessed 3 May 2020).
Njegovan, Z. (2018): Agrikultura, kratka istorija. Univerzitet u Novom Sadu, Poljoprivredni fakultet. p. 375.
Prodanović. R. & Babović. J. (2014): Ekonomski pokazatelji u proizvodnji organskog voća. Ekonomija, teorija i praksa, VII(4): 21-35.
Robertson, G.P., Gross L.G., Hamilton K.S., Landis. A.L., Schmidt, M.T., Snapp S.S. & Swinton M.S. (2014): Farming for ecosystem services: an ecological approach to production agriculture. BioScience, 64: 404-415.
Seufert, V., Ramankutty, N. & Foley, J. (2012): Comparing the yields of organic and conventional agriculture. Nature, 485: 229–232. doi:10.1038/nature11069
Sredojević, Z. (2002): Ekonomski problemi ekološke poljoprivrede, Poljoprivredni fakultet, Beograd-Zemun. p. 101.
Sredojević, Z., Oljača, S., Oljača, M., Milenković, S., Filipović, V., Ugren, V., Dimitrijević, B., Đorđević, T. & Simić, I. (2018): Efikasnost organske proizvodnje – malina, višnja i paprika. Univerzitet u Beogradu, Poljoprivredni fakultet, Beograd. p. 30.
Torres, J., Valera, L.D., Belmonte, J.L. & Herrero-Sanchez, C. (2016): Economic and social sustainability through organic agriculture: study of the restructuring of the citrus sector in the “Bajo Andarax” district (Spain). Sustainability, 8(9), 918: 1-14. doi:10.3390/su8090918
Vaško, Ž., Jotanović, S., Vučenović, A. & Savić, Đ (2009): Estimation of perspectives for organic food production in BiH, based on SWOT analaysis. 1
st international
scentific and expert conference TEAM 2009, Slavonski Brod, Croatia, 10-11 December 2009: 393-397.
Vaško, Ž. (2019): Troškovi i kalkulacije u poljoprivrednoj proizvodnji – teorija i primjeri. Univerzitet u Banjoj Luci, Poljoprivredni fakultet: pp. 166-235.
Vehapi, S. (2019): Determinante razvoja tržišta organske hrane u zemljama Zapadnog Balkana. Marketing, 50(1): 43-56.
Veličković, M. & Golijanin, J. (2016): Organic fruit production in Serbia. Agro-knowledge Journal, 17(3): 289-297. doi: 10.7251/AGREN1603289V
Vlahović, B., Užar, D., Škatarić, G. (2019): Comparative analysis of organic food markets in the Republic of Serbia and the neighboring countries. Contemporary Agriculture, 68(1-2): 34-42. doi: 10.2478/contagri-2019-0007
Zrakić, M., Jež Rogelj M. & Grgić, I. (2017): Organic agricultural production on family farms in Croatia, Agroecology and Sustainable Food Systems, 41(6): 635-649. doi: 10.1080/21683565.2017.1290731

Agriculture & Forestry, Vol. 66 Issue 2: 179-190, 2020, Podgorica 179
Balli, M. H., Özaslan, C. (2020): Weed flora of lentil in Diyarbakir province, Turkey. Agriculture and Forestry,
66 (2): 179-190.
DOI: 10.17707/AgricultForest.66.2.17
Hazal Merve BALLI, Cumali ÖZASLAN 1
WEED FLORA OF LENTIL IN DIYARBAKIR PROVINCE, TURKEY
SUMMARY
Lentil is usually cultivated under rainfed conditions in various geographic
regions of the globe. Thus, lentil productivity is constrained by various biotic and
abiotic factors. Weeds are one of the biotic factors negatively influencing the
productivity and profitability of the crop. Lentil is intensively cultivated in
southeastern Anatolia region of Turkey under rainfed conditions. Weeds have
been identified as one of the major challenges to lentil productivity in the region.
Therefore, development of suitable management strategies is inevitable in the
region. The development of effective weed management strategies relies on the
basic knowledge of weed species/weed inventories. The current study was
conducted to determine the weed flora in lentil production areas of Diyarbakır
province situated in southeastern Anatolia region of Turkey. A total 55 fields
were surveyed and data relating to weed species, their densities and frequency of
occurrence were recorded. A total 89 weed species and 78 taxa belonging to 28
plant families (2 parasitic, 7 monocotyledonous and 19 dicotyledonous) were
recorded form the province. The overall weed species’ density in the province
was 35 weeds m-2
. The weed species having the highest density in the province
were; Sinapis arvensis L. (7.38 plants/m2), Avena sterilis L. (6.55 plants/m
2),
Ranunculus arvensis L. (3.49 plants/m2), Papaver sp. (2.78 plants/m
2), Anthemis
chia L. (2.11 plants/m2), Vaccaria pyramidata Medik. (1.72 plants/m
2), Galium
spp. (1.43 plants/m2) and Vicia sativa L. (1.19 plants/m
2). Similarly, the weed
species having the highest frequency of occurrence were; Sinapis arvensis L.
(87.96%), Vaccaria pyramidata Medik. (87.22%), Papaver sp. (84.38%), Vicia
sativa (77.02%), Ranunculus arvensis (68.11%), Avena sterilis L. (67%),
Cephalaria syriaca (L.) Schrad (61.93%), Silene conica L. (53.59%) and
Anthemis sp. (52.60%). The current study has improved our understanding on the
weed flora of lentil fields in Diyarbakır province of the country. The data
generated through this study could be used to devise suitable weed management
strategies for lentil in the province.
Keywords: Weed flora, Lentil, Diyarbakır, Southeastern Anatolia, Turkey.
1Cumali Özaslan (corresponding author: [email protected]), Hazal Merve Balli, Department of
Plant Protection, Faculty of Agriculture, Dicle University, 21100 Diyarbakır, TURKEY.
Notes: The authors declare that they have no conflicts of interest. Authorship Form signed online.
Received:03/04/2020 Accepted:16/06/2020
Balli and Özaslan 180
INTRODUCTION
The increasing global population demands more food production than ever
before. Therefore, cereals, oilseeds and legumes have an important position in
human nutrition. Lentils (Lens culinaris Medik.) is one of the most important
legume species, regarded as a high quality proteins source and used in human
nutrition (El-Nahry et al., 1980; Desphande and Damodaran, 1990; Costa et al.
2006; Wang et al., 2009; Şehirali, 1988; Pekşen and Artık, 2005; Urbano et al.,
2007). The crop is cultivated in temperate and sub-tropic climate regions
worldwide (Şehirali 1988). Turkey is 3rd
largest lentil producer following India
and Canada. However, lentil production varies considerably from year to year
globally and in Turkey (FAO, 2014; TÜİK, 2016).
Several biotic and abiotic factors affect the lentil production in the country.
The plant protection problems, i.e., weeds, diseases and insects are among the
major constraints impairing lentil production. However, weeds cause more
nuisance than other plant protection agents (Tepe, 1997; Özer at al., 2001). The
damage caused by weeds to lentil production is higher compared to the other
agents since weeds compete and suppress lentil plants from the early stage of
growing period. Competition for water is much more severe in arid areas and
yield losses can reach ~93% during dry seasons (Şehirali, 1988). In addition,
weeds also cause quality losses in lentil (Kuntay, 1944; Güncan, 1982; Yeğen,
1984; Çınar and Uygun 1987). Therefore, Sepetoğlu (1992) concluded that weeds
should be controlled during the lentil growing season in order to obtain good
yield. The weed surveys are critical to determine the distribution patterns of the
weed species at spatial and landscape scales, and possible factors shaping the
distribution patterns (Rankins et al. 2005; Ozaslan et al., 2016; Korres et al.,
2015a, b).
The information obtained from surveys makes an important contribution to
the development of effective regional or site-specific weed management
strategies (Önen and Özer, 2001; Özaslan et al., 2002; Önen et al., 2018).
However, there is no information available on the weed flora of lentil fields in
Diyarbakır province. Therefore, the current survey study was conducted with an
objective to determine the weed flora prevailing in the lentil fields of Diyarbakır
province, Turkey. The results will contribute towards the development of site-
specific weed management practices in the region. It was hypothesized that
different fields will differ in weed species composition.
MATERIAL AND METHODS
Geographic location
Survey studies were carried out in six districts of Diyarbakır province
during 2017. Diyarbakır is located in the north of Mesopotamia in the central part
of the Southeastern Anatolia Region. It is surrounded by Elazığ and Bingöl
provinces from the north, Siirt and Muş from the east, Mardin from the south, and
Şanlıurfa, Adıyaman, Malatya from the west. The total area of the province is
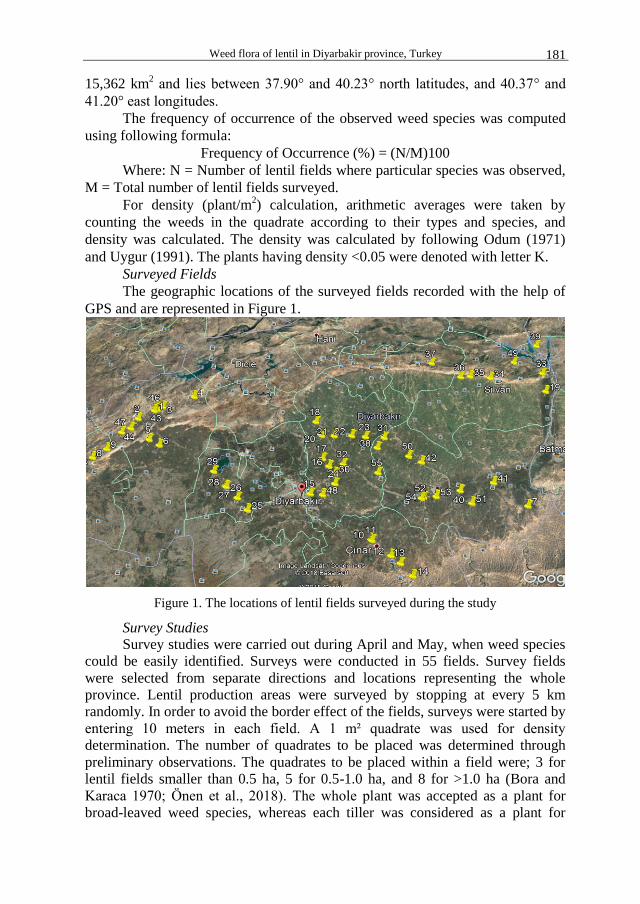
Weed flora of lentil in Diyarbakir province, Turkey 181
15,362 km2 and lies between 37.90° and 40.23° north latitudes, and 40.37° and
41.20° east longitudes.
The frequency of occurrence of the observed weed species was computed
using following formula:
Frequency of Occurrence (%) = (N/M)100
Where: N = Number of lentil fields where particular species was observed,
M = Total number of lentil fields surveyed.
For density (plant/m2) calculation, arithmetic averages were taken by
counting the weeds in the quadrate according to their types and species, and
density was calculated. The density was calculated by following Odum (1971)
and Uygur (1991). The plants having density <0.05 were denoted with letter K.
Surveyed Fields
The geographic locations of the surveyed fields recorded with the help of
GPS and are represented in Figure 1.
Figure 1. The locations of lentil fields surveyed during the study
Survey Studies Survey studies were carried out during April and May, when weed species
could be easily identified. Surveys were conducted in 55 fields. Survey fields
were selected from separate directions and locations representing the whole
province. Lentil production areas were surveyed by stopping at every 5 km
randomly. In order to avoid the border effect of the fields, surveys were started by
entering 10 meters in each field. A 1 m² quadrate was used for density
determination. The number of quadrates to be placed was determined through
preliminary observations. The quadrates to be placed within a field were; 3 for
lentil fields smaller than 0.5 ha, 5 for 0.5-1.0 ha, and 8 for >1.0 ha (Bora and
Karaca 1970; Önen et al., 2018). The whole plant was accepted as a plant for
broad-leaved weed species, whereas each tiller was considered as a plant for
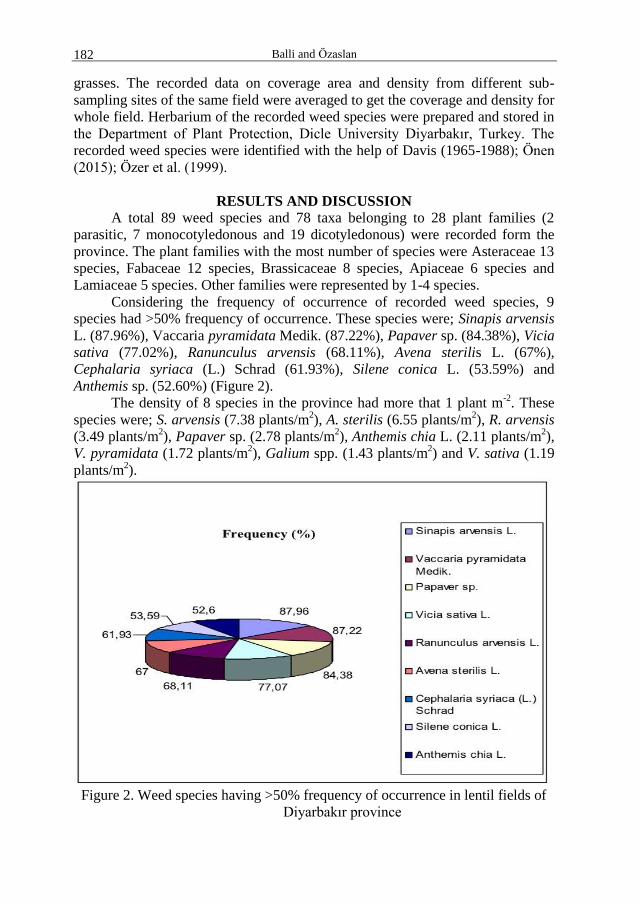
Balli and Özaslan 182
grasses. The recorded data on coverage area and density from different sub-
sampling sites of the same field were averaged to get the coverage and density for
whole field. Herbarium of the recorded weed species were prepared and stored in
the Department of Plant Protection, Dicle University Diyarbakır, Turkey. The
recorded weed species were identified with the help of Davis (1965-1988); Önen
(2015); Özer et al. (1999).
RESULTS AND DISCUSSION
A total 89 weed species and 78 taxa belonging to 28 plant families (2
parasitic, 7 monocotyledonous and 19 dicotyledonous) were recorded form the
province. The plant families with the most number of species were Asteraceae 13
species, Fabaceae 12 species, Brassicaceae 8 species, Apiaceae 6 species and
Lamiaceae 5 species. Other families were represented by 1-4 species.
Considering the frequency of occurrence of recorded weed species, 9
species had >50% frequency of occurrence. These species were; Sinapis arvensis
L. (87.96%), Vaccaria pyramidata Medik. (87.22%), Papaver sp. (84.38%), Vicia
sativa (77.02%), Ranunculus arvensis (68.11%), Avena sterilis L. (67%),
Cephalaria syriaca (L.) Schrad (61.93%), Silene conica L. (53.59%) and
Anthemis sp. (52.60%) (Figure 2).
The density of 8 species in the province had more that 1 plant m-2
. These
species were; S. arvensis (7.38 plants/m2), A. sterilis (6.55 plants/m
2), R. arvensis
(3.49 plants/m2), Papaver sp. (2.78 plants/m
2), Anthemis chia L. (2.11 plants/m
2),
V. pyramidata (1.72 plants/m2), Galium spp. (1.43 plants/m
2) and V. sativa (1.19
plants/m2).
Figure 2. Weed species having >50% frequency of occurrence in lentil fields of
Diyarbakır province
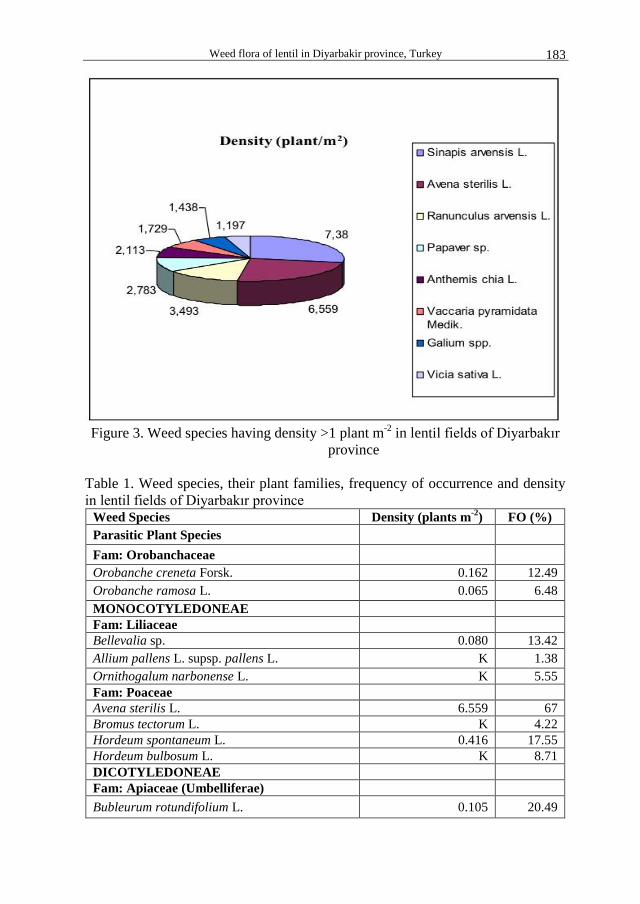
Weed flora of lentil in Diyarbakir province, Turkey 183
Figure 3. Weed species having density >1 plant m
-2 in lentil fields of Diyarbakır
province
Table 1. Weed species, their plant families, frequency of occurrence and density
in lentil fields of Diyarbakır province Weed Species Density (plants m
-2) FO (%)
Parasitic Plant Species
Fam: Orobanchaceae
Orobanche creneta Forsk. 0.162 12.49
Orobanche ramosa L. 0.065 6.48
MONOCOTYLEDONEAE
Fam: Liliaceae
Bellevalia sp. 0.080 13.42
Allium pallens L. supsp. pallens L. K 1.38
Ornithogalum narbonense L. K 5.55
Fam: Poaceae
Avena sterilis L. 6.559 67
Bromus tectorum L. K 4.22
Hordeum spontaneum L. 0.416 17.55
Hordeum bulbosum L. K 8.71
DICOTYLEDONEAE
Fam: Apiaceae (Umbelliferae)
Bubleurum rotundifolium L. 0.105 20.49
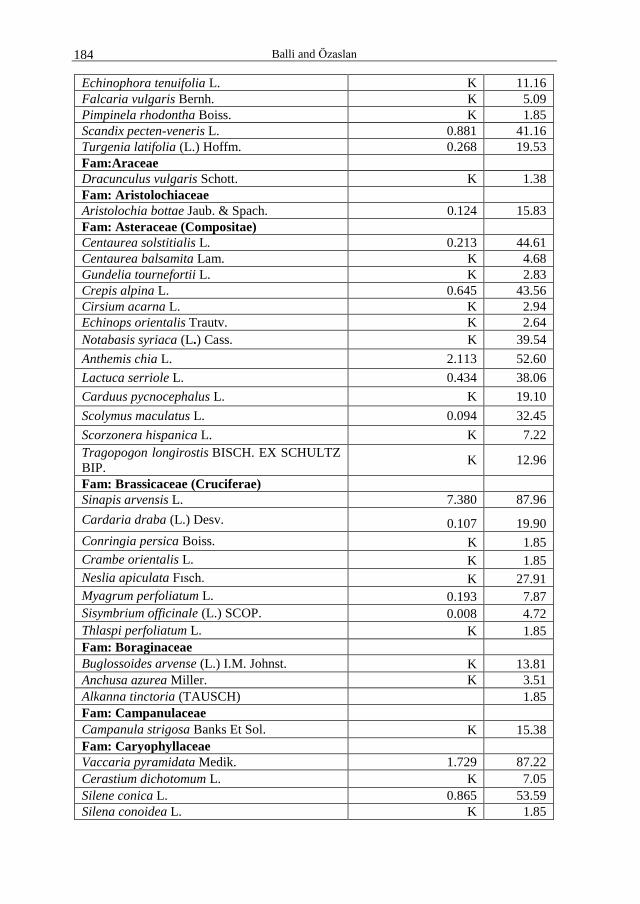
Balli and Özaslan 184
Echinophora tenuifolia L. K 11.16
Falcaria vulgaris Bernh. K 5.09
Pimpinela rhodontha Boiss. K 1.85
Scandix pecten-veneris L. 0.881 41.16
Turgenia latifolia (L.) Hoffm. 0.268 19.53
Fam:Araceae
Dracunculus vulgaris Schott. K 1.38
Fam: Aristolochiaceae
Aristolochia bottae Jaub. & Spach. 0.124 15.83
Fam: Asteraceae (Compositae)
Centaurea solstitialis L. 0.213 44.61
Centaurea balsamita Lam. K 4.68
Gundelia tournefortii L. K 2.83
Crepis alpina L. 0.645 43.56
Cirsium acarna L. K 2.94
Echinops orientalis Trautv. K 2.64
Notabasis syriaca (L.) Cass. K 39.54
Anthemis chia L. 2.113 52.60
Lactuca serriole L. 0.434 38.06
Carduus pycnocephalus L. K 19.10
Scolymus maculatus L. 0.094 32.45
Scorzonera hispanica L. K 7.22
Tragopogon longirostis BISCH. EX SCHULTZ
BIP. K 12.96
Fam: Brassicaceae (Cruciferae)
Sinapis arvensis L. 7.380 87.96
Cardaria draba (L.) Desv. 0.107 19.90
Conringia persica Boiss. K 1.85
Crambe orientalis L. K 1.85
Neslia apiculata Fısch. K 27.91
Myagrum perfoliatum L. 0.193 7.87
Sisymbrium officinale (L.) SCOP. 0.008 4.72
Thlaspi perfoliatum L. K 1.85
Fam: Boraginaceae
Buglossoides arvense (L.) I.M. Johnst. K 13.81
Anchusa azurea Miller. K 3.51
Alkanna tinctoria (TAUSCH) 1.85
Fam: Campanulaceae
Campanula strigosa Banks Et Sol. K 15.38
Fam: Caryophyllaceae
Vaccaria pyramidata Medik. 1.729 87.22
Cerastium dichotomum L. K 7.05
Silene conica L. 0.865 53.59
Silena conoidea L. K 1.85
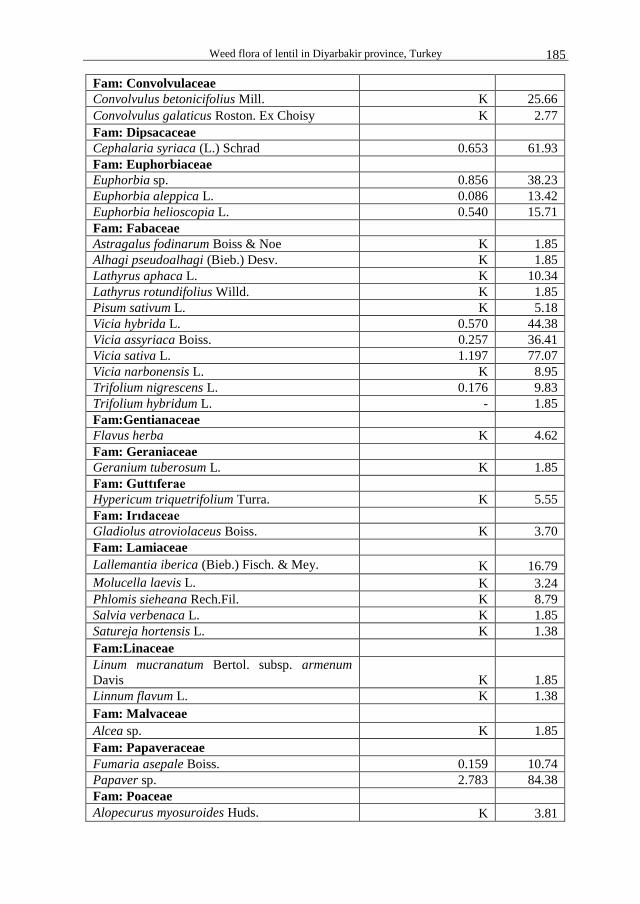
Weed flora of lentil in Diyarbakir province, Turkey 185
Fam: Convolvulaceae
Convolvulus betonicifolius Mill. K 25.66
Convolvulus galaticus Roston. Ex Choisy K 2.77
Fam: Dipsacaceae
Cephalaria syriaca (L.) Schrad 0.653 61.93
Fam: Euphorbiaceae
Euphorbia sp. 0.856 38.23
Euphorbia aleppica L. 0.086 13.42
Euphorbia helioscopia L. 0.540 15.71
Fam: Fabaceae
Astragalus fodinarum Boiss & Noe K 1.85
Alhagi pseudoalhagi (Bieb.) Desv. K 1.85
Lathyrus aphaca L. K 10.34
Lathyrus rotundifolius Willd. K 1.85
Pisum sativum L. K 5.18
Vicia hybrida L. 0.570 44.38
Vicia assyriaca Boiss. 0.257 36.41
Vicia sativa L. 1.197 77.07
Vicia narbonensis L. K 8.95
Trifolium nigrescens L. 0.176 9.83
Trifolium hybridum L. - 1.85
Fam:Gentianaceae
Flavus herba K 4.62
Fam: Geraniaceae
Geranium tuberosum L. K 1.85
Fam: Guttıferae
Hypericum triquetrifolium Turra. K 5.55
Fam: Irıdaceae
Gladiolus atroviolaceus Boiss. K 3.70
Fam: Lamiaceae
Lallemantia iberica (Bieb.) Fisch. & Mey. K 16.79
Molucella laevis L. K 3.24
Phlomis sieheana Rech.Fil. K 8.79
Salvia verbenaca L. K 1.85
Satureja hortensis L. K 1.38
Fam:Linaceae
Linum mucranatum Bertol. subsp. armenum
Davis K 1.85
Linnum flavum L. K 1.38
Fam: Malvaceae
Alcea sp. K 1.85
Fam: Papaveraceae
Fumaria asepale Boiss. 0.159 10.74
Papaver sp. 2.783 84.38
Fam: Poaceae
Alopecurus myosuroides Huds. K 3.81
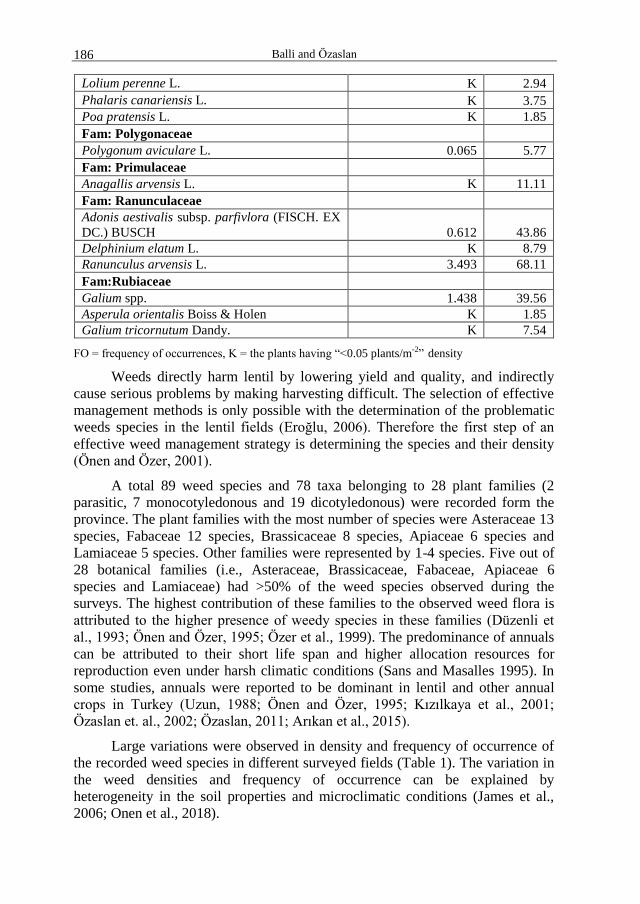
Balli and Özaslan 186
Lolium perenne L. K 2.94
Phalaris canariensis L. K 3.75
Poa pratensis L. K 1.85
Fam: Polygonaceae
Polygonum aviculare L. 0.065 5.77
Fam: Primulaceae
Anagallis arvensis L. K 11.11
Fam: Ranunculaceae
Adonis aestivalis subsp. parfivlora (FISCH. EX
DC.) BUSCH 0.612 43.86
Delphinium elatum L. K 8.79
Ranunculus arvensis L. 3.493 68.11
Fam:Rubiaceae
Galium spp. 1.438 39.56
Asperula orientalis Boiss & Holen K 1.85
Galium tricornutum Dandy. K 7.54
FO = frequency of occurrences, K = the plants having “<0.05 plants/m-2” density
Weeds directly harm lentil by lowering yield and quality, and indirectly
cause serious problems by making harvesting difficult. The selection of effective
management methods is only possible with the determination of the problematic
weeds species in the lentil fields (Eroğlu, 2006). Therefore the first step of an
effective weed management strategy is determining the species and their density
(Önen and Özer, 2001).
A total 89 weed species and 78 taxa belonging to 28 plant families (2
parasitic, 7 monocotyledonous and 19 dicotyledonous) were recorded form the
province. The plant families with the most number of species were Asteraceae 13
species, Fabaceae 12 species, Brassicaceae 8 species, Apiaceae 6 species and
Lamiaceae 5 species. Other families were represented by 1-4 species. Five out of
28 botanical families (i.e., Asteraceae, Brassicaceae, Fabaceae, Apiaceae 6
species and Lamiaceae) had >50% of the weed species observed during the
surveys. The highest contribution of these families to the observed weed flora is
attributed to the higher presence of weedy species in these families (Düzenli et
al., 1993; Önen and Özer, 1995; Özer et al., 1999). The predominance of annuals
can be attributed to their short life span and higher allocation resources for
reproduction even under harsh climatic conditions (Sans and Masalles 1995). In
some studies, annuals were reported to be dominant in lentil and other annual
crops in Turkey (Uzun, 1988; Önen and Özer, 1995; Kızılkaya et al., 2001;
Özaslan et. al., 2002; Özaslan, 2011; Arıkan et al., 2015).
Large variations were observed in density and frequency of occurrence of
the recorded weed species in different surveyed fields (Table 1). The variation in
the weed densities and frequency of occurrence can be explained by
heterogeneity in the soil properties and microclimatic conditions (James et al.,
2006; Onen et al., 2018).
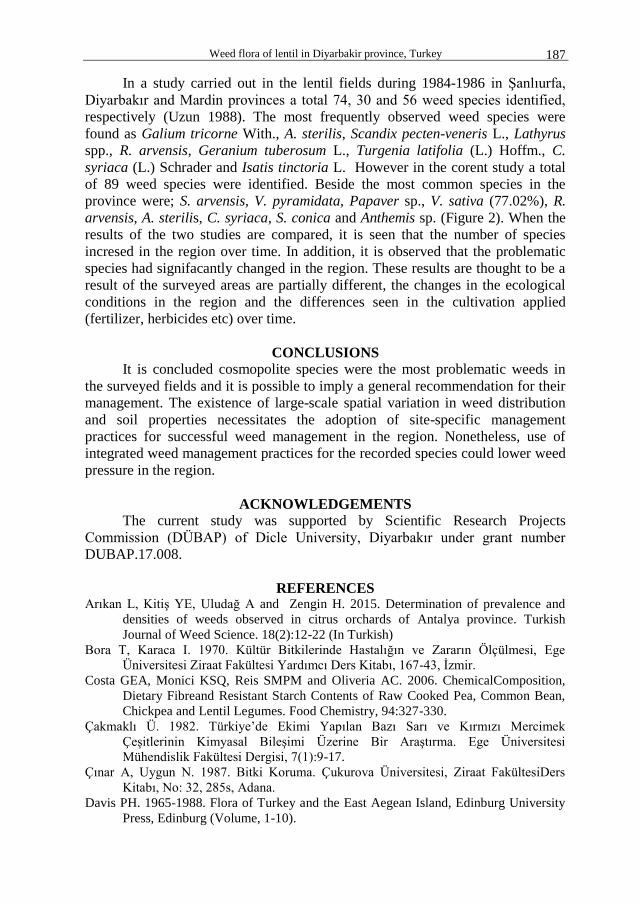
Weed flora of lentil in Diyarbakir province, Turkey 187
In a study carried out in the lentil fields during 1984-1986 in Şanlıurfa,
Diyarbakır and Mardin provinces a total 74, 30 and 56 weed species identified,
respectively (Uzun 1988). The most frequently observed weed species were
found as Galium tricorne With., A. sterilis, Scandix pecten-veneris L., Lathyrus
spp., R. arvensis, Geranium tuberosum L., Turgenia latifolia (L.) Hoffm., C.
syriaca (L.) Schrader and Isatis tinctoria L. However in the corent study a total
of 89 weed species were identified. Beside the most common species in the
province were; S. arvensis, V. pyramidata, Papaver sp., V. sativa (77.02%), R.
arvensis, A. sterilis, C. syriaca, S. conica and Anthemis sp. (Figure 2). When the
results of the two studies are compared, it is seen that the number of species
incresed in the region over time. In addition, it is observed that the problematic
species had signifacantly changed in the region. These results are thought to be a
result of the surveyed areas are partially different, the changes in the ecological
conditions in the region and the differences seen in the cultivation applied
(fertilizer, herbicides etc) over time.
CONCLUSIONS
It is concluded cosmopolite species were the most problematic weeds in
the surveyed fields and it is possible to imply a general recommendation for their
management. The existence of large-scale spatial variation in weed distribution
and soil properties necessitates the adoption of site-specific management
practices for successful weed management in the region. Nonetheless, use of
integrated weed management practices for the recorded species could lower weed
pressure in the region.
ACKNOWLEDGEMENTS
The current study was supported by Scientific Research Projects
Commission (DÜBAP) of Dicle University, Diyarbakır under grant number
DUBAP.17.008.
REFERENCES Arıkan L, Kitiş YE, Uludağ A and Zengin H. 2015. Determination of prevalence and
densities of weeds observed in citrus orchards of Antalya province. Turkish
Journal of Weed Science. 18(2):12-22 (In Turkish)
Bora T, Karaca I. 1970. Kültür Bitkilerinde Hastalığın ve Zararın Ölçülmesi, Ege
Üniversitesi Ziraat Fakültesi Yardımcı Ders Kitabı, 167-43, İzmir.
Costa GEA, Monici KSQ, Reis SMPM and Oliveria AC. 2006. ChemicalComposition,
Dietary Fibreand Resistant Starch Contents of Raw Cooked Pea, Common Bean,
Chickpea and Lentil Legumes. Food Chemistry, 94:327-330.
Çakmaklı Ü. 1982. Türkiye’de Ekimi Yapılan Bazı Sarı ve Kırmızı Mercimek
Çeşitlerinin Kimyasal Bileşimi Üzerine Bir Araştırma. Ege Üniversitesi
Mühendislik Fakültesi Dergisi, 7(1):9-17.
Çınar A, Uygun N. 1987. Bitki Koruma. Çukurova Üniversitesi, Ziraat FakültesiDers
Kitabı, No: 32, 285s, Adana.
Davis PH. 1965-1988. Flora of Turkey and the East Aegean Island, Edinburg University
Press, Edinburg (Volume, 1-10).
Balli and Özaslan 188
Desphande SS, Damodaran S. 1990. Food Legumes:Chemistry andTechnology .
Advances in Cereal Science and Technology. American Association of Cereal
Chemists, Incorporated. St.Paul, Minnesota, USA, p.147-241.
Düzenli A, Türkmen N, Uygur FN, Uygur S and Boz Ö. 1993. Important weeds of
Aegean region and their botanical features. Türkiye 1. Herboloji Kongresi, 3-5
Adana, Turkey. (In Turkish)
El-Nahry FI, Mourad FE, Abdel Khalik SM and Bassıly N.1980. Chemical
ompositionand Protein Quality of Lentils (Lens) Consumed in Egypt. Plant Foods
for Human Nutrition, 30(2):87-95.
Eroğlu N. 2006. Karaman'da nohutlarda sorun oluşturan yabancı otlar ve kritik periyodun
belirlenmesi. Selçuk Üniversitesi, Fen Bilimleri Enstitüsü, Bitki Koruma Anabilim
Dalı, Yüksek Lisans Tezi, 51s, Konya.
FAO 2014. Agricultural Statistics Database. http://www.fao.org/faostat/en/#data/QC
(Erişim tarihi: 01.12.2017).
Güncan A. 1980. Anadolu’nun Doğusunda Buğday Ürününe Karışan Yabancı Ot
Tohumları, Bunların Yoğunluları (Assosiation) Üzerinde Bir Araştırma, Yüzüncü
Yıl Üniv. Zir.Fakültesi, Van.
Güncan A. 1982. Erzurum Yöresinde Buğday Ürününe Karışan Bazı Yabancı
Ottohumlarının Çimlenme Biyolojisi Üzerinde Araştırmalar. A.Ü, Ziraat Fakültesi
Yayınları. No: 270, Erzurum.
James JJ, Caird MA, Drenovsky RE and Sheley RL. 2006. Influence of resource pulses
and perennial neighbors on the establishment of an invasive annual grass in the
Mojave Desert. J. Arid Environ. 67, 528–534.
Kızılkaya A, Önen H, Özer Z. 2001. Soğan Verimine Yabancı Ot Rekabetinin Etkileri
Üzerinde Araştırmalar. Türkiye Herboloji Dergisi, Cilt 4, Sayı 2, 58-65.
Korres NE, Norsworthy JK, Bagavathiannan MV and Mauromoustakos A. 2015a:
Distribution of arable weed populations along eastern Arkansas Mississippi Delta
roadsides: occurrence, distribution, and favored growth habitats. Weed
Technology 29(3), 587–595.
Korres NE, Norsworthy JK, Bagavathiannan MV and Mauromoustakos A. 2015b:
Distribution of arable weed populations along eastern Arkansas-Mississippi Delta
roadsides: factors affecting weed occurrence. Weed Technology 29(3), 596–604.
Kuntay S. 1944. Türkiye Hububat Mahsulü İçinde Tohumları Bulunan Yabancı Otlar
Üzerinde Araştırmalar. Ankara Yüksek Ziraat Enstitüsü Dergisi, 2(1)
Lee HC, Htoon AK, Uthayakumaran S and Paterson JL. 2007. Chemical and functional
quality of protein isolated from Alkaline Extraction of Australian Lentil Cultivars:
Matilda and Digger. Food Chemistry, 102(2007):1199-1207.
Odum EP. 1971. Fundamentals of Ecology. W.B. Saunders Company, Philadelphia,
London, Toronyo.
Onen H, Akdeniz M, Farooq S, Hussain M and Ozaslan C. 2018. Weed Flora of Citrus
Orchards and Factors Affecting Its Distributionin Western Mediterranean Region
of Turkey. Planta Daninha, v35:e017172126.
Ozaslan C, Onen H, Farooq S, Gunal H and Akyol N, 2016: Common ragweed: An
emerging threat for sunflower production and human health in Turkey. Weed
Biology and Management 16(1), 42¬–55.
Önen H. 2015. (Ed.) Türkiye istilacı bitkiler kataloğu. T.C. Gıda, Tarım Ve Hayvancılık
Bakanlığı Tarımsal Araştırmalar ve Politikalar Genel Müdürlüğü Bitki Sağlığı
Araştırmaları Daire Başkanlığı, Ankara. ISBN: 978-605-9175-05-0.
Weed flora of lentil in Diyarbakir province, Turkey 189
Önen H, Özer Z. 1995. Kazova'da (Tokat) Şeker Pancarı Ekim Alanlarında Görülen
Yabancı Otlar. VII. Türkiye Fitopatoloji Kongresi, 26-29 Eylül 1995, Adana.
Önen H, Özer Z. 2001. Tarla İçerisinde Yabancı Otların Dağılımları Arasındaki
Farklılıkların Haritalanarak Belirlenmesi. Türkiye Herboloji Dergisi, Cilt 4, Sayı 2,
74-83.
Özaslan C, Önen H, Özer Z. 2002. Tokat Kazova'da İlkbahar ve Sonbaharda Ispanak
(Spinacia oleracea L.) Yetiştiriciliğinde Sorun Olan Yabancı Otların Belirlenmesi.
Türkiye Herboloji Dergisi, cilt 5, sayı 1, 52-61.
Özaslan C. 2011. Diyarbakır İli Buğday ve Pamuk Ekim Alanlarında Sorun Olan Yabancı
Otlar ile Üzerindeki Fungal Etmenlerin Tespiti ve Bio-Etkinlik
PotansiyellerininAraştırılması. Selçuk Üniversitesi, Fen Bilimleri Enstitüsü, Bitki
Koruma Anabilim Dalı. Doktora Tezi, Konya
Özer Z, H Önen, Tursun N, Uygur FN. 1999. Türkiye’nin Bazı Önemli Yabancı Otları
(Tanımları ve Kimyasal Savaşımları). Gaziosmanpaşa Üniversitesi Ziraat Fakültesi
Yayınları, No: 38, Kitap seri No: 16, ISBN: 975-7328-24-3.
Özer Z, Kadıoğlu İ, Önen H and Tursun N. 2001. Herboloji (Yabancı Ot Bilimi)
Gaziosmanpaşa Üniversitesi Ziraat Fakültesi Yayınları No:20 Kitap Serisi No:10,
3. Baskı, TOKAT.
Özer Z, Önen H, Tursun N and Uygur FN. 1999. Türkiye’nin Bazı Önemli Yabancı Otları
(Tanımları ve Kimyasal Savaşımları). Gaziosmanpaşa Üniversitesi Ziraat Fakültesi
Yayınları No:38 Kitap Serisi No:16 Tokat.
Pekşen E, Artık C. 2005. Antinutritional Factors and Nutritive Values of Food Grain
Legumes. The Journal of Agricultural Faculty of Ondokuz MayısUniversity,
20(2):111-121.
Radosevich SR, Holt JS. 1984. Weed Ecology Implications for VegetationManagement.
A Wiley Interscience Publication, New York,United States of America, ISBN 0-
471-87674-7, 265p.
Rao V. 2000. Principles of Weed Sicience. Science Publishers, Inc. Enfield (NH),555p,
USA.
Sans FX, Masalles RM. 1995. Phenological patterns in an arable land weed community
related to disturbance. Weed Research, 35(5), 321-332.
Sepetoğlu H. 1992. Yemeklik Dane Baklagiller. Ege Üniversitesi Ziraat Fakültesi
Yayınları, Ders Notları:24, E.Ü. Ziraat Fakültesi Ofset Basımevi, Bornova-İzmir.
Sönmez S. 1976. Bolu ilinde Patateslerde Yabancı Ot Rekabeti ve Savaşı üzerine
araştırmalar.
Şehirali S. 1988. Yemeklik Dane Baklagiller. AÜ, Ziraat Fak. Tarla Bit. Bö. AÜZF yay.
No: 1089, Ders Kitapları Ser. No :314, Ankara
Tepe I. 1997. Türkiye’de Tarım ve Tarım dışı alanlarda sorun olan yabancı otlar ve
mücadeleleri. Yüzüncü Yıl Üniversitesi Yay. No 32, Ziraat Fakültesi Yay.No:
ISBN 975-7616-24-9, Van.
TÜİK 2016. Bitkisel Üretim İstatistileri. http://www.tuik.gov.tr/PreTablo.do?alt_id=1001
Erişim Tarihi:12.10.2017
Urbano G, Porres JM, Frias J and Vidal-Valverde C. 2007. NutritionalValue Shyam,
D.m. Philip, and C. Stevenson. Lentil: An Ancient Cropfor Modern Times. XXIV,
Hardcover ISBN: 978-1-4020-6312-1 Netherlands, p.47-93
Uygur FN. 1991. Herboloji Araştırma Yöntemleri. Ç. Ü. Ziraat Fakültesi Bitki Koruma
Bölümü, Yardımcı Ders Notu, Adana.
Uygur FN, Koch W, Walter H. 1984. Yabancı ot bilimine giriş. Plits, 1984/2(1). Verlag
Josef Margraf, Stuttgart 114s.

Balli and Özaslan 190
Uzun A. 1988. Türkiye’de mercimek (Lens esculenta Moench.) tarlalarında sorun olan
yabancı otlarla mücadele imkanlarının araştırılması. Nihai rapor. Diyarbakır Zirai
Mücadele Araştırma Enstitüsü, 47 s.
Wang N, Hatcher DW, Toews R and Gowalko EJ. 2009. Influence of Cooking and
Dehulling on Nutritional Composition of Several Varieties of Lentils (Lens
culinaris). Food Science and Technology, 42(4):842-848.
Yeğen O. 1984. Yabancı Otlar ve Mücadelesi. Ankara Üniversitesi, Ziraat Fakültesi
Yayınları, 146s. Ankara.

Agriculture & Forestry, Vol. 66 Issue 2: 191-216, 2020, Podgorica 191
Krivokapić, S., Pejatović, T., Perović, S. (2020): Chemical charactetization, nutritional benefits and some
processed products from carrot (Daucus carota L.). Agriculture and Forestry, 66 (2): 191-216.
DOI: 10.17707/AgricultForest.66.2.18
Slađana KRIVOKAPIĆ, Tijana PEJATOVIĆ, Svetlana PEROVIĆ 1
CHEMICAL CHARACTETIZATION, NUTRITIONAL BENEFITS AND
SOME PROCESSED PRODUCTS FROM CARROT (Daucus carota L.)
SUMMARY
Carrot (Daucus carota L.) is a famous horticultural crop eaten all over the
planet and can be used raw, cooked or processed. It is well known by its high β-
carotene content but its' root also contains carotenoids, phenolic compounds,
vitamin C and polyacetylenes. This review article discusses both: carrots
chemical composition and nutritional value, and some of the processed carrots
products such as: beverages (juice, yoghurt, smoothies and milk), jam and jelly,
carrots chips (dehydrated non-fried carrot chips, deep-fried carrot chips and
whole grain carrot chips), carrots edible seed oil and carrots essential seed oil.
However, the main purpose of this article is to inform the reader about afore
mentioned carrots products and the latest technology achievements in their
production, as well as to highlight carrot as a functional food rich in nutrients.
Keywords: Daucus carota L., carrot, β-carotene, carrots beverages, carrots
jam and jelly, carrots chips, carrots edible seed oil, carrots essential seed oil.
List of abbreviations:
DPPH - 2,2-diphenyl-1-picrylhydrazyl assay
EPS - exopolisaccharides
G-C - gas chromatograpy
GC-MS - gas chromatography-mass spectrometry
HTLT - high temperature-long time
HTST - high temperature-short time
MTLT - mild temperature-long time
MTST - mild temperature-short time
TBRS - thiobarbituric acid reactive substances assay
INTRODUCTION
Daucus carota L. (carrot) belongs to Apiaceae family and is the most
significant plant of that family (Silva Dias, 2014). It is considered as one of the
10 most appreciated crops from economic point of view, and broadly used radix
1Tijana Pejatović (corresponding author: [email protected]), Slađana Krivokapić, Svetlana
Perović, Department of Biology, Faculty of Natural Sciences and Mathematics, University of
MONTENEGRO
Notes: The authors declare that they have no conflicts of interest. Authorship Form signed online.
Received:24/04/2020 Accepted:17/06/2020
Pejatović et al 192
in peoples' diet (Ergun and Süslüoğlu, 2018). Also, it has been rated sixth in per
person utilization out of 22 popular vegetables (Zhang and Hamauzu, 2004).
Recently, utilization of carrot and its processed products has expanded regularly
because of their admission as an meaningful source of antioxidants, as well as β-
carotene (which is a precursor of vitamin A) activity against cancer (Sharma et
al., 2012). Carrots are the main source of provitamin A and they bring 17% of its
intake (Zhang and Hamauzu, 2004). A good processing method is crucial for
producing products which are not only greatly liked by customers but also a
satisfying source of phytonutrients like β-carotene in order to boost carrot
consummation (Sulaeman et al., 2001).
This review aims at highlighting raw carrot chemical composition and
nutritional value but as its' major has some of the processed carrot products such
as beverages, jam and jelly, carrots chips, carrots edible seed oil and carrots
essential seed oil. This review provides latest research in the field of afore
mentioned processed carrot products.
1.Survey methodology
The literature for this review paper was retrieved from Google Scholar by
using following key words: carrot (Daucus carota L.); nutritional value and
chemical composition of raw carrots; nutritional value and chemical composition
of carrot seeds; "provitamin A activity" of carrots; occurrence of phenolics or
phenols or phenolic acids, carotenoids, polyacetylenes and ascorbic acid or
vitamin C in carrots; carrots processing; main components, functions and
nutritive value of jam and jelly, deep-fried chips, dehydrated slices, juice, milk,
yogurt, smoothie, edible seed oil and essential oil from carrots.
More than 70 articles including original research papers, review papers and
books were downloaded, and all of the articles were relevant to the topic and up-
to-date so they were all selected for writing this review article.
2.Daucus carota L.
a. Description
According to Shakheel et al. (2017) carrot can be characterized as a
biennial crop that belongs to the family Apiaceae. It is an erect perennial
vegetable (Negi and Roy, 2000), tall booming spiny-fruited herb (Özcan and
Chalchat, 2007) with height of 0.3 to 0.6 m; hairy and with a strong stem (Kataria
et al., 2016).
Firstly, a rosette of leaves is formed (in the spring and summer) along with
the extended taproot which stores large volume of sugars that will be used by the
plant in the second year to form flowers (Shakheel et al., 2017). Negi & Roy
(2000) also confirms that flower and seeds are produced in the second year. There
are some varieties, called fast-growing, that mature in a period of three months
(90 days) after sowing, however others called slower-maturing varieties are
collected four months later (120 days) (Shakheel et al., 2017).
Chemical charactetization, nutritional benefits and some processed products... 193
Tap root is bloated, thick, usually orange-red, in conical shape or thin and
light colored even tough cylindrical and round ones are also available (Kataria et
al., 2016). It consists of cortex, which is pulpy, and central core. Most of the
taproot consists of a pulpy outer cortex and an inner core. Finest-quality carrots
have a smaller amount of core compared to cortex. Some sorts have tiny in size
and deeply pigmented core, but a totally xylem-free carrot is not possible; the
taproot can seem to lack a core when the color of the cortex and core are of
similar intensity. The width of root can range from 1cm to 10cm and its length
from 5 to 50cm, even though most of them are from 10 to 25cm long (Shakheel et
al., 2017).
Stem is striated, brushy-haired or condensed and with not distinct
internodes (Kataria et al., 2016). It is situated just above the ground. When the
stem of the plant elongates, the very tops becoming thinner and grows pointed, it
lengthens upward, and becomes a very branched inflorescence. The stems usually
grow to 60-200cm (Shakheel et al., 2017).The leaves are tri-pinnate, finely cleft,
pedicel, netlike and of overall triangular shape (Kataria et al. 2016). The first real
leaf develops from 10 to 15 days after germination. Following leaves, which are
formed from the stem nodes, are intermittent and compounds, and disposed in a
spiral. While the plant grows, the bases of the seed leaves are suppressed
(Shakheel et al., 2017).
The inflorescence is a complex umbel, and every umbel consists of few
umbellets. A big primary umbel sometimes has around 50 umbellets, and every
umbellet may contain up to 50 small, white flowers. They are frequently with a
light green or yellow tint, organized in a flat umbrella-like head or umbel, build
from five petals, five stamens and calyx. The carrots fruits are pressed from the
sides and oval, 2-4mm with short styles and hooked spines (Kataria et al. 2016).
b. Anathomy
After appearance the young carrot plant shows a bright difference between
the taproot and the hypocotyl. The taproot is firstly thick and do not carry side
roots. At the end of hypocotyl there is cotyledonary node. Here the physical
foundation of the cotyledons evenly comes together with the hypocotyl
(Kjellenberg, 2007). The depository root is mostly composed of phloem and
xylem along with cambium area evenly joining together in a cylinder. The form
of a depository root varies; it can be round, conical or even cylindrical. When it
comes to pigment combination there are purple, red, yellow, white and orange
carrots. Configuration and color are affected by genetic factors as well as
environmental circumstances but also varies between different plant development
stages (Kjellenberg, 2007).
c. Distribution
Wild carrot is native to Western or the near East Asia and it can be found
in the Mediterranean area, Southwest Asia, Tropical Africa, Australia and North
and South America. It is seen as a crucial weed in Hungary, Greece, Afghanistan,
Pejatović et al 194
and Poland, a dominant weed in Puerto Rico, Jordan, Mauritius, Sweden, and
Tunisia, an ordinary weed in Canada, Austria, Egypt, Germany, England, Iran,
Iraq, USA, and West Polynesia. Carrot takes up residence in a rid open lands and
uncultivated places and it can be found at low altitudes throughout the northern
United States from Vermont to Virginia west to Washington and California; and
more up to north into Canada (Kataria et al., 2016).
Cultivated carrot is the one of the main vegetable crops in global. The
tamed breeds are detached into two groups: the Eastern or Asian carrots (var.
atrorubens), with primarily purple and yellow roots color; and the Western
carrots (var. sativus) with mainly orange roots color.
It is believed that carrot was domesticated in Afghanistan at first, and they
were spread over Europe, Asia and the Mediterranean area (Al-Snafi, 2017).
d.Origins
Central Asia (Vavilov, 1992) or Asia Minor (Banga, 1957) is thought to be
the origin of cultivated carrot used as root storage has generally been accepted to
be either. The results obtained from Iorizzo et al. (2013) strongly separate
cultivated carrot from wild carrot and strongly place wild carrots from Central
Asia as the closest genetic relatives of domesticated carrot, supporting Vavilov’s
(1992) hypothesis. To the Iorizzo et al. (2013) research, the origin(s) of carrot
domestication has not been studied, and only a small number of studies have used
molecular markers to examine carrot genetic diversity. Present-day carrots are
strongly disparate from ancestral ones with decreased bitterness, raised
sweetness, decreased endocarp fraction (Ergun and Süslüoğlu, 2018). First carrots
were purple and yellow, firstly characterized in the 10th century in Iran and
northern Arabia (Simon, 2000). After being spread carrots became known on the
Middle East, North Africa, Europe, and China by the middle of 15th century. In
northern Europe they loved yellow carrots before growth of orange ones. White
carrots were famous in Europe and red carrots are believed for being introduced
in China about this time (Arscott and Tanumihardjo 2010). First hypotheses for
explaining the origin of orange carrots proposed Vilmorin (1859). He deduced
that orange carrots were elected in Europe straight derived from wild carrots.
Small (1978) and Thellung (1927) taught that they had an ancestor in
Mediterranean and that they were result of hybridization with D. carota
subsp.maximus. Banga (1957) made an assumption that they were elected from
cultivated yellow carrots and Heywood (1983) made a conclusion that they were
hybrids between cultivated European carrots and wild ones. We should be aware
of the fact that none of these hypotheses was not established on genetic analyses,
instead, it was based on taxonomic analyses, historical archive, and geographical
distribution of wild carrot and cultivated orange carrot (Iorizzo et al., 2013). Y
and y2 are two recessive genes which majorly regulate accumulation of yellow
and orange carotenoids in the carrots root (Just et al., 2009). Genetic evidence
suggests that two recessive genes, y and y2, play a major role in the accumulation
of yellow and orange carotenoids in the root of carrot (Just et al., 2009). This
Chemical charactetization, nutritional benefits and some processed products... 195
information, together with the study of Iorizzo et al. (2013), supports Banga’s
(1957) hypothesis which states that orange root color was selected out of yellow,
domesticated carrots.
e.World production
Carrot (Daucus carota L.) represents the most valuable root vegetable and
the leading vegetable of the family Apiaceae (Umbelliferae) (Simon et al., 2008).
It was firstly used as a medical plant in middle Asia and after that it became an
important world crop (Stolarczyk and Janick, 2011). Although carrots are not a
predominant food in any part of the world, because of the low nutritional value,
they are deliberated as an essential vegetable in lot of countries (Arscott and
Tanumihardjo 2010). The domesticated carrot (Daucus carota sativus) is
cultivated around the world (Nguyen and Nguyen, 2015) Nowadays, production
of carrots is: 61% from Asia, 24%Europe, 9.7% the Americas and 4% Africa
(Nguyen and Nguyen, 2015). The 50% of world carrot production belongs to
China, Russia, and the United States which are the 3 biggest producers of carrot
(Arscott and Tanumihardjo, 2010). China is the country with the biggest carrot
production affirmed by the FAO 2008 (Sharma et al., 2012). Carrots can be
produced in temperate region. Production of carrots in tropical regions is more
restricted; still, subtropical region in South America are suitable for this (Arscott
and Tanumihardjo, 2010). It has been stated that 30–40 tons of car¬rots/ha is
noted as a good yield, even though strong farmers can reach a goal of 60 tons or
more. Carrot production has 7.85 MT, in 1990 it was 13.7 MT, in 2000 - 21.4
MT, and reached 35.658 MT in 2011 (FAOSTAT 2013) (Nguyen and Nguyen,
2015). This increase is a consequence of development of product areas, advanced
agricultural practice, agriculture mechanization, and development of hybrid
breeding methods (Bradeen and Simon, 2007).
4. Chemical composition and nutritive values of raw carrot root
4.1 Chemical composition
a.Core nutrients
Carrot root consists of almost 88% water, 1% protein, 7% carbohydrate,
0.2% fat, and 3% fiber (USDA 2008) (Arscott and Tanumihardjo, 2010).
Carrots are an excellent source of carbohydrates and minerals. Among
carbohydrates there are most of simple sugars (Arscott and Tanumihardjo, 2010).:
sucrose, glucose, xylose and fructose (Kalra et al., 1987) with a insignificant
amount of starch (USDA 2008) (Arscott and Tanumihardjo 2010). In some plant
species most important macroelements are found to be K, Ca and Mg (Bošković
et al. 2018) and in carrots we have: Ca, P, Fe and Mg (Surbhi et al., 2018).
Carrots are also rich in fiber including cellulose (50%), hemicellulose (92%) and
lignin (4%) (Marlett, 1992). Composition of carrot root is given in a Table 1.
Composition of carrot root (According to: Hag and Prasad, 2015).
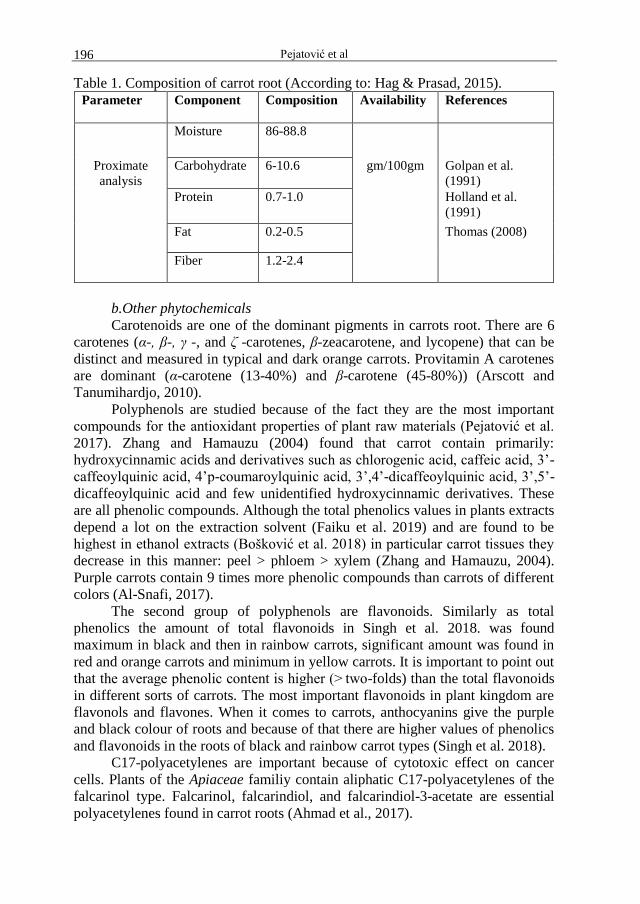
Pejatović et al 196
Table 1. Composition of carrot root (According to: Hag & Prasad, 2015). Parameter
Component Composition Availability References
Moisture 86-88.8
Proximate
analysis
Carbohydrate 6-10.6 gm/100gm Golpan et al.
(1991)
Protein 0.7-1.0 Holland et al.
(1991)
Fat 0.2-0.5 Thomas (2008)
Fiber 1.2-2.4
b.Other phytochemicals
Carotenoids are one of the dominant pigments in carrots root. There are 6
carotenes (α-, β-, γ -, and ζ -carotenes, β-zeacarotene, and lycopene) that can be
distinct and measured in typical and dark orange carrots. Provitamin A carotenes
are dominant (α-carotene (13-40%) and β-carotene (45-80%)) (Arscott and
Tanumihardjo, 2010).
Polyphenols are studied because of the fact they are the most important
compounds for the antioxidant properties of plant raw materials (Pejatović et al.
2017). Zhang and Hamauzu (2004) found that carrot contain primarily:
hydroxycinnamic acids and derivatives such as chlorogenic acid, caffeic acid, 3’-
caffeoylquinic acid, 4’p-coumaroylquinic acid, 3’,4’-dicaffeoylquinic acid, 3’,5’-
dicaffeoylquinic acid and few unidentified hydroxycinnamic derivatives. These
are all phenolic compounds. Although the total phenolics values in plants extracts
depend a lot on the extraction solvent (Faiku et al. 2019) and are found to be
highest in ethanol extracts (Bošković et al. 2018) in particular carrot tissues they
decrease in this manner: peel > phloem > xylem (Zhang and Hamauzu, 2004).
Purple carrots contain 9 times more phenolic compounds than carrots of different
colors (Al-Snafi, 2017).
The second group of polyphenols are flavonoids. Similarly as total
phenolics the amount of total flavonoids in Singh et al. 2018. was found
maximum in black and then in rainbow carrots, significant amount was found in
red and orange carrots and minimum in yellow carrots. It is important to point out
that the average phenolic content is higher (> two-folds) than the total flavonoids
in different sorts of carrots. The most important flavonoids in plant kingdom are
flavonols and flavones. When it comes to carrots, anthocyanins give the purple
and black colour of roots and because of that there are higher values of phenolics
and flavonoids in the roots of black and rainbow carrot types (Singh et al. 2018).
C17-polyacetylenes are important because of cytotoxic effect on cancer
cells. Plants of the Apiaceae familiy contain aliphatic C17-polyacetylenes of the
falcarinol type. Falcarinol, falcarindiol, and falcarindiol-3-acetate are essential
polyacetylenes found in carrot roots (Ahmad et al., 2017).
Chemical charactetization, nutritional benefits and some processed products... 197
Together with these bioactive compounds, carrots consist of different and
important amount of Vitamin C, E, and K, folate and choline (Ergun and
Süslüoğlu, 2018). They have appreciable quantity of vitamin C (5.9 mg 100 g-1
fw). This is higher in comparison with grapes, nectarines, pears, and plums etc.
(Char, 2018).
4.2 Nutritive value
Carrots root is frequently used part of the plant in human diet, even though
young leaves are used seldom in China and in Japan (Arscott and Tanumihardjo ,
2010).It is very nutritive because it contains 𝛽-carotene as well as vitamins B1,
B2, B6, and B12. It is taught to be one of the most pleasant and delicious roots
(Yi et al., 2018). Beside B vitamins carrots have appreciable amount of thiamin,
riboflavin, and niacin (Arscott and Tanumihardjo, 2010). In order to afford
enough quantity of vitamin C and A one should consume 73 kg/capita/year of
vegetables (Ali and Abedullah, 2002) and at least 146 kg/year (5 portions per
day) for the best health. Carrot can not provide an important amount of calories to
the human diet (Arscott and Tanumihardjo, 2010). Even though it has fine
nutritional value = 42 kcal of energy, 1.1g protein, 1100 IU vitamin A, 8 mg
ascorbic acid, 0.06 mg thiamine, Ca 37 mg, P 36 mg and iron 0.7 mg per 100 g of
fresh specimen (Surbhi et al., 2018). Surbhi et al. (2018) state that 100g from 4
carrot carrot cultivars has 10% carbohydrates (among them soluble carbohydrates
ranging from 6.6 - 7.7 g and protein (0.8 - 1.1 g).
5.Processed products from carrots
5.1 Juice and beverages
We ingest fruits and vegetables sometimes through juices, blends,
smoothies, fermented and fortified beverages, which is a contribution to healthy
aliment as well as a life habits (Petruzzi et al., 2017).
Juice
Juices have become a part of everyday meals for people all around the
globe. They are tasty source of vitamins, minerals and fibers (Janve et al., 2014).
The juice from carrots is regularly consumed like a vigorous drink (Singh and
Chandra, 2012). It is rather used as a good source of β-carotene. The alpha-
tocopherol-beta-carotene drinks (ATBC-drinks) are made from this juice and they
have exceptional physical and chemical stability (Reiter et al., 2003). Carrot juice
has notably high content of β-carotene, a source of vitamin A and it is rich in B
complex vitamins and a lot of minerals including calcium, copper, magnesium,
potassium, phosphorus, and iron. It has an especially sweet flavor. Difference to
other juices is that it is opaque (Singh and Chandra, 2012). This juice is extracted
by different methods like centrifugal basket, centrifugal pulp ejecting, twin gear,
two step triturator and hydraulic press, and mastication juice extractors (Hag and
Prasad, 2015). The common extractors culminate in poor juice yield because of
the very solid root structure. Yield could be raised by enzymes or heat treatment
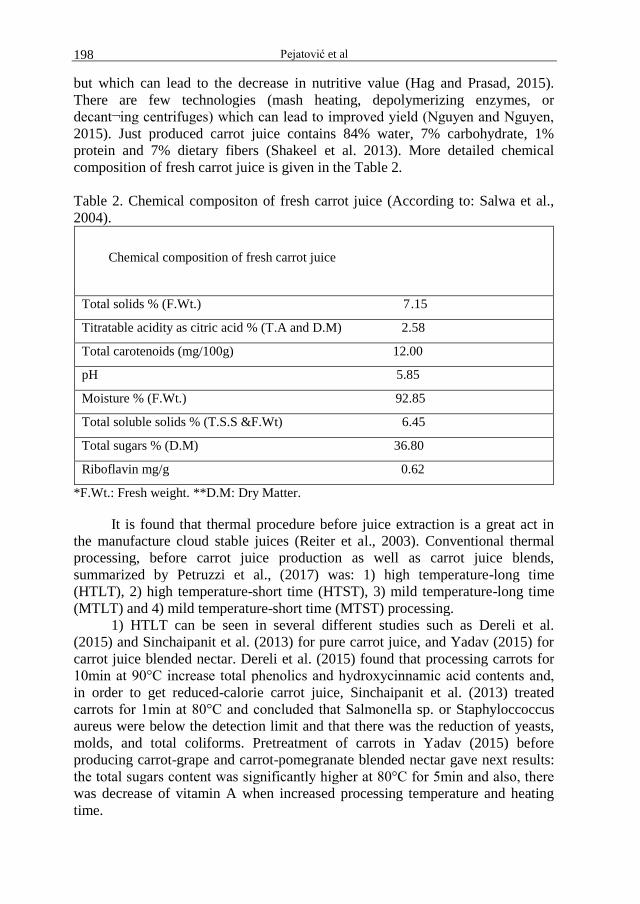
Pejatović et al 198
but which can lead to the decrease in nutritive value (Hag and Prasad, 2015).
There are few technologies (mash heating, depolymerizing enzymes, or
decant¬ing centrifuges) which can lead to improved yield (Nguyen and Nguyen,
2015). Just produced carrot juice contains 84% water, 7% carbohydrate, 1%
protein and 7% dietary fibers (Shakeel et al. 2013). More detailed chemical
composition of fresh carrot juice is given in the Table 2.
Table 2. Chemical compositon of fresh carrot juice (According to: Salwa et al.,
2004).
Chemical composition of fresh carrot juice
Total solids % (F.Wt.) 7.15
Titratable acidity as citric acid % (T.A and D.M) 2.58
Total carotenoids (mg/100g) 12.00
pH 5.85
Moisture % (F.Wt.) 92.85
Total soluble solids % (T.S.S &F.Wt) 6.45
Total sugars % (D.M) 36.80
Riboflavin mg/g 0.62
*F.Wt.: Fresh weight. **D.M: Dry Matter.
It is found that thermal procedure before juice extraction is a great act in
the manufacture cloud stable juices (Reiter et al., 2003). Conventional thermal
processing, before carrot juice production as well as carrot juice blends,
summarized by Petruzzi et al., (2017) was: 1) high temperature-long time
(HTLT), 2) high temperature-short time (HTST), 3) mild temperature-long time
(MTLT) and 4) mild temperature-short time (MTST) processing.
1) HTLT can be seen in several different studies such as Dereli et al.
(2015) and Sinchaipanit et al. (2013) for pure carrot juice, and Yadav (2015) for
carrot juice blended nectar. Dereli et al. (2015) found that processing carrots for
10min at 90°C increase total phenolics and hydroxycinnamic acid contents and,
in order to get reduced-calorie carrot juice, Sinchaipanit et al. (2013) treated
carrots for 1min at 80°C and concluded that Salmonella sp. or Staphyloccoccus
aureus were below the detection limit and that there was the reduction of yeasts,
molds, and total coliforms. Pretreatment of carrots in Yadav (2015) before
producing carrot-grape and carrot-pomegranate blended nectar gave next results:
the total sugars content was significantly higher at 80°C for 5min and also, there
was decrease of vitamin A when increased processing temperature and heating
time.
Chemical charactetization, nutritional benefits and some processed products... 199
2) HTST (temperature equal or above 80 °C and holding times equal or
less than 30 s), Petruzzi et al. (2017) is reported by Chen et al. (2012);
Sinchaipanit et al. (2013) and Barba et al. (2010). Chen et al. (2012) concluded
that there was higher viscosity and low stability of particles dispersion during the
refrigerated storage. From Sinchaipanit et al. (2013) it is obvious that, after
HTST, there was low β-carotene content in reduced-calorie carrot juice, while
Barba et al. (2010) detected decrease of ascorbic acid in blended beverage.
3) MTLT (temperature <80°C and holding times >30 s), Petruzzi et al.
(2017) was evaluated by Sinchaipanit et al. (2013); Aguiló-Aguayo et al. (2014);
Profir & Vizireanu (2013) and Dima et al. (2015). Huge holding of β-carotene
capacity and production of a non satisfactory cooked flavor is expected when
pretreating carrots for 30 min at 65°C (Sinchaipanit et al., 2013). Juices processed
at low temperatures of 20°C demonstrated an improvement on both falcarinol and
falcarindiol-3-acetate contents with increasing the processing time up to 10 min
in comparison with untreated juices. In comparison, longer processing times of 30
and 60 min did not affect the polyacetylene levels of the samples (Aguiló-Aguayo
et al., 2014). Huge deficits of vitamin C, along with low increase of acidity
throughout the consequent storage for 2 weeks at 4°C was found while processing
carrot, celery and beetroot on MTLT (Profir and Vizireanu, 2013). Further,
according to Dima et al., (2015) MTLT (70 °C/10 min) before creating carrot
juice blend had negative influence on flavor and flavonoids during the
refrigerated storage for 14 days.
4) MTST heat processing uses temperatures <80°C and holding times
equal or less than 30s. Still, MTST treatment can affect the physicochemical,
olfactory and functional properties of beverages, especially color and flavor in a
carrot/orange juice blend (Caminiti et al., 2011). There are some new thermal
technologies next to the common thermal processing that have been studied as
alternative methods to heat treatment (Mercali et al., 2015).
An encouraging method is microwave heating (MWH) because of its
advantages like: the decreased processing time, great energy efficiency, a good
process menagement, and space saving (Salazar-González et al., 2014). As it can
be seen in Rayman and Baysal (2011) carrot pretreatment at 540-900W during
4min at the temperature lower than 90°C results in total inactivation of PME.
One other alternate procedure to heat treatment is ohmic heating (OH).
Jakób et al. (2010) concluded that there is destabilization of the labile isozyme
fraction of POD after carrot tretement 6 to 1500 min at temperature between 58
and 78°C. In the study of Profir and Vizirean (2013) carrot, celery and beetroot
juice blend was investigated after OH of raw vegetables at 17.5V/cm3 to 4 min at
70°C. They noticed low loss of ascorbic acid throughout the refrigerated storage
for 2 weeks.
Finally, Dima et al. (2015), who also used OH, found no negative
influence on flavor of carrot and other vegetables juice blend. Just produced and
thermally untreated carrots juice should be used up in a period of 1-2 days,
because it can be a good source of nourishment for microorganisms (Hag and
Pejatović et al 200
Prasad, 2015). Carrot juice is thought to be a fine growth medium for
Lactobacillus strains. In carrots juice L. rhamnosus and L. bulgaricus
demonstrated meaningful growth and reached about 109 cfu ml-1
at the end of
fermentation. Furthermore, these 2 Lactobacillus strains showed important
survival at low pH (43.5) during 30 days of storage (Nazzaro et al., 2008).
Yoghurt
Yoghurt has high nutritive and advantageous effects on people and it is one
of the favorite fermented milk which is produced worldwide. Because of the
addition of fruit and vegetable flavored yoghurt production and consumption of
yogurt has increased during the last quarter of XX century. Addition of fruits and
vegetables to the yogurt makes it a good prebiotic, although these agents also act
as flavouring and coloring agents as well as antioxidants (El Samh et al., 2013).
Presently researchers are working on usage of carrot juice in making yoghurt. The
goal is to offer assortment and competition in the market (Schieber et al., 2002;
Simova et al., 2004). When blended yogurt and carrots juice give very nutritive
food (Ikken et al., 1998; Raum, 2003). This kind of yogurt can boost consumer’s
satisfaction because of the pleasant characteristics, viable lactic acid bacteria and
β-carotene advancement (Amany et al., 2012). On the Figure 1. Steps in
preparation of carrot yogurt (According to: Salwa et al., 2004) there is a flow
chart that shows how an outstanding carrot yogurt could be prepared. Cow’s milk
for this research was collected from Fayoum district, Egypt (Salwa et al., 2004).
Preparation of carrot yoghurt has also been investigated by other authors
all over the world: Cliff et al. (2013); El Samh et al. (2013); Ayar and Gurlin
(2014); Agarwal and Prasad (2013) and others. Unlike the Salwa et al. (2004)
four levels of carrot juice in yoghurt (8, 16, 24, and 32%) were tested by Cliff et
al. (2013). The study investigated Canadian probiotic unsweetened yogurt, its
sensory properties and consumer acceptance. Still, beside this, the research
explored characteristics and antioxidant capacity of this yoghurt flavored with
black carrot (El Samh et al., 2013). In this research, pH value of the yogurt was
decreased by flavoring it with black carrot. That proves that black carrot
stimulates the starter microorganisms and Befidobacterium lactis B12. In
addition, viscosity of yoghurt was decreased after 10 days of cold depository.
This yoghurt obtained 97.3 points in average acceptability by consumers.
Flavoring ingredients, in this case black carrot increases total phenolics content in
yogurt (El Samh et al., 2013). The black carrot was used to improve yoghurt in
Ayar and Gurlin (2014) research as well (Figure 2. The production flow chart for
flavored spreadable yoghurt (According to: Ayar and Gurlin 2014)).
Next study was accomplished to evaluate the results of stabilizer on the
sensory properties including microbial analysis of low-fat frozen yogurt with
carrot pulp in the amount of 2%, 3%, 4% and 5% (Agarwal and Prasad, 2013).
The conclusion from the results was that the this yoghurt with 3% carrot pulp,
0.5% stabilizer (T3S3) and 4% carrot pulp, 0.5% stabilizer (T4S3) are high in
comparison with other treatments.

Chemical charactetization, nutritional benefits and some processed products... 201
The typical value of yeast and mould count of different treatment of
yoghurt was less than 10/g. It brings to mind that all the samples were of the best
quality. Study of the effect of carrot juice on exopolisaccharides (EPS) and β-D
galactosidase activity in yogurt (Radiati et al., 2016) demonstrated that the carrot
juice highly affects lactic acid amount, pH value, viscosity, β-carotene, EPS, β-D-
galactosidase activity, but doesn´t affect significantly on the number of bacteria.
During the research the carrot juice increased the yogurt culture activity by
increasing acidifying, β-carotene, EPS and β-D-galactosidase, which imply that
yogurt could be reinforced with carrot juice.
Smoothie
Making smoothies which included carrots was reported by Andrés et al.
(2016a), Andrés et al. (2016b), Andrés et al. (2016c) and Arjmandi et al. (2016).
Conventional thermal processing at high temperature-long time was used
in studies of Andrés et al. (2016a), Andrés et al. (2016b) and Andrés et al.
(2016c). Carrots were treated at 80°C during 3 min, and after that, smoothie with
carrot, melon, orange and papaya was prepared. The color degradation was
noticed in Andrés et al. (2016a). Andrés et al. (2016b) observed carrot, melon,
orange and papaya smoothie with soymilk added. Heat treatment did not produce
any major variations in bioactive compounds. The bioactive compounds of
treated smoothies were relatively stable after 45 days of refrigerated storage
compared to the fresh product, although the loss of ascorbic acid resulted in
decreased antioxidant capacity. Carrot, melon, orange and papaya smoothie with
skim milk was made by Andrés et al. (2016c). Total reduction in microorganisms
was noticed as well as aroma and acceptability scores were significantly
decreased.
Alternative thermal processing – microweave heating, was applied in
treatment of carrots during a carrot, lemon, pumpkin and tomato smoothie
production (Arjmandi et al., 2016) and the major findings were: 1) increase of the
contents of total phenolic compounds and carotenoids, 2) the highest power and
the shortest time MWH treatments (3600W for 93 s), resulted into better
preservation of antioxidant capacity and vitamin C, and 3) no L. monocytogenes
growth.
Milk
In the study of Shin et al. (2013) were compared the organoleptic and other
qualities of fermented milk having 10 or 15% purple carrot extract previously
fermented with Aspergillus oryzae or not fermented. In 15% purple carrot extract
fermented with Aspergillus oryzae viable cell count were significantly higher in
comparison with the control after fermentation. Extract of purple carrot fermented
with Aspergillus oryzae showed a lower red value and higher yellow value in
comparison with non-fermented purple carrot extract because of heat-
sterilization. From the sensory judgment, 15% purple carrot extract fermented
with Aspergillus oryzae gained most of the points. To conclude, the best product
Pejatović et al 202
was made by adding 15% of purple carrot extract fermented with Aspergillus
oryzae (Shin et al., 2013).
5.2. Jam and jelly
Jams are valuable food products which contain sugars in high
concentrations (Habiba and Mehaia, 2008). Jam is gelatinous food product,
obtained by cooking of fruits or vegetables pulp with sugar, citric acid and pectin.
In addition, jam can be described as a food with intermediate moisture content
and can be done by fruit or vegetable pulp being cooked with sugar, pectin, citric
acid and additional additives to a sensibly texture. It shall contain at least 65%
total soluble solid (TSS) and more than 45% pulp (Manay and
Shadaksharaswamy, 2005). During the jam fabrication sucrose is used as a main
sugar. All along the production sucrose is inverted to fructose and glucose and it
is acceptable to invert 30-40% (Habiba and Mehaia, 2008).
There are two kind of jams: first one is manufactured from pulp of single
fruit and the other one is processed by mixing two or more fruits pulp (Manay
and Shadaksharaswamy, 2005). Jam of excellent quality has a creamy even
consistency without distinct bits of fruit, a shining color, nice flavor and a semi-
coagulated texture. The texture is easy to extend but it is without free liquid
(Nalinde et al., 2018). Carrot like an excellent point of supply of carotene can be
treated into jam as well (Habiba and Mehaia, 2007). Several scientist (Ullah et al.,
2018; Nalinde et al., 2018; Habiba and Mehaia, 2008; Roy et al., 2017) were
analyzing different jams including carrot jam or carrot jam blends with other
fruits/vegetables. The research of Ullah et al., (2018) was done to analysis the
jam treatments which were CA0 (carrot pulp 100%), CA1 (carrot pulp 90% +
apple pulp 10%), CA2 (carrot pulp 80% + apple pulp 20%), CA3 (carrot pulp
70% + apple pulp 30%), CA4 (carrot pulp 60% + apple pulp 40%) and CA5
(carrot pulp 50% + apple pulp 50%). During physicochemical and sensory
analysis it was found that CA5 carrot, apple (5:5) followed by CA4 carrot, apple
(6:4) were of good qualities among the treatments. In order to provide health
benefits to the customers carrots can be combined with sweet potato in jam
production. This jam was found as overall accepted by consumers (Nalinde et al.,
2018) (Figure 3. Flowchart for sweet potato jam blended with carrots (According
to: Nalinde et al. 2016)).
In other study (Habiba and Mehaia, 2008), during the carrot jam
preparation, sugars were replaced with date paste (0, 25, 50 and 75%) and the
acquired data showed that by doing so the jam ash was increased as well as
protein, total crude fiber and minerals (Ca, Mg, K, Mn, Fe and Zn), and that Na
content was lowered. Roy et al. (2017) concluded that carrot jam might be
manufactured by using extracted pomelo peel pectin.
Jelly can be made of sugar, citric acid and pectin before adding fruit extract
and it´s boiling. Jelly must include minimum 65% of TSS and minimum 45% of
fruit fraction (Singh and Chandra, 2012). Research was done to create the fruit
jelly by the usage of different levels of guava extract and carrots juice (75:25,

Chemical charactetization, nutritional benefits and some processed products... 203
50:50 and 25:75). 75:25 ratio got the best total points for overall acceptability of
the jelly and it was awarded as 7.8. In conclusion, the best quality jelly was
prepared prepared with guava extract and carrot juice ratio of 75:25 (Singh and
Chandra, 2012). Nho et al. (2013) determined the properties and features of jelly
in which was added black carrot extract. Their conclusion was that this procedure
whit 0.15% ascorbic acid+0.05% NaCl added was excellent soft jelly production.
5.3. Carrot chips
Currently, an accelerated increase in the utilization of snack food has been
detected, particularly the snack food from fruits and vegetables (Hiranvarachat et
al., 2011), in addition, it has been detected an increasing request for dried
products that contain most of their authentic properties (Zheng-Wei et al., 2008)
even though they have to experience high temperature and high pressure
procedure. During this process it is possible that important degradation of
advantageous nutrients is happening (Yi et al., 2018). Chips is considered as one
of the most popular snacks. There are two kinds of chips: fried and non-fried
chips (Yi et al., 2018). In this moment, a diversity of technologies are developed
for restructured chips production, such as extrusion, vacuum frying, freeze-drying
and other (Yi et al., 2018).
a.Dehydrated non-fried carrot chips
Best quality of the dried food is characterized by high rehydration, lower
bulk mass, small shrinkage, and the high holding of colour and bioactive materies
(Zheng-Wei et al., 2008). A lot of drying technologies can be applied in order to
get dried carrots without the loss of their with the goal of maintaining their
characteristics and nutritive value (Hiranvarachat et al., 2011). The accepted
drying methods which are applied for fruits and vegetables are: air drying, solar
drying, vacuum drying and freeze drying (Shyu and Hwang, 2011). As opposed
to other, freeze-dried products have superior characteristics like super crispness,
high retention of nutrients, and minimum shrinkage (Yi et al., 2018). Still, it is
accepted that freeze-dried products have superior characteristics: they keep color,
aroma, and supplements, good taste, low bulk density, high porosity, better
rehydration characteristics in comparison with foods that have passed some of the
following drying methods: hot air, vacuum, microwave, and osmotic dehydration
(Zheng-Wei et al., 2008). From above mentioned we can see that freeze-drying
has a lot of benefits but there is one big problem - long drying time which causes
high energy consumption and bigger production costs (Yi et al., 2018). Because
of the higher price of this method, it is used for the production of a smaller
quantity of superior food and pharmaceutical products (Zheng-Wei et al., 2008).
Major concern within this method is cutting down of the running costs
without disturbing the products quality (Zheng-Wei et al., 2008). This can be
easily done by connecting it with some of other drying technologies (Yi et al.,
2018). For instance, freeze-drying combined with instant controlled pressure drop
drying for making restructured carrot-potato chips: optimized by response surface

Pejatović et al 204
method,was the study conducted by Yi et al., 2018. as well as a study of
combined microwave-vacuum and freeze drying of carrot chips that was
conducted by Zheng-Wei et al., (2008). Impact of various drying temperatures on
the value of dehydrated tiny carrot pieces was investigated by Quartulane et al.,
(2015). Results show that beta-carotene is not resistant to heat and the quality of
foods depends significantly on drying temperature and pre-treatment. It is proven
that during the hot air drying there is the highest loss of total carotene (29.4%)
(Zheng-Wei et al., 2008). Suman and Krishna Kumari, (2002) found that there
was 71% loss of beta-carotene during sun drying, 52% in solar cabinet drying and
42% hot air cabinet drying.
At first moisture contents of the restructured chips varied from 10.08 g/g
to 7.23 g/g with lowering of the amount of carrots from 70% to 30% (Yi et al.,
2018). Initial moisture contents of the restructured chips were varied from 10.08
g/g to 7.23 g/g with reducing of the amount of carrot from 70% to 30% (Yi et al.,
2018). Preparation and quality evaluation of dehydrated carrot slices was also
carried out by Gupta and Shukla (2017). From the obtained results, it was found
that the Vitamin A content decreased with increase in temperature as well as
during storage period. Mondhe et al. (2017) conducted the study on osmotic
dehydration of carrot slices and Planinić et al. (2005) studied modelling of drying
and rehydration of carrots using Peleg's model.
b.Deep-fried carrot chips
During the year of nineties, carrot chips has been developed by numerous
researchers (Slinde et al., 1993; Aukrust et al., 1994, 1995; Baardseth et al., 1995,
1996; Skrede et al., 1997) by means of lactic-acid fermentation (sugar reduction
process) and deep-frying in palm oil. Afore mentioned type of fermentation is
essential for the chips production having in mind already acquired routines and
experience in its performance. However, production process has not been yet
fully scientifically treated beyond lactic-acid fermentation and using various
temperatures and oils (Sulaeman et al., 2001).
Skrede et al. (1997) discovered that the carotenoids content in carrots
remained at the approximately same level as before the production process of
chips. Being beneficial to human nourishment, possible increase of the source of
provitamin A might be expected due to the frying process in palm oil which
contains lipids. Carotenoids content of deep-fried carrots chips in the present
study of Sulaeman et al. (2001) were (mg/100 g w/w) lutein, 1964 - 2480; alpha-
carotene, 10832 - 15573; beta-carotene, 28958 - 37156; and tentatively identified
cis-9-beta-carotene, 9468 - 17987. Presence of cis-9-beta-carotene in the deep-
fried carrots chips was also found by Skrede et al. (1997).
Observation of the lactic acid fermentation and its effects on properties of
above mentioned product, was conducted in 1993. by Slinde et al.. Colour
characteristics were at its maximum when carrot chops were fermented during 24
hours before deep-frying. Amount of reducing sugars was 75% lower after lactic
acid fermentation of carrots chops. In 2003. Sulaeman et al. wrote an article
Chemical charactetization, nutritional benefits and some processed products... 205
about different values of deep-fried carrots chips properties, one among them –
carotenoids content.Shyu & Hwang (2011) described development of vaccum
frying of carrots slices by central combined rotatable design. This study showed
that temperature optimum for this process is from 100 to 105°C and that time
optimum from 16 to 20 minutes.
c.Whole grain carrot chips
Norazmir et al. (2014) generated whole grain carrots chips. They pointed
out some key data: in 5.00g of the sample of above mentioned product there is
17.573 ± 5.099 percentage of ash, in 2.00g 10.55 ± 2.192 percentage of fat, in
1.00g 7.5 ± 0.141 percentage of unrefined fibers. When it comes to advised fiber
consumption, which is 3g per 100g, in above mentioned product there is 7.359 -
7.641g per 100g.
5.4. Carrot seeds
In carrots seeds there are dissimilar compounds in comparison with raw
carrots (Seifert et al., 1968). It is known that they contain lots of Ca, P, K, Na,
Mg and Al (Özcan and Chalchat, 2007) and carotene which improves
lactoperoxidase system microbial activity (Hayashi et al., 2013).
a.Carrot seed oil
According to Emir et al. (2014) cold pressing is the best way to obtain
edible carrots seed oil because it is uncomplicated, inexpensive and accessible.
Oils obtained in this way are without chemicals, durable, with essential flavor and
they contain all bioactive compounds. Further, they have excellent marks by
consumers.
In the studies of Özcan and Chalchat (2007) and Parker et al. (2003) some
of the properties of carrots seed oil are given: relative mass, unsaponifiable matter
content, peroxide and acidity values and fatty acid formation. It is well known
that petroselinic acid is ruling and most important fatty acid in Apiaceae family
which it is valuable for the industry (Dutta, 1992).
There are fourteen compounds in carrots seed oil found by Özcan and
Chalchat (2007) among them: carotol and daucol. Jasika-Miaska et al. (2005)
classified thirtythree components by GC-MS in carrots seed oil with majors:
carotol and β-caryophyllene. Together with daucol they composed 51.5 percent of
this oil. According to Gonny et al. (2004) carrots oil from Corsica contains
methylisoeugenol, α-pinene and elemicin as main compounds.
b.Essential carrot seed oil
Steam distillation is a process of derivation of essential oils, which are mix
of secondary metabolites (Calsamiglia et al., 2017), and which vary in their
concentration in plants depending on the plants vegetation cycle, as shown in
Damjanović-Vratnica et al. (2011) who found that amount of essential oil
obtained from Satureja montana L. was higher in May (1.9% w/w) than in

Pejatović et al 206
August (1.1% w/w). Also, from the common phytochemical observations and
from the results of Damjanović-Vratnica et al. (2016a) it is clear that the
preprocessing of plant material plays a significant aspect when it comes to
chemicals that the essential oil consists of.
When it comes to the carrots seed essential oil it is extracted from the
seeds of carrots and must not be mixed up with the inexpensive macerated -
carrot oil made by soaking the carrots material in a base oil (Staniszewska and
Kula, 2001). There is 0.59% of essential oil in fresh carrot material (Kataria et
al., 2016) and it is yellow in color (Özcan and Chalchat, 2007). There are 34
compounds found in this essential oil (Özcan and Chalchat, 2007). According to
Özcan and Chalchat (2007) main components of carrots seed essential oil were
carotol (66.78%) and daucene (8.74%). The major compounds identified by in
carrot oil were isoprene (84%), caryophyllene (47%) and linalool (38%). Some
scientists have found that main compound of carrot seed oil is carotol (Seifert et
al., 1968; Özcan and Chalchat, 2007). Also, according to Schaller and Schnitzler
(2000), the oil collected from the air dried seed essential oil of Daucus carota L.
consist of α- terpinolene, β-caryophyllene, α-pinene, myrcene, α- terpinene and
limonene. Aćimović et al. (2016) found out that wild carrot grown in Serbia
contained 1.67% of essential seed oil and the cultivated one contained 0.55%.
Also, they identified 34 compounds in wild carrot seed essential oil and 51 in
cultivated carrot seed oil compounds through GC-MS analyses. When it comes to
wild carrot, GC-MS examination of seeds essential oil showd sabinene (40.9%)
and α-pinene (30.1%), followed by β-bisabolene (6.2%), β-pinene (5.7%) and
trans-caryophyllene (5.3%), as major components, but when it comes to
cultivated ones it is found that carotol (22.0%), sabinene (19.6%) and α-pinene
(13.2%) are the major compounds.
The combination of beta-farnesene and sesquisabinene consists of 8.2%,
the load of trans-caryophyllene is 5.7% and the content of myrcene is 4.7%
(Aćimović et al., 2016). According to Özcan and Chalchat, (2007) the carrots
seed essential oil yield of cultivated carrots in Turkey was 0.83% and the main
component was carotol (66.78%). G-C analysis of the essential carrots seed oil
was performed by Ksouri et al. (2015). Carrots seed essential oil had a yield of
3% and carrots folium essential oil had a yield of 2.1%.
Isolation of carrots essential oil was also done by Glišić et al. (2007). They
used supercritical carbon dioxide procedure. On the other hand, Abdulrasheed et
al. (2015) used soxlet extractor. The colour of extract was yellow and brown in
the same time. Authors give the % of yield which was 23,4 and some other
chemical properties of obtained oil which was then used for medical soap
production. It is shown than this soap can be effective in curing infection caused
by Trichophyton rubrum. In comparison with regular medical soaps above
mentioned soap was found to be more effective when it comes to infections
caused by fungi. This is can lead to minimized costs for soaps preservatives.

Chemical charactetization, nutritional benefits and some processed products... 207
c.Effects of carrot seed extract, edible oil and essential oil
Vasudevan et al. (2006) confirmed antinociceptive and antiinflammatory
characteristics of wild carrots seeds extract and Rao and Reedy (2013) showed
hypoglycaemic and antidiabetic properties of these extracts. It also showed
antioxidative and anticancer properties (Shebaby et al., 2013). Different analyses
(DPPH and TBARS) showed that wild carrot seed essential oil is good
antioxidant and should be recommended as an added ingredient in food and in
pharmaceutical industries (Ksouri et al., 2015). Antioxidant characteristics of
cold-pressed carrot seed oil was reported by Yu et al. (2005) while antifungal
activity of the carrot seed oil and its main sesquiterpene components were
investigated by Jasica-Misiak et al. (2014).
Essential oils show antimicrobial properties (Damjanović-Vratnica et al.
2016b, Damjanović-Vratnica et al. 2016c, Bošković et al. 2018, Perovic et al.
2019). Due to the high degree of bacterial resistance to conventional antibiotics,
new alternative agents are constantly being explored overcoming this problem.
Many studies indicate that essential oils and extracts from plants are a good
source of bioactive compounds that show antimicrobial activity against many
pathogens. The antimicrobial effect of essential oils and extracts of plants is
associated with the content of flavonoids, terpenoids and phenols (Perović et al.
2018). The antimicrobial potential of Satureja sp. and Mentha sp. from
Montenegro was indicated in investigations by Damjanović-Vratnica et al.
(2011), Božović et al. (2015). Significant antimicrobial activity of carrots against
Staphylococcus aureus, Candida albicans and Alternaria alternate has also been
reported (Jasicka-Misiak et al., 2004; Imamu et al., 2007).
CONCLUSIONS
We can conclude that carrots are an indispensable part of human nutrition
and that they can be classified as functional food due to their rich chemical
composition (β-carotene, vitamins and minerals). They can be consumed raw or
in the form of beverages, jam, jelly or carrots chips. It is proven that processed
carrots in a form of carrots chips are also rich in β-carotene and, when it comes to
whole grain carrot chips, in dietary fibers. Carrots edible seed oil and carrots
essential seed oil can also be used.
REFERENCES Abdulrasheed, A., Aroke, U. O., & Sani, I. M. (2015). Parametric studies of carrot seed
oil extract for the production of medicated soap. International journal of recent
development in engineering and technology, 4(1), 1-5.
Aćimović, M., Stanković, J., Cvetković, M., Ignjatov, M., & Nikolić, Lj. (2016).
Chemical characterization of essential oil from seeds of wild and cultivated carrots
from Serbia. Botanica serbica, 40(1), 55-60.
Agarwal, S., & Ranu, P. (2014). Effect of stabilizer on sensory characteristics and
microbial analysis of low-fat frozen yoghurt incoporated with carrot pulp.
International journal of agriculture and food science technology, 4(8), 797-806.
Pejatović et al 208
Aguiló-Aguayo, I., Soliva-Fortuny, R., & Martín-Belloso, O. (2010). Colour and viscosity
of watermelon juice treated by high-intensity pulsed electric fields or heat.
Innovative food science and emerging technologies, 11, 299–305.
Ahmad, T., Cawood, M., Batool, A., Tariq, R. M. S., Ghani M. A., & Azam, M. (2017).
Phytochemicals in Daucus carota and their importance in nutrition – Review
article. PeerJ Preprints, 40 pages.
Alabran, D. M., Moskowitz, H. R., & Mabrouk, A. F. (1975). Carrot root oil components
and their dimensional characterization of aroma. Journal of agriculture and food
chemistry, 23, 229-232.
Ali, M., & Dr. Abedullah (2002). Nutritional and economic benefits of enhanced
vegetable production and consumption. Journal of crop production, 6(1/2), (11/12),
145-176.
Al-Snafi, A. M. (2017). Nutritional and therapeutic importance of Daucus carota - A
review. IOSR Journal of pharmacy, 7(2), 71-88.
Amany, E. E., Hany, A., Abou, G., Hamida, M. M., Mousa, M., & Youssef, M. M.
(2012). Mixes of carrot juice and some fermented dairy products potentiality as
novel functional beverages. Journal of food and nutritional sciences, 3, 233-239.
Amanyunose, A. A., Abiodun, O. A., Adegoke, G. O., & Dauda, A. O. (2017). Changes
in the quality characteristics of carrot juice preserved with Aframomumdanielli
seed extract. Croatian journal of food technology, biotechnology and nutrition,
12(3-4), 131-136.
Andrés, V., Mateo-Vivaracho, L. E. G., MY, V., & Tenorio, M. (2016a). High hydrostatic
pressure treatment and storage of soy-smoothies: colour, bioactive compounds and
antioxidant capacity. LWT - Food science and technology, 69, 123–30.
Andrés, V., Villanueva, M. J., & Tenorio, M. D. (2016b). The effect of high-pressure
processing on colour, bioactive compounds, and antioxidant activity in smoothies
during refrigerated storage. Food chemistry, 192, 328–35.
Andrés, V., Villanueva, M. J., & Tenorio, M. D. (2016c). Influence of high pressure
processing on microbial shelf life, sensory profile, soluble sugars, organic acids,
and mineral content of milk- and soy-smoothies. LWT - Food science and
technology, 65, 98–105.
Arjmandi, M., Otón, M., Artés, F., Artés-Hernández, F., Gómez, P. A., & Aguayo, E.
(2016). Semi-industrial microwave treatments positively affect the quality of
orange-colored smoothies. Journal of food science and technology, 53, 3695–703.
Arscott, S. A., & Tanumihardjo, S. A. (2010). Carrots of many colors provide basic
nutrition and bioavailable phytochemicals acting as a functional food.
Comprehensive reviews in food science and food safety, 9, 223-239.
Aukrust, T., Blom, H., & Slinde, E. (1995). Influence of brine composition on yield and
quality of deep fried fermented carrot chips. Lebensmittel wissenschaft und
technologie, 28(1), 100-104.
Aukrust, T., Blom, H., Sandtorv, B., & Slinde, E. (1994). Interaction between starter
culture and raw material in lactic acid fermentation of sliced carrot. Lebensmittel
wissenschaft und technologie, 27(4), 337-341.
Ayar, A., & Gürlin, E. (2014). Production and sensory, textural, physicochemical
properties of flavored spreadable yogurt. Life science journal, 11(4), 58-65.
Baardseth, P., Rosenfeld, H. J., Sundt, T. W., Skrede, G. Lea, P., & Slinde, E. (1995).
Evaluation of carrot varieties for production of deep-fried carrot chips: I. Chemical
aspects. Food research international, 28(3), 195-200.
Chemical charactetization, nutritional benefits and some processed products... 209
Baardseth, P., Rosenfeld, H. J., Sundt, T. W., Skrede, G., Lea, P., & Slinde, E. (1996).
Evaluation of carrot varieties for production of deep-fried carrot chips: II. Sensory
aspects. Food research international, 28(6), 513-519.
Banga, O. (1957) . The development of the original European carrot material. Euphytica,
6, 64-76 .
Barba, F. J., Esteve, M. J., & Frigola, A. (2010). Ascorbic acid is the only bioactive that is
better preserved by high hydrostatic pressure than by thermal treatment of a
vegetable beverage. Journal of agriculture and food chemistry, 58, 10070–5.
Bošković, I., Đukić, D., Mašković, P., Mandić, L., Perović, S., Govedarica Lučić, A., &
Malešević, Z. (2018) Mineral composition of plant extracts from the family
Boraginaceae. Archives for Technical Sciences, 19(1), 85-90.
Boskovic, I., Đukić, D.A., Maskovic, P., Mandić, L., & Perović, S. (2018) Phytochemical
composition and antimicrobial, antioxidant and cytotoxic activities of Anchusa
officinalis L. extracts. Biologia 73, 1025-1042.
Božović, M., Pirolli, A., Ragno, R. (2015). Mentha suaveolens Ehrh. (Lamiaceae)
essential oil and its main constituent piperitenone oxide: biological activities and
chemistry. Molecules 20(5), 8605-8633.
Bradeen, J. M., & Simon, P. W. (2007). Carrot. In: Kole C. (ed). Genome mapping and
molecular breeding in plants. Berlin, Germany: Springer-Verlang, 161–184.
Calsamiglia, S., Busquet, M., Cardozo, P. W., Castillejos, L., & Ferret, A. (2017). Invited
review: essential oils as modifiers of rumen microbial fermentation. Journal of
dairy science, 90, 2580-2595.
Caminiti, I. M., Noci, F., Munoz, A., Whyte, P., Morgan, D. J., & Cronin D. A. (2011).
Impact of selected combinations of non-thermal processing technologies on the
quality of an apple and cranberry juice blend. Journal of food chemistry, 124,
1387–9.
Char, C. D. (2018). Carrots (Daucus corota L), fruit and vegetable phytochemicals. In:
Chemistry and Human Health (Ed. E.M. Yahia), Second Edition, John Wiley &
Sons, Inc., 111 River Street, Hoboken, NJ 07030, USA, 969-978.
Chen, C., Zhao, W., Yang, R., & Zhang, S. (2012). Effects of pulsed electric field on
colloidal properties and storage stability of carrot juice. International journal of
food science and technology, 47, 2079–85.
Cliff, M. A., Fan, L., Sanford, K., Stanich, K., Doucette, C., & Raymond, N. (2013).
Descriptive analysis and early-stage consumer acceptance of yogurts fermented
with carrot juice. Journal of dairy science, 96, 4160–4172.
Damjanović-Vratnica, B., Perović, A., Šuković, D., & Perović, S., (2011) Effect of
vegetation cycle on chemical content and antibacterial activity of Satureja
montana L. Archives of Biological Sciences, 63 (4), 1173-1179.
Damjanović-Vratnica, B., Perović, S., Lu, T., & Santos R. (2016a) Effect of matrix
pretreatment on the supercritical CO2 extraction od Satureja montana essential oil,
Chemical industry and chemical engineering quarterly, 22(2), 201-209.
Damjanović-Vratnica, B., Šuković, D., & Perović, S. (2016b) Essential oil components
and antimicrobial activity of peppermint (Mentha piperita) from Montenegro,
Agriculture & Forestry, 62(1), 259-268.
Damjanovic-Vratnica, B., Perović, S., & Lepojević Ž. (2016c) Supercritical fluid
extraction of fennel (Foeniculum vulgare Mill.) seed from Montenegro:
antimicrobial activity, Supercritical fluid applications, Publisher: New Chemical
Syntheses Institute, Pulawy, 61-74.

Pejatović et al 210
Dereli, U., Türkyilmaz, M., Yemiş, O., & Özkan, M. (2015). Effects of clarification and
pasteurization on the phenolics, antioxidant capacity, colour density and polymeric
colour of black carrot. (Daucus carotaL.) juice. Journal of food biochemistry, 39.
528–37.
Dima, F., Istrati, D., Garnai, M., Serea, V., & Vizireanu, C. (2015). Study on obtaining
vegetables juices with high antioxidant potential, preserved by ohmic
pasteurization. Journal of agroalimentary processing and technologies, 21, 67–74.
Dutta, P. C. (1992). Incorporation of [14 C] acetate in different lipid classes and in the
fatty acids of triacylglycerols in somatic embryos and cotyledon slices of Daucu
scarota L. Swedish journal of agricicultural research, 22, 117-123.
Dutta, P. C., & Appelqvist, L. A. A. D. (1989). The effects of different cultural conditions
on the accumulation of depot lipids, notably petroselinic acid, during somatic
embryogenesis in Daucus carota L. Plant science. Lime Rick, 64, 167-177.
El Samh, M. M. A, Sherein, A. A. D., & Essam, H. H. (2013). Properties and antioxidant
activity of probiotic yoghurt flavored with black carrot, pumpkin and strawberry.
International journal of diary science, 8(2), 48-57.
Emir, D. D., Guneser, O., & Yılmaza E. (2014). Cold pressed poppy seed oils: sensory
properties, aromatic profiles and consumer preferences. Grasas y aceites, 65(3), 13
pages.
Ergun, M., & Süslüoğlu, Z. (2018). Evaluatin carrot as a functional food. Middle East
journal of science, 4(2), 113-119.
Faiku, F., Buqaj, L., & Haziri, A., (2019) Phytochemicals and antioxidant study of
Teucrium chamaedrys (L.) plant. Agriculture & Forestry, 65(1), 137-145.
Glišić, S.B., Mišić, D. R., Stamenić, M. D. Zizovic, I. T, Ašanin R. M., & Skala, D. U.
(2007). Supercritical carbon dioxide extraction of carrot fruit essential oil:
Chemical composition and antimicrobial activity. Food chemistry, 105(1), 346-
352.
Gonny, M., Bradesi, P., & Casanova, J. (2004). Identification of the components of the
essential oil from wild Corsican Daucus carota L. using 13C-NMR spectroscopy.
Flavour and fragrance journal, 19, 424-433.
Gopalan, C., Ramasastry, B. V., & Balasubramanian, S. C. (1991). Nutritive value of
Indian foods (NVIF). Revised and updated by Narasinga Rao, B. S. Deosthala, Y.
G. & Pant, K. C. (Reprinted 2007, 2011). National Institute of Nutrition,
Hyderabad, (India).
Gupta, N., & Shukla, R. N. (2017). Preparation and quality evaluation of dehydrated
carrot and onion slices. Journal of food processing technology, 8(9), 6 pages.
Habiba, R. A., & Mehaia, M. A. (2007). Improving carrot jam characteristics and its
nutritional value by using date paste instead of sugar. Journal of agricultural and
veterinary sciences, Qassim University, 1(1), 13-18.
Haq, R. U., & Prasad, K. (2015). Nutritional and processing aspects of carrot (Daucus
carota) - A review. South Asian journal of food, technology and environment,
1(1): 1-14 .
Hashidoko, Y., Tahara, S., & Mizutani, J. (1992). Sesquiterpene hydrocarbons in
glandular trichome exudate of Rosa rugosa leaves. Zeitschrift für naturforschung,
47c, 353-359.
Hayashi, M., Naknukool, S., Hayakawa, S., Ogawa, M., & Ni'matulah, A. B. A. (2012).
Enhancement of antimicrobial activity of a lactoperoxidase system by carrot
extract and β-carotene. Journal on food chemistry, 130, 541-546.
Chemical charactetization, nutritional benefits and some processed products... 211
Heywood, V. H. (1983). Relationships and evolution in the Daucus carota complex.
Israel journal of ecology and evolution, 32, 51-65.
Hiranvarachat, B., Devahastin, S., & Chiewchan, N. (2011). Effects of acid pretreatments
on some physicochemical properties of carrot undergoing hot air drying. Food and
bioproducts processing, 89(2), 116-127.
Holland, B., Unwin, J. D., & Buss, D. H. (1991). Vegetables, herbs, and spices. Fifth
Supplement to McCance and Widdowson's The Composition of Foods. London,
(UK).
Hong, H., Nguyen, V., & Nguyen, L. T. (2015). Carrot processing. In: Handbook of
Vegetable Preservation and Processing, Second Edition, 449-466.
Ikken, Y., Cambero, I., Marin, M., Martner, A., Hars, I., & Morales, P. (1998).
Antimutagenic effect of fruit and vegetable aqueous extracts against N-nitrosamine
evaluated by the Ames test. Journal of agriculture and food chemistry, 46, 5194–
5200.
Imamu, X., Yili, A., Aisa, H. A., Maksimov, V. V., Veshkurova, O. N., & Salikhov, S.,
(2007). Chemical composition and antimicrobial activity of essential oil from
Daucus carota sativa seeds. Chemistry of natural compounds, 43(4), 495-496.
Iorizzo, M., Senelik, D. A., Ellison S. L., Grzebelus, D., Cavagnaro, P. F., Allender, C.,
Brunet, J., Spooner, D. M., Deynzeand, A. V., & Simon P. W. (2013). Genetic
structure and domestication of carrot (Daucus carita sunsp. sativus) (Apiaceae).
American journal of botany, 100(5), 930-938.
Jakób, A., Bryjak, J., Wójtowicz, H., Illeová, V., Annus, J., & Polakovič, M. (2010).
Inactivation kinetics of food enzymes during ohmic heating. Food chemistry, 123,
369–76.
Janve, B., Prasad, K. K., & Prasad, K. (2014). Development of fibre rich functional
mango jam: Studies on its formulation. In: Lambert Academic Publishing,
Saarbrücken, Germany, 96.
Jasicka-Misiak, I., Lipok, J., Nowakowska E. M., Wieczoreka, P. P., Młynarzb, P., &
Paweł Kafarskia, P. (2005). Antifungal activity of the carrot seed oil and its major
sesquiterpene compounds. Zeitscrift für naturforschung, 59c, 791-796.
Just, B., Santos, C. F., Yandell, B., & Simon, P. (2009). Major QTL for carrot color are
positionally associated with carotenoid biosynthetic genes and interact epistatically
in a domesticated × wild carrot cross. Theoretical and applied genetics, 119, 1155-
1169.
Kalra, C. L., Kulkarni, S. G., & Berry, S. K. (1987). The carrot-a most popular root
vegetable. Indian food packer, 41, 46-73.
Karangwa, E., Khizar, H., Rao, L., Nishimiyimona, D. S., Foh, M. B. K., Li, L., Xia, S.
Q., & Zhang, X. M. (2010). Optimization of processing parameters for
clarification of blended carrot-orange juice and improvement of its carotene
content. Advance journal of food science and technoogy, 2(5). 268-278.
Kataria, D., Chahal, K. D., Kaur, P., & Kaur, R. (2016). Carrot Plant-A Potential Source
of High Value Compounds and Biological Activities: A Review. Proceedings of
the Indian national science academy, 82(4), 1237-1248.
Kjellenberg, L. (2007). Sweet and bitter taste in organic carrot. In: Introductory Paper at
the Faculty of Landscape Planning, Horticulture and Agricultural Science.
Swedish University of Agricultural Sciences, Alnarp, 1-46.
Ksouri, A., Dob, T., Belkebir, A., Krimat, S., & Chelghoum, C. (2015). Chemical
composition and antioxidant activity of the essential oil and the methanol extract
Pejatović et al 212
of Algerian wild carrot Daucus carotaL. ssp. carota. (L.) Thell. Journal of
materials and environmental science, 6(3), 784-791.
Manay, S. N., & Shadaksharaswamy, N. (2005). Foods, facts and principles. In: New age
international publishers, New Delhi, 197.
Marica, R., Baras, J., Vukašinović, M., & Maksimović, M. (2004). The examination of
parameters for lactic acid fermentation and nutritive value of fermented juice of
beetroot, carrot and brewer’s yeast autolysate. Journal of Serbian chemical society,
69(8–9), 625–634.
Marlett, J. A. (1992). Content and composition of dietary fiber in 117 frequently
consumed foods. Journal of American dietetic association, 92, 175–86.
Mercali, G. D., Gurak, P. D., Schmitz, F., & Marczak, L. D. (2015). Evaluation of non-
thermal effects of electricity on anthocyanin degradation during ohmic heating of
jaboticaba (Myrciaria cauliflora) juice. Food chemistry, 171, 200-5.
Mondhe, D. S., Shinde, S. E., & Deshmukh S. S. (2017). Studies on osmotic dehydration
of carrot slices. IRE Journals, 1(4), 35-41.
Nalinde, A., Mhaske, A., Bhagwat, N., Borale, S., & Jadhav, S. (2018). Development and
quality evaluation of “Sweet potato jam blended with carrot”. International journal
of science and research, 7(11), 109-112.
Nazzaro, F., Fratianni, F., Sada, A., & Orlando, P. (2008). Synbiotic potential of
carrotjuice supplemented with Lactobacillus spp. and inulin or
fructooligosaccharides. Journal of the Science of Food and Agriculture, 88, 2271–
2276.
Negi, P. S., & Roy, S. K. (2000). Effect of low-cost storage and packaging on quality and
nutritive value of fresh and dehydrated carrots. Journal of science food and
agriculture, 80, 2169-2175.
Nguyen, H. H. V., & Nguyen, L. T. (2015). Carrot processing. In: Handbook of vegetable
preservation and processing, Second edition, 449-478.
Nho, H. J., Jang, S. Y., Park, J. J. Yun, H. S., & Park S. (2013). Browning Prevention of
Black Carrot Extract and the Quality Characteristics of Jelly Supplemented with
Black Carrot Extract. Korean journal of food culture, 28(3), 293-302
Ninnart, C., Tangsuphoom, N., Prairahong, P., & Duangrat, V. (2007). Mixed vegetable
and fruit high fiber jelly drink: Effects of carrot, pineapple and pumpkin
proportions on physical, chemical and sensory characteristics. Thai journal of
agricultural science. 213-222.
Norazmir, M. N., Mastura, K. Syahrul Bariah, A. H. Naleena Devi, M. & Siti Sabariah, B.
(2014). Development of whole grain carrot (Daucus carota) chips. Current
research in nutrition and food science, 2(1), 26-32.
Özcan, M. M., & Chalchat, J. C. (2007). Chemical composition of carrot seeds (Daucus
carota L.) cultivated in Turkey: Characterization of the seed oil and essential oil.
Grasas y aceites, 58(4), 359-365.
Parker, T. D. ,Adams, D. A., Zhou, K. Haris, M., & Yu, L. (2003). Fatty acid composition
and oxidative stability of coldpressed edible seed oils. Journal of food science, 68,
1240-1243.
Pejatović, T., Samardžić, D., & Krivokapić, S. (2017) Antioxidative properities of a
traditional tincture and several leaf extracts of Allium ursinum L. (collected in
Montenegro and Bosnia and Herzegovina). Journal of Materials and
Environmental Sciences 8(6), 1929-1934.
Perovic, S., Pantovic, S., Scepanovic V., Perovic A., Zivkovic, V., & Damjanovic-
Vratnica, B. (2019) Evaluation of antimicrobial activity and activity on the
Chemical charactetization, nutritional benefits and some processed products... 213
autonomic nervous system of the lavender essential oils from Montenegro,
Progress in Nutrition, 21(3), 584-590.
Perović, S., Veinović, G., & Antić Stanković, J. (2018) A review on antibiotic resistance:
origin and mechanisms of bacterial resistance as biological phenomenon,
Genetika, 50 (3), 1123-1135.
Petruzzi, L., Campaniello, D., Speranza, B., Corbo, M. R., Sinigaglia, M., & Bevilacqua,
A. (2017). Thermal treatments for fruit and vegetable juices and beverages: a
literature overview. Comprehensive reviews in food science and food safety, 668-
691.
Planinić M., Velić, D., Tomas S., Bilić M., & Bucić A. (2005). Modelling of drying and
rehydration of carrots using Peleg's model. European food research and
technology, 221, 446–451.
Platzer, N., Goasdoue, N., & Davoust, D. (1987). Long range 1H coupling interactions:
identification of different pathways by 2D NMR δ-δ correlated spectroscopy.
Applications in structural analysis. Magnetic resonance in chemistry, 25, 311-319.
Profir, A. G., & Vizireanu, C. (2013). Sensorial analysis of a functional beverage based
on vegetables juice. Acta biologica szegediensis, 57(2),145-148.
Profir, A., & Vizireanu, C. (2013). Effect of the preservation processes on the storage
stability of juice made from carrot, celery and beetroot. Journal of agroalimentary
processes and technology, 19(1), 99-104.
Qurtulanea, Zargara, I. A., Mehraj-ud-udinb, S., Bisatic I. A., & Kumarc, A. (2015).
Effect of different drying temperature on the quality of dehydrated carrot shreds.
Ecology environment and conservation, 21 (3), 1317-1320.
Radiati, L. E., Jaya, F., & Oktavia, H. (2016). Effect of carrot-juice on exopolisaccharides
and β-D galactosidase activity in yogurt. Animal production, 18(3): 173-179.
Rao, D. B. S., & Reedy, S. R. (2013). Hypoglycaemic and antidiabetic activity of Daucus
carota seeds in alloxan induced diabetic rats. Pharmanest, 4(5), 907-913.
Raum, R. (2003). Microbiological quality of health foods and organic foods. Nethrlands
milk and dairy journal, 14, 130–134.
Rayman, A.,& Baysal, T. (2011). Yield and quality effects of electroplasmolysis and
microwave applications on carrot juice production and storage. Journal of food
science, 76, 598–605.
Reiter, M.,Stuparić, M., Neidhart, S., & Carle, R. (2003). The role of process
technologyin carrot juice cloud stability. Lebensmittel wissenschaft und
technologie, 36, 165–172.
Roy, M. C., Alam, M., Saeid, A., Das, B. C., Mia, M. B., Rahman, M. A., Eun, J. B., &
Ahmed, M., (2017). Extraction and characterization of pectin from pomelo peel
and its impact on nutritional properties of carrot jam during storage. Journal of
food processing and preservation, 1-9.
Salazar-González, C., San Martín-González, M. F., Vergara-Balderas, F. T., López-Malo,
A., & Sosa-Morales, M. E. (2014). Physical-chemical and microbiological stability
during refrigerated storage of microwave-pasteurized guava nectar. Focusing on
modern food industry, 3, 43-51.
Salwa, A. A., Galal, E. A., Neimat, A., & Elewa, A. (2004). Carrot yoghurt: sensory,
chemical, microbiological properties and consumer acceptance. Pakistan journal of
nutrition, 3, 322–330.
Schaller, R. G., & Schnitzler, W. H. (2000). Nitrogen nutrition and flavour compounds of
carrots (Daucus carotaL.) cultivated in Mitscherlich pots. Journal of the scinence
food and agriculture, 80, 49-56.
Pejatović et al 214
Schieber, A., Marx, M., & Carle, R. (2002). Simultaneous determination of carotenes
tocopherol in ATBC drinks by high-performance liquid chromatography. Food
chemistry, 76, 357-362.
Seifert, R. M., Buttery, M. G., & Ling, L. (1968). Identification of faaasgvf2ffsome
constituents of carrot seed oil. Journal of the science of food and agriculture, 19,
384-387.
Shakeel, A., Aslam, H. K. W., Shoaib, M., Sikandar, H. A., & Ramzan, R. (2013). Effect
of variour hydrocolloids on cloud stability and nutrition of carrot juice. Journal of
global innovations in agricultural and social sciences, 1(1), 22-27.
Shakheel, M. B., Saliyan, T. Satish, S., & Hedge K. (2017). Therapeutic uses of daucus
carota: A review. International journal of pharma and chemical research, 3(2),
138-143.
Sharma, K. D., Karki, S., Thakur, N. S., & Attri S. (2012). Chemical composition,
functional properties and processing of carrot - a review. Journal of food science
and technology, 49(1), 22-32.
Shebaby, W. N., El-Sibai, M., Bodman-Smith, K., Karam, M. C., Mroueh, M., & Daher,
C. F. (2013). The antioxidant and anticancer effects of wild carrot oil extract.
Phytotherapy research, 27, 737-744.
Shin, B. K., Han, S. K. J. I., & Park S. (2015). Quality and sensory characteristics of
fermented milk adding black carrot extracts fermented with Aspergillus oryzae.
Journal of Korean society of food culture, 30(3), 370-376.
Shyu, S. L., & Hwang, L. S. (2011). Process optimization of vacuum fried carrot chips
using central composite rotatable design. Journal of food and drug analysis, 19(3),
324-330.
Silva Dias, J. C. (2014). Nutritional and health benefits of carrots and their seed extracts.
Food and nutrition sciences, 5, 2147-2156.
Simon, P. W. (2000). Domestication, historical development, and modern breeding of
carrot. Plant breeding reviews, 19, 157-189.
Simon, P., Freeman, R., Vieira, J., Boiteux, L., Briard, M., Nothnagel, T. et al. (2008).
Carrot. In: Prohens J. and Nuez F. (eds). Vegetables II., New York: Springer, 327–
357.
Simova, E. D., Frengova, G. T., & Beshkova, D. M. (2004). Synthesis of carotenoids by
Rhodotorula rubra cultured with yoghurt starter whey ultra filtrate. Journal of the
society of dairy technology, 31, 115–121.
Sinchaipanit, P., Kerr, W. L., & Chamchan, R. (2013). Effect of sweeteners and
hydrocolloids on quality attributes of reduced-calorie carrot juice. Journal of the
science of food and agriculture, 93(33), 04-11.
Singh, B. K., Koley, T. K., Maurya, M., Singh, P. M., & Singh, B. (2018) Phytochemical
and antioxidative potential of orange, red, yellow, rainbow and black coloured
tropical carrots (Daucus carota subsp. sativus Schubl. & Martens), Physiology and
Molecular Biology of Plants, 24(5): 899–907.
Singh, J., & Chandra, S. (2012). Preparation and evaluation of guava-carrot jelly.
International journal of food fermentation and technology, 2(2), 197-200.
Skrede, G., Nilson, A., Baardseth, P., Rosenfeld, H. J., Enersen, G., & Slinde, E. (1997).
Evaluation of carrot varieties for production of deep fried carrot chips:
III.Carotenoids. Food resarch international, 30(1), 73-81.
Slinde, E., Skrede, G., Aukrust, T., Blom, H., & Baardseth, P. (1993). Lactic acid
fermentation influence on sugar content and color of deep-fried carrot chips. Food
resarch international, 26, 255-260.
Chemical charactetization, nutritional benefits and some processed products... 215
Small, E. (1978). Numerical taxonomic analysis of Daucus carota complex. Canadian
journal of botany, 56, 248-276.
Staniszewska, M., & Kula, J. (2001). Composition of the essential oil from wild carrot
umbels (Daucus carota) growing in Poland. Journal of essential oil resources, 13,
439-441.
Stolarczyk, J., & Janick, J. (2011). Carrot: history and iconography. Chronica
horticulturae, 51(2), 1-6.
Stoll, A., Schieber, A., & Carle, R. (2001). Carrot pomace an underestimated by-product.
In: Pfannhauser W, Fenwick GR, Khokhar S (eds) Biologically active
phytochemicals in food. The Royal Society of Chemistry, Cambridge, 525–527.
Sulaeman. A., Keeler. L., Giraud, D. W., Taylor, S. L., Wehling, R. L., & Driskell, J. A.
(2001). Carotenoid content and physicochemical and sensory characteristics of
carrot chips deep fried in different oils at several temperatures. Food chemistry and
technology, 66(9), 1257-1264.
Sulaeman. A., Keeler. L., Giraud, D. W., Taylor, S. L., Wehling, R. L., & Driskell, J. A
(2003). Changes in carotenoid, physicochemical and sensory values of deep-fried
carrot chips during storage. International journal of food science and technology,
38, 603–613.
Suman, M., & Krishna Kumari, K. (2002). A study on sensory evaluation, β-carotene
retention and shelf-life of dehydrated carrot products. Journal of food science and
technology, 39(6), 677-681.
Surbhi, S., Verma, R. C., Deepak, R., Jain, H.K., & Yadav K.K. (2018). A review: Food,
chemical composition and utilization of carrot (Daucus carota L.) pomace.
International journal of chemical sciences, 6(3), 2921-2926.
Thellung, A. (1927). Origin of garden carrots (Daucus carota subsp. sativus) and garden
radish (Raphanus raphanistrum subsp. sativus). Feddes Repertorium Specierum
Novarum Regni Vegetabilis ( Supplement 46 ): 1-7.
Thomas, S. C. L. (2008). Vegetables and fruits: nutritional and therapeutic values. Taylor
and Francis Group, CRC Press.
Ullah, N., Ullah, S., Khan, A., Ullah, I., & Badshah, S. (2018). Preparation and evaluation
of carrot and apple blended jam. Journal of food processing and technology, 9(4),
6 pages.
Vasudevan, M., Gunnam, K. K., & Parle, M. (2006). Antinoceptive and antiinflamatory
properties of Daucus carota seeds extracts. Journal of health science, 52(5), 598-
606.
Vavilov, N. I. (1992). Origin and geography of cultivated plants. Cambridge University
Press, New York, New York, USA, 337-340.
Vilmorin, M. (1859). Heredity in plants. In: M. Vilmorin [ed.], Notice on the
improvement of plants by sowing, Librairie Agricole, Paris, France, 5-29.
Yadav, V.T. (2015). Effect of heat processing on β carotene and ascorbic acid content of
carrot-fruit juice blended nectar. Bioscan, 10, 699–703.
Yi, J. Hou, C., Bi, J., Zhao, Y., Peng, J., & Liu, C. (2018). Novel Combined Freeze-
Drying and Instant Controlled Pressure Drop Drying for Restructured Carrot-
Potato Chips: Optimized by Response Surface Method. Journal of food quality, 13
pages.
Yu, L. L., Zhou, K. K., & Parry, J. (2005). Antioxidant properties of cold-pressed black
caraway, carrot, cranberry, and hemp seed oils. Food chemistry, 91(4), 723-729.

Pejatović et al 216
Zhang, D., & Hamauzu, Y. (2004). Phenolic compounds and their antioxidant properties
in different tissues of carrots (Daucus carota L.). Journal of agriculture and
environment, 2, 95-101.
Zheng-Wei, C., Chun-Yang, L., Chun-Fang, S., & Yun S. (2008). Combined Microwave-
vacuum and freeze drying of carrot and apple chips. Drying technology, 26, 1517–
1523.
Agriculture & Forestry, Vol. 66 Issue 2: 217-227, 2020, Podgorica 217
Ljubičić, N., Radović, M., Kostić, M., Popović, V., Radulović, M., Blagojević, D., Ivošević, B. (2020): The
impact of ZnO nanoparticles application on yield components of different wheat genotypes. Agriculture and
Forestry, 66 (2): 217-227.
DOI: 10.17707/AgricultForest.66.2.19
Nataša LJUBIČIĆ, Marko RADOVIĆ, Marko KOSTIĆ, Vera POPOVIĆ, .
Mirjana RADULOVIĆ, Dragana BLAGOJEVIĆ, Bojana IVOŠEVIĆ 1
THE IMPACT OF ZnO NANOPARTICLES APPLICATION ON YIELD
COMPONENTS OF DIFFERENT WHEAT GENOTYPES
SUMMARY
The properties of zinc oxide nanoparticles (ZnO NPs) and their use have
been shown as prominent for application in agriculture since it can bring certain
benefits in agricultural production. The objective of this study was to estimate the
impact of seed priming with ZnO NPs on yield components, plant height and
spike length on wheat. In order to estimate the effects of ZnO nanoparticles on
yield component, four winter wheat genotypes namely, NS Pobeda, NS Futura,
NS 40S and NK Ingenio were selected. Seeds of each wheat genotypes were
primed with different concentrations of ZnO NPs (0, 10, 100 and 1000 mg l-1
) for
48 h in dark box by continuous aeration. Primed seeds were after sown in soil
pots with 60-70% moisture contents during the till maturity. Considerable
improvement was observed in plant height and spike length which increased with
rates of ZnO NPs compared to the control. At rates of 10 mg l-1
ZnO NPs, the
greatest increases in plant height and spike length were observed for genotypes
NS Pobeda and NS Futura. At 100 mg l-1
ZnO NPs, the greatest increase for both
traits was observed for genotypes NS 40S and NK Ingenio. Maximum rates of
ZnO nanoparticles reduced both observed traits of wheat. The result indicated
that ZnO nanoparticles can significantly increase plant height and spike length of
wheat, but also plant response to ZnO nanoparticles significantly depends on
concentration of application, as well as from wheat genotype.
Keywords: Triticum aestivum L., yield components, zinc oxide,
nanoparticles, correlation.
INTRODUCTION
Wheat (Triticum aestivum L.) is one of the most important cereal crops in
the World, grown on over 220 million hectares and representing 26% of the total
harvested area (Popović, 2010; USDA, 2015). Wheat is a food source for over
1Nataša Ljubičić, (corresponding author: [email protected]), Marko Radović, Marko
Kostić, Mirjana Radulović, Dragana Blagojević, Bojana Ivošević, BioSense Institute, University of
Novi Sad, 21000 Novi Sad, SERBIA; Vera Popović, Institute of Field and Vegetable Crops, Institute of National Importance for the Republic of Serbia, Maksima Gorkog 30, Novi Sad,
SERBIA.
Notes: The authors declare that they have no conflicts of interest. Authorship Form signed online.
Received:10/05/2020 Accepted:18/06/2020
Ljubičić et al. 218
seven billion of people and is a major food item in many countries of the world
(Pavićević, 1991; 1992; Popović, 2010; Dončić et al., 2019). According to FAO
(2017), all types of wheat in the Republic of Serbia are cultivated in the about
588.820 ha. In addition to the main product, grain, significant quantities of by-
products are remaining in the field, in warehouses and in industrial production
and processing (Rakaščan et al., 2019). In 2016, Serbia had a very good wheat
crop of over 2.89 million tones, which had harvested from 595,000 ha. The initial
wheat stock in 2018 was 218,000 tonnes with 3.11 million tonnes of wheat,
available for consumption. Wheat needs in grain, in Serbia were about 1.55
million tonnes. For domestic consumption it required 1,200,000 tones, for
supplies 200,000 tonnes and for seed production 150,000 tonnes, while the rest
was intended for export (about 1.34 million tonnes), (Gulan, 2017). Growing
demands for wheat rising approximately 2% per year, which is twice of the
current gain rate in genetic yields potential, hence plant breeders have to put
many efforts to improve the grain yield of wheat (Reynolds et al., 2001; Ljubičić
et al., 2015).
Grain yield in wheat is a complex polygenic trait influenced by many
components that interact in a multiplicative manner (Slafer and Calderine, 1996;
Popović, 2010). Since that increment in one yield component might have positive
or negative effect on the other components, a large number of genetic studies
have been made to investigate the genetic basis of these traits of wheat. Breeders
frequently use yield components to improve the grain yield, despite the fact that
these components compensate each other in practice and increase in one cause a
decrease in the other (Foroozanfar and Zeynali, 2013; Ljubičić et al., 2015; Djuric
et al., 2018; Biberdzic et al., 2020). A high and stable wheat yield can be
achieved only when it is based on the cultivation of varieties of high genetic yield
potential with the application of intensive agro-technology. Producers of wheat in
our country have a wide range of domestic varieties that are highly yielding, not
genetically modified (Popović, 2010; Popović et al., 2011; Glamočlija et al.,
2015; Lakić et al., 2015; Maksimović et al., 2018; Milivojević et al., 2018;
Rakaščan et al., 2019; Rakić et al., 2020) and adapted to our climate. Recent
studies suggest that nanotechnology possess great potential to be successfully
used in agriculture for different purposes and various conditions. Among different
nanoparticles (NPs) in use, zinc oxide nanoparticles (ZnO NPs) are the most
widely used, since they can bring certain benefits in agricultural production. It
has been reported that zinc oxide nanoparticles (ZnO NPs) could promote seed
germination, improve zinc deficiencies, root volume, increase plant growth and
yield traits, as a biomass, stem height and spike length in wheat (Munir et al.,
2018; Rizwan et al., 2019). On the other side, different methods have been
developed for the application of ZnO NPs to crop, such as in the soil application,
foliar application and by seed priming method. Seed priming method has been
shown as a simple, cost effective and beneficial especially under adverse
environmental conditions (Mahakham et al., 2017). Seed priming method can
also improve the growth quality and production of crops (Munir et al., 2018).
The impact of ZnO nanoparticles application on yield components of different wheat... 219
Therefore, in the present study seed priming method was selected to
evaluate the effect of ZnO NPs on yield traits, plant height and spike length in
four winter wheat varieties. Assessing the impacts of NPs on these traits of wheat
will provide new insights into the application of nanotechnology in improving
yield traits of wheat.
MATERIAL AND METHODS The present study was carried out at the experimental field in the
greenhouse facility available in the University of Novi Sad, in Serbia, during the
2018-2019 growing season. The experimental material in this study was
comprised of 4 winter wheat genotypes, namely, NS Pobeda, NS 40S, NK
Ingenio and NS Futura. Seeds of each wheat genotypes were primed with
different solutions containing appropriate concentrations of ZnO NPs (0, 10, 100
and 1000 mg L-1
) for 48 h in dark box by continuous aeration. Ten primed seeds
of wheat were after sown in soil pots filled with 5.0 kg of soil, with 60-70%
moisture contents during the experiment. The trial was set up according to the
completely randomized design with three replications of each treatment on
chernozem soil. To avoid the micronutrient deficiency in plants, the chernozem
soil used for conducting trial was collected from the agricultural field, mainly
used to grow wheat with usual agrotechnics measure was applied. At the stage of
full maturity, ten plants from each replication of winter wheat genotypes were
selected for recording data for plant height and spike length. Average values of
three replication trait analysis were used. Components of phenotypic variance
were calculated based on the following statistical parameters: the mean value
( X ), the coefficient of variation (Cv) as an index of relative variability of the trait
and analysis of variance. Significant differences between the mean values were
estimated by LSD - test values. Pearson correlation coefficient (r) was used as a
measure of correlation of NDVI with aboveground biomass and grain yield of
wheat. All statistical analyses were carried out using software STATISTICA,
version 13 (StatSoft Inc., USA). For the calculation of the yield components, we
used a basic statistical method comprising of the following: for calculation of
variation degree of yield coefficient of variation (Cv) was applied in equation:
Cv=b•100/ X .
RESULTS AND DISCUSSION
The yield per unit area is the result of the action of factors of variety in
interaction with environmental factors. The yield is largely dependent on the
genetic potential and considerably vary primarily as a result of agro-ecological
conditions during the growing season (Popović et al., 2011; Vasileva, 2016;
Đekić et al., 2017; 2018; Jaćimović et al., 2017; Milivojević et al., 2018; Terzić et
al., 2018; Ugrenović et al., 2018; Rajičić et al., 2019; 2020; Vasileva and Vasilev,
2020). The studied yield components, plant height and spike length are complex
variable traits which expression is largely depended on the environmental factors
(Zečević et al., 2008). Within treatment the investigated wheat cultivars showed

Ljubičić et al. 220
significant differences in the mean values of plant height and spike length and
varied on overall basis.
Plant height. The results of plant height of four winter wheat varieties are
presented in Table 1. Plant height increased with increasing ZnO NPs
concentration applied. The greatest increase in plant height was found at 100 mg
L-1
ZnO NPs for genotypes NS 40S (89.33 cm) and NK Ingenio (86 cm), while
genotypes with greatest increase at 10 mg L-1
ZnO NPs applied were NS Futura
(89 cm) and NS Pobeda (86 cm). Low values of plant height were observed at
control plants, whereas the lowest values of these parameters were found in
maximum concentration of ZnO NPs. It could be noted that ZnO NPs treatment
had a twofold impact on wheat height. In general, wheat plants had advanced
elongation under lower ZnO NPs concentration treatment (up to 100 mg l-1
),
while the enriched concentration of nanomaterials diminished plant growth.
Given results revealed that different treatments influenced the differences in plant
height.
The plant height is considered a quantitative and variable trait which
expression highly depends on the environmental factors. This is confirmed by
values of the coefficient of variation which ranged from 0.70 % to 3.9 % The
lowest variability was observed within treatments of 100 mg l-1
ZnO NPs
(Cv=1.0%) and 10 mg l-1
ZnO NPs (Cv=1.2 %). The highest variation coefficient
was observed 1000 mg l-1
ZnO NPs (Cv=3.1%), Table 1.
Table 1. Mean values and Cv for plant height of examined wheat varieties.
Parameters Environments
Treatments K - 0 mg l-1
10 mg l-1
100 mg l-1
1000 mg l-1
Varieties X Cv (%) X Cv (%) X Cv (%) X Cv(%)
Pobeda 79.67 0.7 86.00 1.2 85.00 1.2 67.33 3.1
NS40S 75.00 1.3 83.67 1.8 89.33 0.7 63.67 3.6
Ingenio 74.67 3.9 82.67 0.7 86.00 1.2 65.33 3.9
Futura 75.00 2.7 89.00 1.1 88.00 1.1 64.33 1.8
X 76.08 2.2 85.33 1.2 87.08 1.0 65.17 3.1
X - mean value (cm); Cv- coefficient of variation (%)
*Environmental labels represent control (K), and 10, 100 and 1000 mg l-1
primed
concentrations of ZnO NPs applied.
Highest Cv of the plant height tells how consistent influence of the
treatment was on the single plant. Due to CVs, high confidence in the positive
impact of ZnO NPs to the wheat height could be underlined for 10-100 mg l-1
concentrations. Differences are caused by different plants response to
environmental factors (treatment) with the experiment was performed. Overall, it
is noticed that the greatest variability of stem height was obtained for the highest
concentration of applied ZnO NPs of all varieties. This points out an increased
The impact of ZnO nanoparticles application on yield components of different wheat... 221
interaction of genotype and the environment in terms of the more inconvenient
conditions, compared to favorable conditions with lower levels of the applied
concentration. According to Popović (2010) and Petrović et al. (2017) in the
process of breeding wheat genotypes tolerant to abiotic stress, caused by
unfavorable conditions, one of the selection criteria would be reducing genotype
environment interaction for this trait, at higher mean values of trait.
According to ANOVA, the components of phenotypic variance were
analyzed and significant differences in the average values for plant height was
observed due to treatment (Table 2). The ANOVA showed that plant height was
significantly affected by the treatment because of significant variance at 1% level,
which explained 73.3 % of the total (G + E + GEI) variation. Variation was not
significant when genotype was considered as the main effect, but was more
obvious in GEI (genotype/environment interaction). Lower impact belongs to
genetic/environment interaction (22.3 %) of the total sum of squares lower and
non-significant impact belongs to genotypes (4.4 %), Table 2. These results are in
agreement with previous study reported by Zečević et al. (2004) and Zečević et
al. (2008).
Tab.2.ANOVA for plant height mean values for 4 wheat varieties in 4 treatments.
Effect SS DF MS F p LSD 0.01 LSD 0.05
Intercept 284284.1 1 284284.1 2509.773*
0.000000
Genotype 254.1 3 84.7 0.748ns
0.531698 11.848 8.825
Treatment 4280.4 3 1426.8 12.596* 0.000013 11.849* 8.826*
GEI 1302.8 9 144.8 1.278* 0.286478 23.695* 17.648*
Error 3624.7 32 113.3
ns - non significant; *– Significant at P < 0.05 probability level, ** – Highly significant at
P < 0.01 probability level; SS - Sum of squares; DF - Degree of freedom; MS - Mean
square; F- F values
Spike length. The results of the spike length of four winter wheat varieties
are presented in Table 3. The results revealed that spike length increases with
increasing ZnO NPs concentrations in the priming solution, comparing than
control. Depending on genotype, the highest increase in spike length was found
with doses of 10 mg l-1
and 100 mg l-1
NPs applied, whereas the lower values of
this parameter were found on control plants. The greatest increase in spike length
within application dose of 10 mg l-1
ZnO NPs for genotypes NS Futura (11.30
cm) and NS Pobeda (9.87 cm), while genotypes with greatest increase at 100 mg
l-1
ZnO NPs applied were NS 40S (9.80 cm) and NK Ingenio (11.07 cm). Low
values of spike length were observed at control plants, and the lowest were found
in highest concentration of ZnO NPs.
The present results indicated that different treatments influenced the
differences in spike length. According to Zečević et al. (2008), spike length is
genetically controlled, but it highly depends on environmental factors.
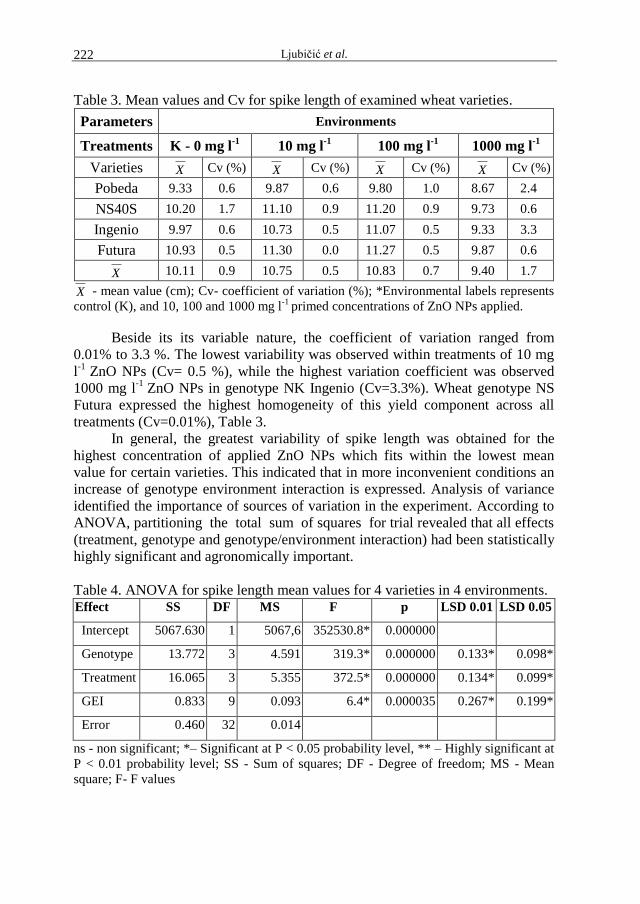
Ljubičić et al. 222
Table 3. Mean values and Cv for spike length of examined wheat varieties.
Parameters Environments
Treatments K - 0 mg l-1
10 mg l-1
100 mg l-1
1000 mg l-1
Varieties X Cv (%) X Cv (%) X Cv (%) X Cv (%)
Pobeda 9.33 0.6 9.87 0.6 9.80 1.0 8.67 2.4
NS40S 10.20 1.7 11.10 0.9 11.20 0.9 9.73 0.6
Ingenio 9.97 0.6 10.73 0.5 11.07 0.5 9.33 3.3
Futura 10.93 0.5 11.30 0.0 11.27 0.5 9.87 0.6
X 10.11 0.9 10.75 0.5 10.83 0.7 9.40 1.7
X - mean value (cm); Cv- coefficient of variation (%); *Environmental labels represents
control (K), and 10, 100 and 1000 mg l-1
primed concentrations of ZnO NPs applied.
Beside its its variable nature, the coefficient of variation ranged from
0.01% to 3.3 %. The lowest variability was observed within treatments of 10 mg
l-1
ZnO NPs (Cv= 0.5 %), while the highest variation coefficient was observed
1000 mg l-1
ZnO NPs in genotype NK Ingenio (Cv=3.3%). Wheat genotype NS
Futura expressed the highest homogeneity of this yield component across all
treatments (Cv=0.01%), Table 3.
In general, the greatest variability of spike length was obtained for the
highest concentration of applied ZnO NPs which fits within the lowest mean
value for certain varieties. This indicated that in more inconvenient conditions an
increase of genotype environment interaction is expressed. Analysis of variance
identified the importance of sources of variation in the experiment. According to
ANOVA, partitioning the total sum of squares for trial revealed that all effects
(treatment, genotype and genotype/environment interaction) had been statistically
highly significant and agronomically important.
Table 4. ANOVA for spike length mean values for 4 varieties in 4 environments. Effect SS DF MS F p LSD 0.01 LSD 0.05
Intercept 5067.630 1 5067,6 352530.8*
0.000000
Genotype 13.772 3 4.591 319.3*
0.000000 0.133* 0.098*
Treatment 16.065 3 5.355 372.5* 0.000000 0.134* 0.099*
GEI 0.833 9 0.093 6.4* 0.000035 0.267* 0.199*
Error 0.460 32 0.014
ns - non significant; *– Significant at P < 0.05 probability level, ** – Highly significant at
P < 0.01 probability level; SS - Sum of squares; DF - Degree of freedom; MS - Mean
square; F- F values
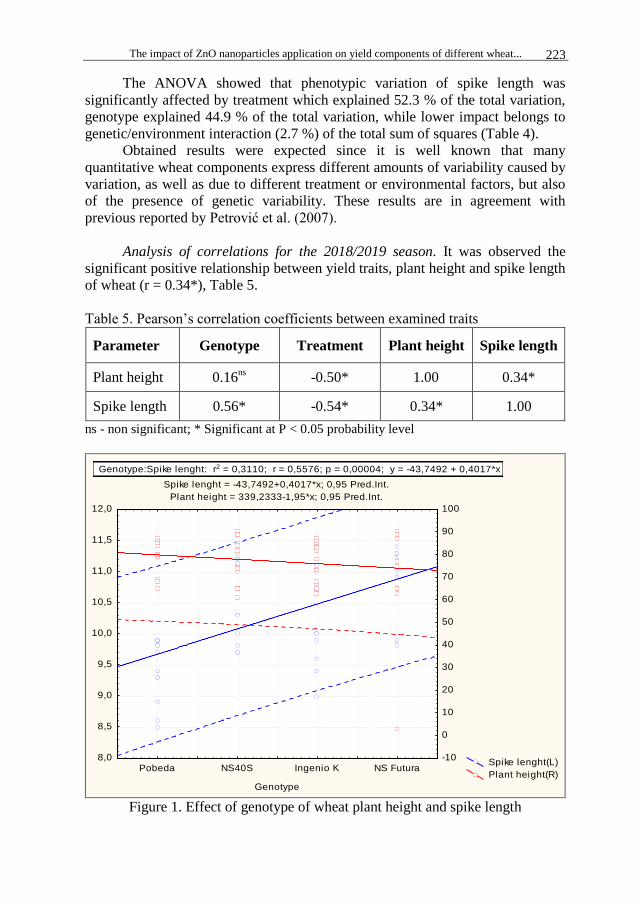
The impact of ZnO nanoparticles application on yield components of different wheat... 223
The ANOVA showed that phenotypic variation of spike length was
significantly affected by treatment which explained 52.3 % of the total variation,
genotype explained 44.9 % of the total variation, while lower impact belongs to
genetic/environment interaction (2.7 %) of the total sum of squares (Table 4).
Obtained results were expected since it is well known that many
quantitative wheat components express different amounts of variability caused by
variation, as well as due to different treatment or environmental factors, but also
of the presence of genetic variability. These results are in agreement with
previous reported by Petrović et al. (2007).
Analysis of correlations for the 2018/2019 season. It was observed the
significant positive relationship between yield traits, plant height and spike length
of wheat (r = 0.34*), Table 5.
Table 5. Pearson’s correlation coefficients between examined traits
Parameter Genotype Treatment Plant height Spike length
Plant height 0.16ns
-0.50* 1.00 0.34*
Spike length 0.56* -0.54* 0.34* 1.00
ns - non significant; * Significant at P < 0.05 probability level
Scatterplot (Wheat AF 12v*90c)
Spike lenght = -43,7492+0,4017*x; 0,95 Pred.Int.
Plant height = 339,2333-1,95*x; 0,95 Pred.Int.
Spike lenght(L)
Plant height(R)Pobeda NS40S Ingenio K NS Futura
Genotype
8,0
8,5
9,0
9,5
10,0
10,5
11,0
11,5
12,0
-10
0
10
20
30
40
50
60
70
80
90
100
Genotype:Spike lenght: r2 = 0,3110; r = 0,5576; p = 0,00004; y = -43,7492 + 0,4017*x
Figure 1. Effect of genotype of wheat plant height and spike length

Ljubičić et al. 224
Scatterplot (Wheat AF 12v*90c)
Spike lenght = 10,66-0,0013*x; 0,95 Pred.Int.
Plant height = 82,2258-0,0174*x; 0,95 Pred.Int.
Spike lenght(L)
Plant height(R)10 1000
Treatment
8,0
8,5
9,0
9,5
10,0
10,5
11,0
11,5
12,0
-10
0
10
20
30
40
50
60
70
80
90
100
Treatment:Spike lenght: r2 = 0,4074; r = -0,6383; p = 0,000001; y = 10,66 - 0,0013*x
Figure 2. Effect of treatment of wheat plant height and spike length
The values of the correlation coefficients can be explained by the plant
response to the applied treatments. This means that favorable conditions in the
experiment caused increased values of plant height and spike length. Our findings
in this study support the research of Banjec et al. (2000). The authors state highly
significant positive correlations were observed between the length of the spikes
and the number of grains per spike. Positive but very weak correlation manifested
between plant height and grain weight per class (0.104), as well as between plant
height and class mass (0.123).
CONCLUSIONS
Based on the obtained research, it can be concluded that the seed priming
with different concentrations of ZnO NPs might be a suitable method to improve,
plant height and spike length of wheat. Plant height and spike length varied
widely within different treatment and different wheat genotypes. Seed priming
with 100 mg/L ZnO NPs provided, the highest plant height for the Pobeda and
Futura varieties, while under 100 mg/L treatment the largest values was noticed
for Ingenio and NS40S varieties. Similar results, was obtained in case of spike
length. The levels of the mean values of the analyzed yield components were the
lowest in condition of maximum amount of ZnO NPs applied. In order to achieve
a stable wheat yield component, appropriate measures of applying ZnO NPs
should be applied. Overall this results showed that seed priming might be an
effective method for improve important yield components of wheat and could
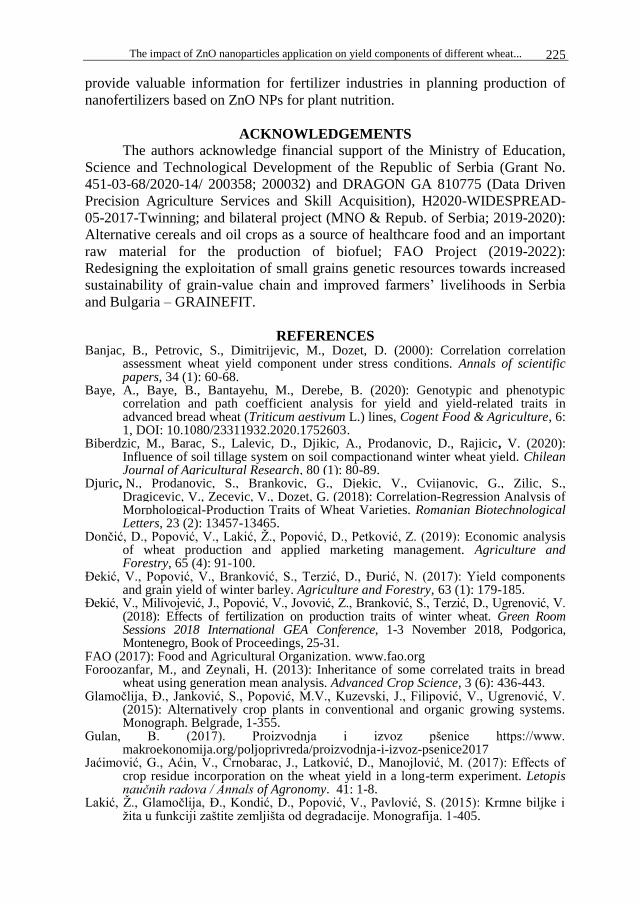
The impact of ZnO nanoparticles application on yield components of different wheat... 225
provide valuable information for fertilizer industries in planning production of
nanofertilizers based on ZnO NPs for plant nutrition.
ACKNOWLEDGEMENTS
The authors acknowledge financial support of the Ministry of Education,
Science and Technological Development of the Republic of Serbia (Grant No.
451-03-68/2020-14/ 200358; 200032) and DRAGON GA 810775 (Data Driven
Precision Agriculture Services and Skill Acquisition), H2020-WIDESPREAD-
05-2017-Twinning; and bilateral project (MNO & Repub. of Serbia; 2019-2020):
Alternative cereals and oil crops as a source of healthcare food and an important
raw material for the production of biofuel; FAO Project (2019-2022):
Redesigning the exploitation of small grains genetic resources towards increased
sustainability of grain-value chain and improved farmers’ livelihoods in Serbia
and Bulgaria – GRAINEFIT.
REFERENCES Banjac, B., Petrovic, S., Dimitrijevic, M., Dozet, D. (2000): Correlation correlation
assessment wheat yield component under stress conditions. Annals of scientific papers, 34 (1): 60-68.
Baye, A., Baye, B., Bantayehu, M., Derebe, B. (2020): Genotypic and phenotypic correlation and path coefficient analysis for yield and yield-related traits in advanced bread wheat (Triticum aestivum L.) lines, Cogent Food & Agriculture, 6: 1, DOI: 10.1080/23311932.2020.1752603.
Biberdzic, M., Barac, S., Lalevic, D., Djikic, A., Prodanovic, D., Rajicic, V. (2020): Influence of soil tillage system on soil compactionand winter wheat yield. Chilean Journal of Agricultural Research, 80 (1): 80-89.
Djuric, N., Prodanovic, S., Brankovic, G., Djekic, V., Cvijanovic, G., Zilic, S., Dragicevic, V., Zecevic, V., Dozet, G. (2018): Correlation-Regression Analysis of Morphological-Production Traits of Wheat Varieties. Romanian Biotechnological Letters, 23 (2): 13457-13465.
Dončić, D., Popović, V., Lakić, Ž., Popović, D., Petković, Z. (2019): Economic analysis of wheat production and applied marketing management. Agriculture and Forestry, 65 (4): 91-100.
Đekić, V., Popović, V., Branković, S., Terzić, D., Đurić, N. (2017): Yield components and grain yield of winter barley. Agriculture and Forestry, 63 (1): 179-185.
Đekić, V., Milivojević, J., Popović, V., Jovović, Z., Branković, S., Terzić, D., Ugrenović, V. (2018): Effects of fertilization on production traits of winter wheat. Green Room Sessions 2018 International GEA Conference, 1-3 November 2018, Podgorica, Montenegro, Book of Proceedings, 25-31.
FAO (2017): Food and Agricultural Organization. www.fao.org Foroozanfar, M., and Zeynali, H. (2013): Inheritance of some correlated traits in bread
wheat using generation mean analysis. Advanced Crop Science, 3 (6): 436-443. Glamočlija, Đ., Janković, S., Popović, M.V., Kuzevski, J., Filipović, V., Ugrenović, V.
(2015): Alternatively crop plants in conventional and organic growing systems. Monograph. Belgrade, 1-355.
Gulan, B. (2017). Proizvodnja i izvoz pšenice https://www. makroekonomija.org/poljoprivreda/proizvodnja-i-izvoz-psenice2017
Jaćimović, G., Aćin, V., Crnobarac, J., Latković, D., Manojlović, M. (2017): Effects of crop residue incorporation on the wheat yield in a long-term experiment. Letopis naučnih radova / Annals of Agronomy. 41: 1-8.
Lakić, Ž., Glamočlija, Đ., Kondić, D., Popović, V., Pavlović, S. (2015): Krmne biljke i žita u funkciji zaštite zemljišta od degradacije. Monografija. 1-405.

Ljubičić et al. 226
Ljubičić, N., Petrović, S., Dimitrijević, M., Hristov, N. (2015): The inheritance of plant height in hexaploid wheat (Triticum aestivum L.). 6 Intern. Scientific Agricultural Symposium „Agrosym 2015“, 494-499.
Ljubičić, N., Petrović, S., Dimitrijević, M., Hristov, N. (2016): Genetic analysis of some important quantitative traits in bread wheat (Triticum aestivum L.), Ekin Journal of Crop Breeding and Genetics, 2 (2): 47-53.
Mahakham, W., Sarmah, A.K., Maensiri, S., Theerakulpisut, P. (2017): Nano-priming technology for enhancing germination and starch metabolism of aged rice seeds using phytosynthesized silver nanoparticles. Sci.Rep., 7: 1-21.
Maksimović, L., Popović, V., Stevanović, P. (2018). Water and irrigation requirements of field crops grown in central Vojvodina, Serbia. Agriculture & Forestry, Podgorica, 64 (1): 133-144.
Mihailović, B. (2005). Marketing. Book. Podgorica, Montenegro. 400. Milivojević, J., Bošković-Rakočević, Lj., Đekić, V., Luković, K., Simić,
Z. (2018):
Cultivar-specific accumulation of iron, manganese, zinc and copper in winter wheat grain (Triticum aestivum L.). Journal of Central European Agriculture, 19 (2): 423-436.
Munir, T., Rizwan, M., Kashif, M., Shahzad, A., Ali, S. (2018): Effect of zinc oxide nanoparticles on the growth and Zn uptake in wheat (Triticum aestivum L.) by seed priming method. Digest Journal of Nanomaterials and Biostructures, 13 (1): 315-323.
Pavićević, Lj. (1991): A study of rare species of wheat in Montenegro. Agriculture and Forestry, 37 (1-2): 55-62.
Pavićević, Lj. (1992): About promotion bare wheat tetraploid in the Southern coastal belt Yugoslavia, Agriculture and Forestry, 38 (3-4): 3-12
Popović, V. (2010): Agro-technical and agro-ecological influence on the production of wheat, maize and soybean seeds. Doctoral dissertation, University of Belgrade, Faculty of Agriculture, Zemun, 1-145.
Popović, V., Glamočlija, Đ., Malešević, M., Ikanović, J., Dražić, G., Spasić, M., Stanković, S. (2011): Genotype specificity in nitrogen nutrition of malting barley. Genetika, Belgrade, 43 (1): 197-204.
Petrović, S., Dimitrijević, M., Belić, M. (2007): Stem heifht and spike parameters heritability in wheat grown on black humicgley soil. Letopis naučnih radova, 1: 146–152.
Petrović, S., Dimitrijević, M, Banjac, B., Mladenov, V. (2017): Correlation and Path coefficient analysis of yield components in bread wheat (Triticum aestivum L.). Ann. Agron. 41 (2): 12-20.
Rajičić, V., Milivojević, J., Popović, V., Branković, S., Đurić, N., Perišić, V., Terzić, D. (2019): Winter wheat yield and quality depending on the level of nitrogen, phosphorus and potassium fertilization. Agriculture and Forestry, 65 (2): 79-88.
Rajičić, V., Popović, V., Perišić, V., Biberdžić, M., Jovović, Z., Gudžić, N., Mihailović, V., Čolić, V., Đurić, N., Terzić, D. (2020): Impact of Nitrogen and Phosphorus on Grain Yield in Winter Triticale Grown on Degraded Vertisol. Agronomy, 2020, 10 (6): 757.
Rakaščan, N., Dražić, G., Živanović, Lj., Ikanović, J., Jovović, Z., Lončar, M., Bojović, R., Popović, V. (2019): Effect of genotypes and locations on wheat yield components. Agriculture & Forestry, Podgorica, 65 (1): 233-242.
Rakić, S., Janković, S., Marčetić, M., Rajičić, V., Rakić, R., Rakić, V., Kolarić, Lj. (2020): Functional properties of wheat kernels (Triticum aestivum L.) during storage. Journal of Stored Products Research, May 2020, 87: 101587.
Reynolds, MP., Ortiz Monas Terio, JI., Mcnab, A. (2001): Application of Physiology in Wheat Breeding. Mexico, D.F.: CIMMYT.
Rizwan, M., Ali, S., Ali, B., Adrees, M., Arshad, M., Hussain, A., Zia ur Rehman, M., Waris, A.A. (2019): Zinc and iron oxide nanoparticles improved the plant growth and reduced the oxidative stress and cadmium concentration in wheat, Chemosphere, 214: 269-277.
The impact of ZnO nanoparticles application on yield components of different wheat... 227
Slafer, GA, Calderine, DF, MD, J. (1996): Yield components and compensation in wheat: opportunities for further increasing yield potential. In: RM P., Rajaram S, McNab A, editors. Increasing yield potential in wheat: breaking the barriers. Mexico D.F.: Cimmyt; p. 101–34.
STATISTICA (Data Analysis Software System), version 13. Tulsa, OK, 2017 (www.statsoft.com).
USDA (2015): World Agricultural Production. Foreign Agricultural Service, Office of Global Analysis, United States Department of Agriculture.
Terzić, D., Đekić, V., Milivojević, J., Branković, S., Perišić, V., Perišić, V., Đokić, D. (2018): Yield components and yield of winter wheat in different years of research. Biologica Nyssana, 9 (2): 119-131.
Ugrenović, V., Bodroža Solarov, M., Pezo, L., Đisalov, J., Popović, V., Marić, B., Filipović, V. (2018): Analysis of spelt variability (Triticum spelta L.) grown in different conditions of Serbia by organic conditions. Genetika, 50 (2): 635-646.
Vasileva, V. (2016): Botanical composition improvement with subterranean clover (Trifolium subterraneum L.) in grass mixtures. J.Appl.Sci.,16 (2):68-76.
Vasileva V., Vasilev V. (2020): Agronomic characterization and the possibility for potential use of subterranean clover (Trifolium subterraneum L.) in the forage production in Bulgaria. Pakistan Journal of Botany. 52 (2): 1-5. DOI: http://dx.doi.org/10.30848/PJB2020-2(26)
Zečević, V., Knežević, D., Mićanović, D. (2004a): Phenotypic variability and heritability of plant height in wheat (Triticum aestivum L.). Genetika, Beograd, 36 (2): 143-150.
Zečević, V., Knežević, D., Mićanović, D. (2004b): Genetic correlations and path coefficient analysis of yield and quality components in wheat. Genetika, Belgrade, 36 (1): 13-21.
Zečević, V., Knežević, D., Mićanović, D., Madić, M. (2008): Genetic and phenotypic variability of spike length and plant height in wheat. Kragujevac J. Sci., 30: 125-130.

Agriculture & Forestry, Vol. 66 Issue 2: 229-236, 2020, Podgorica 229
Dubljević, R., Radonjić, D., Marković, M. (2020): Production traits of major types of grasslands in the
Durmitor area. Agriculture and Forestry, 66 (2): 229-236.
DOI: 10.17707/AgricultForest.66.2.20
Radisav DUBLJEVIĆ , Dušica RADONJIĆ, Milan MARKOVIĆ 1
PRODUCTION TRAITS OF MAJOR TYPES OF GRASSLANDS
IN THE DURMITOR AREA
SUMMARY
Research was done on three localities in the area of Durmitor mountain
with the aim to determine the production potential, primarily floristic composition
and yield of important types of mountain grasslands (Nardetum strictae,
Agrostidetum vulgaris and Poetum viollacea). Natural grasslands in this area are
of special importance, because their share in the total agricultural area is above
90% and they are often the only source of fodder for ruminants.
Although Durmitor is a habitat of many plant species, including some
endemic, these grasslands have a simple to semi-complex floristic composition,
mostly due to the competitiveness of leading plants. The share of grasses and
herbaceous plants in the fresh biomass of fodder is over 61-68%, legumes 3-6%,
and plants of other families 29-33%. The highest yield at all localities was
obtained on grassland of the Agrostidetum vulgaris type (7.74 - 9.81 t/ha-1
), and
the lowest on Nardetum strictae 5.72 - 6.94 t/ha-1
of fresh fodder. Although most
of these grasslands are significantly degraded, their production characteristics can
be significantly improved by applying appropriate agricultural techniques and if
they are regularly used.
Keywords: Durmitor, grassland, floristic composition, grasses, legumes,
yield.
INTRODUCTION
Improving the production of animal feed in the mountainous area of
Montenegro is a constant aspiration and goal, but without sufficient commitment
to achieve the expected results. The production resource of natural grasslands is
one of the most important potentials for development of livestock production in
rural areas, where grasslands share in the total agricultural area are above 90%
(Dubljević, 2009). Hay and pasture are the basic, and often the only fodder with a
smaller share of grain and concentrated feed. Bearing in mind that the grasslands
potential is a base for ruminant nutrition, a very significant reduction of the
livestock population directly affected the condition and degree of use of
meadows, and especially pastures in the wider area of Durmitor mountain.
1Radisav Dubljević (corresponding author: [email protected]), Dušica Radonjić, Milan Marković
University of Montenegro, Biotechnical Faculty, Mihaila Lalica 1, 81000, Podgorica,
MONTENEGRO.
Notes: The authors declare that they have no conflicts of interest. Authorship Form signed online.
Received:10/04/2020 Accepted:20/06/2020
Dubljević et al 230
In an effort to reactivate these areas by returning to the countryside, some
measures of agricultural policy are trying to stimulate production, primarily
livestock. To meet such efforts, this research was conducted with the aim to
contribute the determination of the production potential of mountain natural
meadows, which have already been significantly degraded due to poor use and
the absence of the care of swards.
In the earlier period, with a much larger number of heads of ruminants, the
meadows were fertilized with manure, what resulted in good yields and positive
changes in the floristic composition. Bearing in mind that there is almost no
manure in this area nowadays, it would be necessary to apply mineral fertilizers,
especially on swards that will not be in the system of organic livestock
production. Rational fertilization improves the production characteristics of
swards, primarily yield, nutritional value and floristic composition (Dubljević,
2005, 2007, 2010; Vučković et al., 2007; Grubišić et al., 2011; Stoycheva et al.,
2016). The authors emphasized the high degree of degradation of mountain
grasslands in other areas of similar natural conditions, but also the relation to that
resource. There is a real need to work on improvement of the characteristics of
mountain grasslands, especially meadows, in the coming period, but also the
obligation to apply the measures to preserve the state of the environment.
Durmitor mountain plateau (Jezersko-sinjajevinska and Planinsko Pivska
area) is an area that abounds in meadows and pastures of very different potential
and accessibility. In the recent time, most of these areas have not been used due
to the drastic reduction of livestock in mainly abandoned rural areas or villages.
MATERIAL AND METHODS Study of production characteristics of more important types of natural
meadows in the Durmitor area was performed on the territory of the
municipalities of Žabljak (Kovčica, locality B-1), Plužine (Pišče locality B-2) and
Šavnik (Donja Bukovica locality B-3). These localities are at the altitude as
follow: B-1 1500 m; B-2 1650 m and B-3 1250 m.
The study of vegetation and classification of grasslands was performed
using the Braun - Blanquet method. The selected types of grasslands that are the
subject of these studies were determined on the basis of previous research
(Kovačević, 1969; Dubljević, 2005, 2007; Stešević and Caković, 2013; etc.), their
distribution and overall importance for livestock production in this area.
Sward productivity was determined by mowing and measuring fresh fodder
from 1m2 plots (4 x 1 plots for each grassland variant) (3 localities x 3 grassland
types). Dry matter content was determinated by the gravimetric method
according to AOAC (2000). Yield analysis was performed on the basis of weight
participation of grasses, legumes and herbaceous plants or herbs (plants of other
families - Ranunuclaceae, Apiaceae, Scrophulariaceae, Asteraceae, Lamiaceae,
Rubiaceae) in the total yield of fodder.
In the whole area, which is under the influence of a harsh mountain
climate, specific orographic and edaphic factors, (very dynamic relief), several
Production traits of major types of grasslands in the Durmitor area 231
plant communities have been formed on different lands, with similar and
sometimes quite different properties.
Kovačević (1969), examining the grassland communities of the wider area
of Durmitor moutain, identified the following groups:
A - Mountain grasslands: (Goleti and Rudine in the local language)
B - Hilly - mountain grasslands
C - Mountain heaths
D - Hilly grasslands
E - Wetlands
Three main grassland communities or types: Nardetum strictae (A-1),
Agrostietum vulgaris (A-2) and Poetum violacea (A-3) were identified as the
variants of the most represented meadow communities in this area. However, the
other grassland communities (Festucetum vallesiaca, Brometum erecti,
Plantagietum carinata, Festucetum rubra – fallax) are also important but not
considered in this research due to the fact that they have a rather complex floristic
composition.
Statistical analysis encompassed the calculation of basic statistical
parameters. The statistical significance of the results for grassland biomass and
DM in different grassland communities (factor A) and at different location (factor
B) was tested by ANOVA using LSD test. In statistical analysis of data program
Statistica 10 was used.
RESULTS AND DISCUSSION
Meadow types and their botanical features
The wider area of Durmitor mountain is characterized by quite complex
meadow-pasture vegetation, but the larger meadow complexes closer to the
settlements (villages or 'katuns’- mountain settlements) are dominated by types
of Nardetum strictae, Agrostietum vulgarisi, Poetum viollacea, but their
transitional forms created by human influence (fertilization, organized
exploitation, etc.) are also significant.
The Nardetum strictae type
Grasslands of the Nardetum strictae type are dominant in the study area
(table 1), where they consist almost half of the total grassland. They have a
simple floristic composition, changed very slowly, and considered the most
difficult for land reclamation. The leading species Nardus strictae is a plant with
very modest production characteristics (composition, yield and nutritional value),
but due to its good cover and firm and compacted sod, it protects the soil well
from erosion, even on higher slopes.
The formation and spread of this type of grassland was mostly influenced
by unfavorable natural conditions, which limited the development of better
species and their communities, but also man, by poor management.
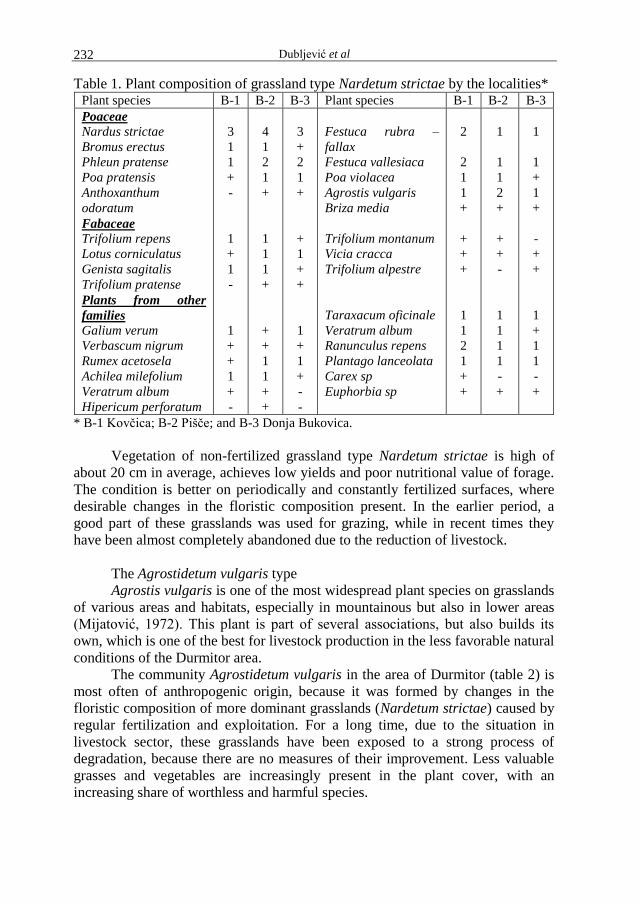
Dubljević et al 232
Table 1. Plant composition of grassland type Nardetum strictae by the localities* Plant species B-1 B-2 B-3 Plant species B-1 B-2 B-3
Poaceae Nardus strictae
Bromus erectus
Phleun pratense
Poa pratensis
Anthoxanthum
odoratum
Fabaceae Trifolium repens
Lotus corniculatus
Genista sagitalis
Trifolium pratense
Plants from other
families
Galium verum
Verbascum nigrum
Rumex acetosela
Achilea milefolium
Veratrum album
Hipericum perforatum
3
1
1
+
-
1
+
1
-
1
+
+
1
+
-
4
1
2
1
+
1
1
1
+
+
+
1
1
+
+
3
+
2
1
+
+
1
+
+
1
+
1
+
-
-
Festuca rubra –
fallax
Festuca vallesiaca
Poa violacea
Agrostis vulgaris
Briza media
Trifolium montanum
Vicia cracca
Trifolium alpestre
Taraxacum oficinale
Veratrum album
Ranunculus repens
Plantago lanceolata
Carex sp
Euphorbia sp
2
2
1
1
+
+
+
+
1
1
2
1
+
+
1
1
1
2
+
+
+
-
1
1
1
1
-
+
1
1
+
1
+
-
+
+
1
+
1
1
-
+
* B-1 Kovčica; B-2 Pišče; and B-3 Donja Bukovica.
Vegetation of non-fertilized grassland type Nardetum strictae is high of
about 20 cm in average, achieves low yields and poor nutritional value of forage.
The condition is better on periodically and constantly fertilized surfaces, where
desirable changes in the floristic composition present. In the earlier period, a
good part of these grasslands was used for grazing, while in recent times they
have been almost completely abandoned due to the reduction of livestock.
The Agrostidetum vulgaris type
Agrostis vulgaris is one of the most widespread plant species on grasslands
of various areas and habitats, especially in mountainous but also in lower areas
(Mijatović, 1972). This plant is part of several associations, but also builds its
own, which is one of the best for livestock production in the less favorable natural
conditions of the Durmitor area.
The community Agrostidetum vulgaris in the area of Durmitor (table 2) is
most often of anthropogenic origin, because it was formed by changes in the
floristic composition of more dominant grasslands (Nardetum strictae) caused by
regular fertilization and exploitation. For a long time, due to the situation in
livestock sector, these grasslands have been exposed to a strong process of
degradation, because there are no measures of their improvement. Less valuable
grasses and vegetables are increasingly present in the plant cover, with an
increasing share of worthless and harmful species.
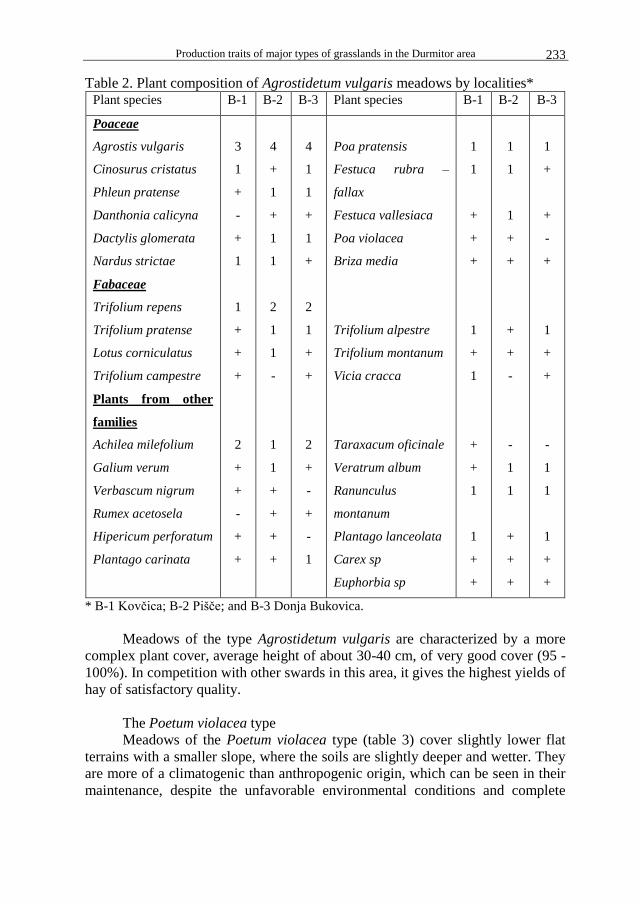
Production traits of major types of grasslands in the Durmitor area 233
Table 2. Plant composition of Agrostidetum vulgaris meadows by localities* Plant species B-1 B-2 B-3 Plant species B-1 B-2 B-3
Poaceae
Agrostis vulgaris
Cinosurus cristatus
Phleun pratense
Danthonia calicyna
Dactylis glomerata
Nardus strictae
Fabaceae
Trifolium repens
Trifolium pratense
Lotus corniculatus
Trifolium campestre
Plants from other
families
Achilea milefolium
Galium verum
Verbascum nigrum
Rumex acetosela
Hipericum perforatum
Plantago carinata
3
1
+
-
+
1
1
+
+
+
2
+
+
-
+
+
4
+
1
+
1
1
2
1
1
-
1
1
+
+
+
+
4
1
1
+
1
+
2
1
+
+
2
+
-
+
-
1
Poa pratensis
Festuca rubra –
fallax
Festuca vallesiaca
Poa violacea
Briza media
Trifolium alpestre
Trifolium montanum
Vicia cracca
Taraxacum oficinale
Veratrum album
Ranunculus
montanum
Plantago lanceolata
Carex sp
Euphorbia sp
1
1
+
+
+
1
+
1
+
+
1
1
+
+
1
1
1
+
+
+
+
-
-
1
1
+
+
+
1
+
+
-
+
1
+
+
-
1
1
1
+
+
* B-1 Kovčica; B-2 Pišče; and B-3 Donja Bukovica.
Meadows of the type Agrostidetum vulgaris are characterized by a more
complex plant cover, average height of about 30-40 cm, of very good cover (95 -
100%). In competition with other swards in this area, it gives the highest yields of
hay of satisfactory quality.
The Poetum violacea type
Meadows of the Poetum violacea type (table 3) cover slightly lower flat
terrains with a smaller slope, where the soils are slightly deeper and wetter. They
are more of a climatogenic than anthropogenic origin, which can be seen in their
maintenance, despite the unfavorable environmental conditions and complete

Dubljević et al 234
neglect. Belongs to the better meadows of this area, especially on unfertilized
areas, thanks to the higher fertility of the land it covers.
These grasslands have a slightly more complex plant cover than the
Nardetum strictae type, with an average height of about 30-40 cm. They give
medium yields of satisfactory quality, especially with earlier mowing. They are
characterized by a very high degree of cover, so since they cover terrains with a
smaller slope, there is almost no soil erosion on them.
Table 3. Plant composition of Poetum violacea meadow by localities* Plant species B-1 B-2 B-3 Plant species B-1 B-2 B-3
Poaceae Poa violacea
Festuca rubra – fallax
Agrostis vulgaris
Cinosurus cristatus
Phleun pratense
Nardus strictae
Fabaceae
Trifolium repens
Trifolium pratense
Lotus corniculatus
Plants from other
families
Achilea milefolium
Galium verum
Verbascum nigrum
Rumex acetosela
Euphorbia sp
Plantago carinata
Ranunculus repens
3
1
+
-
1
1
1
+
+
1
+
+
-
+
+
1
4
1
+
+
1
1
+
-
1
2
+
1
+
+
-
+
3
1
1
+
1
+
1
+
1
1
-
+
+
+
+
+
Festuca vallesiaca
Anthoxanthum
odoratum
Poa pratensis
Briza media
Dactylis glomerata
Trifolium montanum
Vicia cracca
Anthilis vulneraria
Timus montanus
Taraxacum oficinale
Veratrum album
Ranunculus montanum
Plantago lanceolata
Carex sp
2
+
+
+
+
+
+
1
2
+
+
1
1
+
1
+
-
+
+
+
+
1
1
+
1
+
1
-
1
+
+
-
+
+
+
+
1
1
1
1
1
+
* B-1 Kovčica; B-2 Pišče; and B-3 Donja Bukovica.
Yields of grass biomass and dry matter
The results of measuring the yield of fresh grass and dry matter of the
examined types of grassland by localities are given in Table 4. The highest
average yields at all localities were in meadow type Agrostidetum vulgaris,
namely 7.74 t/ha-1
(B-1), 8.86 t/ha-1
(B-3) and 9.81 t/ha-1
(B-2), and the least one
in type of Nardetum strictae, 5.72 t/ha-1
(B-1), 6.47 t/ha-1
(B-3) and 6.94 t/ha-1
(B-2). The average yield of variants A-2 was significantly higher compared to
variants A-1 and A-3.
Apart from the variants (types of grasslands), differences in yield were also
achieved by localities. At sites B-2 and B-3, the yields of fresh fodder of all
variants were significantly higher than the yields at site B-1.
Similar yields of fresh forages were obtained by Mijatović (1972),
Dubljević (2003, 2009, 2010), Vučković et al. (2007), on non-fertilized
grasslands of the type Nardetum striktae, Agrostidetum vulgaris and Poetum
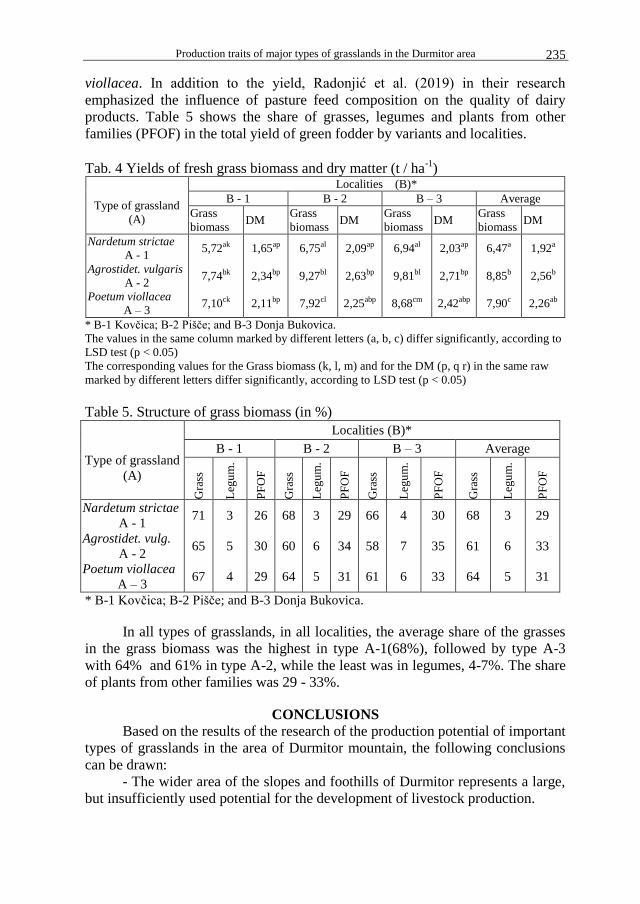
Production traits of major types of grasslands in the Durmitor area 235
viollacea. In addition to the yield, Radonjić et al. (2019) in their research
emphasized the influence of pasture feed composition on the quality of dairy
products. Table 5 shows the share of grasses, legumes and plants from other
families (PFOF) in the total yield of green fodder by variants and localities.
Tab. 4 Yields of fresh grass biomass and dry matter (t / ha-1
)
Type of grassland
(A)
Localities (B)*
B - 1 B - 2 B – 3 Average
Grass
biomass DM
Grass
biomass DM
Grass
biomass DM
Grass
biomass DM
Nardetum strictae
A - 1
Agrostidet. vulgaris
A - 2
Poetum viollacea
A – 3
5,72ak
7,74bk
7,10ck
1,65ap
2,34bp
2,11bp
6,75al
9,27bl
7,92cl
2,09ap
2,63bp
2,25abp
6,94al
9,81bl
8,68cm
2,03ap
2,71bp
2,42abp
6,47a
8,85b
7,90c
1,92a
2,56b
2,26ab
* B-1 Kovčica; B-2 Pišče; and B-3 Donja Bukovica.
The values in the same column marked by different letters (a, b, c) differ significantly, according to
LSD test (p < 0.05)
The corresponding values for the Grass biomass (k, l, m) and for the DM (p, q r) in the same raw
marked by different letters differ significantly, according to LSD test (p < 0.05)
Table 5. Structure of grass biomass (in %)
Type of grassland
(A)
Localities (B)*
B - 1 B - 2 B – 3 Average
Gra
ss
Leg
um
.
PF
OF
Gra
ss
Leg
um
.
PF
OF
Gra
ss
Leg
um
.
PF
OF
Gra
ss
Leg
um
.
PF
OF
Nardetum strictae
A - 1
Agrostidet. vulg.
A - 2
Poetum viollacea
A – 3
71
65
67
3
5
4
26
30
29
68
60
64
3
6
5
29
34
31
66
58
61
4
7
6
30
35
33
68
61
64
3
6
5
29
33
31
* B-1 Kovčica; B-2 Pišče; and B-3 Donja Bukovica.
In all types of grasslands, in all localities, the average share of the grasses
in the grass biomass was the highest in type A-1(68%), followed by type A-3
with 64% and 61% in type A-2, while the least was in legumes, 4-7%. The share
of plants from other families was 29 - 33%.
CONCLUSIONS
Based on the results of the research of the production potential of important
types of grasslands in the area of Durmitor mountain, the following conclusions
can be drawn:
- The wider area of the slopes and foothills of Durmitor represents a large,
but insufficiently used potential for the development of livestock production.
Dubljević et al 236
- Meadow types Nardetum strictae, Agrostidetum vulgaris and Poetum
viollacea are dominant in this area, but Festucetum vallesiaca, Brometum erecti,
Festucetum rubra-falax and others are significantly present.
- The highest average fresh grass yields were in the meadow type of
Agrostidetum vulgaris 8.85 t/ha-1, and the lowest in Nardetum strictae 6.47 t/ha-
1 of green fodder.
- The average share in the total yield of fresh biomass was 61 - 68% of
grasses, 3 - 6% of legumes and 31 - 33% of the other plant families.
REFERENCES AOAC 2000. Official methods of analysis of AOAC International. 17th ed. Gaithersburg,
Maryland, USA (method number 991.20; 33.2.11). Dubljević, R.; Mitrović, D. 2010. Fertilizing results of high montain grasslands
Poetumviolace. Biotehnology in Animal Husbadry, p 417 – 422, 2010. Institutefor Animal Husbandry, Belgrade - Zemun.
Dubljević, R, ; Mitrović, D. 2009. Productive Featurer of Mountain Lawn Type Agrostidetum vulgaris, Fertilizadwzh Differet Nitrogen Doses. Agroznanje, Vol. 10. Br. 2, ISSN. 1512, Banja Luka
Dubljević, R. 2003. Uticaj đubrenja azotom na proizvodne osobine travnjaka Nardetum strictae. Poljoprivreda i šumarstvo, Vol 49 (1-2) 39-46. Podgorica.
Dubljević, R. 2007. Uticaj đubrenja azotom na proizvodne osobine livade tipa Agrostietum vulgaris u brdskom području Polimlja. Institut za ratarstvo i povrtarstvo, Novi Sad, Zbornik radova-Vol. 44, No. I, Novi Sad.
Dubljević, R. 2009. Country Pasture Forage Resource Profiles. FAO. Đuričković, M. 1978. Ispitivanje agrotehničkih i agromelioracionih mjera za povećanje
proizvodnje na prirodnim livadama. Poljoprivreda i šumarstvo, XXIV, 1, 85-90. Titograd.
Mijatović, M. 1972. Tipovi prirodnih livada i pašnjaka na planini Stolovi i njihove proizvodne osobine. Univerzitet u Beogradu, Zbornik radova Poljoprivrednog fakulteta. God XX, sv. 549, 1 – 17. Beograd.
Grubišić, M.; Vuković, Z.; Savić, N.; Stojanović, S. 2011. Nove mere i tehnologije u biološkoj rekultivaciji zemljišta na odlagalištu Drmno. Zbornik radova II Simpozijuma, Vrnjačka Banja PKS Str. 700-705. Beograd.
Kovačević, J. 1969. Travnjačke biljne zajednice Durmitorsko – Sinjajevinske i centralne oblasti Crne Gore u odnosu na faktore staništa. Poljoprivredna znanstvena smotra. Sv. 26. br 10. Zagreb.
Radonjić, D. 2019. Uticaj ispaše na travnjacima različitih područja Crne Gore na sadržaj masnih kisjelina u kravljem mlijeku. Univerzitet u Beogradu, Poljoprivredni fakultet Zemun.
Stat-Soft Inc. 2010. STATISTICA (Data Analyses Software System), v.10.0. 2010., USA. www.statsoft.com.
Stešević, D.; Caković, D. 2013. Katalog vaskularne flore Crne Gore, Tom I CAN-u Podgorica.
Stoycheva, I.; Kirilov, A.; Naydenova, Y; Katova, A. 2016. Yield and composition changes of temporary and permanent pasture. Grassland Science in Evrope 21: 317-320.
Vučković, S.; Simić, A.; Đorđević, N.; Živković, D.; Erić, P., Ćupina, B.; Stojanović, I.; Petrović-Tošković, S. 2007. Uticaj đubrenja na prinos livade tipa Agrostietum vulgaris u zapadnoj Srbiji. Zbornik radova Instituta za ratarstvo i povrtarstvo, 44, 1, 355-360.
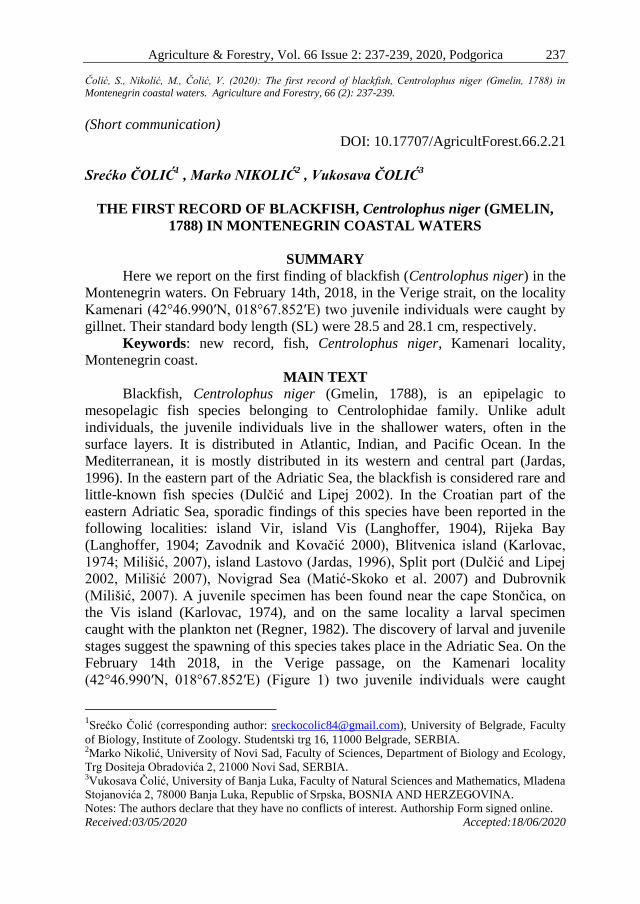
Agriculture & Forestry, Vol. 66 Issue 2: 237-239, 2020, Podgorica 237
Čolić, S., Nikolić, M., Čolić, V. (2020): The first record of blackfish, Centrolophus niger (Gmelin, 1788) in
Montenegrin coastal waters. Agriculture and Forestry, 66 (2): 237-239.
(Short communication)
DOI: 10.17707/AgricultForest.66.2.21
Srećko ČOLIĆ1 , Marko NIKOLIĆ
2 , Vukosava ČOLIĆ
3
THE FIRST RECORD OF BLACKFISH, Centrolophus niger (GMELIN,
1788) IN MONTENEGRIN COASTAL WATERS
SUMMARY
Here we report on the first finding of blackfish (Centrolophus niger) in the
Montenegrin waters. On February 14th, 2018, in the Verige strait, on the locality
Kamenari (42°46.990′N, 018°67.852′E) two juvenile individuals were caught by
gillnet. Their standard body length (SL) were 28.5 and 28.1 cm, respectively.
Keywords: new record, fish, Centrolophus niger, Kamenari locality,
Montenegrin coast.
MAIN TEXT
Blackfish, Centrolophus niger (Gmelin, 1788), is an epipelagic to
mesopelagic fish species belonging to Centrolophidae family. Unlike adult
individuals, the juvenile individuals live in the shallower waters, often in the
surface layers. It is distributed in Atlantic, Indian, and Pacific Ocean. In the
Mediterranean, it is mostly distributed in its western and central part (Jardas,
1996). In the eastern part of the Adriatic Sea, the blackfish is considered rare and
little-known fish species (Dulčić and Lipej 2002). In the Croatian part of the
eastern Adriatic Sea, sporadic findings of this species have been reported in the
following localities: island Vir, island Vis (Langhoffer, 1904), Rijeka Bay
(Langhoffer, 1904; Zavodnik and Kovačić 2000), Blitvenica island (Karlovac,
1974; Milišić, 2007), island Lastovo (Jardas, 1996), Split port (Dulčić and Lipej
2002, Milišić 2007), Novigrad Sea (Matić-Skoko et al. 2007) and Dubrovnik
(Milišić, 2007). A juvenile specimen has been found near the cape Stončica, on
the Vis island (Karlovac, 1974), and on the same locality a larval specimen
caught with the plankton net (Regner, 1982). The discovery of larval and juvenile
stages suggest the spawning of this species takes place in the Adriatic Sea. On the
February 14th 2018, in the Verige passage, on the Kamenari locality
(42°46.990′N, 018°67.852′E) (Figure 1) two juvenile individuals were caught
1Srećko Čolić (corresponding author: [email protected]), University of Belgrade, Faculty
of Biology, Institute of Zoology. Studentski trg 16, 11000 Belgrade, SERBIA. 2Marko Nikolić, University of Novi Sad, Faculty of Sciences, Department of Biology and Ecology,
Trg Dositeja Obradovića 2, 21000 Novi Sad, SERBIA. 3Vukosava Čolić, University of Banja Luka, Faculty of Natural Sciences and Mathematics, Mladena
Stojanovića 2, 78000 Banja Luka, Republic of Srpska, BOSNIA AND HERZEGOVINA.
Notes: The authors declare that they have no conflicts of interest. Authorship Form signed online.
Received:03/05/2020 Accepted:18/06/2020
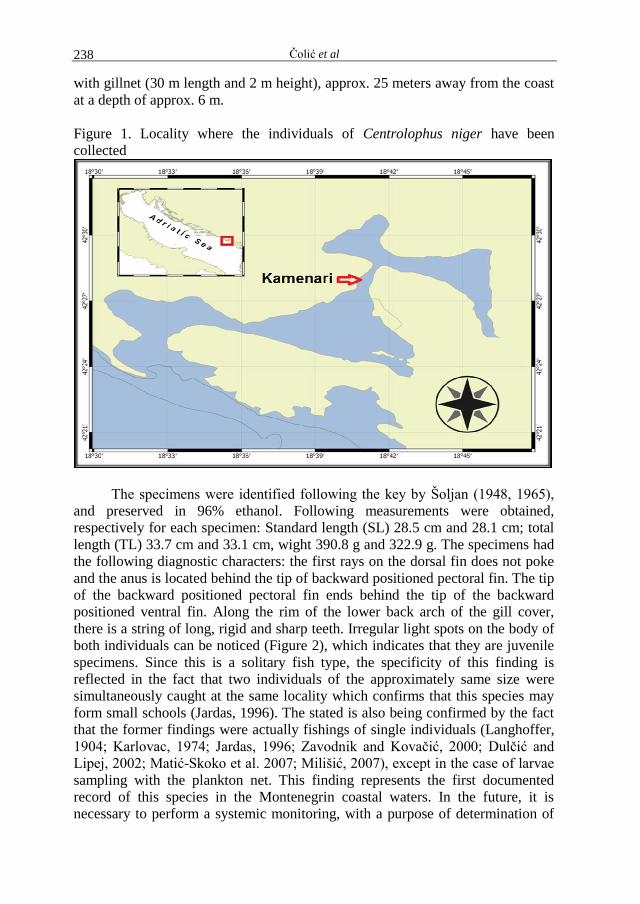
Čolić et al 238
with gillnet (30 m length and 2 m height), approx. 25 meters away from the coast
at a depth of approx. 6 m.
Figure 1. Locality where the individuals of Centrolophus niger have been
collected
The specimens were identified following the key by Šoljan (1948, 1965),
and preserved in 96% ethanol. Following measurements were obtained,
respectively for each specimen: Standard length (SL) 28.5 cm and 28.1 cm; total
length (TL) 33.7 cm and 33.1 cm, wight 390.8 g and 322.9 g. The specimens had
the following diagnostic characters: the first rays on the dorsal fin does not poke
and the anus is located behind the tip of backward positioned pectoral fin. The tip
of the backward positioned pectoral fin ends behind the tip of the backward
positioned ventral fin. Along the rim of the lower back arch of the gill cover,
there is a string of long, rigid and sharp teeth. Irregular light spots on the body of
both individuals can be noticed (Figure 2), which indicates that they are juvenile
specimens. Since this is a solitary fish type, the specificity of this finding is
reflected in the fact that two individuals of the approximately same size were
simultaneously caught at the same locality which confirms that this species may
form small schools (Jardas, 1996). The stated is also being confirmed by the fact
that the former findings were actually fishings of single individuals (Langhoffer,
1904; Karlovac, 1974; Jardas, 1996; Zavodnik and Kovačić, 2000; Dulčić and
Lipej, 2002; Matić-Skoko et al. 2007; Milišić, 2007), except in the case of larvae
sampling with the plankton net. This finding represents the first documented
record of this species in the Montenegrin coastal waters. In the future, it is
necessary to perform a systemic monitoring, with a purpose of determination of
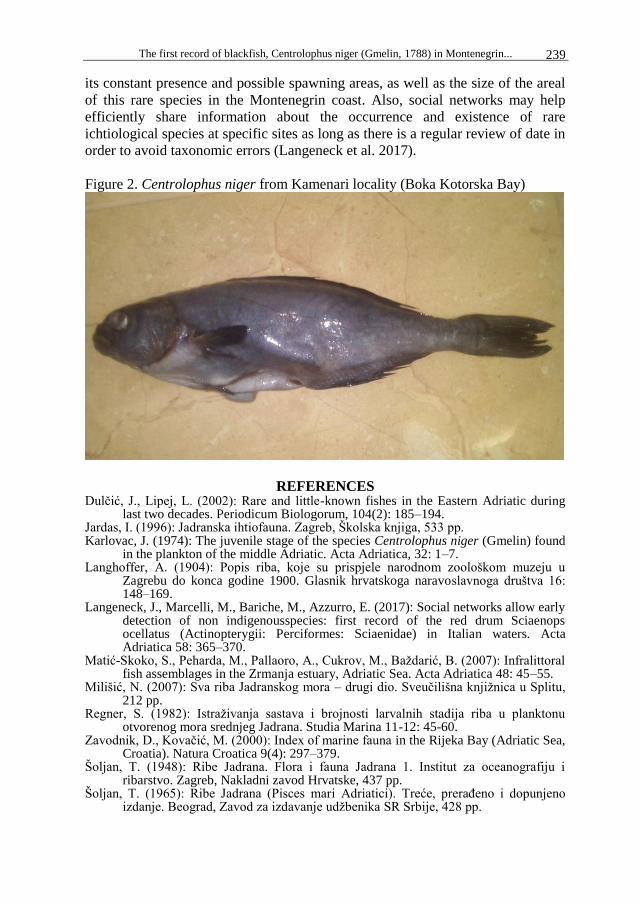
The first record of blackfish, Centrolophus niger (Gmelin, 1788) in Montenegrin... 239
its constant presence and possible spawning areas, as well as the size of the areal
of this rare species in the Montenegrin coast. Also, social networks may help
efficiently share information about the occurrence and existence of rare
ichtiological species at specific sites as long as there is a regular review of date in
order to avoid taxonomic errors (Langeneck et al. 2017).
Figure 2. Centrolophus niger from Kamenari locality (Boka Kotorska Bay)
REFERENCES Dulčić, J., Lipej, L. (2002): Rare and little-known fishes in the Eastern Adriatic during
last two decades. Periodicum Biologorum, 104(2): 185–194. Jardas, I. (1996): Jadranska ihtiofauna. Zagreb, Školska knjiga, 533 pp. Karlovac, J. (1974): The juvenile stage of the species Centrolophus niger (Gmelin) found
in the plankton of the middle Adriatic. Acta Adriatica, 32: 1–7. Langhoffer, A. (1904): Popis riba, koje su prispjele narodnom zoološkom muzeju u
Zagrebu do konca godine 1900. Glasnik hrvatskoga naravoslavnoga društva 16: 148–169.
Langeneck, J., Marcelli, M., Bariche, M., Azzurro, E. (2017): Social networks allow early detection of non indigenousspecies: first record of the red drum Sciaenops ocellatus (Actinopterygii: Perciformes: Sciaenidae) in Italian waters. Acta Adriatica 58: 365–370.
Matić-Skoko, S., Peharda, M., Pallaoro, A., Cukrov, M., Baždarić, B. (2007): Infralittoral fish assemblages in the Zrmanja estuary, Adriatic Sea. Acta Adriatica 48: 45–55.
Milišić, N. (2007): Sva riba Jadranskog mora – drugi dio. Sveučilišna knjižnica u Splitu, 212 pp.
Regner, S. (1982): Istraživanja sastava i brojnosti larvalnih stadija riba u planktonu otvorenog mora srednjeg Jadrana. Studia Marina 11-12: 45-60.
Zavodnik, D., Kovačić, M. (2000): Index of marine fauna in the Rijeka Bay (Adriatic Sea, Croatia). Natura Croatica 9(4): 297–379.
Šoljan, T. (1948): Ribe Jadrana. Flora i fauna Jadrana 1. Institut za oceanografiju i ribarstvo. Zagreb, Nakladni zavod Hrvatske, 437 pp.
Šoljan, T. (1965): Ribe Jadrana (Pisces mari Adriatici). Treće, prerađeno i dopunjeno izdanje. Beograd, Zavod za izdavanje udžbenika SR Srbije, 428 pp.

Agriculture and Forestry, Vol 66, Issue 2: 241-242, Podgorica, 2020 241
INSTRUCTIONS TO AUTHORS The "Agriculture and Forestry" journal publishes original scientific papers, review
papers, short communications on agriculture, veterinary medicine, forestry, biology and other natural sciences. It is the endeavour of the journal to give place to papers of high scientific quality and international interest, authored by all the scientists from the South Eastern European Region, as well as other international scientist in order to stimulate contacts and exchange of knowledge fostering scientific productivity.
Manuscripts, submitted via electronic journal web system should be prepared in Microsoft Word (Times New Roman font, 11 pt) and submitted in format 17 x 24 cm (File / Page setup / Paper / Width = 17 cm; Height = 24 cm), with single line spacing (Format / Paragraph / Line spacing = Single), 2 cm margins all around (File / Page setup / Margins / Top = 2 cm; Bottom = 2 cm; Left = 2 cm; Right = 2 cm), that is approximately 44 lines per page in this format. All technical details are available in section AUTHORS / Check-list for Authors.
Manuscripts are published in English. Papers that have been published elsewhere, in whole or extracts (excerpts) of their important findings, will not be accepted. A manuscript should not exceed 10 pages. Exceptions can be made if content and quality of the paper justify it (at the discretion of the Editor). Full research papers should include the following sections: - Author/s name/s, Title with DOI number The author's name should be placed above the title and with the author's appellation and affiliation in a footnote at the bottom of the front page. Author(s) affiliation should indicate name and address of institution, including the e-mail address of the corresponding author. Title should provide a concise but also an informative synthesis of the study (recommended not more than 100 characters including spaces). Short title (not more than 70 characters) should also be provided in order to be included in the header of the Manuscript. Ensure that the title contains the most important words that relate to the topic. - Abstract The summary, in English language, should provide basic data on the problem that was treated and the results obtained. It should be brief, preferably one paragraph only, up to 250 words, but sufficient to inform the reader of the character of the work, its results and its conclusions. Include the keywords and phrases you repeated in your abstract. - Key words Keywords should provide 4-6 words or compound words, suitable for an information retrieval system. Choose the appropriate keywords and phrases for your article. Think of a phrase of 2-4 words that a researcher might search on to find your article. Repeat your keywords and phrases 3-4 times throughout the abstract in a natural, contextual way. Main text of the manuscript includes the following sections: - INTRODUCTION
The introduction should answer the questions what was studied, why was it an important question, what was known about it before and how the study will advance our knowledge.
- MATERIAL AND METHODS Material and methods explain how the study was carried: the organism(s) studied; description of the study site, including the significant physical and biological features, and the precise location (latitude and longitude, map, etc); the
Instructions to authors 242
experimental or sampling design; the protocol for collecting data; how the data were analyzed. In this section also should be provided a clear description of instruments and equipment, machines, devices, chemicals, diagnostic kits, plants/animals studied, technology of growing/housing, sampling sites, software used etc.
- RESULTS followed by DISCUSSION Results and Discussion may be combined into a single section (if appropriate) or it can be a separate section. The results objectively present key results, without interpretation, in an orderly and logical sequence using both text and illustrative materials (tables and figures). The discussion interpret results in light of what was already known about the subject of the investigation, and explain new understanding of the problem after taking results into consideration. The International System of Units (SI) should be used.
- CONCLUSIONS The conclusion should present a clear and concise review of experiments and results obtained, with possible reference to the enclosures.
- ACKNOWLEDGMENTS If received significant help in designing, or carrying out the work, or received materials from someone who did a favour by supplying them, their assistance must be acknowledged. Acknowledgments are always brief and never flowery.
- REFERENCES (LITERATURE) References should cover all papers cited in the text. The in-text citation format should be as follows: for one author (Karaman, 2011), for two authors (Erjavec and Volk, 2011) and for more than two authors (Rednak et al., 2007). Use semicolon (Rednak et al., 2012; Erjavec and Volk, 2011) to separate multiple citations. Multiple citations should be ordered chronologically. The literature section gives an alphabetical listing (by first author's last name) of the references. More details you can find in the Annex to the INSTRUCTIONS TO AUTHORS / Bibliographic style on the web page of the Journal: www.agricultforest.ac.me.
Short communication should include the following sections: Title, Abstract, Key words, Main text, Acknowledgments, References, Tables and Figures with captions.
SUPPLY OF ARTWORK, PHOTOS: Diagrams and graphs should be provided as finished black and white line artwork or colour images. Electronic graphics included in your manuscript should be either inserted in the word document or as .gif or .jpg formats. Please check with the editor if you wish to submit any other type of graphic for conversion suitability. Photos should be supplied un-screened in original form or in electronic form. All illustration (diagrams, graphs, tables, photos) must be fully captioned. When there are a number of illustrations, the author should endeavour to reduce the amount of text to accommodate the illustrations in the limited space available for any article.
THE REVIEW PROCESS: Submitted manuscripts are reviewed anonymously by 2 referees (duble blind review): one from the journal Editorial board, one must be an international reviewer, working out of the University of Montenegro. All tracking of manuscripts and reviewers is done by the Editor. All attempts will be made to ensure submissions will be reviewed within three months after the submission. Manuscripts will be returned to the coresponding authors when each review is completed.
Examples available on www.agricultforest.ac.me.
Related Documents