Food and Nutrition Technical Assistance Project (FANTA) Academy for Educational Development 1825 Connecticut Ave., NW Washington, DC 20009-5721 Tel: 202-884-8000 Fax: 202-884-8432 E-mail: [email protected] Website: www.fantaproject.org Agricultural Productivity Indicators Measurement Guide Patrick Diskin December 1997

Welcome message from author
This document is posted to help you gain knowledge. Please leave a comment to let me know what you think about it! Share it to your friends and learn new things together.
Transcript
Food and Nutrition Technical Assistance Project (FANTA)Academy for Educational Development 1825 Connecticut Ave., NW Washington, DC 20009-5721
Tel: 202-884-8000 Fax: 202-884-8432 E-mail: [email protected] Website: www.fantaproject.org
Agricultural ProductivityIndicators MeasurementGuide
Patrick Diskin
December 1997
This publication was made possible throughthe support provided to the Food andNutrition Technical Assistance (FANTA)Project by the Office of Health, InfectiousDisease and Nutrition of the Bureau forGlobal Health at the U.S. Agency forInternational Development, under terms ofCooperative Agreement No. HRN-A-00-98-00046-00 awarded to the Academy forEducational Development (AED).Additional support was provided by theOffice of Food for Peace of the Bureau forDemocracy, Conflict and HumanitarianAssistance. Earlier drafts of the guide weredeveloped with funding from the Food andNutrition Monitoring Project (IMPACT)(Contract No. DAN-5110-Q-00-0014-00,Delivery Order 16), managed by theInternational Science and TechnologyInstitute, Inc. (ISTI).
The opinions expressed herein are those ofthe author(s) and do not necessarily reflectthe views of the U.S. Agency forInternational Development.
Published December 1997
Recommended citation:Diskin, Patrick. Agricultural ProductivityIndicators Measurement Guide.Washington, D.C.: Food and NutritionTechnical Assistance Project, Academy forEducational Development, 1997.
Copies of the publication can be obtainedfrom:Food and Nutrition Technical Assistance(FANTA) ProjectAcademy for Educational Development1825 Connecticut Avenue, NWWashington, D.C. 20009-5721Tel: 202-884-8000Fax: 202-884-8432Email: [email protected]: www.fantaproject.org

Acknowledgements
This guide was written by Patrick Diskin. The author wishes to thank the reviewers for theirhelpful comments on the drafts. Eunyong Chung of the USAID Global Health Bureau's Officeof Health, Infectious Disease and Nutrition provided useful insight and support for thedevelopment of this Guide. The Office of Food for Peace was instrumental in supporting ourefforts for the Guide. Anne Swindale and Bruce Cogill of the IMPACT Project providedextensive comments and assistance. Special thanks to the efforts of the editor, Dorothy B.Wexler, and the layout advisor, Stacy Swartwood. The Cooperating Sponsors were essential tothe development of the Guide. This guide is dedicated to them.
TABLE OF CONTENTS
1. Purpose of Guide 1
2. Issues Related to Measurement and Interpretation of Impact2.1. Impacts on Crop Yields2.2. Gaps in Actual vs. Potential Yields2.3. Changes in Yield Variability2.4. Values of Crop Production2.5. Number of Months of Food Stocks2.6. Measuring Crop Storage Losses
449
10101313
3. Data Collection Plan3.1. General Principles3.2. Data Collection Plan
151516
4. Calculating Indicators4.1. Changes in Crop Yiels4.2. Gaps in Actual vs. Potential Yields4.3. Changes in Yields Variability4.4. Values of Crop Production4.5. Number of Months of Food Stocks4.6. Crop Storage Losses
32323233343636
5. References 37
APPENDICESAppendix 1: Discussion of Alternative Methods for Estimating Crop YieldsAppendix 2: List of Generic Title II Indicators
4045
TABLESTable 1: Generic Agricultural Productivity Performance Indicators for Title II food Aid Development ActivitiesTable 2: Summary of Data Collection Plan for Measuring Title II Agricultural Productivity Indicators
3
18
FIGURESFigure 1: Straight Line Approximation of Irregular Shaped PlotsFigure 2: Breaking Irregular Shaped Sides into SegmentsFigure 3: Closing Error Resulting from Measurement InaccuraciesFigure 4: Sample Standard Deviation Calculation
23242735
Purpose of Guide
1
1. Purpose of Guide
This series of Title II Generic Indicator Guides has been developed by the Food and NutritionTechnical Assistance (FANTA) Project and its predecessor projects (IMPACT, LINKAGES), aspart of USAID’s support of the Cooperating Sponsors in developing monitoring and evaluationsystems for use in Title II programs. These guides are intended to provide the technical basis forthe indicators and the recommended method for collecting, analyzing and reporting on thegeneric indicators that were developed in consultation with the PVOs in 1995/1996.
Below is the list of available guides:
! Food Security Indicators and Framework for use in the Monitoring and Evaluation ofFood Aid Programs by Frank Riely, Nancy Mock, Bruce Cogill, Laura Bailey, and EricKenefick
! Infant and Child Feeding Indicators Measurement Guide by Mary Lung'aho
! Food for Education Indicator Guide by Gilles Bergeron and Joy Miller Del Rosso
! Sampling Guide by Robert Magnani
! Anthropometric Indicators Measurement Guide by Bruce Cogill
! Measuring Household Food Consumption: A Technical Guide by Anne Swindale andPunam Ohri-Vachaspati
! Water and Sanitation Indicators Measurement Guide by Pat Billig
! Agricultural Productivity Indicators Measurement Guide by Patrick Diskin
This guide discusses the subset of generic Title II indicators identified for agriculturalproductivity-related activities. These are listed below in Table 1, together with a summary oftheir measurement requirements and analytical concerns. The guide is divided into four sections,plus appendices:
Section 1. Purpose of Guide.
Section 2. Issues Related to Measurement and Interpretation of Impact Indicators. Thissection explores the many difficult issues and concerns that arise regarding the measurement andinterpretation of the first six agricultural impact indicators shown in Table 1. These areconsidered impact indicators, as opposed to indicators 7 and 8, which are monitoring indicatorsand which are relatively straightforward to measure. This discussion is intended in part to helppractitioners avoid pitfalls in measuring these indicators that may lead to misinterpretations ofthe resulting data. It also lays a basis for the recommended methods in the proposed datacollection plan.
Section 3. Data Collection Plan. Section 3. recommends a data collection plan for the sixindicators. The proposed methods are designed to minimize measurement problems and

Purpose of Guide
2
maximize the ability to make a plausible (if not definitive) case for demonstrating activityimpacts within resource constraints for carrying out monitoring and evaluation activities.
Section 4. Calculating Indicators. This section describes how to calculate the values of thefirst six indicators listed in Table 1 below, based on the data collected.
Appendix 1. Discussion of Alternative Methods for Estimating Crop Yields. The firstappendix provides a discussion on the relative merits of crop cut versus farmer estimationmethods for estimating crop yields.
Appendix 2. List of Generic Title II Indicators. The second appendix is a list of generic TitleII indicators.
Purpose of Guide
3
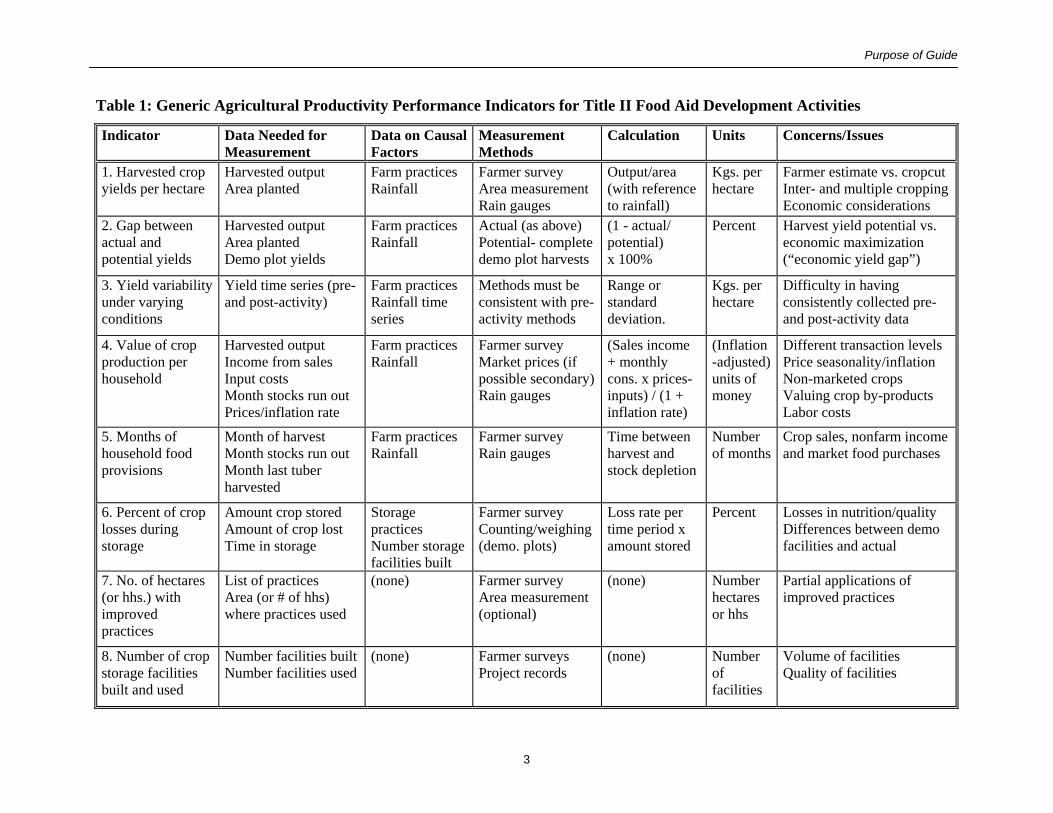
Table 1: Generic Agricultural Productivity Performance Indicators for Title II Food Aid Development Activities
Indicator Data Needed forMeasurement
Data on CausalFactors
MeasurementMethods
Calculation Units Concerns/Issues
1. Harvested cropyields per hectare
Harvested outputArea planted
Farm practicesRainfall
Farmer surveyArea measurementRain gauges
Output/area(with referenceto rainfall)
Kgs. perhectare
Farmer estimate vs. cropcutInter- and multiple croppingEconomic considerations
2. Gap betweenactual andpotential yields
Harvested outputArea plantedDemo plot yields
Farm practicesRainfall
Actual (as above)Potential- completedemo plot harvests
(1 - actual/potential)x 100%
Percent Harvest yield potential vs.economic maximization(“economic yield gap”)
3. Yield variabilityunder varyingconditions
Yield time series (pre-and post-activity)
Farm practicesRainfall timeseries
Methods must beconsistent with pre-activity methods
Range orstandarddeviation.
Kgs. perhectare
Difficulty in havingconsistently collected pre-and post-activity data
4. Value of cropproduction perhousehold
Harvested outputIncome from salesInput costsMonth stocks run outPrices/inflation rate
Farm practicesRainfall
Farmer surveyMarket prices (ifpossible secondary)Rain gauges
(Sales income+ monthlycons. x prices-inputs) / (1 +inflation rate)
(Inflation-adjusted)units ofmoney
Different transaction levelsPrice seasonality/inflationNon-marketed cropsValuing crop by-productsLabor costs
5. Months ofhousehold foodprovisions
Month of harvestMonth stocks run outMonth last tuberharvested
Farm practicesRainfall
Farmer surveyRain gauges
Time betweenharvest andstock depletion
Numberof months
Crop sales, nonfarm incomeand market food purchases
6. Percent of croplosses duringstorage
Amount crop storedAmount of crop lostTime in storage
StoragepracticesNumber storagefacilities built
Farmer surveyCounting/weighing(demo. plots)
Loss rate pertime period xamount stored
Percent Losses in nutrition/qualityDifferences between demofacilities and actual
7. No. of hectares(or hhs.) withimprovedpractices
List of practicesArea (or # of hhs)where practices used
(none) Farmer surveyArea measurement(optional)
(none) Numberhectaresor hhs
Partial applications ofimproved practices
8. Number of cropstorage facilitiesbuilt and used
Number facilities builtNumber facilities used
(none) Farmer surveysProject records
(none) Numberoffacilities
Volume of facilitiesQuality of facilities

Issues Related to Measurement and Interpretation of Impact
4
2. Issues Related to Measurement and Interpretation of Impact
This section discusses issues relating to the measurement and interpretation of the six genericagricultural productivity performance impact indicators listed in Table 1. Ultimately, many ofthese issues cannot be resolved adequately, particularly given the limited resources available toPVOs and USAID for data collection. These measurement problems will inevitably impede theability to draw definitive conclusions with statistical confidence on the ultimate impacts of TitleII activities on agricultural productivity. A clear understanding of the measurement problems isnevertheless important for identifying data collection approaches that minimize measurementbiases, avoid misinterpretations of data, improve causal links between activities and outcomes,and thereby improve the possibility of drawing sound conclusions about the impacts of theactivities.
2.1. Impacts on Crop Yields
Crop yield per area (amount of crop harvested per amount of land planted) is the most commonlyused impact indicator for Title II agricultural productivity activities.1 Trying to assess impacts ofinterventions on crop yields over time, however, raises a number of important data measurementand interpretation concerns. These include (1) rainfall and other exogenous factors; (2) choice ofdata collection methods; (3) sample size requirements; (4) data collection biases; (5) mixed(inter-) cropping; (6) multiple or continuous harvesting; and (7) non-standard units. Each isdiscussed below.
2.1.1. Rainfall and Other Exogenous Factors Affecting Yields
Crop yields are inevitably affected by many factors beyond the control of Title II food aidactivities, such as weather, input prices, locust cycles, etc. These factors, and their effects onyields, may vary from year to year. The question is how to control for changes in yieldsresulting from such factors.
Weather, especially rainfall, is the most important factor. Most Title II activities areimplemented in areas dependent on rainfed agriculture. In such systems, variations from year toyear in the amount, timing and distribution of rainfall can have a greater effect on yield levels
1 Some Title II activities also use production per household (or target area) — i.e., the total amount in terms of weight of a cropthat a household (or target area) produces — as an indicator, disaggregating this indicator by crop type. This is generally a poorchoice. One reason is that changing economic or environmental conditions (e.g., changes in relative market prices or the timingof rainfall) may (and should) lead farmers to adjust relative crop mixes based on expected returns. Since these conditions will notbe known in advance of the project, setting specific crop-disaggregated targets for increased production is complicated in that itinvolves predicting not only yield increases from project interventions, but also changes in relative cultivated areas. Anotherreason for not setting crop-specific production increases as targets is that this may be counterproductive, since in some situationsit may be better to reduce production of one crop in favor of another. A third reason is that most Title II agricultural activities arefocused on yield-related interventions rather than area-planted-related interventions. Consequently, production targets are lesswell linked to project activities than yield targets. A final complication is the need to disaggregate crop types; if disaggregation isnot done, more comparable units of measurement will have to be established since using crop weights results in “comparingapples and oranges” (e.g., a pound of sorghum and a pound of teff are not equivalent nutritionally or economically). Usingcalories as the standard for comparison may be appropriate in a predominately subsistence economy. Market value would be thebest choice otherwise, but this would simply convert this indicator into Indicator #4 on Table 1 — “Value of agriculturalproduction per household.”

Issues Related to Measurement and Interpretation of Impact
5
than project-related factors, such as changes in farming practices, amounts of fertilizer used,quality of seed varieties, and even use of irrigation.
The importance of weather is so great that, unless weather data are referred to when comparingyields at two or three points in time, a plausible case for the impacts of project activities onyields cannot be made. An exception is if weather factors are similar between years. Theproblem can be reduced (but not eliminated) by tracking yield trends over a longer period ofyears than the five-year life span of most Title II activities (Kelly et al., 1995). The greater theyield variation resulting from exogenous factors, the greater the number of years of data needed.2
One approach to control for weather and other exogenous factors is to collect yield data on acontrol group of non-project participants (Riely & Mock, 1995). The difficulty of identifying asuitable control group and the costs involved, however, generally make this approach unlikely.A simpler and less costly (though less persuasive) approach is to collect data on rainfall (or otherclimatic factors) and explicitly relate yield data to the climatic data (i.e., report them side-by-side). Title II activities generally do not do this. Instead, results reports have tended to noteadverse climate factors anecdotally and only in cases where yields have not risen as expected.When yields have increased at or above targeted levels, however, the credit is given to projectactivities, not the weather.
Many developing countries do collect regionally disaggregated rainfall data, which are recordedannually and sometimes seasonally. Such data are rarely made available systematically in asufficiently disaggregated form (Kelly et al., 1995), however. A better alternative is to haveTitle II PVO staff collect primary rain data. This is already done in some cases. The approach issimple, involving distribution of rain gauges to farmer participants (see Section 3.2.2.2.).
The other aspect of controlling for weather is to have strong data that document that farmershave indeed adopted the farming practices advocated in the project. This is essential to the casethat it is these practices — and not the weather — that have affected yield levels. Monitoring theadoption of Title II-activity-promoted practices is thus crucial.
As discussed below, three other Title II generic indicators are also affected by weather factors:yield gap, value of agricultural production per household, and months of household grainprovisions.
2 Poate & Casley (1985) illustrate this using hypothetical figures. They show that to calculate a linear trend slope of 10 percent,with a standard deviation of 2 percent of base yield and a random variation from exogenous factors of 15 percent, approximatelynine years of data would be required. In this case, if the annual increment in yield being estimated is 100 kilograms per hectare,the confidence interval with nine time points would be approximately 60-140 kilograms. With only four to five years of data, itwould be difficult to detect a yield trend that is rising even at 10 percent a year and be sure that it is significantly higher thanzero; under such circumstances, data on year-to-year changes in crop yields would be only “indicative.”

Issues Related to Measurement and Interpretation of Impact
6
2.1.2. Choice of Data Collection Methods
Several methods are available for estimating harvested yields of farmer plots. The two mostcommon are crop cutting and farmer estimation.
! Crop cutting, the more traditional, involves direct physical measurement (weighing) by theenumerator of crop(s) taken from one or more selected (ideally randomly) subplots withinfarmers' fields harvested by or in the presence of project staff.
! Farmer estimation involves surveying farmers to obtain their estimates of the total crop theyharvested and dividing this by estimates of how much land they planted (ideally obtained bydirect land area measurements) to calculate estimated yields. In this case, yield estimates arebased on the entire area planted by a farmer rather than on a subplot.3
Which of these methods is more appropriate is a matter of debate. Crop cutting has long beenconsidered more accurate, and most agricultural surveys rely on it (Murphy et al., 1991). Therisk is that it can result in significant overestimates of yields (e.g., Casley & Kumar, 1988).Studies in several countries have suggested that post-harvest farmer estimates of cereal cropyields may be just as accurate (or even more so). In addition, obtaining farmer estimates issimpler, less costly, and permits greater sampling efficiency than crop cuts. (For moreinformation, see Appendix 1).
Evidence in the literature points to the conclusion that farmer estimates of output divided bydirect measurements of planted areas is the best way to estimate cereal crop yields in mostcontexts. Certain conditions, however, would preclude use of the method or bias the results:
! Farmers have or perceive incentives to inflate or deflate production estimates (e.g., taxes,status, eligibility for program benefits).4
! Crops are not harvested within a short defined time period but rather harvested continuouslyover long periods, particularly root and tuber crops (e.g., cassava). This is discussed furtherbelow under the heading “Multiple (or Continuous) Harvesting.”
3 Other methods not discussed here but which may be applicable in certain situations include “complete harvesting” in whichentire farmer plots would be harvested under project staff supervision; “expert assessment” in which teams of experts familiarwith crop production in the region visit fields prior to harvest and make subjective estimates of yields; and “sampling of harvestunits” in which a sample of harvest units is weighed and the total units harvested is estimated (Casley & Kumar, 1988). Thecomplete harvest method is considered the most accurate and often used as a standard for comparison, but is too costly for largesamples of farmers. It may be applicable, however, for case study evaluation approaches, and for estimating demonstration plotyields. The expert assessment method, which is more applicable for rapid assessment and early warning purposes than forevaluation purposes, would be a last resort option if other measurement methods are infeasible. In one study in Zimbabwe,expert assessments of harvest yields were found to be closely correlated with farmer estimates (Casley & Kumar, 1988). For theharvest unit sampling method, two ways of estimating the total number of units are inspection (counting) or questioning thefarmer. The inspection approach has the constraint that all crops need to be harvested at one time and the enumerator must bepresent precisely at that time. If estimates of units are obtained by questioning the farmer, this method is virtually the same as thefarmer estimation method.4 Remington (1997) cites three situations in which this problem may occur. The first is the use of baseline data for determiningwhich areas or population groups to target. The second arises when data on improved food security is to be used for decisions tophase out activities. The third occurs when data would be used to reduce quantities of food relief in areas recovering fromdisasters as production recovers. In all cases, the population may be motivated to under-/over-report information in order to gainaccess to project benefits.

Issues Related to Measurement and Interpretation of Impact
7
! Farmers are unable to express estimates in units that are or can be standardized. This isdiscussed further in this section under the heading “Non-Standard Units” and possiblesolutions are proposed in Section 3.2.2.4.
! Accurate estimates of land area cannot be obtained either by direct measurement (e.g., due towidely scattered plots or difficult terrain) or farmer estimates. Section 3.2.2.1. providesinformation on how to carry out measurements in most cases.
! Logistical or other constraints prevent enumerators from visiting farmers shortly afterharvest. This would mean the recall period would be longer and farmer estimates ofproduction would be less likely to be accurate.
2.1.3. Sample Size Requirements
Sample size is another concern in measuring changes in crop yields over time. Three factorsaffect sample size requirements: the amount of variance in the data (which is unknown inadvance); the level of confidence desired; and the level of sampling efficiency. (For furtherguidance on sampling issues and methods, see the FANTA project's Sampling Guide.) Poate &Casley (1985) point out that if the intention is to measure small changes from year to year or topresent findings for each geographical sub-population, several hundred households is too small asample on which to base the kind of comparisons and conclusions desired. This point is relevantto Title II agricultural activities which in some cases have annual yield increase targets of only 3percent.
As a general rule sample size should be kept as small as possible in order to save time andmoney. Therefore, Title II evaluators should focus only on the yields of crops that are planted bymost farmers. In addition, data collection methods should be chosen that reduce or eliminate theneed for clustered sampling and use instead simple random sampling.5 Since farmer estimationallows for use of less highly clustered samples (i.e., greater number of sample areas with fewerhouseholds per sample area), sampling considerations provide another argument in favor ofusing farmer estimates rather than crop cutting (see Appendix 1).
2.1.4. Data Collection Biases
Title II activity evaluators are also faced with problems of data collection biases (or biases thatare introduced by the way the data are collected). The presence of such biases further impede theability to draw valid conclusions on activity impacts on crop production and yields. The cropcutting method tends to overestimate total production since the subplots selected may not berepresentative of the total plot area and may be harvested more thoroughly than the typicalfarmer plot (see Appendix 1 for further discussion). For the farmer estimation method, apotentially major source of bias is “strategic responses” in which there are perceived incentivesto under- or over-report crop production. In particular, farmers may choose to under-report theirproduction if they believe their responses may be linked to personal costs (e.g., taxes, marketingquota enforcement) or gains (e.g., food aid benefits). 5 Poate & Casley (1985) point out that the loss in sampling efficiency in clustered samples may require the sample size to beincreased by a factor of two or three.

Issues Related to Measurement and Interpretation of Impact
8
2.1.5. Mixed Cropping
Mixed cropping (or intercropping), common in many developing country agricultural systems,presents another challenge for measuring and interpreting data on crop yields. Casley & Lury(1981) found in Ghana that 84 percent of the area under seasonal crops contained a mixture ofcrops, and in Botswana that 90 percent of the area under millet and more than two-thirds of thearea under sorghum contained other crops. Unless the implications of mixed cropping areaccounted for, crop yield and area data will be misleading.
Mixed cropping takes different forms: one crop may occupy space within the plot that wouldotherwise be occupied by another; one crop may be added between rows of another crop whichhas been planted at its normal density; or two crops may share a plot for only a brief part of thegrowing season or occupy it at entirely different times of the year (Kearle, 1976; Kelly et al.,1995). In any case, joint (or sequential) occupation of different crops on the same land cansignificantly affect (positively or negatively) measured yields of both crops. A secondary cropmight, for example, reduce yields of a primary crop due to displacement or competition fornutrients. Yields of the primary crop could be seriously underestimated if such intercroppingeffects are not taken into account (Kelly et al., 1995).
A number of approaches can be used to address this problem, none entirely satisfactory (Poate &Casley, 1985; Stallings, 1983).6 Poate & Casley suggest that the most reliable approach is topresent at least two levels of detail. First, the overall land area on which the principal crops aregrown, together with crop yields. Second, for each crop a breakdown of the area into the typesof cropping systems — for example, maize in pure stand, maize with other cereals, maize withbeans and pulses, maize with permanent crops, or maize with all other crops. Although thiswould seem an improvement over other commonly used methods, it too has problems: (1) thenumber of indicators is increased, as multiple indicators are needed for each crop that isintercropped; and (2) more serious, meaningful conclusions still cannot be drawn about changesin yields for all except the pure stand indicators, unless the yields for the secondary crops inmixed cropping systems remain constant. An additional concern is that where a particular cropis planted in more than one type of cropping system (i.e., pure stand and mixed cropped ormultiple mixed cropping patterns) farmers may be able to estimate total production of the crop,but find it difficult to disaggregate by individual plots or cropping systems (Murphy et al., 1991).
For these reasons, where mixed cropping is common and where reliable, relevant price data areavailable or can be collected for each crop, the best approach for Title II purposes may be tochange this indicator from weight yield to value yield. As explained in Section 4.4., this would
6 In the simplest of these approaches, crop areas are divided by the number of crops grown on them. For example, if two cropsare grown together on one hectare of land, the area assigned to each crop would be 0.5 hectares. In most cases, crops do notshare the land equally, seriously impairing the validity of this approach. Another overly simplistic approach has been to give thewhole area to each crop, dividing total production of crop x by the whole area planted to both crops, thus overestimating the areaplanted to crop x and underestimating the yield of crop x. The FAO, for instance, has used this approach for some crops, whileacknowledging the consequent underestimation of yields (Kelly et al., 1995). More important for Title II evaluations, thesesimplistic approaches, by reporting complex cropping mixtures as if they were grown in pure stands, do not account for changesin relative amounts of land planted to the mixed crops. More complex approaches have also been tried, such as using seedingrates or crop densities to assign area proportions. The plant density method has the advantage in theory of approximatingproduct-specific yields, but its costs and difficulties are high (Kelly et al., 1995), and it is still subject to problems ofinterpretation.

Issues Related to Measurement and Interpretation of Impact
9
mean that instead of calculating two indicators (i.e., the weight yield of corn and beans, the totalvalue of both the corn and bean production would be calculated and then divided by the areaplanted).
2.1.6. Multiple (or Continuous) Harvesting
Another problem for measuring crop yields is multiple harvesting. For instance, a portion ofmaize crops is often harvested in advance of the main harvest and eaten as green maize, with theamounts varying from year to year. Roots and tubers, on the other hand, may remain in theground for a long time after reaching maturity and be harvested on an ongoing basis as needed.In both cases, yield measurement is difficult. Murphy et al. (1991) suggests for crops such ascassava and potatoes, the only alternative is a case study approach in which agreement is madewith a small sample of farmers to harvest their plot at a specified time. Since harvesting thecrops at one time like this would not be in their best interests, some compensation (monetary orin-kind) should be paid to these farmers.
2.1.7. Non-Standard Units
A final issue is that developing country farmers often measure crop yields in non-standardmeasurement units. This problem has four aspects: (1) conversion from local units tointernationally recognized units; (2) variations in local units; (3) accounting for crops at differentstages of growth or processing (e.g., green maize); and (4) conversion from volume to weightmeasures (Rozelle, 1991). Whereas conversion from local to internationally recognized units isgenerally straightforward, variations in local standards is more problematic. Small-scale farmersin many developing countries use a wide variety of reporting units, which may vary by crop, byarea, or even among farmers in the same area. Sometimes different terms are used to describethe same unit, or worse, the same term may be used in different areas to represent different units(Verma et al., 1988).7
2.2. Gaps in Actual vs. Potential Yields
Gaps in actual vs. potential crop yields are assessed by comparing yields in demonstration plotswith yields obtained by other farmers in the project areas. Neither the crop cut nor farmerestimation techniques are adequate for estimating average demonstration plot yields, however,since the samples are too small.8 Instead complete harvesting is far more accurate andstatistically efficient (Casley & Kumar, 1988). Moreover, though it would not work for large 7 For instance, Rozelle (1991) observes in Malawi that harvest size was counted by the number of baskets that were used tocarry the harvested products, but that these varied in shape and size. Similarly, Filipino farmers reported crop outputs bynumbers of bags, numbers of cans, or other volumetric measures that varied from household to household. Verma et al. (1988)observed in Central African Republic that the same unit (cuvette) is used throughout the country, but the manner in which it isfilled varies by region, necessitating calculation of a different conversion factor for each region. In Niger, Verma et al. found thatinstead of being placed in containers, harvested crops were tied into bundles, which varied considerably in size from region toregion.8 Casley & Kumar (1988), for instance, cited studies in Niger and Nigeria which found that within-plot variation accounted for40-60 percent of total observed variations in yields, suggesting that crop-cutting estimates are subject to about twice as muchvariation as estimates based on complete harvesting of plots. Murphy et al. (1991) also observes that “even strong advocates” ofthe crop-cutting method do not claim that random cuts provide accurate estimates of individual plots, only that a sufficientnumber of cuts in a sufficient number of fields provides a valid estimate of average yields. Similarly, advocates of farmers'estimates accept that there is considerable variation in the accuracy of estimates by individual farmers.

Issues Related to Measurement and Interpretation of Impact
10
numbers of areas, complete harvesting is practicable for the relatively few demonstration plots atissue (Murphy et al., 1991).
The problem is that measurements in the comparison will have been done by two differentmethods (i.e., complete harvest vs. farmer estimation) and estimated yield gaps will likely beinfluenced also by differences in biases between the two measurement methods.9 It will beimportant, in interpreting absolute values of yield gaps, to keep these different biases in mind.On the other hand, it may be reasonable to assume that differences in measurement biases remainfairly constant and therefore do not affect changes in yield gaps over time.
2.3. Changes in Yield Variability
Whereas measuring crop yields may need more than the normal five-year Title II projectlifespan, measuring whether projects have reduced the variability of yields from year to year willbe impossible within the five-year project period. This is because the changes during the projectwill need to be set in the context of a farmer's production before and after the project. Thus,several years of both pre-activity and post-activity (or follow-on activity) yield data will need tobe collected among targeted farmers in the project area. Methods for collecting yield data duringand after the activity will have to be consistent with the methods used for collecting the pre-activity data.
2.4. Values of Crop Production
Increases in the value of household crop production may be the best way to reflect the ultimateimpacts of activities on the welfare of targeted households, assuming that other sources ofincome are not significantly reduced as a result of the agricultural activities. Not only may it be abetter indicator than increased crop yields,10 but it also has fewer difficulties (i.e., there is noneed to deal with intercropping or to measure land areas planted). On the other hand, theindicator has its own set of difficulties: (1) identifying appropriate transaction level prices fornon-marketed crops; (2) adjusting for price inflation; and (3) accounting for crop by-products,including inputs to other household production processes. (Exogenous factors will affect valuesas they do yields.)
2.4.1. Non-Marketed Crops and Appropriate Transaction Level Prices
It is easy enough to value crops that are sold. The values will be simply what the farmer stateshe sold them for (see Section 3.2.2.1.). A significant portion of crops produced by farmhouseholds in Title II activity areas, however, is not sold in the market but rather is eitherconsumed by family members, used as seed, transferred as gifts or compensation for labor, 9 Verma et al. (1988) explores the likely biases that arise with complete harvesting.10 It is important to recognize that it is not maximization of harvest yields that matters to farmers, but rather maximization of neteconomic value yields. Often, farmers are able to increase their yields, but the costs involved in doing so may exceed the valueof the additional output. A way to anticipate whether this will be the case is to see whether the technological applications used indemonstration plots are oriented towards economic value rather than harvest maximization; such an analysis would be based onestimates of the average input costs to farmers (including credit, transportation) and output market values. These findings shouldaffect not only monitoring and evaluation but also project design and implementation. Minimizing risk is another factor thatneeds to be taken into account in anticipating farmer behavior; though the level of risk is not measurable, the level of risk candetermine whether or not a farmer will adopt a certain practice.
Issues Related to Measurement and Interpretation of Impact
11
and/or fed to livestock. The question is how to value non-marketed crop production. Twoscenarios are discussed below: the first in which local competitive markets for the non-marketed(home-consumed) crops exist and the other which there is no such market.
2.4.1.1. Valuing home-consumed crops that are available in local competitive markets
When home-consumed crops are also sold in local markets, one way to value them is to equatetheir value with the price that farm households would have received for their product in themarket (i.e., the market producer price) (Levin, 1991; Rozelle, 1991). Using market producerprices in such cases, however, may overestimate the value of crops if transport and othertransaction costs are not subtracted. In other words, the real value for crops sold by householdsis the farmgate price. Farmgate prices may differ widely among households due to differingtransaction costs resulting from unequal access to markets. Thus, although two households mayface equal nominal prices in markets, the effective price for one household may be considerablyhigher than for the other (Rozelle, 1991).
At the same time, using the market producer prices in well-targeted Title II activities where mostparticipant households, at least initially, are likely to be “net deficit” producers (or “net buyers”)of food may result in underestimating the value of the crops. For these households, the realvalue of increased crop production to the household is not what they would earn if they sold it,but rather what they would have to pay to buy it if they had not produced it. Therefore, theconsumer (retail) price may be a more valid estimate of the value of home-consumed crops.
A combined producer-consumer price approach has been tried in some cases: this uses producerprices for net surplus households and consumer prices for net deficit households (Levin, 1991).This too is problematic, however. Not only is it burdensome to collect two sets of prices, buthouseholds that switch from being net deficit to net surplus producers (perhaps as a result of thesuccess of the Title II activity) might appear (wrongly) to have a reduced value of agriculturalproduction because of using the lower (producer) price for valuing the production. In addition,being either net surplus or net deficit does not imply that the households only buy or only sell.Households in both groups may both buy at certain times of the year and sell at other timesdepending on seasons, cash needs, and prices.
Given the problems described above, using producer prices may be most practical option. Thereasons are that (1) secondary price data, with sufficient quality and disaggregation, may be morereadily available for producer prices, thus obviating the need for primary price data collection(see Section 3.2.2.2.); (2) the extra effort of collecting both producer and retail prices may beprohibitive; and (3) retail price data may, in some cases, be more difficult to collect and interpret:producer prices tend to be more uniform, with more standardized units and more centralizedmarkets. If producer prices are used, however, potential biases need to be explicitly recognizedto avoid misinterpretations in assessing the relative benefits of the agricultural productivityactivities.
Issues Related to Measurement and Interpretation of Impact
12
2.4.1.2. Valuing home-consumed crops that are not sold in local markets
Valuing crops consumed at home or only sold at certain times of the year when they are not soldin local markets has its own set of problems. Possible approaches are obtaining prices fromother markets where the crop is sold and making a regional adjustment or using prices for closesubstitutes that are sold in the market (Rozelle, 1991). In either case, the problem is that priceschange over time, usually increasing significantly during the course of a cropping season fromthe time of harvest until shortly before the next harvest. Households may sell parts of their cropat several times during the year at different prices and may store the rest and consume it on acontinuous basis over several months (Levin, 1991). This suggests that it is necessary to knowboth when crops were sold and when they were consumed, and what the prices were at thosetimes. Farmer recall may provide information on sales, but it is highly unlikely that enumeratorscan visit frequently enough to glean good data on crops consumed at home, whether as food,seed, labor payments, or feed (Rozelle, 1991). The approach suggested in this guide to accountfor changing values of home-consumed goods is to ask farmers which month their stocks fromhome-produced crops ran out and assume home-consumed quantities are consumed at a constantrate over the course of the year, from the time of harvest until the time stocks are depleted.
2.4.2. Inflation's Effects on Prices
Effects of general economic inflation on crop prices must be taken into account in comparingvalues of household agricultural production from year to year. In economic language, it is realprices as opposed to nominal prices that must be used in estimating values. Since mostdeveloping countries have double-digit inflation, the use of nominal prices would indicatesubstantial increases in values of agricultural production for Title II activity participanthouseholds, even if the activity accomplished nothing at all. To find the real prices, nominalvalues of agricultural production must be deflated using an appropriate price index (Riely &Mock, 1995). Normally, price indices can be obtained from secondary sources; the best wouldbe one specific to rural households in the country. If these are not available, the PVO wouldneed to obtain advice on how create a price index.
2.4.3. Crop By-Products
Another important issue is the valuation of crop by-products. Failure to account for their valuecan cause serious downward biases in valuing crop production.11 Such valuation is difficultwhen by-products are not sold but rather used by the household as inputs into other activities,such as fodder for livestock (Kelly et al., 1995; Malik, 1993). Specifically, measuring values offodder and straw can be difficult since the proportion of these by-products to the grain itselfvaries by variety and climate (Malik, 1993). One approach is to change the indicator to includethe value of crops and livestock (or total farm enterprise). This, however, entails difficulties, aslivestock numbers are sometimes considered the most difficult agricultural statistic to obtainsince the holder may not know how many he owns or may be reluctant to give away such 11 For instance, Kelly et al. (1995) cites research that found that peanut hay accounted for 39 to 47 percent of the gross value ofoutput from peanut fields in Senegal's central Peanut Basin and cowpea hay accounted for 35 to 59 percent of the gross value ofcowpea output in Niger when cowpeas were produced as part of a mixed-cropping enterprise. Malik (1993) reports for a sampleof farmers in Pakistan that fodder accounted for a range of 10 to 30 percent of the value of overall crop production and that thevalue of wheat straw was approximately 20 percent of the value from wheat crop revenues.

Issues Related to Measurement and Interpretation of Impact
13
information (Casley & Lury, 1981). Even if numbers of livestock are known, there is furtherdifficulty in classifying them by age, sex, weight, milk yield, grade, or breed, all of which mayaffect their value.
2.5. Number of Months of Food Stocks
Months of food self-provisions have been included in the list of generic Title II indicators as aproxy for the crop yield and value of production indicators. This indicator should be used onlyin subsistence areas, however, where production is mostly for home consumption and householdsdo not make significant sales or purchases in the market. It should cover both grain, roots, andtubers, if commonly consumed.
2.6. Measuring Crop Storage Losses
Post-harvest crop losses have many causes and take many forms. For Title II activities, however,the source of post-harvest loss addressed in this guide is what occurs during storage by farmhouseholds (i.e., losses from other sources such as threshing, transport, milling, etc., are notconsidered). Activities to stem these losses therefore relate to farmer storage practices orconstruction of improved farm household grain storage facilities. Little work has been done ondeveloping methods to assess on-farm storage losses in developing countries, although asignificant portion of food is estimated to be lost during storage. This is partly because storageloss is difficult to measure even for those skilled in the area.12 Among issues that need to beexamined are:
! Losses in nutritional or other quality factors, such as those that result from mold toxins,are very important but too difficult to measure to include in evaluation or monitoring of TitleII (Harris & Lindblad, 1978).13 All that can reasonably be measured are losses in quantities.
! Costs of reducing losses need to be incorporated in calculations of losses during storage ifpositive impacts on farm households are to be demonstrated. If costs exceed benefits, thenreducing losses is not beneficial to farm households.
12 Most work on storage loss assessment methods was done during a several-year period after a United Nations resolution in1975 to reduce post-harvest losses in developing countries by 50 percent. At that point, it was recognized that not only was thereno agreement on the extent of post-harvest losses in various countries, but also there was no agreement on appropriate methodsfor measuring such losses (Boxall, 1979; Harris & Lindblad, 1978). It also became evident that due to the variability of localpost-harvest situations and the types of crops harvested, no one definitive loss assessment methodology can be universallyapplied. Instead, methods need to be adapted to local contexts (Harris & Lindblad, 1978).13 The U.S. Food and Drug Administration uses a number of procedures for assessing qualitative losses, but all are too time-consuming, require a laboratory setting, and require judgments that are difficult to standardize (Harris & Lindblad 1978).

Issues Related to Measurement and Interpretation of Impact
14
! Changes in volume and weight due to moisture/effects of climate need to be accounted forwhen tracking on-farm storage losses over the course of a season or between seasons. This isbecause the weight per volume of grain varies according to increases or decreases in themoisture content, though food value may not change. Farmers, however, may not haveaccess either to the equipment (e.g., moisture meters, drying ovens) or expertise needed tostandardize moisture contents (Harris & Lindblad, 1978). Differences in moisture contentsalso have an effect on the susceptibility of stored crops to losses; in other words, they are aconfounding factor when measuring the amount of storage loss. Therefore, a measurementapproach is needed that controls for changes in rainfall and humidity when differences instorage losses from year to year are compared. Harris & Lindblad (1978) point out thatlosses to insects remain small to non-existent as long as moisture levels are low: losses areminimal when moisture is only 6 to 8 percent; at 10 percent, insects still have seriousdifficulties surviving; and even at 12 percent moisture or less, grain insects have a hard timefeeding and reproducing. The cross-sectional, as opposed to longitudinal, approach formonitoring changes in storage losses that is prescribed in the next section reduces theproblem of needing to account for changes in crop moisture.
! Accessibility of samples can be a problem when stored crops (in whatever form, e.g., cobs,shelled grain) are at the bottom and rear of storage facilities. Even if bags are used and canbe selected randomly, sampling within bags is difficult. The method of measuring only alimited number of demonstration sites helps reduce this problem significantly (see Section 3).
! Timing and frequency of storage loss measurements will affect the amount of loss. Thisis because the percentage of storage loss normally increases over time from the time ofharvest to stock depletion. If storage losses are measured at just one point in time, under- oroverestimates are likely, i.e., loss measurements early in the storage period will giveestimates that are too low, and measurements made late in the storage period will giveestimates that are too high.14 This implies a need for multiple measurements during thestorage period. Both Boxall (1979) and Harris & Lindblad (1978) suggest that monthlymeasurements are ideal. Boxall concedes that this may not be feasible and suggests analternative approach in which estimates are made on three occasions: at the time of storage,halfway through the season, and during the last month of the season. Variations betweenfarmers and between years, however, may make it almost impossible to predict the halfwaypoint and the end of the stocking period. If, for instance, a farmer has a bad year and putslittle food into storage, stocks may be depleted before the time of the second visit. On theother hand, in a good year the visits may come too early. In other words, the alternative tomonthly visits may be equally unworkable. The solution, therefore, may be a significantlyreduced sample size, though this will reduce the statistical confidence of the results.
14 As Boxall (1979) explains, the problem lies in making an accurate estimate in a situation in which there is a decreasingquantity of grain and a potentially increasing degree of loss. It is important, therefore, to relate losses in a sample to the patternof grain consumption. If an entire consignment of grain remains undisturbed throughout the storage period and at the time ofremoval the estimated loss is 10 percent, then this represents the total loss due to insects over the storage period. In most cases,however, and particularly in farm stores, grain is removed at intervals and each quantity removed will have suffered a differentdegree of loss since it will have been exposed to insect infestation for a different length of time. This factor will need to be takeninto account when determining the total estimate of loss.

Data Collection Plan
15
3. Data Collection Plan
This section provides an overall plan and specific methods for collecting data for measuring theTitle II generic indicators for agricultural productivity. It also notes advantages anddisadvantages of the approaches depending on the context.
3.1. General Principles
Data collection must be ongoing throughout the growing season; data collected duringmonitoring will make possible evaluations of project performance vis-a-vis appropriateindicators at a later date. Six general principles should guide PVO personnel during datacollection:
1. Be consistent. Consistency in methods from year to year is essential. Despite the adage thattwo wrongs don't make a right, for assessing impacts over time, it is usually better to repeat“inadequate” methods than to change methods between years. Consistency in survey timingfrom year to year is also important; for example, it is best to visit farmers each year as soonafter harvest as possible (see below, Section 2.2.4).
2. Document methods thoroughly. The methods used for collecting and analyzing data mustbe documented in order to ensure consistent repetition of the methods in subsequent yearsand to avoid misinterpretations of results by data users. Project records should fully describemeasurement methods and include copies of questionnaires and sampling frames used, andresults reports should summarize these methods and key assumptions and omissions in thedata. Currently, most Title II results reports include little, if any, of this information.
3. Account for exogenous factors affecting outcomes. To strengthen attribution of causalitybetween project activities and changes in impact indicators, data should be collected on otherfactors (e.g., rainfall) likely to affect these indicators, particularly given the difficulty ofusing control group methods in most cases.
4. Build trust with farmers. Create trust through courteous introductions, explaining surveyobjectives and sharing survey results (Puetz, 1993). To avoid strategic responses, make itclear that responses are not linked to personal costs (e.g., taxes, marketing quotaenforcement) or gains (e.g., food aid benefits) for respondents. Respondents should beassured, and it must actually be the case, that data will not be disseminated to others in sucha way that the names of individual respondents can be linked to the responses they provide.Ask less sensitive questions first, leaving the most sensitive until the end.
5. Integrate monitoring and evaluation activities with implementation activities. Integratein order to (1) reduce costs; (2) promote usefulness of data; and (3) benefit fromimplementors' knowledge of local practices and rapport built with the farmers. Farmers areless likely to give candid responses if surveyors are outsiders with whom they have had noprevious contact.

Data Collection Plan
16
6. Train and supervise enumerators thoroughly. Where feasible, review completedquestionnaires on the same day in the vicinity of the sample households to permit revisits forcorrecting errors where necessary. High quality-data depends on enumerators who aremotivated, well trained, and well supervised (Puetz, 1993).
3.2. Data Collection Plan
3.2.1. Overview
This guide provides an overview of a data collection plan that covers the entire set of genericTitle II agricultural productivity indicators. As shown in Table 2, data will be collected on 11aspects of agricultural activity, ranging from farmer practices to sales and storage. As is evidentfrom viewing Table 2 horizontally, some information is used more widely than other:information on farmer practices (collected both after planting and after harvest) and on theamount of rainfall will be necessary for most of the indicators whereas information on marketprices and input costs/crop sales will be needed for only one — the value of agriculturalproduction. Looked at vertically, Table 2 shows a similar variation among indicators: forexample, measuring the value of agricultural production will require gathering 10 different typesof information whereas measuring months of stocks will require only three. Genericrecommendations may not be appropriate in all situations and project staff may need to adaptthem based on the context and nature of their activities.
The plan is divided into four groups of activities based on their timing. To determine theapproximate dates on which these activities need to take place, preliminary information must beknown on the usual planting and harvest times of area farmers.
1. Post-Planting Farmer Visit15 (approximately 1 to 2 months after planting)
! Farmer pre-planting/planting/post-planting practices! Agricultural input costs! Additional crop sales since post-harvest survey (except first post-planting visit)! Months of self-provisioning from previous harvest! Measurement of area planted for each crop or mixed crop system
2. Monthly Data Collection (collected monthly if secondary data not available)
! Rainfall data from rain gauges! Local market crop price data if adequate secondary data unavailable! Storage loss measurements at experimental (or demonstration) facilities
3. Harvest of Demonstration Plots (on agreed upon harvest days)
! Complete harvest and weighing of demonstration plots by or in presence ofmonitoring and evaluation staff
15 The farmer is defined as the person who works the plot. This is not necessarily the landowner or the head of the household.

Data Collection Plan
17
4. Post-Harvest Farmer Visit (approximately 2 to 4 weeks after harvest)
! Farmer pre-harvest/harvest/post-harvest practices! Farmer estimates of production! Additional input costs since post-planting visit! Crop sales income from current harvest! Number and type of crop storage facilities! Amount of crops in storage
The data collection plan includes at least two visits to farm households per year, once just afterplanting and the other after the harvest. Both visits are essential for measuring the yield: the besttime to measure the area planted is early in the planting season; the best time to collect data onproduction is shortly after the harvest, when farmers have the clearest recollection of the amountharvested. If there are two cropping seasons per year, the number of farmer visits will need to bedoubled.

Data Collection Plan
18
Table 2: Summary of Data Collection Plan for Measuring Title II Agricultural Productivity Indicators
Title II Indicator Being MeasuredDataCollectionTimetable
Type of DataCollected
Yield perhectare
Yield gap Yieldvariability
Value ag.production
Months ofstocks
Storagelosses
Adoption ofpractices
Storagefacilities
Farmerpractices X X X X XInput costs/crop sales XMonths ofstocks X X X
Post-PlantingFarmerVisit
(1-2 monthsafter planting)
Areas plantedby crop type X X see * below
Rainfall X X X X XMarketprices X
Monthly DataCollection
Storagelosses(demo. sites)
X
Demo harvest(harvest time)
Yields ofdemo. plots X
Farmerpractices X X X X X X XFarmer prod.estimates X X see * below XInput costs/crop sales XStoragefacilities X X X
Post-HarvestFarmerVisit
(2-4 weeksafter harvest)
Crops instorage X X
*Estimating changes in yield variability requires comparison with pre- and post-activity yield data. Because data collection methods need to be consistent acrossthese years, the methods used for collecting yield data for this indicator should be the same as those used in collecting the pre-activity yield data.
Data Collection Plan
19
3.2.2. Data Collection Timetable/Type of Data to be Collected
3.2.2.1. Post-Planting Farmer Visit
The post-planting farmer visit should take place approximately one to two months after planting.Depending on which indicators are being tracked, the types of data collected may include farmerplanting practices, input costs, income from crop sales, months of food stocks from previousharvest, and areas planted for each crop or crop mix system.
3.2.2.2. Farmer Practices (Early Planting Season)
Data on the adoption of improved farming practices should be collected through farmersurveys.16 The types of questions will vary depending on which practices the Title II activity ispromoting, other practices of key interest to activity designers and implementors, and thecontextual factors that affect the adoption of practices.17
The practices in question for this survey are those that take place early in the planting cycle.Eleven potential topic areas are listed below. Although specific practices will vary depending onthe activity and context, they will be related to one or more of the areas listed below. Althoughmost of the questions will be used to monitor farmer adoption of practices (indicator #7), two ofthem — types of crops planted and whether they are planted in pure stands or mixed with othercrops — will be needed to group data on areas and yields.
1. Land preparation2. Seedbed maintenance3. Plowing techniques4. Types of crops planted5. Pure stand and mixed cropping systems6. Planting practices7. Types of seeds used8. Fertilizer application18
9. Weeding
16 An alternative approach which has been used with success is a record-keeping approach in which farmers write down on aregular (perhaps daily) basis what practices they employ and what inputs they use. While record keeping has the advantage ofshorter (and thus more accurate) farmer recall, disadvantages include (1) the need for a literate, well-motivated sample; (2) thegreater time and costs per farmer needed for frequent visits to check records and for data analysis; and consequently (3) morelimited sample sizes and area coverage (Rozelle, 1991). Due to these disadvantages, the survey method is preferred for Title IImonitoring and evaluation purposes.17 Unlike health and nutrition projects, where surveys on adoption of practices (i.e., knowledge, practices, and coverage or KPCsurveys) can be relatively standardized, surveys on adoption of farmer practices (often called knowledge, attitude, and practicesor KAP surveys) cannot. That is because best practices for child health are basically the same from place to place, but bestpractices for agricultural production vary greatly depending on the geographic and economic context.18 A number of Title II activities have established, and are attempting to measure, crop-disaggregated fertilizer use targets.Where farmers plant many crops or engage in intercropping, such disaggregation can be extremely difficult, raising the questionas to whether the value of the information is worth the measurement difficulty. The recommendation, therefore, is generally toask for total fertilizer use only. The same is true for other inputs such as herbicides or pesticides. It may be useful also toestimate input use per land unit. The enumerator, however, should not directly ask the farmer how much input is used per landunit, as this information is likely to be unreliable. Instead, the amount of input per hectare should be calculated by dividingfarmer estimates of total input use by direct area measurements made by the enumerator.
Data Collection Plan
20
10. Insect and disease control measures11. Irrigation and other water control measures
An important issue is the completeness and quality with which farmers adopt these practices.Many farmers will partially adopt practices or adopt them in a lower-quality fashion. Forexample, in an activity that promotes the use of a particular fertilizer, some farmers may use thefertilizer but at doses different from those recommended, or at different times from thoserecommended. For each farmer practice being monitored, therefore, to avoid ambiguity it isessential to be precise in defining what constitutes satisfactory adoption (Krimmel et al., 1990).For fertilizer, for instance, adoption could be defined as “application of the fertilizer within ___percent of (recommended amounts) within week of (the recommended time).”
To increase their usefulness for activity designers and implementors, the farmer practice surveysshould also ask about reasons for non-adoption. Knowledge is a necessary but not sufficientcondition for adoption of practices (Kearle, 1976). On the other hand, a number of factors mayweigh against a farmer adopting various practices: not only may they lack knowledge but theymay lack confidence in recommended improved practices, believe that to adopt them would notbe cost-effective, or lack access to inputs, credit, or labor.
Additional principles that should be followed in collecting data on farmer practices include:
! Do not ask unnecessary questions;! Avoid open-ended questions; use questions with yes/no answers where possible. For
example, do not ask “what practices do you use when planting?” Instead ask “do youplant in rows?”; and
! Do a pre-survey to test whether questions make sense and solicit the desired information.
3.2.2.3. Input costs/crop sales
Questions on input costs are needed when the value of agricultural production indicator is beingtracked. These questions would be asked during both the post-planting and post-harvest visits.During the post-planting visit, costs of inputs used in the current planting season up to the timeof the visit would be ascertained. Farmers should be asked for the total amount of inputexpenditures or inputs used, including the costs of purchased labor inputs (non-purchased laborinputs are also important but difficult to measure). Inputs used instead of input expenditures areappropriate when some inputs are carried over from year to year or obtained from non-commercial sources. In such cases, price data for these inputs must be obtained in order toderive expenditure equivalents. It is not necessary for measuring this indicator to disaggregateinput expenditures or usage by cropping system or per land unit. Some farmers may find iteasier to separate out input costs for each type of input (which the data analyst can add togetherlater) and others may find it easier to simply report total input costs. Therefore, the questionnaireshould allow for both options.
Data Collection Plan
21
Illustrative Questions for Inputs:
1. Did you use any fertilizer that you purchased on your crops? [ ] yes [ ] no
2. Did you use any herbicide that you purchased on your crops? [ ] yes [ ] noRepeat for insecticide, etc.
3. How much did you pay for these inputs?Fertilizer [ ] Total [ ] (reported by farmer or calculated by analyst)Repeat for herbicide, insecticide, etc.
Questions on crop sales income are also needed for measuring the value of crop production.These questions would be asked first during the post-harvest visit, to capture sales immediatelyafter harvest, and followed up during the post-planting visit to capture subsequent sales from theprevious planting season. Thus, questions on sales income would be asked in the post-plantingvisit starting only in the second year of data collection. Questions on income from sales arerelatively sensitive and should be asked toward the end of the visit (Spencer, 1972). Below is alist of illustrative questions:
Illustrative Questions for Sales:
1. How many different times did you sell some crops since (date of last visit)?
2. Transaction 1:a. In what month did you make the sale?b. How much did you sell?c. How much money did you receive?d. Did you have to pay any transportation costs?e. Repeat for each subsequent transaction.
3.2.2.4. Months of Food Stocks for Home Consumption
Farmers should be asked whether they still have food stocks remaining from the previous year'sharvest.19 For cereals, farmers are asked for stocks kept in storage facilities. For crops that arestored in the ground and harvested as needed (particularly roots and tubers), farmers are askedabout stocks kept in the ground. If the household still has stocks, the respondent is asked howmany more weeks or months the food stocks are expected to last. If they are all gone, therespondent is asked when they ran out.
19 Frankenberger (1992) notes that a study in Mauritania found that female heads of households were able to estimate quiteaccurately how many months their food stocks from their previous harvest would last. Asking about number of months stockslast is usually more accurate, easier, and more culturally sensitive than calculating numbers of months of stocks by dividingestimates of food in storage by estimates of household food requirements. Not only is this latter method difficult and subject toerror, but some people may be reluctant to discuss food in storage due to cultural beliefs.

Data Collection Plan
22
Illustrative Questions for Food Stocks:
1. What staple crops does your family consume? (This question is unnecessary if theanswer is obvious).
2. Do you still have food stocks remaining from last year's planting season? [ ] yes [ ] no
3. If yes, how many more weeks do you expect the stocks to last? [ ] weeks
4. If no, in what month did the stocks run out? month [ ]
3.2.2.5. Measurement of Planted Areas
Since most farmers in developing countries do not know the amount of planted areas for theircrops (FAO, 1982; Kearle, 1976; Stallings, 1983), direct measurement of planted areas (not landarea owned or land area harvested) is necessary (see Section 2.1.). Likewise, plots, not holdingsor fields, should be measured. A plot is defined as a contiguous piece of land in which only onetype of crop or mixed cropping system has been planted (Casley & Lury, 1981). A farmer'sparcel (field) thus may contain a number of separate plots according to the variety of crops orcrop mixtures planted. The enumerator must measure and note the crop types planted for each ofthese plots. Plots may or may not be marked by fences or paths. If unmarked, the dividing linebetween the crops becomes the boundary of the plot. In addition, when a farmer plants crops onmultiple parcels in different locations, each should be visited if possible.
The farmer's holding must be separated into the different pure stand and mixed crop plots forwhich yields will be measured; these will have been ascertained during the farmer survey.Because of the complications of measuring and interpreting crop yield data (see Section 2.1.), inareas where many types of crop and mixed crop systems exist, concentration should be limited toa few principal crops or crop mixes (Casley & Kumar, 1988). The area for each of these plotsmust be measured. If two or more plots contain the same crop or crop mix, these should beadded together. (As suggested above, another, better alternative would be simply to measurevalue, not yield.)
Land area measurement should take place during the post-planting farmer visit when crops havebeen planted but are still at an early stage. If only a post-harvest visit is possible, areameasurement can be done at that time, though this would result in measuring areas harvestedareas rather than those planted.
A number of approaches with different types of equipment can be used for the actualmeasurement, but use of measuring tape and compass are recommended.20 This is because (1)the equipment is cheap and easy to acquire and use; (2) the method is applicable in most
20 Other technique and equipment options that have been used include measuring wheels, measuring chains, and range finders.Measuring wheels have the advantage of needing only one operator but are difficult to use on many types of land (especiallyforests and rocky or wet surfaces) and are generally considered less accurate (Belbase, 1991; FAO, 1982; Kearle, 1976; Poate &Casley, 1988). Measuring chains are more sturdy than measuring tape but are less easy to use, heavier and even more prone toerror (FAO, 1982). Range finders can save measurement time but are more expensive. Also, Kelly et al. (1995) and Riely &Mock (1995) have noted the potential for using global positioning system (GPS) technology to increase accuracy and reduce timein measuring field areas, although the accuracy and costs of this technique are not certain.

Data Collection Plan
23
situations; and (3) the calculation of closing errors limits measurement error (see below). Ifaerial photographs are a feasible option, they can serve as a cross-check; they would also serveother useful purposes for activity implementation and monitoring/evaluation.
Plots will often not be shaped as simple polygons. In such cases, the first step is to transform theplots to be measured into approximate polygons and demarcate the corners of the polygons withstakes in the ground. A rough drawing of each plot should be made. The drawing should givesome indication of the position of the plot within larger parcels and the distance and direction ofthe field from key landmarks, including the farmer's house (Casley & Kumar, 1988; Murphy &Sprey, 1986).
The number of sides of the polygon for each plot will depend on the plot shape. For plots thathave curved or otherwise irregular shapes, straight-edged approximations of polygon sides needto be made. In identifying such polygon sides, pieces of the plot that are excluded from thepolygons need to be compensated for. This can be done by including approximately equal piecesof land that are not part of the plot. Figure 1 below illustrates how to do this. In this figure, oneside of a farmer's plot is curved (imagine that it borders a stream or a road). A straight lineconnecting points B and D would result in a good approximation of the plot area, since theamount of the plot that would be excluded by the polygon is roughly equal to the amount of non-plot area that is included. The area of this irregularly shaped plot can then be measured as asimple four-sided polygon.
Figure 1: Straight Line Approximation of Irregular Shaped Plots

Data Collection Plan
24
To reduce error resulting from making straight line approximations of curved plot shapes, curvedsides may be broken into two or three measurements. This is illustrated in Figure 2 below. Inthis figure, connecting points B and E in a straight line would result in a large overestimate ofplot area. Breaking the curve into two pieces and drawing two straight lines between points Band F and between points F and E, and compensating for excluded plot area by including somenon-plot area, results in the area of the hypothetical polygon being roughly equal to the actualplot area. In this case the plot area can then be measured by the resulting six-sided polygon. Themore irregular the shape of the plot, the greater the number of polygon sides that will be needed,though the number should not exceed ten (FAO, 1982).
Figure 2: Breaking Irregular Shaped Sides into Segments

Data Collection Plan
25
Once the polygon shape is determined and each of its corners marked with stakes, the length ofeach side is measured and recorded in meters, and the compass bearings from corner to cornerare recorded. Two people are needed for these measurements, but only one needs to be a trainedenumerator. The enumerator holds one end of the tape and makes the tape and compassreadings, while the assistant (perhaps a local extension agent) holds the other end of the tape. Itis critical that measuring tape remains at full tension to reduce error.
The compass bearings are measured in order to calculate the angles between sides of thepolygon, which are in turn needed to calculate the areas. To illustrate this, consider the angle atpoint B in Figure 2 above. First take a compass bearing from points B to A. To do this, theenumerator stands with the compass at point B while the measuring tape is held by the otherperson at point A. The enumerator holds the compass horizontally above the measuring tapefacing point A and rotates the compass until the needle pointing north is aligned with the 0degree mark. The enumerator then notes and records the compass reading in the direction ofpoint A, using the line formed by the measuring tape. The same procedure is followed frompoints B to C. The angle at point B is then derived by calculating the difference between the twocompass readings (Murphy & Sprey, 1986). For instance, if the reading from B to A is 150degrees and the reading from point B to C is 60 degrees, the angle at point B would be 90degrees.
Depending on which way the difference between the two readings is taken, the two sides canform two different angles, one of which will be greater than 180 degrees and one that will beless. Consider, for example, two compass readings of 30 degrees and 270 degrees. Going in aclockwise direction on the compass dial from 30 degrees to 270 degrees, the difference can beseen as 240 degrees. Going in a counter-clockwise direction, however, the difference is 120degrees. The correct angle is easy to see from looking at the polygon shape. If the angle bendsinward, as in the angle at point B, the correct angle is the difference in readings that is less than180 degrees. On the other hand, if the angle bends outward, as is the case for the angle at pointF, the correct angle is the one that is more than 180 degrees.
To reduce errors, compass readings should be taken in both directions for each side of thepolygon and the average of the resulting angles taken (Casley & Kumar, 1988; FAO, 1982).This is especially important as the measurement of angles from compass readings is likely to bethe greatest source of error in area measurements (Ariza-Nino, 1982). The extra step ofmeasuring in both directions helps avoid the need to repeat area measurements and reduceserrors in yield estimates. The two readings taken in opposite directions would be approximately180 degrees different. Before taking the average of the two readings, it is necessary to add (orsubtract) 180 degrees from the second reading. Considering angle B in Figure 2 once again,suppose that the compass reading from point B to A is 92 degrees and the reading from point Ato B is 270 degrees. Subtracting 180 from the second reading would convert this reading to 90degrees, and the average between the two readings would be 91 degrees.
Some amount of closing error is likely during calculations as a result of inaccuracies inmeasuring the lengths and compass bearings of the polygon sides. This is illustrated in Figure 3below. In this example, imagine measuring a four-sided polygon starting from point A to B,from B to C, from C to D, and from D back to A. When plotting on graph paper the distances
Data Collection Plan
26
and angles derived from the measurements, any inaccuracies in the measurements will cause theplotted polygon (the dotted line) to deviate from the true polygon (the solid line), and this willcause the final measured point (A') to differ in position from the starting point (A). Thisdifference between A and A' is referred to as the closing error.
Calculations of the plot area and closing error should be done in the field when themeasurements are completed and verified later in the office by monitoring and evaluation staff.Calculating closing errors in the field is crucial to allow immediate remeasurement of plots if theclosing error exceeds a certain percentage of the perimeter of the polygon. Otherwise, datacollected on households for which area measurement errors are discovered later will have to haveto be dropped from the sample (Ariza-Nino, 1982; Casley & Kumar, 1988).
Monitoring and evaluation staff should decide in advance the maximum tolerated percentage ofclosing error. A 5 percent maximum tolerated closing error is recommended.21 To determine theamount of closing error, the measurements can be plotted on squared graph paper (as in Figure 3)and the angles between the sides of the plotted polygon can be measured (using a protractor)between this sum and the calculation of (180 degrees) x (N - 2), where N = the number of sides.To allow quick calculations of areas and closing errors in the field (and avoid the need forplotting areas on paper in the field), the enumerator should be equipped with a programmablepocket calculator that has been programmed to make closing error calculations automatically(Casley & Kumar, 1988).
Finally, other sources of error must also be guarded against. Iron and steel objects near thecompass (e.g., watches, steel-rimmed glasses) are a source of compass deviation and, if possible,should be removed to a safe distance to reduce error (FAO, 1982).
21 The allowable limit for closing error percentages is a matter of choice, and recommendations have varied among agriculturemeasurement experts. Poate & Casley (1985) suggest a maximum tolerated percentage closing error of 3 percent. Kearle (1976)suggests that up to 10 percent is acceptable. Hunt (1977) (cited in Casley & Lury 1981) suggests a range of 5 to 10 percent whileCasley & Lury suggest the limit be close to 5 percent.
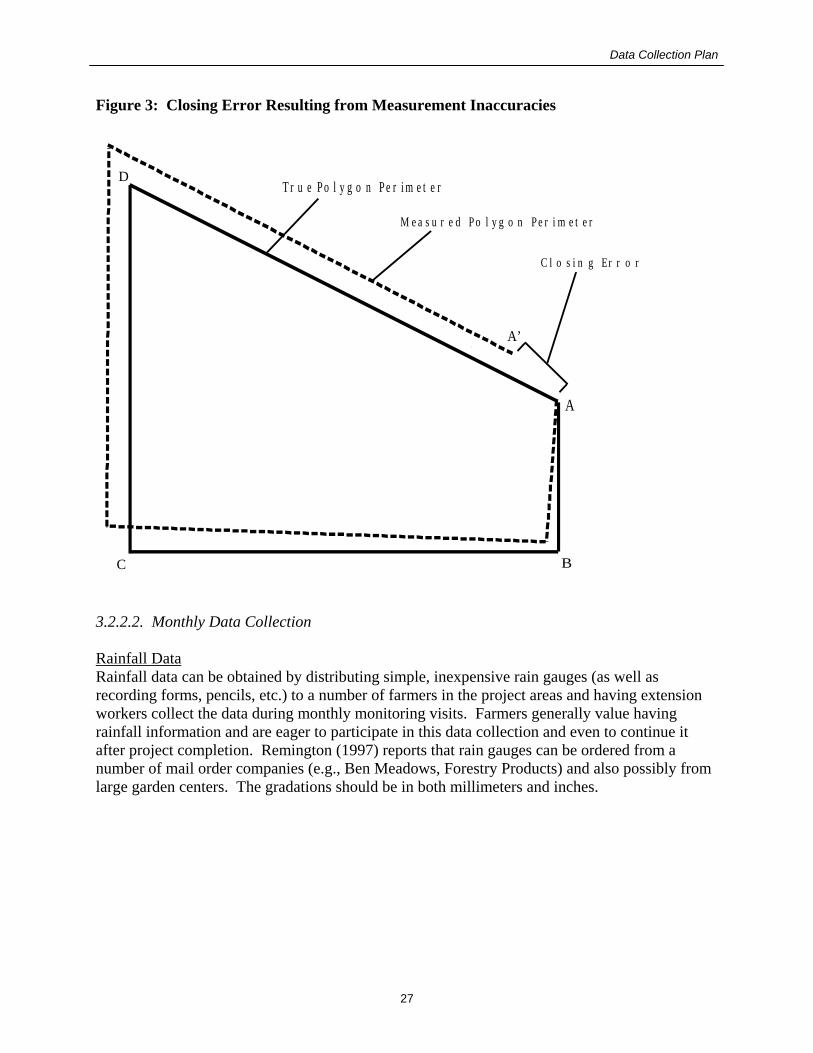
Data Collection Plan
27
Figure 3: Closing Error Resulting from Measurement Inaccuracies
3.2.2.2. Monthly Data Collection
Rainfall DataRainfall data can be obtained by distributing simple, inexpensive rain gauges (as well asrecording forms, pencils, etc.) to a number of farmers in the project areas and having extensionworkers collect the data during monthly monitoring visits. Farmers generally value havingrainfall information and are eager to participate in this data collection and even to continue itafter project completion. Remington (1997) reports that rain gauges can be ordered from anumber of mail order companies (e.g., Ben Meadows, Forestry Products) and also possibly fromlarge garden centers. The gradations should be in both millimeters and inches.
C B
D
A
A’
Closing Error
True Polygon Perimeter
Measured Polygon Perimeter

Data Collection Plan
28
Market Price DataAs suggested in Section 2.4., farmer reports of crop sales gathered during farmer surveys willprovide the information needed on value of marketed crops, whereas the prices in local markets(market producer prices) will provide a basis to value crops that are consumed at home, assumingthese crops are also sold in local markets. Reliable secondary price data should be used if theyare available; if not, primary data should be collected for local markets once a month for eachcrop, a sample of local units weighed, and the unit price calculated. Price data should beobtained by observing and recording actual transactions. It would not work to simply ask sellersas they would most likely report the price they want to get rather than actually get.22
For practical reasons, wholesale producer price data should be collected (rather than data onfarmgate or retail prices) as these tend to be most uniform in units, standards, and price.Different varieties of a particular crop having different prices may exist in the same market. InEthiopia, for example, ten varieties of teff, four varieties of wheat, and three varieties of sorghummay be found (Tschirley et al., 1995). The enumerator must thus ensure that the variety beingmonitored matches with that being produced by the participant farmers. Differences in qualityand moisture content also matter, but these will likely be too difficult to measure for Title IImonitoring purposes and therefore can be ignored.
Prices for the same crop in the same market on the same day are likely to be fairly homogenous,but some price variation will almost certainly exist (particularly as the day progresses).Therefore, a number of price observations will need to be made. If possible, at least fivetransactions should be recorded for each crop being monitored, and the average price calculated.Random sampling for these observations is not possible, but enumerators should be sure thatthey are at least observing transactions for a variety of traders in the market.
Crop Storage LossesAs pointed out in Section 2.6., monthly data collection on storage loss would be ideal but wouldbe impractical for a large sample of farmers. Therefore, a proxy evaluation approach isrecommended in which storage losses are measured and compared in a limited number ofdemonstration sites that have both improved and traditional storage facilities and practices.23 Toensure valid estimates, two requirements need to be satisfied: (1) crops in the improved andtraditional storage facilities must be of the same quality and selected in the same way; and (2) thestorage facilities and practices in the demonstration sites must accurately reflect actual farmerfacilities and practices (Harris & Lindblad, 1978).
The purpose is to learn what portion of the grain has remained undamaged, what portion isdamaged but still fit for human consumption, and what portion is no longer edible. The point atwhich the grain is considered inedible may differ among different populations. Insect infestationmay render grain inedible when not only are holes visible but the grain develops an unpleasant
22 A third option is to include questions on prices in surveys of farm households. This has the advantage of more directlyestimating the actual value of the crop to households either buying or selling the crop. A disadvantage is the imperfect recall ofthe farmers, due to the survey being conducted only twice a year or to the use of volume rather than weight units.23 Currently, there is a lack of field-tested methods for calculating storage loss. This guide briefly describes a recommendedbut not fully developed method. Subsequent versions of the guide will contain a more detailed methodology for calculatingstorage losses.

Data Collection Plan
29
odor; likewise, when molds become visible, create an odor, or discolor the crop, the grain mayhave reached the point of being inedible (Reed et al., 1997).
In undertaking the study, if the crop is stored in bags, a sample of bags should be selected. Toplayers, which are less prone to deterioration, should be removed so that bags in the middle andbottom layers can be accessed (Harris & Lindblad, 1978) and samples taken from each selectedbag. If the crop is in the form of grain, a grain trier should be used (Harris & Lindblad, 1978;Reed et al., 1997). A grain trier (also called a sampler, spear, probe or bamboo) is a shortpointed tube that can be inserted into a bag with minimal damage to the fibers of the bag. Thegrain kernels or other commodity pass through the hollow tube to be collected outside the tube(Reed et al., 1997).
The method prescribed for measuring losses is to count and weigh (Boxall, 1979; Harris &Lindblad, 1978; Reed et al., 1997). Once collected, the grain should be sieved and a handful ofgrains taken from the center of the sieve and placed on a hard surface. Then, 100 grains shouldbe counted out. To ensure a random count, some selection rule should be used such as countingthe grains in the order of their proximity to the person counting.
Each sample of 100 grains should be separated into (1) undamaged portions, (2) damaged butedible portions, and (3) portions unfit for human consumption that must be discarded (or fed toanimals). The grains in the undamaged portion are counted and weighed, and this informationused to calculate the percentage of loss represented by the remaining two portions.
Additional qualitative data should be recorded. This includes, for each sample: (1) evidence ofrodent activity (e.g., fecal matter, damaged bags); (2) presence of odors; and (3) wetness ordiscolored areas (Reed at el., 1997).
3.2.2.3. Demonstration Plot Harvest
The complete harvest method recommended for estimating demonstration plot yields (seeSection 2.2.) requires the presence of the project staff or evaluators. This is because the output,once dried, shelled, etc., must be carefully weighed and recorded (Murphy et al., 1991). Thiswill mean that demonstration plot farmers and project staff need to agree on the harvestingschedule, keeping in mind when the crop is ready for harvesting (Murphy et al., 1991).
3.2.2.4. Post-Harvest Farmer Visit
The post-harvest farmer visit should take place two to four weeks after harvest. As during thepost-planting farmer visit, farmer practices and input costs/crop sales should be reviewed. Datamay also be collected on exclusively post-harvest issues, such as total production and storageplans.

Data Collection Plan
30
Farmer Practices Survey (Late Planting and Harvest Season)Similar to the post-planting visits, surveys of farmer practices will depend on the nature ofimproved practices that the activity seeks to promote, as well as other practices that are of keyinterest to activity designers and implementors. These could include practices such as weeding;insect and disease control and irrigation that are introduced during the planting season andcontinue while the crops are maturing; and practices specific to harvesting, such as harvestingtechniques, threshing and storage, and marketing practices, as shown below:
! Weeding! Insect and disease control measures! Irrigation and other water control measures! Harvesting techniques! Threshing! Storage and marketing practices
Farmer Production EstimatesDuring the post-harvest visit, farmers are asked to estimate their production in terms of locallyunderstood units. Farmers should be surveyed as soon as possible after harvest to ensureaccurate estimates of total production and yield (Malik, 1993). If feasible, farmer estimatesshould be cross-checked by visually checking the amount of crop in storage and adding thatwhich has already been sold or consumed (Poate & Casley, 1985). Harvest times may varyconsiderably from region to region, as well as from crop to crop.
Local measurement units are often not well standardized and may vary considerably. This canlead to substantial errors in estimating yields. A solution is to weigh a sample of the contents ofthe containers each farmer uses for collecting/storing the harvested crops and multiply theaverage weight by the number of units harvested. However, this process is both time-consumingand subject to high measurement error (Rozelle, 1991). Moreover, it is not adequate for root andtuber crops, which are usually harvested in small portions over a long period with no standardharvest unit (Kearle, 1976). As Poate & Casley (1985) point out, estimating mean tuber weightand counting the total number of tubers from multiple harvests is “fraught with potential forerror.” An alternative strategy would be to provide participating households with a standardcontainer, both as a gift for their participation and as a means to enable household members tocount the number of times they fill the container in bringing the harvest to the compound(Murphy et al., 1991). This is particularly appropriate when crops are harvested in smallquantities over time.
Another solution is to estimate a mean weight per unit for each crop type. This should be doneby weighing a sample of five units for each crop. If little variation exists between farmers in thesame area, this can be done for just a sample of the area farmers. If the units vary fromhousehold to household, which is more likely in subsistence production areas, mean unit weightsneed to be estimated for each household in the sample.24 The method for weighing will depend 24 The weights of the sample units can also be significantly influenced by the moisture content of the crop, which varies overtime for each farmer. Murphy et al. (1991), for instance, cites evidence from Zaire indicating that fresh maize loses over 30percent of its weight after drying. Moisture content can be measured with a hygrometer which may be available at agriculturalextension stations. Assuming that measuring moisture content may be impractical, a second-best alternative to limit moisturecontent biases is to ensure consistency in the timing (relative to harvest dates) of production estimate surveys from year to year.

Data Collection Plan
31
on the equipment available and the units used by the farmers, but should be relativelystraightforward.
Input Costs Since Post-Planting VisitInput costs since the post-planting visit, would also be included in the post-harvest survey if“value of agricultural production” is being tracked (see Section 3.2.2.1. above).
Crop SalesCrop sales since the recent harvest would also be surveyed if value of agricultural production isbeing tracked. Techniques for analyzing would be the same those for post-planting visits (seeSection 3.2.2.1.).
Storage Facilities/Crops in StorageMonitoring the number and type of storage facilities can take place during post-harvest visits andthe information used to derive information on changes in storage losses (i.e. the impactindicator). The approach for measuring storage losses will be to impute losses according to theprevalence of different types of storage facilities based on the different storage loss rates for eachtype of facility. Therefore, the enumerator will need to verify that farmer storage facilities arecomparable not only in type but also in quality to the facilities in the demonstration storage sites.

Calculating Indicators
32
4. Calculating Indicators
This section explains how to calculate the six generic agricultural productivity performanceindicators listed in Table 1: crop yields per given area; gap between the actual and the potentialcrop yields; and yield variability under varying conditions; value of food production perhousehold; months of food stocks; and percent of loss during storage. Some of the key issuesraised in Section 2. regarding interpreting these indicators will be restated here.
4.1. Changes in Crop Yields
The general equation for calculating crop yields per area is Y = P/A, where Y is the yield perarea of the crop, P is the weight of the crop harvested, and A is the size of the area planted.25The values for Y, P, and A will be based on yield-related data collected including farmerestimations of output and mean weights per unit (P) and land areas planted (A). The equationwill be as follows:
Yield (Y) = (Farmer estimate in local units) x (Estimated kgs/local unit)Estimated area
If the farmer has more than one plot for a particular cropping system (pure stand crops or cropmixtures), the total production and total area for all plots planted under each crop system shouldbe calculated and then the yield for each cropping system determined. Separate yields should notbe calculated for each plot and then combined.
As noted in Section 2., the results of this calculation will not give a convincing picture of theinfluence of project activities on the yield unless key environmental factors (especially rainfall)are also taken into account (i.e., staff must amalgamate rain data collected monthly from farmersand make a judgment as to how it may have affected production). Although factoring weatherinto changes in yield trends may require data collected annually over a period of more than fiveyears, a shorter time series may be possible if yields increase while environmental conditionsstay the same or become worse from one time to the next.
4.2. Gaps in Actual vs. Potential Yields
As explained in Section 3, this indicator requires two annual measurements: (1) estimates of cropyields of the sample of targeted farmers in the project area based on farmer production estimatesand measurements of planted areas; and (2) estimates of yields for the same crops or croppingsystems on demonstration plots, based on the complete harvesting method. The calculation issimply the difference between them.
If demonstration plots are pure stand, only farmer plots that are also pure stand should be usedfor comparison. Likewise, if demonstration plots are intercropped, then the farmer plots used forcomparison should be intercropped with the same crop types.
25 This equation is the basis for calculating yields whether the crop cutting or farmer estimation method is used. The onlydifference is that in crop cutting, P and A refer only to the small areas from which the crop cuts are taken, whereas for farmerestimation yield estimates are based on the entire area planted by a farmer.

Calculating Indicators
33
The absolute value of yield gaps between farmer and demonstration plots will be influenced bothby real differences in yields and differences resulting from the different measurement methodsused. As noted in Section 2.2., the complete harvest method is likely to give a higher estimate ofyields. Nevertheless, because differences in yield estimates resulting from measurementdifferences are likely to be fairly constant over time, changes in yield gap estimates from year toyear can reasonably be assumed to reflect real changes in yield gaps.
4.3. Changes in Yields Variability
The simplest measure to assess variability of annual crop yields within a specified time period isthe range. The range is calculated by subtracting the lowest annual yield during the period fromthe highest annual yield. This would need to be calculated for each sampled farmer anddisaggregated by each crop or cropping system for which the project is trying to reducevariability. Though easy to calculate, the range measure has the disadvantage of beingdetermined only by the extreme values (with no consideration of variability in non-extremeyears). In addition, it is very sensitive to outliers, i.e., one year of unusually high or unusuallylow yields greatly increases the value of the range, thus having a disproportionate influence onassessments of variability.
A more commonly used method is the standard deviation (SD). Its advantages are that it reflectsvariability among all years in the period and is less sensitive to outliers. Although its calculationis more complicated, it does not require any additional data collection effort. The standarddeviation is defined as the sum of the square of the differences between yields in individual yearsand the average yield over the period, divided by the number of years in the period. This can becalculated quite easily by basic statistical software. The calculation is based on the followingequation (see Figure 4 for an example):
[(Y1 - Ym)2 + (Y2 - Ym)2 + .... + (YN - Ym)2]1/2
SD = ________________________________________
N
Key:N = the number of years in the periodY1,Y2, ... YN = annual yields in years 1 through NYm = average annual yield over the period.
Changes in variability of yields can be measured by calculating and comparing the standarddeviation of average annual yields between two different periods of time for each sampledfarmer. For each crop or cropping system for which reduction of variability is the objective, thestandard deviation of annual yields should be calculated for two different time periods (pre-implementation and post-implementation) for each farmer in the sample. Since variability inyields is likely to be strongly affected by variability in rainfall between years, rainfall data shouldalso be collected and the range and/or standard deviations for rainfall be calculated for eachperiod for comparison. To calculate the standard deviations for rainfall, substitute rainfall (R)for yield (Y) in the equation above.
Calculating Indicators
34
4.4. Values of Crop Production
This indicator uses farmer production estimates for each crop but multiplies them by crop pricesinstead of dividing by area planted. The total production will be split into that which is sold andthat which is not sold (e.g., crops used for home consumption, seed, feed, in-kind laborpayments). The value for the crops sold will come directly from the farmer survey responses.The value of non-sold crops, whatever their use, will be estimated by multiplying the amount ofthe crop (minus sales and post-harvest losses) by an unweighted average of prices (discountedfor inflation) between the time of harvest and the time that stocks are depleted. If post-harvestloss data is not available, another assumption would need to be made regarding the averagepercent of post-harvest losses for each crop. This yields the gross value of production; thecalculation will need to be done for each crop produced. The equation for non-sold crops is asfollows:
Production value = Crop sales income + (estimated production - sales) x kgs/local unit xaverage price/kg during period from harvest to stock depletion
To calculate an overall net value for household crop production, the total input costs should besubtracted from the total production value (i.e., the sum of the production value for all crops).As was the case for changes in yields and yield variability, measuring and interpreting values ofhousehold agricultural production presents many difficulties. To strengthen attribution of causesof changes in crop production values, both changes in practices and in key environmental factors(especially rainfall) should also be reported.

Calculating Indicators
35
Figure 4: Sample Standard Deviation Calculation
A B C D E F G H
1 Year Yield Average yield[(B2+B3+
B4+B5+B6)/5]
Differencebetween
annual yieldand averageyield [B-C]
Squareddifference
[DxD]
Sum ofsquared
difference[D2+D3+
D4+D5+D6]
Square root ofsum ofsquared
difference
Standarddeviation
[G2/5]
2 1996 20 26.2 -6.2 38.44 182.80 13.52 2.7
3 1997 23 -3.2 10.24
4 1998 21 -5.2 27.04
5 1999 34 7.8 60.84
6 2000 33 6.8 46.24
Calculating Indicators
36
4.5. Number of Months of Food Stocks
When the food stocks are measured in terms of grain self-provisions, this indicator is calculatedby counting the months between harvest and household stock depletion. In the case ofcontinuously harvested roots and tubers, the calculation is based on the number of months theseare stored in the ground, although this is more difficult to assess than months in storage facilities(see Table 1).
As noted in Section 2., this indicator is primarily applicable in highly subsistence-oriented areaswhere households depend on their own production rather than market purchases for food. It issubject to the same confounding environmental factors as yield and production value.
4.6. Crop Storage Losses
Storage losses are calculated by multiplying differences in loss rates each month for theimproved and traditional facilities/practices in the demonstration sites by the amounts of crops instorage for each facility/practice based on the survey of sampled farmers. As stated in Section3., it is crucial for interpretation that demonstration site practices accurately represent actualfarmer practices.

References
37
5. References
Ariza-Nino, Edgar J. "On-Site Computation of Farm Plot Area." Consumption Effects ofAgricultural Policies: Cameroon and Senegal. Ann Arbor, Mich.: Center for Research onEconomic Development, University of Michigan, 1982.
Belbase, Krishna P. Rural Household Data Collection in Developing Countries: DesigningInstruments and Methods for Collecting General Household Information Data. Ithaca, N.Y.:Cornell University, 1991.
Boxall, R.A. “The Use of Rapid Appraisal Methods in the Assessment of Post-Harvest Losses,”conference paper presented at the Institute of Development Studies, University of Sussex,Brighton, U.K., December 1979.
Casley, Dennis J. and Krishna Kumar. The Collection, Analysis and Use of Monitoring andEvaluation Data. Washington, D.C.: World Bank and John Hopkins Press, 1988.
Casley, Dennis J. and D.A. Lury. Data Collection in Developing Countries. Oxford, U.K.:Clarendon Press, 1981.
Food and Agriculture Organization (FAO). Estimation of Crop Areas and Yields in AgriculturalStatistics. Rome, Italy: FAO, 1982.
Frankenberger, Timothy R. Indicators and Data Collection Methods for Assessing HouseholdFood Security: Draft. Tucson, Ariz.: University of Arizona, 1992.
Harris, Kenton L. and Carl J. Lindblad (eds.). Post-harvest Grain Loss Assessment Methods: AManual of Methods for the Evaluation of Post-harvest Losses. American Association of CerealChemists, 1978.
Hunt, K.E. Agricultural Statistics for Developing Countries. Rome, Italy: FAO, 1977.
Kearle, Bryant (ed.). Field Data Collection in the Social Sciences: Experiences in Africa andthe Middle East. New York, N.Y.: Agricultural Development Council, Inc., 1976.
Kelly, Valerie, Jane Hopkins, Thomas Reardon, and Eric Crawford. Improving the Measurementand Analysis of African Agricultural Productivity: Promoting Complementarities BetweenMicro and Macro Data. East Lansing, Mich.: Michigan State University, 1995.
Krimmel, Thomas, Thomas Duve, Gerd Fleischer, Gazali Ismal, Maimunah Madjid, Hans-PeterPiepho, Anke Schnoor, Mathias Sommer, and Sondra Wentzel. Towards an Institutionalizationof Monitoring and Evaluation of Project Impact: The Example of Projects in the Small-ScaleIrrigation Sector in West Sumatra, Indonesia. Berlin, Germany: Center for Advanced Trainingin Agricultural Development, Technical University of Berlin, 1990.

References
38
Levin, Carol. Rural Household Data Collection in Developing Countries: DesigningInstruments and Methods for Collecting Consumption and Expenditure Data. Ithaca, N.Y.:Cornell University, 1991.
Malik, Sohail J. "Farm Production Data in Rural Household Surveys." Data Needs for FoodPolicy in Developing Countries: New Directions for Household Surveys, J. von Braun and D.Puetz (eds.). Washington, D.C.: International Food Policy Research Institute, 1993.
Murphy, Josette, Dennis J. Casley, and John J. Curry. Farmers' Estimations as a Source ofProduction Data: Methodological Guidelines for Cereals in Africa. Washington, D.C.: WorldBank, 1991.
Murphy, Josette and Leendert H. Sprey. Introduction to Farm Surveys. Wageningen, TheNetherlands: International Institute for Land Reclamation and Improvement, 1986.
National Academy of Sciences (NAS). Study on Post Harvest Food Loss: Minutes of SteeringCommittee Meeting. Washington, D.C.: NAS, 1977.
O’Brien-Place, Patricia and Timothy Frankenberger. Food Availability and ConsumptionIndicators. Washington, D.C.: United States Agency for International Development, 1988.
Poate, C.D. and Dennis J. Casley. Estimating Crop Production in Development Projects,Methods and Their Limitations. Washington, D.C.: World Bank, 1985.
Puetz, Detlev. "Improving Data Quality in Household Surveys." Data Needs for Food Policy inDeveloping Countries: New Directions for Household Surveys, J. von Braun and D. Puetz (eds.).Washington, D.C.: International Food Policy Research Institute, 1993.
Reed, Carl, Roe Borsdorf, and William Anderson. Technical Support for Grain Storage/LossesProgram, World Vision Relief and Development. Manhattan, Kan.: Food and Feed GrainsInstitute, Kansas State University, 1997.
Remington, Tom. Personal communication, 1997.
Riely, Frank and Nancy Mock. "Inventory of Food Security Impact Indicators." Food SecurityIndicators and Framework: A Handbook for Monitoring and Evaluation of Food Aid Programs.Arlington, Virg.: USAID Food Security and Nutrition Monitoring (IMPACT) Project, 1995.
Rozelle, Scott. Rural Household Data Collection in Developing Countries: DesigningInstruments and Methods for Collecting Farm Production Data. Ithaca, N.Y.: CornellUniversity, 1991.
Spencer, Dunstan S.C. "Micro-Level Farm Management and Production Economics Researchamong Traditional African Farmers: Lessons from Sierra Leone." Sierra Leone: NjalaUniversity College, University of Sierra Leone, 1972.

References
39
Stallings, James L. Data Collection in Subsistence Farming Systems: A Handbook. Auburn,Ala.: Auburn University, 1983.
Tschirley, David, Patrick Diskin, Daniel Molla, and Daniel Clay. "Improving Information andPerformance in Grain Marketing: An Assessment of Current Market Information Systems, andRecommendations for Developing a Public Grain MIS: Draft." Addis Ababa, Ethiopia: FoodSecurity Research Project, 1995.
Verma, Vijay, Tim Marchant, and Chris Scott. Evaluation of Crop-Cut Methods and FarmerReports for Estimating Crop Production: Results of a Methodological Study in Five AfricanCountries. London, U.K.: Longacre Agricultural Development Centre Ltd., 1988.

Appendices for Agricultural Productivity Indicators Measurement Guide
40
Appendix 1: Discussion of Alternative Methods for Estimating Crop Yields
Drawing on evidence in the literature, this Appendix discusses the pros and cons of the two mostcommon methods for estimating crop yield — “crop cutting” and “farmer estimation” — andprovides a justification for the recommendation in this guide that the latter should be used. Inaddition, since farmer estimates of crop production need to be combined with estimates ofcultivated areas, a brief discussion of the need for using direct area land measurements asopposed to farmer estimates is included.
As described in the text, crop cutting, the more traditional yield measurement method, involvesdirect physical measurement of area and production in one or more selected (ideally random)subplots within farmers' fields harvested by or in the presence of project staff. Farmer estimationinvolves surveying farmers to obtain their estimates of how much they harvested, and dividingthis by estimates of how much land they planted (ideally obtained by direct land areameasurements) to calculate estimated yields. The discussion below addresses the accuracy andthe cost-effectiveness of the methods.
Issues regarding Crop Cutting
Accuracy
Crop cutting has been used for measuring crop production in many countries since the 1950s andhas been a standard method recommended by organizations such as the Food and AgricultureOrganization (FAO) (FAO, 1982; Murphy et al., 1991). For years, it was assumed that farmerestimates were too subjective and unreliable (Verma et al., 1988); when differences appearedbetween crop cut and farmer production estimates, the assumption was that crop cuts wereunbiased and that differences reflected “farmer error” (Murphy et al., 1991). Evidence fromresearch in the 1980s, however, questioned these assumptions. It suggested that crop cuttingsuffers from serious upward biases and that production data based on farmer estimation methodmay be just as accurate, at least for estimating total farm production (though, as is discussedbelow, not necessarily for farm yields). (See Casley & Kumar, 1988; Murphy et al., 1991; Poate& Casley, 1985; Rozelle, 1991; Verma et al., 1988).
Meanwhile, Casley & Kumar (1988) cite evidence from studies in Bangladesh, Nigeria andZimbabwe questioning the validity of crop-cut methods. These studies also indicated thatmeasurements of yield from crop cuts exhibited serious upward biases and had large variancesdue to heterogeneity of crop conditions within farmer plots. The Bangladesh study found thateven in the best of experimental conditions with well-educated (Masters-degree level)enumerators, crop-cut estimates exceeded actual yields by 20 percent, whereas farmer estimatesof production were lower. In the Nigerian study, however, results indicated that crop cuts andfarmer estimates of yields were both biased, and the biases were of similar magnitude.Murphy et al. (1991) summarized sources of error in crop-cut estimates of production. Theseerrors primarily relate to biases resulting from non-random location of sub-plots and tendenciesto harvest crop-cut plots more thoroughly than farmers would. All these errors result in upwardbiases. Although the errors may be small individually, the combination of the errors can besignificant. Rozelle (1991) further notes that crop-cut techniques are frequently “poorly

Appendices for Agricultural Productivity Indicators Measurement Guide
41
executed” in developing countries, even by supposedly trained personnel from technical stations.Even under highly supervised conditions with well-educated enumerators, crop-cut-basedproduction estimates have resulted in significant overestimates of yields, as evidenced by Casley& Kumar (1988).
Cost and efficiency
Kearle (1976) pointed out various difficulties in applying crop cutting: “The farmer is requestedto notify the enumerator when he plans to harvest the quadrant... so arrangements can be madefor the enumerator to be present to weigh the crop(s) taken from the ground. This method ofyield sampling is extremely time consuming. It is difficult to schedule the enumerator's time toensure that he will be present for the harvest, the plot may be harvested over time for familyconsumption, and the enumerator may not be aware that the quadrant is to be harvested. Thesedifficulties (are) coupled with the statistical problems resulting from the enormous heterogeneityof plots due to the spatial arrangements of crops, tree stumps, logs, termite hills, soil variability,animal damage, etc.”
Farmer Estimates
Production
Given the time, cost, and difficulty of crop cuts, interest has turned in recent years to testing thevalidity of using farmer estimates. Verma et al. (1988) undertook one detailed methodologicalstudy that provided strong evidence in favor of farmer estimates for estimating crop production(though not necessarily yields). The study was undertaken in five African countries (Benin,Central African Republic, Kenya, Niger, and Zimbabwe). It tested the hypothesis that post-harvest farmer estimates of production were at least as accurate as estimates based on crop cutson sample subplots.26 The method involved comparing both farmer and crop-cut estimates with“actual production” figures based on complete harvesting and weighing of crops. Farmerestimates were both closer to “actual production” and had lower variances than crop-cutestimates. Whereas the average farmer estimates were fairly accurate, crop cuts gaveoverestimates that were statistically highly significant. For the five countries, average post-harvest farmer estimates ranged from 8 percent below actual production (Benin) to 7 percentabove production (Zimbabwe, Central African Republic). Average crop- cut estimatesmeanwhile ranged from 14 percent overestimation (Zimbabwe) to 38 percent overestimation(Kenya).
A caveat in interpreting this study is that, although it provides evidence for the accuracy offarmer reports for estimating total production of crops, it does not necessarily mean that they areas accurate in estimating crop yields per hectare, which is what the Title II generic indicatormeasures. The reason is that to estimate crop production levels, crop-cut yield estimates must bemultiplied by estimates of the area planted, whereas the farmer estimate measures production
26 The study also compared pre-harvest farmer estimates (at two different times) but found post-harvest farmer estimates tohave both more accurate mean values and lower variance. Two methods of crop cutting were also tested — the “square method”and “row method” — and the square method was found to be more accurate. In this discussion, “farmer estimates” and “cropcuts” refer to the post-harvest and square method variations, respectively.

Appendices for Agricultural Productivity Indicators Measurement Guide
42
directly. Thus, crop-cut-based estimates of production are subject not only to measurementerrors in the crop cut itself but also to errors in area measurement. On the other hand, to estimateyields per hectare, crop cutting becomes the direct measure, whereas farmer estimates ofproduction must be divided by area measurements made by the enumerator. Thus the “burden”of area measurement errors (regardless of the method used for measuring areas) shifts from thecrop-cutting method (in estimating production) to the farmer estimation method (in estimatingyields), resulting in greater errors for farmer estimates. In short, results from Verma et al. do notdirectly provide evidence of the relative merits of farmer estimation method for estimatingyields. What they do suggest, rather, is that, if errors involved in measuring planted areas can beminimized, these results would support the farmer estimation method for estimating yields aswell as production. This underlines the need for a high degree of accuracy in area measurementsto increase confidence in the validity of using farmer reports to estimate crop yields.
Poate & Casley (1985) also conclude that “under certain circumstances, farmers' estimates oftheir crop output...will be no more biased than crop cutting on a sample of similar size and canbe collected without great expenditure of resources and skills.” They observe that in certainwell-defined cropping situations, carefully obtained farmer estimates can provide validindications of the year-to-year changes in production for approximate macro-level overviews.Poate & Casley further observe that crop cutting can produce reasonably accurate results, butonly if the field work is “closely supervised,” and therefore that crop cutting may be moresuitable for a detailed case study approach than for project-wide estimation of crop outputs oryields.
Yields
Rozelle (1991), in a review of six Cornell studies, considered farmers' abilities to make yieldestimates directly and found that these varied. In study areas in China and Indonesia, farmerseasily provided estimates on yields of almost all crops and could even relate differences in yieldswithin the household's own fields to variations in cropping practices and land characteristics.Yield estimates by Filipino and Nepalese farmers were somewhat less reliable, however, andfarmers in Malawi had great difficulties in providing yield estimates for most crops. The mainreason was errors made by farmers in estimating areas planted, not in amounts produced.
Land Planted
Because farmers often have difficulty in providing accurate estimates of land area planted,27 thegeneral consensus is that in most cases area estimates by farmers in developing countries arehighly unreliable.28 On the other hand, when cultivated areas are measured directly orobjectively by enumerators, results are considered relatively accurate and reliable. Even though
27 It is area planted, as opposed to area harvested or area owned, that is relevant for transforming farmer production estimatesto estimated yields. However, for transforming crop-cut yield estimates into production estimates (as would be the case, forinstance, if crop cutting was used for measuring the total quantity or value of household production), area harvested would be therelevant area measurement.28 Rozelle (1991) notes an exception in a China study where Chinese farmers in densely populated areas of the Yangtze Deltaprovided very precise estimates of cultivated area, reporting their plots to the 1/1,500th of a hectare. Conversely, Rozelleconcludes from two Malawi studies that “African farmers do not know how much land they are using. As evidence of this, manylocal languages have no words with which to measure land area.”

Appendices for Agricultural Productivity Indicators Measurement Guide
43
this approach is more time consuming and requires more training, it is worth the extra time andcost (Belbase, 1991; Casley & Lury, 1981; Kearle, 1976; Poate & Casley, 1985; Verma et al.,1988). It is the approach called for in this guide; and if followed, it would solve the problemmentioned in the preceding paragraph regarding inaccurate farmer estimates of yields.
Given that the farmer estimation method requires less time and money for a given sample size29
and allows for better sampling efficiency, these findings suggest that farmer estimates offer thepotential for both more efficient and more accurate data collection on crop yields. Aqualification pointed out by Verma et al. (1988) is that although the evidence shows “thatfarmers are able to state their production in an accurate and useable manner, it does not showthat they would necessarily be willing to give out this information in all cases.” In the Verma etal. study, the farmers were probably more motivated than usual to calculate and report accurateestimates (Murphy et al., 1991). Another caveat is that these studies looked at cereal crops(specifically, maize, millet and rice) and the results may not apply to other crops, particularlyroots and tubers. Verma et al. (1988) note that further inter-country methodological studies arestill needed to confirm and extend the positive findings and that such studies should include awider range of crops, cropping patterns, farming systems, socio-economic conditions, and so on.
Conclusion
Despite the various qualifications mentioned above, the World Bank report by Murphy et al.(1991) concludes:
! It is not reasonable to assume that farmers do not know much they produce.
! It is not reasonable to assume that farmers will be biased or evasive in their estimates.
! Farmers well-motivated to make their best estimates can do so with impressive results.
! Therefore, “farmers' own estimates represent a valid, efficient source of data that shouldbe used more systematically than they have been.”
In addition to advantages in time and cost savings involved in the farmer estimation method,because crop-cutting surveys require more effort and must be conducted at the precise time ofharvest, they require highly clustered samples. Farmer estimates, however, can be more widelydispersed (i.e., more sample areas with fewer households per sample area) because of the greaterscheduling flexibility and the reduced time required. Murphy et al. (1991) calculate withhypothetical figures that the highly clustered design required of crop cuts could necessitate asample size eight times larger than would be needed for a random sample.
29 The lower cost and time for farmer estimates vs. crop cutting is presumed. Verma et al. did not actually measure the relativecost and time requirements of the two methods.

Appendices for Agricultural Productivity Indicators Measurement Guide
44
Another important advantage of the farmer estimation method is that the survey of farmers onproduction can be readily combined with questions on other Title II generic indicators such asadoption of improved practices. Moreover, the interview method is also less intrusive and moreconvenient for farmers than crop cuts (Murphy et al., 1991).

Appendices for Agricultural Productivity Indicators Measurement Guide
45
Appendix 2: List of Generic Title II IndicatorsCategory Level Indicator
% stunted children 24-59 months (height/age Z-score)
% underweight children by age group (weight/age Z-score)
% infants breastfed w/in 8 hours of birth
% infants under 6 months breastfed only
% infants 6-10 months fed complementary foods
% infants continuously fed during diarrhea
Impact
% infants fed extra food for 2 weeks after diarrhea
% eligible children in growth monitoring/promotion
% children immunized for measles at 12 months
% of communities with community health organization
Health, nutrition,and MCH
Annualmonitoring
% children in growth promotion program gaining weight in past 3 months
% infants with diarrhea in last two weeks
liters of household water use per person
% population with proper hand washing behavior
Impact
% households with access to adequate sanitation (also annual monitoring)
% households with year-round access to safe water
Water andsanitation
Annualmonitoring % water/sanitation facilities maintained by community
% households consuming minimum daily food requirements
number of meals/snacks eaten per day
Household foodconsumption
Impact
number of different food/food groups eaten
annual yield of targeted crops
yield gaps (actual vs. potential)
yield variability under varying conditions
value of agricultural production per vulnerable household
months of household grain provisions
Impact
% of crops lost to pests or environment
annual yield of targeted crops
number of hectares in which improved practices adopted
Agriculturalproductivity
Annualmonitoring
number of storage facilities built and used
imputed soil erosion
imputed soil fertility
Impact
yields or yield variability (also annual monitoring)
number of hectares in which NRM practices used
Natural resourcemanagement
Annualmonitoring seedling/sapling survival rate
agriculture input price margins between areas
availability of key agriculture inputs
staple food transport costs by seasons
volume of agriculture produce transported by households to markets
Impact
volume of vehicle traffic by vehicle type
kilometers of farm to market roads rehabilitated
FFW/CFW roads
Annualmonitoring selected annual measurements of the impact indicators
Related Documents