Distortions to Agricultural Incentives in Tanzania Oliver Morrissey and Vincent Leyaro CREDIT, University of Nottingham [email protected] Agricultural Distortions Working Paper 52, December 2007 This is a product of a research project on Distortions to Agricultural Incentives, under the leadership of Kym Anderson of the World Bank’s Development Research Group. The authors are grateful for helpful comments from Kym Anderson, Henry Gordon and, specifically on cotton, Colin Poulton, as well as from workshop participants. They are also grateful for funding from World Bank Trust Funds provided by the governments of Ireland, the Netherlands (BNPP) and the United Kingdom (DfID). This Working Paper series is designed to promptly disseminate the findings of work in progress for comment before they are finalized. The views expressed are the authors’ alone and not necessarily those of the World Bank and its Executive Directors, nor the countries they represent, nor of the countries providing the trust funds for this research project.

Welcome message from author
This document is posted to help you gain knowledge. Please leave a comment to let me know what you think about it! Share it to your friends and learn new things together.
Transcript
Distortions to Agricultural Incentives
in Tanzania
Oliver Morrissey and Vincent Leyaro
CREDIT, University of Nottingham
Agricultural Distortions Working Paper 52, December 2007 This is a product of a research project on Distortions to Agricultural Incentives, under the leadership of Kym Anderson of the World Bank’s Development Research Group. The authors are grateful for helpful comments from Kym Anderson, Henry Gordon and, specifically on cotton, Colin Poulton, as well as from workshop participants. They are also grateful for funding from World Bank Trust Funds provided by the governments of Ireland, the Netherlands (BNPP) and the United Kingdom (DfID). This Working Paper series is designed to promptly disseminate the findings of work in progress for comment before they are finalized. The views expressed are the authors’ alone and not necessarily those of the World Bank and its Executive Directors, nor the countries they represent, nor of the countries providing the trust funds for this research project.

Distortions to Agricultural Incentives in Tanzania
Oliver Morrissey and Vincent Leyaro
Following independence in 1961 (as Tanganyika, which united with Zanzibar to form
Tanzania in 1964), Tanzania experienced a relatively brief period when the share of
agriculture in GDP declined as resources were shifted into other, potentially higher value-
added, sectors. Between the early 1960s and the early 1970s, agriculture’s GDP share fell
from about 60 percent to just below 40 percent of GDP. It then grew slowly to just over 40
percent of GDP by the late 1970s and rose steadily back up to about 60 percent of GDP by
the late 1980s and early 1990s (World Bank 1994, p. 4). In this sense Tanzania has yet to
achieve or complete the traditional ‘structural transformation’. Balanced growth is achieved
if agriculture becomes increasingly commercialized while the manufacturing sector grows.
Initially manufacturing may be based on agriculture, through processing and agri-business,
but ultimately manufacturing and the economy will become diversified (Thirlwall 1986).
This has not happened in Tanzania, and the economy remains essentially agriculture-based.
Given the major importance of agriculture, which is the dominant sector, this chapter
provides an analysis of the combined effect of various government policies (in particular
taxes and exchange rates) and features of the agricultural sector (notably inefficiencies in the
input supply and product marketing chains) on incentives to production in agriculture. The
next two sections provide an overview of agricultural performance and relevant policies since
independence. Then the methodology applied to measure distortions faced by agricultural
producers and consumers is described, after which the results are discussed.
The analysis reveals that while some reforms have significantly reduced distortions for
some crops, many crops still face high distortions and, most worryingly, this includes the two
major food crops (maize and rice, which together account for over 40 percent of agricultural
output). Although exchange rate liberalization and privatization of marketing has removed
many distortions, marketing inefficiencies and limited competition persist for many products,
so the level of distortion against agriculture remains reasonably high for all tradables on most
of the measures used. For exportables overall, part of the remaining high distortion is
attributable to high distribution and marketing costs, due for example to inefficient marketing
2
structures and high transport costs faced by exporters. For food crops (import-competing
products), persistent distortions are attributable to inefficiencies in the domestic marketing
chain and/or monopoly power in processing and purchasing. Although reductions in
distortions to many crops have to some extent been offset by persistent high distortions
facing others, especially certain exports, the overall bias against agriculture has been reduced.
Brief conclusions are offered in the final section. Reforms have been moving in the
right direction, especially liberalization of the exchange rate regime and reductions in trade
taxes, but much remains to be done to improve the efficiency of marketing (including
transport) to eliminate the net distortions against agriculture. The core problem is that
effective real producer prices remain low, especially given high costs of inputs and
inefficiencies in marketing. In the case of coffee, the major traditional export crop, although
government policy distortions have been largely eliminated, so that it faces a neutral policy
regime, domestic prices appear insufficient for profitable trading margins, given the decline
in the world price (and there is evidence of declining production).
Growth and structural changes
Tanzania experienced fairly steady economic growth from the mid-1960s to mid-1970s, with
real GDP increasing by almost four percent, although real agricultural GDP grew at only just
over two percent. Performance weakened in the latter half of the 1970s, partly in response to
external shocks and partly due to increasing state intervention in the economy, including
widespread nationalisation. Between 1976 and 1980, real GDP rose by just over two percent
but real agricultural GDP grew by less than one percent (World Bank 1994, pp. 2-3). The
combination of the 1979 oil price shock and the war with Uganda precipitated an economic
crisis, with negative real growth over 1981-83 (although agriculture grew by over 2 percent).
There was recovery from the mid-1980s with the implementation of the World Bank-
sponsored Economic Recovery Program (ERP) from 1986 that steadily introduced
liberalization policies. Over the period 1986-92 both real GDP and agriculture grew by more
than four percent (World Bank 1994, pp. 2-3).
3
Agriculture has remained the dominant production part of the economy, and its share
of GDP has actually increased. Agriculture accounted for about 40 percent of GDP in the
1970s and early 1980s, rising to 48 percent in the early 1980s (when the services share fell)
and falling back to 45 percent in the early 2000s. The services sector has varied around 45
percent of GDP, whereas manufacturing has declined steadily from 12 percent in the 1970s to
just over 7 percent in the early 2000s. The mining share has been less than 2 percent
(Appendix Table 1).
Agriculture performed relatively well in Tanzania in the 1980s (World Bank 1994,
McKay et al. 1999), improving from some 45 percent of GDP in 1980 to about 50 percent by
1990. Within agriculture the best performance was in food crops, notably pulses, starches,
oilseeds and non-traditional exports (fruit and vegetables) throughout 1976-91, but with good
growth in cereals during 1976-85. Traditional export crops performed poorly, with negative
growth through 1976-85 and modest growth over 1986-91, reflecting the effect of
unfavorable terms of trade on Tanzania: real export prices for coffee, cotton and tea in 1990
were less than half their value in 1984.
The econometric results in McKay et al. (1999), albeit based on data up to the early
1990s, suggest that the agricultural sector is quite responsive to relative prices (although
more so for annual than perennial crops in the short term) and so should respond to market
liberalization. This is consistent with the evidence of agricultural sector growth following
adjustment policies in Tanzania in the mid-1980s. Liberalization of agricultural markets,
where it increases the prices paid to farmers, can be effective in promoting production, and is
consistent with the observed improved performance of the sector following liberalization in
the 1980s. Complementary interventions, to improve infrastructure, marketing, access to
inputs and credit, and improved production technology can be expected to make producers
even more responsive. This latter point is especially important if the objective is to expand
total agricultural output. This evidence is consistent with the view that much of the response
is substitution between (export and food) crops, although there is a strong suggestion that
total production will respond if constraints are relaxed and incentives improved. Production
data support this argument: although there was a dip in the early 1990s, production of
(import-competing) food crops has grown dramatically in volume terms since the 1970s,
production of staple (non-tradable) foods has also grown, but the volume of export (cash)
crop production declined in the 1980s and only recovered in the late 1990s and 2000s
(Appendix Figure 1). However, in terms of production shares in total agriculture, it is ‘non-

4
traditional crops’ that have increased, especially vegetables such as green beans and fruits,
cash crops (for export) have declined as a share of production since 1985, and import-
competing products such as maize and rice (and non-traded staples) have maintained their
production shares (Appendix Table 2).
The growth of food crop production from the mid-1980s probably contributed to
poverty reduction. About 85 percent of the Tanzanian population in 1990 was defined as
rural. For the vast majority of these people, agriculture was the primary source of income,
almost 60 percent of them were below the poverty line, some 77 percent of their expenditure
was on food, and over 40 percent of their food came from home production (World Bank
1994, pp. 45-8). Growth in agriculture, especially food production, makes a major
contribution to the income and welfare of rural households, and hence is central to any
poverty reduction strategy.
The growth of agriculture following the ERP was not sustained beyond the early
1990s. In particular, the removal of all subsidies for agriculture in 1994 heralded stagnation if
not decline in production, especially as the large increase in fertilizer prices discouraged its
use and reduced yields. Production levels of the major crops, maize and paddy, are also very
susceptible to fluctuating levels of rainfall and especially drought, which can reduce paddy
production by up to half (Isinika et al. 2005, pp. 199-200).
Skarstein (2005) argues that the reforms led to failure in food crop production during
the 1990s, with declines in labor productivity and in maize and wheat yields. The
combination of successive devaluations, the removal of the fertilizer subsidy and
privatization of input markets led to a dramatic increase in input prices. Price deregulation in
July 1990 was initially associated with significant real producer price increases in the early
1990s (more than doubling for maize, rice, wheat and millet) but then it induced a decline in
real producer prices of maize, rice and beans (all to less than half the level of the early 1990s
and below the level of the early 1980s by 1999), wheat (relative to the early 1990s but not the
1980s), and millet in the late 1990s (Skarstein 2005, p. 355). Although maize and rice
production did increase during the 1990s, low real prices and limited marketing opportunities
meant that much of this was absorbed as household own-consumption.
Tanzania’s strong economic performance over 2000-04, with average annual real
GDP growth of almost six percent, has been helped by farmers, in particular through an
increase in the area under cultivation. Although agriculture had lower growth rates than
5
industry or services, it made a larger contribution to GDP growth than either of the other two
sectors (World Bank 2006, p. 4). There appears to have been a slight reduction in poverty in
Tanzania, from a headcount of almost 39 percent in 1991/92 to just over 35 percent in
2000/01. Although the major reduction was in Dar-es-Salaam (from 28 percent to 18
percent), rural poverty declined slightly, from 41 percent to 39 percent (World Bank 2006, p.
9). However, sustained growth requires improved manufacturing performance, and to date
Tanzania has not achieved any manufacturing growth.
The structure of exports changed notably in the early 2000s, with a decline in the
share of traditional (cash crop) exports (from roughly 60 percent of exports in the late 1990s)
and an increase especially in mining. The structure of traditional exports has also changed as
the major share of coffee and cotton (the main exports before 1990) has declined, largely due
to falling world prices, and there has been a renewal of the cashew nut industry. With the
exception of tea, most cash crops experienced a significant fall in export volume over 1994-
2003, with a notable dip from 1998/99 (especially cotton) due to a decline in international
prices (Kweka 2006). There has been a fall in real prices for all major export crops relative to
the 1994 prices (prices of cotton, coffee and tea declined by some 50 percent by 2000), hence
cash crop production has not been a source of increasing (or even stable) farm incomes. By
2003, non-traditional exports accounted for almost 80 percent of the total exports of which
half was from the mining sector.
Brief history of policy evolution
After independence, the institutional structure of agriculture was characterized by
cooperatives. This was not particularly successful, and from the mid-1970s there was a shift
to parastatals dominating marketing. But these parastatals were not efficient or successful
either, and the liberalization policies in agriculture from the mid-1980s have seen a shift back
towards cooperatives, with a viable private sector emerging from the 1990s.
1960-75: the cooperative system

6
In the period following independence, smallholder agriculture was market oriented and
supported by cooperatives. The National Agricultural Products Board (NAPB) was
established in 1962 and held a monopoly over the marketing of grain, purchased from
Cooperative Unions (which in turn sourced from the Primary Cooperatives). The NAPB
became the National Milling Corporation (NMC) in 1973, which had the additional
responsibility of maintaining the strategic grain reserve (Isinika et al. 2005, p. 201).
Cooperatives were owned and controlled by the members on a democratic basis, sales were
restricted to the official market and the marketing board purchasing price was fixed. The
actual producer price was the board price minus unit marketing costs. Consequently,
producer prices varied across the country according to variations in agreed unit costs (an
important source of variation was transport costs). Corruption and weak administrative
capacity in the cooperative societies and unions were a major problem, but the boards did
help to involve farmers and limit marketing costs. The general impact was successful and
through the 1960s Tanzania was self-sufficient in food.
The Arusha Declaration in 1967 heralded the government’s ‘villagization’ policy
(Ujamaa) as rural populations were moved into new villages with a more socialist-oriented
mode of production. There was an increase in the area under cultivation, expansion of
extension services and increased use of chemical fertilizer to expand food production. The
policy was not successful and in the early 1970s, due to a combination of drought and
increased prices of imported inputs, production declined (Isinika et al. 2005, p. 198).
1976-1980: the parastatal marketing system
The cooperative system based on the membership of individual farmers was abolished and
replaced by parastatal crop authorities from 1976. Ten parastatal crop authorities were
established to cover 27 main and about 15 minor crops. This was a highly centralized system
with parastatals responsible for production, research and development, project financing,
procurement, processing, and marketing of crops. Each parastatal had a country-wide
procurement capability and the government fixed uniform producer (and food retail) prices.
A major problem is that there was effectively no control on marketing costs, the burden of

7
which fell on export crops (as food crops were subject to other policy objectives, such as low
food prices for consumers, and benefited from input subsidies). Furthermore, the policy of
pan-territorial pricing discriminated against producers located close to markets while
providing price incentives for remote areas.
The parastatal system created extensive and costly distortions. Due to their
inefficiency, the parastatals became effectively bankrupt and began to fail in basic functions
such as crop collection and payments to farmers. By 1980, the problems had become so
alarming that the government decided to re-establish the cooperative movement. This was
achieved through the 1982 Cooperative Act. However, the new marketing system was hastily
formed, e.g. primary societies were based on only one village, irrespective of size and market
considerations, while parastatals reverted to the status of marketing boards (although with
responsibility limited to processing and final sale). Indeed, like the parastatal system, the
cooperative system remained in the hands of government officials, thus maintaining the
historically high level of state intervention. On a positive note, export taxes were almost
completely eliminated by 1985.
The system did allow for regional price differences via a dual price system based on
comparative advantage in production (premium prices for regions with high marketed
output), although it did not take into account transport cost differences. Distortions persisted,
encouraging high production/high transport cost regions (e.g. Southern Highlands) and
discouraging low production/low transport cost regions (e.g. the Coast). Regional pricing also
had the effect of paying premium prices for less-preferred foods, such as sorghum and
cassava in drought-prone areas, so that these foods were accumulated in the NMC reserve, as
a result of which the NMC incurred heavy losses (Isinika et al. 2005, p. 202). Price controls
also imposed high implicit taxation on producers, encouraging a switch from cash to food
crops as the latter could be sold at higher prices on parallel markets. The overvalued
exchange rate added to these distortions as it ‘taxed exports and subsidized imports to the
extent that it sometimes became cheaper for the NMC to import maize than buy locally’
(Isinika et al. 2005, p. 202).
1985-2000: market transition
8
Following ERP policies for agriculture, the Government implemented reforms to move
towards a more market-oriented, liberalized agricultural sector. In 1984 the Government
started to decontrol prices, initially for food crops, and reduce the role of the NMC. By 1990
the marketing of food was largely run by the private sector: ‘in 1985 private trade supplied 50
percent of maize to Dar-es-Salaam, by 1992 this figure had increased to 80-90 percent’
(Isinika et al. 2005, p. 205). The major devaluation of 1986 went some way to compensate
producers for declining world prices. Between 1980 and 1982, export crop sales changed
from being one of the largest single sources of government revenue to being a major recipient
of government subsidies because the government increased nominal producer prices and
reduced export taxes, rather than devaluing to respond to falling world prices.
With the growth of parallel markets, official prices had become in practice minimum
floor prices. With retail prices determined by market forces, farm-gate prices were obtained
by deducting marketing and transport costs from retail prices. Thus, producer prices in the
regions with the highest transport costs are closest to the official (minimum) prices (and most
likely to become the major sources for government procurement), whereas market prices in
other surplus regions are much higher than the official premium price.
As liberalization continued throughout the 1990s, the private sector has become more
efficient in food marketing. Marketing costs and margins have been reduced, private sector
trade has become more competitive, and grain markets are more spatially integrated.
Nevertheless, limited access to information on market opportunities has been a problem for
small farmers, and increases in input prices reduced profits and discouraged production
(Isinika et al. 2005, p. 209). This problem motivated the government to reintroduce fertilizer
subsidies from 2003, albeit on a limited basis. Fertilizer use was not widespread, with no
more than 15 percent of farmers using it in the late 1980s; its use was concentrated on maize
in the Southern Highlands, coffee in Kilimanjaro and tobacco in Tabora (Cooksey 2003, p.
72). Despite the elimination of subsidies, maize yields remained stable and production
increased in the 1990s, with the exception of drought years.
Liberalization has also had significant effects on export crops, in particular coffee and
cotton (the major and second most important export crops). The monopoly of the Cotton
Board was eliminated in 1994, cooperatives were allowed to engage in marketing and
ginning and private companies entered the market, purchasing about half of production by
1996/7 (offering higher prices than cooperatives). As a result, marketing improved and
9
ginning capacity increased. The producer’s share of the cotton export price was about 40
percent during 1989-94, and this rose to about 50 percent in 1995-2000 (Baffes 2004, p. 82).
Taxes of various forms are high, at 13-14 percent of the producer price in the late 1990s,
although often these are not paid in full (Baffes 2004, pp. 90-1). Although cotton is very
responsive to prices, there is no evidence of significant supply response, perhaps because the
availability of credit collapsed and input use declined, and quality may have declined since
liberalization. There are some similarities with cashew nuts, also liberalized in the 1990s:
although marketing efficiency increased and production has grown steadily, limited access to
credit to finance purchases of inputs, especially sulphur, is a major constraint, particularly for
poorer cashew growers (Poulton 1998).
Although almost all of Tanzania’s coffee is produced by smallholders, the Tanzania
Coffee Board (TCB) had a monopoly over marketing, processing and exporting until the mid-
1990s. Private agents were allowed to enter marketing and processing from 1995/5, although
exports were still through the TCB auction. ‘By 1997 there were five fully vertically
integrated exporters (VIEs, subsidiaries of multinational coffee companies) that engaged in
domestic trade, owned processing factories, and exported coffee … accounting for 45 percent
of deliveries to the auction’ (Temu et al. 2001, p. 207). Other private buyers accounted for 22
percent of deliveries to auction; and, from a zero share prior to 1994, private agents
accounted for almost 70 percent of marketed coffee by 1997/8. During this period, marketing
margins were reduced dramatically and the producer price as a share of the export price rose
from 50 percent to over 90 percent (Temu et al. 2001, p. 207-8). Although there was concern
that the VIEs could attain a detrimental dominant position in the market, this had not
happened by the late 1990s.
However, recent events suggest that these liberalization gains are being reversed, in
part because the declining world price for coffee makes the crop unprofitable and squeezes
the margins of traders, and in part because cooperatives are gaining political support in a
rearguard action to preserve their position (Cooksey 2003, p. 76). In 2001, laws were
presented to re-establish the TCB and Tanzania Tobacco Board, under which producers
needed the permission of the boards to grow the crops. Similar measures were proposed for
sugar (Cooksey 2003, pp. 77-8). There is also some concern that the 2001 Cotton Industry
Act provides too much power and intervention to the Cotton Board (Baffes 2004, p. 92). In
sum, while liberalization appears to have had limited successes for food crops (but see
10
Skarstein 2005), the evidence for traditional exports is mixed, as liberalization policies have
either not been implemented or not been sustained.
Post-2000 policy issues
Recognizing that agriculture accounts for some 50 percent of GDP, 80 percent of rural
employment and over 50 percent of the foreign exchange earnings, Tanzania’s Development
Vision 2025 places considerable emphasis on the sector. An annual real growth rate of at
least 8 percent in agriculture would be needed to provide the basis for economic growth and
poverty reduction. A number of policy documents have aimed to achieve this growth: the
Agricultural Sector Development Strategy (ASDS) and Agricultural Sector Development
Program (ASDP) in 2001, and the Cooperative Development Policy (CDP) of 2002,
complemented by a variety of sector policies. These and others are fully reviewed in ESRF
(2005), on which this section is based, and we confine attention to three core issues.
First, the policy statements have at least identified the issues and proposed a strategy.
The ASDS emphasized the need to improve the efficiency of input markets and product
marketing, increase access to credit, enhance the provision of extension services and increase
investment in rural areas (especially for irrigation and transport). The ASDP was in principle
the strategy to implement these aims, but had limited impact. Thus, the culmination of these
initiatives was the formulation of a belief in the need to ‘reintroduce selective subsidies,
particularly for agricultural inputs, machinery and livestock development inputs and services’
(ESRF 2005, p. xii).
Second, despite the CDP, the cooperative sector has failed to respond to the challenge
of liberalization. The sector suffers from weak managerial (and advocacy) skills, a lack of
financial resources (in particular undercapitalization of cooperative banks, so credit
constraints remain), and a weak institutional structure (especially in that they are not
accountable to members). Thus although the cooperative sector remains significant, it is not
viewed as successful, either in supporting development and growth or in representing the
interests of members, giving added impetus to liberalization initiatives.
Third, agriculture is recognized as integral to the Poverty Reduction Strategy, and
agricultural sector growth is essential if Tanzania is to achieve sustained economic
11
development. While this may seem somewhat obvious, it marks a change in emphasis – the
whole sector (not only export crops) has attained a higher status on the policy (political)
agenda, and a view is emerging that there is a need for positive support to the sector.
Trade policy reforms
Although elements of trade policy reform were introduced as part of adjustment programs
from the early 1980s, the major reductions and rationalization of both import duties and
domestic sales taxes were announced in 1988 and 1989. The range and levels of tariffs were
reduced, and most specific sales taxes were converted to ad valorem taxes. The average
implicit tariff (revenue relative to value of imports) rose from 2.9 per cent in 1986 to 4.5 per
cent in 1988, when there was roughly a 100 per cent devaluation over the period, and it fell
slightly to 4.4 per cent by 1990, during which time there had been further devaluation of
about 100 per cent and tariff rationalization (Lyakurwa 1992).
The Tax Commission (1991) placed a heavy emphasis on reform of tariffs and sales
taxes, recommending that Customs Duty be further simplified to three rates. The 1992 Budget
reduced the number of rates to five. Considerable emphasis was placed on the need to limit
the scope of exemptions, as too many importers were exempted from tariffs and sales tax, in
particular government bodies and parastatals. In 1989 actual import tax revenue represented
only 44 per cent of the yield that would have resulted had no importers been exempt (Tax
Commission 1991, p. 13). Licenses for virtually all imports and exports were abolished in
1993, and by the end of that year the foreign exchange market was significantly liberalized.
The number of tariff rates and the maximum tariff have been reduced a number of times such
that by 1997 there were only four rates, the maximum being 30 per cent (with a different and
lower schedule of rates applying to members of regional trade agreements).
Tanzania has been implementing a gradual process of trade policy reform since the
mid-1980s, with notable policy and institutional reforms during the 1990s, leading to a more
open trade regime. These trade reforms have succeeded in lowering tariffs (the average tariff
has fallen from about 28 percent in the early 1990s to 16 percent in the early 2000s), and
appear to be having a beneficial effect. The import/GDP ratio declined by almost 30 percent
(from 37 percent to 26 percent) and the export/GDP ratio increased by almost 50 percent
(from 14 percent to 18 percent) between the early and late 1990s. The National Trade Policy
12
for Tanzania (announced in 2003) seeks to address export promotion to further reduce the
trade deficit, but the reform agenda is incomplete. Further harmonization of the tariff
structure is needed, with improvements to marketing and input supply for agricultural
exports. The National Trade Policy (NTP) is however weak on policies to enhance
agriculture (the largest contributor to exports), although the thrust of the NTP is to transform
the economy from a supply-constrained one into a competitive export-led economy
responsive to the challenges of the global market. A key feature is emphasis on regional
integration and commitment to the Multilateral Trade System with demand for trade policy to
address poverty eradication as the key development challenge for Tanzania. Agricultural
exports feature prominently in the policy, although much remains to be done to integrate
trade, agriculture and poverty reduction strategies.
Measuring distortions to agricultural incentives
The main focus of the present study’s methodology (Anderson et al. 2008) is on government-
imposed distortions that create a gap between domestic prices and what they would be under
free markets. Since it is not possible to understand the characteristics of agricultural
development with a sectoral view alone, the project’s methodology not only estimates the
effects of direct agricultural policy measures (including distortions in the foreign exchange
market), but it also generates estimates of distortions in non-agricultural sectors for
comparative evaluation. More specifically, this study computes a Nominal Rate of Assistance
(NRA) for farmers. It also generates an NRA for nonagricultural tradables, for comparison
with that for agricultural tradables via the calculation of a Relative Rate of Assistance (RRA).
The quantitative analysis is applied to the most important crops in Tanzania over the
period 1976-2004. Almost 80 percent of agricultural crop production is covered, even though
the analysis excludes livestock products. While livestock, dairy and chickens have been
important contributors to overall agricultural growth over the past decade or so, we did not
have adequate data to include them. The 18 products analyzed are classified as cash crops
(coffee, cotton, tea, sisal, tobacco, cashew nuts, pyrethrum and beans), import-competing
13
food crops (maize, rice, wheat and sugar),1 and non-traded crops (cassava, sorghum, millet,
Irish potato, yam and plantain).
The basic principle underlying the measures we estimate is that the price received by
producers (farmers or processors), as adjusted to allow for taxes (subsidies), margins
(marketing and transport) and exchange rate distortions, is compared to some reference price
(an undistorted or international price intended to measure the true opportunity cost). In
principle, the result is an estimate of the difference between the domestic and world price (for
a product at a comparable point in the supply chain), a non-zero wedge implying distortions.
For non-traded goods, there is no reference international price, but the market could be
distorted in various ways. We lack information on distortions to input markets, and have no
evidence to assume any taxes or subsidies to producers of staples (either because there is no
tax or the crops are mostly sold by small traders in local markets where sales taxes are not
collected), so we assume there are no (measurable) distortions for the six non-traded staples.
The treatment of exchange rate distortions is common throughout: we assume the
undistorted exchange rate is a simple average of the nominal and parallel market exchange
rates (as we have no information on the share of currency traded on the black market). We
make a number of other general assumptions. First, we treat cash crops as the semi-processed
traded product, i.e. the primary crop is treated as a non-tradable and the analysis is conducted
for the processed equivalent (e.g. price and production data for coffee are for the clean
equivalent that is exported). Second we assume equi-proportionate transmission throughout
the value chain. Third, we assume domestic and foreign products are of the same quality.
Fourth, we use an international reference price where available, otherwise we use the fob
export price.
The measures we estimate do not explicitly account for ‘excess’ international trading
costs. Recent analysis (Kweka 2006) suggests that Tanzanian exporters face trading costs
above those prevailing in competitive markets, specifically due to inefficiencies in transport
and Customs (which increase costs, delays and wastage), which we represent as an implicit
1 There were often exports of maize and sugar, sometimes even net exports, but they are treated as import-competing products as imports tend to be significant and producers do compete with imports. In the case of maize, informal cross-border exports, especially to Kenya, are often significant but are not included in official trade statistics. This highlights the fact that our estimates relate to the aggregate national sector; specific regions and farmers will tend to face regional price, marketing and trading variations which imply a different level of distortion compared to the national average. This concern applies to all food crops and, to a lesser extent, cash crops (margins and marketing costs may vary by region but prices should be fairly uniform). Unofficial cross-

14
tax (as these cannot be passed on to foreign buyers). In the case of import-competing
products, we treat the marketable product as the primary product and do not consider the
processed product separately, and we use the cif import price for reference.
Results
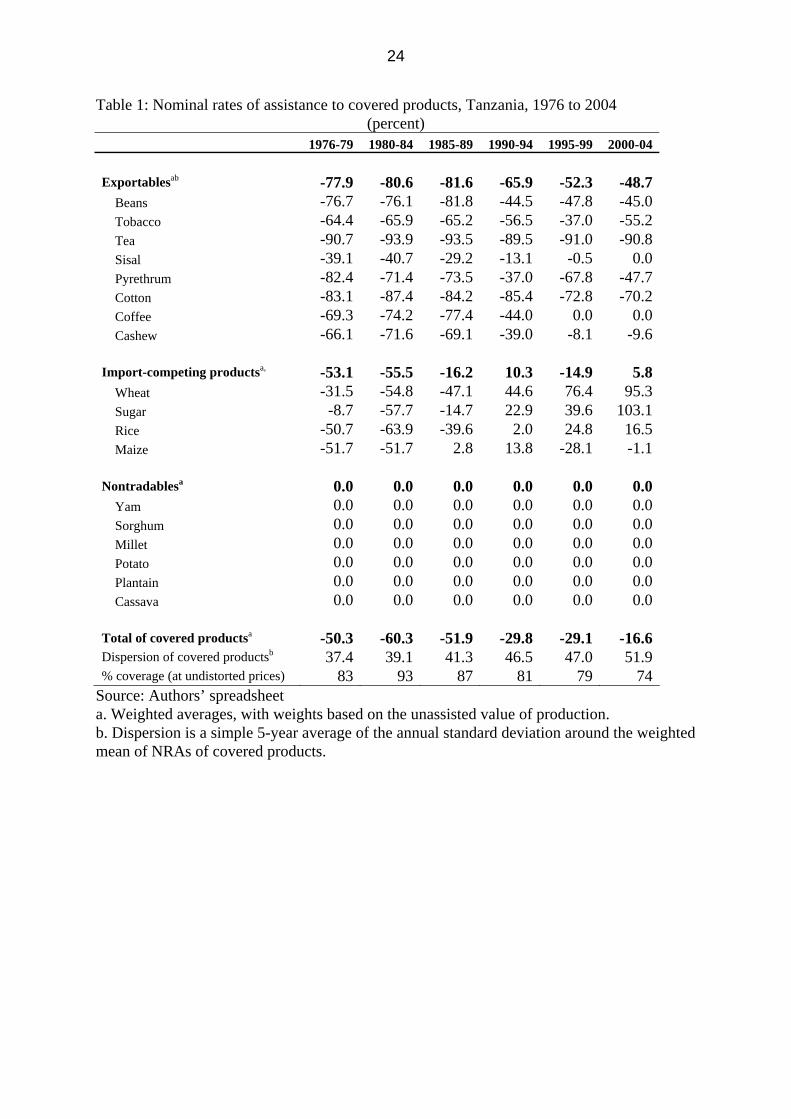
The NRA results for the various crops are given in Table 1. A mixed pattern is evident,
reflecting in part the limited quality of the domestic price data available (in effect an
observation at one point, and possibly for a particular sub-market, in the marketing chain).
Coffee, traditionally one of the more important crops, faced relatively high negative
NRAs from 1976 to the early 1990s (producers received in effect about 30 percent of the
reference price; this was a period with State control of marketing). After 1995, marketing was
liberalized, exchange rate distortions were largely eliminated and there were no subsidies.
Even so, the industry has been under severe stress in recent years, with the share of coffee in
export earnings falling from 17 percent in 1999 to 4 percent or lower from 2002 (WTO 2007,
p A2-203).
Obtaining reliable local price data was a particular problem for cotton, and we
experimented with alternative estimates (see Appendix for a discussion). The results
presented are based on estimating the producer price (inclusive of all margins) as a ratio of
the export price. The NRA was most distorted at worse than -80 percent from the mid-1970s
to the mid-1990s, but then lessened a little to -70 percent during the most recent decade. It
seems likely that the extent of disincentive is overestimated. Poulton and Maro (2007) note
that significant reforms have been implemented for the cotton sector in Tanzania, especially
since 2004, and that the sector now looks quite healthy.
There has been almost no change in the situation for producers of tea over the whole
period, the NRA remaining at about -90 percent. It was difficult to get information on the
industry, and there are no reports of reforms being implemented (which is consistent with the
estimates). While the estimates may overstate the extent of negative distortions, it is likely
that the producers face large disincentives. The tea industry in Tanzania involves strong
monopsony power, with a few companies dominating processing and marketing; the absence
border trade may be important for many horticultural products omitted from the analysis, and in some cases to crops we define as non-traded.
15
of competition may be a reason for the persistent high distortions. Nevertheless, it is
surprising that the significant reduction in exchange rate distortions did not reduce distortions
since the mid-1990s, and this suggests that the data available to us has not captured the true
situation for the sector. One implication is that producers have in effect been receiving a
diminishing share of the export price, and marketing distortions have increased (i.e. non-
exchange rate distortions must have increased to offset reductions in ER distortions). A
general implication (which applies also to cotton) is that the data as applied have not properly
distinguished the primary from the processed product, and the results imply a continued
subsidy to the processing sector. We cannot discount this possibility, but it remains true that
the bias against farmers appears to be high.
Similar conclusions can be drawn for tobacco and pyrethrum. The NRA for tobacco
has remained over -60 percent, while for pyrethrum it appears to have fallen from over -70
percent to less than -50 percent. There is no evidence that elimination of the exchange rate
distortion has reduced distortions, so one must assume inefficiencies remain high and farmers
receive a diminishing proportion of the export price. Although the results suggest a subsidy
for consumers, there are few actual consumers in Tanzania and this should be interpreted as
implying a potential subsidy for processors/traders (at least in the sense that producer prices
are lower than they should be). As with tea, the results may be capturing market distortions
rather than actual policy distortions, limiting the ability of government to address the
problems.
The results for cashew nuts are consistent with observations that (marketing and
processing) efficiency in the sector has increased in recent years, reflecting the increased
competition in the sector (helping farm-gate prices to keep pace with export prices). An NRA
of nearly -70 percent for 1976-89 has become close to zero for the period 1995-2004. Sisal
appears to have been the least (negatively) distorted product, and by the mid-1990s to be
freely traded. Beans are the only example of a non-traditional export covered: the results
suggest relatively unchanged marketing efficiency so that the elimination of exchange rate
distortions is reflected in a reduction in distortions as the NRA declines from -75 percent -45
percent.
For maize, the sustained negative assistance to producers implies a subsidy to
domestic consumers. A combination of trade and exchange rate policies help to explain this.
Until the mid-1990s, access to the overvalued exchange rate lowered the cost of foreign
16
currency and hence the price of imports, and that was less than offset by the relatively high
import tariff (45 percent until 1994). Marketing inefficiencies also kept producer prices (net
of margins) relatively low, although the trend has been for distortions to decline from -50
percent to close to zero. To some extent this overstates the actual distortions, as prior to about
1990 and since about 2000 maize farmers have been able to access fertilizer subsidies (not
incorporated in the analysis due to lack of data). As fertilizer accounts for 30 percent of
production costs on average and the subsidy amounts to 50 percent of the fertilizer costs (on
average for those who get the subsidy), production costs of assisted producers would be
reduced by 15 percent on average.
The results for rice are somewhat similar to maize although the timing of turning
points differs. Negative assistance to producers declined from -50 percent to close to zero by
the 1990s and even slightly positive in the early 2000s. Producers have been able to avail
themselves of fertilizer subsidies since about 2000 (as they were prior to 1990). As with
maize, the combination of trade and exchange rate policies help to explain the trend.
The results for sugar are harder to interpret and data limitations are likely to be severe
(in particular in distinguishing stages of production). The industry appears to be now highly
protected in Tanzania, as sugar typically is in other countries. A larger proportion of the
producer subsidy may be retained by the processor at the expense of the cane farmer than our
NRAs suggest, however.
The aggregate NRAs for exportable, import-competing and all covered farm products
are summarized in Figure 1. A clear anti-trade bias is evident from that figure, although it is
smaller now than it was in the 1980s before the reforms began.
Aggregate distortions to agriculture versus non-agricultural tradables
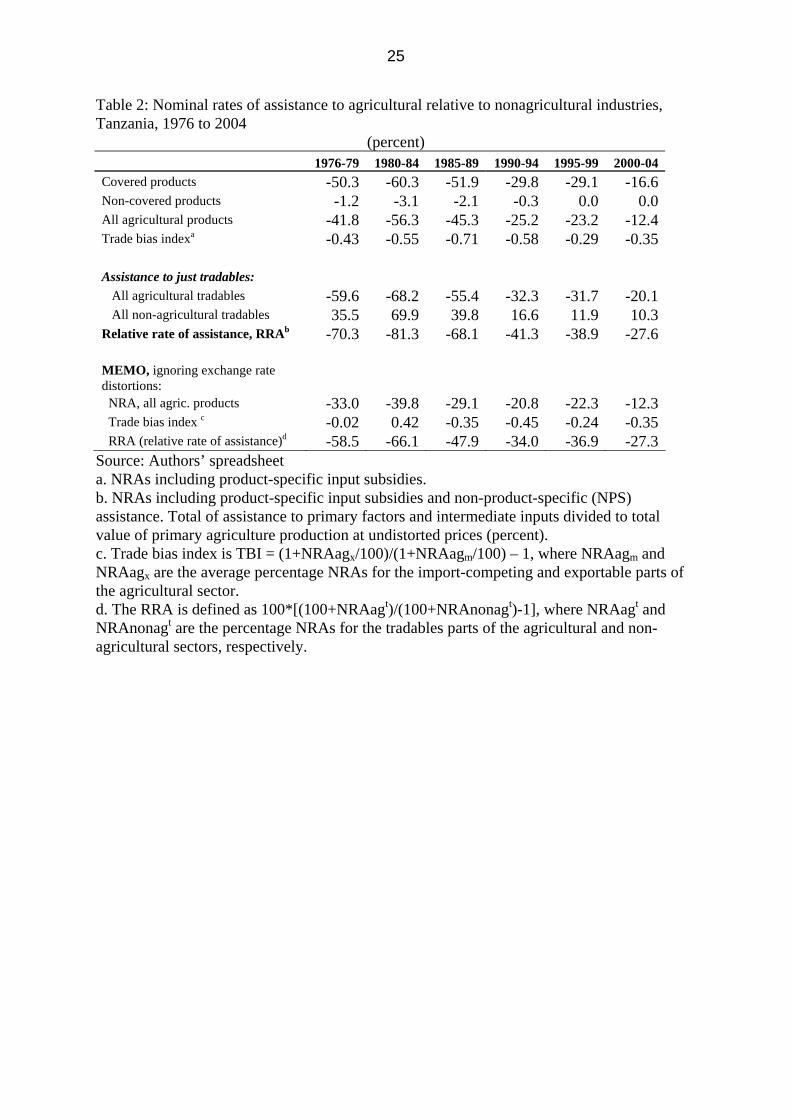
The aggregate NRA for covered products is repeated at the top of Table 2. Also reported
there is a guesstimate of the NRA for non-covered products, accounting for 20-25 percent of
production. Those goods (largely nontraded fruits, vegetables and livestock products) are
assumed to face distortions only from the market for foreign currency.
Aggregate distortions to agriculture appear to have been reduced quite significantly,
from worse than -50 percent in the early 1980s to -25 percent in the 1990s and just -12
percent in the early 2000s.
17
How does this compare with the NRA for producers of non-agricultural tradables?
These are shown in the middle rows of Table 2. The RRA measures the overall bias against
agriculture, relative to non-agricultural tradables. The bias has halved since the latter 1980s,
from -70 percent to -35 percent recently. This implies the overall bias against agriculture has
been reduced, but remains considerable. This change is also depicted in Figure 2.
The final set of rows in Table 2 shows what the distortion indicators would have
been had the distortions to exchange rates not been taken into account. They suggest that
more than one-quarter of the RRA in the 1980s was due just to exchange rate distortions, but
that they have since disappeared.
Prospects and implications
It is important to emphasize that the estimates reported here are based on many assumptions
and limited data, that in at least some cases were not really up to the task. For cash crops it
was difficult if not impossible to distinguish the effect of policy distortions from
inefficiencies in marketing and market structures.2 This is particularly important for estimates
since the mid-1990s when most policy distortions (relating to the exchange rate and export
taxes) were eliminated.3 It is quite possible that for cash crops such as tea, cotton, beans and
tobacco, the negative estimates reflect market inefficiencies in addition to (and perhaps even
more than) policy distortions. Nonetheless, we believe the relative estimates are reasonably
reliable, but probably less reliable for the 1970s. For cash crops, products with high NRA
estimates appear to be those where there is limited competition and inefficient marketing or
2 Four ‘levels’ of agricultural market can be identified in Tanzania (Eskola 2005). Local (village) markets are where farmers sell surplus production, typically of (non-cereal) staples, are seasonal and not integrated into regional markets. Regional markets are typically based in district capitals or urban centers, and sell a wide variety of food products. Although some farmers may trade, the markets are dominated by traders who collect products from producers and other markets (and larger scale traders may supply the national market). The national market is essentially Dar-es-Salaam (DSM), the marketing hub of the country (given the nature of transport systems, regional markets are usually linked via DSM) and the largest urban market. It is dominated by relatively large-scale traders. Finally, cash crops serve the export market, and most cash crop production is exported (in largely unprocessed form), which is dominated by large-scale, often foreign, traders. 3 Policy distortions have not been entirely eliminated as commodity boards were established for the cash crops (except beans) and sugar after liberalization to replace the monopoly marketing boards. These boards announce minimum prices to be paid to farmers and impose a 2 per cent levy on exports. There are also a variety of other taxes or levies (imposed at various points on the production chain), some of which vary across districts (WTO 2007, p. A2-173).
18
processing (cotton, tea and tobacco) whereas NRAs are small for those products where
competition has been introduced and efficiency increased (coffee, cashew nuts and sisal).
The agricultural sector has performed reasonably well since the mid-1990s, and
especially in the early 2000s. By 2005, the policy emphasis was on ensuring that the poor
shared in growth. For agriculture, this implied a need to focus on improved functioning of
output and input markets (especially credit) and public spending on agricultural sector
development, especially irrigation and strengthening research and extension (World Bank
2006). Our results reinforce this, as distortions (mostly negative) remain widespread. We
have two specific conclusions and one general implication.
First, although liberalization of the exchange rate reduced the black market premium
in the 1990s and removed it by about 2000, this did not translate fully into a reduction in
distortions to producers in all crops. Benefits in terms of less negative NRA measures can be
seen for coffee, cashew nuts, cotton and beans among major exports, and for food crops, but
many export crops (such as tea and tobacco) appeared unaffected. This implies that for many
cash crops, other distortions, due to high transport costs, marketing inefficiencies and the
prices paid to farmers, got worse. Addressing these distortions will require institutional
changes.
Second, there is little evidence of improvements in marketing (including processing
and transport) efficiency for most products, although it should be stressed that this may
simply reflect limitations in the data available. There is evidence that high transport costs are
still a major distortion for export crops in the 2000s. For crops where distortions were
reduced progressively but remain high, this can be fully attributed to exchange rate
liberalization (beans, maize). Where producer distortions did not decline despite exchange
rate liberalization, marketing efficiency and/or the (proportion of the world) price paid to
farmers must have deteriorated (tea and tobacco), suggesting that commodity boards are still
not functioning properly from the viewpoint of farmers.
The general implication is that policy reforms in agriculture have some way to go to
eliminate distortions, but certain products may provide examples of what to do (for example,
coffee and cashews for exports, and rice for import-competing food). Overall, the negative
distortions to agriculture have been reduced, but they still remain high for a number of crops
and have not fallen sufficiently relative to the rest of the economy. Given that agriculture is
such a large share of the ‘productive’ economy, sector growth is essential to achieving
19
sustained economic growth in Tanzania. While measures to improve yields and production
efficiency are important, the analysis suggests that measures to improve competitiveness and
efficiency in processing and marketing (including transport and distribution) are equally
important. Growth in agriculture can also contribute significantly to poverty reduction: the
rural poor as producers benefit and, provided productivity and efficiency increase so that real
prices can be reduced, the poor as consumers of food can also benefit. In this respect,
measures relating to regional cross-border trade, typically omitted from official statistics and
often from policy discussions, have a potentially high pay-off. Intra-regional trade facilitation
and other measures associated with regional integration could make cross-border trade easier,
benefiting those in border areas. The typical focus of analysis of marketing and transport
costs is on getting products to Dar-es-Salaam, either as the major domestic market or as the
main port for export. While some attention to Dar-es-Salaam is appropriate, it should not be
at the expense of local, and especially border, markets.
References
Anderson, K., M. Kurzweil, W. Martin, D. Sandri and E. Valenzuela (2008), “Methodology
for Measuring Distortions to Agricultural Incentives,” Agricultural Distortions
Working Paper 02, World Bank, Washington DC, revised January.
Baffes, J. (2004), ‘Tanzania’s Cotton Sector: Reforms, Constraints and Challenges’,
Development Policy Review 22(1): 75-96.
Cooksey, B. (2003), ‘Marketing Reform? The Rise and Fall of Agricultural Liberalization in
Tanzania’, Development Policy Review 21(1): 67-92.
Djurfeldt, G., H. Holmén, M. Jirström and R. Larsson (eds.) (2005), The African Food Crisis:
Lessons from the Asian Green Revolution, Wallingford: CABI Publications.
Eskola, E. (2005), ‘Agricultural Marketing and Supply Chain Management in Tanzania: A
Case Study’, Working Paper Series No. 16, Economic and Social Research Foundation
(ESRF), Dar-es-Salaam.
20
ESRF (2005), Assessment of the Relevancy and Adequacy of Existing Policies on Promoting
Agricultural Development, Final Report to the Ministry of Agriculture and Food
Security, Dar-es-Salaam: Economic and Social Research Foundation (ESRF).
Grenier, L., A. McKay and O. Morrissey (1999), ‘Exporting, Ownership and Confidence in
Tanzanian Enterprises’, The World Economy 22(7): 995-1011.
Isinika, A., G. Ashimogo and J. Mlangwa (2005), ‘From Ujamaa to Structural Adjustment –
Agricultural Intensification in Tanzania’, in Djurfeldt et al. (2005), pp. 197-218.
Kweka, J. (2006), ‘Trade and Transport Costs in Tanzania’, CREDIT Research Paper 06/10,
School of Economics, University of Nottingham.
Lyakurwa, W. (1992), “Fiscal Implications of Trade Policy Reforms in Tanzania”, Paper
presented at the CREDIT-CSAE Workshop on Trade and Fiscal Reforms in Sub-
Saharan Africa, St. Anthony’s College, Oxford, January 6-8.
McKay, A., O. Morrissey and C. Vaillant (1999), ‘Aggregate Agricultural Supply Response
in Tanzania’, Journal of International Trade and Economic Development 8(1): 107-123.
Poulton, C. (1998), ‘The Cashew Sector in Southern Tanzania: Overcoming Problems of
Input Supply’, pp. 113-76 in A. Dorward, J. Kydd and C. Poulton (eds.), Smallholder
Cash Crop Production Under Market Liberalization, Wallingford: CAB International.
Poulton, C. and W. Maro (2007), Tanzania Country Study, First Draft prepared for the World
Bank project on Multi-Country Review of the Impact of Cotton Sector Reform in sub-
Saharan Africa mimeo, March.
Skarstein, R. (2005), ‘Economic Liberalisation and Smallholder Productivity in Tanzania:
From Promised Success to Real failure, 1985-1998’, Journal of Agrarian Change 5(3):
334-62.
Tanzania Economic Survey (various years), Dar-es-Salaam, Tanzania Bureau of Statistics.
Tax Commission (1991), Presidential Commission of Enquiry into Public Revenues, Taxation
and Expenditure: Final Report, Dar-es-Salaam: Government Printers.
Temu, A., A. Winter-Nelson and P. Garcia (2001), ‘Market Liberalisation, Vertical
Integration and Price Behaviour in Tanzania’s Coffee Auction’, Development Policy
Review 19(2): 205-22.
Thirlwall, A.P. (1986), ‘A General Model of Growth and Development along Kaldorian
Lines’, Oxford Economic Papers 38: 199-219.

21
World Bank (1994), Tanzania Agriculture: A Joint Study by the Government of Tanzania and
the World Bank, Washington DC: The World Bank
World Bank (2006), Tanzania: Sustaining and Sharing Economic Growth, Country
Economic Memorandum and Poverty Assessment, Volume 1 (draft 28 April).
WTO (2007), Trade Policy Review: East Africa Community 2006, Geneva: World Trade
Organization, February.

22
Figure 1: Nominal rates of assistance to exportables, import-competing and alla agricultural products, Tanzania, 1976 to 2004
(percent)
-90
-60
-30
0
30
60
1976 1978 1980 1982 1984 1986 1988 1990 1992 1994 1996 1998 2000 2002 2004
total import-competing products exportables
Source: Authors’ spreadsheet a. The total NRA can be above or below the exportable and import-competing averages because assistance to nontradables and non-product specific assistance is also included.

23
Figure 2: Nominal rates of assistance to all nonagricultural tradables, all agricultural tradable industries, and relative rates of assistancea, Tanzania, 1976 to 2004
(percent)
-90
-60
-30
0
30
60
90
1976 1978 1980 1982 1984 1986 1988 1990 1992 1994 1996 1998 2000 2002 2004
RRA agricultural tradables nonagricultural tradables
Source: Authors’ spreadsheet a. The RRA is defined as 100*[(100+NRAagt)/(100+NRAnonagt)-1], where NRAagt and NRAnonagt are the percentage NRAs for the tradables parts of the agricultural and nonagricultural sectors, respectively.
24
Table 1: Nominal rates of assistance to covered products, Tanzania, 1976 to 2004 (percent)
1976-79 1980-84 1985-89 1990-94 1995-99 2000-04 Exportablesab -77.9 -80.6 -81.6 -65.9 -52.3 -48.7
Beans -76.7 -76.1 -81.8 -44.5 -47.8 -45.0 Tobacco -64.4 -65.9 -65.2 -56.5 -37.0 -55.2 Tea -90.7 -93.9 -93.5 -89.5 -91.0 -90.8 Sisal -39.1 -40.7 -29.2 -13.1 -0.5 0.0 Pyrethrum -82.4 -71.4 -73.5 -37.0 -67.8 -47.7 Cotton -83.1 -87.4 -84.2 -85.4 -72.8 -70.2 Coffee -69.3 -74.2 -77.4 -44.0 0.0 0.0 Cashew -66.1 -71.6 -69.1 -39.0 -8.1 -9.6
Import-competing productsa, -53.1 -55.5 -16.2 10.3 -14.9 5.8
Wheat -31.5 -54.8 -47.1 44.6 76.4 95.3 Sugar -8.7 -57.7 -14.7 22.9 39.6 103.1 Rice -50.7 -63.9 -39.6 2.0 24.8 16.5 Maize -51.7 -51.7 2.8 13.8 -28.1 -1.1
Nontradablesa 0.0 0.0 0.0 0.0 0.0 0.0
Yam 0.0 0.0 0.0 0.0 0.0 0.0 Sorghum 0.0 0.0 0.0 0.0 0.0 0.0 Millet 0.0 0.0 0.0 0.0 0.0 0.0 Potato 0.0 0.0 0.0 0.0 0.0 0.0 Plantain 0.0 0.0 0.0 0.0 0.0 0.0 Cassava 0.0 0.0 0.0 0.0 0.0 0.0
Total of covered productsa -50.3 -60.3 -51.9 -29.8 -29.1 -16.6 Dispersion of covered productsb 37.4 39.1 41.3 46.5 47.0 51.9 % coverage (at undistorted prices) 83 93 87 81 79 74
Source: Authors’ spreadsheet a. Weighted averages, with weights based on the unassisted value of production. b. Dispersion is a simple 5-year average of the annual standard deviation around the weighted mean of NRAs of covered products.
25
Table 2: Nominal rates of assistance to agricultural relative to nonagricultural industries, Tanzania, 1976 to 2004
(percent) 1976-79 1980-84 1985-89 1990-94 1995-99 2000-04 Covered products -50.3 -60.3 -51.9 -29.8 -29.1 -16.6Non-covered products -1.2 -3.1 -2.1 -0.3 0.0 0.0All agricultural products -41.8 -56.3 -45.3 -25.2 -23.2 -12.4Trade bias indexa -0.43 -0.55 -0.71 -0.58 -0.29 -0.35 Assistance to just tradables: All agricultural tradables -59.6 -68.2 -55.4 -32.3 -31.7 -20.1 All non-agricultural tradables 35.5 69.9 39.8 16.6 11.9 10.3Relative rate of assistance, RRAb -70.3 -81.3 -68.1 -41.3 -38.9 -27.6 MEMO, ignoring exchange rate distortions: NRA, all agric. products -33.0 -39.8 -29.1 -20.8 -22.3 -12.3 Trade bias index c -0.02 0.42 -0.35 -0.45 -0.24 -0.35 RRA (relative rate of assistance)d -58.5 -66.1 -47.9 -34.0 -36.9 -27.3
Source: Authors’ spreadsheet a. NRAs including product-specific input subsidies. b. NRAs including product-specific input subsidies and non-product-specific (NPS) assistance. Total of assistance to primary factors and intermediate inputs divided to total value of primary agriculture production at undistorted prices (percent). c. Trade bias index is TBI = (1+NRAagx/100)/(1+NRAagm/100) – 1, where NRAagm and NRAagx are the average percentage NRAs for the import-competing and exportable parts of the agricultural sector. d. The RRA is defined as 100*[(100+NRAagt)/(100+NRAnonagt)-1], where NRAagt and NRAnonagt are the percentage NRAs for the tradables parts of the agricultural and non-agricultural sectors, respectively.
26
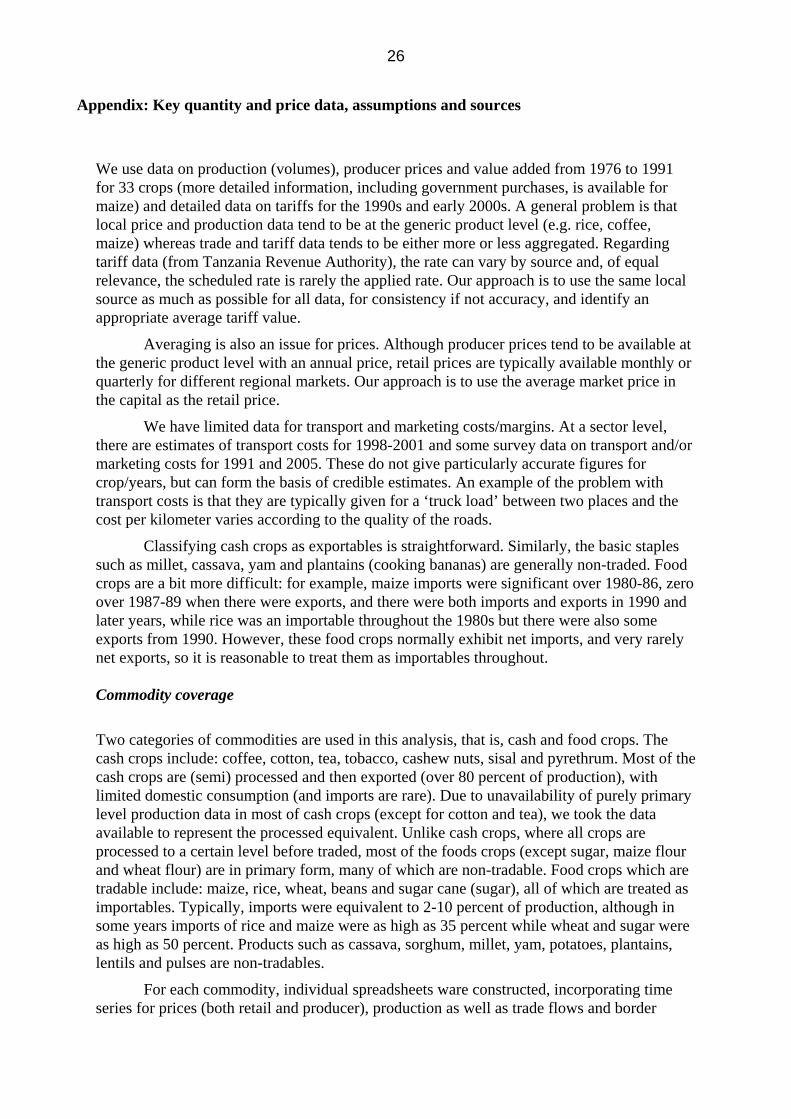
Appendix: Key quantity and price data, assumptions and sources
We use data on production (volumes), producer prices and value added from 1976 to 1991 for 33 crops (more detailed information, including government purchases, is available for maize) and detailed data on tariffs for the 1990s and early 2000s. A general problem is that local price and production data tend to be at the generic product level (e.g. rice, coffee, maize) whereas trade and tariff data tends to be either more or less aggregated. Regarding tariff data (from Tanzania Revenue Authority), the rate can vary by source and, of equal relevance, the scheduled rate is rarely the applied rate. Our approach is to use the same local source as much as possible for all data, for consistency if not accuracy, and identify an appropriate average tariff value.
Averaging is also an issue for prices. Although producer prices tend to be available at the generic product level with an annual price, retail prices are typically available monthly or quarterly for different regional markets. Our approach is to use the average market price in the capital as the retail price.
We have limited data for transport and marketing costs/margins. At a sector level, there are estimates of transport costs for 1998-2001 and some survey data on transport and/or marketing costs for 1991 and 2005. These do not give particularly accurate figures for crop/years, but can form the basis of credible estimates. An example of the problem with transport costs is that they are typically given for a ‘truck load’ between two places and the cost per kilometer varies according to the quality of the roads.
Classifying cash crops as exportables is straightforward. Similarly, the basic staples such as millet, cassava, yam and plantains (cooking bananas) are generally non-traded. Food crops are a bit more difficult: for example, maize imports were significant over 1980-86, zero over 1987-89 when there were exports, and there were both imports and exports in 1990 and later years, while rice was an importable throughout the 1980s but there were also some exports from 1990. However, these food crops normally exhibit net imports, and very rarely net exports, so it is reasonable to treat them as importables throughout. Commodity coverage
Two categories of commodities are used in this analysis, that is, cash and food crops. The cash crops include: coffee, cotton, tea, tobacco, cashew nuts, sisal and pyrethrum. Most of the cash crops are (semi) processed and then exported (over 80 percent of production), with limited domestic consumption (and imports are rare). Due to unavailability of purely primary level production data in most of cash crops (except for cotton and tea), we took the data available to represent the processed equivalent. Unlike cash crops, where all crops are processed to a certain level before traded, most of the foods crops (except sugar, maize flour and wheat flour) are in primary form, many of which are non-tradable. Food crops which are tradable include: maize, rice, wheat, beans and sugar cane (sugar), all of which are treated as importables. Typically, imports were equivalent to 2-10 percent of production, although in some years imports of rice and maize were as high as 35 percent while wheat and sugar were as high as 50 percent. Products such as cassava, sorghum, millet, yam, potatoes, plantains, lentils and pulses are non-tradables.
For each commodity, individual spreadsheets ware constructed, incorporating time series for prices (both retail and producer), production as well as trade flows and border
27
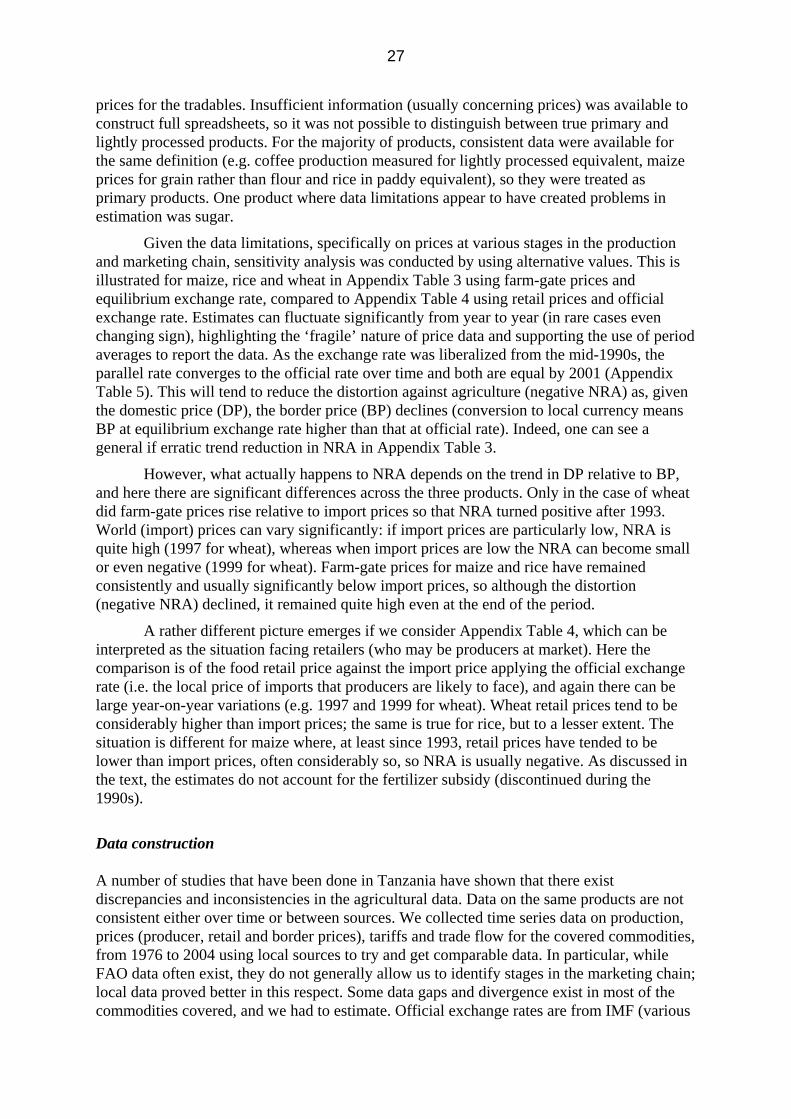
prices for the tradables. Insufficient information (usually concerning prices) was available to construct full spreadsheets, so it was not possible to distinguish between true primary and lightly processed products. For the majority of products, consistent data were available for the same definition (e.g. coffee production measured for lightly processed equivalent, maize prices for grain rather than flour and rice in paddy equivalent), so they were treated as primary products. One product where data limitations appear to have created problems in estimation was sugar.
Given the data limitations, specifically on prices at various stages in the production and marketing chain, sensitivity analysis was conducted by using alternative values. This is illustrated for maize, rice and wheat in Appendix Table 3 using farm-gate prices and equilibrium exchange rate, compared to Appendix Table 4 using retail prices and official exchange rate. Estimates can fluctuate significantly from year to year (in rare cases even changing sign), highlighting the ‘fragile’ nature of price data and supporting the use of period averages to report the data. As the exchange rate was liberalized from the mid-1990s, the parallel rate converges to the official rate over time and both are equal by 2001 (Appendix Table 5). This will tend to reduce the distortion against agriculture (negative NRA) as, given the domestic price (DP), the border price (BP) declines (conversion to local currency means BP at equilibrium exchange rate higher than that at official rate). Indeed, one can see a general if erratic trend reduction in NRA in Appendix Table 3.
However, what actually happens to NRA depends on the trend in DP relative to BP, and here there are significant differences across the three products. Only in the case of wheat did farm-gate prices rise relative to import prices so that NRA turned positive after 1993. World (import) prices can vary significantly: if import prices are particularly low, NRA is quite high (1997 for wheat), whereas when import prices are low the NRA can become small or even negative (1999 for wheat). Farm-gate prices for maize and rice have remained consistently and usually significantly below import prices, so although the distortion (negative NRA) declined, it remained quite high even at the end of the period.
A rather different picture emerges if we consider Appendix Table 4, which can be interpreted as the situation facing retailers (who may be producers at market). Here the comparison is of the food retail price against the import price applying the official exchange rate (i.e. the local price of imports that producers are likely to face), and again there can be large year-on-year variations (e.g. 1997 and 1999 for wheat). Wheat retail prices tend to be considerably higher than import prices; the same is true for rice, but to a lesser extent. The situation is different for maize where, at least since 1993, retail prices have tended to be lower than import prices, often considerably so, so NRA is usually negative. As discussed in the text, the estimates do not account for the fertilizer subsidy (discontinued during the 1990s).
Data construction A number of studies that have been done in Tanzania have shown that there exist discrepancies and inconsistencies in the agricultural data. Data on the same products are not consistent either over time or between sources. We collected time series data on production, prices (producer, retail and border prices), tariffs and trade flow for the covered commodities, from 1976 to 2004 using local sources to try and get comparable data. In particular, while FAO data often exist, they do not generally allow us to identify stages in the marketing chain; local data proved better in this respect. Some data gaps and divergence exist in most of the commodities covered, and we had to estimate. Official exchange rates are from IMF (various
28
years) and parallel exchange rates are from International Currency Analysis (various years) updated from Easterly (2006), see summary in Appendix Table 5. Production data Cash crops data were collected directly from their respective boards and authorities, for instance; cotton from Cotton Marketing Board, tea from Tanzania Tea Authority and tobacco from Tobacco Marketing Board. Most of the food crops production data (tradable and non-tradable) are from the Statistics Unit (various years) of the Ministry of Agriculture and Cooperatives. We used FAOSTAT production data to fill gaps where possible.
Prices data
Most data on food crop retail prices have only been compiled on a consistent basis from 1983 by the Statistics Unit (various years), while producer price series often have gaps. We combine data on producer prices of food crops from World Bank (1994) for 1976 to 1991 with data from the Statistics Unit for 1992 to 2004. In the case of cash crops, we have a reasonable time series data for producer prices but limited data on prices at different stages of marketing; we used a mark up of 20 percent on the producer prices to get the wholesale prices and allow for a transport cost margin at the ‘retail’ (export) level.
Trade flow and price data
All of the cash crops are traded commodities as around 80 percent of their processed are exported. Good data are available on the exports of cash crops exist in various sources, but for consistency we used those from Central Bank of Tanzania which are largely comparable to FAOSTAT data. While most of these cash crops are semi/full-processed and then exported, Tanzania does not import similar commodities, the related imports are of the processed product. Only a few of the food crops covered are traded (mostly imported), either at their primary level or processed level. These include maize grain (maize flour), wheat grain (wheat flour), paddy/rice and sugar. Most of data on these import-competing commodities were taken from FAOSTAT data, as it was difficult to get consistent trade data on food crops from the local sources.
As cash crops are exported we take FOB as their border prices. On the other hand, since the tradable food crops are mostly imported we take CIF as their border prices. FOB prices which are expressed in the US$ are taken from the World Bank (1994) for the period 1976 to 1991 and for 1992 to 2004 from the Tanzania Economic Survey (2002 and 2005). CIF prices were taken from FAOSTAT, imports divided by the volume of that trade, with those data extracted from FAO (1996) for years prior to 1995. Treatment of marketing chains Marketing chains in Tanzania, as is the case in most African countries, are complex. One commodity usually leads to various processed products from where it is produced through local/village markets on its way to regional/districts and national/city markets. For instance a fresh cassava (or Irish potatoes) converts to cassava (potato) chips and flour. And sometimes the growers themselves sell both primary and part-processed production. Thus if one is to trace the chain from the growers to consumers in urban areas, a number of traders of different scale are involved and commodities are transformed into various processed products.
29
Most exportables (with the exception of seed cotton and tea leaves which are primary at their first record and then converted into processed cotton lint and tea made) are treated, and data recorded, as the processed commodities. For importables, maize and wheat in their primary form are converted into flour (processed), and the data relate to flour. Sugar is a processed food product transformed from sugarcane. Given lack of data, all non-tradables are treated as primary (unprocessed) products.
Like most countries in the region, Tanzania grows two types of coffee, Robusta and Arabica. These are processed into clean coffee (also called green coffee). Arabica coffee accounts for about 75 percent of the total production. About 27,000 small holders produce coffee in small plots averaging 0.5 hectares. However, production is on a downward trend, as it fallen from a peak of nearly 67,000 ton in 1980/81 to only 33,000 tons in 2004 – a fall of 50 percent. Likewise, yields per hectare are low, averaging 151 kilograms for Arabica and 260 kilograms for Robusta (ESRF 2005). In the case of cotton, farmers (usually smallholders on farms of about 0.5 to 10 hectares, the average being 1.5 hectares) produce seed cotton which is assembled and brought for ginning. The ginning process produces lint and cottonseed. The cotton lint is mainly exported but with a proportion is retained for domestic use, while cottonseed is crushed to produce cottonseed oil and a residual cake. We use data for cotton lint as the most comprehensive series available.
Information on margins
A number of studies of the agricultural sector or specific crops in Tanzania include information on marketing costs and margins. Brokers and traders tend to charge a fixed price per specified quantity and as prices vary regionally and seasonally, converting this to a percentage of the retail or producer price (as an annual average) is inevitably no more than a rough approximation. Although such information is neither collected nor reported in a uniform way, and there will be considerable variations over time, across products and across regions and producers, it does permit us to make some estimates of the magnitude of margins. In general:
Non-traded food crops (H), in particular non-cereal staples such as cassava and tubers, tend effectively to have very low margins because they are mostly sold locally (near the point of production). Food staples have low price/weight ratios, hence transport costs are a relatively high proportion of the price, and are less popular amongst urban consumers (except perhaps the poorest). Thus, although they are ‘the major crops traded at the village and regional markets, they rarely enter into the national market’ (Eskola 2005, p. 17).
Food crops, which are in principle importables (M) even if not always imported, face margins that increase as they move through the supply chain to the urban (DSM) market, where they may compete with imports. In 2004/05, the margins on grains, such as rice or maize, tends to be around 10 percent for regional markets rising to 20 percent in DSM (with similar margins for bananas), but the margins on potatoes and fruits, such as oranges, in DSM can be much higher than 20 percent (Eskola 2005, p. 19). Land transport costs for foods are estimated at 2.7 percent in 1998 and 3.6 percent in 2002 (Kweka 2006 and Table 8).
Cash crops (X) are almost entirely exported, with very low domestic demand (except for some processed coffee, tea and cotton lint, and non-traditional exports of fruits and vegetables). Estimates of export cost margins vary considerably, but if marketing was efficient 10 percent would be a reasonable figure. To these should be added transport costs, estimated at about 33 percent in 1998 and 25 percent in 2002 (Kweka 2006 and Table 8). For coffee (clean) in the early 1990s, marketing board margins were up to 7 percent of the
30
auction price and other levies, including some taxes, added another 3-6 percent (World Bank 1994, p. 126). The marketing cost for parchment coffee is estimated to have fallen from 0.59 $/kg to 0.14 $/kg, so the margin fell from 54 percent of the export price in 1992/3 to six percent in 1997/8 (Temu et al. 2001, p. 208). In the case of cotton, export market costs were over 30 percent of the export price, although efficiency gains could have reduced this to about 10 percent (World Bank 1994, p. 131). Baffes (2004, p. 90) shows that various taxes amounted to about 14 percent of the producer price of cotton in the late 1990s. Export agents for cashew nuts charged up to 5 percent of the producer price in 2004/05 (Eskola 2005, p. 19).
Appendix Table 6 presents our (rough) estimates of the magnitude of marketing margins and trade costs for types of crops in Tanzania. The high values in the early 1990s reflect the inefficiencies of marketing boards, and similar excess margins probably prevailed in the 1980s. The available evidence suggests that liberalization increased efficiency and reduced margins from the mid-1990s down to about 10 percent (higher or lower depending on the vagaries of world prices). Thus, 10 percent is taken as the base estimate unless better data are available.
We only have estimates of margins for foods in the mid-2000s, information suggesting that the margin on grains in regional markets is around 10 percent rising to 20 percent in DSM, while margins on fruits and vegetables are about ten percentage points higher in each market. In the analysis below, we utilize two retail reference prices (taken as averages for each year to smooth of seasonal variations). The DSM price refers to the national market, and as a lower bound we select the regional market in which the product was traded (i.e. a price recorded) in all months that had the lowest price.
Transport Costs
Kweka (2006) has calculated effective protection incorporating transport costs (but not at a highly disaggregated level). This analysis was based on broad sectors, and we summarize the results below to provide a flavor.
Estimates of freight costs in Tanzania, comparing 1998 and 2002, suggest that average costs were quite low, especially for overland freight, but increased slightly (Appendix Table 7). While sea freight costs on average fell from 12 percent to 11 percent, land freight costs rose from four to almost seven percent (due largely to an increase in rail freight rates in 2001), and overall average costs rose from 16 percent to 18 percent. There were significant variations for the major export sectors. For the main cash crops (cotton, coffee, tea) overall costs fell significantly from 33 percent to 25 percent, due to a fall in sea freight costs. For non-traditional exports (fish and mining) however, overall transport costs appear to have risen. As the average changes are quite small and the data reliability is limited on actual freight rates, the cross-sector pattern of costs is more informative than the estimated trends over time. This suggests that transport costs for major export products remain quite high, especially for the non-traditional sectors into which Tanzania is aiming to diversify.
In contrast, there have been significant reductions in tariffs, and hence in protection due to trade policy. Estimates for Tanzania are in Appendix Table 8, comparing 1995 with 2001. Average (unweighted) nominal tariffs were reduced from 15 percent to just over 8 percent, contributing to a reduction in effective protection of imports from 31 percent to 17 percent. The most significant reductions were in building materials, machinery and other manufacturing. The results for effective taxation of exports give rise to concern, as this

31
increased from 32 percent to 40 percent. The rates are especially high, and increased, for cash crops – the traditional export sector; this almost entirely due to high and increasing levels of transport costs.
Treatment of Cotton As Baffes (2007, pp. 17-18) notes, aspects of the structure of cotton production
facilitates estimating distortions (provided one has adequate data). There is a generally accepted international reference price and as almost all cotton is exported conditions in the domestic market are not very important. The distortion to cotton lint captures the distortions to the cotton sector quite well, while the rate of conversion (the ginning ratio) from cotton seed to cotton lint is usually known. On the other hand, it is usually very difficult to fully incorporate the effects of taxes, government interventions at various stages of production and marketing, and true marketing and distribution costs.
The initial estimates of distortions to cotton were based on seed cotton prices, for which data were available covering the whole period, as a measure of the primary (farm-gate) product. These estimates (‘Initial’ in Appendix Table 9) suggested implausibly high distortions, and did not capture the expected reductions in distortions from the mid-1990s as exchange rate distortions were eliminated. In the light of comments from Colin Poulton, it was evident that ginning ratios and margins had not been properly incorporated so we revised our estimates of distortions to the sector, as set out in Appendix Table 9.
For Revision1, we used cotton lint prices (applying the ginning ratio only to link this to farm production). These prices were not available for all years, so some estimation was required. This generated substantially different estimates (‘Revision1’ in Appendix Table 9), suggesting much lower levels of distortions being eliminated by the early 1990s. However, these estimates reveal implausibly large positive distortions from the mid-1990s and especially 2000s. On inspecting the data from the mid-1980s, the domestic producer (cotton lint) prices are seen to have been increasing at implausibly rapid rates (e.g. doubling between 1984 and 1985, trebling between 1986 and 1988, then more than doubling by 1992 and again by 1995). This contrasts with an international reference price that was stagnant or even declining during this period. It also contrasts with seed cotton and other local prices: Appendix Figure 4 (for Cotton) suggests farm-gate and wholesale local seed cotton prices appear to have stagnated since the late 1980s, although export prices rose significantly.
As this implies serious concern over the reliability of the price data, the second revision estimates the producer price (inclusive of all margins) as a fixed ratio of the export price (on which we did have reliable data). ‘From 1990-94 the mean share of the c.i.f. export price received by producers was 45%; from 1995-2006 it has been 59%’ (Poulton and Maro 2007, p. 40). To stretch the revision back to 1985, we assumed the proportion received over 1985-89 was 40 percent. This generated the final estimates (‘Revision2’ in Appendix Table 9) that appear more plausible. It seems likely that the extent of distortions is underestimated for the 1970s, and overestimated from the mid-1980s (especially 1985-94). Nevertheless, we feel that Revision2 is a marked improvement over the initial estimates.
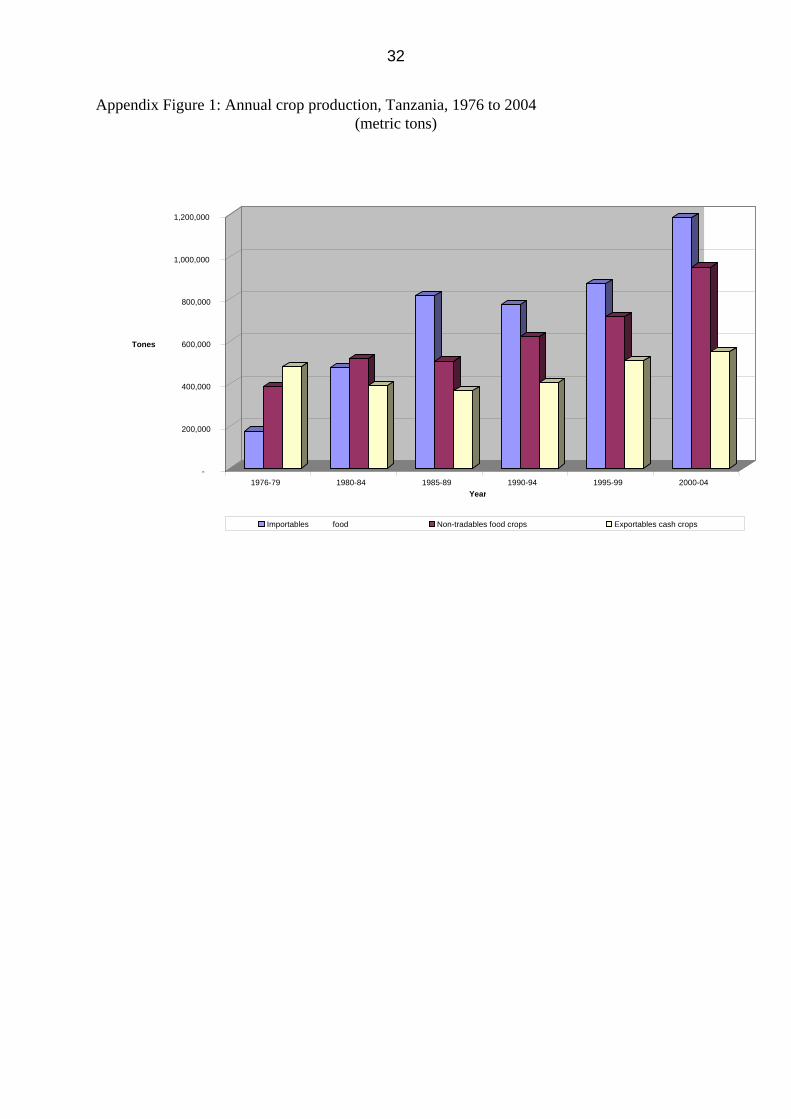
32
Appendix Figure 1: Annual crop production, Tanzania, 1976 to 2004 (metric tons)
-
200,000
400,000
600,000
800,000
1,000,000
1,200,000
Tones
1976-79 1980-84 1985-89 1990-94 1995-99 2000-04Year
Importables food Non-tradables food crops Exportables cash crops
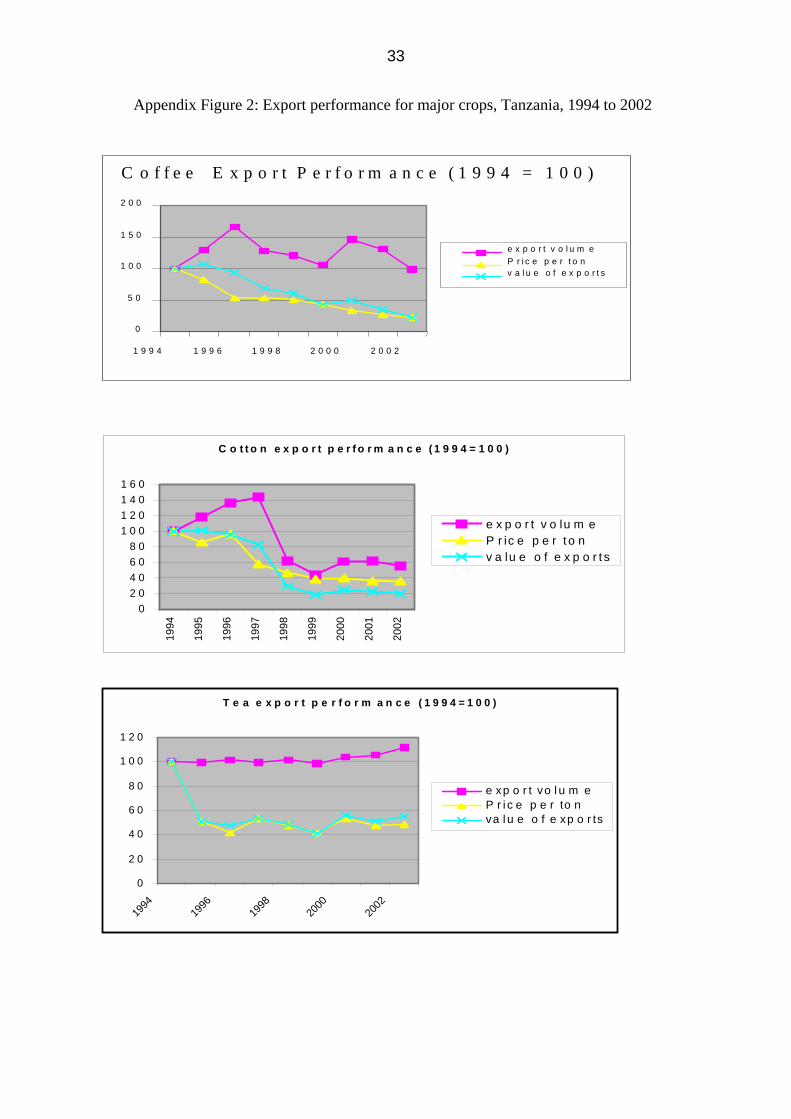
33
Appendix Figure 2: Export performance for major crops, Tanzania, 1994 to 2002
C o f f e e E x p o r t P e r f o r m a n c e ( 1 9 9 4 = 1 0 0 )
0 5 0
1 0 0 1 5 0 2 0 0
1 9 9 4 1 9 9 6 1 9 9 8 2 0 0 0 2 0 0 2
e x p o r t v o l u m e P r i c e p e r t o n v a l u e o f e x p o r t s
C o t t o n e x p o r t p e r f o r m a n c e ( 1 9 9 4 = 1 0 0 )
02 04 06 08 0
1 0 01 2 01 4 01 6 0
1994
1995
1996
1997
1998
1999
2000
2001
2002
e x p o r t v o lu m eP r ic e p e r t o nv a lu e o f e x p o r t s
T e a e x p o r t p e r f o r m a n c e ( 1 9 9 4 = 1 0 0 )
0
2 0
4 0
6 0
8 0
1 0 0
1 2 0
1994
1996
1998
2000
2002
e xp o r t vo l u m eP r i c e p e r to nva l u e o f e xp o r ts
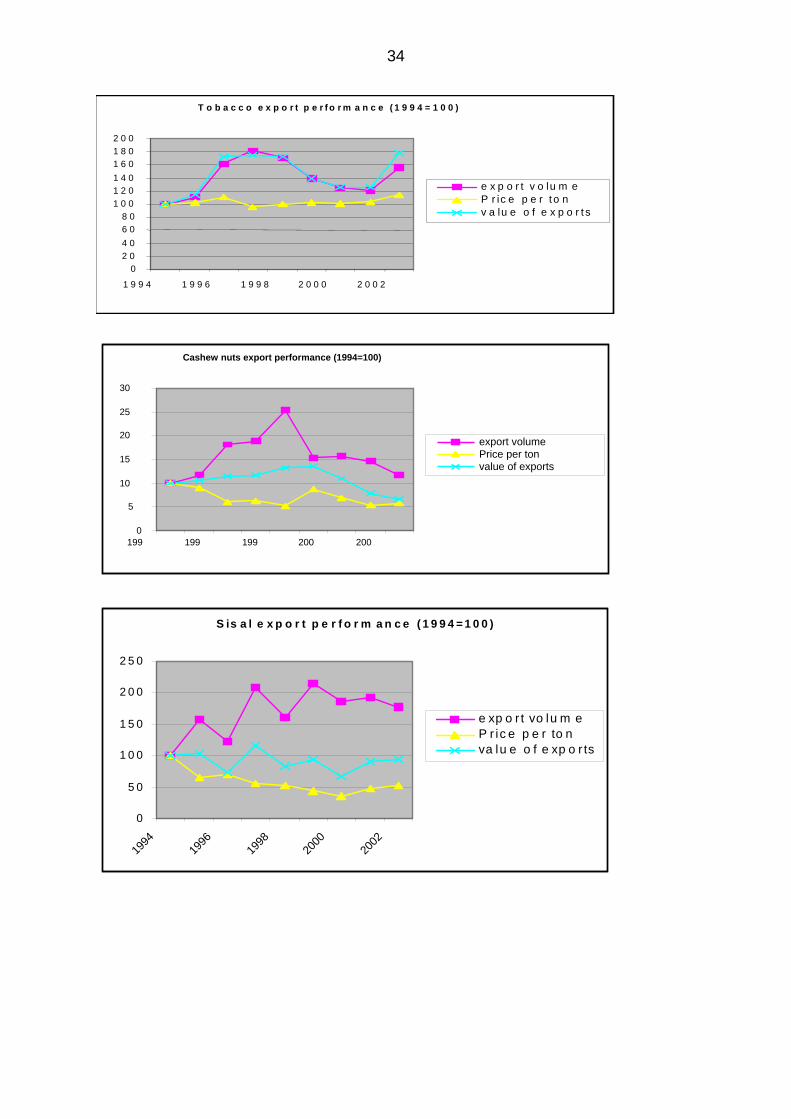
34
T o b a c c o e x p o r t p e r f o r m a n c e ( 1 9 9 4 = 1 0 0 )
0 2 0 4 0 6 0 8 0
1 0 0 1 2 0 1 4 0 1 6 0 1 8 0 2 0 0
1 9 9 4 1 9 9 6 1 9 9 8 2 0 0 0 2 0 0 2
e x p o r t v o lu m e P r ic e p e r t o n v a lu e o f e x p o r t s
S is a l e x p o r t p e r f o r m a n c e ( 1 9 9 4 = 1 0 0 )
0
5 0
1 0 0
1 5 0
2 0 0
2 5 0
1994
1996
1998
2000
2002
e xp o r t vo lu m eP r ic e p e r to nva lu e o f e xp o r ts
Cashew nuts export performance (1994=100)
0 5
10
15
20
25
30
199 199 199 200 200
export volumePrice per tonvalue of exports

35
Figure 3: Tea Prices (current), 1976 to 2004
0
200000
400000
600000
800000
1000000
1200000
1400000
1600000
1976 1977 1978 1979 1980 19811982 1983 1984 1985 1986 198719881989199019911992199319941995199619971998199920002001 2002 2003 2004 Year
Price
Farm-gate selling price (Pf) Wholesale price for processed goods (Pwp) Border price (fob in Tshs)
Figure 4: Cotton Prices (current), 1976 to 2004
0
200000
400000
600000
800000
1000000
1200000
1976 1977 1978 1979 1980 1981 1982 1983 1984 1985 198619871988198919901991199219931994199519961997199819992000 2001 2002 2003 2004 Year
Price
Farm-gate selling price (Pf) Wholesale price for processed goods (Pwp) Border price (fob in Tshs)
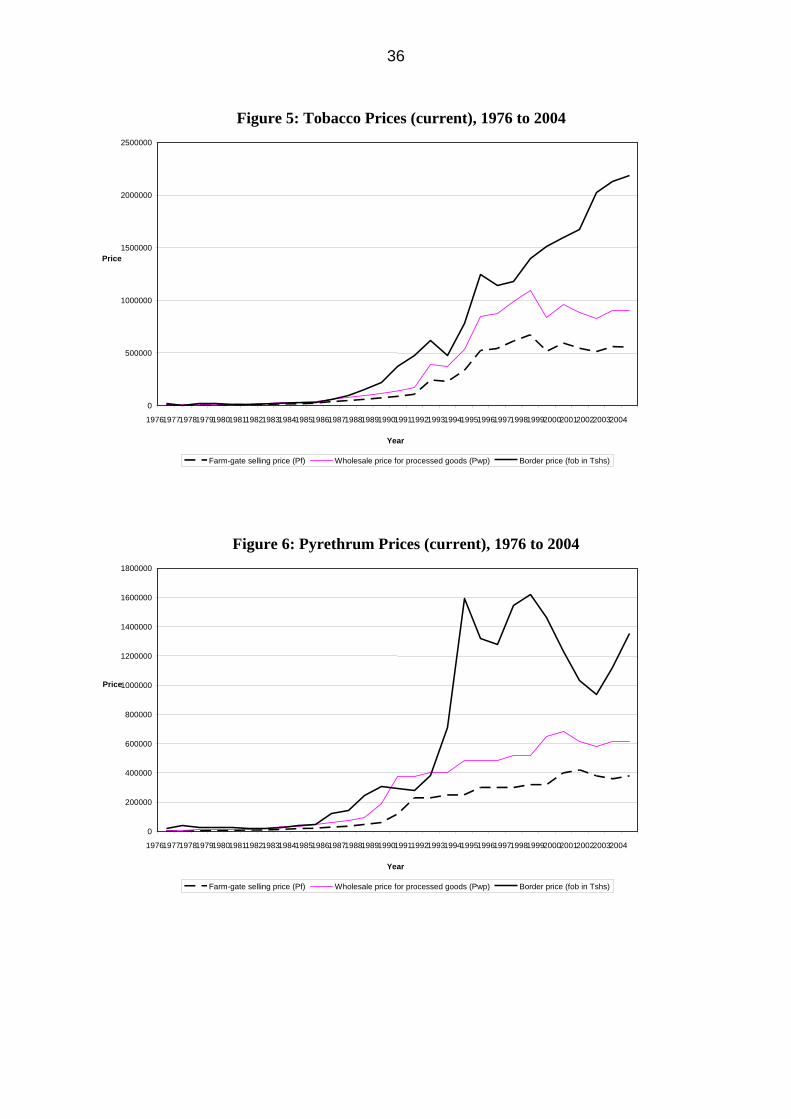
36
Figure 5: Tobacco Prices (current), 1976 to 2004
0
500000
1000000
1500000
2000000
2500000
1976 1977 1978 1979 1980 1981 1982 1983 1984 1985 198619871988198919901991199219931994199519961997199819992000 2001 2002 2003 2004 Year
Price
Farm-gate selling price (Pf) Wholesale price for processed goods (Pwp) Border price (fob in Tshs)
Figure 6: Pyrethrum Prices (current), 1976 to 2004
0
200000
400000
600000
800000
1000000
1200000
1400000
1600000
1800000
1976 1977 1978 1979 1980 1981 1982 1983 1984 1985 198619871988198919901991199219931994199519961997199819992000 2001 2002 2003 2004 Year
Price
Farm-gate selling price (Pf) Wholesale price for processed goods (Pwp) Border price (fob in Tshs)
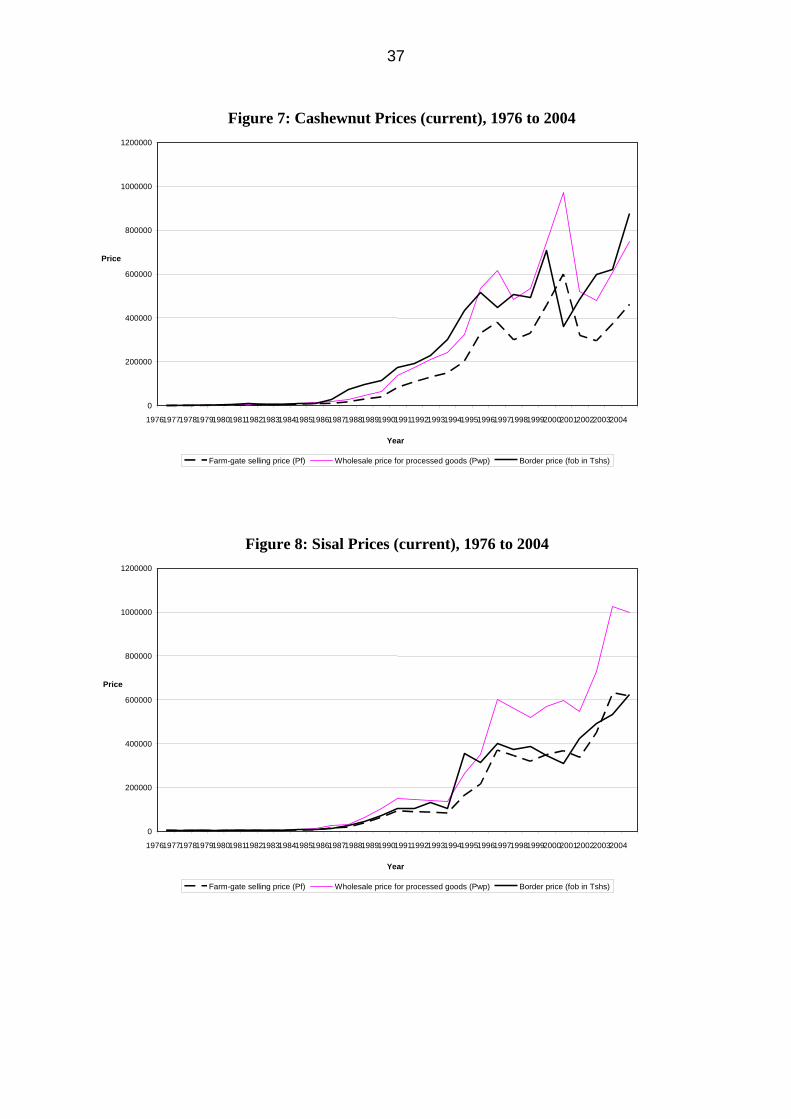
37
Figure 7: Cashewnut Prices (current), 1976 to 2004
0
200000
400000
600000
800000
1000000
1200000
1976 1977 1978 1979 1980 1981 1982 1983 1984 1985 198619871988198919901991199219931994199519961997199819992000 2001 2002 2003 2004 Year
Price
Farm-gate selling price (Pf) Wholesale price for processed goods (Pwp) Border price (fob in Tshs)
Figure 8: Sisal Prices (current), 1976 to 2004
0
200000
400000
600000
800000
1000000
1200000
1976 1977 1978 1979 1980 1981 1982 1983 1984 1985 198619871988198919901991199219931994199519961997199819992000 2001 2002 2003 2004 Year
Price
Farm-gate selling price (Pf) Wholesale price for processed goods (Pwp) Border price (fob in Tshs)
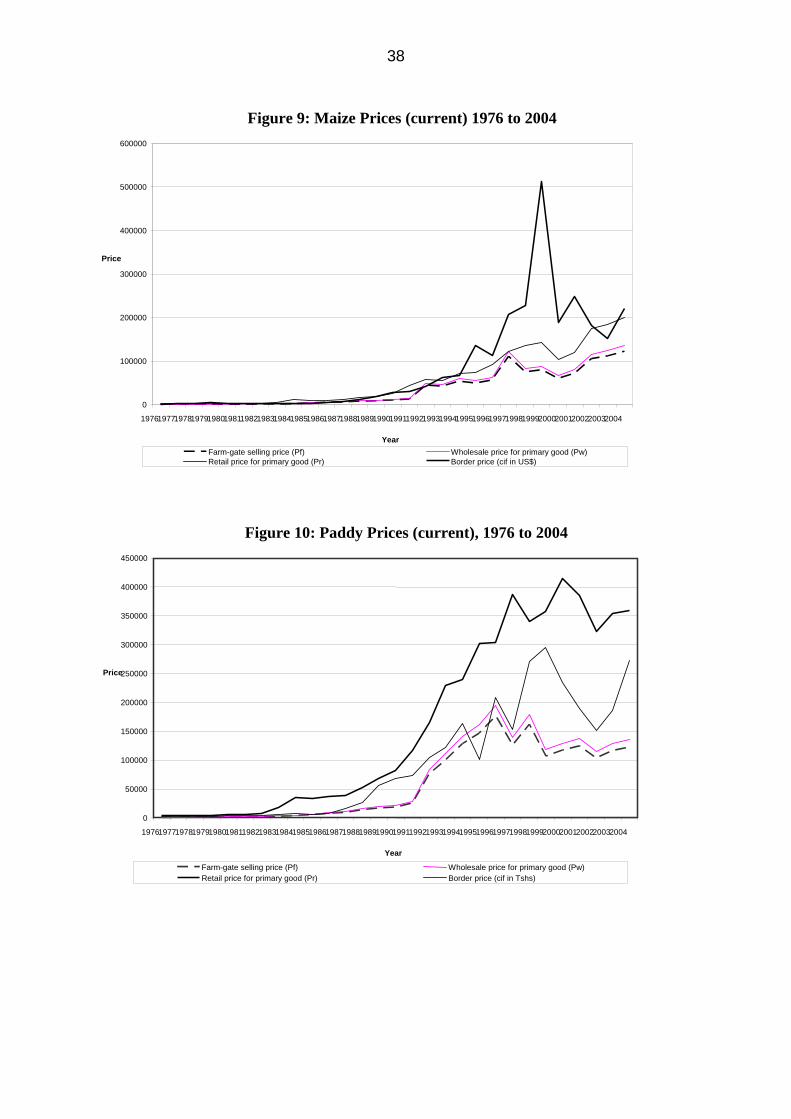
38
Figure 9: Maize Prices (current) 1976 to 2004
0
100000
200000
300000
400000
500000
600000
1976 1977 1978 1979 1980 19811982 1983 1984 1985 1986 198719881989199019911992199319941995199619971998199920002001 2002 2003 2004 Year
Price
Farm-gate selling price (Pf) Wholesale price for primary good (Pw) Retail price for primary good (Pr) Border price (cif in US$)
Figure 10: Paddy Prices (current), 1976 to 2004
0
50000
100000
150000
200000
250000
300000
350000
400000
450000
1976 1977 1978 1979 1980 19811982 1983 1984 1985 1986 19871988198919901991199219931994199519961997199819992000 2001 2002 2003 2004 Year
Price
Farm-gate selling price (Pf) Wholesale price for primary good (Pw) Retail price for primary good (Pr) Border price (cif in Tshs)

39
Figure 11: Wheat Prices (current), 1976 to 2004
0
50000
100000
150000
200000
250000
300000
350000
400000
450000
1976 1977 1978 1979 1980 19811982 1983 1984 1985 1986 19871988198919901991199219931994199519961997199819992000 2001 2002 2003 2004 Year
Price
Farm-gate selling price (Pf) Wholesale price for primary good (Pw) Retail price for primary good (Pr) Border price (cif in Tshs)
Figure 12: Sugar Prices (current), 1976 to 2004
0
100000
200000
300000
400000
500000
600000
700000
800000
1976 1977 1978 1979 1980 19811982 1983 1984 1985 1986 19871988198919901991199219931994199519961997199819992000 2001 2002 2003 2004 Year
Price
Farm-gate selling price (Pf) Wholesale price for primary good (Pw) Retail price for primary good (Pr) Border price (cif in Tshs)
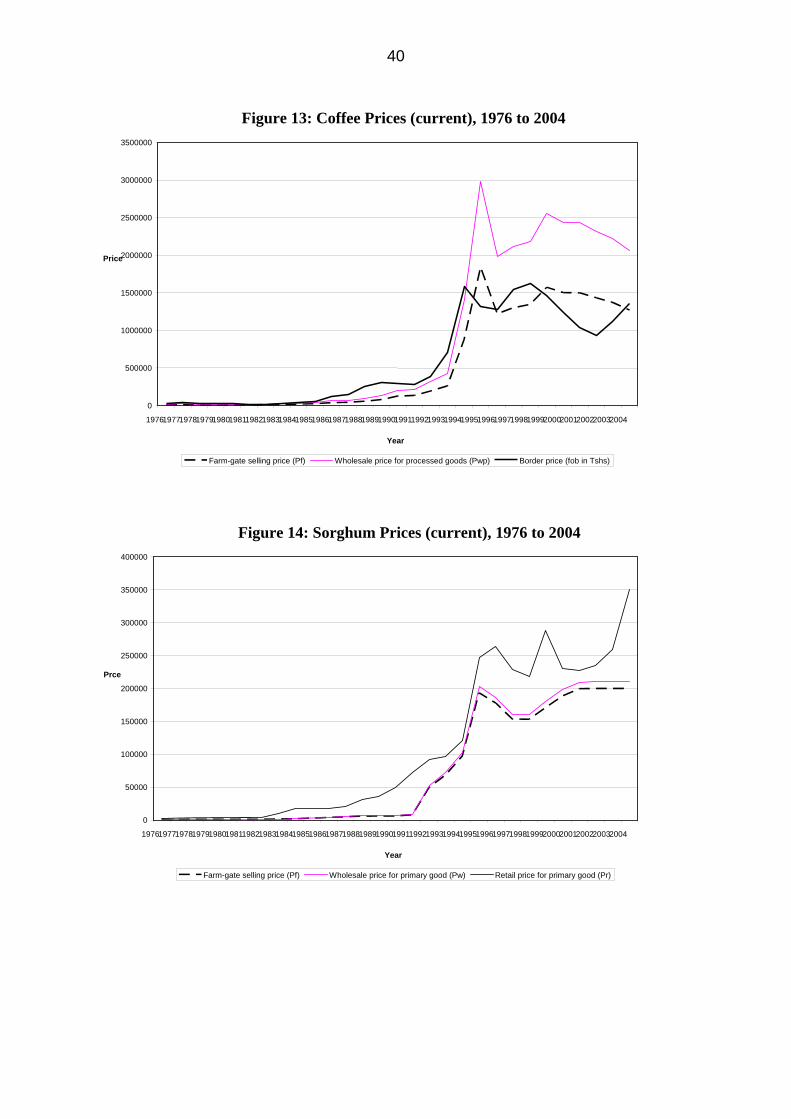
40
Figure 13: Coffee Prices (current), 1976 to 2004
0
500000
1000000
1500000
2000000
2500000
3000000
3500000
1976 1977 1978 1979 1980 1981 1982 1983 1984 1985 198619871988198919901991199219931994199519961997199819992000 2001 2002 2003 2004 Year
Price
Farm-gate selling price (Pf) Wholesale price for processed goods (Pwp) Border price (fob in Tshs)
Figure 14: Sorghum Prices (current), 1976 to 2004
0
50000
100000
150000
200000
250000
300000
350000
400000
1976 1977 1978 1979 1980 19811982 1983 1984 1985 1986 19871988198919901991199219931994199519961997199819992000 2001 2002 2003 2004 Year
Prce
Farm-gate selling price (Pf) Wholesale price for primary good (Pw) Retail price for primary good (Pr)
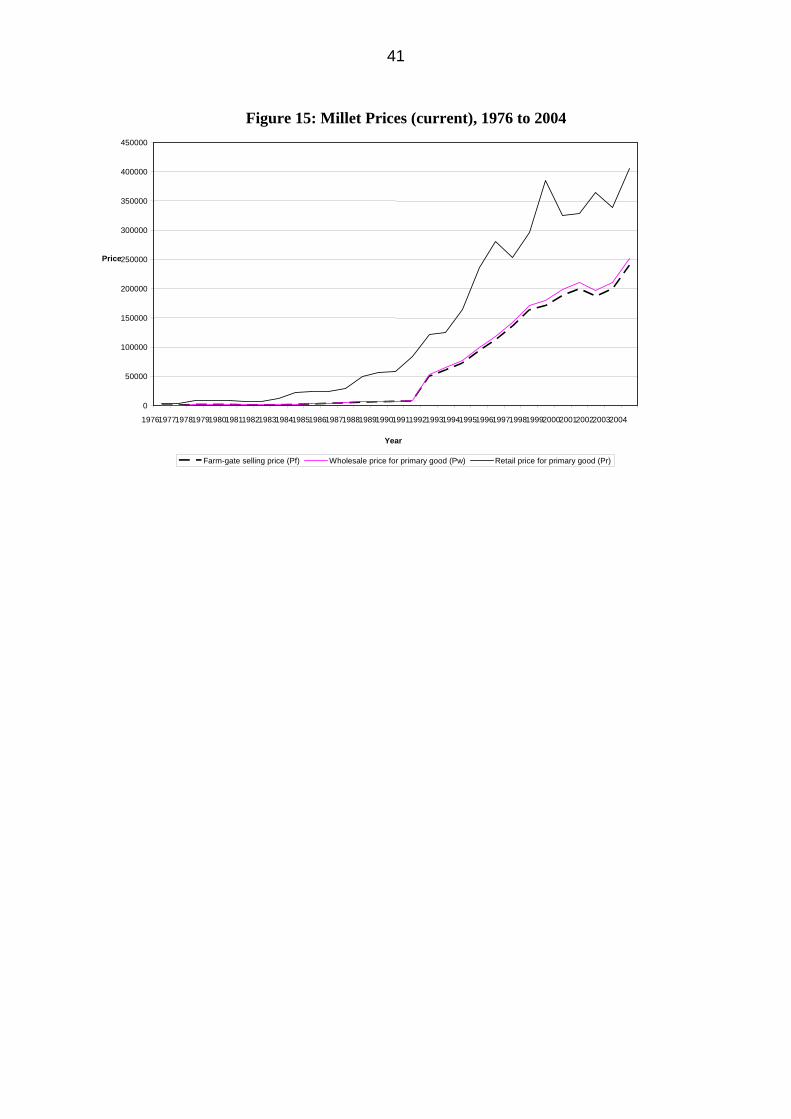
41
Figure 15: Millet Prices (current), 1976 to 2004
0
50000
100000
150000
200000
250000
300000
350000
400000
450000
1976 1977 1978 1979 1980 19811982 1983 1984 1985 1986 19871988198919901991199219931994199519961997199819992000 2001 2002 2003 2004 Year
Price
Farm-gate selling price (Pf) Wholesale price for primary good (Pw) Retail price for primary good (Pr)
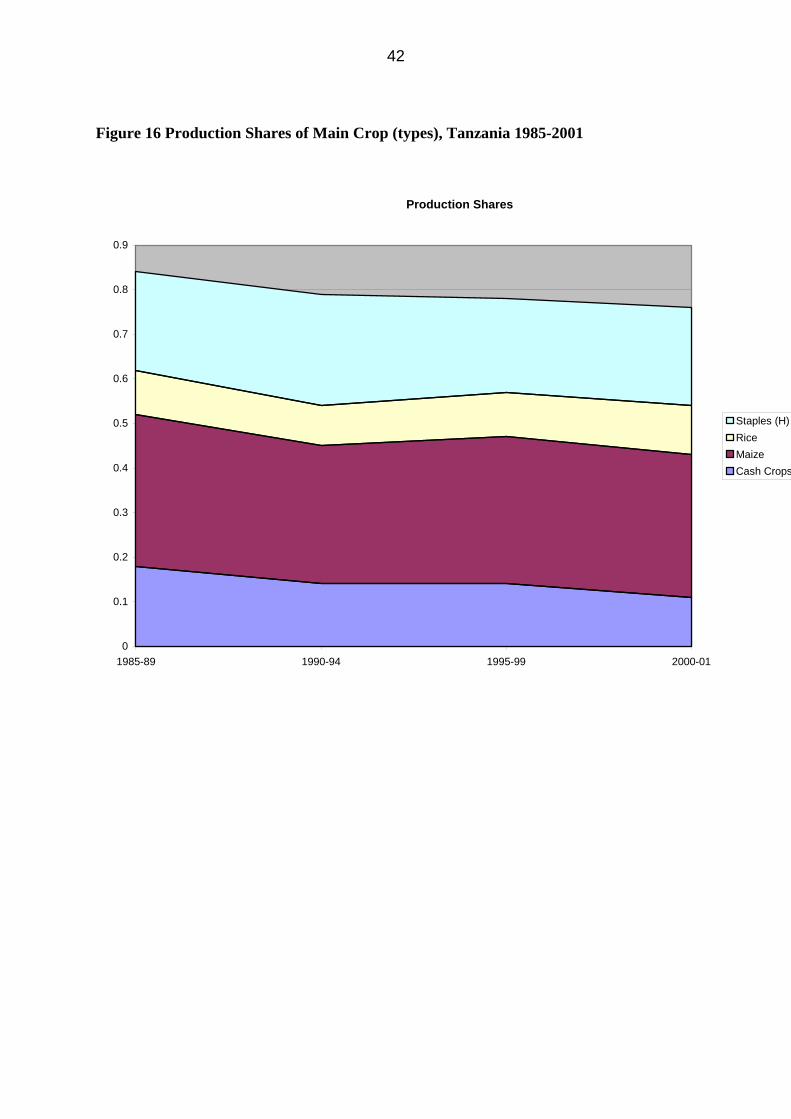
42
Figure 16 Production Shares of Main Crop (types), Tanzania 1985-2001
Production Shares
0
0.1
0.2
0.3
0.4
0.5
0.6
0.7
0.8
0.9
1985-89 1990-94 1995-99 2000-01
Staples (H)RiceMaizeCash Crops
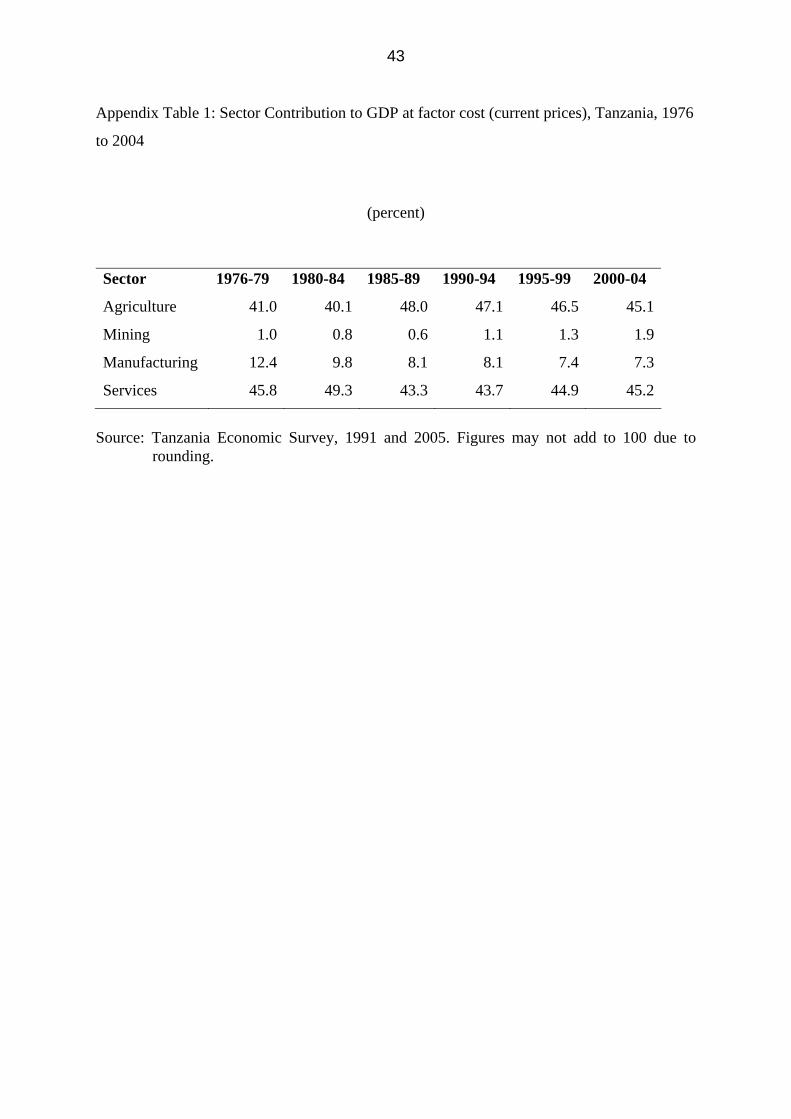
43
Appendix Table 1: Sector Contribution to GDP at factor cost (current prices), Tanzania, 1976
to 2004
(percent)
Sector 1976-79 1980-84 1985-89 1990-94 1995-99 2000-04
Agriculture 41.0 40.1 48.0 47.1 46.5 45.1
Mining 1.0 0.8 0.6 1.1 1.3 1.9
Manufacturing 12.4 9.8 8.1 8.1 7.4 7.3
Services 45.8 49.3 43.3 43.7 44.9 45.2
Source: Tanzania Economic Survey, 1991 and 2005. Figures may not add to 100 due to
rounding.
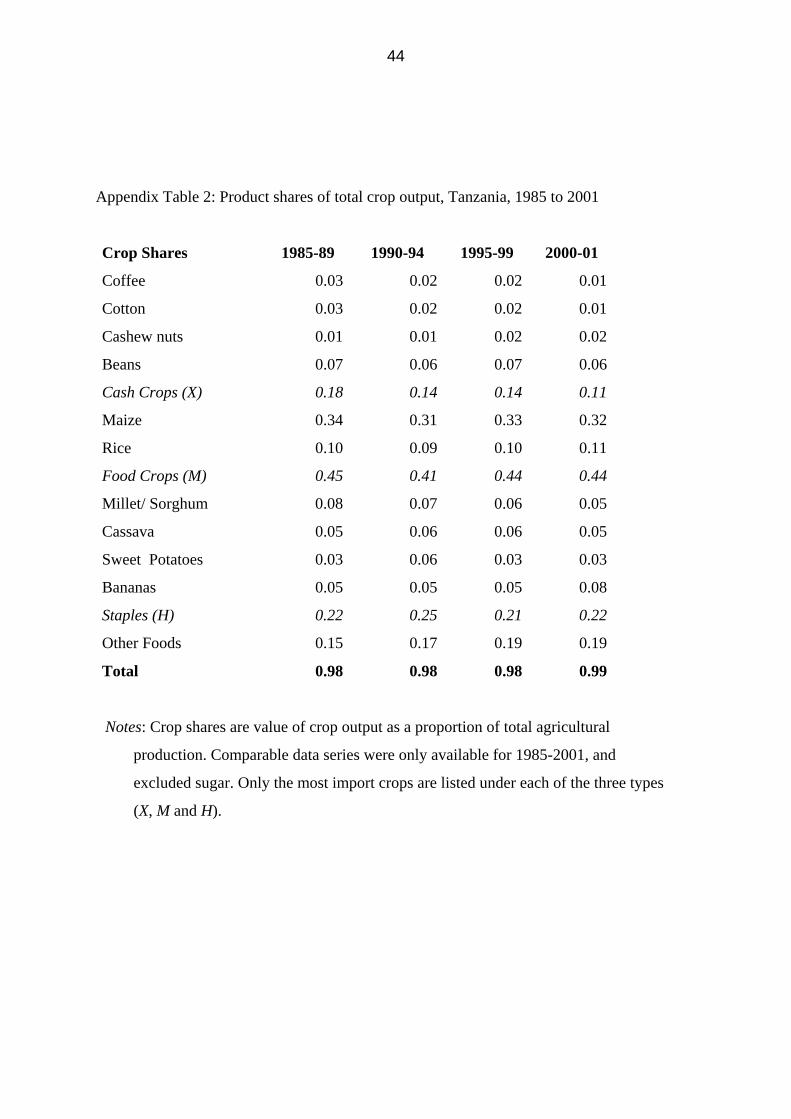
44
Appendix Table 2: Product shares of total crop output, Tanzania, 1985 to 2001
Crop Shares 1985-89 1990-94 1995-99 2000-01
Coffee 0.03 0.02 0.02 0.01
Cotton 0.03 0.02 0.02 0.01
Cashew nuts 0.01 0.01 0.02 0.02
Beans 0.07 0.06 0.07 0.06
Cash Crops (X) 0.18 0.14 0.14 0.11
Maize 0.34 0.31 0.33 0.32
Rice 0.10 0.09 0.10 0.11
Food Crops (M) 0.45 0.41 0.44 0.44
Millet/ Sorghum 0.08 0.07 0.06 0.05
Cassava 0.05 0.06 0.06 0.05
Sweet Potatoes 0.03 0.06 0.03 0.03
Bananas 0.05 0.05 0.05 0.08
Staples (H) 0.22 0.25 0.21 0.22
Other Foods 0.15 0.17 0.19 0.19
Total 0.98 0.98 0.98 0.99
Notes: Crop shares are value of crop output as a proportion of total agricultural
production. Comparable data series were only available for 1985-2001, and
excluded sugar. Only the most import crops are listed under each of the three types
(X, M and H).

45
Appendix Table 3: Prices and NRAs for food importables, Tanzania, 1976 to 2004 (using the estimated equilibrium exchange rate)
Maize Rice Wheat
DP BP (BP-DP) DP BP (BP-DP) DP BP (BP-DP) /BP /BP /BP
1976 800 1743 -0.541 1000 4966 -0.799 1000 2670 -0.6251977 800 2820 -0.716 1000 3705 -0.730 1200 1584 -0.2421978 850 3424 -0.752 1200 3635 -0.670 1250 1668 -0.2511979 850 6386 -0.867 1200 3696 -0.675 1250 2378 -0.4741980 1000 3683 -0.728 1500 8057 -0.814 1300 4094 -0.6821981 1000 3720 -0.731 1750 8399 -0.792 1650 4099 -0.5971982 1500 3667 -0.591 2300 7294 -0.685 2200 3651 -0.3971983 1750 5877 -0.702 3000 14063 -0.787 2500 5896 -0.5761984 2200 7640 -0.712 4000 18019 -0.778 3000 6484 -0.5371985 4000 3681 0.087 6000 14215 -0.578 4500 5926 -0.2411986 5250 9406 -0.442 8000 18064 -0.557 6000 10054 -0.4031987 6300 10857 -0.420 9600 28298 -0.661 7200 13833 -0.4801988 8200 16995 -0.518 14400 39445 -0.635 9000 29406 -0.6941989 9000 21077 -0.573 17300 66557 -0.740 10350 33724 -0.6931990 11000 34220 -0.679 19000 86025 -0.779 13000 48747 -0.7331991 13000 39540 -0.671 26000 94610 -0.725 32000 51089 -0.3741992 44860 49574 -0.095 76130 123134 -0.382 62000 63326 -0.0211993 42500 64091 -0.337 100830 127316 -0.208 126330 64693 0.9531994 54150 69355 -0.219 128620 167974 -0.234 125330 63740 0.9661995 49690 139256 -0.643 146851 104049 0.411 149330 131636 0.1341996 56740 115728 -0.510 176758 212683 -0.169 183000 165080 0.1091997 111140 214038 -0.481 126330 158813 -0.205 200000 82847 1.4141998 75325 240715 -0.687 162330 285170 -0.431 223330 165011 0.3531999 80264 539194 -0.851 107000 309400 -0.654 242216 269688 -0.1022000 60347 194218 -0.689 117700 241042 -0.512 266438 155120 0.7182001 72343 247958 -0.708 124762 188730 -0.339 282424 154421 0.8292002 105761 182311 -0.420 103850 150500 -0.310 230000 144741 0.5892003 112188 152612 -0.265 116884 186544 -0.373 200000 161694 0.2372004 122627 219958 -0.443 122915 272177 -0.548 250000 215313 0.161
Note: Domestic price (DP) is farm-gate (primary) in LC/MT; border price (BP) is cif import
price ($/MT) converted to LC using equilibrium exchange rate. Source: Authors’ spreadsheet using methodology from Anderson et al. (2006)

46
Appendix Table 4: Prices and NRAs for food importables, Tanzania, 1976 to 2004 (using retail price and official exchange rate)
Maize Rice Wheat
RP MP (BP-RP) RP MP (BP-RP) RP MP (BP-RP) /BP /BP /BP
1976 1704 1010 0.687 3715 2877 0.291 4523 1547 1.9241977 1705 1951 -0.126 3715 2564 0.449 5427 1096 3.9521978 1811 2649 -0.316 4458 2811 0.586 5653 1290 3.3821979 1811 4833 -0.625 4458 2798 0.593 5653 1800 2.1411980 2131 1738 0.226 5573 3801 0.466 5879 1931 2.0451981 2131 1895 0.125 6502 4278 0.520 7462 2088 2.5741982 3196 1813 0.763 8545 3605 1.370 9950 1805 4.5121983 5500 2345 1.345 17200 5611 2.065 12700 2352 4.4001984 11700 3141 2.725 35500 7407 3.793 28400 2666 9.6531985 9400 1532 5.136 34200 5915 4.78 34200 2466 12.8691986 9800 4199 1.334 36800 8064 3.563 42400 4488 8.4471987 11500 6407 0.795 39400 16700 1.359 48800 8163 4.9781988 16433 11330 0.450 52150 26297 0.983 66100 19604 2.3721989 19167 17922 0.069 68112 56594 0.204 93000 28675 2.2431990 24875 27386 -0.092 82081 68843 0.192 131400 39011 2.3681991 44284 30531 0.450 116900 73052 0.600 160200 39448 3.0611992 58553 41950 0.396 165700 104198 0.590 190300 53587 2.5511993 55914 61205 -0.087 228500 121582 0.879 216100 61780 2.4981994 70690 67335 0.050 239500 163082 0.469 231300 61884 2.7381995 74444 135860 -0.452 302600 101511 1.981 340900 128426 1.6541996 91562 113316 -0.192 304200 208250 0.461 366100 161639 1.2651997 122950 206489 -0.405 387600 153213 1.530 368900 79925 3.6161998 136780 228045 -0.400 339800 270161 0.258 385100 156326 1.4631999 142000 513518 -0.723 357400 294666 0.213 361300 256845 0.4072000 102490 189481 -0.459 414500 235162 0.763 346000 151336 1.2862001 120770 247958 -0.513 385800 188730 1.044 346000 154421 1.2412002 175400 182311 -0.038 322300 150500 1.142 333100 144741 1.3012003 185000 152612 0.212 354200 186544 0.899 341200 161694 1.1102004 200000 219958 -0.091 360000 272177 0.323 360700 215313 0.675
Note: Domestic Retail price (RP) in LC/MT; import price (MP) is cif import price ($/MT)
converted to LC using official exchange rate. (RP-MP)/MP captures the retail level effect.
Source: Authors’ spreadsheet using methodology from Anderson et al. (2006)
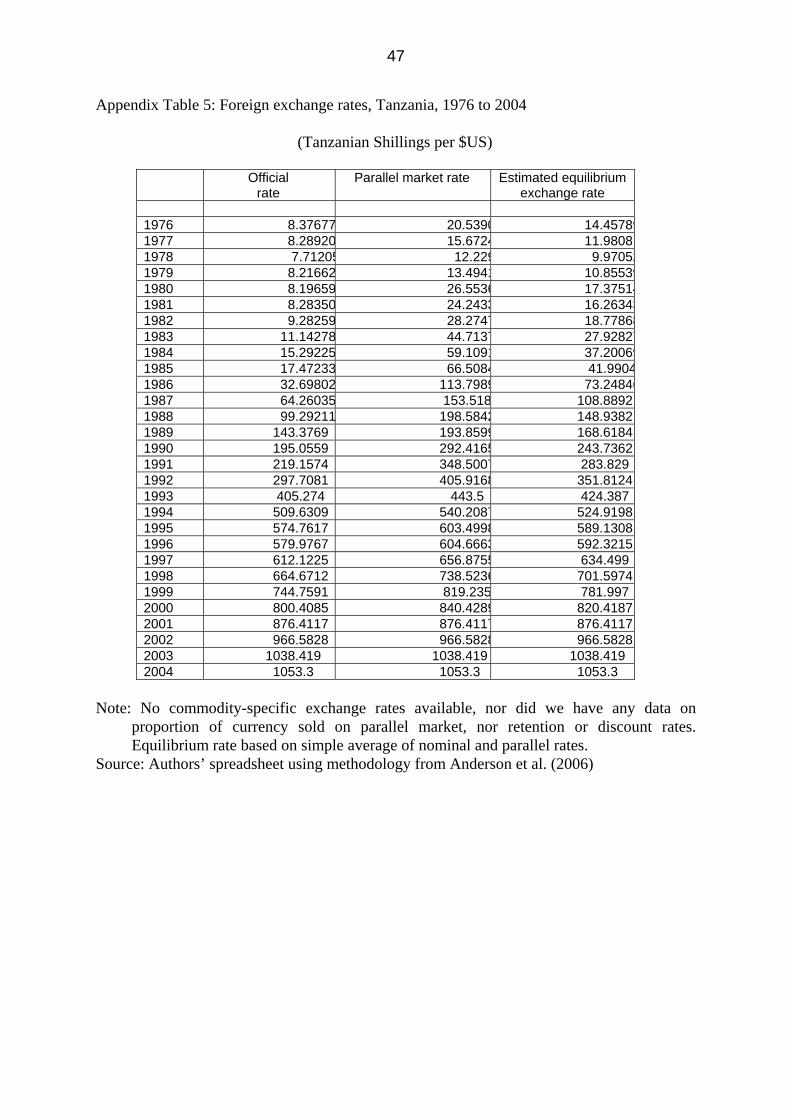
47
Appendix Table 5: Foreign exchange rates, Tanzania, 1976 to 2004
(Tanzanian Shillings per $US)
Official rate
Parallel market rate Estimated equilibrium exchange rate
1976 8.37677 20.5390 14.457891977 8.28920 15.6724 11.98081978 7.71205 12.229 9.970521979 8.21662 13.4941 10.855391980 8.19659 26.5536 17.375141981 8.28350 24.2433 16.263431982 9.28259 28.2747 18.778681983 11.14278 44.7137 27.928271984 15.29225 59.1091 37.200691985 17.47233 66.5084 41.99041986 32.69802 113.7989 73.248461987 64.26035 153.518 108.8892 1988 99.29211 198.5842 148.9382 1989 143.3769 193.8599 168.6184 1990 195.0559 292.4165 243.7362 1991 219.1574 348.5007 283.829 1992 297.7081 405.9168 351.8124 1993 405.274 443.5 424.387 1994 509.6309 540.2087 524.9198 1995 574.7617 603.4998 589.1308 1996 579.9767 604.6663 592.3215 1997 612.1225 656.8755 634.499 1998 664.6712 738.5236 701.5974 1999 744.7591 819.235 781.997 2000 800.4085 840.4289 820.4187 2001 876.4117 876.4117 876.4117 2002 966.5828 966.5828 966.5828 2003 1038.419 1038.419 1038.419 2004 1053.3 1053.3 1053.3
Note: No commodity-specific exchange rates available, nor did we have any data on proportion of currency sold on parallel market, nor retention or discount rates. Equilibrium rate based on simple average of nominal and parallel rates.
Source: Authors’ spreadsheet using methodology from Anderson et al. (2006)

48
Appendix Table 6: Estimates of margins in the food value chain, Tanzania
(percent of price)
External Trade Marketing Margin
Sector Early90s Late90s 2000s
Early90
s Late90s 2000s
Cash Crops (X) 35 33.4 24.5 25 10 10
Coffee 50 6 10
Cotton 30 10 10
Cashews 5
Food Crops (M): grains 25 20.6 15.5 10-20
Other food crops 20-30
Manufactured foods 20 17.2 18.5
Staple foods (H) na na na <5 <5 <5
Notes: Figures for ‘External Trade’ are estimates of international trading costs expressed as a percentage of
the export or import price. Figures for ‘Marketing Margin’ are estimates of supply chain margins as a share of producer price (these correspond to the sum of mark-ups on farm gate price and retail markup in the spreadsheet template is it was not possible to distinguish wholesale and retail margins). The margin in the ‘cash crop’ row is the figure used if no product-specific estimates are available; similarly for food crops and manufactured foods rows. The margin range given for food crops in 2000s is the regional-DSM spread.
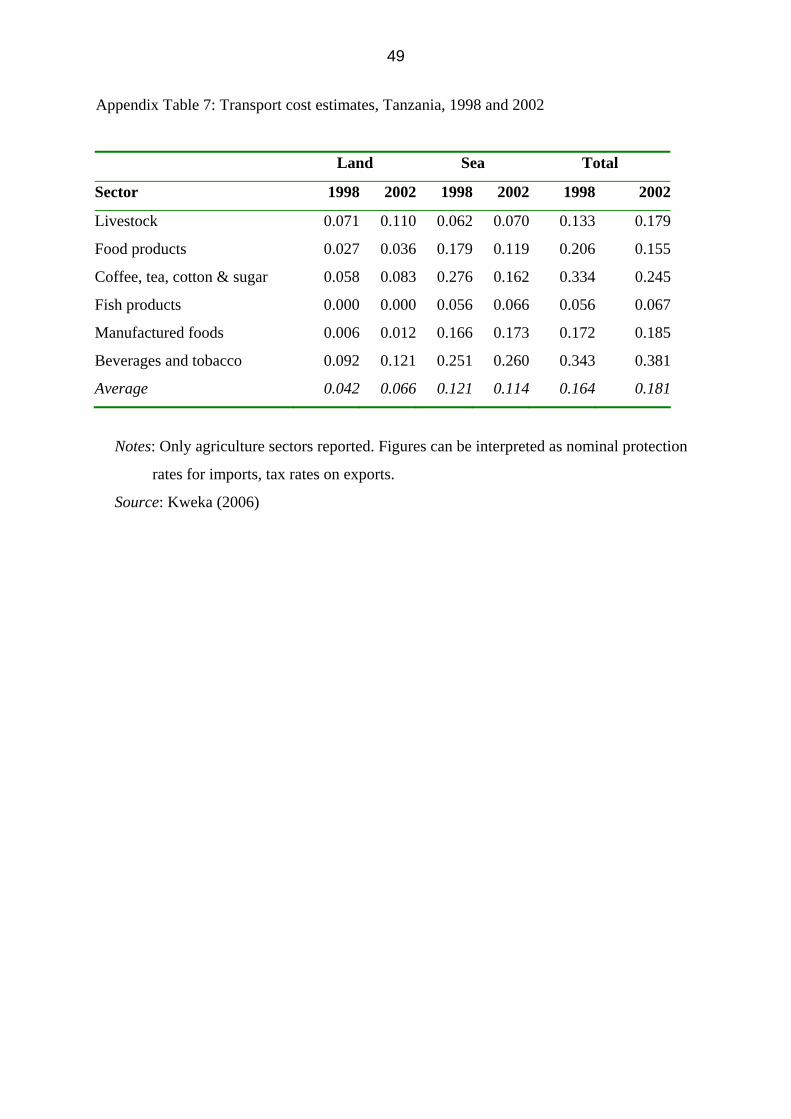
49
Appendix Table 7: Transport cost estimates, Tanzania, 1998 and 2002
Land Sea Total
Sector 1998 2002 1998 2002 1998 2002
Livestock 0.071 0.110 0.062 0.070 0.133 0.179
Food products 0.027 0.036 0.179 0.119 0.206 0.155
Coffee, tea, cotton & sugar 0.058 0.083 0.276 0.162 0.334 0.245
Fish products 0.000 0.000 0.056 0.066 0.056 0.067
Manufactured foods 0.006 0.012 0.166 0.173 0.172 0.185
Beverages and tobacco 0.092 0.121 0.251 0.260 0.343 0.381
Average 0.042 0.066 0.121 0.114 0.164 0.181
Notes: Only agriculture sectors reported. Figures can be interpreted as nominal protection
rates for imports, tax rates on exports.
Source: Kweka (2006)
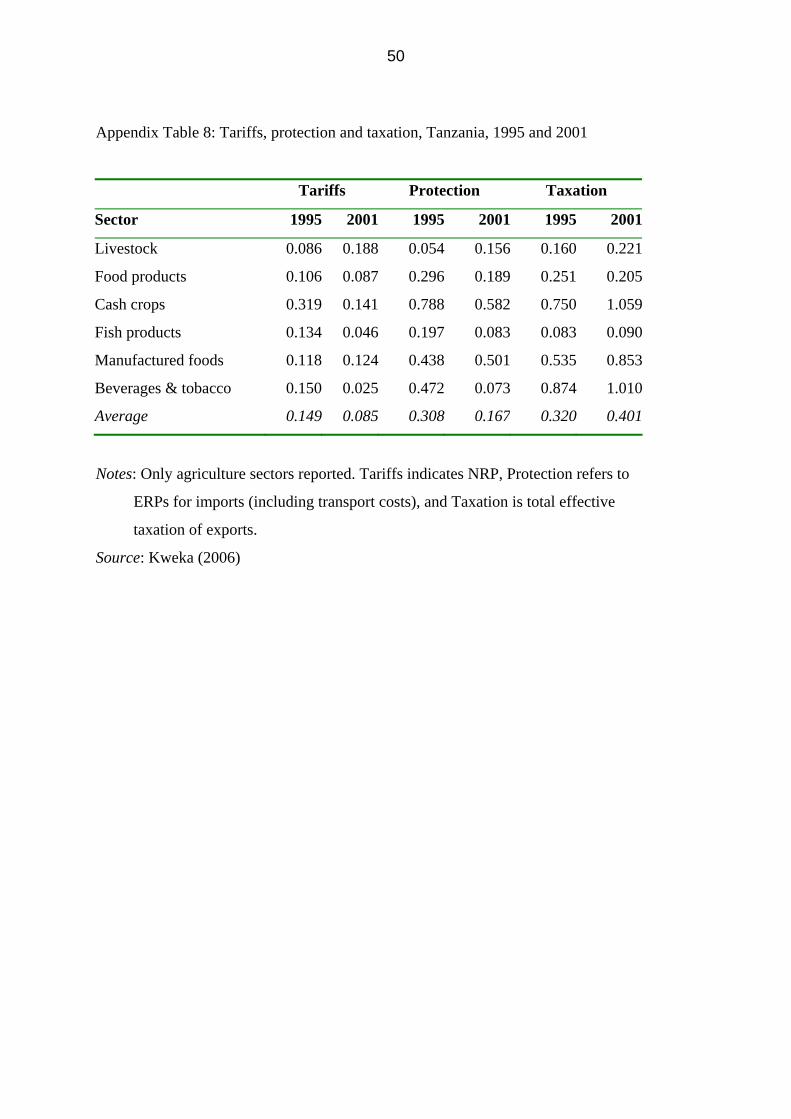
50
Appendix Table 8: Tariffs, protection and taxation, Tanzania, 1995 and 2001
Tariffs Protection Taxation
Sector 1995 2001 1995 2001 1995 2001
Livestock 0.086 0.188 0.054 0.156 0.160 0.221
Food products 0.106 0.087 0.296 0.189 0.251 0.205
Cash crops 0.319 0.141 0.788 0.582 0.750 1.059
Fish products 0.134 0.046 0.197 0.083 0.083 0.090
Manufactured foods 0.118 0.124 0.438 0.501 0.535 0.853
Beverages & tobacco 0.150 0.025 0.472 0.073 0.874 1.010
Average 0.149 0.085 0.308 0.167 0.320 0.401
Notes: Only agriculture sectors reported. Tariffs indicates NRP, Protection refers to
ERPs for imports (including transport costs), and Taxation is total effective
taxation of exports.
Source: Kweka (2006)
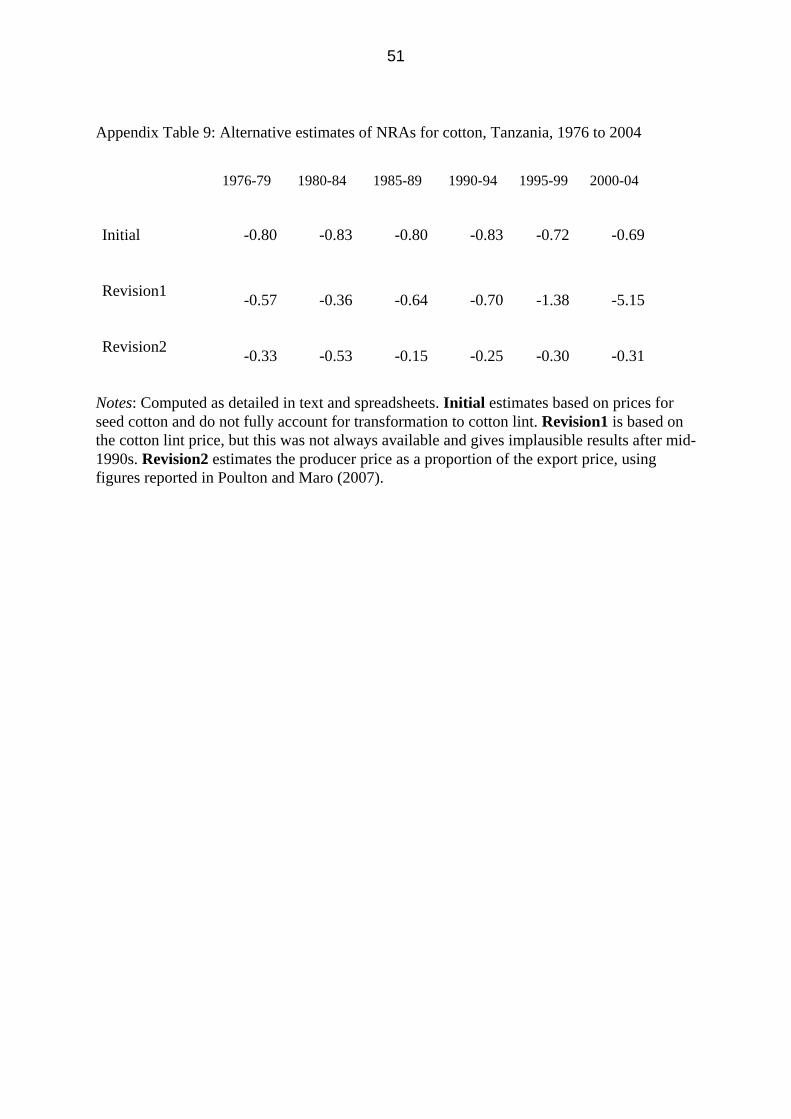
51
Appendix Table 9: Alternative estimates of NRAs for cotton, Tanzania, 1976 to 2004
1976-79 1980-84 1985-89 1990-94 1995-99 2000-04
Initial -0.80 -0.83 -0.80 -0.83 -0.72 -0.69
Revision1 -0.57 -0.36 -0.64 -0.70 -1.38 -5.15
Revision2 -0.33 -0.53 -0.15 -0.25 -0.30 -0.31
Notes: Computed as detailed in text and spreadsheets. Initial estimates based on prices for seed cotton and do not fully account for transformation to cotton lint. Revision1 is based on the cotton lint price, but this was not always available and gives implausible results after mid-1990s. Revision2 estimates the producer price as a proportion of the export price, using figures reported in Poulton and Maro (2007).
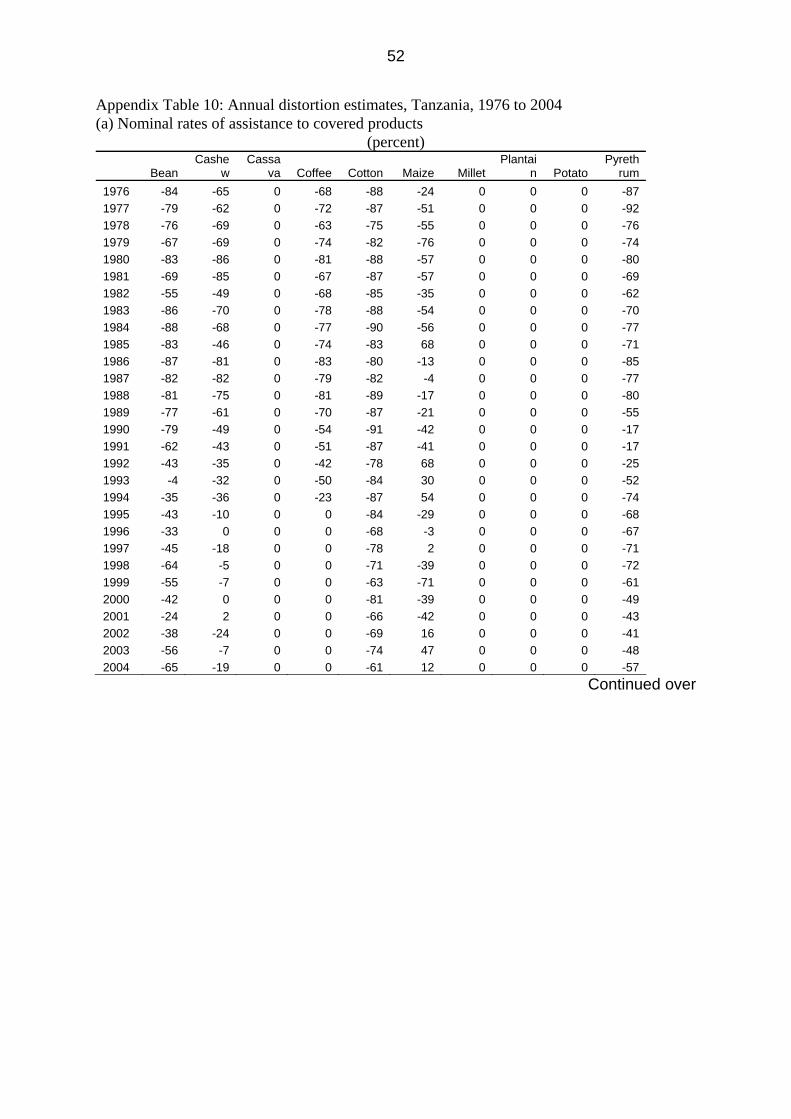
52
Appendix Table 10: Annual distortion estimates, Tanzania, 1976 to 2004 (a) Nominal rates of assistance to covered products
(percent)
Bean Cashe
w Cassa
va Coffee Cotton Maize Millet Plantai
n Potato Pyreth
rum 1976 -84 -65 0 -68 -88 -24 0 0 0 -87 1977 -79 -62 0 -72 -87 -51 0 0 0 -92 1978 -76 -69 0 -63 -75 -55 0 0 0 -76 1979 -67 -69 0 -74 -82 -76 0 0 0 -74 1980 -83 -86 0 -81 -88 -57 0 0 0 -80 1981 -69 -85 0 -67 -87 -57 0 0 0 -69 1982 -55 -49 0 -68 -85 -35 0 0 0 -62 1983 -86 -70 0 -78 -88 -54 0 0 0 -70 1984 -88 -68 0 -77 -90 -56 0 0 0 -77 1985 -83 -46 0 -74 -83 68 0 0 0 -71 1986 -87 -81 0 -83 -80 -13 0 0 0 -85 1987 -82 -82 0 -79 -82 -4 0 0 0 -77 1988 -81 -75 0 -81 -89 -17 0 0 0 -80 1989 -77 -61 0 -70 -87 -21 0 0 0 -55 1990 -79 -49 0 -54 -91 -42 0 0 0 -17 1991 -62 -43 0 -51 -87 -41 0 0 0 -17 1992 -43 -35 0 -42 -78 68 0 0 0 -25 1993 -4 -32 0 -50 -84 30 0 0 0 -52 1994 -35 -36 0 -23 -87 54 0 0 0 -74 1995 -43 -10 0 0 -84 -29 0 0 0 -68 1996 -33 0 0 0 -68 -3 0 0 0 -67 1997 -45 -18 0 0 -78 2 0 0 0 -71 1998 -64 -5 0 0 -71 -39 0 0 0 -72 1999 -55 -7 0 0 -63 -71 0 0 0 -61 2000 -42 0 0 0 -81 -39 0 0 0 -49 2001 -24 2 0 0 -66 -42 0 0 0 -43 2002 -38 -24 0 0 -69 16 0 0 0 -41 2003 -56 -7 0 0 -74 47 0 0 0 -48 2004 -65 -19 0 0 -61 12 0 0 0 -57
Continued over

53
Appendix Table 10(a) (cont)
Rice Sisal Sorghu
m Sugar Tea Tobacc
o Wheat Yam All
covered 1976 -67 n.a. 0 -40 -95 -70 -60 0 -52 1977 -53 n.a. 0 9 -95 n.a. -15 0 -54 1978 -41 n.a. 0 2 -86 -60 -12 0 -44 1979 -42 -39 0 -6 -86 -63 -39 0 -51 1980 -71 -37 0 -74 -94 -62 -67 0 -60 1981 -67 -20 0 -77 -92 -59 -58 0 -59 1982 -50 -31 0 -55 -94 -66 -37 0 -50 1983 -67 -55 0 -47 -94 -69 -58 0 -67 1984 -66 -60 0 -36 -96 -74 -54 0 -66 1985 -35 -49 0 39 -92 -64 -24 0 -41 1986 -31 -27 0 -22 -95 -67 -39 0 -58 1987 -44 -49 0 -6 -93 -64 -44 0 -53 1988 -37 -25 0 -42 -94 -68 -66 0 -56 1989 -52 5 0 -43 -93 -62 -63 0 -51 1990 -60 -4 0 -29 -94 -75 -68 0 -57 1991 -51 -12 0 13 -90 -77 -27 0 -49 1992 15 -23 0 26 -87 -55 18 0 -22 1993 55 9 0 73 -88 -34 148 0 -9 1994 51 -36 0 31 -89 -41 152 0 -12 1995 n.a. -3 0 9 -88 -41 46 0 -30 1996 65 0 0 66 -91 -33 43 0 -18 1997 56 0 0 100 -92 -28 208 0 -19 1998 11 0 0 3 -94 -32 71 0 -36 1999 -32 0 0 21 -89 -51 14 0 -43 2000 -4 0 0 72 -93 -45 121 0 -23 2001 32 0 0 96 -91 -50 138 0 -18 2002 38 0 0 96 -90 -61 107 0 -11 2003 25 0 0 137 -90 -59 61 0 -8 2004 -10 0 0 115 -91 -61 51 0 -23
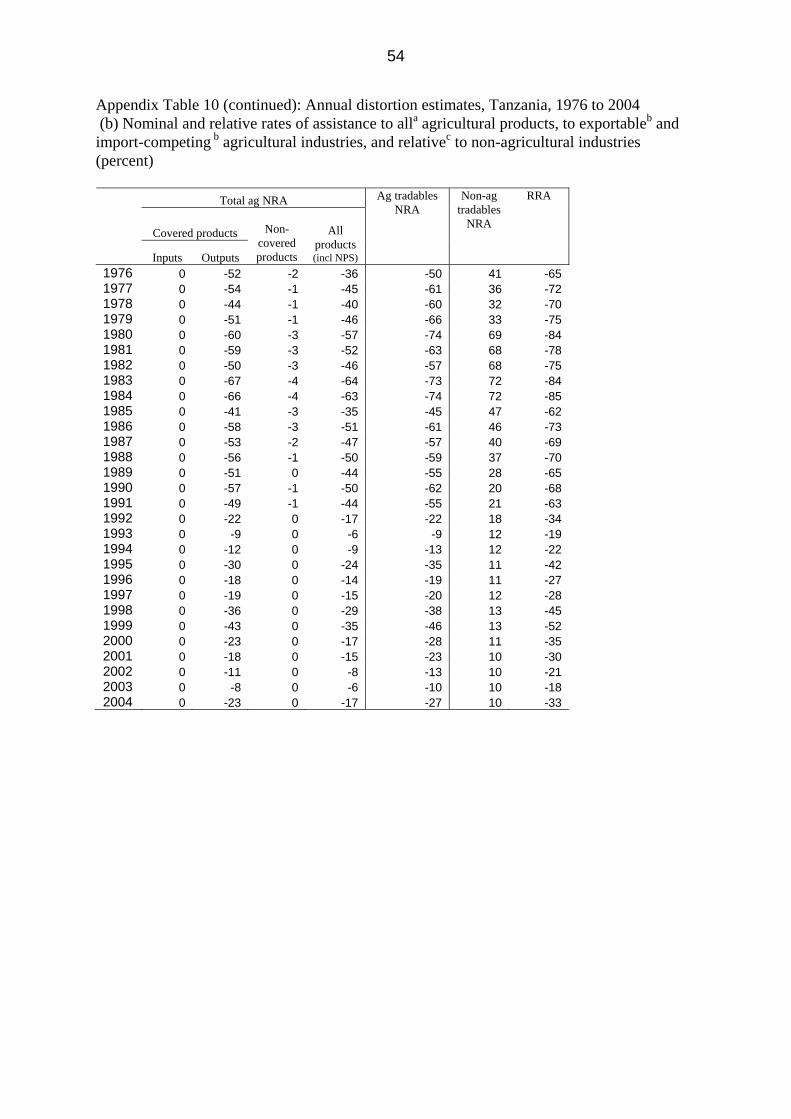
54
Appendix Table 10 (continued): Annual distortion estimates, Tanzania, 1976 to 2004 (b) Nominal and relative rates of assistance to alla agricultural products, to exportableb and import-competing b agricultural industries, and relativec to non-agricultural industries (percent)
Total ag NRA
Covered products
Inputs Outputs
Non-covered products
All products (incl NPS)
Ag tradables NRA
Non-ag tradables
NRA
RRA
1976 0 -52 -2 -36 -50 41 -65 1977 0 -54 -1 -45 -61 36 -72 1978 0 -44 -1 -40 -60 32 -70 1979 0 -51 -1 -46 -66 33 -75 1980 0 -60 -3 -57 -74 69 -84 1981 0 -59 -3 -52 -63 68 -78 1982 0 -50 -3 -46 -57 68 -75 1983 0 -67 -4 -64 -73 72 -84 1984 0 -66 -4 -63 -74 72 -85 1985 0 -41 -3 -35 -45 47 -62 1986 0 -58 -3 -51 -61 46 -73 1987 0 -53 -2 -47 -57 40 -69 1988 0 -56 -1 -50 -59 37 -70 1989 0 -51 0 -44 -55 28 -65 1990 0 -57 -1 -50 -62 20 -68 1991 0 -49 -1 -44 -55 21 -63 1992 0 -22 0 -17 -22 18 -34 1993 0 -9 0 -6 -9 12 -19 1994 0 -12 0 -9 -13 12 -22 1995 0 -30 0 -24 -35 11 -42 1996 0 -18 0 -14 -19 11 -27 1997 0 -19 0 -15 -20 12 -28 1998 0 -36 0 -29 -38 13 -45 1999 0 -43 0 -35 -46 13 -52 2000 0 -23 0 -17 -28 11 -35 2001 0 -18 0 -15 -23 10 -30 2002 0 -11 0 -8 -13 10 -21 2003 0 -8 0 -6 -10 10 -18 2004 0 -23 0 -17 -27 10 -33
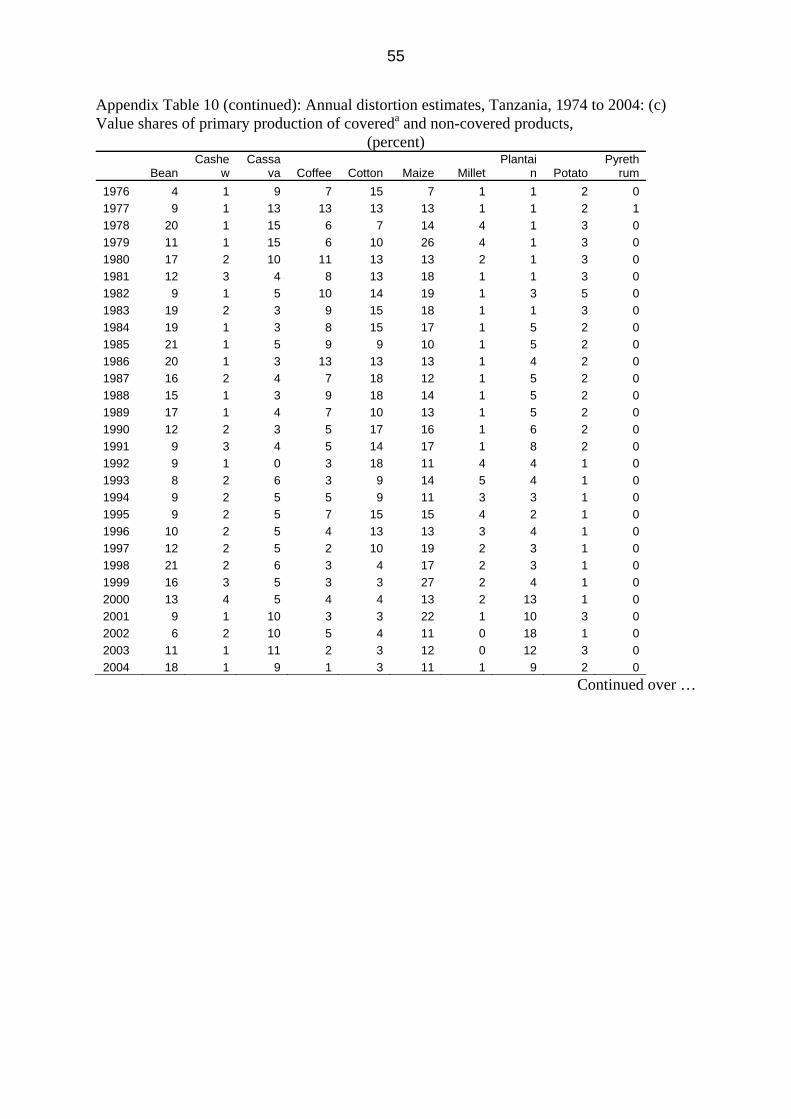
55
Appendix Table 10 (continued): Annual distortion estimates, Tanzania, 1974 to 2004: (c) Value shares of primary production of covereda and non-covered products,
(percent)
Bean Cashe
w Cassa
va Coffee Cotton Maize Millet Plantai
n Potato Pyreth
rum 1976 4 1 9 7 15 7 1 1 2 0 1977 9 1 13 13 13 13 1 1 2 1 1978 20 1 15 6 7 14 4 1 3 0 1979 11 1 15 6 10 26 4 1 3 0 1980 17 2 10 11 13 13 2 1 3 0 1981 12 3 4 8 13 18 1 1 3 0 1982 9 1 5 10 14 19 1 3 5 0 1983 19 2 3 9 15 18 1 1 3 0 1984 19 1 3 8 15 17 1 5 2 0 1985 21 1 5 9 9 10 1 5 2 0 1986 20 1 3 13 13 13 1 4 2 0 1987 16 2 4 7 18 12 1 5 2 0 1988 15 1 3 9 18 14 1 5 2 0 1989 17 1 4 7 10 13 1 5 2 0 1990 12 2 3 5 17 16 1 6 2 0 1991 9 3 4 5 14 17 1 8 2 0 1992 9 1 0 3 18 11 4 4 1 0 1993 8 2 6 3 9 14 5 4 1 0 1994 9 2 5 5 9 11 3 3 1 0 1995 9 2 5 7 15 15 4 2 1 0 1996 10 2 5 4 13 13 3 4 1 0 1997 12 2 5 2 10 19 2 3 1 0 1998 21 2 6 3 4 17 2 3 1 0 1999 16 3 5 3 3 27 2 4 1 0 2000 13 4 5 4 4 13 2 13 1 0 2001 9 1 10 3 3 22 1 10 3 0 2002 6 2 10 5 4 11 0 18 1 0 2003 11 1 11 2 3 12 0 12 3 0 2004 18 1 9 1 3 11 1 9 2 0
Continued over …
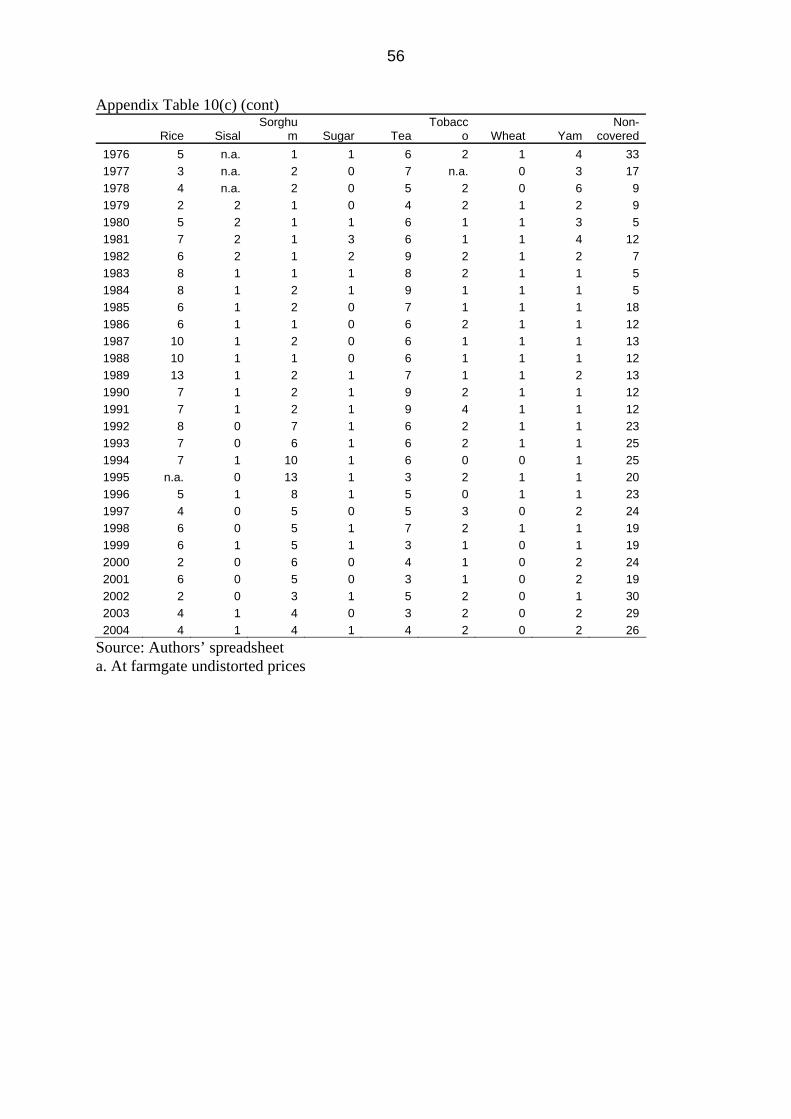
56
Appendix Table 10(c) (cont)
Rice Sisal Sorghu
m Sugar Tea Tobacc
o Wheat Yam Non-
covered 1976 5 n.a. 1 1 6 2 1 4 33 1977 3 n.a. 2 0 7 n.a. 0 3 17 1978 4 n.a. 2 0 5 2 0 6 9 1979 2 2 1 0 4 2 1 2 9 1980 5 2 1 1 6 1 1 3 5 1981 7 2 1 3 6 1 1 4 12 1982 6 2 1 2 9 2 1 2 7 1983 8 1 1 1 8 2 1 1 5 1984 8 1 2 1 9 1 1 1 5 1985 6 1 2 0 7 1 1 1 18 1986 6 1 1 0 6 2 1 1 12 1987 10 1 2 0 6 1 1 1 13 1988 10 1 1 0 6 1 1 1 12 1989 13 1 2 1 7 1 1 2 13 1990 7 1 2 1 9 2 1 1 12 1991 7 1 2 1 9 4 1 1 12 1992 8 0 7 1 6 2 1 1 23 1993 7 0 6 1 6 2 1 1 25 1994 7 1 10 1 6 0 0 1 25 1995 n.a. 0 13 1 3 2 1 1 20 1996 5 1 8 1 5 0 1 1 23 1997 4 0 5 0 5 3 0 2 24 1998 6 0 5 1 7 2 1 1 19 1999 6 1 5 1 3 1 0 1 19 2000 2 0 6 0 4 1 0 2 24 2001 6 0 5 0 3 1 0 2 19 2002 2 0 3 1 5 2 0 1 30 2003 4 1 4 0 3 2 0 2 29 2004 4 1 4 1 4 2 0 2 26
Source: Authors’ spreadsheet a. At farmgate undistorted prices
Related Documents


![[eng] AGRICULTURAL PRICES : Price indices and absolute ... · agricultural production Eurostat publications on agricultural price statistics Page 5 Signes et abréviations employés](https://static.cupdf.com/doc/110x72/5f82febcf143ec7a1a0d0d02/eng-agricultural-prices-price-indices-and-absolute-agricultural-production.jpg)


