AGRICULTURAL POLICY ANALYSIS PRWECT, PHASE II Under contract to the Agency for International Development, Bureau for Science and Technology, Office of Agriculture Project Office Hampoen Sq.,are, 4800 Monlgomer/ Lane, Surte 500, Belhesca MD 2081 4 Teurnon. (301) 913 -0500 Teiex 312636 , Fax (301) 652-7530 o Fax (301, 652-7791 DEMAND MANAGEMENT OF PAKISTAN'S FOOD SYSTEM 1960-1986 July 1992 APAP II Collaborative Research Report No. 308 Prepared for AID/R&D/AGR and AD/NE/DR under the Agricultural Policy Analysis Project, Phase I (APAP II) A.I.D. Contract No. DAN-4084-Z-00-8034-00 Author: Richard H. Goldman, Harvard Institute for International Development Prime Contractor: Abt Associates Inc., 55 Wheeler Street, Cambridge, MA 02138 . (617) 492-7100 Subcontractors: Harvard Institute for Intornational Development, Harvard University, One Eliot Street, Cambridge, MA 02138 . (617) 495-2164 Food Research Institute, Stanford University, Stanford. CA 94305-6084 . (415) 723-3941 North Carolina State University, Department of Economics and Business, Box 7645, Raleigh, NC 27695-7645 , (919) 737-7187 Abel, Daft & Earley, 1410 King Street, Alexandria, VA 22314 . (703) 739-9090 International Science and Technology Institute, 1129 20th Street, NW, Suite 800, Washington, D.C. 20036 . (202) 785-0831 International Food Policy Research Institute, 1776 Massachusetts Avenue, NW, Washington, D.C. 20036 . (202) 862-5600

Welcome message from author
This document is posted to help you gain knowledge. Please leave a comment to let me know what you think about it! Share it to your friends and learn new things together.
Transcript
AGRICULTURAL POLICY ANALYSIS PRWECT PHASE II Under contract to the Agency for International Development Bureau for Science and Technology Office of AgricultureProject Office Hampoen Sqare 4800 Monlgomer Lane Surte 500 Belhesca MD 2081 4 Teurnon (301) 913 -0500
Teiex 312636 Fax (301) 652-7530 o Fax (301 652-7791
DEMAND MANAGEMENT OF PAKISTANS FOOD SYSTEM
1960-1986
July 1992
APAP II Collaborative Research
Report No 308
Prepared for AIDRampDAGR and ADNEDR
under the Agricultural Policy Analysis Project Phase I (APAP II) AID Contract No DAN-4084-Z-00-8034-00
Author Richard H Goldman Harvard Institute for International Development
Prime Contractor Abt Associates Inc 55 Wheeler Street Cambridge MA 02138 (617) 492-7100 Subcontractors Harvard Institute for Intornational Development Harvard University One Eliot Street Cambridge MA 02138 (617) 495-2164
Food Research Institute Stanford University Stanford CA 94305-6084 (415) 723-3941 North Carolina State University Department of Economics and Business Box 7645 Raleigh NC 27695-7645 (919) 737-7187 Abel Daft amp Earley 1410 King Street Alexandria VA 22314 (703) 739-9090 International Science and Technology Institute 1129 20th Street NW Suite 800 Washington DC 20036 (202) 785-0831 International Food Policy Research Institute 1776 Massachusetts Avenue NW Washington DC 20036 (202) 862-5600
TABLE OF CONTENTS
EXECUTIVE SUMMARY i
1 INTRODUCTION I
2 FOOD CONSUMPTION IN THE GREEN REVOLUTION ERA 1960-70 2
3 INSTABILITY IN THE FOOD SYSTEM 1971-76 7
4 ECONOMIC RECOVERY AND DIET DIVERSIFICATION 1977-86 9
5 ACCOMMODATING DEMAND EXPANSION THE EDIBLE OILMILK COMPLEX 12
6 INCOME AND PRICE IMPACTS ON FOOD DEMAND 14
7 THE CHANGING ROLE OF WHEAT IN THE FOOD SYSTEM 18
8 CONCLUSION 20
BIBLIOGRAPHY
TABLES
TABLE 1 TABLE 2 TABLE 3
Food Consumption Growth and Self Sufficiency Real Food Price Indices (197576 = 100) Average Annual Growth in Agricultural Production
3 4 6
TABLE 4 TABLE 5 TABLE 6
Percent Change in Per Capita Calorie Consumption Comparison of Pakistan Demand Elasticity Estimates Comparison of Actual and Predicted Consumption Changes
9 15 17
FIGURES
FIGURE 1 Retail Food Price Indices (Deflated) 5 FIGURE 2 Per Capita Sweetener Consumption in Pakistan 11 FIGURE 3 Per Capita Consumption of Edible Oil 13
EXECUTIVE SUMMARY
During the quarter century 1960-1986 Pakistans food system was dramatically transformed Over that period per capita calorie consumption impioved dramatically the share of cereal calories provided by domestic production increased and diets became more diverse This process was partially promoted by a rapidly growing agricultural sector and importantgrowth and diversification of per capita incomes Policy makers in the context of this demand expansion faced conflicting policy objectives On the one hand there was a need to promoteadditional food consumption from the low level that prevailed in the 1960s On the other handadditional domestic food production could be used to substitate for imports or expand exportsthus generating scarce foreign exchange and contributing to food self-sufficiency goalsparticularly for wheat The management of food demand through trade and other pricing policyinstruments resulted in dramatically changing patterns of prices and consumption in the food system This paper traces the evolution of Pakistans food system through three distinctlydifferent periods the Green Revolution thrust toward wheat self-sufficiency and food consumption growth the economic stagnation of 1970-76 with rapidly rising food prices and the search for new sources of food supplies and the post 1976 economic recovery and diet diversification The paper places special emphasis on complex interactions within the food system associated with the diet diversification process particularly the rapid increase ini edible oil and milk consumption and the recent trend toward declining per capita consumption of wheat
1 LNTRODUCTION
This paper is about changing patterns of food consumption in Pakistan and the policyenvironment which promoted these changes The analysis here is carried out largely at the national aggregate level National policies are often implemented in response to a concern about macroeconomic aggregates such as the price level of politically sensitive commodities and the flows of trade and foreign exchange These policies in turn aim to alter aggregate behavior in the national economy An analysis of food consumption outcomes within the framework of aggregate response to policy instruments is critical since it throws light on primay stresses influencing policy management
National food systems are defined by complicated interactions among commodities at the production level where there is competition for production inputs such as water and land Furthermore primary production commodities such as cotton or milk often result in more than one consumption commodity Thus commodity-specific policies can have unintended and important spill-over effects At the consumption level there are also mu -commodityinteractions where families and individuals shift their consumption patterns as their incomesemployment place of residence and other aspects of their economic environment change
Prices are at the interface between these domestic production and consumption patternsinfluencing both producers and consumers usually in opposite directions But prices themselves are a reflection of trade and fiscal policies These policies play a major role in managing the food demand system as economic development unfolds Pakistans experience with food policy over the past 25 years reflects the complexity of its food system
Pakistan has achieved impressive agricultural production growth and diversification But the factors generating this process-Green Revolution technology irrigation investments and some price and marketing reform-are often not the primary factors influeicing the food consumption process Despite the importance of the agricultural sectors contribution to on-farm consumption and rural incomes and employment the changing pattern of food consumption in Pakistan is not at all an analog of the production changes At the center of the differences is a policy-led process of demand management reflecting often conflicting objectives and inducing both intended and unintended results in the food system
The next three sections of this paper are about the changing pattern of food demand in Pakistan measured at the national level These sections which correspond to three distinct periods of food system development comprise a story told from a demand managementperspective Following this is an analysis of the unusual interactions between edible oil and milk consumption two of Pakistans fastest growing food commodities The next section reports an attempt not entirely successful to formally disaggregate the influences of income and pricechanges on the consumer demand system The paper concludes with a discussion about issues relating to future development of the food system
2 FOOD CONSUMPTION IN THE GREEN REVOLUTION ERA 1960-70
An overview of key indicators of Pakistans food production consumption and
international trade is shown in Table 1 The country began the 1960s with a low level of food
consumption about 1700 calories per person per day Unstable production in the first part of
the decade combined with an interruption of food aid pushed food issues to the top of the
countrys policy agenda By 197071 per capita food consumption had increased by 20 percent
An inspection of Table 1 shows that this consumption expansion was led by a dramatic increase
in both wheat and rice (the dominant other cereal) production resulting from widespread
adoption of imported high-yielding seed varieties and large private sector investments in tubewell
irrigation technology T1his huge production increase allowed policy managers to induce not only
a dramatic increase in consumption but also large generation of foreign exchange through wheat
import substitution The share of wheat consumption supplied from domestic sources increased
ten percentage points in the last half of the 1960s from 84 to 94 percent Despite the growth
in both production and consumption domestic wheat prices during this period (producer level)
held almost 30 percent above the world market equivalent An implication here is thatwere consumption gains could have been even greater through greater imports and lower prices had
policy managers not been contending with the conflicting foreign exchange objective an
important feature of Pakistans demand management system
During the same period per capita consumption of rice increased even more rapidly than
as its share of total food calories grew from 10 to 13 percent Policy managers usingwheat the national rice export monopoly allowed the productionconsumption ratio to fall from 116
to 114 in order to promote lower real rice prices domestically and to accommodate aggregate led by a large decline in the productionnational diet diversification The share of non-cereals
and consumption of pulses fell by 3 percentage points or 75 percent
Some further insight into this process is provided by the way the forces of demand and
supply played out in the countrys price system A record of real (deflated) consumer food prices
shown in index form for various years over the period 196061 - 198485 is shown in Table 2
Some of these prices are portrayed in Figure 1 (It is important to note that the lines in Figure
1 simply connect the points for the 5 years shown and do not represent prices in the interim
years While this masks some price variability it also provides a clearer view of real relative
price trends) This price graph which will be referred to at various points in the paper
provides a useful portrayal of the dramatically changing real relative prices in Pakistans food
economy and suggests a richer pattern of diet diversification than that summarized in the calorie
share column in Table 1
What was going on in the food economy during the 1960s other than strategic events in
the rice and wheat sectors The prices shown in Figure 1 are the result of real supply and Prices fall when the growth in demand largely ademand forces in the Pakistan economy
function of demographic and income factors is outstripped by the growth in available supply
2
from domestic and imported sources This is clearly shown for the case of wheat and rice between 196061 and 197071 when real prices fell by 9 and 15 percent respectively
TABLE 1 Food Consumption Growth and Self Sufficiency
PRODUCTION CALORIES PER CALORIES CALORIE CONSUMPTION
CAPITA INDEX SHARE RATIO
Total Food 196163 1685 100 100 96 197071 2013 100120 99 197476 2084 124 100 97 197780 2143 127 100 99 198486 2193 130 100 99
Wheat 196163 688 100 41 84 197171 860 125 43 94 197476 995 145 48 84 197780 1003 147 45 90 198486 994 45144 97
Other Cereals 196163 313 100 19 116 197071 415 21133 114 197476 366 117 18 126 197780 355 113 17 139 198486 329 105 15 129
Non Cereals 196163 668 100 40 99 197071 738 110 37 99 197476 722 108 35 98 197780 778 117 36 96 198486 871 40130 94
Source FAO Food Balance Sheets (revised for Agrialture in the Year 2000 study)
3
TABLE 2 Real Food Price lridices (197576 = 100)
WHEAT RICE MILK BEEF PULSES
196061 108 92 73 58 88
197071 98 78 88 82 107
197576 100 100 100 100 100
198081 96 97 90 96 144
198485 90 101 101 11 159
REFINED VEGETABLE EGGS REAL WPI NOMINAL
SUGAR GHEE FOOD WPI FOOD 196061 89 95 na 89 33 197071 78 114 112 92 44
197576 100 100 100 100 100
198081 90 73 90 100 155
198485 88 70 78 98 205
Source Calculated from Government of Pakistan Economic Suwvey Statistical Supplement 198889
4
FIGURE 1 Retail Food Price Indices (Deflated)
120 - -
110 - e e f-
Wheat
100 -
Vegetable Ghee
90-- ----- ---- -- -- shy- - - - at Rice
Sugar ugar (Refined)
80 ---
70- egetableGhee
60
Beef
50 - I
6061 7071 7576 8081 8485
Source Government of Pakistan
5
Sugar is the other outstanding example The share of non-cereal calories in the Pakistani diet would have fallen further were it not for substantial increases in sugar production induced by protected producer prices public investment and a price subsidized ration program in urban areas Policy managers could have achieved an even greater decrease in the real sugar price and hence more consumption had they not been concerned with the direct foreign exchange costs and food security implications of existing policies During the period the large domestic production increment was utilized not only to facilitat2 an increase in per capita consumption but also to increase self-sufficiency (from about 8 to 95) and domestic stocks (by about 16 fold) to cushion the impact of the unstable domestic production and world price environmenc This policy of high protection from world markets while appearing to save foreign exchange through the self-sufficiency gain actually worsened Pakistans foreign exchange earning capacity by drawing scarce production inputs away from crops with better net foreign exchange earning prospects (Gotsch 1975)
The decrease in real prices in the latter half of the 1960s for wheat rice and sugar should be compared with the price performance of other important elements in the diet as this is helnful to undeistanding the important changes in the food system in the 1970s Meat milk and 6 ee (a cooking oil) each play an important role in the Pakistani diet with demand being strongly responsive to changes in income In contrast to the major grain crops livestock production experienced a slow two percent annual growth during the 1960s These relatiCnships are shown in Table 3 With population growing at almost three percent and real per capita income growing in excess of four percent great pressure was placed on livestock product prices as confirmed in Figure 1 and Table 2 The ghee price shown is for the vegetable oil based product (as distinct from the butterfat produict desi ghec) which grew to a place of major importance in the food economy in the latter half of the 970s During the 1960s the price of the predominant butterfat ghee increased even faster than the dalda price shown in Figure 1 Despite these food price increases the strategic role of wheat and rice in the diet resulted in only a 33 percent increase in the real food price index during the 1960s
TABLE 3 Average Annual Growth in Agricultural Production (At constant factor cost)
196065 196570 197077 197785 Agriculture 38 63 17 37 Major Crops 47 91 09 35 Minor Crops 48 38 46 28
Livestock 19 20 24 44
Source Report of the National Commission on Agriculture
6
3 INSTABILITY IN THE FOOD SYSTEM 1971-76
The optimism induced by the Green Revolutions impact on the food economy in the late 1960s was short-lived Between 1970 and 1975 actual market prices for food increased by an average of 127 percent International price shocks and general excess demand in the macroshyeconomy played an important part here but imbalance between supply and demand in the food economy pushed food prices up even faster than the general inflation rate so that in contrast to the 1960s real food prices iciireased by almost 10 percent in the first half of the seventies The dilemma facing food policy makers was acute during this period as they struggled to keepprices under control and to generate foreign exchange in the face of excessive government spending and an increasingly over valued exchange rate
Unfortunately the agricultural sector itself was a major source of the problem Duringthe first half of the 1970s growth in the major crop sector as shown in Table 3 slowed dramatically This was led by successive years of falling cotton and sugar production But growth in the grains sector slowed as well By 1970 almost 60 percent of Pakistans wheat land was planted in high-yielding varieties With such a large proportion of the land already growingHYVs the production growth rate inevitably slowed The rice growth rate also slowed due in part to the Governments desire to maintain a large share of rice land in low yielding but highvalued (on export markets) aromatic rice varieties
On the demand side there was some respite Growth in real per capita income was small during the early 1970s On the other hand the 31 percent annual population growth rate was almost 7 percent higher than that of the previous decade
The record of real prices shown in Figure 1 and the data ii Table I provide evidence of the food policy drama during this period Keeping in mind that actual market prices were exploding real prices were also rising for virtually all major food commodities Policy managers were losing control of the supply-demand balances In the face of a slow-growing livestock production sector with no new technology available and no real options for international trade there was little policy managers could do to prevent the continuing escalation of livestock-based food prices
The grains sector however offered options to food policy managers and dilemmas as they struggled with conflicting policy objectives Insight is gained by contrasting the policy response to demand pressure in domestic wheat and rice markets At the beginning of the 1970s Paldstan had made great progress toward its goal of national self-sufficiency in wheat consumption a remarkable achievement given that it coincided with a 25 percent increase in percapita consumption The record in Table 1 shows that all of this gain was lost by 1975 In addition real prices reversed their trend of the earlier period increasing modestly By turning once again to imported wheat policy managers accommodated not only the impact of rapidpopalation growth but also facilitated a 16 percent increase in per capita wheat consumption
7
This increase is a bit puzzling given the negligible growth in real per capita income during the period It is possible despite the 25 percent increase in wheat consumption in the earlier period that consumers were prepared to purchase more wheat Jhan was available at official prices making consumption in this period dependent upon administratively controlled supplies An estimated 5G-60 percent of urban consumers still relied on the official ration shop distribution system in the early 1970s Under this condition an import generated increase in available supply could be absorbed by consumers even with moderately increasing real prices An alternative explanation is that as Green Revolution wheat technology continued to spread it was adopted increasingly by poorer farmers in more problematic agri-ecological environments These farm families with their relatively high income elasticities of demand would tend to use the increase in production to accommodate an increase in household wheat consumption Finally near the end of the period Pakistan began io experience large inflows of remittance funds from formerly rural Pakistanis working in oil exporting countries These remittances were received by households with lower than average per capita incomes and higher than average demand elasticities for wheat It is likely that all three of these processes combined to explain the increase in per capita wheat consumption in the face of rising real prices and low growth in national aggregate per capita income
The domestic rice market was managed differently from that of wheat Rice is a important commodity in the Pakistani diet In this earlier period rice constituted somewhat less than half the calorie consumption share of wheat and a stronger income elasticity of demand It does not have the symbolic importance in the political economy however In addition it is an export crop and a principal generator of foreign exchange In the early 1970s with rice production continuing to expand policy managers faced the choice of using the production increment to dampen the domestic food price level and facilitate a further eXpansion of consumption or to increase exports and generate badly needed foreign exchange The results of their choice is revealed in Table 1 and Figure 1 Rice exports were stepped up to the extent that domestic per capita rice consumption fell by 12 percent The domestic self-sufficiency ratio increased from 114 to 126 reflecting the move toward exports The domestic food economy gave up this rice grudgingly as real rice prices increased 28 percent
In effect the government sacrificed its wheat self-sufficiency objective but did it as cheaply as possible in terms of foreign exchange cost It exported expensive rice calories driving up the domestic price of rice and used part of the proceeds to import considerably more and cheaper wheat calories thus keeping the politically sensitive domestic wheat flour market marginally under control Overall by 197576 nominal food prices rose 127 percent over the previous five years while real food prices increased by 88 percent Per capita calorie consumption which had made such large gains during the previous period increased by only 3 percent
8
4 ECONOMIC RECOVERY AND DIET DIVERSIFICATION 1977-86
In the 1977-86 period Pakistan has experienced economic expansion (see Table 3) stimulated by a recovering agricultural sector increases in foreign assistance and large remittances from workers in the Middle East (see Amjad 1986) with real per capita income growing by 44 percent annually Population has continued to expand at a 3 percent rate However a glance at Figure 1 shows that in the post 1976 period the rise in food prices was halted and in some cases reversed With demand generating factors expanding at such a rapid rate faster than the 1970 - 76 period how have real food prices been contained
The agricultural recovery facilitated an easing of supply conditions This effect was reinforced by the beginning of an apparent slowdown in the demand expansion for wheat The period also witnessed a remarkable diversification in consumption pattern1s This diversification is revealed in broad outline in Table I but is shown more completely in Table 4 below
TABLE 4 Percent Change in Per Capita Calorie Consumption
TOTAL REFINED CALaIES WHEAT RICE SUGAR PULSES
1960-70 200 250 590 1350 -360 1970-75 33 16 -100 -20 14 1975-80 24 14 -10 210 -151 1980-85 10 -20 -13 440 -161
FLUID BEEF MILK POULTRY EDIBLE OIL
1960-70 - - 17 shy1970-75 - - 43 22 1975-80 0 21 35 41 1980-85 2 19 135 29
Note Beef and fluid milk figures a1e for 1970-80 and 1980-84 Source FAO supply utilization accounts with the following exceptions Refined sugar from Lodhi (1988) Beef
and Fluid milk from Pakistan household income and expenditure surveys
Export priorities continued to dominate the rice sector particularly in the face of faltering rice production thus pushing up real prices and reinforcing the trend toward modestly falling per capita rice consumption Per capita wheat consumption also fell slightly despite falling real prices a feature confirmed both by food balance sheet data and comparison of national
9
household sample surveys Given the substantial increase in real per capita income over the period this evidence suggests a very low and perhaps negative income elasticity for wheat This possibility will be discussed in more detail below Per capita consumption of grams and other pulses also continued falling as real prices increased apparently the result of crop system shifts induced by spreading Green Revolution technology in wheat and rice In contrast consumers increased their consumption of refined sugar vegetable oil milk and other dairy products eggs and poultry meat as prices fell sharply
The dramatic increases in livestock product prices in the earlier period reflected by those for milk and beef in Figure 1 stimulated two additional responses in the food economy First private parties and some government sponsored joint-ventures began to make investments in modern poultry raising techniques The impact of this can be seen in the astonishing fall in real egg prices Eggs and poultry meat which played a negligible role in the food economy prior to this investment have dominated the expansion of animal protein consumption since 1975 While per capita protein consumption grew at a slow 25 percent annually protein consumption from poultry and eggs grew from a low base at almost 18 percent per year thus increasing the animal share of total protein from 66 to 93 percent
The second response came from food policy managers With the price of desi ghee the butterfat based cooking oil skyrocketing the government decided to begin imports of large amounts of soybean and palm oil Although government administered the domestic price of these imports through import duties and release prices the landed price of imported vegetable oil was low enough to cause the step to fall in the domestic price level shown in Figure 1 (Goldman and Hall) The response of consumers was overwhelming putting per capita consumption of
vegetable oil on an upward trajectory after 1974 when the large imports began Initially this imported oil was provided through concession PL-480 sales As demand expanded however the share of commercial imports increased and was upplemented by domestic supplies of cottonseed oil from the recovering cotton crop following 1978 The result of this supply expansion even in the face of robust demand forces drove down prices in dramatic fashion Between 1974 and 1984 edible oil consumption accounted for 123 percent of change in per capita calorie consumption in Pakistan (see Goldman and Hall 1990 for further details)
The consumption of refined sugar also increased In this case however the demand was accommodated from neither imports nor domestic supply expansion Rather Government supported investors in capital intensive centrifugal sugar mills by establishing production zones around those mills in order to guarantee throughput in the mills and augment the supply of refined sugar in urban areas where it was sold to consumers through a subsidized ration program This was necessary to curtail the supply of cane sugar to the village sugar processing industry which produced a coarse brown sweetener called gur a product preferred by rural consumers As shown in Figure 2 over time this policy was successful Refined sugar consumption increased mostly an urban phenomenon while gurconsumption decreased in rural areas At the end of the period per capita sugar consumption refined and unrefined combined remained virtually unchanged
10
FIGURE 2 Per Capita Sweetener Consumption in Pakistan
35
39
Total Swetene
shybullGur
29f
19 Ref ine Suar
62 64 66 68 79 72 74 YEAR
76 78 8 82 84 86
11
5 ACCOMMODATING DEMAND EXPANSION THE EDIBLE OLMILK COMPLEX
One of the most intriguing elements in the diet diversification process involves milk over the entireconsumption As with beef production the overall supply of milk in Pakistan
period grew at a rate equal to or marginally less than population Evidence suggests that the
income elasticity of demand for both commodities is strong so that demand was expanding at
a rate faster than domestic supply The result for beef is easy to see in Figure 1 and Table 4
where the real price increases sharply and per capita consumption stagnates There is a slacking
of this process between 1975 and 1980 when real prices fall slightly This is probably in
response to the unusually high rate of bullock and buffalo slaughter as tractors spread rapidly over the Pakistani countryside
The price and consumption pattern for fluid milk is different however Real prices fell rate than beef prices Surprisingly howeversharply after 1975 then rose but at a slower
comparison of household expenditure surveys show a very substantial increse in per capita
consumption of fluid milk Although powdered milk imports increased sharply from a negligible
base during this perir the level of imports represented a very small fraction of total milk
consumption in the country With per capita milk production virtually constant over the period
where did the additional milk come from
In a roundabout way the increased milk consumption came from the vegetable oil
imports Attracted by the rapidly falling real prices and the easy availability of vegetable ghee
shifted out of the butterfat based desi ghee This substitution is confirmed by theconsumers comparison of household expenditure survey consumption data shown in Figure 3 Buffalo milk
which predominates over cow milk in Pakistan cow uLlis about 5-6 percent butterfat Desi ghee
contains almost 100 percent butterfat As consumers shifted out of desi ghee and into dalda it some of this butterfatfacilitated a 20 to 1 potential supply expansion in fluid milk Of course
was diverted into confectionery consumption But the evidence in the expenditure surveys reveals markets Thisthat a tremendous increment of fluid milk was released directly into consumer
unplanned result of the decision to expand vegetable oil imports has been a strategic feature of the Pakistan food economy over the past decade
12
07
FIGURE 3 Per Capita Consumption of Edible Oil (per month)
06
05
Vegetable Ghee
04shy
03shy
02shy
01-
Desi Ghee
6869 7980 84185
Source Pakistan Household Income and Expenditure Surveys
13
6 INTCOME AND PRICE IMPACTS ON FOOD DEMAND
food policy makers have had to contend withThroughout the period examined here vigorous expansion in the demand for food Although there are many factors which contribute to this demand three are generally considered to be primary population growth changes in real
per capita income and changes in real and relative food prices A simple equation model
showing the impact of these factors on the change in expenditure on food (both market purchases and purchases from own-farm production) is
Expend = Pop + Y (Ey) + P (Ep)
where Expend Pop Y and P represent growth rates over time in real food expenditures population real per capita total expenditure and real food prices Ey and Ep represent expenditure and price elasticities of demand the proportionate relationships between the change in total expenditure (used in applied studies as a proxy for income which is more difficult to
measure) and a change in price respectively and the change in consumption These relationships also apply to changes in calorie consumption holding the market quality of the food group in question constant an exercise which is carried out below Population growth exerts a general pressure on aggregate demand for food while changes in incomes and prices influence per capita consumption levels When domestic availability of food from either
domestic production stocks or imported sources cannot accommodate the change in demand
induced by population growth and change in income then real prices rise When availability grows faster than these changes then real prices fall
Population growth in Pakistan has been among the highest in Asia at about 3 percent per annum and accounts for the largest portion of change in aggregate consumption over the past 25 years But over that period there has been important increases in per capita consumption of
total calories as well with some foods playing a greater role than others in that growth Food
policy management has played a central role in that process
The narrative thus far has been constructed around inspection of real price changes shown in Figure 1 and the data on per capita consumption shown in Tables I and 4 Is it pnssible to
obtain a stronger quantitative estimate of the relative importance of income changes versus price changes as factors shaping the actual changing pattern of consumption in Pakistan
There is a record of household expenditure survey data for Pakistan beginning in the
early 1970s and including various years through the mid-1980s The early surveys form a weak statistical base and are not necessarily comparable with those which follow but the 1979 and
1984-85 surveys are stronger These surveys provide rich understanding of many dimenisions of Pakistans food system
14
The results of two sophisticated attempts to use this survey data to determine income and price elasticities are reported in Alderman (1987) and Ahmad et al (1987) A summary and comparison of their estimates of national aggregate elasticities is shown in Table 5 Each of these studies confirm that income and price are important determinants of demand Unfortunately they differ substantially regarding the order of magnitude of the parametersAldermans estimate of the income elasticity for wheat for example is 36 contrasted with Ahmad et als estimate of 12 There are important differences between the two studies with respect to estimates of both price and income elasticities for all major commodities
TABLE 5 Comparison of Pakistan Demand Elasticity Estimates
Expenditure Elasticity (Ey) ELASTICITY RELATIONSHIPS
Alderman Ahmad Alderman Ahmad Wheat 036 012 029 026 Rice 091 044 072 096 Pulses 049 026 039 057 Dairy 126 06 100 100
Own Uncompensated Price Elasticity (Ep) ELASTICITY RELATIONSHIPS
Alderman Ahmad Alderman Ahmad Wheat -071 -017 C75 035 Rices -151 -037 159 077 Pulses -044 -026 046 054 Dairy -095 -048 100 100
Ratio of Income and Price Elasticities (EyEp) Alderman Ahmad
Wheat -051 -071 Rice -060 -119 Pulses -111 -100 Dairy -133 -096
Notes 1 The aggregate national Elasticities reported by both studies are the weighted average of estimated urban and rural elasticities 2 In both cases these estimates are from the 1979 Household and Income Expenditure Survey data Aldermans estimates are from a Almost Ideal Demand System (using independent market prices) approach Ahmad et al employ a modified Linear Expenditure System approach
Sources Alderman (September 1987) Ahmad et al (1987)
15
Some common structural relationships are revealed however Inspection of the proportionate relationship among expenditure elasticities within each study shows an almost similar hierarchy (see the elasticity relationships columns) Milk has the highest income elasticity inboth studies and wheat the lowest the ratio between the two elasticities is almost identical as well The relative relationships between wheat rice and milk are similar in both studies but the expenditure elasticities for pulses are in different place orders Unfortunately there is not a similar degree of consistency between the own price elasticity estimates other than milk being the highest in both studies There are also large discrepancies between the expenditureprice elasticity ratios in the two studies
Although both studies are carefully and expertly done Aldermans estimates may be preferred since his methodology is less constraining Applying Aldermans elasticity estimates to the demand equation shown above and using the actual price and real per capita income changes for past periods should result in estimates of per capita consumption changes which approximate those actually observed The results of this exercise applied to wheat rice and milk shown in Table 6 are mixed These elasticity estimates work best with fluid milk (and other dairy product) consumption where the expenditure and own-price elasticities over-predict by 27 percent the actual 21 percent increase in per capita consumption in the 1970-80 period and under predict by 28 percent the observed 19 percent increase in consumption between 1979 and 1984 Including the effect of the wheat and rice cross-price elasticities (not shown in the table) reduces the under prediction in the latter case to 18 percent The elasticities also work reasonably well for wheat and rice during the neriod 1970-80 where the own price and expenditure elasticities explain almost 100 percent of the observed 92 percent change in per capita wheat consumption and over-predict the actual 11 percent decline in rice consumption by 35 percent (26 percent error when the wheat and pulse cross-price elasticities are included) The parameters also predict well the 1960-70 period Unfortunateiy for wheat and rice they do not explain at all well the 1975-84 period nor do they explain well the successive five-year periods after 1970 (only 1980-85 is shown in Table 6)
It is possible based on Table 6 to make some judgments about the relative importance of per capita income and price changes on the national consumption pattern between 1960-70 and 1970-80 Per capita income is about 23 times more important than price on wheat consumption in the earlier period and is almost the exclusive influence in the 1970-80 period Income and price effects are somewhat more balanced in the case of rice in the 1960-70 period with the income effect on consumption about 75 percent greater than the price impact This is reversed in the 1970-80 period where the impact of price is about 70 percent greater than that of income as the aggressive export thrust drove up domestic rice prices For milk we have no consumption change data for the earlier period During 1970-80 however the income effect dominates the price effect During 1980-85 where the elasticity estimates seem to work reasonable well for milk consumption the role of price increases accounting for a bit less than half the impact of income
16
TABLE 6 Comparison of Actual and Predicted Consumption Changes
ACTUAL CONSUMPTION PREDICTED CONSUMPTION CHANGE ACTUALPREDICTED
CHANGE () RATIO
Income Effect Own Price Effect
1969-70
Wheat 250 155 66 113
Rice 590 402 230 093
Milk na na na na
1970-80
Wheat 92 80 14 098
Rice -113 207 -360 074
Milk 210 287 -21 127
1980-85
Wheat -20 70 48 - 17
Rice -15 182 -62 - 13
Milk 188 252 -116 072
Note These estimates are from coefficients estimated by Alderman (1987) See text and Table 5
17
7 THE CHANGING ROLE OF WHEAT IN THE FOOD SYSTEM
Throughout the period under investigation here wheat has played a strategic role in the food economy It is by far the largest calorie source and accounts for a large portion of the impressive gains in per capita calorie consumption The Government of Pakistan used domestic procurement and pricing policy as well as donor assisted imports to ensure stable and modestly declining real consumer prices throughout the period following the mid-1960s (see Figure 1) Earlier in the period the domestic price level was about 30 percent above the equivalent world price (measured at the official exchange rate) Later this situation reversed with domestic prices below the world market by about 35 percent in the 1970s and 19 percent from 1983-87 (Dorosh and Vald6s) Failure of domestic wheat prices to fully reflect rupee devaluations accounts for a large share of this reversal
Although large amount of public resources were expended to support a program of consumer wheat subsidies during this period at one point accounting for 13 percent of current budgetary expenditure this program had little influence on aggregate flour demand or the price performance described above Despite the huge amount of resources required to support a program of subsidized ration shops recent analysis has shown that relatively little of this expenditure was actually transferred to consumers generally and poor consumers specifically Alderman (1988) concludes that the self-targeting nature of the ration-shop flour notwithstanding a very small portion of Pakistans consumers actually benefitted This was due to the large urban bias in the distribution of ration shops actually selling subsidized flour in a country where more than two-thirds of the population is rural and to massive fiscal and physical leakages from the wheat subsidy program In 1975 the budgetary cost per kilo of released flour was three times greater than the price differential between rationed and open-market flour (Hamid Nabi and Nasim) Similarly a 198586 stidy suggests that approximately 69 of the subsidized wheat released by the government is not drawn by consumers from ration shops or subsidized bakeries (Alderman Chaudhry and Garcia 1988) In 1987 the ration-shop program was terminated and replaced by a general subsidy offsetting a portion of processing and marketing costs of wheat flour
Evidence suggests that Pakistan has entered a new phase in the evolution of its wheat economy Despite rising per capita income and falling market prices per capita wheat consumption declined during the 1980s This decline is revealed in a comparison of the 1979 and 1984 household expenditure surveys and is confirmed in the food balance sheets for the two periods (see Ender et al) The evidence is consistent with a negative income elasticity of demand in contrast to the positive elasticities estimated by both Alderman and Ahmad et al from the 1979 survey Bouis and Haddad make a strong case of upward bias in calorie-income elasticities estimated by standard econometric techniques If the evidence supporting a low or negative wheat income elasticity is correct then it has strategic implications for Pakistan in the post-Green Revolution period With growth in wheat production slowing and a continued rapid population growth Pakistan is likely to face renewed pressure on wheat supplies and an increasing need for supplemental wheat imports In contrast to earlier periods however the
18
impact of rising incomes will probably not be an important factor in Pakistans wheat economy In addition increasing urbanization is likely to dampen further the consumer demand for wheat
19
8 CONCLUSION
Pakistans food economy has gone through three distinct phases since the 1960s During the Green Revolution expansion government utilized the additional wheat supplies to reduce domestic shortages and simultaneously promote both consumption expansion and national selfshysufficiency Despite rapid increases in prices for key commodities such as meat milk and edible oil the overall real food price index remained stable reflecting the influence of wheat and rice policy The first half of the 1970s witnessed a reversal of some of these gains The expansion of wheat and rice production slowed marKedly The general absence of new technology for other crops combined with poor weather and politically motivated interventions in agricultural markets led to economic stagnation in the face of rapid population growth As prices for most food c)mmodities increased government maintained stable wheat prices through imports Near the end of the period massive imports of vegetable oil were commenced
A period of extended economic recovery began in 1977 Demand forces were accommodated by further government promotion of vegetable oil imports thus driving down the real and relative price of cooking oil Increased consumption of cooking oil accounted for more than 100 percent of increase in per capita calorie intake during this period Despite renewed growth of wheat production particularly in rain-fed areas and in areas with new irrigation water per capita consumption of wheat declined modestly apparently due to already high levels of flour consumption and low income elasticities of demand Finally diet diversification during this period was promoted further by rapidly increasing poultry production with falling real consumer prices and by increasing supplies of fluid milk which accommodated the robust demand at stable prices The expanded fluid milk stipply resulted from consumer substitution of cheap imported vegetable oil for the traditional butterfat based cooking oil
Pakistans food economy is entering a new Post-Green Revolution phase Continued pressure on domestic wheat supplies will come from rapid population growth but further rises in per capita income will generate only a small and possibly even a negative demand response Increasing urbanization of the Pakistan population may further dampen wheat demand expansion (Goldman 1992) Per capita demand for edible oil particularly vegetable oil will also grow less rapidly in the 1990s since the desi ghee substitution phase is virtually complete (see Goldman and Hall 1990) Although demand for milk is likely to continue expanding the supply generating interaction with vegetable ghee imports has largely run its course Nevertheless it is likely that demand may continue to be accommodated by domestic supply Hall has shown that during the 1980s an important change in Pakistans bovine herd structure occurred resulting in a larger share of milk producing females
20
BIBLIOGRAPHY
Ahmad Etisham and Stephen Ludlow 1990 Aggregate and Regional Demand Response Patterns in Pakistan The London School of Economics
Alderman Harold 1987 Estimates of Consumer Price Response in Pakistan Using Market Prices as Data International Food Policy Research Institute
Alderman Harold 1988 The Twilight of Flour Rationing in 2Iakistan Food Policy (August)
Alderman Harold M G Chaudhry and M Garcia 1987 Household Food Security in Pakistan with Reference to the Ration Shop System Washington DC International Food Policy Research Institute
Amjad Rashid 1986 Impact of Workers Remittances from the Middle East on Pakistans Economy Some Selected Issues The PakistanDevelopment Review (Winter)
Bouis Howarth 1991 A FoodDemand System Based on Demand CharacteristicsIf there is Curvaturein the Slutsky Matrix What Do the Curves Look Like and Why Washington DC International Food Policy Research Institute
Bouis Howarth and L Haddad 1991 Are Estimates of Calorie-IncomeElasticitiesToo High Washington DC International Food Policy Research Institute
Dorosh Paul and A Vald6s 1990 Effects ofExchange Rate and Trade Policieson Agriculture in Pakistan International Food Policy Research Institute Research Report No 84 Washington DC International Food Policy Research Institute
Ender Gary A Wasay and A Maniood 1991 Wheat Price Policies in PakistanShould There Be a Subsidy Agricultural Policy Analysis Project Phase II (APAP II) Collaborative Research Report No 333 Washington DC Abt Associates Inc
Goldman Richard 1992 Demand Management of Food Systems in Asian and Near Eastern Countriesa Synthesis draft Agricultural Policy Analysis Project Phase II (APAP II) Collaborative Reseach Report No 340 Washington DC Abt Associates Inc
Goldman Richard and M tHall 1990 Pakistan Edible Oils Study Agricultural Policy Analysis Project Phase II (APAP II) Collaborative Research Report No 324 Washington DC Abt Associates Inc
Gotsch Carl H 1975 The Green Revolution and the Economics of PunjabAgriculture Food Research Institute Studies No 1
21
Government of Pakistan Economic Survey 1986-87
1988 Report of the National Commission on Agriculture
1979 Household Income and Expenditure Survey 1979
1984-1985 Household Income and Expenditure Survey 1984-85
Hall Malcolm 1992 Pakistan Animal Feedstuff Policy Study draft Agricultural Policy Analysis Project Phase I (APAP II) Collaborative Research Report No 337 Washington DC Abt Assoiates Inc
Hamid Naved I Nabi and A Nasim 1990 Trade Exchange Rate andAgriculturalPricing Policiesin Pakistan World Bank Comparative Studies Washington DC World Bank
Hamid Naved T C Pinckney S Gnaegy and A Vald6s 1990 The Wheat Economy of PakistanSetting and Prospects
Lodhi Kamal 1988 The Pakistan Sugar Industry An Economic and Policy Analysis Pakistan Economic Analysis Network Project
Qureshi Sarfraz Khan 1985 Some Aspects of Agricultural Price and Taxation Policies in Pakistan Pakistan Institute of Development Economics
22
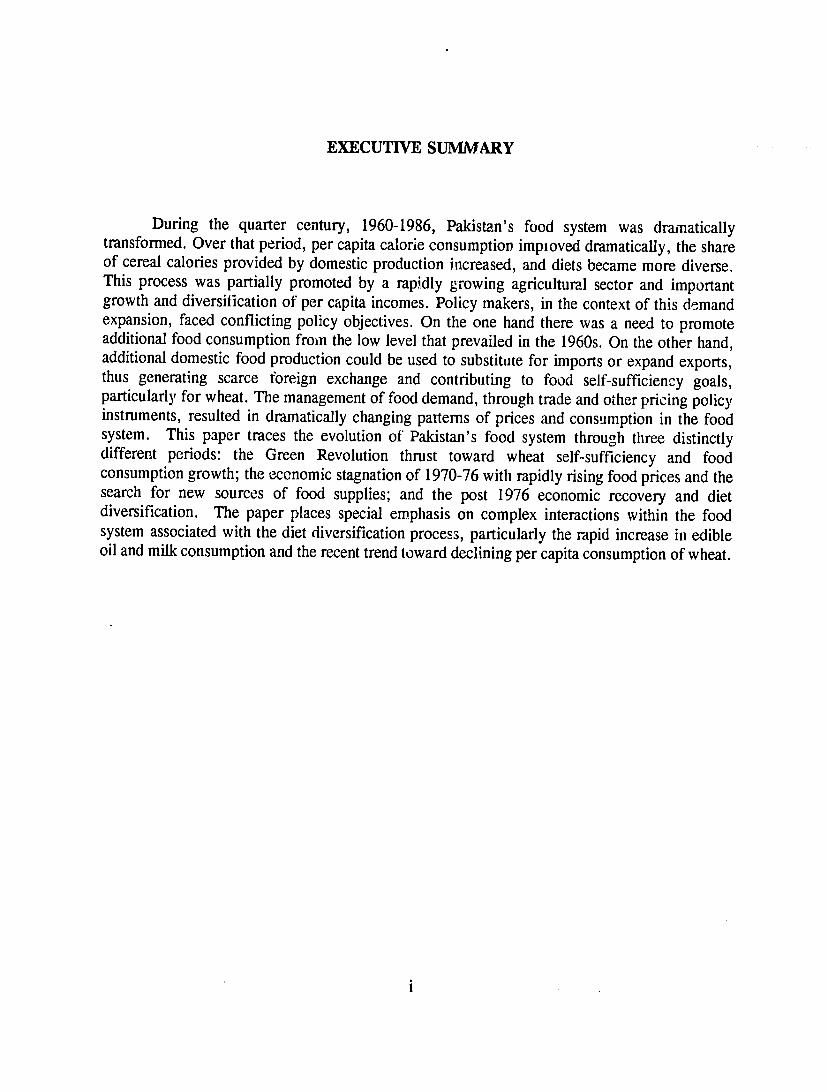
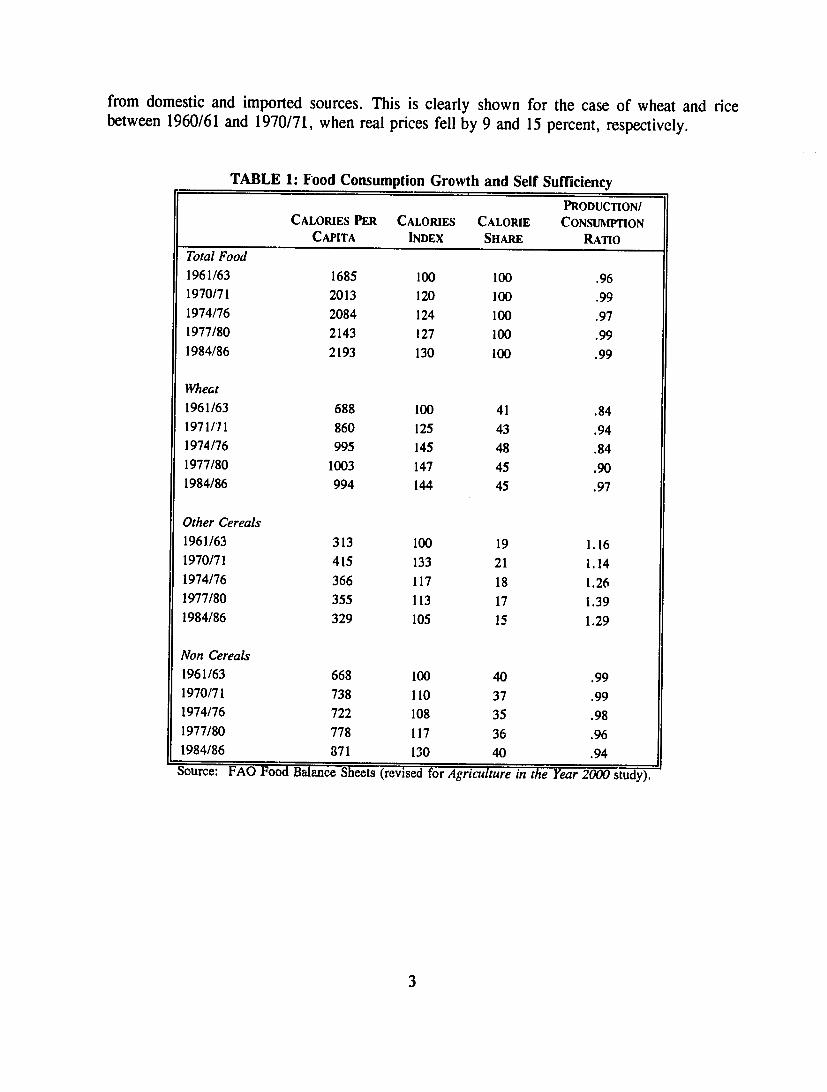
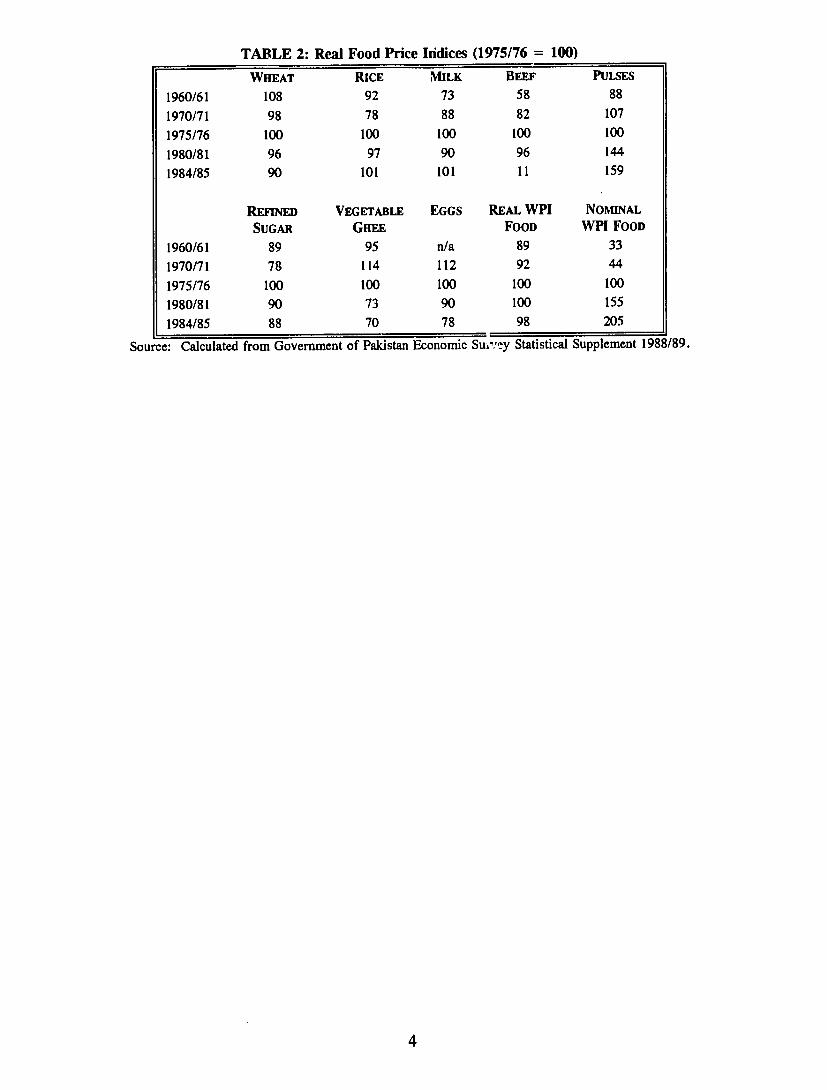
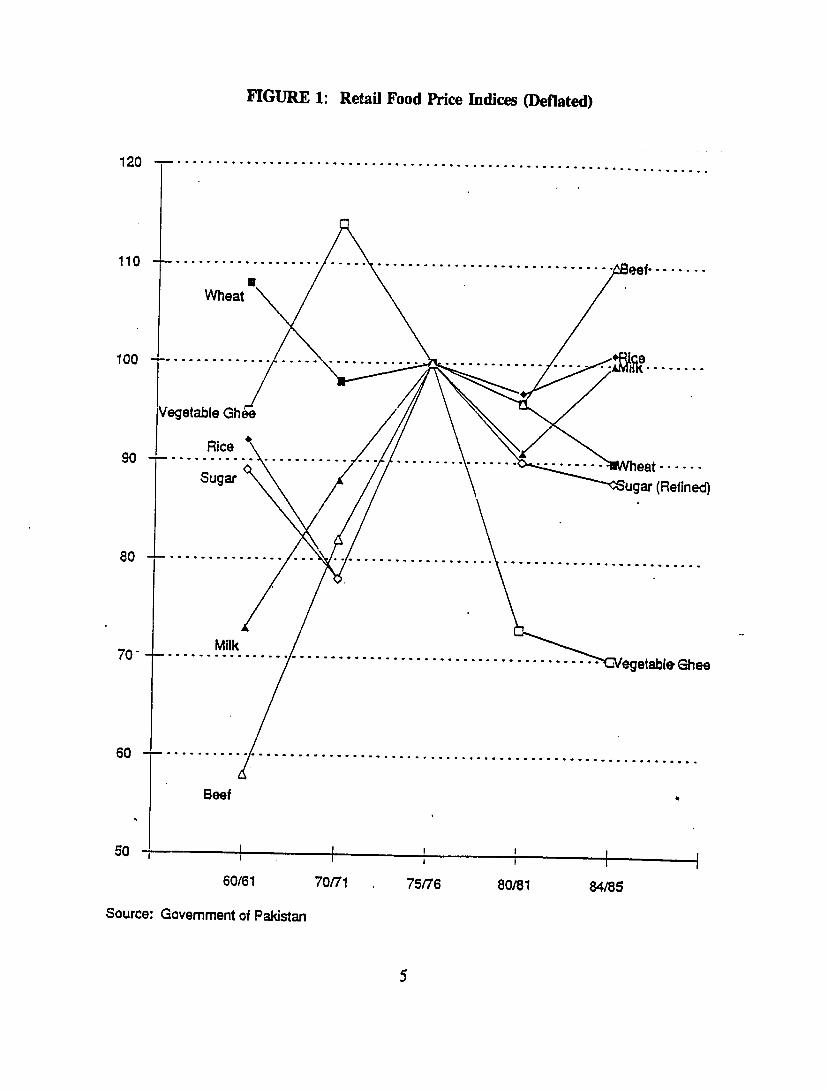
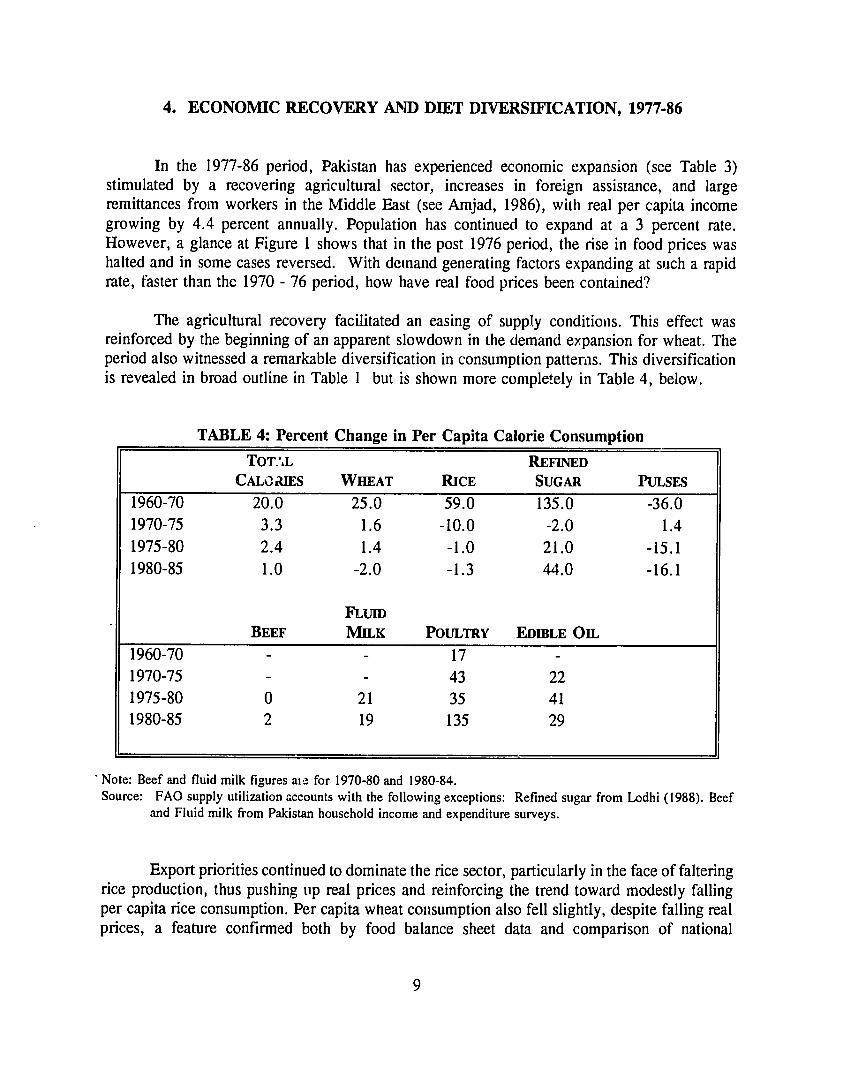
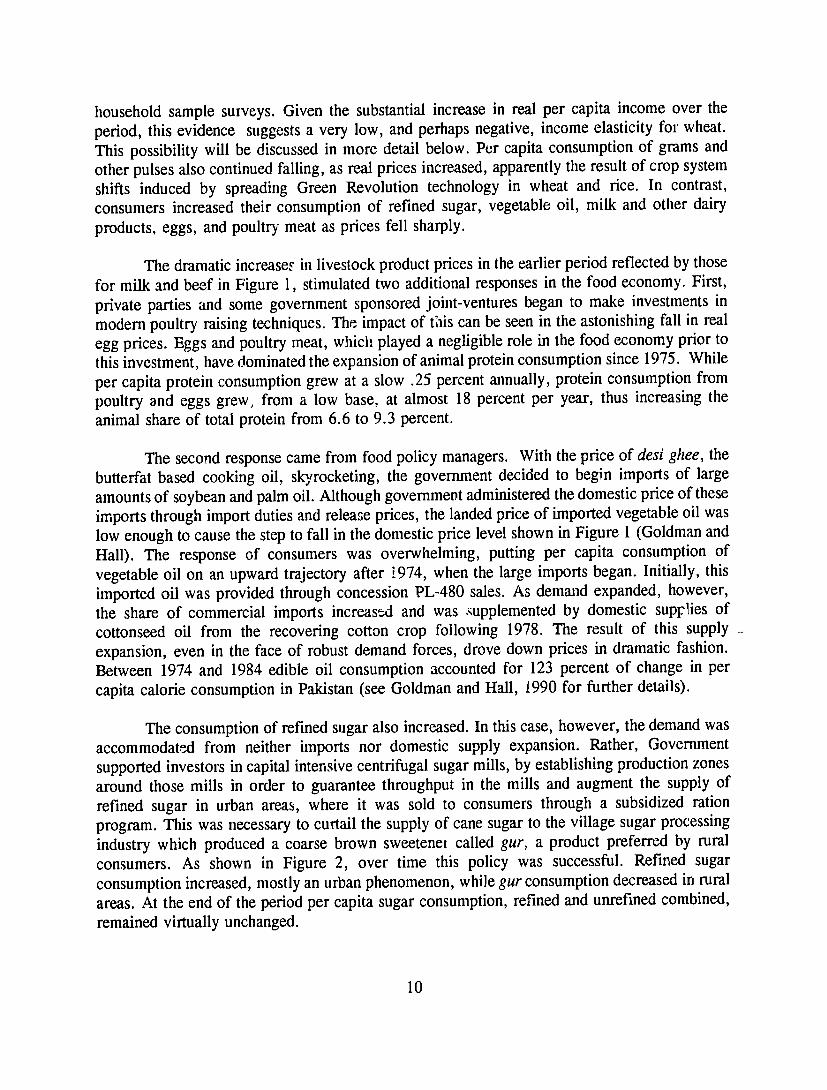
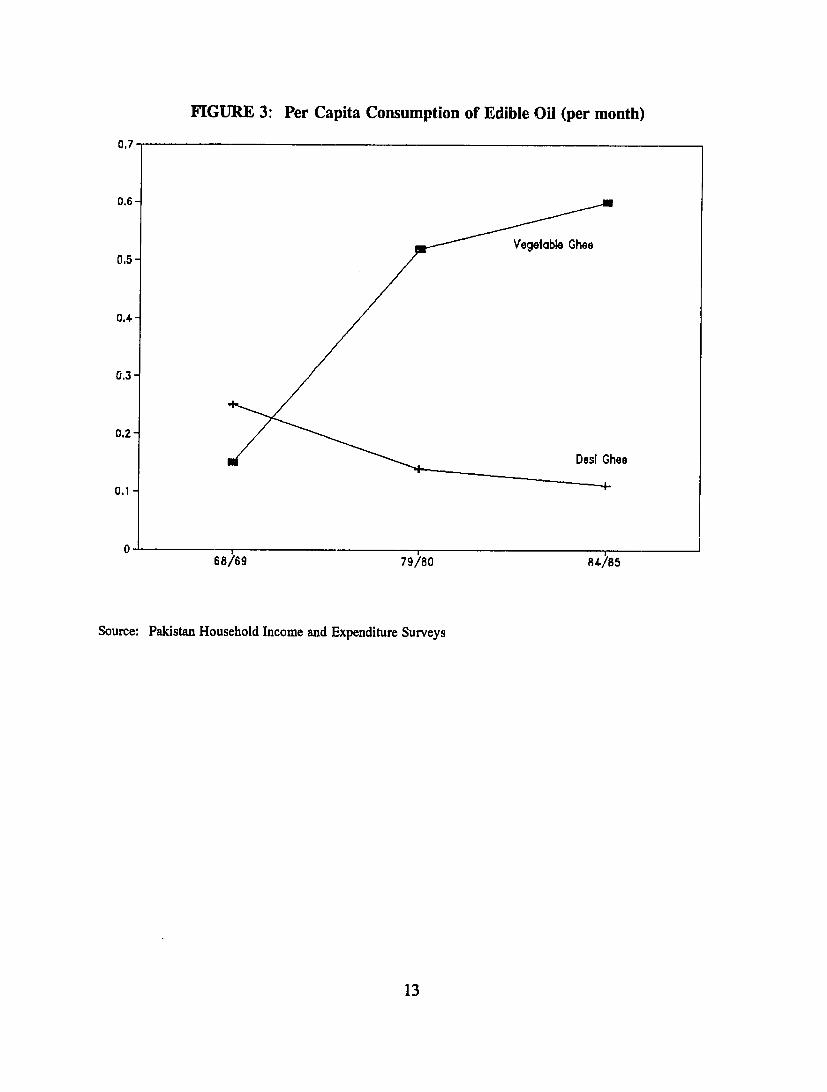
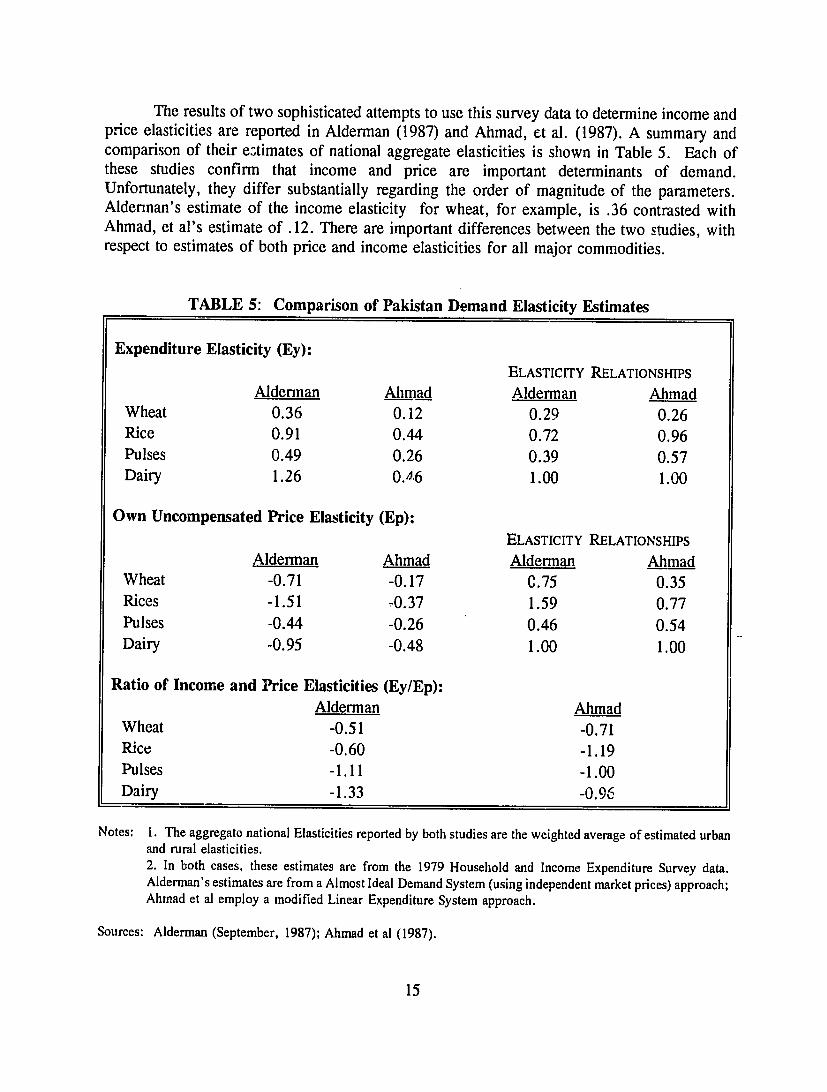
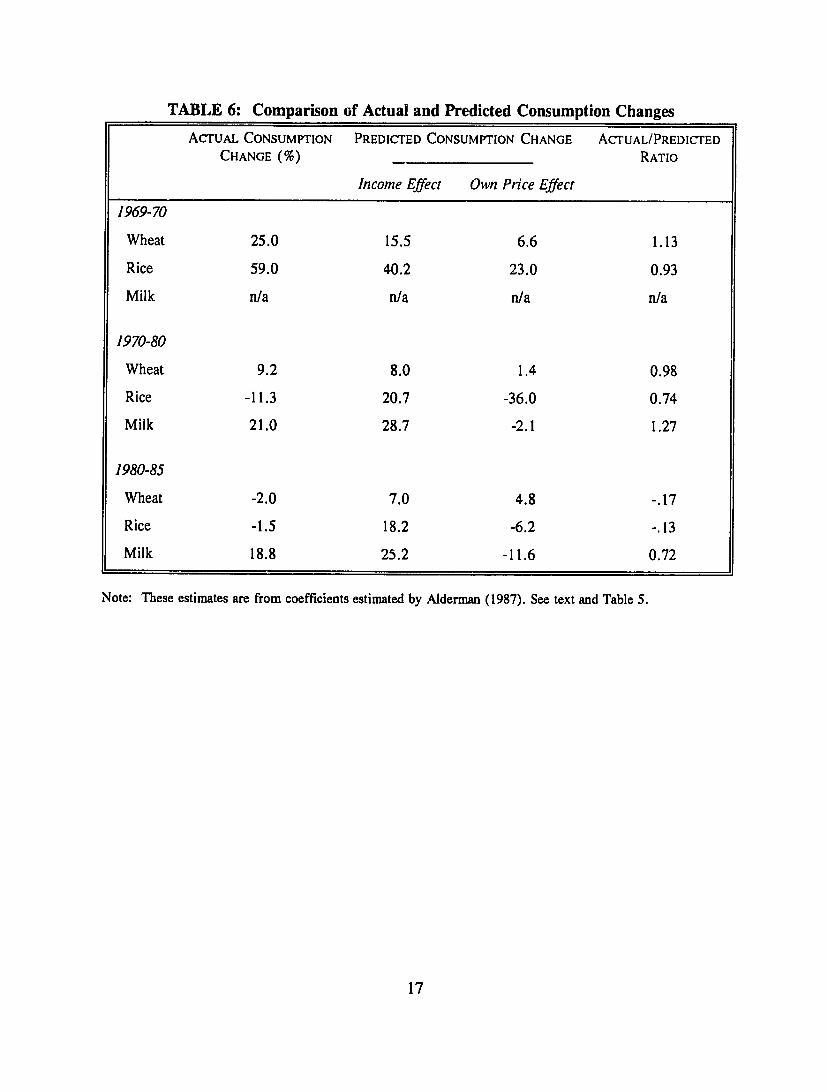
Related Documents


