CHAPTER 3 Agricultural Growth Introduction Maharashtra, as compared to the other states of India, is one of the top economic performers with respect to per capita income. While the All-India per capita income was Rs. 10,254 (2000-01) at 1993-94 prices, the corresponding figure for Maharashtra was Rs. 15,172, i.e., about 1.5 times that of All– India. In 1999-2000, Punjab had the highest per capita income, which was slightly higher (2 per cent) than that of Maharashtra. The relatively high per capita income in the state, however, conceals the enormous urban-rural contrast and the regional disparities in per capita income. This gets reflected from the fact that in 2000-01, the per capita district domestic product for Mumbai was Rs. 31,779 (1993-94 prices) i.e. exactly double the state average. Only six districts, three in the Konkan region (Mumbai, Thane and Raigad), in addition to Pune, Kolhapur and Nagpur, have per capita income above the state average. The remaining districts have per capita income below the state average. Thus, about 82 per cent of the districts in the state have per capita income not only below the state average but also below the national average and it is in these districts, that agriculture is the main economic activity. Agriculture, thus, emerges as a key sector in the state, especially with respect to workforce. While the same is true for the country, there do exist differences in the performance of Maharashtra’s agricultural sector in comparison to that of India. Therefore, in this chapter, an attempt has been made to study the progress of the agricultural sector in Maharashtra, the constraints that jeopardise its growth and the strategies to accelerate its growth. Rapid growth in the agricultural sector, undoubtedly assumes importance, as growth in this sector will in turn, stimulate growth in other sectors. Status of Agricultural Sector in Maharashtra In this section, we have observed the status of the agricultural sector in the state and compared it with all India status. Sectoral Contribution to SDP The shares of the different sectors in SDP/ NDP are undergoing major changes over the years (Table 3.1) and the contribution of the primary sector (agriculture and allied services) continued to decline over the decades at the All-India level as well as in Maharashtra. Taking into consideration the three decades (Table 3.1), the contribution of this sector was highest for All-India in 1980-81, but declined to 26 per cent in 2000-01. In Maharashtra, the contribution of the primary sector to SDP was much lower and declined to 14 per cent in 2000-01, while that of the tertiary sector rapidly increased to 52 per cent. At the All-India level also, the tertiary sector played the major role in terms of contribution to NDP. Table 3.1: Sector-wise Share of Income in SDP/NDP in per cent Maharashtra India Sector 1980 - 81 1990 -91 2000 -01 1980 -81 1990 -91 2000 –01 Primary 28 21.4 14.2 41.2 35 26 Secondary 35 36.6 33.5 22.9 25 26 Tertiary 36.8 42 52.3 35.6 40 48 Source: Computed from Economic Survey of Maharashtra (Various issues) Share of Agriculture in Workforce While agriculture’s contribution to income rapidly declined, the workforce continued to perpetuate in this sector, indicating limited employment opportunities in other sectors (Table 3.2). Table 3.2: Share of Workforce in Agriculture (%) Maharashtra India Year Culti- vators Agri. Lab. Total Culti- vators Agri. Lab. Total 1981 35 26.6 61.6 41 25 66 1991 32.8 26.8 59.6 38 26 64 2001 28.5 26.8 55.3 32 27 59 Source: Census of India A comparison of the state with the national figures show that at the All- India level, 59 per cent of workforce (2000-01) is employed in agriculture, while the corresponding figure for Maharashtra is 55

Welcome message from author
This document is posted to help you gain knowledge. Please leave a comment to let me know what you think about it! Share it to your friends and learn new things together.
Transcript

CHAPTER 3
Agricultural Growth
Introduction Maharashtra, as compared to the other states of India, is one of the top economic performers with respect to per capita income. While the All-India per capita income was Rs. 10,254 (2000-01) at 1993-94 prices, the corresponding figure for Maharashtra was Rs. 15,172, i.e., about 1.5 times that of All–India. In 1999-2000, Punjab had the highest per capita income, which was slightly higher (2 per cent) than that of Maharashtra.
The relatively high per capita income in the state, however, conceals the enormous urban-rural contrast and the regional disparities in per capita income. This gets reflected from the fact that in 2000-01, the per capita district domestic product for Mumbai was Rs. 31,779 (1993-94 prices) i.e. exactly double the state average. Only six districts, three in the Konkan region (Mumbai, Thane and Raigad), in addition to Pune, Kolhapur and Nagpur, have per capita income above the state average. The remaining districts have per capita income below the state average. Thus, about 82 per cent of the districts in the state have per capita income not only below the state average but also below the national average and it is in these districts, that agriculture is the main economic activity. Agriculture, thus, emerges as a key sector in the state, especially with respect to workforce.
While the same is true for the country, there do exist differences in the performance of Maharashtra’s agricultural sector in comparison to that of India. Therefore, in this chapter, an attempt has been made to study the progress of the agricultural sector in Maharashtra, the constraints that jeopardise its growth and the strategies to accelerate its growth. Rapid growth in the agricultural sector, undoubtedly assumes importance, as growth in this sector will in turn, stimulate growth in other sectors.
Status of Agricultural Sector in Maharashtra
In this section, we have observed the status of the agricultural sector in the state and compared it with all India status.
Sectoral Contribution to SDP The shares of the different sectors in SDP/ NDP are undergoing major changes over the years (Table 3.1) and the contribution of the primary sector (agriculture and allied services) continued to decline over the decades at the All-India level as well as in Maharashtra. Taking into consideration the three decades (Table 3.1), the contribution of this sector was highest for All-India in 1980-81, but declined to 26 per cent in 2000-01. In Maharashtra, the contribution of the primary sector to SDP was much lower and declined to 14 per cent in 2000-01, while that of the tertiary sector rapidly increased to 52 per cent. At the All-India level also, the tertiary sector played the major role in terms of contribution to NDP.
Table 3.1: Sector-wise Share of Income in SDP/NDP in per cent
Maharashtra India Sector 1980 -81
1990 -91
2000 -01
1980 -81
1990 -91
2000 –01
Primary 28 21.4 14.2 41.2 35 26 Secondary 35 36.6 33.5 22.9 25 26 Tertiary 36.8 42 52.3 35.6 40 48
Source: Computed from Economic Survey of Maharashtra (Various issues)
Share of Agriculture in Workforce While agriculture’s contribution to income rapidly declined, the workforce continued to perpetuate in this sector, indicating limited employment opportunities in other sectors (Table 3.2).
Table 3.2: Share of Workforce in Agriculture (%) Maharashtra India Year
Culti- vators
Agri. Lab.
Total Culti- vators
Agri. Lab.
Total
1981 35 26.6 61.6 41 25 66 1991 32.8 26.8 59.6 38 26 64 2001 28.5 26.8 55.3 32 27 59
Source: Census of India
A comparison of the state with the national figures show that at the All- India level, 59 per cent of workforce (2000-01) is employed in agriculture, while the corresponding figure for Maharashtra is 55

Maharashtra State Development Report 58
per cent. Although the share of workers in agriculture is lower in Maharashtra as compared to India, a district-wise analysis presents a different picture. First of all, if we exclude workforce only in Mumbai, which is the commercial capital of India, from total workforce in the state, the share of workers in the agricultural sector increases by 7 to 8 per cent for the years that the data is presented. Further, in 2000-01, almost 20 out of 34 districts had more than 70 per cent of their workforce in the agricultural sector while 29 districts had more than 60 per cent workforce in agriculture. These percentages are more than those of the national average. This indicates that Maharashtra’s economy is predominantly agrarian and barring a few districts, (Mumbai, Thane, Nagpur and Pune), a major portion of Maharashtra’s workforce is still dependent on agriculture as its primary source of livelihood.
Further, regarding composition of workforce, it can be observed that both at the state as well as national level, the share of cultivators in the total workforce is declining, while that of agricultural labourers is more or less the same. Bhalla (2000), using the National Sample Survey data for 1993-94, observed that among different groups of rural workers, the incidence of poverty (headcount ratio) is highest among agricultural labourers (57 per cent).
Growth in SDP/NDP by sectors Since agriculture is the mainstay of Maharashtra’s economy, it is necessary to observe how this sector is growing and how it compares with other sectors in terms of growth rates. It can be observed from Table 3.3 that for both periods as well as entire period the growth rate of SDP of Maharashtra grew faster than the All-India NDP average.
Table 3.3: Sector-wise Growth Rates in SDP/NDP (constant prices) (per cent Per annum)
1980-81 to 1989-90
1990-91 to 2000-01
1980-81 to 2000-01
Sector
Maha. All- India
Maha. All- India
Maha
All- India
Agriculture 2.23 3.25* 3.33* 2.96* 3.98* 3.27*Allied 1.93 0.97* 0.73* 3.44* 2.05 2.60*Primary 2.19 3.00* 3.08* 3.03* 3.77* 3.18*Secondary 6.2* 6.4* 6.01* 6.19* 6.72* 6.25*Tertiary 6.6* 6.7* 8.5* 8.03* 8.43* 7.15*SDP/NDP 5.33* 5.03* 6.67* 6.04* 6.80* 5.60*
Note: * significant at 1 per cent; Maha-Maharashtra. Source: Computed from data in Economic Survey
An analysis of the sector-wise comparison, however, indicated that Maharashtra’s performance was not always better than that of the national level. During 1980-81 to 1989-90, the growth rate in the primary sector in Maharashtra was only 2.19 per cent per annum and it was not statistically significant while All-India registered a statistically significant growth rate of 3 per cent per annum. Perhaps, this relatively lower growth rate could be partly explained by the state being affected by a severe drought in 1986-87. The growth rate during this period showed a better performance of 2.7 per cent per annum, and is also statistically significant if we exclude the drought year.
Agriculture in Maharashtra is heavily dependent on monsoons as barely 15 per cent of the gross cropped area is irrigated. This is much below and even less than half the national average where 38.7 per cent of gross cropped area is irrigated.
The secondary and tertiary sector for the state and also at the national level showed better performance compared to primary sector. Thus, the macro economic performance of the state as well as for the country as a whole, in different periods showed that growth rates were lowest in the primary sector. However, as noted earlier, a major portion of the workforce is still dependent upon this sector for their subsistence.
Land Reforms in Maharashtra
The theme of land reforms assumed importance in the post independence period. Under the Indian Constitution, land reform is a state subject and all states began implementing their own land reform laws. The state of Maharashtra followed suit and the abolition of intermediary tenures began, soon after independence, with the abolition of khoti tenure in coastal districts, Malguzari and izardar tenures in the Vidarbha districts, jagirdari tenure in the Marathwada districts, and came to an end with the abolition of the Revenue Patel Watans in Western Maharashtra and Patwari Watans in the former Hyderabad, in 1965. The abolition of these tenures resulted in the intermediaries becoming revenue-paying occupants of only such lands as were under their personal cultivation while on the remaining land the tenants secured occupancy rights.
The Tenancy Acts amended in mid fifties, required that in Western Maharashtra and Vidarbha

Agricultural Growth 59
regions all recorded tenancy arrangements must be terminated. Landlords were permitted to retain land under certain circumstances and tenants were also free to voluntarily surrender land to their landlords. Finally, with effect from 1st April 1957, the “ tillers day”, the tenants in possession of the leased land were declared as owners of land, subject to payment of price. In Marathwada, the law did not require the termination of all existing tenancies. Tenants were made owners of only a part of the land and the remaining was to continue under their tenancy as long as they did not surrender it. The latest information (Economic Survey of Maharashtra, 2001-02) reveals that right of ownership was conferred on about 1.4 million tenants with respect to 1.7 million hectares of land till March 2001.
The Tenancy Act in Maharashtra also provides that a new tenancy can be of only one year’s duration and at the end of one year the tenant will be entitled to own (on payment of a prescribed price) so much of the leased land as the Act entitles him to, provided he applies to the Agricultural Lands Tribunal within one year of the commencement of tenancy. The Land Ceiling Act, addressing the third aspect of Land reforms namely ceiling on land holdings, came into force in all parts of the state in 1961. By the end of 1971, only about 4,600 landholders were found to hold land in excess of the ceiling. Barely, 0.1 million hectares had been declared surplus with these landholders. The ceilings prescribed in the 1961 Act were revised and lowered from 2nd October, 1975. Under this Act, by December 2001, 0.3 million hectares of land was declared surplus and 0.2 million hectares of land had been allotted to 0.14 million landless persons and 75 cooperative farming societies (Economic Survey of Maharashtra, 2001-02).
Every landholder in the state has to keep proper documents about the record of his land and keep these updated. The state government also started the scheme, since May 1999, for distribution of up-to-date village form No. 7/12 to the landholders, which is now also available by post.
The trend in structure of operational holdings (Table 3.4) indicates that from 1970-71 to 1995-96, the number of operational holdings increased by 2.2 times but the operated area over the years has not shown any remarkable change but rather disturbingly, shows a declining trend. The
beneficiaries of the structural distribution were the marginal and small farmers. Their share in terms of number and area operated showed an increasing trend since 1970-71. In case of marginal farmers, their number as well as area operated increased by about 3.5 times from the period 1970-71 to 1995-96. The same was observed in case of small farmers. This reveals the increasing marginalisation of farmers in Maharashtra as together 74.3 per cent of farmers belonged to marginal and small category. Obviously, the large farmers lost their share and area operated by them which was 40 per cent in 1970-71 steeply declined to 9 per cent in 1995-96. Another important feature relates to the average size of holding. The average size, which was 4.28 hectares in 1970-71, started reducing and the average size has come down to 1.87 hectares in 1995-96.
Land Use and Cropping Pattern in Maharashtra The state of Maharashtra located in the western coast of India has a geographical area of 30.7 million hectares, which is second largest in the country, next to the state of Rajasthan.
Land Utilisation Pattern The land utilisation pattern displayed minimal changes since 1990-91 and its composition in 2000-01 is shown in figure 3.1. While net sown area (NSA) was 60 per cent of the geographical area (18.56 million hectares) in 1990-91, it declined to 57 per cent (17.63 million hectares) in 2000-01. The share of fallow land increased from 6.4 per cent to 8 per cent during the same period.
Figure 3.1: Land Utilisation Pattern
Other uncultivable land
8%
land not available for cultivation
10%Forest17%
Fallow8%
Net sown area57%
Source: Economic Survey, GoM, 2000-01

Maharashtra State Development Report 60
Cropping Pattern in Maharashtra Agriculture in Maharashtra continues to be dominated by foodgrains (Figure 3.2). While 70 per cent of the gross cropped area (GCA) was under foodgrains in 1980-81, this share declined to 60 per cent in 2000-01. Among foodgrains, the decline was with respect to cereals and the area under jowar, the main cereal in Maharashtra, declined by 23 per cent during this period. The area under pulses, however, showed a minor increase.
The notable feature of Maharashtra’s agriculture is that the cropping pattern is shifting towards commercial crops. The share of oilseeds increased from 9 per cent in 1980-81 to 12 per cent in the later decades. Cotton also showed an increase and its share went up from 12.4 per cent in 1990-91 to 14.3 per cent in 2000-01. Area under sugarcane also gradually moved up from 0.3 million hectares in TE
1980-81 to 0.6 million hectares in 2000-01. The increase in area was more marked in case of fruits and vegetables and increased rapidly from 0.27 million hectares in 1980-81 to 1.26 million hectares in 2000-01. It may be mentioned here and will be elaborated later that government policies have been instrumental in inducing cropping pattern changes.
The Technology Mission on Oilseeds launched in 1986 coupled with price support encouraged the shift in area towards oilseeds. Assured prices by cooperatives for sugarcane and guaranteed price for cotton through the government’s Monopoly Procurement Scheme encouraged the production of these crops while the Horticulture Development Programme linked with the Maharashtra Employment Guarantee scheme accelerated the expansion of area under fruits and vegetables. After observing the share of various crops in the cropping
Figure 3.2: Cropping Pattern in Maharashtra
(TE Ending 1980-81)
Other 5%
Total oil seed9%
Cotton13%
Total Cereals
56%Sugarcane2%
Fruits & Veg.1%
Total Pulses14%
c
(TE Ending 1990-91)
Total Pulses15%
Sugarcane2%
Fruits & Veg.2%
Other 5%
Total oil seed12%
Cotton12%
Total Cereals
52%
(TE Ending 2000-2001)
Total Pulses16%
Sugarcane3%
Fruits & Veg.4%
Total Cereals
45%
Cotton14%
Other 6%
Total oil seed12%
Source: Season and Crop Reports, various issues (GoM)
Table 3.4: Distribution of Number and Area of Operational Holdings in Maharashtra (Number in million and Area in million hectares)
Number of operational holdings Area of operational holdings Size Group 1970-71 1980-81 1990-91 1995-96 1970-71 1980-81 1990-91 1995-96
Marginal (Upto 1 ha)
1.24 (25.05)
1.92 (28.07)
3.27 (34.58)
4.26 (40.00)
0.57 (2.72)
0.93 (4.55)
1.6 (7.73)
2.0 (10.5)
Small (1 to 2 ha)
0.87 (17.60)
1.54 (22.44)
2.7 (28.80)
3.1 (29.80)
1.28 (6.06)
2.30 (10.93)
3.98 (19.03)
4.6 (23.2)
Semi-medium (2 to 4 ha)
1.08 (21.82)
1.68 (24.57)
2.1 (22.45)
2.1 (20.20)
3.1 (14.78)
4.80 (22.55)
5.88 (28.10)
5.8 (29.5)
Medium (4 to 10 ha)
1.22 (24.65)
1.39 (20.29)
1.17 (12.37)
0.94 (8.80)
7.7 (36.44).
8.40 (39.55)
6.85 (32.76)
5.43 (27.3)
Large (Above 10 ha)
0.51 (10.38)
0.32 (4.63)
0.17 (1.80)
0.12 (1.20)
8.47 (39.99)
4.78 (22.41)
2.6 (12.37)
1.87 (9.45)
Total 4.95 (100)
6.86 (100)
9.47 (100)
10.65 (100)
21.20 (100)
21.36 (100)
20.92 (100)
19.87 (100)
Average size of holding (hec)
- - - - 4.28 3.11 2.2 1.87
Note: Figures for 1995-96 are provisional; Figures in brackets are percentage to total. Source: Agricultural Census, GoM

Agricultural Growth 61
pattern of Maharashtra, in Table 3.5 we present the growth rates of area under the important crops. The growth rates show that over the entire period (1980-81 to 2000-01), food grains registered negative growth rate whereas in the case of all commercial crops viz. sugarcane, cotton oilseeds, fruits and vegetables, the growth rates were statistically significant. In the case of oilseeds, the growth rate was more marked in the first period whereas in the case of sugarcane and cotton the growth rates were higher in the second period.
Table 3.5: Growth Rates by Area of Major Crops in Maharashtra (Per cent per annum) Crop 1980-81 to
1989-90 1990-91 to 2000-01
1980-81 to 2000-01
Rice 0.58 -0.65* 0.17 Wheat -2.3* 3.5** -0.76 Bajra 2.4* -0.8 0.5** Jowar -0.37 -1.69** -1.4* Total Cereals 0.07 -0.67 -0.69* Total Pulses 2.7* 0.91 1.69* Total Food grains -0.27 0.61* -0.15 Sugarcane 1.7** 2.4** 3.8* Cotton 0.35 2.6* 1.14* Oilseeds 6.7* 0.6 2.7* Fruits & Vegetables 6.2* 8.0* 6.5* Note: * significant at 1%, ** significant at 5%
Finally, we look at the commodity composition of agricultural SDP (Figure 3.3). It has been observed that in 2000-2001, although the share of food grains in total area was 60 per cent, its contribution to state domestic product was only 25.5 per cent.
Figure 3.3: Commodity Composition (per cent) of Agricultural State Domestic Product -2000-01 (1993-94 prices)
Others13%
Paddy6%
Wheat3%
Jower7%
Other Cereals3%
Pulses8%
Cotton8%
Fruits and Vegetables
23%
Sugarcane19%
Oil seeds10%
Source: Directorate of Economic and Statistics
This can partly be explained by the fact that Maharashtra’s food grain economy is dominated by low value coarse cereals such as jowar, which accounted for 52 per cent area under cereals and 23 per cent of GCA in 2000-01. Sugarcane, which barely constitutes 3 per cent of GCA, contributed to 19.3 per cent of state domestic product. Fruits and vegetables, which account for only 5.6 percent of the GCA, accounted for as much as 24 per cent of agricultural state domestic product.
Production and Productivity of Crops It was observed earlier that Maharashtra’s cropping pattern is dominated by foodgrains, which constitute 60 per cent of the area under cultivation. However, Maharashtra contributes only 5.8 per cent to the foodgrain production of the country. This is mainly because jowar is the dominant cereal cultivated in the state and this crop is characterised by very low yield. The yield of rabi jowar is particularly very low and was 583 kg per hectare in TE 1996-97, while it constituted 62 per cent of the area under jowar during the same period. Rabi jowar is almost entirely unirrigated and this acts as a constraint on the use of high yielding varieties for rabi jowar. These factors also explain the fact that the yield of food grains in Maharashtra is about half that of the national level.
With respect to non-foodgrain crops also, with the sole exception of sugarcane, Maharashtra has lower yields than the national average. While 36 per cent of the country’s area under cotton is in Maharashtra, the state contributes only 21.6 per cent to production (TE 1999-2000), and the yield is 40 per cent less than the all India level. This is again explained by lack of irrigation facilities as only 4 per cent area under cotton is irrigated. The growth rate of production (Table 3.6) and yield (Table 3.7), of major crops in Maharashtra indicates that food grains registered a negative growth rate in production, during the period 1990-91 to 2000-01 mainly due to decline in growth rate of area and yield of jowar.
The area under jowar declined by 20 per cent from 1990-91 to 2000-01. This also explains the negative growth rate of production of cereals. Pulses, however, performed well, especially during 1980-81 to 1989-90 in terms of both production and yield. With respect to non-foodgrains, cotton and

Maharashtra State Development Report 62
oilseeds showed an encouraging performance during the entire period as well as sub-periods. The Technology Mission on Oilseeds and the introduction of extra-long staple high yielding varieties of cotton led to an increase in yield of oilseeds and cotton respectively. While production of sugarcane showed a statistically significant growth rate during the entire period (1980-81 to 2000-01), this was mainly achieved due to increase in area. The growth rate of yield of sugarcane, which is negative, is a disturbing feature especially because this crop is entirely irrigated. Pests often infest this crop, which lowers the yield.
Table 3.6: Growth Rate of Production of Major Crops in Maharashtra (per cent per annum)
Crop 1980-81 to 1989-90
1990-91 to 2000-01
1980-81 to 2000-01
Rice - 0.4 -0.13 0.7 Wheat -0.4 3.7 2.03* Jowar 1.4 -2.2 0.16 Bajra 4.4 0.55 4.6* Total Cereals 1.2 -0.5 1.1 Total Pulses 7.2* 3.2 3.9 Total foodgrains 1.9 -0.01 1.5* Total oilseeds 9.2* 4.3** 6.08* Cotton 3.3 3.8 4.2* Sugarcane 0.64 4.2* 3.6*
Note: * significant at 1 per cent; ** significant at 5 per cent
Table 3.7: Growth Rate of Yield of Major Crops in Maharashtra (per cent per annum)
Crop
1980-81 to 1989-90
1990-91 to 2000-01
1980-81 to 2000-01
Rice 1.5** -1.4 0.0 Wheat 2.3 1.5 2.7* Jowar 1.6 -0.4 1.6 Bajra 2.0 1.4 4.1* Total Cereals 1.1 0.39 -0.06 Total Pulses 4.6 2.3 2.3* Total foodgrains 1.3 0.48 1.6* Total oilseeds 1.6 4.2 3.1* Cotton 3.1 1.5 3.0* Sugarcane -1.4* 0.7 -0.58
Note: * significant at 1 per cent; ** significant at 5 per cent
Agricultural Inputs in Maharashtra
The major agricultural inputs besides water/irrigation are seeds, fertilisers, pesticides and machinery. The farmers can also treat agricultural extension service provided to the farmers as an
important input as it includes various activities and mechanisms for ensuring efficient use of inputs. Use of better quality inputs and efficient input use management and practices are extremely important for increasing the productivity of the given land.
Seed Maharashtra is one of the major seed-producing states in India contributing to around 40 per cent of the total seed production in the country. Out of the total seed distribution, the public sector and the private sector, each, contribute 50 per cent. Entry of private sector in seeds market is expanding. It can also be noted that with reforms, seed production on taluka seed farms is on decline and many seed farms have been converted into agri-polyclinics, which is a welcome change. In Maharashtra, the production of certified seeds increased from 0.14 million quintals in 1980-81 to 0.41 million quintals in 1998-99, thus registering a threefold increase in the last 20 years. As far as the research dimension is concerned, so far, 183 hybrid/HYV varieties of various crops have been released by the state. During mid 1980, the number of such varieties developed was just 47. The increase is particularly high for oilseeds and cotton along with the cereals.
For understanding the progress on the seed front, data on two indicators can be observed. These are - area under the HYVs and the Seed Replacement Ratio (SRR) of the crop. Table 3.8 shows that the data on the percent coverage under of HYV/hybrids relating to crops like jowar (kharif and rabi), wheat, cotton and paddy shows an increasing (though fluctuating) trend in the area under HYVs/hybrids. The latest figures show that the coverage is around 90 per cent for these crops. Over the period, area under HYVs and hybrids has been increasing at a very fast pace for jowar. There seems to be thus a scope for further increase. SRR which is the proportion of total (private + public) seed distribution to the total seed requirement and which indicates the rate at which the seeds get replaced via market is another important indicator. Thus, SRR is 100 per cent for the hybrids and lower for the traditional seeds, as the output cannot be used as seed in the next year in the case of the former as against the latter. Table 3.9 shows that at the state level, SRR of 100 per cent has been achieved only for the crops like hybrid jowar

Agricultural Growth 63
(kharif), hybrid bajra and hybrid cotton. SRR for the oilseed crops like sunflower and soybean is seen to be comparatively higher. Pulses and cereals (other than hybrid jowar and bajra) have lower SRR indicating lesser extent of seed marketisation. For almost all the crops except groundnut it is seen that the targets set for the 9th plan have been achieved and SRRs for the year 2001 are seen to be closer to the target for year 2003.
Table 3.8: Achievement under Intensive Cultivation in Maharashtra Category Wheat Paddy Jowar Cotton
Growth rates of area under HYVs 1980-2001 (%)
-0.52 2.35* 13.56* 35.87
Area under HYVs & Hybrids 2000-01 (%)
92 95 97 97
Note: 1. *= Significance at 5% level. 2. For Cotton, growth rate not calculated, as data is not available for adequate years, the figure indicates % change during 1992-93 to 2000-01. 3. For Jowar, area under HYV for kharif season and the growth rate is for rabi jowar only. Growth Rate for kharif jowar is insignificant Source: District-wise Agricultural Statistical Information of Maharashtra, Office of Commissioner of Agriculture, GoM, Pune
Table 3.9: Seed Replacement Rate Achieved in Maharashtra Crops 1985 1990 1995 2001 Target
fixed by GoM for 2003
Target fixed by GoI, 9th Plan
R. Jowar 4 4 5 11 11 10 Paddy 2 4 14 18 20 14 Wheat 11 19 29 25 26 20 G.nut 2 1 2 2 4 4 Sunfl. (K) 17 14 23 28 28 20 Sunfl. (R) 13 19 22 22 19 10 Soyabean 3 3 16 33 43 10
Source: Department of inputs and quality control, Office of Commissioner of Agriculture, GoM, Pune
Fertiliser and Pesticides Like seeds, the fertiliser consumption in Maharashtra has been rising continuously. It is one of the major fertiliser consuming states in India with the share of around 10 per cent in the total fertiliser consumption in India. Annually around 3.8-4.0 million tonnes of fertilisers are consumed in terms of material and 1.8 to 2.0 million tonnes in terms of nutrients-nitrogen, phosphate and potassium (N, P, K). In 1995, per hectare consumption was highest in Punjab (167kg/ha.). Comparatively, in Maharashtra,
it was around 65 kg (in 1995). However, it has increased from just 14 kg /ha in 1970-71 to currently around 75 kg/ ha thus registering a fivefold growth and a growth rate of 7.4 per cent per annum. As far as the level of NPK ratio is concerned, it was distorted from the normal level (4:2:1) to 8.1:2.3:1 due to the decontrol of phosphatic and potash fertilisers in 1992. It subsequently improved to 5.4:2.4:1, after the government introduced the Concessional Scheme of fertilisers to increase the consumption after 1992. With increasing area under horticultural and other high value export crops (which have significant nutrition requirement), fertiliser consumption might increase further.
However, it emerged out of the discussion with the government officials that there is still widespread ignorance among farmers about the appropriate application of fertilisers in terms of quantity and variety. Soil test based application of fertilisers and application of micronutrients has still not become a rule. Application of fertilisers is governed by their prices. Thus, need based application of fertilisers to avoid excess usage and wastage of fertilisers is the most important need today. At the regional level, in districts of Western Maharashtra, per hectare usage of fertilisers is found to be very high (as compared to other districts) and this has affected fertility of soil adversely. Similarly, among various crops grown in the state, sugarcane is the crop, which consumes very high quantity of fertilisers. It was reported that the per hectare consumption of fertilisers for this crop moved up from 226 kg per hectare in 1972-73 to 501 kg per hectare in 1990-91 (Sawant et al, 1999).
Bio-fertilisers are economical and pollution-free sources of plant nutrients. Under the integrated approach, implemented by the Government of India, balanced use of chemical fertilisers and bio-fertilisers / organic manure is suggested to maintain the soil health. The state hardly uses 1500 tonnes of these fertilisers as against the potential of 85000 tonnes. On the other hand, the state consumes around 4 million tonnes of the chemical fertilisers. The state has about 41 production units of bio-fertilisers with capacity of 5000-6000 tonnes (www.agri.mah.nic.in). There is a large scope for further increase.

Maharashtra State Development Report 64
In the case of pesticides, the consumption in Maharashtra has come down to 173 g/ha from 320 g/ha during VII plan due to integrated pest management (IPM). However, there is irrational distribution of pesticide use with maximum use on cotton (54 per cent) (GoI, 2003). The use of eco friendly IPM strategy has to be widespread.
Agricultural Machinery Agricultural implements and machinery help farmers in speeding up agricultural operations and in utilising the land and labour resources more productively. In the post-green revolution period therefore, their importance has been increasing (Table 3.10). As against the availability of 1.16 tractors per ha of NSA, in 1982-83, in 1996-97, 4.58 tractors were available. Importance of usage of electric pumpsets also can be noted. Usage of manually operated ploughs is clearly on decline.
Table 3.10: Agricultural Machinery in Maharashtra during 1982-83 to 1996-97
Absolute Number Implements/ Machinery 1982-83 2002-03
(provisional)
% Change per ha of NSA
Plough 2586922 2206438 -14.06 Four wheeled tractors
20704 103964 490
Electric Pumpsets used for irrigation
448632 966713 116.46
Source: GoM 1997, 2003
Agricultural Extension Extension services provided to the farmers assume a great significance as various schemes for improving agricultural performance get actually implemented through this service. This basically includes dissemination of scientific information to and training of farmers as well as implementation of various schemes. Agricultural department of the state plays a major role in providing this service. A change in the approach towards provision of these services is being noted as far as the state is concerned. Earlier, these services were provided by the three separate sections of the department viz. crop husbandry, horticulture and soil conservation. With the recent reforms carried out in the department, 'single window system' was adopted since 1998, under which machinery of the three sections were integrated with an intention to provide extension services to the farmers with a holistic approach. Another welcome change observed is a gradual shift from individual based
government subsidies towards community and private-public partnership based subsidies. Also, recently, a more flexible approach has been adopted by the central government as far as implementation of schemes and delegation of powers to the state government are concerned. Lastly, it is observed that there has been entry and gradual expansion of the private sector for providing extension services.
Discussion with various government officials revealed that a major weakness of the system today is the poor quality of the manpower with department that actually interacts with the farmers and also weakening of the university scientist and agricultural assistant link. Better utilisation of other inputs definitely rests on these aspects.
Investment in Agriculture Agricultural sector at the national level has been undergoing a disheartening trend of falling capital formation on government account. In contrast, the private investment’s stepping up has been observed over a period of time. For Maharashtra, it was found that the gross fixed capital formation in agriculture (GFCFA) at 1980-81 prices was increasing at the trend growth rate of 2.39 per cent per annum during 1980-81 to 1993-94 (Data for the later years could not be made available from the CSO). Though the share of public sector was 55.61 per cent (Gulati and Bathla, 2002), public sector investment was increasing only marginally and at a non-significant annual growth rate of 1.21 per cent while that of the private sector was 3.72 per cent. A similar picture emerges for per hectare investment in agriculture with per hectare public and private GFCFA growing at the rates of 1.3 per cent and 3.84 per cent respectively.
As far as the private sector investment is concerned, it was found that Maharashtra had achieved impressive growth in private fixed capital formation in agriculture (PFCFA). According to this study, PFCFA in Maharashtra was one of the highest in absolute terms in the country in 1981-82 (Rs.1669 million) and in 1991-92 (Rs.6592 million) thus, exhibiting a percent change of 294 per cent. Maharashtra also recorded higher percent change during this period in per hectare PFCFA (Chand, 2000).
Similarly, the composition of PFCFA has also been undergoing a change during the period from

Agricultural Growth 65
1981-82 to 1991-92. A few important points can be noted from Table 3.11 in this regard. Firstly, though the share of 'orchards and plantation' increased only marginally, in absolute terms, the rise in expenditure has been considerable i.e. more than 400 per cent. This probably indicates the growing importance of horticulture in the state. Secondly, the share of 'wells' has reduced and that of 'other irrigation sources' (such as tanks and water channels) has increased over the period by more than 150 per cent. In absolute terms, the expenditure on latter item has increased by around 1000 per cent. This possibly can be attributed to increasing expenditure by the farmers on construction and maintenance of water channels and micro irrigation systems such as drip and sprinklers, which are relatively costlier. Together, wells and other irrigation sources contribute more than 50 per cent of the total PFCFA in Maharashtra, which is higher than the all India level figure.
Table 3.11: Distribution of Fixed Capital Expenditure of Households in Different Categories of Farm Business in Maharashtra in 1981-82 and 1991-92 (per cent)
Categories 1981-82 1991-92
Improvement/reclamation of land/buildings
20.52 14.13
Orchards and plantation 1.96 2.61 Wells 37.39 34.16 Other irrigation resources 7.74 19.55 Agri implements, machinery, transport equipment etc.
26.72 25.24
Farm houses, barns, animal, sheds, etc.
2.09 0.96
Other 3.59 3.14 Farm Business –Total 100 100
Source: Calculated from data given in Gulati and Bathla (2002) Chand (2000), GoI (1988, 1998)
Agricultural Finance
Although there has been multi-agency set-up for rural banking, the major institutional finance to farming community in Maharashtra comes from commercial banks and credit cooperatives. Further, the priority sectors such as agriculture and allied activities account for the major share in total annual credit plan outlay for the state of Maharashtra with activities relating to small scale industries (SSI) and
non-farm sectors (NFS) accounting for the least share in the allocations in credit plan outlay. The estimates relating to Potential Linked Credit Plan (PLCP) outlays encompassing various sectors/activities show that among various regions, western Maharashtra alone accounts for around 50 per cent share in total PLCP outlay for the state of Maharashtra (Table 3.12).
Table 3.12: Potential Linked Credit Plan (PLCP) Estimates of Exploitable Potential for Different Regions of Maharashtra (Amount in Multiples of 10 Million Rupees) Regions 1997-98 1999-00 2001-02 Western Maharashtra
2552.87 (50.66)
3577.54 (50.17)
4945.71 (50.18)
Vidarbha 912.67 (18.11)
1361.47 (19.09)
1937.79 (19.66)
Marathwada 1159.36 (23.00)
1556.79 (21.83)
2048.29 (20.78)
Konkan 414.87 (8.23)
635.51 (8.91)
925.13 (9.38)
Maharashtra State
5039.77 7131.31 9856.92
Notes: i) Figures in parentheses are percentages to the total potential linked credit plan for the state. Source: Compiled from Official records, NABARD office, Pune
The next important regions are Marathwada and Vidarbha, each accounting for about 20 per cent share in state’s total PLCP outlay during the past five years. The allocation for Konkan region in state’s total PLCP outlay is the least. As regards credit delivery from various rural financial institutions in Maharashtra, the trends over the past two decades as indicated in Tables 3.13 and 3.14 show a slower growth in institutional finance through both credit cooperatives and commercial banks during the decade of economic reforms (1991-2000) as against the decade preceding it (1980-1990). Not only this, the reform period is also seen to be marked with a slower growth in membership of credit cooperatives in Maharashtra (Table 3.13). On the other hand, the outstanding loans of these cooperatives have grown at much faster rate as compared to their loan advances during both pre- and post economic reform periods.
The commercial banks in Maharashtra have not only shown slower growth in their loan advances and deposits but also decline in their credit-deposit (C-D) ratios during the period of reforms as against the pre-economic reform period (Table 3.14).

Maharashtra State Development Report 66
Table 3.13: Cooperative Bank Finances in Maharashtra: 1980-2000 (Amount in Multiples of 10 Million Rs.)
Triennium Ending CGR (%) Indicators
1982- 1983
1990- 1991
1999- 2000
1980- 1990
1991-2000
1980-2000
I- No. of Cooperative Societies
a. Apex 31 34 34 1.33 - 0.37 b. PACS 18565 19694 20378 -0.03NS 0.48 0.65 Total 18596 19728 20412 -0.03NS 0.48 0.65 II. No. of Members (‘000’)
a. Apex 1109 1523 1340 1.01NS -1.91 1.65 b. PACS 5595 7910 10432 4.90 3.48 3.35 Total 6704 9433 11772 4.33 2.72 3.13 III- Loan Advances
a. Apex 3318 9298 22195 14.47NS 7.12 8.64 b. PACS 288 929 2280 13.64 9.36 12.93 Total 3606 10227 24475 14.08NS 9.74 10.76IV- Outstanding Loans
a. Apex 1507 4811 15274 23.97NS 13.52 14.57 b. PACS 431 1521 3456 12.59 9.07 12.92 Total 1938 6332 18730 18.50 12.98 14.64Notes: 1) CGR = Compound Growth Rates 2) All growth rates significant at 1 per cent level 3) NS: Growth rates not significant at 1 per cent 4) Apex institutions include SCBs and DCCBs Source: Computations are based on figures obtained from various issues of ‘Economic Survey of Maharashtra’
Table 3.14: Rural Deposits and Credits of Commercial Banks in Maharashtra (Amount in Multiples of 10 Million Rupees)
Period Rural Deposit
Rural Credit
CD Ratio
(%)
TE 1982/83 381 274 71.91
TE 1992/93 1964 1457 74.18
TE 1999/00 5145 3346 65.03
CGR (%) - 1980-90 - 1991-00 - 1980-00
19.05 14.40NS 16.28
17.08 12.28NS 14.91
- - -
Source: Computations are based on figures obtained from various issues of ‘Economic Survey of Maharashtra’
The C-D ratios of Regional Rural Banks (RRBs) of this state have also fallen sharply over time (Table 3.15). So far as the rural finances are concerned, the most disquieting feature is the decline in loan
advances of Land Development Banks (LDBs) during the second half of the 1990s (Table 3.16). Not only the loan advances of LDBs of Maharashtra have declined sharply during the period of reform but the working capital of these banks also fell marginally during this period. The membership of LDBs of Maharashtra has also grown at slower rate during the period between 1991 and 2000 as against the period between 1981 and 2000 (Table 3.16).
Table 3.15: Progress of Deposit and Credit of Regional Rural Banks (RRBs) in Maharashtra Vis- à-vis India (Amount in one hundred thousand Rs.)
Period Deposit Credit CD Ratio (%)
Maharashtra
1981 557 824 147.94 TE 1985 1724 2034 117.40 TE 1990 8851 10709 120.99 TE 1995 22757 17373 76.34 TE 2000 75492 41562 55.05 All-India
1981 33147 40682 122.73 TE 1985 97075 107492 110.73 TE 1990 353554 321839 91.03 TE 1995 861931 528835 61.35 TE 2000 2685412 1152160 42.90
Source: Computations are based on figures obtained from various issues of ‘Statistical Tables Relating to Banks in India’, Department of Banking Operations and Development for the RBI, Bombay
Table 3.16: Progress of Maharashtra State Cooperative Land Development Banks (LDBs) (Amount in one hundred thousand Rs.; Membership in ‘000’) Period Memb-
ership Working Capital
Loan Advances
Loans Outstand-ing
TE 1985 827 44405 5651 30627 TE 1990 926 66685 8932 49245 TE 1995 1111 107311 13668 82328 TE 2000 1189 144262 4875 99690 CGR (%) - 1981-00 - 1991-00
2.79* 1.65*
6.07* -0.27
0.54 -18.53
9.21* 5.64*
Source: Computations are based on figures obtained from various issues of ‘Co-operative Movement at a Glance in Maharashtra, Office of the Commissioner for Co-operation & Registrar of Co-operative Societies, Maharashtra State, Pune

Agricultural Growth 67
The estimates relating to various Rural Financial Institutions (RFIs) of Maharashtra also show a slower growth in their Outstanding Loans (OL), overdue from Direct Advances (DA) and bad debt in agriculture during the period between 1991and 1997 as against the period between 1980 and 1990 (Table 3.17). However, the proportion of overdue to OL of RFIs of Maharashtra has grown at much faster rate during the reform period as against the pre-economic reform period. The reform period also shows increasingly high growth of Maharashtra’s share in total overdue and bad debts in agriculture of RFIs in India.
Table 3.17: Some Broad Performance Indicators of Rural Financial Institutions (RFIs) of Maharashtra vis-à-vis All-India (In Multiples of 10 Million Rs.) Period Maharashtra India Share (%)
Outstanding Loan (OL)
TE 1982 842.12 7326.36 11.49 TE 1990 3084.77 25940.29 11.85 TE 1997 3521.57 34579.59 10.67 CGR (%) - 1980-90 - 1991-97 - 1980-97
16.12* -1.02 10.51*
15.21* 2.01 10.75*
0.91 -2.97 -0.22
Overdue from DA
TE 1982 294.99 2157.95 13.74 TE 1990 812.76 6712.71 12.03 TE 1997 1536.03 8912.23 17.10 CGR (%) - 1980-90 - 1991-97 - 1980-97
13.47* 9.99 11.75*
14.22* 1.00 10.13*
-2.97 7.92* 1.45
Bad Debt in Agriculture
TE 1982 46.97 244.44 19.30 TE 1990 112.01 771.98 14.50 TE 1997 185.84 1054.68 17.54 CGR (%) - 1980-90 - 1991-97 - 1980-97
11.78* 4.91 10.12*
15.65* -2.11 10.83*
-3.11* 7.17* -0.65
Notes: CGR = Compound Annual Growth Rate; DA = Direct Advances Source: Computations are based on figures obtained from: Gulati, Ashok and Seema Barhla (2002)
The slower growth in institutional finances through commercial banks, credit cooperatives, RRBs and LDBs during the decade of 1991-2000 is due to adverse environment created by the financial
sector reforms. One of the reasons for slowing down in institutional finance during reform period could be the highly regressive and biased interest rate structure for priority sector during this era (Mujumdar, 1998). Another reason could be the emergence of new types of financial institutions like Non-Banking Financial Institutions (NBFCs) that provide loans for transactions on account of buying and selling of agricultural inputs and output. As pointed out by Mujumdar (1999), the new policy regime of financial sector reforms has grossly neglected the rural credit delivery system. Due to unfavourable policy framework, the entire rural credit delivery system encompassing rural branches of commercial banks, cooperative credit institutions and RRBs is reduced to a moribund state (Mujumdar, 2001). Mujumdar (2001) has also shown concern for the shrinking flow of financial resources to agriculture, both in terms of investment and working capital. In fact, the public investment in agriculture is reported to be declining (Thamarajakshi, 1999). However, the Ninth Plan not only recognises the role of priority sectors in the future growth of the country’s economy but it also categorically emphasises upon the imperative of enlarging the flow of credit to these sectors.
It is to be noted that high transaction costs and poor repayment performance are the twin root causes of the moribund state of rural credit delivery system (Mujumdar, 2001). With a view to revive the agricultural credit delivery system, there is need to adopt innovative approaches like linking of Self-Help Groups (SHGs) and Non-Government Organisations (NGOs) with mainstream financial institutions. Such linkages are reported to have not only reduced transaction costs but also ensured better repayment performance. In Maharashtra, the strength of SHGs linked with bank credit grew from as low as 424 in March, 1997 to as high as 11,148 by June, 2001. One of the recent studies conducted in Maharashtra has shown cent percent recovery of loans through SHGs despite having excessively high rates of interest (24-36 per cent per annum) on their loan advances (Kshirsagar and Shah, 2002).
As pointed out by Mujumdar (1998), one of the recent welcome developments in rural credit has been the establishment of the Rural Infrastructure Development Fund (RIDF) instituted by NABARD with the objective of advancing loans to state

Maharashtra State Development Report 68
governments and state-owned corporations for hastening ongoing projects, mainly those related to medium and minor irrigation, soil conservation, watershed management, etc. However, it is also being observed by Mujumdar (2001) that the utilisation of this fund is dismal at only 30 per cent. One of the further disquieting features of RFIs in Maharashtra has been the high proportion of NPAs to total assets, particularly of RRBs and State Cooperative Agriculture and Rural Development Banks (SCARDBs), which are estimated to hover around 36-48 per cent during the mid-nineties. One of the reasons for such high incidence of NPAs of RFIs has been the familiar practice of debt forgiveness, which eroded repayment.
Marketing of Agricultural Produce While technology and institutional factors play a pivotal role in agricultural growth, equally important is the role of agricultural marketing. In Maharashtra, most agricultural commodities are traded in regulated markets through auction method, but in the case of selected crops such as cotton and sugarcane, marketing is through state intervention.
Regulated Agricultural Markets and Rural Infrastructure The Maharashtra Agricultural Produce Marketing (Regulation) Act, 1963, requires that all notified agricultural produce bought or sold within the market area must pass through the market yard or sub-yard managed by the Agricultural Produce Market Committee (APMC) constituted for each market. The APMC functions under the supervision of a state level Agricultural Marketing Board. No one is allowed to market any notified produce in the market area other than the principal yard or sub-yard. All functionaries like traders, commission agents, weigh-men and loading workers must hold license of the APMC to carry out business. There are 857 regulated markets in Maharashtra consisting of 266 market yards and 591 sub-yards. The APMCs generate income by charging market fee, license fee and rentals. The main objective of regulated markets is to protect farmers from exploitation by middlemen and to provide facilities for auctioning of produce so that farmers are assured of competitive prices. Rural infrastructure also plays an important role in enabling farmers to market their produce. In the year 2000 the total road length was
257,000 km. As per Census 2001, all weather roads connected 79 per cent of villages, while fair roads connected 8 per cent of the villages. The state had 676 warehouses with a storage capacity of 3.5 million metric tonnes. Government Intervention in Marketing The government of Maharashtra has been a strong proponent of cooperative marketing of agricultural produce. Cooperative marketing is especially predominant in sugar and cotton sectors and growers have an assured market as well as price for their produce.
Cooperative Sugar Factories (CSFs) in Maharashtra Maharashtra has been the pioneering state with respect to setting up of CSFs and the first such factory (Pravara Cooperative Sugar factory) was set up in 1948. The successful establishment and operation of this factory initiated a trend in cooperative development with rapid multiplication of cooperative sugar factories in the state. There are at present 160 sugar factories in the state, out of which 147 are in the cooperative sector while only 13 are in the private sector. Also 57 sugar cooperative factories are in the initial stage.
The CSFs are involved in scheduling of planting, harvesting, transport and financing of the sugarcane crop. They purchase sugarcane supplied by farmers and process it into sugar. A committee of Ministers sets a mill specific cane price. On delivery of the sugarcane, within 15 days, farmers are to be paid Statutory Minimum Price; a second payment is made when the balance sheet of the mills permit and a small final payment is made some months later, following a state audit of the mill.
The contribution of the state government to the share capital of every factory has been 32.5 per cent of the originally appraised cost of the project. The loan amount borrowed by every factory from the banks and financial institutions, for which the state government has been giving default guarantee, amounts to 60 per cent of the appraised cost of the project. In this way, the financial involvement of the state government in every cooperative sugar factory has been 92.5 per cent of the originally appraised cost of the project. In addition, due to cost overruns, the state government has been giving direct loans to the cooperative sugar factories as “Last Mile Assistance” to enable them to complete

Agricultural Growth 69
their projects. Further, through government resolutions, soft loans and other forms of financial support were also rendered to sugar factories (Wadhwa, 2000).
In the initial years of independence, the sugar factories that were set up functioned efficiently and met with success. These factories were located mostly in Western Maharashtra where irrigation facilities and other complementary inputs were available. Since Western Maharashtra had a large number of sugar factories, Northern Maharashtra, Vidarbha and Marathwada followed suit, despite the fact that they were not gifted with the necessary factor endowments. The Godbole Committee (1999) noted that the most critical issue in the examination of applications for new factories was the assessment regarding the availability of water and the area, which was likely to be brought under sugarcane. However, certificates regarding present and future availability of water given by officers of Irrigation Department and Ground Survey and Development Agency were vague and misleading. This resulted in the shortage of sugarcane for the factories and all sugar cooperatives located in these regions began incurring losses. The normative costs adopted by financial institutions for sanction of loans were often outdated as actual costs turned out much higher. Since term loans were not available to meet this increased cost, the sugar factories often resorted to high cost short-term funds. This in turn led to shortage of working capital margins along with time and cost overruns. The state government also delayed releasing its share of equity and giving its guarantee for loans sanctioned by other institutional lenders. These factors led to a financial crisis among sugar factories and they defaulted in timely repayment of loans given by the government and other financial institutions. They were unable to make payments to labour as salaries and wages and also failed to pay interest and arrears of past loans, which were due for payment. A number of sugar factories had been paying much higher prices for sugarcane than warranted by their financial status. Cane prices were also paid by borrowing from banks or from diverting working capital, thus adding to financial liabilities. During the year 1998-99, out of 138 factories, only 31 sugar cooperatives were
making profits while 107 factories were incurring losses. Thus three-fourths of the sugar mills in the state were incurring huge losses and accumulating heavy debts. Further, while accumulated losses of 107 factories amounted to Rs 10.31 billion, the accumulated profits of the 31 mills was only Rs 0.20 billion. In Kolhapur district, out of the 15 sugar cooperatives, 10 were in losses amounting to Rs 420 million, while profits of the 5 mills were only Rs 10.8 million. The situation was similar in Sangli district, where the accumulated losses of the sugar mills amounted to Rs 520 million.
The records from the office of Sugar Federation revealed that the sugar factories in the state at present have the burden of short margin (the difference between the production cost and market price of sugar) to the tune of Rs 15.78 billion. The RBI and NABARD have shown willingness to convert the short-margin into medium-term loans, provided the government gives a guarantee. The government has given a guarantee for Rs 10 billion as in the absence of this guarantee, a number of sugar mills may have to close down, while District Central Cooperative Banks will face a grave crisis. Currently, a number of sugar factories are unable to pay the Statutory Minimum Price and as per the Sugarcane Control order, if factories do not pay SMP within 15 days, they will have to face legal actions.
Besides being a threat on the fiscal status of GoM, sugarcane cultivation poses another problem. Sugarcane is a high water consuming crop and the amount of water conventionally utilised for sugarcane is several times that of other crops. As more sugar cooperatives are given licenses, the area under sugarcane is bound to increase with the result that there would be pressure on scarce water resources and declining water tables. Excessive water use has led to water logging and increased salinity of land. While there are other competitive crops, that can also be grown, sugarcane, which does not require much effort to grow and often termed as “lazy man’s crop” continues to be a popular cash crop in Maharashtra. While some of the successful sugar cooperatives had helped to transform the rural areas especially in Western Maharashtra, the fiscal burden on the government is heavy.

Maharashtra State Development Report 70
Government Intervention in Cotton Maharashtra has the highest area under cotton in the country and about 20 per cent of the cultivators and their families in the state cultivate this crop. The marketing of this crop is characterised by a unique feature i.e. there is complete state intervention. A scheme of Monopoly Procurement of Cotton was framed and given a statutory form under the Maharashtra Raw Cotton (Procurement, Processing and Marketing) Act, 1971. With the enforcement of this act, all private trading in cotton had been prohibited since the 1972-73 cotton season and the farmer was compelled to sell his crop only to the GoM’s designated procuring agency, namely, Maharashtra State Cooperative Cotton Growers Marketing Federation. The hallmark of this scheme was the payment of guaranteed price, which remained the same throughout the season, and the cultivator was assured of it, even if the Federation could not sell at that price. In case the scheme made profits on its operations, the cultivator received 75 per cent of this surplus as bonus. The remaining 25 per cent was credited to a fund, to cover losses when needed. The scheme is now in operation for the last three decades. During the first two decades, the scheme made losses in 8 years and to make good these losses a sum of Rs. 3.31 billion had to be transferred from the state exchequer to the federation for its survival. Since the 1993-94 season, the scheme has been incurring massive losses and total losses from 1994-95 to 2001-2002 season amounted to Rs. 40 billion. The federation was surviving on budgetary support from GoM, delayed payments to farmers and debt rescheduling. There were several causes for mounting losses. First, in several years, the guaranteed price set by GoM was higher than ruling market prices in adjoining markets of neighbouring states. In some years high prices attracted illegal inflow of cotton from border -states in contravention to the provision of the Act. Thus the Federation, not only subsidised Maharashtra farmers but also those in other states. Second, although exports are now under Open General License, world prices are often depressed due to increased world production and thus in this global scenario the federation was unable to capitalise on exports. Also, the cotton is often contaminated and often not acceptable on quality
considerations. The marketing practices of the federation often suffered from corruption in grading and inferior quality cotton was upgraded thus reducing potential revenues. Holding of massive stocks of cotton (worth Rs. 22 billion till 2000) deteriorated the quality of the fibre, forcing the federation to offer huge discounts on its sales. This also led to a huge increase in interest cost due to unsold stocks, (besides storage and insurance), which amounted to Rs. 10 billion (1999-2000) and would sooner or later have to be borne by the state government. The operation of the monopoly scheme has built up a huge financial liability and to ease the situation, from the 2003-04 cotton season, CCI and private traders were allowed to enter the market. As a result of liberalising the monopoly scheme of cotton, the purchases by the federation in the 2003-04 season were negligible and most of the purchase centres were closed down. However, the federation had to ensure that prices do not fall below the guaranteed price fixed by it.
Horticulture Sector As noted earlier, agriculture in Maharashtra is diversifying into high value crops and horticultural crops are a major component of high value crops. Maharashtra has the highest area and production in the country devoted to fruits and fifth largest area under vegetables. It has 20 per cent share in the country’s fruit production and 5 per cent share in vegetable production (1999-2000). The state is the home of the renowned Alphanso mangoes and ranks first in the country in grape, cashewnut, pomegranate and orange production while it is first in banana productivity. It also has the highest share in onion production. The horticulture sector in Maharashtra contributes to the foreign exchange earnings as a large share of horticultural exports are from Maharashtra. With respect to floriculture, the area under flowers was 6600 hectares with an annual production of 28000 metric tonnes (2000-01). Besides, infrastructure created for the floriculture sector includes, 16 tissue culture units, 800 poly/ green houses, 43 pre-cooling units and 101 cold storage units. The records of the state’s Department of Horticulture reveal that 85 per cent of onions, 60 per cent of vegetables, 65 per cent of mangoes, 90 per cent grapes and 15 per cent of total fruits are exported from Maharashtra.

Agricultural Growth 71
The area under fruits and vegetables which was only 0.5 million hectares in 1990-91, more than doubled to 1.25 million hectares in 2000-01. This increase came about due to concerted efforts on the part of the GoM which in 1990-91, launched an ambitious Employment Guarantee Scheme Linked Horticulture Development Programme, mainly to secure better returns to farmers and encourage them to bring wasteland under horticulture. Further, since horticultural production is labour intensive, this programme was intended to generate employment opportunities in rural areas. This programme of GoM has a high potential because a variety of horticultural crops can be grown in different agro-climatic zones of Maharashtra. Marketing of these crops is also facilitated by easy accessibility of major ports and well-established domestic and international airports.
The scheme open to all farmers, covers 88.5 per cent of villages in Maharashtra and includes 25 fruit crops, spices intercropped in coconut plantations and medicinal and aromatic plants. The scheme provides 100 per cent subsidy on wages and 75 per cent subsidy on material inputs for a period of three years. In order to supply high quality planting material to farmers, the government established 140 nurseries, while 24 nurseries were established in the four agricultural universities of the state. Further, 1674 private nurseries were set up to ensure easy availability of planting materials. Supporting infrastructure to facilitate the functioning of this scheme, included 21 tissue culture laboratories, setting up of two Pesticide Residue Testing Laboratories (Pune and Nagpur), and plant health clinics to test genetic purity. The number of beneficiaries selected since inception was 1.28 million and employment generated was 214.1 million man-days. Finally, a website on agriculture- horticulture was launched by the agriculture department to disseminate information about this programme.
Other schemes of the government as well as private sector initiatives served as complementary inputs for this horticultural development programme. For example, through a centrally sponsored scheme, subsidy is given to farmers for micro-irrigation and by 1999-2000, 0.19 million hectares of fruit crops were under drip irrigation. The National Horticulture Board provided soft
loans to cooperatives, associations of growers, etc., in all states, to strengthen the post-harvest infrastructure for horticultural crops. Accordingly, Maharashtra received Rs. 110.56 million, during the period 1993-94 to 1996-97, under the soft loan schemes. The private sector also contributed post-harvest infrastructure facilities such as pre-cooling equipment, cold storage, refrigerated transport, agro- processing units and extension services. Some commodity-marketing organisations, e.g. Mahagrapes and Mahamangoes have been instrumental in promoting exports of domestic produce. The GoM is also in the process of setting up Agri Export Zones for promoting exports of certain fruits with the objective of providing remunerative returns to farmers on a substantial basis through improved access to exports.
The implementation of this scheme thus shows all round efforts on the part of GoM to commercialise agriculture in Maharashtra and despite water constraints, the state has tried to capitalise on soil and climatic factors as well as other infrastructure conducive to horticulture.
Allied Activities Allied activities, namely, livestock, poultry, fishery and forestry have great potential for catalysing Maharashtra’s rural economy. Change in food consumption patterns, from cereals to high protein diet, which includes meat, fish, eggs and dairy products, can give a boost to the livestock and fishery sectors. Forestry, besides creating employment and generating revenue also helps to maintain ecological balance in the state. Given the importance of allied activities, development in these sectors in the state over time is delineated in the subsequent sections.
Livestock Development Technological changes in agriculture associated with the green revolution have brought about significant changes in the size, composition and productivity of livestock in Maharashtra as well as in several other areas of the country. The dynamics of changes in size and composition of livestock population in Maharashtra vis-à-vis India since 1956 are shown in Table 3.18.
The size of bovine head in this state registered an increase from 16.9 million in 1956 to 24.1 million by 1997. On the other hand, the total livestock

Maharashtra State Development Report 72
population in the state grew from 23.8 million in 1956 to 39.6 million in 1997. In fact, Maharashtra accounts for around eight per cent of the total livestock wealth of India and this share has remained by and large constant over the past 3-4 decades (Table 3.18). Further, over the course of time, the sex composition of bovine in the state has shifted in favour of females and breed composition in favour of crossbreeds (Shah, 1997). The male buffalo population in the state is seen to be in the process of erosion over time and females are replacing it. The poultry population in the state has shown much faster growth as compared to the growth in total livestock population. The total poultry birds in the state have grown dramatically
from 8.8 million in 1956 to as high as 35.4 million in 1997 showing a four fold increase (Table 3.18).
The scenario obtained over the past decade and a half also reveals dramatic transformation in livestock production of the state, particularly in the case of milk (Table 3.19). During the period between 1985 and 2000, the total milk production in the state registered a much faster growth rate as compared to that for India. The higher milk production in this state is mainly due to increase in productivity levels of various species of animals during the given period of time. Further, the ready acceptability of modern technology by the milk producers and intensive efforts of dairy co-
Table 3.18: Livestock (including Poultry) Population Dynamics of Maharashtra and India Maharashtra India
Indicators 1956 1972 1997 1956 1972 1997@
I. Population Indicators Livestock (in 106) A. Cattle - Male 5.83 6.21 6.99 64.87 74.46 74.49 - Female 4.27 4.58 5.89 49.89 56.40 64.36 - Young Stock 4.06 3.92 5.19 43.80 47.48 65.73 Total 14.16 14.71 18.07 158.56 178.34 204.58 B. Buffalo – Male 0.30 0.30 0.31 6.51 8.07 8.09 - Female 1.47 1.88 3.61 22.34 29.24 43.81 - Young Stock 0.95 1.12 2.15 16.07 20.12 32.31 Total 2.72 3.30 6.07 44.92 57.43 84.21 C. Total Bovine 16.88 18.01 24.14 203.48 235.77 288.79 D. Sheep 1.96 2.59 3.37 39.25 39.99 50.78 E. Goats 4.61 5.91 11.43 55.41 67.52 115.28 F. Pigs 0.15 0.20 0.57 4.93 6.90 12.79 1.G. Equine 0.20 0.11 0.12 2.58 2.01 1.98 H. Camels Neg. Neg. Neg. 0.78 1.11 1.03 Total Livestock 23.80
(7.77) 26.82 (7.59)
39.63 (8.42)
306.50 353.34 470.86
Poultry (in 106) 8.77 12.22 35.40 94.68 138.54 307.25 II. Other Indicators A. Draught Animal Population (106) 5.92 6.40 7.06 68.43 80.17 70.59 H. Draught Animal Power (DAP) (104 HP)
236.54 256.00 282.40 2737.20 3206.80 2823.60
E. Electric Pumpsets & Oil Engines (104) 2.88 34.35 96.40 16.80 317.50 1097.90 F. No. of Tractors 2320 6200 81353 20980 183800 1221800 G. Mechanical Power (MP) (104 HP) - Pumpsets 1.05 84.90 425.90 23.00 809.00 3201.75 - Oil Engines 13.36 86.84 57.75 61.00 778.50 2288.70 - Tractor 5.80 15.50 203.38 52.45 459.50 3054.50 Total 20.21 187.24 687.03 136.45 2047.00 8544.95 I. Total Farm Power (TFP) (104 HP) 256.75 443.22 969.43 2873.65 5253.80 11368.55 J. Share of MP in TFP (%) 7.87 42.24 70.87 4.75 38.96 75.16 K. Share of DAP in TFP (%) 92.13 57.76 29.13 95.25 61.04 24.84
Note: It is assumed that one animal is equivalent to 0.4 HP, oil engines/pumpsets to 5 HP, and tractor to 25 HP @ - 1997 Livestock Census figures for India are not yet published. Figures in parentheses are percentages to the total livestock population of India Source: Computations are based on figures obtained from various livestock census reports of Maharashtra and India

Agricultural Growth 73
operatives in providing balanced cattle feed, veterinary and health care services, and the availability of other infrastructure facilities have also played a positive role towards this increase in milk production in the state (Patel, 1993). However, there are still considerable regional imbalances in milk production. Regional imbalances in milk production are due to changes in agro-climatic conditions, extent of economic development, availability of irrigation facilities, etc. in different regions of the state.
Table 3.19: Changing Structure of Livestock Production in Maharashtra vis-à-vis India
Triennium Ending 85-2000 Production 87-88 91-92 99-00 CGR(%)
Milk Production (million tonnes) Maharashtra 2.47 4.10 5.40 7.13* India 45.60 58.10 74.53 4.23 Share in India (%) 5.42 7.06 7.25 2.71 Wool Production (metric tonnes) Maharashtra - 1487.54 1595.76 1.18* India - 40100 45500 2.04* Share in India (%) 3.71 3.51 -0.85 Egg Production (billion) Maharashtra - 2.26 2.91 4.34* India - 23.04 30.07 4.51* Share in India (%) 9.80 9.69 -0.17 Meat Production@ (in ‘000’ MT) Maharashtra 159.257 151.21
0 203.056 2.30*
India 993.334 3420.667
3895.000 11.41*
Share in India (%) 16.03 4.42 5.21 -8.11* Meat Production Per Animal (in Kgs.) Maharashtra 21.577 24.054 27.857 2.80* Notes: * - implies significance of growth rates at 1 per cent level of probability; CGR = Annual Compound Growth; @ - excluding poultry meat Source: The estimates are based on figures obtained from various issues of ‘Report on Milk, Egg, Wool, Meat Production and Livestock and Poultry Keeping Practices in Maharashtra State, Department of Animal Husbandry, Maharashtra State, Pune’.
It is also clearly evident from Table 3.19 that except for milk, all the products from livestock species in this state have shown slower growth during the period between 1985 and 2000 as compared to their growth for the nation as a whole. The growth rates in egg and wool production in the state have been marginally lower than the national average. The lower growth rate in wool production may be due to predominantly migratory nature of sheep flocks in the state. In the case of meat, the
growth rate in production is so low that the state has shown a sharp decline in its share in India’s total production of meat during the period between 1992 and 2000. The share of Maharashtra in India’s total meat production is seen to have declined at the rate of 11 per cent a year during the given period (Table 3.19). It deserves mention here that meat in the state is produced from both authorised and unauthorised slaughter-houses. As the estimates of meat production from unauthorised slaughter-houses are unavailable, it is difficult to arrive at realistic estimates of meat production in the state. And, this might have caused a decline in Maharashtra's share in India's total meat production. Nonetheless, insofar as the meat production is concerned, the productivity levels of various species of animals in the state showed an upward trend during this period. This is also corroborated from the fact that the number of animals slaughtered in the state has shown a decline over time. However, there still exists vast scope for increasing livestock productivity in the state by following improved animal husbandry practices.
Fisheries Development Maharashtra accounts for a significant share (around 16 per cent) so far as marine fish production in the country is concerned. The estimates relating to fisheries development in Maharashtra encompassing the period from 1979 and 1999 are provided in Table 3.20. The state of Maharashtra has 720 km. of coastline. There are as many as 32 varieties of fish harvested/produced in Maharashtra. Among these varieties, shrimps, prawns, harpodon neherias, ribbon fish, otalithes, pomfrets, anchoviella, mackeral and cattle fish put together account for over 70 per cent share in total fish production of Maharashtra. As for various regions, Brihan Mumbai and Thane alone account for about 60 per cent of the total fish catch of Maharashtra. However, over the course of time, the shares of these regions in total fish catch of Maharashtra have declined marginally.
It is to be further noted that the share of Maharashtra in total fish production of India has steadily declined over the past two decades mainly due to a sharp decline in her share in total marine fish production of India (Table 3.20). However, over time, the state has shown considerable increase

Maharashtra State Development Report 74
in the quantum strength of marine-fishing villages/hamlets, boats engaged in fishing, fish brought for curing, salt issued, cured fish removed, besides in the number of fish cooperative societies and their membership, etc. (Table 3.20).
Table 3.20: Fisheries Development in Maharashtra: 1979-80 to 1998-99
Triennium Ending 79-99 Particulars
1981-82 1991-92 1998-99 CGR
1. TCS 720 720 720 - 2. MFV 375 386 391 Neg. 3. BEF 12503 15712 18345 2.24* 4. BAOT 6834 9061 13005 4.21* 5. MB – D MB – E
3058 4072
3939 7047
4544 8734
2.07* 4.41*
6. QFBC 8384 3083 15093 8.38 7. QSI 1732 697 2885 8.12 8. QCFR 6420 2140 10820 8.22 9. FP - M - I - T
340 25 365
372 61 433
436 112 548
1.37* 7.40* 1.86**
9.1 ALL India FP - M - I - T
1498 912 2410
2347 1549 3896
2662 2381 5043
3.89* 6.08* 4.81*
9.2 SMI - M - I - T
22.70 2.74 15.15
15.89 3.94 11.11
16.38 4.70 10.87
-2.43* 1.25 -2.82*
10. FCS 535 1547 2202 8.92* 11.0 MCOOP. 177 190 221 2.29* 12. IWSA 310 301 300 - 13. FCY 20 7 11 -1.95* 14. FS 9 9 9 - 15. DFC - 473344 536303 3.87* Notes: 1) CGR: Compound Growth Rate (annual) (in %) 2) * and ** indicate significance of growth rates 1and 5 per cent level of probability 3) TCS: Total Coastline of State (in Kms.) MFV: No. of Marine Fishing Villages BEF: No. of Boats Engaged in Fishing BAOT: No. of Boats Above one Tonne MB – D: No. of Mechanised Boats – Departmentally MB – E: No. of Mechanised Boats –Existing QFBC: Quantity of Fish Brought for Curing (in Tonnes) QSI: Quantity of Salt Issued (in Tonnes) QCFR: Quantity of Cured Fish Removed (in Tonnes) FP – M, I, T: Fish Production – Marine; Inland, Total (in '000' tonnes); SMI – M, I, T: Share of Maharashtra In India (%)-Marine, Inland, Total FCS: No. of Fish Cooperative Societies; MCOOP. : Membership of Cooperatives (in ‘000’); IWSA: Total Inland Water Spread Area (in ‘000’ Ha); FCY: No. of Fish Curing Yard, FS: No. of Fishing Schools; DFC: Disposition of Fish Catch (in Tonnes) Source: Handbook of Basic Statistics of Maharashtra
Another disquieting feature of fisheries sector of Maharashtra is the decline in the number of fish curing yards, which have come down by 45 per cent during the period under consideration. On the other hand, the number of fishery schools in the state has stagnated at nine over the last two decades.
The declining trends in inland water spread area, numerical strength of fish curing yards and stagnant number of fishery schools are certainly disturbing features of the fisheries sector of Maharashtra. However, in order to develop fisheries sector, the department of fisheries in the state is conducting various training programmes relating to carp fish seed production, fresh water prawn culture, integrated fish farming and management of aquarium, etc.
Forestry Maharashtra accounts for about 7.3 per cent of the total forest area of India and the share of Maharashtra in country’s total wasteland stands at around 12.3 per cent (GoI, 1998). The land utilisation figures for Maharashtra during the period between 1980-81 to 1982-83 and 1994-95 to 1996-97 reveal a marginal decline in barren and uncultivated land and an increase in land put to non-agricultural uses. Permanent pastures and other grazing lands have also declined sharply during the given period of time. On the other hand, the current and other fallow lands have increased over time. While decline in barren and uncultivable land may be considered as desirable for the state's forest economy, the increases in land put to non-agricultural uses, current and other fallow land and at the same time decline in permanent pastures and other grazing land are certainly disturbing phenomena.
Growth in various forest related indicators of Maharashtra encompassing the period between 1980-81 and 1995-96 are provided in Table 3.21. A critical evaluation of Table 3.21 shows a marginal decline in value of forest produce harvested during the period between TE 1989-90 and TE 1995-96 in face of sharp increase in the same between TE 1982-83 and 1989-90. The decline in forest produce harvested is mainly due to sharp decline in forest area harvested, especially after the late eighties period. It is to be noted that during the late eighties the Government had banned felling of trees in many parts of the state. This had not only affected forest area harvested, but also value of forest
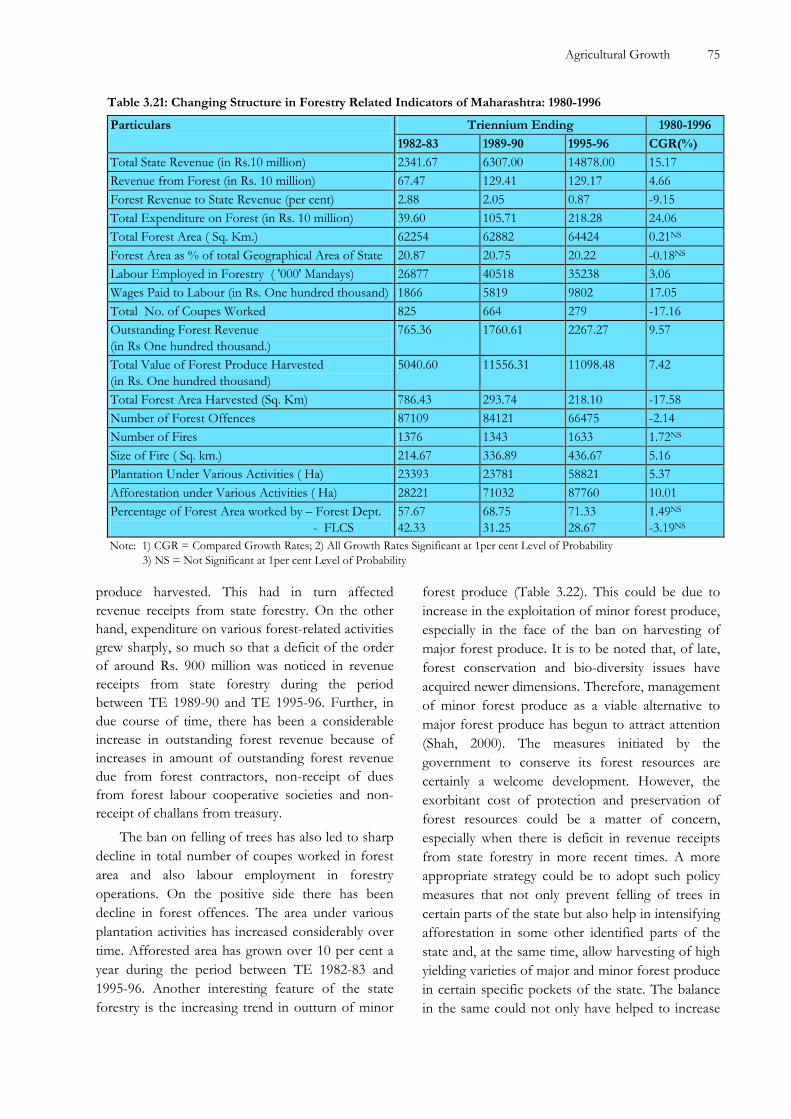
Agricultural Growth 75
produce harvested. This had in turn affected revenue receipts from state forestry. On the other hand, expenditure on various forest-related activities grew sharply, so much so that a deficit of the order of around Rs. 900 million was noticed in revenue receipts from state forestry during the period between TE 1989-90 and TE 1995-96. Further, in due course of time, there has been a considerable increase in outstanding forest revenue because of increases in amount of outstanding forest revenue due from forest contractors, non-receipt of dues from forest labour cooperative societies and non-receipt of challans from treasury.
The ban on felling of trees has also led to sharp decline in total number of coupes worked in forest area and also labour employment in forestry operations. On the positive side there has been decline in forest offences. The area under various plantation activities has increased considerably over time. Afforested area has grown over 10 per cent a year during the period between TE 1982-83 and 1995-96. Another interesting feature of the state forestry is the increasing trend in outturn of minor
forest produce (Table 3.22). This could be due to increase in the exploitation of minor forest produce, especially in the face of the ban on harvesting of major forest produce. It is to be noted that, of late, forest conservation and bio-diversity issues have acquired newer dimensions. Therefore, management of minor forest produce as a viable alternative to major forest produce has begun to attract attention (Shah, 2000). The measures initiated by the government to conserve its forest resources are certainly a welcome development. However, the exorbitant cost of protection and preservation of forest resources could be a matter of concern, especially when there is deficit in revenue receipts from state forestry in more recent times. A more appropriate strategy could be to adopt such policy measures that not only prevent felling of trees in certain parts of the state but also help in intensifying afforestation in some other identified parts of the state and, at the same time, allow harvesting of high yielding varieties of major and minor forest produce in certain specific pockets of the state. The balance in the same could not only have helped to increase
Table 3.21: Changing Structure in Forestry Related Indicators of Maharashtra: 1980-1996
Triennium Ending 1980-1996 Particulars
1982-83 1989-90 1995-96 CGR(%)
Total State Revenue (in Rs.10 million) 2341.67 6307.00 14878.00 15.17 Revenue from Forest (in Rs. 10 million) 67.47 129.41 129.17 4.66 Forest Revenue to State Revenue (per cent) 2.88 2.05 0.87 -9.15 Total Expenditure on Forest (in Rs. 10 million) 39.60 105.71 218.28 24.06 Total Forest Area ( Sq. Km.) 62254 62882 64424 0.21NS
Forest Area as % of total Geographical Area of State 20.87 20.75 20.22 -0.18NS Labour Employed in Forestry ( '000' Mandays) 26877 40518 35238 3.06 Wages Paid to Labour (in Rs. One hundred thousand) 1866 5819 9802 17.05 Total No. of Coupes Worked 825 664 279 -17.16 Outstanding Forest Revenue (in Rs One hundred thousand.)
765.36 1760.61 2267.27 9.57
Total Value of Forest Produce Harvested (in Rs. One hundred thousand)
5040.60 11556.31 11098.48 7.42
Total Forest Area Harvested (Sq. Km) 786.43 293.74 218.10 -17.58 Number of Forest Offences 87109 84121 66475 -2.14 Number of Fires 1376 1343 1633 1.72NS Size of Fire ( Sq. km.) 214.67 336.89 436.67 5.16 Plantation Under Various Activities ( Ha) 23393 23781 58821 5.37 Afforestation under Various Activities ( Ha) 28221 71032 87760 10.01 Percentage of Forest Area worked by – Forest Dept. - FLCS
57.67 42.33
68.75 31.25
71.33 28.67
1.49NS
-3.19NS Note: 1) CGR = Compared Growth Rates; 2) All Growth Rates Significant at 1per cent Level of Probability 3) NS = Not Significant at 1per cent Level of Probability

Maharashtra State Development Report 76
its revenue receipts from state forestry, but also in respect of achieving its goal of maintaining ecological balance in the state.
Table 3.22: Outturn of Forest Produce in Maharashtra (Quantity in '000' cum. and value in ‘00,000’ Rs.)
Triennium Ending 80-96 Forest Produce 1982-83 1989-90 1995-96 CGR(%)TVMNFP 1028.26 3188.07 5720.32 18.97 TVMJFP 4012.35 8368.24 5378.16 1.81NS TOFP 5040.61 11556.31 11098.48 7.42
Notes: 1-3) As in Table 3.21; 4) TVMNFP: Total Value of Minor Forest Produce; TVMJFP: Total Value of Major Forest Produce; TOFP: Total Outturn of Forest Produce
Constraints on agricultural growth
Agriculture plays a major role with respect to employment as 55.3 per cent of the workforce is engaged in this sector. This figure rapidly rises to 69 per cent, when we exclude Mumbai, the commercial capital of India, indicating that in almost all districts in Maharashtra, agriculture is the main source of livelihood. This indicates very limited non- farm development. The problem is further aggravated because agriculture in the state is mainly rainfed as barely 16 per cent of the GCA is irrigated. More than half the districts have irrigated area below the state average. Further, one-third area of the state falls under rain-shadow region, with scanty rainfall. In fact, rainfall is uncertain in all districts, with the exception of the Konkan region. The state has the distinction of having more than 24 per cent of drought-prone area of the country. Almost 73 per cent of the area of the state falls in the semi-arid region. The state therefore faces major problems and constraints associated with rainfed agriculture such as low yields, crop failures and uncertainties due to erratic rainfall pattern. Lack of access to water also inhibits the use of other inputs such as high yielding varieties of seeds and fertilisers, thus widening the gap between potential and actual yields. Low value crops such as coarse cereals, therefore dominate the cropping pattern, which reduces the income generating potential of farmers. Thus, poor resources decrease the capacity of farmers to take risks and invest in improved technologies as well as land improvement.
Land degradation is also emerging as a major problem in Maharashtra. The National Bureau of Soil Survey and Land Use Planning estimated that about 86 per cent of land area in the Western Ghats
and 75 per cent in the Konkan coast suffer from severe to strong soil erosion. Land degradation reduces the productivity of land and total loss to the state economy from soil erosion is estimated at Rs 30 billion (Rural Development and Water Conservation Department, GoM).
The main source of water for agriculture in the state is groundwater. The area irrigated by wells accounts for 67 per cent of net irrigated area. This water is primarily drawn from the ground, using electric pumpsets. Excessive withdrawals of groundwater have contributed to the drying up of wells in several districts. Declining water tables may lead to scarcity of water in the future. There are also threats to the sustainability of surface irrigation due to deterioration of canal systems and inability to collect water charges from farmers.
While productivity levels are low due to natural constraints, government interventions to diversify agriculture, from low value coarse cereals to high value commercial crops such as sugarcane, cotton and horticultural crops, have not been free from problems. The direct and indirect support of the GoM to 147 sugar cooperatives in the state, besides 57 being in the erection stage is adding to the fiscal burden of the state as large number of them are sick and incurring huge losses. Further, since sugarcane is a highly water intensive crop, cultivation of this crop is leading to declining water tables and environmental degradation. Also, area irrigated with groundwater is through electric pump sets and the subsidy on power to agriculture further adds to fiscal crisis. Besides, increasing support to the sugar sector, total state intervention with respect to cotton is also a burden to the state exchequer. Further, the yield of both these crops is a cause for concern. White woolly sugarcane aphid, which is a common pest, infests the sugarcane crop and farmers are unable to combat this pest, which lowers their yield. In the case of cotton, about 166 different species of insect pests are reported to attack cotton at various stages of growth. Farmers lack adequate extension services on use of pesticides, which leads to pest resurgence. Further, often the quality of pesticides is sub standard and spurious and timely availability of these inputs act as a constraint.
While attempts to promote the horticulture and floriculture sector are a welcome step, there are likely to emerge certain challenges and constraints in

Agricultural Growth 77
the development of these sectors. Plants have a high mortality rate in areas where there are water constraints and there is non-availability of specifically prescribed pesticides and nutrients. Besides infrastructure bottlenecks also exist such as poor condition of rural roads, improper post harvest handling, storage, processing etc. In case of exports also there exist bottlenecks such as inadequate cold storage facilities at Mumbai international airport and shortage of cargo space on international flights. Also, meeting stringent export quality standards is made difficult as farmers lack awareness on scientific cultural practices. Due to such constraints, the state may not be able to fully capitalise on its export potential.
Under the State APMC act, the law requires that all notified agricultural produce bought or sold within the market area must pass through the market yard or sub-yard managed by the APMC. This precludes any private agency from setting up an alternative marketing system to operate outside the purview of the notified markets. Thus besides natural constraints, at times even government policies impede agricultural growth, besides adding to the fiscal burden.
Policy Implications
About 58 per cent of Maharashtra’s population continues to reside in rural areas with agriculture as the dominant source of livelihood. However, growth rate of this sector (1980-81 to 2000-01) is far lower than that of the secondary and tertiary sectors. Therefore attempts have to be made to overcome the constraints and increase the productivity and competitiveness of this sector. The government may also have to reformulate its policies and priorities to create an environment suitable to agricultural growth. Equally important is the need to promote rural non-farm employment so that the burden in the agricultural sector is reduced. Growth in both these sectors will generate more rural income, stimulate consumer demand and give a boost to other economic sectors.
Agricultural productivity and hence its growth potential depend to a large extent on availability of irrigation. Irrigation helps kharif crops when there is a failure of rainfall and has a substantial effect in increasing the productivity of crops grown in the rabi season such as wheat, rabi jowar etc. Water
constraints also inhibit the use of complementary inputs such as HYVs and fertilisers. Thus, top priority must be given to bridge the gap between irrigation potential created and actual area under irrigation. The number of wells in the state is also increasing but it is burdensome for marginal and small farmer to bear the cost of a well. Constructing community wells may ease this problem. This may also lead to better utilisation of available groundwater. Besides development of irrigation facilities, watershed development is also very necessary to stabilise the carrying capacity of land and water resources in rainfed areas. A successful implementation of such programmes involves wholehearted participation of beneficiaries. These strategies generate employment and the bulk of the costs of such programmes can be accounted for by wages, which can be paid in kind, through grains obtained from Food Corporation of India (Mujamdar, 2002). Thus the GoM instead of thinly spreading the available investible resources over wide areas, should concentrate on few strategically selected areas for intensive development, such as completion of irrigation projects already underway and massive watershed development programmes. The state must also make fuller utilisation of resources available from NABARD’s RIDF facility. Public investment in agriculture is reported to be declining. Agriculture and allied sectors, being the priority sectors in the future growth of the state, should be given due emphasis and necessary measures need to be drawn up for streamlining the credit flow in this sector.
Besides the development of irrigation facilities and watersheds, the government policy of encouraging the cultivation of very water intensive crops, notably sugarcane must be reconsidered. Increase in area under sugarcane is due to high profitability in cane cultivation relative to other crops, as well as preferential treatment extended to cooperative sugar factories. There are, however, concerns about the sustainability of this water intensive crop in water scarce state of Maharashtra. Use of micro irrigation systems such as drip can be viewed as a solution to the growing water scarcity as well as to safeguard the sugarcane area from potential threats of water logging and salinity.
The GoM should also withdraw its support to the cooperative sugar mills and in the cotton sector;

Maharashtra State Development Report 78
it should phase out the monopoly procurement scheme. Perhaps, a move is being made in this direction with respect to cotton, as during the 2003-04 cotton season, private traders as well as CCI were allowed to enter the market. Since state intervention in sugar and cotton sector have had a huge fiscal impact, alternative strategies to manage the uncertainty and risks inherent in agricultural markets, such as futures trading must be encouraged. The hedging and price discovery functions of futures markets will help to achieve efficiency in agricultural marketing. However, the physical markets of commodities encounter a number of impediments, such as government control and regulations, monopoly procurement (in the case of cotton), minimum support price, etc. Thus all major hurdles that come in the way of proper functioning of futures trading must be removed so that it can function smoothly.
Attempts to shift to high value horticultural crops through an employment guarantee scheme is a step in the right direction. The state, which catered earlier to domestic markets, is now making inroads into international markets. Maharashtra has great export potential for fruits such as grapes and pomegranates because although there is competition from other countries, the basic advantage is that these fruits are available in the months of March and April only in Maharashtra. The state can therefore try and achieve maximum exports during these months. In case of floriculture also, there exists great export potential as there is peak demand in European markets in colder months due to festival season and the climate in India during these months is conducive for floriculture.
In order to fully capitalise on exports, it is necessary to invest in post-harvest technology and ensure that there are no infrastructure bottlenecks. While the establishment of WTO has led to the expansion of international economic activity, technical measures such as food quality and Sanitary and Phytosanitary requirements can impede trade. It is, therefore, necessary to educate farmers on quality standards and phyto sanitary codes. The GoM is also in the process of setting up Agri-Expot Zones for Kesar mangoes, oranges, pomegranates, onions, etc. Marathwada has a good production base for kesar mangoes and this region being drought prone with limited opportunities for agriculture can take
advantage of the Agri Export Zone and become an important player in the international market. Similarly, an Agri Export Zone in Vidarbha for oranges may help to stimulate the agricultural economy of the region.
Barely 3 per cent of all fruits and vegetables from the state are processed as against 50 to 80 per cent in developed countries such as USA and Brazil. As production of fruits is likely to increase, government as well as private sector, to promote value addition, must further promote agro-processing units. Private sector investment in agro-processing may be encouraged through contract farming through which farmers can receive inputs, extension services and all logistical support, besides an assured market. Use of IT for dissemination of information to farmers and upgradation of knowledge, skills and communication capacity of extension personnel will help to increase agricultural performance. Necessary facilities for skill upgradation of graduates in agricultural science for setting up agri-business centres through training programmes under the on going “Agri Clinics and Agri Business Scheme” of the Ministry of Agriculture must be availed.
Reforms pertaining to rural credit also assume importance. There is a need to increase PLCP outlay for Marathwada, Vidarbha and Konkan regions. Further, there is a need for cooperative and commercial banks to study the mechanism of new generation lending institutions like SHGs in terms of their pattern of loan recovery and interest rate structure, particularly in the light of the fact that they show high rate of recovery despite higher rate of interest on loan advances. In fact, the studies conducted earlier have clearly shown lower transaction costs and higher recovery performance of SHGs (Gulati and Batla, 2002). These groups are also reported to have favourably impacted the social and economic status of their members. Further, the RFIs of Maharashtra are also seen to be beset with high levels of NPAs or overdues. There is, therefore a need to take more stringent and cohesive measures for recovery of loans from chronic and heavy defaulters. In brief, in order to rejuvenate rural credit delivery system, the twin problems facing the system, viz., high transaction costs and poor repayment performance, need to be tackled (Mujumdar, 2001). In fact, insofar as the rural credit

Agricultural Growth 79
delivery system is concerned, the focus should be on strategies that are required for tackling issues such as sustainability and viability, operational efficiency, recovery performance, small farmer coverage and balanced sectoral development (Puhazhendhi and Jayaraman, 1999).
The GoM must also reform the APMC act, 1963, to allow private parties to develop agricultural markets in the state as this would facilitate the construction of more markets and also improvement in market infra structure.
Allied activities, which provide supplementary and complementary employment and also add to the income of the farmers, must be promoted. With respect to the livestock economy, it may be noted that, first, while draught animals are not displaced by other sources of farm power, there is a sharp increase in the stock of female bovine population. This trend is desirable in the light of the growing economic opportunities for increasing milk production and for undertaking dairying as a commercial enterprise. In fact, the slowing down in the growth of work animals has been concomitant with the expansion of milch animal population in Maharashtra, which showed over 53 per cent growth between 1956 and 1997. One of the observations of Vaidyanathan (1987) and Nair and Das (1990) is also in favour of this trend. Second, the increasing use of mechanical equipment for cultivation in lieu of additional animal power will progressively increase the rural demand for energy, i.e., for electricity, diesel, etc. Therefore, there must be adequate investment in power sector in the future to accommodate this increasing rural demand for power. Lastly, as for livestock production, there still exists a vast scope for increasing livestock productivity by following improved animal husbandry practices. The prospects for increasing livestock production in the state will also depend on the extent to which farmers undertake fodder cultivation as an integral part of livestock production.
In order to develop fisheries sector in Maharashtra, there is need to educate fishermen with respect to dissemination of information
relating to modern/mechanised fishing techniques and efficient marketing of fish catch. Education of fishermen about modern fishing techniques is reported to have a significant impact on adoption of recommended fish culture practices by the farmers (Sivasankar, et.al., 1995). It is also pointed out that extension and mass media participation have strong positive relationship with adoption of fish culture practices (Prabhakara and Murthy, 1994). Nonetheless, inadequate infrastructure and flow of information technology have been cited as the major barriers for better market integration in the existing marine fish markets of India (Behura and Pradhan, 1998). There, however, exists vast scope for exploitation of offshore fishery resources through introduction of newly designed fuel saving multi-day mechanised fishing vessels and deep sea fishing vessels. Measures must also be taken to increase production of both marine inland fisheries from reservoirs, etc. and culture fisheries to increase the overall fish production.
With respect to forestry, afforestation of the waste and unproductive lands has acquired new dimensions and importance (Yadav, 1980; Chaturvedi, 1985). Unfortunately, the waste and other fallow lands in the state are increasing over time. Earlier, afforestation in wastelands of village panchayats was stressed by Joshi and Agnihotri (1983). Efforts, therefore, should be made to bring these lands under forest cover of the state. Further, efforts should also be made to curtail expenditure on forest related activities, which have shown to grow at an alarming rate of 24 per cent a year during the period between TE 1982-83 and 1995-96. Equally, important is to recover outstanding forest revenue.
On the whole, it appears that the state of Maharashtra must use water judiciously, reduce its intervention in sensitive crops like cotton and sugar, capitalise on its horticultural and floriculture sector, further promote allied activities, strengthen rural infrastructure and encourage private sector participation and investment in agriculture. Such strategies along with promotion of rural non-farm employment will stimulate the agricultural sector.

Related Documents