Agricultural Drought; Assessment and Monitoring using Geospatial technologies C.S. Murthy

Welcome message from author
This document is posted to help you gain knowledge. Please leave a comment to let me know what you think about it! Share it to your friends and learn new things together.
Transcript
Agricultural Drought; Assessment and Monitoring using
Geospatial technologies
C.S. Murthy

Drought – a silent threat torural economy
unemployment Cattle - starvation
Fodder shortage
Non agricultural impact: Drinking water shortage
Agriculture – the immediate victim of drought
Consequences of crop failure
• 70% of population depend on agril.
• 68% of net sown area(142.2 M ha) is drought prone
• 50% of drought prone is severe in nature
Geographical Area328.7 M ha
Net Sown Area142.2 M haNet Irrigated Area55.10 M ha

Understanding Drought
• Complex nonlinear interactions • Slow process with multiple impact• No single index • Different states adopt different norms
Weather
Soil
Crop
Agricultural drought
Management
Drought Management
Short term Management
Long term Management
Monitoring & Assessment
Prediction & Early warning
Agro-advisories Crop damage
assessment
Vulnerability maps
Risk maps Prioritization Impact
monitoring
Meteorological drought: reduced rainfall met. indicators
Hydrological drought: reduced surface water hydrological indicators
Agricultural drought: reduced soil moisture crop stress indicators

Gu
idel
ines
fo
r d
rou
ght
man
agem
en
t in
Ind
ia Department of Agriculture, Cooperation and Farmers Welfare (DACFW), Govt. of India is the Nodal agency for drought management
Guidelines to states
• National Drought Manual 2009
• National Drought Manual 2016(www.agricoop.nic.in)
Manual provides•indices for drought monitoring•Drought declaration protocols•Relief management•Long term measures •Training to states

Agricultural DroughtCausative factors
Deficit rainfall
Deficit Soil moisture
Rise in temperature
Rise in water demand
Effect on agriculture
Delayed sowings Reduced sown area Poor germination Stressed crops Loss of crop yield
Indian Meteorological Department
Sparse observations Sharp variability in weather Physical nature of parameters partly related to biological nature of crops.
Aridity Anomaly
Non spatial and subjective manual observations.+
Inconsistency w.r.t to data collection and availability among the states.
No uniform criteria for drought assessment/drought declaration
State Depts. of Agriculture/Revenue/Relief
Weekly reporting of information• Rainfall• Crop sown areas (delay in sowings/reduction in sown area)• Reservoir levels• Manually observed agricultural situation at district/sub district level
Met. Drought season – if rainfall isless than 75 % of normal

Meteorological indicators
Rainfall – most common indicator
Standardized Precipitation index (SPI)
Indicators based on water balance
• Palmer drought severity index• Moisture Adequacy Index (MAI)• Aridity Index and its anomaly
Rainfall – in season+/- 20 % dev. Normal-20 to -60 % Deficit<-60 % dev. Scanty
SPI Values
2.0+ extremely wet
-.99 to .99 near normal
-1.0 to -1.49 moderately dry
-1.5 to -1.99 severely dry
-2 and less extremely dry
Palmer Classifications
4.0 or more extremely wet
0.5 to 0.99incipient wet
spell
0.49 to -0.49 near normal
-0.5 to -0.99incipient dry
spell
-1.0 to -1.99 mild drought
-2.0 to -2.99moderate
drought
-3.0 to -3.99 severe drought
-4.0 or lessextreme
drought
MAI Values
76-100 No drought
50-75 mild
25-49 moderate
< 25 severe
Aridity anomaly
0 Non arid
1-25 mild
25-50 moderate
>50 severe

Standardized Precipitation Index (SPI)
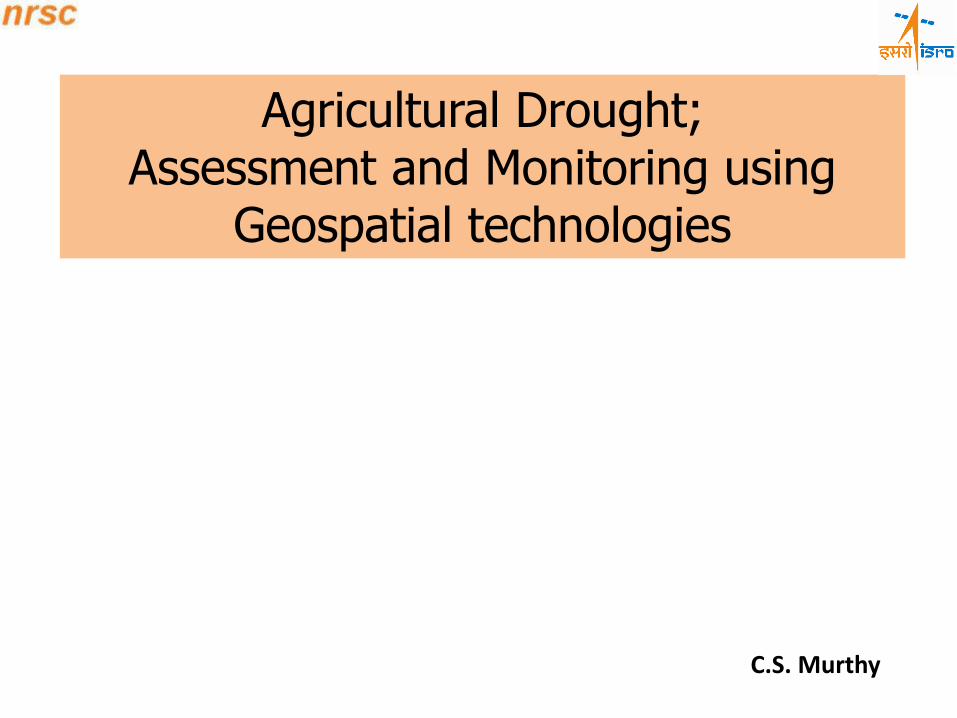
Reservoir Storage Index
Water levels in reservoirs in different yearsSurface water bodies mapping – water spread areaRunoff index using hydrological models
Ground water index
Observation wells – water level data
Hydrology indicators

Agricultural drought indicators
• Extent of reduction in crop planted area
• Extent of delay in crop planted area
• Crop stress at different growth states
• Crop yield loss

AGRICULTURAL DROUGHT – Satellite indices
Ground water Storage
Surface Storage
Runoff
Rain
Infiltration &Percolation
Satellite Sensors
Evapo transpiration
Biophysical Parameters
Vegetation Indices
Agricultural
Drought
Meteorological
Drought
Hydrological
Drought
Runoff

Conceptualisation, development, operational services and institutionalisation of a remote sensing application project
2012+
• Institutional Arrangement at Ministry of Agriculture, GOI
• Creation of MNCFC
• Transfer of NADAMS project to MNCFCApril 2012
• Enhanced end-use of NADAMS project
NADAMS ProjectA success story of
Institutionalization
• IRS WiFS based district / subdistrict level assessment • Participation of user departments1998+
• Use of multiple indices • IRS AWiFS based sub-district level assessment • Decision rules for drought warning & declaration• Enhanced content & frequency of reporting• Institutional participation & Capacity building
2004+
• Conceptualization of NADAMS project at NRSC• Development of Methodology
1988
• Supplementation of WiFS with MODIS • Agricultural area monitoring• Increased number of indices
2002+
2009+
• Operational Services from NRSC• NOAA AVHRR • Regional/district level assessment• Prevalence, intensity and persistence of agricultural
1989 +
• New approach for sowing-period drought assessment• Geospatial products on soil mositure and rainfall• New Indices – Shortwave Angle Slope Index
Institutionalisation phase
Traj
ecto
ry o
f N
AD
AM
S p
roje
ct-
Dev
elo
pm
en
t an
d o
per
atio
nal
ser
vice
s National Agricultural Drought Assessment and
Monitoring Systems (NADAMS)

NADAMS)
Coverage
Information reporting
Satellite derived Indicators/information• NDVI• NDWI/LSWI• EVI• SASI• AMSR E soil moisture
Ground data•Soil• Rainfall• Sown area• Cropping pattern• Irrigation support
OCM 2 NDVI
AWiFSNDVI
District levelSub-district level
Satellite data analysis – Resourcesat, Oceansat, NOAA, Terra, Aqua
NormalMildModerateSevere
End use: • Crop contingency plans• Drought declaration
• Ministry of Agriculture• State Depts. of Agril and Relief• Scientific Organizations
NDWI
Resourcesat AWiFS
AMSR E Soil moisture Spatial Water Balance
(Soil moisture estimation)
Crop SowingFavourable Area
Agricultural drought assessment

Data from multiple satellites
Combination of indices for assessment
Strong ground data base
Sub-district level assessment
Objective and user friendly information
Positive feedback from the User departments
Strengths of NADAMS project
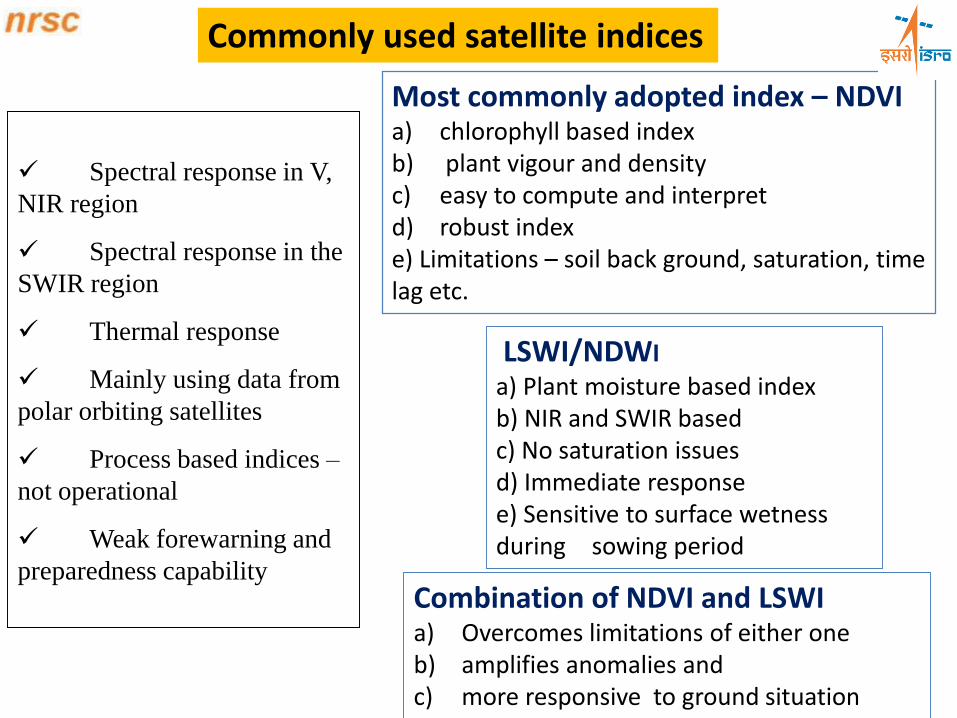
Most commonly adopted index – NDVIa) chlorophyll based indexb) plant vigour and densityc) easy to compute and interpretd) robust indexe) Limitations – soil back ground, saturation, timelag etc.
Commonly used satellite indices
LSWI/NDWI
a) Plant moisture based indexb) NIR and SWIR basedc) No saturation issuesd) Immediate responsee) Sensitive to surface wetness during sowing period
Combination of NDVI and LSWIa) Overcomes limitations of either oneb) amplifies anomalies andc) more responsive to ground situation
Spectral response in V,
NIR region
Spectral response in the
SWIR region
Thermal response
Mainly using data from
polar orbiting satellites
Process based indices –
not operational
Weak forewarning and
preparedness capability

.
-100
-50
0
50
100
150
200
250
300
.
12/6 19/6 6/6 3/710/7 17/7 24/7 31/7 7/8 14/8 21/8 28/8 4/9 11/9 18/9 25/9
% d
evi
atio
n
NDVI response to Agricultural Drought
0
0.1
0.2
0.3
0.4
0.5
0.6
June July Aug. Sept. Oct. Nov.
Month
ND
VI
Normal delayed season Drought
(1) relative deviation from normal, (2) vegetation Condition Index, (3) in season rate of transformation
Integration with ground data
.
0
10
20
30
40
50
60
70
80
90
100
5 J
un
12
Ju
n
19
Ju
n
26
Ju
n
3 J
ul
10
Ju
l
17
Ju
l
24
Ju
l
31
Ju
l
7 A
ug
14
Au
g
21
Au
g
31
Au
g
11
Se
p
18
Se
p
25
Se
p
30
Se
p
% o
f n
orm
al
Seasonal NDVI profiles for drought assessmentWeekly deviations of rainfall
Weekly progression of sown areas
Tie up with ground depts.

Fortnightly NDVI Composites of Resourcesat-2 AWiFS over kharif crop area
Increasing NDVI (greenness)Non-crop area
Jun 01-15, 2016 Jun 16-30, 2016 Jul 01-15, 2016 Jul 16-31, 2016 Aug 01-15, 2016
Aug16-30, 2016 Sep 01-15, 2016 Sep 16-31, 2016 Oct 01-15, 2016 Oct 15-31, 2016
Nov 01-15, 2016 Nov15-31, 2016
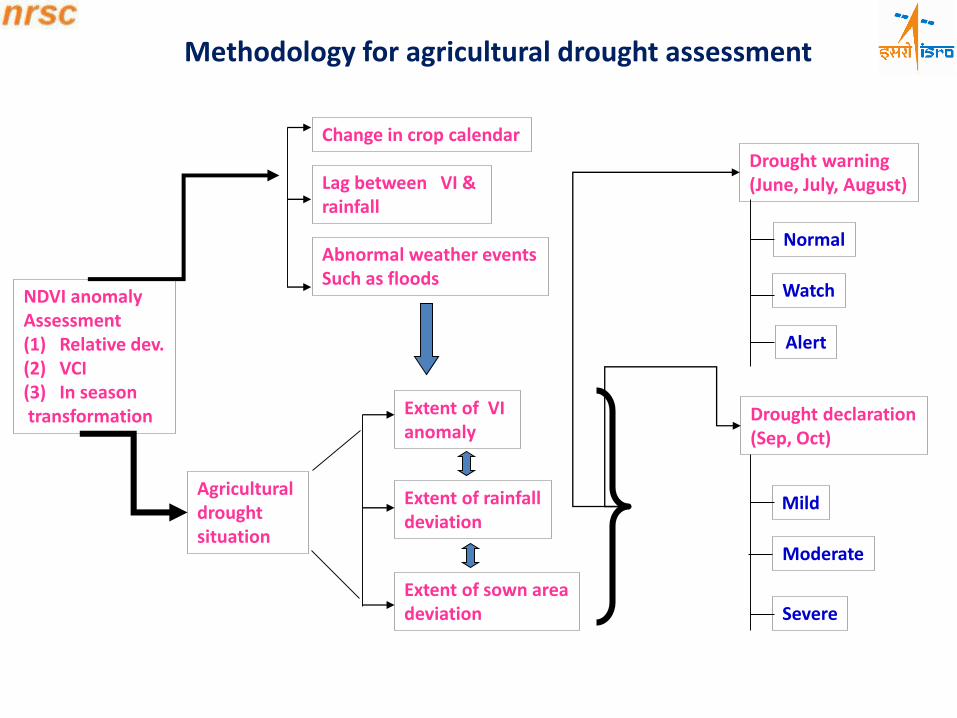
NDVI anomaly Assessment(1) Relative dev.(2) VCI(3) In seasontransformation
Agricultural drought situation
Change in crop calendar
Lag between VI & rainfall
Abnormal weather eventsSuch as floods
Extent of VI anomaly
Extent of rainfalldeviation
Extent of sown areadeviation
Methodology for agricultural drought assessment
Normal
Watch
Alert
Drought warning(June, July, August)
Drought declaration(Sep, Oct)
Mild
Moderate
Severe

NDVI anomaly
% dev. from normal
(actual NDVI-normal NDVI)/normal NDVI*100
Selection of normal year –average of recent past normal years
NDVI is a conservative indicator and hence anomalies are not very high
Thumb rule:> 20% reduction in NDVI – drougtconditions
>30% reduction indicate moderate to severe drought conditions
Interpretation of NDVI changes to assess Agricultural drought

Block level crop condition – Anantpur districtComparison between normal year (2005) and drought year (2002)

Crop area affected by drought in kharif 2015, West Bengal
5
17
40
29
81
0
10
20
30
40
50
< 10 % 10-20%
20-30%
30-40%
40-50%
< 50 %
Agr
iltu
ral a
rea
Aff
ecte
d
(%)
% of reduction in crop condition
Normal
Mild Moderate
Severe
Normal
Mild Moderate
Severe
10
26
47
15
2 00
10
20
30
40
50
< 10 %10-20 %20-30 %30-40 %40-50 %< 50 %
Agr
iltu
ral a
rea
Aff
ecte
d
(%)
% of reduction in crop condition
Normal
Mild Moderate
Severe
23
3931
61 0
0
10
20
30
40
50
Agr
iltu
ral a
rea
Aff
ecte
d (
%)
% of reduction in crop condition
Purulia district Bankura district West Midnapur district

AWiFS derived crop condition anomalies showing agricultural drought situation in Andhra Pradesh, kharif 2011
Sep 2011 Sep 2010 NDVI anomaly Sep 2011
NDWI anomalyOct 2011
0.00
0.10
0.20
0.30
0.40
0.50
FN1-SEP FN2-SEP FN1-OCT FN2-OCT Nov
ND
VI
2010 2011
0.00
0.05
0.10
0.15
0.20
0.25
0.30
0.35
F1SEP F2SEP F1OCT F2OCT F1NOV
ND
WI
2011 2010
NDWI - Roddam mandal, AnantpurNDVI - Roddam mandal, Anantpur
164 mandals394 mandals
562 mandals
Assessment atsub-district level

Resourcesat AWiFS – A work-horse for monitoring Agriculture
AWiFS NDVIOct. 2010 (Drought year)
AWiFS NDVIOct. 2008 (Normal year)
1. Pas. Champaran2. Pur. Champaran3. Sheohar4. Sitamarhi5. Madhubani6. Supal7. Ararai8. Kishanganj9. Purnia10. Madhepura11. Saharsa12. Darbhanga13. Muzaffarpur14. Gopalganj15. Siwan16. Saran17.Vaishali18. Samastipur19. Begusarai
20. Khagaria21. Katihar22. Bhagalpur23. Banka24. Munger25. Lackeesarai26. Sheikhpura27. Nalanda28. Patna29. Bhojpur30. Buxar31. Bhabua32. Rhotas33. Aurangabad34. Jahanabad35. Gaya36. Nawada37. Jamui
-60
-40
-20
0
Jam
ui
Gay
a
Jahan
a…
Bu
xar
Aurang…
Samasti…
Bh
ojp
ur
Nal
and
a
Pat
na
Bhagalp…
% d
evia
tio
n f
rom
n
orm
al
Rainfall deficiency
0
50
100
Jam
ui
Gay
a
Jahan
a…
Bu
xar
Aurang…
Samasti…
Bh
ojp
ur
Nal
and
a
Pat
na
Bhagal…%
of
no
rmal
Crop sown area status
Crop areas affected by agriculturaldrought situation are showing lowerNDVI compared to normal, in kharif 2010in Bihar state.
Agricultural drought assessment
(based on multiple indices; NDVI, NDWI, SASI)
Moderate (103)Severe (55)
Moderate (103)Severe (55)
Satellite derived Area Favourable for Crop Sowing/Crop Sown Area (AFCS) , Lakh ha.
Kharif Nromal
Area
AFCS AFCS Unfavourable
Jul-10 Aug-10 area
37 19 23 14

Satellite based agricultural drought assessment
kharif 2010, West Bengal

0
100
200
300
400
500
-0.20
-0.15
-0.10
-0.05
0.00
0.05
0.10
0.15
0.20
09
Jun
25
Jun
11
Jul
27
Jul
12
Au
g
28
Au
g
13
Se
p
29
Se
p
So
wn
are
a 0
00’
ha
SA
SI
Weeks
SASI Sown area
Response of SASI to crop sown area
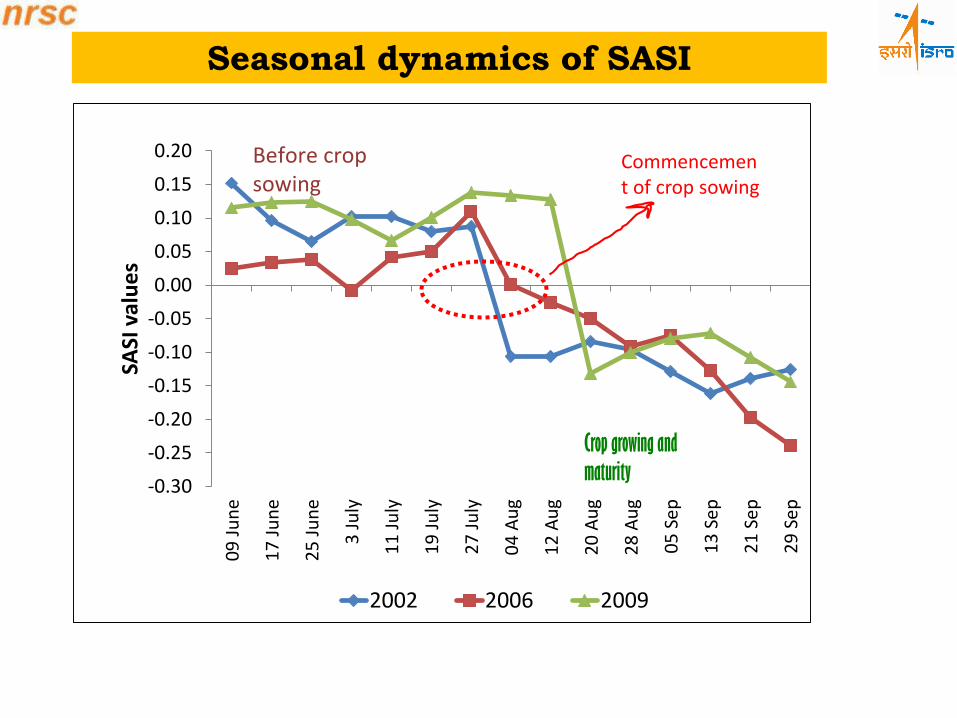
Features SASI value
Dry vegetation low negative
Moist veg. high negative
Shortwave Angle Slope Index (SASI)
βSWIR1 = cos-1 [ (a2 + b2 - c2) /
(2*a*b) ]
Slope = (SWIR2 − NIR)
SASI = βSWIR1 * Slope (radians)
where a, b and c are Euclidian
distances between vertices NIR
and SWIR1, SWIR1 and SWIR2,
and NIR and SWIR2, respectively
Chronological synchronization between(a) Decrease in SASI(b) Increase in rainfall(c) Increase in sown area
NADAMS projectConceptually and computationally simpleprocedures to discriminate the crop sowingfavorable areas at state level
Features SASI value
Dry soil highly positive
Wet soil low positive
-0.30
-0.25
-0.20
-0.15
-0.10
-0.05
0.00
0.05
0.10
0.15
0.20
09
Ju
ne
17
Ju
ne
25
Ju
ne
3 J
uly
11
Ju
ly
19
Ju
ly
27
Ju
ly
04
Au
g
12
Au
g
20
Au
g
28
Au
g
05
Se
p
13
Se
p
21
Se
p
29
Se
p
SASI
val
ue
s
2002 2006 2009
Seasonal dynamics of SASI
Before crop sowing
Crop growing and
maturity
Commencement of crop sowing

Area Favourable for Crop Sowing/Crop Sowan Area (AFCS)
Geospatial product on Area Favourable for Crop Sowing (AFCS)
using multi-criteria approach
Soil Texture
Rice area mask
Kharif areamask
SASIModelledsoil moisture
Input datasets

SeptemberAugust
JulyJune
State Kharif normal
AFCS M ha. Unfavorablearea
state June July Aug Sep
Andhra Pradesh 7.8 2.0 6.8 6.9 7.3 0.4
Bihar 3.7 0.7 3.6 3.7 3.7 0
Chhattisgarh 4.8 3.2 4.8 4.8 4.8 0
Gujarat 8.7 1.3 5.0 5.8 8.1 0.6
Haryana 2.8 0.6 1.6 2.8 2.8 0
Jharkhand 2.5 0.3 2.4 2.5 2.5 0
Karnataka 7.5 3.5 6.0 6.0 7.0 0.5
Madhya Pradesh 10.4 0.7 9.7 10.3 10.4 0
Maharashtra 14.0 5.5 13.2 13.8 13.8 0.2
Odisha 6.3 3.9 6.1 6.2 6.3 0
Rajasthan 14.3 0.2 4.4 11.7 13.6 0.8
Tamil nadu 2.4 1.1 1.8 2.0 2.0 0.4
Uttar Pradesh 9.3 2.8 8.7 9.2 9.3 0
Sub-Total 94.5 25.8 74.2 85.7 91.7 2.9
All India 108.6 34.2 87.0 97.7 105.5 3.1
Area Favourable for Crop Sowing (AFCS) derived from SASI and water balance methodology, Kharif 2012

Soil moisture
Satellite based• Large area, daily coverage• 25-50 km resolution• Increasing popularity Several microwave sensors• SMRR – 1978-1987• TRMM – TMI since 1997• Scatterometer – ERS 1 & 2• ASCAT – MetopA• AMSRE – 2002-2011• SMOS – 2009• SMAP - 2015Retrieval algorithms from passive systems• NASA• LPRM• PRI
Soil moisture important data for hydrology, agriculture, environment, climate system etc.
Sources of soil moisture data
I. Insitu measurements non-spatial data
Manual• accurate• inadequate coverageAutomatic systems• calibration related issues• large area coverage is
expensive
Spatial dataNon-spatial data
Hydrological models
• Mass balance approach• Profile level moisture• Parameterisation of
models – challenge
Soil moisture products from NRSC
• VIC hydrological models – daily soil moisture images
• AMSR 2 LPRM soil moisture 25 km, 2 day frequency
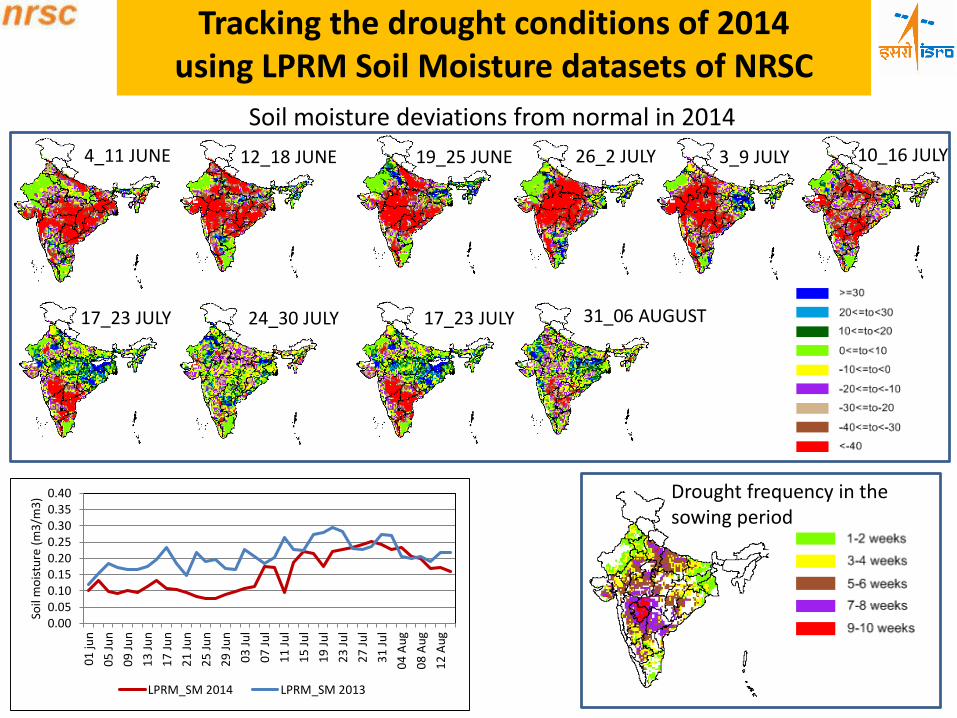
4_11 JUNE 12_18 JUNE 19_25 JUNE 26_2 JULY 3_9 JULY 10_16 JULY
Tracking the drought conditions of 2014 using LPRM Soil Moisture datasets of NRSC
17_23 JULY 24_30 JULY 31_06 AUGUST17_23 JULY
Soil moisture deviations from normal in 2014
0.000.050.100.150.200.250.300.350.40
01
jun
05
Ju
n
09
Ju
n
13
Ju
n
17
Ju
n
21
Ju
n
25
Ju
n
29
Ju
n
03
Ju
l
07
Ju
l
11
Ju
l
15
Ju
l
19
Ju
l
23
Ju
l
27
Ju
l
31
Ju
l
04
Au
g
08
Au
g
12
Au
g
Soil
mo
istu
re (
m3
/m3
)
LPRM_SM 2014 LPRM_SM 2013
Drought frequency in the sowing period

Field enumeration for drought impact assessment and relief management
Mobile Apps. Technology
Improved field data collection system
• Real-time field data collection,
robust & versatile system,
automation etc.
• Surveillance of events, automated
alerts generation and
dissemination
• Objective enumeration system
• Localised crop damages
Field Data Collection using Geo-ICT
Observation Transmission Information Decision Action

Field Data Collection using Geo-ICT Observation Transmission Information Decision Action
Mobile app. from NRSC/ISRO
that allows users to share,
access and upload natural
resources information on a near
real time basis, with Bhuvan
serving as the platform
Crowd sourcing approach with
open source tools like Open
layers, PHP, Geoserver and
Mapserver, etc. for
visualization and uploading
Immense use for agricultural
information collection/analysis
Provision to upload the
information through internet or
customized mobile which will
be geo-tagged for
visualization through Bhuvan
Portal
Geo-tagged in-season field
data enables developing a
repository of agriculture/crop
related data
Successful and On-going applications of FDC• Crop mapping• Pest/disease surveillance• Crop Insurance• Crop damage assessment enumerations• Disaster• Drought impact enumeration.

Exposure • Identification of factors
• Collection of data• Analysis of data• Construction of
composite Index
ExposureIndex (EI)
Sensitivity Index (SI)
AdaptiveCapacityIndex (AI)
Sensitivity
Adaptive Capacity
Agricultural Drought Vulnerability Index (ADVI)
ADVI = EI+SI-AI
Vulnerability framework
Agricultural drought vulnerability
• Degree of susceptibility of an area to agricultural drought due to variable exposure and coping abilities, Vulnerability map helps visualize the hazard and act before potential damage
• Vulnerability information is crucial for long term drought management• A quantitative and multi-dimensional approach for measuring crop-generic agricultural drought
vulnerability status at sub-district level
A. Exposure component1. Total season rainfall
2. Sowing period rainfall
3. Total season rainy days
4. Sowing period rainy days
B. Sensitivity component1. Season’s Integrated NDVI
2. Season’s Maximum NDVI
3. August NDVI
4. Cropping patternC. Adaptive capacitycomponent
1. Soil2. Irrigation support
3. Land holdings
Exposu
re I
ndex
Telangana state
Adap
tiv
e ca
pac
ity In
dex
Sen
siti
vit
y I
nd
ex

Agricultural Drought Vulnerability Index
87 90 9198
76
0
20
40
60
80
100
120
Less.vul Mod.vul. Vul. Highly vul. Very highlyvul.
No
. o
f M
and
als
Category
Telangana state

Agricultural drought vulnerability status of different blocksComposite Index based on exposure, sensitivity and adaptive capacity indices
29
115 114
49
7
020406080
100120140
No
of
blo
cks

0
2
4
6
8
10
12
14
No
of
Blo
cks
District
Less. Vul. Mod.Vul. Vul. High.Vul Very. High.Vul
District wise distribution of blocks in different vulnerability classes
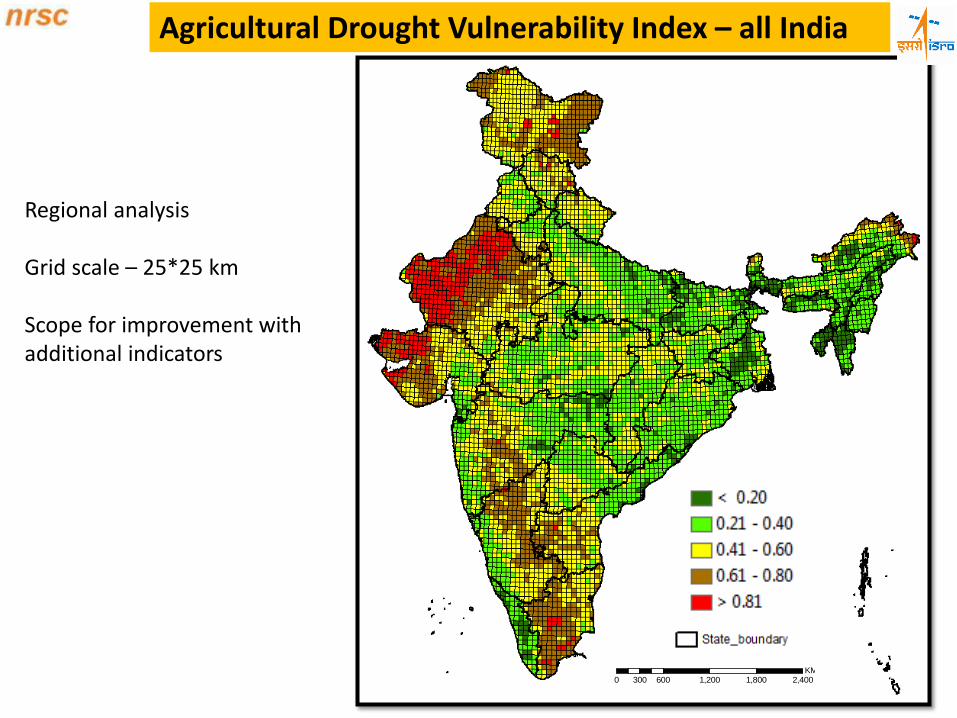
Agricultural Drought Vulnerability Index – all India
0 600 1,200 1,800 2,400300KM
Regional analysis
Grid scale – 25*25 km
Scope for improvement withadditional indicators

Some drought monitoring products over Odisha State

AWiFS NDVI - Odisha – June to November 2016
Jun 01-15, 2016 Jun 16-30, 2016 Jul 01-15, 2016 Jul 16-31, 2016
Aug 01-15, 2016 Aug 16-31, 2016 Sep 01-15, 2016 Sep 16-30, 2016
Oct 01-15, 2016 Oct 16-30, 2016 Nov 01-15, 2016 Nov 16-30, 2016
Increasing NDVI (greenness) Non-crop area

Agricultural area NDVI (AWiFS) at Block levelAugust 2017 August 2016
August 2014
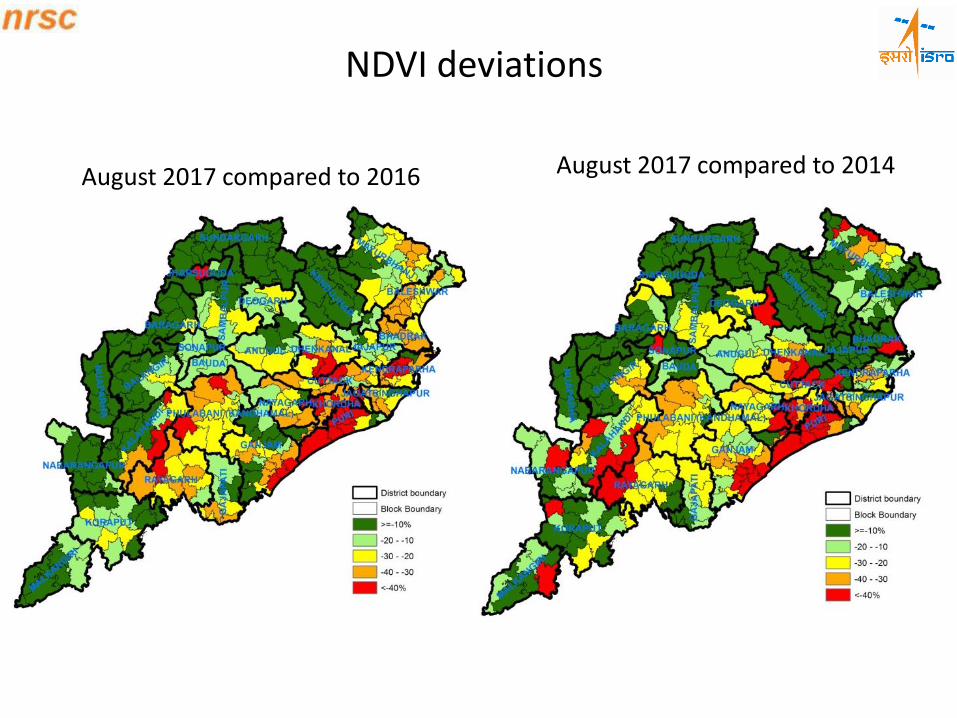
NDVI deviations
August 2017 compared to 2016 August 2017 compared to 2014
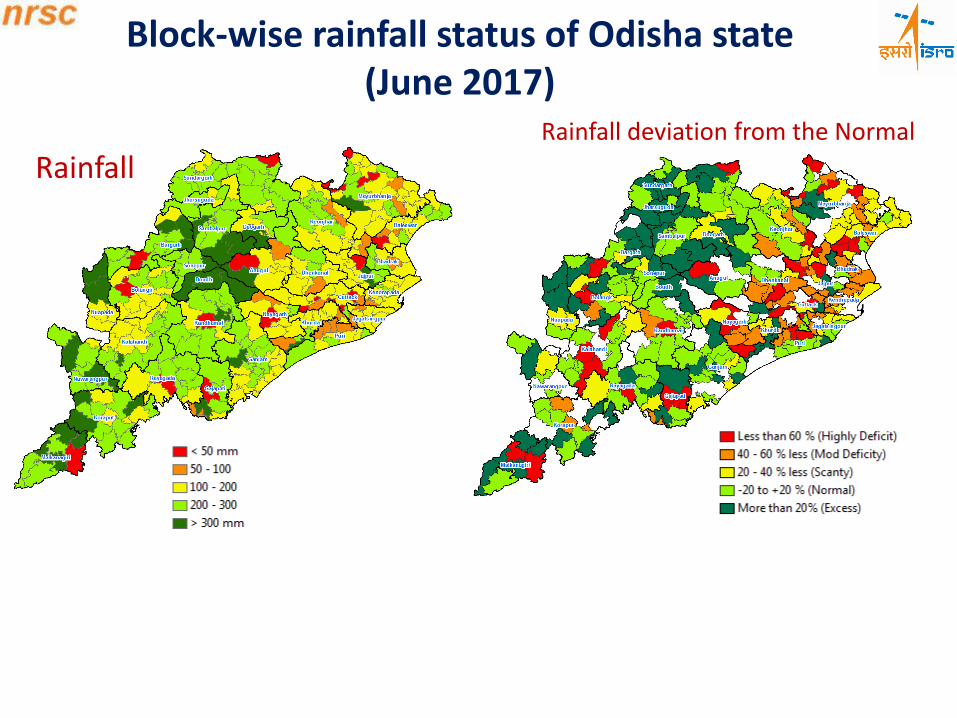
Block-wise rainfall status of Odisha state (June 2017)
RainfallRainfall deviation from the Normal

Block-wise Rainydays status of Odisha state (June 2017)
Rainy Days Rainy days deviation from the Normal

Block-wise rainfall status of Odisha state (July 2017)
Rainfall Rainy days deviation from the Normal
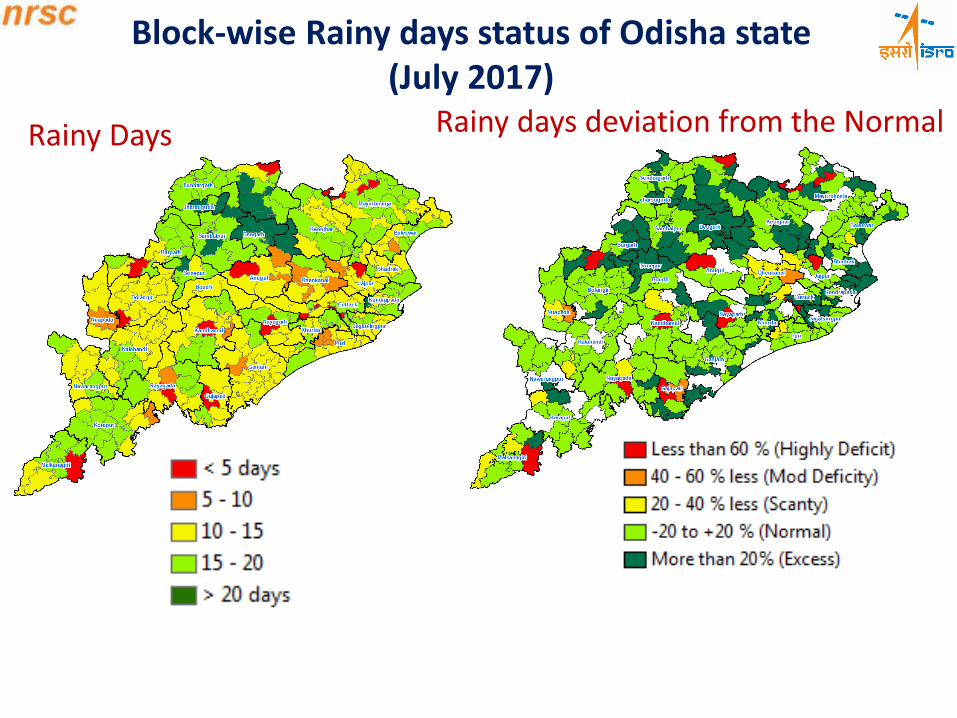
Block-wise Rainy days status of Odisha state (July 2017)
Rainy Days Rainy days deviation from the Normal

Block-wise rainfall status of Odisha state (Aug 2017)
RainfallRainfall deviation from the Normal
Cumulative Rainfall Aug2017 Deviation from Normal August Rainfall

Block-wise Rainydays status of Odisha state (Aug 2017)
Rainydays Rainydays deviation from the Normal
Rainy Days Aug2017Deviation from Normal August Rainy Days
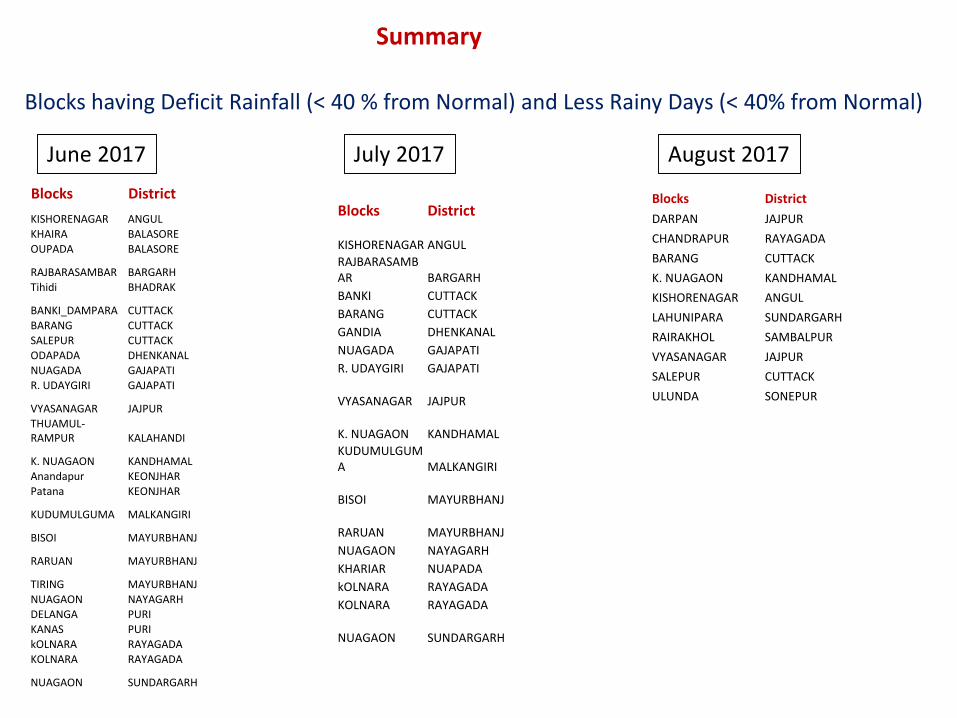
Summary
Blocks having Deficit Rainfall (< 40 % from Normal) and Less Rainy Days (< 40% from Normal)
Blocks District
DARPAN JAJPUR
CHANDRAPUR RAYAGADA
BARANG CUTTACK
K. NUAGAON KANDHAMAL
KISHORENAGAR ANGUL
LAHUNIPARA SUNDARGARH
RAIRAKHOL SAMBALPUR
VYASANAGAR JAJPUR
SALEPUR CUTTACK
ULUNDA SONEPUR
August 2017
Blocks District
KISHORENAGAR ANGULKHAIRA BALASOREOUPADA BALASORE
RAJBARASAMBAR BARGARHTihidi BHADRAK
BANKI_DAMPARA CUTTACKBARANG CUTTACK
SALEPUR CUTTACKODAPADA DHENKANAL
NUAGADA GAJAPATIR. UDAYGIRI GAJAPATI
VYASANAGAR JAJPUR
THUAMUL-RAMPUR KALAHANDI
K. NUAGAON KANDHAMALAnandapur KEONJHAR
Patana KEONJHAR
KUDUMULGUMA MALKANGIRI
BISOI MAYURBHANJ
RARUAN MAYURBHANJ
TIRING MAYURBHANJ
NUAGAON NAYAGARH
DELANGA PURI
KANAS PURI
kOLNARA RAYAGADA
KOLNARA RAYAGADA
NUAGAON SUNDARGARH
June 2017 July 2017
Blocks District
KISHORENAGAR ANGUL
RAJBARASAMBAR BARGARH
BANKI CUTTACK
BARANG CUTTACK
GANDIA DHENKANAL
NUAGADA GAJAPATI
R. UDAYGIRI GAJAPATI
VYASANAGAR JAJPUR
K. NUAGAON KANDHAMAL
KUDUMULGUMA MALKANGIRI
BISOI MAYURBHANJ
RARUAN MAYURBHANJ
NUAGAON NAYAGARH
KHARIAR NUAPADA
kOLNARA RAYAGADA
KOLNARA RAYAGADA
NUAGAON SUNDARGARH

Dry Spells occurrence over Odisha
during 1 June - 31 August 2017
• A Dry Spell is an event of consecutive non-rainy days, i.e. rainfall less than or equal to 2.5 mm
• 10-day and 15-day dry spell events have been identified and mapped during 1 June- 31 August
2017, for 315 blocks of 30 districts of Orissa.
• Block wise daily rainfall provided by the State is the input data
• 103 blocks of 26 Districts were found affected by dry spell events of >=10 days.
• 12 blocks of 8 Districts were found affected by dry spell event of 15 or more days.

Blocks with one or more of dry spell events of >=10 days
Dry spell of >=10 days occurred in 103 blocks of 26 districts of Odisha between 1 June and 31 August 2017
Districts with no dry-spell1. Deogarh2. Kandhamal3. Malkangiri4. Nawarangapur
District
Number of Blocks
affected by dry spell
(>= 10 days)
ANGUL 2
BALASORE 5
BARAGARH 4
BHADRAK 6
BOLANGIR 9
BOUDH 1
CUTTACK 4
DHENKANAL 3
GAJAPATI 2
GANJAM 5
JAGATSINGHPUR 3
JAJPUR 7
JHARSUGUDA 3
KALAHANDI 5
KENDRAPARA 3
KEONJHAR 6
KHORDHA 1
KORAPUT 5
MAYURBHANJ 5
NAYAGARH 4
NUAPADA 4
PURI 7
RAYAGADA 2
SAMBALPUR 2
SUBARNAPUR 2

List of blocks that suffered any event of dry spell of >=10 days
District Blocks District Blocks District Blocks
Banki -Dampada Bolangir
Nischintakoi l i Puintala
Sa l ipur Gudvel la
Ja leswar Tangi -Choudwar Deogaon
Soro Lois ingha
Bahanaga Dhenkanal Patnagarh
Simul ia Gondia Titi lagarh
Khaira Bhuban Bangomunda
Sa intala
Ambabhona
Attabira
Gais i lete Padmapur Bal ikuda
Chhatrapur Naugaon
Bhadrak Ganjam Kujanga
Bhandaripokha
ri Khal ikot
Basudevpur Dharakote Jharsuguda
Bonth Sheragada Laikera
Chandbal i Lakhanpur
Tihidi
ANGULKahiha
BALASORE
DHENKANAL
BOUDH Kantamal
JHARSUGUDA
BARAGARH GAJAPATI
Kashinagar
GANJAM
BHADRAK
JAGATSINGHPUR
BOLANGIR
Chhendipada
CUTTACK

District Block District Block District Block
Karlamunda Gania Jajpur
Th.Rampur Nuagaon Dasarathpur
Junagarh Odagaon Korei
Jaipatna Ranpur Danagadi
Golamunda Sukinda
Boden Barachana
Mohakalpara Khariar Bari
Aul Komana
Rajnagar Nuapara
Banspal Astarang
Patna Brahmagiri
Saharpada Delang
Anandapur Gop
Ghasipura Kakatpur
Hatadihi Kanas
Nimapara
Raygada
Gunupur
Pottangi
Bandhugan Dhankuda
Nandapur Maneswar
Narayanpatna
Laxmipur Binika
Ullanda
Samakhunta
Betanati Hemagiri
Kuliana Subdega
Tiring Balisankara
Thakurmunda
JAJPUR
SAMBALPUR
SUBARNAPUR
MAYURBHANJ SUNDARGARH
KALAHANDI NAYAGARH
NUAPADA KENDRAPARA
KEONJHAR PURI
KHORDHA Begunia
RAYAGADA
KORAPUT
List of blocks that suffered any event of dry spell of >=10 days

Number of Dry Spell events (each event >=10 days) occurred between June and August 17
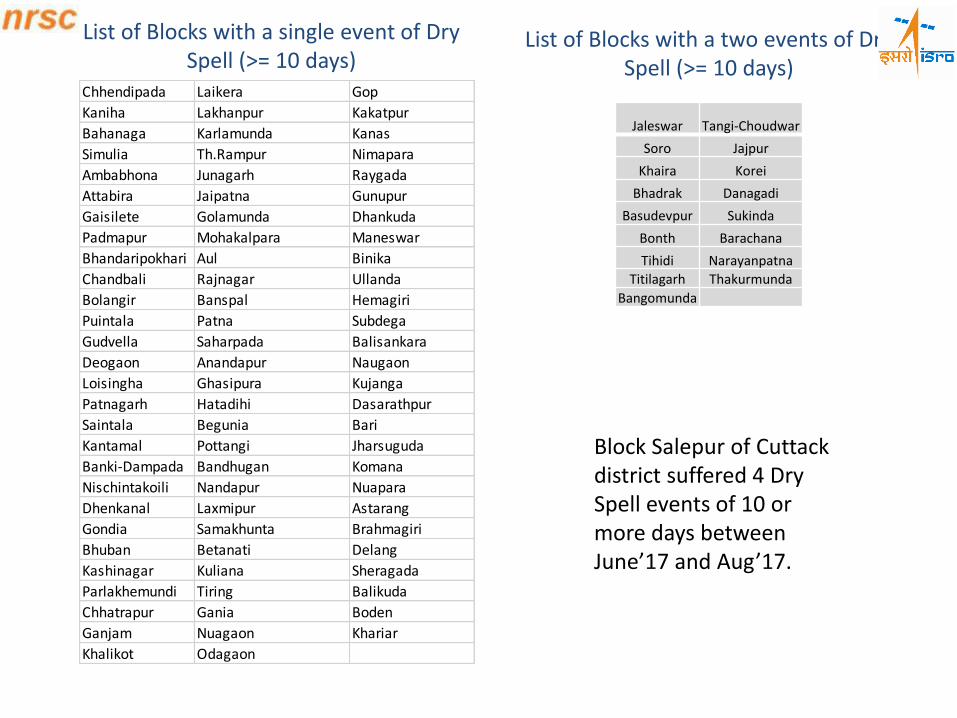
List of Blocks with a single event of Dry Spell (>= 10 days)
Chhendipada Laikera Gop
Kaniha Lakhanpur Kakatpur
Bahanaga Karlamunda Kanas
Simulia Th.Rampur Nimapara
Ambabhona Junagarh Raygada
Attabira Jaipatna Gunupur
Gaisilete Golamunda Dhankuda
Padmapur Mohakalpara Maneswar
Bhandaripokhari Aul Binika
Chandbali Rajnagar Ullanda
Bolangir Banspal Hemagiri
Puintala Patna Subdega
Gudvella Saharpada Balisankara
Deogaon Anandapur Naugaon
Loisingha Ghasipura Kujanga
Patnagarh Hatadihi Dasarathpur
Saintala Begunia Bari
Kantamal Pottangi Jharsuguda
Banki-Dampada Bandhugan Komana
Nischintakoili Nandapur Nuapara
Dhenkanal Laxmipur Astarang
Gondia Samakhunta Brahmagiri
Bhuban Betanati Delang
Kashinagar Kuliana Sheragada
Parlakhemundi Tiring Balikuda
Chhatrapur Gania Boden
Ganjam Nuagaon Khariar
Khalikot Odagaon
List of Blocks with a two events of Dry Spell (>= 10 days)
Jaleswar Tangi-Choudwar
Soro Jajpur
Khaira Korei
Bhadrak Danagadi
Basudevpur Sukinda
Bonth Barachana
Tihidi Narayanpatna
Titilagarh Thakurmunda
Bangomunda
Block Salepur of Cuttack district suffered 4 Dry Spell events of 10 or more days between June’17 and Aug’17.

Blocks with Dry spell of 15 or more daysDistrict
Number of Blocks with Dry spell (>= 15 Days)
ANGUL 1
BALASORE 2
BOLANGIR 3
BOUDH 1
KALAHANDI 1
KEONJHAR 2
MAYURBHANJ 1
NAYAGARH 1
District Block
ANGUL Kaniha
BALASORE Soro
Khaira
Bolangir
BOLANGIR Puintala
Gudvella
BOUDH Kantamal
KALAHANDI Th.Rampur
KEONJHAR Patna
Saharpada
MAYURBHANJ Betanati
NAYAGARH Odagaon
List of Blocks that suffered a dry spell of 15 or more days
12 Blocks of 8 Districts suffered a single event dry spell of 15 or more days.
Dry spell of >=15 days duration

Conclusion
• Development of drought manuals
• Strengthen the drought monitoring and declaration systems
• Adopt integrated approach
• Satellite indices have the potential to capture drought conditions
• Satellite data – free access, easy computations
• Immense scope for automation
• Technology support for drought resilient agriculture
Related Documents