Agricultural and Forest Meteorology 195–196 (2014) 143–151 Contents lists available at ScienceDirect Agricultural and Forest Meteorology j our na l ho me page: www.elsevier.com/locate/agrformet Short communication Monitoring vegetation phenology using an infrared-enabled security camera Anika R. Petach a , Michael Toomey b , Donald M. Aubrecht b , Andrew D. Richardson b,∗ a Harvard University, Department of Earth and Planetary Sciences and School of Engineering and Applied Sciences, Cambridge MA, United States b Harvard University, Department of Organismic and Evolutionary Biology, Cambridge MA, United States a r t i c l e i n f o Article history: Received 14 February 2014 Received in revised form 4 May 2014 Accepted 7 May 2014 Available online 6 June 2014 Keywords: Digital repeat photography Green chromatic coordinate (gCC) Near-surface remote sensing Normalized difference vegetation index (NDVI) Phenology Stress monitoring a b s t r a c t Sensor-based monitoring of vegetation phenology is being widely used to quantify phenological responses to climate variability and change. Digital repeat photography, in particular, can character- ize the seasonality of canopy greenness. However, these data cannot be directly compared to satellite vegetation indices (e.g. NDVI, the normalized difference vegetation index) that require information about vegetation properties at near-infrared (NIR) wavelengths. Here, we develop a new method, using an inex- pensive, NIR-enabled camera originally designed for security monitoring, to calculate a “camera NDVI” from sequential visible and visible + NIR photographs. We use a lab experiment for proof-of-concept, and then test the method using a year of data from an ongoing field campaign in a mixed temperate forest. Our analysis shows that the seasonal cycle of camera NDVI is almost identical to that of NDVI measured using narrow-band radiometric instruments, or as observed from space by the MODIS platform. This cam- era NDVI thus provides different information about the state of the canopy than can be obtained using only visible-wavelength imagery. In addition to phenological monitoring, our method should be useful for a variety of applications, including continuous monitoring of plant stress and quantifying vegetation responses to manipulative treatments in large field experiments. © 2014 Elsevier B.V. All rights reserved. 1. Introduction The phenology of terrestrial vegetation is highly sensitive to cli- mate variability and change (Rosenzweig et al., 2007; Migliavacca et al., 2012). In the context of climate change, phenology is impor- tant because it mediates many of the feedbacks between terrestrial vegetation and the climate system (Richardson et al., 2013a). From an ecological perspective, phenology plays an important role in both competitive interactions and trophic dynamics, as well as in reproductive biology, primary production, and nutrient cycling (Morisette et al., 2009). Satellite remote sensing can provide global coverage of vege- tation phenology, but suffers from tradeoffs between spatial and temporal resolution (Zhang et al., 2006; White et al., 2009). Thus, over the last decade, there has been great enthusiasm for increased on-the-ground monitoring of phenology (Betancourt et al., 2005; Morisette et al., 2009; Polgar and Primack, 2011). The general objec- tive of these efforts is to better understand spatial and temporal ∗ Corresponding author at: HUH, 22 Divinity Avenue, Cambridge, MA 02138, United States. Tel.: +1 617 496 1277. E-mail address: [email protected] (A.D. Richardson). variation in phenology, and how this variability is driven by environmental factors such as temperature, precipitation, and pho- toperiod (or insolation). Citizen science networks, such as the USA National Phenology Network (http://www.usanpn.org) and Project Budburst (http://budburst.org), are playing an important role in this monitoring, by engaging large numbers of motivated volun- teers and establishing standardized protocols. Instrument-based approaches (Richardson et al., 2013b) provide a compelling alternative to observer-based phenology, because of the potential for high frequency, automated data collection in a manner that is scalable for regional or continental monitoring. In this context, digital repeat photography (e.g. Richardson et al., 2007, 2009; Sonnentag et al., 2012) is an attractive option because images can be analyzed either qualitatively or quantitatively, and analysis can focus on individual organisms or integrate across the field of view to obtain a community- or canopy-level perspective. Com- pared to data collected by a human observer, which tend to focus on discrete phenophases, such as flowering or budburst, the entire seasonal trajectory of canopy greenness can be characterized from digital camera imagery. Additionally, the archived images provide a permanent visual record that can be reanalyzed as new tools and questions are developed. Camera-based monitoring (e.g. the Phe- noCam network, http://phenocam.sr.unh.edu/) thus provides data http://dx.doi.org/10.1016/j.agrformet.2014.05.008 0168-1923/© 2014 Elsevier B.V. All rights reserved.

Welcome message from author
This document is posted to help you gain knowledge. Please leave a comment to let me know what you think about it! Share it to your friends and learn new things together.
Transcript

S
Mc
Aa
b
a
ARRAA
KDGNN(PS
1
metvabi(
ttooMt
U
h0
Agricultural and Forest Meteorology 195–196 (2014) 143–151
Contents lists available at ScienceDirect
Agricultural and Forest Meteorology
j our na l ho me page: www.elsev ier .com/ locate /agr formet
hort communication
onitoring vegetation phenology using an infrared-enabled securityamera
nika R. Petacha, Michael Toomeyb, Donald M. Aubrechtb, Andrew D. Richardsonb,∗
Harvard University, Department of Earth and Planetary Sciences and School of Engineering and Applied Sciences, Cambridge MA, United StatesHarvard University, Department of Organismic and Evolutionary Biology, Cambridge MA, United States
r t i c l e i n f o
rticle history:eceived 14 February 2014eceived in revised form 4 May 2014ccepted 7 May 2014vailable online 6 June 2014
eywords:igital repeat photographyreen chromatic coordinate (gCC)ear-surface remote sensing
a b s t r a c t
Sensor-based monitoring of vegetation phenology is being widely used to quantify phenologicalresponses to climate variability and change. Digital repeat photography, in particular, can character-ize the seasonality of canopy greenness. However, these data cannot be directly compared to satellitevegetation indices (e.g. NDVI, the normalized difference vegetation index) that require information aboutvegetation properties at near-infrared (NIR) wavelengths. Here, we develop a new method, using an inex-pensive, NIR-enabled camera originally designed for security monitoring, to calculate a “camera NDVI”from sequential visible and visible + NIR photographs. We use a lab experiment for proof-of-concept, andthen test the method using a year of data from an ongoing field campaign in a mixed temperate forest.Our analysis shows that the seasonal cycle of camera NDVI is almost identical to that of NDVI measured
ormalized difference vegetation indexNDVI)henologytress monitoring
using narrow-band radiometric instruments, or as observed from space by the MODIS platform. This cam-era NDVI thus provides different information about the state of the canopy than can be obtained usingonly visible-wavelength imagery. In addition to phenological monitoring, our method should be usefulfor a variety of applications, including continuous monitoring of plant stress and quantifying vegetationresponses to manipulative treatments in large field experiments.
© 2014 Elsevier B.V. All rights reserved.
. Introduction
The phenology of terrestrial vegetation is highly sensitive to cli-ate variability and change (Rosenzweig et al., 2007; Migliavacca
t al., 2012). In the context of climate change, phenology is impor-ant because it mediates many of the feedbacks between terrestrialegetation and the climate system (Richardson et al., 2013a). Fromn ecological perspective, phenology plays an important role inoth competitive interactions and trophic dynamics, as well as
n reproductive biology, primary production, and nutrient cyclingMorisette et al., 2009).
Satellite remote sensing can provide global coverage of vege-ation phenology, but suffers from tradeoffs between spatial andemporal resolution (Zhang et al., 2006; White et al., 2009). Thus,ver the last decade, there has been great enthusiasm for increased
n-the-ground monitoring of phenology (Betancourt et al., 2005;orisette et al., 2009; Polgar and Primack, 2011). The general objec-ive of these efforts is to better understand spatial and temporal
∗ Corresponding author at: HUH, 22 Divinity Avenue, Cambridge, MA 02138,nited States. Tel.: +1 617 496 1277.
E-mail address: [email protected] (A.D. Richardson).
ttp://dx.doi.org/10.1016/j.agrformet.2014.05.008168-1923/© 2014 Elsevier B.V. All rights reserved.
variation in phenology, and how this variability is driven byenvironmental factors such as temperature, precipitation, and pho-toperiod (or insolation). Citizen science networks, such as the USANational Phenology Network (http://www.usanpn.org) and ProjectBudburst (http://budburst.org), are playing an important role inthis monitoring, by engaging large numbers of motivated volun-teers and establishing standardized protocols.
Instrument-based approaches (Richardson et al., 2013b) providea compelling alternative to observer-based phenology, because ofthe potential for high frequency, automated data collection in amanner that is scalable for regional or continental monitoring. Inthis context, digital repeat photography (e.g. Richardson et al., 2007,2009; Sonnentag et al., 2012) is an attractive option because imagescan be analyzed either qualitatively or quantitatively, and analysiscan focus on individual organisms or integrate across the field ofview to obtain a community- or canopy-level perspective. Com-pared to data collected by a human observer, which tend to focuson discrete phenophases, such as flowering or budburst, the entireseasonal trajectory of canopy greenness can be characterized from
digital camera imagery. Additionally, the archived images providea permanent visual record that can be reanalyzed as new tools andquestions are developed. Camera-based monitoring (e.g. the Phe-noCam network, http://phenocam.sr.unh.edu/) thus provides data
1 rest Meteorology 195–196 (2014) 143–151
ao
lctc�autacae
g
G
awdsrwtdN
N
pmotbats2tmtmccNRmdr
ctsatectemwc
Fig. 1. Reflectance spectra of the 51 samples (thin gray lines) used in the laboratory
44 A.R. Petach et al. / Agricultural and Fo
t a spatial scale that is intermediate between ground observationsf individual plants and satellite remote sensing.
To date, most camera-based monitoring of vegetation pheno-ogy has been conducted using standard, consumer-grade digitalameras (e.g. Sonnentag et al., 2012). These typically record ahree-layer image (red, green and blue: RGB), which is suffi-ient for the representation of colors in the visible spectrum (VIS,
= 400–700 nm) as perceived by the human eye. For quantitativenalysis, the average value of each color layer for all pixels within aser-defined region of interest (ROI) is extracted from each imageo yield a digital number triplet (RDN, GDN, BDN). Then seasonal vari-tion in the state of the canopy is characterized by the use of severalolor indices, such as the green chromatic coordinate (gCC, Eq. (1a))nd excess green (Gex, Eq. (1b)) (Sonnentag et al., 2012; Richardsont al., 2013b):
CC = GDN
RDN + GDN + BDN(1a)
EX = 2GDN − (RDN + BDN) (1b)
Conversely, satellite remote sensing of vegetation has tradition-lly used both visible and near-infrared (NIR, � = 700–1400 nm)avelengths. The reason for this is that healthy vegetation can beistinguished from other land cover types by its unique spectralignature, which combines low reflectance in the VIS with higheflectance in the NIR. Thus, the camera indices presented above,hich are based only VIS wavelengths, are not directly comparable
o standard satellite vegetation indices such as NDVI (normalizedifference vegetation index, Eq. (1c)), calculated from red band andIR band reflectances (�R and �NIR, respectively) (Tucker, 1979).
DVI = �R − �NIR
�R + �NIR(1c)
Intriguingly, the CCD (charge-coupled device) or CMOS (com-lementary metal-oxide-semiconductor) imaging sensors used inost digital cameras are sensitive to wavelengths in the NIR portion
f the spectrum. An infrared cut filter is typically used to blockhese wavelengths from reaching the imaging sensor, as they areeyond the spectral range to which the human eye is sensitive andre thus not necessary for conventional color photography. Cus-omized cameras have been used in the past to leverage this NIRensitivity (Shibayama et al., 2009, 2011; Sakamoto et al., 2010,012; Nijland et al., 2013). For example, using a two-camera sys-em Sakamoto et al. (2012) calculated an NDVI-style index that was
ore akin to the conventional NDVI than either gCC or GEX. Thewo-camera approach allows for simultaneous recording of infor-
ation about the VIS and NIR properties of vegetation, but createshallenges related to camera alignment, cross-calibration, and syn-hronization of image capture. Very recently, relatively low-costDVI cameras have become available (e.g. MaxMax, Event-38, andegent brands), but these have not been produced with long-termonitoring in mind, and such cameras are unable to also pro-
uce conventional RGB imagery—that is, infrared wavelengths areecorded at the expense of information in one of the RGB channels.
Here, we show that a commercially available, network-enabledamera (“webcam”) with a software-controlled infrared cut fil-er overcomes the above limitations. With the cut filter in place,tandard 3-layer RGB imagery is recorded; with the filter removed,
monochrome RGB + NIR image is obtained. We develop a methodo compute an NDVI-style vegetation index, which we call “cam-ra NDVI”, from this imagery. A lab experiment, conducted underontrolled conditions, is used as a proof-of-concept. We then applyhe method to a one-year archive of images from the Harvard For-
st to demonstrate the feasibility of employ this method for fieldonitoring of vegetation phenology, where day-to-day variation ineather and lighting cause additional challenges. As a final test, weompare the seasonality of camera NDVI from the Harvard Forest
experiment. The heavier black lines indicate representative spectra from a healthygreen leaf (bottom), a yellowing leaf (middle), and a red (top) leaf.
data with that obtained using co-located narrow-band radiometricinstruments and from satellite sensors. Data from our camera sys-tem will be of value for quality assessment of phenology productsderived from satellite imagery (e.g. White et al., 2009).
2. Materials and methods
2.1. Camera
We used a NetCam SC IR (StarDot Technologies, Buena Park, CA)camera, featuring a Micron ½′′ CMOS active-pixel digital imagingsensor and configured for 1.3 megapixel (1296 × 976) output. Thecamera was set at manual (fixed) white balance and, unless other-wise noted, automatic exposure. With a built-in uClinux operatingsystem, the camera operates as a standalone system with Internetconnectivity. Command scripts running on the camera controlledthe infrared cut filter, image capture, and image upload to a remoteserver via FTP. The customized scripts used here are available in the“Tools” section of the PhenoCam project page (http://phenocam.sr.unh.edu/webcam/tools/) or from the corresponding author.
2.2. Proof-of-concept lab experiment
We conducted a lab experiment to evaluate whether cameraimagery can be used to accurately characterize the broadband spec-tral properties of different materials. We used the StarDot camerato record sequential color RGB and monochrome RGB + NIR imagesof materials with a wide range of spectral signatures (Fig. 1). Eachsample was illuminated from above with a 50 W Halogen lampdesigned for indoor diffuse reflectance measurements (ASD Pro-Lamp, Analytical Spectral Devices Inc., Boulder, CO). The StarDotcamera was mounted on a tripod to the side of the sample andinclined downward at an angle of about 45◦. Each sample filledapproximately one-quarter of the camera’s field of view. For qualityassurance, we included a multi-color reference panel in each image,made by painting red, green, blue, white and gray strips on a flatpiece of plastic. We recorded four images of each sample: one imageat fixed exposure (1/300 s) for both color RGB and monochromeRGB + NIR images, and one image at automatic exposure for bothcolor RGB and monochrome RGB + NIR. Automatic exposure val-ues were determined by the camera. The mean automatic exposurefor the color RGB images was 1/30 s (minimum 1/120 s), compared
with 1/200 s (minimum 1/350 s) for the monochrome RGB + NIRimages. Thus the fixed exposure images were almost always under-exposed compared to the automatic exposure images.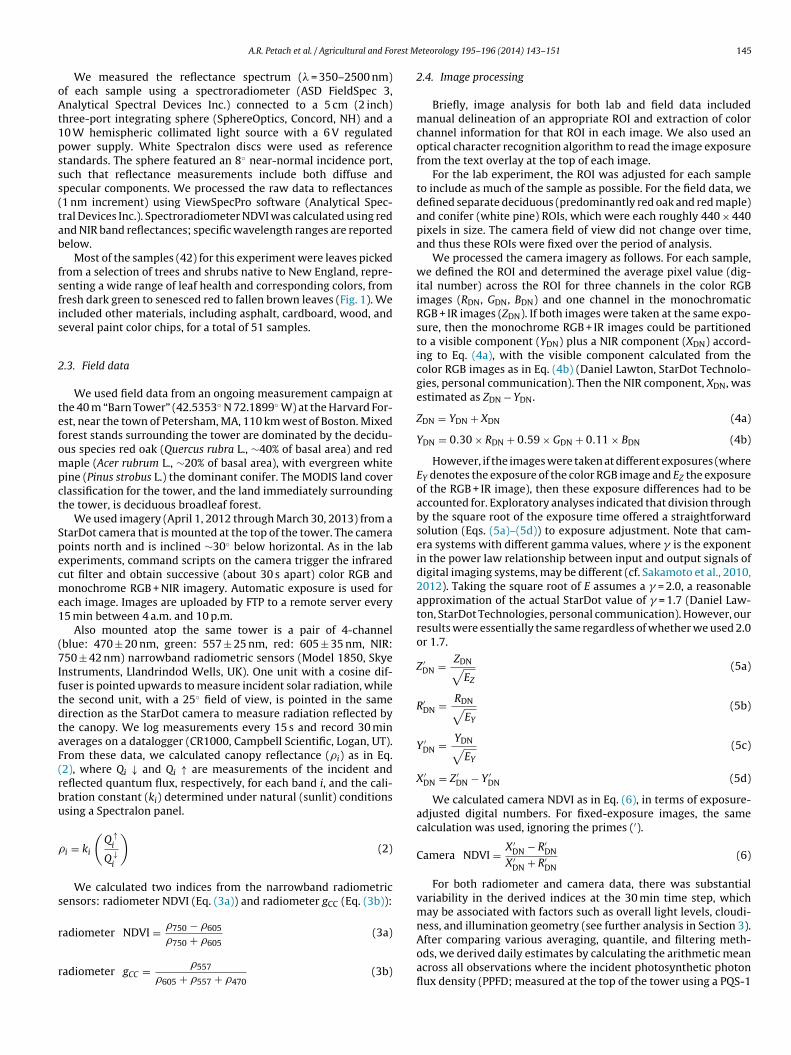
rest M
oAt1psss(tab
fsfis
2
tefompct
Specme1
(7IftdtaF(rbu
�
s
r
r
A.R. Petach et al. / Agricultural and Fo
We measured the reflectance spectrum (� = 350–2500 nm)f each sample using a spectroradiometer (ASD FieldSpec 3,nalytical Spectral Devices Inc.) connected to a 5 cm (2 inch)
hree-port integrating sphere (SphereOptics, Concord, NH) and a0 W hemispheric collimated light source with a 6 V regulatedower supply. White Spectralon discs were used as referencetandards. The sphere featured an 8◦ near-normal incidence port,uch that reflectance measurements include both diffuse andpecular components. We processed the raw data to reflectances1 nm increment) using ViewSpecPro software (Analytical Spec-ral Devices Inc.). Spectroradiometer NDVI was calculated using rednd NIR band reflectances; specific wavelength ranges are reportedelow.
Most of the samples (42) for this experiment were leaves pickedrom a selection of trees and shrubs native to New England, repre-enting a wide range of leaf health and corresponding colors, fromresh dark green to senesced red to fallen brown leaves (Fig. 1). Wencluded other materials, including asphalt, cardboard, wood, andeveral paint color chips, for a total of 51 samples.
.3. Field data
We used field data from an ongoing measurement campaign athe 40 m “Barn Tower” (42.5353◦ N 72.1899◦ W) at the Harvard For-st, near the town of Petersham, MA, 110 km west of Boston. Mixedorest stands surrounding the tower are dominated by the decidu-us species red oak (Quercus rubra L., ∼40% of basal area) and redaple (Acer rubrum L., ∼20% of basal area), with evergreen white
ine (Pinus strobus L.) the dominant conifer. The MODIS land coverlassification for the tower, and the land immediately surroundinghe tower, is deciduous broadleaf forest.
We used imagery (April 1, 2012 through March 30, 2013) from atarDot camera that is mounted at the top of the tower. The cameraoints north and is inclined ∼30◦ below horizontal. As in the labxperiments, command scripts on the camera trigger the infraredut filter and obtain successive (about 30 s apart) color RGB andonochrome RGB + NIR imagery. Automatic exposure is used for
ach image. Images are uploaded by FTP to a remote server every5 min between 4 a.m. and 10 p.m.
Also mounted atop the same tower is a pair of 4-channelblue: 470 ± 20 nm, green: 557 ± 25 nm, red: 605 ± 35 nm, NIR:50 ± 42 nm) narrowband radiometric sensors (Model 1850, Skye
nstruments, Llandrindod Wells, UK). One unit with a cosine dif-user is pointed upwards to measure incident solar radiation, whilehe second unit, with a 25◦ field of view, is pointed in the sameirection as the StarDot camera to measure radiation reflected byhe canopy. We log measurements every 15 s and record 30 minverages on a datalogger (CR1000, Campbell Scientific, Logan, UT).rom these data, we calculated canopy reflectance (�i) as in Eq.2), where Qi ↓ and Qi ↑ are measurements of the incident andeflected quantum flux, respectively, for each band i, and the cali-ration constant (ki) determined under natural (sunlit) conditionssing a Spectralon panel.
i = ki
(Q↑
i
Q↓i
)(2)
We calculated two indices from the narrowband radiometricensors: radiometer NDVI (Eq. (3a)) and radiometer gCC (Eq. (3b)):
�750 − �605
adiometer NDVI =�750 + �605(3a)
adiometer gCC = �557
�605 + �557 + �470(3b)
eteorology 195–196 (2014) 143–151 145
2.4. Image processing
Briefly, image analysis for both lab and field data includedmanual delineation of an appropriate ROI and extraction of colorchannel information for that ROI in each image. We also used anoptical character recognition algorithm to read the image exposurefrom the text overlay at the top of each image.
For the lab experiment, the ROI was adjusted for each sampleto include as much of the sample as possible. For the field data, wedefined separate deciduous (predominantly red oak and red maple)and conifer (white pine) ROIs, which were each roughly 440 × 440pixels in size. The camera field of view did not change over time,and thus these ROIs were fixed over the period of analysis.
We processed the camera imagery as follows. For each sample,we defined the ROI and determined the average pixel value (dig-ital number) across the ROI for three channels in the color RGBimages (RDN, GDN, BDN) and one channel in the monochromaticRGB + IR images (ZDN). If both images were taken at the same expo-sure, then the monochrome RGB + IR images could be partitionedto a visible component (YDN) plus a NIR component (XDN) accord-ing to Eq. (4a), with the visible component calculated from thecolor RGB images as in Eq. (4b) (Daniel Lawton, StarDot Technolo-gies, personal communication). Then the NIR component, XDN, wasestimated as ZDN − YDN.
ZDN = YDN + XDN (4a)
YDN = 0.30 × RDN + 0.59 × GDN + 0.11 × BDN (4b)
However, if the images were taken at different exposures (whereEY denotes the exposure of the color RGB image and EZ the exposureof the RGB + IR image), then these exposure differences had to beaccounted for. Exploratory analyses indicated that division throughby the square root of the exposure time offered a straightforwardsolution (Eqs. (5a)–(5d)) to exposure adjustment. Note that cam-era systems with different gamma values, where � is the exponentin the power law relationship between input and output signals ofdigital imaging systems, may be different (cf. Sakamoto et al., 2010,2012). Taking the square root of E assumes a � = 2.0, a reasonableapproximation of the actual StarDot value of � = 1.7 (Daniel Law-ton, StarDot Technologies, personal communication). However, ourresults were essentially the same regardless of whether we used 2.0or 1.7.
Z ′DN = ZDN√
EZ
(5a)
R′DN = RDN√
EY
(5b)
Y ′DN = YDN√
EY
(5c)
X ′DN = Z ′
DN − Y ′DN (5d)
We calculated camera NDVI as in Eq. (6), in terms of exposure-adjusted digital numbers. For fixed-exposure images, the samecalculation was used, ignoring the primes (′).
Camera NDVI = X ′DN − R′
DNX ′
DN + R′DN
(6)
For both radiometer and camera data, there was substantialvariability in the derived indices at the 30 min time step, whichmay be associated with factors such as overall light levels, cloudi-ness, and illumination geometry (see further analysis in Section 3).
After comparing various averaging, quantile, and filtering meth-ods, we derived daily estimates by calculating the arithmetic meanacross all observations where the incident photosynthetic photonflux density (PPFD; measured at the top of the tower using a PQS-1
1 rest Meteorology 195–196 (2014) 143–151
qtiaar
rtffaT(eri
r
3
3
spytiilw
na(Snrtwob
amirrF(c
ieblmrwXTre>
Fig. 2. Correlation of digital number (color bands extracted from fixed-exposurecamera imagery) and mean reflectance (measured with a spectroradiometer) forn = 51 samples in laboratory experiment. (a) Mean reflectance from 570 to 660 nm vs.
46 A.R. Petach et al. / Agricultural and Fo
uantum sensor, Kipp & Zonen, Delft, the Netherlands) was greaterhan 200 �mol m−2 s−1. This method reduced day-to-day variabil-ty in the resulting time series better than the 90th percentilepproach used by Sonnentag et al. (2012), although an obviousdvantage of the latter approach is that it does not require solaradiation data.
Because R′DN and X ′
DN are not direct measurements ofeflectance, the magnitude of camera NDVI depends on the spec-ral distribution of the incident light. Thus, camera NDVI valuesrom the lab experiments are not directly comparable to thoserom the field experiment, and those from the field experimentre not comparable to either radiometer or satellite NDVI values.o compensate for this, we re-scaled field-measured camera NDVIyielding camera NDVIR) by estimating the coefficients of a lin-ar regression between camera NDVI (for the deciduous ROI) andadiometer NDVI, where a is a slope coefficient, b is the y-axisntercept and ε is the model residual:
adiometer NDVI = a(camera NDVI) + b + ε (7)
. Results
.1. Lab experiment
Spectral reflectance signatures differ markedly among the 51amples scanned by the spectroradiometer (Fig. 1). There areronounced differences in reflectance spectra between green,ellowing, and red leaves, but the non-foliar samples added greatlyo the variability among samples across both visible and near-nfrared wavelengths. The variation in reflectance across sampless smallest for violet and blue (400–500 nm) wavelengths, andargest for red (620–700 nm) and near infrared (700–1000 nm)
avelengths.For the fixed exposure imagery (results not illustrated), digital
umbers extracted from camera imagery for the red channel (RDN)re well correlated with mean reflectance over red wavelengths620–700 nm) measured with the spectroradiometer (r = 0.91).imilarly, digital numbers for the near infrared (XDN) compo-ent of the RGB + NIR imagery are well correlated with meaneflectance over NIR wavelengths (700–1000 nm) measured withhe spectroradiometer (r = 0.87). Camera NDVI is well correlatedith spectroradiometer NDVI using these broad bands (r = 0.91),
r using the spectral range of MODIS bands (band 1 = 620–670 nm,and 2 = 841–867 nm) (r = 0.93).
We used an iterative procedure to identify the wavelengthscross which reflectance measured by the spectroradiometer isost highly correlated with RDN and XDN from the fixed exposure
magery. For RDN, we obtained a correlation of r = 0.96 across theange from 570 to 660 nm (Fig. 2A), whereas for XDN, we find a cor-elation of r = 0.91 across the range from 805 to 815 nm (Fig. 2B).or the fixed exposure imagery, there is an excellent correlationr = 0.99) between camera NDVI and spectroradiometer NDVI cal-ulated using these particular bands (Fig. 2C).
We conducted a similar analysis for the automatic exposuremagery. Exposure-adjusted digital numbers (Eqs. (5b) and (5d)) forach channel are best correlated with mean reflectance, measuredy the spectroradiometer, across an appropriate range of wave-
engths (Fig. 3). For example, B′DN is most strongly correlated with
ean reflectance across violet and blue wavelengths (430–515 nm, = 0.92), G′
DN with green wavelengths (510–570 nm, r = 0.94), R′DN
ith yellow and red wavelength (575–710 nm, r = 0.96; Fig. 4A), and′DN with near infrared wavelengths (800–815 nm, r = 0.88; Fig. 4B).
he contour plots in Fig. 3 show how the strength of these cor-elations tended to fall off rapidly outside the optimal range. Forxample, R′DN is not well correlated with wavelengths <575 nm or710 nm, and X ′
DN is not well correlated with wavelengths <700 nm.
digital number of camera red channel (RDN); (b) mean reflectance from 805–815 nmvs. digital number of NIR component of camera RGB + NIR imagery (XDN); (c) spec-troradiometer NDVI vs. camera NDVI calculated using RDN and XDN.
For the automatic exposure imagery, camera NDVI is very wellcorrelated with spectroradiometer NDVI using either the most-highly correlated bands identified here (i.e. red 575–710 nm andNIR 800–815 nm; r = 0.96, Fig. 4C), or the standard MODIS bands(r = 0.94).
Results from the lab experiment demonstrate the potential ofthe StarDot camera imagery for characterizing the spectral proper-ties of diverse materials, particularly in red and near infrared bands.By processing sequential VIS and VIS + NIR images, we are able to

A.R. Petach et al. / Agricultural and Forest Meteorology 195–196 (2014) 143–151 147
F l numr oradio( lor in
bsdeecivTfii
3
bseipsaafeciT(tbcu
ig. 3. Contour plot showing linear correlation (Pearson’s r) of pixel values (digitaeflectance over the region from �1 (x axis) to �2 (y axis) nm, as measured on a spectrd) NIR component of RGB + NIR imagery. (For interpretation of the references to co
ack-calculate the NIR component. Furthermore, this experimenthows that camera NDVI is strongly correlated with spectrora-iometer NDVI when using either fixed exposure or automaticxposure imagery. Since field images are recorded with automaticxposures to optimize dynamic range under varying illuminationonditions, our ability to correct for variations in exposure is crit-cal. These lab results prove that camera NDVI is sensitive to theariation in reflectances of a wide range of materials and surfaces.his indicates the potential for monitoring canopy phenology in theeld using a similar approach to characterize the seasonal variation
n canopy optical properties, as described in the following section.
.2. Field measurements
The green chromatic coordinate calculated from the narrow-and radiometric sensors, radiometer gCC (Fig. 5A), exhibits aeasonal pattern that is typical of deciduous forests (e.g. Sonnentagt al., 2012; Richardson et al., 2013b). Radiometer gCC rises rapidlyn spring with budburst (day 115–120) and leaf development to aronounced spiky peak (day 140; see Keenan et al., 2014, for discus-ion), before decreasing gradually over the course of the summer,nd then declining rapidly (day 250) in autumn with leaf colorationnd abscission (day 300). For the deciduous ROI, camera gCC (Fig. 5B)ollows essentially the same seasonal pattern, with the notablexception of a more pronounced dip in greenness around day 290,orresponding to the peak of autumn colors and a marked increasen canopy redness that is clearly visible in the RGB camera imagery.he coniferous ROI shows a seasonally varying signal in camera gCCFig. 5C), but with substantially smaller amplitude than that for
he deciduous ROI, reflecting the year-round presence of foliageut nevertheless indicating seasonal variation in foliar chlorophylloncentrations (Richardson et al., 2009). The start of spring green-p also begins about 30 days earlier, and the end of the autumnbers) of individual color bands, from digital camera imagery, with mean spectralmeter. (a) Camera blue channel; (b) camera green channel; (c) camera red channel;
this figure legend, the reader is referred to the web version of this article.)
decline ends about 60 days later, for the coniferous ROI comparedto the deciduous ROI.
By contrast, the seasonal cycle of radiometer NDVI differs fromthat of radiometer (or camera) gCC (Fig. 5D). The primary differenceis the absence of the spike seen in gCC around day 140. A sec-ondary difference is the presence of a broad plateau in radiometerNDVI from about day 130 to day 240. As a result, radiometer NDVIgives a better representation of the seasonal dynamics of canopyleaf area index (LAI) than does radiometer gCC (e.g. compare withFig. 1 in Richardson et al., 2012). Additionally, the seasonal cycleof radiometer NDVI roughly parallels (and is comparable in magni-tude to) that of MODIS NDVI (Fig. 5D). In particular, the timing ofthe spring increase and autumn decrease in NDVI is similar in bothtime series. However, during the winter months the MODIS dataare somewhat noisier than the radiometer data.
There is a strong linear relationship (R2 = 0.89) betweenradiometer NDVI and camera NDVI for the deciduous ROI. Thebest-fit linear scaling coefficients (Eq. (7)) are a = 0.53 ± 0.02 SEand b = 0.84 ± 0.01, with �(ε) = 0.041. Henceforth, we focus on therescaled time series, camera NDVIR, for which the seasonal cycle ismuch more similar in shape to that of radiometer NDVI than cameragCC. For example, the relative rate of increase in both radiometerNDVI and camera NDVIR for the deciduous region of interest inspring is more gradual than the corresponding rate of increase inradiometer or camera gCC, and conspicuously absent in the cam-era NDVIR data for the deciduous region of interest is the gCC spikethat occurs around day 140. For the coniferous region of interest,camera gCC shows a seasonal pattern that is less pronounced thanthat for the deciduous region of interest. However, there is no clear
seasonal cycle in the camera NDVIR data for the coniferous regionof interest. Together, these results suggest that camera NDVI is cap-turing different aspects of seasonal canopy dynamics than indices,such as gCC, that are based only on visible wavelengths (cf. Nijland
148 A.R. Petach et al. / Agricultural and Forest M
Fig. 4. Correlation of exposure-adjusted digital number (color bands extracted fromauto-exposure camera imagery) and mean reflectance (measured with a spectrora-diometer) for n = 51 samples in laboratory experiment. (a) Mean reflectance from575 to 710 nm vs. exposure-adjusted digital number of camera red channel (R′
DN);(Nc
emoii
3
sotc
b) mean reflectance from 800 to 815 nm vs. exposure-adjusted digital number ofIR component of camera RGB + NIR imagery (X ′
DN); (c) spectroradiometer NDVI vs.amera NDVI calculated using R′
DN and X ′DN vs. spectroradiometer NDVI.
t al., 2013). The use of both gCC and camera NDVI together giveore information than can be obtained from either index on its
wn. The advantage of gCC is that it is sensitive to leaf color, whichs related to pigmentation (Keenan et al., 2014), while camera NDVIs a better proxy for LAI.
.3. Non-phenological sources of variability in camera NDVI
Even with averaging of 30-min data to a daily product, the
ignal-to-noise ratio of camera NDVIR is somewhat lower than thatf camera gCC (day-to-day variability being equal to about 8% ofhe seasonal amplitude for camera NDVIR, compared with 5% foramera gCC; compare Fig. 5B and E), and indeed also lower thaneteorology 195–196 (2014) 143–151
that of radiometer NDVI (compare Fig. 5E and D). Of course, someof the variation in both camera NDVI and radiometer NDVI canpotentially be attributed to sky condition, shadow fraction, and illu-mination geometry, all of which can change over the course of theday or between one day and the next. And, some of this variabilityis undoubtedly the result of the brief (30 s) lag between the VIS andVIS + NIR imagery, which is unavoidable as the camera needs sometime to adjust after the cut filter has been triggered on or off.
We further investigate some of the factors associated with vari-ability in camera NDVIR using the 30-min data, focusing on theperiod from day 160 to day 200, when camera NDVIR for thedeciduous region of interest is essentially stable at its maximumsummertime value. During this period, camera NDVIR at the 30-min time step (1 SD = 0.13) is 10 times more variable than at thedaily time step (1 SD = 0.01). Much of the variability in the 30-min data results from imagery captured under low-to-intermediatelight levels (1 SD = 0.17 for PPFD < 500 �mol m−2 s−1; 1 SD = 0.06 forPPFD ≥ 500 �mol m−2 s−1). At both dawn and dusk, camera NDVIR
is considerably lower, and markedly more variable, than at mid-day, indicating both a systematic bias and a lower signal-to-noiseratio under low-light conditions. However, excluding periods withPPFD < 200 �mol m−2 s−1, the diurnal pattern (data from 6 a.m. to6 p.m.) in camera NDVIR is negligible: a polynomial function of timeof day accounts for no more than 2% of the total variance in cameraNDVIR. This suggests that illumination geometry has only a minimaleffect on camera NDVIR. Similarly, although camera NDVIR is highlyvariable when the ratio of diffuse/total PPFD is ≥0.90, the noisyobservations are all associated with PPFD < 500 �mol m−2 s−1.
A final—and important, because it cannot be entirely elimi-nated by filtering for lower-light conditions—source of variationin camera NDVIR is the ratio of the exposure times for the RGBand RGB + NIR imagery, i.e. Eratio = EY/EZ. A second-order polyno-mial of Eratio explains 73% of the variation in 30-min camera NDVIR,with both low (<2) and high (>5) values of Eratio contributing to thispattern. Filtering for periods with PPFD ≥ 500 �mol m−2 s−1 elimi-nates most instances of low Eratio. High values of Eratio are most oftenassociated with anomalously long RGB exposures (high EY). TheRGB images associated with these long exposures are characterizedby an anomalously bluish cast. We are unable to identify the specificlighting conditions (total PPFD, PPFD variance, direct PPFD, diffusePPFD, or the direct/total PPFD ratio) that cause this effect. How-ever, even considering only data acquired with 2 < Eratio < 5, Eratiostill accounts for 40% of the variation in camera NDVIR between day160 and day 200. Using a fixed exposure setting (with potentiallydifferent values of EY and EZ), and limiting the analysis to high-light,mid-day conditions, it may be possible to eliminate this source ofvariability in camera NDVIR.
4. Discussion
We have proposed a method by which an off-the-shelf net-worked digital camera, originally marketed for security monitoringapplications, can be repurposed and used to obtain informa-tion about the spectral properties of vegetation in both visibleand NIR wavelengths, and thus to calculate NDVI-style indices.The lab experiment described here is used as a proof-of-concept(Figs. 2 and 4), and shows that not only can we back out the IRcomponent from the RGB + NIR imagery, but also that our methodfor exposure-correction of auto-exposed imagery is effective. Thefield data, on the other hand, show how this method can be appliedfor long term monitoring of vegetation phenology in real-world
conditions with varying solar illumination and weather condi-tions. Specifically, we show good agreement between data obtainedusing the camera NDVI method and the seasonal trajectory ofNDVI measured using radiometric sensors (Fig. 5). Our analysis
A.R. Petach et al. / Agricultural and Forest Meteorology 195–196 (2014) 143–151 149
Fig. 5. Time series of daily means (calculated for PPFD ≥ 200 �mol m−2 s−1) of vegetation indices calculated from radiometric instruments (a and d) and digital cameraimagery, analyzed separately for deciduous (b and e) and coniferous (c and f) regions of interest, from instruments mounted on the Harvard Forest Barn Tower. In (d), the grayfi he towv
dfthr(sipbdhiiamcTimta
ttamfiti
md
lled circles are the mean value of MODIS NDVI from a 3 × 3 window centered on tegetation index.
iffers from that of Nijland et al., 2013, who found that imageryrom a filtered, infrared-sensitive camera was of no more valuehan conventional RGB imagery for tracking plant phenology andealth. This approach is highly economical: the camera used hereetails for about US$1200, which is a fraction of the cost of a pairupward- and downward-looking) of multi-channel radiometricensors. While we did not rely on a reference panel for standard-zation, inclusion of a gray Spectralon (or other diffuse reflector)anel within the field of view of the camera would potentiallye of value for normalization under changing illumination con-itions (e.g. cloudy vs. sunny days); however, the results shownere suggest that even without this kind of calibration standard,
t is possible to obtain high-quality data on the seasonal variationn canopy NDVI. Although our field experiment was conducted in
mixed forest ecosystem, there is no reason to believe that thisethod would not be applicable in other vegetation types, espe-
ially those with a strong seasonal cycle such as crops or grasslands.he signal-to-noise ratio may, however, be inadequate for track-ng the seasonality of evergreen vegetation with a high LAI. This
ethod is currently implemented at more than 40 core sites withinhe PhenoCam network (http://phenocam.sr.unh.edu), and futurenalysis of those data will confirm the viability of this approach.
Networked cameras are well suited to field monitoring applica-ions because with Internet connectivity (using cell phone modems,his is now possible even at remote field sites) images can berchived to an off-site server, and camera functionality can beonitored remotely. Furthermore, since this eliminates the need
or manually swapping out memory cards, the potential for shiftsn camera alignment are minimized, making it is easier to main-ain a constant field of view. This facilitates image processing and
mproves data quality.We acknowledge that cameras with red and NIR sensitivity, pri-arily designed for precision agriculture applications, have been
eveloped and are commercially available (e.g. the Agricultural
er pixel. gCC is the green chromatic coordinate, NDVI is the normalized difference
Digital Camera by Tetracam, Inc., Chatsworth, CA, which retails forUS$4800). These have been used for ecological studies (e.g. Steltzerand Welker, 2006; Higgins et al., 2011), but we are not aware ofthis type of camera being installed in the field for continuous, long-term monitoring applications. Conventional digital cameras havealso been customized and used for similar work, but these have typ-ically made use of two-camera systems, with one camera filteredfor visible wavelengths and the other for near infrared wavelengths(e.g. Shibayama et al., 2009, 2011; Sakamoto et al., 2010, 2012; seealso Nijland et al., 2013). What is unique about the present approachis that by controlling the camera’s infrared cut filter we insteadobtained sequential images from a single sensor, rather than simul-taneous images from two sensors. Not only does the single-cameraapproach reduce costs, it also eliminates issues related to paral-lax, sensor calibration, and image alignment. Our method could, inprinciple, be used with other camera systems although the linearscaling coefficients (a, b) reported here are probably specific to theStarDot NetCam SC IR.
Compared to other low-cost, sensor-based methods for mon-itoring seasonal changes in the spectral properties of vegetation(e.g. radiometric instruments based on photodiodes, Garrity et al.,2010, or light emitting diodes, Ryu et al., 2010), a clear advantageof the camera approach is that it yields high-resolution images.This enables tracking the phenology of different organisms orgroups of organisms by breaking the image into different regionsof interest—e.g. deciduous and coniferous trees (e.g. Fig. 5E,F).False-color images similar to those traditionally generated fromsatellite imagery can also be generated using near infrared, red,and green bands (i.e. XRG rather than RGB), as shown in Fig. 6.Thus, the camera effectively becomes a four-channel imaging sen-
sor. We acknowledge that higher-quality spectral image data could,potentially, be obtained from existing, commercially available mul-tichannel or hyper-spectral cameras, e.g. Surface Optics SOC-710or TetraCam MCA. However, for budget-limited observational and
150 A.R. Petach et al. / Agricultural and Forest M
Fig. 6. Winter (February 1, top) and summer (July 6, bottom) false-color images(XRG) obtained from an infrared-enabled security camera mounted on the HarvardForest Barn Tower. The near infrared component (X) is mapped to the red (R) channel,the red channel is mapped to the green (G) channel, and the green channel is mappedto the blue channel. Both images were taken from the top of the tower at 4 PMlwl
eap
tssJsifo(vbrasahasfeme
A
taIl
ocal standard time. The evergreen trees that are clearly visible in the top image arehite pine (Pinus strobus). (For interpretation of the references to color in this figure
egend, the reader is referred to the web version of this article.)
xperimental studies, the system proposed here may representn acceptable compromise, given its substantially lower cost androven performance.
Our camera NDVI approach is conceptually similar to that usedo obtain broadband NDVI from readily available radiometric mea-urements of incident and canopy-reflected visible (PPFD) and totalhortwave radiation (Huemmrich et al., 1999; Wang et al., 2004;enkins et al., 2007; see review in Richardson et al., 2013b). Theimilarity of camera NDVI to radiometer NDVI, and the dissimilar-ty between camera NDVI and camera gCC, highlights the potentialor camera NDVI to provide different information about the statef the canopy than can be obtained using only visible-wavelengthRGB) imagery. Furthermore, indices such as EVI (the enhancedegetation index, which also uses blue channel information) cane calculated from the camera imagery in a similar manner. Theesulting data should therefore be of great value for “apples-to-pples” evaluation of landscape phenology products derived fromatellite remote sensing, as suitable data for this kind of analysisre currently lacking (cf. Hufkens et al., 2012; note that landscapeeterogeneity and the mismatch between the camera field of viewnd the satellite pixel to which it is being compared remain out-tanding challenges). More generally, camera NDVI could be usedor continuous monitoring of plant stress in greenhouse or nurs-ry applications, or even quantifying responses to experimentalanipulations in large field experiments (e.g. nutrient additions,
levated CO2, rainfall exclusion, etc.).
cknowledgments
This work was supported by the National Science Founda-
ion’s Macrosystems Biology program (award EF-1065029). Wecknowledge additional support from the US National Park Servicenventory and Monitoring Program and the USA National Pheno-ogy Network, through a grant from the United States Geologicaleteorology 195–196 (2014) 143–151
Survey (award G10AP00129). Research at Harvard Forest is par-tially supported by the National Science Foundation’s LTER program(awards DEB-0080592, DEB-1237491). The contents of this paperare solely the responsibility of the authors and do not necessarilyrepresent the official views of NSF or USGS.
References
Betancourt, J.L., Schwartz, M.D., Breshears, D.D., Cayan, D.R., Dettinger, M.D., Inouye,D.W., Post, E., Reed, B.C., 2005. Implementing a U.S. National Phenology Network.Eos Trans. Am. Geophys. Union 86, 539.
Garrity, S.R., Vierling, L.A., Bickford, K., 2010. A simple filtered photodiode instru-ment for continuous measurement of narrowband NDVI and PRI over vegetatedcanopies. Agric. For. Meteorol. 150, 489–496.
Higgins, S.I., Delgado-Cartay, M.D., February, E.C., Combrink, H.J., 2011. Is there atemporal niche separation in the leaf phenology of savanna trees and grasses?J. Biogeogr. 38, 2165–2175.
Huemmrich, K.F., Black, T.A., Jarvis, P.G., McCaughey, J.H., Hall, F.G., 1999. High tem-poral resolution NDVI phenology from micrometeorological radiation sensors.J. Geophys. Res. Atmos. 104, 27935–27944.
Hufkens, K., Friedl, M., Sonnentag, O., Braswell, B.H., Milliman, T., Richardson, A.D.,2012. Linking near-surface and satellite remote sensing measurements of decid-uous broadleaf forest phenology. Remote Sens. Environ. 117, 307–321.
Jenkins, J.P., Richardson, A.D., Braswell, B.H., Ollinger, S.V., Hollinger, D.Y., Smith,M.L., 2007. Refining light-use efficiency calculations for a deciduous forestcanopy using simultaneous tower-based carbon flux and radiometric measure-ments. Agric. For. Meteorol. 143, 64–79.
Keenan, T.F., Darby, B., Felts, E., Sonnentag, O., Friedl, M., Hufkens, K., O’Keefe, J.F.,Klosterman, S., Munger, J.W., Toomey, M., Richardson, A.D., 2014. Tracking forestphenology and seasonal physiology using digital repeat photography: a criticalassessment. Ecol. Appl., http://dx.doi.org/10.1890/13-0652.1, In press.
Migliavacca, M., Sonnentag, O., Keenan, T.F., Cescatti, A., O’Keefe, J., Richardson,A.D., 2012. On the uncertainty of phenological responses to climate change, andimplications for a terrestrial biosphere model. Biogeosciences 9, 2063–2083.
Morisette, J.T., Richardson, A.D., Knapp, A.K., Fisher, J.I., Graham, E.A., Abatzoglou, J.,Wilson, B.E., Breshears, D.D., Henebry, G.M., Hanes, J.M., Liang, L., 2009. Trackingthe rhythm of the seasons in the face of global change: phenological research inthe 21st century. Front. Ecol. Environ. 7, 253–260.
Nijland, W., de Jong, R., de Jong, S.M., Wulder, M.A., Bater, C.W., Coops, N.C., 2013.Monitoring plant condition and phenology using infrared sensitive consumergrade digital cameras. Agric. For. Meteorol. 184, 98–106.
Polgar, C.A., Primack, R.B., 2011. Leaf-out phenology of temperate woody plants:from trees to ecosystems. New Phytol. 191, 926–941.
Richardson, A.D., Anderson, R.S., Arain, M.A., Barr, A.G., Bohrer, G., Chen, G., Chen,J.M., Ciais, P., Davis, K.J., Desai, A.R., Dietze, M.C., Dragoni, D., Garrity, S.R., Gough,C.M., Grant, R., Hollinger, D.Y., Margolis, H.A., McCaughey, H., Migliavacca, M.,Monson, R.K., Munger, J.W., Poulter, B., Raczka, B.M., Ricciuto, D.M., Sahoo, A.K.,Schaefer, K., Tian, H., Vargas, R., Verbeeck, H., Xiao, J., Xue, Y., 2012. Terrestrialbiosphere models need better representation of vegetation phenology: resultsfrom the North American Carbon Program Site Synthesis. Global Change Biol.18, 566–584.
Richardson, A.D., Braswell, B.H., Hollinger, D.Y., Jenkins, J.P., Ollinger, S.V., 2009.Near-surface remote sensing of spatial and temporal variation in canopy phen-ology. Ecol. Appl. 19, 1417–1428.
Richardson, A.D., Jenkins, J.P., Braswell, B.H., Hollinger, D.Y., Ollinger, S.V., Smith,M.L., 2007. Use of digital webcam images to track spring green-up in a deciduousbroadleaf forest. Oecologia 152, 323–334.
Richardson, A.D., Keenan, T.F., Migliavacca, M., Ryu, Y., Sonnentag, O., Toomey, M.,2013a. Climate change, phenology, and phenological control of vegetation feed-backs to the climate system. Agric. For. Meteorol. 169, 156–173.
Richardson, A.D., Klosterman, S., Toomey, M., 2013b. Chapter 22: near-surfacesensor-derived phenology. In: Schwartz, M.D. (Ed.), Phenology: An IntegrativeEnvironmental Science. , 2nd ed. Springer, New York, pp. 413–430.
Rosenzweig, C., Casassa, G., Karoly, D.J., Imeson, A., Liu, C., Menzel, A., Rawlins, S.,Root, T.L., Seguin, B., Tryjanowski, P., 2007. Assessment of observed changesand responses in natural and managed systems. In: Parry, M.L., Canziani, O.F.,Palutikof, J.P., van der Linden, P.J., Hanson, C.E. (Eds.), Climate Change 2007:Impacts, Adaptation and Vulnerability, Contribution of Working Group II to theFourth Assessment Report of the Intergovernmental Panel on Climate Change.Cambridge UP, Cambridge, UK, pp. 79–131.
Ryu, Y., Baldocchi, D.D., Verfaillie, J., Ma, S., Falk, M., Ruiz-Mercado, I., Hehn, T.,Sonnentag, O., 2010. Testing the performance of a novel spectral reflectance sen-sor, built with light emitting diodes (LEDs), to monitor ecosystem metabolism,structure and function. Agric. For. Meteorol. 150, 1597–1606.
Sakamoto, T., Gitelson, A.A., Nguy-Robertson, A.L., Arkebauer, T.J., Wardlow, B.D.,Suyker, A.E., Verma, S.B., Shibayama, M., 2012. An alternative method using dig-ital cameras for continuous monitoring of crop status. Agric. For. Meteorol. 154,113–126.
Sakamoto, T., Shibayama, M., Takada, E., Inoue, A., Morita, K., Takahashi, W., Miura, S.,Kimura, A., 2010. Detecting seasonal changes in crop community structure usingday and night digital images. Photogramm. Eng. Remote Sens. 76, 713–726.
Shibayama, M., Sakamoto, T., Takada, E., Inoue, A., Morita, K., Takahashi, W., Kimura,A., 2009. Continuous monitoring of visible and near-infrared band reflectance

rest M
S
S
S
T
A.R. Petach et al. / Agricultural and Fo
from a rice paddy for determining nitrogen uptake using digital cameras. PlantProd. Sci. 12, 293–306.
hibayama, M., Sakamoto, T., Takada, E., Inoue, A., Morita, K., Takahashi, W., Kimura,A., 2011. Estimating paddy rice leaf area index with fixed point continuous obser-vation of near infrared reflectance using a calibrated digital camera. Plant Prod.Sci. 14, 30–46.
onnentag, O., Hufkens, K., Teshera-Sterne, C., Young, A.M., Friedl, M., Braswell,B.H., Milliman, T., O’Keefe, J., Richardson, A.D., 2012. Digital repeat photogra-phy for phenological research in forest ecosystems. Agric. For. Meteorol. 152,
159–177.teltzer, H., Welker, J.M., 2006. Modeling the effect of photosynthetic vegetationproperties on the NDVI-LAI relationship. Ecology 87, 2765–2772.
ucker, C.J., 1979. Red and photographic infrared linear combinations for monitoringvegetation. Remote Sens. Environ. 8, 127–150.
eteorology 195–196 (2014) 143–151 151
Wang, Q., Tenhunen, J., Dinh, N.Q., Reichstein, M., Vesala, T., Keronen, P., 2004. Sim-ilarities in ground- and satellite-based NDVI time series and their relationshipto physiological activity of a Scots pine forest in Finland. Remote Sens. Environ.93, 225–237.
White, M.A., de Beurs, K.M., Didan, K., Inouye, D.W., Richardson, A.D., Jensen, O.P.,O’Keefe, J., Zhang, G., Nemani, R.R., van Leeuwen, W.J.D., Brown, J.F., de Wit,A., Schaepman, M., Lin, X., Dettinger, M., Bailey, A.S., Kimball, J., Schwartz, M.D.,Baldocchi, D.D., Lee, J.T., Lauenroth, W.K., 2009. Intercomparison, interpretation,and assessment of spring phenology in North America estimated from remote
sensing for 1982–2006. Global Change Biol. 15, 2335–2359.Zhang, X., Friedl, M.A., Schaaf, C.B., 2006. Global vegetation phenology from mod-erate resolution imaging spectroradiometer (MODIS): evaluation of globalpatterns and comparison with in situ measurements. J. Geophys. Res. Biogeosci.111, Art. No. G04017.
Related Documents