1 Agricultural and food trade Contents 1. Agri-food products are mostly traded within the EU but exports to third countries are increasingly important ................................................................ 2 2. CAP reforms and the EU trade policy helped turn the EU from net importer to the world's top exporter of agri-food products ...................................... 3 3. However, not all sectors are equally impacted .................................................................................................................................................................... 7 Figures Figure 1: Trends in intra and extra-EU exports of agri-food products over 2005-2015............................................................................................................. 2 Figure 2: Share of exports to third countries in production value .............................................................................................................................................. 2 Figure 3: EU agri-food trade development over the past decade ............................................................................................................................................... 3 Figure 4: World top traders of agri-food products, average 2014-2016 ..................................................................................................................................... 4 Figure 5: Top world agri-food exporters, 1995-2015 ................................................................................................................................................................. 4 Figure 6: Ratio between EU and world prices ............................................................................................................................................................................ 5 Figure 7: Trend in CAP expenditure by type of subsidy – phasing out of export subsidies ...................................................................................................... 5 Figure 8: EU-28 and Big 5 agri-food imports from Least Developed Countries, 2015 ............................................................................................................. 6 Figure 9: Main export destinations ............................................................................................................................................................................................. 6 Figure 10: Main import origins................................................................................................................................................................................................... 6 Figure 11: Flagship EU exports to third countries, in value (EUR million) and percentage, 2016 ........................................................................................... 7 Figure 12: Main EU imports from third countries, in value (EUR million) and percentage, 2016 ............................................................................................ 7 Figure 13: Cumulative impact of trade agreements – change in EU production volume........................................................................................................... 8 Figure 14: Cumulative impact of trade agreements – change in EU producer prices ................................................................................................................ 9 This document does not necessarily represent the official views of the European Commission Contact: DG Agriculture and Rural Development, Unit Farm Economics Tel: +32-2-29 91111 / E-mail: AGRI-[email protected] © European Union, 2017 - Reproduction authorised provided the source is acknowledged

Welcome message from author
This document is posted to help you gain knowledge. Please leave a comment to let me know what you think about it! Share it to your friends and learn new things together.
Transcript

1
Agricultural and food trade
Contents 1. Agri-food products are mostly traded within the EU but exports to third countries are increasingly important ................................................................ 2
2. CAP reforms and the EU trade policy helped turn the EU from net importer to the world's top exporter of agri-food products ...................................... 3
3. However, not all sectors are equally impacted .................................................................................................................................................................... 7
Figures
Figure 1: Trends in intra and extra-EU exports of agri-food products over 2005-2015 ............................................................................................................. 2 Figure 2: Share of exports to third countries in production value .............................................................................................................................................. 2
Figure 3: EU agri-food trade development over the past decade ............................................................................................................................................... 3 Figure 4: World top traders of agri-food products, average 2014-2016 ..................................................................................................................................... 4 Figure 5: Top world agri-food exporters, 1995-2015 ................................................................................................................................................................. 4 Figure 6: Ratio between EU and world prices ............................................................................................................................................................................ 5
Figure 7: Trend in CAP expenditure by type of subsidy – phasing out of export subsidies ...................................................................................................... 5
Figure 8: EU-28 and Big 5 agri-food imports from Least Developed Countries, 2015 ............................................................................................................. 6
Figure 9: Main export destinations ............................................................................................................................................................................................. 6
Figure 10: Main import origins................................................................................................................................................................................................... 6 Figure 11: Flagship EU exports to third countries, in value (EUR million) and percentage, 2016 ........................................................................................... 7 Figure 12: Main EU imports from third countries, in value (EUR million) and percentage, 2016 ............................................................................................ 7 Figure 13: Cumulative impact of trade agreements – change in EU production volume ........................................................................................................... 8
Figure 14: Cumulative impact of trade agreements – change in EU producer prices ................................................................................................................ 9
This document does not necessarily represent the official views of the European Commission
Contact: DG Agriculture and Rural Development, Unit Farm Economics
Tel: +32-2-29 91111 / E-mail: [email protected]
© European Union, 2017 - Reproduction authorised provided the source is acknowledged
2
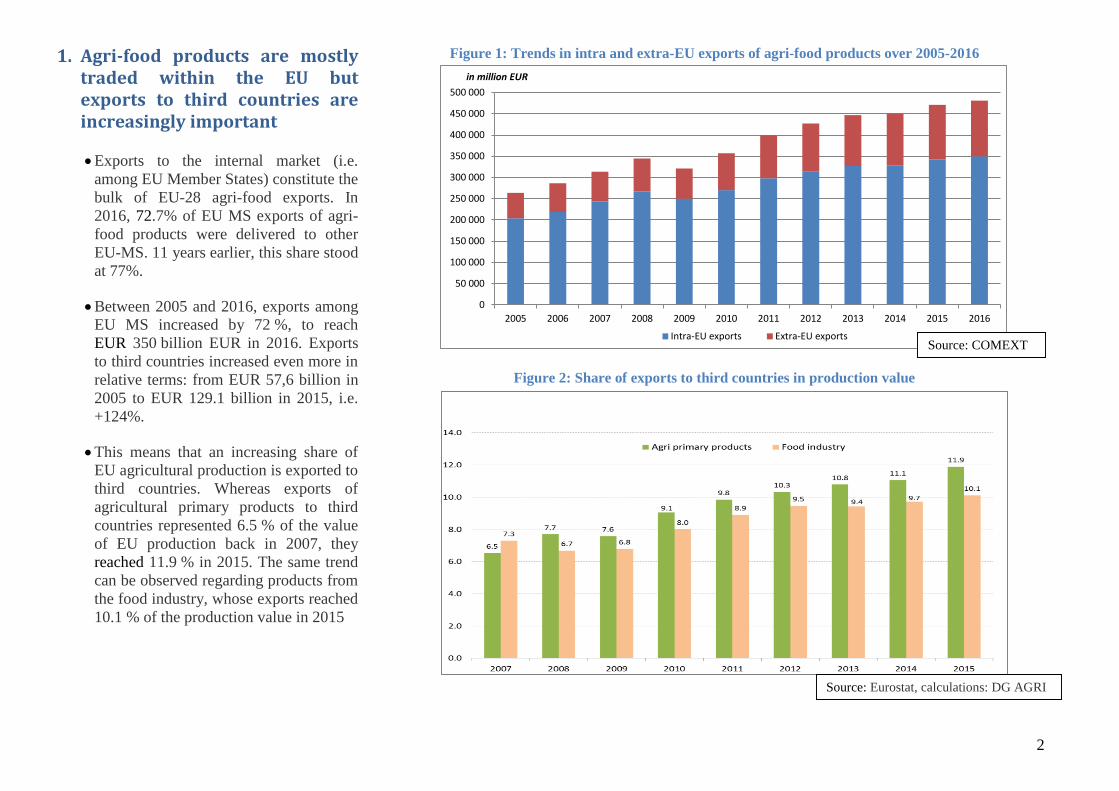
1. Agri-food products are mostly traded within the EU but exports to third countries are increasingly important
Exports to the internal market (i.e.
among EU Member States) constitute the
bulk of EU-28 agri-food exports. In
2016, 72.7% of EU MS exports of agri-
food products were delivered to other
EU-MS. 11 years earlier, this share stood
at 77%.
Between 2005 and 2016, exports among
EU MS increased by 72 %, to reach
EUR 350 billion EUR in 2016. Exports
to third countries increased even more in
relative terms: from EUR 57,6 billion in
2005 to EUR 129.1 billion in 2015, i.e.
+124%.
This means that an increasing share of
EU agricultural production is exported to
third countries. Whereas exports of
agricultural primary products to third
countries represented 6.5 % of the value
of EU production back in 2007, they
reached 11.9 % in 2015. The same trend
can be observed regarding products from
the food industry, whose exports reached
10.1 % of the production value in 2015
Figure 1: Trends in intra and extra-EU exports of agri-food products over 2005-2016
Figure 2: Share of exports to third countries in production value
0
50 000
100 000
150 000
200 000
250 000
300 000
350 000
400 000
450 000
500 000
2005 2006 2007 2008 2009 2010 2011 2012 2013 2014 2015 2016
Intra-EU exports Extra-EU exports
in million EUR
Source: COMEXT
Source: Eurostat, calculations: DG AGRI

3
2. CAP reforms and the EU trade policy helped turn the EU from net importer to the world's top exporter of agri-food products
Since 2006, both EU agri-food exports
and imports from third countries have
doubled in value. The annual value of
EU agri-food exports in 2016 reached a
new record level of EUR 130.7 billion,
which is EUR 1.7 billion (1.3 %) higher
than in 2015 and EUR 29.4 billion
higher than five years ago (+29 %). EU
agri-food imports reached EUR 112
billion in 2016.
This means that the EU trade balance in
agri-food is now positive, and this has
been the case for the EU since 2010.
Today, the agri-food sector represents
7.5 % of total EU exports in goods in
2016 and 6.6% of all imported goods are
agri-food. With its surplus of EUR 18.8
billion, the agri-food sector is a major
contributor to the overall surplus of the
European Union in merchandise trade,
which stands at EUR 39.3 billion in
2016.
Figure 3: EU agri-food trade development over the past decade
Source: COMEXT

4
Not only did the EU become a net
exporter of agri-food products, but it
became in 2012 the world's number one
exporter, before the USA. Besides, six
EU Member States feature among the
world top ten exporters of agri-food
products.
This development took place in a rapidly
expanding world trade environment.
Over the period 1995-2015, agricultural
exports from Brazil, China and Canada
grew at a fast pace. EU agricultural
exports, although they grew slower, have
exhibited a compound annual growth
rate of 3.6 %, compared to 2.7 % for the
USA1.
This good performance has been driven
mainly by EU agricultural policies,
structural change and technological
progress in the agri-food sector, as well
as trade policies. A recent study
commissioned by the European
Commission2 on the impact of
implemented trade agreements shows
that EU bilateral trade agreements
contribute to increased EU exports and
imports, the latter not necessarily at the
expense of domestic production.
1 "Study on the impact of EU agriculture and
agricultural trade of EU concluded bilateral trade
agreements", Copenhagen Economics, 2016.
https://ec.europa.eu/agriculture/external-studies/2016-
bilateral-trade-agreements_en 2 Id.
Figure 4: World top traders of agri-food products, average 2014-2016
Figure 5: Top world agri-food exporters, 1995-2015
0
250 000
500 000
750 000
1 000 000
1995 1996 1997 1998 1999 2000 2001 2002 2003 2004 2005 2006 2007 2008 2009 2010 2011 2012 2013 2014 2015
EU28-EXTRA US BRAZIL CHINA CANADA OTHERS
Source: GTA
Source: based on UN COMTRADE

5
This development underlines the
increased competitiveness of EU agri-
food products. The successive CAP
reforms indeed helped bridge the gap
between EU and world prices.
One notable feature in this context is the
gradual phasing-out of CAP export
subsidies, once a major component of
the CAP expenditure. Following CAP
reform, they could only be used in very
limited circumstances. In practice - and
contrary to many of its competitors - the
EU hasn't used them since 2013,
although they remained as an instrument
in the CMO regulation. The DDA
Nairobi agreement of the WTO reached
in December 2015 now provided for the
elimination for good of all forms of
export subsidies and introduced
disciplines on other potentially trade-
distorting export measures.
Figure 6: Ratio between EU and world prices
Figure 7: Trend in CAP expenditure by type of subsidy – phasing out of export subsidies
Source: AGRI calculations based on various sources
Source: DG Agriculture and Rural Development
6
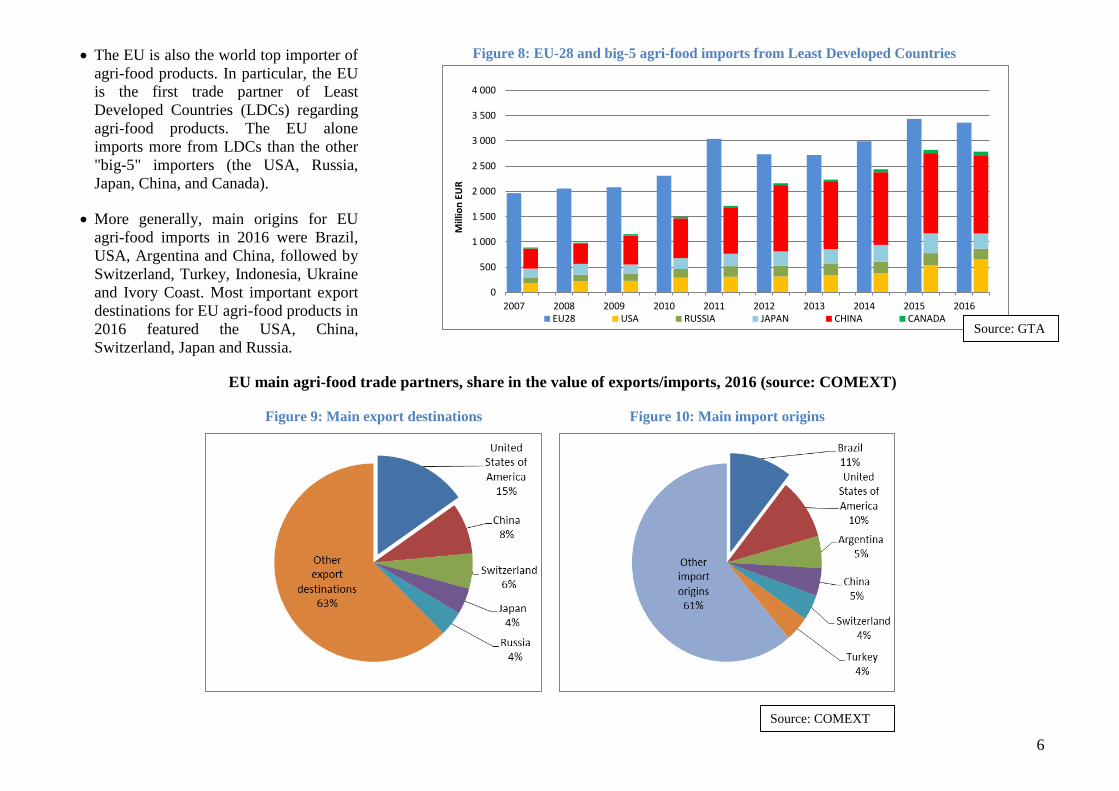
The EU is also the world top importer of
agri-food products. In particular, the EU
is the first trade partner of Least
Developed Countries (LDCs) regarding
agri-food products. The EU alone
imports more from LDCs than the other
"big-5" importers (the USA, Russia,
Japan, China, and Canada).
More generally, main origins for EU
agri-food imports in 2016 were Brazil,
USA, Argentina and China, followed by
Switzerland, Turkey, Indonesia, Ukraine
and Ivory Coast. Most important export
destinations for EU agri-food products in
2016 featured the USA, China,
Switzerland, Japan and Russia.
Figure 8: EU-28 and big-5 agri-food imports from Least Developed Countries
EU main agri-food trade partners, share in the value of exports/imports, 2016 (source: COMEXT)
Figure 9: Main export destinations
Figure 10: Main import origins
0
500
1 000
1 500
2 000
2 500
3 000
3 500
4 000
2007 2008 2009 2010 2011 2012 2013 2014 2015 2016
Mill
ion
EU
R
EU28 USA RUSSIA JAPAN CHINA CANADASource: GTA
Source: COMEXT

7
3. However, not all sectors are equally impacted
EU-28 agri-food exports are balanced
across classes of products. In 2016,
54.5 % of EU agri-food exports consist
in agricultural food and feed products
(commodities: 18.1 % of total agri-food
exports; other primary agricultural
products: 17.8 %; and agricultural
processed products including wine:
18.6 %); 34.4 % are products of the food
and drink industry (food preparations:
21.2 %; beverages: 13.2 %); while the
remaining 11.1 % are non-edible
products. EU imports are dominated by
agricultural food and feed products
(80 % of EU imports of agri-food
products in 2016), especially
commodities, which account for 41.7 %
of all EU agri-food imports in 2016.
In more detail, wine, vermouth, cider
and vinegar, spirits and liqueurs, infant
food, food preparations, wheat and pig
meat are flagship EU-28 export
products. Main import products consist
of tropical fruit, nuts and spices,
unroasted coffee and tea in bulk,
oilcakes, fruit excluding citrus and
tropical fruit, palm and palm kernel oil
and soya beans.
Figure 11: Flagship EU exports to third countries, in value (EUR million) and percentage, 2016
Figure 12: Main EU imports from third countries, in value (EUR million) and percentage, 2016
Source: COMEXT
Source: COMEXT

8
However, not all sectors are equal in the
face of international competition.
In a context where 90 % of the
additional world demand for agri-food
products over the next 10-15 years is
expected to be generated outside Europe,
exports to third countries will be
instrumental to the growth of the
agricultural sector. Given the limited
progress in the multilateral trading
system (WTO), bilateral agreements
create opportunities for EU producers on
global markets.
The agenda of negotiations is set in the
"Trade for all" communication3. It
foresees opening or resuming
negotiations with some key world
agricultural exporters, allowing for more
imports and increasing competition on
domestic agri-food markets. In order to
assess the potential cumulative impact of
ongoing and upcoming trade
negotiations on the EU agricultural
sector, the European Commission carried
out an economic study4.
3 "Trade for all – Towards a more responsible trade and
investment policy", European Commission, 2015.
http://trade.ec.europa.eu/doclib/docs/2015/october/trado
c_153846.pdf 4 "Cumulative economic impact of future trade
agreements on EU agriculture", European Commission,
2016. http://ec.europa.eu/agriculture/trade-
analysis/impact-assessment_en
Figure 13: Cumulative impact of trade agreements – change in EU production volume
Source: "Cumulative economic impact of future trade agreements on EU agriculture" European
Commission, 2016.

9
That study focuses on 12 agreements yet
to be implemented. It is based on scenario
simulations run by means of economic
models. Reciprocal liberalisation of
import tariffs between the EU and the
relevant trading partners was modelled for
two theoretical scenarios (conservative /
ambitious). The conclusions of the study
provide an indication about the likely
potential direction and magnitude of the
impact of those scenarios, and are not a
forecast of the outcome of future
agreements.
The study shows a positive impact for the
EU agriculture as a whole, with an in
increase in production value ranging from
€ 0.24 billion to € 2.1 billion. However,
significant differences exist between
specific commodities.
Although the sensitive sectors are not the
same in all agreements, the study overall
anticipates losses for beef meat and rice,
both in terms of trade effects and of
decline in producer price. Other struggling
sectors are sugar and sheep meat, although
to a lesser extent.
On the bright side of the equation,
significant gains are expected to be
achieved in the EU dairy and pigmeat
sectors and, to a slightly lesser degree, by
wheat producers. For all other sectors, the
respective gains or losses are more
moderate.
The size of the sector-specific impacts is obviously magnified when moving from the
conservative scenario to the ambitious one, albeit the direction of the change does generally not
change.
Due to methodological limitations, the study tends to underestimate gains for EU agriculture
(removal on non-tariff barriers and protection of geographical indications in partner countries are
not taken into account). It shows the impact of a tariff reduction for sensitive sectors, which in
reality will not happen. The impact for sensitive sectors will be limited by negotiating tariff rate
quotas instead of general tariff reductions.
Figure 14: Cumulative impact of trade agreements – change in EU producer prices
Source: "Cumulative economic impact of future trade agreements on EU agriculture"
European Commission, 2016.
Related Documents