Agilent N6820ES Option USD Universal Signal Detection User Guide Part Number: E3238-90031 Printed in U.S.A. Print Date: January 2014 © Agilent Technologies, Inc. 2014

Welcome message from author
This document is posted to help you gain knowledge. Please leave a comment to let me know what you think about it! Share it to your friends and learn new things together.
Transcript
Agilent N6820ES
Option USD
Universal Signal Detection
User Guide
Part Number: E3238-90031
Printed in U.S.A.
Print Date: January 2014
© Agilent Technologies, Inc. 2014
NOTICE
2
NOTICE
The information contained in this manual is subject to change without notice.
AGILENT TECHNOLOGIES MAKES NO WARRANTY OF ANY KIND WITH REGARD TO THIS
MANUAL, INCLUDING, BUT NOT LIMITED TO, THE IMPLIED WARRANTIES OF
MERCHANTABILITY AND FITNESS FOR A PARTICULAR PURPOSE. Agilent Technologies shall
not be liable for errors contained herein or direct, indirect, special, incidental, or consequential damages in
connection with the furnishing, performance, or use of the material.
This manual and related technical data are authorized by the U.S. Government for export. They may not be
transferred, transshipped on a non-continuous voyage, or otherwise be disposed of in any other country,
either in their original form or after being incorporated into other end-items, without the prior written
approval of the U.S. Department of State.

Trademarks
3
Trademarks
Windows®, and Windows® XP are U.S. registered trademarks of Microsoft Corporation in the United
States and other countries.
4
U.S. GOVERNMENT RESTRICTED RIGHTS
U.S. GOVERNMENT RESTRICTED RIGHTS
Software and technical data rights granted to the federal government include only those rights customarily
provided to end user customers. Agilent provides this customary commercial license in Software and
technical data pursuant to FAR 12.211 (Technical Data) and 12.212 (Computer Software) and, for the
Department of Defense, DFARS 252.227-7015 (Technical Data - Commercial Items) and DFARS
227.7202-3 (Rights in Commercial Computer Software or Computer Software Documentation).
© Agilent Technologies, Inc. 2007-20014
Made in U.S.A.
This document contains proprietary information which is protected by copyright. All rights are reserved.
No part of this document may be photocopied, reproduced, or translated to another language without the
prior written consent of Agilent Technologies, Inc.
Use of this manual and compact disk(s) supplied for this pack is restricted to this product only. Additional
copies of the programs can be made for security and back-up purposes only. Resale of the software in its
present form or with alterations is expressly prohibited.

5
Table of Contents
Table of Contents
NOTICE 2
Trademarks 3
U.S. GOVERNMENT RESTRICTED RIGHTS 4
Table of Contents 5
Introduction 8
System Requirements 9
Installation and Configuration 10
Universal Signal Detection Overview 14
USD Setup Window 16
USD Setup Window Overview 16
Major components of the USD Setup Window: 16
Enable Signal Detection Check Box 17
Add Detector Button 17
Remove Detector Button 17
Frequency Plan Button 18
N6820ES Requirements Button 20
Runtime Settings Button 22
Runtime settings: 22
Global Settings Button 25
USD Monitor Window 26
USD Monitor Window Overview 26
Monitor Window Blocks Prior to Energy Detection 27
Spectral Sweep 28
Energy Detection 28 Bandwidth Filter 28
Frequency Plan 29
Wideband Detection 29
Monitor Window Blocks from Energy History to Recording 30
Energy History 30
Narrowband Confirmer Blocks 31 Pending Queue 31
Narrowband Confirmation 31
Narrowband Recorder 32
Monitor Window Arrows 34
Click to Fix 35
Summary of Possible Arrow Messages 38
6
U.S. GOVERNMENT RESTRICTED RIGHTS
USD Design Window 40
USD Design Window Overview 40
Major components of the USD Design Menu: 40
USD Design Window Signal Detector List 41
USD Design Window General Tab 43
USD Design Window Bandwidth Filter Tab 44
Bandwidth Filtering Example 46
USD Design Window Frequency Plan Tab 48
Major components of the Frequency Plan: 48
Frequency Plan Add Band 49
Frequency Plan Add Frequency 50
Frequency Plan Label Frequency 51
Frequency Plan Delete 52
Frequency Plan Import 52 Frequency Plan Setup 52
USD Design Window Wideband Detectors Tab 53
Wideband Detectors Overview 53 Acquiring a Signal for Signal Detector Development 55
Live Data 55
Recording Data with the Wideband Detector Editor 56 Recording Data with Time and Frequency Snapshots 57
Recording Data with the Narrowband Confirmer Editor 57
Shape Method 60 Peaks Method 65
Limit Lines Method 72
Importing Data Files 80
USD Design Window Narrowband Confirmers Tab 82
Narrowband Confirmers Overview 82
USD Design Window Runtime Defaults Tab 91
Default Runtime Settings: 92
Universal Signal Database 94
USD Programming Guide 98
Overview 98
Configuring the Streaming Server 99
Configuring Streamed Data 101
USD Server 102
USD Data Streams 102 USD Server Commands 103
Command Passthrough 106
USD Data Output Format 107
Message Definitions 107
E3238S_USD_DATA_BEGIN 109
E3238S_USD_DATA 112 E3238S_USD_DATA_END 114
E3238S_USD_INFO 115
E3238S_USD_STREAM_INFO 116 E3238S_USD_SUBSCRIPTION_INFO 117
7
Table of Contents
E3238S_USD_ERROR 118
E3238S_USD_ENERGY_ALARM_SPEW 119
E3238S_USD_ENERGY_ALARM_SIGNAL 121
Client Connection to the USD Server 122
Data Rate 122
Version Checking 122
Example Programs 123
Streaming Client 123
StreamingCapture 127
USD Client .Net Example 128
Tutorial: How to Build a USD Signal Detector 130
Overview 130
Step 1: Capture an Example of the Signal 131
Step 2: Choose the Search Setup Settings 132
Step 3: Add a New Detector 133
Step 4: Configure a Bandwidth Filter 134
Step 5: Configure the Frequency Plan 135
Step 6: Add a Wideband Detector 137
Step 7a: Configure a Wideband Detector using Peaks Method 138
Step 7b: Configure a Wideband Detector using Shape Method 140
Step 7c: Configure a Wideband Detector using Limit Lines 145
Step 8: Configure a Narrowband Confirmer 150
Step 9: Test with a Live Signal 156
Step 10: Configure Runtime Defaults 166
Step 11: Deploy the Signal Detector 170
Summary and Tips 171
Index 172
8
Introduction
Introduction
This document describes the installation, configuration, and operation of option USD (Universal Signal
Detection) for the N6820ES Signal Surveyor 4D software.
The Universal Signal Detection option provides a foundational capability and structure upon which you can
create N6820ES signal detectors to find Signals of Interest (SOI) without the need to program and/or
compile code.
This User Guide includes a brief overview of Universal Signal Detection, information on the various
windows, menus and features of USD, and a brief example demonstrating the steps used to detect a specific
signal of interest.
Installation and Configuration
9
System Requirements
• Agilent N6841A RF Sensor configured for your mission needs.
• Agilent N6820ES software running on Windows 7 or Windows XP.
• N6820ES option USD - Universal Signal Detection application
• Optional, but highly recommended; option MR1 - Modulation Recognition application. Option MR1
provides a library of 30 analog and digital modulation recognizers.
Installation and Configuration
To install the N6820ES software on your laptop, follow the steps below.
1. Install the N6820ES software (if not already installed) - Refer to the N6820ES Installation and
Configuration Reference for instructions. The USD software is installed as part of the main
N6820ES software installation. The USD libraries are installed to the C:\E3238s\usd directory
along with a sample configuration file, d.e3238s.cfg. Example Read-Only signals are installed to
the C:\E3238S\detectors directory. These signals can be examined in the USD Design
Environment.
• HF BPSK 1800 Baud.Agilent.sig
• HF BPSK 2400 Baud.Agilent.sig
• HF Classifier.Agilent.sig
• HF FSK 170 Hz.Agilent.sig
• HF FSK 200 Hz.Agilent.sig
• HF FSK 850 Hz.Agilent.sig
• HF MILSTD 188_141.Agilent.sig
• HF PACTOR I.Agilent.sig
• HF PSK 31.Agilent.sig
• HF PSK 63.Agilent.sig
• HF PSK 125.Agilent.sig
• HF PSK 220.Agilent.sig
• SAT INMARSAT B Control.Agilent.sig
• SAT INMARSAT B.Agilent.sig
• SAT INMARSAT C.Agilent.sig
• VUHF AIS.Agilent.sig
• VUHF Classifier.Agilent.sig
• VUHF EDACS.Agilent.sig
• VUHF iDEN.Agilent.sig
• VUHF NADC.Agilent.sig
• VUHF Pager.Agilent.sig
• VUHF Smartnet.Agilent.sig

Installation and Configuration
10
• VUHF TETRA 25.Agilent.sig
• VUHF TETRAPOL.Agilent.sig
Installation and Configuration
11
2. To use USD software, your N6820ES license file must contain a valid license entry. The N6820ES
license file is located in the C:\E3238s\licenses directory and must have a ".lic" extension. The USD
option is indicated by a "USD" in the VENDOR_STRING. More information on software licensing
may be found in C:\E3238s\licensing.txt.
3. Add the following lines (if there are not already present) to the N6820ES hardware configuration
file (n6841.32bitOS.cfg and n6841.64bitOS.cfg):
!!!!!!!!!!!!!!!!!!!!!!!!!!!!!!!!!!!!!!!!!!!!!!!!!!!!!
!!! Universal Signal Detection !!!
!!!!!!!!!!!!!!!!!!!!!!!!!!!!!!!!!!!!!!!!!!!!!!!!!!!!
genericLib: C:\e3238s\usd\usdHost.dll
userMenu: C:\e3238s\usd\usdHost.dll
featureExtraction: C:\e3238s\usd\usdHost.dll
energyHistoryFilter: C:\e3238s\usd\usdHost.dll, \
C:\e3238s\lib\filterAGE.dll!
!
!!!!!!!!!!!!!!!!!!!!!!!!!!!!!
!!! USD Signal !!!
!!!!!!!!!!!!!!!!!!!!!!!!!!!!!
signal1.enabled: True
signal1.hostLib: C:\e3238s\usd\usdHost.dll
signal1.hostDsp: C:\e3238s\usd\usdDsp.dll
signal1.targetDsp: C:\e3238s\usd\usdDsp.esl
signal1.minChannels: 1
signal1.maxChannels: 256
signal1.loadFactor: 8
signal1.args:
Notes:
• File paths are valid for typical installations. C:\E3238s\ is the default installation location.
• The USD Signal should only be enabled if the system includes optional digital down converters.
• The number 1 in signal1 in the USD Signal section of the e3238s.cfg file represent an example of the
sequence of the signal types being used in the N6820ES. Modify the value to fit your particular
configuration.
• minChannels, maxChannels, and loadFactor values may be modified as needed.
• The following options are allowed on the genericLib line:
• -noDesign - Removes the design tab from the USD GUI.
Installation and Configuration
12
• -maxrec <rate> - Specifies the maximum record rate.
• default value is 4000000 bytes/sec.
• minimum value is 0 (disables recording)
• maximum value is 10000000 bytes/sec.
• -allowNB - Allows Signal Detectors that include Narrowband Confirmers to be loaded into the
Signal Detector Library.
• The following options are allowed on the “signal1.args:” line:
• -maxClients - Specifies maximum number of streaming clients that can connect to the USD server.
• default value is 0 (streaming disabled).
• maximum value is 32.
• -sendBufferSize - Specifies the size (in bytes) of the buffer for messages going from the server to
the client.
• default value is 1048576 bytes.
• minimum value 32768 bytes.
• -recvBufferSize - Specifies the size (in bytes) of the buffer for messages coming from the client to
the server.
• default value is 32768 bytes.
• minimum value 32768 bytes.
Installation and Configuration
13
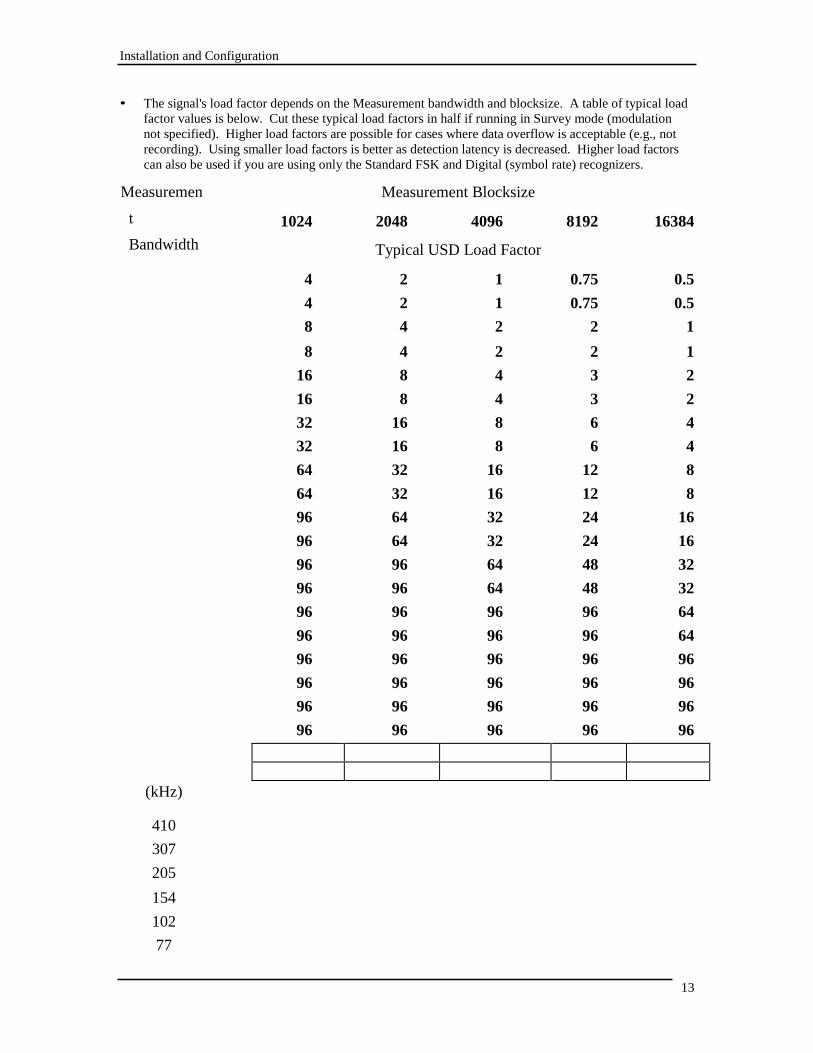
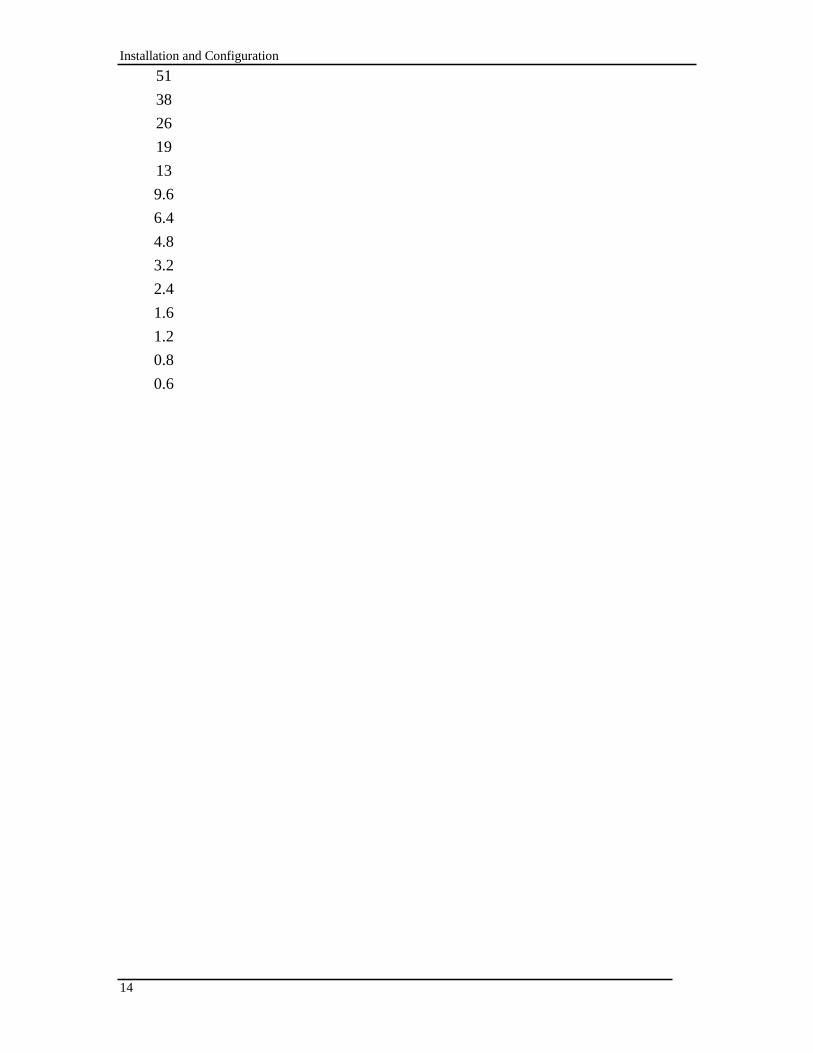
• The signal's load factor depends on the Measurement bandwidth and blocksize. A table of typical load
factor values is below. Cut these typical load factors in half if running in Survey mode (modulation
not specified). Higher load factors are possible for cases where data overflow is acceptable (e.g., not
recording). Using smaller load factors is better as detection latency is decreased. Higher load factors
can also be used if you are using only the Standard FSK and Digital (symbol rate) recognizers.
Measuremen
t
Bandwidth
1024
4
4
8
8
16
16
32
32
64
64
96
96
96
96
96
96
96
96
96
96
Measurement Blocksize
2048 4096
Typical USD Load Factor
2 1
2 1
4 2
4 2
8 4
8 4
16 8
16 8
32 16
32 16
64 32
64 32
96 64
96 64
96 96
96 96
96 96
96 96
96 96
96 96
8192
0.75
0.75
2
2
3
3
6
6
12
12
24
24
48
48
96
96
96
96
96
96
16384
0.5
0.5
1
1
2
2
4
4
8
8
16
16
32
32
64
64
96
96
96
96
(kHz)
410
307
205
154
102
77
Installation and Configuration
14
51
38
26
19
13
9.6
6.4
4.8
3.2
2.4
1.6
1.2
0.8
0.6
15
Universal Signal Detection Overview
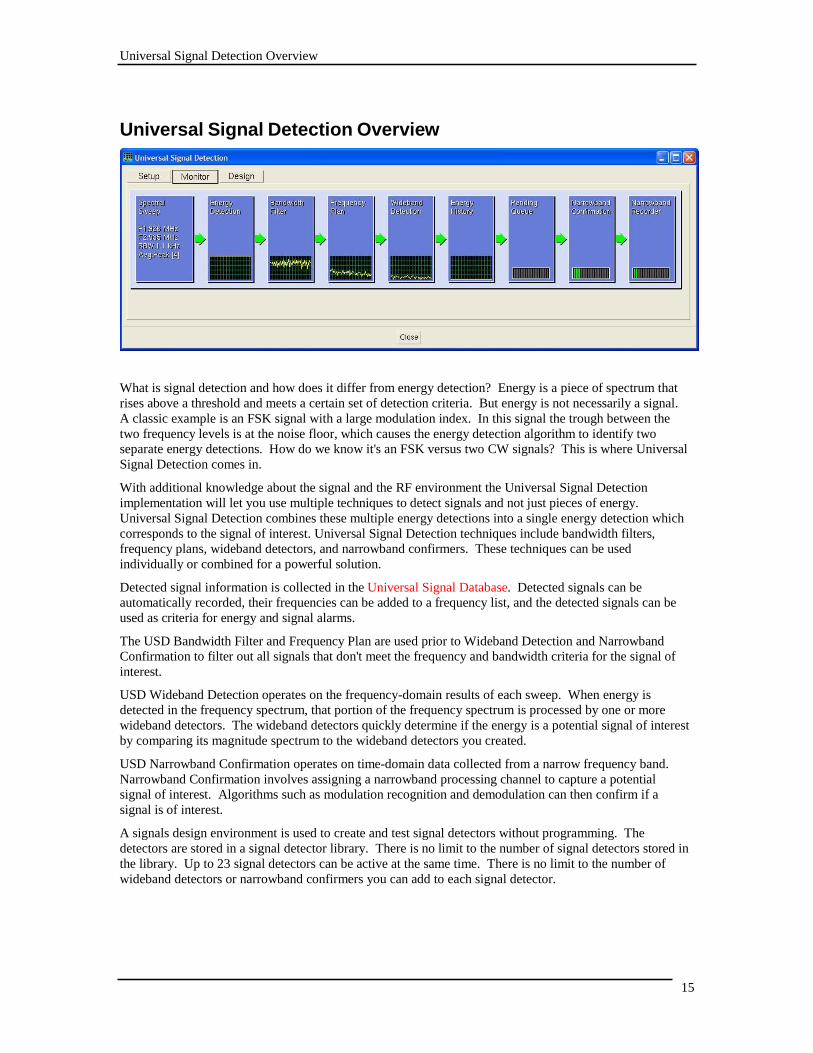
Universal Signal Detection Overview
What is signal detection and how does it differ from energy detection? Energy is a piece of spectrum that
rises above a threshold and meets a certain set of detection criteria. But energy is not necessarily a signal.
A classic example is an FSK signal with a large modulation index. In this signal the trough between the
two frequency levels is at the noise floor, which causes the energy detection algorithm to identify two
separate energy detections. How do we know it's an FSK versus two CW signals? This is where Universal
Signal Detection comes in.
With additional knowledge about the signal and the RF environment the Universal Signal Detection
implementation will let you use multiple techniques to detect signals and not just pieces of energy.
Universal Signal Detection combines these multiple energy detections into a single energy detection which
corresponds to the signal of interest. Universal Signal Detection techniques include bandwidth filters,
frequency plans, wideband detectors, and narrowband confirmers. These techniques can be used
individually or combined for a powerful solution.
Detected signal information is collected in the Universal Signal Database. Detected signals can be
automatically recorded, their frequencies can be added to a frequency list, and the detected signals can be
used as criteria for energy and signal alarms.
The USD Bandwidth Filter and Frequency Plan are used prior to Wideband Detection and Narrowband
Confirmation to filter out all signals that don't meet the frequency and bandwidth criteria for the signal of
interest.
USD Wideband Detection operates on the frequency-domain results of each sweep. When energy is
detected in the frequency spectrum, that portion of the frequency spectrum is processed by one or more
wideband detectors. The wideband detectors quickly determine if the energy is a potential signal of interest
by comparing its magnitude spectrum to the wideband detectors you created.
USD Narrowband Confirmation operates on time-domain data collected from a narrow frequency band.
Narrowband Confirmation involves assigning a narrowband processing channel to capture a potential
signal of interest. Algorithms such as modulation recognition and demodulation can then confirm if a
signal is of interest.
A signals design environment is used to create and test signal detectors without programming. The
detectors are stored in a signal detector library. There is no limit to the number of signal detectors stored in
the library. Up to 23 signal detectors can be active at the same time. There is no limit to the number of
wideband detectors or narrowband confirmers you can add to each signal detector.
16
Universal Signal Detection Overview
To start the Universal Signal Detection application, click the USD icon located on the toolbar or
click Universal > Universal in the menu bar. This brings up the Universal Signal Detection tab view
window, which contains the Setup tab, the Monitor tab, and the Design tab.
The Setup Window is where a Mission Engineer or N6820ES Operator would typically start working with
the Universal Signal Detection application. Mission Engineers and N6820ES Operators start with the
Setup Window to load the signal detector then switch to the Monitor Window to monitor the performance
of the USD application and make adjustments if necessary.
The Design Window is used to create a new signal detector or modify an existing one. Typically only
signal developers access the Design window. Once the signal detectors are designed, it is recommended
that you remove the Design tab from the Universal Signal Detection GUI. This will reduce the chance of
someone corrupting a signal detector. Appending -nodesign to the end of the genericLib line of the
e3238s.cfg file removes the Design tab.
genericLib: C:/e3238s/universal/sigDetector.dll -nodesign
18
USD Setup Window
Enable Signal Detection Check Box
This will enable and disable the signal detection processing. When the check box is selected, the USD
software will check that the N6820ES has the right features, filters, thresholds, energy detection settings,
tuner lock, and alarming configured. Incorrect or not recommended settings are displayed in the Monitor
Window as red or yellow arrows respectively.
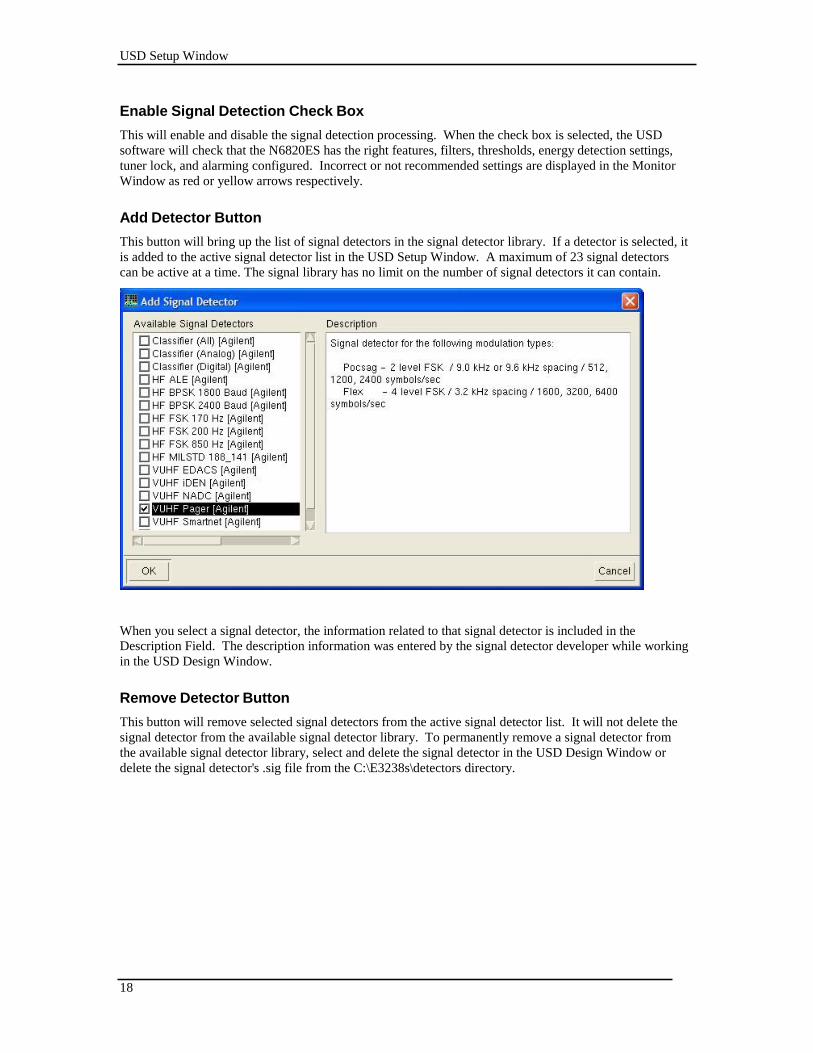
Add Detector Button
This button will bring up the list of signal detectors in the signal detector library. If a detector is selected, it
is added to the active signal detector list in the USD Setup Window. A maximum of 23 signal detectors
can be active at a time. The signal library has no limit on the number of signal detectors it can contain.
When you select a signal detector, the information related to that signal detector is included in the
Description Field. The description information was entered by the signal detector developer while working
in the USD Design Window.
Remove Detector Button
This button will remove selected signal detectors from the active signal detector list. It will not delete the
signal detector from the available signal detector library. To permanently remove a signal detector from
the available signal detector library, select and delete the signal detector in the USD Design Window or
delete the signal detector's .sig file from the C:\E3238s\detectors directory.
19
USD Setup Window
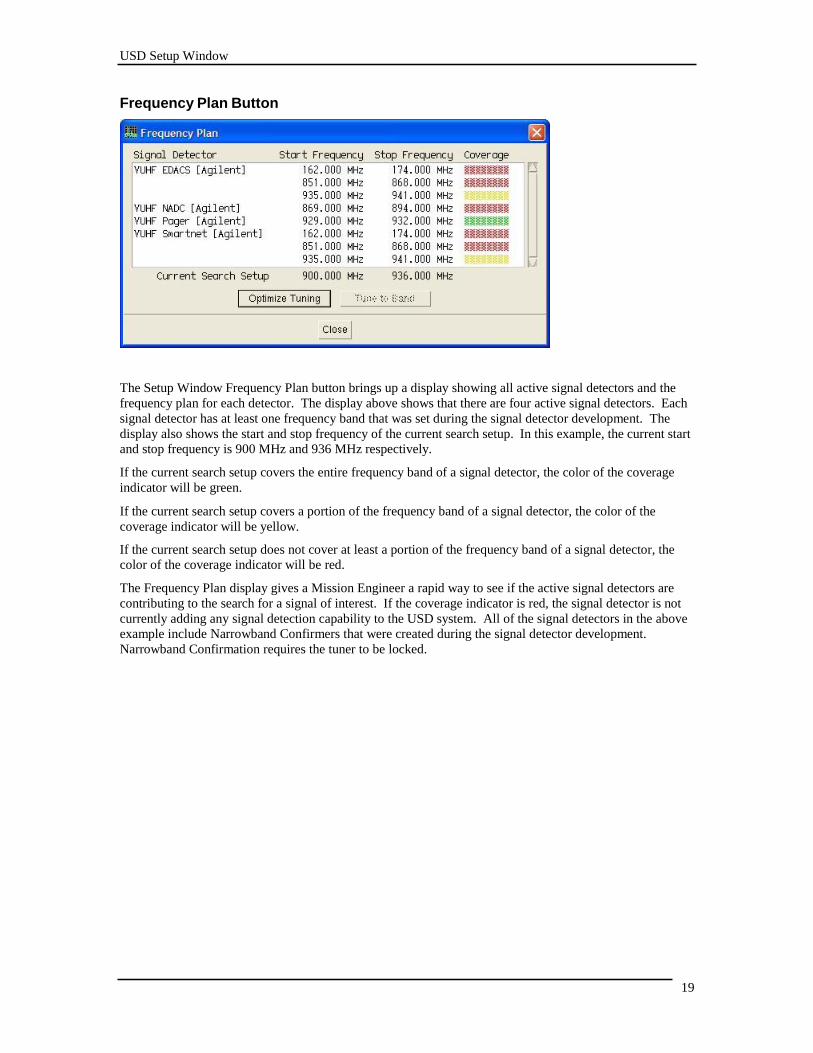
Frequency Plan Button
The Setup Window Frequency Plan button brings up a display showing all active signal detectors and the
frequency plan for each detector. The display above shows that there are four active signal detectors. Each
signal detector has at least one frequency band that was set during the signal detector development. The
display also shows the start and stop frequency of the current search setup. In this example, the current start
and stop frequency is 900 MHz and 936 MHz respectively.
If the current search setup covers the entire frequency band of a signal detector, the color of the coverage
indicator will be green.
If the current search setup covers a portion of the frequency band of a signal detector, the color of the
coverage indicator will be yellow.
If the current search setup does not cover at least a portion of the frequency band of a signal detector, the
color of the coverage indicator will be red.
The Frequency Plan display gives a Mission Engineer a rapid way to see if the active signal detectors are
contributing to the search for a signal of interest. If the coverage indicator is red, the signal detector is not
currently adding any signal detection capability to the USD system. All of the signal detectors in the above
example include Narrowband Confirmers that were created during the signal detector development.
Narrowband Confirmation requires the tuner to be locked.
20
USD Setup Window
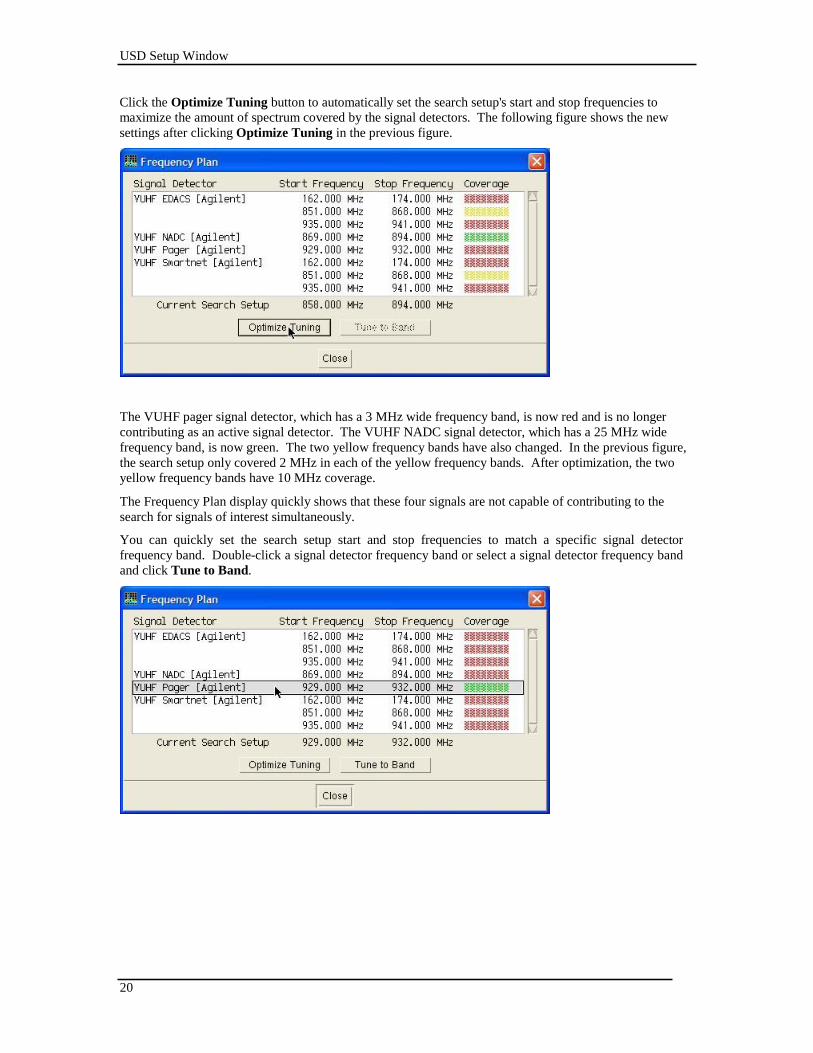
Click the Optimize Tuning button to automatically set the search setup's start and stop frequencies to
maximize the amount of spectrum covered by the signal detectors. The following figure shows the new
settings after clicking Optimize Tuning in the previous figure.
The VUHF pager signal detector, which has a 3 MHz wide frequency band, is now red and is no longer
contributing as an active signal detector. The VUHF NADC signal detector, which has a 25 MHz wide
frequency band, is now green. The two yellow frequency bands have also changed. In the previous figure,
the search setup only covered 2 MHz in each of the yellow frequency bands. After optimization, the two
yellow frequency bands have 10 MHz coverage.
The Frequency Plan display quickly shows that these four signals are not capable of contributing to the
search for signals of interest simultaneously.
You can quickly set the search setup start and stop frequencies to match a specific signal detector
frequency band. Double-click a signal detector frequency band or select a signal detector frequency band
and click Tune to Band.
USD Setup Window
21
N6820ES Requirements Button
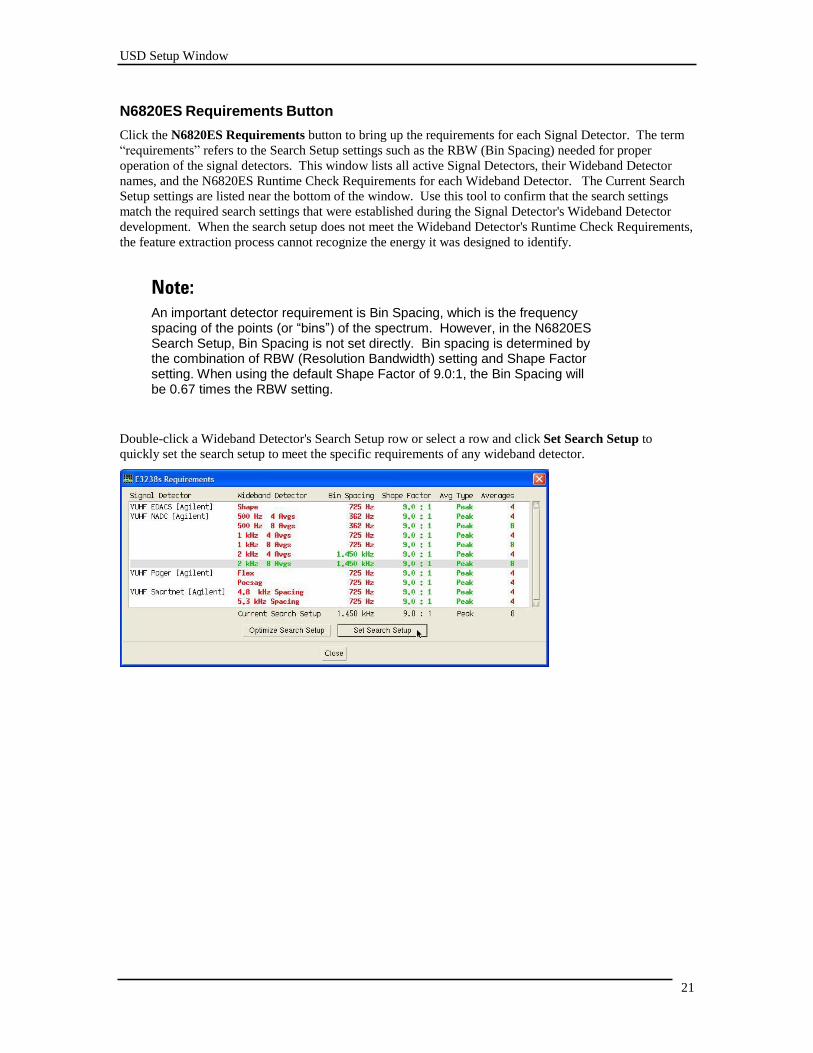
Click the N6820ES Requirements button to bring up the requirements for each Signal Detector. The term
“requirements” refers to the Search Setup settings such as the RBW (Bin Spacing) needed for proper
operation of the signal detectors. This window lists all active Signal Detectors, their Wideband Detector
names, and the N6820ES Runtime Check Requirements for each Wideband Detector. The Current Search
Setup settings are listed near the bottom of the window. Use this tool to confirm that the search settings
match the required search settings that were established during the Signal Detector's Wideband Detector
development. When the search setup does not meet the Wideband Detector's Runtime Check Requirements,
the feature extraction process cannot recognize the energy it was designed to identify.
Note:
An important detector requirement is Bin Spacing, which is the frequency spacing of the points (or “bins”) of the spectrum. However, in the N6820ES Search Setup, Bin Spacing is not set directly. Bin spacing is determined by the combination of RBW (Resolution Bandwidth) setting and Shape Factor setting. When using the default Shape Factor of 9.0:1, the Bin Spacing will be 0.67 times the RBW setting.
Double-click a Wideband Detector's Search Setup row or select a row and click Set Search Setup to
quickly set the search setup to meet the specific requirements of any wideband detector.
USD Setup Window
20
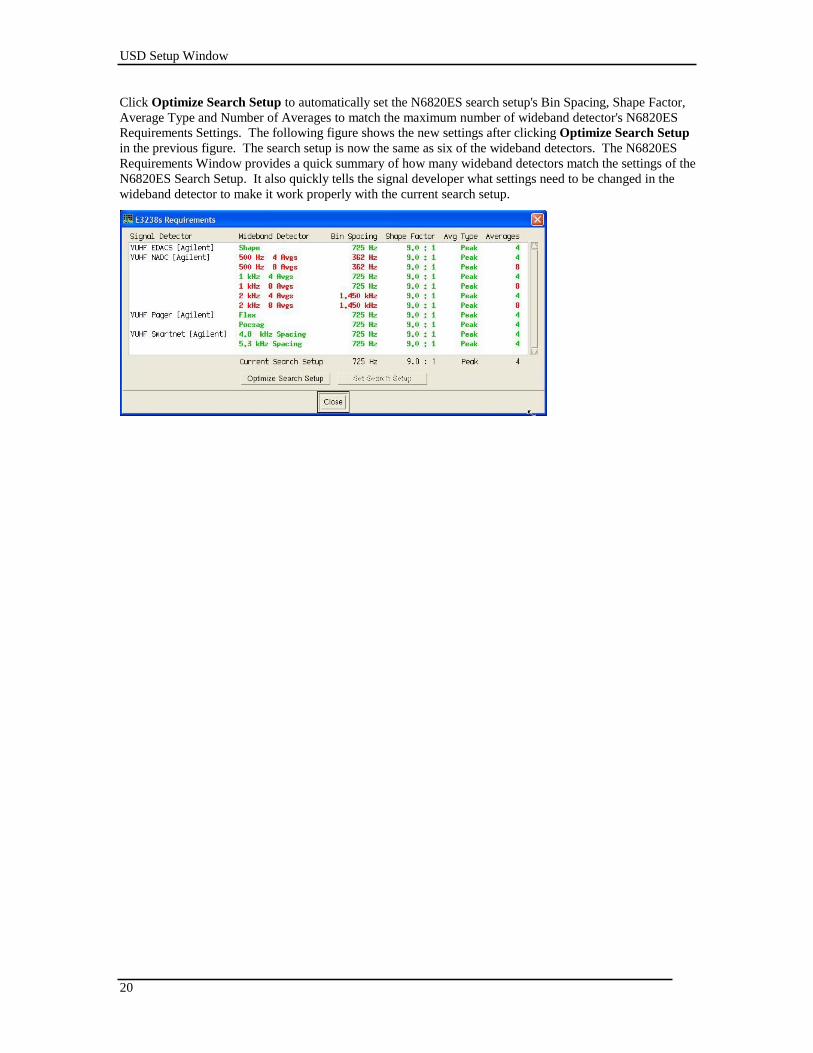
Click Optimize Search Setup to automatically set the N6820ES search setup's Bin Spacing, Shape Factor,
Average Type and Number of Averages to match the maximum number of wideband detector's N6820ES
Requirements Settings. The following figure shows the new settings after clicking Optimize Search Setup
in the previous figure. The search setup is now the same as six of the wideband detectors. The N6820ES
Requirements Window provides a quick summary of how many wideband detectors match the settings of the
N6820ES Search Setup. It also quickly tells the signal developer what settings need to be changed in the
wideband detector to make it work properly with the current search setup.
USD Setup Window
22
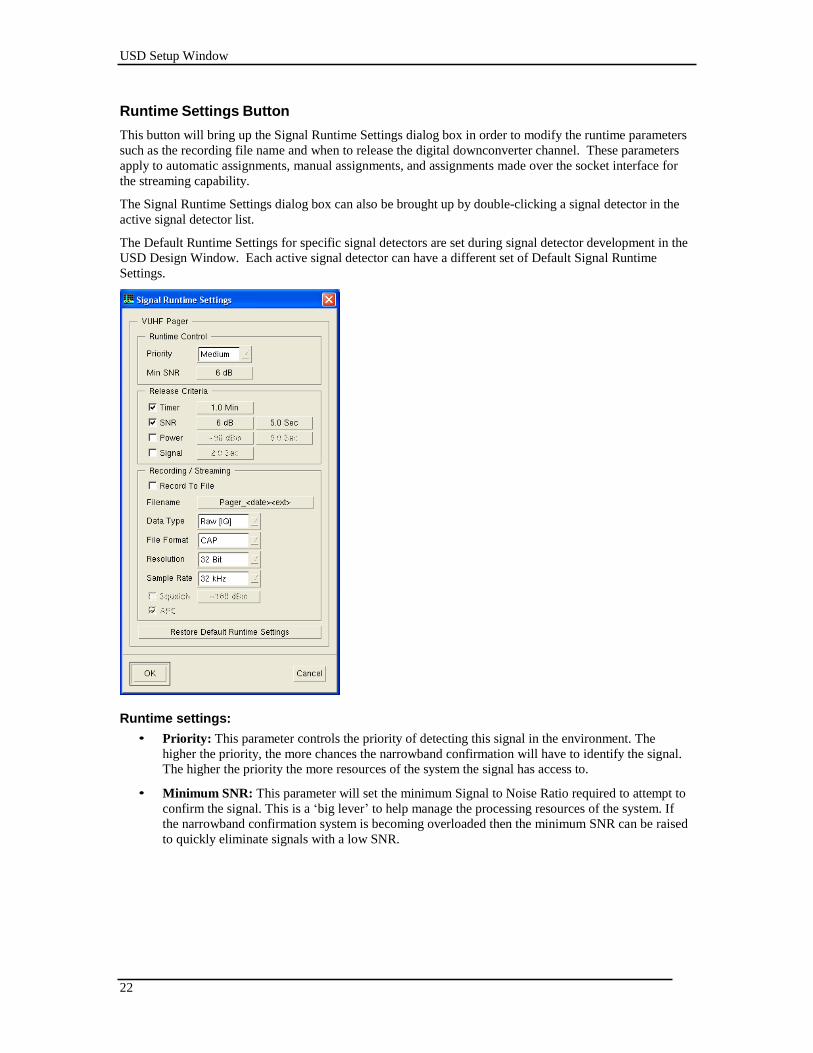
Runtime Settings Button
This button will bring up the Signal Runtime Settings dialog box in order to modify the runtime parameters
such as the recording file name and when to release the digital downconverter channel. These parameters
apply to automatic assignments, manual assignments, and assignments made over the socket interface for
the streaming capability.
The Signal Runtime Settings dialog box can also be brought up by double-clicking a signal detector in the
active signal detector list.
The Default Runtime Settings for specific signal detectors are set during signal detector development in the
USD Design Window. Each active signal detector can have a different set of Default Signal Runtime
Settings.
Runtime settings:
• Priority: This parameter controls the priority of detecting this signal in the environment. The
higher the priority, the more chances the narrowband confirmation will have to identify the signal.
The higher the priority the more resources of the system the signal has access to.
• Minimum SNR: This parameter will set the minimum Signal to Noise Ratio required to attempt to
confirm the signal. This is a ‘big lever’ to help manage the processing resources of the system. If
the narrowband confirmation system is becoming overloaded then the minimum SNR can be raised
to quickly eliminate signals with a low SNR.
USD Setup Window
23
• Release Criteria: These parameters control how the narrowband confirmation channel is released.
Release Criteria is only used when recording is on. If recording isn't on, the release criteria settings
have no effect. When recording is on, the recording will stop based on the release criteria. The
Release Criteria selections are OR'd. The first criterion met will cause the recording to stop. By
default, the recordings are saved in the C:\snapshot directory.
• Timer: The most basic release criterion is to set the timer to a specific time frame, such as 60
seconds. At the end of 60 seconds, the recording stops whether the signal is up or not.
• SNR: The channel will be released if the signal to noise ratio falls below the minimum SNR
for the specified time period. This is typically the most effective technique. For example,
you could set the release criteria to stop recording if the SNR goes below 3 dB for 5 Seconds.
• Power Level: The channel will be released if the power level falls below the specified
minimum power level for the specified time period. Depending on the environment, selecting
Power as the release criterion may be a little unreliable. If you're in an environment where the
noise floor is jumping up and down it may not be the best choice. If the environment is fairly
stable, you could set the Power Release Criteria to an appropriate setting. For example, you
could set the release criteria to stop recording if the Power goes below -100 dBm for 2
Seconds.
• Signal: The channel will be released if the "Release" Narrowband Confirmer doesn’t detect
the specified modulation for the length of time specified in the Signal Time Entry. The
interval at which the narrowband confirmer checks for the presence of the modulation is
controlled by the narrowband confirmer's Release Check Interval and the signal’s priority
setting. If the narrowband confirmer is set to Detection Only, the Signal Release Criteria has
no effect. Signal release is not often recommended as it consumes extra signal processing
CPU time. Signal release is only recommend when you want to release based on the absence
of a particular modulation, where the signal continues to be up (so SNR and Power won’t
work).
USD Setup Window
24
Recording / Streaming: These parameters specify the properties of narrowband data that is saved to disk
or streamed to a client program.
• Record To File check box: This parameter specifies whether narrowband data recording to
disk is on or off.
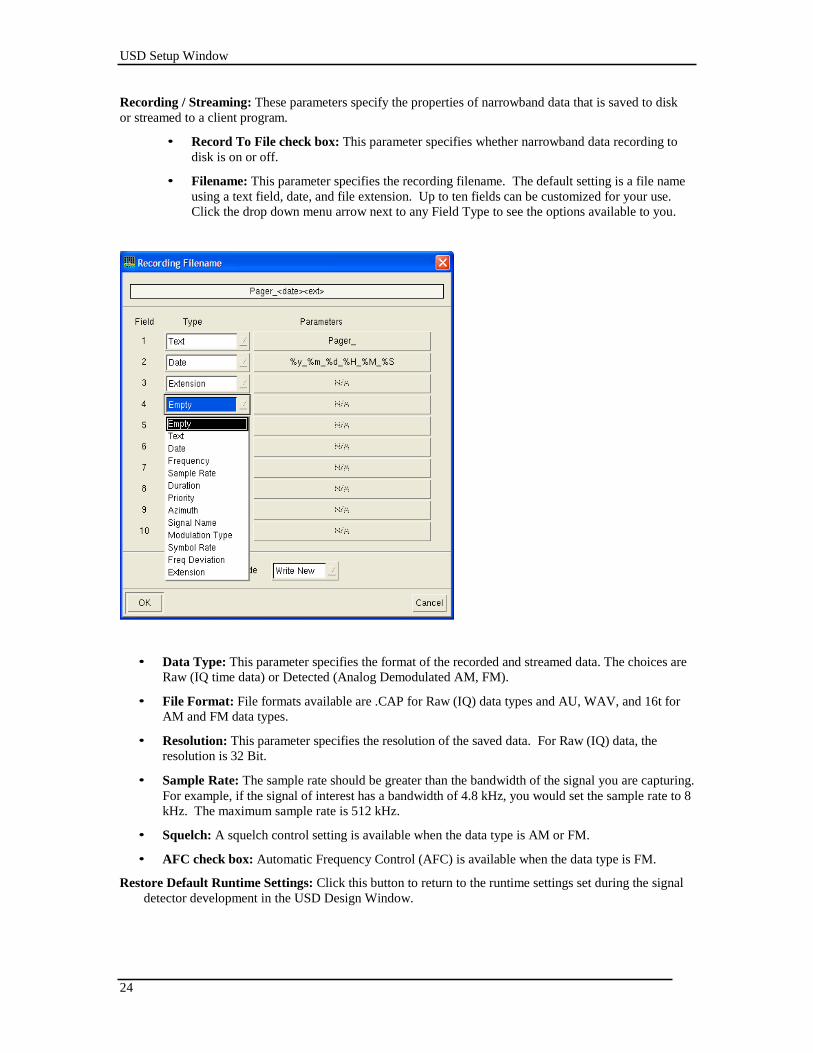
• Filename: This parameter specifies the recording filename. The default setting is a file name
using a text field, date, and file extension. Up to ten fields can be customized for your use.
Click the drop down menu arrow next to any Field Type to see the options available to you.
• Data Type: This parameter specifies the format of the recorded and streamed data. The choices are
Raw (IQ time data) or Detected (Analog Demodulated AM, FM).
• File Format: File formats available are .CAP for Raw (IQ) data types and AU, WAV, and 16t for
AM and FM data types.
• Resolution: This parameter specifies the resolution of the saved data. For Raw (IQ) data, the
resolution is 32 Bit.
• Sample Rate: The sample rate should be greater than the bandwidth of the signal you are capturing.
For example, if the signal of interest has a bandwidth of 4.8 kHz, you would set the sample rate to 8
kHz. The maximum sample rate is 512 kHz.
• Squelch: A squelch control setting is available when the data type is AM or FM.
• AFC check box: Automatic Frequency Control (AFC) is available when the data type is FM.
Restore Default Runtime Settings: Click this button to return to the runtime settings set during the signal
detector development in the USD Design Window.
USD Setup Window
25
Global Settings Button
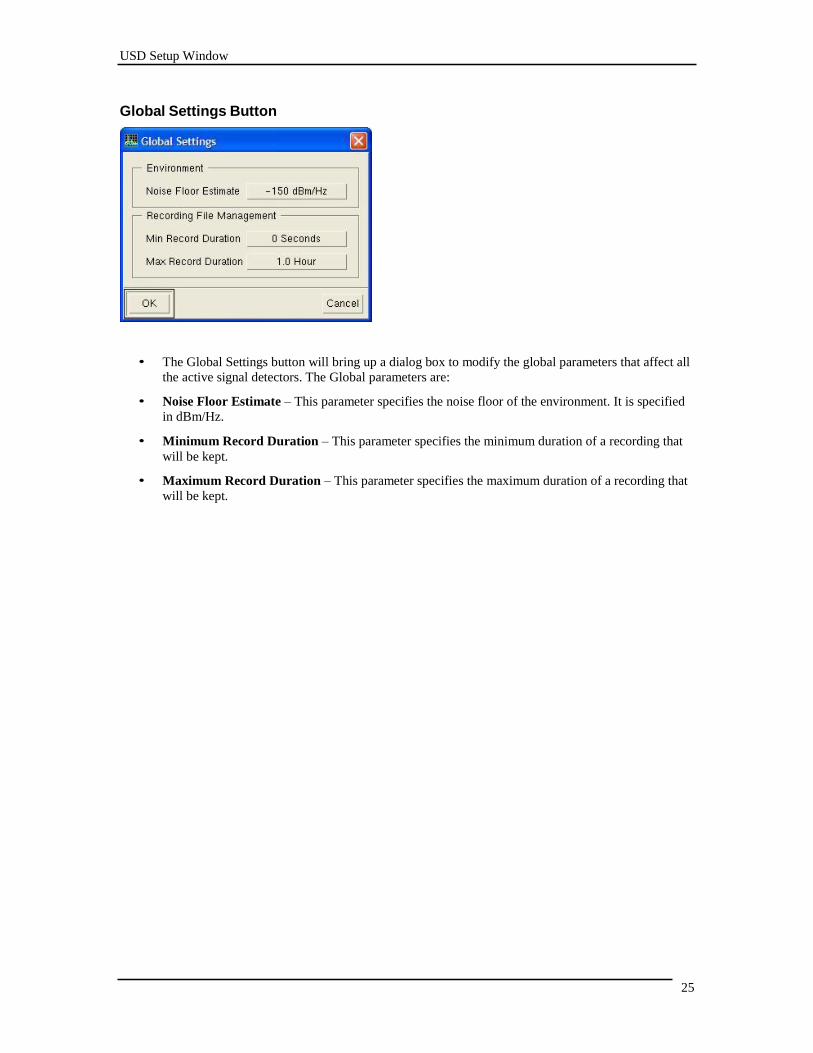
• The Global Settings button will bring up a dialog box to modify the global parameters that affect all
the active signal detectors. The Global parameters are:
• Noise Floor Estimate – This parameter specifies the noise floor of the environment. It is specified
in dBm/Hz.
• Minimum Record Duration – This parameter specifies the minimum duration of a recording that
will be kept.
• Maximum Record Duration – This parameter specifies the maximum duration of a recording that
will be kept.
26
USD Monitor Window
USD Monitor Window
USD Monitor Window Overview
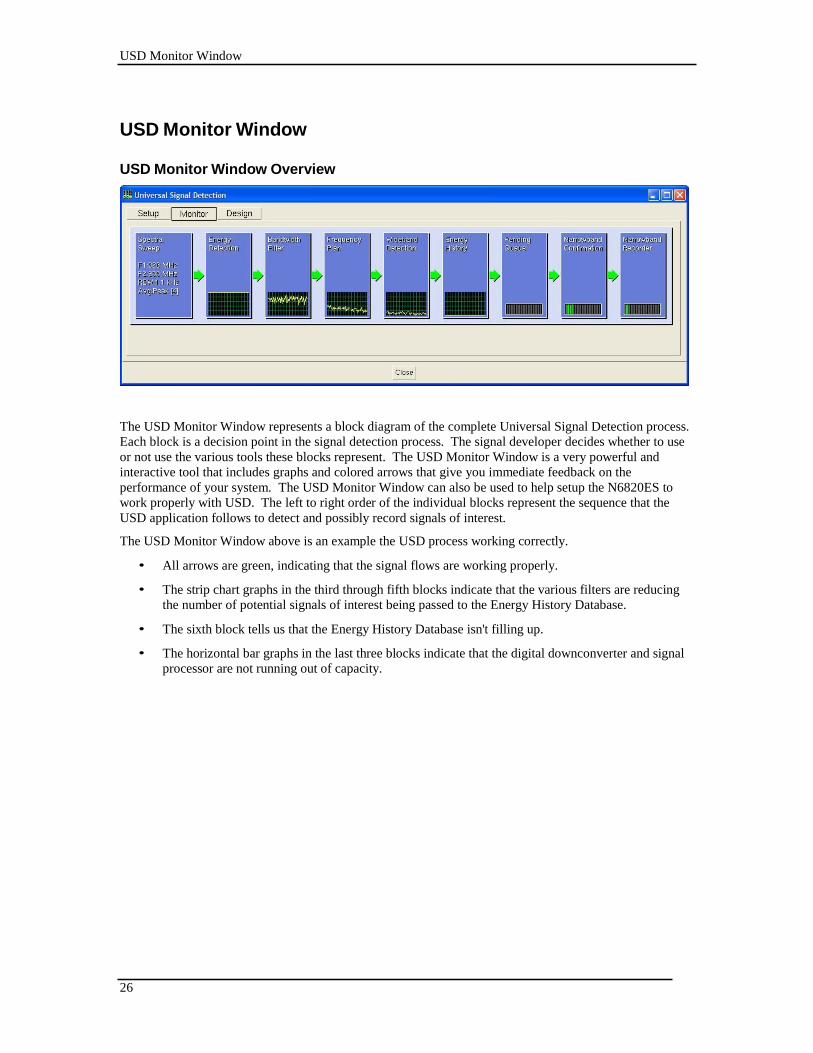
The USD Monitor Window represents a block diagram of the complete Universal Signal Detection process.
Each block is a decision point in the signal detection process. The signal developer decides whether to use
or not use the various tools these blocks represent. The USD Monitor Window is a very powerful and
interactive tool that includes graphs and colored arrows that give you immediate feedback on the
performance of your system. The USD Monitor Window can also be used to help setup the N6820ES to
work properly with USD. The left to right order of the individual blocks represent the sequence that the
USD application follows to detect and possibly record signals of interest.
The USD Monitor Window above is an example the USD process working correctly.
• All arrows are green, indicating that the signal flows are working properly.
• The strip chart graphs in the third through fifth blocks indicate that the various filters are reducing
the number of potential signals of interest being passed to the Energy History Database.
• The sixth block tells us that the Energy History Database isn't filling up.
• The horizontal bar graphs in the last three blocks indicate that the digital downconverter and signal
processor are not running out of capacity.
27
USD Monitor Window
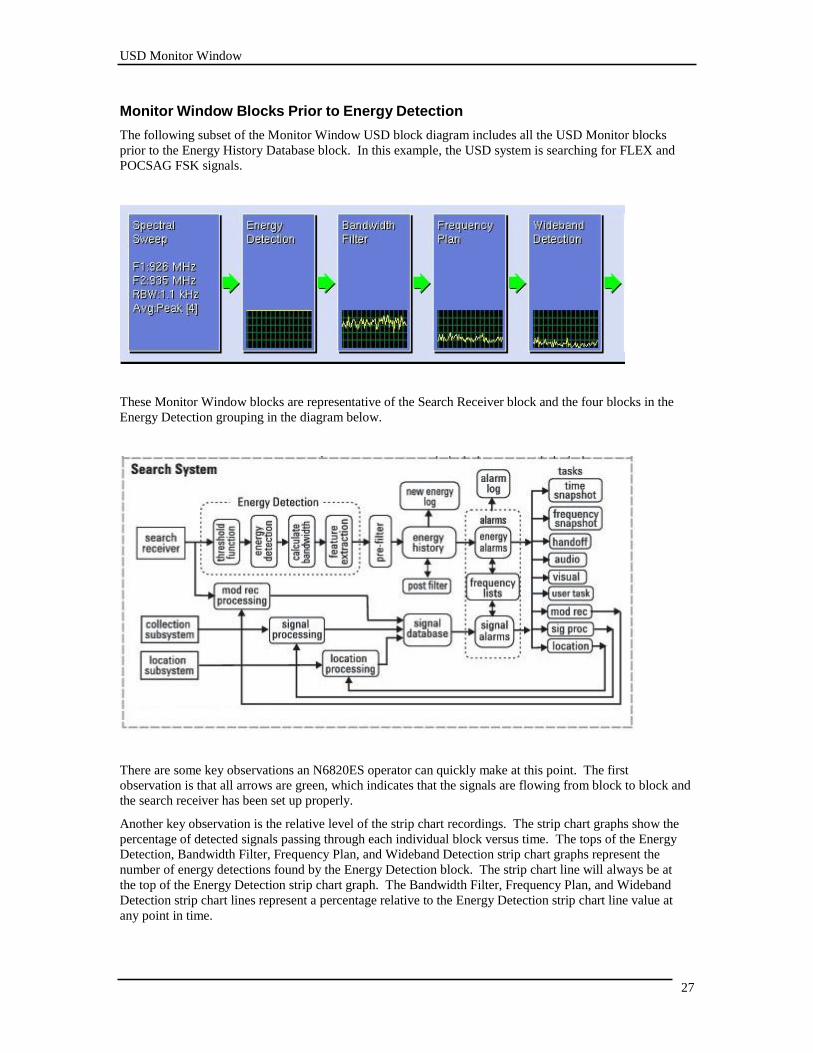
Monitor Window Blocks Prior to Energy Detection
The following subset of the Monitor Window USD block diagram includes all the USD Monitor blocks
prior to the Energy History Database block. In this example, the USD system is searching for FLEX and
POCSAG FSK signals.
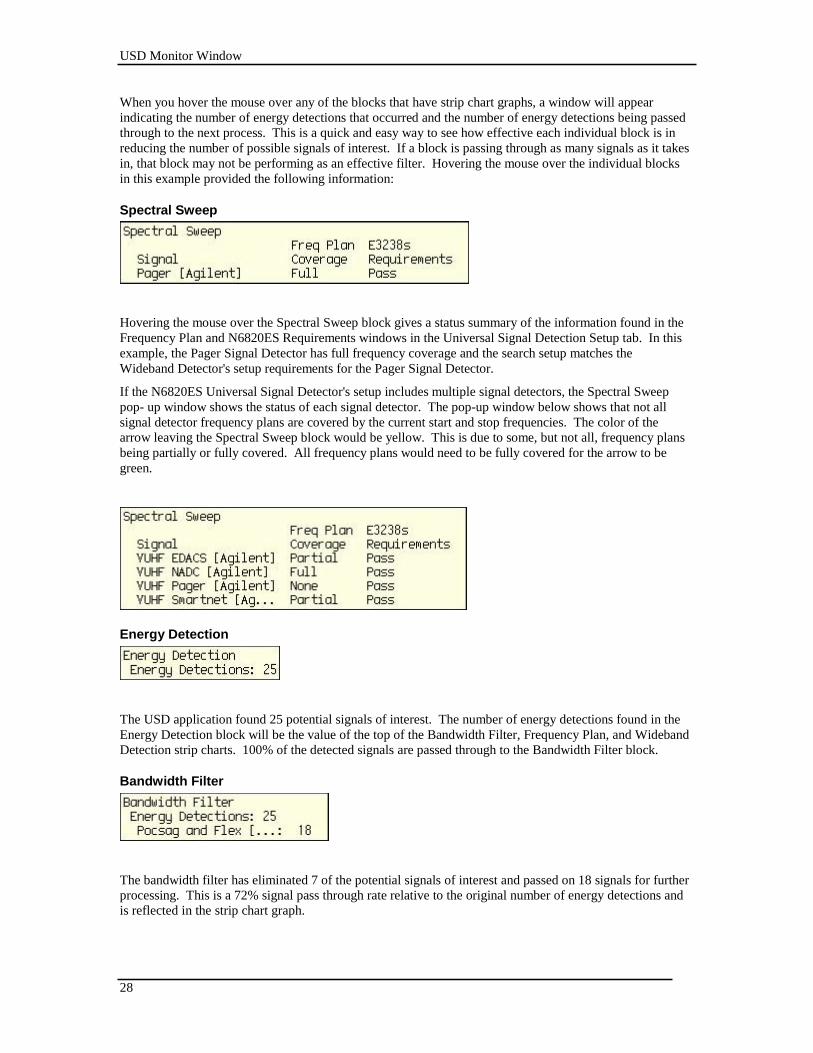
These Monitor Window blocks are representative of the Search Receiver block and the four blocks in the
Energy Detection grouping in the diagram below.
There are some key observations an N6820ES operator can quickly make at this point. The first
observation is that all arrows are green, which indicates that the signals are flowing from block to block and
the search receiver has been set up properly.
Another key observation is the relative level of the strip chart recordings. The strip chart graphs show the
percentage of detected signals passing through each individual block versus time. The tops of the Energy
Detection, Bandwidth Filter, Frequency Plan, and Wideband Detection strip chart graphs represent the
number of energy detections found by the Energy Detection block. The strip chart line will always be at
the top of the Energy Detection strip chart graph. The Bandwidth Filter, Frequency Plan, and Wideband
Detection strip chart lines represent a percentage relative to the Energy Detection strip chart line value at
any point in time.
28
USD Monitor Window
When you hover the mouse over any of the blocks that have strip chart graphs, a window will appear
indicating the number of energy detections that occurred and the number of energy detections being passed
through to the next process. This is a quick and easy way to see how effective each individual block is in
reducing the number of possible signals of interest. If a block is passing through as many signals as it takes
in, that block may not be performing as an effective filter. Hovering the mouse over the individual blocks
in this example provided the following information:
Spectral Sweep
Hovering the mouse over the Spectral Sweep block gives a status summary of the information found in the
Frequency Plan and N6820ES Requirements windows in the Universal Signal Detection Setup tab. In this
example, the Pager Signal Detector has full frequency coverage and the search setup matches the
Wideband Detector's setup requirements for the Pager Signal Detector.
If the N6820ES Universal Signal Detector's setup includes multiple signal detectors, the Spectral Sweep
pop- up window shows the status of each signal detector. The pop-up window below shows that not all
signal detector frequency plans are covered by the current start and stop frequencies. The color of the
arrow leaving the Spectral Sweep block would be yellow. This is due to some, but not all, frequency plans
being partially or fully covered. All frequency plans would need to be fully covered for the arrow to be
green.
Energy Detection
The USD application found 25 potential signals of interest. The number of energy detections found in the
Energy Detection block will be the value of the top of the Bandwidth Filter, Frequency Plan, and Wideband
Detection strip charts. 100% of the detected signals are passed through to the Bandwidth Filter block.
Bandwidth Filter
The bandwidth filter has eliminated 7 of the potential signals of interest and passed on 18 signals for further
processing. This is a 72% signal pass through rate relative to the original number of energy detections and
is reflected in the strip chart graph.
29
USD Monitor Window
Frequency Plan
The frequency plan has eliminated an additional 13 potential signals of interest and passed on 5 signals for
further processing. This is a 20% signal pass through rate relative to the original number of energy
detections and is reflected in the strip chart graph.
Wideband Detection
The Wideband Detection process has eliminated an additional 2 potential signals of interest and passed
three to the energy history database. This is a 12% signal pass through rate relative to the original number
of energy detections and is reflected in the strip chart graph.
As you can see, this is an example of an effective Universal Signal Detector setup. Using the USD tools,
the number of potential signals of interest at a specific point in time has been reduced from 25 to 3 prior to
entry into the Energy History Database.
USD Monitor Window
30
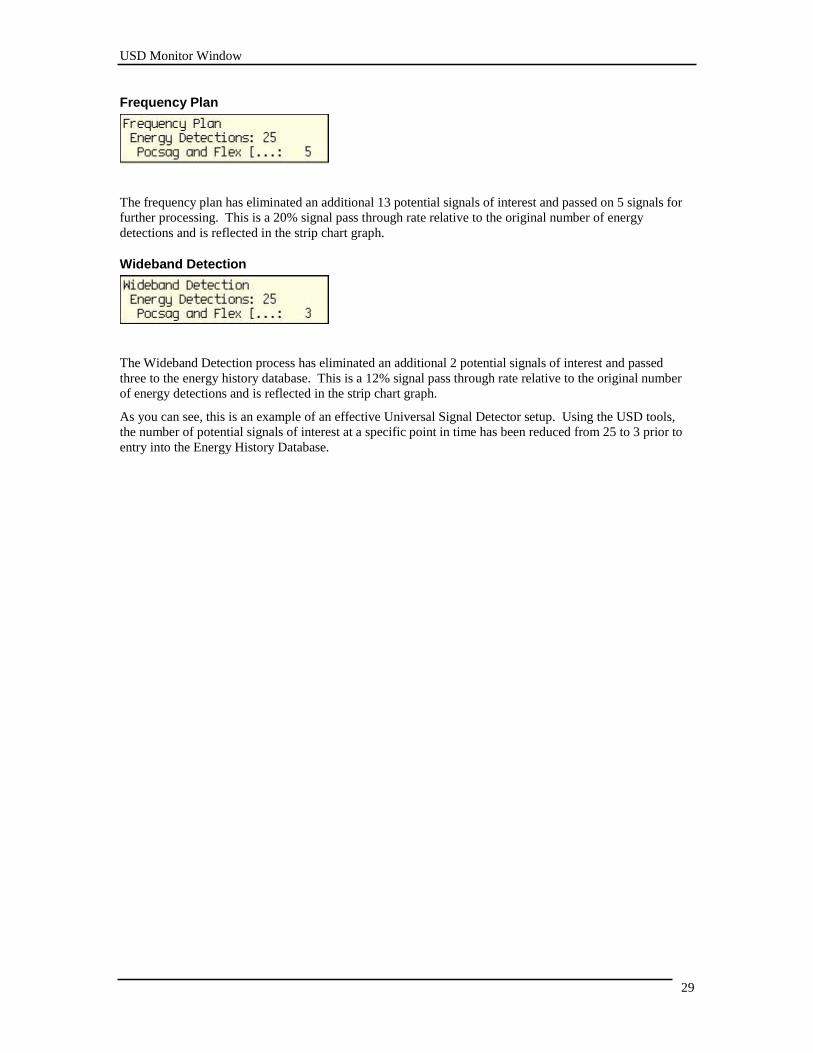
Monitor Window Blocks from Energy History to Recording
The Monitor Window blocks in the image above are representative of all blocks except for the Search
Receiver block and the four blocks in the Energy Detection grouping in the diagram below.
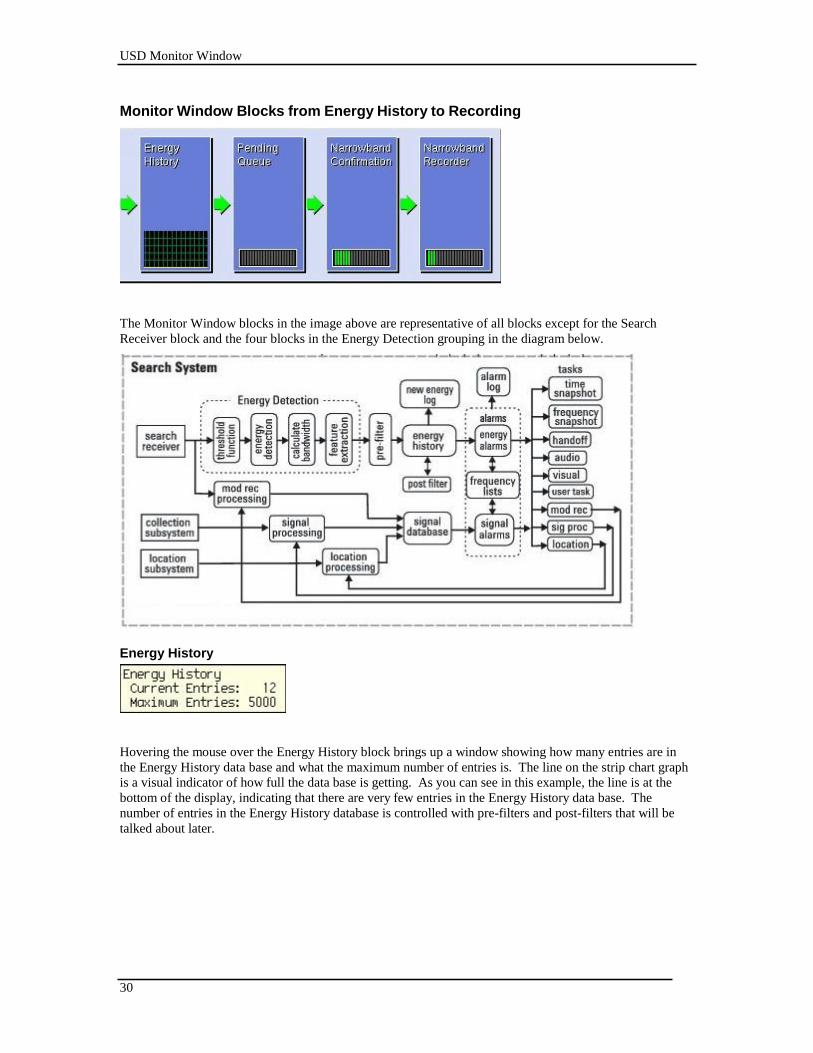
Energy History
Hovering the mouse over the Energy History block brings up a window showing how many entries are in
the Energy History data base and what the maximum number of entries is. The line on the strip chart graph
is a visual indicator of how full the data base is getting. As you can see in this example, the line is at the
bottom of the display, indicating that there are very few entries in the Energy History data base. The
number of entries in the Energy History database is controlled with pre-filters and post-filters that will be
talked about later.
USD Monitor Window
31
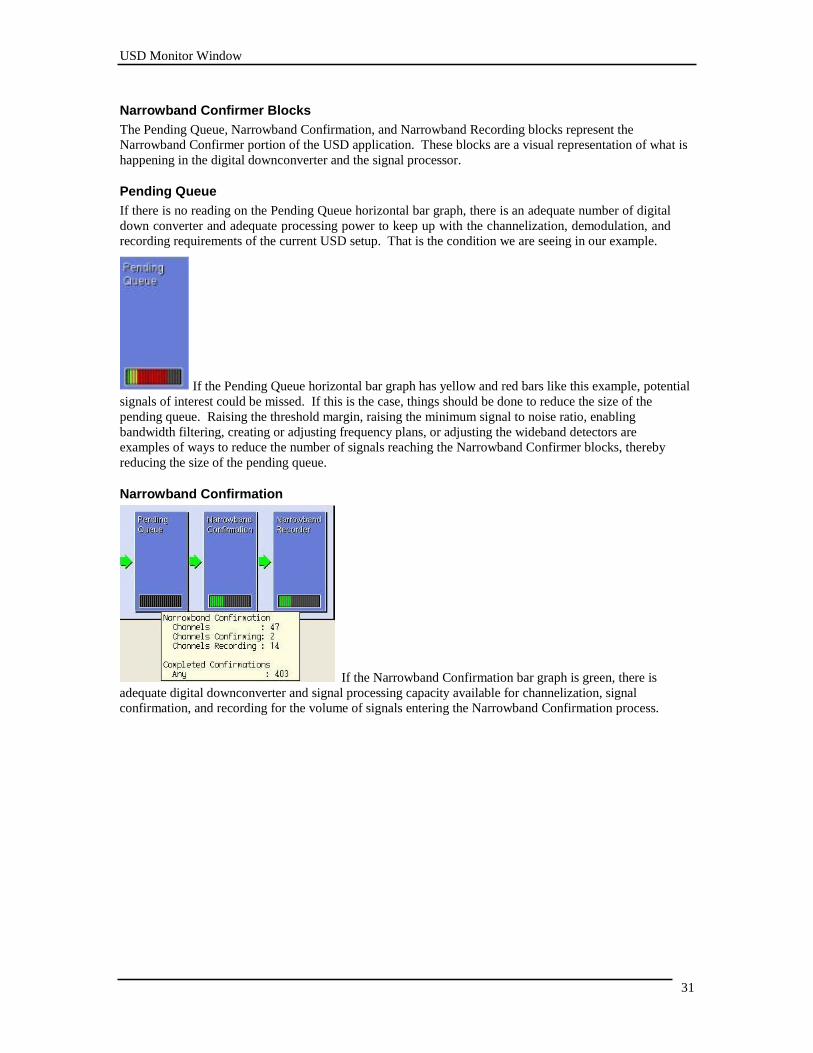
Narrowband Confirmer Blocks
The Pending Queue, Narrowband Confirmation, and Narrowband Recording blocks represent the
Narrowband Confirmer portion of the USD application. These blocks are a visual representation of what is
happening in the digital downconverter and the signal processor.
Pending Queue
If there is no reading on the Pending Queue horizontal bar graph, there is an adequate number of digital
down converter and adequate processing power to keep up with the channelization, demodulation, and
recording requirements of the current USD setup. That is the condition we are seeing in our example.
If the Pending Queue horizontal bar graph has yellow and red bars like this example, potential
signals of interest could be missed. If this is the case, things should be done to reduce the size of the
pending queue. Raising the threshold margin, raising the minimum signal to noise ratio, enabling
bandwidth filtering, creating or adjusting frequency plans, or adjusting the wideband detectors are
examples of ways to reduce the number of signals reaching the Narrowband Confirmer blocks, thereby
reducing the size of the pending queue.
Narrowband Confirmation
If the Narrowband Confirmation bar graph is green, there is
adequate digital downconverter and signal processing capacity available for channelization, signal
confirmation, and recording for the volume of signals entering the Narrowband Confirmation process.
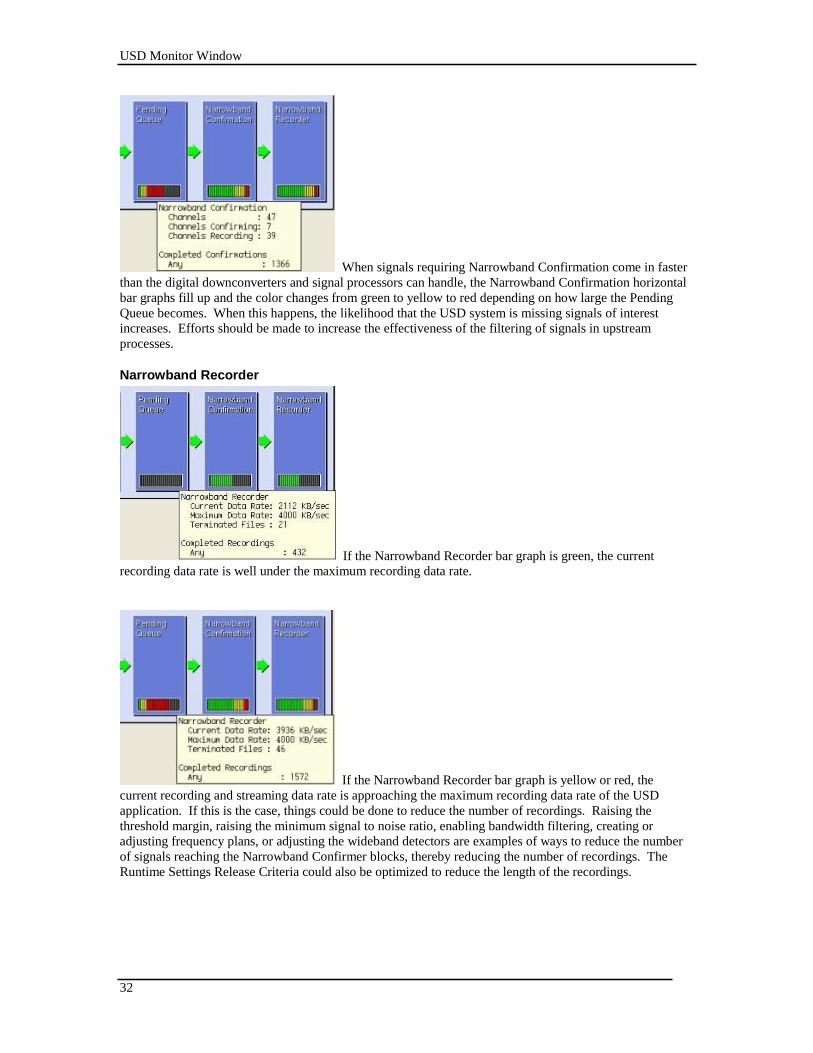
USD Monitor Window
32
When signals requiring Narrowband Confirmation come in faster
than the digital downconverters and signal processors can handle, the Narrowband Confirmation horizontal
bar graphs fill up and the color changes from green to yellow to red depending on how large the Pending
Queue becomes. When this happens, the likelihood that the USD system is missing signals of interest
increases. Efforts should be made to increase the effectiveness of the filtering of signals in upstream
processes.
Narrowband Recorder
If the Narrowband Recorder bar graph is green, the current
recording data rate is well under the maximum recording data rate.
If the Narrowband Recorder bar graph is yellow or red, the
current recording and streaming data rate is approaching the maximum recording data rate of the USD
application. If this is the case, things could be done to reduce the number of recordings. Raising the
threshold margin, raising the minimum signal to noise ratio, enabling bandwidth filtering, creating or
adjusting frequency plans, or adjusting the wideband detectors are examples of ways to reduce the number
of signals reaching the Narrowband Confirmer blocks, thereby reducing the number of recordings. The
Runtime Settings Release Criteria could also be optimized to reduce the length of the recordings.
USD Monitor Window
33
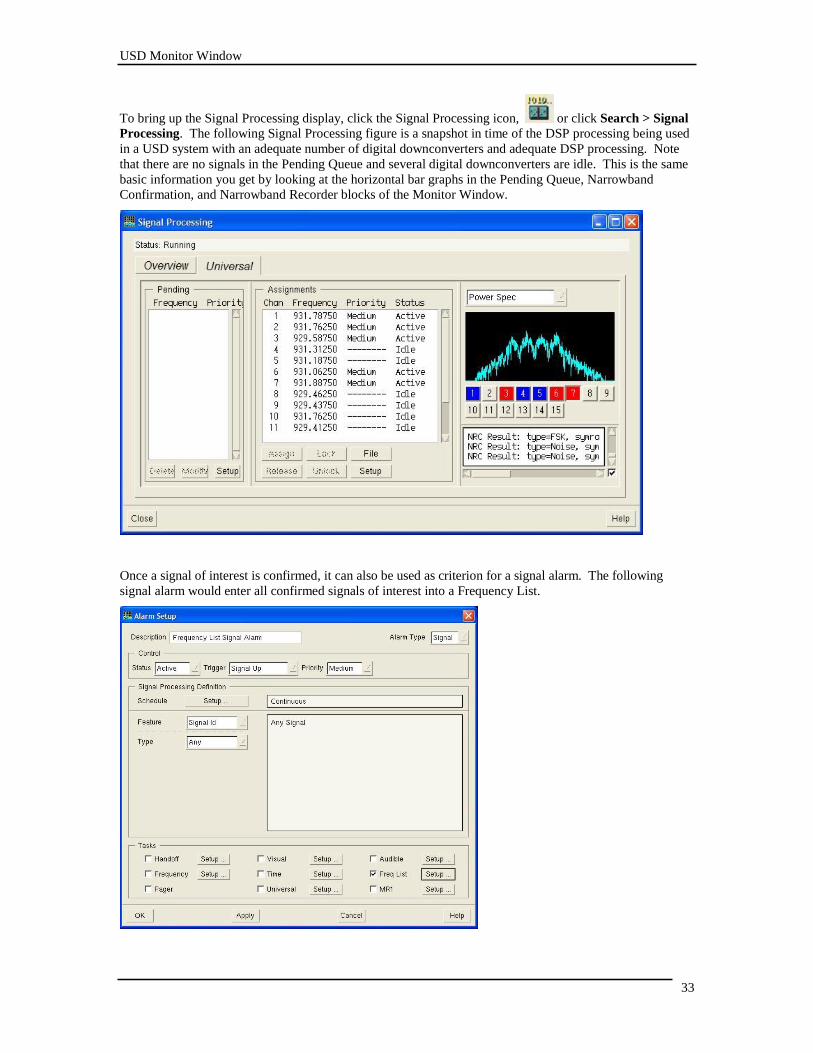
To bring up the Signal Processing display, click the Signal Processing icon, or click Search > Signal
Processing. The following Signal Processing figure is a snapshot in time of the DSP processing being used
in a USD system with an adequate number of digital downconverters and adequate DSP processing. Note
that there are no signals in the Pending Queue and several digital downconverters are idle. This is the same
basic information you get by looking at the horizontal bar graphs in the Pending Queue, Narrowband
Confirmation, and Narrowband Recorder blocks of the Monitor Window.
Once a signal of interest is confirmed, it can also be used as criterion for a signal alarm. The following
signal alarm would enter all confirmed signals of interest into a Frequency List.
USD Monitor Window
34
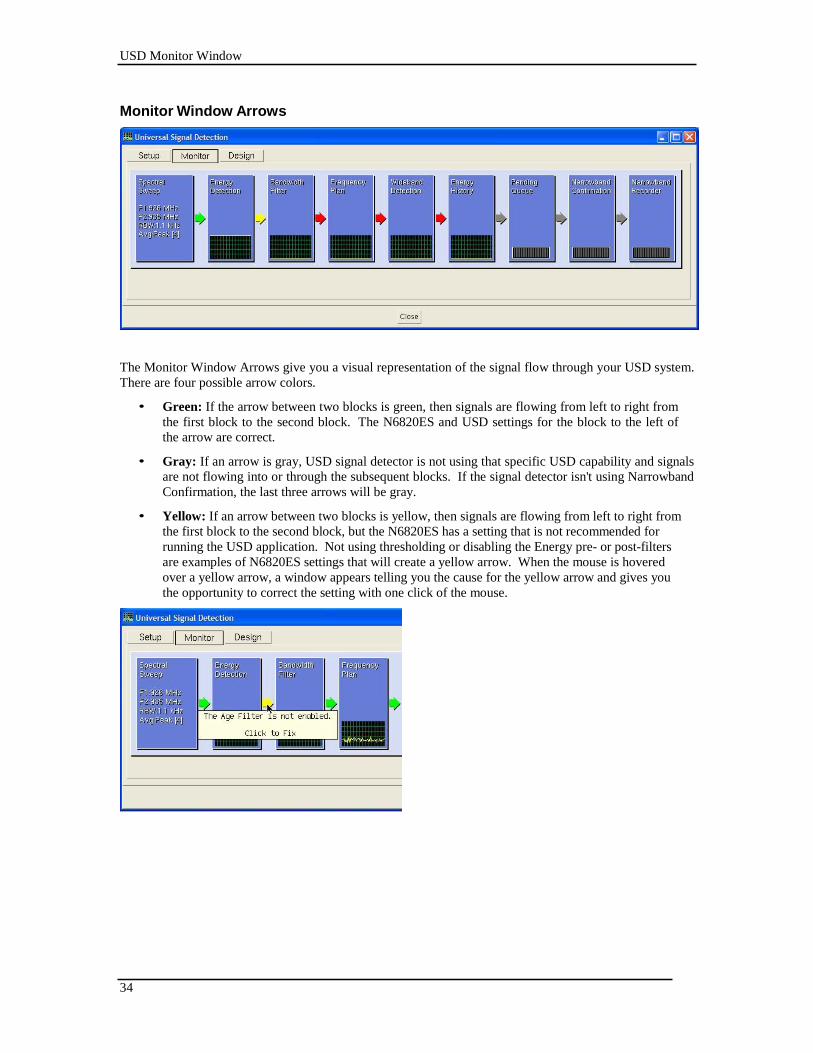
Monitor Window Arrows
The Monitor Window Arrows give you a visual representation of the signal flow through your USD system.
There are four possible arrow colors.
• Green: If the arrow between two blocks is green, then signals are flowing from left to right from
the first block to the second block. The N6820ES and USD settings for the block to the left of
the arrow are correct.
• Gray: If an arrow is gray, USD signal detector is not using that specific USD capability and signals
are not flowing into or through the subsequent blocks. If the signal detector isn't using Narrowband
Confirmation, the last three arrows will be gray.
• Yellow: If an arrow between two blocks is yellow, then signals are flowing from left to right from
the first block to the second block, but the N6820ES has a setting that is not recommended for
running the USD application. Not using thresholding or disabling the Energy pre- or post-filters
are examples of N6820ES settings that will create a yellow arrow. When the mouse is hovered
over a yellow arrow, a window appears telling you the cause for the yellow arrow and gives you
the opportunity to correct the setting with one click of the mouse.
USD Monitor Window
35
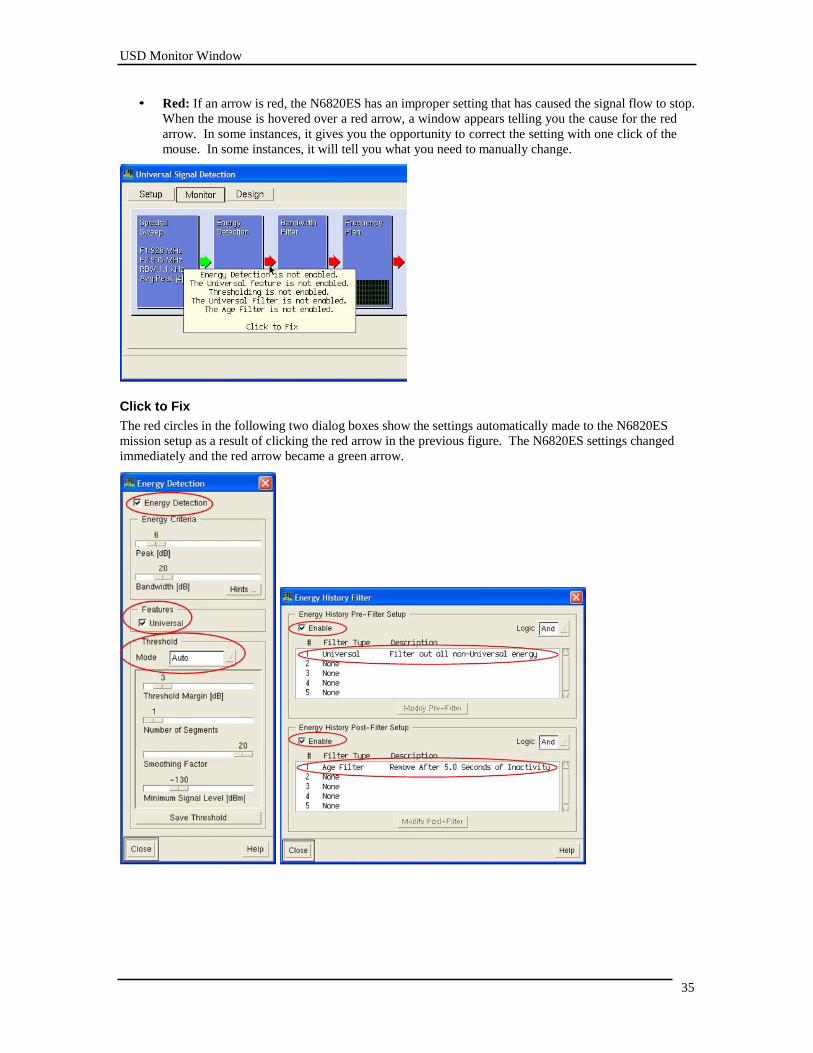
• Red: If an arrow is red, the N6820ES has an improper setting that has caused the signal flow to stop.
When the mouse is hovered over a red arrow, a window appears telling you the cause for the red
arrow. In some instances, it gives you the opportunity to correct the setting with one click of the
mouse. In some instances, it will tell you what you need to manually change.
Click to Fix
The red circles in the following two dialog boxes show the settings automatically made to the N6820ES
mission setup as a result of clicking the red arrow in the previous figure. The N6820ES settings changed
immediately and the red arrow became a green arrow.
USD Monitor Window
36
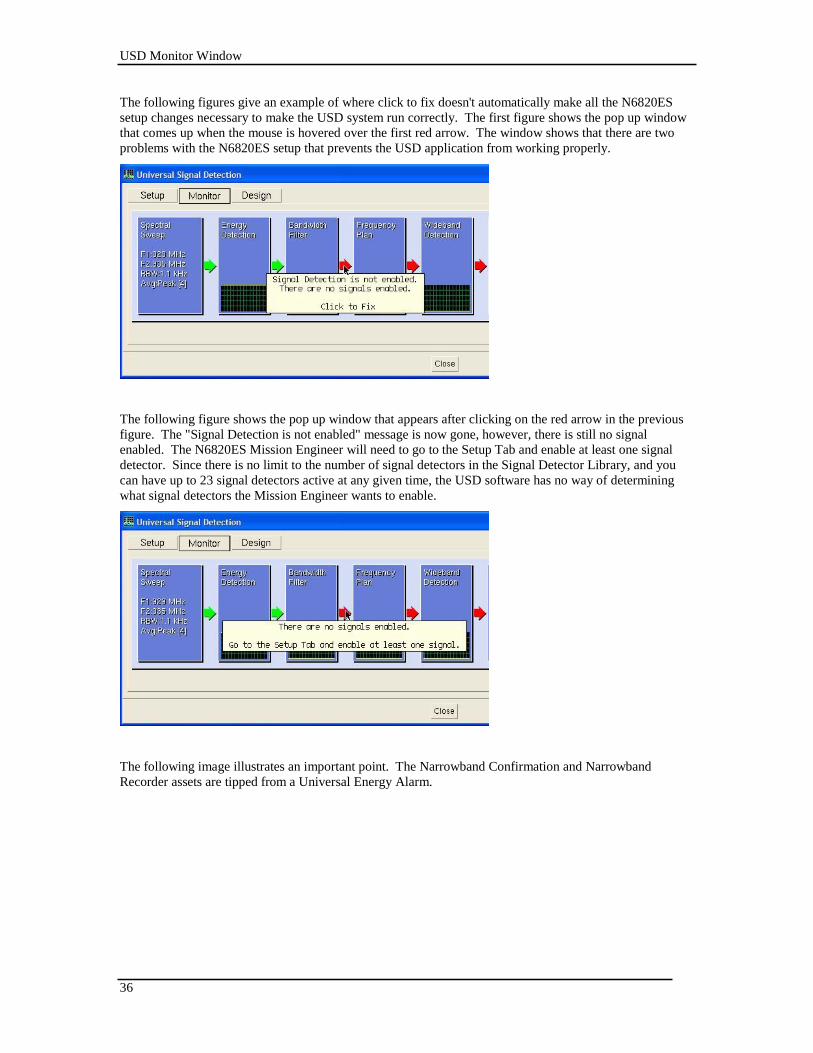
The following figures give an example of where click to fix doesn't automatically make all the N6820ES
setup changes necessary to make the USD system run correctly. The first figure shows the pop up window
that comes up when the mouse is hovered over the first red arrow. The window shows that there are two
problems with the N6820ES setup that prevents the USD application from working properly.
The following figure shows the pop up window that appears after clicking on the red arrow in the previous
figure. The "Signal Detection is not enabled" message is now gone, however, there is still no signal
enabled. The N6820ES Mission Engineer will need to go to the Setup Tab and enable at least one signal
detector. Since there is no limit to the number of signal detectors in the Signal Detector Library, and you
can have up to 23 signal detectors active at any given time, the USD software has no way of determining
what signal detectors the Mission Engineer wants to enable.
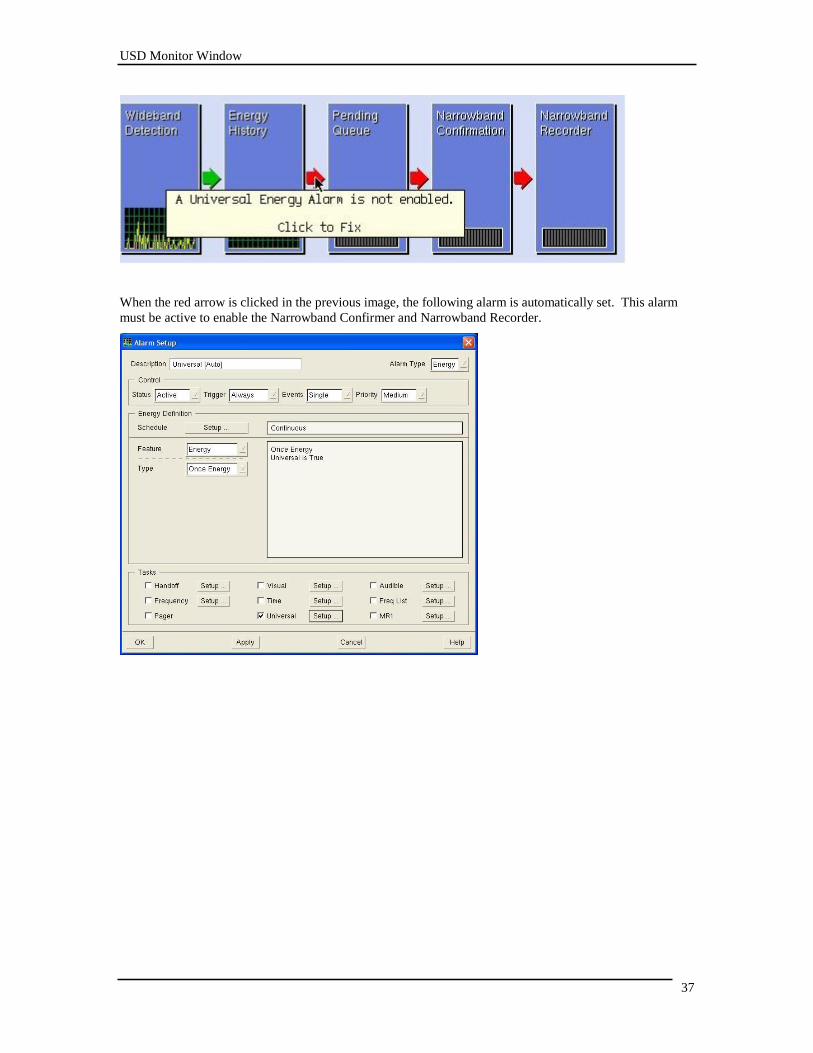
The following image illustrates an important point. The Narrowband Confirmation and Narrowband
Recorder assets are tipped from a Universal Energy Alarm.
USD Monitor Window
37
When the red arrow is clicked in the previous image, the following alarm is automatically set. This alarm
must be active to enable the Narrowband Confirmer and Narrowband Recorder.
USD Monitor Window
38
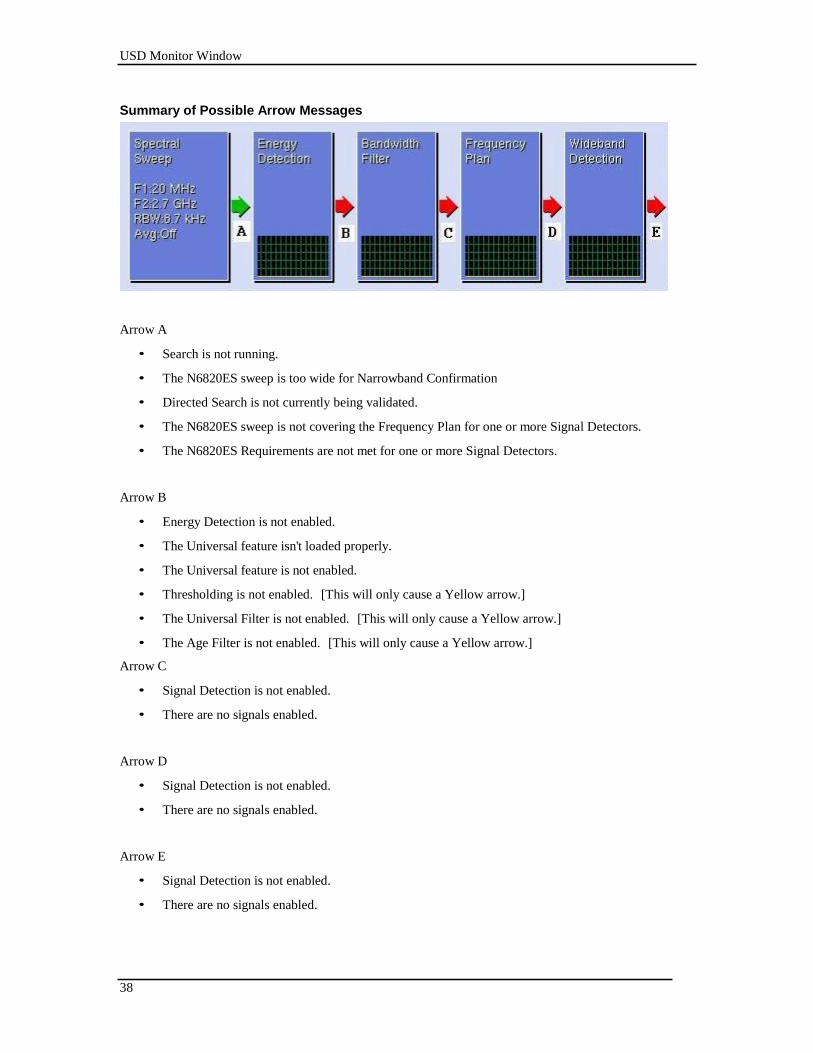
Summary of Possible Arrow Messages
Arrow A
• Search is not running.
• The N6820ES sweep is too wide for Narrowband Confirmation
• Directed Search is not currently being validated.
• The N6820ES sweep is not covering the Frequency Plan for one or more Signal Detectors.
• The N6820ES Requirements are not met for one or more Signal Detectors.
Arrow B
• Energy Detection is not enabled.
• The Universal feature isn't loaded properly.
• The Universal feature is not enabled.
• Thresholding is not enabled. [This will only cause a Yellow arrow.]
• The Universal Filter is not enabled. [This will only cause a Yellow arrow.]
• The Age Filter is not enabled. [This will only cause a Yellow arrow.]
Arrow C
• Signal Detection is not enabled.
• There are no signals enabled.
Arrow D
• Signal Detection is not enabled.
• There are no signals enabled.
Arrow E
• Signal Detection is not enabled.
• There are no signals enabled.
USD Monitor Window
39
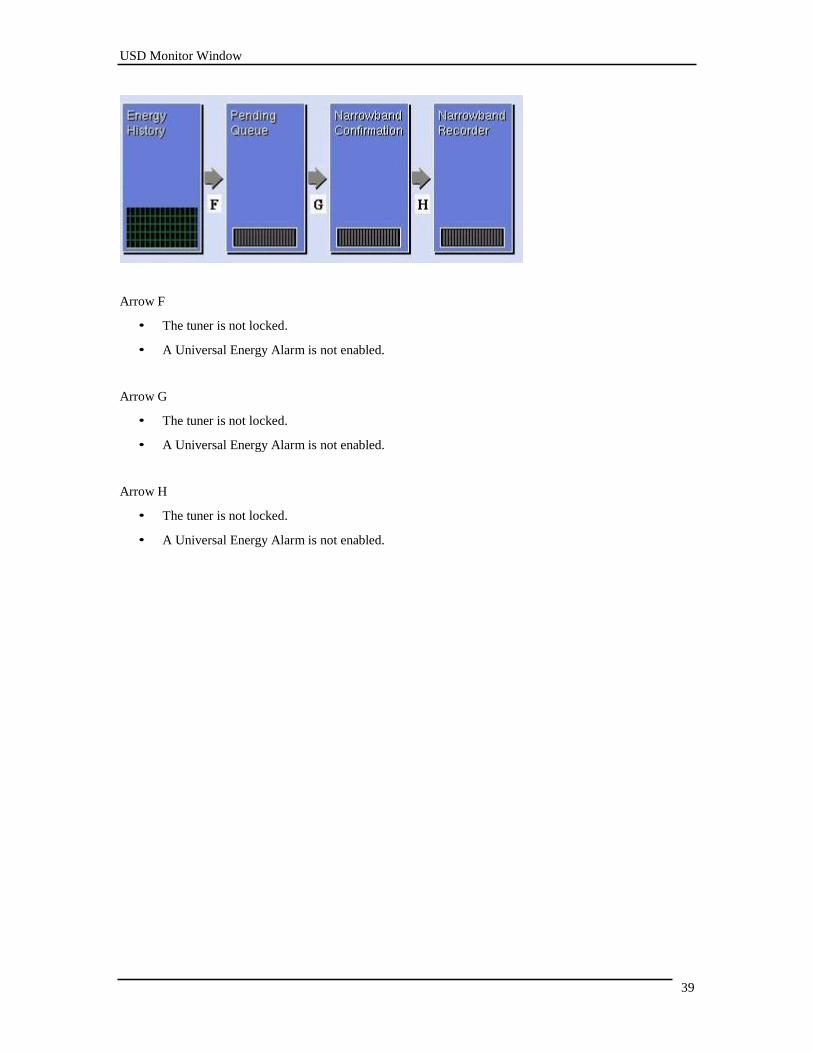
Arrow F
• The tuner is not locked.
• A Universal Energy Alarm is not enabled.
Arrow G
• The tuner is not locked.
• A Universal Energy Alarm is not enabled.
Arrow H
• The tuner is not locked.
• A Universal Energy Alarm is not enabled.
USD Design Window
40
USD Design Window
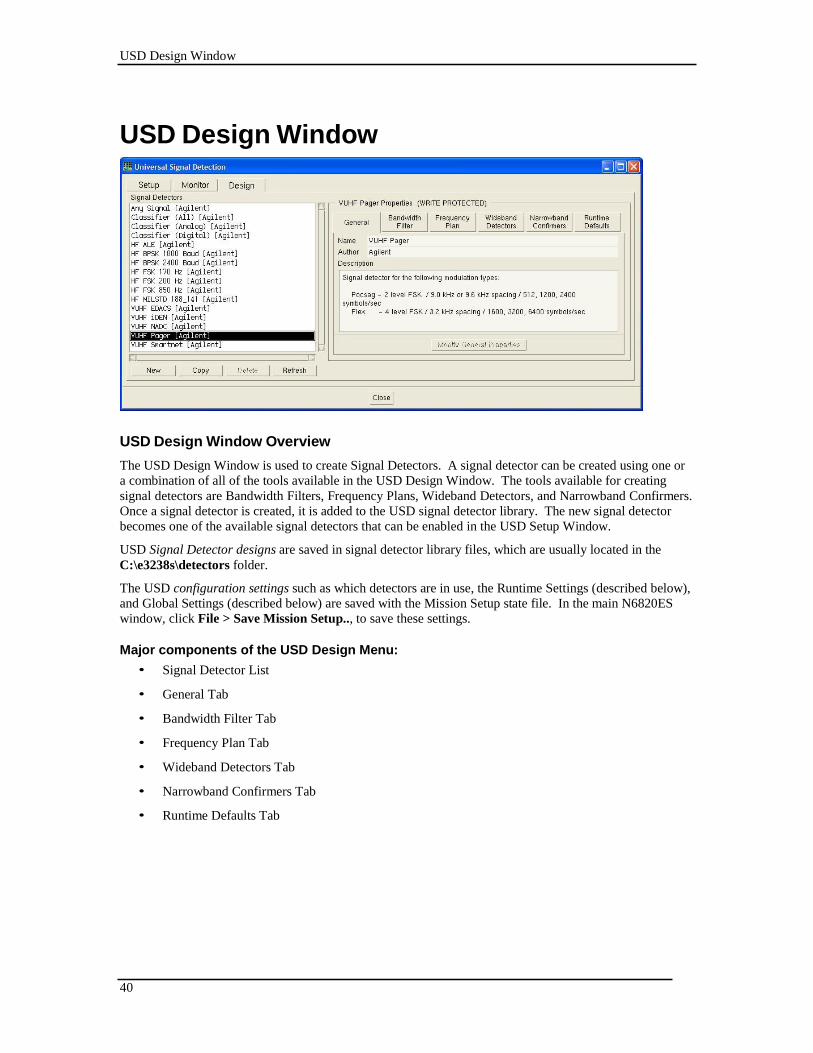
USD Design Window Overview
The USD Design Window is used to create Signal Detectors. A signal detector can be created using one or
a combination of all of the tools available in the USD Design Window. The tools available for creating
signal detectors are Bandwidth Filters, Frequency Plans, Wideband Detectors, and Narrowband Confirmers.
Once a signal detector is created, it is added to the USD signal detector library. The new signal detector
becomes one of the available signal detectors that can be enabled in the USD Setup Window.
USD Signal Detector designs are saved in signal detector library files, which are usually located in the
C:\e3238s\detectors folder.
The USD configuration settings such as which detectors are in use, the Runtime Settings (described below),
and Global Settings (described below) are saved with the Mission Setup state file. In the main N6820ES
window, click File > Save Mission Setup.., to save these settings.
Major components of the USD Design Menu:
• Signal Detector List
• General Tab
• Bandwidth Filter Tab
• Frequency Plan Tab
• Wideband Detectors Tab
• Narrowband Confirmers Tab
• Runtime Defaults Tab
USD Design Window
41
USD Design Window Signal Detector List
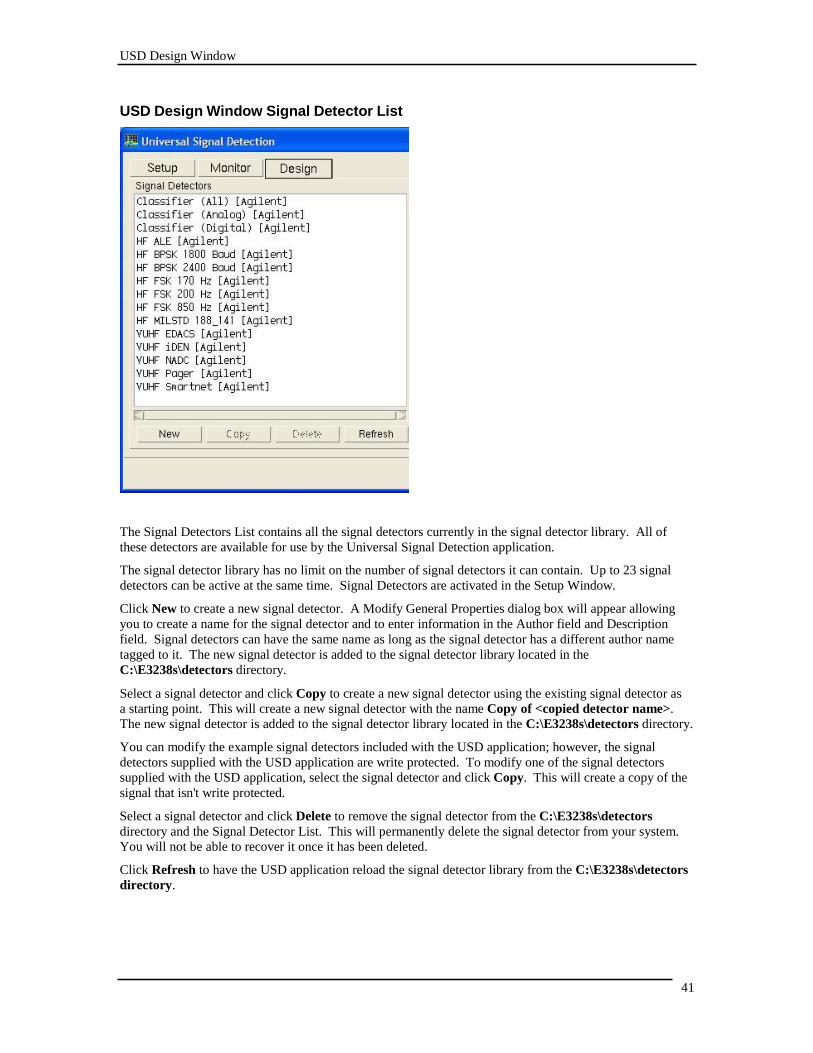
The Signal Detectors List contains all the signal detectors currently in the signal detector library. All of
these detectors are available for use by the Universal Signal Detection application.
The signal detector library has no limit on the number of signal detectors it can contain. Up to 23 signal
detectors can be active at the same time. Signal Detectors are activated in the Setup Window.
Click New to create a new signal detector. A Modify General Properties dialog box will appear allowing
you to create a name for the signal detector and to enter information in the Author field and Description
field. Signal detectors can have the same name as long as the signal detector has a different author name
tagged to it. The new signal detector is added to the signal detector library located in the
C:\E3238s\detectors directory.
Select a signal detector and click Copy to create a new signal detector using the existing signal detector as
a starting point. This will create a new signal detector with the name Copy of <copied detector name>.
The new signal detector is added to the signal detector library located in the C:\E3238s\detectors directory.
You can modify the example signal detectors included with the USD application; however, the signal
detectors supplied with the USD application are write protected. To modify one of the signal detectors
supplied with the USD application, select the signal detector and click Copy. This will create a copy of the
signal that isn't write protected.
Select a signal detector and click Delete to remove the signal detector from the C:\E3238s\detectors
directory and the Signal Detector List. This will permanently delete the signal detector from your system.
You will not be able to recover it once it has been deleted.
Click Refresh to have the USD application reload the signal detector library from the C:\E3238s\detectors
directory.
USD Design Window
42
If signal detectors are added or deleted directly from the C:\E3238s\detectors directory, the additions or
deletions are not reflected in the Signal Detector list until Refresh is clicked or the e3238s.exe application
is re-started.
USD Design Window
43
USD Design Window General Tab
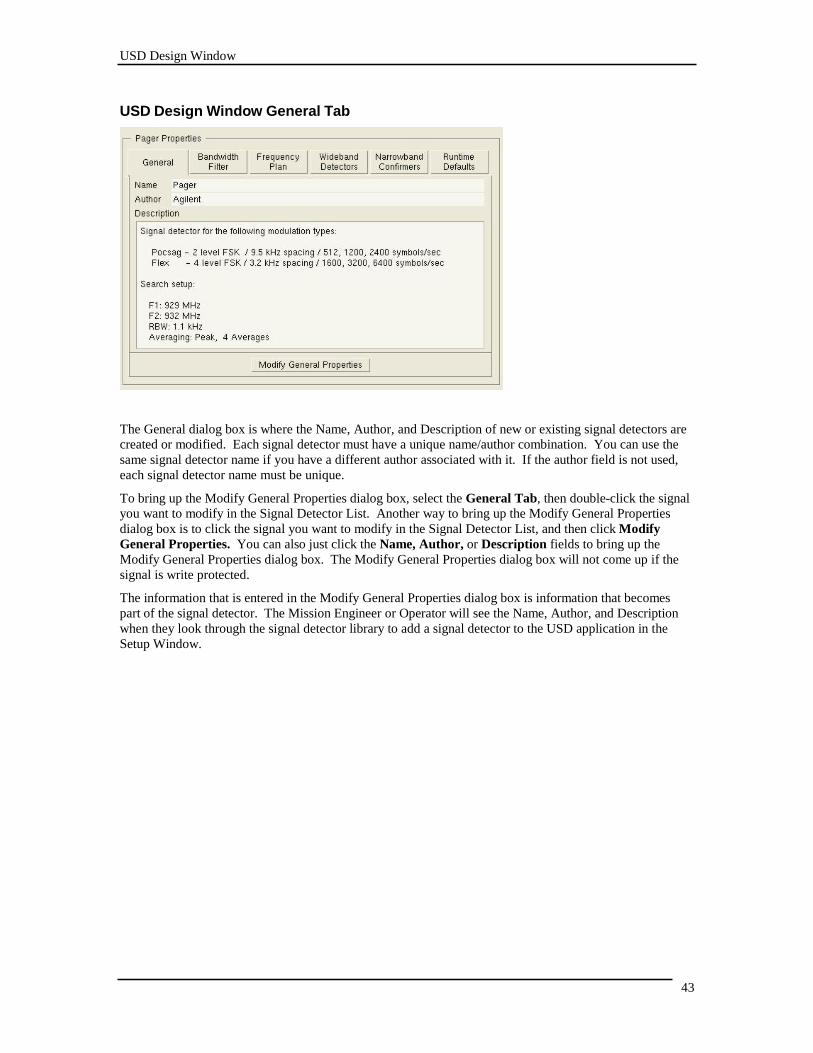
The General dialog box is where the Name, Author, and Description of new or existing signal detectors are
created or modified. Each signal detector must have a unique name/author combination. You can use the
same signal detector name if you have a different author associated with it. If the author field is not used,
each signal detector name must be unique.
To bring up the Modify General Properties dialog box, select the General Tab, then double-click the signal
you want to modify in the Signal Detector List. Another way to bring up the Modify General Properties
dialog box is to click the signal you want to modify in the Signal Detector List, and then click Modify
General Properties. You can also just click the Name, Author, or Description fields to bring up the
Modify General Properties dialog box. The Modify General Properties dialog box will not come up if the
signal is write protected.
The information that is entered in the Modify General Properties dialog box is information that becomes
part of the signal detector. The Mission Engineer or Operator will see the Name, Author, and Description
when they look through the signal detector library to add a signal detector to the USD application in the
Setup Window.
USD Design Window
44
USD Design Window Bandwidth Filter Tab
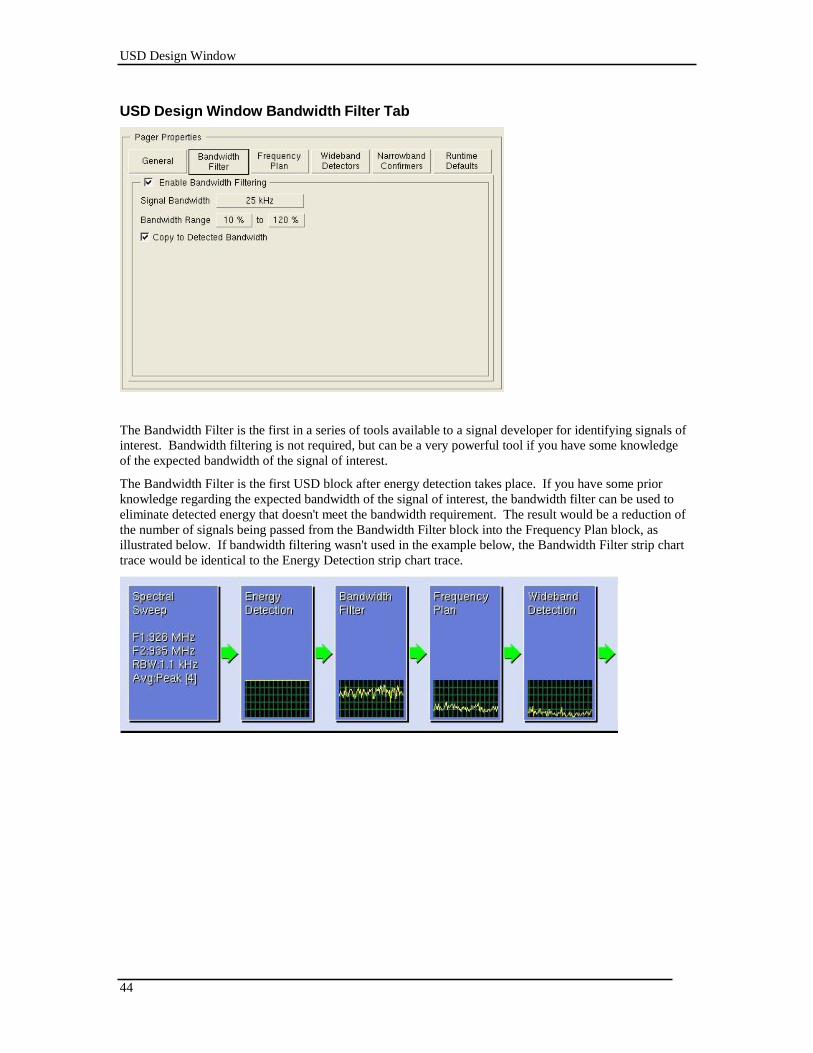
The Bandwidth Filter is the first in a series of tools available to a signal developer for identifying signals of
interest. Bandwidth filtering is not required, but can be a very powerful tool if you have some knowledge
of the expected bandwidth of the signal of interest.
The Bandwidth Filter is the first USD block after energy detection takes place. If you have some prior
knowledge regarding the expected bandwidth of the signal of interest, the bandwidth filter can be used to
eliminate detected energy that doesn't meet the bandwidth requirement. The result would be a reduction of
the number of signals being passed from the Bandwidth Filter block into the Frequency Plan block, as
illustrated below. If bandwidth filtering wasn't used in the example below, the Bandwidth Filter strip chart
trace would be identical to the Energy Detection strip chart trace.
USD Design Window
45
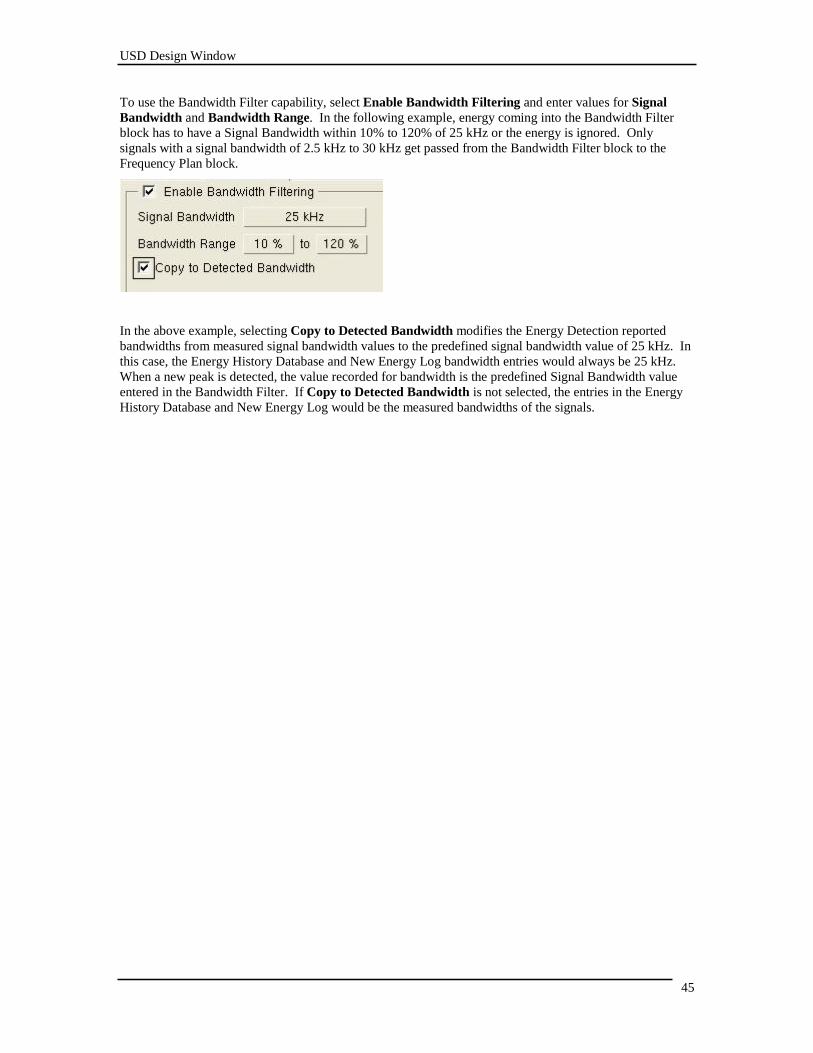
To use the Bandwidth Filter capability, select Enable Bandwidth Filtering and enter values for Signal
Bandwidth and Bandwidth Range. In the following example, energy coming into the Bandwidth Filter
block has to have a Signal Bandwidth within 10% to 120% of 25 kHz or the energy is ignored. Only
signals with a signal bandwidth of 2.5 kHz to 30 kHz get passed from the Bandwidth Filter block to the
Frequency Plan block.
In the above example, selecting Copy to Detected Bandwidth modifies the Energy Detection reported
bandwidths from measured signal bandwidth values to the predefined signal bandwidth value of 25 kHz. In
this case, the Energy History Database and New Energy Log bandwidth entries would always be 25 kHz.
When a new peak is detected, the value recorded for bandwidth is the predefined Signal Bandwidth value
entered in the Bandwidth Filter. If Copy to Detected Bandwidth is not selected, the entries in the Energy
History Database and New Energy Log would be the measured bandwidths of the signals.
USD Design Window
46
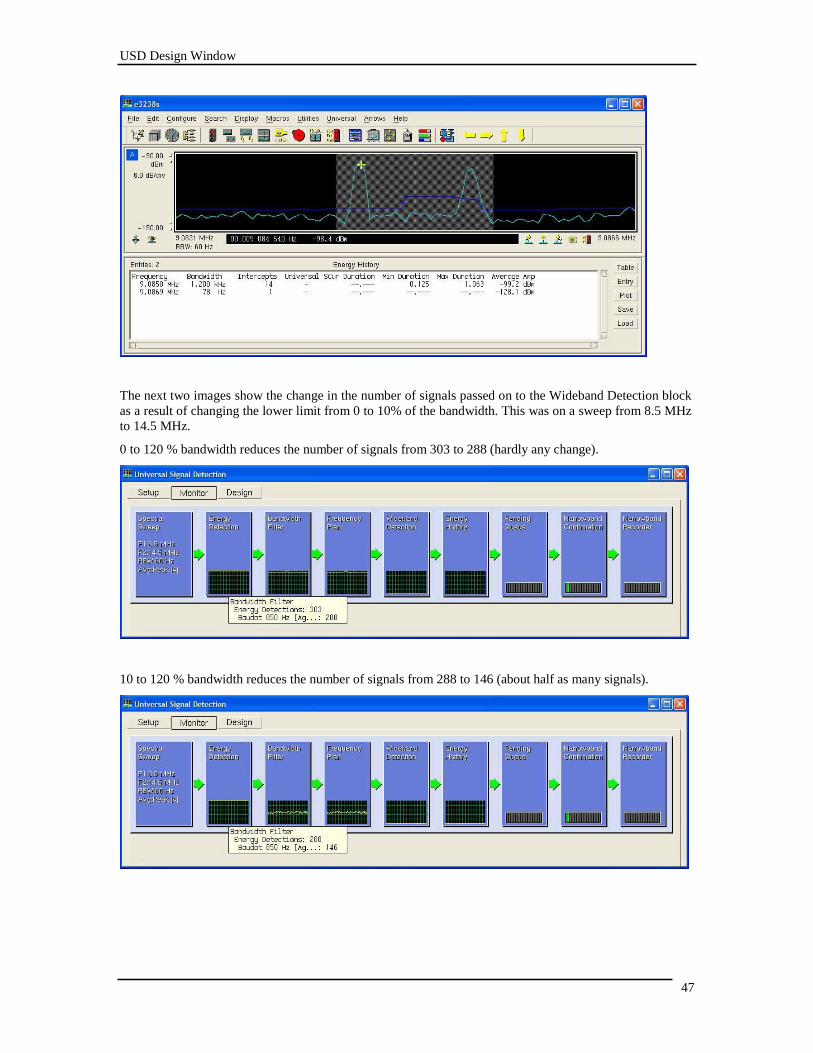
Bandwidth Filtering Example
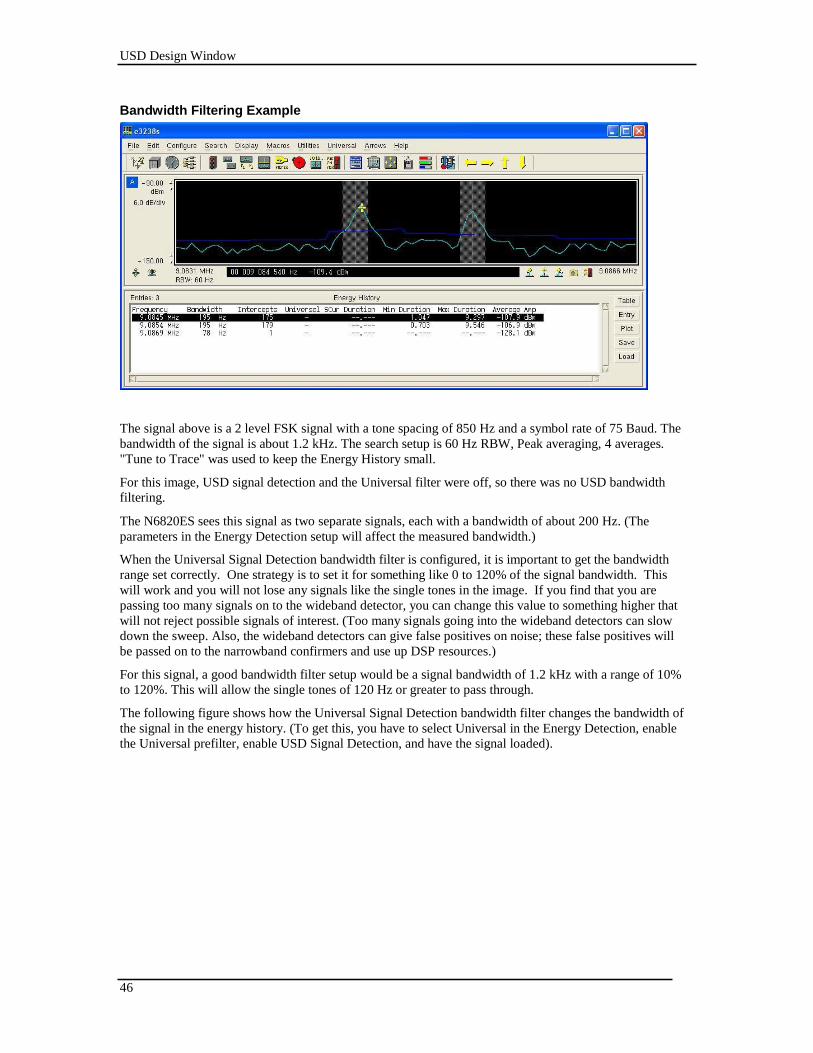
The signal above is a 2 level FSK signal with a tone spacing of 850 Hz and a symbol rate of 75 Baud. The
bandwidth of the signal is about 1.2 kHz. The search setup is 60 Hz RBW, Peak averaging, 4 averages.
"Tune to Trace" was used to keep the Energy History small.
For this image, USD signal detection and the Universal filter were off, so there was no USD bandwidth
filtering.
The N6820ES sees this signal as two separate signals, each with a bandwidth of about 200 Hz. (The
parameters in the Energy Detection setup will affect the measured bandwidth.)
When the Universal Signal Detection bandwidth filter is configured, it is important to get the bandwidth
range set correctly. One strategy is to set it for something like 0 to 120% of the signal bandwidth. This
will work and you will not lose any signals like the single tones in the image. If you find that you are
passing too many signals on to the wideband detector, you can change this value to something higher that
will not reject possible signals of interest. (Too many signals going into the wideband detectors can slow
down the sweep. Also, the wideband detectors can give false positives on noise; these false positives will
be passed on to the narrowband confirmers and use up DSP resources.)
For this signal, a good bandwidth filter setup would be a signal bandwidth of 1.2 kHz with a range of 10%
to 120%. This will allow the single tones of 120 Hz or greater to pass through.
The following figure shows how the Universal Signal Detection bandwidth filter changes the bandwidth of
the signal in the energy history. (To get this, you have to select Universal in the Energy Detection, enable
the Universal prefilter, enable USD Signal Detection, and have the signal loaded).
USD Design Window
47
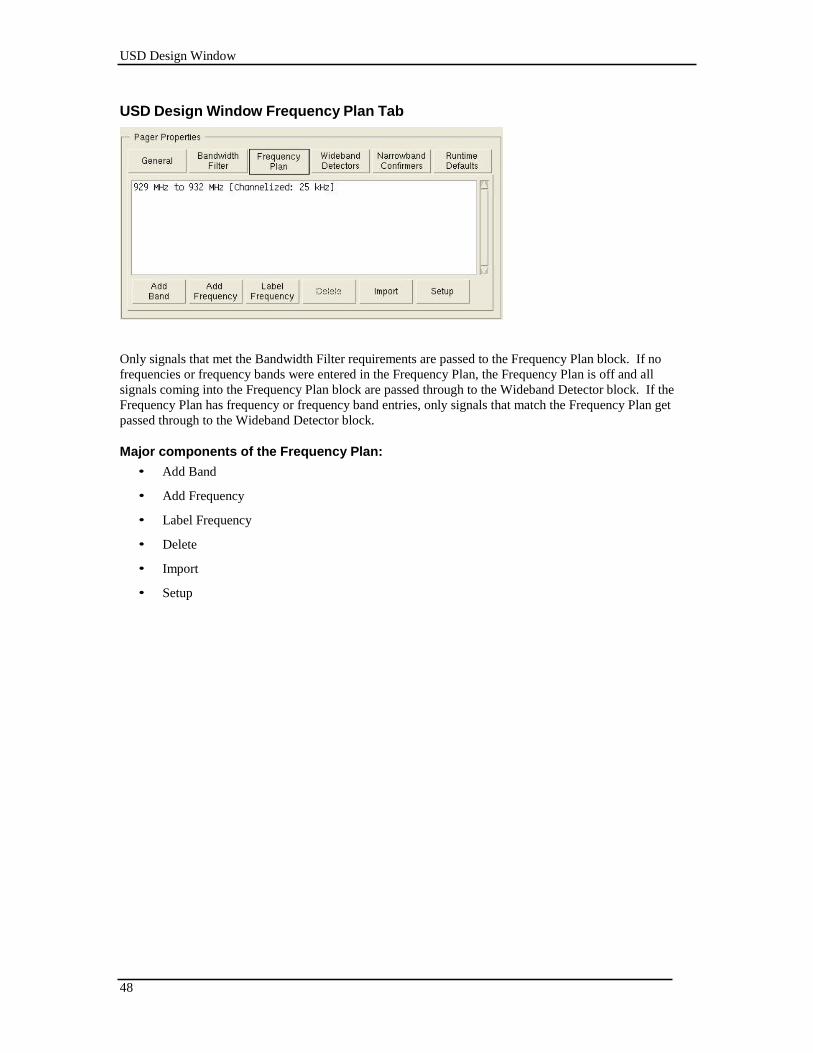
The next two images show the change in the number of signals passed on to the Wideband Detection block
as a result of changing the lower limit from 0 to 10% of the bandwidth. This was on a sweep from 8.5 MHz
to 14.5 MHz.
0 to 120 % bandwidth reduces the number of signals from 303 to 288 (hardly any change).
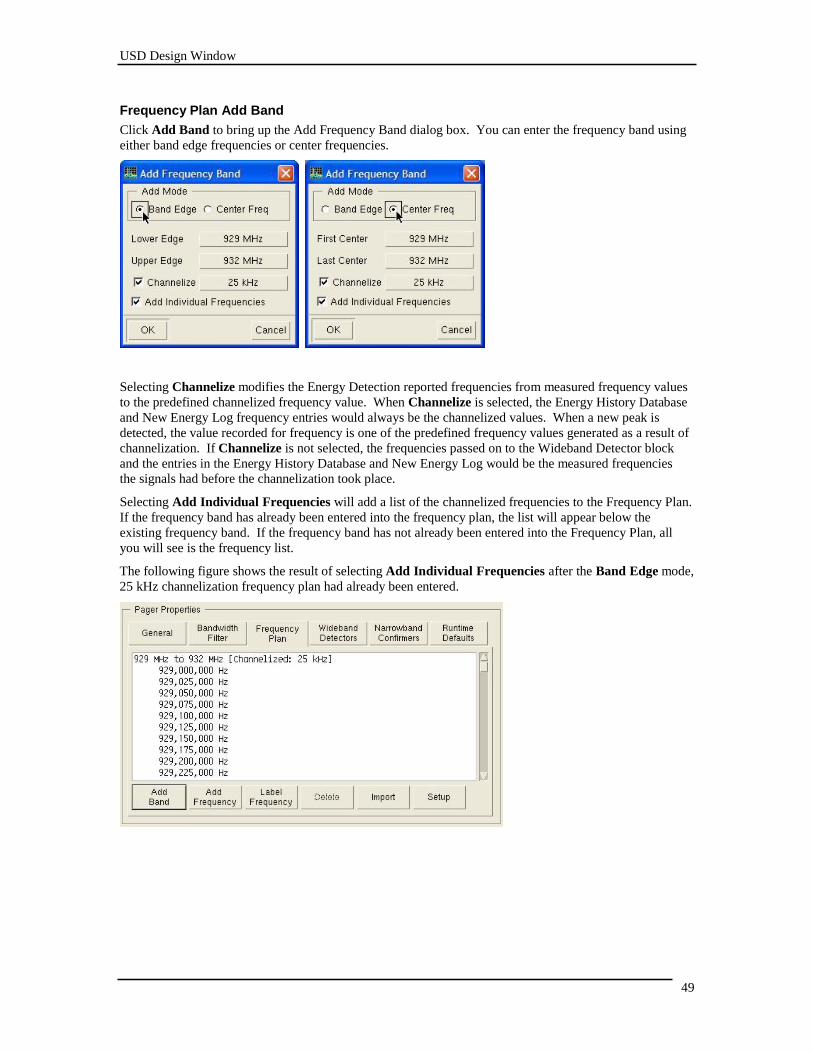
10 to 120 % bandwidth reduces the number of signals from 288 to 146 (about half as many signals).
USD Design Window
48
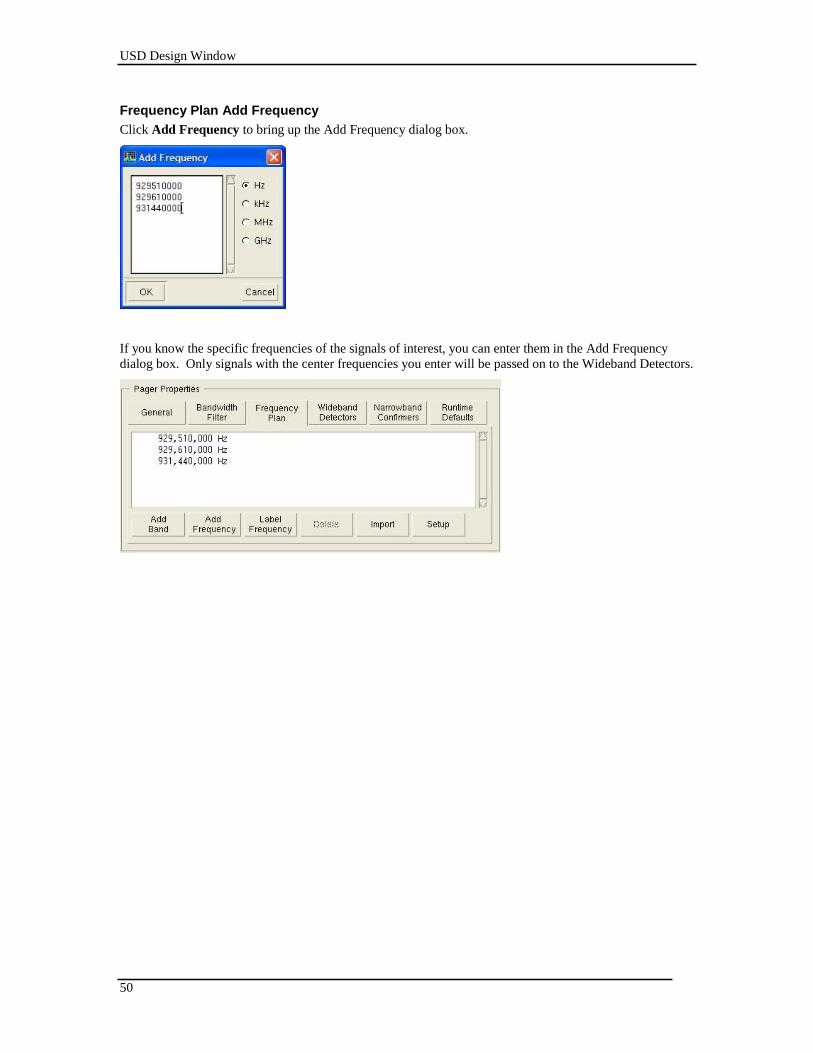
USD Design Window Frequency Plan Tab
Only signals that met the Bandwidth Filter requirements are passed to the Frequency Plan block. If no
frequencies or frequency bands were entered in the Frequency Plan, the Frequency Plan is off and all
signals coming into the Frequency Plan block are passed through to the Wideband Detector block. If the
Frequency Plan has frequency or frequency band entries, only signals that match the Frequency Plan get
passed through to the Wideband Detector block.
Major components of the Frequency Plan:
• Add Band
• Add Frequency
• Label Frequency
• Delete
• Import
• Setup
USD Design Window
49
Frequency Plan Add Band
Click Add Band to bring up the Add Frequency Band dialog box. You can enter the frequency band using
either band edge frequencies or center frequencies.
Selecting Channelize modifies the Energy Detection reported frequencies from measured frequency values
to the predefined channelized frequency value. When Channelize is selected, the Energy History Database
and New Energy Log frequency entries would always be the channelized values. When a new peak is
detected, the value recorded for frequency is one of the predefined frequency values generated as a result of
channelization. If Channelize is not selected, the frequencies passed on to the Wideband Detector block
and the entries in the Energy History Database and New Energy Log would be the measured frequencies
the signals had before the channelization took place.
Selecting Add Individual Frequencies will add a list of the channelized frequencies to the Frequency Plan.
If the frequency band has already been entered into the frequency plan, the list will appear below the
existing frequency band. If the frequency band has not already been entered into the Frequency Plan, all
you will see is the frequency list.
The following figure shows the result of selecting Add Individual Frequencies after the Band Edge mode,
25 kHz channelization frequency plan had already been entered.
USD Design Window
50
Frequency Plan Add Frequency
Click Add Frequency to bring up the Add Frequency dialog box.
If you know the specific frequencies of the signals of interest, you can enter them in the Add Frequency
dialog box. Only signals with the center frequencies you enter will be passed on to the Wideband Detectors.
USD Design Window
51
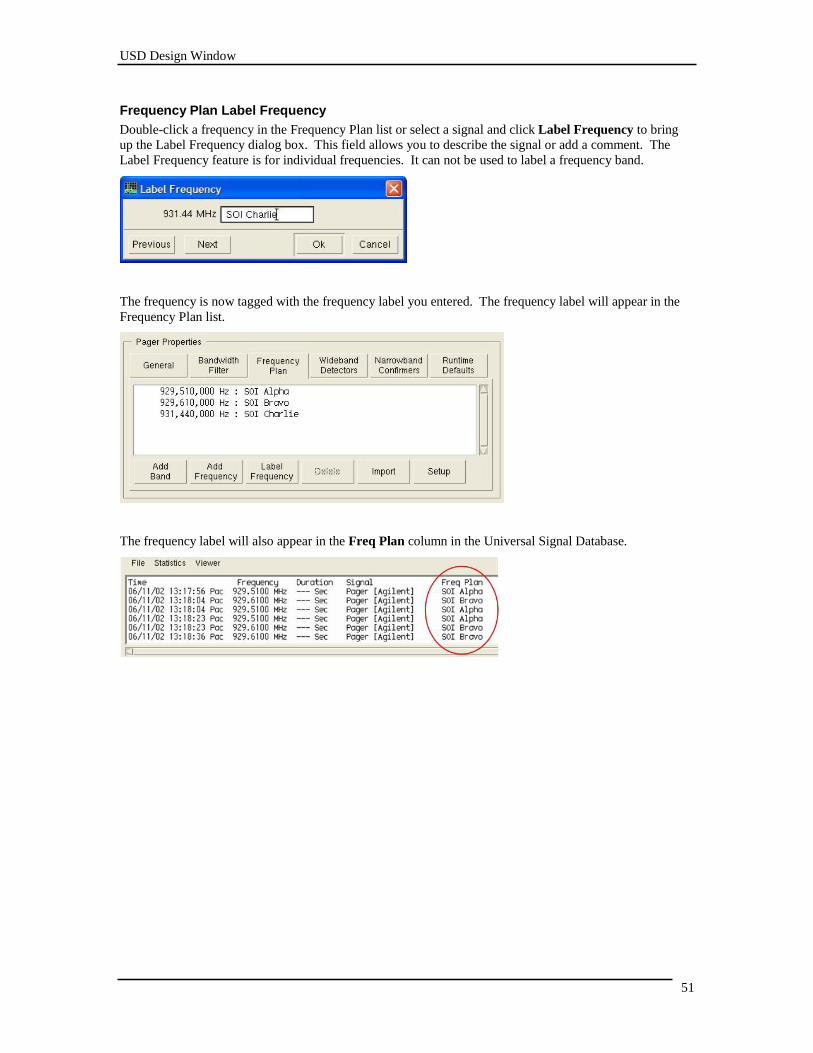
Frequency Plan Label Frequency
Double-click a frequency in the Frequency Plan list or select a signal and click Label Frequency to bring
up the Label Frequency dialog box. This field allows you to describe the signal or add a comment. The
Label Frequency feature is for individual frequencies. It can not be used to label a frequency band.
The frequency is now tagged with the frequency label you entered. The frequency label will appear in the
Frequency Plan list.
The frequency label will also appear in the Freq Plan column in the Universal Signal Database.
USD Design Window
52
Frequency Plan Delete
Select a frequency, group of frequencies, frequency band, or group of frequency bands in the Frequency
Plan list and click Delete to remove them.
If you need to remove several frequencies or frequency plans from the Frequency Plan lists, click one of the
frequencies or frequency bands and press Ctrl > Shift > A to select all, Ctrl > Shift > End to select
everything to the end of the list, or Ctrl > Shift > Home to select everything to the beginning of the list,
then click Delete.
You can also use the mouse to select multiple entries. Select an entry and then Shift > Click another entry
to select the two entries and everything in between. Select an entry and then Ctrl > Click additional entries
to pick specific entries out of the list.
Frequency Plan Import
Click Import to load a frequency list file (*frq) that was generated from the Frequency Lists pane.
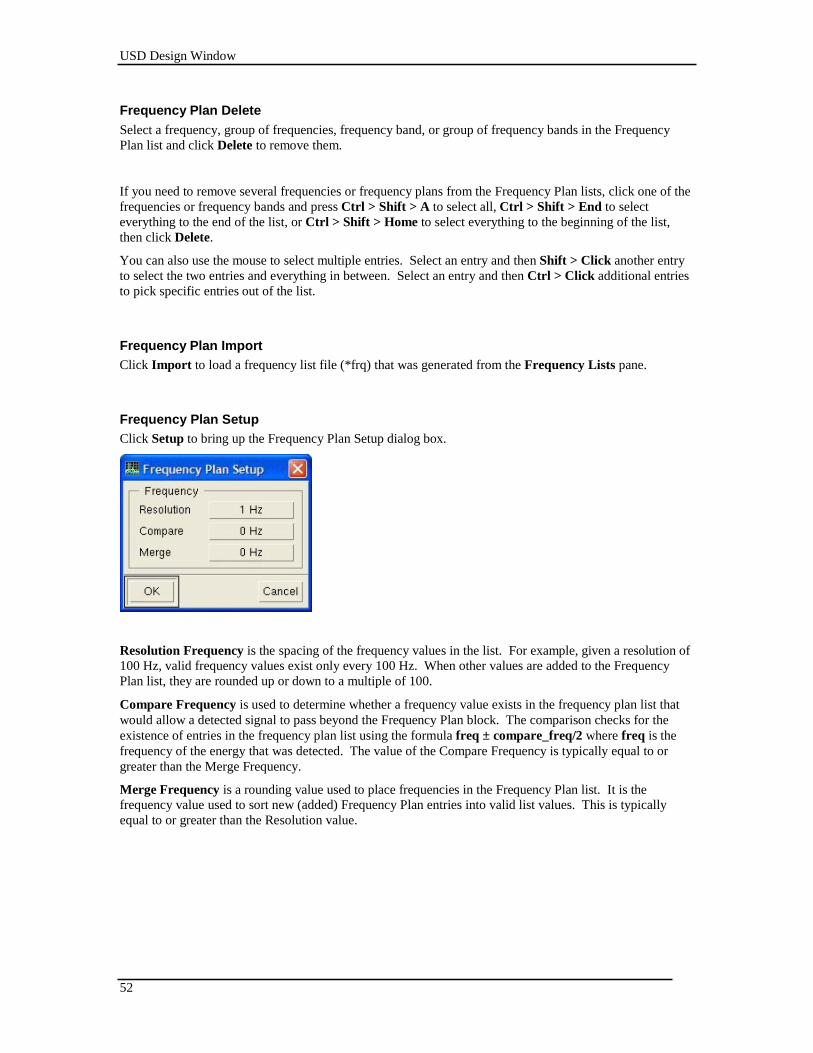
Frequency Plan Setup
Click Setup to bring up the Frequency Plan Setup dialog box.
Resolution Frequency is the spacing of the frequency values in the list. For example, given a resolution of
100 Hz, valid frequency values exist only every 100 Hz. When other values are added to the Frequency
Plan list, they are rounded up or down to a multiple of 100.
Compare Frequency is used to determine whether a frequency value exists in the frequency plan list that
would allow a detected signal to pass beyond the Frequency Plan block. The comparison checks for the
existence of entries in the frequency plan list using the formula freq ± compare_freq/2 where freq is the
frequency of the energy that was detected. The value of the Compare Frequency is typically equal to or
greater than the Merge Frequency.
Merge Frequency is a rounding value used to place frequencies in the Frequency Plan list. It is the
frequency value used to sort new (added) Frequency Plan entries into valid list values. This is typically
equal to or greater than the Resolution value.
USD Design Window
53
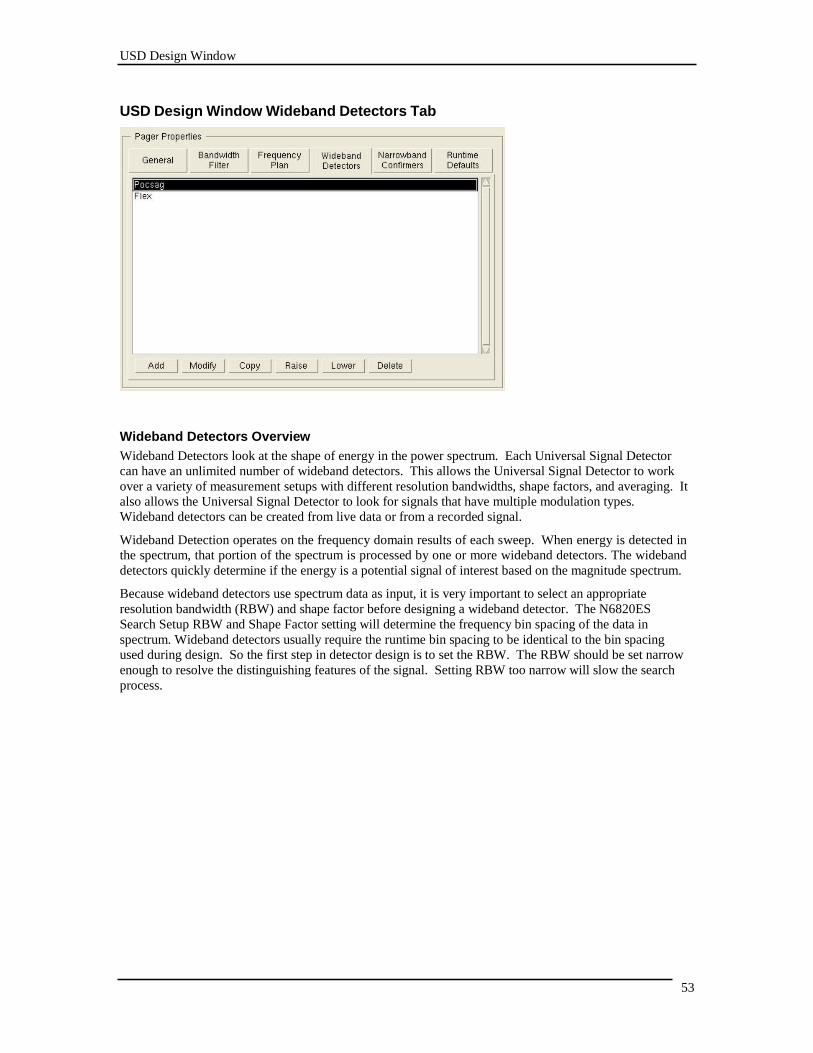
USD Design Window Wideband Detectors Tab
Wideband Detectors Overview
Wideband Detectors look at the shape of energy in the power spectrum. Each Universal Signal Detector
can have an unlimited number of wideband detectors. This allows the Universal Signal Detector to work
over a variety of measurement setups with different resolution bandwidths, shape factors, and averaging. It
also allows the Universal Signal Detector to look for signals that have multiple modulation types.
Wideband detectors can be created from live data or from a recorded signal.
Wideband Detection operates on the frequency domain results of each sweep. When energy is detected in
the spectrum, that portion of the spectrum is processed by one or more wideband detectors. The wideband
detectors quickly determine if the energy is a potential signal of interest based on the magnitude spectrum.
Because wideband detectors use spectrum data as input, it is very important to select an appropriate
resolution bandwidth (RBW) and shape factor before designing a wideband detector. The N6820ES
Search Setup RBW and Shape Factor setting will determine the frequency bin spacing of the data in
spectrum. Wideband detectors usually require the runtime bin spacing to be identical to the bin spacing
used during design. So the first step in detector design is to set the RBW. The RBW should be set narrow
enough to resolve the distinguishing features of the signal. Setting RBW too narrow will slow the search
process.
USD Design Window
54
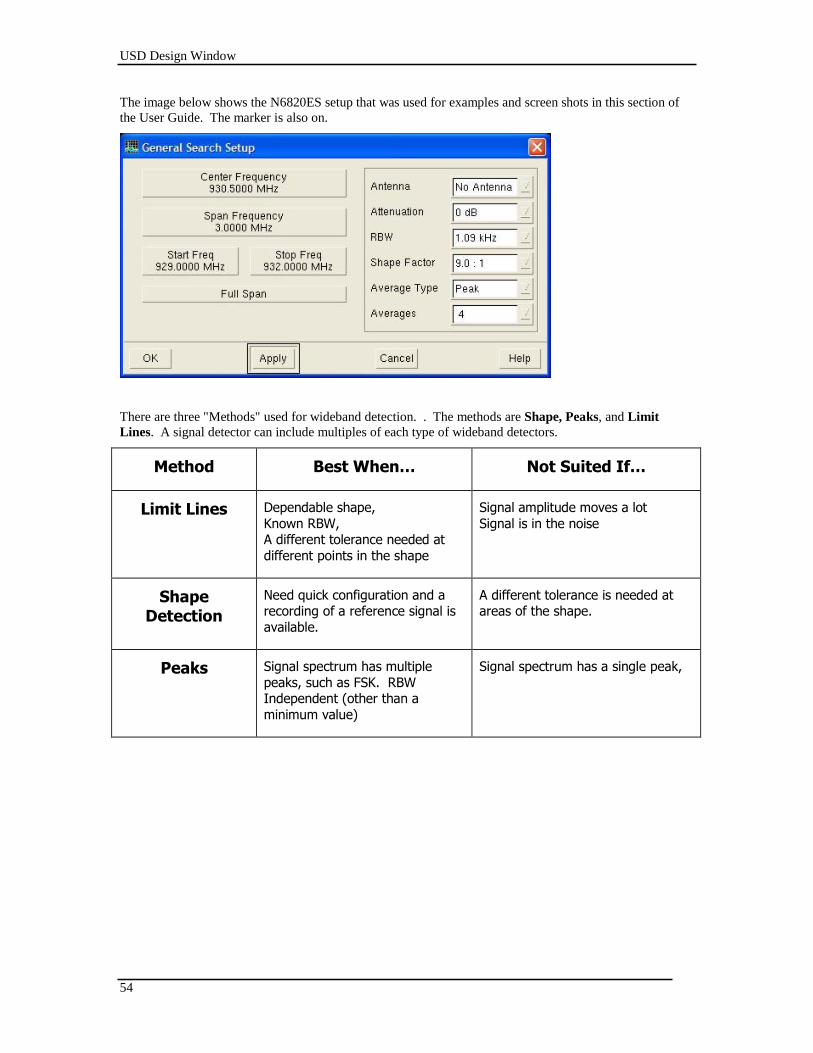
The image below shows the N6820ES setup that was used for examples and screen shots in this section of
the User Guide. The marker is also on.
There are three "Methods" used for wideband detection. . The methods are Shape, Peaks, and Limit
Lines. A signal detector can include multiples of each type of wideband detectors.
Method
Best When…
Not Suited If…
Limit Lines
Dependable shape,
Known RBW, A different tolerance needed at
different points in the shape
Signal amplitude moves a lot
Signal is in the noise
Shape Detection
Need quick configuration and a recording of a reference signal is
available.
A different tolerance is needed at areas of the shape.
Peaks
Signal spectrum has multiple
peaks, such as FSK. RBW Independent (other than a
minimum value)
Signal spectrum has a single peak,
USD Design Window
55
Acquiring a Signal for Signal Detector Development
An important step for both wideband detector and narrowband confirmer development is to obtain a quality
example of the target signal. It could be live data from an antenna or a signal generator, or it could be
recorded data from a time or frequency snapshot for example. For wideband detector and narrowband
confirmer development purposes, recordings are recommended for repeatability. Ideally you will have
more than one recording of your target signal.
The techniques for acquiring a signal are the same no matter which Method is used to create a wideband
detector. In this particular example, the Method is set to Shape, but it could just as well be set to Peaks or
Limit Lines. Wideband detectors can be created from live data or from a recorded signal.
Click the USD icon located on the toolbar, or click Universal > Universal in the menu bar to start
the Universal Signal Detection application. This brings up the Universal Signal Detection tab view
window, which contains the Setup tab, the Monitor tab, and the Design tab. Click the Design Tab.
Select the signal detector you are currently working on, or click New and enter a Name, Author, and
Description for the universal signal detector in the Modify General Properties dialog box. Click OK. The
name of the universal signal detector you are creating is now listed in the USD tab view window.
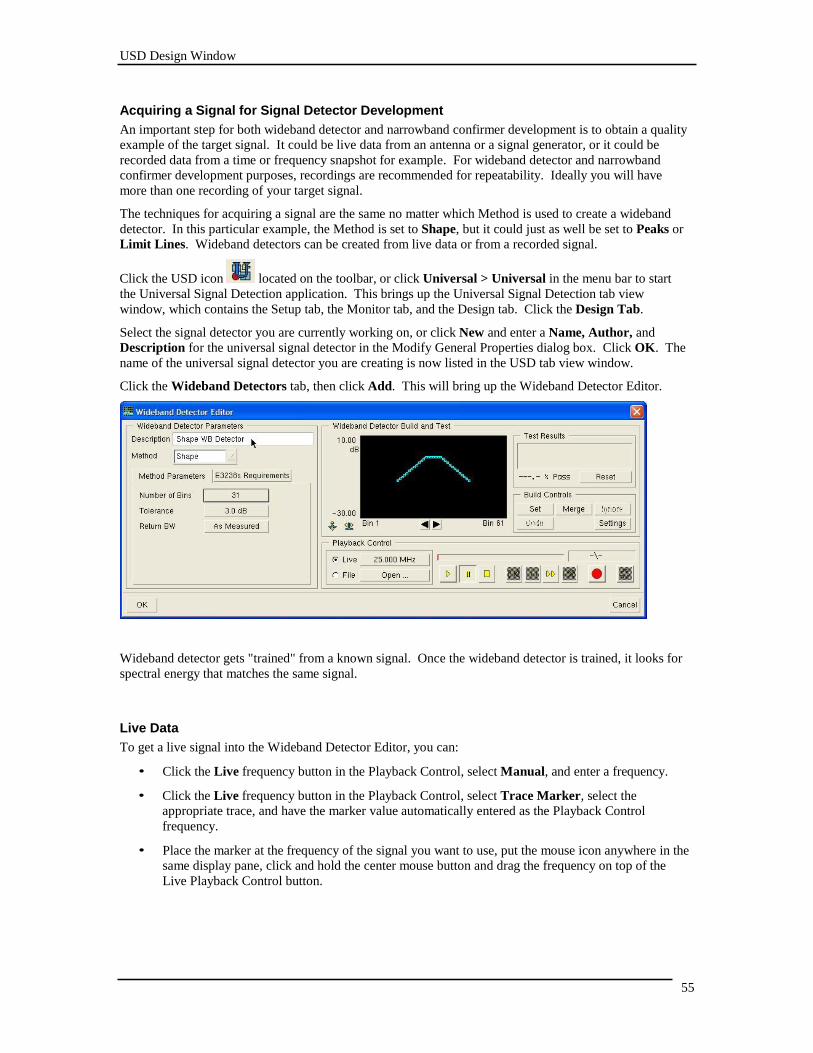
Click the Wideband Detectors tab, then click Add. This will bring up the Wideband Detector Editor.
Wideband detector gets "trained" from a known signal. Once the wideband detector is trained, it looks for
spectral energy that matches the same signal.
Live Data
To get a live signal into the Wideband Detector Editor, you can:
• Click the Live frequency button in the Playback Control, select Manual, and enter a frequency.
• Click the Live frequency button in the Playback Control, select Trace Marker, select the
appropriate trace, and have the marker value automatically entered as the Playback Control
frequency.
• Place the marker at the frequency of the signal you want to use, put the mouse icon anywhere in the
same display pane, click and hold the center mouse button and drag the frequency on top of the
Live Playback Control button.
USD Design Window
56
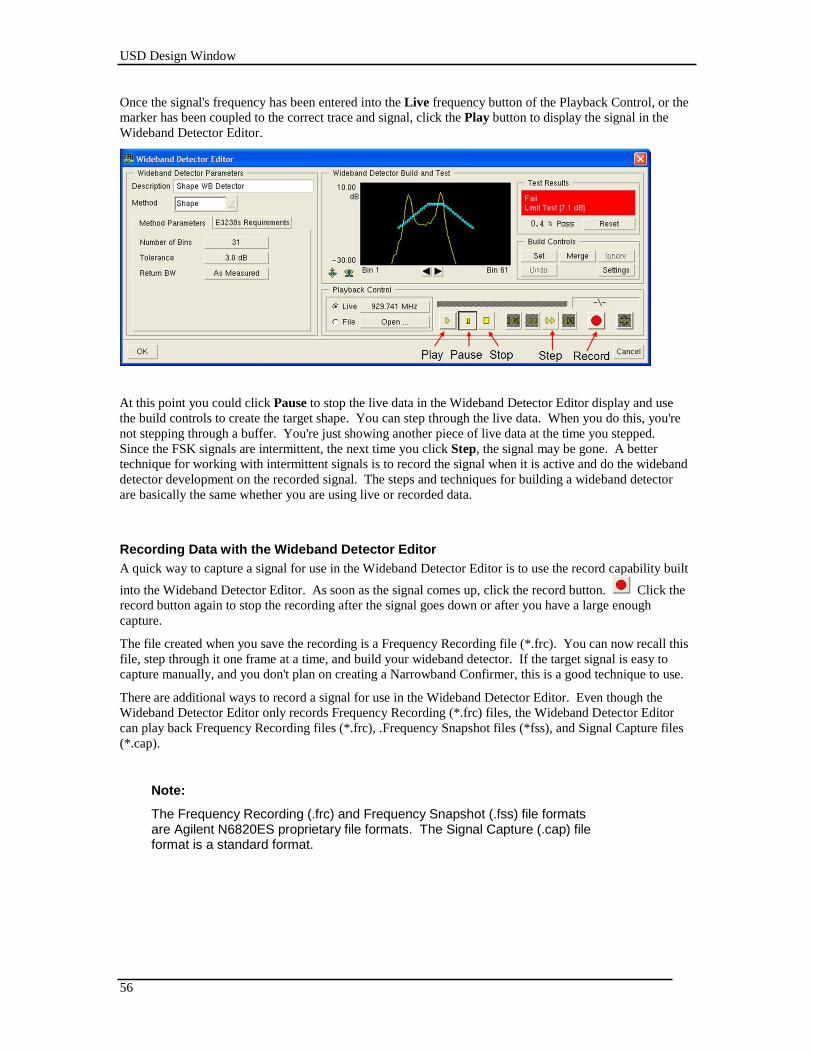
Once the signal's frequency has been entered into the Live frequency button of the Playback Control, or the
marker has been coupled to the correct trace and signal, click the Play button to display the signal in the
Wideband Detector Editor.
At this point you could click Pause to stop the live data in the Wideband Detector Editor display and use
the build controls to create the target shape. You can step through the live data. When you do this, you're
not stepping through a buffer. You're just showing another piece of live data at the time you stepped.
Since the FSK signals are intermittent, the next time you click Step, the signal may be gone. A better
technique for working with intermittent signals is to record the signal when it is active and do the wideband
detector development on the recorded signal. The steps and techniques for building a wideband detector
are basically the same whether you are using live or recorded data.
Recording Data with the Wideband Detector Editor
A quick way to capture a signal for use in the Wideband Detector Editor is to use the record capability built
into the Wideband Detector Editor. As soon as the signal comes up, click the record button. Click the
record button again to stop the recording after the signal goes down or after you have a large enough
capture.
The file created when you save the recording is a Frequency Recording file (*.frc). You can now recall this
file, step through it one frame at a time, and build your wideband detector. If the target signal is easy to
capture manually, and you don't plan on creating a Narrowband Confirmer, this is a good technique to use.
There are additional ways to record a signal for use in the Wideband Detector Editor. Even though the
Wideband Detector Editor only records Frequency Recording (*.frc) files, the Wideband Detector Editor
can play back Frequency Recording files (*.frc), .Frequency Snapshot files (*fss), and Signal Capture files
(*.cap).
Note:
The Frequency Recording (.frc) and Frequency Snapshot (.fss) file formats are Agilent N6820ES proprietary file formats. The Signal Capture (.cap) file format is a standard format.
USD Design Window
57
Recording Data with Time and Frequency Snapshots
In the main N6820ES application, frequency snapshot (*.fss) and time snapshot (*.cap) files can be
recorded manually by setting up and clicking the snapshot icon (click Display > Trace > Marker On
> Snapshot Setup). Frequency snapshots and time snapshots can also be recorded by having an alarm
task a frequency or time snapshot. If you are after a signal that appears quite infrequently, using an alarm
that tasks a snapshot would allow the N6820ES system to capture the signal while left unattended.
Information on frequency snapshots, time snapshots, and alarms can be found in the N6820ES Operators
Reference.
Make sure the time snapshot has a span setting wide enough to capture the entire signal bandwidth. A time
snapshot gets converted from time domain data to frequency domain data when it is loaded into the
wideband detector Playback Control. A window comes up that allows you to set various parameters for the
spectrum processing. The default values are set to the current N6820ES setup, but you can change the
values.
You can't make your bin spacing any wider than what the recording allows. The span limits the bin spacing
maximum value. The bin spacing will always be slightly smaller than the resolution bandwidth because the
Shape Factor expands the frequency resolution. What limits how narrow your bin spacing can go is the
length of the file. It takes a long recording to resolve really narrow frequencies. During *.cap file
playback, the signal processing parameters such as averaging can be setup so the spectrum computation is
identical to the N6820ES search spectrum computation. .
Recording Data with the Narrowband Confirmer Editor
If you want to be able to recall the same signal into both the Wideband Detector Editor and the Narrowband
Confirmer Editor, the signal must be a *.cap file. As mentioned before, a time snapshot creates a *.cap file.
Another way to create a *.cap file is to do a recording from the Narrowband Confirmer Editor.
The Narrowband Confirmer's Playback Control is identical to the Wideband Detector's Playback Control
with one exception. The Narrowband Confirmer's Playback Control only saves and loads *.cap files. This
is why the signal file must be a *.cap file if you want to use the same file for the Wideband Detector and
the Narrowband Confirmer.
A benefit of creating a recording using the Narrowband Confirmer Editor is that the Narrowband
Confirmer's modulation recognition feature can show you what modulation formats are present. If you're
building a wideband detector to go after a specific signal, the Narrowband Confirmer may be able to
confirm its presence before and after the recording is made.
To use the Narrowband Confirmer Editor to create a *.cap file, click the Narrowband Confirmers tab in
the USD Design window. Click Add if no narrowband confirmer exists or Modify an existing narrowband
confirmer.
Run a live signal in the Narrowband Confirmer Editor Playback Control using the same techniques used for
the Wideband Detector Playback Control. When the signal is up, the Narrowband Confirmer will show
you the various modulation formats it is detecting. When you find a signal that has the modulation format
you want to build a wideband detector for, click the record button and capture and save the signal. The
Narrowband Confirmer Editor recording function has some built in buffering so you will get the beginning
of the signal.
The default storage location for files recorded with the Narrowband Confirmer Editor, Wideband Detector
Editor, or the Time and Frequency Snapshot feature is C:\Snapshot.
USD Design Window
58
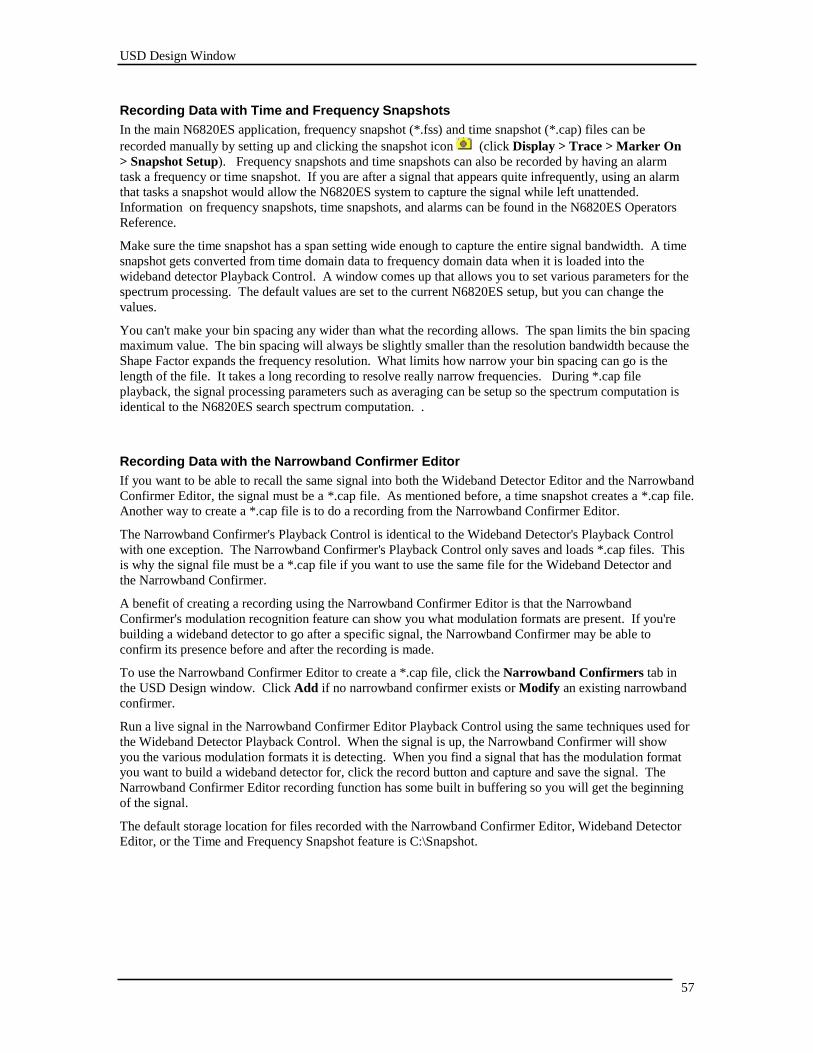
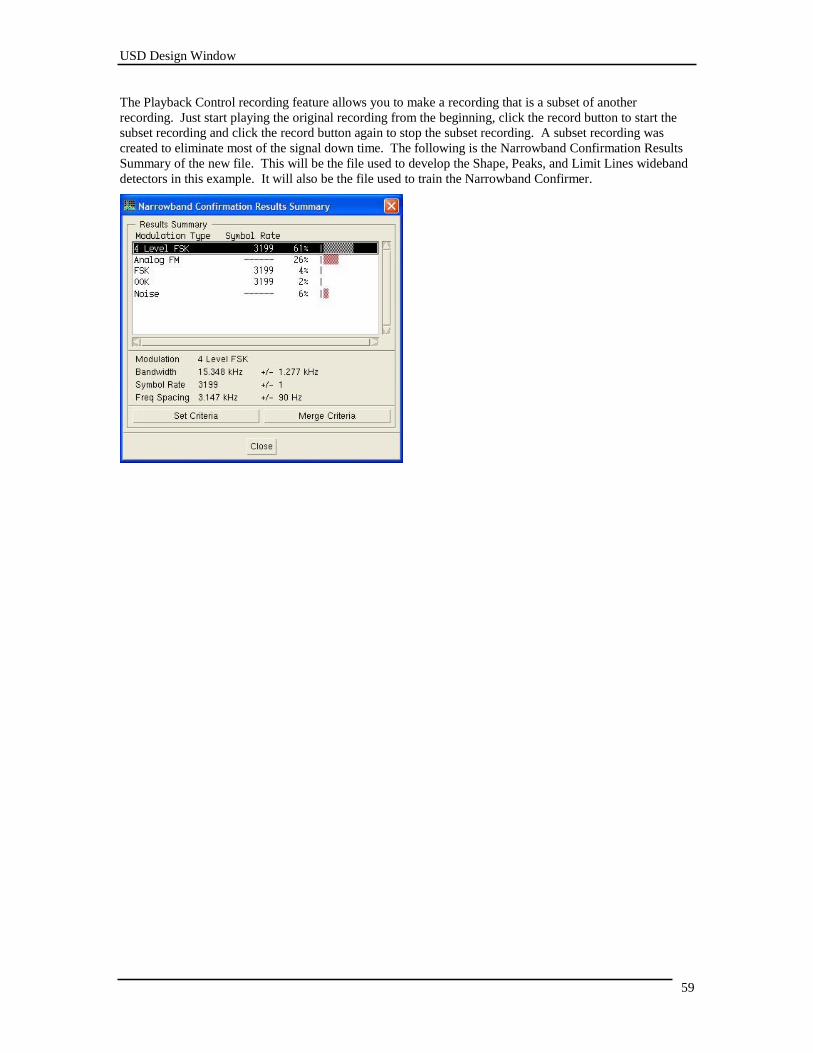
The following figures show the Narrowband Confirmer Editor Window after playing back a *.cap file. As
the file plays back, the various formats being detected are listed in a table above the Narrowband Confirmer
Editor Window spectrum display.
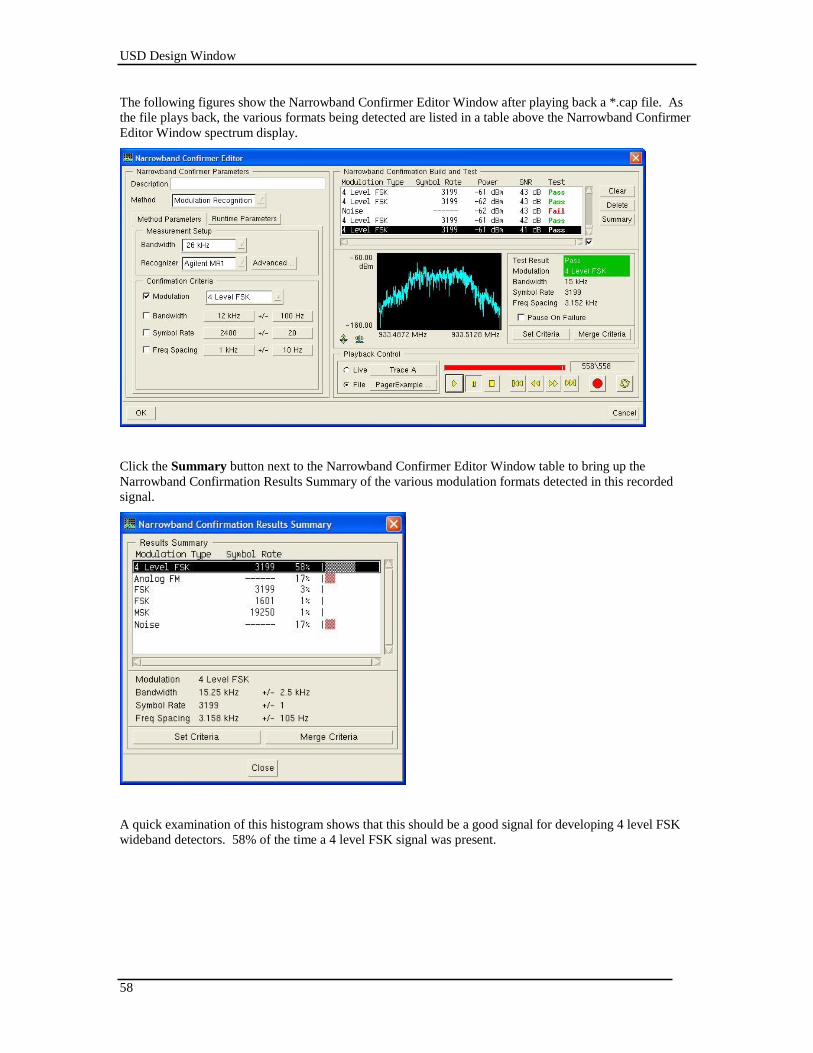
Click the Summary button next to the Narrowband Confirmer Editor Window table to bring up the
Narrowband Confirmation Results Summary of the various modulation formats detected in this recorded
signal.
A quick examination of this histogram shows that this should be a good signal for developing 4 level FSK
wideband detectors. 58% of the time a 4 level FSK signal was present.
USD Design Window
59
The Playback Control recording feature allows you to make a recording that is a subset of another
recording. Just start playing the original recording from the beginning, click the record button to start the
subset recording and click the record button again to stop the subset recording. A subset recording was
created to eliminate most of the signal down time. The following is the Narrowband Confirmation Results
Summary of the new file. This will be the file used to develop the Shape, Peaks, and Limit Lines wideband
detectors in this example. It will also be the file used to train the Narrowband Confirmer.

USD Design Window
60
Shape Method
The target signal filter you create using the Shape Method uses cross correlation to determine if a target
signal is present during each sweep. The cross correlation of the target signal filter with the current sweep
of data measures how much energy in the current sweep resembles the target signal.
Click the USD icon located on the toolbar, or click Universal > Universal in the menu bar to start
the Universal Signal Detection application. This brings up the Universal Signal Detection tab view
window, which contains the Setup tab, the Monitor tab, and the Design tab. Click the Design Tab.
Select the signal detector you are currently working on, or click New and enter a Name, Author, and
Description for the universal signal detector in the Modify General Properties dialog box. Click OK. The
name of the universal signal detector you are creating is now listed in the USD tab view window.
Click the Wideband Detectors tab, then click Add. This will bring up the Wideband Detector Editor.
Enter a name for the wideband detector you are creating. In this example it will be called "Shape WB
Detector." This wideband detector will be added to your universal signal detector. Click the Method drop down list and select Shape.
A 4 level FSK Shape wideband detector will now be created using a *.cap file recorded using the
Narrowband Confirmer Playback Control. These will essentially be the same steps you would follow using
live data. See Acquiring a Signal for Signal Detector Development for information on using live data
and for information related to recording signals.
USD Design Window
61
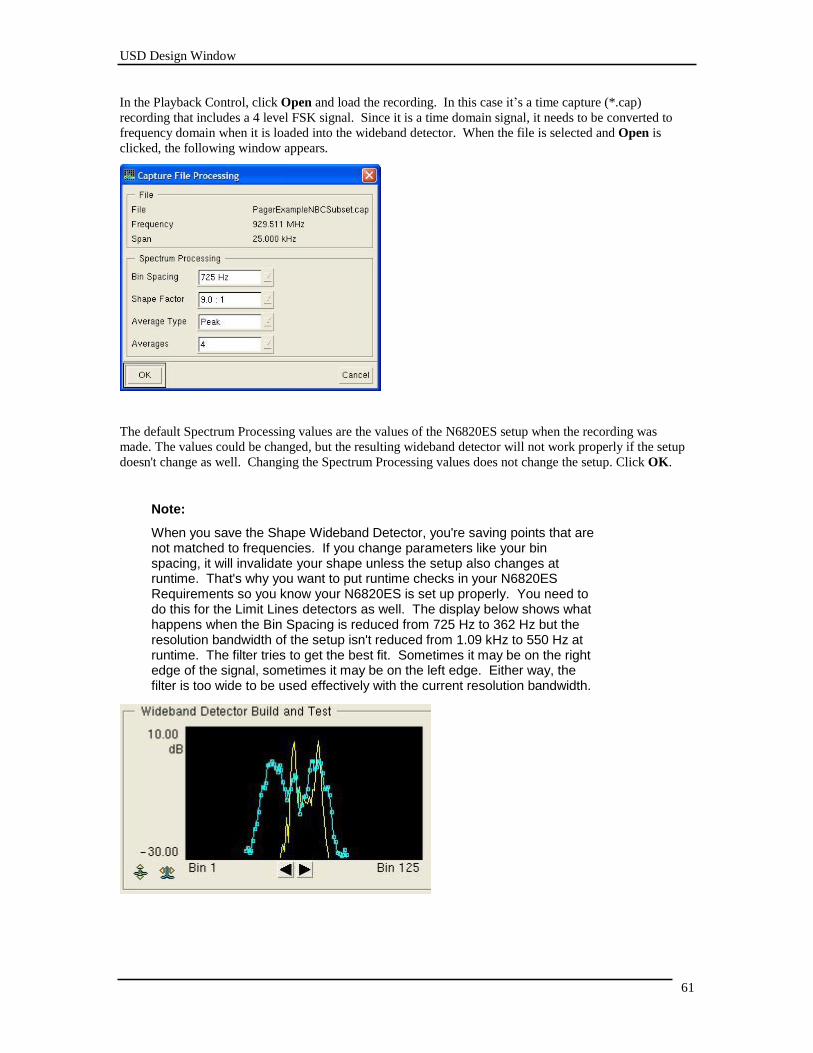
In the Playback Control, click Open and load the recording. In this case it’s a time capture (*.cap)
recording that includes a 4 level FSK signal. Since it is a time domain signal, it needs to be converted to
frequency domain when it is loaded into the wideband detector. When the file is selected and Open is
clicked, the following window appears.
The default Spectrum Processing values are the values of the N6820ES setup when the recording was
made. The values could be changed, but the resulting wideband detector will not work properly if the setup
doesn't change as well. Changing the Spectrum Processing values does not change the setup. Click OK.
Note:
When you save the Shape Wideband Detector, you're saving points that are not matched to frequencies. If you change parameters like your bin spacing, it will invalidate your shape unless the setup also changes at runtime. That's why you want to put runtime checks in your N6820ES Requirements so you know your N6820ES is set up properly. You need to do this for the Limit Lines detectors as well. The display below shows what happens when the Bin Spacing is reduced from 725 Hz to 362 Hz but the resolution bandwidth of the setup isn't reduced from 1.09 kHz to 550 Hz at runtime. The filter tries to get the best fit. Sometimes it may be on the right edge of the signal, sometimes it may be on the left edge. Either way, the filter is too wide to be used effectively with the current resolution bandwidth.
USD Design Window
62
Each signal detector can have an unlimited number of wideband and narrowband detectors. This enables a
universal signal developer to set up several wideband and narrowband detectors within the same universal
signal detector that cover different parameters (different RBWs for example) with little performance costs.
This is because the runtime system first verifies that the wideband and narrowband detector N6820ES
requirements are met by the current setup. Wideband or narrowband detectors whose N6820ES
Requirements don't match the current setup will not be run.
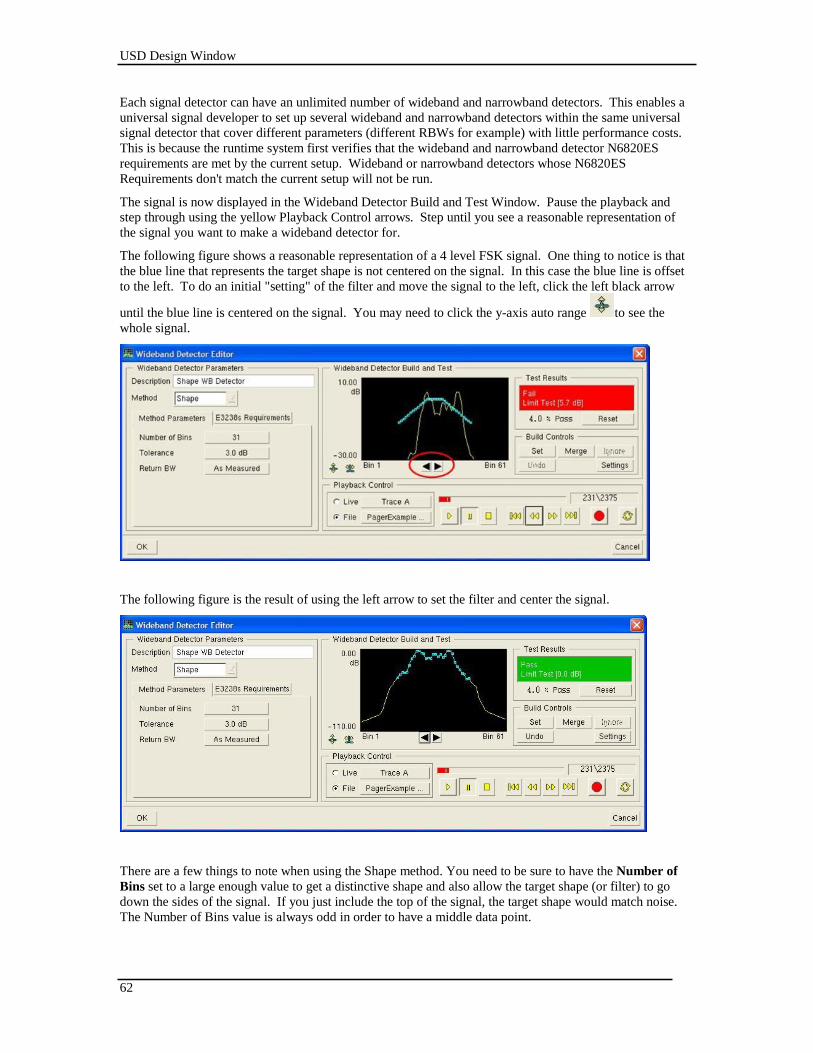
The signal is now displayed in the Wideband Detector Build and Test Window. Pause the playback and
step through using the yellow Playback Control arrows. Step until you see a reasonable representation of
the signal you want to make a wideband detector for.
The following figure shows a reasonable representation of a 4 level FSK signal. One thing to notice is that
the blue line that represents the target shape is not centered on the signal. In this case the blue line is offset
to the left. To do an initial "setting" of the filter and move the signal to the left, click the left black arrow
until the blue line is centered on the signal. You may need to click the y-axis auto range to see the
whole signal.
The following figure is the result of using the left arrow to set the filter and center the signal.
There are a few things to note when using the Shape method. You need to be sure to have the Number of
Bins set to a large enough value to get a distinctive shape and also allow the target shape (or filter) to go
down the sides of the signal. If you just include the top of the signal, the target shape would match noise.
The Number of Bins value is always odd in order to have a middle data point.
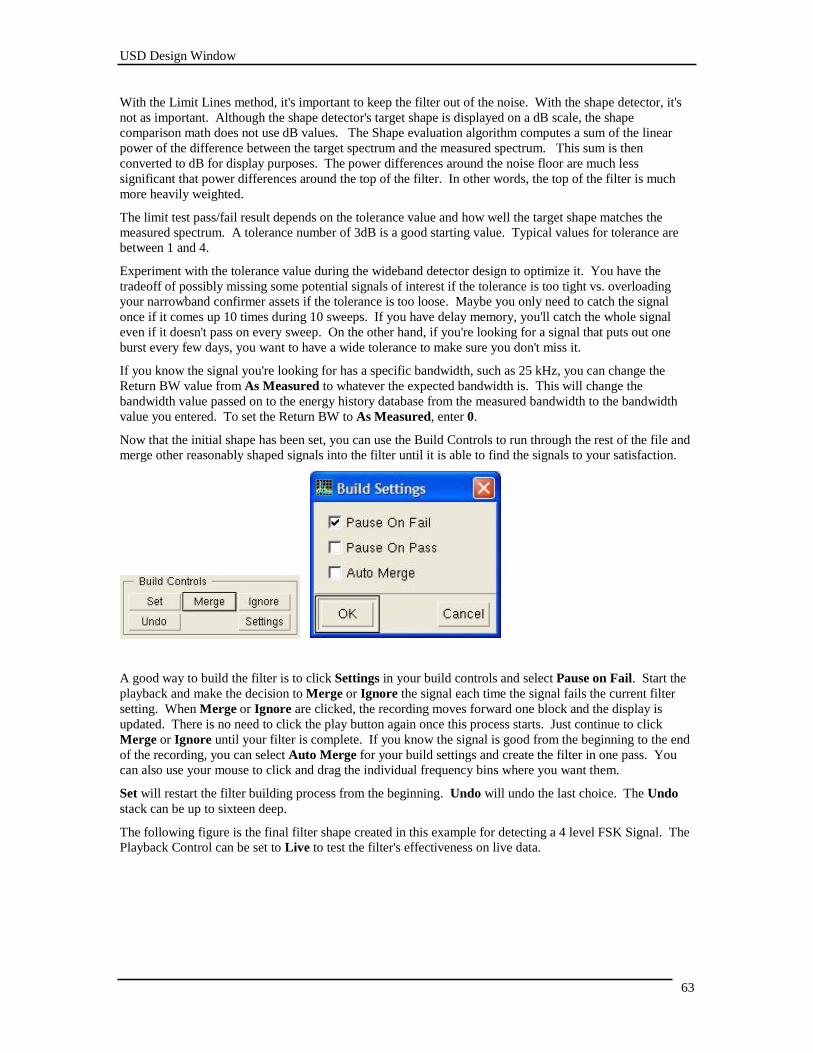
USD Design Window
63
With the Limit Lines method, it's important to keep the filter out of the noise. With the shape detector, it's
not as important. Although the shape detector's target shape is displayed on a dB scale, the shape
comparison math does not use dB values. The Shape evaluation algorithm computes a sum of the linear
power of the difference between the target spectrum and the measured spectrum. This sum is then
converted to dB for display purposes. The power differences around the noise floor are much less
significant that power differences around the top of the filter. In other words, the top of the filter is much
more heavily weighted.
The limit test pass/fail result depends on the tolerance value and how well the target shape matches the
measured spectrum. A tolerance number of 3dB is a good starting value. Typical values for tolerance are
between 1 and 4.
Experiment with the tolerance value during the wideband detector design to optimize it. You have the
tradeoff of possibly missing some potential signals of interest if the tolerance is too tight vs. overloading
your narrowband confirmer assets if the tolerance is too loose. Maybe you only need to catch the signal
once if it comes up 10 times during 10 sweeps. If you have delay memory, you'll catch the whole signal
even if it doesn't pass on every sweep. On the other hand, if you're looking for a signal that puts out one
burst every few days, you want to have a wide tolerance to make sure you don't miss it.
If you know the signal you're looking for has a specific bandwidth, such as 25 kHz, you can change the
Return BW value from As Measured to whatever the expected bandwidth is. This will change the
bandwidth value passed on to the energy history database from the measured bandwidth to the bandwidth
value you entered. To set the Return BW to As Measured, enter 0.
Now that the initial shape has been set, you can use the Build Controls to run through the rest of the file and
merge other reasonably shaped signals into the filter until it is able to find the signals to your satisfaction.
A good way to build the filter is to click Settings in your build controls and select Pause on Fail. Start the
playback and make the decision to Merge or Ignore the signal each time the signal fails the current filter
setting. When Merge or Ignore are clicked, the recording moves forward one block and the display is
updated. There is no need to click the play button again once this process starts. Just continue to click
Merge or Ignore until your filter is complete. If you know the signal is good from the beginning to the end
of the recording, you can select Auto Merge for your build settings and create the filter in one pass. You
can also use your mouse to click and drag the individual frequency bins where you want them.
Set will restart the filter building process from the beginning. Undo will undo the last choice. The Undo
stack can be up to sixteen deep.
The following figure is the final filter shape created in this example for detecting a 4 level FSK Signal. The
Playback Control can be set to Live to test the filter's effectiveness on live data.
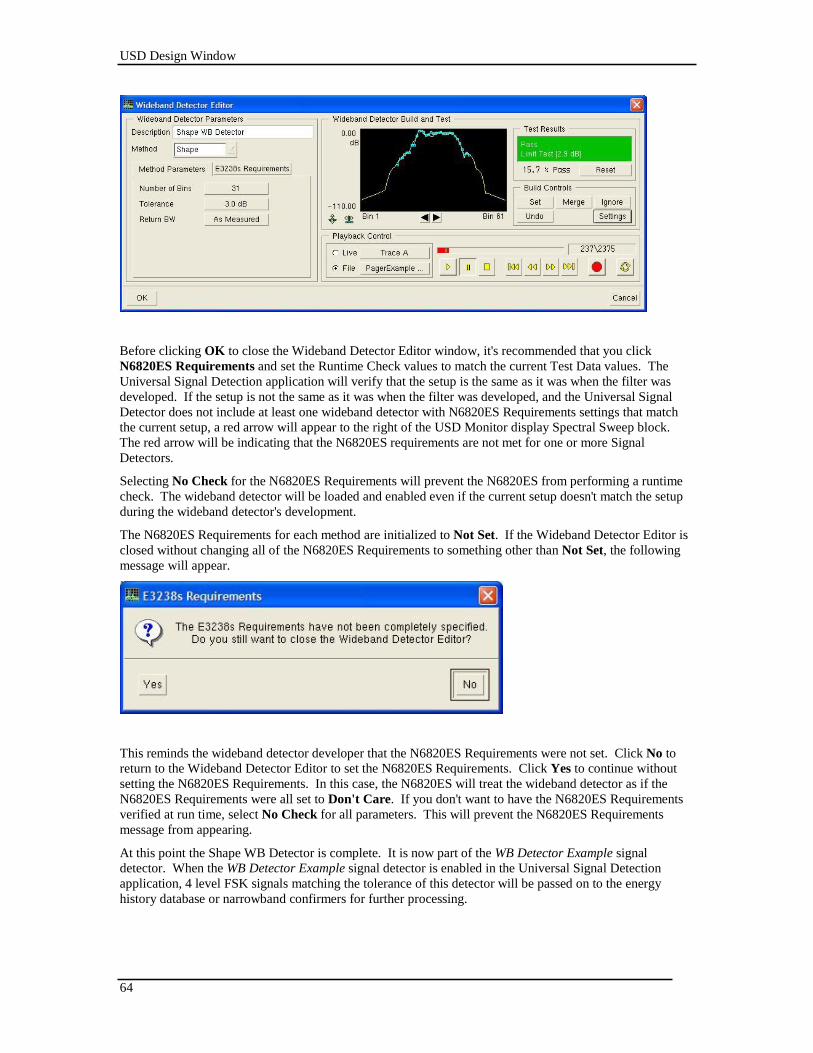
USD Design Window
64
Before clicking OK to close the Wideband Detector Editor window, it's recommended that you click
N6820ES Requirements and set the Runtime Check values to match the current Test Data values. The
Universal Signal Detection application will verify that the setup is the same as it was when the filter was
developed. If the setup is not the same as it was when the filter was developed, and the Universal Signal
Detector does not include at least one wideband detector with N6820ES Requirements settings that match
the current setup, a red arrow will appear to the right of the USD Monitor display Spectral Sweep block.
The red arrow will be indicating that the N6820ES requirements are not met for one or more Signal
Detectors.
Selecting No Check for the N6820ES Requirements will prevent the N6820ES from performing a runtime
check. The wideband detector will be loaded and enabled even if the current setup doesn't match the setup
during the wideband detector's development.
The N6820ES Requirements for each method are initialized to Not Set. If the Wideband Detector Editor is
closed without changing all of the N6820ES Requirements to something other than Not Set, the following
message will appear.
This reminds the wideband detector developer that the N6820ES Requirements were not set. Click No to
return to the Wideband Detector Editor to set the N6820ES Requirements. Click Yes to continue without
setting the N6820ES Requirements. In this case, the N6820ES will treat the wideband detector as if the
N6820ES Requirements were all set to Don't Care. If you don't want to have the N6820ES Requirements
verified at run time, select No Check for all parameters. This will prevent the N6820ES Requirements
message from appearing.
At this point the Shape WB Detector is complete. It is now part of the WB Detector Example signal
detector. When the WB Detector Example signal detector is enabled in the Universal Signal Detection
application, 4 level FSK signals matching the tolerance of this detector will be passed on to the energy
history database or narrowband confirmers for further processing.
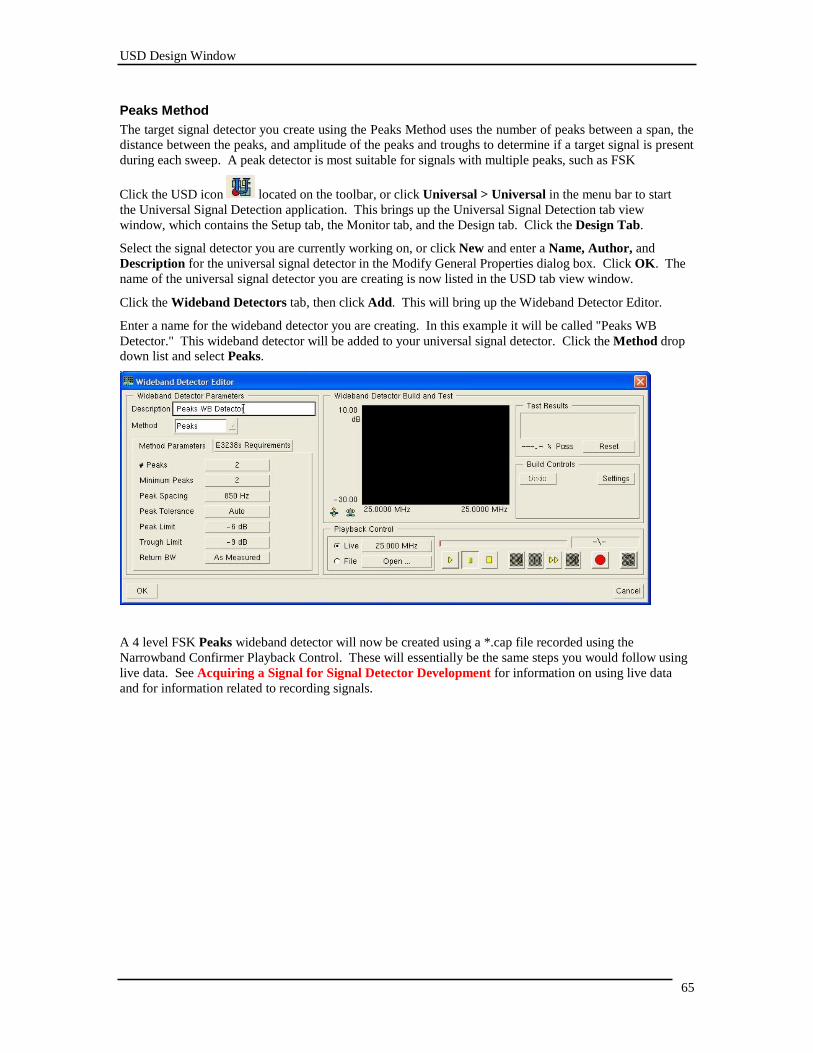
USD Design Window
65
Peaks Method
The target signal detector you create using the Peaks Method uses the number of peaks between a span, the
distance between the peaks, and amplitude of the peaks and troughs to determine if a target signal is present
during each sweep. A peak detector is most suitable for signals with multiple peaks, such as FSK
Click the USD icon located on the toolbar, or click Universal > Universal in the menu bar to start
the Universal Signal Detection application. This brings up the Universal Signal Detection tab view
window, which contains the Setup tab, the Monitor tab, and the Design tab. Click the Design Tab.
Select the signal detector you are currently working on, or click New and enter a Name, Author, and
Description for the universal signal detector in the Modify General Properties dialog box. Click OK. The
name of the universal signal detector you are creating is now listed in the USD tab view window.
Click the Wideband Detectors tab, then click Add. This will bring up the Wideband Detector Editor.
Enter a name for the wideband detector you are creating. In this example it will be called "Peaks WB
Detector." This wideband detector will be added to your universal signal detector. Click the Method drop down list and select Peaks.
A 4 level FSK Peaks wideband detector will now be created using a *.cap file recorded using the
Narrowband Confirmer Playback Control. These will essentially be the same steps you would follow using
live data. See Acquiring a Signal for Signal Detector Development for information on using live data
and for information related to recording signals.
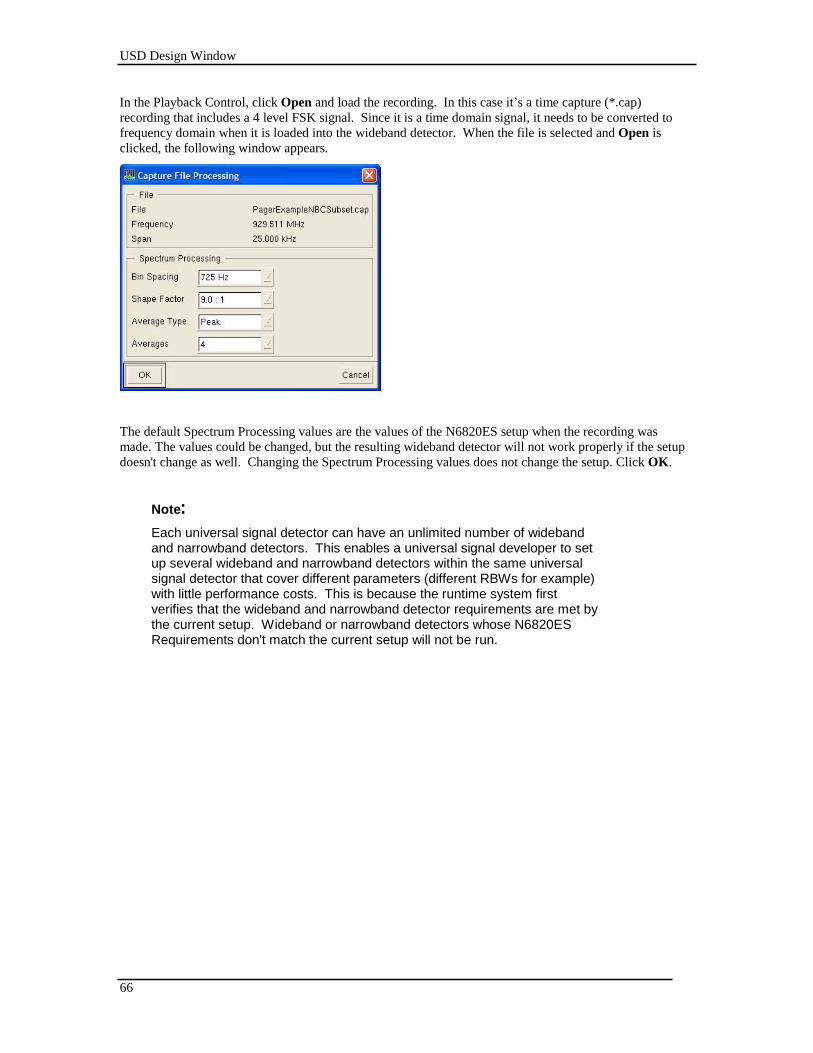
USD Design Window
66
In the Playback Control, click Open and load the recording. In this case it’s a time capture (*.cap)
recording that includes a 4 level FSK signal. Since it is a time domain signal, it needs to be converted to
frequency domain when it is loaded into the wideband detector. When the file is selected and Open is
clicked, the following window appears.
The default Spectrum Processing values are the values of the N6820ES setup when the recording was
made. The values could be changed, but the resulting wideband detector will not work properly if the setup
doesn't change as well. Changing the Spectrum Processing values does not change the setup. Click OK.
Note:
Each universal signal detector can have an unlimited number of wideband and narrowband detectors. This enables a universal signal developer to set up several wideband and narrowband detectors within the same universal signal detector that cover different parameters (different RBWs for example) with little performance costs. This is because the runtime system first verifies that the wideband and narrowband detector requirements are met by the current setup. Wideband or narrowband detectors whose N6820ES Requirements don't match the current setup will not be run.
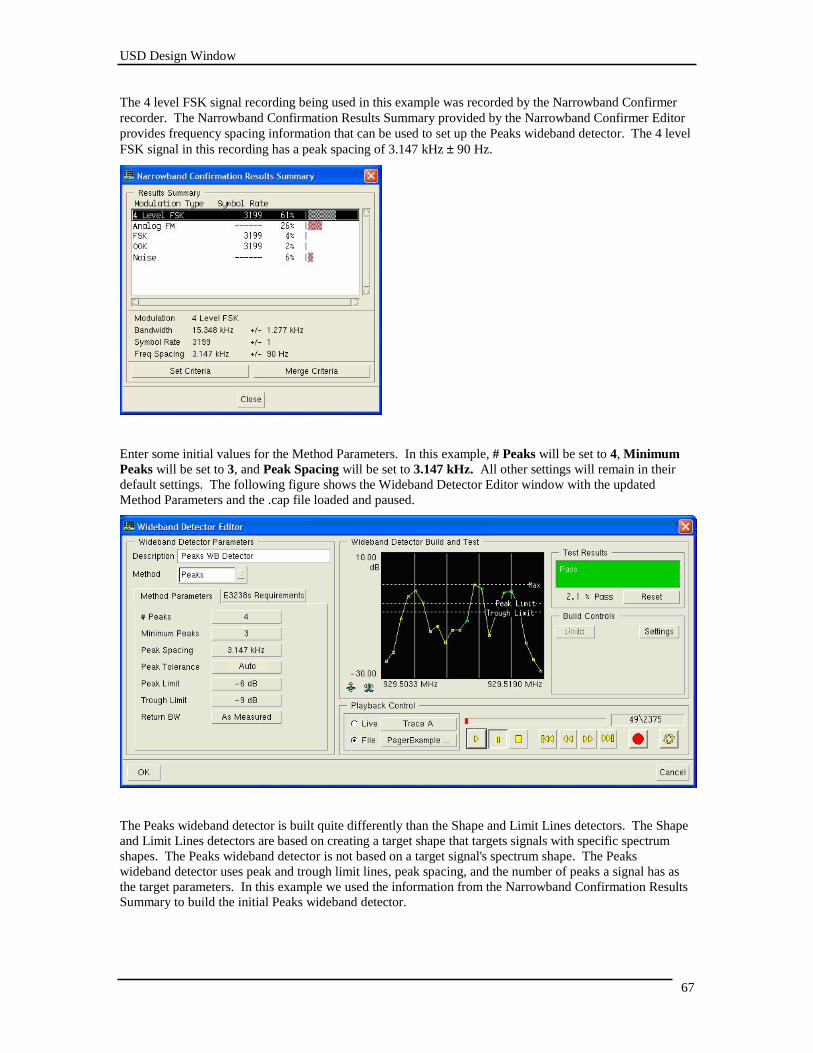
USD Design Window
67
The 4 level FSK signal recording being used in this example was recorded by the Narrowband Confirmer
recorder. The Narrowband Confirmation Results Summary provided by the Narrowband Confirmer Editor
provides frequency spacing information that can be used to set up the Peaks wideband detector. The 4 level
FSK signal in this recording has a peak spacing of 3.147 kHz ± 90 Hz.
Enter some initial values for the Method Parameters. In this example, # Peaks will be set to 4, Minimum
Peaks will be set to 3, and Peak Spacing will be set to 3.147 kHz. All other settings will remain in their
default settings. The following figure shows the Wideband Detector Editor window with the updated
Method Parameters and the .cap file loaded and paused.
The Peaks wideband detector is built quite differently than the Shape and Limit Lines detectors. The Shape
and Limit Lines detectors are based on creating a target shape that targets signals with specific spectrum
shapes. The Peaks wideband detector is not based on a target signal's spectrum shape. The Peaks
wideband detector uses peak and trough limit lines, peak spacing, and the number of peaks a signal has as
the target parameters. In this example we used the information from the Narrowband Confirmation Results
Summary to build the initial Peaks wideband detector.
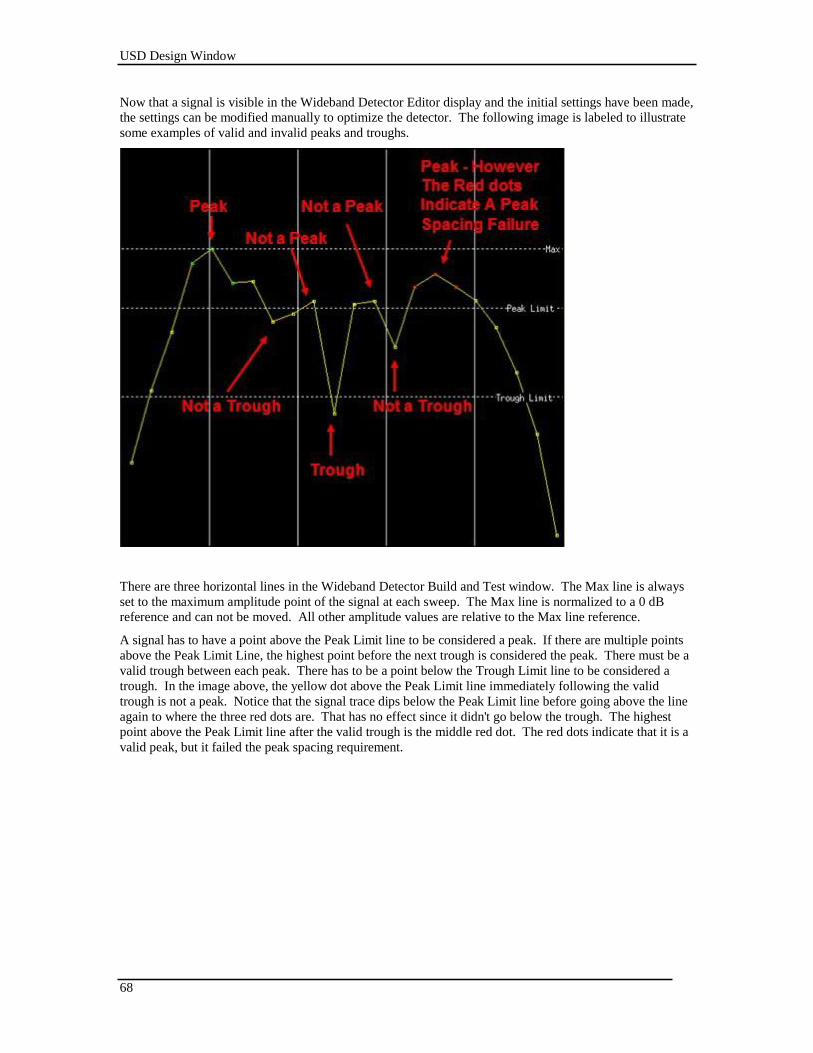
USD Design Window
68
Now that a signal is visible in the Wideband Detector Editor display and the initial settings have been made,
the settings can be modified manually to optimize the detector. The following image is labeled to illustrate
some examples of valid and invalid peaks and troughs.
There are three horizontal lines in the Wideband Detector Build and Test window. The Max line is always
set to the maximum amplitude point of the signal at each sweep. The Max line is normalized to a 0 dB
reference and can not be moved. All other amplitude values are relative to the Max line reference.
A signal has to have a point above the Peak Limit line to be considered a peak. If there are multiple points
above the Peak Limit Line, the highest point before the next trough is considered the peak. There must be a
valid trough between each peak. There has to be a point below the Trough Limit line to be considered a
trough. In the image above, the yellow dot above the Peak Limit line immediately following the valid
trough is not a peak. Notice that the signal trace dips below the Peak Limit line before going above the line
again to where the three red dots are. That has no effect since it didn't go below the trough. The highest
point above the Peak Limit line after the valid trough is the middle red dot. The red dots indicate that it is a
valid peak, but it failed the peak spacing requirement.
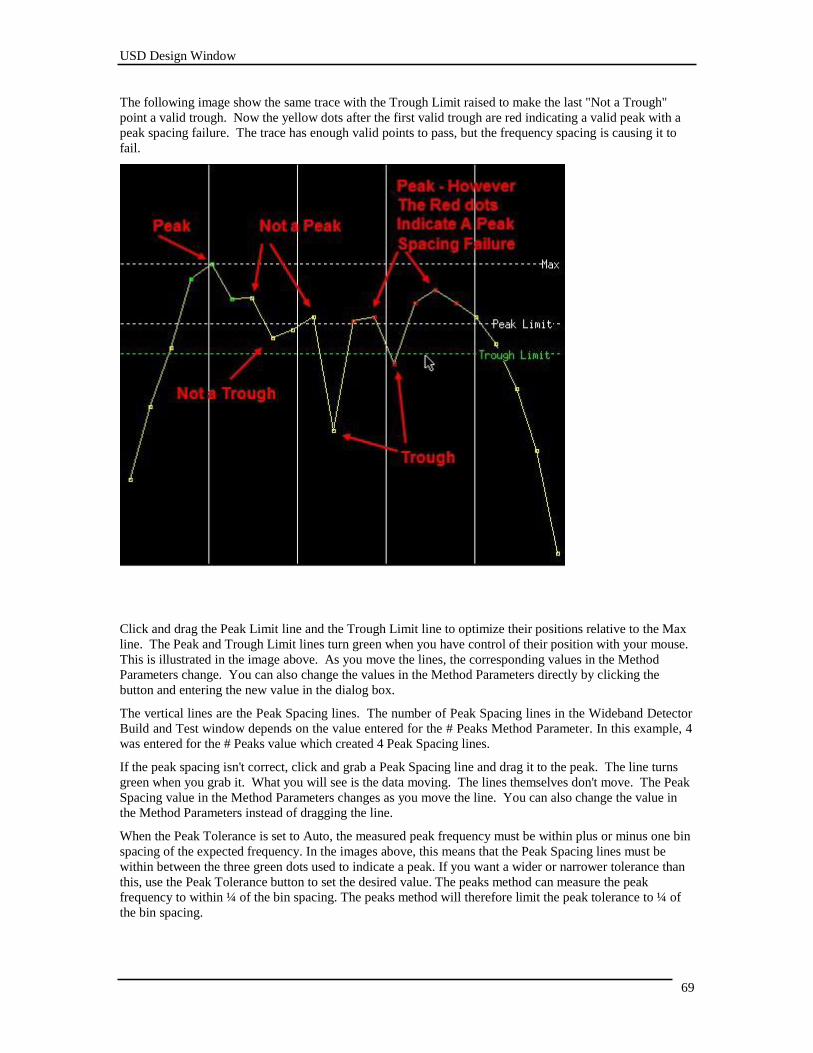
USD Design Window
69
The following image show the same trace with the Trough Limit raised to make the last "Not a Trough"
point a valid trough. Now the yellow dots after the first valid trough are red indicating a valid peak with a
peak spacing failure. The trace has enough valid points to pass, but the frequency spacing is causing it to
fail.
Click and drag the Peak Limit line and the Trough Limit line to optimize their positions relative to the Max
line. The Peak and Trough Limit lines turn green when you have control of their position with your mouse.
This is illustrated in the image above. As you move the lines, the corresponding values in the Method
Parameters change. You can also change the values in the Method Parameters directly by clicking the
button and entering the new value in the dialog box.
The vertical lines are the Peak Spacing lines. The number of Peak Spacing lines in the Wideband Detector
Build and Test window depends on the value entered for the # Peaks Method Parameter. In this example, 4
was entered for the # Peaks value which created 4 Peak Spacing lines.
If the peak spacing isn't correct, click and grab a Peak Spacing line and drag it to the peak. The line turns
green when you grab it. What you will see is the data moving. The lines themselves don't move. The Peak
Spacing value in the Method Parameters changes as you move the line. You can also change the value in
the Method Parameters instead of dragging the line.
When the Peak Tolerance is set to Auto, the measured peak frequency must be within plus or minus one bin
spacing of the expected frequency. In the images above, this means that the Peak Spacing lines must be
within between the three green dots used to indicate a peak. If you want a wider or narrower tolerance than
this, use the Peak Tolerance button to set the desired value. The peaks method can measure the peak
frequency to within ¼ of the bin spacing. The peaks method will therefore limit the peak tolerance to ¼ of
the bin spacing.
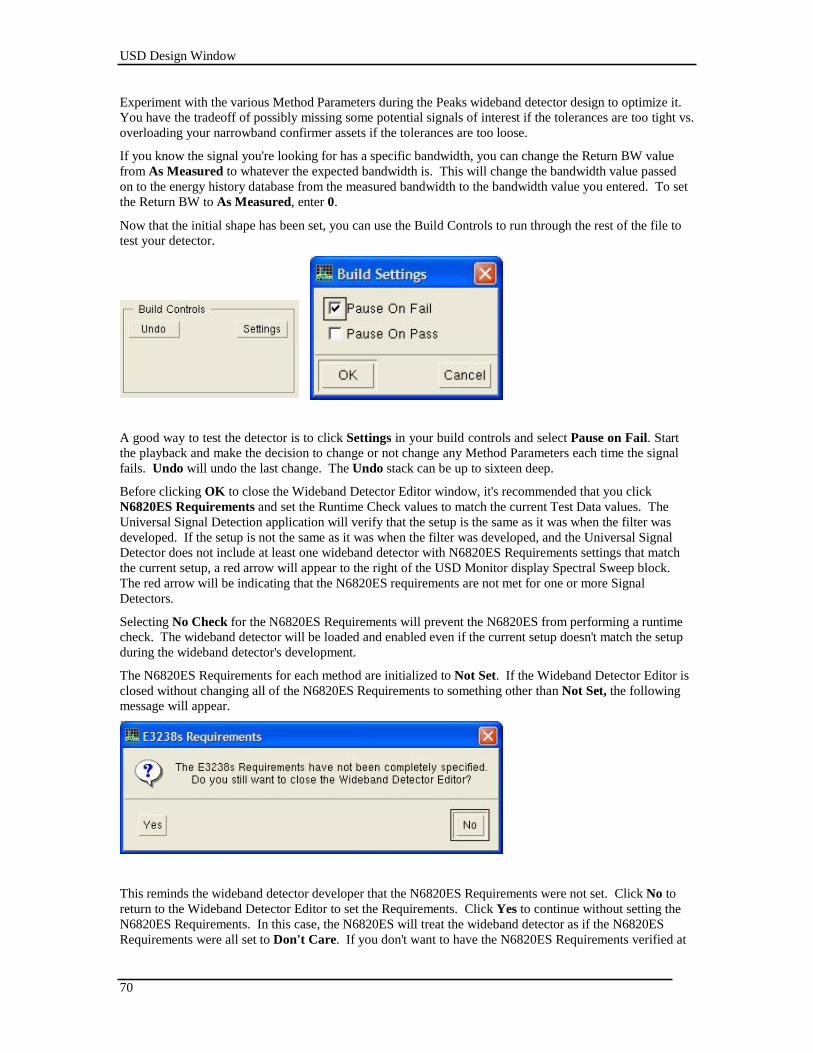
USD Design Window
70
Experiment with the various Method Parameters during the Peaks wideband detector design to optimize it.
You have the tradeoff of possibly missing some potential signals of interest if the tolerances are too tight vs.
overloading your narrowband confirmer assets if the tolerances are too loose.
If you know the signal you're looking for has a specific bandwidth, you can change the Return BW value
from As Measured to whatever the expected bandwidth is. This will change the bandwidth value passed
on to the energy history database from the measured bandwidth to the bandwidth value you entered. To set
the Return BW to As Measured, enter 0.
Now that the initial shape has been set, you can use the Build Controls to run through the rest of the file to
test your detector.
A good way to test the detector is to click Settings in your build controls and select Pause on Fail. Start
the playback and make the decision to change or not change any Method Parameters each time the signal
fails. Undo will undo the last change. The Undo stack can be up to sixteen deep.
Before clicking OK to close the Wideband Detector Editor window, it's recommended that you click
N6820ES Requirements and set the Runtime Check values to match the current Test Data values. The
Universal Signal Detection application will verify that the setup is the same as it was when the filter was
developed. If the setup is not the same as it was when the filter was developed, and the Universal Signal
Detector does not include at least one wideband detector with N6820ES Requirements settings that match
the current setup, a red arrow will appear to the right of the USD Monitor display Spectral Sweep block.
The red arrow will be indicating that the N6820ES requirements are not met for one or more Signal
Detectors.
Selecting No Check for the N6820ES Requirements will prevent the N6820ES from performing a runtime
check. The wideband detector will be loaded and enabled even if the current setup doesn't match the setup
during the wideband detector's development.
The N6820ES Requirements for each method are initialized to Not Set. If the Wideband Detector Editor is
closed without changing all of the N6820ES Requirements to something other than Not Set, the following
message will appear.
This reminds the wideband detector developer that the N6820ES Requirements were not set. Click No to
return to the Wideband Detector Editor to set the Requirements. Click Yes to continue without setting the
N6820ES Requirements. In this case, the N6820ES will treat the wideband detector as if the N6820ES
Requirements were all set to Don't Care. If you don't want to have the N6820ES Requirements verified at
USD Design Window
71
run time, select No Check for all parameters. This will prevent the N6820ES Requirements message from
appearing.
At this point the Peaks WB Detector is complete. It is now part of the WB Detector Example signal
detector. When the WB Detector Example signal detector is enabled in the Universal Signal Detection
application, 4 level FSK signals matching the peak, trough, number of peaks, and peak spacing
requirements of this detector will be passed on to the energy history database or narrowband confirmers for
further processing.
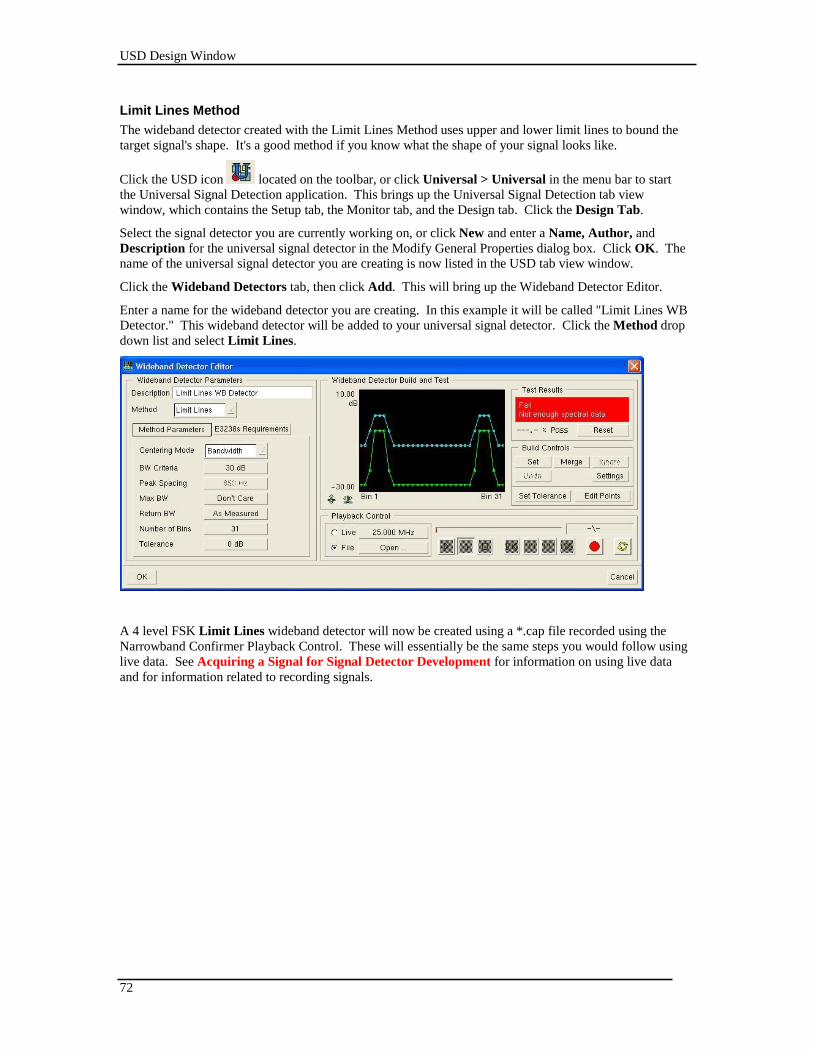
USD Design Window
72
Limit Lines Method
The wideband detector created with the Limit Lines Method uses upper and lower limit lines to bound the
target signal's shape. It's a good method if you know what the shape of your signal looks like.
Click the USD icon located on the toolbar, or click Universal > Universal in the menu bar to start
the Universal Signal Detection application. This brings up the Universal Signal Detection tab view
window, which contains the Setup tab, the Monitor tab, and the Design tab. Click the Design Tab.
Select the signal detector you are currently working on, or click New and enter a Name, Author, and
Description for the universal signal detector in the Modify General Properties dialog box. Click OK. The
name of the universal signal detector you are creating is now listed in the USD tab view window.
Click the Wideband Detectors tab, then click Add. This will bring up the Wideband Detector Editor.
Enter a name for the wideband detector you are creating. In this example it will be called "Limit Lines WB
Detector." This wideband detector will be added to your universal signal detector. Click the Method drop
down list and select Limit Lines.
A 4 level FSK Limit Lines wideband detector will now be created using a *.cap file recorded using the
Narrowband Confirmer Playback Control. These will essentially be the same steps you would follow using
live data. See Acquiring a Signal for Signal Detector Development for information on using live data
and for information related to recording signals.
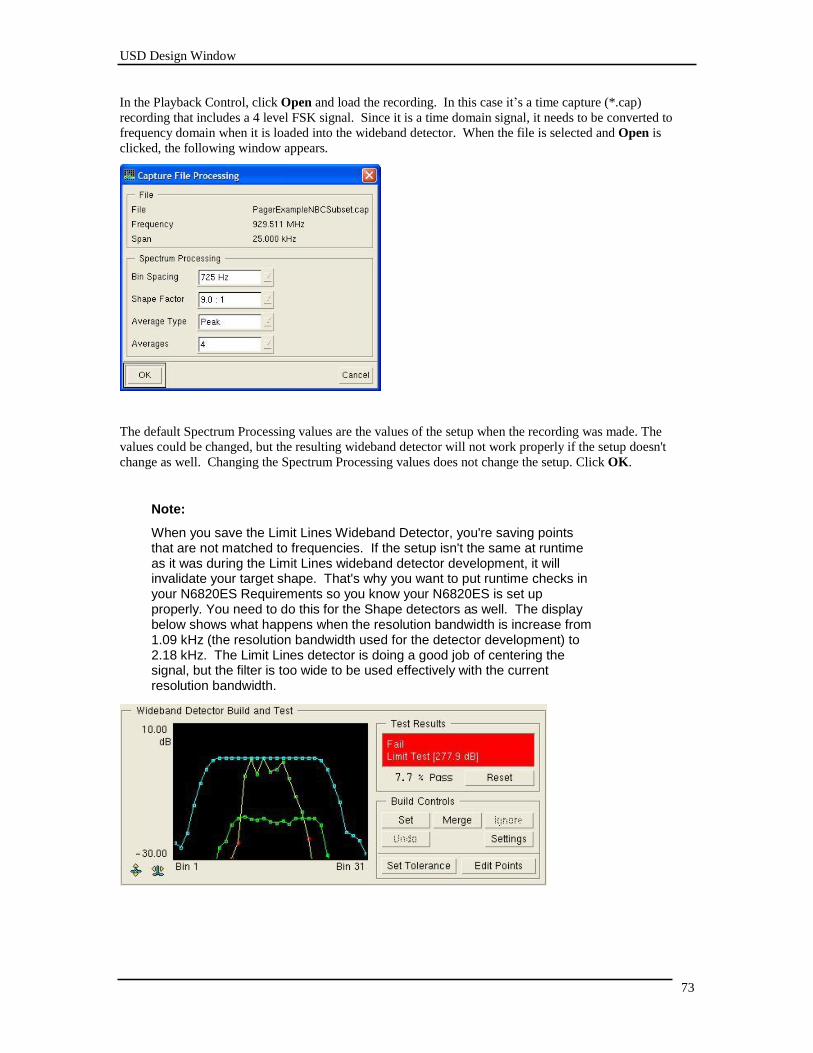
USD Design Window
73
In the Playback Control, click Open and load the recording. In this case it’s a time capture (*.cap)
recording that includes a 4 level FSK signal. Since it is a time domain signal, it needs to be converted to
frequency domain when it is loaded into the wideband detector. When the file is selected and Open is
clicked, the following window appears.
The default Spectrum Processing values are the values of the setup when the recording was made. The
values could be changed, but the resulting wideband detector will not work properly if the setup doesn't
change as well. Changing the Spectrum Processing values does not change the setup. Click OK.
Note:
When you save the Limit Lines Wideband Detector, you're saving points that are not matched to frequencies. If the setup isn't the same at runtime as it was during the Limit Lines wideband detector development, it will invalidate your target shape. That's why you want to put runtime checks in your N6820ES Requirements so you know your N6820ES is set up properly. You need to do this for the Shape detectors as well. The display below shows what happens when the resolution bandwidth is increase from 1.09 kHz (the resolution bandwidth used for the detector development) to 2.18 kHz. The Limit Lines detector is doing a good job of centering the signal, but the filter is too wide to be used effectively with the current resolution bandwidth.
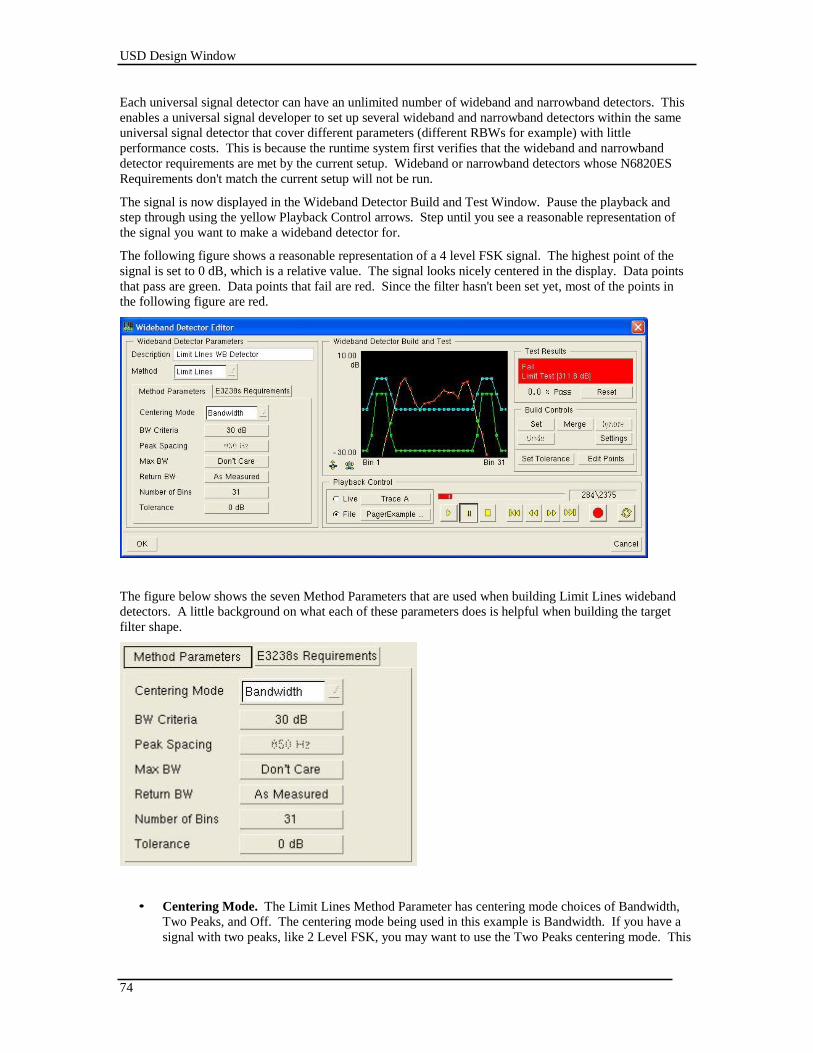
USD Design Window
74
Each universal signal detector can have an unlimited number of wideband and narrowband detectors. This
enables a universal signal developer to set up several wideband and narrowband detectors within the same
universal signal detector that cover different parameters (different RBWs for example) with little
performance costs. This is because the runtime system first verifies that the wideband and narrowband
detector requirements are met by the current setup. Wideband or narrowband detectors whose N6820ES
Requirements don't match the current setup will not be run.
The signal is now displayed in the Wideband Detector Build and Test Window. Pause the playback and
step through using the yellow Playback Control arrows. Step until you see a reasonable representation of
the signal you want to make a wideband detector for.
The following figure shows a reasonable representation of a 4 level FSK signal. The highest point of the
signal is set to 0 dB, which is a relative value. The signal looks nicely centered in the display. Data points
that pass are green. Data points that fail are red. Since the filter hasn't been set yet, most of the points in
the following figure are red.
The figure below shows the seven Method Parameters that are used when building Limit Lines wideband
detectors. A little background on what each of these parameters does is helpful when building the target
filter shape.
• Centering Mode. The Limit Lines Method Parameter has centering mode choices of Bandwidth,
Two Peaks, and Off. The centering mode being used in this example is Bandwidth. If you have a
signal with two peaks, like 2 Level FSK, you may want to use the Two Peaks centering mode. This
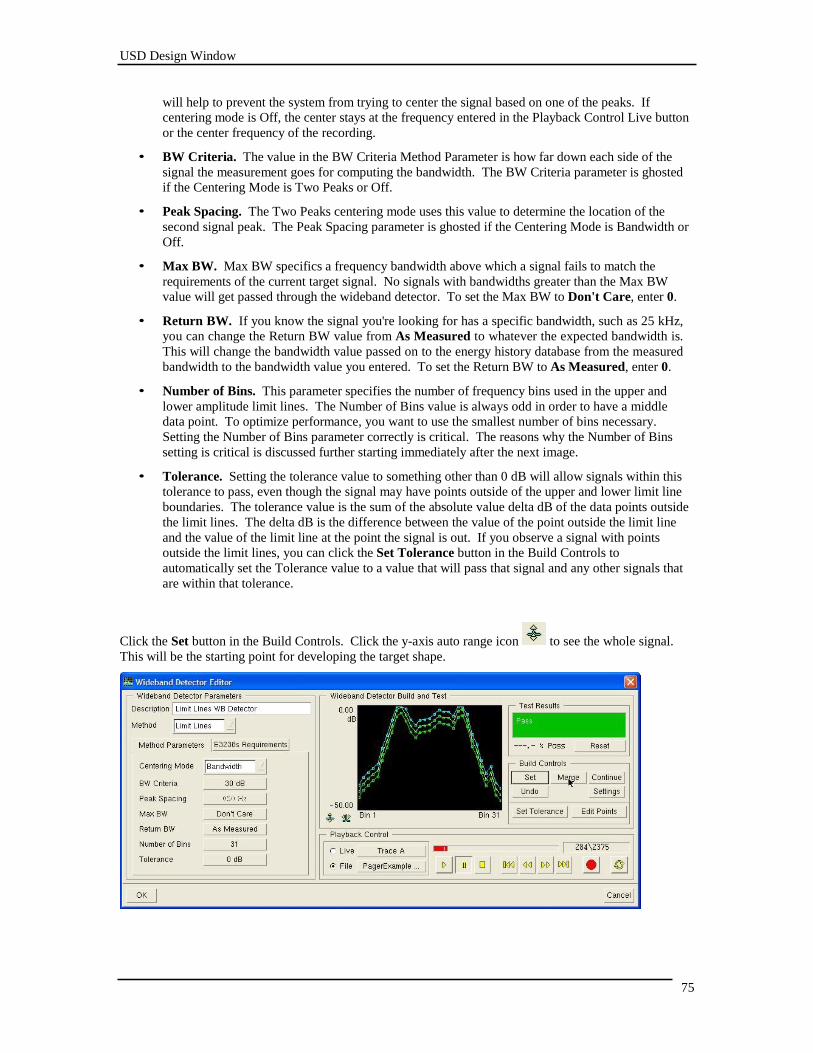
USD Design Window
75
will help to prevent the system from trying to center the signal based on one of the peaks. If
centering mode is Off, the center stays at the frequency entered in the Playback Control Live button
or the center frequency of the recording.
• BW Criteria. The value in the BW Criteria Method Parameter is how far down each side of the
signal the measurement goes for computing the bandwidth. The BW Criteria parameter is ghosted
if the Centering Mode is Two Peaks or Off.
• Peak Spacing. The Two Peaks centering mode uses this value to determine the location of the
second signal peak. The Peak Spacing parameter is ghosted if the Centering Mode is Bandwidth or
Off.
• Max BW. Max BW specifics a frequency bandwidth above which a signal fails to match the
requirements of the current target signal. No signals with bandwidths greater than the Max BW
value will get passed through the wideband detector. To set the Max BW to Don't Care, enter 0.
• Return BW. If you know the signal you're looking for has a specific bandwidth, such as 25 kHz,
you can change the Return BW value from As Measured to whatever the expected bandwidth is.
This will change the bandwidth value passed on to the energy history database from the measured
bandwidth to the bandwidth value you entered. To set the Return BW to As Measured, enter 0.
• Number of Bins. This parameter specifies the number of frequency bins used in the upper and
lower amplitude limit lines. The Number of Bins value is always odd in order to have a middle
data point. To optimize performance, you want to use the smallest number of bins necessary.
Setting the Number of Bins parameter correctly is critical. The reasons why the Number of Bins
setting is critical is discussed further starting immediately after the next image.
• Tolerance. Setting the tolerance value to something other than 0 dB will allow signals within this
tolerance to pass, even though the signal may have points outside of the upper and lower limit line
boundaries. The tolerance value is the sum of the absolute value delta dB of the data points outside
the limit lines. The delta dB is the difference between the value of the point outside the limit line
and the value of the limit line at the point the signal is out. If you observe a signal with points
outside the limit lines, you can click the Set Tolerance button in the Build Controls to
automatically set the Tolerance value to a value that will pass that signal and any other signals that
are within that tolerance.
Click the Set button in the Build Controls. Click the y-axis auto range icon to see the whole signal.
This will be the starting point for developing the target shape.
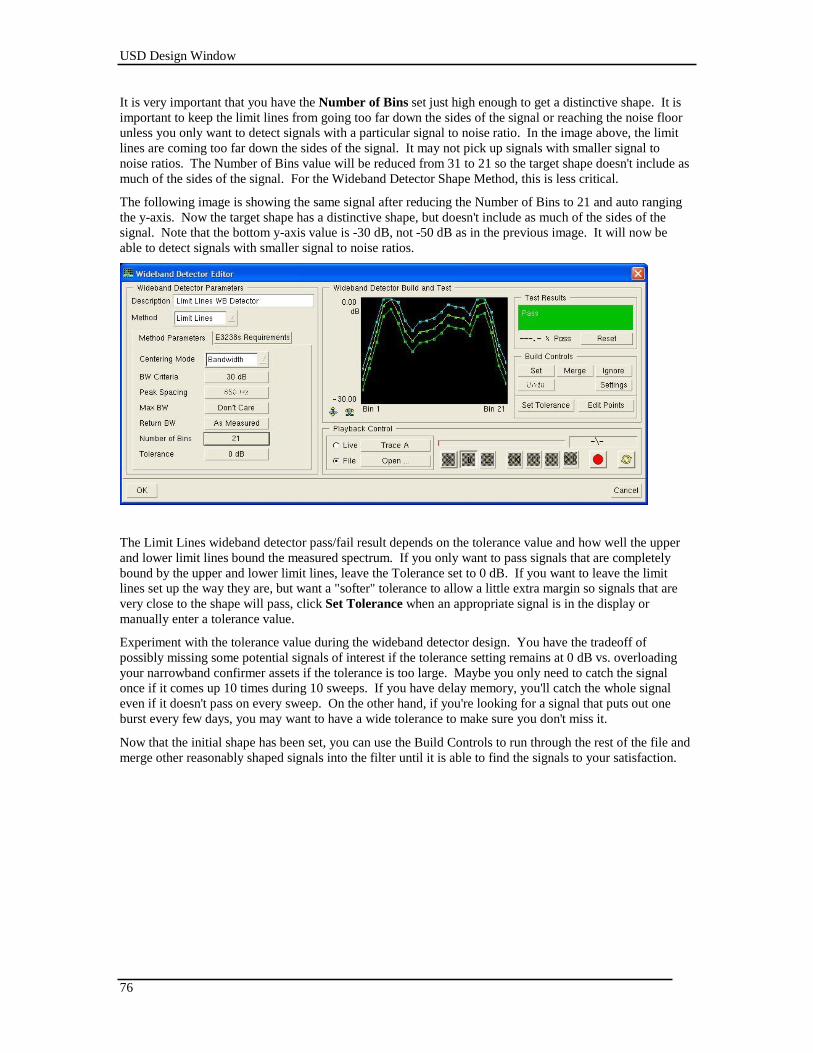
USD Design Window
76
It is very important that you have the Number of Bins set just high enough to get a distinctive shape. It is
important to keep the limit lines from going too far down the sides of the signal or reaching the noise floor
unless you only want to detect signals with a particular signal to noise ratio. In the image above, the limit
lines are coming too far down the sides of the signal. It may not pick up signals with smaller signal to
noise ratios. The Number of Bins value will be reduced from 31 to 21 so the target shape doesn't include as
much of the sides of the signal. For the Wideband Detector Shape Method, this is less critical.
The following image is showing the same signal after reducing the Number of Bins to 21 and auto ranging
the y-axis. Now the target shape has a distinctive shape, but doesn't include as much of the sides of the
signal. Note that the bottom y-axis value is -30 dB, not -50 dB as in the previous image. It will now be
able to detect signals with smaller signal to noise ratios.
The Limit Lines wideband detector pass/fail result depends on the tolerance value and how well the upper
and lower limit lines bound the measured spectrum. If you only want to pass signals that are completely
bound by the upper and lower limit lines, leave the Tolerance set to 0 dB. If you want to leave the limit
lines set up the way they are, but want a "softer" tolerance to allow a little extra margin so signals that are
very close to the shape will pass, click Set Tolerance when an appropriate signal is in the display or
manually enter a tolerance value.
Experiment with the tolerance value during the wideband detector design. You have the tradeoff of
possibly missing some potential signals of interest if the tolerance setting remains at 0 dB vs. overloading
your narrowband confirmer assets if the tolerance is too large. Maybe you only need to catch the signal
once if it comes up 10 times during 10 sweeps. If you have delay memory, you'll catch the whole signal
even if it doesn't pass on every sweep. On the other hand, if you're looking for a signal that puts out one
burst every few days, you may want to have a wide tolerance to make sure you don't miss it.
Now that the initial shape has been set, you can use the Build Controls to run through the rest of the file and
merge other reasonably shaped signals into the filter until it is able to find the signals to your satisfaction.
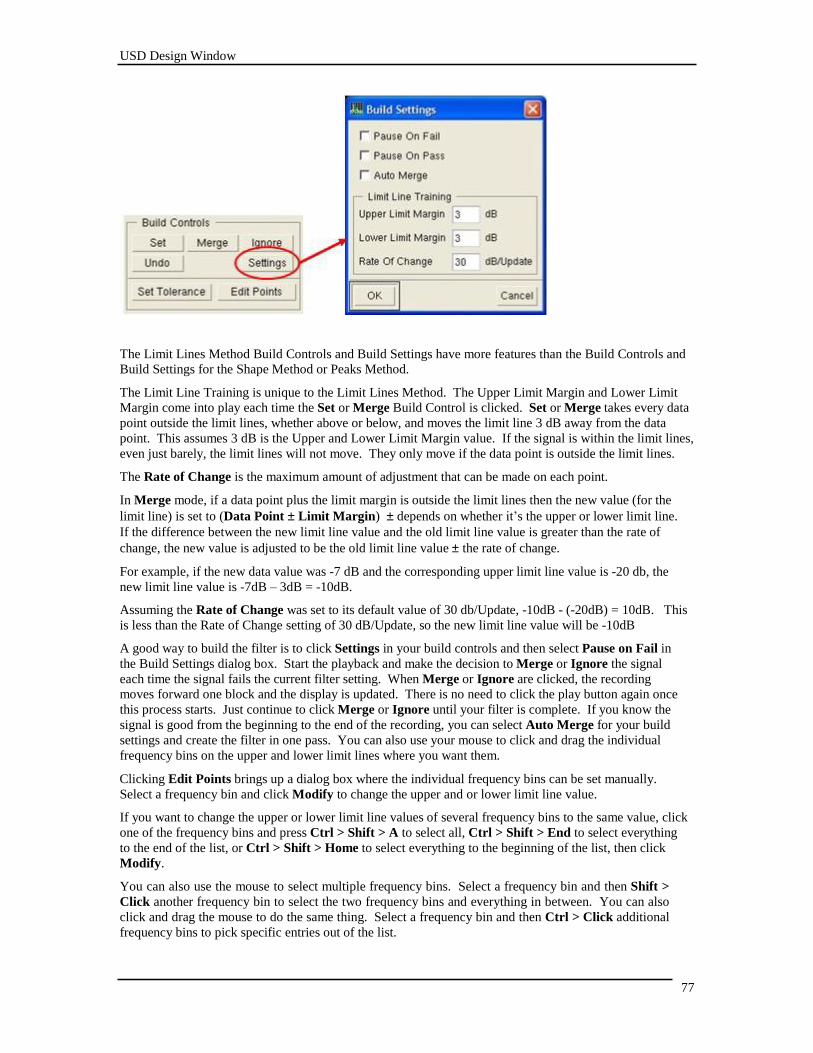
USD Design Window
77
The Limit Lines Method Build Controls and Build Settings have more features than the Build Controls and
Build Settings for the Shape Method or Peaks Method.
The Limit Line Training is unique to the Limit Lines Method. The Upper Limit Margin and Lower Limit
Margin come into play each time the Set or Merge Build Control is clicked. Set or Merge takes every data
point outside the limit lines, whether above or below, and moves the limit line 3 dB away from the data
point. This assumes 3 dB is the Upper and Lower Limit Margin value. If the signal is within the limit lines,
even just barely, the limit lines will not move. They only move if the data point is outside the limit lines.
The Rate of Change is the maximum amount of adjustment that can be made on each point.
In Merge mode, if a data point plus the limit margin is outside the limit lines then the new value (for the
limit line) is set to (Data Point ± Limit Margin) ± depends on whether it’s the upper or lower limit line.
If the difference between the new limit line value and the old limit line value is greater than the rate of
change, the new value is adjusted to be the old limit line value ± the rate of change.
For example, if the new data value was -7 dB and the corresponding upper limit line value is -20 db, the
new limit line value is -7dB – 3dB = -10dB.
Assuming the Rate of Change was set to its default value of 30 db/Update, -10dB - (-20dB) = 10dB. This
is less than the Rate of Change setting of 30 dB/Update, so the new limit line value will be -10dB
A good way to build the filter is to click Settings in your build controls and then select Pause on Fail in
the Build Settings dialog box. Start the playback and make the decision to Merge or Ignore the signal
each time the signal fails the current filter setting. When Merge or Ignore are clicked, the recording
moves forward one block and the display is updated. There is no need to click the play button again once
this process starts. Just continue to click Merge or Ignore until your filter is complete. If you know the
signal is good from the beginning to the end of the recording, you can select Auto Merge for your build
settings and create the filter in one pass. You can also use your mouse to click and drag the individual
frequency bins on the upper and lower limit lines where you want them.
Clicking Edit Points brings up a dialog box where the individual frequency bins can be set manually.
Select a frequency bin and click Modify to change the upper and or lower limit line value.
If you want to change the upper or lower limit line values of several frequency bins to the same value, click
one of the frequency bins and press Ctrl > Shift > A to select all, Ctrl > Shift > End to select everything
to the end of the list, or Ctrl > Shift > Home to select everything to the beginning of the list, then click
Modify.
You can also use the mouse to select multiple frequency bins. Select a frequency bin and then Shift >
Click another frequency bin to select the two frequency bins and everything in between. You can also
click and drag the mouse to do the same thing. Select a frequency bin and then Ctrl > Click additional
frequency bins to pick specific entries out of the list.

USD Design Window
78
Set will restart the filter building process from the beginning. Undo will undo the last choice. The Undo
stack can be up to sixteen deep.
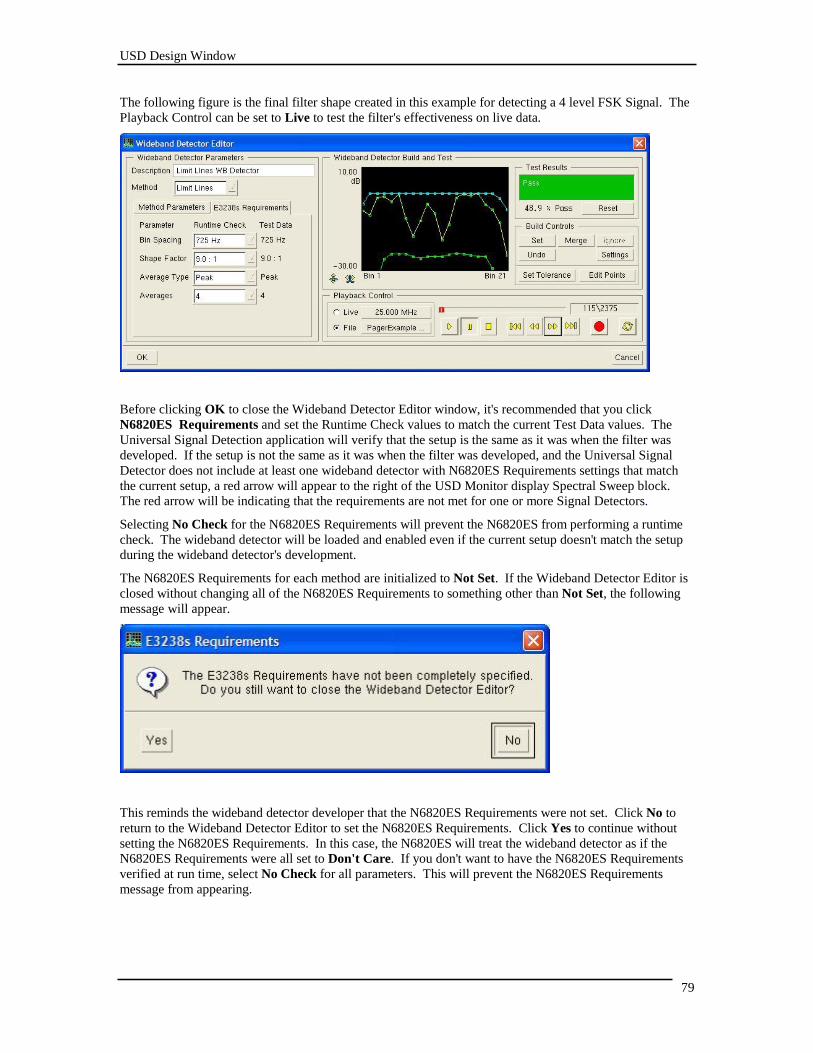
USD Design Window
79
The following figure is the final filter shape created in this example for detecting a 4 level FSK Signal. The
Playback Control can be set to Live to test the filter's effectiveness on live data.
Before clicking OK to close the Wideband Detector Editor window, it's recommended that you click
N6820ES Requirements and set the Runtime Check values to match the current Test Data values. The
Universal Signal Detection application will verify that the setup is the same as it was when the filter was
developed. If the setup is not the same as it was when the filter was developed, and the Universal Signal
Detector does not include at least one wideband detector with N6820ES Requirements settings that match
the current setup, a red arrow will appear to the right of the USD Monitor display Spectral Sweep block.
The red arrow will be indicating that the requirements are not met for one or more Signal Detectors.
Selecting No Check for the N6820ES Requirements will prevent the N6820ES from performing a runtime
check. The wideband detector will be loaded and enabled even if the current setup doesn't match the setup
during the wideband detector's development.
The N6820ES Requirements for each method are initialized to Not Set. If the Wideband Detector Editor is
closed without changing all of the N6820ES Requirements to something other than Not Set, the following
message will appear.
This reminds the wideband detector developer that the N6820ES Requirements were not set. Click No to
return to the Wideband Detector Editor to set the N6820ES Requirements. Click Yes to continue without
setting the N6820ES Requirements. In this case, the N6820ES will treat the wideband detector as if the
N6820ES Requirements were all set to Don't Care. If you don't want to have the N6820ES Requirements
verified at run time, select No Check for all parameters. This will prevent the N6820ES Requirements
message from appearing.
USD Design Window
80
At this point the Limit Lines WB Detector is complete. It is now part of the WB Detector Example signal
detector. When the WB Detector Example signal detector is enabled in the Universal Signal Detection
application, 4 level FSK signals matching the tolerance of this detector will be passed on to the energy
history database or narrowband confirmers for further processing.
Importing Data Files
The wideband detector and narrowband confirmer editors can play sampled time data files in a variety of
formats. The Blackbird capture (*.cap), Agilent SDF (*.sdf), and the windows wave (*.wav) formats are
supported. These file formats all completely specify the data type (8 bit integer, 16 bit integer, etc) as well
as the sample rate. It is assumed that wav files are always real data files.
If the wideband or narrowband editor does not recognize the file type, it can still be played as a raw data
file. In this case, the user must specify the following:
• data type (real or IQ pairs)
• sample type (size and byte ordering)
• data offset in bytes
• sample rate
The data offset can be used to skip over an informational header for unrecognized file formats.
The wideband detector and narrowband confirmer both operate on IQ data. If the file contains real valued
samples, the user must also specify a shift frequency for the signal of interest. This frequency is used to
center the signal when the real valued data is converted to IQ pairs.
As an example, we will walk through opening a 16t file of an 8 level FSK signal. After opening the
ALE.16t file in the either the wideband detector or narrowband confirmer editors, we get the following
dialog box:
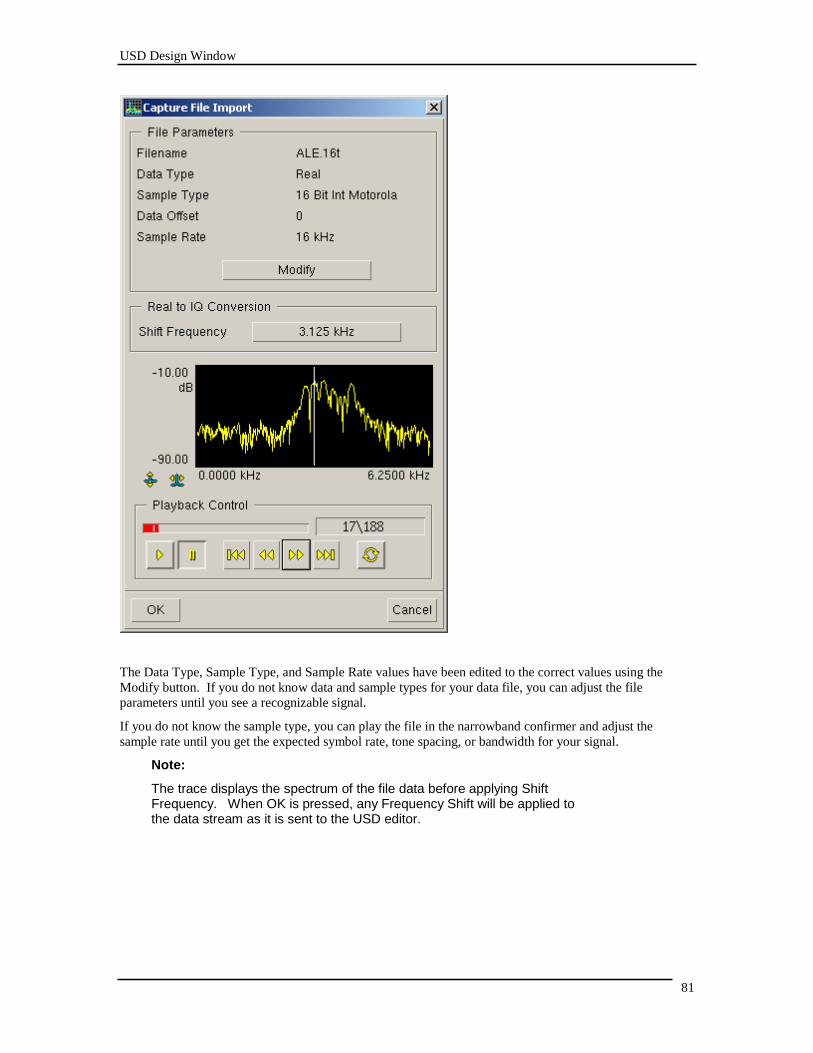
USD Design Window
81
The Data Type, Sample Type, and Sample Rate values have been edited to the correct values using the
Modify button. If you do not know data and sample types for your data file, you can adjust the file
parameters until you see a recognizable signal.
If you do not know the sample type, you can play the file in the narrowband confirmer and adjust the
sample rate until you get the expected symbol rate, tone spacing, or bandwidth for your signal.
Note:
The trace displays the spectrum of the file data before applying Shift Frequency. When OK is pressed, any Frequency Shift will be applied to the data stream as it is sent to the USD editor.
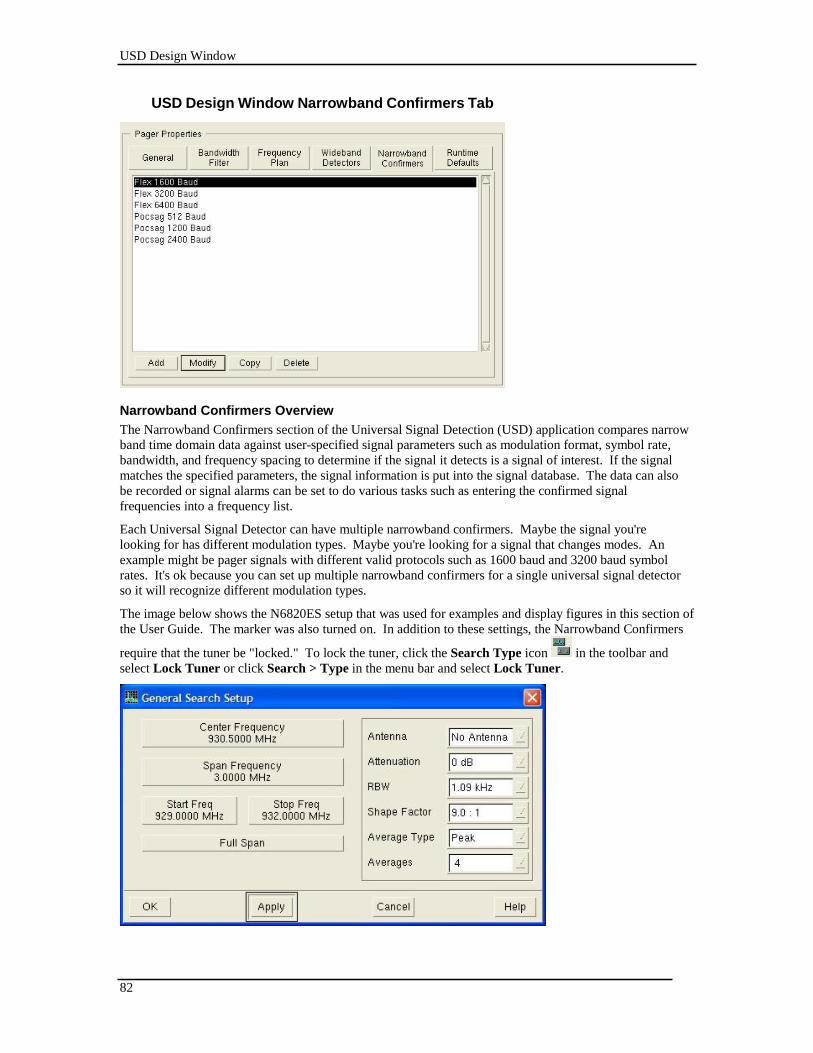
USD Design Window
82
USD Design Window Narrowband Confirmers Tab
Narrowband Confirmers Overview
The Narrowband Confirmers section of the Universal Signal Detection (USD) application compares narrow
band time domain data against user-specified signal parameters such as modulation format, symbol rate,
bandwidth, and frequency spacing to determine if the signal it detects is a signal of interest. If the signal
matches the specified parameters, the signal information is put into the signal database. The data can also
be recorded or signal alarms can be set to do various tasks such as entering the confirmed signal
frequencies into a frequency list.
Each Universal Signal Detector can have multiple narrowband confirmers. Maybe the signal you're
looking for has different modulation types. Maybe you're looking for a signal that changes modes. An
example might be pager signals with different valid protocols such as 1600 baud and 3200 baud symbol
rates. It's ok because you can set up multiple narrowband confirmers for a single universal signal detector
so it will recognize different modulation types.
The image below shows the N6820ES setup that was used for examples and display figures in this section of
the User Guide. The marker was also turned on. In addition to these settings, the Narrowband Confirmers
require that the tuner be "locked." To lock the tuner, click the Search Type icon in the toolbar and
select Lock Tuner or click Search > Type in the menu bar and select Lock Tuner.
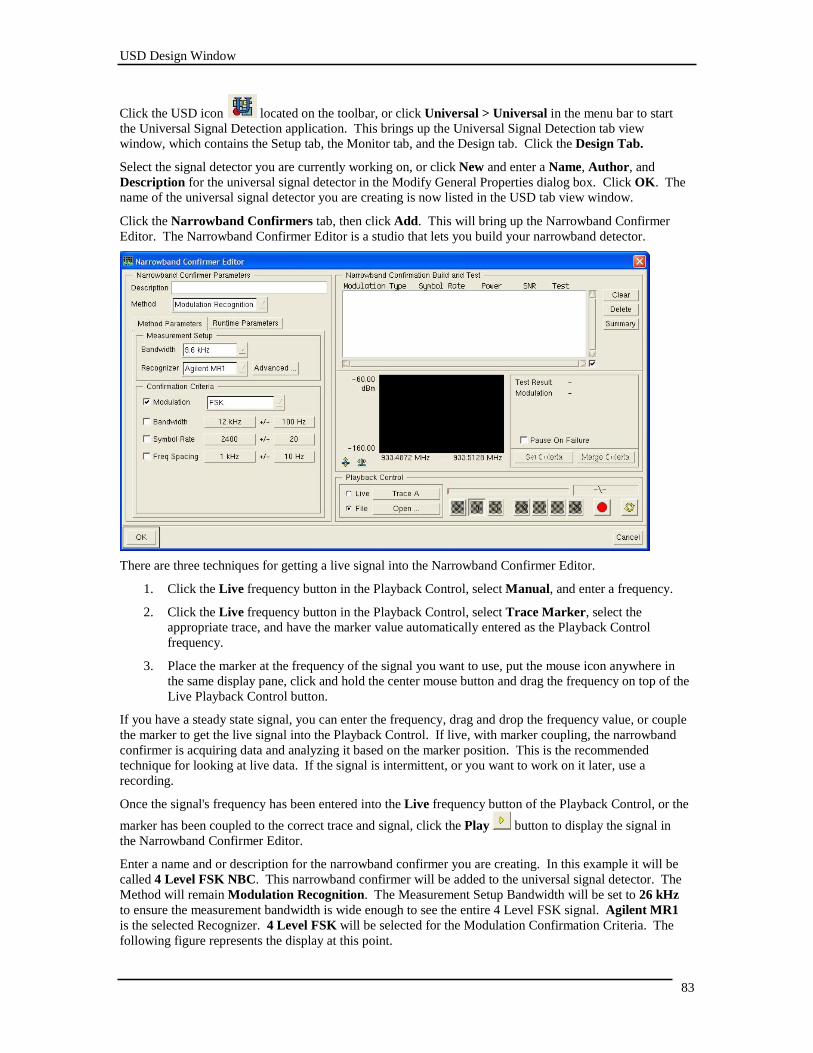
USD Design Window
83
Click the USD icon located on the toolbar, or click Universal > Universal in the menu bar to start
the Universal Signal Detection application. This brings up the Universal Signal Detection tab view
window, which contains the Setup tab, the Monitor tab, and the Design tab. Click the Design Tab.
Select the signal detector you are currently working on, or click New and enter a Name, Author, and
Description for the universal signal detector in the Modify General Properties dialog box. Click OK. The
name of the universal signal detector you are creating is now listed in the USD tab view window.
Click the Narrowband Confirmers tab, then click Add. This will bring up the Narrowband Confirmer
Editor. The Narrowband Confirmer Editor is a studio that lets you build your narrowband detector.
There are three techniques for getting a live signal into the Narrowband Confirmer Editor.
1. Click the Live frequency button in the Playback Control, select Manual, and enter a frequency.
2. Click the Live frequency button in the Playback Control, select Trace Marker, select the
appropriate trace, and have the marker value automatically entered as the Playback Control
frequency.
3. Place the marker at the frequency of the signal you want to use, put the mouse icon anywhere in
the same display pane, click and hold the center mouse button and drag the frequency on top of the
Live Playback Control button.
If you have a steady state signal, you can enter the frequency, drag and drop the frequency value, or couple
the marker to get the live signal into the Playback Control. If live, with marker coupling, the narrowband
confirmer is acquiring data and analyzing it based on the marker position. This is the recommended
technique for looking at live data. If the signal is intermittent, or you want to work on it later, use a
recording.
Once the signal's frequency has been entered into the Live frequency button of the Playback Control, or the
marker has been coupled to the correct trace and signal, click the Play button to display the signal in
the Narrowband Confirmer Editor.
Enter a name and or description for the narrowband confirmer you are creating. In this example it will be
called 4 Level FSK NBC. This narrowband confirmer will be added to the universal signal detector. The
Method will remain Modulation Recognition. The Measurement Setup Bandwidth will be set to 26 kHz
to ensure the measurement bandwidth is wide enough to see the entire 4 Level FSK signal. Agilent MR1
is the selected Recognizer. 4 Level FSK will be selected for the Modulation Confirmation Criteria. The
following figure represents the display at this point.
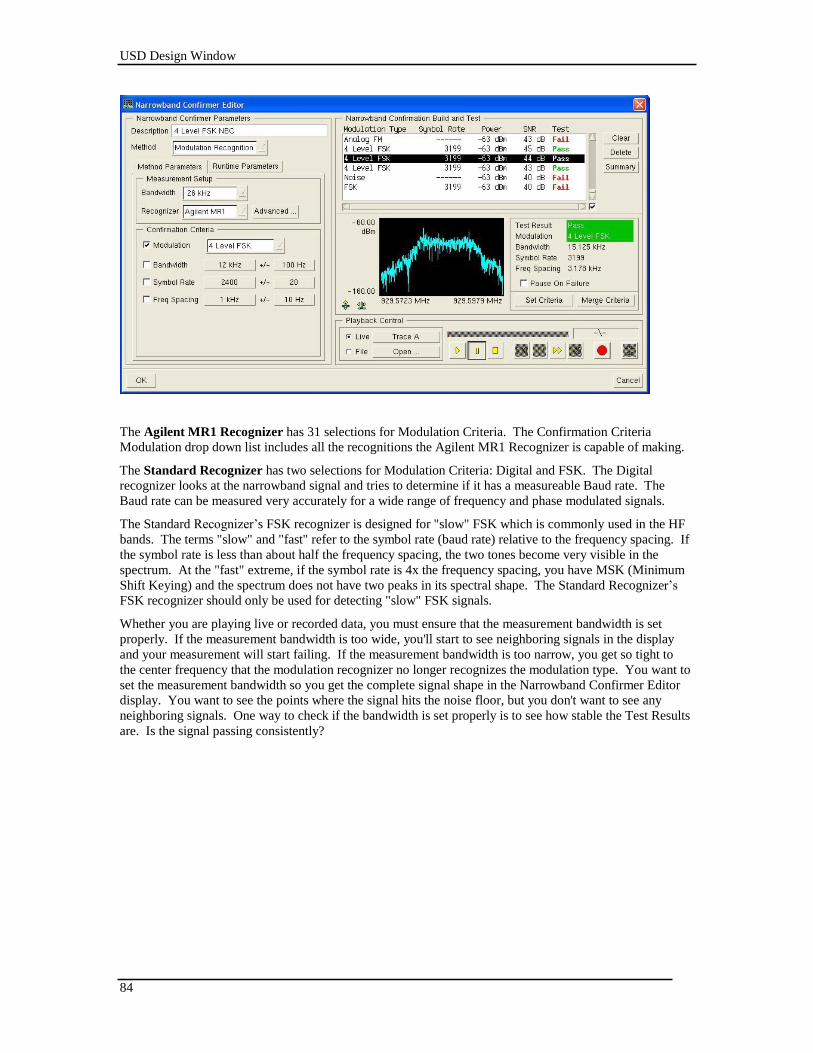
USD Design Window
84
The Agilent MR1 Recognizer has 31 selections for Modulation Criteria. The Confirmation Criteria
Modulation drop down list includes all the recognitions the Agilent MR1 Recognizer is capable of making.
The Standard Recognizer has two selections for Modulation Criteria: Digital and FSK. The Digital
recognizer looks at the narrowband signal and tries to determine if it has a measureable Baud rate. The
Baud rate can be measured very accurately for a wide range of frequency and phase modulated signals.
The Standard Recognizer’s FSK recognizer is designed for "slow" FSK which is commonly used in the HF
bands. The terms "slow" and "fast" refer to the symbol rate (baud rate) relative to the frequency spacing. If
the symbol rate is less than about half the frequency spacing, the two tones become very visible in the
spectrum. At the "fast" extreme, if the symbol rate is 4x the frequency spacing, you have MSK (Minimum
Shift Keying) and the spectrum does not have two peaks in its spectral shape. The Standard Recognizer’s
FSK recognizer should only be used for detecting "slow" FSK signals.
Whether you are playing live or recorded data, you must ensure that the measurement bandwidth is set
properly. If the measurement bandwidth is too wide, you'll start to see neighboring signals in the display
and your measurement will start failing. If the measurement bandwidth is too narrow, you get so tight to
the center frequency that the modulation recognizer no longer recognizes the modulation type. You want to
set the measurement bandwidth so you get the complete signal shape in the Narrowband Confirmer Editor
display. You want to see the points where the signal hits the noise floor, but you don't want to see any
neighboring signals. One way to check if the bandwidth is set properly is to see how stable the Test Results
are. Is the signal passing consistently?
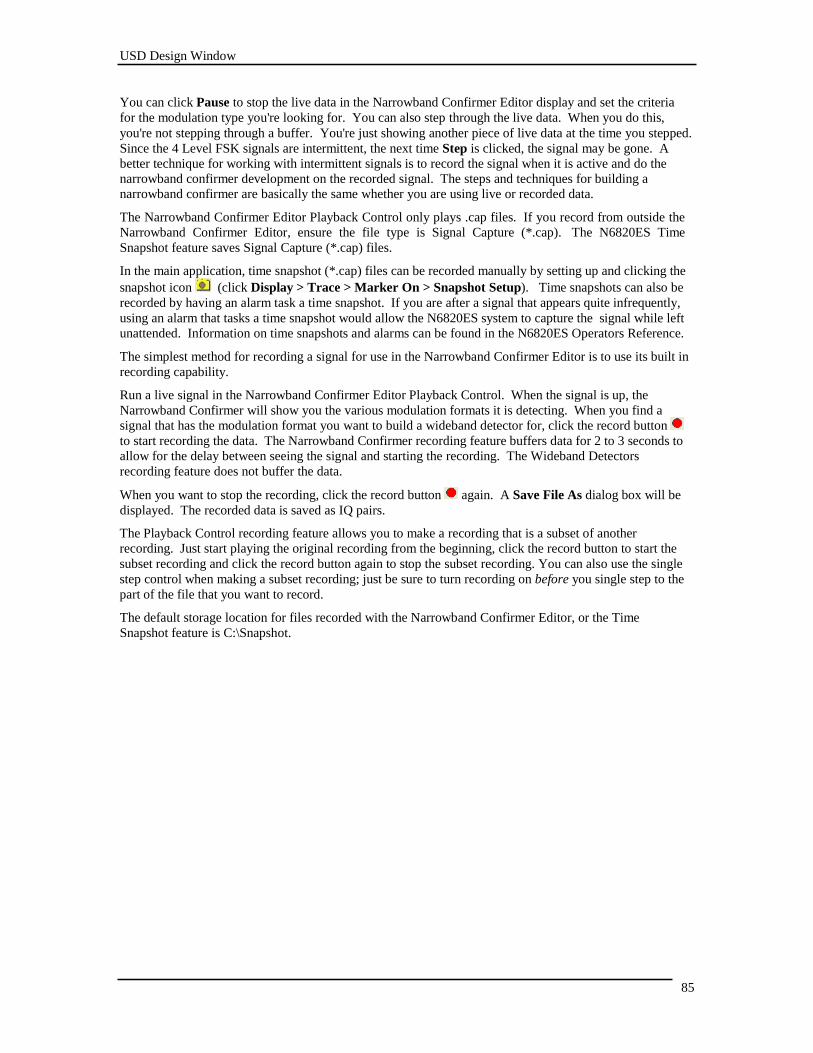
USD Design Window
85
You can click Pause to stop the live data in the Narrowband Confirmer Editor display and set the criteria
for the modulation type you're looking for. You can also step through the live data. When you do this,
you're not stepping through a buffer. You're just showing another piece of live data at the time you stepped.
Since the 4 Level FSK signals are intermittent, the next time Step is clicked, the signal may be gone. A
better technique for working with intermittent signals is to record the signal when it is active and do the
narrowband confirmer development on the recorded signal. The steps and techniques for building a
narrowband confirmer are basically the same whether you are using live or recorded data.
The Narrowband Confirmer Editor Playback Control only plays .cap files. If you record from outside the
Narrowband Confirmer Editor, ensure the file type is Signal Capture (*.cap). The N6820ES Time
Snapshot feature saves Signal Capture (*.cap) files.
In the main application, time snapshot (*.cap) files can be recorded manually by setting up and clicking the
snapshot icon (click Display > Trace > Marker On > Snapshot Setup). Time snapshots can also be
recorded by having an alarm task a time snapshot. If you are after a signal that appears quite infrequently,
using an alarm that tasks a time snapshot would allow the N6820ES system to capture the signal while left
unattended. Information on time snapshots and alarms can be found in the N6820ES Operators Reference.
The simplest method for recording a signal for use in the Narrowband Confirmer Editor is to use its built in
recording capability.
Run a live signal in the Narrowband Confirmer Editor Playback Control. When the signal is up, the
Narrowband Confirmer will show you the various modulation formats it is detecting. When you find a
signal that has the modulation format you want to build a wideband detector for, click the record button
to start recording the data. The Narrowband Confirmer recording feature buffers data for 2 to 3 seconds to
allow for the delay between seeing the signal and starting the recording. The Wideband Detectors
recording feature does not buffer the data.
When you want to stop the recording, click the record button again. A Save File As dialog box will be
displayed. The recorded data is saved as IQ pairs.
The Playback Control recording feature allows you to make a recording that is a subset of another
recording. Just start playing the original recording from the beginning, click the record button to start the
subset recording and click the record button again to stop the subset recording. You can also use the single
step control when making a subset recording; just be sure to turn recording on before you single step to the
part of the file that you want to record.
The default storage location for files recorded with the Narrowband Confirmer Editor, or the Time
Snapshot feature is C:\Snapshot.
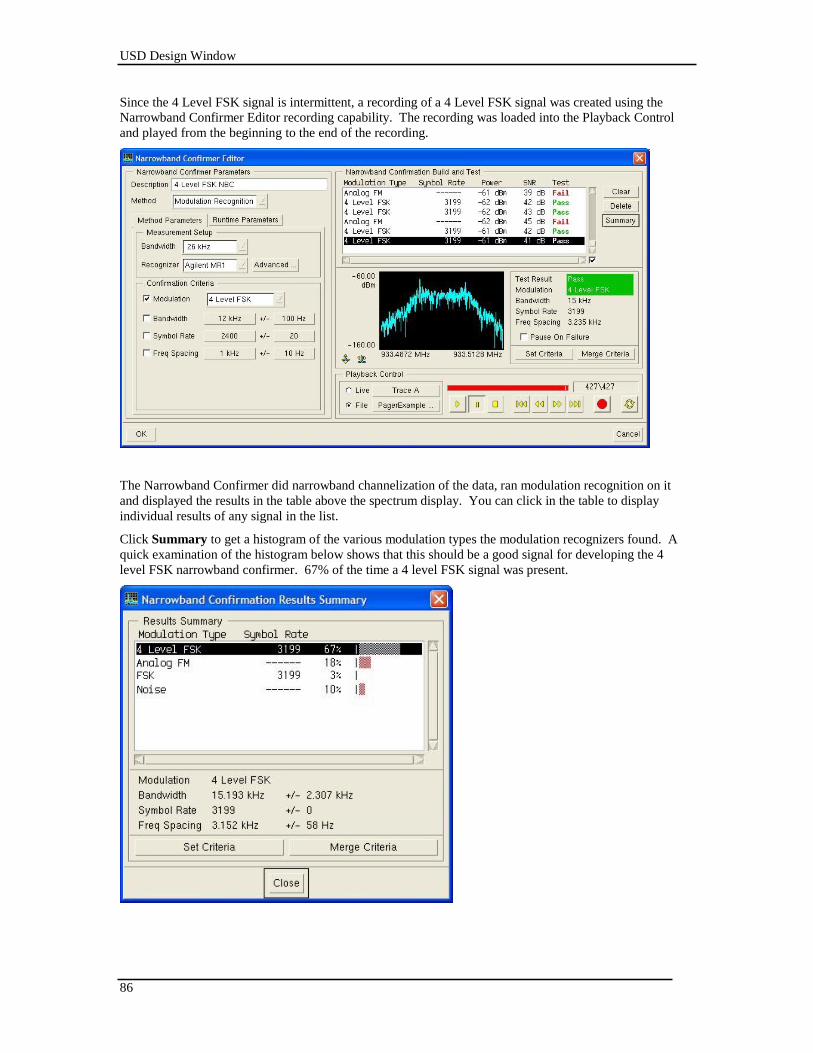
USD Design Window
86
Since the 4 Level FSK signal is intermittent, a recording of a 4 Level FSK signal was created using the
Narrowband Confirmer Editor recording capability. The recording was loaded into the Playback Control
and played from the beginning to the end of the recording.
The Narrowband Confirmer did narrowband channelization of the data, ran modulation recognition on it
and displayed the results in the table above the spectrum display. You can click in the table to display
individual results of any signal in the list.
Click Summary to get a histogram of the various modulation types the modulation recognizers found. A
quick examination of the histogram below shows that this should be a good signal for developing the 4
level FSK narrowband confirmer. 67% of the time a 4 level FSK signal was present.
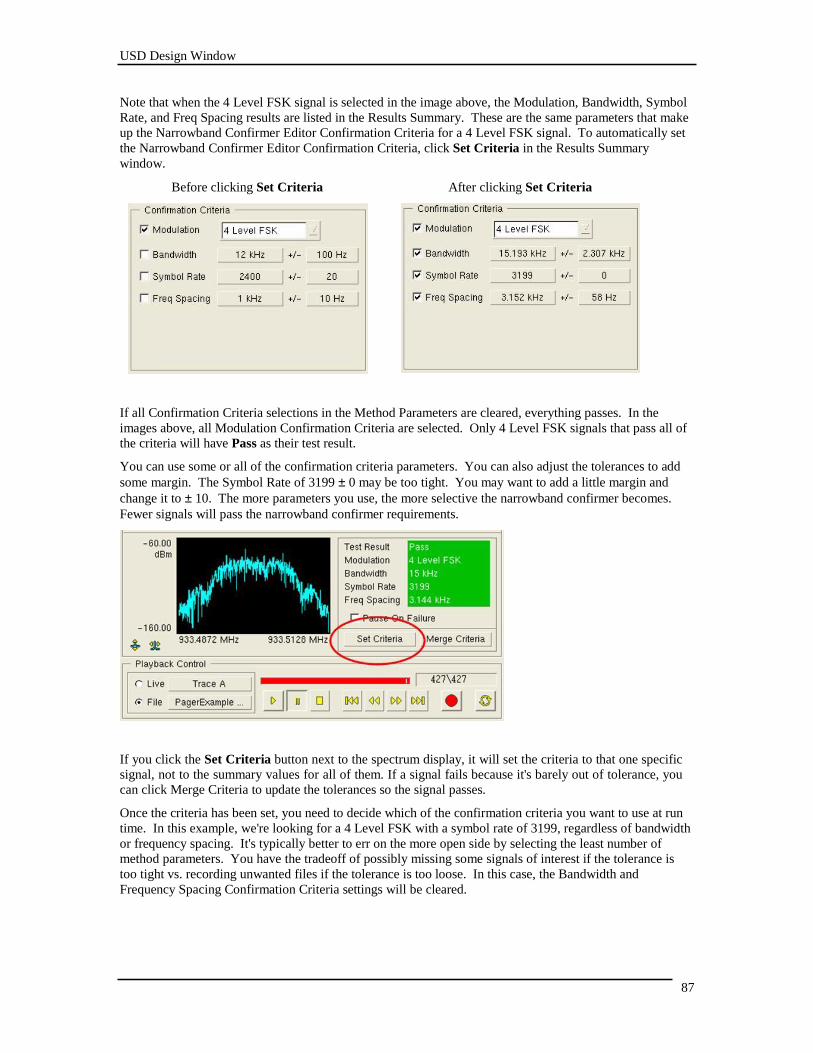
USD Design Window
87
Note that when the 4 Level FSK signal is selected in the image above, the Modulation, Bandwidth, Symbol
Rate, and Freq Spacing results are listed in the Results Summary. These are the same parameters that make
up the Narrowband Confirmer Editor Confirmation Criteria for a 4 Level FSK signal. To automatically set
the Narrowband Confirmer Editor Confirmation Criteria, click Set Criteria in the Results Summary
window.
Before clicking Set Criteria After clicking Set Criteria
If all Confirmation Criteria selections in the Method Parameters are cleared, everything passes. In the
images above, all Modulation Confirmation Criteria are selected. Only 4 Level FSK signals that pass all of
the criteria will have Pass as their test result.
You can use some or all of the confirmation criteria parameters. You can also adjust the tolerances to add
some margin. The Symbol Rate of 3199 ± 0 may be too tight. You may want to add a little margin and
change it to ± 10. The more parameters you use, the more selective the narrowband confirmer becomes.
Fewer signals will pass the narrowband confirmer requirements.
If you click the Set Criteria button next to the spectrum display, it will set the criteria to that one specific
signal, not to the summary values for all of them. If a signal fails because it's barely out of tolerance, you
can click Merge Criteria to update the tolerances so the signal passes.
Once the criteria has been set, you need to decide which of the confirmation criteria you want to use at run
time. In this example, we're looking for a 4 Level FSK with a symbol rate of 3199, regardless of bandwidth
or frequency spacing. It's typically better to err on the more open side by selecting the least number of
method parameters. You have the tradeoff of possibly missing some signals of interest if the tolerance is
too tight vs. recording unwanted files if the tolerance is too loose. In this case, the Bandwidth and
Frequency Spacing Confirmation Criteria settings will be cleared.
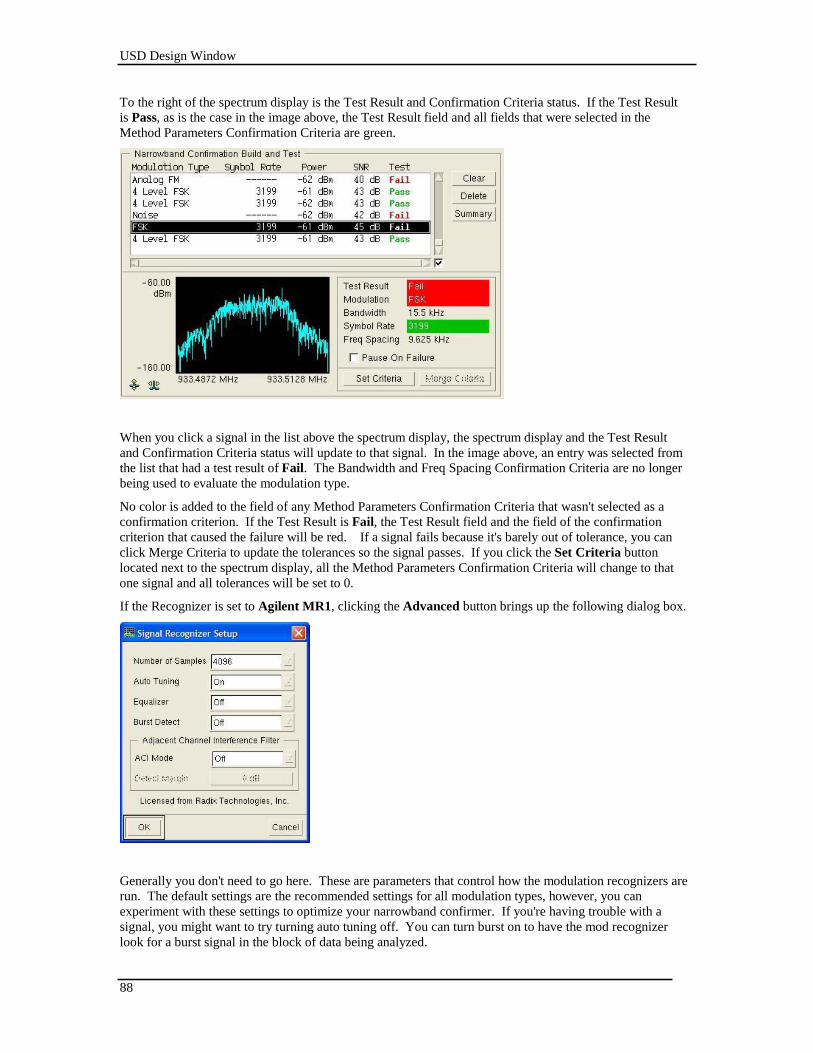
USD Design Window
88
To the right of the spectrum display is the Test Result and Confirmation Criteria status. If the Test Result
is Pass, as is the case in the image above, the Test Result field and all fields that were selected in the
Method Parameters Confirmation Criteria are green.
When you click a signal in the list above the spectrum display, the spectrum display and the Test Result
and Confirmation Criteria status will update to that signal. In the image above, an entry was selected from
the list that had a test result of Fail. The Bandwidth and Freq Spacing Confirmation Criteria are no longer
being used to evaluate the modulation type.
No color is added to the field of any Method Parameters Confirmation Criteria that wasn't selected as a
confirmation criterion. If the Test Result is Fail, the Test Result field and the field of the confirmation
criterion that caused the failure will be red. If a signal fails because it's barely out of tolerance, you can
click Merge Criteria to update the tolerances so the signal passes. If you click the Set Criteria button
located next to the spectrum display, all the Method Parameters Confirmation Criteria will change to that
one signal and all tolerances will be set to 0.
If the Recognizer is set to Agilent MR1, clicking the Advanced button brings up the following dialog box.
Generally you don't need to go here. These are parameters that control how the modulation recognizers are
run. The default settings are the recommended settings for all modulation types, however, you can
experiment with these settings to optimize your narrowband confirmer. If you're having trouble with a
signal, you might want to try turning auto tuning off. You can turn burst on to have the mod recognizer
look for a burst signal in the block of data being analyzed.
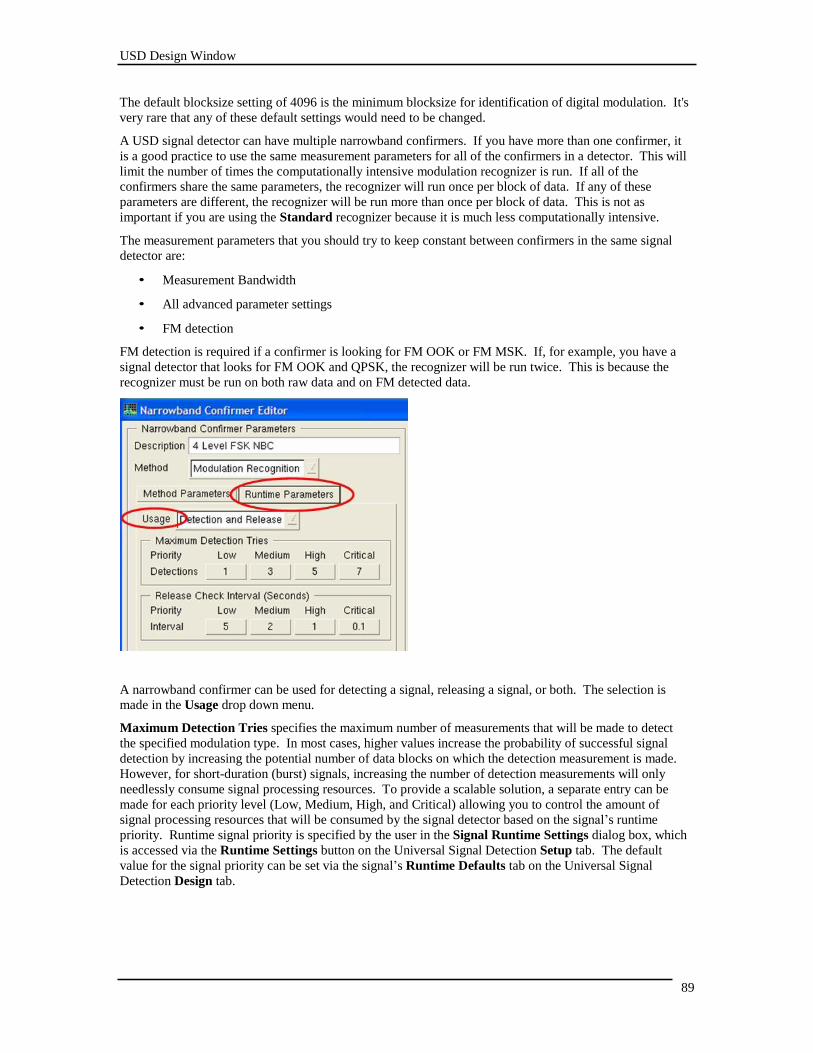
USD Design Window
89
The default blocksize setting of 4096 is the minimum blocksize for identification of digital modulation. It's
very rare that any of these default settings would need to be changed.
A USD signal detector can have multiple narrowband confirmers. If you have more than one confirmer, it
is a good practice to use the same measurement parameters for all of the confirmers in a detector. This will
limit the number of times the computationally intensive modulation recognizer is run. If all of the
confirmers share the same parameters, the recognizer will run once per block of data. If any of these
parameters are different, the recognizer will be run more than once per block of data. This is not as
important if you are using the Standard recognizer because it is much less computationally intensive.
The measurement parameters that you should try to keep constant between confirmers in the same signal
detector are:
• Measurement Bandwidth
• All advanced parameter settings
• FM detection
FM detection is required if a confirmer is looking for FM OOK or FM MSK. If, for example, you have a
signal detector that looks for FM OOK and QPSK, the recognizer will be run twice. This is because the
recognizer must be run on both raw data and on FM detected data.
A narrowband confirmer can be used for detecting a signal, releasing a signal, or both. The selection is
made in the Usage drop down menu.
Maximum Detection Tries specifies the maximum number of measurements that will be made to detect
the specified modulation type. In most cases, higher values increase the probability of successful signal
detection by increasing the potential number of data blocks on which the detection measurement is made.
However, for short-duration (burst) signals, increasing the number of detection measurements will only
needlessly consume signal processing resources. To provide a scalable solution, a separate entry can be
made for each priority level (Low, Medium, High, and Critical) allowing you to control the amount of
signal processing resources that will be consumed by the signal detector based on the signal’s runtime
priority. Runtime signal priority is specified by the user in the Signal Runtime Settings dialog box, which
is accessed via the Runtime Settings button on the Universal Signal Detection Setup tab. The default
value for the signal priority can be set via the signal’s Runtime Defaults tab on the Universal Signal
Detection Design tab.
USD Design Window
90
Release Check Interval is used as a release criterion during signal recording when Signal is the Release
Criteria selection in the signal detector's Runtime Settings. Once the specified modulation type is detected
and the signal is being recorded, the Release Check Interval tells the narrowband confirmer how often to
check to see if the modulation type is still active. When the narrowband confirmer determines the
modulation type is no longer active for the period of time specified in the Signal Release Criteria, the
recording will stop.
In most cases, using the Release Check Interval is not the recommended approach. Using narrowband
confirmers for measuring absence of a modulation type as your release criteria takes up valuable signal
processing resources. If you can use the other Release Criteria selections in the Default Runtime Settings
dialog box instead of using the Release Check Interval, you'll free up DSP resources for other tasks. The
only recommended time you should use the Release Check Interval is when the methods in the Runtime
Settings dialog box don't work on the signal of interest.
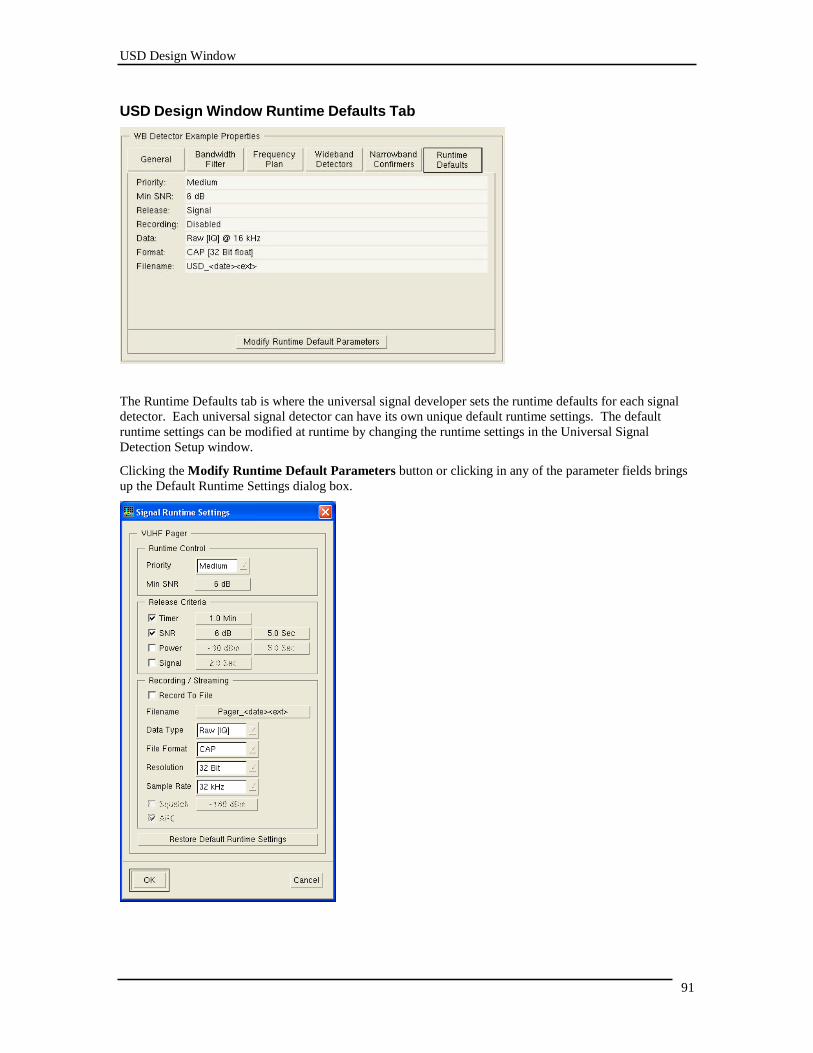
USD Design Window
91
USD Design Window Runtime Defaults Tab
The Runtime Defaults tab is where the universal signal developer sets the runtime defaults for each signal
detector. Each universal signal detector can have its own unique default runtime settings. The default
runtime settings can be modified at runtime by changing the runtime settings in the Universal Signal
Detection Setup window.
Clicking the Modify Runtime Default Parameters button or clicking in any of the parameter fields brings
up the Default Runtime Settings dialog box.
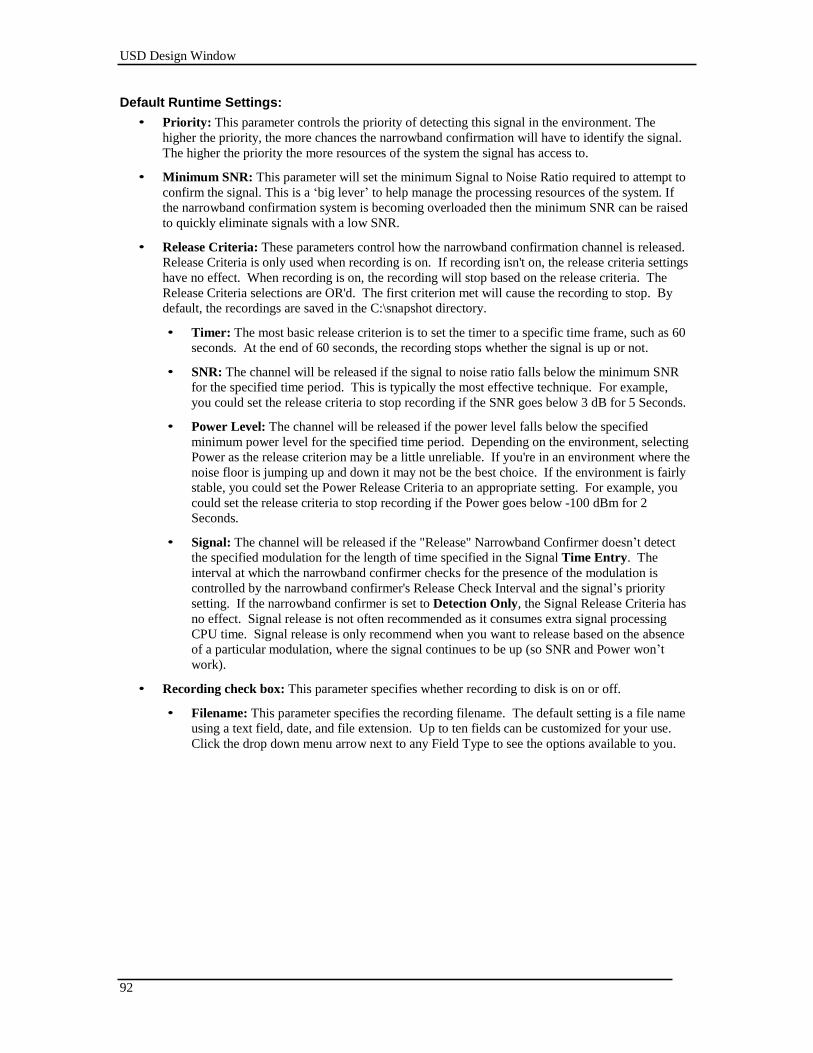
USD Design Window
92
Default Runtime Settings:
• Priority: This parameter controls the priority of detecting this signal in the environment. The
higher the priority, the more chances the narrowband confirmation will have to identify the signal.
The higher the priority the more resources of the system the signal has access to.
• Minimum SNR: This parameter will set the minimum Signal to Noise Ratio required to attempt to
confirm the signal. This is a ‘big lever’ to help manage the processing resources of the system. If
the narrowband confirmation system is becoming overloaded then the minimum SNR can be raised
to quickly eliminate signals with a low SNR.
• Release Criteria: These parameters control how the narrowband confirmation channel is released.
Release Criteria is only used when recording is on. If recording isn't on, the release criteria settings
have no effect. When recording is on, the recording will stop based on the release criteria. The
Release Criteria selections are OR'd. The first criterion met will cause the recording to stop. By
default, the recordings are saved in the C:\snapshot directory.
• Timer: The most basic release criterion is to set the timer to a specific time frame, such as 60
seconds. At the end of 60 seconds, the recording stops whether the signal is up or not.
• SNR: The channel will be released if the signal to noise ratio falls below the minimum SNR
for the specified time period. This is typically the most effective technique. For example,
you could set the release criteria to stop recording if the SNR goes below 3 dB for 5 Seconds.
• Power Level: The channel will be released if the power level falls below the specified
minimum power level for the specified time period. Depending on the environment, selecting
Power as the release criterion may be a little unreliable. If you're in an environment where the
noise floor is jumping up and down it may not be the best choice. If the environment is fairly
stable, you could set the Power Release Criteria to an appropriate setting. For example, you
could set the release criteria to stop recording if the Power goes below -100 dBm for 2
Seconds.
• Signal: The channel will be released if the "Release" Narrowband Confirmer doesn’t detect
the specified modulation for the length of time specified in the Signal Time Entry. The
interval at which the narrowband confirmer checks for the presence of the modulation is
controlled by the narrowband confirmer's Release Check Interval and the signal’s priority
setting. If the narrowband confirmer is set to Detection Only, the Signal Release Criteria has
no effect. Signal release is not often recommended as it consumes extra signal processing
CPU time. Signal release is only recommend when you want to release based on the absence
of a particular modulation, where the signal continues to be up (so SNR and Power won’t
work).
• Recording check box: This parameter specifies whether recording to disk is on or off.
• Filename: This parameter specifies the recording filename. The default setting is a file name
using a text field, date, and file extension. Up to ten fields can be customized for your use.
Click the drop down menu arrow next to any Field Type to see the options available to you.
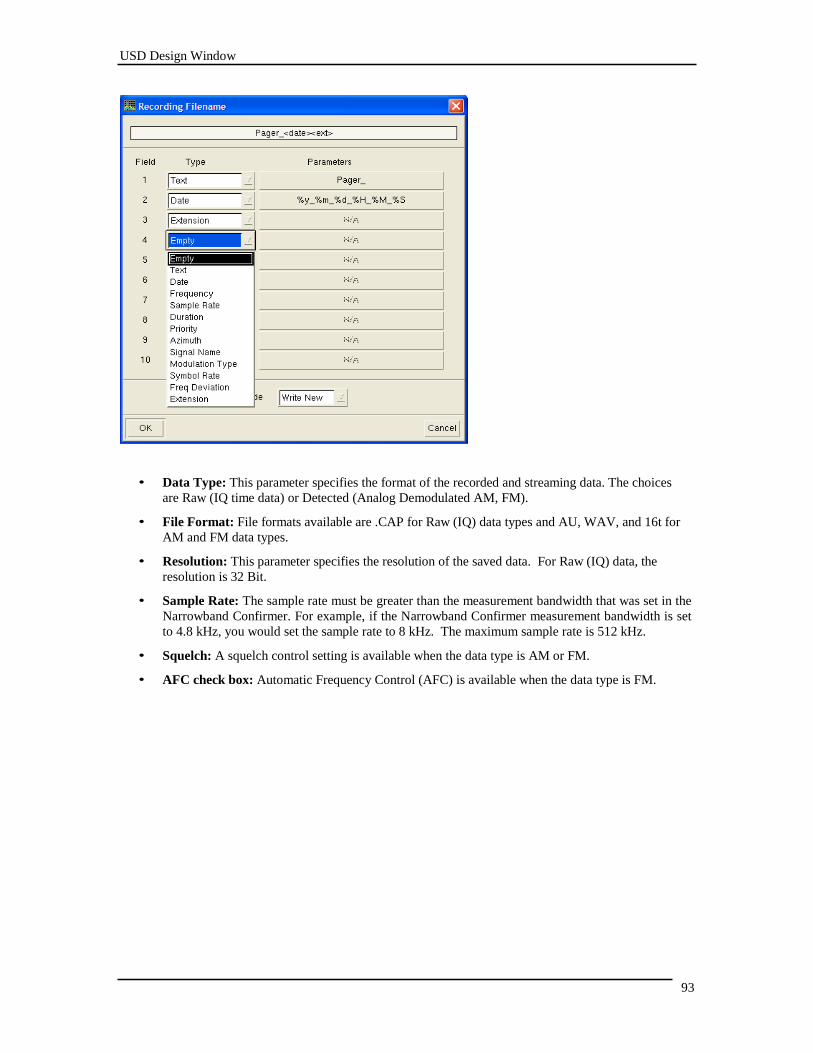
USD Design Window
93
• Data Type: This parameter specifies the format of the recorded and streaming data. The choices
are Raw (IQ time data) or Detected (Analog Demodulated AM, FM).
• File Format: File formats available are .CAP for Raw (IQ) data types and AU, WAV, and 16t for
AM and FM data types.
• Resolution: This parameter specifies the resolution of the saved data. For Raw (IQ) data, the
resolution is 32 Bit.
• Sample Rate: The sample rate must be greater than the measurement bandwidth that was set in the
Narrowband Confirmer. For example, if the Narrowband Confirmer measurement bandwidth is set
to 4.8 kHz, you would set the sample rate to 8 kHz. The maximum sample rate is 512 kHz.
• Squelch: A squelch control setting is available when the data type is AM or FM.
• AFC check box: Automatic Frequency Control (AFC) is available when the data type is FM.
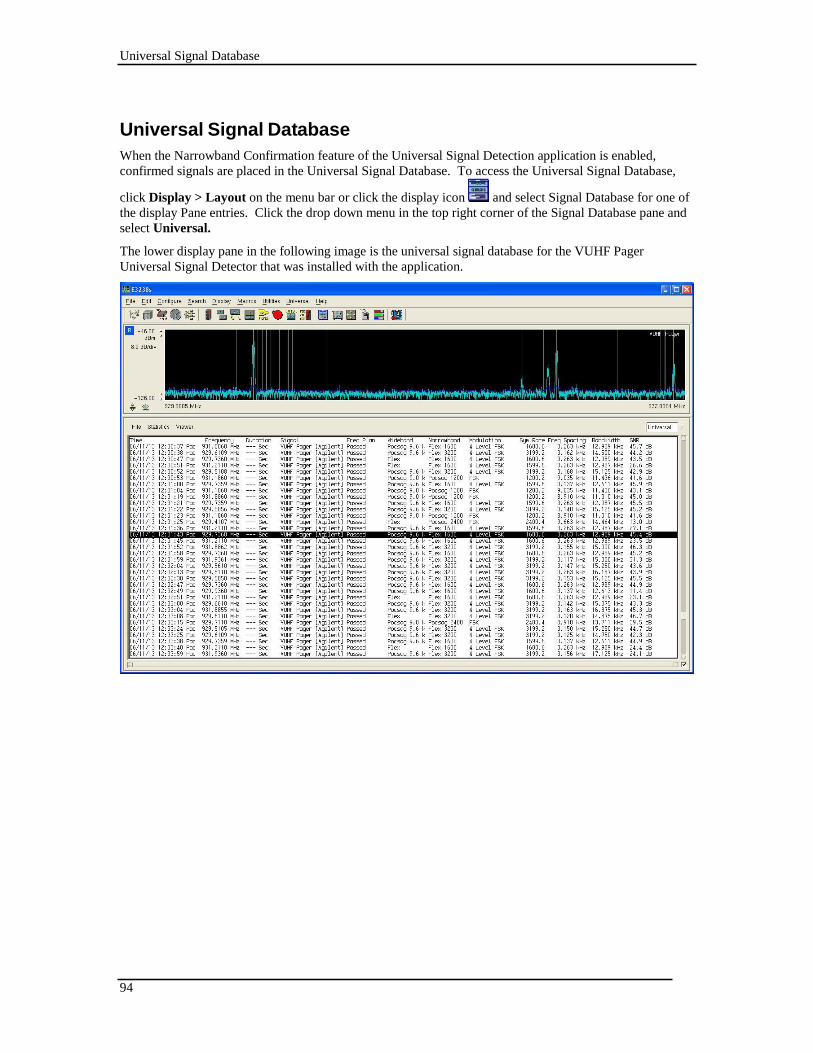
94
Universal Signal Database
Universal Signal Database
When the Narrowband Confirmation feature of the Universal Signal Detection application is enabled,
confirmed signals are placed in the Universal Signal Database. To access the Universal Signal Database,
click Display > Layout on the menu bar or click the display icon and select Signal Database for one of
the display Pane entries. Click the drop down menu in the top right corner of the Signal Database pane and
select Universal.
The lower display pane in the following image is the universal signal database for the VUHF Pager
Universal Signal Detector that was installed with the application.
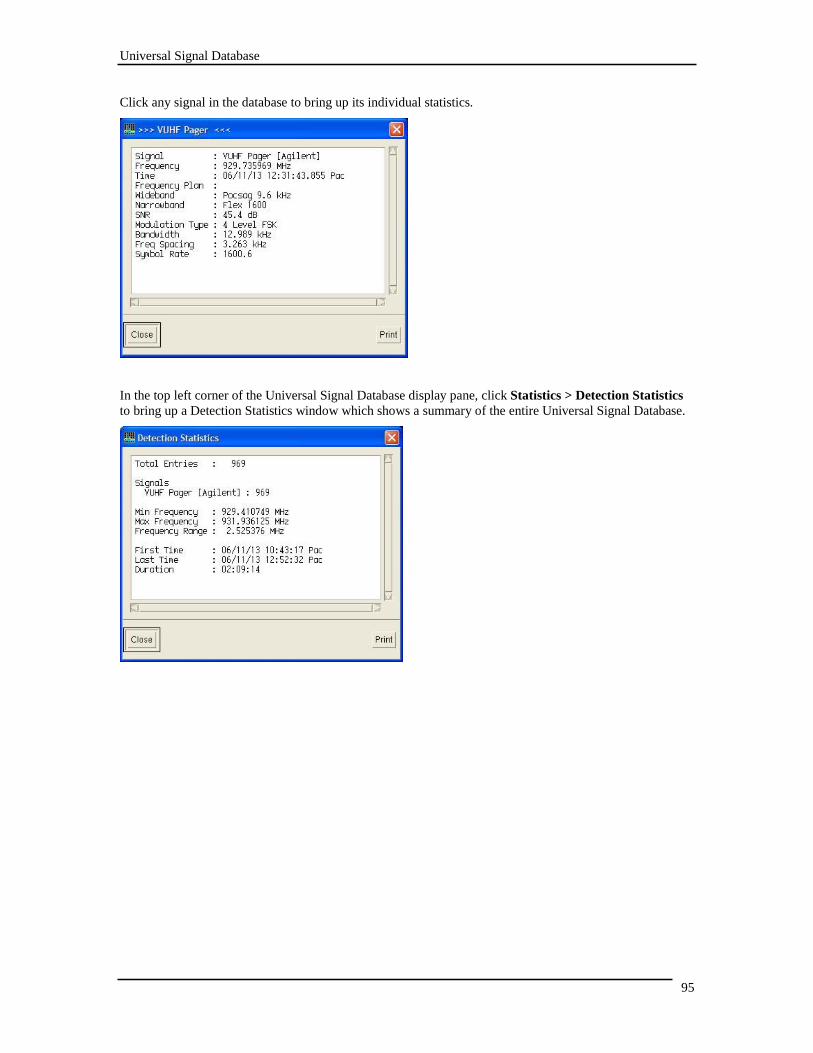
95
Universal Signal Database
Click any signal in the database to bring up its individual statistics.
In the top left corner of the Universal Signal Database display pane, click Statistics > Detection Statistics
to bring up a Detection Statistics window which shows a summary of the entire Universal Signal Database.
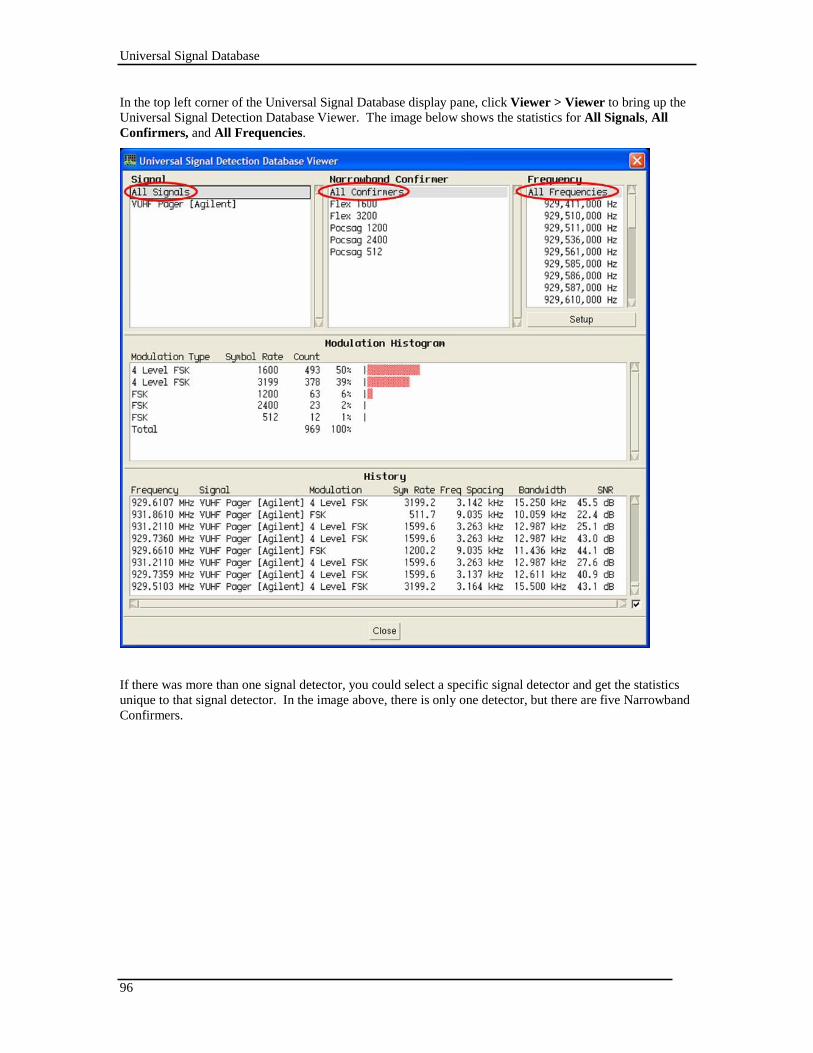
96
Universal Signal Database
In the top left corner of the Universal Signal Database display pane, click Viewer > Viewer to bring up the
Universal Signal Detection Database Viewer. The image below shows the statistics for All Signals, All
Confirmers, and All Frequencies.
If there was more than one signal detector, you could select a specific signal detector and get the statistics
unique to that signal detector. In the image above, there is only one detector, but there are five Narrowband
Confirmers.
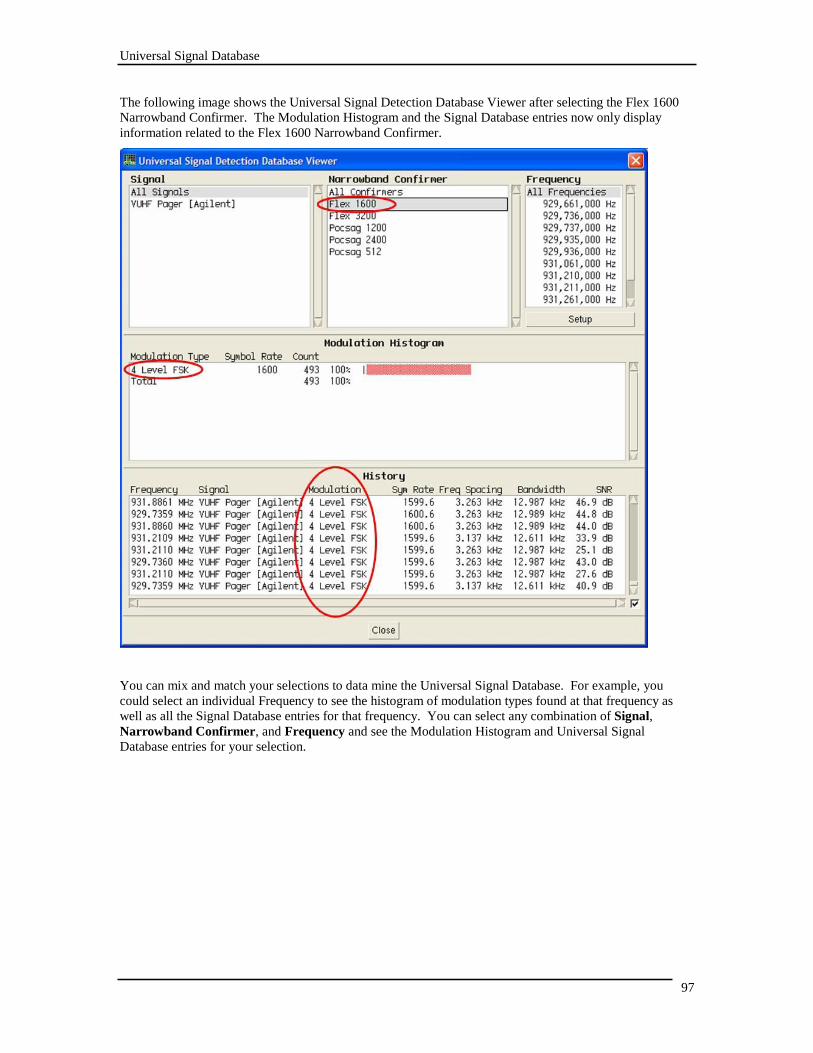
97
Universal Signal Database
The following image shows the Universal Signal Detection Database Viewer after selecting the Flex 1600
Narrowband Confirmer. The Modulation Histogram and the Signal Database entries now only display
information related to the Flex 1600 Narrowband Confirmer.
You can mix and match your selections to data mine the Universal Signal Database. For example, you
could select an individual Frequency to see the histogram of modulation types found at that frequency as
well as all the Signal Database entries for that frequency. You can select any combination of Signal,
Narrowband Confirmer, and Frequency and see the Modulation Histogram and Universal Signal
Database entries for your selection.
98
USD Programming Guide
USD Programming Guide
Overview
The N6820ES USD Data Streaming feature provides the capability to deliver multiple channels of
narrowband IQ time data, FM demodulated data, or demodulated data to an external processing workstation.
Data is delivered to the processing workstation via a LAN connection.
The narrowband data stream can be started in two ways. The first method is to use a USD signal detector to
detect a signal of interest using wideband detectors and narrowband confirmers. After a signal has been
found, the USD system will stream the narrowband data over the LAN interface. Data will continue to flow
until the release criteria specified in the USD signal detector has been met. The user can also send a
command to stop the data stream.
The second method to start a narrowband data stream is to task a channel to stream data at a fixed
frequency. This bypasses the USD wideband detectors and narrowband confirmers and starts data
streaming immediately.
Client programs receive data by subscribing to a USD signal detector stream. A client can subscribe to all
USD detectors or to one or more USD detectors by name. Multiple USD clients are supported, and the
clients can run on different workstations.
The USD system can be configured with signal delay. This allows the client processing workstation to
obtain narrowband time data collected prior to the channel assignment time.
99
USD Programming Guide
Configuring the Streaming Server
Follow the steps below to configure USD streaming data server and verify that it is working properly. This
procedure can be performed with or without hardware.
1. The setup program should have added the following line to your services file (typically
C:\WINDOWS\system32\drivers\etc\services):
E3238sUSD 7014/tcp
If this line is not in your services file, use an editor such as Notepad to add it.
2. Configure the N6820ES socket capabilities. Modify the following lines in the system
configuration file c:\e3238s\e3238s.cfg (typically) :
socketServer Enabled
maxServices 2
maxClientSockets 5
socketServerTimerInterval 2
3. In the e3238s.cfg file, add the following line to specify how many clients you will have connected
to the USD server (change the XX to the signal number of the USD signal) and control the LAN
socket buffer sizes:
signalXX.args: -maxClients 1
-maxClients <number> Change the maximum number of e3238sUsd
server client sockets to <number>. A value of
0 turns off streaming. The maximum number
of clients is 32.
-sendBufferSize <number> Change the size of the LAN socket send buffer.
The default send buffer size is 1,048,576 bytes.
The minimum size is 32,768 bytes. The
maximum size is system dependent.
-recvBufferSize <number> Change the size of the LAN socket receive
buffer. The default receive buffer size is
32,768 bytes. The minimum size is 32,768
bytes. The maximum size is system dependent.
4. For this verification we will assume that the configuration file already works with your hardware
and that the USD system is already configured.
5. Start the N6820ES program and wait for the initialization process to complete.
6. Using the USD system dialog box Setup tab, enable one or more signal detectors. For this example,
we will enable the UVHF Pager.Agilent and UVHF NADC.Agilent signals.
USD Programming Guide
100
On the same workstation where the N6820ES system is executing, open a Command Prompt window and
execute the commands:
cd c:\e3238s\usd\examples
streamingClient
You should see the prompt: Enter command:
7. In the command prompt window type the command: info
Below is an example of the output you should see; the output on your workstation will depend on
the number of narrowband channels you have configured for USD and the USD signal detectors
you have enabled.
Info Num USD channels = 16
Num USD signals = 2
Max bytes/sec = 4000000
Current bytes/sec = 0
Signal Name = VUHF NADC.Agilent
Data type = IQ (Raw)
Resolution = 32 bit integer
Sample Rate = 64000.000000 Hz
Signal Name = VUHF Pager.Agilent
Data type = IQ (Raw)
Resolution = 32 bit integer
Sample Rate = 32000.000000 Hz
Subscribed to all = No
Num subscriptions = 0
8. This completes the verification procedure.
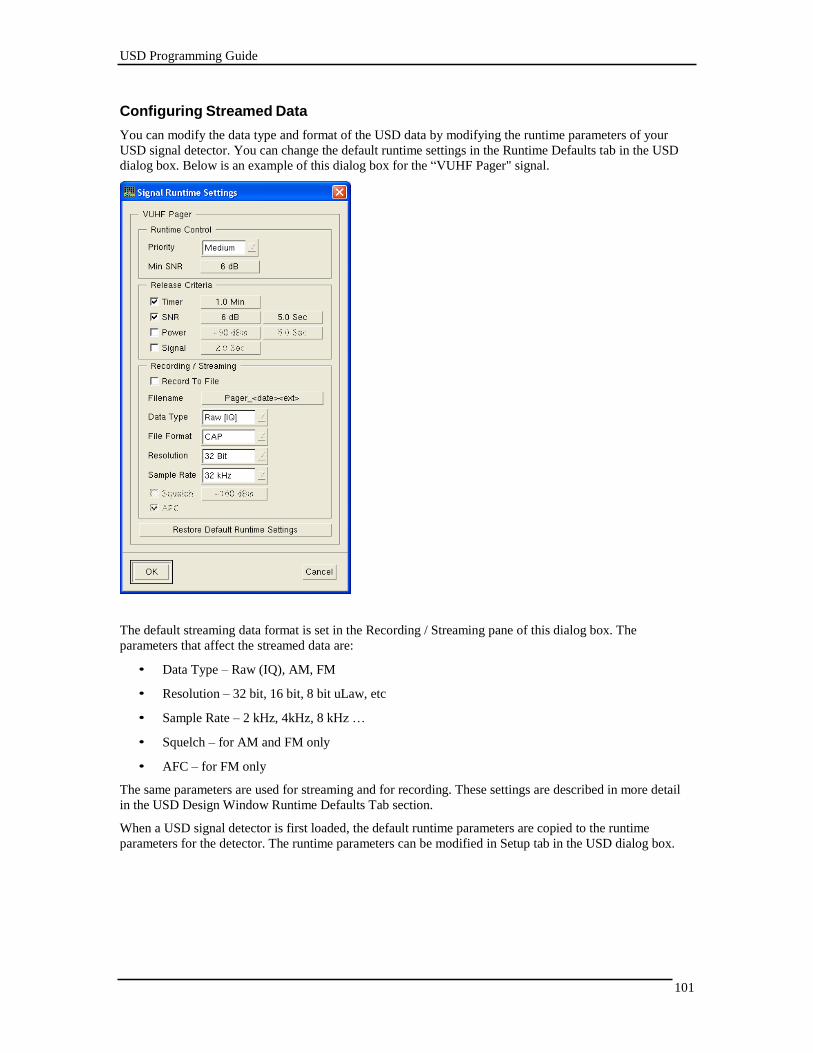
USD Programming Guide
101
Configuring Streamed Data
You can modify the data type and format of the USD data by modifying the runtime parameters of your
USD signal detector. You can change the default runtime settings in the Runtime Defaults tab in the USD
dialog box. Below is an example of this dialog box for the “VUHF Pager" signal.
The default streaming data format is set in the Recording / Streaming pane of this dialog box. The
parameters that affect the streamed data are:
• Data Type – Raw (IQ), AM, FM
• Resolution – 32 bit, 16 bit, 8 bit uLaw, etc
• Sample Rate – 2 kHz, 4kHz, 8 kHz …
• Squelch – for AM and FM only
• AFC – for FM only
The same parameters are used for streaming and for recording. These settings are described in more detail
in the USD Design Window Runtime Defaults Tab section.
When a USD signal detector is first loaded, the default runtime parameters are copied to the runtime
parameters for the detector. The runtime parameters can be modified in Setup tab in the USD dialog box.
USD Programming Guide
102
USD Server
The USD system provides a server that the processing workstation client application uses to manage USD
channels and to receive narrowband time data through a network connection.
The server is accessed though the e3238sUsd service defined in the services file. This service file entry is
added during the USD software installation:
e3238sUsd 7014/TCP
The location of the services file depends on the version of Window OS running on the N6820ES host
workstation. On Window2000 the services file is at C:\WINNT\system32\drivers\etc\services and on
WindowsXP at C:\WINDOWS\system32\drivers\etc\services.
The client application software that runs on the processing workstation must first establish a socket
connection to the e3238sUsd service on the N6820ES workstation. Once connected, the client application
can send ASCII command strings to the server. This socket connection will also be used to deliver data to
the processing workstation.
USD Data Streams
When a signal is detected by the USD system, the system checks to see if any clients are subscribed to that
detector. If there are any subscribers, a USD data stream is started. Each data stream starts with the
E3238S_USD_DATA_BEGIN message. This message contains a streamId identifying the data stream, as
well as signal detector information (USD detector name, measured center frequency, modulation type, etc).
The narrowband IQ data is sent in a E3238S_USD_DATA message. This message contains the same
streamId as in the associated the E3238S_USD_START message. A sequence number is also sent in this
message.
Once a data stream session starts, data will be delivered to subscribers until the channel is released by one
of the following:
• The signal release criteria (Timer, SNR, Signal or Power) are met.
• The N6820ES receives a STOPSTREAM command for the session from a USD client.
• The narrowband channel is released by some other means (such as the search system sweep being
stopped).
The USD system can detect multiple signals per channel assignment. This means that the worst-case
number of streaming sessions that can be active at one time is
(Number of USD channels) * (Number of enabled USD signals)
USD Programming Guide
103
USD Server Commands
A number of commands are supported by the USD server to allow the processing workstation to subscribe
to data streams, assign channels to stream data, query info, and stop data streams.
• INFO
The INFO command is used to query the current USD setup. The response will be
E3238S_USD_INFO structure. This structure contains information about the current USD setup,
including number of channels, number of USD signal detectors loaded, and the names of the
loaded signal detectors.
• SUBSCRIBE: [name.author]
The SUBSCRIBE command is used to subscribe to USD data streams. The [name.author]
specifies the name and author of the signal detector data stream you want to subscribe to. You
can omit [name.author] to subscribe to the data streams from all USD signal detectors. No error
is returned if you subscribe to a detector that is not enabled.
Examples:
Subscribe to VUHF Pager.Agilent and VUHF NADC.Agilent:
SUBSCRIBE: VUHF Pager.Agilent
SUBSCRIBE: VUHF NADC.Agilent
Subscribe to all USD signals:
SUBSCRIBE
• UNSUBSCRIBE: [name.author]
The UNSUBSCRIBE command is used to unsubscribe from USD data streams. If the
[name.author] parameter is omitted, all subscriptions for the client will be removed. No error is
returned if you unsubscribe from a detector that does not have a subscription.
Examples:
Unsubscribe from VUHF Pager.Agilent and VUHF NADC.Agilent:
UNSUBSCRIBE: VUHF Pager.Agilent
UNSUBSCRIBE: VUHF NADC.Agilent
Subscribe from all USD signals:
UNSUBSCRIBE
USD Programming Guide
104
• STOPSTREAM: <StreamId>
The STOP command is used to stop a stream of data from the USD server. StreamId is an integer
that is sent from the server to the client in the E3238S_USD_START message.
Example:
Stop the data stream with StreamId 1076:
STOPSTREAM: 1076
• ASSIGN: <channel number>, <frequency>, <name.author> [, <name.author>…]
The ASSIGN command assigns the specified narrowband channel to specified frequency. The
narrowband confirmers for the specified detector (or detectors) are then run at the assigned
frequency. If the channel is locked (see the LOCK command), the confirmers will be run
continuously at the assigned frequency.
<channel number> Channel number to assign (1 to MaxChannels)
<frequency> Center frequency of the signal to process in Hz.
<name.author> Name and author of the USD detector.
Example:
Test for the HF BPSK 1800 Baud and HF BPSK 2400 Baud signals at
9.6 MHz on channel 4:
Assign 4, 9600000, HF BPSK 1800 Baud.Agilent, HF BPSK 2400 Baud.Agilent
• RELEASE: <channel number>
Release a channel. If the channel is currently streaming data, this will terminate all data streams
on that channel.
<channel number> Channel number to release (1 to MaxChannels)
• LOCK: <channel number>
Lock the specified channel. This is used with the ASSIGN command to test for a specified
signal.
<channel number> Channel number to lock (1 to MaxChannels)
• UNLOCK: <channel number>
Unlock the specified channel
<channel number> Channel number to unlock (1 to MaxChannels)
USD Programming Guide
105
• STREAM: <channel number>, <frequency>, <name.author> [,duration] [,sample rate] [,data type]
[,data resolution]
The STREAM command bypasses the USD wideband detection and narrowband confirmation
and starts streaming data immediately. If the sample rate is not specified, the current runtime
parameters will be used for the streaming data properties (sample rate, data type and data
resolution). If the sample rate is not specified, the <name.author> parameter must specify a
loaded USD signal.
If the sample rate is specified in the STREAM command, the <name.author> parameter does not
have to specify a loaded USD signal. The string that is specified by the <name.author> parameter
will be sent in the data stream messages.
For IQ data, only the 32 bit resolution is supported. For AM and FM data, the 16 bit resolution
and the 8 bit resolutions are supported.
<channel number> Channel number to assign (1 to MaxChannels)
<frequency> Center frequency of the signal to process in Hz.
<name.author> Name and author of the USD signal detector.
[duration] Duration in seconds. Default is 0 (infinite duration).
[sample rate] Sample rate in samples/second. Unsupported sample rates
will be set to next highest supported rate.
[data type] E3238sUsdDataType value as an integer. Default is 0 (IQ).
[data resolution] E3238sUsdResolution value as an integer. Default is 4 (32
bits) for IQ data, and 3 (16 bits) for AM or FM data.
• SPEWUSDENERGYALARM: <ON|OFF>
This command turns the USD energy alarm spew on or off. If the USD energy alarm spew is on,
the USD system will send an energy alarm spew message when a USD wideband detector detects
a signal. See the description of the E3238sUsdTag_energyAlarmSpew message below for
details about the energy alarm spew message.
Example
Turn the energy alarm spew on:
Spewusdenergyalarm: on
USD Programming Guide
106
Shorthand versions consisting of the first two letters of each command are accepted (for the
UNSUBSCRIBE and UNLOCK commands, the short forms are ULS and UNL). For example, ‘ST’ is the
same as ‘STREAM’. The command is case independent. For compatibility with N6820ES commands you
can optionally have a colon (“:”) following the command word. Command parameters must be separated
by spaces or commas.
The following commands are equivalent:
• STREAM: 5, 10000000, UVHF Pager.Agilent
• Stream 5, 10000000, UVHF Pager.Agilent
• st 5, 10000000, UVHF Pager.Agilent
Command Passthrough
If the USD server receives a command that is not in its command set, the command will be passed through
to the N6820ES server. This allows you to control the N6820ES using a single connection. N6820ES spews
enabled via the USD server will be delivered by the USD server.
Note:
For a list of N6820ES server commands, see the N6820ES Command Reference.
USD Programming Guide
107
USD Data Output Format
The USD server outputs narrowband complex time data to external processing workstations. This section
defines the format of information delivered to the processing workstation over the LAN or FPDP
connection. This interface definition between the USD server and the processing workstation is
documented in the c:/E3238s/usd/e3238sUsd.h header file.
Message Definitions
A message consists of a header followed by a payload. The message header is two 32-bit integers with the
first integer indicating the size of the message payload (in bytes) and the second integer identifying the type
of the message. The message payload depends on the type of message. All binary data is sent in network
byte order.
The message header is:
unsigned int length; /* length of payload in bytes */
unsigned int tag; /* tag identifies payload type
The USD server will produce six different messages each with a unique payload. The six tags are defined
by the E3238sUsdTag enum:
typedef enum {
E3238sUsdTag_dataBegin = 0x4567,
E3238sUsdTag_data,
E3238sUsdTag_dataEnd,
E3238sUsdTag_info,
E3238sUsdTag_error,
E3238sUsdTag_terminated
E3238sUsdTag_energyAlarmSpew
} E3238sUsdTag;
USD Programming Guide
108
Following the message header is the message payload, which is typically a data structure. The following
table tells you which data structure is sent for each message tag.
Tag Payload data structure
E3238sUsdTag_dataBegin E3238S_USD_DATA_BEGIN
E3238sUsdTag_data E3238S_USD_DATA
E3238sUsdTag_dataEnd E3238S_USD_DATA_END
E3238sUsdTag_info E3238S_USD_INFO
E3238sUsdTag_error E3238S_USD_ERROR
E3238sUsdTag_terminated None
E3238sUsdTag_energyAlarmSpew E3238S_USD_ENERGY_ALARM_SPEW
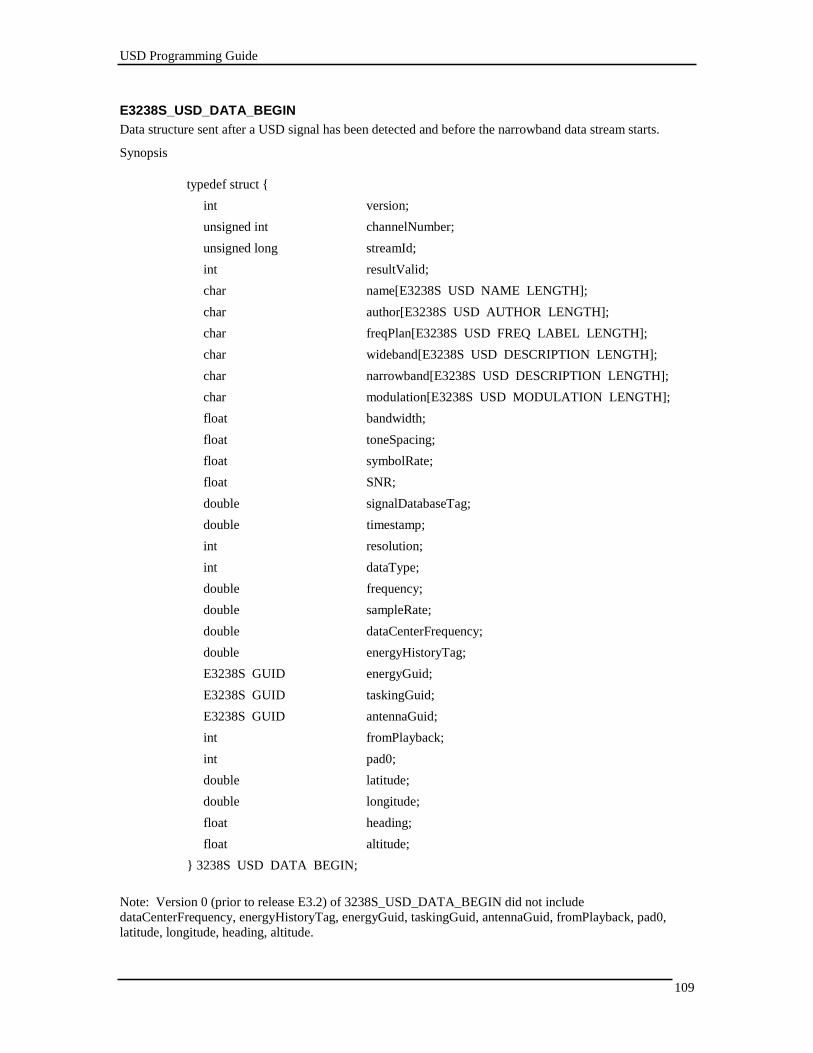
USD Programming Guide
109
E3238S_USD_DATA_BEGIN
Data structure sent after a USD signal has been detected and before the narrowband data stream starts.
Synopsis
typedef struct {
int version;
unsigned int channelNumber;
unsigned long streamId;
int resultValid;
char name[E3238S USD NAME LENGTH];
char author[E3238S USD AUTHOR LENGTH];
char freqPlan[E3238S USD FREQ LABEL LENGTH];
char wideband[E3238S USD DESCRIPTION LENGTH];
char narrowband[E3238S USD DESCRIPTION LENGTH];
char modulation[E3238S USD MODULATION LENGTH];
float bandwidth;
float toneSpacing;
float symbolRate;
float SNR;
double signalDatabaseTag;
double timestamp;
int resolution;
int dataType;
double frequency;
double sampleRate;
double dataCenterFrequency;
double energyHistoryTag;
E3238S GUID energyGuid;
E3238S GUID taskingGuid;
E3238S GUID antennaGuid;
int fromPlayback;
int pad0;
double latitude;
double longitude;
float heading;
float altitude;
} 3238S USD DATA BEGIN;
Note: Version 0 (prior to release E3.2) of 3238S_USD_DATA_BEGIN did not include
dataCenterFrequency, energyHistoryTag, energyGuid, taskingGuid, antennaGuid, fromPlayback, pad0,
latitude, longitude, heading, altitude.
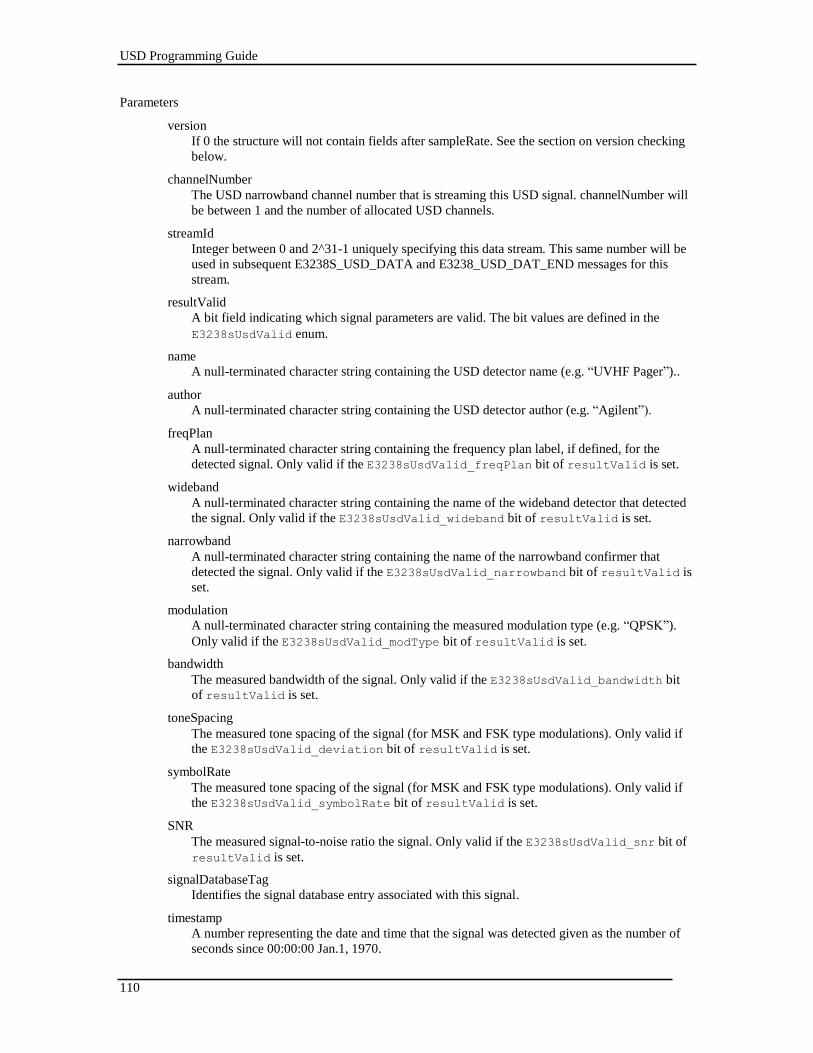
USD Programming Guide
110
Parameters
version
If 0 the structure will not contain fields after sampleRate. See the section on version checking
below.
channelNumber
The USD narrowband channel number that is streaming this USD signal. channelNumber will
be between 1 and the number of allocated USD channels.
streamId
Integer between 0 and 2^31-1 uniquely specifying this data stream. This same number will be
used in subsequent E3238S_USD_DATA and E3238_USD_DAT_END messages for this
stream.
resultValid
A bit field indicating which signal parameters are valid. The bit values are defined in the
E3238sUsdValid enum.
name
A null-terminated character string containing the USD detector name (e.g. “UVHF Pager”)..
author
A null-terminated character string containing the USD detector author (e.g. “Agilent”).
freqPlan
A null-terminated character string containing the frequency plan label, if defined, for the
detected signal. Only valid if the E3238sUsdValid_freqPlan bit of resultValid is set.
wideband
A null-terminated character string containing the name of the wideband detector that detected
the signal. Only valid if the E3238sUsdValid_wideband bit of resultValid is set.
narrowband
A null-terminated character string containing the name of the narrowband confirmer that
detected the signal. Only valid if the E3238sUsdValid_narrowband bit of resultValid is
set.
modulation
A null-terminated character string containing the measured modulation type (e.g. “QPSK”).
Only valid if the E3238sUsdValid_modType bit of resultValid is set.
bandwidth
The measured bandwidth of the signal. Only valid if the E3238sUsdValid_bandwidth bit
of resultValid is set.
toneSpacing
The measured tone spacing of the signal (for MSK and FSK type modulations). Only valid if
the E3238sUsdValid_deviation bit of resultValid is set.
symbolRate
The measured tone spacing of the signal (for MSK and FSK type modulations). Only valid if
the E3238sUsdValid_symbolRate bit of resultValid is set.
SNR
The measured signal-to-noise ratio the signal. Only valid if the E3238sUsdValid_snr bit of
resultValid is set.
signalDatabaseTag
Identifies the signal database entry associated with this signal.
timestamp
A number representing the date and time that the signal was detected given as the number of
seconds since 00:00:00 Jan.1, 1970.
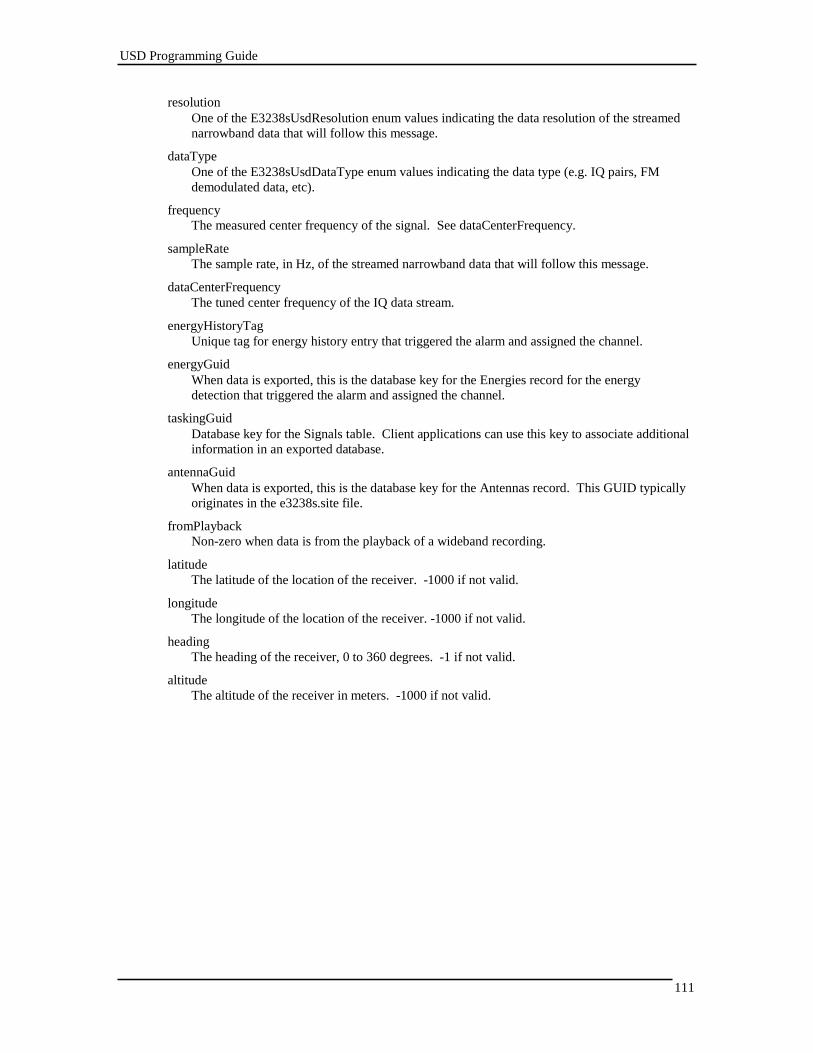
USD Programming Guide
111
resolution
One of the E3238sUsdResolution enum values indicating the data resolution of the streamed
narrowband data that will follow this message.
dataType
One of the E3238sUsdDataType enum values indicating the data type (e.g. IQ pairs, FM
demodulated data, etc).
frequency
The measured center frequency of the signal. See dataCenterFrequency.
sampleRate
The sample rate, in Hz, of the streamed narrowband data that will follow this message.
dataCenterFrequency
The tuned center frequency of the IQ data stream.
energyHistoryTag
Unique tag for energy history entry that triggered the alarm and assigned the channel.
energyGuid
When data is exported, this is the database key for the Energies record for the energy
detection that triggered the alarm and assigned the channel.
taskingGuid
Database key for the Signals table. Client applications can use this key to associate additional
information in an exported database.
antennaGuid
When data is exported, this is the database key for the Antennas record. This GUID typically
originates in the e3238s.site file.
fromPlayback
Non-zero when data is from the playback of a wideband recording.
latitude
The latitude of the location of the receiver. -1000 if not valid.
longitude
The longitude of the location of the receiver. -1000 if not valid.
heading
The heading of the receiver, 0 to 360 degrees. -1 if not valid.
altitude
The altitude of the receiver in meters. -1000 if not valid.
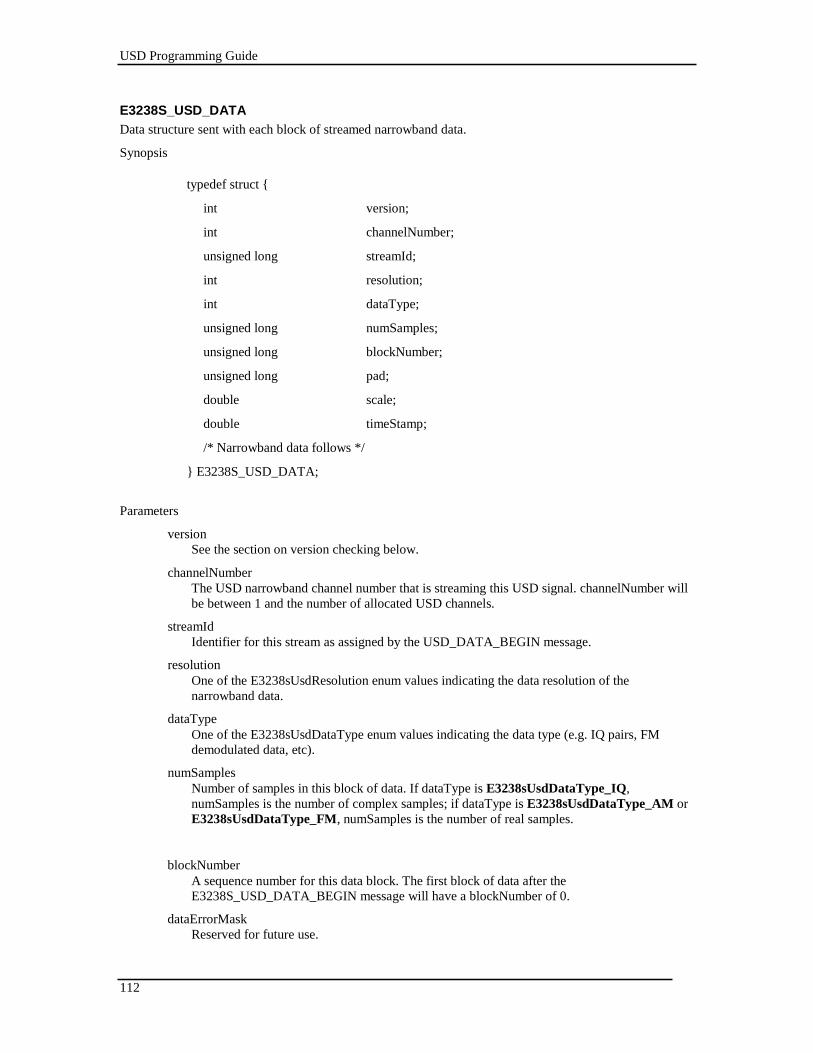
USD Programming Guide
112
E3238S_USD_DATA
Data structure sent with each block of streamed narrowband data.
Synopsis
typedef struct {
int version;
int channelNumber;
unsigned long streamId;
int resolution;
int dataType;
unsigned long numSamples;
unsigned long blockNumber;
unsigned long pad;
double scale;
double timeStamp;
/* Narrowband data follows */
} E3238S_USD_DATA;
Parameters
version
See the section on version checking below.
channelNumber
The USD narrowband channel number that is streaming this USD signal. channelNumber will
be between 1 and the number of allocated USD channels.
streamId
Identifier for this stream as assigned by the USD_DATA_BEGIN message.
resolution
One of the E3238sUsdResolution enum values indicating the data resolution of the
narrowband data.
dataType
One of the E3238sUsdDataType enum values indicating the data type (e.g. IQ pairs, FM
demodulated data, etc).
numSamples
Number of samples in this block of data. If dataType is E3238sUsdDataType_IQ,
numSamples is the number of complex samples; if dataType is E3238sUsdDataType_AM or
E3238sUsdDataType_FM, numSamples is the number of real samples.
blockNumber
A sequence number for this data block. The first block of data after the
E3238S_USD_DATA_BEGIN message will have a blockNumber of 0.
dataErrorMask
Reserved for future use.
USD Programming Guide
113
scale
Multiply the integer narrowband data by scale to convert to scaled floating point data.
timestamp
The timestamp for the first sample of this block of data.
Remarks
The data is always sent as integers; the number of bytes per point depends on the value of resolution. As an
example, if the dataType is E3238sUsdDataType_IQ, resolution is E3238sUsdResolution_32bit, and
numSamples is 1024, the size of the data will be:
(1024 samples ) * (2 points/sample) * (4 bytes/point) = 8192 bytes
USD Programming Guide
114
E3238S_USD_DATA_END
Data structure sent after the last block of streamed narrowband data.
Synopsis
typedef struct {
int version;
int channelNumber;
unsigned long streamId;
int reason;
unsigned long numBlocks;
} E3238S_USD_DATA_END;
Parameters
version
See the section on version checking below.
channelNumber
The USD narrowband channel number that is streaming this USD signal. channelNumber will
be between 1 and the number of allocated USD channels.
streamId
Identifier for this stream as assigned by the USD_DATA_BEGIN message.
reason
One of the E3238sUsdReleaseReason enum values indicating the reason that the data
stream stopped.
numBlocks
The total number of narrowband data blocks sent for this stream.
USD Programming Guide
115
E3238S_USD_INFO
Data structure sent in response to the INFO query.
Synopsis
typedef struct {
int version;
int maxChannels;
int subscribedToAll;
int maxBytesPerSec;
int currentBytesPerSec;
int numUsdSignals;
int numSubscriptions;
/* followed by numUsdSignals E3238S_USD_STREAM_INFO structures */
/* then numSubscriptions E3238S_USD_SUBSCRIPTION_INFO structures */
} E3238S_USD_INFO;
Parameters
version
See the section on version checking below.
maxChannels
The number of narrowband channels used by the USD signal.
subscribedToAll
The value will be 1 if the client is currently subscribed to all USD signals.
maxBytesPerSecond
The configured maximum bytes per second allowed to go from the narrowband USD system
to the host computer. The maximum allowed streaming rate will be approximately
maxBytesPer second.
currentBytesPerSecond
The current bytes per second going from the narrowband USD system to the host computer.
numUsdSignals
The number of USD signal detectors currently enabled.
numSubscriptions
The number of USD detectors to which the requesting client is subscribed (this number is
independent of subscribedToAll).
Remarks
Following this data structure in the E3238sUsdTag_info data message will be numUsdSignals
E3238S_USD_STREAM_INFO structures, followed by numSubscriptions
E3238S_USD_SUBSCRIPTION_INFO structures. These are described next.
USD Programming Guide
116
E3238S_USD_STREAM_INFO
An array of this structure is included in the E3238S_USD_INFO structure described earlier. Each structure
contains the name and current run time parameters for one USD signal detector.
Synopsis
typedef struct {
char name[E3238S_USD_NAME_LENGTH];
char author[E3238S_USD_AUTHOR_LENGTH];
int resolution;
int dataType;
double sampleRate;
} E3238S_USD_STREAM_INFO;
Parameters
name
A null-terminated character string containing the USD signal name (e.g. “UVHF Pager”).
author
A null-terminated character string containing the USD signal author (e.g. “Agilent”)
resolution
One of the E3238sUsdResolution enum values indicating the data resolution that will be
streamed for this USD signal
dataType
One of the E3238sUsdDataType enum values indicating the data type (e.g. IQ pairs, FM
demodulated data, etc)
sampleRate
The sample rate, in Hz, of the streamed narrowband data that will be streamed by this signal.
USD Programming Guide
117
E3238S_USD_SUBSCRIPTION_INFO
An array of this structure is included in the E3238S_USD_INFO structure described earlier. Each structure
specifies the name and author of a one active USD signal detector subscription.
Synopsis
typedef struct {
char name[E3238S_USD_NAME_LENGTH];
char author[E3238S_USD_AUTHOR_LENGTH];
} E3238S_USD_SUBSCRIPTION_INFO;
Parameters
name
A null-terminated character string containing the USD signal name (e.g. “UVHF Pager”).
author
A null-terminated character string containing the USD signal author (e.g. “Agilent”).
USD Programming Guide
118
E3238S_USD_ERROR
Data structure used to report command errors to the client.
Synopsis
typedef struct {
int version; /*version of this data structure */
int errorNumber; /*E3238sUsdError_or enum */
char errorString[E3238S_USD_ERROR_LENGTH];
} E3238S_USD_ERROR;
Parameters
version
See the section on version checking below.
errorNumber
One of the E3238sUsdError enum values specifying the error.
errorString
More detail on the error.
USD Programming Guide
119
typedef struct {
int version;
int alarm;
char name[ALARM_SPEW_NAME_LENGTH];
double timeStamp;
double frequency;
double bandwidth;
float amplitude;
int detections;
double duration;
int intercepts;
int numUsdSignals; /*followed by numUsdSignals
E3238S_USD_ENERGY_ALARM_SIGNAL structures */
} E3238S_USD_ENERGY_ALARM_SPEW;
E3238S_USD_ENERGY_ALARM_SPEW
Data structure sent when one or more USD wideband detectors detect a signal.
Synopsis
Parameters
version
See the section on version checking below.
alarm
Identifies the alarm whose criteria was met by the energy.
name
The description field as defined in the N6820ES Alarm Setup. Size is defined as:
timestamp
The date and time that the energy was detected given as the number of seconds since 00:00:00
Jan.1, 1970.
frequency
The frequency value that identifies the signal in the Energy History.
bandwidth
The signal’s calculated bandwidth in Hz; depends on the energy detection configuration.
amplitude
The amplitude (in dBm) of the energy that triggered the alarm.
detections
The number of detections for this entry in the energy history when the alarm triggered.
duration
The current duration for the energy history entry when the alarm triggered.
intercepts
The number of intercepts for the entry that triggered the alarm.
numUsdSignals
The number of USD signal detectors that had wideband detections for this alarm.
USD Programming Guide
120
Remarks
This data structure will be followed by numUsdSignal E3238S_USD_ENERGY_ALARM_SIGNAL
structures.
USD Programming Guide
121
E3238S_USD_ENERGY_ALARM_SIGNAL
An array of this structure is included in the E3238S_USD_ENERGY_ALARM_SPEW structure described
earlier.
Synopsis
typedef struct {
char name[E3238S_USD_NAME_LENGTH];
char author[E3238S_USD_AUTHOR_LENGTH];
char freqPlan[E3238S_USD_FREQ_LABEL_LENGTH];
char wideband[E3238S_USD_DESCRIPTION_LENGTH];
} E3238S_USD_ENERGY_ALARM_SIGNAL;
Parameters
name
A null-terminated character string containing the USD detector name (e.g. “UVHF Pager”)
author
A null-terminated character string containing the USD detector author (e.g. “Agilent”)
freqPlan
A null-terminated character string containing the frequency plan label, if defined, for the
detected signal.
wideband
A null-terminated character string containing the name of the wideband detector that detected
the signal.
USD Programming Guide
122
Client Connection to the USD Server
The USD service port is typically identified in the services file. When the USD software is installed on the
N6820ES system the entry e3238sUsd 7014/TCP is added to the system’s services file. This same entry
must be entered to the services file on the client processing workstation, or, the client socket code must be
written to use port number 7014. The port number assigned to the e3238sUsd service is not critical
– it can be any value that’s available and it must be the same value on both the workstation and any client
workstation.
The client application program must disable the Nagle message buffering algorithm in the TCP code. This
is done with the setsockopt function with the option name TCP_NODELAY. This disables the buffering of
small messages and makes the socket much more responsive to send short messages to the USD server. An
example of the code used to disable the Nagle algorithm can be found in the example program. (For
information on the Nagle algorithm see “RFC896 Congestion Control in IP/TCP.”)
As indicated previously, USD channels can be managed (assigned, released, locked), using commands sent
to the command/response/spew socket and/or the USD socket. It is preferable that customers use the USD
socket for all USD channel management.
Data Rate
The processing workstation must be able to keep up with the USD data stream or data will be lost. The
worst case data rate in bytes/second is approximately:
(Sample Rate) * (8 bytes/sample) * (Number of Channels) * (Number of USD signals/channel)
This assumes the data is raw IQ pairs (two integers/sample). Typically, you should design your USD signal
detectors so that the number of USD signals/channel is one. This formula also assumes that all of the
channels are streaming at the same time.
As an example, 32 narrowband channels operating at a sample rate of 8 kSample/second will produce
approximately 2.048 MB/second of data.
Version Checking
The client application must check the version code in the message headers to make sure the received header
version is compatible with the client’s expectation of the header. The client program was compiled with
some version of e3238sUsd.h that contained a definition of E3238S_USD_VERSION. This version
number must match the version number in all packet headers. If the version number doesn’t match, the
client application program must be recompiled using the correct version of the e3238sUsd.h file.
USD Programming Guide
123
Example Programs
Streaming Client
The streamingClient example program is a good way to get familiar with the USD server commands and
messages.
The example below uses the VUHF Pager.Agilent signal detector as an example because pager signals are
typically easy to find. You can substitute a different signal detector if desired. The example also assumes
you are familiar with N6820ES and the USD option.
1. Start the N6820ES program and wait for the initialization process to complete.
2. Using the USD system dialog box Setup tab, enable the UVHF Pager.Agilent detector.
3. Configure the search system (frequency range, averaging, etc.) for the pager system (this can be
done quickly using the Frequency Plan and N6820ES Requirements buttons in the USD dialog
box). In the USD dialog box, leave the Enable Signal Detection box unchecked for now.
4. In the command prompt window execute the command:
streamingClient
You should see the prompt: Enter command:
5. In the command prompt window type:
subscribe VUHF Pager.Agilent
6. In the command prompt window type the command
info
You should see the following response:
Info Num USD channels =16
Num USD signals =1
Max bytes/sec =4000000
Current bytes/sec =0
Signal Name = VUHF Pager.Agilent
Data type = IQ (Raw)
Resolution = 32 bit integer
Sample Rate = 32000.000000 Hz
Subscribed to all = No
Num subscriptions =1
Subscription[0] = VUHF Pager.Agilent
Note: The Num of USD Channels may be different on your system
USD Programming Guide
124
7. In the USD dialog box, enable the USD system by checking the Enable Signal Detection box.
8. You should now see E3238_USD_DATA_BEGIN and E3238S_USD_DATA_END messages as
pager signals are detected going on and off. (By default, the VUHF Pager.Agilent will be released
if the SNR goes below 6 dB or if the signal has been on for more than 1 minute.)
A typical E3238_USD_DATA_BEGIN message will look like this in the command window:
Start: name = VUHF Pager
author = Agilent
channel = 2
streamId = 18
frequency = 929.612500 MHz
sampleRate =32000.0 Hz
resolution = 4
database tag = 4294967986.000000
Freq Plan =
Wideband = Pocsag 9.6 kHz
Narrowband = Flex 3200
Modulation = 4 Level FSK
Symbol Rate = 3199.2 Baud
Tone Spacing = 3262.7 Hz
Bandwidth = 16186.7 Hz
SNR = 37.0 dB
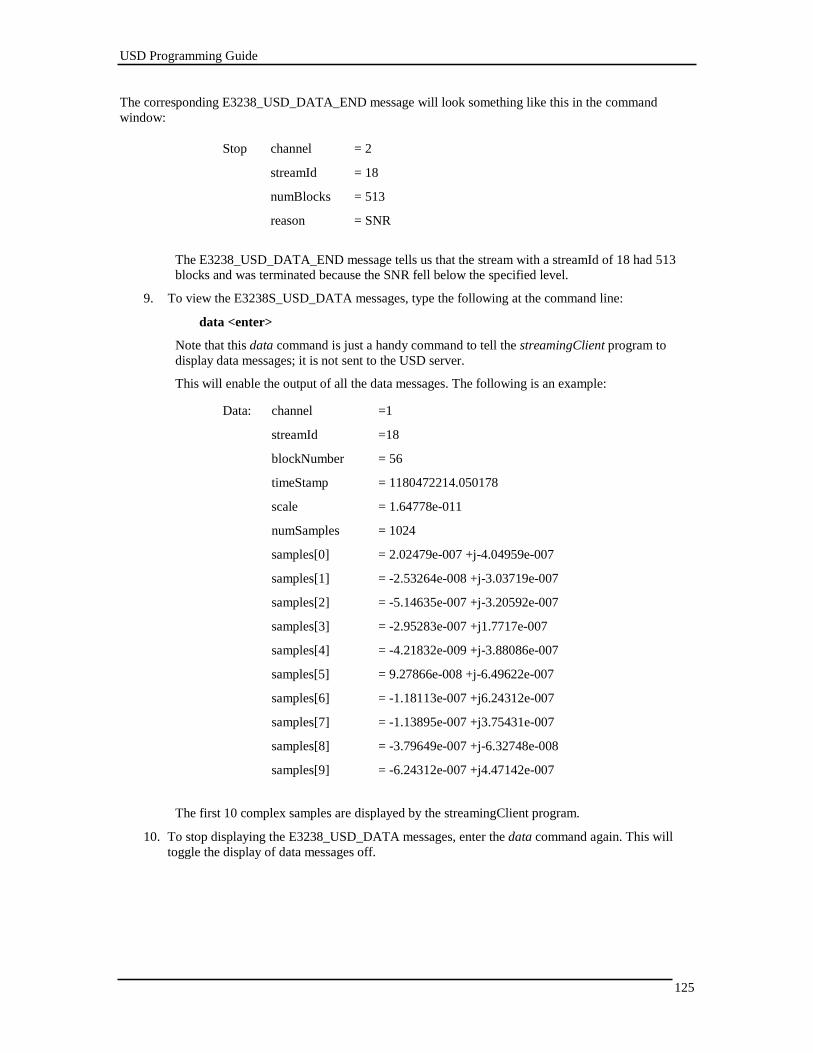
USD Programming Guide
125
The corresponding E3238_USD_DATA_END message will look something like this in the command
window:
Stop channel = 2
streamId = 18
numBlocks = 513
reason = SNR
The E3238_USD_DATA_END message tells us that the stream with a streamId of 18 had 513
blocks and was terminated because the SNR fell below the specified level.
9. To view the E3238S_USD_DATA messages, type the following at the command line:
data <enter>
Note that this data command is just a handy command to tell the streamingClient program to
display data messages; it is not sent to the USD server.
This will enable the output of all the data messages. The following is an example:
Data: channel =1
streamId =18
blockNumber = 56
timeStamp = 1180472214.050178
scale = 1.64778e-011
numSamples = 1024
samples[0] = 2.02479e-007 +j-4.04959e-007
samples[1] = -2.53264e-008 +j-3.03719e-007
samples[2] = -5.14635e-007 +j-3.20592e-007
samples[3] = -2.95283e-007 +j1.7717e-007
samples[4] = -4.21832e-009 +j-3.88086e-007
samples[5] = 9.27866e-008 +j-6.49622e-007
samples[6] = -1.18113e-007 +j6.24312e-007
samples[7] = -1.13895e-007 +j3.75431e-007
samples[8] = -3.79649e-007 +j-6.32748e-008
samples[9] = -6.24312e-007 +j4.47142e-007
The first 10 complex samples are displayed by the streamingClient program.
10. To stop displaying the E3238_USD_DATA messages, enter the data command again. This will
toggle the display of data messages off.
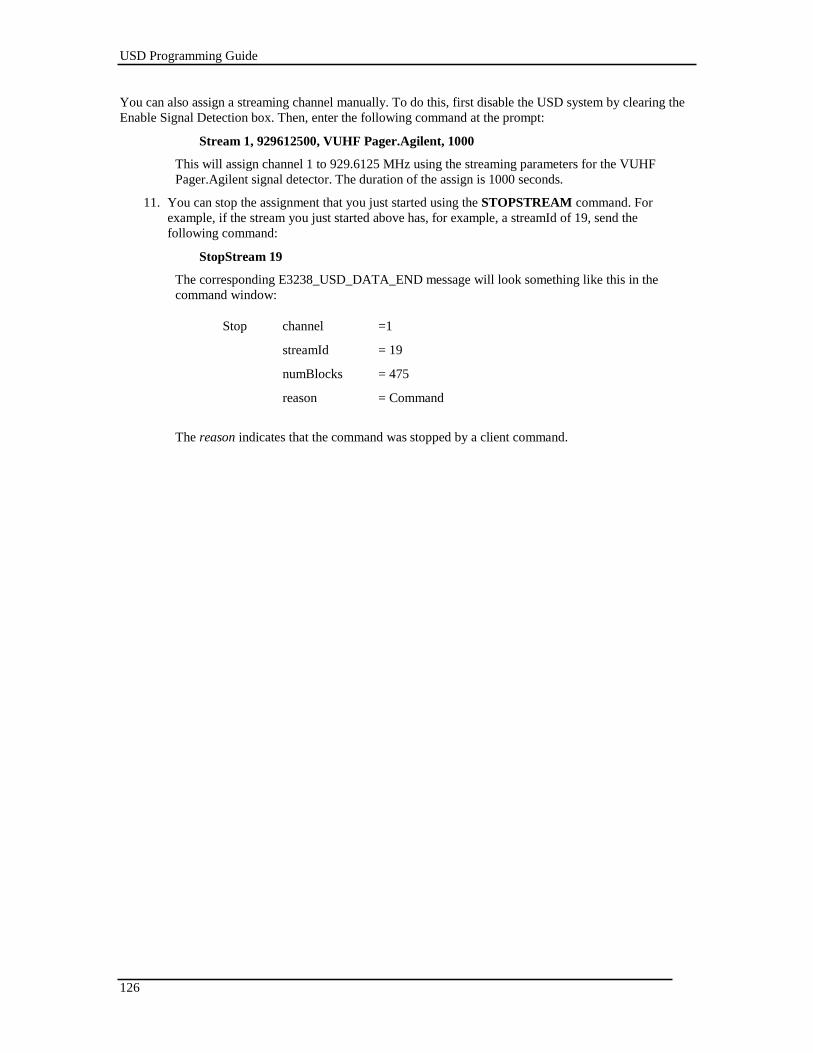
USD Programming Guide
126
You can also assign a streaming channel manually. To do this, first disable the USD system by clearing the
Enable Signal Detection box. Then, enter the following command at the prompt:
Stream 1, 929612500, VUHF Pager.Agilent, 1000
This will assign channel 1 to 929.6125 MHz using the streaming parameters for the VUHF
Pager.Agilent signal detector. The duration of the assign is 1000 seconds.
11. You can stop the assignment that you just started using the STOPSTREAM command. For
example, if the stream you just started above has, for example, a streamId of 19, send the
following command:
StopStream 19
The corresponding E3238_USD_DATA_END message will look something like this in the
command window:
Stop channel =1
streamId = 19
numBlocks = 475
reason = Command
The reason indicates that the command was stopped by a client command.
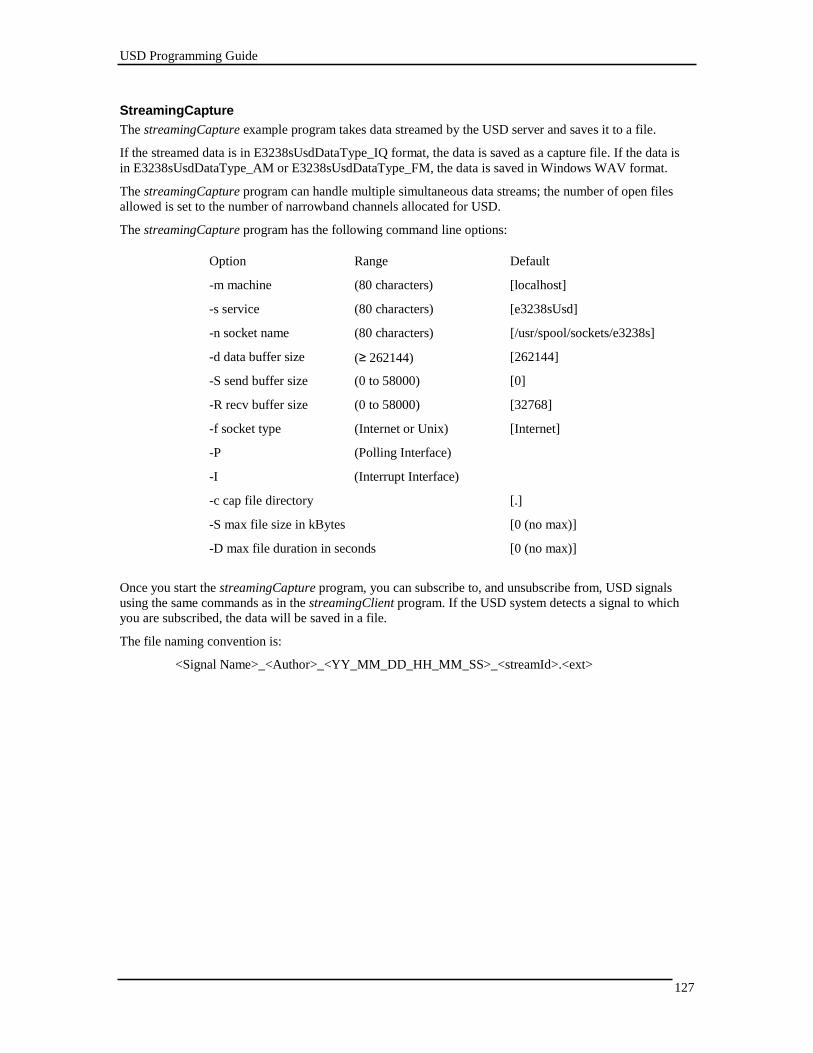
USD Programming Guide
127
StreamingCapture
The streamingCapture example program takes data streamed by the USD server and saves it to a file.
If the streamed data is in E3238sUsdDataType_IQ format, the data is saved as a capture file. If the data is
in E3238sUsdDataType_AM or E3238sUsdDataType_FM, the data is saved in Windows WAV format.
The streamingCapture program can handle multiple simultaneous data streams; the number of open files
allowed is set to the number of narrowband channels allocated for USD.
The streamingCapture program has the following command line options:
Option Range Default
-m machine (80 characters) [localhost]
-s service (80 characters) [e3238sUsd]
-n socket name (80 characters) [/usr/spool/sockets/e3238s]
-d data buffer size (≥ 262144) [262144]
-S send buffer size (0 to 58000) [0]
-R recv buffer size (0 to 58000) [32768]
-f socket type (Internet or Unix) [Internet]
-P (Polling Interface)
-I (Interrupt Interface)
-c cap file directory [.]
-S max file size in kBytes [0 (no max)]
-D max file duration in seconds [0 (no max)]
Once you start the streamingCapture program, you can subscribe to, and unsubscribe from, USD signals
using the same commands as in the streamingClient program. If the USD system detects a signal to which
you are subscribed, the data will be saved in a file.
The file naming convention is:
<Signal Name>_<Author>_<YY_MM_DD_HH_MM_SS>_<streamId>.<ext>
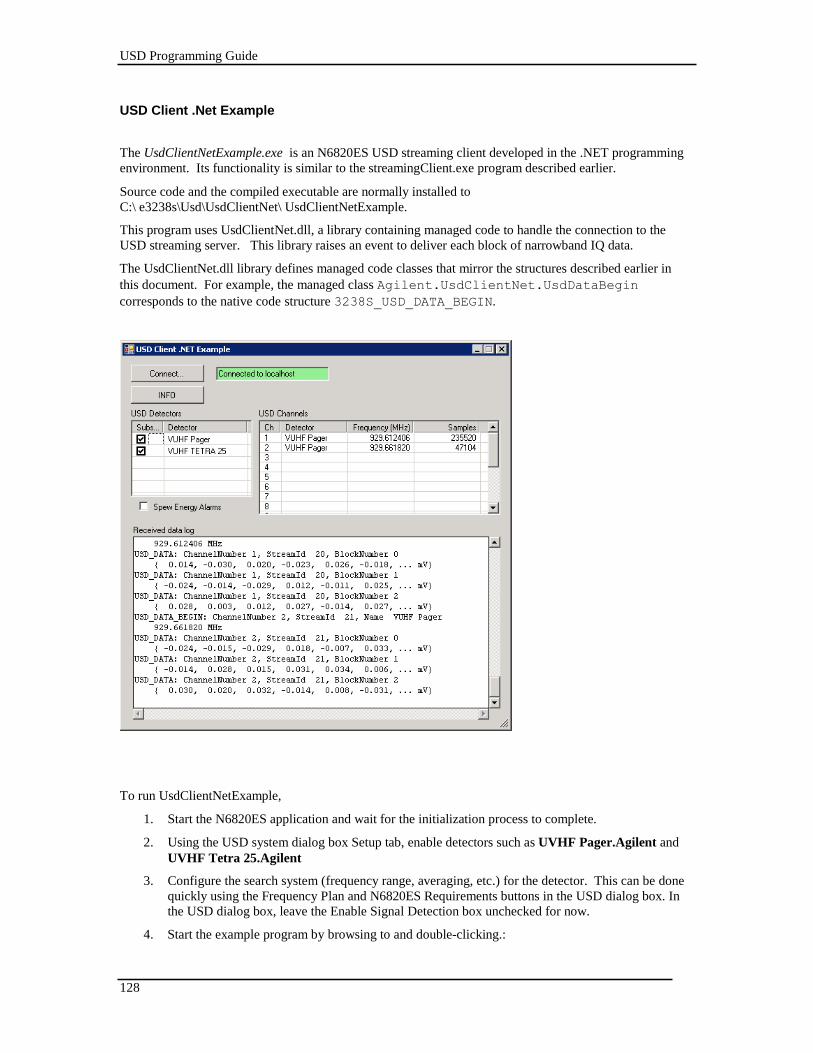
USD Programming Guide
128
USD Client .Net Example
The UsdClientNetExample.exe is an N6820ES USD streaming client developed in the .NET programming
environment. Its functionality is similar to the streamingClient.exe program described earlier.
Source code and the compiled executable are normally installed to
C:\ e3238s\Usd\UsdClientNet\ UsdClientNetExample.
This program uses UsdClientNet.dll, a library containing managed code to handle the connection to the
USD streaming server. This library raises an event to deliver each block of narrowband IQ data.
The UsdClientNet.dll library defines managed code classes that mirror the structures described earlier in
this document. For example, the managed class Agilent.UsdClientNet.UsdDataBegin
corresponds to the native code structure 3238S_USD_DATA_BEGIN.
To run UsdClientNetExample,
1. Start the N6820ES application and wait for the initialization process to complete.
2. Using the USD system dialog box Setup tab, enable detectors such as UVHF Pager.Agilent and
UVHF Tetra 25.Agilent
3. Configure the search system (frequency range, averaging, etc.) for the detector. This can be done
quickly using the Frequency Plan and N6820ES Requirements buttons in the USD dialog box. In
the USD dialog box, leave the Enable Signal Detection box unchecked for now.
4. Start the example program by browsing to and double-clicking.:
USD Programming Guide
129
C:\ e3238s\Usd\UsdClientNet\UsdClientNetExample.exe
5. On the UsdClientNetExample program, click the Connect… button to show the connection dialog
box, and then click Connect.
6. Click the INFO button. This will query for a list of enabled USD detectors and display this
information in the USD Detectors list.
7. Check the “Subscribe” checkboxes for the detectors.
8. In the USD dialog box, enable the USD system by checking the Enable Signal Detection box.
9. On the UsdClientNetExample program, you should now see USD_DATA_BEGIN and
USD_DATA_END messages as pager signals are detected going on and off. (By default, the
VUHF Pager.Agilent will be released if the SNR goes below 6 dB or if the signal has been on for
more than 1 minute.)
10. You can stop new stream assignments by clearing the Subscribe checkboxes.
To view the source code for this example, open the C# project file UsdClientNetExample.csproj.
Tutorial: How to Build a USD Signal Detector
130
Tutorial: How to Build a USD Signal Detector
Overview
In this section we will go through the steps of building a signal detector for use with the Universal Signal
Detection option. This section is organized as a step-by-step guide.
The steps in this tutorial can be performed with or without measurement hardware connected. To start the
software without using hardware, use the -noHardware option in the command line or shortcut properties.
Our example signal of interest is a POCSAG pager signal. The modulation format is 2- level FSK with a
tone spacing of 9.6 kHz at a symbol rate of 2400 symbols/second. We refer to this as a “slow” FSK signal
because the symbol rate is less than half of the tone spacing. Slow FSK signals appear as two distinct tones
in the frequency domain.
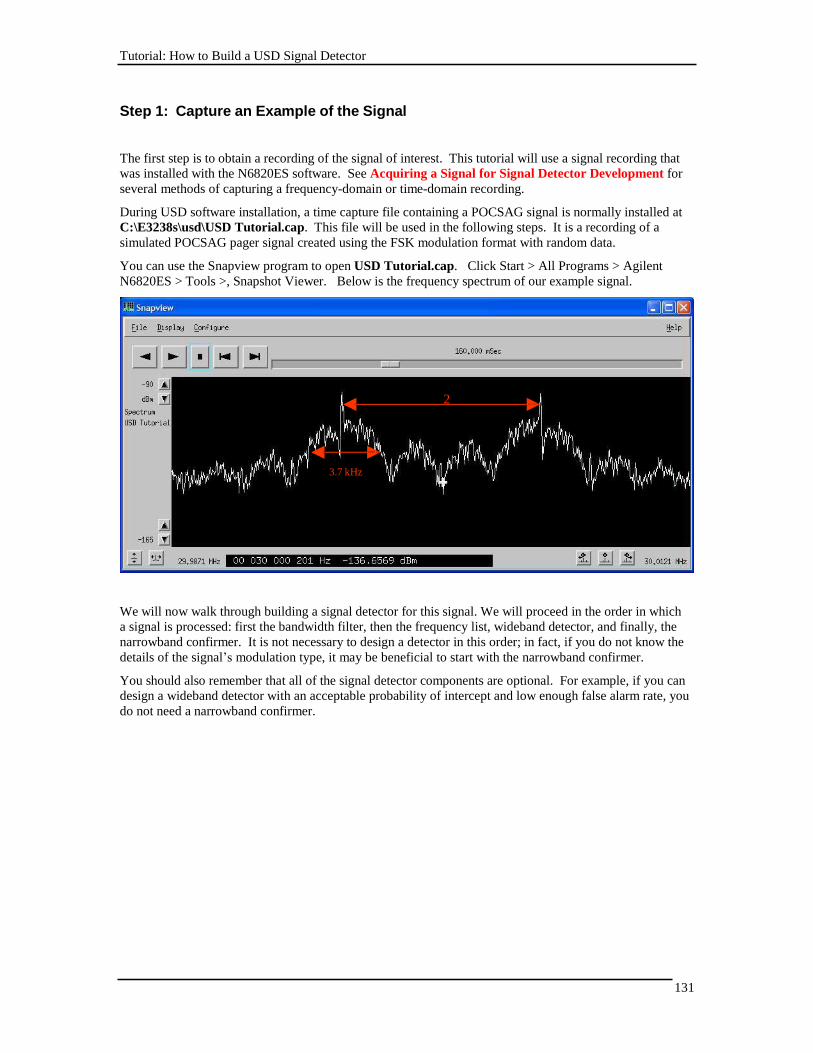
Tutorial: How to Build a USD Signal Detector
131
Step 1: Capture an Example of the Signal
The first step is to obtain a recording of the signal of interest. This tutorial will use a signal recording that
was installed with the N6820ES software. See Acquiring a Signal for Signal Detector Development for
several methods of capturing a frequency-domain or time-domain recording.
During USD software installation, a time capture file containing a POCSAG signal is normally installed at
C:\E3238s\usd\USD Tutorial.cap. This file will be used in the following steps. It is a recording of a
simulated POCSAG pager signal created using the FSK modulation format with random data.
You can use the Snapview program to open USD Tutorial.cap. Click Start > All Programs > Agilent
N6820ES > Tools >, Snapshot Viewer. Below is the frequency spectrum of our example signal.
2
3.7 kHz
We will now walk through building a signal detector for this signal. We will proceed in the order in which
a signal is processed: first the bandwidth filter, then the frequency list, wideband detector, and finally, the
narrowband confirmer. It is not necessary to design a detector in this order; in fact, if you do not know the
details of the signal’s modulation type, it may be beneficial to start with the narrowband confirmer.
You should also remember that all of the signal detector components are optional. For example, if you can
design a wideband detector with an acceptable probability of intercept and low enough false alarm rate, you
do not need a narrowband confirmer.
Tutorial: How to Build a USD Signal Detector
132
Step 2: Choose the Search Setup Settings
Some components of the signal detector, such as the bandwidth filter and the wideband detector, are
dependent on the search setup. The important settings are:
• Resolution Bandwidth
• Shape Factor
• Average Type
• Number of Averages
The resolution bandwidth must be small enough to resolve the signal sufficiently. We do not want to make
it too small, however, because this will slow the search update rate. Averaging type and number of
averages should also be chosen to highlight the signal of interest.
The 9:1 shape filter is almost always used because frequency resolution is more important than amplitude
accuracy in search applications.
Our example signal has lobes of about 4 kHz. A 1 kHz resolution bandwidth will resolve these lobes
sufficiently for the wideband detector.
Peak averaging will be used to enhance the signal’s spectral shape. Peak averaging is particularly useful
with FSK signals because peak averaging increases the probability of observing more than one of the FSK
frequencies in one measurement. Four averages usually provide enough averaging and still allow a fast
sweep rate.
If you are designing detectors for a variety of signals, it is good practice to choose a common set of search
parameters that will work well for all the detectors. Here are some good starting points:
• HF: 60 Hz RBW, 9:1 Shape, Peak Averaging, 4 Averages
• UHF/VHF: 1 kHz RBW, 9:1 Shape, Peak Averaging, 4 Averages
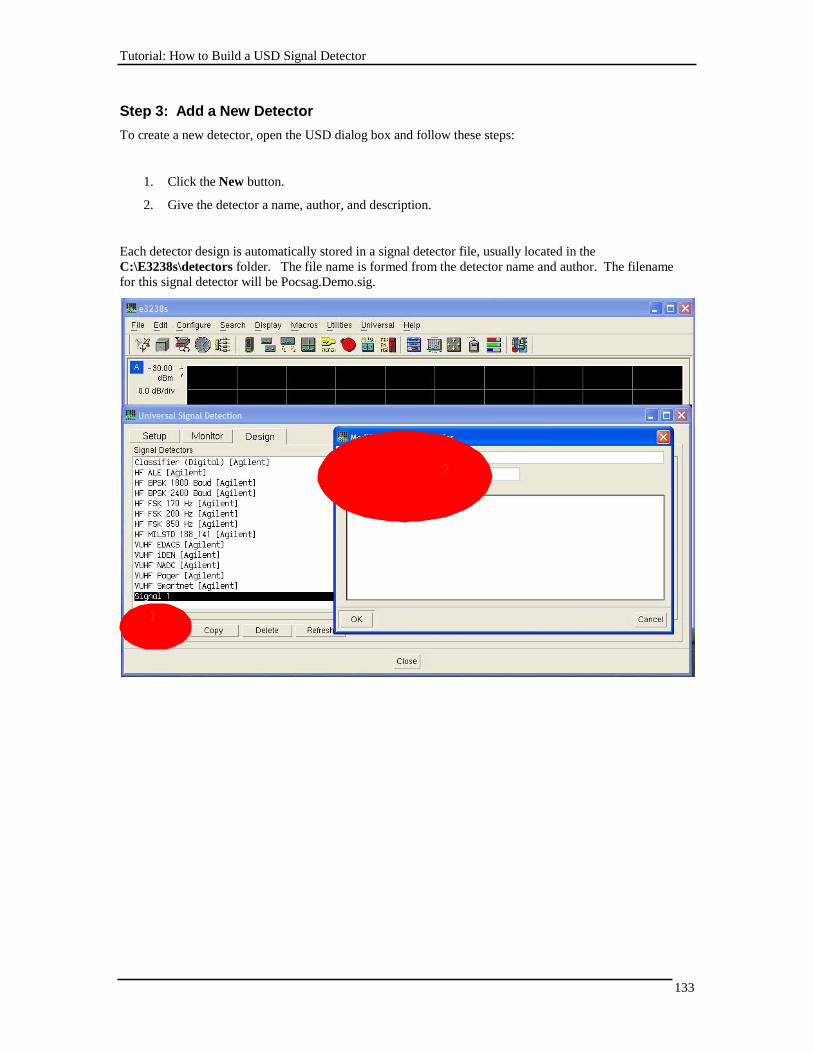
Tutorial: How to Build a USD Signal Detector
133
Step 3: Add a New Detector
To create a new detector, open the USD dialog box and follow these steps:
1. Click the New button.
2. Give the detector a name, author, and description.
Each detector design is automatically stored in a signal detector file, usually located in the
C:\E3238s\detectors folder. The file name is formed from the detector name and author. The filename
for this signal detector will be Pocsag.Demo.sig.
2
1
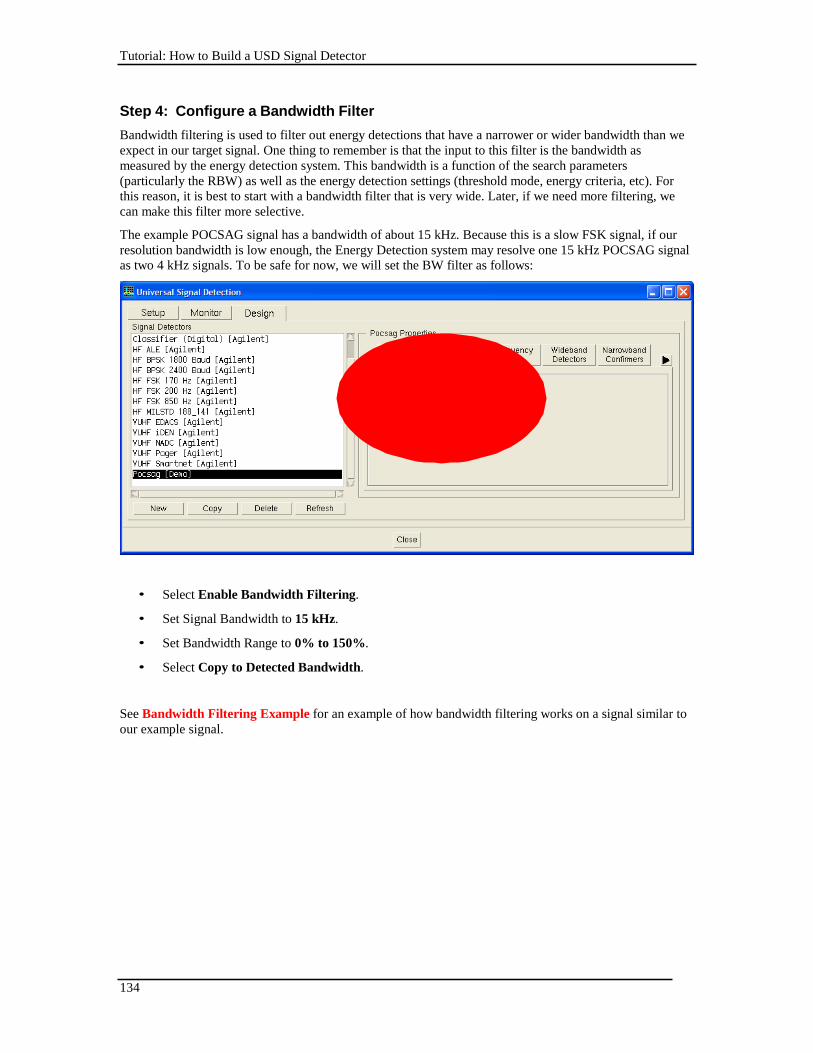
Tutorial: How to Build a USD Signal Detector
134
Step 4: Configure a Bandwidth Filter
Bandwidth filtering is used to filter out energy detections that have a narrower or wider bandwidth than we
expect in our target signal. One thing to remember is that the input to this filter is the bandwidth as
measured by the energy detection system. This bandwidth is a function of the search parameters
(particularly the RBW) as well as the energy detection settings (threshold mode, energy criteria, etc). For
this reason, it is best to start with a bandwidth filter that is very wide. Later, if we need more filtering, we
can make this filter more selective.
The example POCSAG signal has a bandwidth of about 15 kHz. Because this is a slow FSK signal, if our
resolution bandwidth is low enough, the Energy Detection system may resolve one 15 kHz POCSAG signal
as two 4 kHz signals. To be safe for now, we will set the BW filter as follows:
• Select Enable Bandwidth Filtering.
• Set Signal Bandwidth to 15 kHz.
• Set Bandwidth Range to 0% to 150%.
• Select Copy to Detected Bandwidth.
See Bandwidth Filtering Example for an example of how bandwidth filtering works on a signal similar to
our example signal.
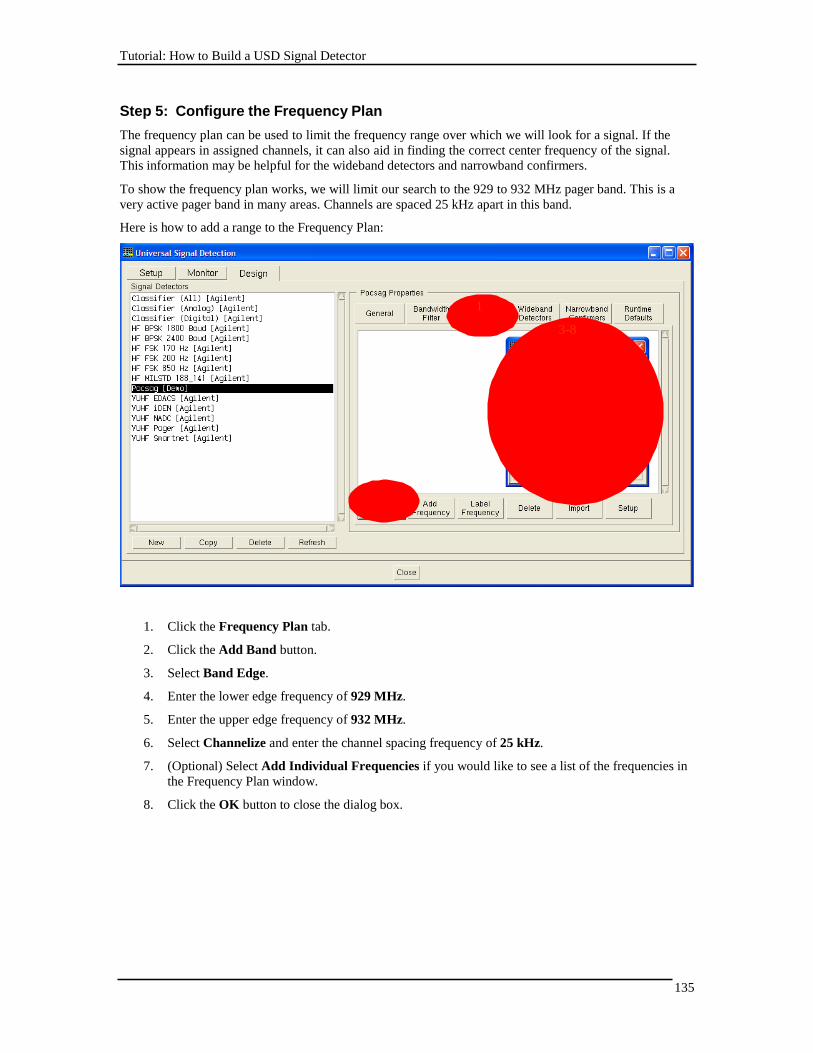
Tutorial: How to Build a USD Signal Detector
135
Step 5: Configure the Frequency Plan
The frequency plan can be used to limit the frequency range over which we will look for a signal. If the
signal appears in assigned channels, it can also aid in finding the correct center frequency of the signal.
This information may be helpful for the wideband detectors and narrowband confirmers.
To show the frequency plan works, we will limit our search to the 929 to 932 MHz pager band. This is a
very active pager band in many areas. Channels are spaced 25 kHz apart in this band.
Here is how to add a range to the Frequency Plan:
1
3-8
2
1. Click the Frequency Plan tab.
2. Click the Add Band button.
3. Select Band Edge.
4. Enter the lower edge frequency of 929 MHz.
5. Enter the upper edge frequency of 932 MHz.
6. Select Channelize and enter the channel spacing frequency of 25 kHz.
7. (Optional) Select Add Individual Frequencies if you would like to see a list of the frequencies in
the Frequency Plan window.
8. Click the OK button to close the dialog box.
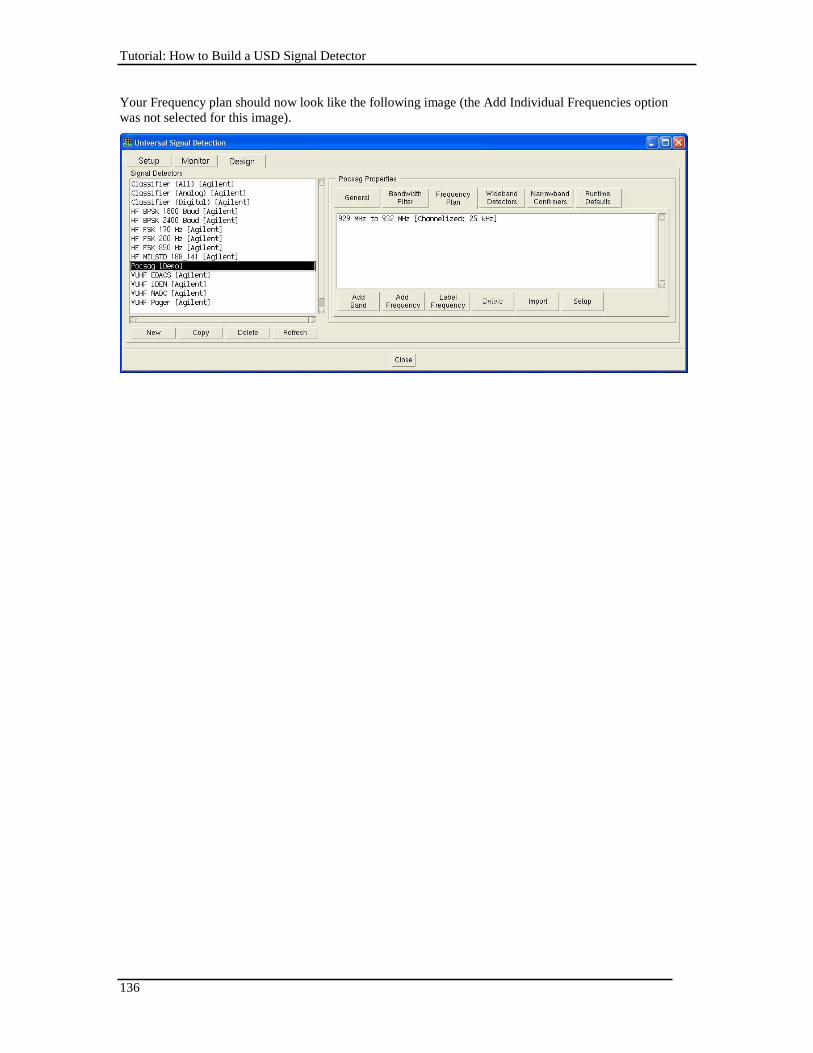
Tutorial: How to Build a USD Signal Detector
136
Your Frequency plan should now look like the following image (the Add Individual Frequencies option
was not selected for this image).
Tutorial: How to Build a USD Signal Detector
137
Step 6: Add a Wideband Detector
A wideband detector takes spectrum data from the search system and determines if it is a potential signal
of interest. There are three methods of wideband detection to choose from: peaks, shape, and limit lines.
Which method you choose depends on the spectral characteristics of your signal of interest.
If your signal has a steady, distinctive shape, the shape method is often the best choice.
If your signal has pronounced, evenly spaced peaks, the peaks method will work well. Slow FSK signals
are well suited to this method. For the FSK family, this method works better when there are more tones.
For example, 4-level FSK is a good candidate for the peaks method, while 2-level FSK is better handled
with the shape method.
One advantage of the peaks method is that a single detector will work over a wider range of resolution
bandwidths than the other methods. As long as the resolution bandwidth allows the peaks to be seen
distinctly, the peaks method will work.
If you signal has a combination of a steady spectral part (or parts), and a less steady part, limit lines may be
the best choice. The example signal detector for the North American Digital Cellular signal (VUHF
NADC.Agilent.sig), for example, uses limit lines. This detector has narrow limits on the sides and wider
limits in the center. It performs well in rejecting other signals in its applicable frequency range.
The best choice for our example 2-level FSK signal is the shape method, with the peak method a close
second. For illustrative purposes, however, we will build a wideband detector using each method.
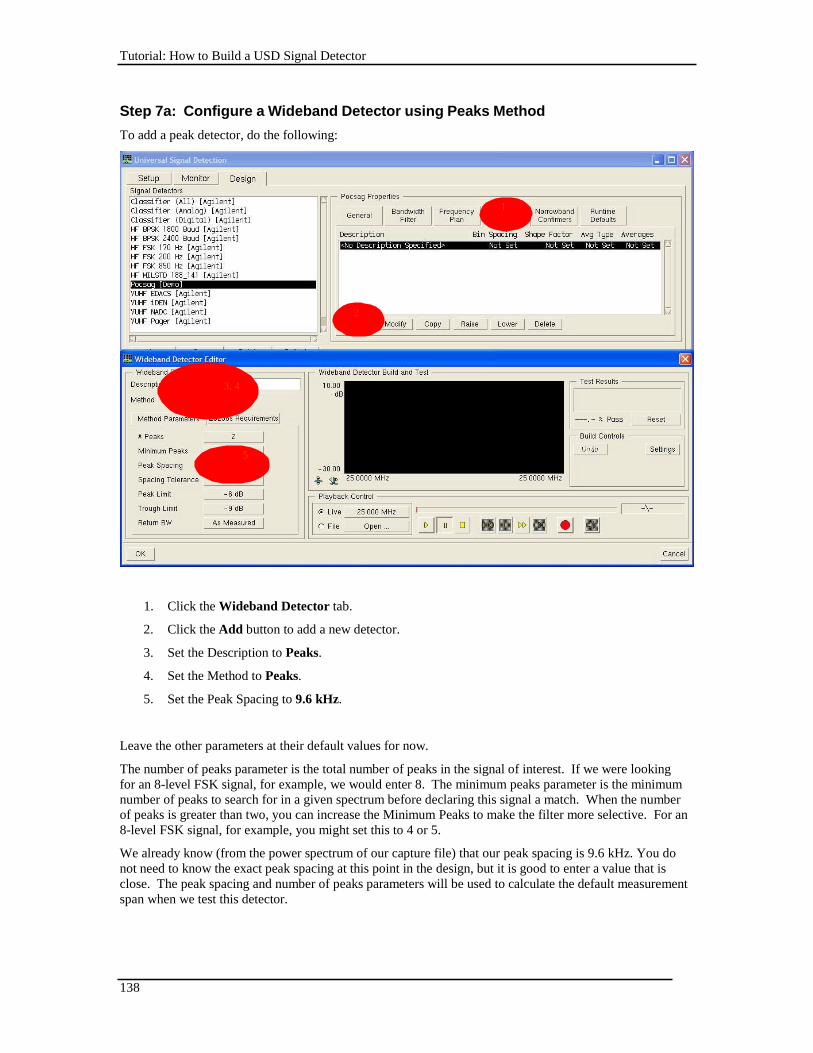
Tutorial: How to Build a USD Signal Detector
138
Step 7a: Configure a Wideband Detector using Peaks Method
To add a peak detector, do the following:
1
2
3, 4
5
1. Click the Wideband Detector tab.
2. Click the Add button to add a new detector.
3. Set the Description to Peaks.
4. Set the Method to Peaks.
5. Set the Peak Spacing to 9.6 kHz.
Leave the other parameters at their default values for now.
The number of peaks parameter is the total number of peaks in the signal of interest. If we were looking
for an 8-level FSK signal, for example, we would enter 8. The minimum peaks parameter is the minimum
number of peaks to search for in a given spectrum before declaring this signal a match. When the number
of peaks is greater than two, you can increase the Minimum Peaks to make the filter more selective. For an
8-level FSK signal, for example, you might set this to 4 or 5.
We already know (from the power spectrum of our capture file) that our peak spacing is 9.6 kHz. You do
not need to know the exact peak spacing at this point in the design, but it is good to enter a value that is
close. The peak spacing and number of peaks parameters will be used to calculate the default measurement
span when we test this detector.
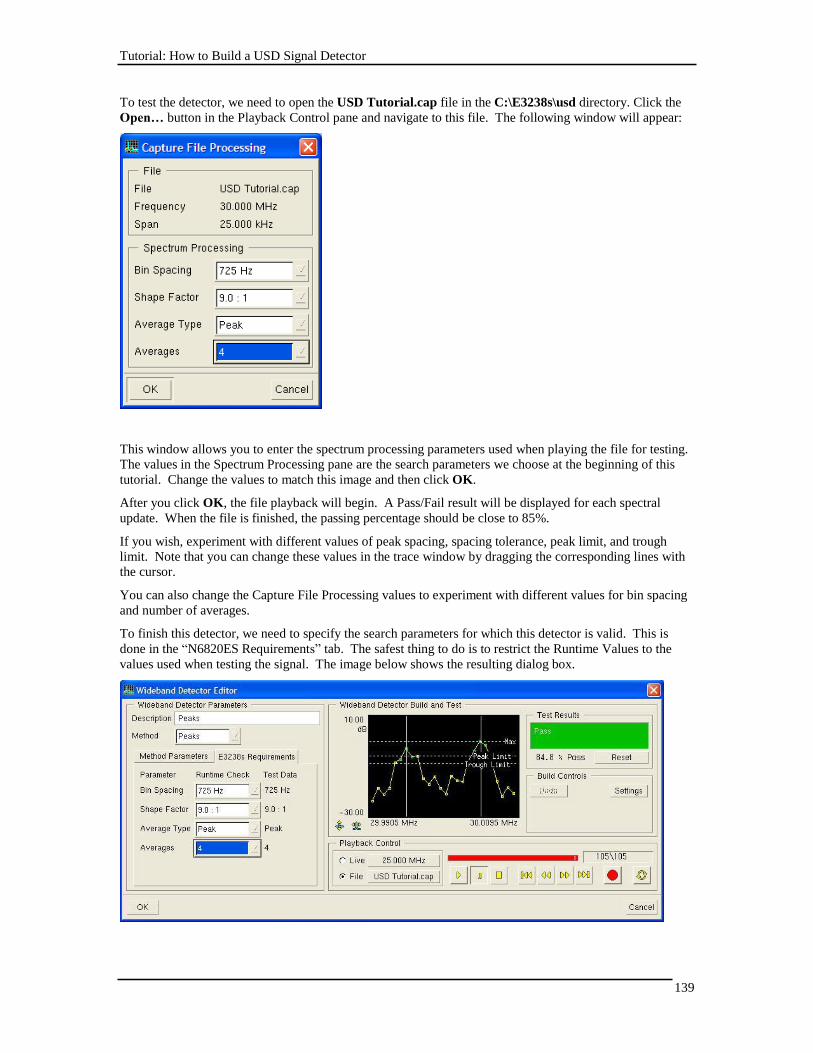
Tutorial: How to Build a USD Signal Detector
139
To test the detector, we need to open the USD Tutorial.cap file in the C:\E3238s\usd directory. Click the
Open… button in the Playback Control pane and navigate to this file. The following window will appear:
This window allows you to enter the spectrum processing parameters used when playing the file for testing.
The values in the Spectrum Processing pane are the search parameters we choose at the beginning of this
tutorial. Change the values to match this image and then click OK.
After you click OK, the file playback will begin. A Pass/Fail result will be displayed for each spectral
update. When the file is finished, the passing percentage should be close to 85%.
If you wish, experiment with different values of peak spacing, spacing tolerance, peak limit, and trough
limit. Note that you can change these values in the trace window by dragging the corresponding lines with
the cursor.
You can also change the Capture File Processing values to experiment with different values for bin spacing
and number of averages.
To finish this detector, we need to specify the search parameters for which this detector is valid. This is
done in the “N6820ES Requirements” tab. The safest thing to do is to restrict the Runtime Values to the
values used when testing the signal. The image below shows the resulting dialog box.
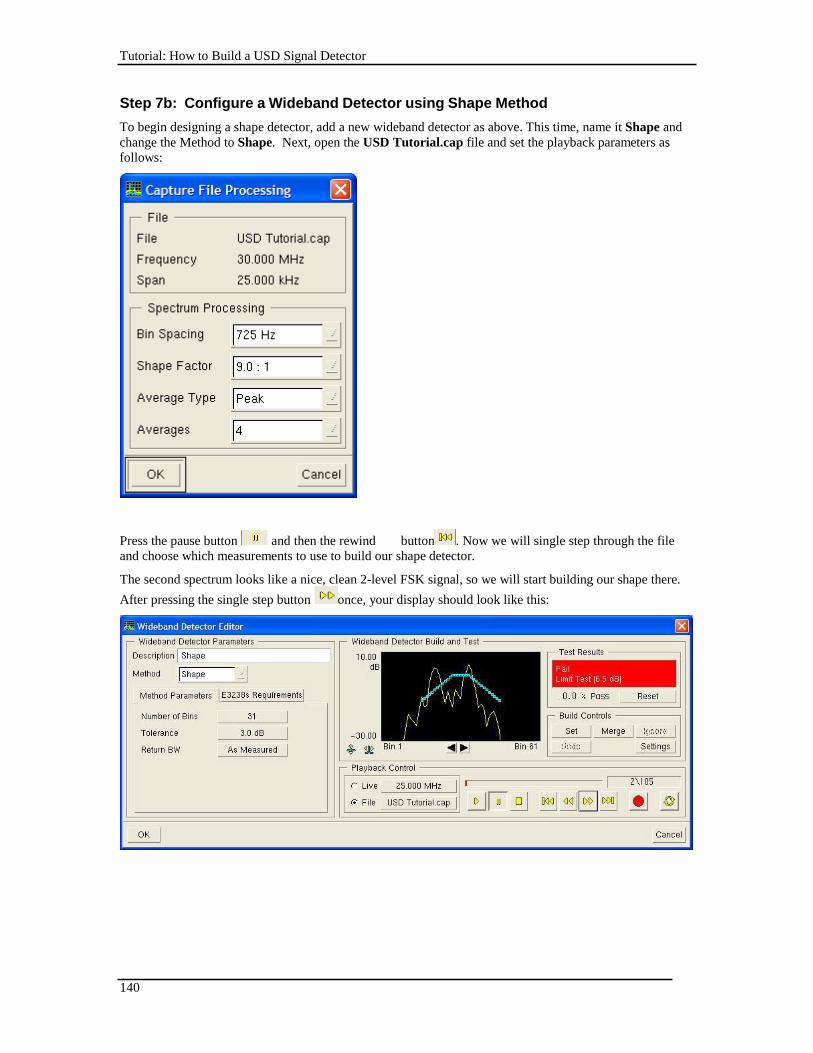
Tutorial: How to Build a USD Signal Detector
140
Step 7b: Configure a Wideband Detector using Shape Method
To begin designing a shape detector, add a new wideband detector as above. This time, name it Shape and
change the Method to Shape. Next, open the USD Tutorial.cap file and set the playback parameters as
follows:
Press the pause button and then the rewind button . Now we will single step through the file
and choose which measurements to use to build our shape detector.
The second spectrum looks like a nice, clean 2-level FSK signal, so we will start building our shape there.
After pressing the single step button once, your display should look like this:
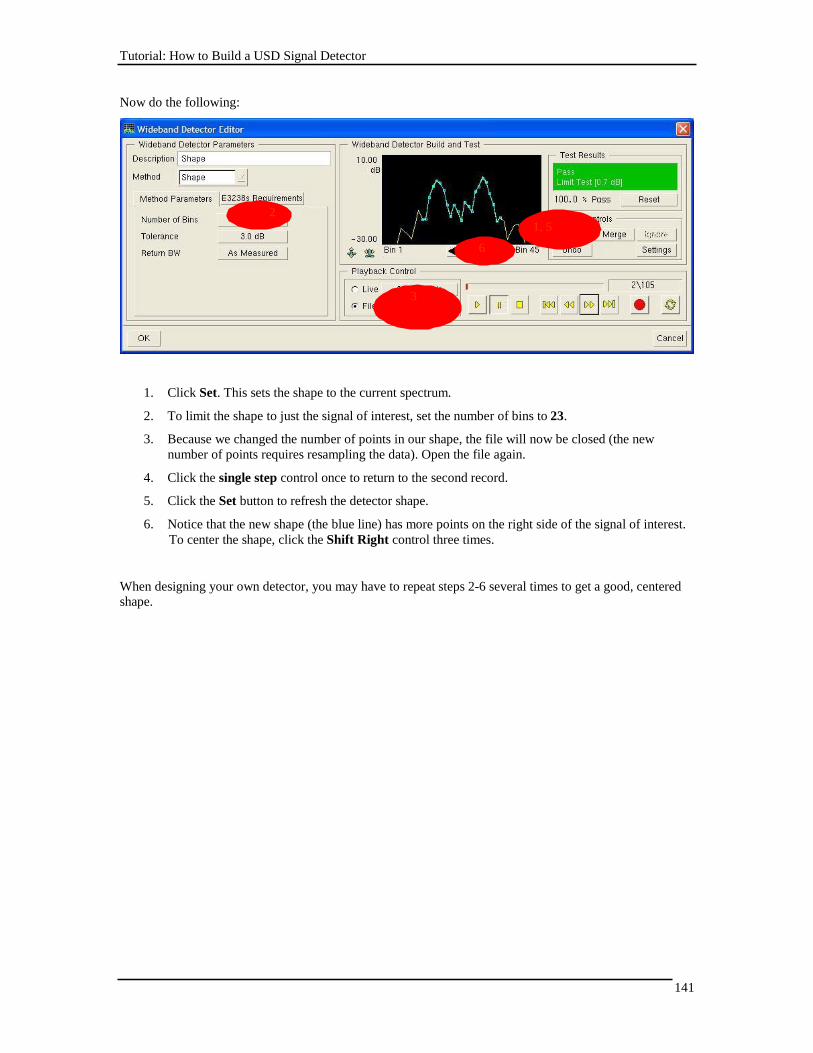
Tutorial: How to Build a USD Signal Detector
141
Now do the following:
2
1, 5
6
3
1. Click Set. This sets the shape to the current spectrum.
2. To limit the shape to just the signal of interest, set the number of bins to 23.
3. Because we changed the number of points in our shape, the file will now be closed (the new
number of points requires resampling the data). Open the file again.
4. Click the single step control once to return to the second record.
5. Click the Set button to refresh the detector shape.
6. Notice that the new shape (the blue line) has more points on the right side of the signal of interest.
To center the shape, click the Shift Right control three times.
When designing your own detector, you may have to repeat steps 2-6 several times to get a good, centered
shape.
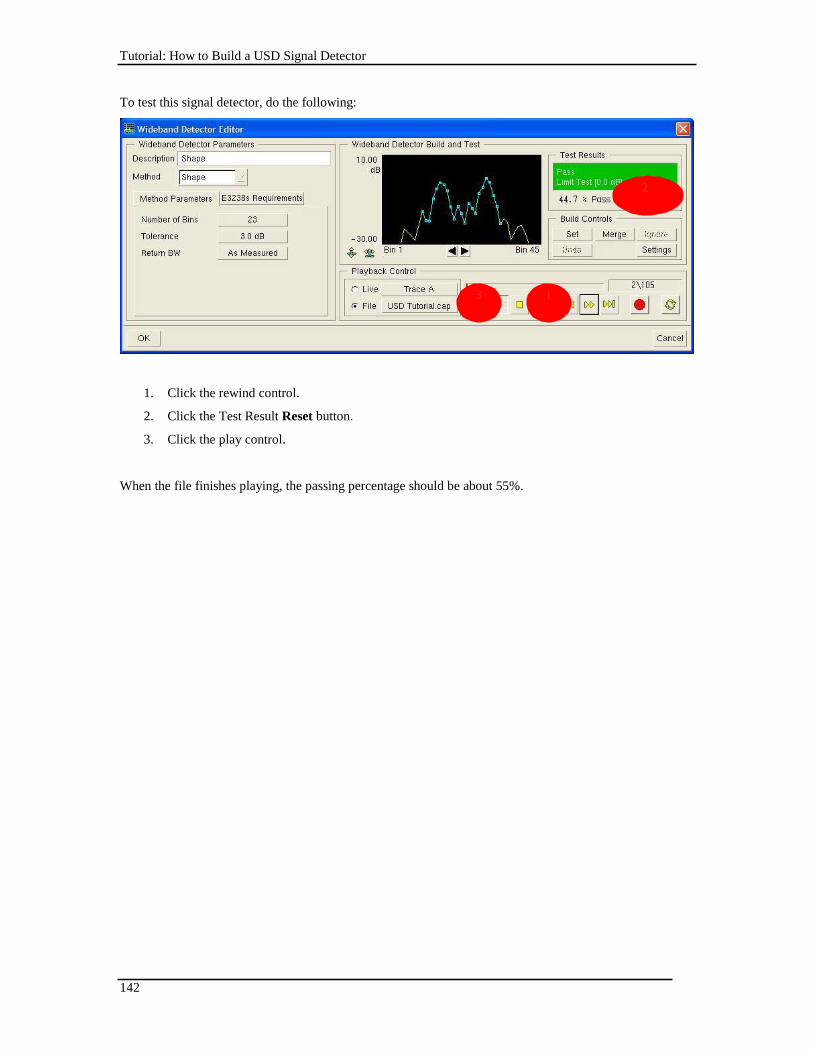
Tutorial: How to Build a USD Signal Detector
142
To test this signal detector, do the following:
2
3 1
1. Click the rewind control.
2. Click the Test Result Reset button.
3. Click the play control.
When the file finishes playing, the passing percentage should be about 55%.
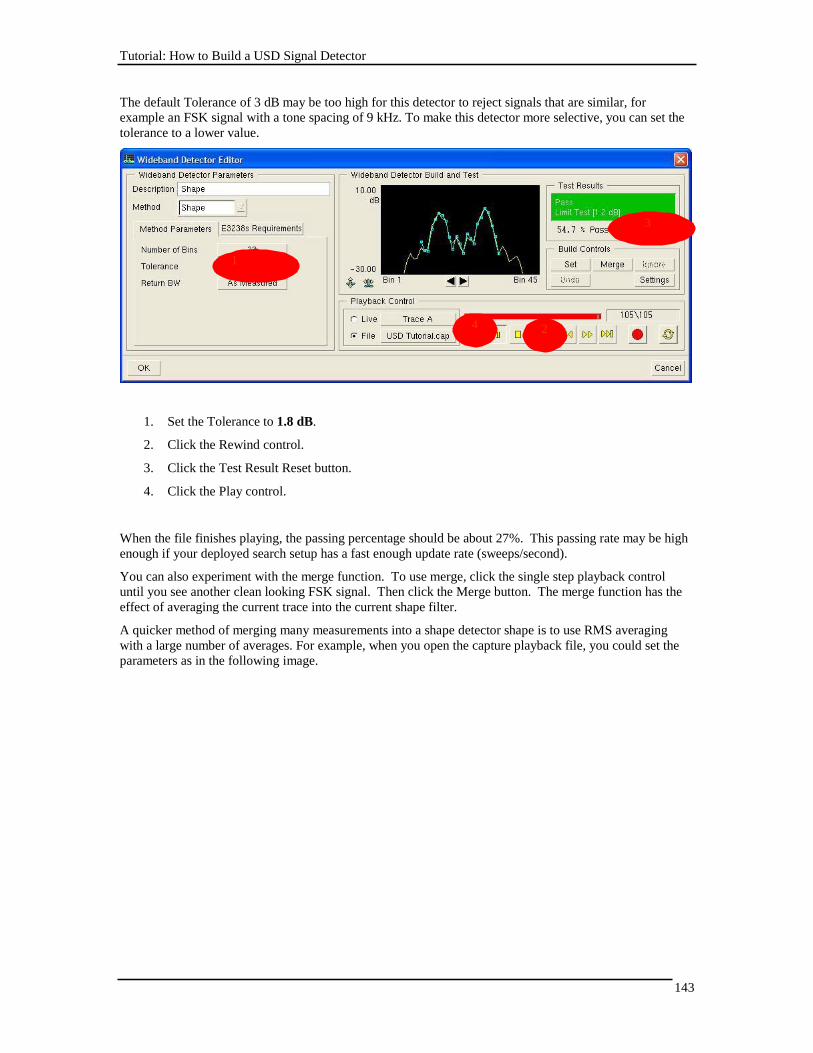
Tutorial: How to Build a USD Signal Detector
143
The default Tolerance of 3 dB may be too high for this detector to reject signals that are similar, for
example an FSK signal with a tone spacing of 9 kHz. To make this detector more selective, you can set the
tolerance to a lower value.
3
1
4 2
1. Set the Tolerance to 1.8 dB.
2. Click the Rewind control.
3. Click the Test Result Reset button.
4. Click the Play control.
When the file finishes playing, the passing percentage should be about 27%. This passing rate may be high
enough if your deployed search setup has a fast enough update rate (sweeps/second).
You can also experiment with the merge function. To use merge, click the single step playback control
until you see another clean looking FSK signal. Then click the Merge button. The merge function has the
effect of averaging the current trace into the current shape filter.
A quicker method of merging many measurements into a shape detector shape is to use RMS averaging
with a large number of averages. For example, when you open the capture playback file, you could set the
parameters as in the following image.
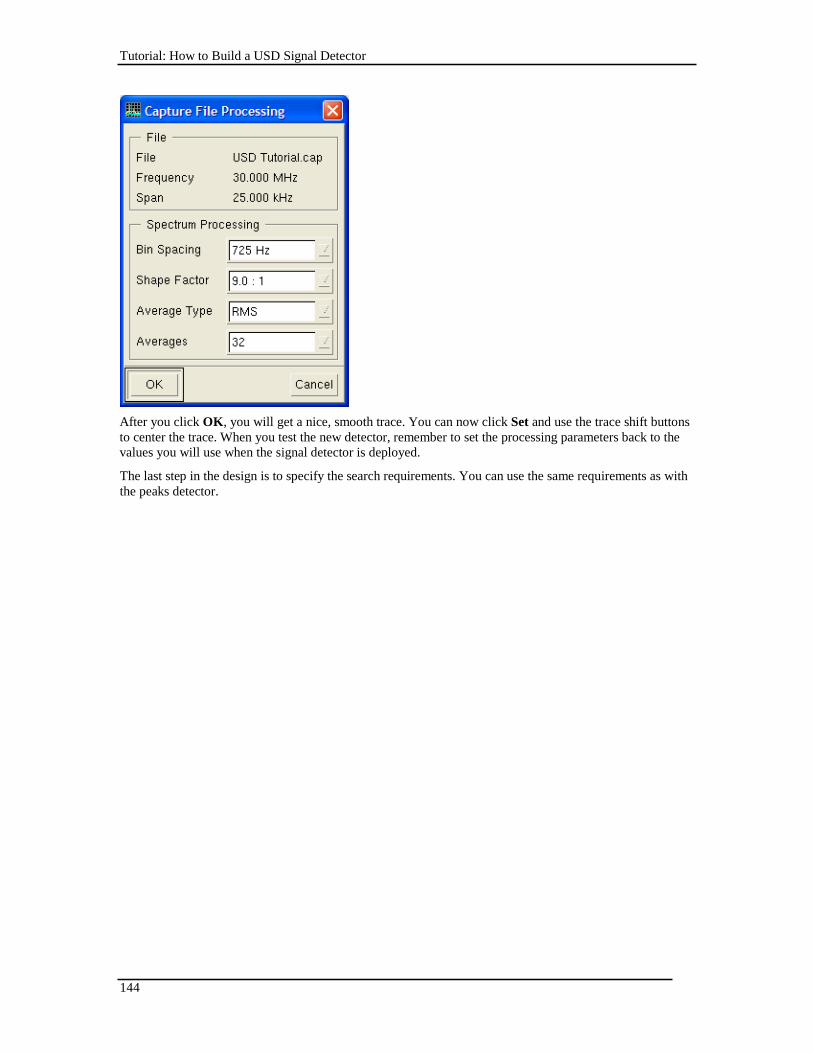
Tutorial: How to Build a USD Signal Detector
144
After you click OK, you will get a nice, smooth trace. You can now click Set and use the trace shift buttons
to center the trace. When you test the new detector, remember to set the processing parameters back to the
values you will use when the signal detector is deployed.
The last step in the design is to specify the search requirements. You can use the same requirements as with
the peaks detector.
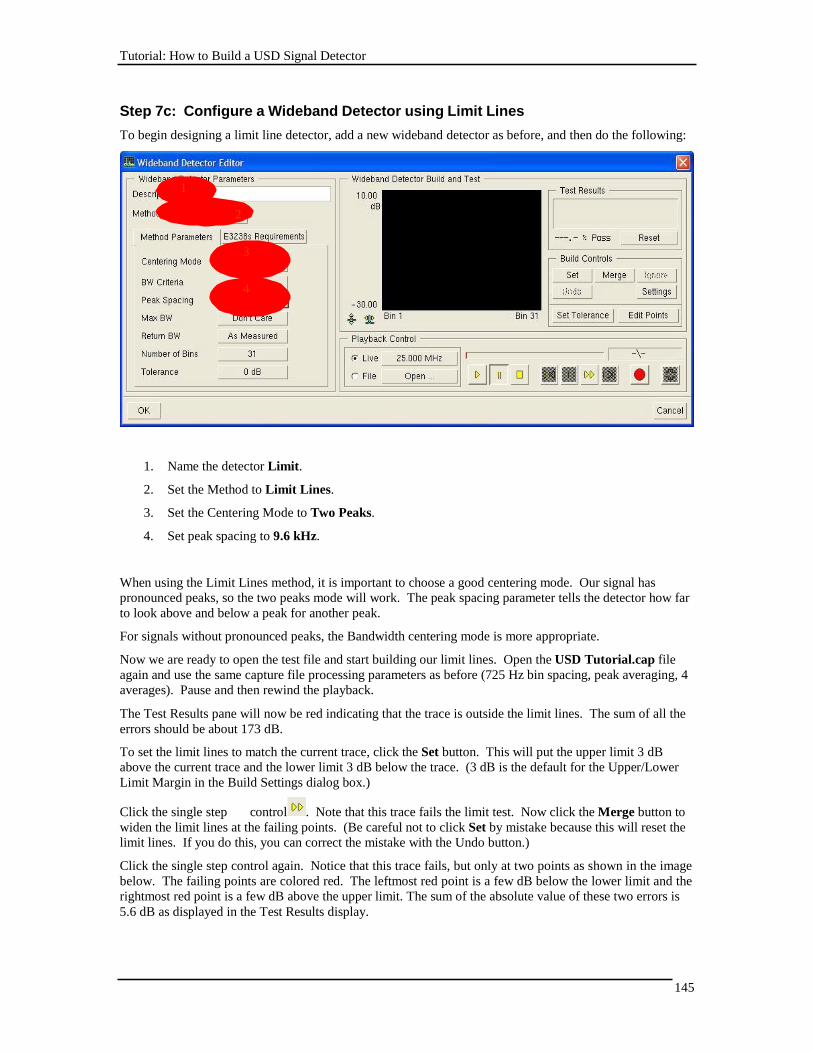
Tutorial: How to Build a USD Signal Detector
145
Step 7c: Configure a Wideband Detector using Limit Lines
To begin designing a limit line detector, add a new wideband detector as before, and then do the following:
1
2
3
4
1. Name the detector Limit.
2. Set the Method to Limit Lines.
3. Set the Centering Mode to Two Peaks.
4. Set peak spacing to 9.6 kHz.
When using the Limit Lines method, it is important to choose a good centering mode. Our signal has
pronounced peaks, so the two peaks mode will work. The peak spacing parameter tells the detector how far
to look above and below a peak for another peak.
For signals without pronounced peaks, the Bandwidth centering mode is more appropriate.
Now we are ready to open the test file and start building our limit lines. Open the USD Tutorial.cap file
again and use the same capture file processing parameters as before (725 Hz bin spacing, peak averaging, 4
averages). Pause and then rewind the playback.
The Test Results pane will now be red indicating that the trace is outside the limit lines. The sum of all the
errors should be about 173 dB.
To set the limit lines to match the current trace, click the Set button. This will put the upper limit 3 dB
above the current trace and the lower limit 3 dB below the trace. (3 dB is the default for the Upper/Lower
Limit Margin in the Build Settings dialog box.)
Click the single step control . Note that this trace fails the limit test. Now click the Merge button to
widen the limit lines at the failing points. (Be careful not to click Set by mistake because this will reset the
limit lines. If you do this, you can correct the mistake with the Undo button.)
Click the single step control again. Notice that this trace fails, but only at two points as shown in the image
below. The failing points are colored red. The leftmost red point is a few dB below the lower limit and the
rightmost red point is a few dB above the upper limit. The sum of the absolute value of these two errors is
5.6 dB as displayed in the Test Results display.
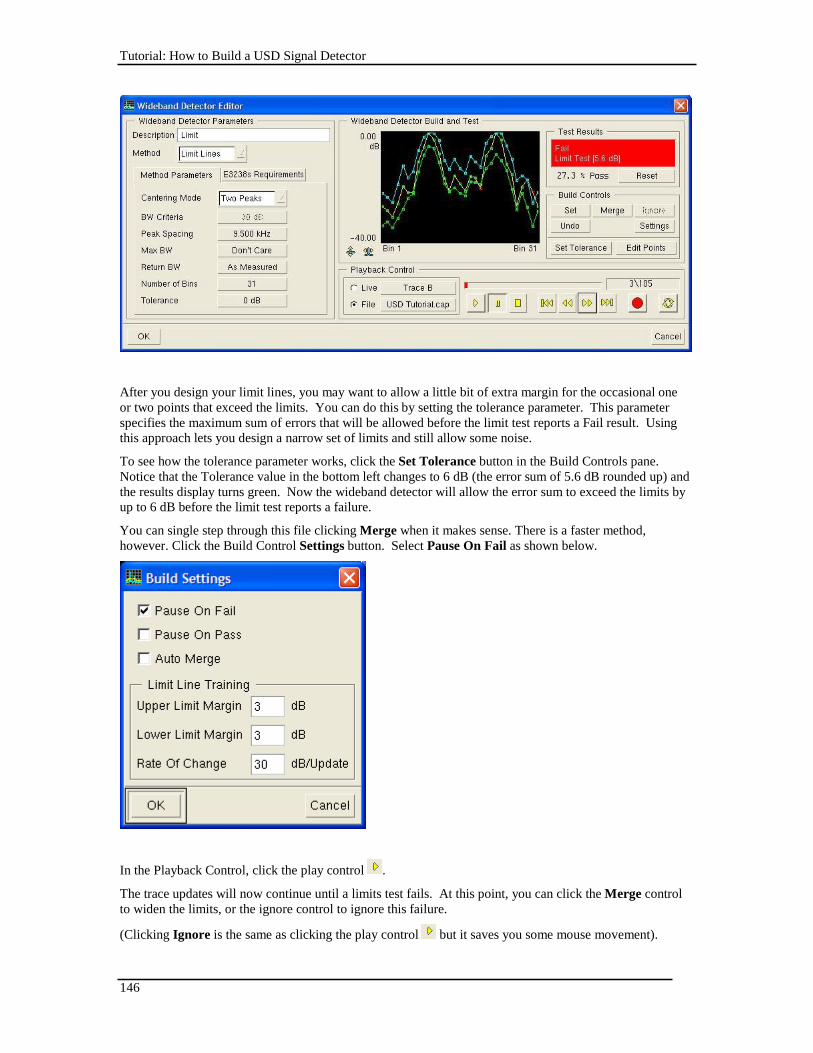
Tutorial: How to Build a USD Signal Detector
146
After you design your limit lines, you may want to allow a little bit of extra margin for the occasional one
or two points that exceed the limits. You can do this by setting the tolerance parameter. This parameter
specifies the maximum sum of errors that will be allowed before the limit test reports a Fail result. Using
this approach lets you design a narrow set of limits and still allow some noise.
To see how the tolerance parameter works, click the Set Tolerance button in the Build Controls pane.
Notice that the Tolerance value in the bottom left changes to 6 dB (the error sum of 5.6 dB rounded up) and
the results display turns green. Now the wideband detector will allow the error sum to exceed the limits by
up to 6 dB before the limit test reports a failure.
You can single step through this file clicking Merge when it makes sense. There is a faster method,
however. Click the Build Control Settings button. Select Pause On Fail as shown below.
In the Playback Control, click the play control .
The trace updates will now continue until a limits test fails. At this point, you can click the Merge control
to widen the limits, or the ignore control to ignore this failure.
(Clicking Ignore is the same as clicking the play control but it saves you some mouse movement).
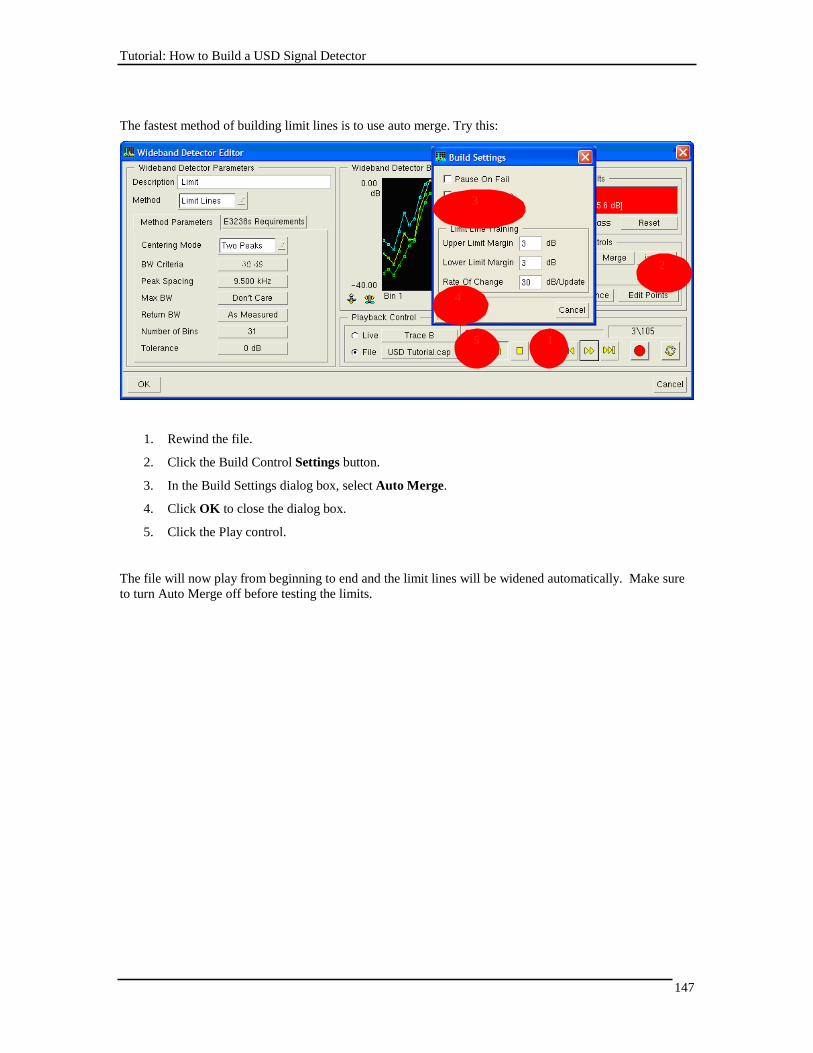
Tutorial: How to Build a USD Signal Detector
147
The fastest method of building limit lines is to use auto merge. Try this:
3
2
4
5 1
1. Rewind the file.
2. Click the Build Control Settings button.
3. In the Build Settings dialog box, select Auto Merge.
4. Click OK to close the dialog box.
5. Click the Play control.
The file will now play from beginning to end and the limit lines will be widened automatically. Make sure
to turn Auto Merge off before testing the limits.
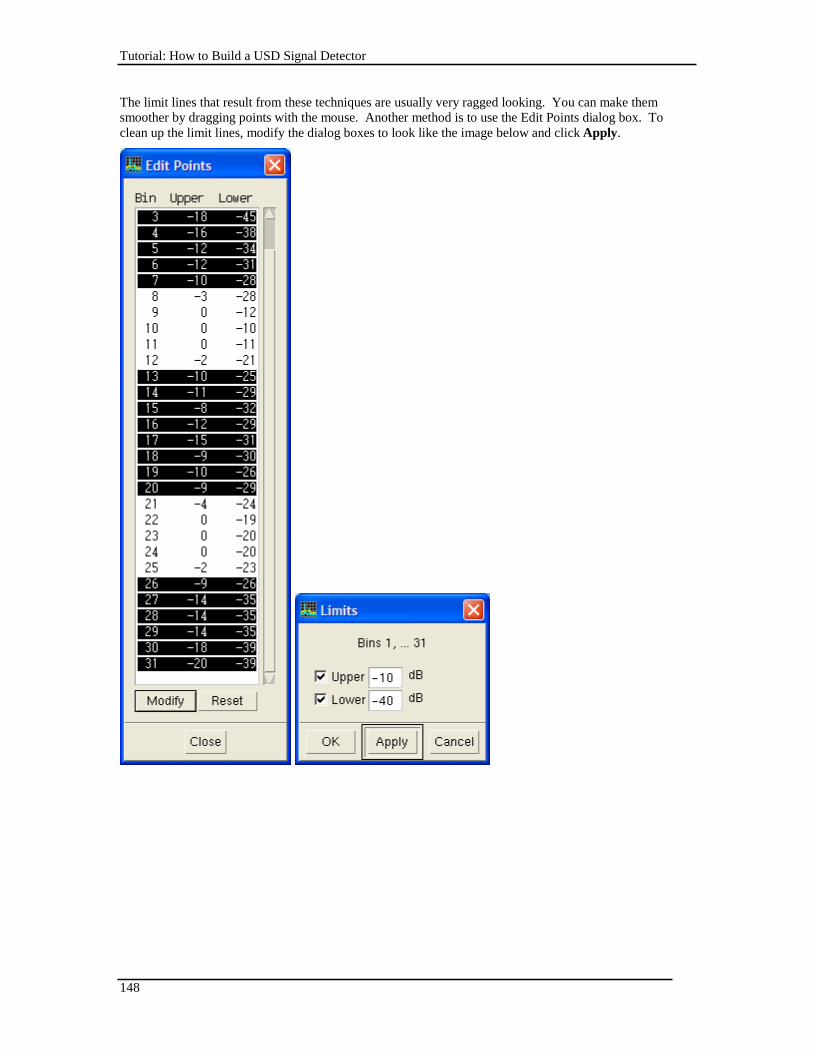
Tutorial: How to Build a USD Signal Detector
148
The limit lines that result from these techniques are usually very ragged looking. You can make them
smoother by dragging points with the mouse. Another method is to use the Edit Points dialog box. To
clean up the limit lines, modify the dialog boxes to look like the image below and click Apply.
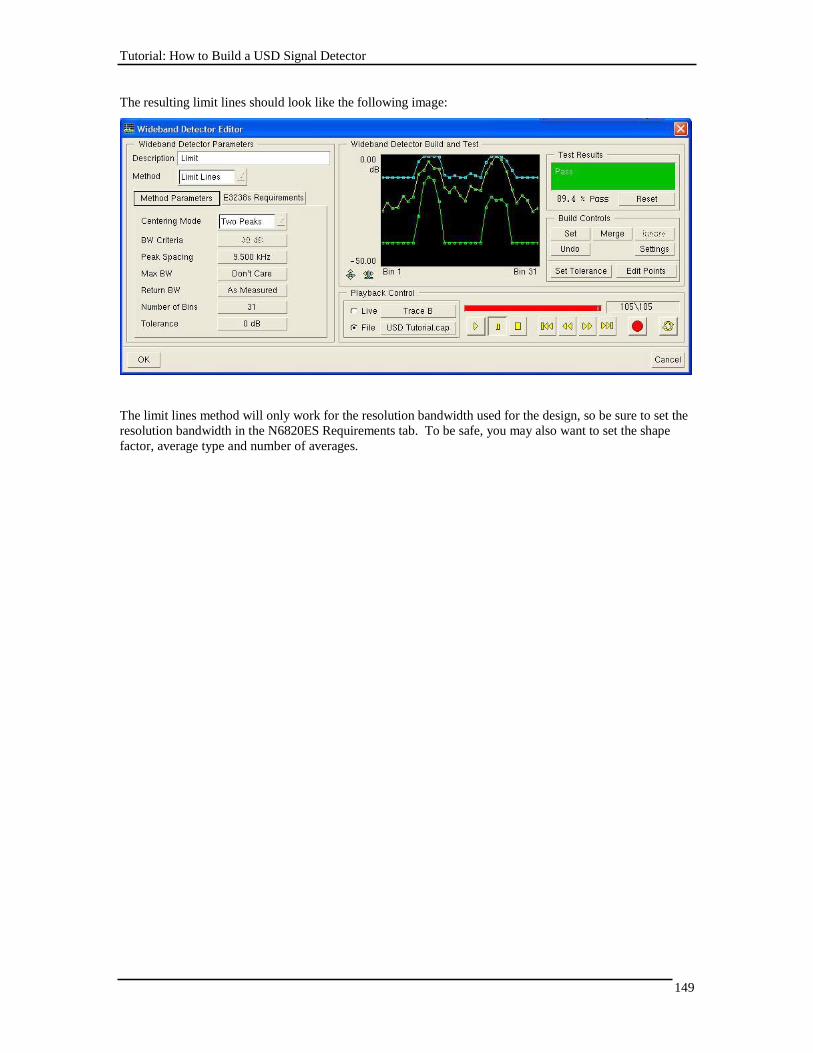
Tutorial: How to Build a USD Signal Detector
149
The resulting limit lines should look like the following image:
The limit lines method will only work for the resolution bandwidth used for the design, so be sure to set the
resolution bandwidth in the N6820ES Requirements tab. To be safe, you may also want to set the shape
factor, average type and number of averages.
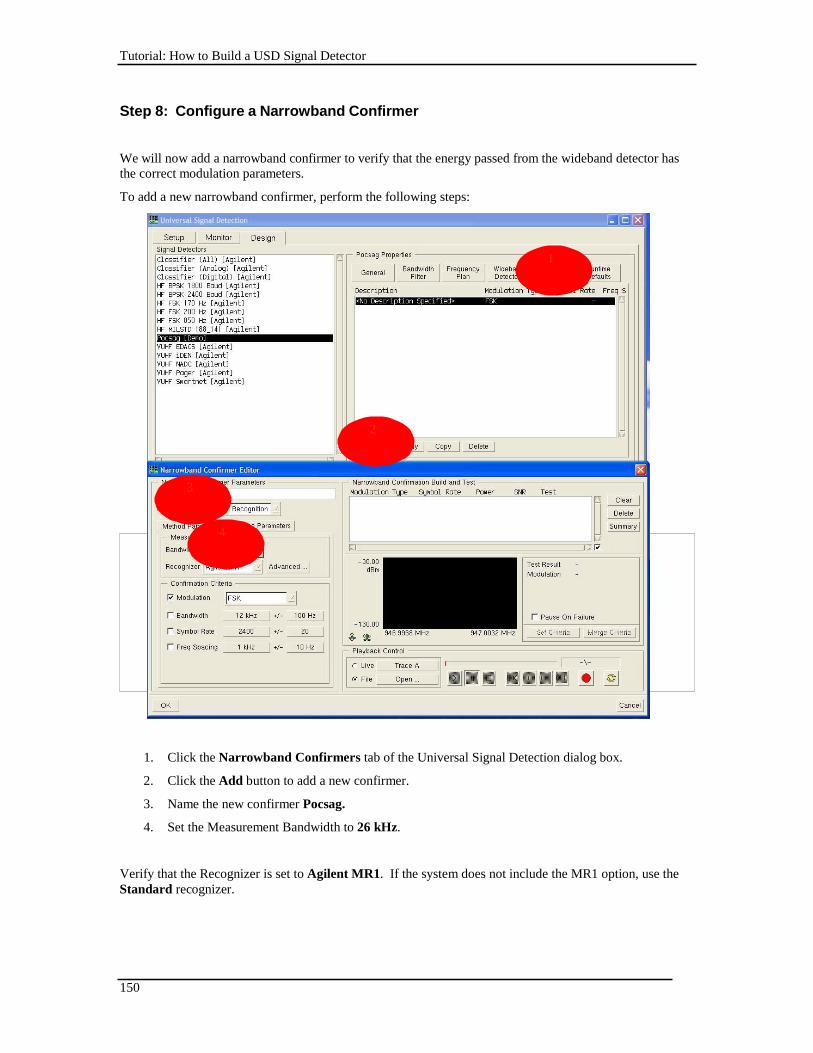
Tutorial: How to Build a USD Signal Detector
150
Step 8: Configure a Narrowband Confirmer
We will now add a narrowband confirmer to verify that the energy passed from the wideband detector has
the correct modulation parameters.
To add a new narrowband confirmer, perform the following steps:
1
2
3
4
1. Click the Narrowband Confirmers tab of the Universal Signal Detection dialog box.
2. Click the Add button to add a new confirmer.
3. Name the new confirmer Pocsag.
4. Set the Measurement Bandwidth to 26 kHz.
Verify that the Recognizer is set to Agilent MR1. If the system does not include the MR1 option, use the
Standard recognizer.
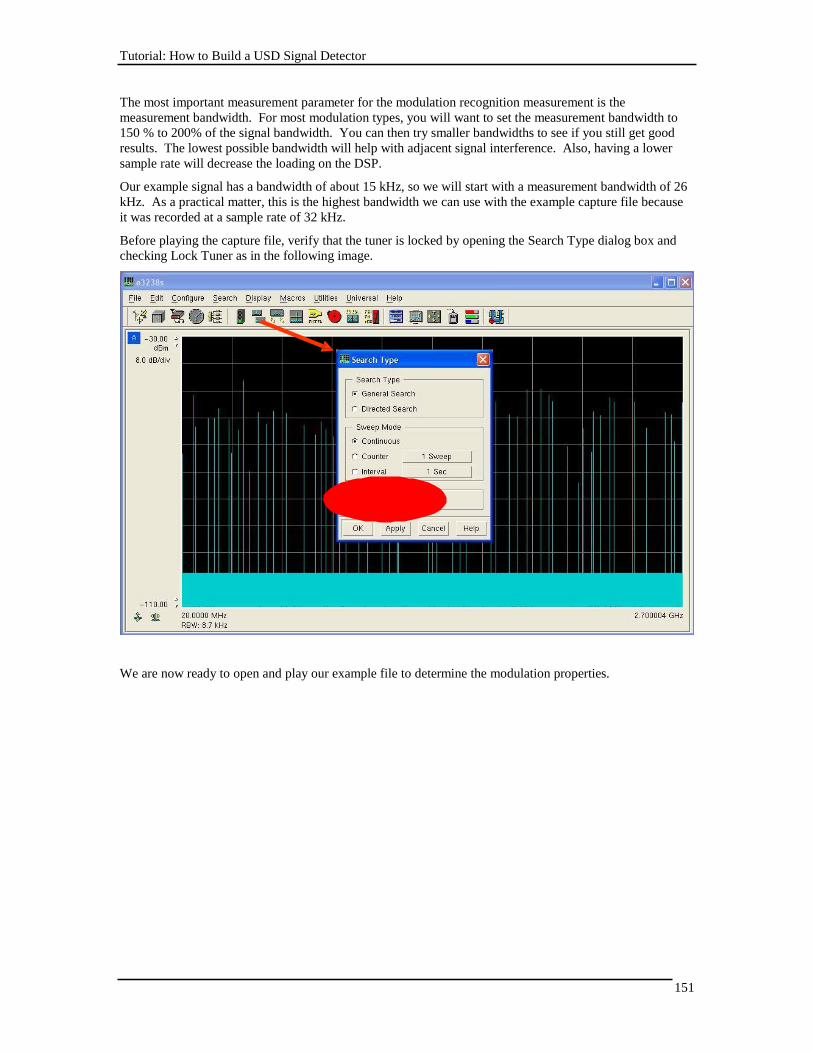
Tutorial: How to Build a USD Signal Detector
151
The most important measurement parameter for the modulation recognition measurement is the
measurement bandwidth. For most modulation types, you will want to set the measurement bandwidth to
150 % to 200% of the signal bandwidth. You can then try smaller bandwidths to see if you still get good
results. The lowest possible bandwidth will help with adjacent signal interference. Also, having a lower
sample rate will decrease the loading on the DSP.
Our example signal has a bandwidth of about 15 kHz, so we will start with a measurement bandwidth of 26
kHz. As a practical matter, this is the highest bandwidth we can use with the example capture file because
it was recorded at a sample rate of 32 kHz.
Before playing the capture file, verify that the tuner is locked by opening the Search Type dialog box and
checking Lock Tuner as in the following image.
We are now ready to open and play our example file to determine the modulation properties.
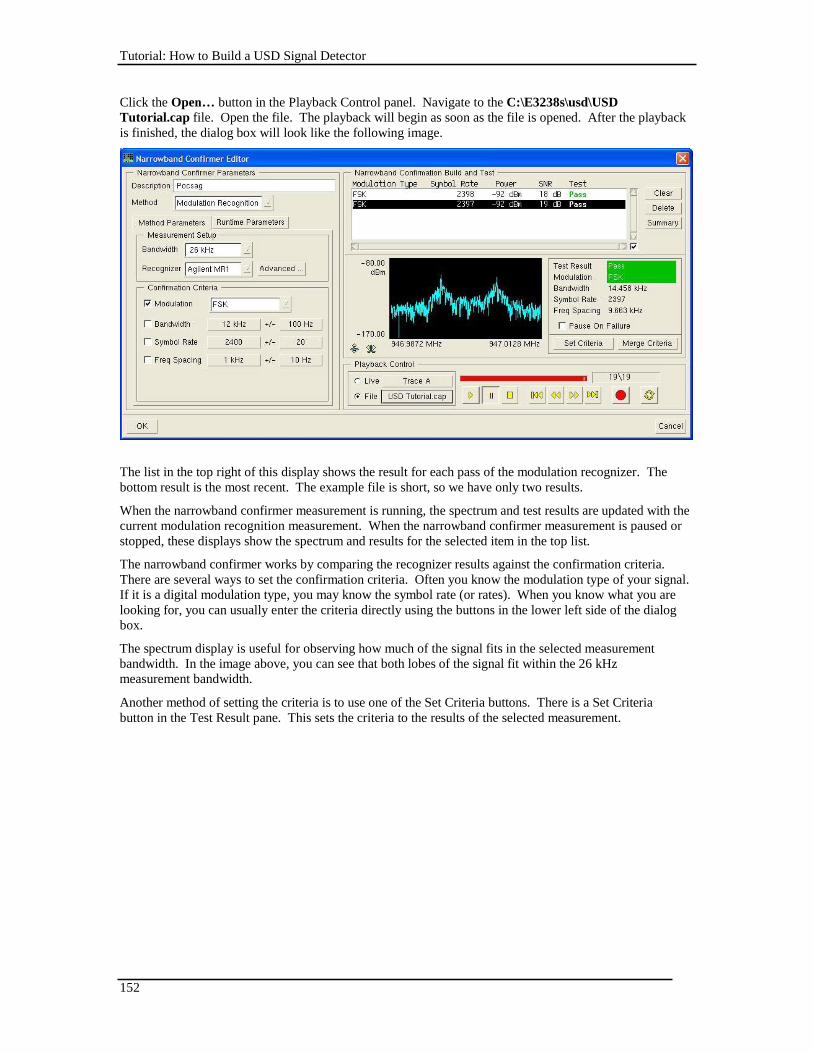
Tutorial: How to Build a USD Signal Detector
152
Click the Open… button in the Playback Control panel. Navigate to the C:\E3238s\usd\USD
Tutorial.cap file. Open the file. The playback will begin as soon as the file is opened. After the playback
is finished, the dialog box will look like the following image.
The list in the top right of this display shows the result for each pass of the modulation recognizer. The
bottom result is the most recent. The example file is short, so we have only two results.
When the narrowband confirmer measurement is running, the spectrum and test results are updated with the
current modulation recognition measurement. When the narrowband confirmer measurement is paused or
stopped, these displays show the spectrum and results for the selected item in the top list.
The narrowband confirmer works by comparing the recognizer results against the confirmation criteria.
There are several ways to set the confirmation criteria. Often you know the modulation type of your signal.
If it is a digital modulation type, you may know the symbol rate (or rates). When you know what you are
looking for, you can usually enter the criteria directly using the buttons in the lower left side of the dialog
box.
The spectrum display is useful for observing how much of the signal fits in the selected measurement
bandwidth. In the image above, you can see that both lobes of the signal fit within the 26 kHz
measurement bandwidth.
Another method of setting the criteria is to use one of the Set Criteria buttons. There is a Set Criteria
button in the Test Result pane. This sets the criteria to the results of the selected measurement.
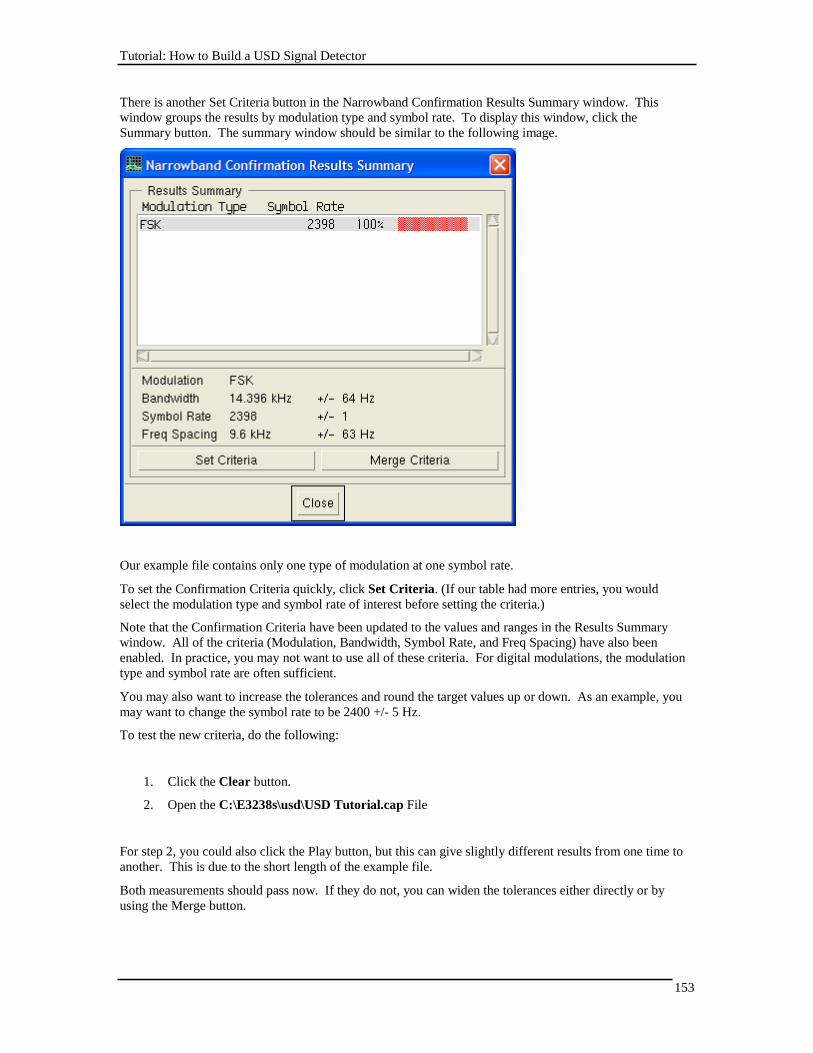
Tutorial: How to Build a USD Signal Detector
153
There is another Set Criteria button in the Narrowband Confirmation Results Summary window. This
window groups the results by modulation type and symbol rate. To display this window, click the
Summary button. The summary window should be similar to the following image.
Our example file contains only one type of modulation at one symbol rate.
To set the Confirmation Criteria quickly, click Set Criteria. (If our table had more entries, you would
select the modulation type and symbol rate of interest before setting the criteria.)
Note that the Confirmation Criteria have been updated to the values and ranges in the Results Summary
window. All of the criteria (Modulation, Bandwidth, Symbol Rate, and Freq Spacing) have also been
enabled. In practice, you may not want to use all of these criteria. For digital modulations, the modulation
type and symbol rate are often sufficient.
You may also want to increase the tolerances and round the target values up or down. As an example, you
may want to change the symbol rate to be 2400 +/- 5 Hz.
To test the new criteria, do the following:
1. Click the Clear button.
2. Open the C:\E3238s\usd\USD Tutorial.cap File
For step 2, you could also click the Play button, but this can give slightly different results from one time to
another. This is due to the short length of the example file.
Both measurements should pass now. If they do not, you can widen the tolerances either directly or by
using the Merge button.
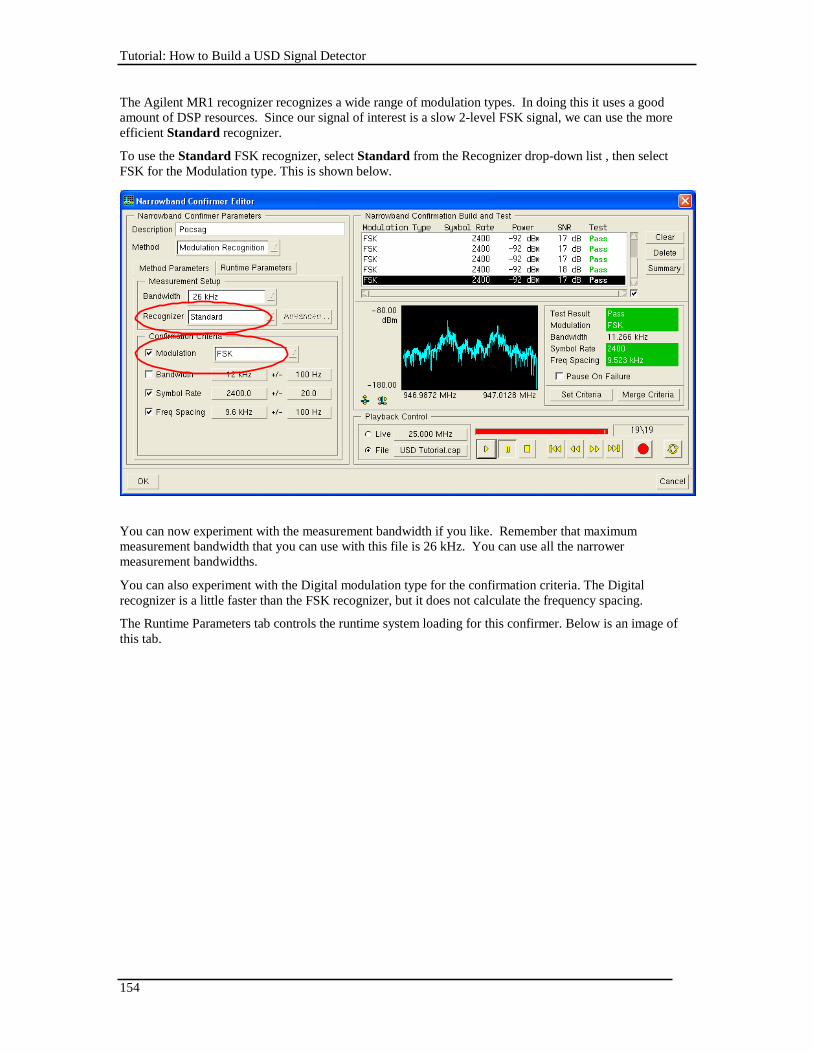
Tutorial: How to Build a USD Signal Detector
154
The Agilent MR1 recognizer recognizes a wide range of modulation types. In doing this it uses a good
amount of DSP resources. Since our signal of interest is a slow 2-level FSK signal, we can use the more
efficient Standard recognizer.
To use the Standard FSK recognizer, select Standard from the Recognizer drop-down list , then select
FSK for the Modulation type. This is shown below.
You can now experiment with the measurement bandwidth if you like. Remember that maximum
measurement bandwidth that you can use with this file is 26 kHz. You can use all the narrower
measurement bandwidths.
You can also experiment with the Digital modulation type for the confirmation criteria. The Digital
recognizer is a little faster than the FSK recognizer, but it does not calculate the frequency spacing.
The Runtime Parameters tab controls the runtime system loading for this confirmer. Below is an image of
this tab.
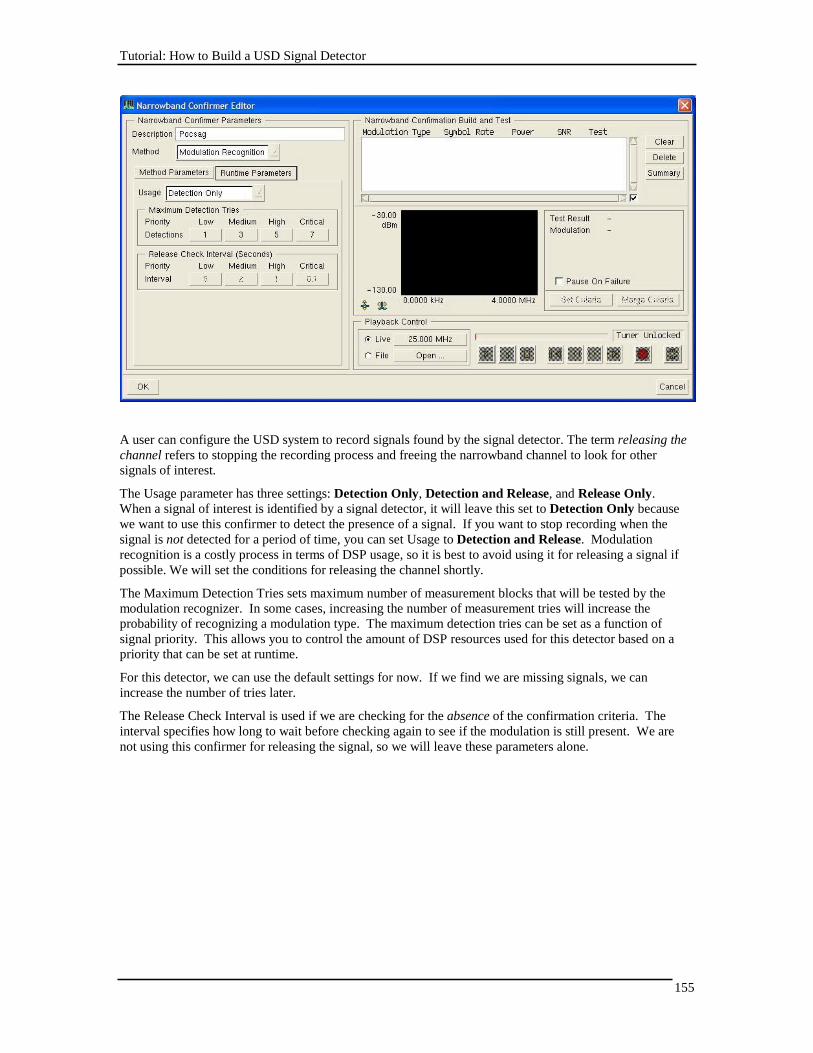
Tutorial: How to Build a USD Signal Detector
155
A user can configure the USD system to record signals found by the signal detector. The term releasing the
channel refers to stopping the recording process and freeing the narrowband channel to look for other
signals of interest.
The Usage parameter has three settings: Detection Only, Detection and Release, and Release Only.
When a signal of interest is identified by a signal detector, it will leave this set to Detection Only because
we want to use this confirmer to detect the presence of a signal. If you want to stop recording when the
signal is not detected for a period of time, you can set Usage to Detection and Release. Modulation
recognition is a costly process in terms of DSP usage, so it is best to avoid using it for releasing a signal if
possible. We will set the conditions for releasing the channel shortly.
The Maximum Detection Tries sets maximum number of measurement blocks that will be tested by the
modulation recognizer. In some cases, increasing the number of measurement tries will increase the
probability of recognizing a modulation type. The maximum detection tries can be set as a function of
signal priority. This allows you to control the amount of DSP resources used for this detector based on a
priority that can be set at runtime.
For this detector, we can use the default settings for now. If we find we are missing signals, we can
increase the number of tries later.
The Release Check Interval is used if we are checking for the absence of the confirmation criteria. The
interval specifies how long to wait before checking again to see if the modulation is still present. We are
not using this confirmer for releasing the signal, so we will leave these parameters alone.
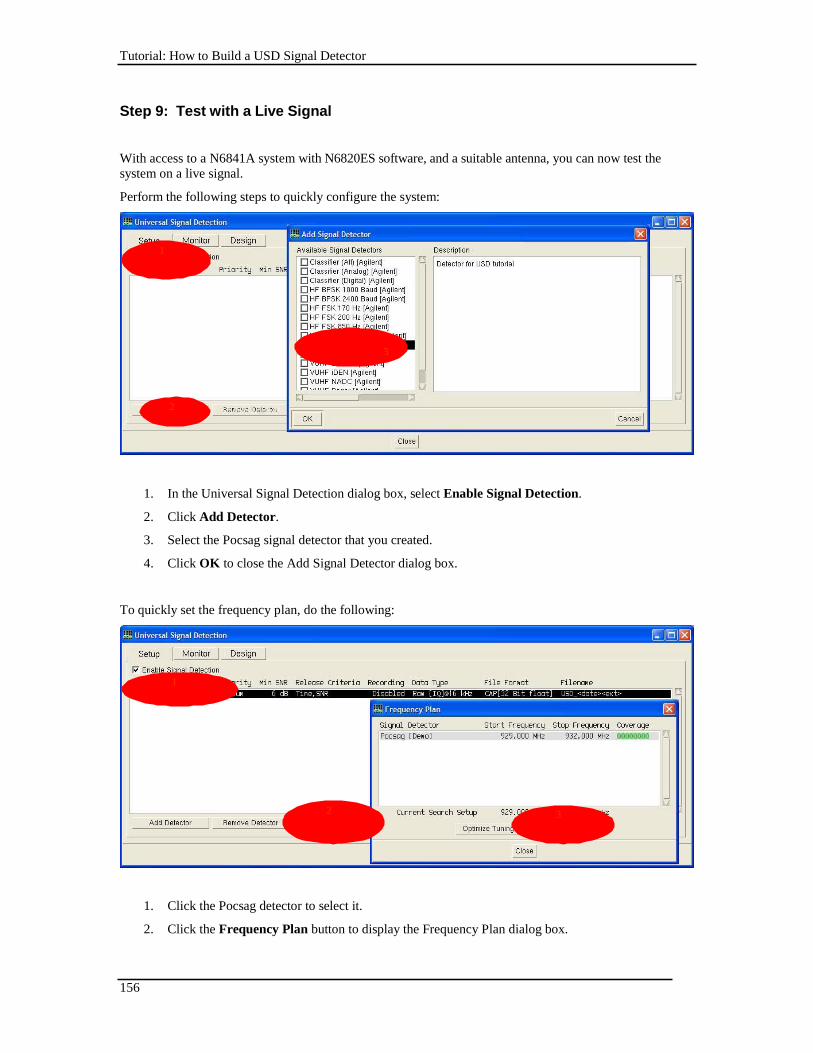
Tutorial: How to Build a USD Signal Detector
156
Step 9: Test with a Live Signal
With access to a N6841A system with N6820ES software, and a suitable antenna, you can now test the
system on a live signal.
Perform the following steps to quickly configure the system:
1
3
2
1. In the Universal Signal Detection dialog box, select Enable Signal Detection.
2. Click Add Detector.
3. Select the Pocsag signal detector that you created.
4. Click OK to close the Add Signal Detector dialog box.
To quickly set the frequency plan, do the following:
1
2 3
1. Click the Pocsag detector to select it.
2. Click the Frequency Plan button to display the Frequency Plan dialog box.

Tutorial: How to Build a USD Signal Detector
157
3. Click Tune to Band to set the search system frequency span.
4. Click Close.
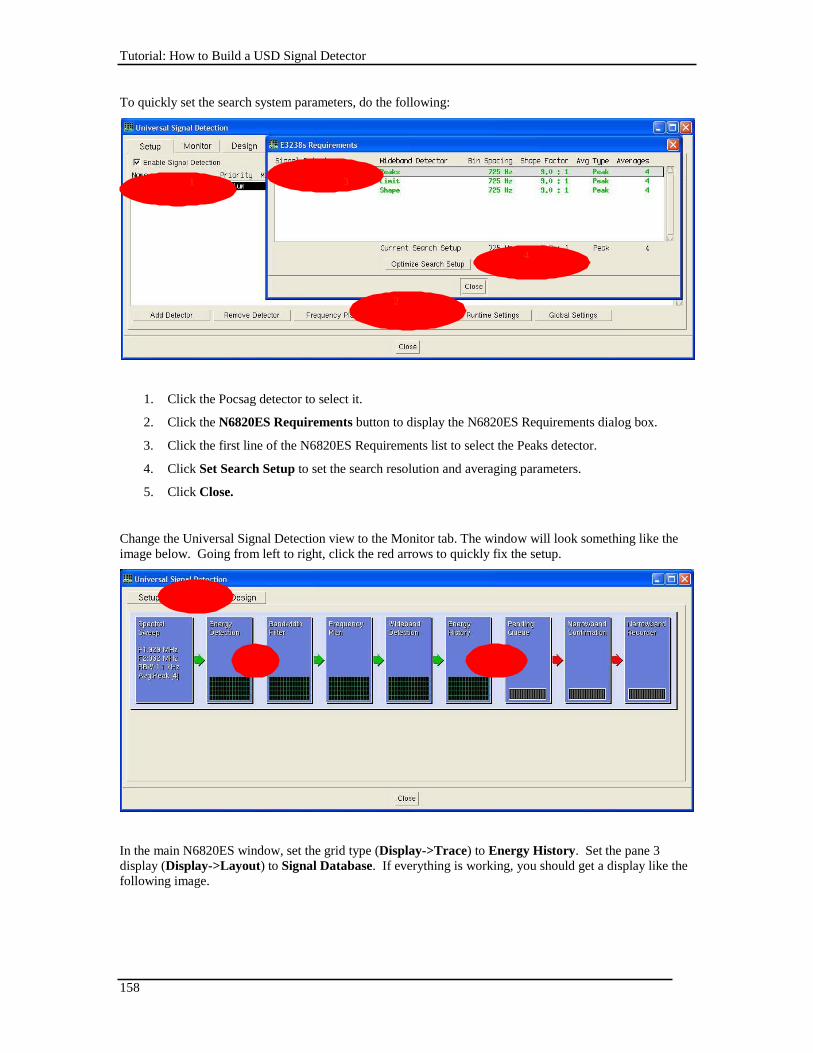
Tutorial: How to Build a USD Signal Detector
158
To quickly set the search system parameters, do the following:
1 3
4
2
1. Click the Pocsag detector to select it.
2. Click the N6820ES Requirements button to display the N6820ES Requirements dialog box.
3. Click the first line of the N6820ES Requirements list to select the Peaks detector.
4. Click Set Search Setup to set the search resolution and averaging parameters.
5. Click Close.
Change the Universal Signal Detection view to the Monitor tab. The window will look something like the
image below. Going from left to right, click the red arrows to quickly fix the setup.
In the main N6820ES window, set the grid type (Display->Trace) to Energy History. Set the pane 3
display (Display->Layout) to Signal Database. If everything is working, you should get a display like the
following image.
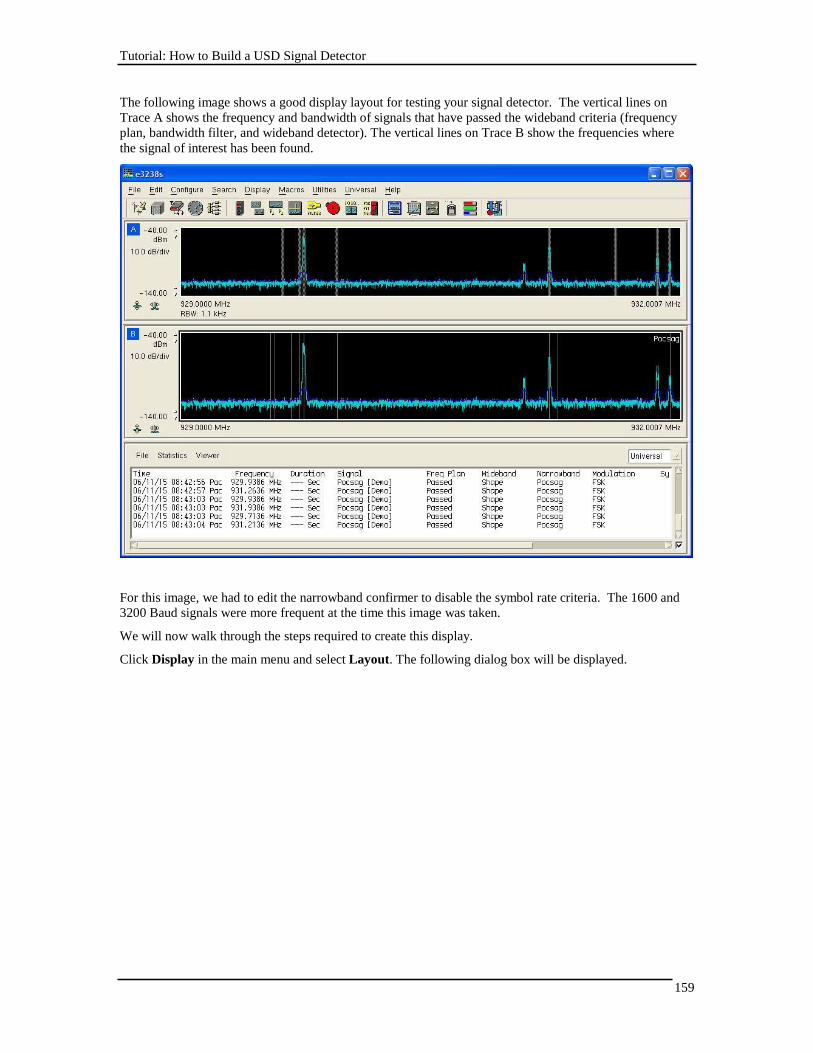
Tutorial: How to Build a USD Signal Detector
159
The following image shows a good display layout for testing your signal detector. The vertical lines on
Trace A shows the frequency and bandwidth of signals that have passed the wideband criteria (frequency
plan, bandwidth filter, and wideband detector). The vertical lines on Trace B show the frequencies where
the signal of interest has been found.
For this image, we had to edit the narrowband confirmer to disable the symbol rate criteria. The 1600 and
3200 Baud signals were more frequent at the time this image was taken.
We will now walk through the steps required to create this display.
Click Display in the main menu and select Layout. The following dialog box will be displayed.
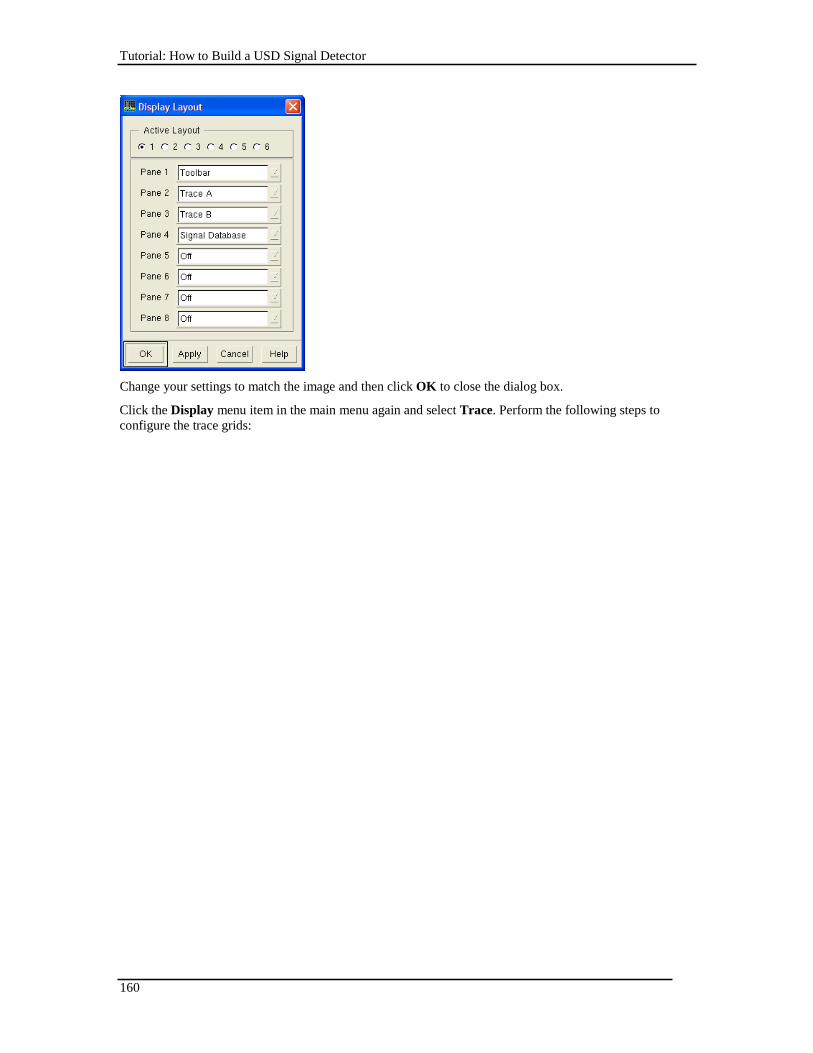
Tutorial: How to Build a USD Signal Detector
160
Change your settings to match the image and then click OK to close the dialog box.
Click the Display menu item in the main menu again and select Trace. Perform the following steps to
configure the trace grids:
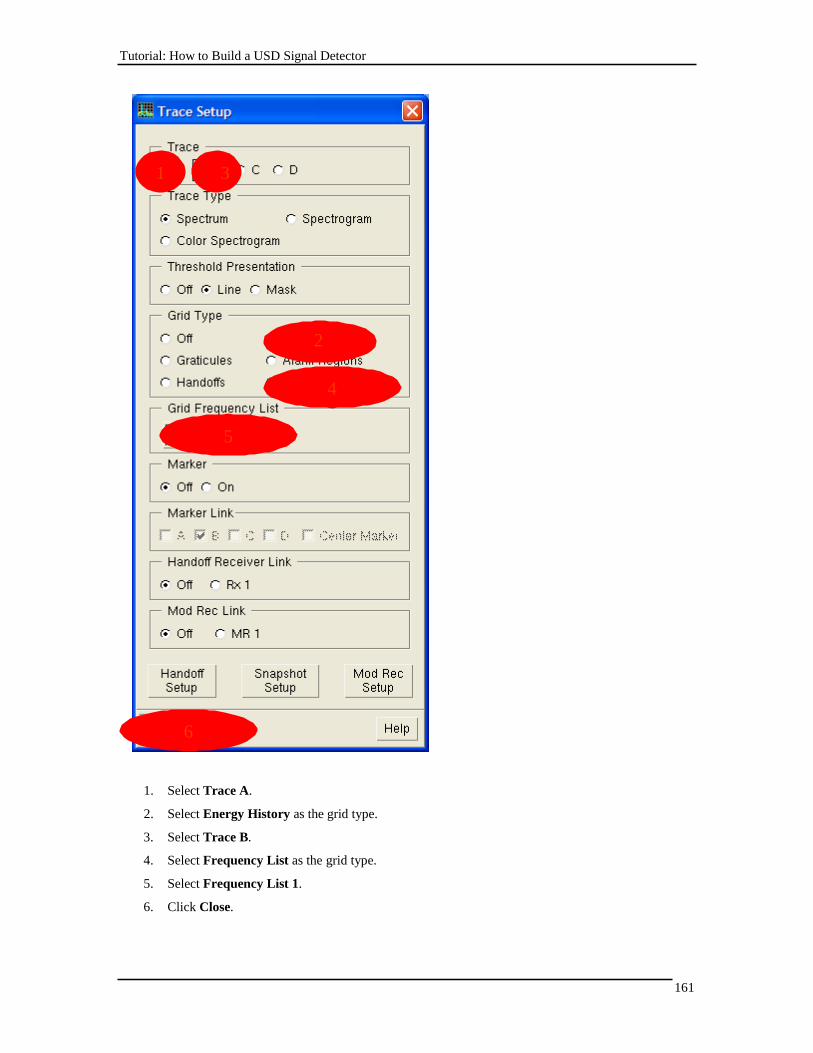
Tutorial: How to Build a USD Signal Detector
161
1 3
2
4
5
6
1. Select Trace A.
2. Select Energy History as the grid type.
3. Select Trace B.
4. Select Frequency List as the grid type.
5. Select Frequency List 1.
6. Click Close.
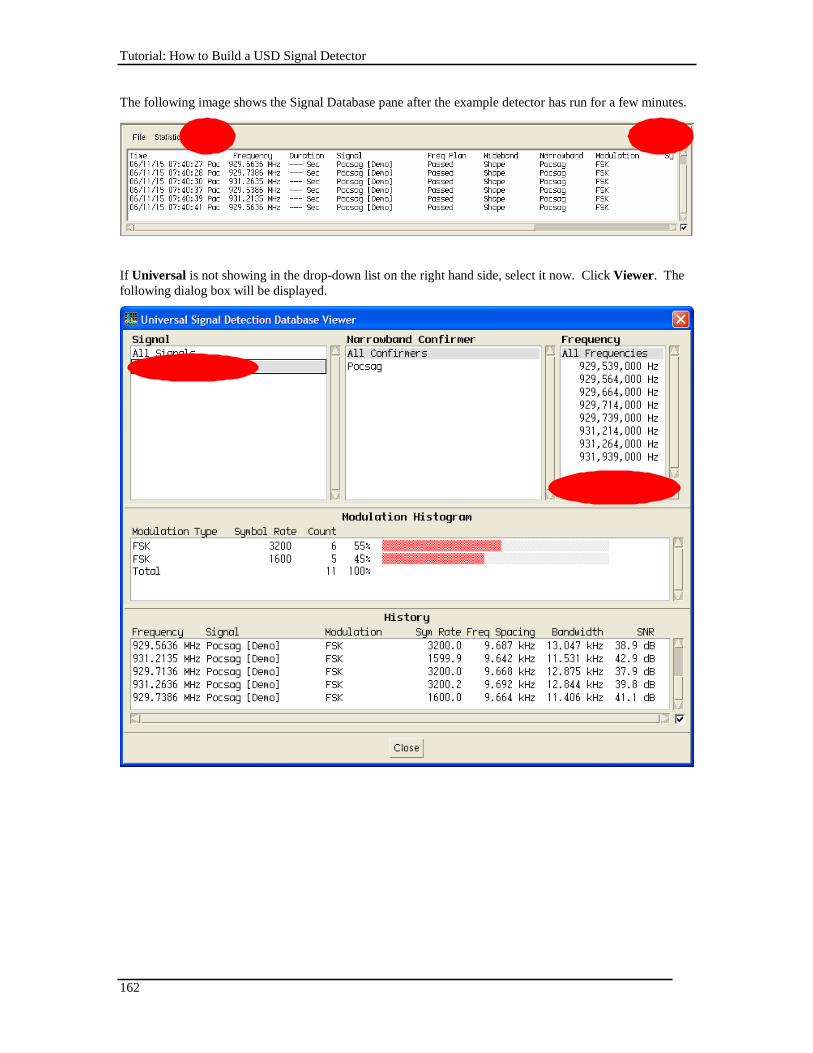
Tutorial: How to Build a USD Signal Detector
162
The following image shows the Signal Database pane after the example detector has run for a few minutes.
If Universal is not showing in the drop-down list on the right hand side, select it now. Click Viewer. The
following dialog box will be displayed.
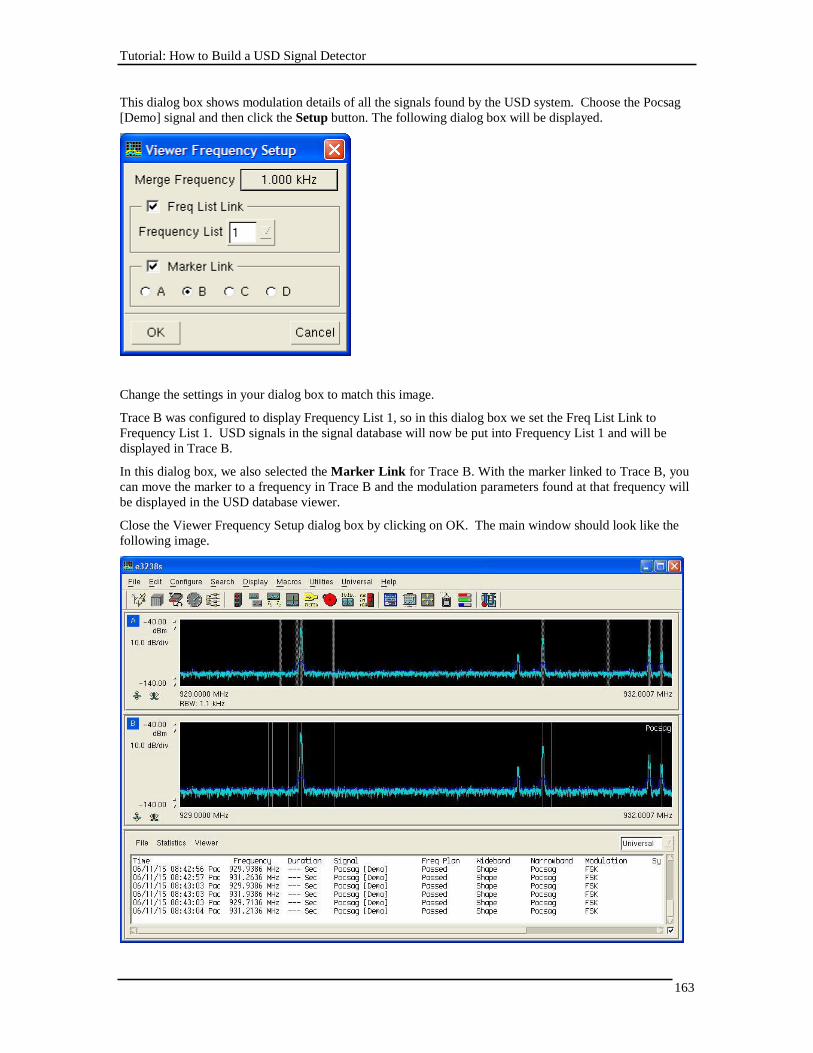
Tutorial: How to Build a USD Signal Detector
163
This dialog box shows modulation details of all the signals found by the USD system. Choose the Pocsag
[Demo] signal and then click the Setup button. The following dialog box will be displayed.
Change the settings in your dialog box to match this image.
Trace B was configured to display Frequency List 1, so in this dialog box we set the Freq List Link to
Frequency List 1. USD signals in the signal database will now be put into Frequency List 1 and will be
displayed in Trace B.
In this dialog box, we also selected the Marker Link for Trace B. With the marker linked to Trace B, you
can move the marker to a frequency in Trace B and the modulation parameters found at that frequency will
be displayed in the USD database viewer.
Close the Viewer Frequency Setup dialog box by clicking on OK. The main window should look like the
following image.
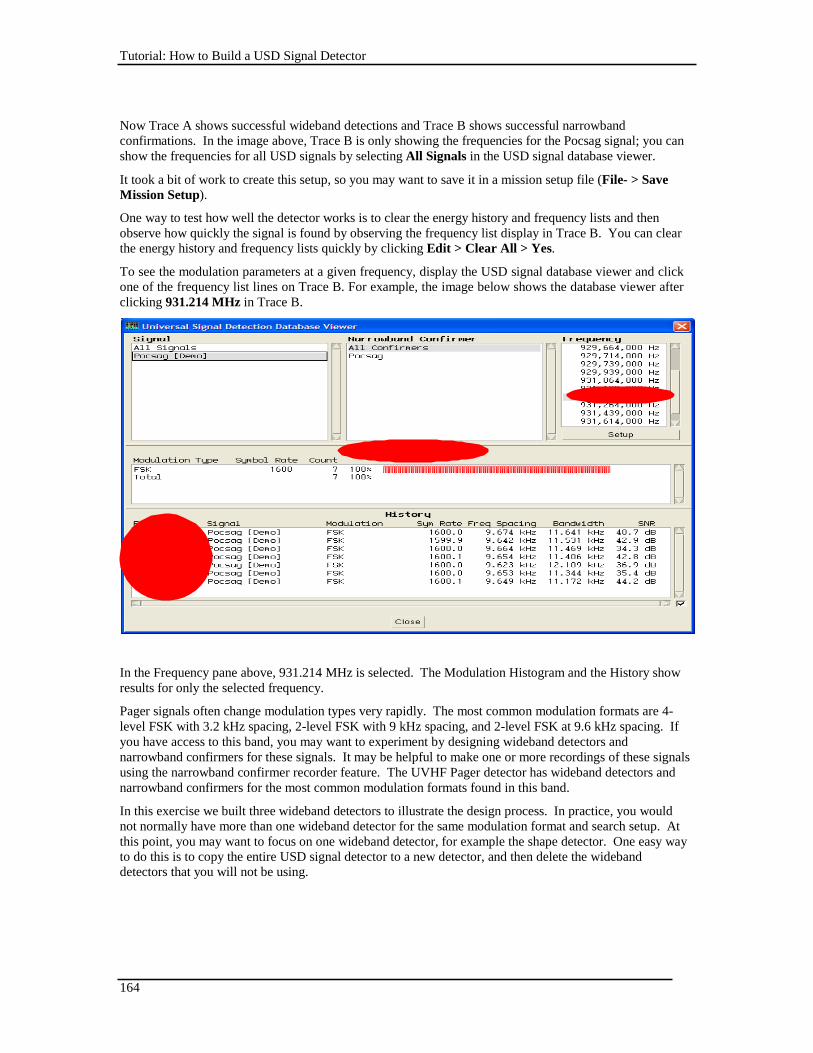
Tutorial: How to Build a USD Signal Detector
164
Now Trace A shows successful wideband detections and Trace B shows successful narrowband
confirmations. In the image above, Trace B is only showing the frequencies for the Pocsag signal; you can
show the frequencies for all USD signals by selecting All Signals in the USD signal database viewer.
It took a bit of work to create this setup, so you may want to save it in a mission setup file (File- > Save
Mission Setup).
One way to test how well the detector works is to clear the energy history and frequency lists and then
observe how quickly the signal is found by observing the frequency list display in Trace B. You can clear
the energy history and frequency lists quickly by clicking Edit > Clear All > Yes.
To see the modulation parameters at a given frequency, display the USD signal database viewer and click
one of the frequency list lines on Trace B. For example, the image below shows the database viewer after
clicking 931.214 MHz in Trace B.
In the Frequency pane above, 931.214 MHz is selected. The Modulation Histogram and the History show
results for only the selected frequency.
Pager signals often change modulation types very rapidly. The most common modulation formats are 4-
level FSK with 3.2 kHz spacing, 2-level FSK with 9 kHz spacing, and 2-level FSK at 9.6 kHz spacing. If
you have access to this band, you may want to experiment by designing wideband detectors and
narrowband confirmers for these signals. It may be helpful to make one or more recordings of these signals
using the narrowband confirmer recorder feature. The UVHF Pager detector has wideband detectors and
narrowband confirmers for the most common modulation formats found in this band.
In this exercise we built three wideband detectors to illustrate the design process. In practice, you would
not normally have more than one wideband detector for the same modulation format and search setup. At
this point, you may want to focus on one wideband detector, for example the shape detector. One easy way
to do this is to copy the entire USD signal detector to a new detector, and then delete the wideband
detectors that you will not be using.
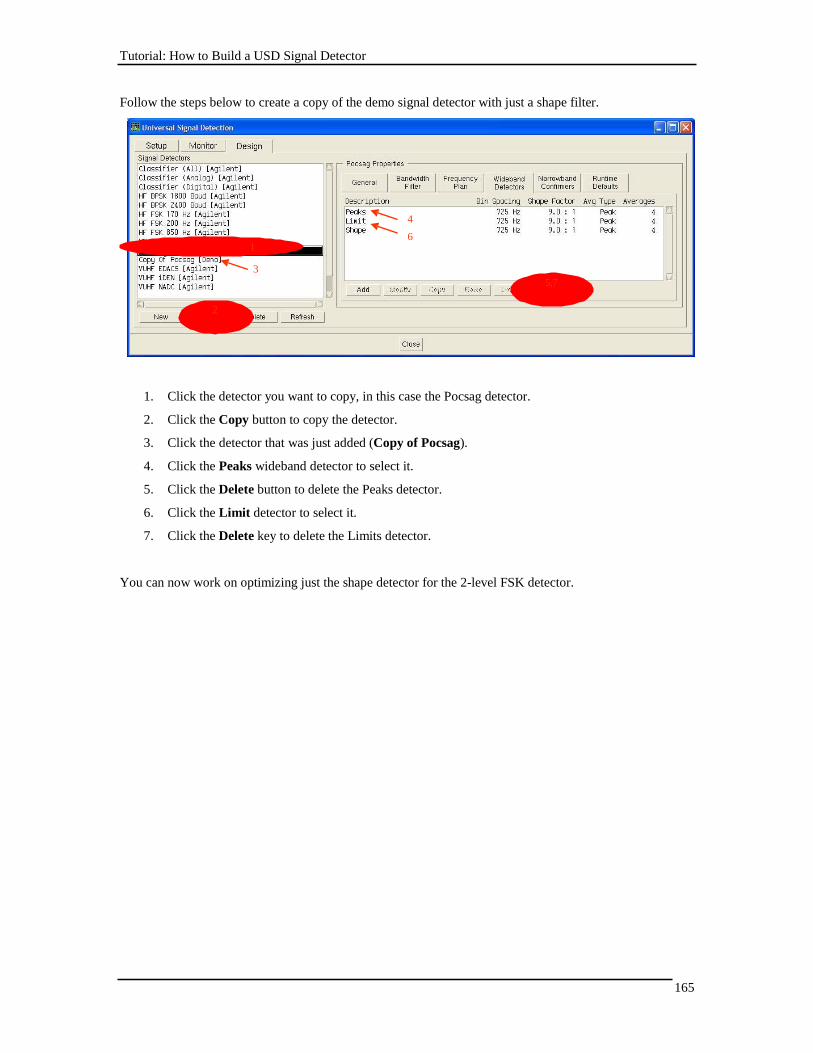
Tutorial: How to Build a USD Signal Detector
165
Follow the steps below to create a copy of the demo signal detector with just a shape filter.
4
6 1
3
5,7
2
1. Click the detector you want to copy, in this case the Pocsag detector.
2. Click the Copy button to copy the detector.
3. Click the detector that was just added (Copy of Pocsag).
4. Click the Peaks wideband detector to select it.
5. Click the Delete button to delete the Peaks detector.
6. Click the Limit detector to select it.
7. Click the Delete key to delete the Limits detector.
You can now work on optimizing just the shape detector for the 2-level FSK detector.
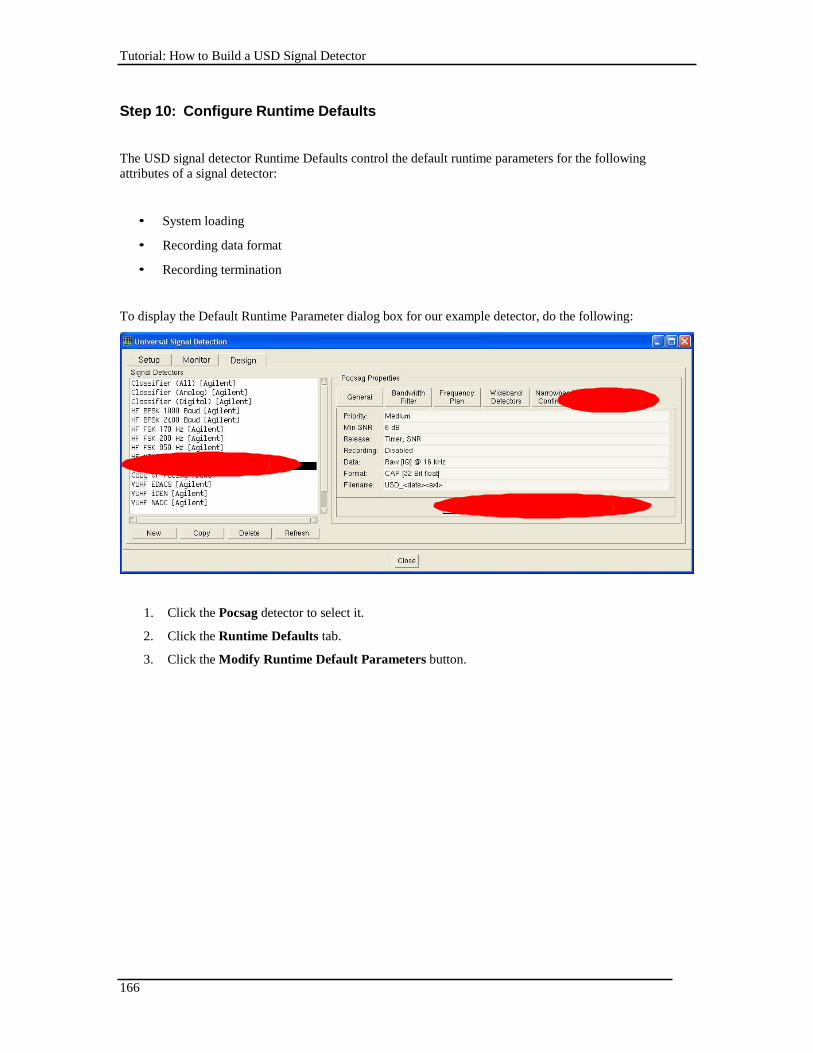
Tutorial: How to Build a USD Signal Detector
166
Step 10: Configure Runtime Defaults
The USD signal detector Runtime Defaults control the default runtime parameters for the following
attributes of a signal detector:
• System loading
• Recording data format
• Recording termination
To display the Default Runtime Parameter dialog box for our example detector, do the following:
2
1
3
1. Click the Pocsag detector to select it.
2. Click the Runtime Defaults tab.
3. Click the Modify Runtime Default Parameters button.
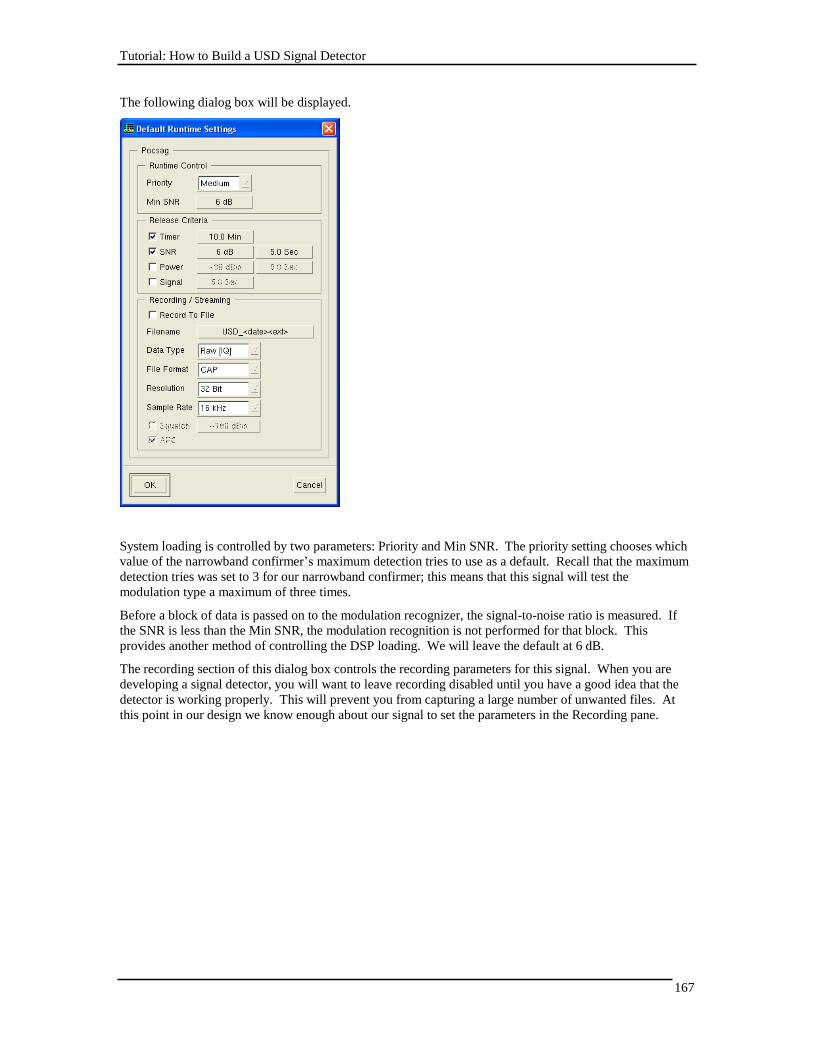
Tutorial: How to Build a USD Signal Detector
167
The following dialog box will be displayed.
System loading is controlled by two parameters: Priority and Min SNR. The priority setting chooses which
value of the narrowband confirmer’s maximum detection tries to use as a default. Recall that the maximum
detection tries was set to 3 for our narrowband confirmer; this means that this signal will test the
modulation type a maximum of three times.
Before a block of data is passed on to the modulation recognizer, the signal-to-noise ratio is measured. If
the SNR is less than the Min SNR, the modulation recognition is not performed for that block. This
provides another method of controlling the DSP loading. We will leave the default at 6 dB.
The recording section of this dialog box controls the recording parameters for this signal. When you are
developing a signal detector, you will want to leave recording disabled until you have a good idea that the
detector is working properly. This will prevent you from capturing a large number of unwanted files. At
this point in our design we know enough about our signal to set the parameters in the Recording pane.
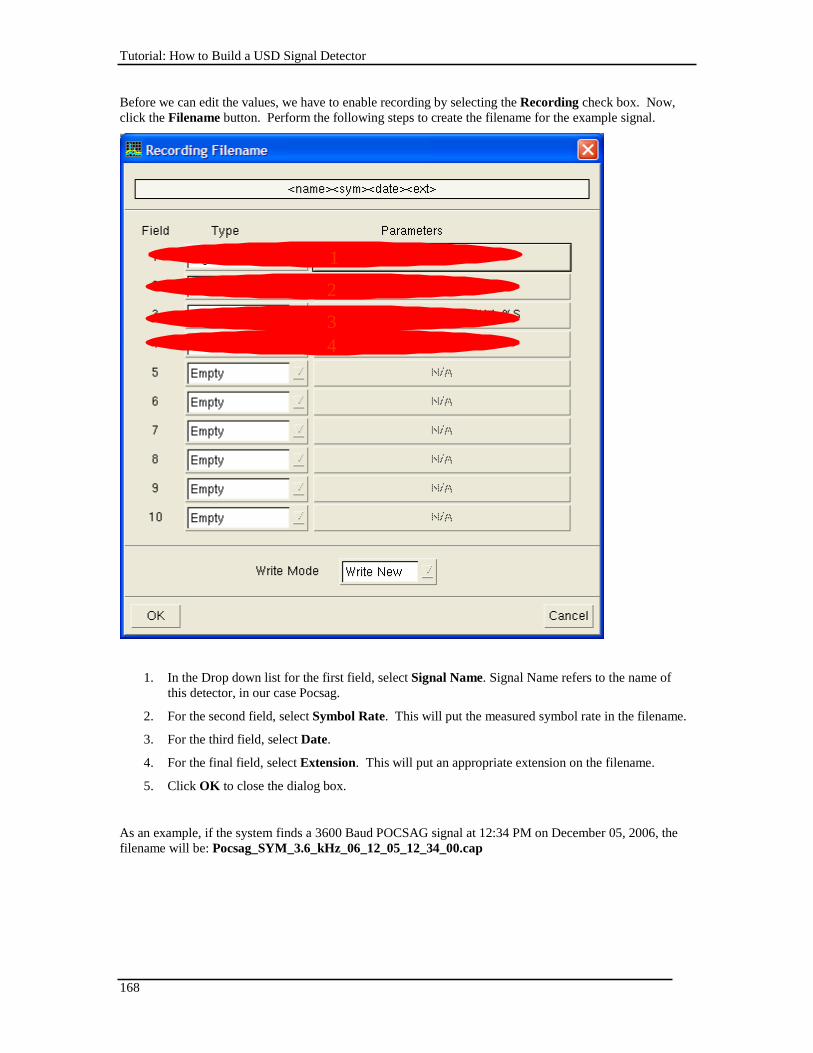
Tutorial: How to Build a USD Signal Detector
168
Before we can edit the values, we have to enable recording by selecting the Recording check box. Now,
click the Filename button. Perform the following steps to create the filename for the example signal.
1
2
3
4
1. In the Drop down list for the first field, select Signal Name. Signal Name refers to the name of
this detector, in our case Pocsag.
2. For the second field, select Symbol Rate. This will put the measured symbol rate in the filename.
3. For the third field, select Date.
4. For the final field, select Extension. This will put an appropriate extension on the filename.
5. Click OK to close the dialog box.
As an example, if the system finds a 3600 Baud POCSAG signal at 12:34 PM on December 05, 2006, the
filename will be: Pocsag_SYM_3.6_kHz_06_12_05_12_34_00.cap
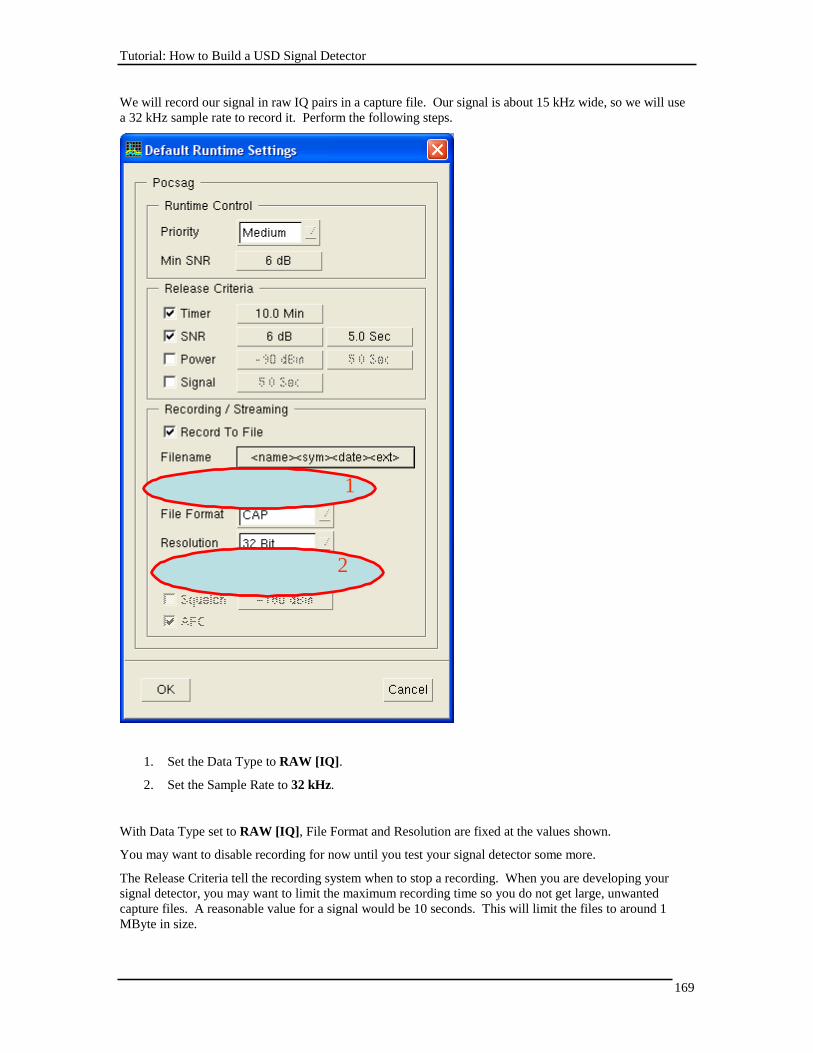
Tutorial: How to Build a USD Signal Detector
169
We will record our signal in raw IQ pairs in a capture file. Our signal is about 15 kHz wide, so we will use
a 32 kHz sample rate to record it. Perform the following steps.
1
2
1. Set the Data Type to RAW [IQ].
2. Set the Sample Rate to 32 kHz.
With Data Type set to RAW [IQ], File Format and Resolution are fixed at the values shown.
You may want to disable recording for now until you test your signal detector some more.
The Release Criteria tell the recording system when to stop a recording. When you are developing your
signal detector, you may want to limit the maximum recording time so you do not get large, unwanted
capture files. A reasonable value for a signal would be 10 seconds. This will limit the files to around 1
MByte in size.
Tutorial: How to Build a USD Signal Detector
170
We will leave the SNR value of 6 dB for 5 seconds at the default. This will stop the recording if the
measured SNR falls below 6 dB for more than 5 seconds.
Step 11: Deploy the Signal Detector
When you close the Signal Detector Design window, the detector design will be saved in a file in the signal
detector library folder, usually C:\E3238s\detectors. If you want to prevent users from modifying your
signal detector, you can make the file “read only” using the operating system file manager.
You may also want to save the settings in a Mission Setup file. To use the new signal detector on another
N6820ES system, copy the signal detector file and the mission setup file to the other system.
Tutorial: How to Build a USD Signal Detector
171
Summary and Tips
The most efficient process for designing a signal detector is to record a time capture file and then design the
wideband detector and narrowband confirmers using capture file playback. You can then fine tune and
optimize the system using live signals.
Obtaining a capture file is sometimes easy, as in the case of the POCSAG signal. You can, for example,
record a known pager channel for a period of a few minutes. Then you can play the file back in the
narrowband confirmer editor and observe the modulation recognition results. The playback control
recording feature in the narrowband confirmer editor can be used to make a new file that contains only your
signal of interest, see Acquiring a Signal for Signal Detector Development for more information on
recording signals.
Intermittent signals with short “on” times are more difficult to capture. The more prior knowledge you
have about your signal, the better. For example, if you know your signal is 8-level FSK with a 2 kHz
bandwidth, you can use an appropriate bandwidth filter and a narrowband confirmer to record all 8-level
FSK signals. You can then look through the recordings using either the narrowband confirmer playback or
the Snapview tool. If you find a good recording, you can use it to design more selective wideband
detectors and narrowband confirmers.
A signal generator capable of producing multiple modulation types can also be useful in designing signal
detectors.
To make your signal detector work over a wide range of signal conditions, you may want to record your
signal of interest at different signal-to-noise ratios. If there are similar signals in the applicable frequency
range that you want your signal detector to reject, you should also record those signals. For example, you
may want to find 2-level FSK signals with a tone spacing of 200 Hz while rejecting signals with a tone
spacing of 170 Hz. In this case you would record examples of both signals. You could then test how well
your detector works at accepting the signal of interest and rejecting the unwanted signal.
When you are optimizing a signal detector, use the USD monitor window to observe how many signals are
passing through the various filter stages. The USD stages typically use more hardware resources as you go
from left to right in the monitoring window. For example, a wideband detector will typically use
considerably more CPU time than bandwidth filtering. If too many signals are processed with the
wideband detector, the search system may slow down. This could lower the probability of catching a signal
of interest. The goal is to eliminate as many non-signals of interest as early in the process as possible.
For narrowband confirmation, the most efficient modulation recognition type is the Standard Digital
recognizer. If you can recognize your signal of interest using only the symbol rate (and possibly bandwidth),
it is best to use the Standard Digital recognizer.
When you have your signal detector designed to the point where you are recording files, you should verify
that the recordings contain your signal of interest. This can be done using the Snapview tool or by testing
the files with the narrowband confirmer editor.
172
Index
Index
A
Acquiring a Signal for Signal Detector
Development, 55
Add Detector Button, 17
Add Individual Frequencies, 49
AFC check box, 24, 93
Agilent MR1, 88
Agilent MR1 Recognizer, 84
ASSIGN, 104
B
Bandwidth Filter, 28, 44
Bandwidth Filtering Example, 46
BW Criteria, 75
C
Centering Mode, 74
Channelize, 49
Click to Fix, 35
Client Connection to the USD Server, 122
Command Passthrough, 106
Compare Frequency, 52
Configuring Streamed Data, 101
Configuring the Streaming Server, 99
Copy to Detected Bandwidth, 45
D
Data Rate, 122
Data Type, 24, 93
Default Runtime Settings, 92
Don't Care, 64
E
N6820ES Requirements, 20
Enable Bandwidth Filtering, 45
Enable Signal Detection Check Box, 17
Energy Detection, 28
Energy History, 30
Example Programs, 123
F
File Format, 24, 93
Filename, 24, 92
Frequency Plan, 29
Frequency Plan Add Band, 49
Frequency Plan Add Frequency, 50
Frequency Plan Button, 18
Frequency Plan Delete, 52
Frequency Plan Import, 52
Frequency Plan Label Frequency, 51
Frequency Plan Setup, 52
G
Global Settings Button, 25
I
INFO, 103
L
Limit Lines Method, 72
Live Data, 55
LOCK, 104
Lock Tuner, 82
M
Max BW, 75
Maximum Detection Tries, 89
Maximum Record Duration, 25
measurement bandwidth, 84
Merge, 77
Merge Frequency, 52
Message Definitions, 107
Minimum Record Duration, 25
Minimum SNR, 22, 92
Modify General Properties, 43
Modify Runtime Default Parameters, 91
Monitor Window Arrows, 34
N
Narrowband Confirmation, 31
173
Index
Narrowband Confirmer Blocks, 31
Narrowband Confirmers, 83
Narrowband Confirmers Overview, 82
Narrowband Recorder, 32
No Check, 64
Noise Floor Estimate, 25
Not Set, 64
Number of Bins, 62, 75, 76
O
Optimize Search Setup, 21
Optimize Tuning, 19
P
Peak Spacing, 75
Peaks Method, 65
Pending Queue, 31
Power Level, 23, 92
Priority, 22, 92
R
Rate of Change, 77
Recording check box, 24, 92
Recording Data with the Narrowband Confirmer
Editor, 57
Recording Data with the Wideband Detector
Editor, 56
Recording Data with Time and Frequency
Snapshots, 57
RELEASE, 104
Release Check Interval, 90
Release Criteria, 23, 92
Remove Detector Button, 17
Resolution, 24, 93
Resolution Frequency, 52
Restore Default Runtime Settings, 24
Return BW, 75
Runtime settings, 22
Runtime Settings Button, 22
S
Sample Rate, 24, 93
Set Criteria, 87
Shape Method, 60
Signal, 23, 92
SNR, 23, 92
Spectral Sweep, 28
Squelch, 24, 93
Standard Recognizer, 84
STOPSTREAM, 104
STREAM, 105
Streaming Client, 123
StreamingCapture, 127
SUBSCRIBE, 103
Summary, 86
Summary of Possible Arrow Messages, 38
T
Timer, 23, 92
Tolerance, 75
Tune to Band, 19
Tutorial, 130
U
Universal Signal Database, 94
UNLOCK, 104
UNSUBSCRIBE, 103
USD Client .Net Example, 128
USD Data Output Format, 107
USD Data Streams, 102
USD Design Window, 40
USD Design Window Bandwidth Filter Tab, 44
USD Design Window Frequency Plan Tab, 48
USD Design Window General Tab, 43
USD Design Window Narrowband Confirmers
Tab, 82
USD Design Window Signal Detector List, 41
USD Design Window Wideband Detectors Tab,
53
USD Monitor Window, 26
USD Programming Guide, 98
USD Server, 102

174
Index
USD Server Commands, 103
USD Setup Window, 16
UsdClientNet.dll, 128
UsdClientNetExample.exe, 128
V
Version Checking, 122
W
Wideband Detection, 29
Wideband Detector Editor, 55
Wideband Detectors Overview, 53
Related Documents