International Journal of Recent Engineering Research and Development (IJRERD) ISSN: 2455-8761 www.ijrerd.com || Volume 02 – Issue 06 || June 2017 || PP. 56-67 56 | P a g e www.ijrerd.com Aggregate Planning and Inventory Management in Textile Industry S. Syath Abuthakeer *1 T. Pavithran #2 , M.S.E. Vigneshraj #3 , S. Vimalkumar #4 , # Student, Department of Mechanical Engineering, P.S.G. College of Technology, Coimbatore, Tamil Nadu, India -641004 * Assistant Professor (Sl. Gr.), Department of Mechanical Engineering, P.S.G. College of Technology, Coimbatore, Tamil Nadu, India -641004 Abstract: The project mainly deals with inventorial management in a textile industry manufacturing fabric from yarn. Textile industries have a tendency to over stock their raw material inventory when the prices are low in anticipation of price hikes, this ends up causing loss to the industry in the form of spoiled inventory. The main focus is pertaining to one particular stock, 80s yarn. The existing inventory model was studied and a model was proposed to replace the qualitative inventory model with a quantitative one. The optimal utilization of resources was considered through aggregate planning. A suitable inventory model and an effective resource utilization is expected to bring down the costs incurred thus increasing the supply chain surplus making it more efficient. Other benefits of a stable inventory model are ease of planning of other activities, steady lead time etc. The end results are concerning Inventory valuation, Future inventory price forecast and optimal inventory levels calculations. Key words: Supply Chain Management, Aggregate planning, Forecasting, Inventory, Demand, Economic order quantity. 1. Introduction Supply chain management (SCM), the management of the flow of goods and services, involves the movement and storage of raw materials, of work-in-process inventory, and of finished goods from point of origin to point of consumption. Interconnected or interlinked networks, channels and node businesses combine in the provision of products and services required by end customers in a supply chain[1,2]. The supply chain includes not only the manufacturer and suppliers, but also transporters, warehouses, retailers, and even customers themselves[2]. Within each organization, such as a manufacturer, the supply chain includes all functions involved in receiving and filling a customer request[3]. These functions include, but are not limited to, new product development, marketing, operations, distribution, finance, and customer service[3]. Inventory exists in the supply chain because of a mismatch between supply and demand. This mismatch is intentional at a steel manufacturer, where it is economical to manufacture in large lots that are then stored for future sales[4]. The mismatch is also intentional at a retail store where inventory is held in anticipation of future demand or when the retail store builds up inventory to prepare for a surge in sales during the holiday season. In these instances, inventory is held to reduce cost or increase the level of product availability[1,2]. The first few papers focus on storing of perishable items. Since the work is more a yarn inventory, and yarn being a perishable item, those papers help in studying in storing methods[4]. Forecasting is an important part of the work. It is important to choose an appropriate method for forecasting. Moreover the chosen method should have minimum error. Various methods like MA method and MSVR are learnt from the papers. There is a strong relationship between inventory and the organisational performance[6]. This can be measured in terms of few constants. SWOT analysis involves preparation of long questionnaires and field work. The knowledge of industrial forces in 2014 paper helps in creating questionnaires. Cotton yarn is a product of cotton and cotton is an agricultural product. The variation of cotton prices is very random and very subtle. It is important to learn about the nature of the variation of the price. 2. Industrty Overview Bannari Amman Spinning Mills Limited commenced spinning operations in the year 1995 with an installed capacity of 30,000 spindles. The weaving division started in the year 2009 is located in Coimbatore, Tamil Nadu with a plant area 2.2 Lakh sq.ft. They serve to be one of the leading fabric exporters in South India. Spinning mills producing 60 tons of Yarn per day. Weaving Wider & Narrow width looms producing 7.5 lakh metres per month. They work on 5s, 6s, 7s, 10s, 20s, 30, 80s, and 205OE varieties of yarn.[7] They produce fabrics of plain, checked, drill and twill varieties. They also have garmenting facilities to provide ultimate finished products. The products of the garmenting facilities are table cloth, bed spreads, pillow

Welcome message from author
This document is posted to help you gain knowledge. Please leave a comment to let me know what you think about it! Share it to your friends and learn new things together.
Transcript

IJRERD
International Journal of Recent Engineering Research and Development (IJRERD)
ISSN: 2455-8761
www.ijrerd.com || Volume 02 – Issue 06 || June 2017 || PP. 56-67
56 | P a g e www.ijrerd.com
Aggregate Planning and Inventory Management in Textile
Industry
S. Syath Abuthakeer*1
T. Pavithran#2
, M.S.E. Vigneshraj #3
,
S. Vimalkumar #4
, # Student, Department of Mechanical Engineering, P.S.G. College of Technology,
Coimbatore, Tamil Nadu, India -641004 * Assistant Professor (Sl. Gr.), Department of Mechanical Engineering, P.S.G. College of Technology,
Coimbatore, Tamil Nadu, India -641004
Abstract: The project mainly deals with inventorial management in a textile industry manufacturing fabric
from yarn. Textile industries have a tendency to over stock their raw material inventory when the prices are low
in anticipation of price hikes, this ends up causing loss to the industry in the form of spoiled inventory. The
main focus is pertaining to one particular stock, 80s yarn. The existing inventory model was studied and a model
was proposed to replace the qualitative inventory model with a quantitative one. The optimal utilization of
resources was considered through aggregate planning. A suitable inventory model and an effective resource
utilization is expected to bring down the costs incurred thus increasing the supply chain surplus making it more
efficient. Other benefits of a stable inventory model are ease of planning of other activities, steady lead time etc.
The end results are concerning Inventory valuation, Future inventory price forecast and optimal inventory levels
calculations.
Key words: Supply Chain Management, Aggregate planning, Forecasting, Inventory, Demand, Economic order
quantity.
1. Introduction Supply chain management (SCM), the management of the flow of goods and services, involves the
movement and storage of raw materials, of work-in-process inventory, and of finished goods from point of origin to
point of consumption. Interconnected or interlinked networks, channels and node businesses combine in the provision
of products and services required by end customers in a supply chain[1,2]. The supply chain includes not only the
manufacturer and suppliers, but also transporters, warehouses, retailers, and even customers themselves[2]. Within
each organization, such as a manufacturer, the supply chain includes all functions involved in receiving and filling a
customer request[3]. These functions include, but are not limited to, new product development, marketing, operations,
distribution, finance, and customer service[3]. Inventory exists in the supply chain because of a mismatch between
supply and demand. This mismatch is intentional at a steel manufacturer, where it is economical to manufacture in
large lots that are then stored for future sales[4]. The mismatch is also intentional at a retail store where inventory is
held in anticipation of future demand or when the retail store builds up inventory to prepare for a surge in sales during
the holiday season. In these instances, inventory is held to reduce cost or increase the level of product
availability[1,2].
The first few papers focus on storing of perishable items. Since the work is more a yarn inventory, and
yarn being a perishable item, those papers help in studying in storing methods[4]. Forecasting is an important
part of the work. It is important to choose an appropriate method for forecasting. Moreover the chosen method
should have minimum error. Various methods like MA method and MSVR are learnt from the papers.
There is a strong relationship between inventory and the organisational performance[6]. This can be measured
in terms of few constants. SWOT analysis involves preparation of long questionnaires and field work. The
knowledge of industrial forces in 2014 paper helps in creating questionnaires. Cotton yarn is a product of cotton
and cotton is an agricultural product. The variation of cotton prices is very random and very subtle. It is
important to learn about the nature of the variation of the price.
2. Industrty Overview Bannari Amman Spinning Mills Limited commenced spinning operations in the year 1995 with an
installed capacity of 30,000 spindles. The weaving division started in the year 2009 is located in Coimbatore,
Tamil Nadu with a plant area 2.2 Lakh sq.ft. They serve to be one of the leading fabric exporters in South India.
Spinning mills producing 60 tons of Yarn per day. Weaving Wider & Narrow width looms producing 7.5 lakh
metres per month. They work on 5s, 6s, 7s, 10s, 20s, 30, 80s, and 205OE varieties of yarn.[7]
They produce fabrics of plain, checked, drill and twill varieties. They also have garmenting facilities to
provide ultimate finished products. The products of the garmenting facilities are table cloth, bed spreads, pillow

IJRERD
International Journal of Recent Engineering Research and Development (IJRERD)
ISSN: 2455-8761
www.ijrerd.com || Volume 02 – Issue 06 || June 2017 || PP. 56-67
57 | P a g e www.ijrerd.com
covers, etc. The industry has Italian warping machines like Karl Mayer Warpdirect. Sizing machines are also
from Italian Manufacturer Size-O-Matic. High speed weaving machines are from the manufacturer Pimacott.
3. Aggregate Planning Aggregate planning is a process by which a company determines planned levels of capacity,
production, subcontracting, inventory, stock outs, and even pricing over a specified time horizon. The goal of
aggregate planning is to build a plan that satisfies demand while maximizing profit[8]. Aggregate planning, as
the name suggests, solves problems involving aggregate decisions rather than stock-keeping unit (SKU)-level
decisions. For example, aggregate planning determines the total production level in a plant for a given month,
but it does so without determining the quantity of each individual SKU that will be produced. This level of
detail makes aggregate planning a useful tool for thinking about decisions with an intermediate time frame of
between roughly 3 and 18 months[8,9]. The aggregate plan serves as a broad blueprint for operations and
establishes the parameters within which short-term production and distribution decisions are made. The
aggregate plan allows the supply chain to alter capacity allocations and change supply contracts[9].
4. Problem Definition Bannari Amman Industries’ weaving facility has a production capacity of 7.5lac meters of fabric per month.
Industries working on very large product quantities will have great probabilities of high wastage. The industry is
facing inventorial wastes for past 8 months. The wastages are 6-9% is various situations. These wastages account for
very large amount of economical loss. This is the place where more concentration is needed[7].
Raw material prices and labour cost impact are to be studied using aggregate planning[9]. Cotton prices are
very prone to serious variation. The variations cannot be minimised, but the variations can be predicted. Plenty of
resources – Capital, man and machinery. The resources are plenty, but proper allocation has to be done in order to
ensure that optimum usage of resources like labour and machineries are done.
5. Methodology Based on the synthesis made above a practical methodology was adopted to carry out the project. The
methodology is shown in below. The methodology involves all the processes mentioned in the synthesis.
Figure 1 Methodology
6. Swot Analysis SWOT analysis is an acronym for strengths, weaknesses, opportunities, and threats and is a
structured planning method that evaluates those four elements of an
organization, project or business venture[10]. A SWOT analysis can be carried out for a company, product,
place, industry, or person. It involves specifying the objective of the business venture or project and identifying
the internal and external factors that are favorable and unfavorable to achieve that objective[10,11]. The degree
to which the internal environment of the firm matches with the external environment is expressed by the concept
of strategic fit.
Identification of SWOTs is important because they can inform later steps in planning to achieve the
objective. First, decision-makers should consider whether the objective is attainable, given the SWOTs. If the

IJRERD
International Journal of Recent Engineering Research and Development (IJRERD)
ISSN: 2455-8761
www.ijrerd.com || Volume 02 – Issue 06 || June 2017 || PP. 56-67
58 | P a g e www.ijrerd.com
objective is not attainable, they must select a different objective and repeat the process. The forces acting on a
industry are used in making a strategic decisions.
Table 1 SWOT matrix
STRENGTH
1. Having Bannari
Amman Spinning
mills as an own
asset.
2. One of the few
companies using
Italian Weaving
machines like
WarpDirect, Karl
Mayer.
WEAKNESS
1. Moderately lacking in
present textile
technology.
2. Absence of Dyeing
facilities.
3. Moderately high
machinery maintenance
costs.
OPPORTUNITIE
S
1. In process waste
reselling abilities
and waste recovery.
2. Scope for Mass
customisation.
3. Dyeing facility
THREATS
1. Government
regulations like GST and
demonetisation.
2. Economic
catastrophes like price
hike of raw materials.
3. Inventory wastage.
The industry has its own spinning mills which is a serious advantage helping in discount of raw
materials. It is one of the industries which have the Italian Manufactured machines. All the machines including
warping, sizing and weaving machines are Italian made. It has no dyeing facility. It affects vastly due to
government policies and price fluctuation like raw material price hike. Policies like demonetization and GST
come under threats category. The industry has a moderate scope for Mass- Customization.
7. Forecasting
Forecasting is the process of making predictions of the future based on past and present data and most
commonly by analysis of trends[10]. A commonplace example might be estimation of some variable of interest at
some specified future date. Prediction is a similar, but more general term. Both might refer to formal statistical
methods employing time series, cross-sectional or longitudinal data, or alternatively to less formal judgmental
methods. Usage can differ between areas of application: for example, in hydrology the terms "forecast" and
"forecasting" are sometimes reserved for estimates of values at certain specific future times, while the term
"prediction" is used for more general estimates, such as the number of times floods will occur over a long period[11].
Risk and uncertainty are central to forecasting and prediction; it is generally considered good practice to
indicate the degree of uncertainty attaching to forecasts. In any case, the data must be up to date in order for the
forecast to be as accurate as possible.
The forecasting requires data from the past to predict the future. The data collected from the industry is
shown in the below table. The data involves past values of 24 months to predict the future 6 months. If the past data is
more in number, the more accurate the future data would be.
Table 2 Input Data
Month Cotton Price (Rs/Kg)
Jan-15 443
Feb-15 384
Mar-15 403
Apr-15 373
May-15 440
Jun-15 374
Jul-15 376
Aug-15 470

IJRERD
International Journal of Recent Engineering Research and Development (IJRERD)
ISSN: 2455-8761
www.ijrerd.com || Volume 02 – Issue 06 || June 2017 || PP. 56-67
59 | P a g e www.ijrerd.com
Sep-15 406
Oct-15 441
Nov-15 412
Dec-15 364
Jan-16 319
Feb-16 271
Mar-16 296
Apr-16 342
May-16 382
Jun-16 439
Jul-16 451
Aug-16 372
Sep-16 366
Oct-16 367
Nov-16 275
GDMH Shell is an open source software used for accurate Time Series Forecasting. The past fiscal data are
entered in Excel.
The software has a facility of importing the data from Microsoft Excel. The sheet containing the past data is
imported.
The Time Series forecasting option is selected.
The range of future prediction is selected.(6 months)
Click OK to predict the results.
Figure 2 GDMH forecasting Results
Forecasting using excel involves generation of charts in order to calculate the trend line[12].
The data are input into the Excel as in the previous case. A chart is generated using the same data. The
trend line option is checked in order to find the trend line equation. Click on the Display Equation option. Now
use the equation to extrapolate the data. Extrapolation can be done using usual excel shortcuts. This extrapolated
data is the forecasted value

IJRERD
International Journal of Recent Engineering Research and Development (IJRERD)
ISSN: 2455-8761
www.ijrerd.com || Volume 02 – Issue 06 || June 2017 || PP. 56-67
60 | P a g e www.ijrerd.com
Figure 3 Moving average forecasting
Demand forecasting is the art and science of forecasting customer demand to drive holistic execution of
such demand by corporate supply chain and business management. Demand forecasting involves techniques
including both informal methods, such as educated guesses, and quantitative methods, such as the use of
historical sales data and statistical techniques or current data from test markets. Demand forecasting may be
used in production planning, inventory management, and at times in assessing future capacity requirements, or
in making decisions on whether to enter a new market[12].
Table 3 Demand Forecasted results
S.No Month Demand Forecasted for 80s
Yarn(Kgs)
1 Dec-16 6915
2 Jan-17 7950
3 Feb-17 7950
4 Mar-17 8295
5 Apr-17 9335
6 May17 9335
A good forecasting method will yield residuals that are uncorrelated and have zero mean. If there are
correlations between residual values, then there is information left in the residuals which should be used in
computing forecasts.
Table 4 Forecast error
Actual Forecast Data Error Mean Error
443 439.87 0.126117381
384 419.3274 0.042519352
403 407.7585 0.086249272
373 399.7442 -0.10792432
440 393.6365 0.044628515
374 388.7155 0.033998779 0.064256
376 384.6029 -0.22711989
470 381.0756 -0.05303065
406 377.9911 -0.15519426
441 375.2531 -0.0833262
412 372.7934 0.021343273
364 370.562 0.141653742
y = 439.8x-0.060
100
200
300
400
500
1 6 11 16 21 26
Series2
Power (Series2)

IJRERD
International Journal of Recent Engineering Research and Development (IJRERD)
ISSN: 2455-8761
www.ijrerd.com || Volume 02 – Issue 06 || June 2017 || PP. 56-67
61 | P a g e www.ijrerd.com
From the error values it is seen that the analytical method has a considerable positive error than
software method. Hence the software results are considered as the final results for the forecast activity.
8. Inventory Modelling
The model adopted for this particular study is the manufacturing model with shortages. Manufacturing
model, shown in figure, is chosen for this case because the replenishments are not instantaneous, rather the
replenishment is made as the existing inventory is simultaneously being utilised for manufacturing[1,2].
Figure 4 Manufacturing model with shortages
𝐸𝑐𝑜𝑛𝑜𝑚𝑖𝑐 𝑂𝑟𝑑𝑒𝑟 𝑄𝑢𝑎𝑛𝑡𝑖𝑡𝑦 = 𝑄∗ = 2𝑥𝐶1𝑥𝐷
𝐶3 𝑥
𝐶3+𝐶4
𝐶4 𝑥
𝑅
𝑅−𝐷 .......1
𝑂𝑝𝑡𝑖𝑚𝑢𝑚 𝑆ℎ𝑜𝑟𝑡𝑎𝑔𝑒 = 𝑆∗ = 𝑄∗𝑥 𝐶3
𝐶3+𝐶4 𝑥
𝑅−𝐷
𝑅 .....2
Total cost (TC) = Total cost of product + Ordering cost + Carrying cost + Shortage cost.
Total cost (TC) = (C1 * D) + (D/Q) * C2 + [(R-D)*(Q-S)2 / (2 * Q * R)] * C3 + [(R-D) * S
2 / (2 * Q * R)] * C4
Where, C1= 358 Rs/Kg , C2= Rs.9300/order, C3= Rs.3.65/month/item, C4= Rs.60/month/item, D= 9350
kg/month, R= 22000kg/Month
Safety stock term is used by logisticians to describe a level of extra stock that is maintained to mitigate risk
of stock outs (shortfall in raw material or packaging) due to uncertainties in supply and demand[13].
Safety Stock = (Max lead time* max lead time demand)-(average lead time *average lead
time demand)
Safety Stock = 1135 kg
The Economic Order Quantity (EOQ) is the number of units that a company should add to inventory
with each order to minimize the total costs.
Figure 5 Cost Vs Quantity
Optimal order quantity Q* = 4857 kg
IJRERD
International Journal of Recent Engineering Research and Development (IJRERD)
ISSN: 2455-8761
www.ijrerd.com || Volume 02 – Issue 06 || June 2017 || PP. 56-67
62 | P a g e www.ijrerd.com
One of the assumptions of our basic EOQ model is that shortages and back ordering are not allowed.
The fourth model variation that we will describe, the EOQ model with shortages, relaxes this assumption.
Optimum Shortage Quantity S* = 870 kg
The reorder point (ROP) is the level of inventory which triggers an action to replenish that particular
inventory stock. It is a minimum amount of an item which a firm holds in stock, such that, when stock falls to
this amount, the item must be reordered.
Reorder time = (Q* / D) = 15 days
Inventory turnover measures how fast a company is selling inventory and is generally compared against
industry averages. A low turnover implies weak sales and, therefore, excess inventory. A high ratio implies
either strong sales and/or large discounts[14].
ITO = Outgoing sales/ Average inventory
ITO= (135000*210)/ (4857*6*358)
Inventory turnover ratio = 2.57
Inventory turnover ratio for previous order = 1.33
The days sales of inventory value, or DSI, is a financial measure of a company's performance that gives
investors an idea of how long it takes a company to turn its inventory (including goods that are a work in
progress, if applicable) into sales.
DIO= (57960 * 365)/ (733.3*210)
DIO= 137.38
DIO (previous order) = 192.95
Table 5 Inventory Resultant
Economic order quantity 4857 kg
Optimal Shortage quantity 870 kg
Re-order period 15 days
Safety Stock 1135 kg
ITO 2.57
DIO 137.38
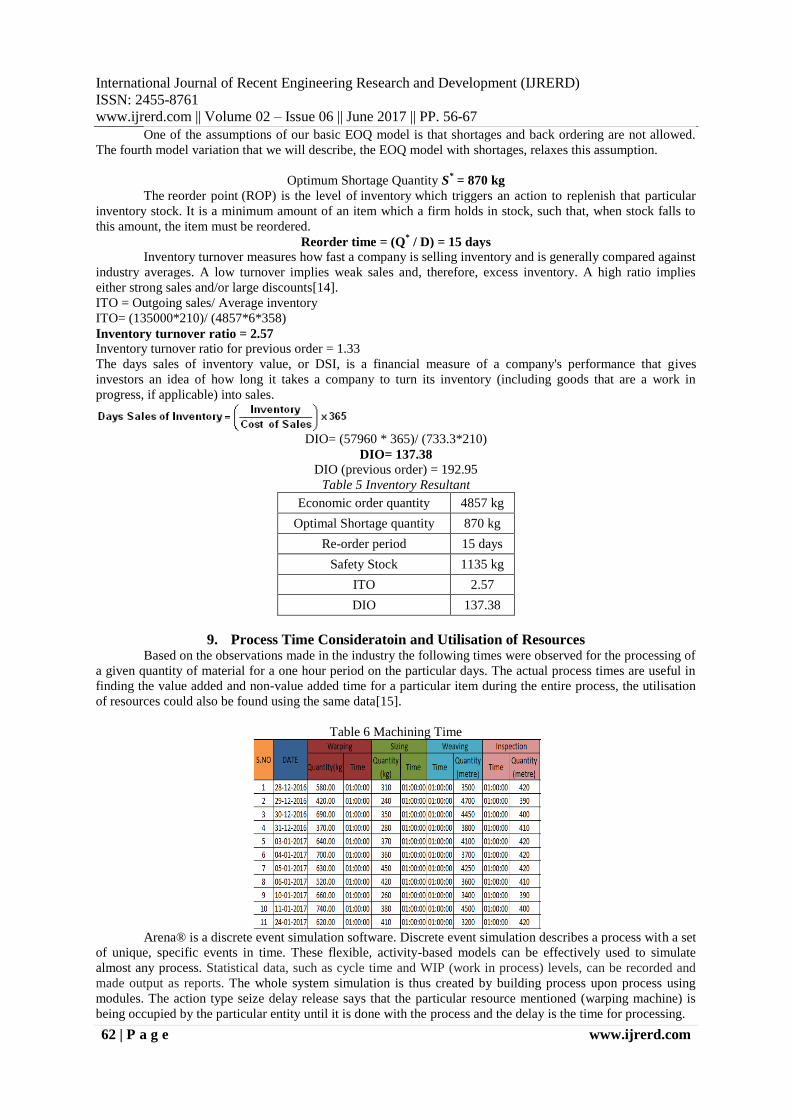
9. Process Time Consideratoin and Utilisation of Resources Based on the observations made in the industry the following times were observed for the processing of
a given quantity of material for a one hour period on the particular days. The actual process times are useful in
finding the value added and non-value added time for a particular item during the entire process, the utilisation
of resources could also be found using the same data[15].
Table 6 Machining Time
Arena® is a discrete event simulation software. Discrete event simulation describes a process with a set
of unique, specific events in time. These flexible, activity-based models can be effectively used to simulate
almost any process. Statistical data, such as cycle time and WIP (work in process) levels, can be recorded and
made output as reports. The whole system simulation is thus created by building process upon process using
modules. The action type seize delay release says that the particular resource mentioned (warping machine) is
being occupied by the particular entity until it is done with the process and the delay is the time for processing.
IJRERD
International Journal of Recent Engineering Research and Development (IJRERD)
ISSN: 2455-8761
www.ijrerd.com || Volume 02 – Issue 06 || June 2017 || PP. 56-67
63 | P a g e www.ijrerd.com
Figure 7 Arena Simulation
In the above model each entity represents 24kg of yarn, the process time for each module is the time
taken for processing 24kg of yarn. The process durations are assumed to follow uniform distribution from the
observations made. The inspection process is represented by a condition module while the weaving operation is
represented by a batch and a process module, since the yarn is being woven into fabric a batch module is used
that represents the conversion of 17 batches of entity (408kg of yarn) into one entity of fabric (1.5m x 1000m
fabric).
Table 7 Arena Time results
Figure 8 Percentage Utilisation 1
Table 8 Percentage Utilisation 2
The man power utilisation is assumed to be optimal because the direct labour involved is very few
compared to the background workers. The utilisation of the weaving machine is very low because if a linear
continuous process like the one assumed in the simulation is assumed weaving can happen only after warping

IJRERD
International Journal of Recent Engineering Research and Development (IJRERD)
ISSN: 2455-8761
www.ijrerd.com || Volume 02 – Issue 06 || June 2017 || PP. 56-67
64 | P a g e www.ijrerd.com
and sizing happens, and since weaving is a comparatively quicker process the machine remains idle for most of
the time. But in reality weaving happens warped and sized yarns from work in process inventory.
10. Aggregate Planning Aggregate planning is an operational activity that does an aggregate plan for the production process,
in advance of 6 to 18 months, to give an idea to management as to what quantity of materials and other
resources are to be procured and when, so that the total cost of operations of the organization is kept to the
minimum over that period. The quantity of outsourcing, subcontracting of items, overtime of labor, numbers to
be hired and fired in each period and the amount of inventory to be held in stock and to be backlogged for each
period are decided[16]. All of these activities are done within the framework of the company ethics, policies,
and long term commitment to the society, community and the country of operation.
The industry’s requirement was to calculate how much workforce need to hired , laid off each period,
how much yarn to purchase each period to meet the forecasted demand , the optimum stock out , optimum
inventory level and last but not the least the minimum variable cost required to be spent in the planning horizon
in 80s fabric division. The planning horizon considered is 6 months.
Table 9 Aggregate Planning Data
Deciding Variables Data
Item cost (80s Yarn) Rs.350/kg
Holding inventory cost Rs.3.65/month/item
Stock out marginal cost Rs.60/month/item
Cost of Hiring &
Training Rs.10000/worker
Cost of Layoff Rs.18000/worker
Labour hours required 2.09hrs/unit
Regular time cost Rs.80/hr/worker
Overtime cost Rs.160/hr/worker
No.of.employees in
November 650
Maximum overtime 25hrs/month
Minimum inventory at
end of 6th month 1135kgs
Regular Time cost is given by,
80 ∗ 8 ∗ 20 ∗ W(t)6t=1 ...............1
Overtime cost is
160 ∗ O6t=1 (t).................................2
Cost of Hiring and layoff is represented as
10,000 ∗ H(t) 6t=1 + 18,000 ∗ L6
t=1 (t)...........3
Inventory stockout cost is denoted by,
3.65 ∗ I(t)6t=1 + 60 ∗ S6
t=1 (t).............................4
And the item cost is represented as,
350 ∗ P6t=1 (t)...................................5
The objective is to minimize the following function.
Z (minimize) = 80 ∗ 8 ∗ 20 ∗ W(t)6t=1 + 160 ∗ O(t)6
t=1 + 10,000 ∗ H(t) 6t=1 + 18,000 ∗ L6
t=1 (t) +
3.65 ∗ I6t=1 (t) + 60 ∗ S(t)6
t=1 + 350 ∗ P6t=1 (t)................................6
The following are the constraints for the above objective function.
11. Inventory at the end of sixth month should be at least 1135kgs.
12. All decision variables should be non-negative.
13. Maximum overtime permitted is 25 hours per month per worker.
14. Balancing of workforces.
15. Production capacity is limited by the number of working hours and hence the production constraint is given.
16. Balancing of inventory and production.
The objective and constraint functions are grouped as respective matrices. The matrices are entered in to the
excel worksheet[12].
1. After creating the three matrixes, the Solver is clicked by going for the menu data.

IJRERD
International Journal of Recent Engineering Research and Development (IJRERD)
ISSN: 2455-8761
www.ijrerd.com || Volume 02 – Issue 06 || June 2017 || PP. 56-67
65 | P a g e www.ijrerd.com
2. The solver parameters dialog box opens.
3. In that box , the following are given as input
4. Set Objective : $C$22 [ since the C22 cell contains the total cost ]
5. To : Min [ since the objective is to minimize the total cost ]
6. By Changing Variable Cells : $B$5:$H$10 [since the decision variables which need to modified to get the
optimum solution is entered in cell B5 to H10 ]
7. Subject to the Constraints: By clicking add all the constraints from eqn 2 to 9 are entered as shown in
figure.
8. Select a Solving Method : Simplex LP [ since our problem revolves around Linear Programming]
9. Click Solve
Figure 9 Results viewer
Table 10 Objective Cell
Objective Cell (Min)
Cell Name
Original
Value Final Value
$C$22
Total
Cost : 0 36082801.4
1) What is the minimum total cost for the entire 6 months?
Rs. 3,60,82,801.40
2) Do employees need to work on Overtime?
NO
3) Does the industry need to hire new employees? If so, when? If not, how much employees need to be laid
off?
Employees need not to be hired and the actual number of employees required to meet the demand is 111.
Number of employees to be laid off = 650-111 = 539
4) What would be the level of inventory, stock out at the end of each month in the planning horizon of 6
months?
5)
Table 11 Aggregate Planning Results
Period H L W O
Hired Laid off Workforce Overtime
0 0 0 650 0
1 0 539.1538 110.8462036 0
2 0 0 110.8462036 0

IJRERD
International Journal of Recent Engineering Research and Development (IJRERD)
ISSN: 2455-8761
www.ijrerd.com || Volume 02 – Issue 06 || June 2017 || PP. 56-67
66 | P a g e www.ijrerd.com
3 0 0 110.8462036 0
4 0 0 110.8462036 0
5 0 0 110.8462036 0
6 0 0 110.8462036 0
I S P
Inventory Stockout Production Demand
0 0 0
1570.833333 0 8485.83333 6915
2106.666667 0 8485.83333 7950
2642.5 0 8485.83333 7950
2833.333333 0 8485.83333 8295
1984.166667 0 8485.83333 9335
1135 0 8485.83333 9335
11. Results and Discussion In the order cope with the rapidly developing textile industries in India it is absolutely necessary that
the company keeps up with the modern technology, apart from enhancing its technical capabilities the industry
must also focus on improving its resource utilisation, this is important both from an economic and sustainability
stand point. Inventory management plays a crucial role in a textile industry since it has a great influence on the
supply chain surplus value[17]. In this project the studies conducted on the raw material inventory shows that
theoretically, using a quantitative approach for the inventory is better than the previously used quantitative
approach. This is seen by the fact that the previously adopted model produces wastage of 3100kg for six months
and using the suggested method this could be theoretically reduced.
The process time study and the aggregate planning model suggests that the existing resources can be
better utilised. The labour forces can be re-distributed within the industry to avoid idle time[17].
12. Conclusion Thus in this project study the working of a textile fabric industry are studied with primary focus on raw
material inventory. The following are the activities that were carried out, Study of the industrial operations and
processes. Evaluation and analysis of current inventory model, forecasting the price of raw materials for the next
cycle period, process timing and utilisation evaluation, developing an inventory model based upon
requirements[17]. Aggregate planning for the 80s yarn section.
The above activities were carried out with an objective to improve the supply chain efficiency and
supply chain surplus for the industry. The future scope for the project can be to further improve the processes
using techniques like total productivity improvement, lean implementation, etc. The inventory model can be
made to have a high responsiveness without compromising cost by further leveraging the existing vertical
integration with its own raw material supplier.
Reference: [1]. Linh N. K. Duonga, Lincoln C. Woodab, William Y. C. Wanga 2015, “A multi-criteria inventory
management system for perishable & substitutable products”, MIMEC2015, Vol.36,No.6/2000, pp.45-
50.
[2]. Haritha Saranga , Arnab Mukherji , Janat Shah,2015,” Inventory trends in emerging market supply
chains: Evidence from the Indian automotive industry”, IIMB, pp. 3-35.
[3]. Carolina Klein Padilhaa,Giancarlo Gomes, 2016, “Innovation culture and performance in innovation of
products and processes:a study in companies of textile industry”, FEAUSP, Vol. 1A-21, pp 610-666
[4]. Gültekin Altuntaş , Fatih Semerciöz , Aslı Mert, Çağlar Pehlivan,2014,” Industry forces, competitive
and functional strategies and organizational performance: Evidence from restaurants in
Istanbul,Turkey”, 10th International Strategic Management Conference, Vol.82(7), pp 1653-1658.
[5]. Khaled Elsayedn, Hayam Wahba, 2015,” Re-examining the relationship between inventory
management and firm performance:An organizational lifecycle perspective”, Future Buisness Journal,
Vol. 70, pp 439-441.

IJRERD
International Journal of Recent Engineering Research and Development (IJRERD)
ISSN: 2455-8761
www.ijrerd.com || Volume 02 – Issue 06 || June 2017 || PP. 56-67
67 | P a g e www.ijrerd.com
[6]. Yousef Ghiami , Terry Williams , Yue Wu, 2013,” A two-echelon inventory model for a deteriorating
item with stock-dependent demand, partial backlogging and capacity constraints”, European Journal of
Operational Research, Vol 68, No 2B-21,pp 2118-2133.
[7]. K.H. van Donselaar, J. Peters, A. de Jong,R.A.C.M. Broekmeulen,2015,” Analysis and Forecasting of
Demand during Promotions for Perishable Items”, Intern. Journal of Production Economics, Vol.82(7),
pp 1653-1658.
[8]. Maragaretta Gansterer, 2015“Aggregate planning and forecasting in make to order production systems”
International journal of production economics.
[9]. Stilianos Alexiadis,2017, “Forecasting agricultural production using co-integration analysis”, Land Use
Policy, Vol. 70, pp 439-441.
[10]. Gunasekaran, A.Goyal,1993, “A Multi level lot sizing in rayon yarn industry”, European journal of
operations research, Vol. 65 (1993) 159-174
[11]. Allen H.Tai, Wai-KiChing, 2014, “Optimal inventory policy for a Markovian two-echelon system with
returns and lateral transhipment”, Intl. Journal of production economics, Vol. 151(2014)48–55
[12]. Tao Xiong , Chongguang Li , Yukun Bao , Zhongyi Hu, Lu Zhang,2015,” A combination method for
interval forecasting of agricultural commodity futures prices”, Knowledge-Based Systems.430-2014
[13]. Ahola, T., & Lehtinen, J. (2010). Is performance measurement suitable for an extended enterprise?
International Journal of Operations & Production Management, 30(2), 181-204. doi:
10.1108/01443571011018707.
[14]. Alizadeh, M., Eskandari, H., & Sajadifar, S. M. (2014). A modified (S - 1,S) inventory system for
deteriorating items with Poisson demand and non-zero lead time. Applied Mathematical Modelling,
38(2), 699-711. doi: 10.1016/j.apm.2013.07.014
[15]. https:/bannarimills.com/aspx/aboutus/
[16]. https://www.arenasimulation.com/
[17]. https://support.office.com/en-us/article/Create-a-forecast-in-Excel-2016-for-Windows-22c500da-6da7-
45e5-bfdc-60a7062329fd
Related Documents