Aggregate Competition, Information Asymmetry and Cost of Capital: Evidence from Equity Market Liberalization * Karthik Balakrishnan † The Wharton School University of Pennsylvania Rahul Vashishtha Fuqua School of Business Duke University Robert E. Verrecchia The Wharton School University of Pennsylvania This Draft: December 2012 Abstract This paper examines the effect of competition amongst traders in an economy on the pricing of information asymmetry. Given the cross-sectional and temporal variation in the level of investibility, emerging equity markets provide an ideal setting to examine the impact of an increase in competition on the extent to which information asymmetry affects cost of capital. Employing equity market liberalization for 31 countries between 1996 and 2006 as a pseudo- natural experiment, we find that pricing of information asymmetry declines with an increase in the number of traders who can invest in the economy. Moreover, we find that the decline in pricing is greater when there is an increase in the number of uninformed traders. * We thank Jeff Ng, Dan Taylor and Holly Yang for comments and suggestions. Balakrishnan gratefully acknowledges funding from the Wharton Global Initiative Fund. We would like to thank Frank Warnock for making the investibility data available. † Address for correspondence: The Wharton School, University of Pennsylvania, 1300 SH-DH, Philadelphia, PA 19104. Phone 215-898-2610. e-mail: [email protected].

Welcome message from author
This document is posted to help you gain knowledge. Please leave a comment to let me know what you think about it! Share it to your friends and learn new things together.
Transcript
Aggregate Competition, Information Asymmetry and Cost of Capital:
Evidence from Equity Market Liberalization*
Karthik Balakrishnan† The Wharton School
University of Pennsylvania
Rahul Vashishtha Fuqua School of Business
Duke University
Robert E. Verrecchia The Wharton School
University of Pennsylvania
This Draft: December 2012
Abstract
This paper examines the effect of competition amongst traders in an economy on the pricing of information asymmetry. Given the cross-sectional and temporal variation in the level of investibility, emerging equity markets provide an ideal setting to examine the impact of an increase in competition on the extent to which information asymmetry affects cost of capital. Employing equity market liberalization for 31 countries between 1996 and 2006 as a pseudo-natural experiment, we find that pricing of information asymmetry declines with an increase in the number of traders who can invest in the economy. Moreover, we find that the decline in pricing is greater when there is an increase in the number of uninformed traders.
* We thank Jeff Ng, Dan Taylor and Holly Yang for comments and suggestions. Balakrishnan gratefully acknowledges funding from the Wharton Global Initiative Fund. We would like to thank Frank Warnock for making the investibility data available. † Address for correspondence: The Wharton School, University of Pennsylvania, 1300 SH-DH, Philadelphia, PA 19104. Phone 215-898-2610. e-mail: [email protected].

1
1. Introduction
This study employs equity market liberalization in 31 countries as a pseudo-natural experiment
to examine whether the level of competition amongst traders in an economy for firms’ shares
affects the relation between information asymmetry and cost of capital. Whether information
asymmetry amongst traders affects cost of capital is an important area of academic inquiry
(Diamond and Verrecchia [1991], Lambert, Leuz and Verrecchia [2007], Bloomfield and Fischer
[2011]). However, literature suggests that the answer to this question depends on the level of
competition for firms’ shares (Kyle [1989], Lambert, Leuz and Verrecchia [2012]). In an
economy characterized by perfect competition, i.e., one where all investors in the economy act as
price takers and thus can buy or sell any quantity at the market price, the degree of information
asymmetry has no effect on cost of capital after controlling for the average precision of
investors’ information (Lambert, et al. [2012]). Such a characterization implicitly assumes that
the number of traders in the economy is (countably) infinite (Hellwig [1980]). Each investor
then believes that neither her trade nor the trade of others will have any impact on price. Thus,
investors with any degree of private information about firms can trade as much as they wish
without affecting prices.
In contrast, in an economy characterized by imperfect competition, information
asymmetry can affect firms’ cost of capital. In such an economy, the number of traders is finite
and each investor anticipates the effect he or she has on price, and therefore price curves are
upwardly sloping in demand due to self-sustaining beliefs. More importantly, in such an
economy, the curve for informed investors will be steeper than that of uninformed investors
because the trades of better-informed investors have a greater impact on price due to their
superior knowledge (Kyle [1989]). The existence of two curves suggests that investors in the
2
economy discount firms’ share prices relative to the expected value of firms’ cash flows
depending on the level of information asymmetry. The discount reflects the extent of adverse
selection in the economy. In other words, adverse selection results from the interaction between
imperfect competition and asymmetric information. In terms of comparative statics, theory
suggests that an increase in the number of uninformed investors in an economy characterized by
imperfect competition will reduce adverse selection and, hence, will result in a reduction in the
discount.
Recent empirical literature has attempted to provide evidence on the conditional relation
between cost of capital and information asymmetry discussed above (Armstrong, Core, Taylor
and Verrecchia [2011], Akins, Ng and Verdi [2012]). Acknowledging that measuring
competition is complex, the empirical literature has attempted to measure competition using
firm-level shareholding patterns.1 Using firm-level measures of competition, these studies have
provided evidence consistent with a decline in the effect of information asymmetry on cost of
capital as competition increases. Nonetheless, the theory itself is based on the notion of
competition at the economy level. In other words, as a theoretical construct, “competition” is a
reference to the number of investors in the economy irrespective of whether or not an individual
investor holds a firm’s stock.2 Thus, the motivation for this study is to consider an institutional
setting and empirical experiment that positions us closer to the extant theoretical literature.
Moreover, given that the setting is plausibly exogenous, our study attempts to provide causal
evidence on the effect of competition on the pricing of information asymmetry. Further, we
1 Armstrong et al. [2011] use the number of shareholders disclosed in the financial statements while Akins et al. [2012] use measures of institutional holdings. 2 Because the theoretical literature that motivates our study (e.g., Kyle [1989]) typically concerns an economy with a single risky asset, the theory, per se, does not explicitly distinguish between the number of investors in the economy versus the number of investors in the asset. That said, the spirit of this literature is that the single risky asset represents the economy’s total, non-diversifiable risk, and thus the number of investors is implicitly the number of investors in the economy.

3
employ our setting to shed light on how the relation between information asymmetry and cost of
capital varies with the fraction of informed investors.
We tackle the aforementioned empirical issues in measuring competition at an economy-
level by employing equity market liberalization of 31 emerging market countries as a pseudo-
natural experimental setting to examine the impact of an increase in competition on the relation
between information asymmetry and cost of capital. Equity market liberalization is a decision by
a country’s government to allow foreigners to purchase shares in that country’s stock market and
represents an exogenous increase in the number of traders that can participate in the economy
and, hence, the competition. Thus, although economy-wide competition as such is unobservable,
liberalization can be employed to clearly identify whether the increased competition amongst
traders in an economy reduces the risk premium associated with information asymmetry.
The extent to which equity markets open up and integrate with world markets following
liberalization reforms is gradual (Bekaert and Harvey [1995], Stulz [2005]). Accordingly,
following prior literature (e.g., Edison and Warnock [2003], Bekaert et al. [2007]), we employ a
continuous measure that captures the gradual movements in equity market openness at a monthly
frequency for the 31 emerging market countries. For each emerging market country, Standard
and Poor’s/International Finance Corporation (SP/IFC) computes two indices: a Global index
(IFCG), designed to represent the market capitalization, and an Investable index (IFCI), designed
to represent the portion of the market capitalization that is available to foreign investors. The
ratio of the market capitalizations of a country’s IFCI and IFCG indices (each scaled by
respective price indices) provides a quantitative measure of the availability of the country’s
equities to foreigners. Thus, increases in this ratio represent increases in the level of competition
amongst traders in the economy.

4
To measure the effect of competition on the pricing of information asymmetry, we
examine future returns of firms sorted based on the extent to which equity markets are open, as a
proxy for the level of competition in their shares, and also sorted on a proxy for information
asymmetry. We use bid-ask spread, analyst coverage and a composite measure based on both
bid-ask and analyst coverage as three alternative measures of information asymmetry. Using a
sample of 31 countries between 1996 and 2006 for which the competition measure is available,
we find that when the level of investibility in an economy is low, i.e., competition is low, firms
with high information asymmetry earn significantly greater excess returns than do firms with low
information asymmetry. We also find that as the equity markets open up and the level of
competition increases, the difference in returns for firms with high information asymmetry over
firms with low information asymmetry declines.
Theory also suggests the effect of competition on the pricing of information asymmetry
depends on whether the increase in competition is due to an increase in informed investors or
uninformed investors. The effect of an increase in the number of uninformed investors on cost of
capital is unambiguously negative. Increasing the number of uninformed investors increases the
risk-bearing capacity in the economy, which decreases the pricing of information asymmetry
through greater sharing of adverse-selection risk. In contrast, addition of informed investors has
two countervailing effects. On the one hand, the increase in the number of informed investors
results in a reduction in the pricing of information asymmetry due to increased risk-bearing
capacity of the information risk. On the other hand, an increase in the proportion of informed
investors results in an increase in adverse-selection risk, which causes an increase in the pricing
of information asymmetry. Thus, we expect that the beneficial effect of increased competition is
greater in cases where uninformed investors are added to the economy. Although we cannot

5
observe the informedness of a new investor, we attempt to provide evidence on this prediction by
examining cross-sectional variation based on the level of opaqueness in a country’s institutions.
In countries where institutions are opaque, the new foreign investors, who rely on arms-length
hard information, are more likely to be uninformed relative to the informed domestic traders.
Consistent with this argument, Bae, Stulz, and Tan [2008] find that local analysts have a greater
information advantage over foreign analysts in countries with greater opacity. This suggests that
when a country’s institutions are opaque, it is more likely that the foreign investors are closer to
the uninformed investors than to informed investors in the local economy. Consistent with
theoretical predictions, we find that the decline in the pricing of information asymmetry with an
increase in competition is concentrated amongst countries that are opaque. Finally, we present
evidence that our findings are robust to different ways of sorting, different samples and inclusion
of various macroeconomic risk characteristics.
This study makes two contributions. First, we extend previous literature that has
empirically investigated the pricing of information asymmetry and information quality (Botosan
[1997], Francis et al. [2004], [2005], Core et al. [2008], Duarte and Young [2009], Mohanram
and Rajgopal [2009], McInnis [2010], Mashruwala and Mashruwala [2011], Ogneva [2012]). In
this literature, our study is most closely related to Armstrong et al. [2011] and Akins et al.
[2011]. Both these studies attempt to provide evidence on the effect of competition on the pricing
of information asymmetry by employing firm-level measures of competition. We extend this
literature by employing an economy-level measure of competition; this extension better positions
us in relation to the extant theoretical literature, as well as helps us provide better causal
evidence on this relation. Further, this growing body of research focuses on the United States,
arguably the market with the highest level of competition internationally and thus the least likely

6
setting for information asymmetry to play a role in pricing. In contrast, our research focuses on
markets where information asymmetry effects may be particularly strong, namely emerging
markets.
Second, we contribute to the literature that examines the implications of stock market
liberalization (Bekaert and Harvey [2000], Henry [2000a], Henry [2000b]). Extant literature on
liberalization has focused solely on the prediction by standard international asset pricing model
(IAPM) that stock market liberalization may reduce the liberalizing country’s cost of equity
capital by allowing for risk sharing between domestic and foreign agents (Stapleton and
Subrahmanyan [1977], Errunza and Losq [1985], Eun and Janakiramanan [1986], Alexander,
Eun, and Janakiramanan [1987], and Stulz [1999a, 1999b]). Thus, the literature has largely
ignored the role of information asymmetry and focused solely on the neo-classical concept of
risk-bearing capacity. We extend this literature by providing evidence that information
asymmetry is one of the specific channels through which a reduction in risk premium occurs
upon liberalization. Moreover, the evidence in this study suggests that the effect of liberalization
on stock return depends on whether the foreign agents are informed or uninformed relative to
domestic agents – an aspect ignored by the literature thus far.
The remainder of the paper proceeds as follows. The next section reviews the relevant prior
literature. Section 3 describes how we measure key variables and the research design for our
empirical tests. Section 4 presents our findings, and Section 5 concludes the paper and offers
caveats.
7
2. Literature Review and Hypothesis Development
In this section, we develop our hypothesis on how an increase in the number of traders in an
economy affects the pricing of information asymmetry between informed and less
informed/uninformed traders in that economy.
In an economy characterized by perfect markets, irrespective of the level of information
asymmetry, no market participant affects price when he or she trades. Because no individual
investor can affect price, differences in information across investors do not affect the cost of
capital. Related to this argument is a literature that employs noisy rational expectations models
(e.g., Grossman and Stiglitz, [1980], Diamond and Verrecchia, [1981]), to examine the role of
information issues in asset pricing. This literature finds that only the average precision of
investors’ information is relevant in deriving the equilibrium cost of capital (e.g., Lintner,
[1969], Admati, [1985], and Lambert, et al. [2012]). Thus, controlling for average precision, the
degree of information asymmetry across investors does not affect cost of capital.
In other words, under perfect competition, market risk completely explains the cost of
capital regardless of the level of information asymmetry. The key assumption underlying this
argument and the above models is that there is perfect competition amongst traders (e.g., Hellwig
[1980], Merton [1989] and O’Hara [2003]). A stream of literature beginning with Hellwig
[1980] points out that the assumption that traders do not affect price implicitly relies on the
assumption that the number of traders is very large (countably infinite). Moreover, imperfect
competition and asymmetric information are common features of market microstructure models
going back to Kyle [1985] and Glosten and Milgrom [1985].
When the number of traders in an economy is finite, each investor anticipates that he or
she and every other investor pushes the price upward (downward) when buying (selling) and
hence faces an upwardly sloping price curve in demand. The upwardly sloping nature of price
8
curve reduces an investor’s willingness to trade and increases the cost of capital. That is,
imperfect competition increases the price of risk in the market as a whole. If, in addition, there is
information asymmetry, it further increases the upward slope in price, resulting in adverse
selection and a higher cost of capital. Adverse selection arises because an individual investor
presumes that when he or she trades in a firm’s shares, there is an additional upward slope in
price because others will presume that he or she has superior information. Figure 1 summarizes
the argument thus far: When markets are imperfect, firms’ with lower levels of information
asymmetry will have a lower cost of capital than that of firms with higher levels of information
asymmetry.
A salient feature of theoretical models in this literature is that they examine a single asset
economy as a representation of the market’s total cash flows. Thus, in these models
“competition” is a reference to the number of investors in the economy irrespective of whether or
not an individual trader holds a firm’s stock. More precisely, the theory suggests that when the
number of traders in an economy increases, information asymmetry is priced less. In this study,
we use the equity market liberalizations of 31 countries as pseudo-natural experiment to provide
evidence on whether increasing the number of traders in an economy reduces the pricing of
information asymmetry.
Another salient feature of the theory is that the effect of competition on pricing depends on
the type of investors added to the economy – informed or uninformed investors [Figure 2].
Consider an economy with imperfect competition and information asymmetry amongst investors.
In such a setting, as discussed above, information asymmetry is priced. Increasing the number of
informed investors in such an economy has two countervailing effects [Figure 2 Row 2]. On the
one hand, the increase in the number of investors – either informed or uninformed – increases the

9
total risk-bearing capacity of the economy and, hence, results in a reduction in the pricing of
information asymmetry due to greater sharing of the information risk. On the other hand, the
increase in the number of informed investors increases adverse-selection risk, which causes
uninformed traders to require a larger risk premium resulting in an increase in the pricing of
information asymmetry. In a case where uninformed investors are added to the economy, the
effect on cost of capital is unambiguously negative. Increasing the number of uninformed
investors increases risk-bearing capacity and improves the ability to share adverse-selection risk
and, thus, reduces the pricing of information asymmetry.
As discussed above, our study relates to the previous literature that has empirically
investigated the pricing of information asymmetry and information quality (e.g., Easley et al.
2002; Francis et al. 2004, 2005; Core et al. 2008; Duarte and Young 2009; Mohanram and
Rajgopal 2009; McInnis 2010). However, much of this literature examines the unconditional
relation between information asymmetry and the cost of capital. Recent studies examine the
relation between information asymmetry and cost of capital conditional on the level of market
competition. Armstrong et al. [2011] use the number of shareholders that hold a firm’s share as
a measure of competition. Akins et al. [2012] use the number of institutional investors and the
concentration of institutional investor ownership as a measure of competition. We extend this
stream of literature by employing a pseudo-experimental setting to provide better evidence on
the theory as discussed above.
3. Research Design
3.1 Equity Market Liberalization and Measure of Aggregate Equity Market Competition

10
A key empirical issue in testing the theory is to measure economy-wide competition, i.e., the
number of traders interested in trading in the stock market. Although, in principle one could
measure economy-wide competition in various ways, such as use a measure of the actual number
of stock traders in a country, we are aware of no such direct measure of this construct. In our
study, we overcome this difficulty of measuring competition by using stock market liberalization
to identify changes in competition at the economy-level. Stock market liberalization is a decision
by a country’s government to allow foreigners to purchase shares in that country’s stock market.3
Thus, equity market liberalization represents an increase in the number of traders in the economy
and provides a pseudo-natural experiment to examine the effects of increase in competition on
the relation between information asymmetry and cost of capital.4
In the last two decades, emerging stock markets have become less segmented from the
world market. However, precisely measuring the degree of stock market liberalization is
challenging. One approach is to treat liberalization as a one-shot event, assuming that markets
are completely segmented before the official liberalization date and perfectly integrated after that
date. For example, liberalization can be identified as the year of a formal regulatory change after
which foreign investors officially have the opportunity to invest in domestic equity securities in
that country. In reality, as Bekaert and Harvey [1995] and Stulz [2005] note, the degree of
openness changes only gradually over time. For example, a country might pass a law that
seemingly drops all barriers to foreign participation in local capital markets. Although this is a
3 The maintained view in the literature is that this increased integration promotes economic growth by lowering the cost of external capital (Bekaert and Harvey [2000]; Henry [2000a], [2000b]), and by improving the alignment between capital and growth opportunities at the country level (Fisman and Love [2004]; Bekaert, Harvey, Lundblad, and Siegel [2007]). In a country level study, Bekaert, Harvey, and Lundblad [2005] document that the effect of a stock market liberalization on GDP growth is between 1 and 2 percent. 4 We do not claim that the liberalization process is completely exogenous. Obviously, a country’s decision to liberalize is based on various socio-economic conditions. Instead, we argue that liberalization can be considered exogenous to a specific firm and its level of information asymmetry.
11
liberalization event, it might not be an effective liberalization that results in market integration.
There are two possibilities in this example. First, the market might have been integrated to a
certain extent before the regulatory liberalization. That is, foreigners might have had the ability
to access the market through other means, such as country funds and depository receipts. Second,
the liberalization might have little or no effect because either foreign investors do not believe the
regulatory reforms will be long lasting or other market imperfections exist. Further, the official
regulatory changes permitting foreign investment are often implemented gradually. Thus,
liberalization cannot be considered as a one-shot event and the time variation in the level of
market segmentation should be taken into account when estimating the impact of liberalizations.
Following prior literature, we employ a measure that captures the gradual movements in
the intensity of capital controls and is available at a monthly frequency for the 31 emerging
market countries (Edison and Warnock [2003], Bekaert et al. [2007]). For each emerging market
country, Standard and Poor’s/International Finance Corporation (SP/IFC) computes two indices:
a Global index (IFCG), designed to represent the market value of equity in a country, and an
Investable index (IFCI), designed to represent the subset of the market value of equity in a
country that is available to foreign investors. The IFC investable index is constructed by taking
into consideration foreign investment restrictions either at the national level or by the individual
company’s corporate statute as well as access, size and liquidity of stocks. The ratio of the
market capitalizations of a country’s IFCI and IFCG indices provides a quantitative measure of
the availability of the country’s equities to foreigners. This measure gives an explicit indication
of the extent of the liberalization and its evolution over time. However, the ratio assumes that a
country has a uniform country-wide restriction on foreign ownership of its equities. Typically,
restrictions vary across stocks or sectors. In such cases, asymmetric shocks to investable and
12
non-investable stocks will lead to relative price changes and, hence, changes in the ratio of the
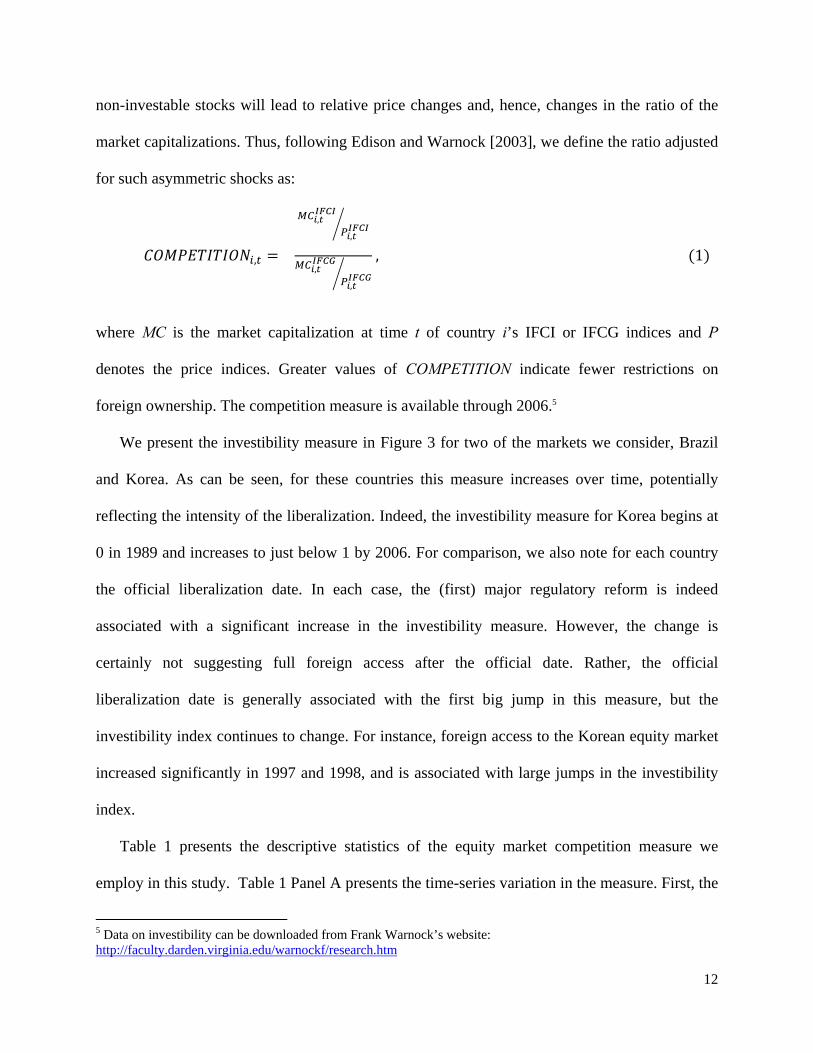
market capitalizations. Thus, following Edison and Warnock [2003], we define the ratio adjusted
for such asymmetric shocks as:
,
,
,
,
,
, 1
where MC is the market capitalization at time t of country i’s IFCI or IFCG indices and P
denotes the price indices. Greater values of COMPETITION indicate fewer restrictions on
foreign ownership. The competition measure is available through 2006.5
We present the investibility measure in Figure 3 for two of the markets we consider, Brazil
and Korea. As can be seen, for these countries this measure increases over time, potentially
reflecting the intensity of the liberalization. Indeed, the investibility measure for Korea begins at
0 in 1989 and increases to just below 1 by 2006. For comparison, we also note for each country
the official liberalization date. In each case, the (first) major regulatory reform is indeed
associated with a significant increase in the investibility measure. However, the change is
certainly not suggesting full foreign access after the official date. Rather, the official
liberalization date is generally associated with the first big jump in this measure, but the
investibility index continues to change. For instance, foreign access to the Korean equity market
increased significantly in 1997 and 1998, and is associated with large jumps in the investibility
index.
Table 1 presents the descriptive statistics of the equity market competition measure we
employ in this study. Table 1 Panel A presents the time-series variation in the measure. First, the
5 Data on investibility can be downloaded from Frank Warnock’s website: http://faculty.darden.virginia.edu/warnockf/research.htm

13
means-across-years range from 0.61 to 0.80. Further, there is considerable variation within each
year providing a source of cross-sectional identification. Table 1 Panel B provides statistics on
the time-series variation within each country. The standard deviation captures the extent to which
countries have experienced liberalization during our sample period. For example, China has the
highest standard deviation suggesting that during our sample period, China transitioned from a
closed economy to one where foreign investors could freely invest. We view the exogenous
nature of the liberalization measure and the time-series as well as cross-sectional variation in the
measure as the key strengths of the competition measure that help in identifying causal relation
between competition, information asymmetry and cost of capital.
3.2 Empirical specification
We test our hypotheses by using future realized excess returns as a proxy for cost of
capital. We estimate the following cross-sectional asset pricing specification to examine the
effect of equity market competition on the pricing of information asymmetry:
, , , , ∗ ,
∑ , , , , (2)
where RET is a firm’s monthly excess stock return over the (US) risk free rate, COMPETITION
is a measure of the intensity of restrictions on foreign ownership in a country’s stock market as
discussed above but coded such that higher values imply greater openness, IA is a measure of the
firm-level information asymmetry, and CONTROL is a vector of commonly used control
variables in asset pricing specifications that are known to predict future stock returns. IND, TIME
denote industry and time fixed effects, respectively. CONTROL comprises natural logarithm of a
firm’s market capitalization (SIZE), book value of equity scaled by market capitalization
(BTOM), market beta (BETA) obtained from the regression of firm-level monthly excess stock

14
returns on country returns over a five year period with a minimum requirement of 5 observations,
and lagged firm’s stock return (LAG_RET). All covariates are measured at the beginning of the
month prior to the month for which the dependent variable RET is computed.6 Finally, we
include a one-month lag between the measurement of variables and calculation of returns. This
ensures that the information for portfolio formation is available to all investors and also takes
into account any short-term return reversals.
To ease the exposition of our findings, we rank all of our variables, except variables that
measure returns. We employ a dependent sort procedure by first obtaining quintile ranks for
COMPETITION every month and then obtaining ranks for measures of information asymmetry
and control variables within each quintile of COMPETITION.7 We rank all of our variables into
quintiles, except for one of the measures of information asymmetry that is based on analyst
following for which we use quartile ranks (see explanation below). We scale the ranks of our
measures of IA, SIZE, BTOM, and BETA such that they range between zero and one so that the
coefficients on these variables can be interpreted as the abnormal return on zero investment
portfolios.
Our key coefficient of interest in the above specification is the coefficient β3 on the
interaction term between COMPETITION and IA. Coefficient β3 indicates how the pricing of
information asymmetry changes as one moves from the bottom quintile to the top quintile of the
COMPETITION. If greater aggregate competition in equity markets reduces the pricing of
information asymmetry, then the Coefficient β3 should be negative.
6 Recent literature argues that using more timely information when constructing the variables results in better asset pricing models (Asness and Frazzini [2011]). 7 As discussed later, our findings our robust to using ranks for IA and control variables that are independent of the ranks for COMPETITION.

15
We estimate the above specification using three different measures of information
asymmetry. Our first measure of information asymmetry is the scaled quintile rank of the
monthly average of daily bid-ask spread in equity prices (BIDASK). We obtain information on
bid-ask spread from the COMPUSTAT global database.8 Our second measure of information
asymmetry is scaled quartile rank of the negative of a firm’s analyst following
(NUMANALYSTS). We measure analyst following as the number of analysts issuing one-year-
ahead earnings forecasts according to I/B/E/S database. Because analyst coverage is known to
improve the information environment, greater analyst coverage should be associated with lower
information asymmetry.9 Both BIDASK and NUMANALYSTS are defined such that a greater
value indicates greater information asymmetry. Finally, we also use a composite measure of
information asymmetry (COMPOSITE_IA) defined as the average of the scaled ranks of BIDASK
and NUMANALYSTS. Because COMPOSITE_IA captures information from both analyst
following and bid-ask spreads, we view COMPOSITE_IA as our main measure of information
asymmetry.
To measure our independent variables, we obtain data on stock returns, bid-ask spreads,
and accounting reports from Compustat global database. Our final sample comprises a maximum
of 663,352 firm-month observations representing 31 emerging market countries from the period
1996 to 2006. Table 2 presents descriptive for our measures of information asymmetry and
control variables.
4. Results
4.1. Competition and Pricing of Information Asymmetry
8 We cannot measure information asymmetry using the adverse selection component of the bid-ask spread because we do not have access to intra-day trading data for our sample firms. 9 While we attempt to rank all of our variables into quintiles, we are unable to do so for the measure of information asymmetry based on analyst following because a large number of firms have zero analyst following in our sample. We therefore work with quartile ranks of analyst following.

16
Table 3 presents our main findings on the effect of competition on the pricing of
information asymmetry and shows ordinary least squares estimates of equation (2). For this
analysis, we exploit both the cross-sectional and the temporal variation in our measure of
competition and estimate equation (2) on a pooled sample of a maximum of 663,352 firm-month
observations representing 31 emerging market countries. Because firm-month observations
within a country are unlikely to be independent, we estimate standard errors by clustering at the
country level. Note that because Equation (2) includes an intercept and because ranks for IA,
LOGSIZE, BTOM, and BETA, are scaled to range from zero to one, the least square values of the
coefficients on these variables represent abnormal returns on zero-investment (hedge) portfolios,
i.e., portfolios where the sum of the weights assigned to individual securities is zero.10
Our key coefficient of interest is the coefficient β3 on the interaction term between
COMPETITION and IA. β3 indicates the change in the pricing of information asymmetry as one
moves from the lowest to the highest quintile of COMPETITION. The first three columns present
results with BIDASK and the next three columns present results with NUMANALYSTS as the
measure of information asymmetry. In the last three columns we present results with
COMPOSITE_IA, which is our main measure of information asymmetry computed as the
average of the scaled ranks of BIDASK and NUMANALYSTS.
Columns (1), (4), and (7) present estimates of our baseline specification that does not
include any control variables. Consistent with our prediction, we find that the coefficient β3 is
negative and significant in these columns. This finding confirms that the returns generated by
the baseline strategy of going long high information asymmetry firms and short low information
asymmetry firms generates smaller returns as one moves from the lowest quintile of competition
10 See Fama (1976, pp. 323-331) for more details on the use of least squares coefficients as portfolio returns.

17
to the highest quintile of competition. This suggests that as the number of traders in the
economy increases the pricing of information asymmetry declines. The effect of competition on
the pricing of information asymmetry is also economically significant. For example, the
magnitude of coefficient β3 in Column (7) indicates that the returns generated by the baseline
hedge strategy decrease by 0.9% per month as COMPETITION increases by one quintile.
Estimates in Columns (2), (5), and (8) show that the above findings are robust to the
inclusion of controls for known risk factors of size, book-to-market ratio, and market beta (Fama
and French [1993], Daniel and Titman [1996]). Consistent with prior literature, we find a
negative coefficient on LOGSIZE and a positive coefficient on BTOM. We find the coefficient on
BETA to be negative and significant. This latter finding, while inconsistent with standard asset-
pricing theory, is consistent with the findings in several prior studies such as Fama and French
(1992), Chalmers and Kadlec (1998), and Datar et al. (1998), Easley et al. (2002), Core et al.
(2008). Finally, estimates in Columns (3), (6), and (9) show that the estimate of coefficient β3
continues to be negative and significant even after including lagged firm returns as an additional
control variable. This result indicates that our findings are robust to controlling for any short-
term reversals in stock returns.
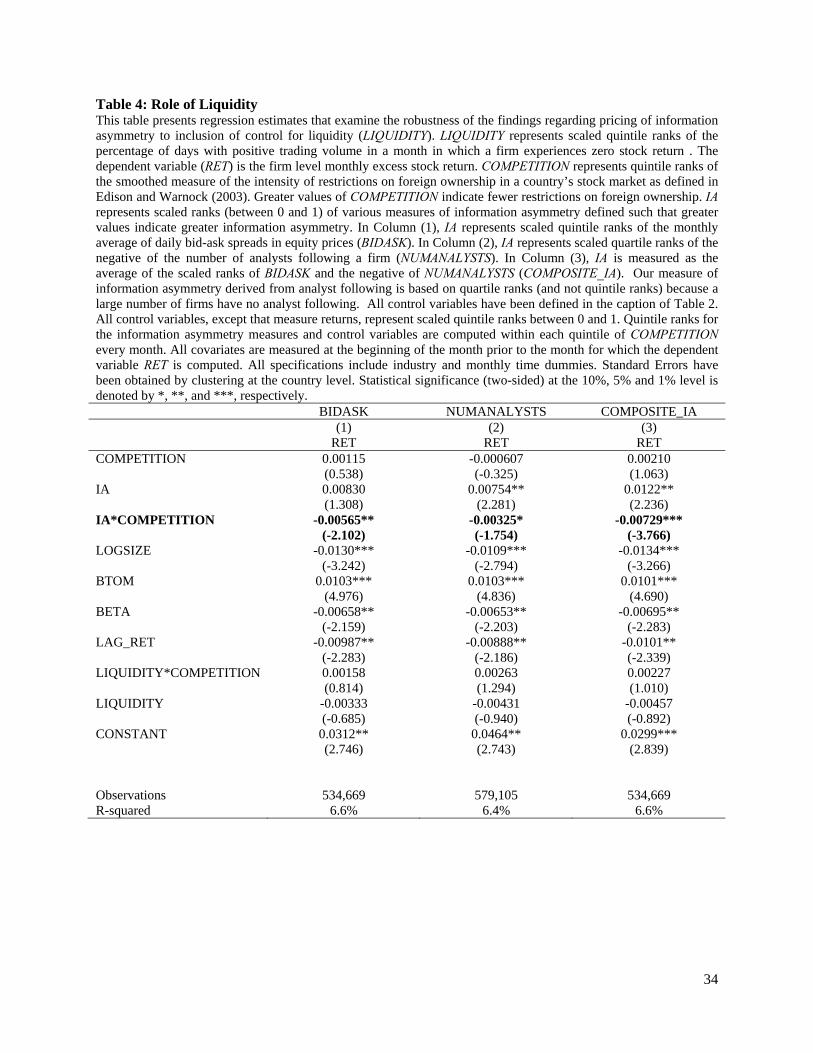
4.2. Role of Liquidity
In this section we address the potential empirical concern that our inferences regarding
the pricing of information asymmetry may reflect the effect of liquidity, which could be
correlated with both our measure of competition and the proxies for information asymmetry.
Accordingly, we augment Equation (2) with a measure of firm-level liquidity as well as
an interaction between competition and liquidity. Following Lesmond, Ogden, and Trzcinka
(1999) and Goyenko, Holden, and Trzcinka (2009), we measure liquidity as the scaled quintile

18
rank of the fraction of trading days with positive trading volume and zero returns during the
month (LIQUIDITY). For brevity, we present results only for our main composite measure of
information asymmetry (COMPOSITE_IA) for this as well as the subsequent analysis in this
paper. Table 4 presents the results. We find that even after controlling for liquidity, the
coefficient on the interaction between IA and COMPETITION is negative and significant. This
finding further enhances the credibility of our inferences by showing that our results related to
pricing of information asymmetry do not reflect the effect of liquidity.
4.3. Effect of Country-level Opacity
As discussed above, theory suggests that the effect of competition on the pricing of
information asymmetry depends on the type of investors added to the economy – informed or
uninformed investors [Figure 2]. Increasing the number of informed investors in an economy has
two countervailing effects [Figure 2 Row 2]. On the one hand, the increase in the number of
investors increases the total risk-bearing capacity of the economy and, hence, results in a
reduction in the pricing of information asymmetry due to greater sharing of the information risk.
On the other hand, the increase in the number of informed investors increases the adverse-
selection risk causing the uninformed traders to require a larger risk premium resulting in an
increase in the pricing of information asymmetry. The effect of increasing the number of
uninformed investors on the pricing of information asymmetry is, however, unambiguously
negative because the increase in uninformed investors increases the risk-bearing capacity leading
to greater sharing of the information risk. We next aim to provide evidence on this prediction.
Specifically, we examine whether the decline in the pricing of information asymmetry is more
pronounced in settings where uninformed investors are added to the economy. Unfortunately, it
is empirically not feasible to identify the exact type of investors added to an economy. However,
19
we can indirectly get to this notion by examining cross-sectional variation based on how opaque
a country’s institutions are. The argument is that in countries where institutions are opaque, the
new foreign investors, who rely on arms-length hard information, are more likely to be
uninformed relative to the informed domestic traders in the opaque country. Consistent with this
argument, Bae, Stulz and Tan [2008] find that local analysts have a significant information
advantage over foreign analysts in a large sample of countries, and that this effect is stronger
when the local analysts are in countries with lower accounting transparency. Thus, we predict
that our results will be stronger in opaque countries.
To test the above prediction, we estimate an augmented version of equation (2) that includes
a measure of the opaqueness of a country (OPACITY), and its interaction terms with IA,
COMPETITION, and IA*COMPETITION as additional covariates. We measure OPACITY as the
scaled quintile ranks of the country level opacity index constructed by Kurtzman, Yago and
Phumiwasana [2004]. This index is constructed following the methodology of
PricewaterhouseCoopers (2001) Opacity Index and reflects a country’s level of corruption,
efficacy of the legal system, deleterious economic policies, inadequacy of accounting and
governance practices, and detrimental regulatory structures. The higher is the index, the higher is
the opacity.
Table 5 presents the results of the analysis. Consistent with our predictions, we find that the
coefficient on the interaction term IA*COMPETITON*OPACITY to be negative and significant.
This suggests that the decline in the pricing of information asymmetry caused by the
liberalization of equity markets is greater when the new foreign investors are uninformed relative
to the domestic informed investors.

20
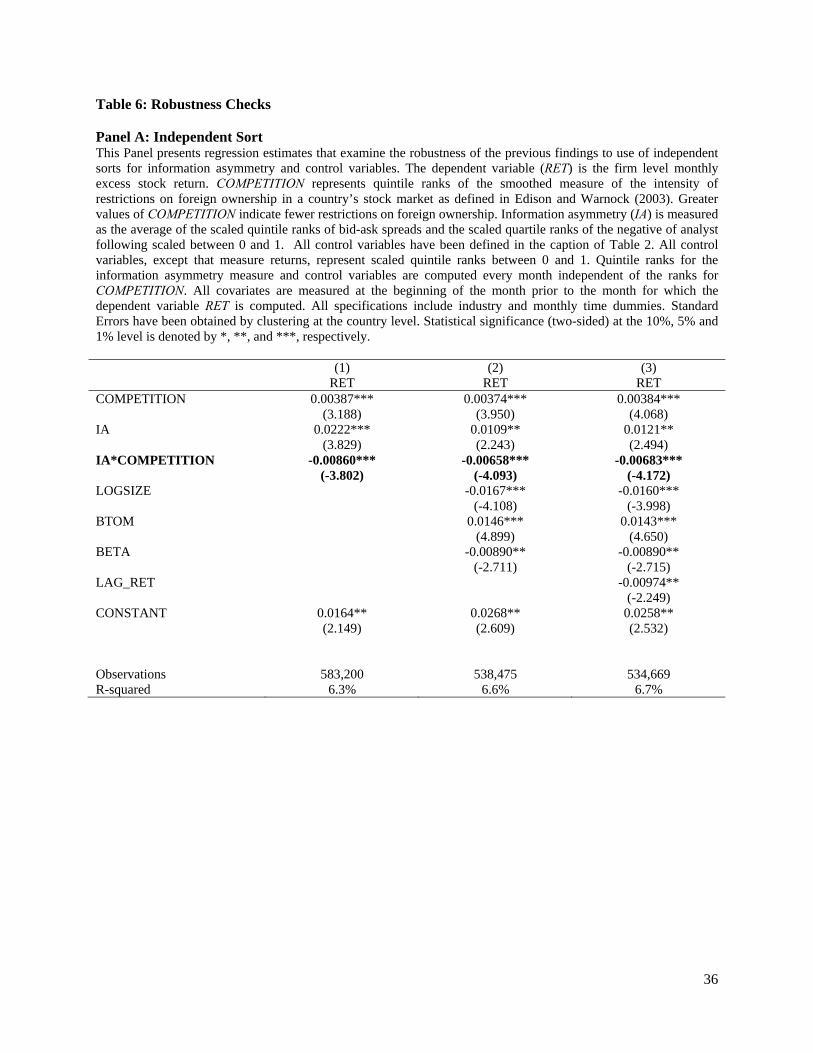
4.4. Robustness
4.4.1. Independent sort
Our research design thus far employs dependent sorts. Specifically, we form rankings of
information asymmetry within a specific quintile of competition. An advantage of this method is
that it takes into account any variation in distribution of information asymmetry across quintiles
of competition and, hence, generates portfolios with similar number of firms. The cost is a
reduction in power to the extent that the two sorting variables are correlated. We next test the
sensitivity of our results to independent sorts. Accordingly, we sort the firms independently each
month by information asymmetry and competition quintile. Results presented in Table 6 Panel A
suggests that our main inferences our robust to this alternative sorting method.
4.4.2. Country Fixed Effects
In the analysis thus far, we have exploited both the time-series and the cross-sectional
variation across countries in the level of competition to identify the effect of competition on the
pricing of information asymmetry. In this section, we identify the effect of competition on the
pricing of information asymmetry by relying only on the time-series variation in competition.
We conduct this analysis for two reasons. First, this analysis helps provide stronger causal
evidence by mitigating concerns that our inferences may be confounded by any unobserved time
invariant differences across countries. Second, this analysis helps assess the relative contribution
of cross-sectional and time series variation in identification of the effect of competition on the
pricing of information asymmetry.
To implement this analysis, we estimate Equation (2) after including country fixed
effects, which absorb the effect of any time invariant cross-sectional differences across countries.
In the presence of country fixed effects, therefore, the effect of competition would be identified

21
only through changes over time. Results are presented in Table 6 Panel B. We find that the
interaction term IA*COMPETITION continues to load negative and significant. This suggests
that the source of identification is not just cross-sectional variation but also time-series variation
in competition. More importantly, this result helps better shed light on the causal nature of the
relation between competition and pricing of information asymmetry.
4.4.3. Asset pricing model
One major concern with international asset pricing models is that there does not exist a
widely accepted pricing model. Accordingly, we examine the sensitivity of our results to the
inclusion of a wide variety of macroeconomic variables that have been used in prior literature
(e.g., Bekaert and Harvey [2000]). Specifically, we control for volatility in foreign exchange rate
by including the rolling three-year standard deviation of the exchange rate scaled by mean
exchange rate (FXVOLATILITY). We also control for asset concentration measured as the
number of publicly traded stocks each month in a country that appear in COMPUSTAT Global
(NUMSTOCKS). Further, we include the cross-sectional standard deviation of the monthly stock
returns at each month in a country (XSECSTDEV), the equity market capitalization of a country
scaled by its GDP for the previous year (MKTTOGDP), the GDP growth rate of a country for the
previous year (GROWTH), and the inflation rate of a country for the previous year
(INFLATION). The results presented in Table 6 Panel C suggest that our results are robust to the
inclusion of these additional risk characteristics.
4.5 Further analysis on causality
In this section, we provide further evidence on the causal nature of the relation between
competition and pricing of information asymmetry. One concern with any regulatory change
such as liberalization reforms is that these reforms might not be completely unanticipated.
22
Although, the continuous measure of competition that we have employed thus far mitigates this
issue significantly, we undertake additional tests to examine the exogeneity of increases to
competition following liberalization. One approach to testing whether the increases in
competition were unanticipated is to focus on economically large changes in competition and
examine whether the effect of high competition exists in periods prior to the increase.11 If the
increase in competition is unanticipated then the effect on the pricing of information asymmetry
should occur only after the increase, and not before. Accordingly, we first modify Equation (2)
and use the following baseline specification:
, , 0 , , , , , ∗ 0 ,
∑ , , , , , (3)
where the variable COMPETITION(0+) is an indicator variable that equals 1 after the
continuous measure of equity market competition in a country j increases above median and zero
otherwise. The focus on below to above median change in competition ensures that we identify
economically large changes in competition. Since increases in competition occur in different
countries in different periods, the control group comprises of countries that do not experience an
above-median increase in competition in year t. For this test, we only focus on countries that
have experienced below to above median change in competition during our sample period.
Next, in order to examine the possibility that firms optimally anticipate increases in
competition, we replace COMPETITION(0+) indicator in Equation (3) with the following three
indicator variables: COMPETITION(-2 to 0), COMPETITION(0 to 2) and COMPETITION(2+),
where COMPETITION(-2 to 0) is an indicator variable that equals 1 during the two-year period
prior to the date when the continuous measure of equity market competition in a country
11 Prior literature has adopted a similar approach to examine whether changes to regulatory reforms were anticipated. For example, Fresard (2010) adopts this method to examine the effect of tariff changes on corporate financial behavior.

23
increases above median competition, COMPETITION(0 to 2) is an indicator variable that equals
1 during the year when the continuous measure of equity market competition in a country
increases above median competition and remains 1 for two years afterwards and
COMPETITION(2+) is an indicator variable that equals 1 two years after the date when the
continuous measure of equity market competition in a country increases above median
competition. 12 If the increases in competition are mostly unanticipated, we should find
significant coefficients only after the increase in competition i.e. for COMPETITION(0 to 2) and
COMPETITION(2+), and, more importantly, not for COMPETITION(-2 to 0).
Table 7 Panel A presents the estimates of the difference-in-difference regressions. The
negative and significant coefficient on COMPETITION(0+) in Columns (1) and (2) confirm the
evidence from prior analyses that increases in competition leads to a reduction in the pricing of
information asymmetry. More importantly, the results in Columns (3) and (4) reveal that the
coefficient on COMPETITION(-2 to 0) is insignificant and, suggest that the effect of the increase
in competition is largely unanticipated. The coefficients on COMPETITION(0 to 2) and
COMPETITION(2+) is negative and significant as expected.
5. Conclusion
This paper employs equity market liberalization in 31 countries as a pseudo-natural
experiment to examine whether the level of competition amongst traders in an economy for
firms’ shares affects the relation between information asymmetry and cost of capital. When
markets are characterized by perfect competition, information asymmetry has no separate effect
12 The choice of employing a two-year window is to account for the time lag between an increase in competition and the period when the effect is observed in the pricing of information asymmetry. We acknowledge that the two-year window width is arbitrary. In sensitivity analyses, we find that our inferences are robust to alternative choices of time windows.
24
on cost of capital. When markets are less than perfectly competitive, however, information
asymmetry affects cost of capital.
To examine the effect of competition on the pricing of information asymmetry, we examine
future returns of firms sorted based on the extent to which equity markets are open, as a proxy
for the level of competition in their shares, and also sorted on a proxy for information
asymmetry. We use bid-ask spread and analyst coverage as two alternative measures of
information asymmetry. Using a sample of 31 countries between 1996 and 2006, we find that
when the level of investibility in an economy increases, the difference in returns for firms with
high information asymmetry over firms with low information asymmetry declines. Moreover, we
find that the decline in the pricing of information asymmetry with an increase in competition is
concentrated amongst countries that are opaque. This suggests that the decline in pricing is due
to the addition of uninformed investors.

25
References
Admati, A., 1985. A noisy rational expectations equilibrium for multiple asset securities markets. Econometrica 53, 629-657.
Akins, B., Ng, J., Verdi, R., 2012. Investor competition over information and the pricing of information asymmetry. Accounting Review 87, 35-58.
Alexander, G., Eun, C., Janakiramanan, S., 1987. Asset Pricing and Dual Listing on Foreign Capital Markets: A Note. Journal of Finance 42, 151-158.
Armstrong, C.S., Core, J.E., Taylor, D.J., Verrecchia, R.E., 2011. When does information asymmetry affect the cost of capital? Journal of Accounting Research 49, 1–40.
Asness, C.S., Frazzini, A., 2011. The devil in HML’s details. AQR Capital Management working paper.
Bae, K., Stulz, R., Tan, H., 2008. Do local analysts know more? A cross-country study of the performance of local analysts and foreign analysts. Journal of Financial Economics 88, 581-606.
Bekaert, G., Harvey, C.R., 1995. Time varying world market integration. Journal of Finance 50, 403‐444.
Bekaert, G., Harvey, C.R., 2000. Foreign speculators and emerging equity markets. Journal of Finance 55, 565-613.
Bekaert, G., Harvey, C.R., Lundblad, 2005. Does financial liberalization spur growth? Journal of Financial Economics 77, 3-55.
Bekaert, G., Harvey, C.R., Lundblad, C., Siegel, S., 2007. Global growth opportunities and market integration. Journal of Finance 62, 1081-1137.
Bloomfield, R., Fischer, P., 2011. Disagreement and the cost of capital. Journal of Accounting Research 49, 41-68.
Botosan, C., 1997. Disclosure level and the cost of equity capital. The Accounting Review 72 (3): 323-349.
Chalmers, J.M., Kadlec, G.B., 1998. An empirical examination of the amortized spread. Journal of Financial Economics 48, 159-188.
Core, J., W. Guay, and R. Verdi. 2008. Is accruals quality a priced risk factor? Journal of Accounting and Economics 46 (1): 2-22.
Datar, V., Naik, N., Radcliffe, R., 1998. Liquidity and stock returns: An alternative test. Journal of Financial Markets 1, 203-219.
Diamond, D.W., Verrecchia, R.E., 1981. Information aggregation in a noisy rational expectations economy. Journal of Financial Economics 9, 221-135.
Diamond, D.W., Verrecchia, R.E., 1991. Disclosure, liquidity, and the cost of capital. Journal of Finance 46, 1325-1359.
Duarte, J., and L. Young. 2009. Why is PIN priced? Journal of Financial Economics 91 (2): 119-
138.

26
Easley, D., S. Hvidkjaer, and M. O'Hara. 2002. Is information risk a determinant of asset returns? Journal of Finance 57, 2185-2221.
Edison, H.J., Warnock, F.E., 2003. A simple measure of the intensity of capital controls. Journal of Empirical Finance 10, 81-103.
Errunza, V., Losq, E., 1985. International asset pricing under mild segmentation: theory and test. Journal of Finance 40, 105-124.
Eun, C., Janakiramanan, S., 1986. A Model of International Asset Pricing with a Constraint on the Foreign Equity Ownership. Journal of Finance 41, 897-914.
Fama, E., 1976. Foundations of Finance. New York, NY: Basic Books.
Fama, E., French, K., 1992. The cross section of expected stock returns. Journal of Finance 47, 427-465.
Fisman, R., Love, I., 2004. Financial development and growth in the short- and the long-run. Working Paper, Columbia University.
Francis, J., R. LaFond, P. Olsson, and K. Schipper. 2004. Costs of equity and earnings attributes. The Accounting Review 79 (4): 967–1010.
Francis, J., R. LaFond, P. Olsson, and K. Schipper. 2005. The market pricing of accruals quality.
Journal of Accounting and Economics 39 (2): 295-327.
Fresard, L., 2010. Financial Strength and Product Market Behavior: The Real Effects of Corporate Cash Holdings. Journal of Finance 65, 1097-1122.
Glosten, L., and P. Milgrom. 1985. Bid, ask, and transaction prices in a specialist market with hetergeneously informed traders. Journal of Financial Economics 14, 71-100.
Goyenko, Y., Holden, C., and Trzcinka, C., 2009. Do liquidity measures measure liquidity, Journal of Financial Economics 92, 153–181.
Grossman, S.J., Stiglitz, J., 1980. On the impossibility of informationally efficient markets. American Economic Review 70, 393-408.
Hellwig, M.F., 1980. On the aggregation of information competitive markets. Journal of Economic Theory 22, 477-498.
Henry, P.B., 2000a. Stock market liberalization, economic reform, and emerging market equity prices. Journal of Finance 55, 529-564.
Henry, P.B., 2000b. Do stock market liberalizations cause investment booms? Journal of Financial Economics 58, 301-334.
Kurtzman, J., Yago, G., Phumiwasana, T., 2004. The global costs of opacity. MIT Sloan Management Review 46, 38-44.
Kyle, A., 1989. Informed speculation with imperfect competition. Review of Economic Studies 56, 317-355.
Lambert, R., Leuz, C., Verrecchia, R.E., 2007. Accounting information, disclosure, and the cost of capital. Journal of Accounting Research 45, 385-420.

27
Lambert, R., Leuz, C., Verrecchia, R.E., 2012. Information asymmetry, information precision, and the cost of capital. Review of Finance 16, 1-29.
Lesmond, D., Ogden, J., and Trzcinka, C., 1999. A new estimate of transaction costs, Review of Financial Studies 12, 1113–1141.
Linter, J., 1969. The aggregation of investor’s diverse judgments and preferences in purely competitive security markets. Journal of Financial and Quantitative Analysis 4, 347-400.
Mashruwala, C., and S. Mashruwala. 2011. The pricing of accruals quality: January vs. the rest of the year. The Accounting Review 86, 1349-1381..
McInnis, J. 2010. Earnings smoothness, average returns, and implied cost of equity capital. The Accounting Review 85 (1): 315-341.
Merton, R.C., 1989. On the application of continuous-time theory of finance to financial intermediation and insurance. The Geneva Papers on Risk and Insurance 14, 225-262.
Mohanram, P., and S. Rajgopal. 2009. Is information risk (PIN) priced? Journal of Accounting
and Economics 47 (3): 226-243.
O’Hara, M., 2003. Liquidity and price discovery. Journal of Finance 58, 1335-1354.
Stapleton, R.C., Subrahmanyam, M.G., 1977. Market imperfections, capital market equilibrium, and corporation finance. Journal of Finance 32, 307-319.
Stulz, R., 1999a. International portfolio flows and securities markets, in Martin Feldstein, ed.: Internal Capital Flows (University Chicago Press, Chicago, IL).
Stulz, R., 1999b. Globalization, corporate finance, and the cost of capital. Journal of Applied Corporate Finance 12, 8-25.
Stulz, R., 2005. The limits of financial globalization. Journal of Finance 60, 1595-1638.

28
Figure 1: Impact of Competition on the Pricing of Information Asymmetry
Figure 2: Impact of Increasing the Number of Investors on Cost of Capital
Low Information
Asymmetry High Information
Asymmetry Perfect Competition Zero Zero
Imperfect Competition Low High
Risk Bearing Capacity
Adverse SelectionEffect
Net Effect
More informed Negative Positive Ambiguous Less informed Negative Negative Negative

29
Figure 3: Liberalization and the Investibility Measure
Official Liberalization

30
Table 1: Descriptive Statistics on the Aggregate Equity Market Competition Measure
Panel A: Measure of Equity Market Competition by Year
year mean 25th
Percentile Median
75th Percentile
Std. Dev.
1996 0.61 0.33 0.73 0.93 0.33 1997 0.69 0.37 0.80 0.94 0.29 1998 0.75 0.49 0.87 0.99 0.28 1999 0.76 0.53 0.90 0.99 0.29 2000 0.80 0.55 0.93 0.99 0.24 2001 0.75 0.52 0.88 0.97 0.28 2002 0.64 0.41 0.85 0.97 0.39 2003 0.64 0.43 0.81 0.95 0.38 2004 0.65 0.51 0.80 0.97 0.38 2005 0.68 0.57 0.91 0.98 0.39 2006 0.71 0.55 0.95 0.99 0.40

31
Table 1 (contd.)
Panel B: Measure of Equity Market Competition by Country for the Sample Period
Country 25th
PercentileMedian
75th Percentile
Mean Std. Dev
Argentina 0.88 0.90 0.90 0.88 0.05 Brazil 0.76 0.83 0.85 0.80 0.08 Chile 0.84 0.86 0.89 0.87 0.04 China 0.24 1.16 1.35 0.95 0.50 Colombia 0.00 0.40 0.61 0.32 0.29 Czech Republic 0.45 0.75 0.83 0.68 0.18 Egypt 0.60 0.70 0.77 0.63 0.23 Greece 0.83 0.92 1.00 0.91 0.09 Hungary 0.65 0.66 0.69 0.66 0.03 Indonesia 0.79 0.81 0.85 0.77 0.12 India 0.27 0.32 0.66 0.43 0.21 Israel 0.99 1.00 1.00 0.99 0.01 Jordan 0.00 0.20 0.26 0.16 0.16 Korea, Republic of 0.87 0.90 0.91 0.77 0.26 Sri Lanka 0.00 0.24 0.28 0.15 0.14 Morocco 0.79 0.87 0.92 0.84 0.08 Mexico 0.67 0.68 0.70 0.68 0.02 Malaysia 0.88 0.91 0.94 0.82 0.28 Pakistan 0.00 0.62 0.70 0.37 0.34 Peru 0.95 1.04 1.09 1.01 0.08 Philippines 0.50 0.55 0.68 0.58 0.09 Poland 0.98 0.99 1.00 0.98 0.01 Portugal 0.82 1.00 1.00 0.93 0.12 Russian Federation 0.61 0.65 0.70 0.68 0.11 Slovakia 0.00 0.00 0.81 0.42 0.42 Thailand 0.48 0.55 0.63 0.54 0.10 Turkey 0.96 0.99 1.00 0.98 0.02 Taiwan, Province of China 0.40 0.54 0.57 0.54 0.20 Venezuela, Bolivarian Republic of 0.00 0.49 0.68 0.34 0.32 South Africa 1.01 1.01 1.01 1.01 0.01 Zimbabwe 0.00 0.23 0.29 0.16 0.15

32
Table 2: Descriptive Statistics This table presents descriptive statistics for the measures of information asymmetry and control variables. The sample comprises a maximum of 663,352firm-year-month observations representing 31 emerging market countries over the period 1996 to 2006. BIDASK is the monthly average of the daily bid-ask spread in equity prices. NUMANALYSTS is the number of analysts following a firm. SIZE is the firm’s market capitalization. BTOM is the book value of assets scaled by the market value of assets. BETA is the coefficient on monthly country returns in a regression of monthly firm excess stock returns on monthly country returns. BETA at time t is computed by estimating the regression over a five year period before time t; we require at 5 least observations for estimating the regression. LAG_RET is the firm-specific monthly stock return. 25th Percentile Median 75th Percentile Mean Std. Dev BIDASK 0.02 0.03 0.05 0.04 0.03 NUMANALYSTS 0.00 0.00 1.00 1.83 4.04 SIZE ($ MN) 16 60 236 4,748 30,009 BTOM 0.38 0.83 1.72 3.60 14.44 BETA 0.59 0.95 1.34 0.99 0.63 LAG_RET -0.08 0.00 0.08 0.02 0.31

33
Table 3: Aggregate equity market competition and pricing of information asymmetry This table presents evidence on the effect of aggregate equity market competition on the pricing of information asymmetry. The sample comprises 31 emerging market countries for the period 1996 to 2006. The dependent variable (RET) is the firm level monthly excess stock return. COMPETITION represents quintile ranks of the smoothed measure of the intensity of restrictions on foreign ownership in a country’s stock market as defined in Edison and Warnock (2003). Greater values of COMPETITION indicate fewer restrictions on foreign ownership. IA represents scaled ranks (between 0 and 1) of various measures of information asymmetry defined such that greater values indicate greater information asymmetry. In Columns (1)-(3), IA represents scaled quintile ranks of the monthly average of daily bid-ask spreads in equity prices (BIDASK). In Columns (4)-(6), IA represents scaled quartile ranks of the negative of the number of analysts following a firm (NUMANALYSTS). In Columns (7)-(9), IA is measured as the average of the scaled ranks of BIDASK and the negative of NUMANALYSTS (COMPOSITE_IA). Our measure of information asymmetry derived from analyst following is based on quartile ranks (and not quintile ranks) because a large number of firms have no analyst following. All control variables have been defined in the caption of Table 2. All control variables, except that measure returns, represent scaled quintile ranks between 0 and 1. Quintile ranks for the information asymmetry measures and control variables are computed within each quintile of COMPETITION every month. All covariates are measured at the beginning of the month prior to the month for which the dependent variable RET is computed. All specifications include industry and monthly time dummies. Standard Errors have been obtained by clustering at the country level. Statistical significance (two-sided) at the 10%, 5% and 1% level is denoted by *, **, and ***, respectively. NUMANALYSTS BIDASK COMPOSITE_IA (1) (2) (3) (4) (5) (6) (7) (8) (9) RET RET RET RET RET RET RET RET RET COMPETITION 0.00272 0.00232 0.00234 0.00220 0.00197 0.00213 0.00413*** 0.00326*** 0.00339*** (1.439) (1.268) (1.275) (1.018) (1.123) (1.212) (2.983) (3.036) (3.161) IA 0.0157*** 0.00882** 0.00897** 0.00851 0.00774 0.00923 0.0209*** 0.0114** 0.0127** (3.750) (2.298) (2.329) (1.200) (1.221) (1.488) (3.226) (2.114) (2.345) IA*COMPETITION -0.00556* -0.00481* -0.00485* -0.00626** -0.00576** -0.00609** -0.00902*** -0.00738*** -0.00765*** (-2.013) (-1.935) (-1.937) (-2.353) (-2.149) (-2.289) (-4.189) (-4.399) (-4.507) LOGSIZE -0.0141*** -0.0137*** -0.0137*** -0.0131*** -0.0143*** -0.0135*** (-3.767) (-3.624) (-3.563) (-3.448) (-3.655) (-3.510) BTOM 0.00709** 0.00669** 0.0106*** 0.0103*** 0.0104*** 0.0100*** (2.591) (2.435) (5.469) (5.061) (5.213) (4.787) BETA -0.00645** -0.00632** -0.00659** -0.00667** -0.00712** -0.00707** (-2.228) (-2.157) (-2.214) (-2.243) (-2.368) (-2.343) LAG_RET -0.00893** -0.00985** -0.0101** (-2.308) (-2.279) (-2.329) CONSTANT 0.0323** 0.0458** 0.0458** 0.0254*** 0.0302*** 0.0293*** 0.0176** 0.0287*** 0.0277*** (2.258) (2.735) (2.696) (3.146) (2.961) (2.911) (2.509) (3.074) (3.012)
Observations 663,352
608,202
603,138 583,200 538,475 534,669
583,200
538,475
534,669
R-squared 5.9% 6.1% 6.1% 6.3% 6.6% 6.6% 6.3% 6.6% 6.6%
34
Table 4: Role of Liquidity This table presents regression estimates that examine the robustness of the findings regarding pricing of information asymmetry to inclusion of control for liquidity (LIQUIDITY). LIQUIDITY represents scaled quintile ranks of the percentage of days with positive trading volume in a month in which a firm experiences zero stock return . The dependent variable (RET) is the firm level monthly excess stock return. COMPETITION represents quintile ranks of the smoothed measure of the intensity of restrictions on foreign ownership in a country’s stock market as defined in Edison and Warnock (2003). Greater values of COMPETITION indicate fewer restrictions on foreign ownership. IA represents scaled ranks (between 0 and 1) of various measures of information asymmetry defined such that greater values indicate greater information asymmetry. In Column (1), IA represents scaled quintile ranks of the monthly average of daily bid-ask spreads in equity prices (BIDASK). In Column (2), IA represents scaled quartile ranks of the negative of the number of analysts following a firm (NUMANALYSTS). In Column (3), IA is measured as the average of the scaled ranks of BIDASK and the negative of NUMANALYSTS (COMPOSITE_IA). Our measure of information asymmetry derived from analyst following is based on quartile ranks (and not quintile ranks) because a large number of firms have no analyst following. All control variables have been defined in the caption of Table 2. All control variables, except that measure returns, represent scaled quintile ranks between 0 and 1. Quintile ranks for the information asymmetry measures and control variables are computed within each quintile of COMPETITION every month. All covariates are measured at the beginning of the month prior to the month for which the dependent variable RET is computed. All specifications include industry and monthly time dummies. Standard Errors have been obtained by clustering at the country level. Statistical significance (two-sided) at the 10%, 5% and 1% level is denoted by *, **, and ***, respectively. BIDASK NUMANALYSTS COMPOSITE_IA (1) (2) (3) RET RET RET COMPETITION 0.00115 -0.000607 0.00210 (0.538) (-0.325) (1.063) IA 0.00830 0.00754** 0.0122** (1.308) (2.281) (2.236) IA*COMPETITION -0.00565** -0.00325* -0.00729*** (-2.102) (-1.754) (-3.766) LOGSIZE -0.0130*** -0.0109*** -0.0134*** (-3.242) (-2.794) (-3.266) BTOM 0.0103*** 0.0103*** 0.0101*** (4.976) (4.836) (4.690) BETA -0.00658** -0.00653** -0.00695** (-2.159) (-2.203) (-2.283) LAG_RET -0.00987** -0.00888** -0.0101** (-2.283) (-2.186) (-2.339) LIQUIDITY*COMPETITION 0.00158 0.00263 0.00227 (0.814) (1.294) (1.010) LIQUIDITY -0.00333 -0.00431 -0.00457 (-0.685) (-0.940) (-0.892) CONSTANT 0.0312** 0.0464** 0.0299*** (2.746) (2.743) (2.839)
Observations
534,669
579,105
534,669 R-squared 6.6% 6.4% 6.6%

35
Table 5: Role of Country-level Opacity This table presents evidence on the role of country level opacity (OPACITY) on the effect of aggregate equity market competition on the pricing of information asymmetry. OPACITY represents scaled quintile ranks of the country level opacity index constructed by Kurtzman, Yago and Phumiwasana (2004), following the methodology of PricewaterhouseCoopers (2001) Opacity Index. The dependent variable (RET) is the firm level monthly excess stock return. COMPETITION represents quintile ranks of the smoothed measure of the intensity of restrictions on foreign ownership in a country’s stock market as defined in Edison and Warnock (2003). Greater values of COMPETITION indicate fewer restrictions on foreign ownership. Information asymmetry (IA) is measured as the average of the scaled quintile ranks of bid-ask spreads and the scaled quartile ranks of the negative of analyst following scaled between 0 and 1. All control variables have been defined in the caption of Table 2. All control variables, except that measure returns, represent scaled quintile ranks between 0 and 1. Quintile ranks for the information asymmetry measures and control variables are computed within each quintile of COMPETITION every month. All covariates are measured at the beginning of the month prior to the month for which the dependent variable RET is computed. All specifications include industry and monthly time dummies. Standard Errors have been obtained by clustering at the country level. Statistical significance (two-sided) at the 10%, 5% and 1% level is denoted by *, **, and ***, respectively. (1) (2) (3) RET RET RET COMPETITION 0.00308** 0.00247** 0.00260** (2.215) (2.125) (2.210) IA 0.00274 -0.00335 -0.00212 (0.273) (-0.394) (-0.247) IA*COMPETITION -0.00134 -0.00217 -0.00234 (-0.395) (-0.702) (-0.756) IA*COMPETITION*OPACITY -0.00335*** -0.00242** -0.00246*** (-4.344) (-2.810) (-2.886) IA*OPACITY 0.00796*** 0.00703*** 0.00707*** (4.155) (3.283) (3.284) COMPETITION*OPACITY 0.000413 0.000368 0.000365 (0.899) (0.876) (0.857) LOGSIZE -0.0130*** -0.0122*** (-3.251) (-3.079) BTOM 0.0105*** 0.0102*** (5.088) (4.716) BETA -0.00728** -0.00722** (-2.516) (-2.484) LAG_RET -0.0105** (-2.419) CONSTANT 0.0172** 0.0274*** 0.0264*** (2.517) (2.959) (2.889)
Observations
580,751
536,394
532,608 R-squared 6.4% 6.6% 6.7%
36
Table 6: Robustness Checks
Panel A: Independent Sort This Panel presents regression estimates that examine the robustness of the previous findings to use of independent sorts for information asymmetry and control variables. The dependent variable (RET) is the firm level monthly excess stock return. COMPETITION represents quintile ranks of the smoothed measure of the intensity of restrictions on foreign ownership in a country’s stock market as defined in Edison and Warnock (2003). Greater values of COMPETITION indicate fewer restrictions on foreign ownership. Information asymmetry (IA) is measured as the average of the scaled quintile ranks of bid-ask spreads and the scaled quartile ranks of the negative of analyst following scaled between 0 and 1. All control variables have been defined in the caption of Table 2. All control variables, except that measure returns, represent scaled quintile ranks between 0 and 1. Quintile ranks for the information asymmetry measure and control variables are computed every month independent of the ranks for COMPETITION. All covariates are measured at the beginning of the month prior to the month for which the dependent variable RET is computed. All specifications include industry and monthly time dummies. Standard Errors have been obtained by clustering at the country level. Statistical significance (two-sided) at the 10%, 5% and 1% level is denoted by *, **, and ***, respectively. (1) (2) (3) RET RET RET COMPETITION 0.00387*** 0.00374*** 0.00384*** (3.188) (3.950) (4.068) IA 0.0222*** 0.0109** 0.0121** (3.829) (2.243) (2.494) IA*COMPETITION -0.00860*** -0.00658*** -0.00683*** (-3.802) (-4.093) (-4.172) LOGSIZE -0.0167*** -0.0160*** (-4.108) (-3.998) BTOM 0.0146*** 0.0143*** (4.899) (4.650) BETA -0.00890** -0.00890** (-2.711) (-2.715) LAG_RET -0.00974** (-2.249) CONSTANT 0.0164** 0.0268** 0.0258** (2.149) (2.609) (2.532)
Observations
583,200
538,475
534,669 R-squared 6.3% 6.6% 6.7%

37
Panel B: Estimation with country fixed effects This Panel presents regression estimates that examine the robustness of the previous findings to inclusion of country fixed effects in our empirical specifications. The dependent variable (RET) is the firm level monthly excess stock return. COMPETITION represents quintile ranks of the smoothed measure of the intensity of restrictions on foreign ownership in a country’s stock market as defined in Edison and Warnock (2003). Greater values of COMPETITION indicate fewer restrictions on foreign ownership. Information asymmetry (IA) is measured as the average of the scaled quintile ranks of bid-ask spreads and the scaled quartile ranks of the negative of analyst following scaled between 0 and 1. All control variables have been defined in the caption of Table 2. All control variables, except that measure returns, represent scaled quintile ranks between 0 and 1. Quintile ranks for the information asymmetry measure and control variables are computed every month independent of the ranks for COMPETITION. All covariates are measured at the beginning of the month prior to the month for which the dependent variable RET is computed. All specifications include country, industry and monthly time dummies. Standard Errors have been obtained by clustering at the country level, except for the specification in column (3) for which clustering at country level in the presence of country fixed effects is rendered infeasible in the statistical analysis software stata. We therefore compute standard errors without clustering in column (3). Statistical significance (two-sided) at the 10%, 5% and 1% level is denoted by *, **, and ***, respectively. (1) (2) (3) RET RET RET COMPETITION 0.00596*** 0.00535*** 0.00548*** (3.501) (3.205) (9.545) IA 0.0157*** 0.00604 0.00730*** (2.890) (1.271) (3.601) IA*COMPETITION -0.00630*** -0.00551*** -0.00573*** (-2.877) (-3.138) (-7.313) LOGSIZE -0.0158*** -0.0151*** (-4.218) (-13.29) BTOM 0.0112*** 0.0107*** (6.350) (10.85) BETA -0.00294 -0.00289*** (-1.470) (-3.118) LAG_RET -0.0113*** (-8.404) CONSTANT 0.0436*** 0.0551*** 0.466 (6.871) (6.883) (0.000158)
Observations
583,200
538,475
534,669 R-squared 6.5% 6.7% 6.8%

38
Panel C: Estimation with macroeconomic control variables This table presents regression estimates that examine the robustness of the findings in Table 1 to inclusion of macroeconomic control variables. The dependent variable (RET) is the firm level monthly excess stock return, COMPETITION is the measure of the aggregate competition in equity markets, and IA is the measure of information asymmetry. The macroeconomic control variables are: (i) the rolling three-year standard deviation of the exchange rate scaled by mean exchange rate (FXVOLATILITY), (ii) asset concentration measured as the number of publicly traded stocks each month in a country that appear in COMPUSTAT Global (NUMSTOCKS), (iii) the cross-sectional standard deviation of the monthly stock returns at each month in a country (XSECSTDEV), (iv) the equity market capitalization of a country scaled by its GDP for the previous year (MKTTOGDP), (v) the GDP growth rate of a country for the previous year (GROWTH), and (vi) the inflation rate of a country for the previous year (INFLATION). All macroeconomic variables represent scaled quintile ranks between 0 and 1. Rests of the variables are as defined in Table 1. All specifications include industry and monthly time dummies. Standard Errors have been obtained by clustering at the country level. To conserve space, t-statistics for the control variables have been omitted. Statistical significance (two-sided) at the 10%, 5% and 1% level is denoted by *, **, and ***, respectively. (1) (2) (3) (4) (5) (6) (7) RET RET RET RET RET RET RET COMPETITION 0.000782 0.00163 0.000392 -0.000211 0.00674*** 0.00614** 0.00757 (0.281) (0.851) (0.190) (-0.0985) (3.331) (2.244) (1.228) IA 0.0105 0.0143** 0.0110* 0.00980* 0.00748 0.00971* 0.00643 (1.612) (2.618) (1.727) (1.743) (1.387) (1.925) (0.900) IA*COMPETITION -0.00598** -0.00790*** -0.00613*** -0.00734*** -0.00463** -0.00695*** -0.00506* (-2.346) (-4.242) (-2.956) (-3.753) (-2.326) (-3.527) (-2.005)
FXVOLATILITY 0.00259 0.00430
NUMSTOCKS -0.00471* -0.00157
XSECSTDEV 0.000564 0.000492
MKTTOGDP -0.00956*** -0.00721*
GROWTH 0.00309 0.00524
INFLATION 0.00611* 0.00145
FXVOLATILITY*COMPETITION 0.000757 0.0000
NUMSTOCKS*COMPETITION 0.000993 0.00116
XSECSTDEV*COMPETITION 0.00137 0.000791
MKTTOGDP*COMPETITION 0.00200** 0.000500
GROWTH*COMPETITION -0.00240** -0.00290*
INFLATION*COMPETITION -0.00172 -0.00187
CONSTANT 0.0216** 0.0348*** 0.0244** 0.0491*** 0.0249** 0.0203 0.0219 Firm Specific controls YES YES YES YES YES YES YES Observations 526,939 534,669 534,669 472,614 472,614 472,353 464,830 R-squared 6.7% 6.7% 6.7% 6.7% 6.7% 6.7% 6.9%

39
Table 7: Timing of the effect of changes in equity market competition This table presents evidence on the timing of the effect of changes in equity market competition on the pricing of information asymmetry. The dependent variable (RET) is the firm level monthly excess stock return. COMPETITION(0+) is an indicator variable that equals 1 after the continuous measure of equity market competition in a country increases above median competition. COMPETITION(-2 to 0) is an indicator variable that equals 1 during the 2 year period prior to the date when the continuous measure of equity market competition in a country increases above median competition. Other dummy variables for competition have been analogously defined. Information asymmetry (IA) is measured as the average of the scaled quintile ranks of bid-ask spreads and the scaled quartile ranks of the negative of analyst following scaled between 0 and 1. All control variables have been defined in the caption of Table 2. All control variables, except that measure returns, represent scaled quintile ranks between 0 and 1. Quintile ranks for the information asymmetry measures and control variables are computed within each quintile of COMPETITION every month. All covariates are measured at the beginning of the month prior to the month for which the dependent variable RET is computed. All specifications include industry and monthly time dummies. Standard Errors have been obtained by clustering at the country level. Statistical significance (two-sided) at the 10%, 5% and 1% level is denoted by *, **, and ***, respectively. (1) (2) (3) (4) RET RET RET RET COMPETITION(0+) 0.0108 0.0119 (1.531) (1.780) IA 0.0171** 0.0121** 0.0254* 0.0166 (2.649) (2.304) (1.857) (1.291) IA*COMPETITION(0+) -0.0239** -0.0207* (-2.849) (-2.137) COMPETITION(-2 to 0) 0.0136* 0.00984 (1.823) (0.992) COMPETITION(0 to 2) 0.0158* 0.0140* (1.994) (2.118) COMPETITION(2+) 0.0159 0.00869 (1.539) (0.576) IA*COMPETITION(-2 to 0) -0.0203 -0.0140 (-0.930) (-0.680) IA*COMPETITION(0 to 2) -0.0253** -0.0212** (-2.492) (-2.322) IA*COMPETITION(2+) -0.0360** -0.0279** (-2.845) (-3.033) CONSTANT 0.0134 0.0478** (1.044) (2.359) Controls YES YES YES YES Country Fixed Effects NO YES NO YES Observations 309,401 309,401 309,401 309,401 R-squared 11.6% 11.7% 11.6% 11.8%
Related Documents