Welcome message from author
This document is posted to help you gain knowledge. Please leave a comment to let me know what you think about it! Share it to your friends and learn new things together.
Transcript
Agglomeration in Fluidized Beds:
Detection and Counteraction
Malte Bartels
Agglomeration in Fluidized Beds:
Detection and Counteraction
Proefschrift
ter verkrijging van de graad van doctor
aan de Technische Universiteit Delft,
op gezag van de Rector Magnificus prof. dr. ir. J.T. Fokkema
voorzitter van het College voor Promoties,
in het openbaar te verdedigen op
dinsdag 11 november 2008 om 10:00 uur
door
Malte BARTELS
Diplom-Ingenieur (FH), Fachhochschule Flensburg Master of Science, Cleveland State University
geboren te Flensburg, Duitsland
Dit proefschrift is goedgekeurd door de promotor: Prof. dr. F. Kapteijn Copromotor: Dr. ir. J.R. van Ommen Samenstelling promotiecommissie: Rector Magnificus, voorzitter Prof. dr. F. Kapteijn Technische Universiteit Delft, promotor Dr. ir. J.R. van Ommen Technische Universiteit Delft, copromotor Prof. dr. T. Pugsley University of Saskatchewan (Canada) Prof. dr. W. Lin The Chinese Academy of Sciences (China),
Technical University of Denmark (Denmark) Prof. ir. J. Grievink Technische Universiteit Delft Prof. dr. R.F. Mudde Technische Universiteit Delft Ir. J. Nijenhuis Technische Universiteit Delft John Nijenhuis en Ruud van Ommen hebben als begeleiders in belangrijke mate aan de totstandkoming van het proefschrift bijgedragen. Front cover: Agglomerate on three different scales (courtesy Energy Technology Group (3mE) TU Delft and ECN - Energy Research Centre of the Netherlands) Back cover: “Agglomerate” of the summary of this thesis (word size related to occurrence, slight adapted). Created with and thanks to Wordle (http://wordle.net/). Copyright © 2008 Malte Bartels Printed by Wöhrmann Print Service All rights reserved. No part of the material protected by this copyright notice may be reproduced or utilized in any form or by any means, electronic or mechanical, including photocopying, recording or by any information storage and retrieval system, without the written permission from the author. A digital version of this dissertation is available at: http://www.library.tudelft.nl/ ISBN: 978-90-8570-311-2

For it is by grace you have been saved, through faith - and this not from yourselves, it is the gift of God - not by works, so that no one can boast.
For we are God's workmanship, created in Christ Jesus to do good works,
which God prepared in advance for us to do.
Ephesians 2:8-10

vii
Summary Gas-solid fluidized beds are utilized for a variety of processes in the chemical industry, such as catalytic reactions, drying, coating, and energy conversion. The occurrence of unwanted agglomeration in fluidized bed processes can be a major problem in industrial practice. For energy conversion processes, typically combustion and gasification, the basic mechanism of agglomeration involves the simultaneous presence of alkali components from the fuel and silica from the bed material and the fuel. Together they can form alkali silicates having melting points below the typical operating temperatures of about 850°C. The presence of such a liquid phase results in increased particle stickiness and formation of agglomerates. If this effect is not counteracted it can eventually result in defluidization of the bed and subsequent shut-down of the installation. Therefore, an early warning system to reliably detect agglomeration is of high importance, enabling to take appropriate counteractions preventing further agglomeration and shut-down.
This work aims at identification and application of suitable methods for the early detection of and counteraction against agglomeration in fluidized beds. Agglomeration in energy conversion processes, specifically combustion and gasification of biomass, is the main focus. The monitoring method based on attractor comparison [1] has been developed in our group and successfully applied on the laboratory and industrial scale to bubbling fluidized beds for the purpose of agglomeration detection. The attractor comparison method compares high-frequency pressure measurements obtained during operation of the installation with reference data that was measured earlier, and expresses whether or not the behaviour has significantly changed.
In the present study, this method is investigated for its suitability to detect agglomeration and small changes in particle size in circulating fluidized beds (CFBs). This has been done by adapting the particle size in a lab-scale CFB during operation, by enforcing agglomeration during biomass gasification in a lab-scale CFB and by monitoring the occurring particle size changes in an industrial CFB during normal operation (chapter 3). Since more methods have been proposed in literature with more or less success, a screening methodology is developed that allows the efficient identification of methods that are sensitive for and selective to agglomeration (chapter 4). This methodology is applied to several case studies, using data from a pilot-scale bubbling fluidized bed (BFB) exhibiting agglomeration and other isolated process changes, from an industrial BFB biomass combustor during agglomeration and from a lab-scale CFB during agglomeration (chapter 5). The attractor comparison method is also investigated for its suitability to successfully prevent defluidization in combination with a suitable counteraction technique and the method is used to assess the benefit of different counteraction strategies. This has been done using a lab-scale and a pilot-scale BFB boiler during the combustion of biomass (chapter 6).
The attractor comparison method has shown to be sensitive to small, gradual changes in particle size in the order of 5%, based on a median size of 235 µm for a lab-scale circulating fluidized bed with an L-valve for the solids return. The method is also sensitive to the presence of model agglomerates (d50 = 1900 µm) in the order of 3 weight-%. The sensitivity of the method depends on the measurement location in the system and is clearly higher for the downcomer and horizontal return-leg than for the riser. This higher sensitivity is decreased when using a loop seal for the solids return and supports the hypothesis that the higher sensitivity for the downcomer with L-valve
viii
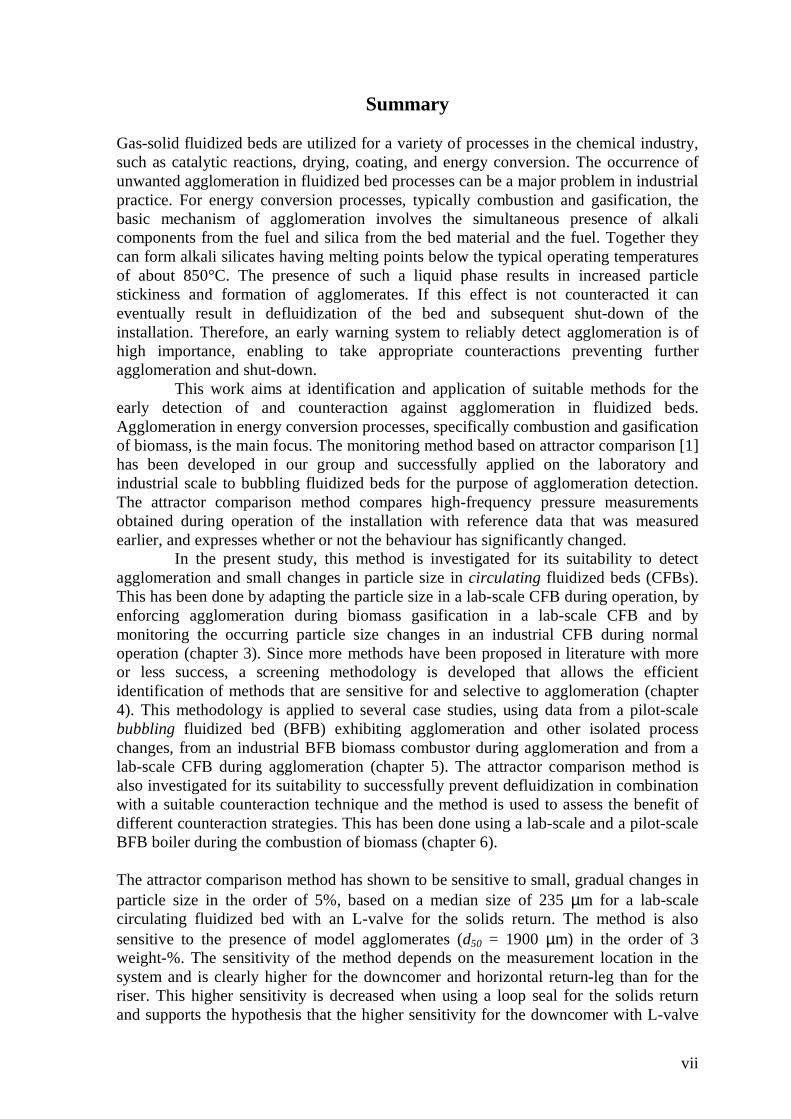
configuration mainly originates from a modification of the pressure fluctuations coming from the riser and propagating into the downcomer. Importantly, the method is not sensitive to other process variables (bed mass, riser velocity and solids reflux) within certain limits for the L-valve and loop seal configuration. On an industrial scale the attractor comparison method has shown to be sensitive to small, gradual changes in particle size in the order of 8%, based on a median size of 240 µm and measurements in the bottom bed of the riser. For an agglomeration incident during biomass gasification on lab-scale the method has shown to detect the impending defluidization with an early warning time of ~30 min, based on measurements in lower riser and horizontal return-leg (Figure S-1).
A new methodology is proposed that consists of screening many different signal analysis methods in combination with pre-treatment (filtering) methods with the goal to find those combinations that are sensitive and selective to a specific cause for a change in the hydrodynamics. More specifically, agglomeration in fluidized beds is taken as the relevant cause for the hydrodynamics change here. Pressure fluctuation measurements form the basis for the analysis. The methodology itself is not limited to this application, but is more generally applicable for other multiphase reactor systems. The suitability of a combination is assessed by a selectivity index. This selectivity index is visualized in a result matrix by coloured tiles (Figure S-2) in which the colour is related to the selectivity index, so that one can quickly identify suitable methods and pre-treatment methods.
-5
0
5
10
15
20
25
30
35
40
45
0:00 0:30 1:00 1:30time [hh:mm]
S-v
alue
[-]
1
10
100
∆p [
mba
r]
Return-leg
Riser
p [mbar]∆
Defluidization
Figure S-1: Successful agglomeration detection in a lab-scale CFB: The approaching defluidization is not anticipated using average pressure drop measurements, but it is correctly indicated by the S-value exceeding the critical value of 3 with an early warning time of about 30 minutes based on measurements from the lower riser and horizontal return-leg.

ix
The screening approach was successfully applied to different case studies in pilot- and industrial scale bubbling bed installations and in a lab-scale circulating bed. For a combined (averaged) case of three different bubbling bed agglomeration incidents several suitable methods were found, among which the Kolmogorov-Smirnov test with a 15 Hz low-pass filter, the Kuiper test, the standard deviation analysis with a 10 Hz high-pass filter, the attractor comparison method, entropy analysis and average cycle time. Apart from this approach to average results from different installations, the screening methodology can of course also be applied to a single process and identify suitable methods for that specific process. Based on the cases studied and previous investigations a simple descriptive model to describe the development of the pressure fluctuations during different agglomeration incidents is proposed. Ultimately, any agglomeration detection method should serve as the basis to actually prevent defluidization and shut-down. Here, it was investigated whether the attractor comparison method can provide a sufficiently early alarm to be able to take counteractions avoiding defluidization. Tests have been carried out on lab-scale (~1 kWth) and pilot-scale (~1 MWth).
In general, the observed agglomeration cases were not well reproducible, considering small variations in the process conditions to be unavoidable in practice. For the pilot-scale setup, rapid agglomeration can occur especially during transition regions (start-up, changes in load/temperature). In such cases a moving reference, i.e. the reference is moved together with the current evaluation window at a constant offset, for the attractor comparison is clearly advantageous. For both rapid and more gradual agglomeration incidents, attractor comparison was able to detect the approaching defluidization early enough to avoid defluidization. A decrease in temperature was successfully applied as a temporary measure to ensure continued operation and to avoid
Figure S-2: Result matrix with coloured tiles illustrating the selectivity indices for all possible combinations of data pre-treatment and signal analysis methods (only lower left corner of the full matrix is shown for illustration purposes here). The colour and intensity is related to the value of the selectivity index, increasing from black to red, yellow, and white.
x
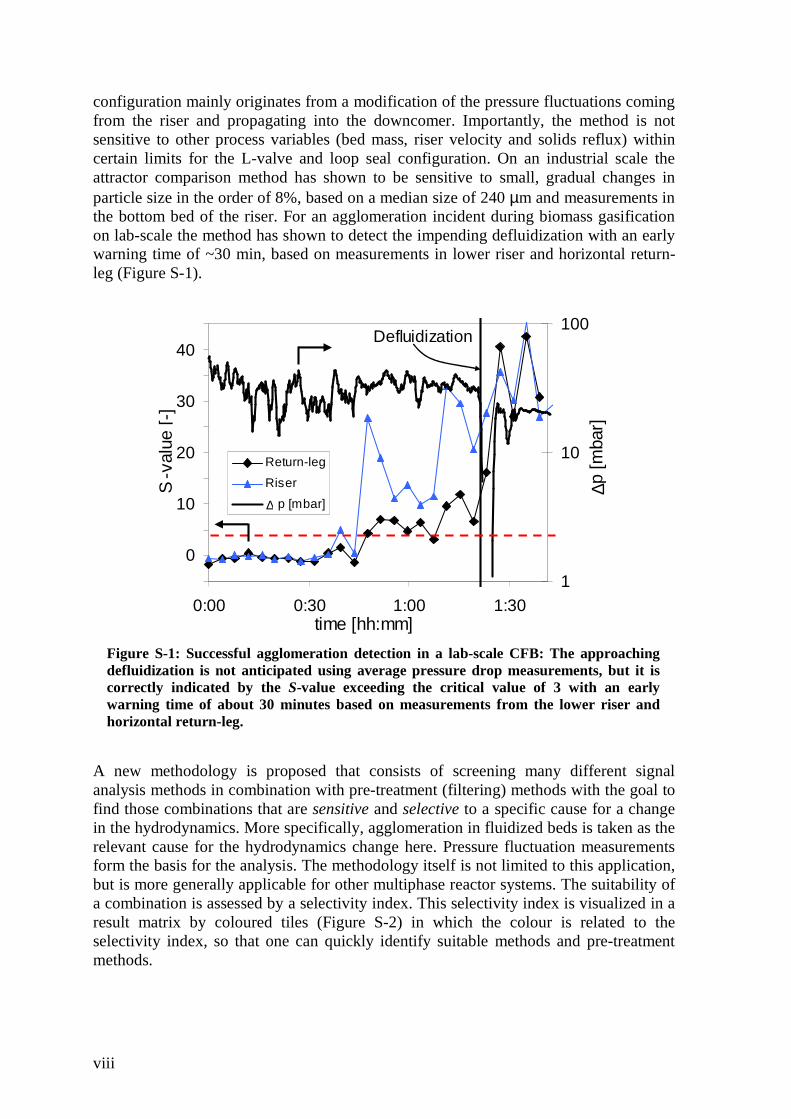
defluidization (Figure S-3). On lab-scale the partial replacement of used bed material with fresh bed material has also shown to work as a permanent solution to ensure continuous operation. Neither a temporary increase in gas velocity nor using an additive were successful in this case.
The research objectives for this work have been successfully accomplished. The results clearly show that the attractor comparison method is indeed suitable for the detection of agglomeration and small particle size changes in circulating fluidized beds. The presented screening methodology has revealed several specific methods that are potentially suitable as an early agglomeration warning tool and it can be readily applied to find suitable methods tailored to a specific application. The attractor comparison method also indicated agglomeration in an early enough stage to successfully avoid defluidization of the bed if combined with a suitable counteraction strategy.
The application of the attractor comparison method - and potentially other monitoring methods - is considered capable of increasing the reliability of operation and the efficiency of industrial solid fuel energy conversion processes. The presented successful application of the method in circulating fluidized beds is especially important in light of the wide-spread application of circulating beds in the energy sector. As a result, this technology can play a prominent role in the process of further promoting the acceptance of biomass as renewable energy source, particularly at the producers’ side. References [1] van Ommen JR, Coppens MO, van den Bleek CM, Schouten JC. Early Warning of
agglomeration in Fluidized Beds by Attractor Comparison. AIChE Journal 2000;46:2183-2197
600
650
700
750
800
850
900
09:15 09:45 10:15 10:45 11:15 11:45 12:15
Time [hh:mm]
Tem
pera
ture
[°C
]
-5
0
5
10
15
20
25
30
S-v
alue
[-]
Figure S-3: Successful agglomeration counteraction: after the S-value indicated agglomeration (S>3), a temperature decrease to below 750°C (typical first melting points of alkali silicates) was applied and resulted in stable operation at the lower temperature level. A moving reference with 30 min time difference between reference time window and evaluation time window was used, which is responsible for the second peak.
xi
Samenvatting Gas-gefluïdiseerde bedden worden voor veel verschillende processen toegepast, o.a. voor katalytische reacties, drogen, coaten en energieconversie. Het optreden van ongewenste agglomeratie in fluïde bedden is in de industriële praktijk soms een groot probleem. Bij de conversie van energie via verbranding of vergassing wordt agglomeratie veroorzaakt door de gelijktijdige aanwezigheid van alkali-componenten uit de brandstof en siliciumoxide (kwarts) uit het bedmateriaal en/of brandstof. Samen kunnen deze alkalisilicaten vormen, waarvan het smeltpunt lager ligt dan typische operatiecondities met temperaturen rond de 850°C. De aanwezigheid van een vloeibare fase resulteert in een verhoogde kleverigheid van de deeltjes en het ontstaan van agglomeraten. Gaat dit agglomeratieproces onopgemerkt door en wordt het niet tegengewerkt, dan kan dit leiden tot defluïdisatie van het bed en vervolgens een tijdelijke buitenbedrijfstelling van de installatie. Het is daarom noodzakelijk om een detectiesysteem te hebben dat agglomeratie vroegtijdig en op een betrouwbare manier kan detecteren, om vervolgens maatregelen te nemen om verdere agglomeratie en buitenbedrijfstelling te voorkomen.
Dit onderzoek richt zich op de identificatie en toepassing van geschikte methoden voor de vroegtijdige detectie en tegenwerking van agglomeratie in fluïde bedden. De nadruk ligt hierbij op agglomeratie tijdens energieconversie, specifiek de verbranding en vergassing van biomassa. De monitoringmethode gebaseerd op attractorvergelijking [1] is in onze groep ontwikkeld en is met succes toegepast voor de detectie van agglomeratie in bubbelende fluïde bedden op labschaal en industriële schaal. De methode vergelijkt hoogfrequente drukmetingen verkregen tijdens operatie met eerder gemeten referentiedata en geeft aan of de hydrodynamica van het bed significant veranderd is.
In dit werk wordt onderzocht of de methode geschikt is om agglomeratie en kleine verschillen in deeltjesgrootte in circulerende fluïde bedden (CFB) te detecteren. Dit is gedaan door middel van veranderingen in de deeltjesgrootte tijdens het opereren, geforceerde agglomeratie tijdens de vergassing van biomassa in een lab-schaal CFB en het monitoren van de deeltjesgrootte in een industriële CFB tijdens operatie (hoofdstuk 3). Aangezien er in de literatuur verschillende methoden met wisselend succes voorgesteld zijn, wordt hier een methodologie voorgesteld voor de efficiënte identificatie van methoden die gevoelig en selectief voor agglomeratie zijn (hoofdstuk 4). Deze methodologie is toegepast op meerdere casestudy’s (voorbeelden) met data van een pilot-schaal bubbelend fluïde bed (BFB) waarin agglomeratie en andere geïsoleerde procesveranderingen opgelegd zijn, data van een industriële BFB biomassa-verbrandingsinstallatie tijdens agglomeratie en data van een lab-schaal CFB tijdens agglomeratie (hoofdstuk 5). Verder is onderzocht of de attractorvergelijkingsmethode in combinatie met een geschikte tegenwerkingsstrategie geschikt is om defluïdisatie te voorkomen en de methode wordt gebruikt om het succes van verschillende tegenwerkingstrategieën te evalueren. Dit is gedaan in een lab-schaal CFB en in een pilot-schaal BFB tijdens de verbranding van biomassa (hoofdstuk 6).
De attractorvergelijkingsmethode blijkt gevoelig voor kleine, geleidelijke veranderingen in deeltjesgrootte, in de orde van grootte van 5% op basis van een gemiddelde deeltjesgrootte van 235 µm, gemeten in een lab-schaal circulerend fluïde bed met een “L-valve” voor de terugvoer van materiaal naar de riser. De methode is ook gevoelig voor de aanwezigheid van modelagglomeraten (d50 = 1900 µm) in de orde van grootte
xii
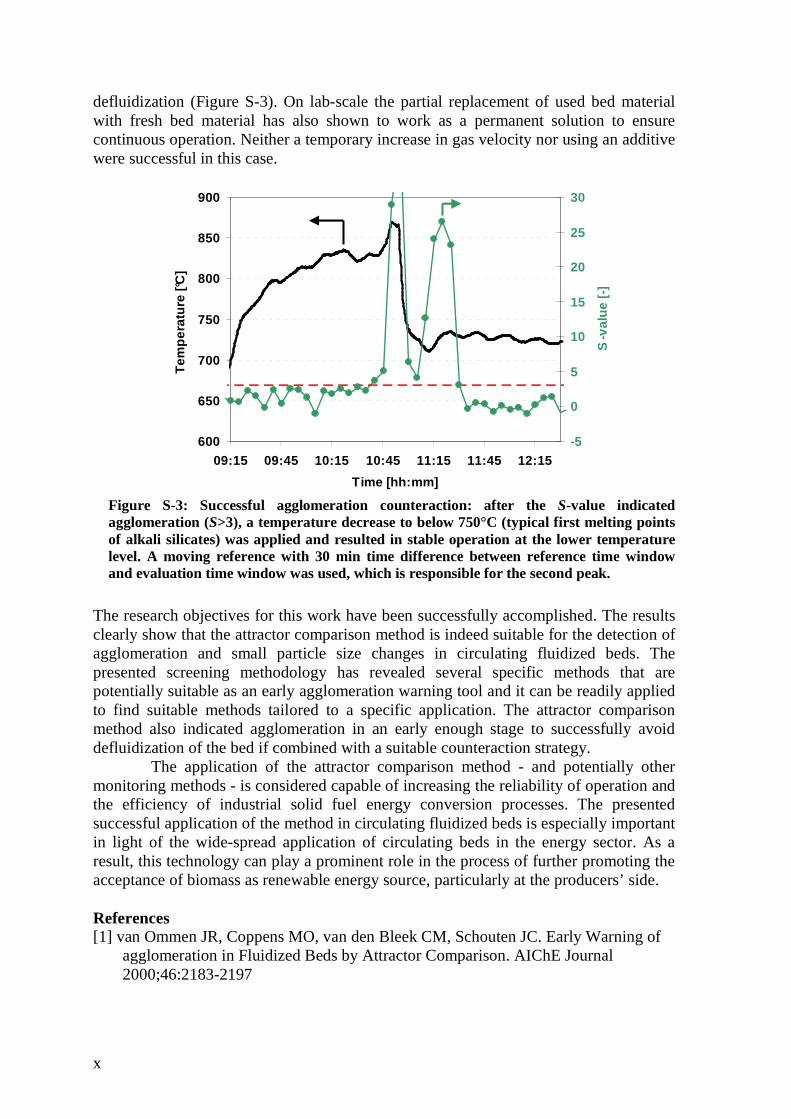
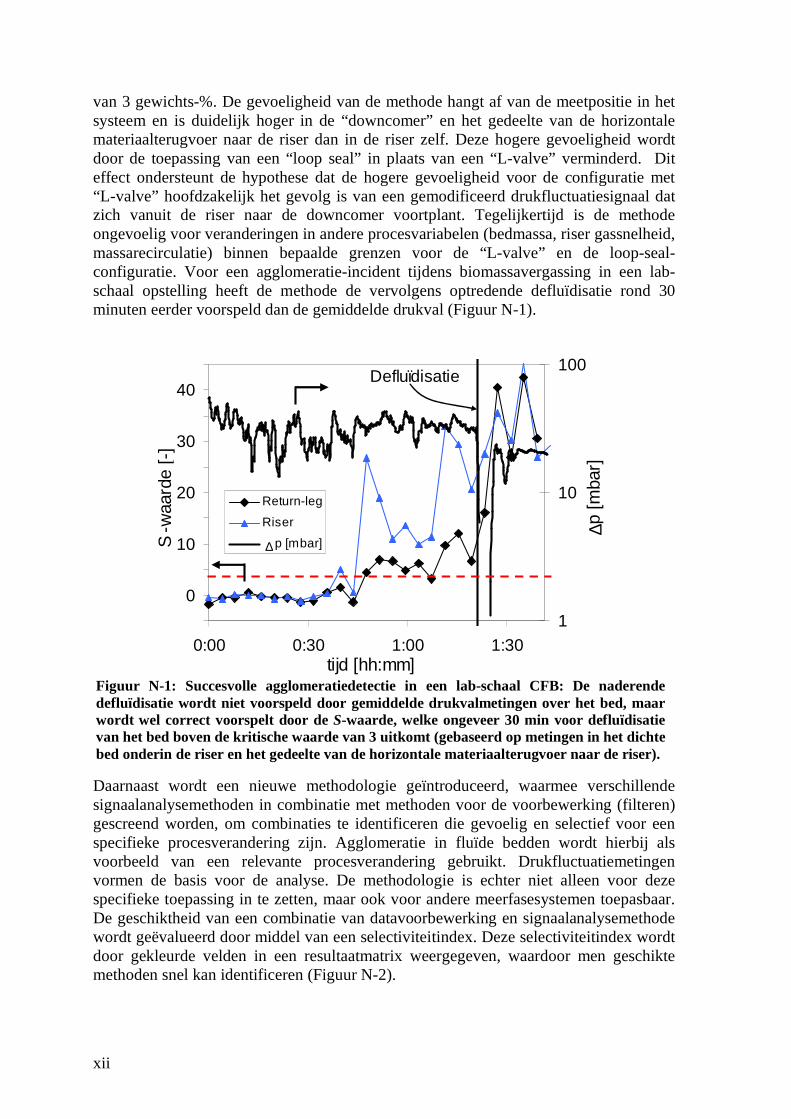
van 3 gewichts-%. De gevoeligheid van de methode hangt af van de meetpositie in het systeem en is duidelijk hoger in de “downcomer” en het gedeelte van de horizontale materiaalterugvoer naar de riser dan in de riser zelf. Deze hogere gevoeligheid wordt door de toepassing van een “loop seal” in plaats van een “L-valve” verminderd. Dit effect ondersteunt de hypothese dat de hogere gevoeligheid voor de configuratie met “L-valve” hoofdzakelijk het gevolg is van een gemodificeerd drukfluctuatiesignaal dat zich vanuit de riser naar de downcomer voortplant. Tegelijkertijd is de methode ongevoelig voor veranderingen in andere procesvariabelen (bedmassa, riser gassnelheid, massarecirculatie) binnen bepaalde grenzen voor de “L-valve” en de loop-seal- configuratie. Voor een agglomeratie-incident tijdens biomassavergassing in een lab-schaal opstelling heeft de methode de vervolgens optredende defluïdisatie rond 30 minuten eerder voorspeld dan de gemiddelde drukval (Figuur N-1).
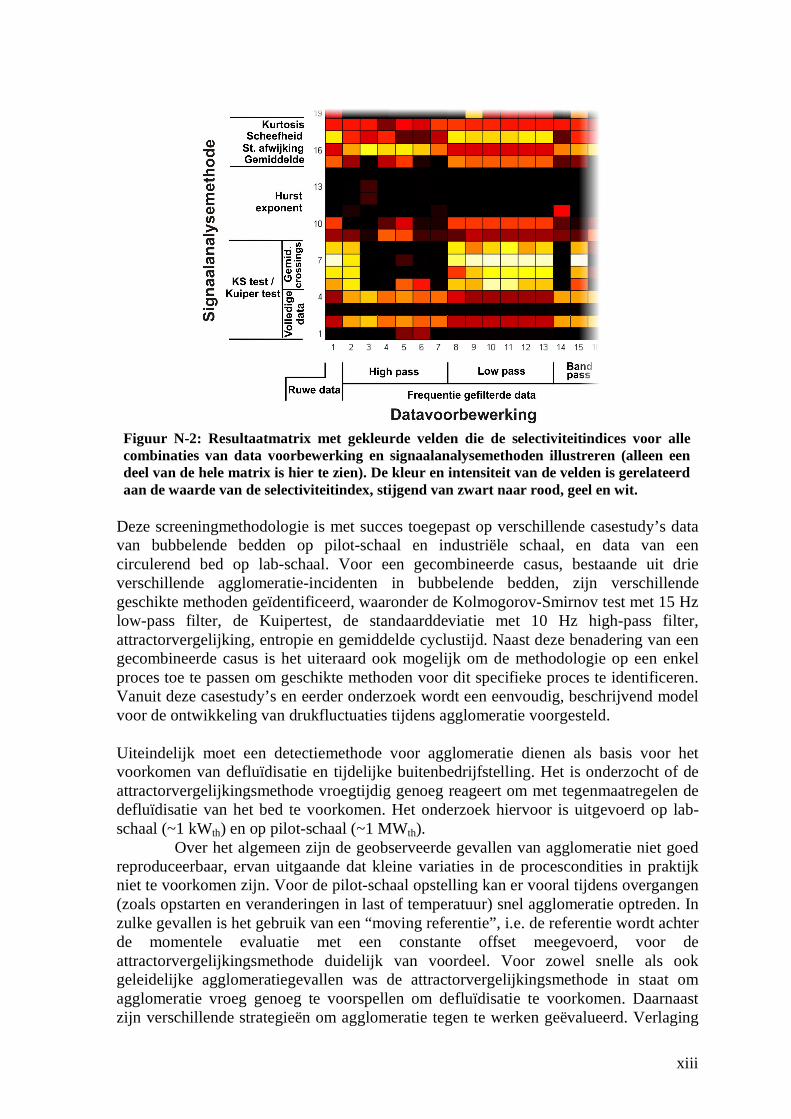
Daarnaast wordt een nieuwe methodologie geïntroduceerd, waarmee verschillende signaalanalysemethoden in combinatie met methoden voor de voorbewerking (filteren) gescreend worden, om combinaties te identificeren die gevoelig en selectief voor een specifieke procesverandering zijn. Agglomeratie in fluïde bedden wordt hierbij als voorbeeld van een relevante procesverandering gebruikt. Drukfluctuatiemetingen vormen de basis voor de analyse. De methodologie is echter niet alleen voor deze specifieke toepassing in te zetten, maar ook voor andere meerfasesystemen toepasbaar. De geschiktheid van een combinatie van datavoorbewerking en signaalanalysemethode wordt geëvalueerd door middel van een selectiviteitindex. Deze selectiviteitindex wordt door gekleurde velden in een resultaatmatrix weergegeven, waardoor men geschikte methoden snel kan identificeren (Figuur N-2).
-5
0
5
10
15
20
25
30
35
40
45
0:00 0:30 1:00 1:30tijd [hh:mm]
S-w
aard
e [-
]
1
10
100
∆p [
mba
r]
Return-leg
Riser
p [mbar]∆
Defluïdisatie
Figuur N-1: Succesvolle agglomeratiedetectie in een lab-schaal CFB: De naderende defluïdisatie wordt niet voorspeld door gemiddelde drukvalmetingen over het bed, maar wordt wel correct voorspelt door de S-waarde, welke ongeveer 30 min voor defluïdisatie van het bed boven de kritische waarde van 3 uitkomt (gebaseerd op metingen in het dichte bed onderin de riser en het gedeelte van de horizontale materiaalterugvoer naar de riser).
xiii
Deze screeningmethodologie is met succes toegepast op verschillende casestudy’s data van bubbelende bedden op pilot-schaal en industriële schaal, en data van een circulerend bed op lab-schaal. Voor een gecombineerde casus, bestaande uit drie verschillende agglomeratie-incidenten in bubbelende bedden, zijn verschillende geschikte methoden geïdentificeerd, waaronder de Kolmogorov-Smirnov test met 15 Hz low-pass filter, de Kuipertest, de standaarddeviatie met 10 Hz high-pass filter, attractorvergelijking, entropie en gemiddelde cyclustijd. Naast deze benadering van een gecombineerde casus is het uiteraard ook mogelijk om de methodologie op een enkel proces toe te passen om geschikte methoden voor dit specifieke proces te identificeren. Vanuit deze casestudy’s en eerder onderzoek wordt een eenvoudig, beschrijvend model voor de ontwikkeling van drukfluctuaties tijdens agglomeratie voorgesteld. Uiteindelijk moet een detectiemethode voor agglomeratie dienen als basis voor het voorkomen van defluïdisatie en tijdelijke buitenbedrijfstelling. Het is onderzocht of de attractorvergelijkingsmethode vroegtijdig genoeg reageert om met tegenmaatregelen de defluïdisatie van het bed te voorkomen. Het onderzoek hiervoor is uitgevoerd op lab-schaal (~1 kWth) en op pilot-schaal (~1 MWth).
Over het algemeen zijn de geobserveerde gevallen van agglomeratie niet goed reproduceerbaar, ervan uitgaande dat kleine variaties in de procescondities in praktijk niet te voorkomen zijn. Voor de pilot-schaal opstelling kan er vooral tijdens overgangen (zoals opstarten en veranderingen in last of temperatuur) snel agglomeratie optreden. In zulke gevallen is het gebruik van een “moving referentie”, i.e. de referentie wordt achter de momentele evaluatie met een constante offset meegevoerd, voor de attractorvergelijkingsmethode duidelijk van voordeel. Voor zowel snelle als ook geleidelijke agglomeratiegevallen was de attractorvergelijkingsmethode in staat om agglomeratie vroeg genoeg te voorspellen om defluïdisatie te voorkomen. Daarnaast zijn verschillende strategieën om agglomeratie tegen te werken geëvalueerd. Verlaging
Figuur N-2: Resultaatmatrix met gekleurde velden die de selectiviteitindices voor alle combinaties van data voorbewerking en signaalanalysemethoden illustreren (alleen een deel van de hele matrix is hier te zien). De kleur en intensiteit van de velden is gerelateerd aan de waarde van de selectiviteitindex, stijgend van zwart naar rood, geel en wit.
xiv
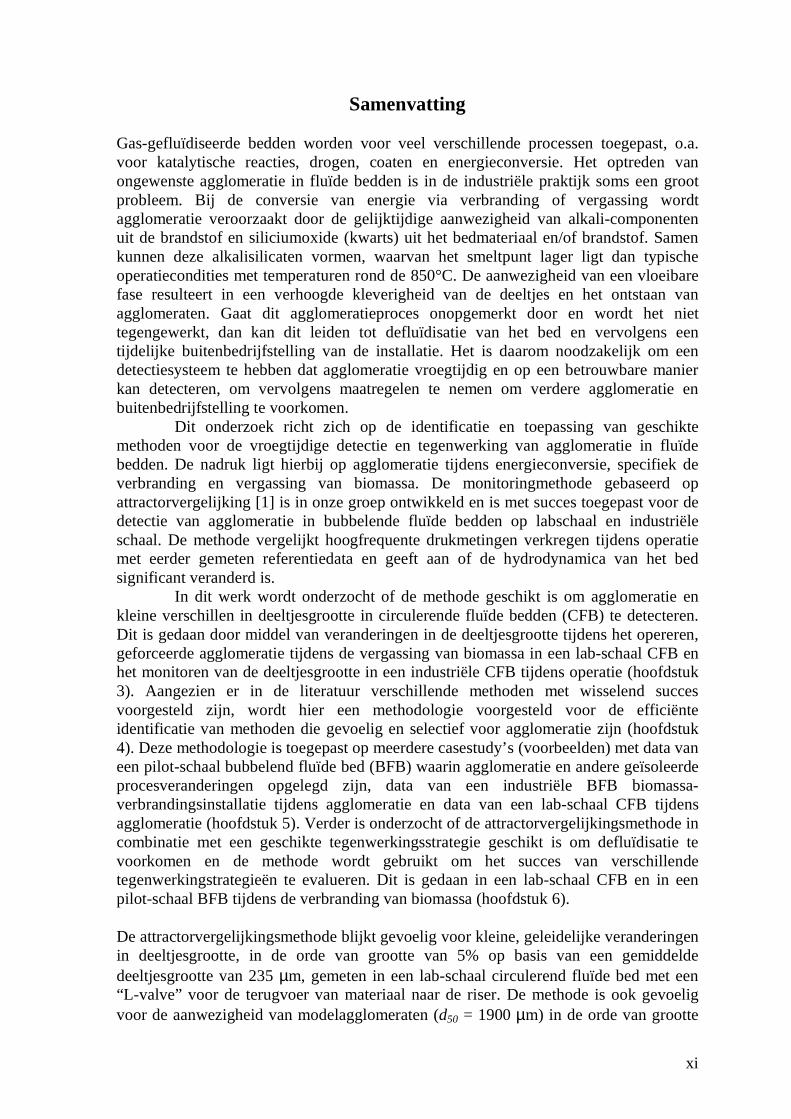
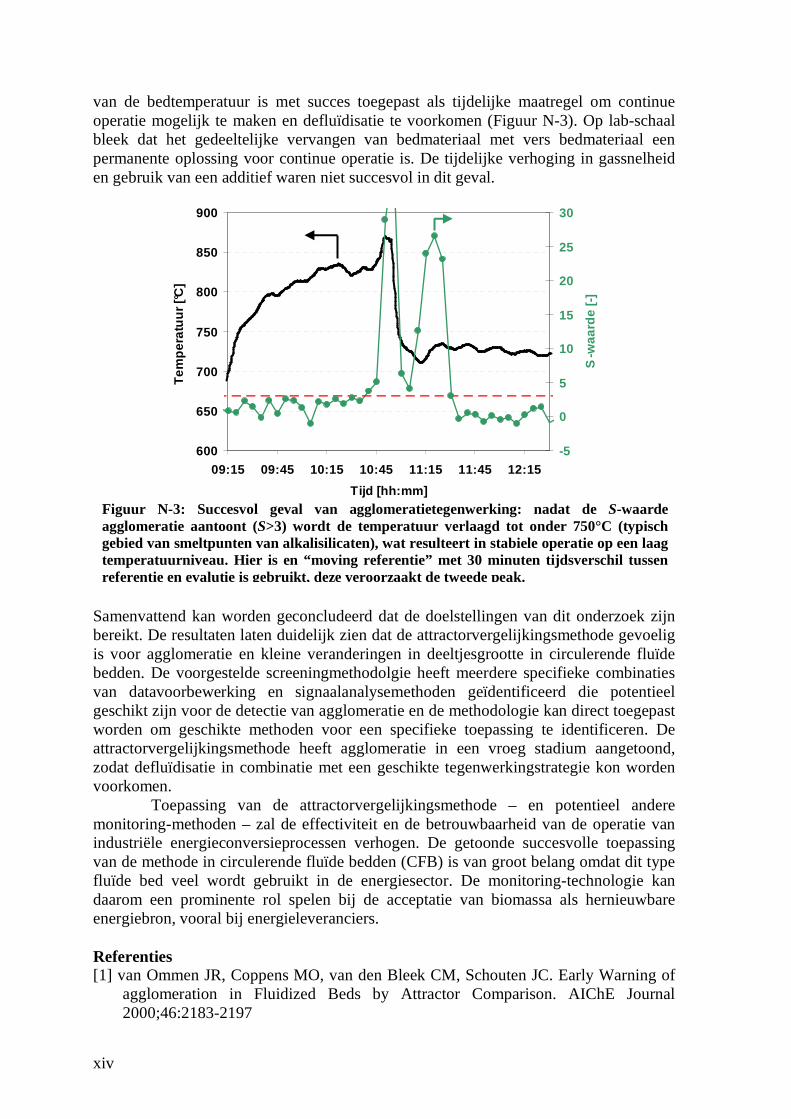
van de bedtemperatuur is met succes toegepast als tijdelijke maatregel om continue operatie mogelijk te maken en defluïdisatie te voorkomen (Figuur N-3). Op lab-schaal bleek dat het gedeeltelijke vervangen van bedmateriaal met vers bedmateriaal een permanente oplossing voor continue operatie is. De tijdelijke verhoging in gassnelheid en gebruik van een additief waren niet succesvol in dit geval.
Samenvattend kan worden geconcludeerd dat de doelstellingen van dit onderzoek zijn bereikt. De resultaten laten duidelijk zien dat de attractorvergelijkingsmethode gevoelig is voor agglomeratie en kleine veranderingen in deeltjesgrootte in circulerende fluïde bedden. De voorgestelde screeningmethodolgie heeft meerdere specifieke combinaties van datavoorbewerking en signaalanalysemethoden geïdentificeerd die potentieel geschikt zijn voor de detectie van agglomeratie en de methodologie kan direct toegepast worden om geschikte methoden voor een specifieke toepassing te identificeren. De attractorvergelijkingsmethode heeft agglomeratie in een vroeg stadium aangetoond, zodat defluïdisatie in combinatie met een geschikte tegenwerkingstrategie kon worden voorkomen.
Toepassing van de attractorvergelijkingsmethode – en potentieel andere monitoring-methoden – zal de effectiviteit en de betrouwbaarheid van de operatie van industriële energieconversieprocessen verhogen. De getoonde succesvolle toepassing van de methode in circulerende fluïde bedden (CFB) is van groot belang omdat dit type fluïde bed veel wordt gebruikt in de energiesector. De monitoring-technologie kan daarom een prominente rol spelen bij de acceptatie van biomassa als hernieuwbare energiebron, vooral bij energieleveranciers. Referenties [1] van Ommen JR, Coppens MO, van den Bleek CM, Schouten JC. Early Warning of
agglomeration in Fluidized Beds by Attractor Comparison. AIChE Journal 2000;46:2183-2197
600
650
700
750
800
850
900
09:15 09:45 10:15 10:45 11:15 11:45 12:15
Tijd [hh:mm]
Tem
pera
tuur
[°C
]
-5
0
5
10
15
20
25
30
S-w
aard
e [-]
Figuur N-3: Succesvol geval van agglomeratietegenwerking: nadat de S-waarde agglomeratie aantoont (S>3) wordt de temperatuur verlaagd tot onder 750°C (typisch gebied van smeltpunten van alkalisilicaten), wat resulteert in stabiele operatie op een laag temperatuurniveau. Hier is en “moving referentie” met 30 minuten tijdsverschil tussen referentie en evalutie is gebruikt, deze veroorzaakt de tweede peak.
xv
Table of contents
Chapter 1 Introduction ......................................................................................................17
1.1. Fluidization & fluidized beds.....................................................................................18 1.2. Circulating fluidized beds (CFB)...............................................................................20 1.3. Fluidized bed processes .............................................................................................21 1.4. Agglomeration & fluidized bed monitoring...............................................................22 1.5. Measurement techniques............................................................................................24 1.6. Signal analysis methods.............................................................................................26 1.7. Research objectives....................................................................................................27 1.8. Structure of the thesis ................................................................................................28 1.9. References .................................................................................................................29
Chapter 2 Agglomeration in fluidized beds at high temperatures: Mechanisms, Detection and Prevention....................................................................................................31
2.1. Abstract......................................................................................................................32 2.2 Introduction ................................................................................................................32 2.3. Mechanisms of agglomeration in a fluidized bed at high temperature.......................36
2.3.1. Hydrodynamics..................................................................................................36 2.3.2. Mechanisms of chemical reactions ....................................................................38 2.3.3. Mechanisms of interactions between ash and bed materials..............................39 2.3.4. Molecular Cramming.........................................................................................41
2.4. Agglomeration tendency determination and detection methods ................................42 2.4.1. Fuel ash measurements ......................................................................................42 2.4.2. Analysis methods based on process measurements ...........................................49
2.4.2.1. Pressure......................................................................................................49 2.4.2.2. Acoustic emission......................................................................................64 2.4.2.3. Temperature...............................................................................................67 2.4.2.4. Detection of gas-phase alkali components.................................................71 2.4.2.5. Other measurement sources .......................................................................72
2.5. Agglomeration counteraction strategies and technologies.........................................73 2.5.1. Methods for implementation in existing processes............................................73
2.5.1.1. Operational ................................................................................................73 2.5.1.2. Additives....................................................................................................77 2.5.1.3. Alternative bed materials ...........................................................................82
2.5.2. Improved reactor design ....................................................................................86 2.6. Conclusions ...............................................................................................................88 2.7. Future Developments.................................................................................................90 2.8. References .................................................................................................................91
Chapter 3 Detection of agglomeration and gradual particle size changes in circulating fluidized beds......................................................................................................................103
3.1. Abstract....................................................................................................................104 3.2. Introduction .............................................................................................................104 3.3. Experimental............................................................................................................106 3.4. Results & Discussion...............................................................................................111 3.5. Conclusions .............................................................................................................134 3.6. Recommendations for Implementation....................................................................135 3.7. Acknowledgements..................................................................................................136 3.8. References ...............................................................................................................136
xvi
Chapter 4 Methodology for the screening of signal analysis methods for selective detection of hydrodynamic changes in multiphase reactors ..........................................137
4.1. Abstract....................................................................................................................138 4.2. Introduction .............................................................................................................138 4.3. Screening methodology ...........................................................................................141 4.4. Illustrating results ....................................................................................................148 4.5. Conclusions .............................................................................................................151 4.6. References ...............................................................................................................151 4.7. Appendix .................................................................................................................153
Chapter 5 Case studies for selective agglomeration detection in fluidized beds: Application of a new screening methodology..................................................................157
5.1. Abstract....................................................................................................................158 5.2. Introduction .............................................................................................................158 5.3. Methodology............................................................................................................159 5.4. Experimental............................................................................................................161 5.5. Results & Discussion...............................................................................................163 5.6. Conclusions .............................................................................................................193 5.7. Acknowledgements..................................................................................................194 5.8. References ...............................................................................................................194 5.9. Appendix .................................................................................................................195
Chapter 6 Detecting and counteracting agglomeration in fluidized bed biomass combustion.........................................................................................................................197
6.1. Abstract....................................................................................................................198 6.2. Introduction .............................................................................................................198 6.3. Experimental............................................................................................................200 6.4. Results & Discussion...............................................................................................204
6.4.1. WOB setup (lab-scale).....................................................................................204 6.4.1.1. Reference cases........................................................................................204 6.4.1.2. Replacement of bed material ...................................................................207 6.4.1.3. Temporary increase in fluidization velocity ............................................210 6.4.1.4. Temporary temperature decrease.............................................................211
6.4.2. Crone boiler setup (small commercial scale) ...................................................213 6.4.2.1. Reference cases........................................................................................213 6.4.2.2. Temporary temperature decrease.............................................................218 6.4.2.3. Addition of kaolin....................................................................................224
6.5. Conclusions .............................................................................................................226 6.6. Acknowledgements..................................................................................................226 6.7. References ...............................................................................................................227
Chapter 7 Conclusions & Recommendations.................................................................229
7.1. Conclusions .............................................................................................................231 7.2. Recommendations....................................................................................................234 7.3. References ...............................................................................................................235
List of publications ............................................................................................................237 Acknowledgements............................................................................................................239 About the author................................................................................................................241

17
Chapter 1
Introduction
Chapter 1
18
In the chemical and process industry various different reactor concepts are applied that facilitate chemical reactions and mixing of solid, liquid and/or gas to obtain various products. Reactors are applied for single-phase systems, but more often to multi-phase systems that are characterized by the presence of at least two phases. Selection procedures for a suitable multi-phase reactor system for a specific process have been discussed by e.g. Krishna and Sie [1]. Multi-phase reactors for gas-solid systems can be distinguished in fixed beds and fluidized beds. Major advantages of fluidized beds above other reactor concepts are the good mixing characteristics and therefore high heat- and mass transfer rates. This makes them a suitable choice for highly exothermal reactions and cases where easy solid handling is needed. Some drawbacks are the generally lower conversion and yield (compared to a fixed bed) due to gas back-mixing, erosion, particle agglomeration and elutriation. An overview of some major applications for fluidized beds in shown in Table 1-1. Table 1-1: Overview of some major applications of fluidized beds, distinguished into chemical and physical processes.
Principle Processes Chemical • Roasting of sulfide ores
• Catalytic synthesis reactions (e.g. chlorination of metal oxides, fluid catalytic cracking (FCC), liquid fuel production via fischer-tropsch synthesis, various gas-phase synthesis reactions [2])
• Catalytic polymerization of olefins • Energy conversion of solid fuels (combustion, gasification,
pyrolysis) Physical • Heat exchange
• Granulation • Drying • Particle coating • Adsorption
In the following, an introduction on fluidization and fluidized beds will be presented, together with some examples for processes and the relation to the focus of this thesis – agglomeration in fluidized beds.
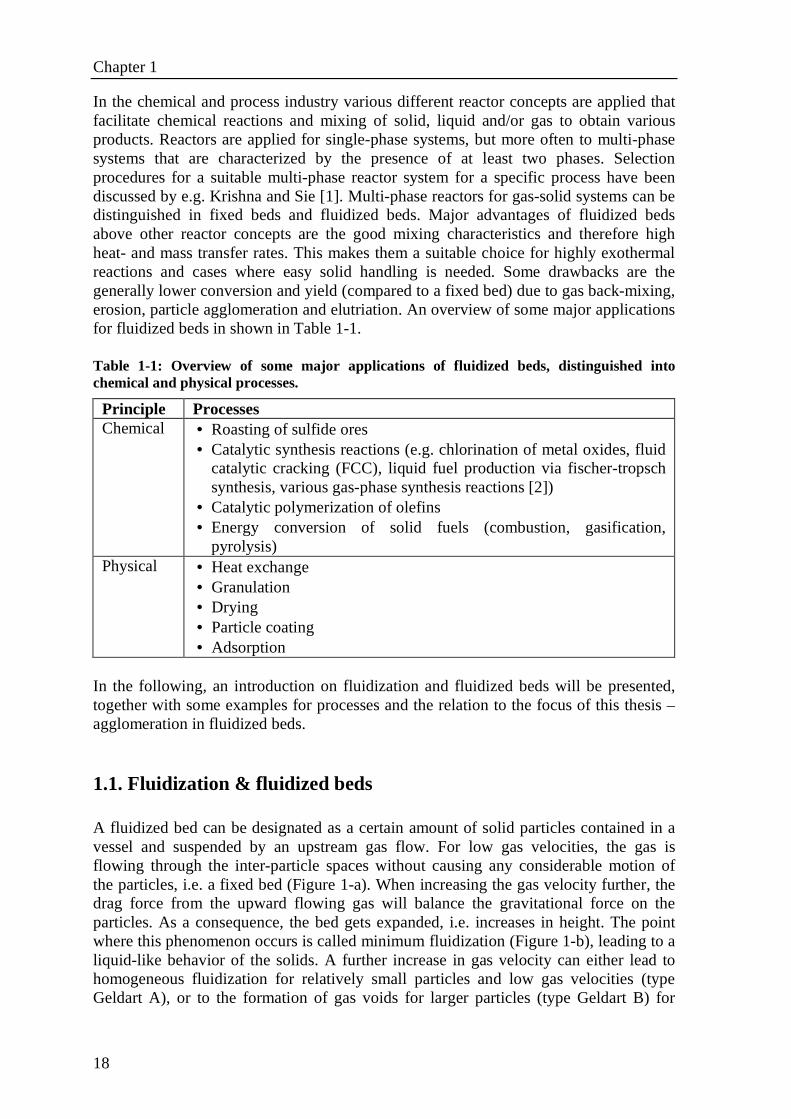
1.1. Fluidization & fluidized beds A fluidized bed can be designated as a certain amount of solid particles contained in a vessel and suspended by an upstream gas flow. For low gas velocities, the gas is flowing through the inter-particle spaces without causing any considerable motion of the particles, i.e. a fixed bed (Figure 1-a). When increasing the gas velocity further, the drag force from the upward flowing gas will balance the gravitational force on the particles. As a consequence, the bed gets expanded, i.e. increases in height. The point where this phenomenon occurs is called minimum fluidization (Figure 1-b), leading to a liquid-like behavior of the solids. A further increase in gas velocity can either lead to homogeneous fluidization for relatively small particles and low gas velocities (type Geldart A), or to the formation of gas voids for larger particles (type Geldart B) for
Introduction
19
which the upward flowing gas cannot flow through the inter-particle spaces in a homogeneous manner (Figure 1-c).
Figure 1-1: Illustration of the different regimes in a fluidized bed: Fixed bed with low gas flow (a), expanded bed at minimum fluidization (b), bubbling fluidization (c) and turbulent fluidization (d). (Adapted from [2]) These gas voids are also often called “bubbles” and have a similar shape as bubbles that gas forms in a liquid, but they should be distinguished from a liquid system by the absence of surface tension. The gas voids rise upwards and can grow in volume through coalescence with other voids. When increasing the gas velocity even further, no distinct round voids are present anymore but a turbulent motion of solid clusters and voids of different size and shape is observed (Figure 1-d). In addition, there is no more distinct upper bed surface and particles start getting entrained from the bed. A further increase in gas velocity will lead to pneumatic transport of particles. Different types of particles are used in fluidized beds, depending on the specific application. Geldart [3] has categorized them into four different groups depending on their size and density. For the same density and increasing particle size the groups are named C, A, B and D. Group C particles are of the smallest size and are strongly cohesive; the strong inter-particle forces make them very difficult to fluidize. Group A particles normally fluidize well, showing homogeneous bed expansion (i.e. no voids) at low gas velocities, small bubbles even at higher gas velocities and a maximum in the bubble size beyond a certain height in the bed. Group B particles, also called “sand-like”, fluidize well with a vigorous bubbling behaviour and no maximum in bubble size along bed height. Group D particles are rather large and are characterized by large exploding bubbles and so-called “spouting” behaviour during fluidization. For most industrial processes group A and B particles are used as they are well suitable for fluidization and handling.
Chapter 1
20
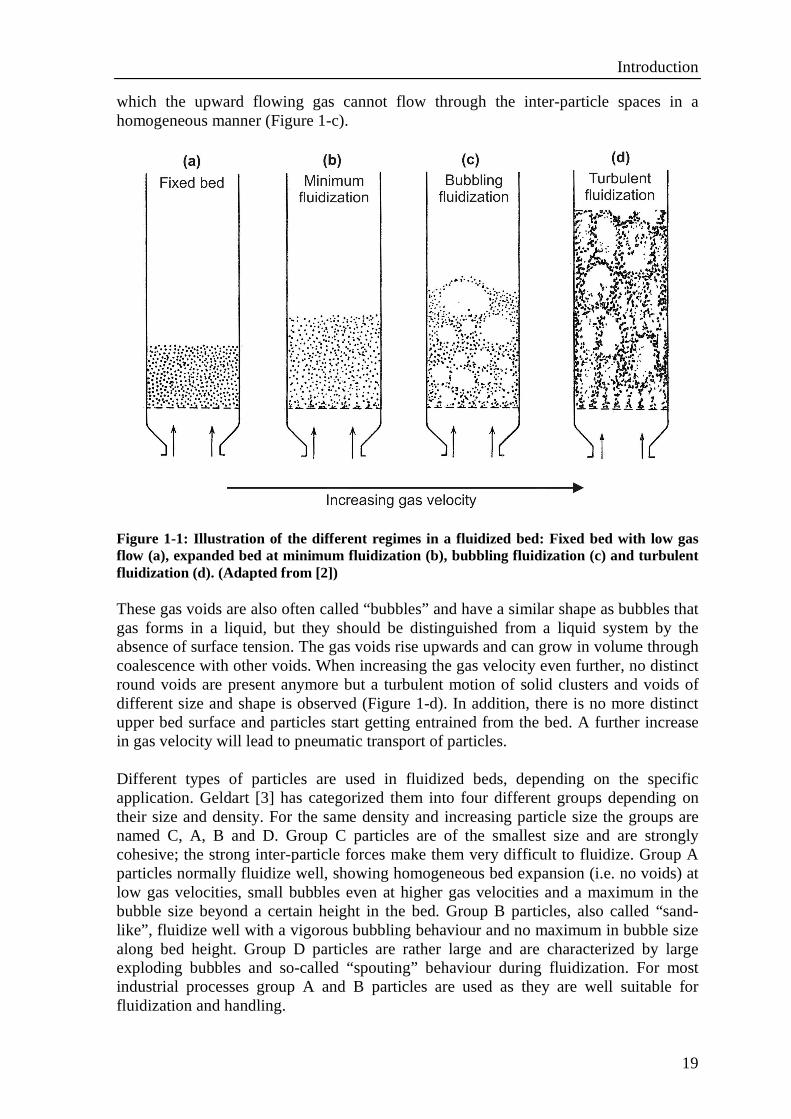
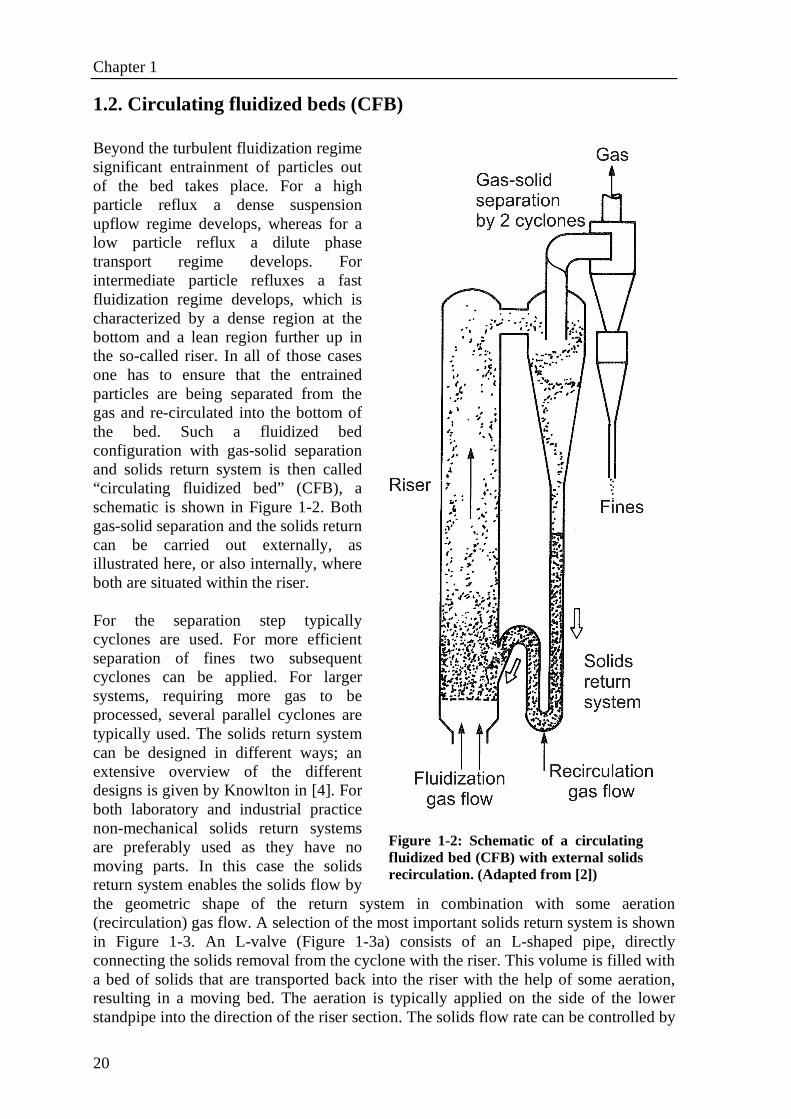
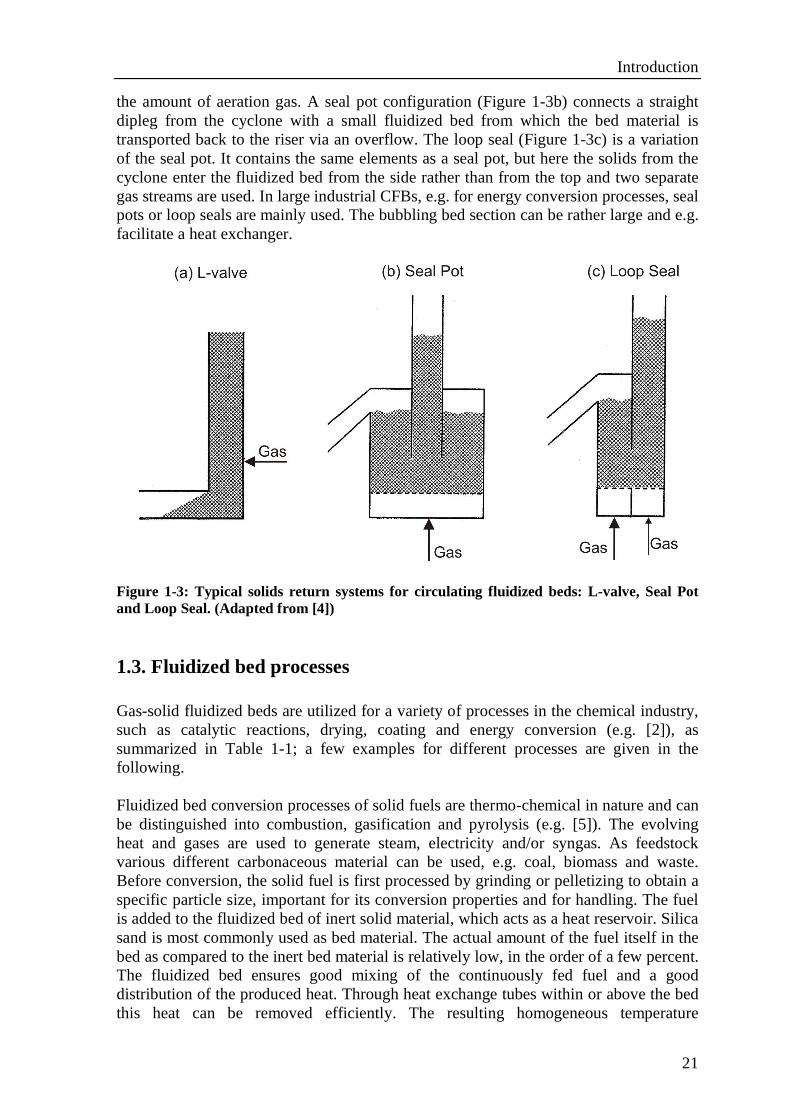
1.2. Circulating fluidized beds (CFB) Beyond the turbulent fluidization regime significant entrainment of particles out of the bed takes place. For a high particle reflux a dense suspension upflow regime develops, whereas for a low particle reflux a dilute phase transport regime develops. For intermediate particle refluxes a fast fluidization regime develops, which is characterized by a dense region at the bottom and a lean region further up in the so-called riser. In all of those cases one has to ensure that the entrained particles are being separated from the gas and re-circulated into the bottom of the bed. Such a fluidized bed configuration with gas-solid separation and solids return system is then called “circulating fluidized bed” (CFB), a schematic is shown in Figure 1-2. Both gas-solid separation and the solids return can be carried out externally, as illustrated here, or also internally, where both are situated within the riser. For the separation step typically cyclones are used. For more efficient separation of fines two subsequent cyclones can be applied. For larger systems, requiring more gas to be processed, several parallel cyclones are typically used. The solids return system can be designed in different ways; an extensive overview of the different designs is given by Knowlton in [4]. For both laboratory and industrial practice non-mechanical solids return systems are preferably used as they have no moving parts. In this case the solids return system enables the solids flow by the geometric shape of the return system in combination with some aeration (recirculation) gas flow. A selection of the most important solids return system is shown in Figure 1-3. An L-valve (Figure 1-3a) consists of an L-shaped pipe, directly connecting the solids removal from the cyclone with the riser. This volume is filled with a bed of solids that are transported back into the riser with the help of some aeration, resulting in a moving bed. The aeration is typically applied on the side of the lower standpipe into the direction of the riser section. The solids flow rate can be controlled by
Figure 1-2: Schematic of a circulating fluidized bed (CFB) with external solids recirculation. (Adapted from [2])
Introduction
21
the amount of aeration gas. A seal pot configuration (Figure 1-3b) connects a straight dipleg from the cyclone with a small fluidized bed from which the bed material is transported back to the riser via an overflow. The loop seal (Figure 1-3c) is a variation of the seal pot. It contains the same elements as a seal pot, but here the solids from the cyclone enter the fluidized bed from the side rather than from the top and two separate gas streams are used. In large industrial CFBs, e.g. for energy conversion processes, seal pots or loop seals are mainly used. The bubbling bed section can be rather large and e.g. facilitate a heat exchanger.
Figure 1-3: Typical solids return systems for circulating fluidized beds: L-valve, Seal Pot and Loop Seal. (Adapted from [4])
1.3. Fluidized bed processes Gas-solid fluidized beds are utilized for a variety of processes in the chemical industry, such as catalytic reactions, drying, coating and energy conversion (e.g. [2]), as summarized in Table 1-1; a few examples for different processes are given in the following. Fluidized bed conversion processes of solid fuels are thermo-chemical in nature and can be distinguished into combustion, gasification and pyrolysis (e.g. [5]). The evolving heat and gases are used to generate steam, electricity and/or syngas. As feedstock various different carbonaceous material can be used, e.g. coal, biomass and waste. Before conversion, the solid fuel is first processed by grinding or pelletizing to obtain a specific particle size, important for its conversion properties and for handling. The fuel is added to the fluidized bed of inert solid material, which acts as a heat reservoir. Silica sand is most commonly used as bed material. The actual amount of the fuel itself in the bed as compared to the inert bed material is relatively low, in the order of a few percent. The fluidized bed ensures good mixing of the continuously fed fuel and a good distribution of the produced heat. Through heat exchange tubes within or above the bed this heat can be removed efficiently. The resulting homogeneous temperature
Chapter 1
22
distribution is one of the important advantages of fluidized beds over other reactor designs. Moreover, fluidized beds in energy conversion have the advantage of being flexible for a variety of different fuels. The process of gas-phase polymerization of olefins is widely applied for production of both high density and low density polymers, typically polyethylene (PE) and polypropylene (PP) [6]. As compared to other processes, the gas-phase polymerization in fluidized beds has the advantages of generally lower operating costs and versatility of the process for quickly switching production between different grades. For this process, typically solid Ziegler-Natta catalyst type particles of < 100 µm are injected into the fluidized bed. Polymerization of ethylene or propylene from the gas phase takes place at the interface between the solid catalyst and the developing polymer matrix. The developing polymer particles typically grow up to a size range of a few millimetres while the catalyst is broken up and still present in the polymer. These particles and are continuously removed from the bottom bed. Fluidized bed granulation and drying is widely applied in the areas of pharmaceutics and food. For pharmaceutical applications the powders are typically first processed by a wet granulation process step, in which a liquid is sprayed onto a powder containing the active ingredient and filler. For food applications, e.g. production of milk powder, a liquid solution is heated and atomized in a spray chamber, leading to evaporation of the water. For all cases a subsequent drying phase is applied to further reduce the moisture content by evaporation in a fluidized bed. It is desired to obtain an optimal particle size distribution and residual moisture content during this process. In case of pharmaceutics this is important for the mechanical stability of tablets produced from the resulting powder. For food applications the taste and further processing properties are important, e.g. the solubility of milk powder.
1.4. Agglomeration & fluidized bed monitoring The occurrence of unwanted agglomeration in fluidized beds can be a major problem in industrial practice. It has been reported in some the earliest work on this topic, e.g. for reduction of ore powder [7] and coal gasification [8]. In the area of energy conversion, typically combustion and gasification of coal, biomass and waste, reports of agglomeration are numerous, e.g. [9,10,11]. Subsequent defluidization of the bed often results in a lengthy and expensive shut-down of the installation. This can be avoided with the help of a monitoring system that gives the process operator an early warning so that he can take the appropriate measures to prevent shutdown. The on-line monitoring of fluidized bed hydrodynamics therefore is an important area of research. Besides applications for early agglomeration detection, on-line monitoring is also useful for other processes where the particle properties influence the bed hydrodynamics and therefore the process efficiency. Some examples for industrially important processes are given in the following. In case of energy conversion agglomeration is related to the simultaneous presence of alkali components from the fuel and silica from the bed material and/or fuel. Alkali silicates can be formed, having melting points starting around 750°C, lower than the
Introduction
23
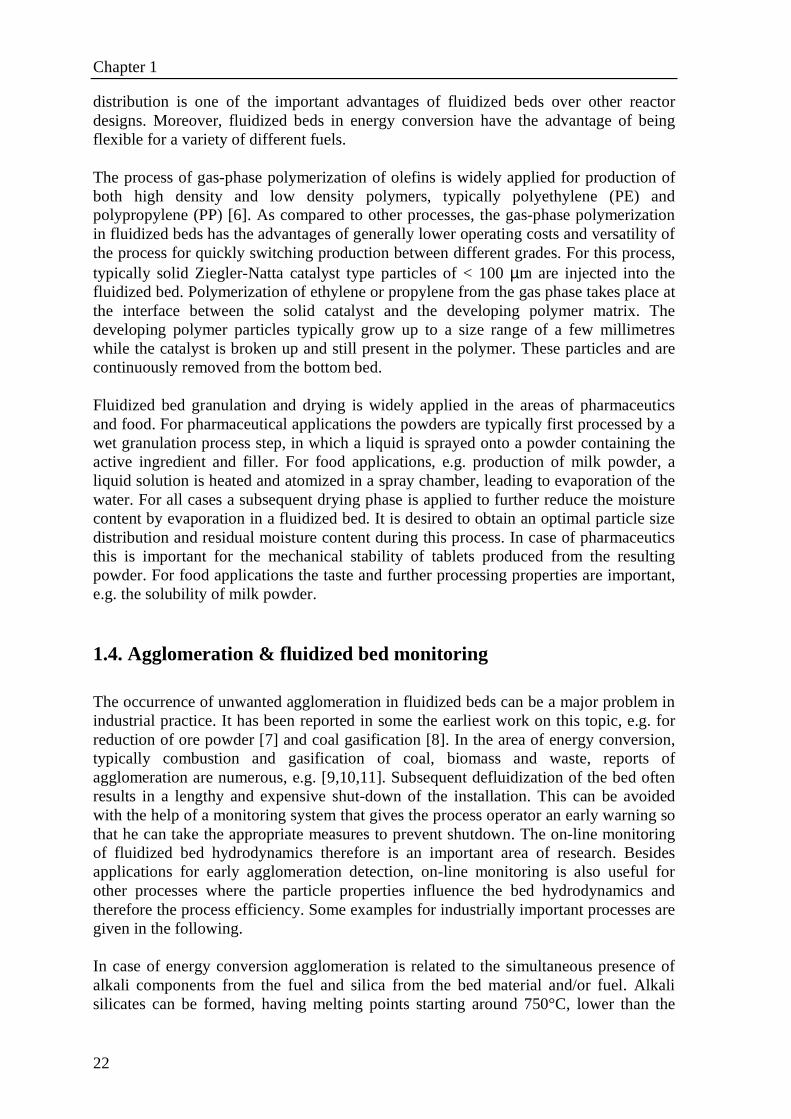
typical operating temperatures of about 850°C. Note that operating temperatures are only average bed temperatures; locally temperatures may be even much higher around burning fuel particles (e.g. [12]). The presence of a liquid phase results in an increased particle stickiness and formation of agglomerates upon particle collision (e.g. [10]); an example is shown in Figure 1-4.
Figure 1-4: Scanning Electron Microscope (SEM) photograph of a small agglomerate comprised of several individual grains covered and connected by a hardened melt-phase (a). The particle coverage is further illustrated in (b), showing an individual grain broken off from an agglomerate. The neck formation in-between particles is clearly visible. (Courtesy “Energy Technology” group at 3mE / TU Delft) Continued agglomeration can result in defluidization of the bed, i.e. the loss of fluidization and formation of a fixed bed. Biomass fuels, especially the economically interesting fast-growing grassy biomasses (e.g. straw, miscanthus), may contain relatively large amounts of alkali and are often responsible for agglomeration problems (e.g. [13]). Reliable early warning systems are therefore expected to be capable of stimulating the acceptance and use of biomass in energy conversion in the future. Besides agglomeration, also the particle size distribution of the bed material can be an important process parameter, especially in the riser section of circulating fluidized beds where the size distribution determines the efficiency of the heat transfer to heat exchangers. Here, a monitoring system could help to optimize the bed composition by addition or replacement of bed material without mechanical bed sampling and analysis. In gas-phase polymerization of olefins, producing polyethylene (PE) and polypropylene (PP), using solid catalyst particles (e.g. [6]), the polymer properties are strongly influenced by the catalyst properties and operating conditions, such as temperature. For
Chapter 1
24
sub-optimal conditions, the growing polymer particles can become sticky and form agglomerates in the bed or sheets on the reactor walls (e.g. [14,15]). In this process also electrostatic forces can play an important role. Monitoring is not only important for detecting agglomeration events here, but potentially also for controlling the process to ensure optimal particle size and properties. In fluidized bed drying of powders, e.g. milk powder, agglomerated moist particles break up into smaller entities, which can be seen as “reverse agglomeration”. The moisture content and particle size distribution are important parameters that define the product quality. Overheating of the product due to the hot drying gas should also be avoided. Here, monitoring is necessary for accurately determining the optimal point to stop the drying process (e.g. [16]).
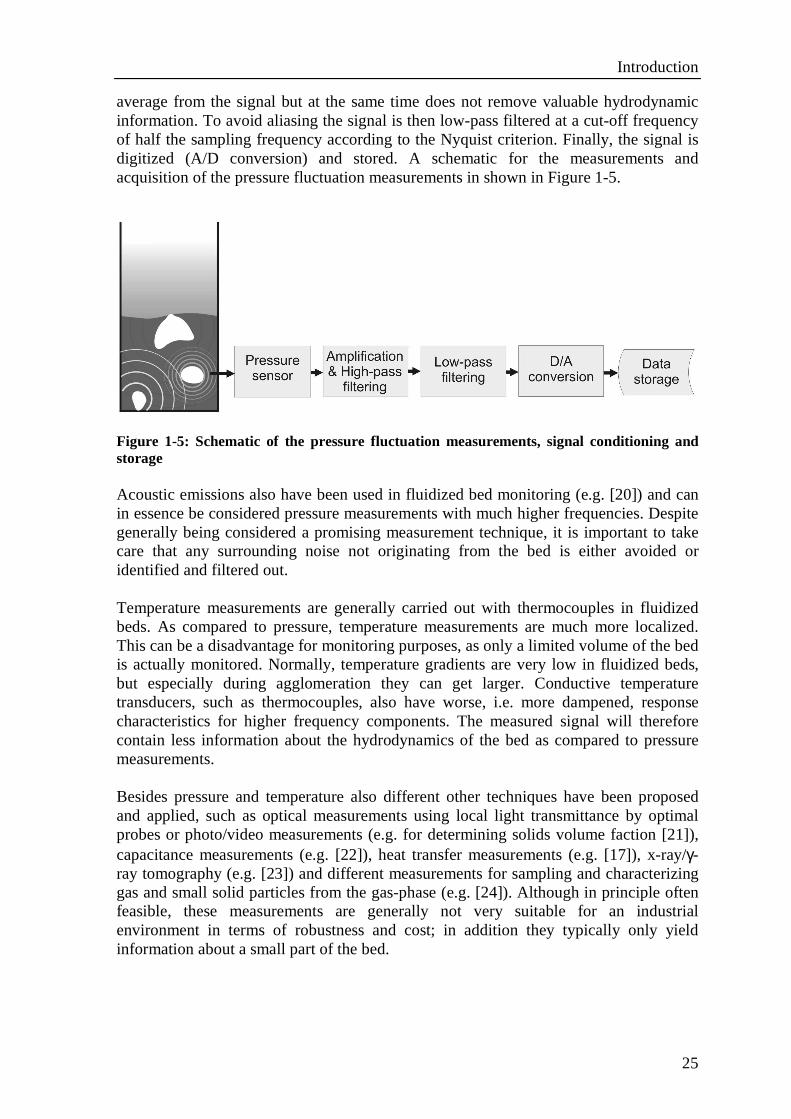
1.5. Measurement techniques Detection methods for agglomeration and changes in particle size can be based on different types of measurements that characterize the hydrodynamics of the bed. A distinction should be made between lab-scale fluidized beds and industrial installations. For an industrial application the measurements should be reliable, cheap and simple to implement. For industrial fluidized beds the measurement of pressure and temperature are the most suitable options [17]. In this work, absolute pressure fluctuation measurements are primarily used. Pressure fluctuations do not directly express a distinct property of the bed (e.g. void fraction, density) but contain information about the global hydrodynamics of the bed comprised of bubble phenomena (formation, coalescence, break-up) and bed oscillations. The design of the measurement probes connecting the fluidized bed with the pressure transducer requires some attention to avoid the distortion of the pressure fluctuations [18]. The measurements carried out in this work are designed according to those guidelines. It is also necessary to prevent bed particles penetrating and blocking the measurement probe. In some cases this can be done with a wire gauze, but often, especially under hot conditions, it is necessary to apply a gas purge stream that enters the bed through the probe [19]. To resolve the pressure fluctuations sufficiently well for the subsequent analysis methods it is necessary to apply significantly higher sampling frequencies than usual for sampling of process variables. Typical sampling frequencies should be in the range of ten to a few hundred Hz. The necessary minimum sampling frequency depends on the frequency characteristics of the specific bed and can be estimated from a power spectrum of the measurements. The power density reduces with higher frequencies and remains roughly constant beyond a certain point; any higher frequency components are considered to not contain any relevant information on the hydrodynamics of the bed and are therefore obsolete for the analysis. The pressure transducer itself needs to be capable of sufficiently resolving the pressure fluctuations. Here, pressure transducers of type Kistler 7261 with a resolution of 1.5 Pa are used (note that this resolution is not considered a minimum requirement). Subsequently the pressure signal is amplified, further modified and finally sampled and stored by a data acquisition system. For the analysis only the fluctuations around the current average pressure are of interest. The signal is therefore first high-pass filtered. The high-pass filtering is carried out at a low cut-off frequency, typically 0.16 Hz, which subtracts the
Introduction
25
average from the signal but at the same time does not remove valuable hydrodynamic information. To avoid aliasing the signal is then low-pass filtered at a cut-off frequency of half the sampling frequency according to the Nyquist criterion. Finally, the signal is digitized (A/D conversion) and stored. A schematic for the measurements and acquisition of the pressure fluctuation measurements in shown in Figure 1-5.
Figure 1-5: Schematic of the pressure fluctuation measurements, signal conditioning and storage Acoustic emissions also have been used in fluidized bed monitoring (e.g. [20]) and can in essence be considered pressure measurements with much higher frequencies. Despite generally being considered a promising measurement technique, it is important to take care that any surrounding noise not originating from the bed is either avoided or identified and filtered out. Temperature measurements are generally carried out with thermocouples in fluidized beds. As compared to pressure, temperature measurements are much more localized. This can be a disadvantage for monitoring purposes, as only a limited volume of the bed is actually monitored. Normally, temperature gradients are very low in fluidized beds, but especially during agglomeration they can get larger. Conductive temperature transducers, such as thermocouples, also have worse, i.e. more dampened, response characteristics for higher frequency components. The measured signal will therefore contain less information about the hydrodynamics of the bed as compared to pressure measurements. Besides pressure and temperature also different other techniques have been proposed and applied, such as optical measurements using local light transmittance by optimal probes or photo/video measurements (e.g. for determining solids volume faction [21]), capacitance measurements (e.g. [22]), heat transfer measurements (e.g. [17]), x-ray/γ-ray tomography (e.g. [23]) and different measurements for sampling and characterizing gas and small solid particles from the gas-phase (e.g. [24]). Although in principle often feasible, these measurements are generally not very suitable for an industrial environment in terms of robustness and cost; in addition they typically only yield information about a small part of the bed.
Chapter 1
26
1.6. Signal analysis methods Many methods for agglomeration detection have been proposed. Relatively simple methods are often based on existing average process measurements at the available sampling frequencies, usually below 1 Hz, and therefore do not analyze the higher frequency bubble phenomena. The average value of the pressure drop over the bed has been proposed (e.g. [25]). For higher-frequency data the standard deviation and variance (e.g. [26,27]) as well as principal component analysis based on pressure drop (e.g. [28]) have been proposed. These methods generally do detect particle size changes or agglomeration, but only in a relatively late stage of the change. Moreover, their sensitivity for other process changes (cross-sensitivity) has either not been investigated or has been shown to be rather large, e.g. for changes in the fluidizing gas flow [29]. A review of methods is presented in chapter 2. The method of “attractor comparison” [30] is especially considered in this work because it has shown to be a suitable early agglomeration warning method for lab-scale and industrial scale bubbling beds [19,30]. The principle of this method consists of reconstructing and comparing so-called attractors. An attractor is the projection of a time series into a multi-dimensional state space, in this case a pressure fluctuation time series. One first has to construct a reference attractor that is representing a desired (e.g. well-fluidized) state of the system. Subsequently, the attractor of the current operating state is reconstructed and compared to the reference attractor. This comparison is based on a statistical test developed by Diks et al. [31], which evaluates the dimensionless squared distance S between two attractors. The S-value is defined as:
( )
with:
: Estimator of the squared distance between the two smoothed distributions of the two attractors
( ) : Variance of
c
c
QS
V Q
Q
V Q Q
∧
∧
∧
∧ ∧
=
For attractors being generated by the same mechanism, S has an expectation of 0 and a standard deviation of 1. An S-value larger than 3 indicates with at least 95% confidence that the two attractors have been generated by a different system, i.e. the hydrodynamics have significantly changed. For bubbling fluidized beds the method has shown to be sensitive to agglomeration and insensitive to changes in bed mass and gas velocity up to about 10%. In general, signal analysis methods can be distinguished into two groups: Methods that characterize a specific aspect of the pressure fluctuation signal, such as cycle time between subsequent crossing of the signal with its average or amplitude, and methods that signify a statistically significant change as compared to a certain reference state, such as attractor comparison or the Kolmogorov-Smirnov test. The latter group needs by definition a reference state to evaluate the relative changes. A comparison of relative changes can also be done for the first group of methods, but one has to define a measure
Introduction
27
for the significance of such a change; this can be done e.g. with the standard deviation during the chosen reference. In addition to the high frequency pressure fluctuation data often also “average” process data, obtained with a low sampling frequency, are used for the interpretation of the results of the high-frequency data analysis. Typical examples are temperatures, gas flow rates, gas composition and mass refluxes. Besides the actual signal analysis method one can also apply pre-treatment methods, i.e. modifications of the signal before the actual analysis. This pre-treatment can consist of the application of a frequency filter or also reducing the dimensionality of the data. The purpose of such a pre-treatment step is to potentially increase sensitivity and selectivity to a specific hydrodynamic phenomenon, e.g. like agglomeration, in the subsequent analysis.
1.7. Research objectives This thesis is based on the following main research objectives: 1. Investigation whether the attractor comparison method [30] based on high-
frequency pressure measurements, previously successfully applied to bubbling fluidized beds, can also successfully applied in circulating fluidized beds for the early detection of agglomeration as well as small uni-modal changes in particle size. The application in circulating fluidized beds is of importance due to their widespread industrial use, particularly for energy conversion. For the applicability of attractor comparison method, it should be investigated how to optimally implement the method in the process with respect to the pressure fluctuation measurement location(s), tuning of the method and electronic pre-treatment (filtering) of the signal before the actual analysis.
2. Investigation on which signal analysis methods are suitable to serve as a suitable early warning method for agglomeration in fluidized bed processes, both on lab-scale and industrial scale. A method is suitable if it is sensitive, selective and early enough to reliably detect agglomeration; here, the sensitivity and selectivity are investigated. The application of (electronic) pre-treatment of the pressure fluctuation data before the actual analysis is also incorporated in this investigation to see if this can improve sensitivity and/or selectivity of the subsequent analysis method.
3. Investigation of the suitability of attractor comparison to successfully prevent defluidization in an energy conversion process in combination with a suitable strategy to counteract agglomeration. This investigation is carried out on lab-scale and small commercial scale to investigate the applicability and implementation of the method on different scales. In addition, the suitability of different counteraction methods is investigated in light of successfully preventing further agglomeration and defluidization.
The focus of all these research objectives is on the process of energy conversion of solid fuels, in particular combustion and gasification of biomass. Related to the proposed research objectives is the identification of the agglomeration mechanisms and suitable detection and counteractions methods proposed in the literature.
Chapter 1
28
1.8. Structure of the thesis For each chapter of this thesis the general scope is shortly addressed below. Chapter 2 reviews agglomeration mechanisms, detection methods, and counteraction strategies in fluidized beds, focusing on high-temperature processes. For the complex phenomenon of agglomeration in fluidized beds at high temperatures various aspects are distinguished: hydrodynamics, chemical reaction mechanisms, particle interaction mechanisms, and molecular cramming. Special emphasis is given to the detection of agglomeration. Detection methods are either based on fuel ash analysis methods to predict potential agglomeration on (on-line) process measurements. Finally, different methods to counteract agglomeration phenomena are presented: operational measures, utilization of additives, alternative bed materials and improved reactor design. Chapter 3 discusses the application of the attractor comparison method in circulating fluidized beds. The two applications considered here are the detection of small, gradual changes in particle size and the early detection of agglomeration. The analysis is based on high-frequency pressure measurements, obtained from different locations (riser, downcomer and return-system) in each of the four investigated setups. A lab-scale cold-flow setup with two alternative solids return systems, L-valve and loop seal, was used to investigate the influence of small particle size changes and the presence of model agglomerates on the method. In a hot lab-scale setup an agglomeration case during biomass gasification was investigated. On industrial scale the method was applied for the detection of small particle size changes. Optimal performance in terms of measurement locations and filtering are discussed. Chapter 4 presents a new methodology used for efficient screening of many different signal analysis methods in combination with different signal pre-treatment methods. The goal to identify those combinations that are selective towards a specific process change. Background for the development of this methodology is that there are many different analysis techniques available, but only sufficiently sensitive and selective methods will be suitable for the unambiguous detection of a specific process change. For the assessment a selectivity index is defined and visualized as coloured elements in a matrix form. The methodology is illustrated with fluidized bed agglomeration data, demonstrating the validity and the benefit of this approach. Chapter 5 presents several case studies based on the methodology introduced in Chapter 4. Data from a pilot-scale cold-flow bubbling fluidized bed with isolated process changes were used to investigate the selectivity to agglomeration compared to changes in gas flow and bed mass. For an agglomeration case in an industrial bubbling bed combustor and in a lab-scale circulating gasifier, agglomeration is compared to common fluctuations in the process instead of isolated process changes. Several methods that visually were identified to perform well, i.e. having a high sensitivity and selectivity to agglomeration, are presented and discussed. Chapter 6 establishes a link between agglomeration detection and counteraction strategies on both lab-scale and small commercial scale. Attractor comparison is applied for the agglomeration detection and is the basis for controlling the
Introduction
29
counteractions with the goal to avoid defluidization of the bed. Temporary temperature decrease, gas velocity increase, bed material replacement and introduction of an additive were investigated; their suitability to successfully counteract agglomeration is discussed. Chapter 7 concludes the main findings of this thesis and gives recommendations for further research.
1.9. References [1] Krishna R, Sie ST. Strategies for multiphase reactor selection. Chemical
Engineering Science 1994;49(24):4029-4065 [2] Kunii D, Levenspiel O. “Fluidization Engineering”, Butterworth-Heinemann Ltd,
USA, 1991 [3] Geldart D. Types of Gas Fluidization. Powder Technology 1973;7(5):285-292 [4] Grace J, Avidan A, Knowlton T (Editors). Circulating Fluidized Beds, Blackie
Academic & Professional, New York, 1997 [5] McKendry P. Energy production from biomass (part 2): conversion technologies.
Bioresource Technology 2002;83(1):47-54 [6] Tuyu Xie, Kim B. McAuley, James C. C. Hsu, and David W. Bacon. Gas Phase
Ethylene Polymerization: Production Processes, Polymer Properties, and Reactor Modeling. Ind Eng Chem Res 1994;33(3):449-479
[7] Gluckman, M.J., Yerushalmi, J. and Squires, A.M., Defluidization characteristics of sticky materials on agglomerating bed, Fluidization Technology, Vol. 2, (ed. Keairns, D.L.), 1976, p. 395 – 422
[8] Yerushalmi J, Kolodney M, Graff RA, Squires AM. Agglomeration of Ash in Fluidized-Beds Gasifying Coal - Godel Phenomenon. Science 1975;187(4177):646-648
[9] Ergüdenler A, Ghaly AE. Agglomeration of silica sand in a fluidized bed gasifier operating on wheat straw. Biomass and Bioenergy 1993;4(2):135-147
[10] Öhman M, Nordin A, Skrifvars B-J, Backman R, Hupa M. Bed Agglomeration Characteristics during Fluidized Bed Combustion of Biomass Fuels. Energy & Fuels 2000;14(1):169-178
[11] Werther J, Saenger M, Hartge E.-U., Ogada T, Siagi Z. Combustion of agricultural residues. Progress in Energy and Combustion Science 2000;26(1):1-27
[12] Chirone R, Salatino P, Scala F. The Relevance of Attrition on the Fate of Ashes during Fluidized-bed Combustion of a Biomass. Proceedings of the Combustion Institute 2000;28:2279-2286
[13] Skrifvars BJ, Öhman M, Nordin A, Hupa M. Predicting Bed Agglomeration Tendencies for Biomass Fuels Fired in FBC Boilers: A Comparison of Three Different Prediction Methods. Energy & Fuels 1999;13:359-363
[14] Hatzantonis H, Goulas A, Kiparissides C. A comprehensive model for the prediction of particle-size distribution in catalyzed olefin polymerization fluidized-bed reactors. Chemical Engineering Science 1998;53(18):3251-3267
[15] Hendrickson G. Electrostatics and gas phase fluidized bed polymerization reactor wall sheeting. Chemical Engineering Science 2006;61(4):1041-1064
Chapter 1
30
[16] Chaplin G, Pugsley T. Application of electrical capacitance tomography to the fluidized bed drying of pharmaceutical granule. Chemical Engineering Science 2005;60(24):7022-7033
[17] Werther J. Measurement Techniques in Fluidized Beds. Powder Technology 1999;102:15-36
[18] J. Ruud van Ommen, Jaap C. Schouten, Michel L. M. van der Stappen, Cor M. van den Bleek. Response characteristics of probe–transducer systems for pressure measurements in gas–solid fluidized beds: how to prevent pitfalls in dynamic pressure measurements. Powder Technology 1999;106(3):199-218 +Erratum
[19] Nijenhuis J, Korbee R, Lensselink J, Kiel JHA, van Ommen JR. A method for agglomeration detection and control in full-scale biomass fired fluidized beds. Chemical Engineering Science 2007;62(1-2):644-54
[20] śukowski W. The pressure pulses generated by the combustion of natural gas in bubbling fluidized beds. Combustion and Flame 2002;30(1-2):15-26
[21] Magnusson A, Rundqvist R, Almstedt AE, Johnsson F. Dual fibre optical probe measurements of solids volume fraction in a circulating fluidized bed. Powder Technology, Volume 151, Issues 1-3, 1 March 2005, Pages 19-26
[22] Sutton, CR, Chen JC. A local transient approach to monitoring fluidization quality in freely bubbling beds. Powder Technology 2008:180(3):296-306
[23] Martin MP, Turlier P, Bernard JR, Wild G. Gas and solid behavior in cracking circulating fluidized beds. Powder Technology 1992;70(3):249-258
[24] Häyrinen V, Hernberg R, Aho M. Demonstration of plasma excited atomic resonance line spectroscopy for on-line measurement of alkali metals in a 20 kW bubbling fluidized bed. Fuel 2004;83(7-8):791-797
[25] Rehmat AG, Patel JG; Inst. Gas Technology (IGTE); “Controlling and maintaining fluidised beds - under non-steady state conditions in ash agglomerating fluidised beds” Patent US4544375-A (1985)
[26] Davies CE, Fenton K. Pressure fluctuations in a fluidized bed: A potential route to the continuous estimation of particle size. IPENZ Transactions 1997;24(1):12-20
[27] Chirone R, Miccio F, Scala F. Mechanism and prediction of bed agglomeration during fluidized bed combustion of a biomass fuel: Effect of the reactor scale. Chemical Engineering Journal 2006;123(3):71-80
[28] Fuller TA, Flynn TJ, Daw CS, Halow JS. Interpretation of Pilot-Scale, Fluidized-Bed Behavior Using Chaotic Time Series Analysis. Proceedings of the 12th International FBC Conference 1993, Edited by L.N. Rubow, Vol.1, 141-155
[29] van Ommen JR, Schouten JC, van den Bleek CM. An early-warning-method for detecting bed agglomeration in fluidized bed combustors. In: Reuther RB, editor. Proceedings of the 15th international conference on fluidized bed combustion, Paper no. FBC99-0150. New York: ASME; 1999.
[30] van Ommen JR, Coppens MO, van den Bleek CM, Schouten JC. Early Warning of agglomeration in Fluidized Beds by Attractor Comparison. AIChE Journal 2000;46:2183-2197
[31] Diks C, van Zwet WR, Takens F, DeGoede J. Detecting the differences between delay vector distributions. Physical Review E 1996;53:2169-2176
31
Chapter 2
Agglomeration in fluidized beds at high temperatures: Mechanisms, Detection and Prevention
This chapter gives an extended overview of the open literature on mechanisms of the agglomeration process, methods to detect agglomeration and strategies to prevent and counteract agglomeration in fluidized beds. The focus lies on agglomeration at high temperatures, mainly in the area of solid energy conversion, but also relevant literature outside of this area is included. This chapter has been published as: Malte Bartels, Weigang Lin, John Nijenhuis, Freek Kapteijn, J Ruud van Ommen. Agglomeration in fluidized beds at high temperatures: Mechanisms, Detection and Prevention. Progress in Energy and Combustion Science 2008;34(5):633-666
Chapter 2
32
2.1. Abstract Fluidized-bed conversion of solid fuels is a well-established and widely used technology. Yet, operational problems are encountered in industrial practice. One of the most important problems is the occurrence of agglomeration at high temperature, meaning that bed particles adhere to each other to form larger entities (agglomerates). This process is often not recognized until sudden defluidization and often leads to a costly shutdown of the whole installation. In particular, the thermal conversion of certain biomass fuels, which is becoming increasingly popular, increases the risk of agglomeration. This paper critically reviews the current research status of this topic in terms of agglomeration mechanisms, detection and counteraction strategies. To understand the complex phenomenon of agglomeration in fluidized beds at high temperatures different areas are distinguished viz. hydrodynamics, chemical reaction mechanisms, particle interaction mechanisms and molecular cramming. Special emphasis is given to the detection of agglomeration. The range of detection methods is comprised of fuel ash analysis methods to predict potential agglomeration as well as analysis methods based on (on-line) process measurements, such as pressure and temperature. Finally, different methods to counteract agglomeration phenomena are presented; they comprise operational measures, utilization of additives, alternative bed materials and improved reactor design.
2.2 Introduction Fluidized bed conversion of solid fuels Fluidized beds are used for a variety of applications in the process industry, such as fluidized catalytic cracking (FCC) including catalyst generation and other strongly exothermal processes, drying, solid fuel conversion and gas-phase polymer production [1]. This review focuses on high-temperature processes, especially thermo-chemical solid fuel conversion carried out in fluidized beds. For an overview of the different thermo-chemical conversion routes (combustion, gasification, pyrolysis, liquefaction) as well as bio-chemical conversion routes (fermentation, anaerobic digestion) see e.g. [2]. Fluidized bed conversion of carbonaceous solid material (e.g. coal, biomass, etc.) at high temperatures is industrial practice to generate steam, electricity and hydrogen. The solid fuel is added to a fluidized bed of inert solid material, which acts as a heat reservoir. Silica sand is most commonly used as bed material. The actual amount of the fuel itself in the bed as compared to the inert bed material is relatively low, in the order of a few percent. The fluidized bed material ensures good mixing of the introduced fuel as well as the evolving heat. The homogeneous temperature distribution is one of the important advantages of fluidized beds over other reactor concepts. Depending on the process, heat can either be directly utilized, e.g. combustion combined with heat exchangers or a gas turbine (in case of a pressurized system), or the evolving gases can be processed, e.g. gasification combined with Fischer-Tropsch synthesis to produce liquid fuels.
Agglomeration in fluidized beds: Mechanisms, Detection and Prevention
33
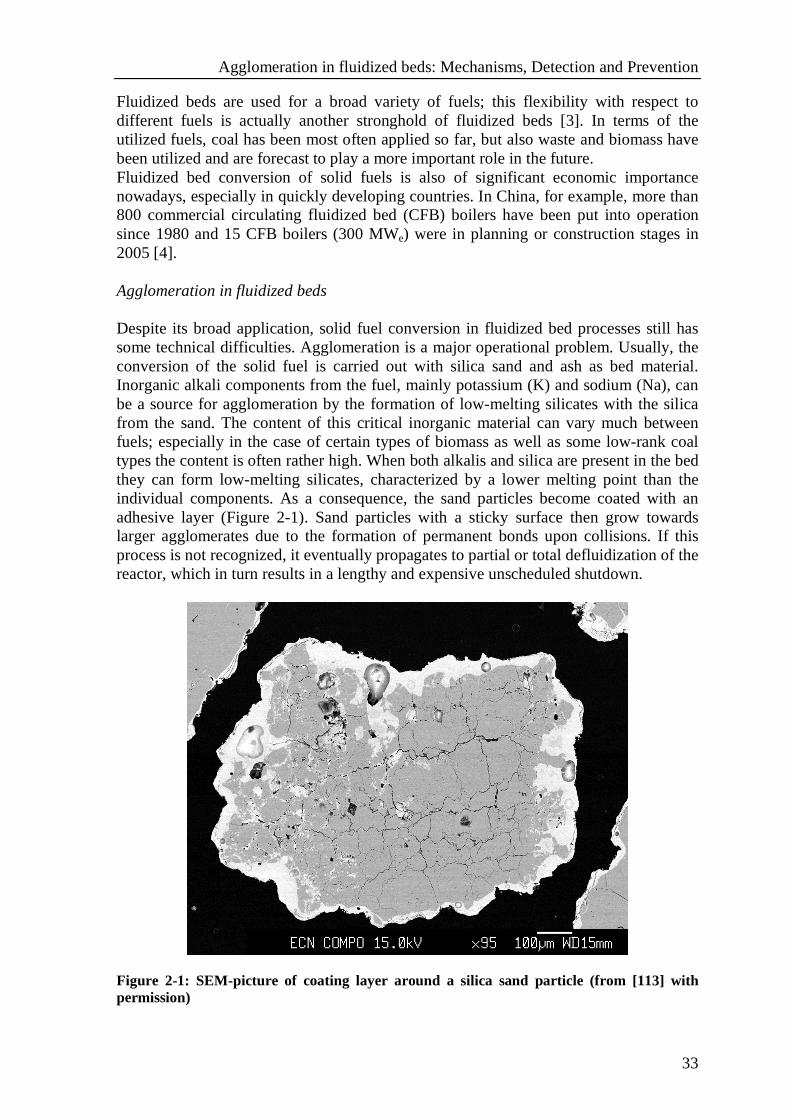
Fluidized beds are used for a broad variety of fuels; this flexibility with respect to different fuels is actually another stronghold of fluidized beds [3]. In terms of the utilized fuels, coal has been most often applied so far, but also waste and biomass have been utilized and are forecast to play a more important role in the future. Fluidized bed conversion of solid fuels is also of significant economic importance nowadays, especially in quickly developing countries. In China, for example, more than 800 commercial circulating fluidized bed (CFB) boilers have been put into operation since 1980 and 15 CFB boilers (300 MWe) were in planning or construction stages in 2005 [4]. Agglomeration in fluidized beds Despite its broad application, solid fuel conversion in fluidized bed processes still has some technical difficulties. Agglomeration is a major operational problem. Usually, the conversion of the solid fuel is carried out with silica sand and ash as bed material. Inorganic alkali components from the fuel, mainly potassium (K) and sodium (Na), can be a source for agglomeration by the formation of low-melting silicates with the silica from the sand. The content of this critical inorganic material can vary much between fuels; especially in the case of certain types of biomass as well as some low-rank coal types the content is often rather high. When both alkalis and silica are present in the bed they can form low-melting silicates, characterized by a lower melting point than the individual components. As a consequence, the sand particles become coated with an adhesive layer (Figure 2-1). Sand particles with a sticky surface then grow towards larger agglomerates due to the formation of permanent bonds upon collisions. If this process is not recognized, it eventually propagates to partial or total defluidization of the reactor, which in turn results in a lengthy and expensive unscheduled shutdown.
Figure 2-1: SEM-picture of coating layer around a silica sand particle (from [113] with permission)
Chapter 2
34
The relevance of biomass fuels The world is currently facing an ever-increasing energy demand and together with a largely fossil fuel-based economy this results a greenhouse effect due to increasing CO2-emissions. Moreover, political instabilities and economical constraints result in increasing energy prices and more turbulent energy markets. Various forms of biomass are already used as a CO2-neutral energy source, despite their generally lower energy density [2,5]. Although up until now biomass is mainly used for cooking and heating in developing countries, a large share of increased biomass usage is anticipated to take place in large-scale heat and power generation, mainly driven by strong government policies (e.g. [6]). Here, one of the fastest growing conversion routes for biomass fuels is the co-combustion in large-scale fluidized bed installations [7], having the advantage that existing facilities can be utilized. Relatively low co-firing shares, in the range of up to about 10% of thermal input, are now commonly utilized. If that share increases and/or more “difficult” fuels should be used, agglomeration phenomena become more likely. Structure of this review This review paper presents an overview of the research on mechanisms of agglomeration in high-temperature fluidized bed processes as well as its detection and counteraction strategies. The focus lies on the industrial high-temperature conversion (combustion, gasification, pyrolysis) of solid carbonaceous fuels. This review starts with an overview of research in the area of the mechanisms of agglomeration. Subsequently, the existing literature on the detection of agglomeration is categorized into a few generalized groups and critically reviewed. Note that in terms of agglomeration detection also methods are reviewed, that are not directly applied to high-temperature agglomeration, but that are more generally concerned with the characterization of fluidized bed hydrodynamics. Finally, different strategies for the counteraction of agglomeration are reviewed. A visual outline of this review is shown in Figure 2-2 and Figure 2-3.
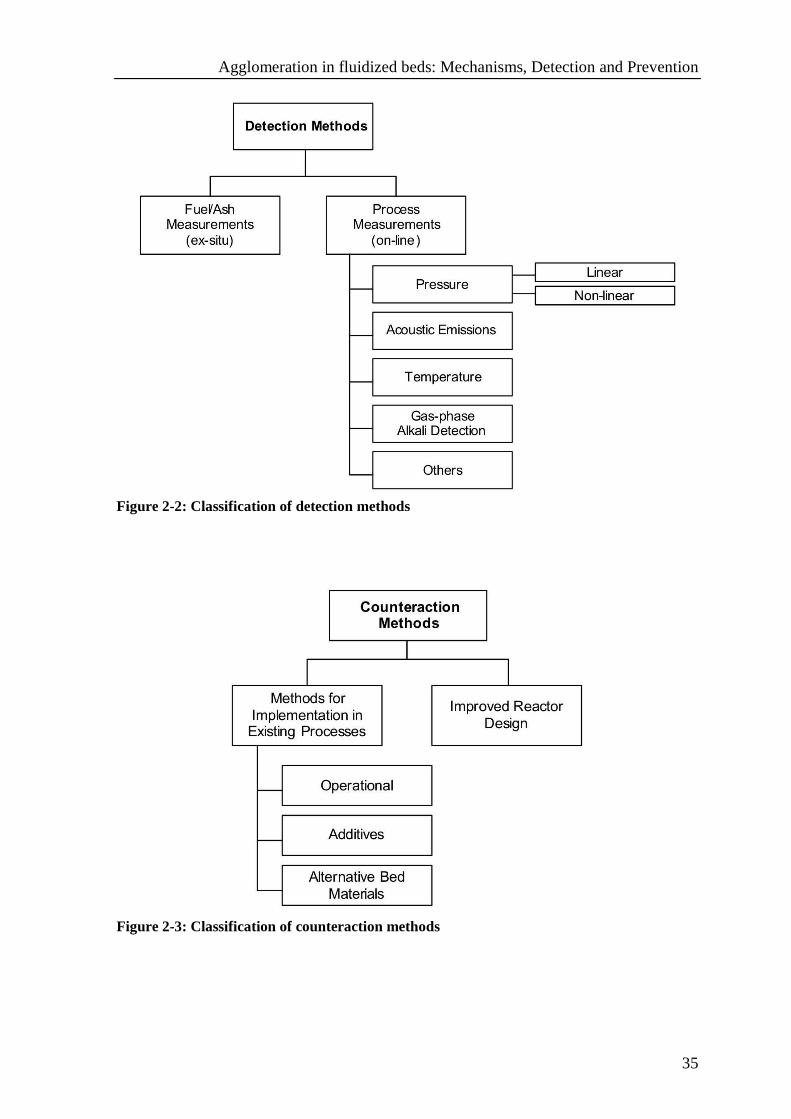
Agglomeration in fluidized beds: Mechanisms, Detection and Prevention
35
Figure 2-2: Classification of detection methods
Figure 2-3: Classification of counteraction methods
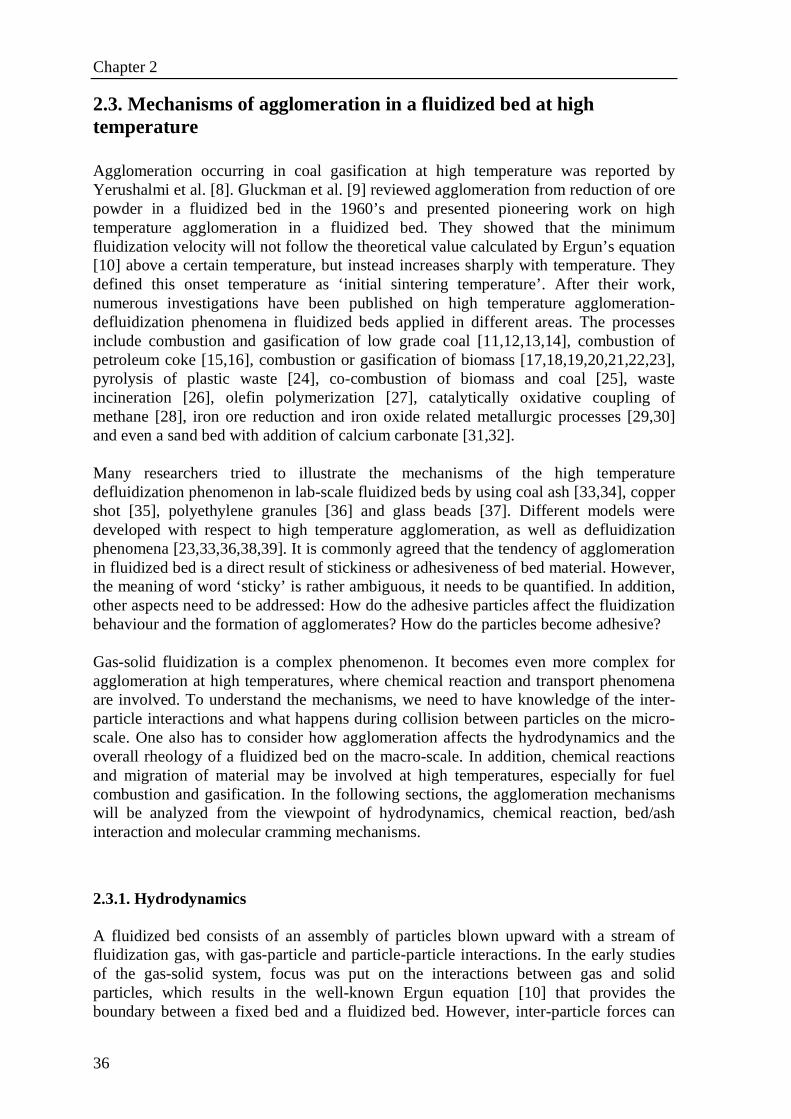
Chapter 2
36
2.3. Mechanisms of agglomeration in a fluidized bed at high temperature Agglomeration occurring in coal gasification at high temperature was reported by Yerushalmi et al. [8]. Gluckman et al. [9] reviewed agglomeration from reduction of ore powder in a fluidized bed in the 1960’s and presented pioneering work on high temperature agglomeration in a fluidized bed. They showed that the minimum fluidization velocity will not follow the theoretical value calculated by Ergun’s equation [10] above a certain temperature, but instead increases sharply with temperature. They defined this onset temperature as ‘initial sintering temperature’. After their work, numerous investigations have been published on high temperature agglomeration-defluidization phenomena in fluidized beds applied in different areas. The processes include combustion and gasification of low grade coal [11,12,13,14], combustion of petroleum coke [15,16], combustion or gasification of biomass [17,18,19,20,21,22,23], pyrolysis of plastic waste [24], co-combustion of biomass and coal [25], waste incineration [26], olefin polymerization [27], catalytically oxidative coupling of methane [28], iron ore reduction and iron oxide related metallurgic processes [29,30] and even a sand bed with addition of calcium carbonate [31,32]. Many researchers tried to illustrate the mechanisms of the high temperature defluidization phenomenon in lab-scale fluidized beds by using coal ash [33,34], copper shot [35], polyethylene granules [36] and glass beads [37]. Different models were developed with respect to high temperature agglomeration, as well as defluidization phenomena [23,33,36,38,39]. It is commonly agreed that the tendency of agglomeration in fluidized bed is a direct result of stickiness or adhesiveness of bed material. However, the meaning of word ‘sticky’ is rather ambiguous, it needs to be quantified. In addition, other aspects need to be addressed: How do the adhesive particles affect the fluidization behaviour and the formation of agglomerates? How do the particles become adhesive? Gas-solid fluidization is a complex phenomenon. It becomes even more complex for agglomeration at high temperatures, where chemical reaction and transport phenomena are involved. To understand the mechanisms, we need to have knowledge of the inter-particle interactions and what happens during collision between particles on the micro-scale. One also has to consider how agglomeration affects the hydrodynamics and the overall rheology of a fluidized bed on the macro-scale. In addition, chemical reactions and migration of material may be involved at high temperatures, especially for fuel combustion and gasification. In the following sections, the agglomeration mechanisms will be analyzed from the viewpoint of hydrodynamics, chemical reaction, bed/ash interaction and molecular cramming mechanisms.
2.3.1. Hydrodynamics A fluidized bed consists of an assembly of particles blown upward with a stream of fluidization gas, with gas-particle and particle-particle interactions. In the early studies of the gas-solid system, focus was put on the interactions between gas and solid particles, which results in the well-known Ergun equation [10] that provides the boundary between a fixed bed and a fluidized bed. However, inter-particle forces can
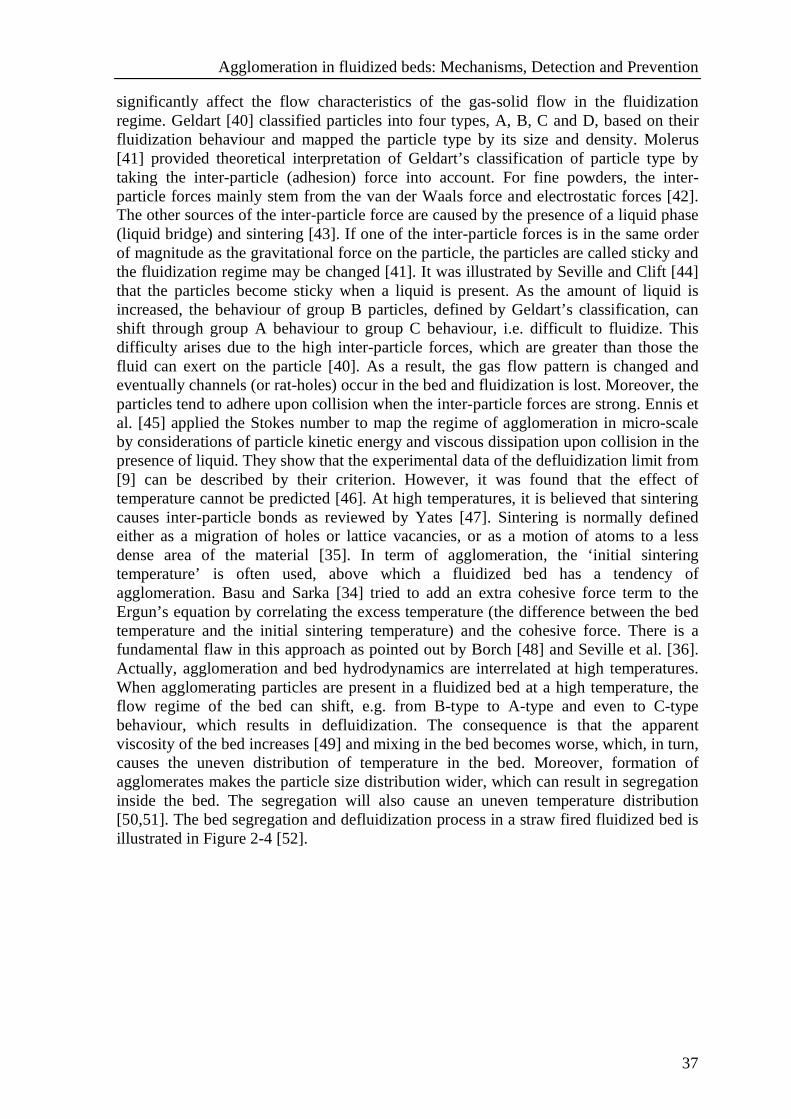
Agglomeration in fluidized beds: Mechanisms, Detection and Prevention
37
significantly affect the flow characteristics of the gas-solid flow in the fluidization regime. Geldart [40] classified particles into four types, A, B, C and D, based on their fluidization behaviour and mapped the particle type by its size and density. Molerus [41] provided theoretical interpretation of Geldart’s classification of particle type by taking the inter-particle (adhesion) force into account. For fine powders, the inter-particle forces mainly stem from the van der Waals force and electrostatic forces [42]. The other sources of the inter-particle force are caused by the presence of a liquid phase (liquid bridge) and sintering [43]. If one of the inter-particle forces is in the same order of magnitude as the gravitational force on the particle, the particles are called sticky and the fluidization regime may be changed [41]. It was illustrated by Seville and Clift [44] that the particles become sticky when a liquid is present. As the amount of liquid is increased, the behaviour of group B particles, defined by Geldart’s classification, can shift through group A behaviour to group C behaviour, i.e. difficult to fluidize. This difficulty arises due to the high inter-particle forces, which are greater than those the fluid can exert on the particle [40]. As a result, the gas flow pattern is changed and eventually channels (or rat-holes) occur in the bed and fluidization is lost. Moreover, the particles tend to adhere upon collision when the inter-particle forces are strong. Ennis et al. [45] applied the Stokes number to map the regime of agglomeration in micro-scale by considerations of particle kinetic energy and viscous dissipation upon collision in the presence of liquid. They show that the experimental data of the defluidization limit from [9] can be described by their criterion. However, it was found that the effect of temperature cannot be predicted [46]. At high temperatures, it is believed that sintering causes inter-particle bonds as reviewed by Yates [47]. Sintering is normally defined either as a migration of holes or lattice vacancies, or as a motion of atoms to a less dense area of the material [35]. In term of agglomeration, the ‘initial sintering temperature’ is often used, above which a fluidized bed has a tendency of agglomeration. Basu and Sarka [34] tried to add an extra cohesive force term to the Ergun’s equation by correlating the excess temperature (the difference between the bed temperature and the initial sintering temperature) and the cohesive force. There is a fundamental flaw in this approach as pointed out by Borch [48] and Seville et al. [36]. Actually, agglomeration and bed hydrodynamics are interrelated at high temperatures. When agglomerating particles are present in a fluidized bed at a high temperature, the flow regime of the bed can shift, e.g. from B-type to A-type and even to C-type behaviour, which results in defluidization. The consequence is that the apparent viscosity of the bed increases [49] and mixing in the bed becomes worse, which, in turn, causes the uneven distribution of temperature in the bed. Moreover, formation of agglomerates makes the particle size distribution wider, which can result in segregation inside the bed. The segregation will also cause an uneven temperature distribution [50,51]. The bed segregation and defluidization process in a straw fired fluidized bed is illustrated in Figure 2-4 [52].
Chapter 2
38
Figure 2-4: Schematic bed segregation and defluidization process in a straw fired fluidized bed (adapted from [52]) 2.3.2. Mechanisms of chemical reactions The majority of the agglomeration incidents at high temperature is induced by chemical reactions, from which cohesive particles are produced. The typical examples are agglomeration in fluidized bed combustion or gasification of coal or biomass. It is well accepted that agglomeration in fluidized bed combustors or gasifiers is caused by generation of ash, which has a low melting temperature and interacts with bed materials. Thus, it is important to understand the ash transformation during combustion or gasification in a fluidized bed. The formation of ash with a low melting point is fuel dependent. Normally, ash from the fuels with a high content of alkali (K and Na) has a lower melting point. For example, in combustion of the low quality, high sodium coal, a molten phase coating rich in sodium, calcium and sulphur was observed [14,53]. Anthony et al. [54,55] examined the agglomerates in a petroleum coke fired CFB boiler and revealed that both vanadium in the pet coke as well as calcium carbonate and calcium sulphate contribute to formation of the agglomerates. The ash characteristics of biomass differ from those of coal. Though the compositions vary with plant types and the growth conditions, biomass ashes are normally dominated by silicon, calcium and potassium and contain little aluminium [56]. Potassium is dispersed in biomass in different forms, e.g. organometallics and salts, while silicon occurs primarily as hydrated silica grains. During combustion, potassium is likely to be volatilized with organic species. It may be released as KCl if chlorine is present in the fuel. Without chlorine, hydroxide, oxide, sulphate or carbonate may be formed [57]. Olanders and Steenari [56] found that alkali and alkaline earth metal ions associate primarily with sulphate, carbonate as well as chloride ions during ash formation. Knudsen et al. [58] showed that the presence of silica in herbaceous biomass can significantly affect the partition of potassium released to gas phase and fixed in the solid phase.
Agglomeration in fluidized beds: Mechanisms, Detection and Prevention
39
Fuel ash interactions occur under normal fluidized bed combustion or gasification conditions and include the formation of molten silicates from sodium-, potassium-, calcium-, and sulphate- components and, possibly, solid-solid reactions [59]. Alkali containing compounds play a central role in both agglomeration processes in a fluidized bed. The mobility of alkali material is defined as its ability to come in physical contact with other materials [60]. Potassium is the dominant source of alkali in most biomass fuels. It has been observed in biomass (especially the herbaceous biomass) fired fluidize beds that the bond of agglomerates is mainly composed of silicon and potassium, sometimes with a small amount of calcium [18,20,23,61], indicating that compounds consisting of K2O-SiO2 and/or K2O-CaO-SiO2 are formed. The eutectic temperature of K2O-SiO2 is as low as 770°C, and that of K2O-CaO-SiO2 is even lower [62], which is also lower than typical fluidized bed combustion temperatures of 800-850°C. The formation of molten silicates causes the particles to be adhesive. When alumina-rich compounds are present, the solid-solid reactions may result in formation of alkali-aluminium silicates (K2O-Al2O3-SiO2), which have a much higher melting temperature. Gas-solid reactions may alter the composition of ash. For example, sulfur dioxide present in the gas phase at relatively low temperatures (<800°C) will react with potassium forming K2SO4, which has a higher melting temperature than the eutectics of silicates [63]. In addition, gas-gas reactions may change the gas phase composition and route of formation of sub-micron particles. A typical example is the reaction [64]:
KCl (g) + SO2 (g) +H2O(g) � K2SO4(g) + HCl (g)
Reduced amounts of gas phase potassium chloride may decrease the probability of depositing potassium compounds on the sand particles by condensation. 2.3.3. Mechanisms of interactions between ash and bed materials Normally, quartz sand is used as bed material. Ash acts as glue for the formation of agglomerates. It is important to understand how the ash components are transferred to the sand particle surface. Different mechanisms on the mechanisms of interactions between ash and bed materials are proposed, which are briefly described here. Öhman et al. [20] proposed a three-step agglomeration mechanism based on experimental investigations. Step 1: Ash is deposited on the surface of the bed material via a combination of attachment of small particles on the bed particle surface, condensation of gaseous alkali species and chemical reaction of those alkalis on the bed material surface. Step 2: As the continuous deposition on the bed particles proceeds, the inner layer of the coating is probably homogenized and strengthened via sintering. Step 3: Agglomeration of covered particles, controlled by adhesive inter-particle forces. Lin et al. [23] proposed that the onset of agglomeration takes place around burning char particles based on batch combustion experiments in a lab-scale fluidized bed. During char combustion, the temperature of the burning char particles is higher than that of the bed, causing the inorganic matters in the char particles to melt and ooze out on the surfaces. This makes the char particles very adhesive and the sticky char particles capture sand particles upon collision, forming agglomerates and coating the sand
Chapter 2
40
surfaces with the sticky melts. When char combustion completes, the temperature of the agglomerates initiated from fuel particles gradually approaches the bed temperature and a little more amorphous phase may be formed. Visser et al. [65] proposed two different types of agglomeration formation: melt-induced agglomeration and coating-induced agglomeration. In the “melt-induced” agglomeration process molten ash particles between colliding particles act as a glue to bind them together. The “coating-induced” agglomeration is stated to be commonly observed in industrial scale fluidized bed combustors. In this case, a uniform coating layer is slowly generated; it originates from accumulating deposits from gas phase inorganic compounds on the particle surface. At certain critical conditions, neck formation can occur during the collision of those coated particles and agglomeration is initiated. Since the agglomeration process is strongly influenced by temperature, special attention should be given to local excess temperatures. It has been measured in the transport zone of a CFB that burning coal particles can have rather high excess temperatures of up to 600K at relatively low average O2-concentrations of about 6% [66]. This agrees with theoretical considerations, assuming that oxygen is distributed very non-uniformly over the bed cross-section and fine char particles following the gas flow where they can burn in regions with relatively high oxygen concentrations. The excess temperature generally increases with smaller particle size; model calculations show that the temperatures measured in this work could be exhibited by particles of 0.3–3 mm in size. Manzoori and Agarwal [67] have observed that the (average) bed temperature has a very strong effect on the bed agglomeration rate, whereas the temperature influence was comparable moderate for the rate of ash deposition on bed particles. They also have shown that the rate of ash deposition is dominated by physical and not by chemical processes. The ash deposition on bed particles will therefore be dominated by the fuel particle temperature, whereas the agglomeration of ash-covered bed particles will be dominated by the average bed temperature. Chirone and co-workers [68] also confirmed the presence of ash-layered bed material at an average bed temperature below the potassium-silicates melting points. They expand on attrition of the fuel particles and propose a mechanism in which small char particles detach from the coarse char particles. The temperature from those fines is then quickly rising, possibly beyond the melting temperature of silica-potassium compounds. Subsequently, they collide with bed particles and form a softened or fluid phase. The deposit thickness grows with continued adhesion of fine material, but only at temperatures beyond the ash-melting range potassium-silicates are formed, which eventually lead to agglomeration and defluidization. From the above considerations it therefore appears that the fuel particle temperature is clearly an important additional parameter besides the average bed temperature; the fuel particle temperature largely depends on the combustion rate, radiative properties and heat/mass transfer in the boundary layer. Ash transformation and formation of agglomerates are schematically summarized in Figure 2-5 ([53]).
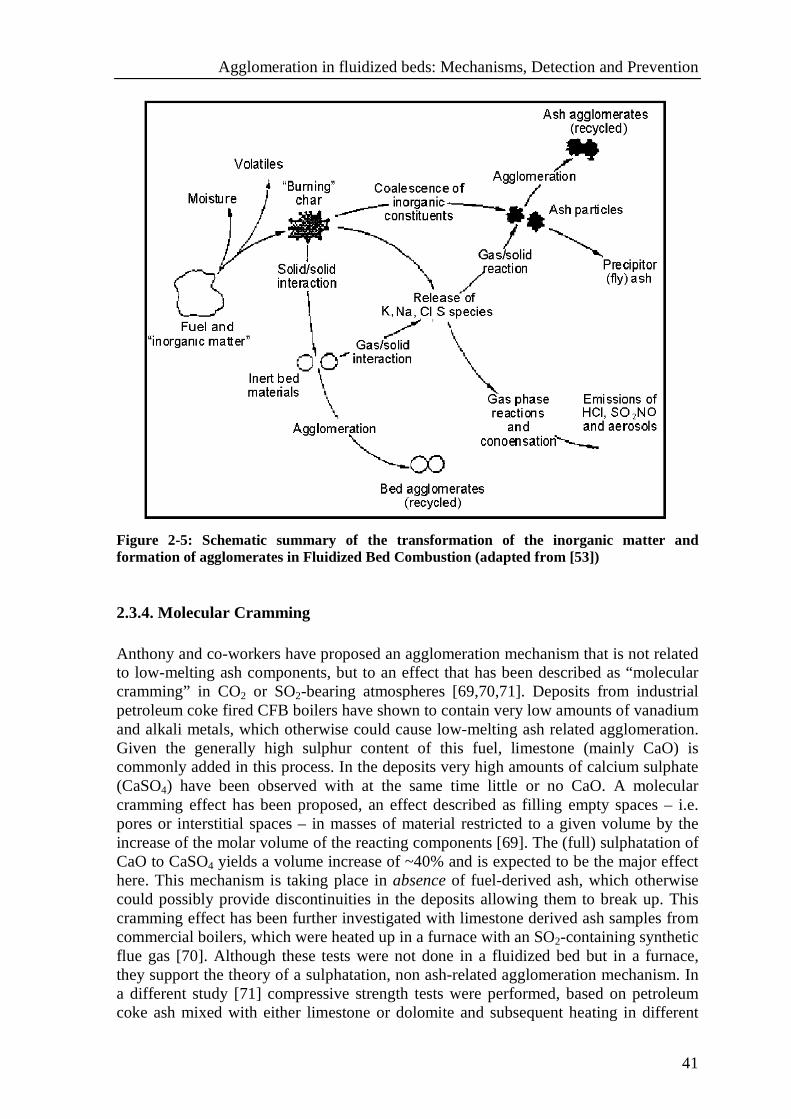
Agglomeration in fluidized beds: Mechanisms, Detection and Prevention
41
Figure 2-5: Schematic summary of the transformation of the inorganic matter and formation of agglomerates in Fluidized Bed Combustion (adapted from [53]) 2.3.4. Molecular Cramming Anthony and co-workers have proposed an agglomeration mechanism that is not related to low-melting ash components, but to an effect that has been described as “molecular cramming” in CO2 or SO2-bearing atmospheres [69,70,71]. Deposits from industrial petroleum coke fired CFB boilers have shown to contain very low amounts of vanadium and alkali metals, which otherwise could cause low-melting ash related agglomeration. Given the generally high sulphur content of this fuel, limestone (mainly CaO) is commonly added in this process. In the deposits very high amounts of calcium sulphate (CaSO4) have been observed with at the same time little or no CaO. A molecular cramming effect has been proposed, an effect described as filling empty spaces – i.e. pores or interstitial spaces – in masses of material restricted to a given volume by the increase of the molar volume of the reacting components [69]. The (full) sulphatation of CaO to CaSO4 yields a volume increase of ~40% and is expected to be the major effect here. This mechanism is taking place in absence of fuel-derived ash, which otherwise could possibly provide discontinuities in the deposits allowing them to break up. This cramming effect has been further investigated with limestone derived ash samples from commercial boilers, which were heated up in a furnace with an SO2-containing synthetic flue gas [70]. Although these tests were not done in a fluidized bed but in a furnace, they support the theory of a sulphatation, non ash-related agglomeration mechanism. In a different study [71] compressive strength tests were performed, based on petroleum coke ash mixed with either limestone or dolomite and subsequent heating in different
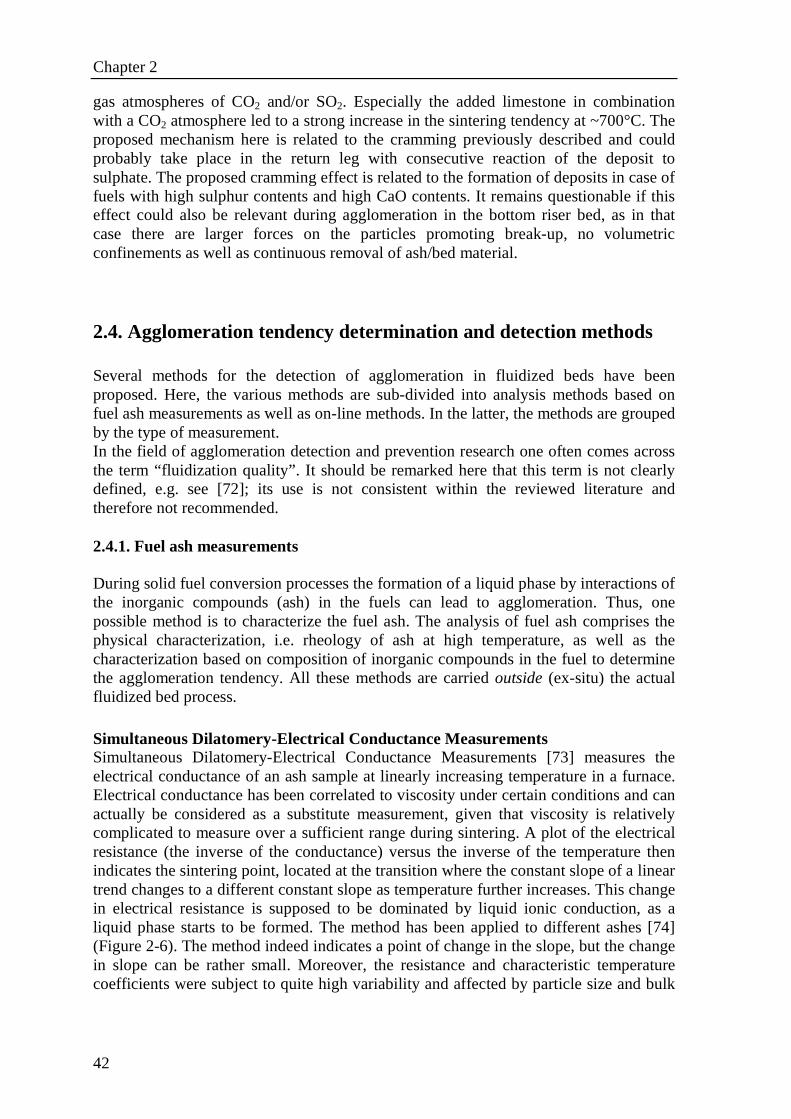
Chapter 2
42
gas atmospheres of CO2 and/or SO2. Especially the added limestone in combination with a CO2 atmosphere led to a strong increase in the sintering tendency at ~700°C. The proposed mechanism here is related to the cramming previously described and could probably take place in the return leg with consecutive reaction of the deposit to sulphate. The proposed cramming effect is related to the formation of deposits in case of fuels with high sulphur contents and high CaO contents. It remains questionable if this effect could also be relevant during agglomeration in the bottom riser bed, as in that case there are larger forces on the particles promoting break-up, no volumetric confinements as well as continuous removal of ash/bed material.
2.4. Agglomeration tendency determination and detection methods Several methods for the detection of agglomeration in fluidized beds have been proposed. Here, the various methods are sub-divided into analysis methods based on fuel ash measurements as well as on-line methods. In the latter, the methods are grouped by the type of measurement. In the field of agglomeration detection and prevention research one often comes across the term “fluidization quality”. It should be remarked here that this term is not clearly defined, e.g. see [72]; its use is not consistent within the reviewed literature and therefore not recommended. 2.4.1. Fuel ash measurements During solid fuel conversion processes the formation of a liquid phase by interactions of the inorganic compounds (ash) in the fuels can lead to agglomeration. Thus, one possible method is to characterize the fuel ash. The analysis of fuel ash comprises the physical characterization, i.e. rheology of ash at high temperature, as well as the characterization based on composition of inorganic compounds in the fuel to determine the agglomeration tendency. All these methods are carried outside (ex-situ) the actual fluidized bed process. Simultaneous Dilatomery-Electrical Conductance Measurements Simultaneous Dilatomery-Electrical Conductance Measurements [73] measures the electrical conductance of an ash sample at linearly increasing temperature in a furnace. Electrical conductance has been correlated to viscosity under certain conditions and can actually be considered as a substitute measurement, given that viscosity is relatively complicated to measure over a sufficient range during sintering. A plot of the electrical resistance (the inverse of the conductance) versus the inverse of the temperature then indicates the sintering point, located at the transition where the constant slope of a linear trend changes to a different constant slope as temperature further increases. This change in electrical resistance is supposed to be dominated by liquid ionic conduction, as a liquid phase starts to be formed. The method has been applied to different ashes [74] (Figure 2-6). The method indeed indicates a point of change in the slope, but the change in slope can be rather small. Moreover, the resistance and characteristic temperature coefficients were subject to quite high variability and affected by particle size and bulk
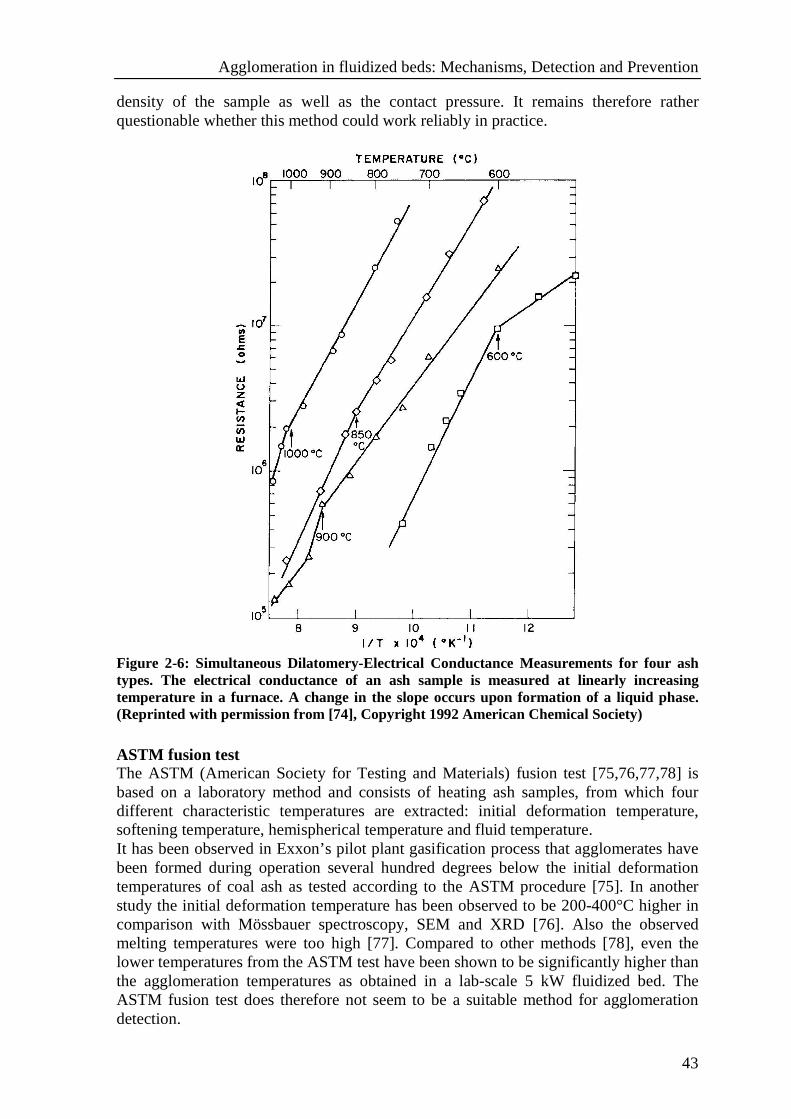
Agglomeration in fluidized beds: Mechanisms, Detection and Prevention
43
density of the sample as well as the contact pressure. It remains therefore rather questionable whether this method could work reliably in practice.
Figure 2-6: Simultaneous Dilatomery-Electrical Conductance Measurements for four ash types. The electrical conductance of an ash sample is measured at linearly increasing temperature in a furnace. A change in the slope occurs upon formation of a liquid phase. (Reprinted with permission from [74], Copyright 1992 American Chemical Society) ASTM fusion test The ASTM (American Society for Testing and Materials) fusion test [75,76,77,78] is based on a laboratory method and consists of heating ash samples, from which four different characteristic temperatures are extracted: initial deformation temperature, softening temperature, hemispherical temperature and fluid temperature. It has been observed in Exxon’s pilot plant gasification process that agglomerates have been formed during operation several hundred degrees below the initial deformation temperatures of coal ash as tested according to the ASTM procedure [75]. In another study the initial deformation temperature has been observed to be 200-400°C higher in comparison with Mössbauer spectroscopy, SEM and XRD [76]. Also the observed melting temperatures were too high [77]. Compared to other methods [78], even the lower temperatures from the ASTM test have been shown to be significantly higher than the agglomeration temperatures as obtained in a lab-scale 5 kW fluidized bed. The ASTM fusion test does therefore not seem to be a suitable method for agglomeration detection.
Chapter 2
44
Dilatometry or TMA (Thermal Mechanical Analysis) Dilatometry or TMA of an ash sample [79,80] comprises the determination of characteristic agglomeration temperatures and is based on measurements of the thermal contraction/expansion of an ash sample. The sample is placed in a cell and a defined force is applied onto the sample with a piston. Simultaneously, the sample is heated at a defined heating rate. The change in length of the sample is measured as a function of temperature, i.e. the thermal expansion curve. The sample first expands due to thermal expansion, then levels off (expansion slope equals zero) and decreases again. As a characteristic temperature, the “initial sintering temperature” is defined as the point in the diagram where the expansion curve levels off and then sharply decreases. Physically, this levelling off refers to the balancing of thermal expansion with contraction due to sintering effects. The heating rate is of crucial importance in this method. A high heating rate increases the initial sintering temperature; at low heating rates, this temperature evolves to a constant value. The effect of the applied force is somewhat ambiguous, but much less significant as compared to the heating rate. The applicability of this method is reported being quite good for glass-like and non-ionic materials [79], although ionic salts, relevant for fuel conversion, behaved somewhat irregular. A combination of those different materials will exhibit a complex behaviour in this regard and the reliability of the method therefore remains unsure. Moreover, determining of the actual sintering temperature with this method can also be ambiguous, as has been shown with titanium dioxide ore. For a spouting lab-scale fluidized bed the predicted initial sintering temperature corresponds well to the point where the minimum spouting velocity of the bed changes from being constant to a linear increase as a function of temperature [80]. Defluidization, however, has not been observed in this work. In light of the actual agglomeration process one could question whether the actual bed material would not be more appropriate for the analysis instead of the pure ash samples used for the analysis in this case. Ash-coated sand particles, however, were considered not appropriate for this method due to the transition of the silica sand from α-quartz to β-quartz at 573°C. The effect also results in a thermal expansion and thus completely masks the contribution of the ash in this temperature range, as shown in Figure 2-7. At least for silica sand as bed material it therefore remains rather questionable whether this method could be successfully applied.
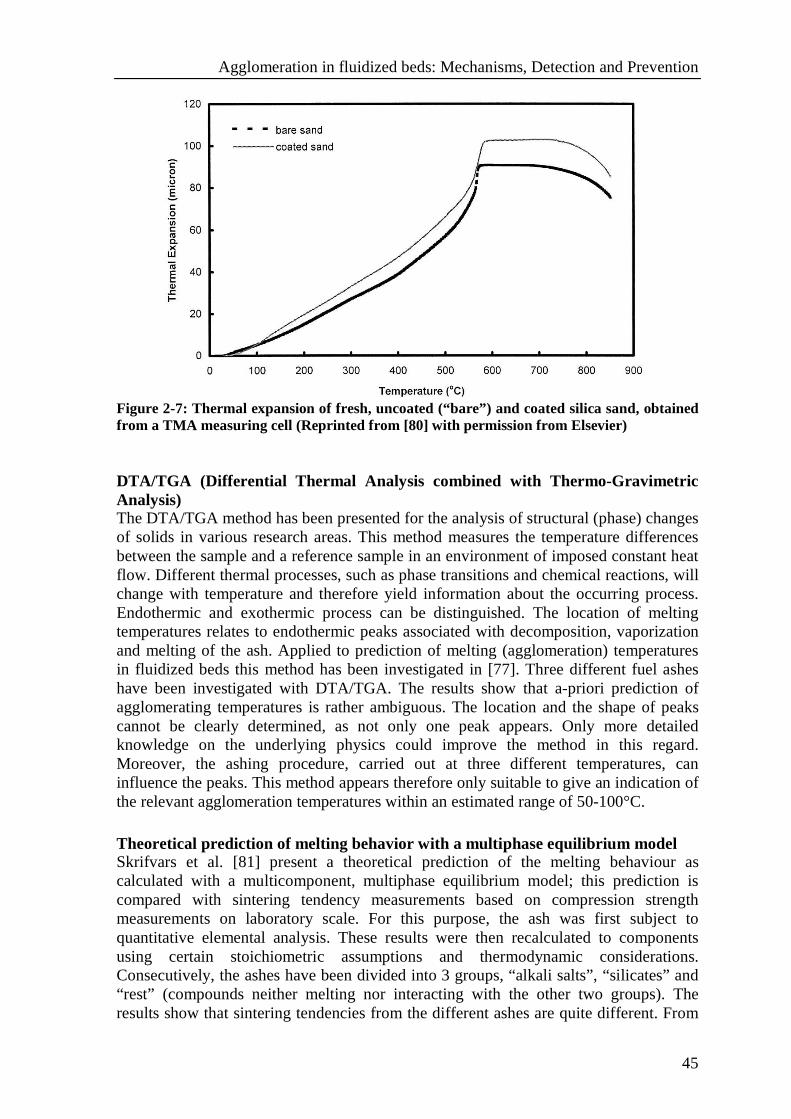
Agglomeration in fluidized beds: Mechanisms, Detection and Prevention
45
Figure 2-7: Thermal expansion of fresh, uncoated (“bare”) and coated silica sand, obtained from a TMA measuring cell (Reprinted from [80] with permission from Elsevier) DTA/TGA (Differential Thermal Analysis combined wit h Thermo-Gravimetric Analysis) The DTA/TGA method has been presented for the analysis of structural (phase) changes of solids in various research areas. This method measures the temperature differences between the sample and a reference sample in an environment of imposed constant heat flow. Different thermal processes, such as phase transitions and chemical reactions, will change with temperature and therefore yield information about the occurring process. Endothermic and exothermic process can be distinguished. The location of melting temperatures relates to endothermic peaks associated with decomposition, vaporization and melting of the ash. Applied to prediction of melting (agglomeration) temperatures in fluidized beds this method has been investigated in [77]. Three different fuel ashes have been investigated with DTA/TGA. The results show that a-priori prediction of agglomerating temperatures is rather ambiguous. The location and the shape of peaks cannot be clearly determined, as not only one peak appears. Only more detailed knowledge on the underlying physics could improve the method in this regard. Moreover, the ashing procedure, carried out at three different temperatures, can influence the peaks. This method appears therefore only suitable to give an indication of the relevant agglomeration temperatures within an estimated range of 50-100°C. Theoretical prediction of melting behavior with a multiphase equilibrium model Skrifvars et al. [81] present a theoretical prediction of the melting behaviour as calculated with a multicomponent, multiphase equilibrium model; this prediction is compared with sintering tendency measurements based on compression strength measurements on laboratory scale. For this purpose, the ash was first subject to quantitative elemental analysis. These results were then recalculated to components using certain stoichiometric assumptions and thermodynamic considerations. Consecutively, the ashes have been divided into 3 groups, “alkali salts”, “silicates” and “rest” (compounds neither melting nor interacting with the other two groups). The results show that sintering tendencies from the different ashes are quite different. From
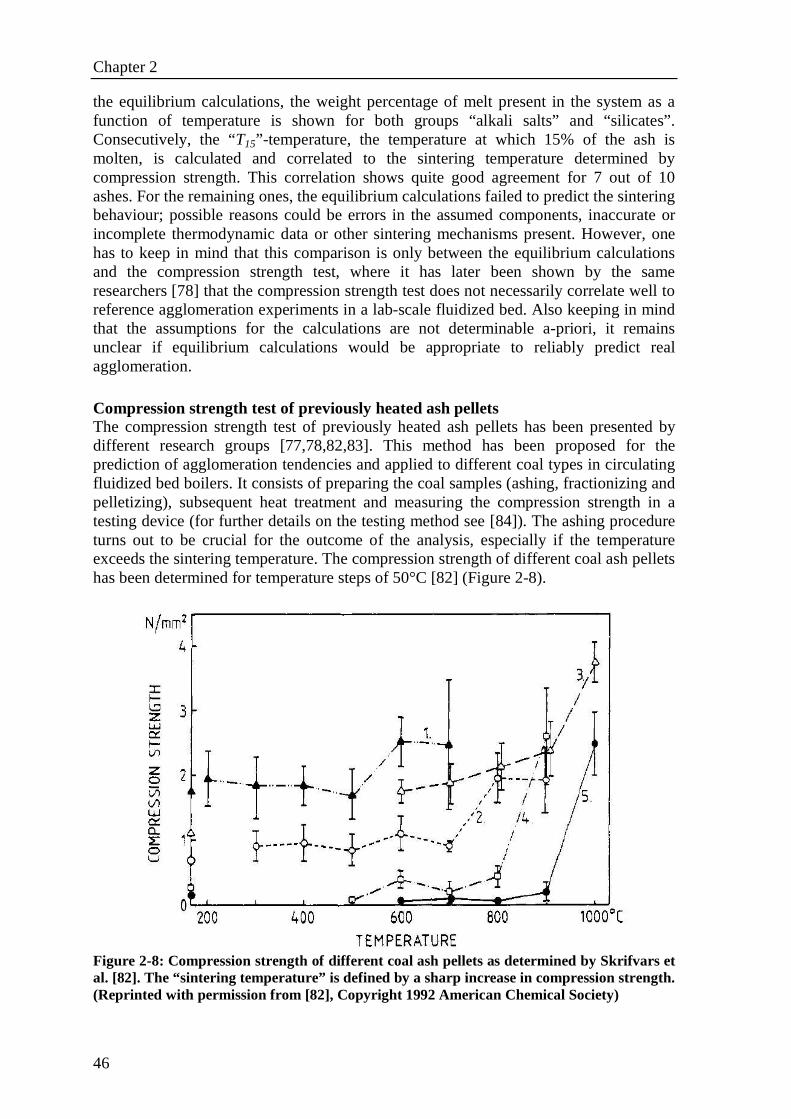
Chapter 2
46
the equilibrium calculations, the weight percentage of melt present in the system as a function of temperature is shown for both groups “alkali salts” and “silicates”. Consecutively, the “T15”-temperature, the temperature at which 15% of the ash is molten, is calculated and correlated to the sintering temperature determined by compression strength. This correlation shows quite good agreement for 7 out of 10 ashes. For the remaining ones, the equilibrium calculations failed to predict the sintering behaviour; possible reasons could be errors in the assumed components, inaccurate or incomplete thermodynamic data or other sintering mechanisms present. However, one has to keep in mind that this comparison is only between the equilibrium calculations and the compression strength test, where it has later been shown by the same researchers [78] that the compression strength test does not necessarily correlate well to reference agglomeration experiments in a lab-scale fluidized bed. Also keeping in mind that the assumptions for the calculations are not determinable a-priori, it remains unclear if equilibrium calculations would be appropriate to reliably predict real agglomeration. Compression strength test of previously heated ash pellets The compression strength test of previously heated ash pellets has been presented by different research groups [77,78,82,83]. This method has been proposed for the prediction of agglomeration tendencies and applied to different coal types in circulating fluidized bed boilers. It consists of preparing the coal samples (ashing, fractionizing and pelletizing), subsequent heat treatment and measuring the compression strength in a testing device (for further details on the testing method see [84]). The ashing procedure turns out to be crucial for the outcome of the analysis, especially if the temperature exceeds the sintering temperature. The compression strength of different coal ash pellets has been determined for temperature steps of 50°C [82] (Figure 2-8).
Figure 2-8: Compression strength of different coal ash pellets as determined by Skrifvars et al. [82]. The “sintering temperature” is defined by a sharp increase in compression strength. (Reprinted with permission from [82], Copyright 1992 American Chemical Society)
Agglomeration in fluidized beds: Mechanisms, Detection and Prevention
47
The point where the compression strength values deviate from their baseline, characterized by a relatively sharp increase, has been taken as the “sintering temperature”. Furthermore, the results from this method have been compared with operating experiences in pilot-scale furnaces and some in full-scale CFBs. Although not reported in detail, the qualitative sintering tendencies of the 5 different coal types agreed with the results from the compression strength tests. Temperatures and conditions where agglomeration has been observed in practice are neither reported for the utilized coal types, nor how reproducible this behavior is; it is therefore not clear how reliable this derived “agglomeration temperature” is. Van der Drift et al. [77] reported that compression strength measurements can give an indication of the temperature where agglomeration starts to occur. However, in certain cases problems were encountered, such as a strange swelling behavior of straw pellets during the heat treatment, which rendered the analysis impossible. The method of “Sintering temperature” determination from the compression strength analysis [78] is also based on compression strength measurements. It refers to the temperature at which the first clear increase in compression strength as compared to the base case value is observed. The base case values refer to the compression strength at much lower temperatures, where no agglomeration effects are assumed to occur. For five different fuels the sintering temperature is correlated to the agglomeration temperature from lab-scale fluidized bed combustion experiments (5 kW fluidized bed with 10 cm inner bed diameter) and is in all cases underestimated in the range of approx. 10-150°C. In addition, the authors show that by defining the agglomeration temperature by the point where the ash pellets reach a compression strength of 3 N/mm2, the prediction significantly improves. This adaptation to the method is motivated by the fact that a certain strength would have to be developed before particles would actually agglomerate. Although this adaptation is quite successful, it is not clear why the value of 3 N/mm2 is chosen. Despite looking very promising in this specific study, it remains questionable if the method would also successfully apply in other circumstances, e.g. different fuels, bed scales or gas velocities. The method of “compression of previously heated ash pellets” [83] can also be used to evaluate the compression strength, in this case biomass pellets. 6 mm pellets were prepared in a swing press at different temperatures. The samples were then cooled and the compression strength was determined utilizing a balance-like device, which compresses the samples with a constant force. This method does not properly predict the sintering behaviour. “Yield stress” analysis The “Yield stress” analysis [85] applies a high-temperature cone-and-plate rheometer to measure rheological properties of coal ash at temperatures of 600-1300°C. The ash samples are introduced between a cone and plate that rotate relative to each other. Rheological properties are related to agglomeration in fluidized beds via the so-called “yield stress”, defined as the critical shear stress that must be overcome to start viscous flow. The magnitude of the yield stress therefore (indirectly) determines the tendency of molten ash to adhere to the surface of bed particles; this effect also determines the degree of what is commonly called “stickiness” of ash-coated bed particles. Experiments with ash from two coal types show that the yield stress is a function of temperature. The “Yield stress” analysis is considered more promising than other methods because it measures a rheological property rather than e.g. temperature or
Chapter 2
48
conductivity. Yet, one has to keep in mind that also this method is based on ex-situ (outside the fluidized bed) measurements. “Ash fusibility” / “disintegration of pre-heated ash” The “Ash fusibility” method and “disintegration of pre-heated ash” method have been presented [83]. The method of “ash fusibility” is based on the changes in shape detected during the heating of a cylindrical ash pellet (3 mm diameter and height) from room temperature to 1400°C by an optical heating microscope (following DIN norms 51730–1998 and 51730–1994). The method of “disintegration of pre-heated ash” consists of heating some loose ash added to five porcelain capsules. The ease of manual disintegration is assessed by visual inspection, distinguishing four levels of difficulty: ‘very easy’, ‘easy’, ‘difficult’ and ‘very difficult’. The predictions from the “ash fusibility” method as well the “disintegration of pre-heated ash” method generally show good consistency with the experimental results obtained from a 1 MWth bubbling fluidized bed combustor. Nevertheless, the methods are based on subjective visual observations and their applicability therefore remains questionable. Theoretical fuel assessment based on component ratios Fernandez Llorente et al. [83] describe two theoretical fuel assessment methods based on previous chemical analysis. The mass ratio of alkaline earth oxides to alkaline oxides, expressed as ((CaO+MgO)/(K2O+Na2O)), as well as the representation of SiO2, CaO and K2O in a ternary diagram have been investigated. Applied to experimental results with different fuels in a 1 MWth bubbling fluidized bed installation, both methods fail to reliably predict agglomeration phenomena. Summary The presented fuel/ash analysis methods are solely based on fuel and ash measurements and evaluate different rheological properties. However, they do not consider the reactions at fluidized bed combustion/gasification conditions and the interaction of fuel with bed material. Due to the nature of the measurements themselves, correlations between the measurements and the agglomeration process are introduced. Yet, the development of these correlations is often not convincing because effects such as reactions and evaporation of certain inorganic compounds are not taken into account. In addition, all these methods are by definition not suitable for a true “on-line” detection of agglomeration phenomena. Their applicability also depends on the use of the fluidized bed installations. For a narrow range of fuels with constant properties they appear useful for a-priori general anticipation of operational problems. However, in practice changing fuels or fluctuations in the fuel properties typically will occur. It is one of the strengths of fluidized bed systems that they are very flexible in terms of the fuel and fuel changes. In this respect, the presented methods are inherently not suitable to reliably predict possible agglomeration phenomena during operation. Öhman et al. [20] compared analyses from used bed material coatings with corresponding pure fuel ash. It was observed that the distribution of the different elements differs significantly between the pure fuel ashes (obtained by elemental analysis) and corresponding coatings on the used bed particles (obtained by SEM/EDS). This difference supports the above statement that the analysis of the fuel ash will probably not give a very accurate prediction of the tendency for agglomeration under actual fluidized bed operating conditions.
Agglomeration in fluidized beds: Mechanisms, Detection and Prevention
49
2.4.2. Analysis methods based on process measurements The methods presented in the following section are based on the measurement of one or more process parameters during fluidized bed operation. As such, they can in principle be applied as an on-line agglomeration detection system. A small number of methods is concerned with the evaluation of the fluidization state in the bed by considerable manipulation of the process itself. PEPT (Positron Emission Particle Tracking [86]) is based on particles being tracer labelled with a positron-emitter tracer and requires the insertion of radioactive particles into the bed. The “Falling ball method” [87] characterizes the “fluidity” of a fluidized bed and measures the velocity of a relatively large ball falling from top to bottom through the bed. The “Deaeration method” [87] measures the resulting decline in pressure over time after abruptly shutting off the main gas flow to the bed. This method is also known as “collapse-test” [88]. However, due to their strong influence on the process itself, all of these methods are considered unsuitable for routinely industrial application. As opposed to the previously presented methods, the major part of agglomeration analysis methods is concerned with the measurement of process variables that can also easily be applied to larger reactor scales. These methods are based on different types of measurements for fluidized beds; especially for industrial fluidized beds the measurement of temperature and pressure are the most suitable options [89]. In the following we present the different agglomeration detection methods based on process measurements; the methods are classified according to measurement sources and data analysis methods. 2.4.2.1. Pressure Absolute and differential pressure measurements are most frequently carried out in fluidized beds. The analysis methods are distinguished into linear and non-linear methods. Pressure is considered a suitable source for fluidized bed monitoring since it reflects the hydrodynamics of the fluidized bed. Average pressure drop measurements yield information on global bed properties such as density and bed height; high-frequency pressure measurements yield information on local and/or global flow phenomena. Linear methods Pressure drop across a bed section The regulation of the ash content in the bed via measurements of pressure drop over a vertical section of the fluidized bed is presented in the patent literature [90]. The basic idea is to measure the ash content, preferably by measuring the pressure drop across a certain height of the bed. This pressure drop is claimed to increase with increasing ash content relative to the carbon content of the bed. This patent presents only very limited experimental data and measurement specifications; it is furthermore also not shown how reliable and robust the measurement of the ash content via the pressure drop is working. The applicability of this method therefore remains questionable.
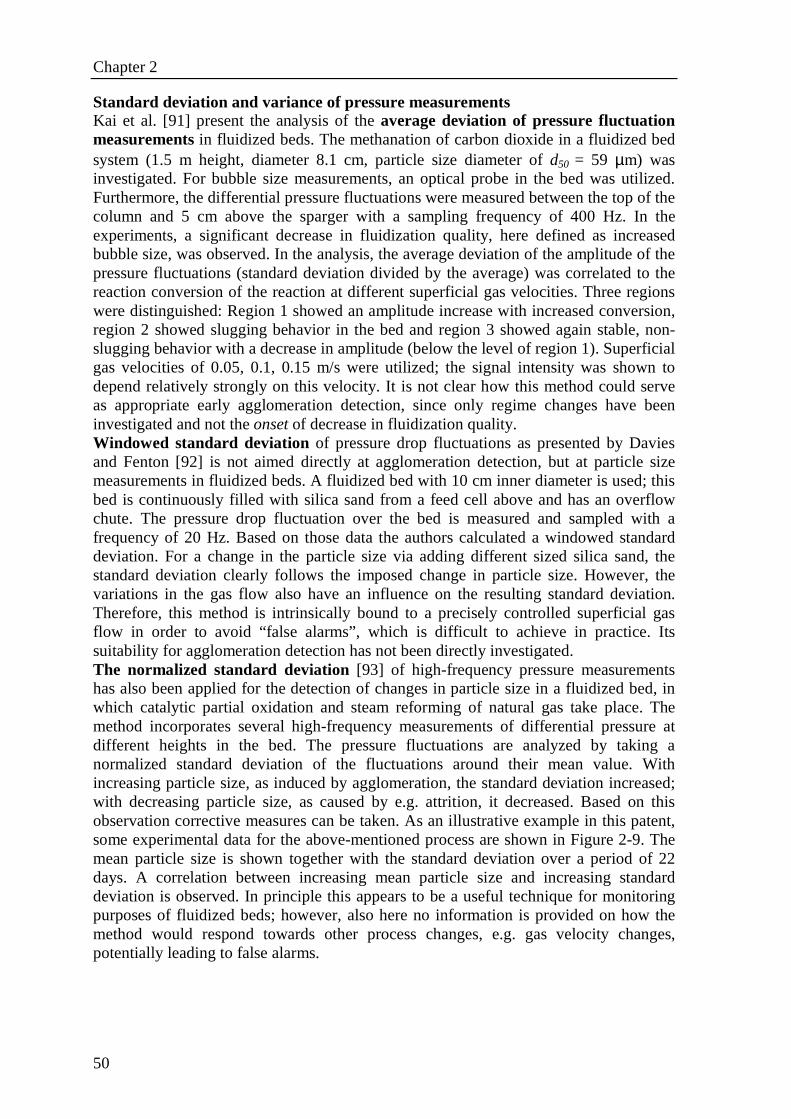
Chapter 2
50
Standard deviation and variance of pressure measurements Kai et al. [91] present the analysis of the average deviation of pressure fluctuation measurements in fluidized beds. The methanation of carbon dioxide in a fluidized bed system (1.5 m height, diameter 8.1 cm, particle size diameter of d50 = 59 µm) was investigated. For bubble size measurements, an optical probe in the bed was utilized. Furthermore, the differential pressure fluctuations were measured between the top of the column and 5 cm above the sparger with a sampling frequency of 400 Hz. In the experiments, a significant decrease in fluidization quality, here defined as increased bubble size, was observed. In the analysis, the average deviation of the amplitude of the pressure fluctuations (standard deviation divided by the average) was correlated to the reaction conversion of the reaction at different superficial gas velocities. Three regions were distinguished: Region 1 showed an amplitude increase with increased conversion, region 2 showed slugging behavior in the bed and region 3 showed again stable, non-slugging behavior with a decrease in amplitude (below the level of region 1). Superficial gas velocities of 0.05, 0.1, 0.15 m/s were utilized; the signal intensity was shown to depend relatively strongly on this velocity. It is not clear how this method could serve as appropriate early agglomeration detection, since only regime changes have been investigated and not the onset of decrease in fluidization quality. Windowed standard deviation of pressure drop fluctuations as presented by Davies and Fenton [92] is not aimed directly at agglomeration detection, but at particle size measurements in fluidized beds. A fluidized bed with 10 cm inner diameter is used; this bed is continuously filled with silica sand from a feed cell above and has an overflow chute. The pressure drop fluctuation over the bed is measured and sampled with a frequency of 20 Hz. Based on those data the authors calculated a windowed standard deviation. For a change in the particle size via adding different sized silica sand, the standard deviation clearly follows the imposed change in particle size. However, the variations in the gas flow also have an influence on the resulting standard deviation. Therefore, this method is intrinsically bound to a precisely controlled superficial gas flow in order to avoid “false alarms”, which is difficult to achieve in practice. Its suitability for agglomeration detection has not been directly investigated. The normalized standard deviation [93] of high-frequency pressure measurements has also been applied for the detection of changes in particle size in a fluidized bed, in which catalytic partial oxidation and steam reforming of natural gas take place. The method incorporates several high-frequency measurements of differential pressure at different heights in the bed. The pressure fluctuations are analyzed by taking a normalized standard deviation of the fluctuations around their mean value. With increasing particle size, as induced by agglomeration, the standard deviation increased; with decreasing particle size, as caused by e.g. attrition, it decreased. Based on this observation corrective measures can be taken. As an illustrative example in this patent, some experimental data for the above-mentioned process are shown in Figure 2-9. The mean particle size is shown together with the standard deviation over a period of 22 days. A correlation between increasing mean particle size and increasing standard deviation is observed. In principle this appears to be a useful technique for monitoring purposes of fluidized beds; however, also here no information is provided on how the method would respond towards other process changes, e.g. gas velocity changes, potentially leading to false alarms.
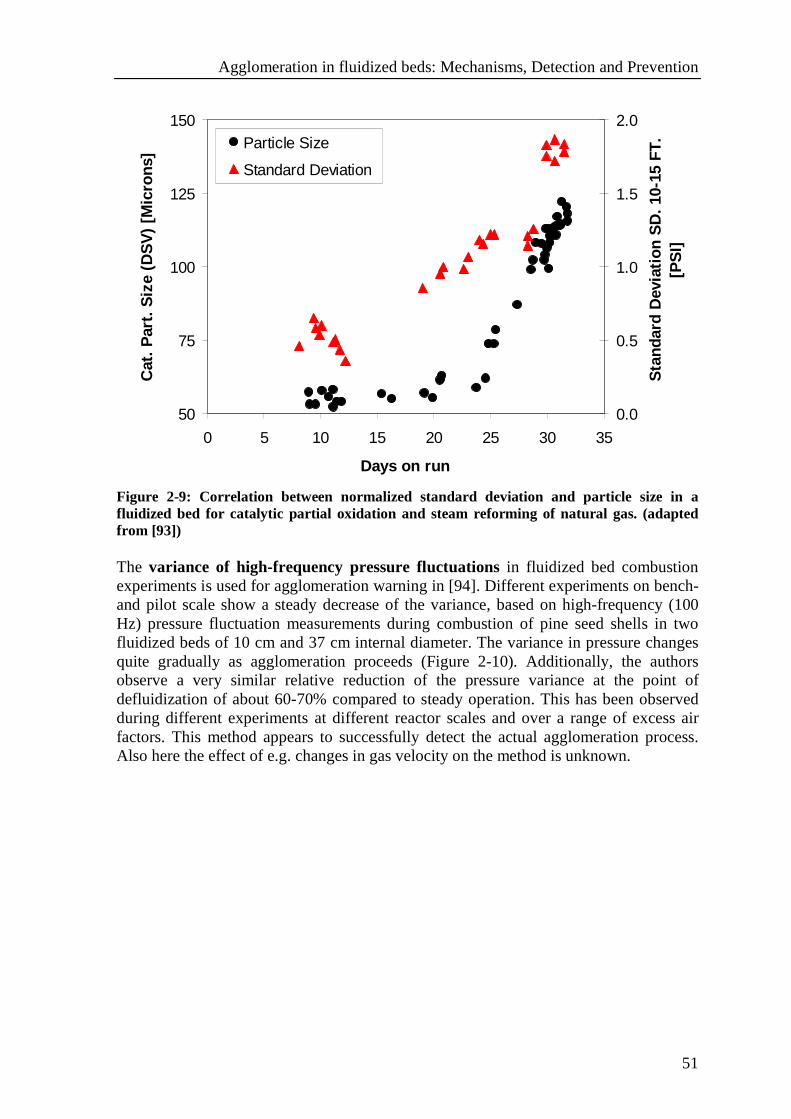
Agglomeration in fluidized beds: Mechanisms, Detection and Prevention
51
50
75
100
125
150
0 5 10 15 20 25 30 35
Days on run
Cat
. P
art.
Siz
e (D
SV
) [M
icro
ns]
0.0
0.5
1.0
1.5
2.0
Sta
ndar
d D
evia
tion
SD
. 10-
15 F
T.
[PS
I]
Particle Size
Standard Deviation
Figure 2-9: Correlation between normalized standard deviation and particle size in a fluidized bed for catalytic partial oxidation and steam reforming of natural gas. (adapted from [93]) The variance of high-frequency pressure fluctuations in fluidized bed combustion experiments is used for agglomeration warning in [94]. Different experiments on bench- and pilot scale show a steady decrease of the variance, based on high-frequency (100 Hz) pressure fluctuation measurements during combustion of pine seed shells in two fluidized beds of 10 cm and 37 cm internal diameter. The variance in pressure changes quite gradually as agglomeration proceeds (Figure 2-10). Additionally, the authors observe a very similar relative reduction of the pressure variance at the point of defluidization of about 60-70% compared to steady operation. This has been observed during different experiments at different reactor scales and over a range of excess air factors. This method appears to successfully detect the actual agglomeration process. Also here the effect of e.g. changes in gas velocity on the method is unknown.
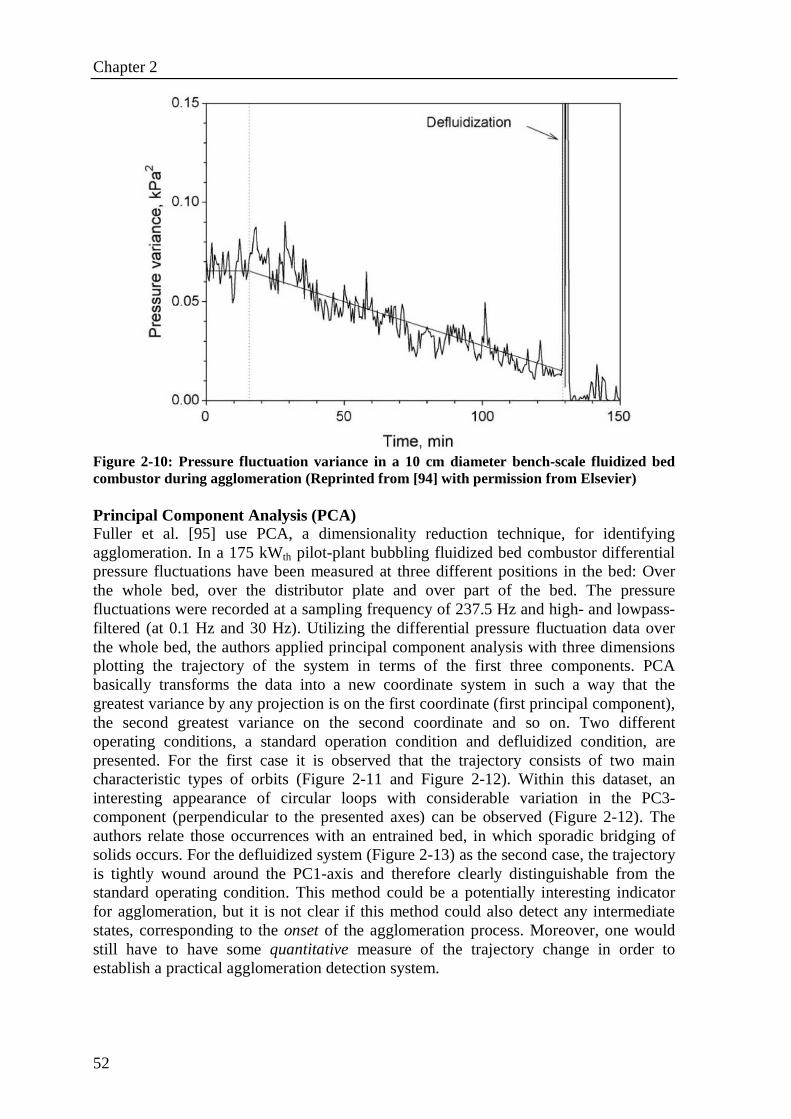
Chapter 2
52
Figure 2-10: Pressure fluctuation variance in a 10 cm diameter bench-scale fluidized bed combustor during agglomeration (Reprinted from [94] with permission from Elsevier) Principal Component Analysis (PCA) Fuller et al. [95] use PCA, a dimensionality reduction technique, for identifying agglomeration. In a 175 kWth pilot-plant bubbling fluidized bed combustor differential pressure fluctuations have been measured at three different positions in the bed: Over the whole bed, over the distributor plate and over part of the bed. The pressure fluctuations were recorded at a sampling frequency of 237.5 Hz and high- and lowpass-filtered (at 0.1 Hz and 30 Hz). Utilizing the differential pressure fluctuation data over the whole bed, the authors applied principal component analysis with three dimensions plotting the trajectory of the system in terms of the first three components. PCA basically transforms the data into a new coordinate system in such a way that the greatest variance by any projection is on the first coordinate (first principal component), the second greatest variance on the second coordinate and so on. Two different operating conditions, a standard operation condition and defluidized condition, are presented. For the first case it is observed that the trajectory consists of two main characteristic types of orbits (Figure 2-11 and Figure 2-12). Within this dataset, an interesting appearance of circular loops with considerable variation in the PC3-component (perpendicular to the presented axes) can be observed (Figure 2-12). The authors relate those occurrences with an entrained bed, in which sporadic bridging of solids occurs. For the defluidized system (Figure 2-13) as the second case, the trajectory is tightly wound around the PC1-axis and therefore clearly distinguishable from the standard operating condition. This method could be a potentially interesting indicator for agglomeration, but it is not clear if this method could also detect any intermediate states, corresponding to the onset of the agglomeration process. Moreover, one would still have to have some quantitative measure of the trajectory change in order to establish a practical agglomeration detection system.
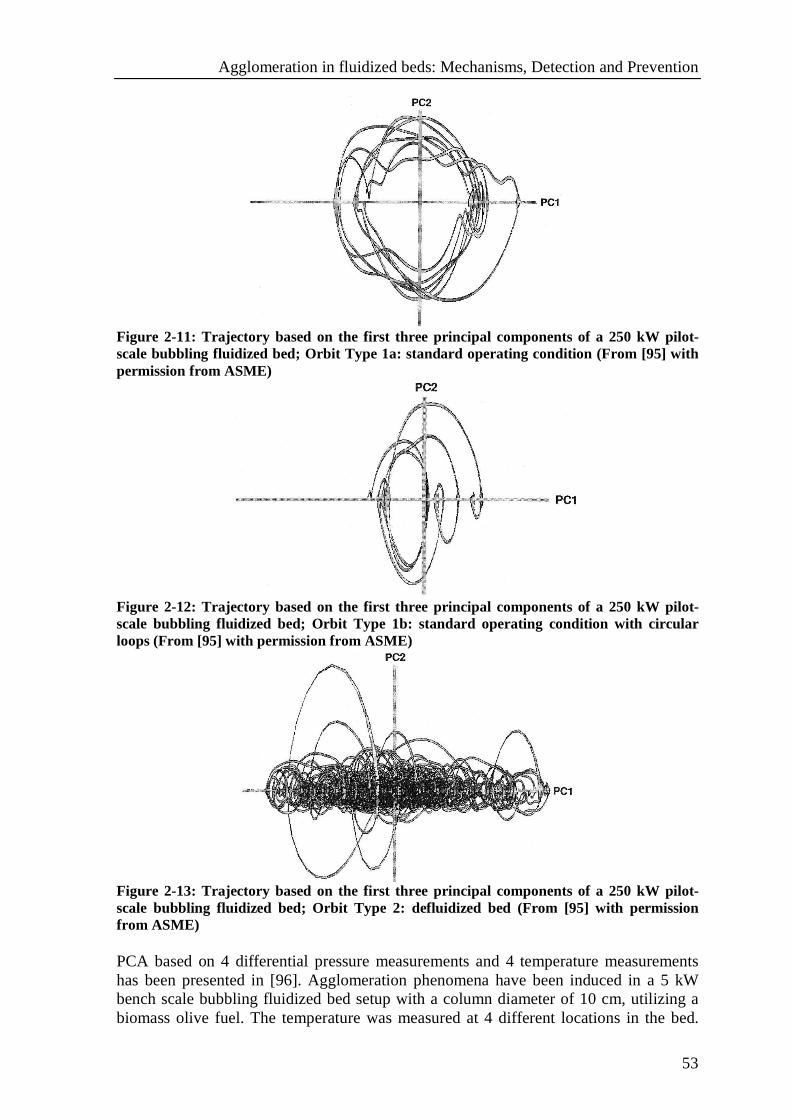
Agglomeration in fluidized beds: Mechanisms, Detection and Prevention
53
Figure 2-11: Trajectory based on the first three principal components of a 250 kW pilot-scale bubbling fluidized bed; Orbit Type 1a: standard operating condition (From [95] with permission from ASME)
Figure 2-12: Trajectory based on the first three principal components of a 250 kW pilot-scale bubbling fluidized bed; Orbit Type 1b: standard operating condition with circular loops (From [95] with permission from ASME)
Figure 2-13: Trajectory based on the first three principal components of a 250 kW pilot-scale bubbling fluidized bed; Orbit Type 2: defluidized bed (From [95] with permission from ASME) PCA based on 4 differential pressure measurements and 4 temperature measurements has been presented in [96]. Agglomeration phenomena have been induced in a 5 kW bench scale bubbling fluidized bed setup with a column diameter of 10 cm, utilizing a biomass olive fuel. The temperature was measured at 4 different locations in the bed.
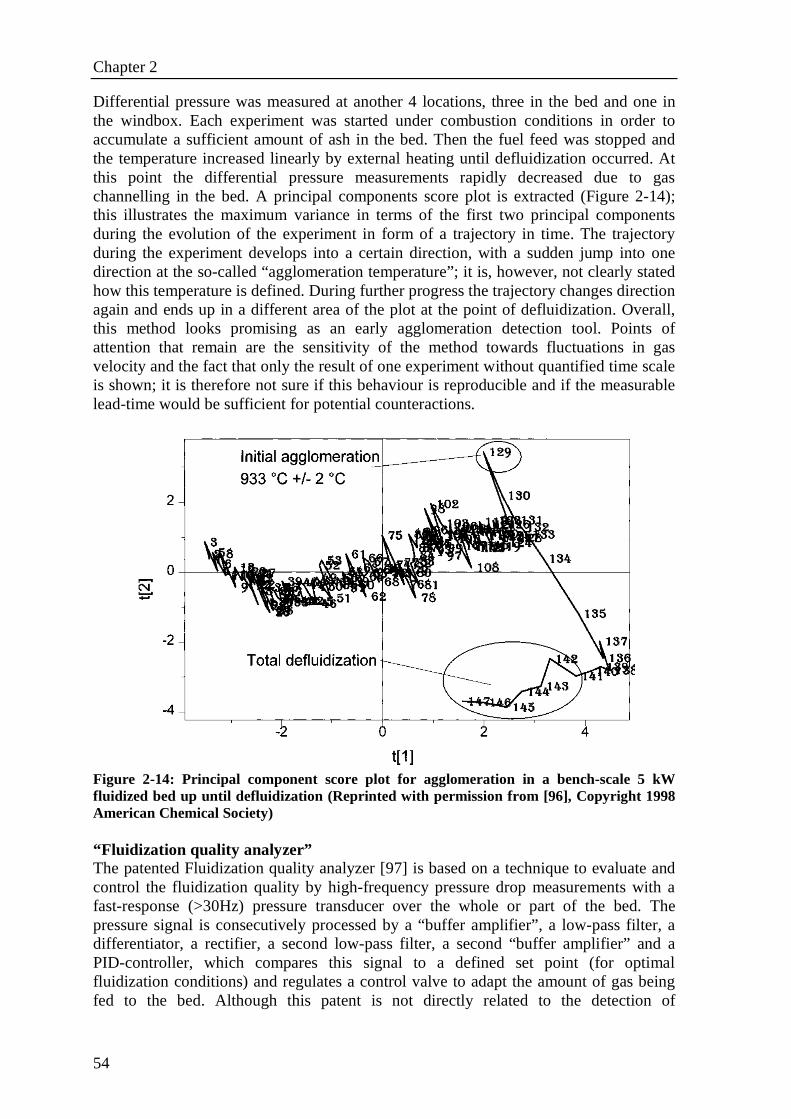
Chapter 2
54
Differential pressure was measured at another 4 locations, three in the bed and one in the windbox. Each experiment was started under combustion conditions in order to accumulate a sufficient amount of ash in the bed. Then the fuel feed was stopped and the temperature increased linearly by external heating until defluidization occurred. At this point the differential pressure measurements rapidly decreased due to gas channelling in the bed. A principal components score plot is extracted (Figure 2-14); this illustrates the maximum variance in terms of the first two principal components during the evolution of the experiment in form of a trajectory in time. The trajectory during the experiment develops into a certain direction, with a sudden jump into one direction at the so-called “agglomeration temperature”; it is, however, not clearly stated how this temperature is defined. During further progress the trajectory changes direction again and ends up in a different area of the plot at the point of defluidization. Overall, this method looks promising as an early agglomeration detection tool. Points of attention that remain are the sensitivity of the method towards fluctuations in gas velocity and the fact that only the result of one experiment without quantified time scale is shown; it is therefore not sure if this behaviour is reproducible and if the measurable lead-time would be sufficient for potential counteractions.
Figure 2-14: Principal component score plot for agglomeration in a bench-scale 5 kW fluidized bed up until defluidization (Reprinted with permission from [96], Copyright 1998 American Chemical Society) “Fluidization quality analyzer” The patented Fluidization quality analyzer [97] is based on a technique to evaluate and control the fluidization quality by high-frequency pressure drop measurements with a fast-response (>30Hz) pressure transducer over the whole or part of the bed. The pressure signal is consecutively processed by a “buffer amplifier”, a low-pass filter, a differentiator, a rectifier, a second low-pass filter, a second “buffer amplifier” and a PID-controller, which compares this signal to a defined set point (for optimal fluidization conditions) and regulates a control valve to adapt the amount of gas being fed to the bed. Although this patent is not directly related to the detection of
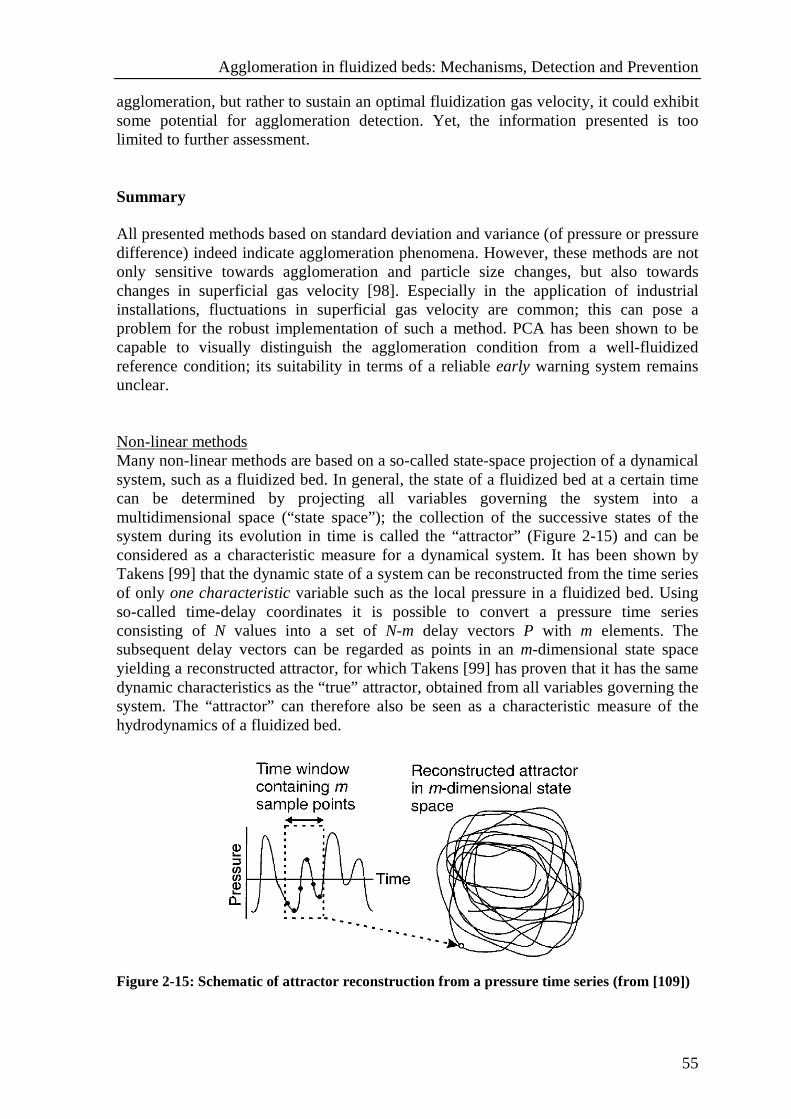
Agglomeration in fluidized beds: Mechanisms, Detection and Prevention
55
agglomeration, but rather to sustain an optimal fluidization gas velocity, it could exhibit some potential for agglomeration detection. Yet, the information presented is too limited to further assessment. Summary All presented methods based on standard deviation and variance (of pressure or pressure difference) indeed indicate agglomeration phenomena. However, these methods are not only sensitive towards agglomeration and particle size changes, but also towards changes in superficial gas velocity [98]. Especially in the application of industrial installations, fluctuations in superficial gas velocity are common; this can pose a problem for the robust implementation of such a method. PCA has been shown to be capable to visually distinguish the agglomeration condition from a well-fluidized reference condition; its suitability in terms of a reliable early warning system remains unclear. Non-linear methods Many non-linear methods are based on a so-called state-space projection of a dynamical system, such as a fluidized bed. In general, the state of a fluidized bed at a certain time can be determined by projecting all variables governing the system into a multidimensional space (“state space”); the collection of the successive states of the system during its evolution in time is called the “attractor” (Figure 2-15) and can be considered as a characteristic measure for a dynamical system. It has been shown by Takens [99] that the dynamic state of a system can be reconstructed from the time series of only one characteristic variable such as the local pressure in a fluidized bed. Using so-called time-delay coordinates it is possible to convert a pressure time series consisting of N values into a set of N-m delay vectors P with m elements. The subsequent delay vectors can be regarded as points in an m-dimensional state space yielding a reconstructed attractor, for which Takens [99] has proven that it has the same dynamic characteristics as the “true” attractor, obtained from all variables governing the system. The “attractor” can therefore also be seen as a characteristic measure of the hydrodynamics of a fluidized bed.
Figure 2-15: Schematic of attractor reconstruction from a pressure time series (from [109])
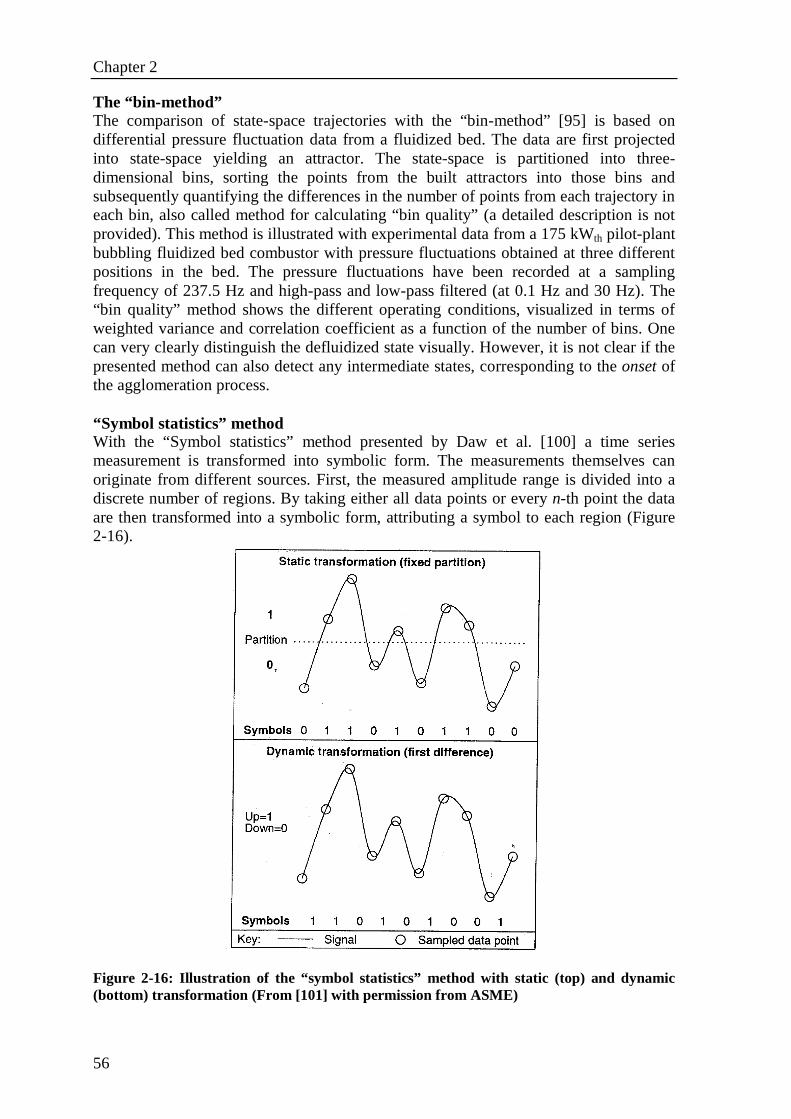
Chapter 2
56
The “bin-method” The comparison of state-space trajectories with the “bin-method” [95] is based on differential pressure fluctuation data from a fluidized bed. The data are first projected into state-space yielding an attractor. The state-space is partitioned into three-dimensional bins, sorting the points from the built attractors into those bins and subsequently quantifying the differences in the number of points from each trajectory in each bin, also called method for calculating “bin quality” (a detailed description is not provided). This method is illustrated with experimental data from a 175 kWth pilot-plant bubbling fluidized bed combustor with pressure fluctuations obtained at three different positions in the bed. The pressure fluctuations have been recorded at a sampling frequency of 237.5 Hz and high-pass and low-pass filtered (at 0.1 Hz and 30 Hz). The “bin quality” method shows the different operating conditions, visualized in terms of weighted variance and correlation coefficient as a function of the number of bins. One can very clearly distinguish the defluidized state visually. However, it is not clear if the presented method can also detect any intermediate states, corresponding to the onset of the agglomeration process. “Symbol statistics” method With the “Symbol statistics” method presented by Daw et al. [100] a time series measurement is transformed into symbolic form. The measurements themselves can originate from different sources. First, the measured amplitude range is divided into a discrete number of regions. By taking either all data points or every n-th point the data are then transformed into a symbolic form, attributing a symbol to each region (Figure 2-16).
Figure 2-16: Illustration of the “symbol statistics” method with static (top) and dynamic (bottom) transformation (From [101] with permission from ASME)
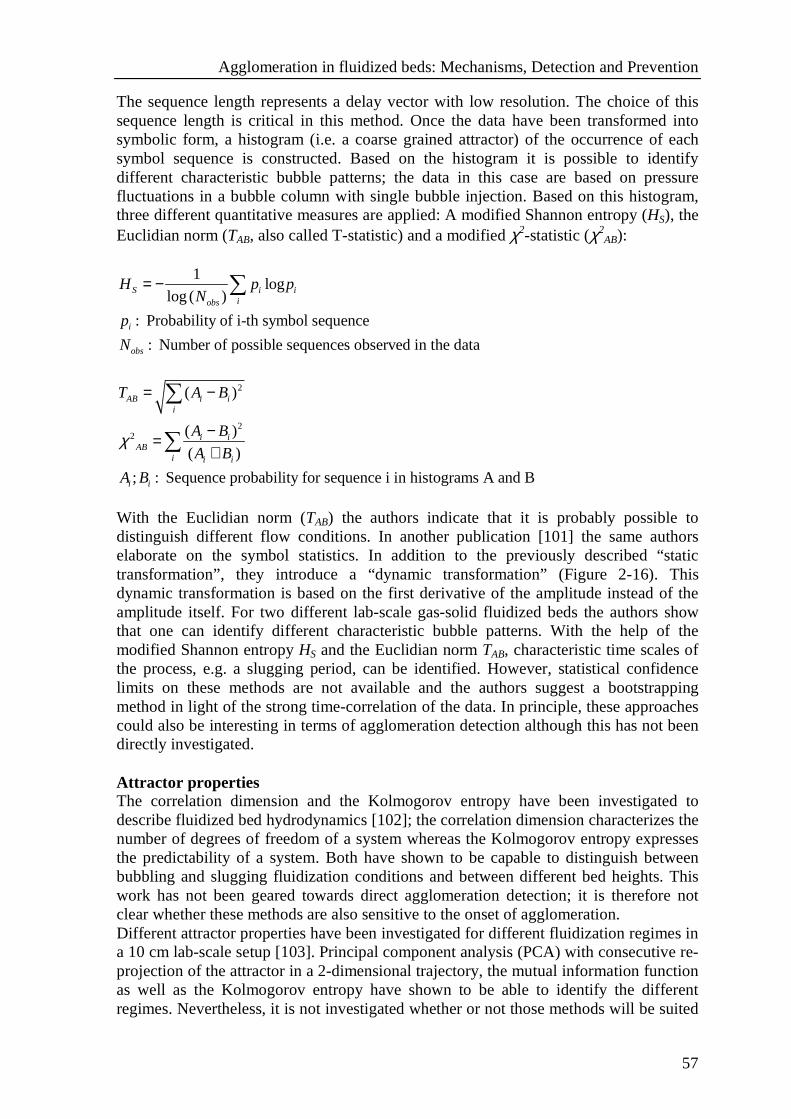
Agglomeration in fluidized beds: Mechanisms, Detection and Prevention
57
The sequence length represents a delay vector with low resolution. The choice of this sequence length is critical in this method. Once the data have been transformed into symbolic form, a histogram (i.e. a coarse grained attractor) of the occurrence of each symbol sequence is constructed. Based on the histogram it is possible to identify different characteristic bubble patterns; the data in this case are based on pressure fluctuations in a bubble column with single bubble injection. Based on this histogram, three different quantitative measures are applied: A modified Shannon entropy (HS), the Euclidian norm (TAB, also called T-statistic) and a modified χ2-statistic (χ2
AB):
1log
log ( )
: Probability of i-th symbol sequence
: Number of possible sequences observed in the data
S i iiobs
i
obs
H p pN
p
N
= − ∑
2
22
( )
( )
( )
; : Sequence probability for sequence i in histograms A and B
AB i ii
i iAB
i i i
i i
T A B
A B
A B
A B
χ
= −
−=+
∑
∑
With the Euclidian norm (TAB) the authors indicate that it is probably possible to distinguish different flow conditions. In another publication [101] the same authors elaborate on the symbol statistics. In addition to the previously described “static transformation”, they introduce a “dynamic transformation” (Figure 2-16). This dynamic transformation is based on the first derivative of the amplitude instead of the amplitude itself. For two different lab-scale gas-solid fluidized beds the authors show that one can identify different characteristic bubble patterns. With the help of the modified Shannon entropy HS and the Euclidian norm TAB, characteristic time scales of the process, e.g. a slugging period, can be identified. However, statistical confidence limits on these methods are not available and the authors suggest a bootstrapping method in light of the strong time-correlation of the data. In principle, these approaches could also be interesting in terms of agglomeration detection although this has not been directly investigated. Attractor properties The correlation dimension and the Kolmogorov entropy have been investigated to describe fluidized bed hydrodynamics [102]; the correlation dimension characterizes the number of degrees of freedom of a system whereas the Kolmogorov entropy expresses the predictability of a system. Both have shown to be capable to distinguish between bubbling and slugging fluidization conditions and between different bed heights. This work has not been geared towards direct agglomeration detection; it is therefore not clear whether these methods are also sensitive to the onset of agglomeration. Different attractor properties have been investigated for different fluidization regimes in a 10 cm lab-scale setup [103]. Principal component analysis (PCA) with consecutive re-projection of the attractor in a 2-dimensional trajectory, the mutual information function as well as the Kolmogorov entropy have shown to be able to identify the different regimes. Nevertheless, it is not investigated whether or not those methods will be suited
Chapter 2
58
for detecting small hydrodynamic changes within a fluidization regime, as would be required for an early warning of agglomeration. A method that is based on the Fourier transform of the probability density of a 2-D attractor has been proposed [104]. Various quantities of this Fourier transform – absolute value, real part, imaginary part, phase derivative – have been investigated in a lab-scale fluidized bed. The bed has been operated at two different operating conditions. Some of the proposed measures are capable of recognizing the two different operating conditions. Yet, from the information presented it is not clear how different those operating conditions actually are. Therefore it is not clear whether or not small changes can be indicated and if observed differences are statistically significant. Short-term predictability in state space The short-term predictability in state space [105] is applied for monitoring the fluidization state in bubbling fluidized beds, specifically to detect agglomeration. The method is based on high-frequency pressure fluctuations, which are analyzed in a statistical manner by comparing a reference pressure time series with the current one in the bed. As the discriminating statistic in this case the “short-term predictability in state space” is taken, which refers to the growth of the distance between points in state-space that were initially close together. The growth of their distance during time is measured with the so-called supremum norm. The final discriminating statistics is expressed by the so-called Z-value. A lower limit of 3 on |Z| is required to disprove the null hypothesis that both pressure time series come from the same distribution function of the pressure time series at 99% confidence level. The authors carried out experimental work in a 5 cm inner diameter, heated fluidized bed using slightly porous plastic particles (d50 = 480 µm). At temperatures in the range of 120°C the plastic particles soften and can subsequently agglomerate. This results in a sharp decrease in the pressure drop over the bed. The pressure fluctuations were measured and recorded with a frequency of 200 Hz. In 6 different experiments |Z| increased above 3 after between 37 and 80 minutes before the defluidization of the bed due to large agglomerates having formed. The method appears suitable for detecting agglomeration in this case, but elsewhere [98] it also has been shown that the test is very sensitive to fluctuations in the gas flow, a problem especially in industrial installations with significant variations in gas supply. Attractor comparison method The Attractor comparison method [106] is a step beyond the “short-term predictability in state space” [105] and has been applied to monitoring agglomeration effects in fluidized beds. The principle of this method consists of reconstructing and comparing attractors of the system. One first has to record a reference attractor representing a desired (e.g. well-fluidized) state of the system. Subsequently, the attractor of the current operating state is reconstructed and compared to the reference attractor. This comparison is based on a statistical test developed by Diks et al. [107], which evaluates the dimensionless squared distance S between two attractors. The S-value is defined as:
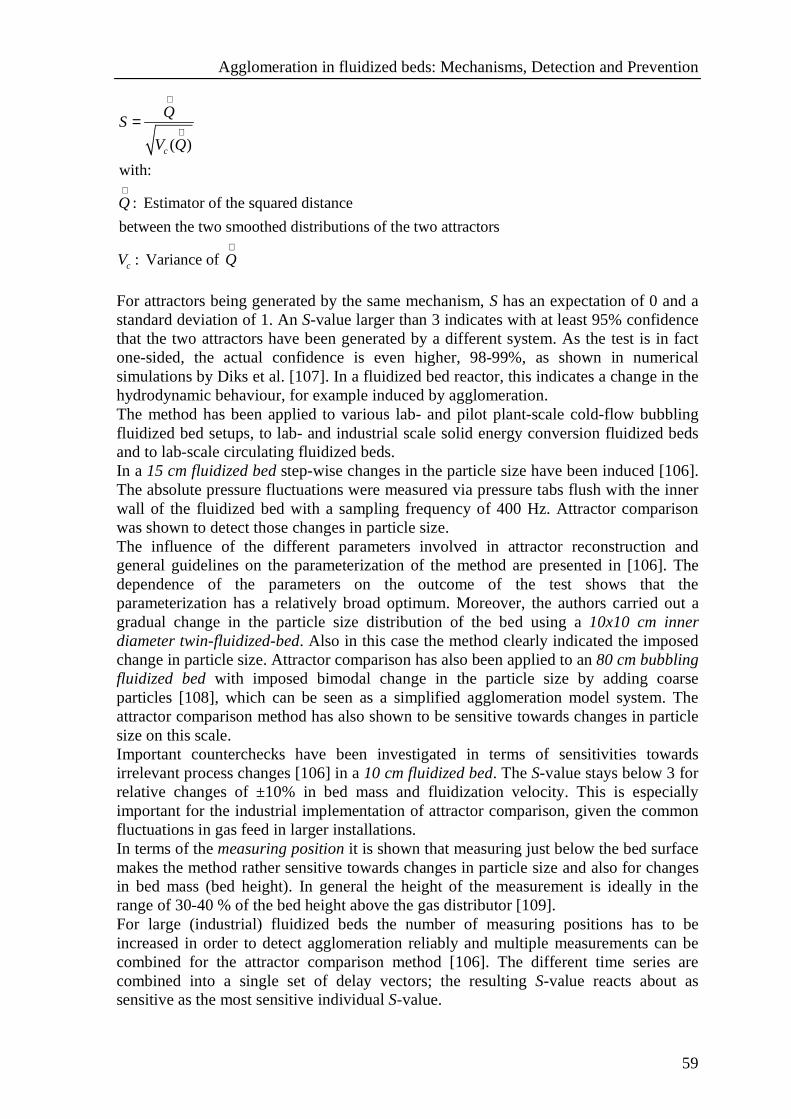
Agglomeration in fluidized beds: Mechanisms, Detection and Prevention
59
( )
with:
: Estimator of the squared distance
between the two smoothed distributions of the two attractors
: Variance of
c
c
QS
V Q
Q
V Q
∧
∧
∧
∧
=
For attractors being generated by the same mechanism, S has an expectation of 0 and a standard deviation of 1. An S-value larger than 3 indicates with at least 95% confidence that the two attractors have been generated by a different system. As the test is in fact one-sided, the actual confidence is even higher, 98-99%, as shown in numerical simulations by Diks et al. [107]. In a fluidized bed reactor, this indicates a change in the hydrodynamic behaviour, for example induced by agglomeration. The method has been applied to various lab- and pilot plant-scale cold-flow bubbling fluidized bed setups, to lab- and industrial scale solid energy conversion fluidized beds and to lab-scale circulating fluidized beds. In a 15 cm fluidized bed step-wise changes in the particle size have been induced [106]. The absolute pressure fluctuations were measured via pressure tabs flush with the inner wall of the fluidized bed with a sampling frequency of 400 Hz. Attractor comparison was shown to detect those changes in particle size. The influence of the different parameters involved in attractor reconstruction and general guidelines on the parameterization of the method are presented in [106]. The dependence of the parameters on the outcome of the test shows that the parameterization has a relatively broad optimum. Moreover, the authors carried out a gradual change in the particle size distribution of the bed using a 10x10 cm inner diameter twin-fluidized-bed. Also in this case the method clearly indicated the imposed change in particle size. Attractor comparison has also been applied to an 80 cm bubbling fluidized bed with imposed bimodal change in the particle size by adding coarse particles [108], which can be seen as a simplified agglomeration model system. The attractor comparison method has also shown to be sensitive towards changes in particle size on this scale. Important counterchecks have been investigated in terms of sensitivities towards irrelevant process changes [106] in a 10 cm fluidized bed. The S-value stays below 3 for relative changes of ±10% in bed mass and fluidization velocity. This is especially important for the industrial implementation of attractor comparison, given the common fluctuations in gas feed in larger installations. In terms of the measuring position it is shown that measuring just below the bed surface makes the method rather sensitive towards changes in particle size and also for changes in bed mass (bed height). In general the height of the measurement is ideally in the range of 30-40 % of the bed height above the gas distributor [109]. For large (industrial) fluidized beds the number of measuring positions has to be increased in order to detect agglomeration reliably and multiple measurements can be combined for the attractor comparison method [106]. The different time series are combined into a single set of delay vectors; the resulting S-value reacts about as sensitive as the most sensitive individual S-value.
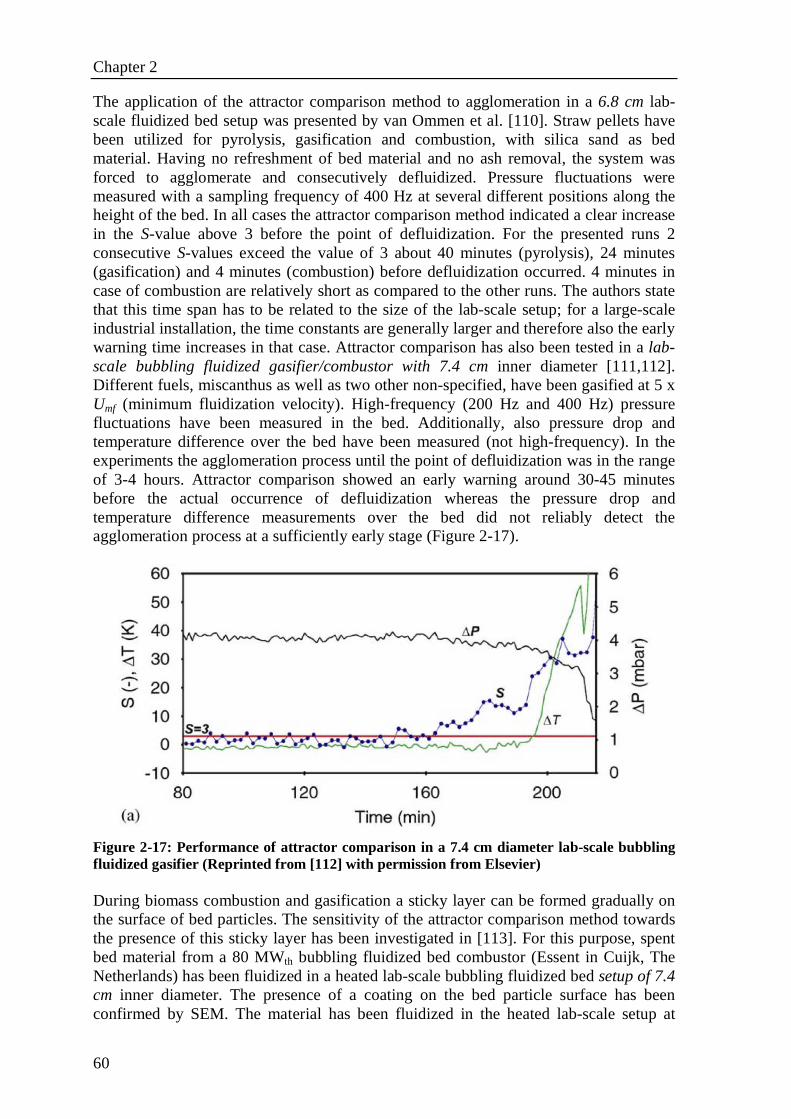
Chapter 2
60
The application of the attractor comparison method to agglomeration in a 6.8 cm lab-scale fluidized bed setup was presented by van Ommen et al. [110]. Straw pellets have been utilized for pyrolysis, gasification and combustion, with silica sand as bed material. Having no refreshment of bed material and no ash removal, the system was forced to agglomerate and consecutively defluidized. Pressure fluctuations were measured with a sampling frequency of 400 Hz at several different positions along the height of the bed. In all cases the attractor comparison method indicated a clear increase in the S-value above 3 before the point of defluidization. For the presented runs 2 consecutive S-values exceed the value of 3 about 40 minutes (pyrolysis), 24 minutes (gasification) and 4 minutes (combustion) before defluidization occurred. 4 minutes in case of combustion are relatively short as compared to the other runs. The authors state that this time span has to be related to the size of the lab-scale setup; for a large-scale industrial installation, the time constants are generally larger and therefore also the early warning time increases in that case. Attractor comparison has also been tested in a lab-scale bubbling fluidized gasifier/combustor with 7.4 cm inner diameter [111,112]. Different fuels, miscanthus as well as two other non-specified, have been gasified at 5 x Umf (minimum fluidization velocity). High-frequency (200 Hz and 400 Hz) pressure fluctuations have been measured in the bed. Additionally, also pressure drop and temperature difference over the bed have been measured (not high-frequency). In the experiments the agglomeration process until the point of defluidization was in the range of 3-4 hours. Attractor comparison showed an early warning around 30-45 minutes before the actual occurrence of defluidization whereas the pressure drop and temperature difference measurements over the bed did not reliably detect the agglomeration process at a sufficiently early stage (Figure 2-17).
Figure 2-17: Performance of attractor comparison in a 7.4 cm diameter lab-scale bubbling fluidized gasifier (Reprinted from [112] with permission from Elsevier) During biomass combustion and gasification a sticky layer can be formed gradually on the surface of bed particles. The sensitivity of the attractor comparison method towards the presence of this sticky layer has been investigated in [113]. For this purpose, spent bed material from a 80 MWth bubbling fluidized bed combustor (Essent in Cuijk, The Netherlands) has been fluidized in a heated lab-scale bubbling fluidized bed setup of 7.4 cm inner diameter. The presence of a coating on the bed particle surface has been confirmed by SEM. The material has been fluidized in the heated lab-scale setup at
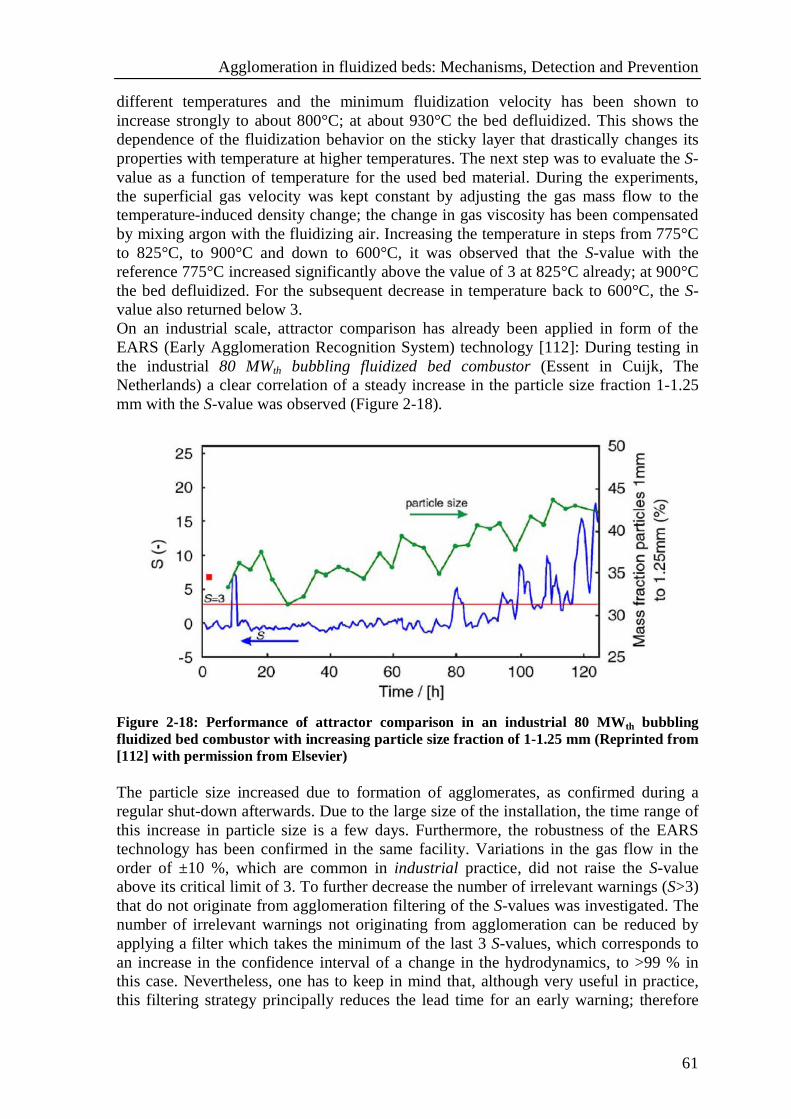
Agglomeration in fluidized beds: Mechanisms, Detection and Prevention
61
different temperatures and the minimum fluidization velocity has been shown to increase strongly to about 800°C; at about 930°C the bed defluidized. This shows the dependence of the fluidization behavior on the sticky layer that drastically changes its properties with temperature at higher temperatures. The next step was to evaluate the S-value as a function of temperature for the used bed material. During the experiments, the superficial gas velocity was kept constant by adjusting the gas mass flow to the temperature-induced density change; the change in gas viscosity has been compensated by mixing argon with the fluidizing air. Increasing the temperature in steps from 775°C to 825°C, to 900°C and down to 600°C, it was observed that the S-value with the reference 775°C increased significantly above the value of 3 at 825°C already; at 900°C the bed defluidized. For the subsequent decrease in temperature back to 600°C, the S-value also returned below 3. On an industrial scale, attractor comparison has already been applied in form of the EARS (Early Agglomeration Recognition System) technology [112]: During testing in the industrial 80 MWth bubbling fluidized bed combustor (Essent in Cuijk, The Netherlands) a clear correlation of a steady increase in the particle size fraction 1-1.25 mm with the S-value was observed (Figure 2-18).
Figure 2-18: Performance of attractor comparison in an industrial 80 MW th bubbling fluidized bed combustor with increasing particle size fraction of 1-1.25 mm (Reprinted from [112] with permission from Elsevier) The particle size increased due to formation of agglomerates, as confirmed during a regular shut-down afterwards. Due to the large size of the installation, the time range of this increase in particle size is a few days. Furthermore, the robustness of the EARS technology has been confirmed in the same facility. Variations in the gas flow in the order of ±10 %, which are common in industrial practice, did not raise the S-value above its critical limit of 3. To further decrease the number of irrelevant warnings (S>3) that do not originate from agglomeration filtering of the S-values was investigated. The number of irrelevant warnings not originating from agglomeration can be reduced by applying a filter which takes the minimum of the last 3 S-values, which corresponds to an increase in the confidence interval of a change in the hydrodynamics, to >99 % in this case. Nevertheless, one has to keep in mind that, although very useful in practice, this filtering strategy principally reduces the lead time for an early warning; therefore
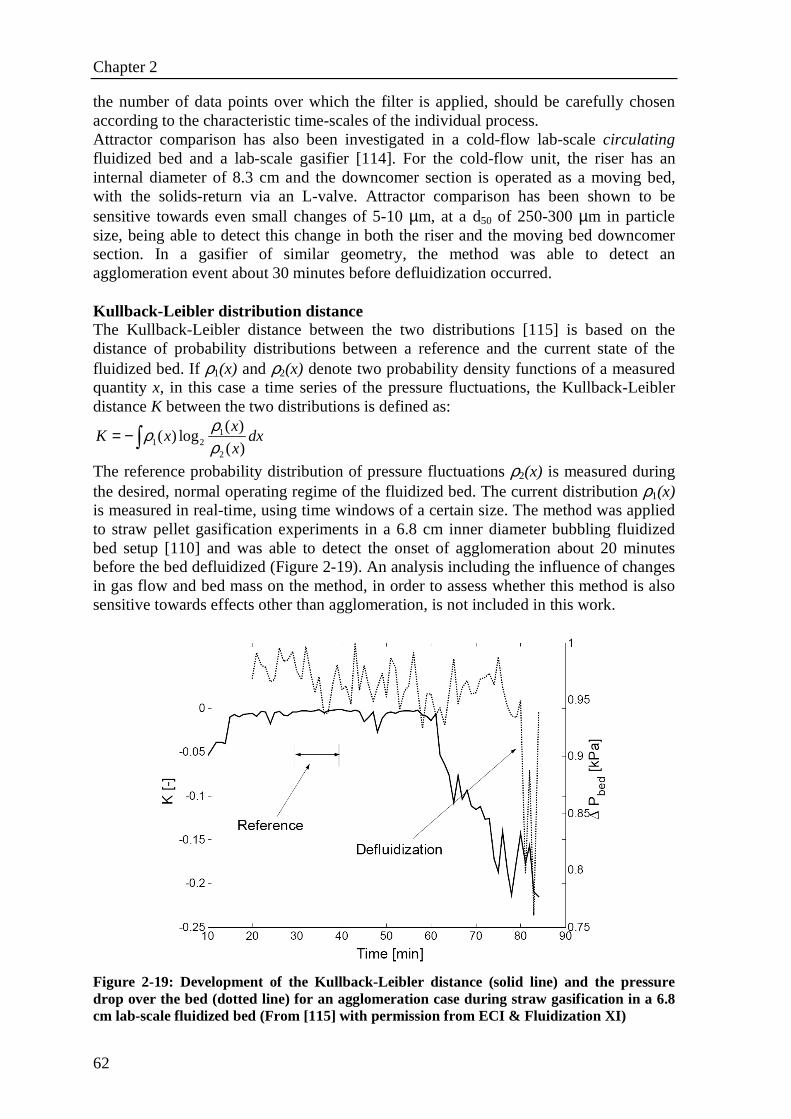
Chapter 2
62
the number of data points over which the filter is applied, should be carefully chosen according to the characteristic time-scales of the individual process. Attractor comparison has also been investigated in a cold-flow lab-scale circulating fluidized bed and a lab-scale gasifier [114]. For the cold-flow unit, the riser has an internal diameter of 8.3 cm and the downcomer section is operated as a moving bed, with the solids-return via an L-valve. Attractor comparison has been shown to be sensitive towards even small changes of 5-10 µm, at a d50 of 250-300 µm in particle size, being able to detect this change in both the riser and the moving bed downcomer section. In a gasifier of similar geometry, the method was able to detect an agglomeration event about 30 minutes before defluidization occurred. Kullback-Leibler distribution distance The Kullback-Leibler distance between the two distributions [115] is based on the distance of probability distributions between a reference and the current state of the fluidized bed. If ρ1(x) and ρ2(x) denote two probability density functions of a measured quantity x, in this case a time series of the pressure fluctuations, the Kullback-Leibler distance K between the two distributions is defined as:
11 2
2
( )( ) log
( )
xK x dx
x
ρρρ
= −∫
The reference probability distribution of pressure fluctuations ρ2(x) is measured during the desired, normal operating regime of the fluidized bed. The current distribution ρ1(x) is measured in real-time, using time windows of a certain size. The method was applied to straw pellet gasification experiments in a 6.8 cm inner diameter bubbling fluidized bed setup [110] and was able to detect the onset of agglomeration about 20 minutes before the bed defluidized (Figure 2-19). An analysis including the influence of changes in gas flow and bed mass on the method, in order to assess whether this method is also sensitive towards effects other than agglomeration, is not included in this work.
Figure 2-19: Development of the Kullback-Leibler distance (solid line) and the pressure drop over the bed (dotted line) for an agglomeration case during straw gasification in a 6.8 cm lab-scale fluidized bed (From [115] with permission from ECI & Fluidization XI)
Agglomeration in fluidized beds: Mechanisms, Detection and Prevention
63
W-statistic The W-statistic [87] is based on high-frequency pressure fluctuation measurements in fluidized bed and has been proposed for monitoring agglomeration. The underlying rationale for this method is that a fluidized bed with a poor fluidity will transmit pressure fluctuations less well than a well-fluidized bed; so-called “small pressure fluctuations” will therefore contribute less to the total signal energy in beds with poor fluidity as compared to good fluidity. Those small pressure fluctuations are calculated by subtracting a wavelet-smoothened signal from the raw signal and can therefore be seen as some high-frequency component of the measured signal. The W-statistic is then defined as:
2
0
2
0
( ( ) ( ))
( ( ) ( ))
where:
( ):raw signal (with being itsaverage)
( ):small fluctuation component of raw signal (with being itsaverage)
T
s s
stat T
s s
g t g t dt
W
g t g t dt
g t g
g t g
−=
−
∫
∫
The method is illustrated with imposed changes in bed fluidity via agglomeration of bed particles with different liquids sprayed into the bed. As bed material coke powder with Sauter mean diameter of 135 µm has been utilized. The W-statistic is additionally calculated for a pilot-plant fluidized bed in which coke particles are fluidized with steam; at the same time heavy oil was sprayed onto the bed. The results from the W-statistic presented in this work are correlated to the falling ball index [87]. Furthermore, in the pilot plant fluidized bed the W-statistic is correlated to the flowing time; the flowing time is measured by the flow of hot bed samples through a funnel and therefore provides a certain measure of the fluidity. The authors state that this method is not as accurate as the “falling ball method”, but can detect large changes in bed fluidity. The correlation between the W-statistic and the flowing time shows almost step-wise behaviour: For flowing times below a certain level, the resulting W-statistic is within a wide range of values, whereas for increasing flowing time (referring to decreased fluidity) the W-statistic stays relatively constant. This sharp “L-characteristic” seems problematic in terms of the application of the method as an early warning tool for agglomeration phenomena. Furthermore, the dependence of other parameters, such as variation in gas flow and total bed mass on the outcome of the W-statistic were not investigated in this work. Portoghese et al. [116] induced agglomeration in a fluidized bed via spraying of propanol-water-solution into a bed of glass beads. The water content of the bed was determined via a triboelectric probe. The raw signal from the triboelectric probe decreased quickly once liquid was introduced. During the drying process the signal slowly increases again, reaching its original level at dry conditions. The W-statistic has also been applied to the raw triboelectric signal of this study. The drying end-points calculated from the W-Statistic, based on 1 s intervals, have been correlated to the drying time determined with a threshold in the raw signal. Both correlated very well. However, in terms of monitoring the humidity of the bed, it is not clear if this more
Chapter 2
64
complex method exhibits any advantage over the raw signal with thresholding, since the raw signal already indicates the end-point quite well. Overall, the W-statistic appears to be suitable for detecting hydrodynamic changes in fluidized bed, such as agglomeration phenomena. The question remains how sensitive the method is towards changes other than agglomeration. Summary Non-linear analysis techniques based on pressure measurements have received much attention in the literature. Many methods project high-frequency fluctuation data into a multi-dimensional state space with subsequent analysis of the attractor properties. The “bin-method”, “Symbol statistics” and different attractor properties have been proposed, but none of them has been shown to be successfully and reliably applied to the early detection of agglomeration. Attractor comparison, the relative comparison of attractors, has been applied on different bed scales to successfully detect agglomeration; it has also been shown to be insensitive towards effects other than agglomeration within certain limits. Other applied methods are the Kullback-Leibler distance between two distributions and the W-statistic. Both also detect agglomeration; however, the influence of other process parameters on the outcome of the analysis has not been investigated. Nevertheless, they appear to be promising based on the available literature. 2.4.2.2. Acoustic emission Acoustic emissions refer to a broad range of frequencies emitted from a fluidized bed. They can therefore be seen as an extension or a shift of pressure measurements into higher-frequency regions and therefore relevant in terms of agglomeration phenomena. Acoustic measurements are not necessarily confined to the human audible range. Correlation between characteristic beat patterns and particle size, reciprocal of the mean frequency Leach et al. [117] present a method which correlates different characteristic frequencies from so-called beat patterns to changes in particle size. Rigid particles emit sound signals upon collision with each other. For well-defined, single-size spherical particles, the resulting fundamental frequencies and their harmonics can be obtained theoretically from the equation of motion for isotropic elastic spheres. For two spheres of different radius so-called “beat frequencies” evolve, i.e. low-frequent signals resulting from interference of their two fundamental frequency signals. A real particle system has a size distribution that is non-linear, e.g. Gaussian; this, in turn, results in a distribution of frequency differences that lead to characteristic beat frequency patterns. The method comprises analyzing short sound time-series in terms of characteristic measures for the beat patterns, namely beat duration, half-wavelength within the envelope, wavelength of a steep maximum within the envelope and an average wavelength of a steep maximum. Some of those measures are correlated to the size of monodisperse particles. The experiments carried out in this work comprise recording sound signals from a rotating cylinder of particles with different known, narrow size distributions. The frequencies of interest are mentioned to be in the range of 50-200 kHz. Mean particle sizes within the
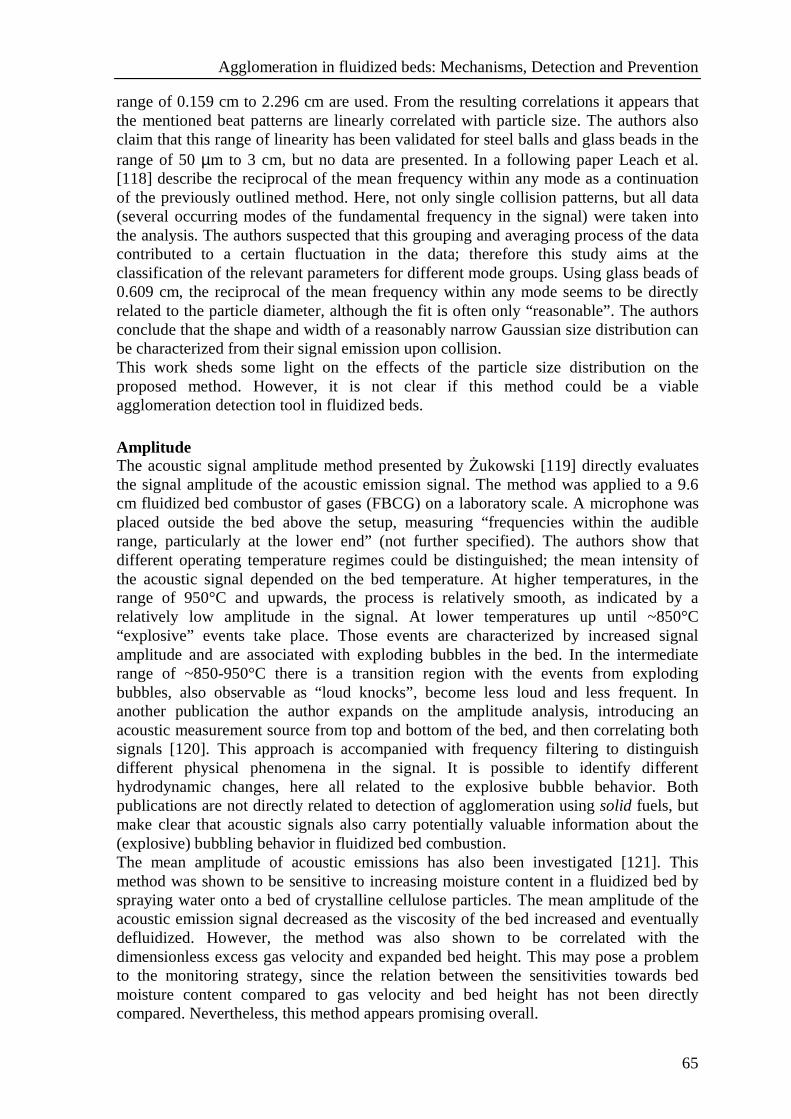
Agglomeration in fluidized beds: Mechanisms, Detection and Prevention
65
range of 0.159 cm to 2.296 cm are used. From the resulting correlations it appears that the mentioned beat patterns are linearly correlated with particle size. The authors also claim that this range of linearity has been validated for steel balls and glass beads in the range of 50 µm to 3 cm, but no data are presented. In a following paper Leach et al. [118] describe the reciprocal of the mean frequency within any mode as a continuation of the previously outlined method. Here, not only single collision patterns, but all data (several occurring modes of the fundamental frequency in the signal) were taken into the analysis. The authors suspected that this grouping and averaging process of the data contributed to a certain fluctuation in the data; therefore this study aims at the classification of the relevant parameters for different mode groups. Using glass beads of 0.609 cm, the reciprocal of the mean frequency within any mode seems to be directly related to the particle diameter, although the fit is often only “reasonable”. The authors conclude that the shape and width of a reasonably narrow Gaussian size distribution can be characterized from their signal emission upon collision. This work sheds some light on the effects of the particle size distribution on the proposed method. However, it is not clear if this method could be a viable agglomeration detection tool in fluidized beds. Amplitude The acoustic signal amplitude method presented by śukowski [119] directly evaluates the signal amplitude of the acoustic emission signal. The method was applied to a 9.6 cm fluidized bed combustor of gases (FBCG) on a laboratory scale. A microphone was placed outside the bed above the setup, measuring “frequencies within the audible range, particularly at the lower end” (not further specified). The authors show that different operating temperature regimes could be distinguished; the mean intensity of the acoustic signal depended on the bed temperature. At higher temperatures, in the range of 950°C and upwards, the process is relatively smooth, as indicated by a relatively low amplitude in the signal. At lower temperatures up until ~850°C “explosive” events take place. Those events are characterized by increased signal amplitude and are associated with exploding bubbles in the bed. In the intermediate range of ~850-950°C there is a transition region with the events from exploding bubbles, also observable as “loud knocks”, become less loud and less frequent. In another publication the author expands on the amplitude analysis, introducing an acoustic measurement source from top and bottom of the bed, and then correlating both signals [120]. This approach is accompanied with frequency filtering to distinguish different physical phenomena in the signal. It is possible to identify different hydrodynamic changes, here all related to the explosive bubble behavior. Both publications are not directly related to detection of agglomeration using solid fuels, but make clear that acoustic signals also carry potentially valuable information about the (explosive) bubbling behavior in fluidized bed combustion. The mean amplitude of acoustic emissions has also been investigated [121]. This method was shown to be sensitive to increasing moisture content in a fluidized bed by spraying water onto a bed of crystalline cellulose particles. The mean amplitude of the acoustic emission signal decreased as the viscosity of the bed increased and eventually defluidized. However, the method was also shown to be correlated with the dimensionless excess gas velocity and expanded bed height. This may pose a problem to the monitoring strategy, since the relation between the sensitivities towards bed moisture content compared to gas velocity and bed height has not been directly compared. Nevertheless, this method appears promising overall.
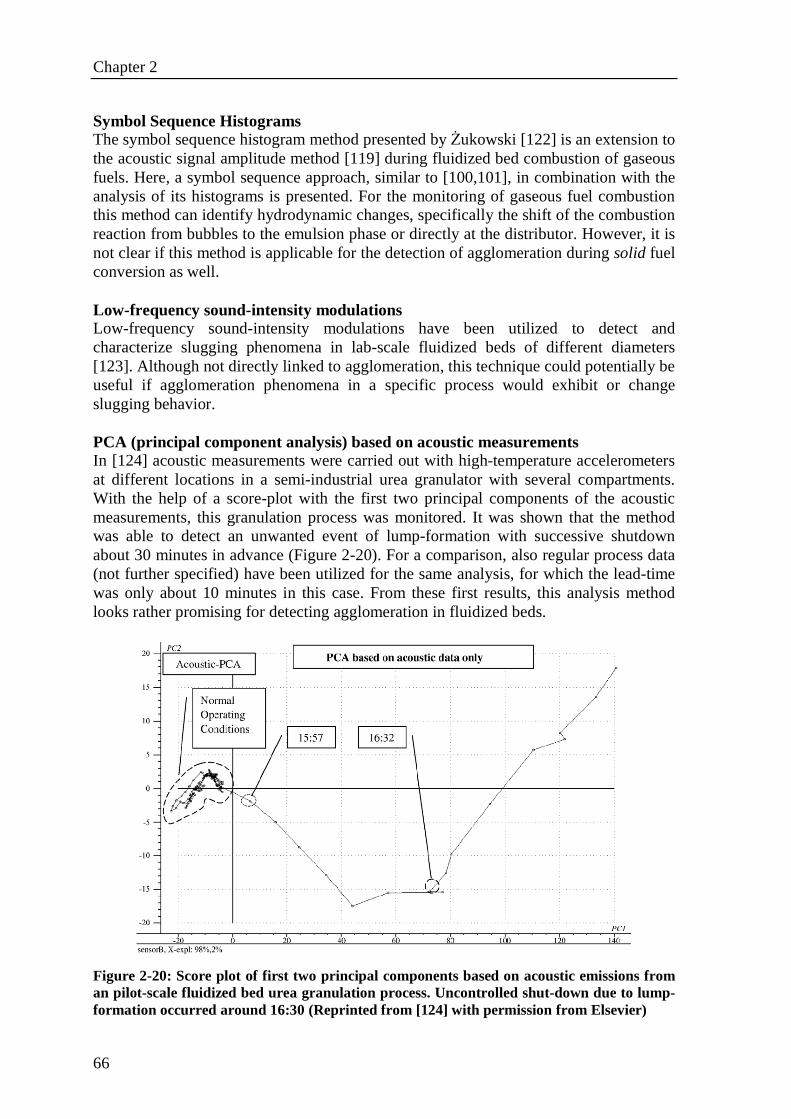
Chapter 2
66
Symbol Sequence Histograms The symbol sequence histogram method presented by śukowski [122] is an extension to the acoustic signal amplitude method [119] during fluidized bed combustion of gaseous fuels. Here, a symbol sequence approach, similar to [100,101], in combination with the analysis of its histograms is presented. For the monitoring of gaseous fuel combustion this method can identify hydrodynamic changes, specifically the shift of the combustion reaction from bubbles to the emulsion phase or directly at the distributor. However, it is not clear if this method is applicable for the detection of agglomeration during solid fuel conversion as well. Low-frequency sound-intensity modulations Low-frequency sound-intensity modulations have been utilized to detect and characterize slugging phenomena in lab-scale fluidized beds of different diameters [123]. Although not directly linked to agglomeration, this technique could potentially be useful if agglomeration phenomena in a specific process would exhibit or change slugging behavior. PCA (principal component analysis) based on acoustic measurements In [124] acoustic measurements were carried out with high-temperature accelerometers at different locations in a semi-industrial urea granulator with several compartments. With the help of a score-plot with the first two principal components of the acoustic measurements, this granulation process was monitored. It was shown that the method was able to detect an unwanted event of lump-formation with successive shutdown about 30 minutes in advance (Figure 2-20). For a comparison, also regular process data (not further specified) have been utilized for the same analysis, for which the lead-time was only about 10 minutes in this case. From these first results, this analysis method looks rather promising for detecting agglomeration in fluidized beds.
Figure 2-20: Score plot of first two principal components based on acoustic emissions from an pilot-scale fluidized bed urea granulation process. Uncontrolled shut-down due to lump-formation occurred around 16:30 (Reprinted from [124] with permission from Elsevier)
Agglomeration in fluidized beds: Mechanisms, Detection and Prevention
67
The Caterpillar algorithm [125] for detection of process changes also utilizes PCA, but in a slightly different way. The acoustic emission signal is analyzed with a moving window approach with two windows, the modelling window and prediction window (most recent data), located side by side. In the modelling window the variation of the data is calculated with a k component PCA approach. It is suggested to base the parameterization of the method on historical data. With the help of the Hotelling’s T2 statistics, a critical variation dcrit of the data is calculated based on a chosen confidence level. Next, the variation d of the modelling window is calculated and compared to dcrit. The number of samples larger than the critical variation is counted and graphically represented in an occurrences plot. The method is demonstrated for a lab-scale fluidized bed with induced agglomeration by liquid spraying. In the occurrence plots of the data, the method detected certain changes, related to “possible events”, such as spraying and agglomeration. The method was also shown to be robust in terms of different types of noise applied to the system. Overall, this method appears to be promising for the detection of process changes, also given the approach of relative comparison (moving windows) and the statistical significance of the obtained results. The suitability for a fuel conversion process would have to be investigated. Summary Acoustic emissions have been applied in various fluidized bed processes to characterize the fluidization state and/or regime, but one has to carefully choose the measuring equipment and location to avoid irrelevant sound emissions dominating the analysis. Agglomeration detection has not been specifically the subject of any investigation to the best of our knowledge. Nevertheless, we consider acoustic measurements to be a viable technique to characterize the fluidized bed and therefore also to have potential for early agglomeration detection. 2.4.2.3. Temperature Temperatures are commonly measured in (industrial) fluidized beds [89]. In solid fuel conversion processes, temperature measurements contain information on the degree of mixing of the bed, i.e. how quickly local temperature differences are equalized. For this reason it is a relevant measurement in terms of agglomeration detection. Compared with pressure measurements, temperature measurements are generally more localized and have smaller temporal resolution. Ideally, the temperature in fluidized beds is relatively homogeneous. However, larger installations and circulating fluidized beds in particular exhibit large-scale non-homogeneous flow patterns. Therefore special attention has to be given to the measurement position in terms of the relevance of the measurements. If high-frequency measurements are carried out, also the probe design has to be taken in account in terms of its response time – e.g. thicker shielding decreases temporal resolution.
Chapter 2
68
Fluctuations in radial bed temperature differences Lau and Whalley [126] proposed the detection of agglomeration based on temperature differences between two radially separated points within a fluidized bed. During the onset of agglomeration, the bed material became sticky and therefore its kinetic energy will be opposed by adhesive and cohesive interparticle forces; this will then slow down bed circulation. At the same time the thermal boundary surface (the surface which corresponds to the radial distance at which the temperature profile reaches the bulk bed value) shifts further away from the wall towards the centre of the bed. This technique was applied in a lab-scale batch 10 cm fluidized bed, equipped with wall-heating and operated with caking coal. The bed was equipped with differential pressure measurements, placed vertically inside the bed with pressure transducing pipes. Furthermore, the setup was equipped with a differential thermocouple (DT). The two measurement positions of this DT were radially displaced in the direction of the heat transfer; one thermocouple was at the centre of the bed (bulk temperature) and the other one close to the wall. For increasing bed temperature the DT-probe first measured a constant signal with relatively low fluctuations of about 2-4 °C. Beyond a certain point the DT-probe signal rapidly increased, until the point of defluidization (Figure 2-21). The anticipation time interval for defluidization was in the range of two minutes in this bed and depends on the various operating parameters; it increased for increasing fluidizing gas velocity, increasing heating rate, increasing bed depth, increasing plasticity of the bed material, and decreasing particle size. In terms of returning to normal fluidization conditions, the authors state that one can indeed return as long as the pressure drop signal has “not fallen off” significantly (not further quantified). One has to notice, however, that for practical applications in a fluidized bed utilized for solid energy conversion with full or partial oxidation supporting heat, the heat generation is not directly localized at the reactor wall, but internally at burning fuel particles. Therefore, the mechanism of radial heat transfer will not apply; the presented methodology is therefore theoretically not valid anymore and might therefore not work in practice. Another potential shortcoming is the decrease in defluidization anticipation time with decreasing heating rates. For a presented parameter set, this time goes down to zero below a heating rate of 7.5 K/min whereas the heating rate did not have any influence on the defluidization temperature. This indirectly shows that the presented method strongly depends on the dynamics of the change in hydrodynamics.
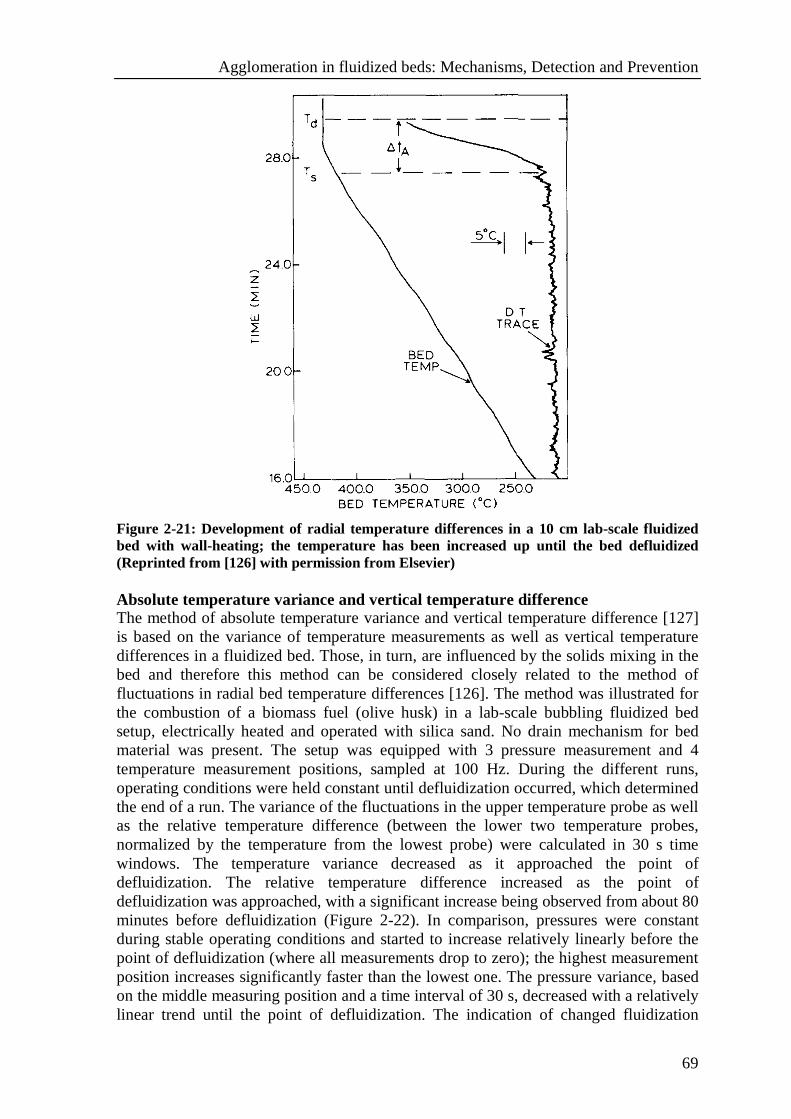
Agglomeration in fluidized beds: Mechanisms, Detection and Prevention
69
Figure 2-21: Development of radial temperature differences in a 10 cm lab-scale fluidized bed with wall-heating; the temperature has been increased up until the bed defluidized (Reprinted from [126] with permission from Elsevier) Absolute temperature variance and vertical temperature difference The method of absolute temperature variance and vertical temperature difference [127] is based on the variance of temperature measurements as well as vertical temperature differences in a fluidized bed. Those, in turn, are influenced by the solids mixing in the bed and therefore this method can be considered closely related to the method of fluctuations in radial bed temperature differences [126]. The method was illustrated for the combustion of a biomass fuel (olive husk) in a lab-scale bubbling fluidized bed setup, electrically heated and operated with silica sand. No drain mechanism for bed material was present. The setup was equipped with 3 pressure measurement and 4 temperature measurement positions, sampled at 100 Hz. During the different runs, operating conditions were held constant until defluidization occurred, which determined the end of a run. The variance of the fluctuations in the upper temperature probe as well as the relative temperature difference (between the lower two temperature probes, normalized by the temperature from the lowest probe) were calculated in 30 s time windows. The temperature variance decreased as it approached the point of defluidization. The relative temperature difference increased as the point of defluidization was approached, with a significant increase being observed from about 80 minutes before defluidization (Figure 2-22). In comparison, pressures were constant during stable operating conditions and started to increase relatively linearly before the point of defluidization (where all measurements drop to zero); the highest measurement position increases significantly faster than the lowest one. The pressure variance, based on the middle measuring position and a time interval of 30 s, decreased with a relatively linear trend until the point of defluidization. The indication of changed fluidization
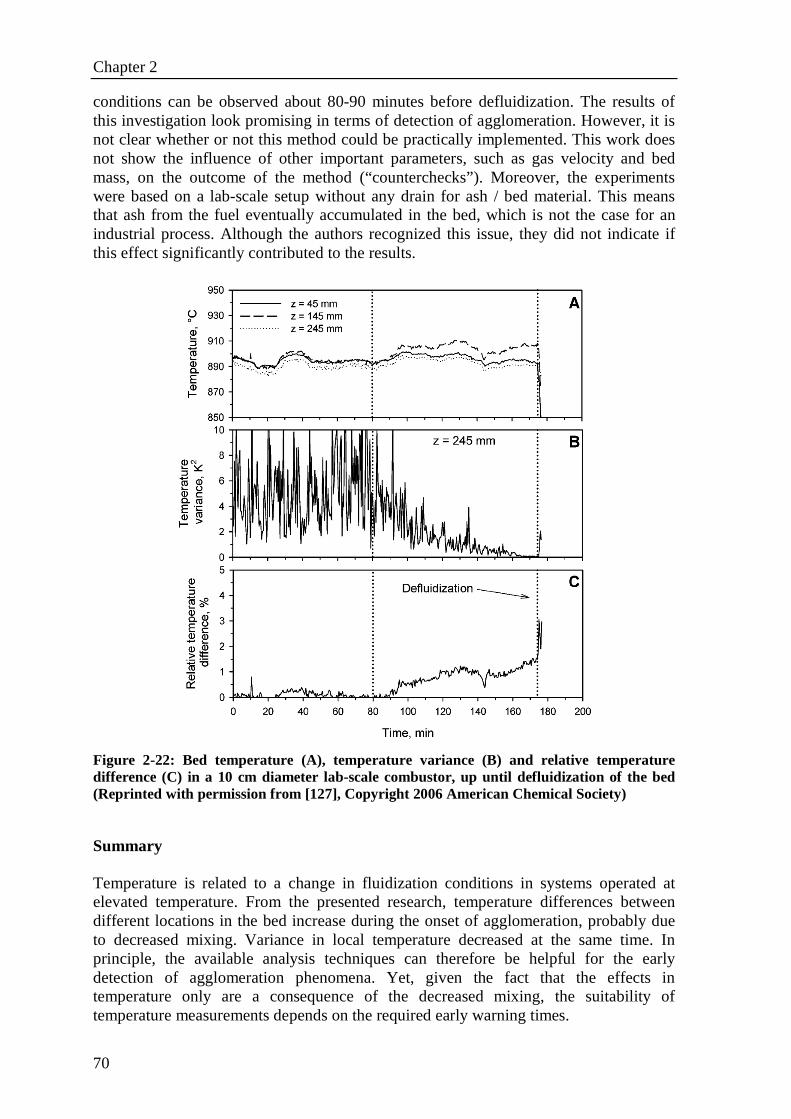
Chapter 2
70
conditions can be observed about 80-90 minutes before defluidization. The results of this investigation look promising in terms of detection of agglomeration. However, it is not clear whether or not this method could be practically implemented. This work does not show the influence of other important parameters, such as gas velocity and bed mass, on the outcome of the method (“counterchecks”). Moreover, the experiments were based on a lab-scale setup without any drain for ash / bed material. This means that ash from the fuel eventually accumulated in the bed, which is not the case for an industrial process. Although the authors recognized this issue, they did not indicate if this effect significantly contributed to the results.
Figure 2-22: Bed temperature (A), temperature variance (B) and relative temperature difference (C) in a 10 cm diameter lab-scale combustor, up until defluidization of the bed (Reprinted with permission from [127], Copyright 2006 American Chemical Society)
Summary Temperature is related to a change in fluidization conditions in systems operated at elevated temperature. From the presented research, temperature differences between different locations in the bed increase during the onset of agglomeration, probably due to decreased mixing. Variance in local temperature decreased at the same time. In principle, the available analysis techniques can therefore be helpful for the early detection of agglomeration phenomena. Yet, given the fact that the effects in temperature only are a consequence of the decreased mixing, the suitability of temperature measurements depends on the required early warning times.
Agglomeration in fluidized beds: Mechanisms, Detection and Prevention
71
2.4.2.4. Detection of gas-phase alkali components Another potential strategy to detect agglomeration related problems in fluidized beds is the detection of relevant gas phase components. Especially the presence of gaseous and fine solid alkali species can be an indirect link to the agglomeration process. “Plasma Excited Atomic Resonance Line Spectroscopy” (PEARLS) The PEARLS-technique [128] measures specific gas phase components based on atomic absorption spectroscopy. A gas stream is sampled from the fluidized bed via a horizontal sampling line with continuous gas flow. The gas is then mixed with a nitrogen plasma jet (generated by a DC plasma torch), which yields the dissociation of the alkali compounds. The alkali concentration itself is then determined by atomic absorption spectroscopy, which is based on the absorption of the different elements at characteristic wavelengths. Since the sampled gas stream is not filtered, the applied PEARLS-instrument also measures alkali from small particles. In this work two biomass fuels, pine bark and “forest residue” have been co-combusted together with coal or lignite. With an increased share of coal or lignite, relative to the biomass, decreased alkali concentrations have been measured. The authors explain this decrease with the formation of alkali chlorides and hydroxides to sulphates and alumino silicates. With the focus of this research not being on agglomeration detection, it remains questionable if the method could be applicable for an on-line agglomeration detection strategy. For this purpose, one would have to obtain more insight on the relation between the measured alkali concentration (from the gas phase as well as small particles) and the tendency of agglomeration. Eximer Laser Induced fragmentation Fluorescence (ELIF) Detecting gas-phase sodium and potassium by ELIF has been presented by Glazer et al. [129]. This technique is sensitive to gas-phase species only. In a lab-scale circulating fluidized it has investigated how fuel compositions and operating conditions influence the release of alkali components during combustion and co-combustion of high-alkali straw pellets and coal. The most important conclusions from this work include the strong temperature dependence of the alkali release into the gas phase. During combustion of straw, very high contents of gaseous alkali metals have been observed. However, the theoretical release based on the calculated thermodynamic equilibrium is an order of magnitude higher than the measured values. The authors propose that part of the released gaseous alkalis condenses on the bed material, walls, fly ash and/or aerosol particles (not detected by the method). Co-combustion experiments lowered the measured alkalis-species, more than would have been expected only from the mass balance on the biomass-coal fuel fed to the reactor. Although mechanisms for these phenomena cannot be extracted from the experimental work, the authors performed additional chemical equilibrium calculations. They show that during co-combustion with coal the formation of alkali-alumina-silicates is thermodynamically favored. This effect is rather strong, so that even small shares of coal in the fuel enhance this alkali sequestration. In terms of potential agglomeration problems, this mechanism is favorable since the alkali-alumina-silicates have relatively high melting temperatures and therefore stay in the bottom ash in solid form. On the other hand, for combustion of pure straw, relatively low gaseous alkali concentrations were also observed. This can be explained by the formation of alkali-silica-oxides (K2Si4O9) in the bed, which have low-
Chapter 2
72
melting temperatures and contribute to agglomeration. Gas-phase alkali measurements therefore are considered not suitable for on-line detection of agglomeration. Summary The presence of gaseous alkali species does not yield very conclusive information about the actual agglomeration tendency in a fluidized bed. The presence of gaseous alkali components can indicate potential agglomeration problems; however, the presence of gaseous alkali metals is not sufficient for the actual occurrence of agglomeration. One has to keep in mind that not only gaseous alkali components play a role in the agglomeration process. Moreover, the alkali concentration in the gas phase within the bed would be more relevant whereas the above-presented technologies only measure the gas phase above the bed. Yet, the described methods are potentially interesting in yielding more insight about the agglomeration mechanisms via the determination of gaseous species. For more detailed information regarding gas phase measurements the reader is referred to an exhaustive review paper by Monkhouse [130], which gives an overview of the detection of metal species in process gases, in particularly alkali and heavy metals. 2.4.2.5. Other measurement sources This chapter presents all other measurement techniques that were not part of the previous presented categories. Monitoring the fines content in the overhead gas stream The technique of monitoring the fines content in the exit gas stream [131] is presented for the gasification of coal in a circulating fluidized bed in which the sampling and analysis of the particle laden gas stream is carried out at the top of the main riser. The measured amount of fines is used to control the coal feed into the bed with the help of a carrier gas. If the formation of agglomerates is increasing, then an increase in the carrier gas velocity will reduce particle size in the bed through attrition, yet without excessive production of fines. A too high carrier gas velocity will then increase the fines contents. The carrier gas velocity therefore essentially generates controlled attrition of agglomerates and is controlled by the measured fines content. It remains questionable if this indirect effect is sufficient for drawing unambiguous conclusions on the state of the bed. “Bogging index” A “bogging index” is proposed [132] in an investigation of the fluidity of a pilot plant fluid coker of 1 m diameter with a fluidized bed height of about 2 m. The bogging index refers to a combination of 9 observations and measurements: visual observation of the vapour emitted from the coke, wetness of the coke, presence of “diet coke”, presence of “peas and beans” agglomerates, adhesiveness of the coke, flowability of the coke, pressure fluctuations in the circulation, particle size distribution and total liquid hydrocarbon content of the coke. The bogging index was said to have a good correlation with the reactor operability in the experience of the Canadian company “Syncrude”. The
Agglomeration in fluidized beds: Mechanisms, Detection and Prevention
73
reproducibility of this method is questionable, however, given that this method relies partly on subjective visual observations. Flow Fluctuation Characterization Device (FFCD) The FFCD technique [133] is based on the analysis of weight data from a vessel with continuous solids flow. The FFCD device itself consists of two vessels on top of each other with the lower vessel attached to a load cell, weighing the system; the weight of the lower vessel is sampled with 200 Hz. The lower vessel has an orifice at the bottom through which the solids exit and are re-circulated into the upper vessel. During the process some fines are removed from the system to establish a change in particle size. The analysis method comprises the calculation of the log-log plot of the power spectrum of the signal. The spectrum of the data was calculated by averaging the squared modulus of the normalized discrete Fourier transform of blocks of data (each containing 500 consecutive points). From the spectrum, a fit in the form of 1/fα
(f: frequency, α: characteristic exponent for the 1/f noise) was made. It was observed that after successive passings the removal of fines decreases α. Although the analysis is geared towards small particle changes, it could potentially be applied towards detecting the onset of agglomeration. This would, however, require implementing a special device for weight measurements in the fluidized bed.
Summary The amount of fines in the exit gas stream, combination of various bed characteristics (bogging index) and high-frequency weight measurements in a flow-through device have been applied besides the previously presented techniques. Aside from the bogging index, it appears that alternative measurement sources, compared to methods in the previous categories, are more indirect with respect to the actual agglomeration effects and more difficult to implement in existing fluidized bed processes.
2.5. Agglomeration counteraction strategies and technologies Methods for counteracting agglomeration are primarily designed for implementation in existing processes. They are distinguished into operational actions, utilization of additives fed to the process and alternative bed materials. A second, smaller group is concerned with improved reactor design and mainly found in the patent literature. 2.5.1. Methods for implementation in existing processes 2.5.1.1. Operational Lowering the bed (operating) temperature below the relevant melting points would be a very simple solution to agglomeration problems, as also reviewed in [77]. Reduction in temperature can be realized by varying of the air/fuel ratio. However, a decrease in this ratio is undesirable since it yields lower carbon conversions and higher tar-concentrations in the gas, an increase could extinguish the reaction. Moreover, low
Chapter 2
74
bed-temperatures generally result in unacceptable high CO-emissions [134]. One should also notice that the temperature in fluidized bed conversion exhibits significant local differences, e.g. in the splash-zone where the temperature can be much higher due to the combustion of volatiles from the fuel. It could therefore be more suitable to achieve a more homogeneous temperature distribution to prevent local temperature peaks. A temporary gas velocity increase to counteract agglomeration has not explicitly been reported in literature to the best of the authors’ knowledge. On lab-scale it has been occasionally reported that some weak agglomeration tendencies could be reversed by increasing the gas flow, e.g. [135]. One could suspect that this effect could help delay defluidization due to increased inter-particle forces hindering the agglomerate formation or breaking up agglomerates. Yet, it is questionable whether a gas velocity increase would be suitable to ultimately prevent agglomeration since it does not counteract the source of developing liquid-phase silicates. A simple strategy of stopping the fuel feed with continued gas flow to break up agglomerates was presented by Ergüdenler and Ghaly [17]. Straw was gasified in a cylindrical fluidized bed of diameter 25.5 cm and height 2.7 m, equipped with a so-called “dual distributor plate feeding system” for the solid fuel. This system consists of a main and a secondary distributor plate allowing direct feeding of fuel through the centre of the main distributor plate. Increasing the bed temperature from 450°C to 800-820°C, agglomeration took place starting at 800°C, forming big clusters in the secondary column when temperatures of 800-820°C were exceeded. At this point the fuel feed was switched off, but air supply was continued. Within 8-10 minutes, the large agglomerates were broken down and normal fluidization conditions were reinstated. For a 50% increase in gas flow (0.425 m3/min and 0.707 m3/min for the secondary and main air supplies, respectively), the time for breaking the agglomerates was slightly lower, 6-7 minutes. One has to keep in mind that this is a somewhat special fluidized bed construction with a secondary column including the fuel feed, so it is not clear whether the results can be directly applied to other systems. Nevertheless, this investigation shows that under certain conditions the continued fluidization without further fuel feed can reverse the agglomeration process and that the time for re-fluidization is shorter at higher gas velocities. A less drastic variant of this strategy could also be to reduce the fuel feed. Imposing pulsations on the gas flow (square- and sinewaves) has been investigated with CFD-simulations of 0.5 mm particles in a quasi-2-D (very flat) bubbling fluidized bed [136]. The authors demonstrated that under certain conditions the pulsation can retain fluidization, whereas without pulsation the bed is partly or completely defluidized; this has been shown to be relatively robust for a wide range of pulsation amplitudes and frequencies. Furthermore, it was observed that higher pulsation amplitude gave rise to more ‘curved’ bubbles and a higher pulsation frequency yielded smaller bubbles. It remains questionable whether this method would be applicable for commercial energy conversion: The agglomeration mechanisms can differ from the ones in this model system, industrial equipment will exhibit relatively large buffer effects and large fluctuations in the operating parameters during stable operation can be undesirable in industrial practice.
Agglomeration in fluidized beds: Mechanisms, Detection and Prevention
75
Controlling bed particle size by optimizing the drainage of spent bed material and addition of fresh sand has been described in [137] and can be considered the most frequently applied agglomeration counteraction method in industrial practice [113]. In an industrial fluidized bed boiler the bed particle size was gradually increased. In this installation the authors observed a quite constant percentage of K2O (~1 wt%) in the bed material after 1 week and 6 weeks of operation, which is subsequently defined as “critical” Na+K concentration. Based on a simple mass-balance model for Na+K the authors estimated necessary drainage rates for stable operation. A sieving installation in the recycle system of bed material was presented in [113]. Within the framework of monitoring agglomeration via attractor comparison an investigation was carried out in a 80 MWth bubbling fluidized bed combustor (owned by Essent and located in Cuijk, The Netherlands). This combustor is equipped with a recycling system for used bed material, automatically removing particles >1.2 mm via the sieving installation. It was shown that the bed material (a composite of 0.8-1.0 and 1.0-1.2 mm sand) could be successfully kept within particle size specifications below 1.2 mm with this installation. This technique is rather promising and relatively robust; however, one has to keep in mind that the increased refreshment also has an economic drawback, i.e. increased cost for waste treatment. Another method to prevent agglomeration phenomena is to pre-treat the fuel itself before introducing it into the actual process. The effect of pre-treatment of brown coal with aluminium [138,139,140] and calcium [141] was investigated. The coal was treated with a solution of aluminium lacetate in different manners. This pre-treated coal was then burned in a “drop-down” reactor, where ash composition, size distribution as well as SEM served to evaluate the resulting ash characteristics. The results show that aluminium pre-treated coals produce less sticky ash and that the aluminium capture onto sticky particles lowers its stickiness. In terms of an industrial implementation, the authors add that the sodium removal with this procedure was incomplete, so that for certain applications a more rigorous removal would be necessary. Moreover, since the aluminium has a beneficial effect on reducing the ash stickiness, economic considerations suggest the direct addition of alumina to be favourable. Pre-treatment with calcium has been carried out in a lab-scale spouted bed system and yielded similar results. The underlying effect also in this case is the removal of sodium combined with a reduction in particle stickiness. A leaching procedure with water for the pretreatment of different biofuels was presented in [142]. The biomass types were olive residue and wheat straw. The washing technique, called leaching in this work, was carried out with water; next the authors carried out combustion experiments in a lab-scale fluidized bed, with both treated and untreated material. The washing pretreatment affects the different fuels in different ways: The thermal behavior of the olive residue samples was significantly improved, leading to almost total removal of the problematic alkali components and ultimately resulting in unproblematic combustion. For the wheat straw samples, on the other hand, this leaching technique turned out to be insufficient to prevent the formation of agglomerates during the subsequent combustion testing. Although no further explanation about the reasons for this difference was presented, the authors state that the limiting effect of leaching on the alkali content of straw has also been observed elsewhere.
Chapter 2
76
Rinsing with water as well as acid leaching has been presented by Davidsson et al. [143]. The authors show that pre-treatment of biomass before combustion can be beneficial in terms of agglomeration, fouling and corrosion problems during combustion. For the release of alkali compounds, two different temperature regions were identified in a previous study by the same group: 200-500°C (pyrolysis phase) and 600-1000°C. Utilizing straw as well as wood as feedstock, two different techniques were investigated: Rinsing with de-ionized water and acid leaching. Subsequently, the biomass samples were heated at 20°C/min and the evolving vaporized compounds were analyzed with a surface ionization technique. Water washing and acid leaching techniques showed a reduction in the release of alkali compounds. In the range of 200-500°C, water washing reduced the alkali release 5-30%. Acid leaching leads to much more reduced release of about 70%. In the higher temperature range of 600-1000°C, washing led to a reduction of the measured alkali release of more than 90%. Moreover, the authors show that the alkalis in the biomass can be bound to the organic structure as well as being present in soluble form. With the help of cellulose as a model system of alkali being only present in the organic structure, the authors show that neither water washing nor acid leaching led to a significant release of alkalis from the organic structure. One can conclude that a quick washing can be effective for reducing the alkali release in biomass fuels, keeping in mind that this will be easier and cheaper than acid leaching. Moreover, fuel leaching could be an attractive option if considering the recycling of minerals back into the growth cycle via the soil. Blending rice straw with urban waste wood was investigated to counteract agglomeration [18]. Combustion experiments have been carried out in a pilot-scale fluidized bed combustor. With unblended rice straw the bed agglomerated rather quickly, in the order of 20-30 minutes. The addition of 25 % and 35 % of waste wood resulted in longer operating times: 1.5 h and 2 h, respectively. Successful operation was only achieved with blends of 50 % or less straw content. However, the pressure drop over the bed underwent gradual decline in a run with a 50 % blend, indicating possible agglomeration with longer operating times. Although not stated in this paper, the actual agglomeration tendency and whether or not the bed can be operated in a stable manner, also depend on the replacement rate of the bed material by fresh sand. Addition of sewage sludge was investigated in [77] and was shown to increase the agglomeration temperature significantly during the combustion of straw in a lab-scale installation. For the pure straw agglomeration temperatures of ~730-900°C were observed; addition of sludge increased the agglomeration temperature above 900°C in all cases, even for sludge concentrations as low as 14 wt%. The mechanism of this positive effect is not quite clear; it could very well just be that the sludge slows down the combustion reaction, thereby reducing local peak temperatures. Especially in light of the potential large availability, sludge could therefore form an interesting additive; yet, one has to keep in mind other potential side effects of this additive, e.g. introduction of heavy metals. The addition of coal has been investigated by Vuthaluru et al. [144]. Two different South Australians low-rank coal types (lignite) were blended with a sub-bituminous coal in two different ratios and then combusted in a lab-scale spouted bed combustor. It was observed that the experiments with coal blends resulted in at least 12-13 times longer operating times without observing defluidization (experiments were then
Agglomeration in fluidized beds: Mechanisms, Detection and Prevention
77
stopped). The key mechanism for the absence of defluidization is described by the increased formation of higher melting point phases that are less sticky; the presence of aluminium and calcium is expected to be responsible for this effect. Moreover, Glazer et al. [129] show that during the co-combustion of coal and straw the formation of alkali-alumina-silicates is thermodynamically favorable. Even small shares of coal favor this effect. In terms of agglomeration prevention, this is desirable since those alkali-alumina-silicates have relatively high melting points compared to alkali-silicates and therefore tend to remain in solid form in the bottom ash. Summary Temperature decrease and gas flow increase have been shown to have some potential for avoiding or delaying agglomeration; yet, they also have rather drastic impact on the operation and are therefore considered “emergency measures”. An optimized bed drain and/or sieving installation can provide a very promising operational solution, but also involves a potential increase in the cost of waste treatment for spent bed material. In this regard one also has to consider the appropriate waste “class” (category) of the bed material. The pre-treatment of the fuel itself has also been shown to be generally capable of successfully reducing agglomeration. For both bed and fuel pre-treatment it will be important to consider the overall process economics to assess whether or not a technique can be suitable in industrial practice. Using mixtures of different fuels by co-feeding (blending) an additional fuel - such as waste wood, sewage sludge and coal - has been shown to be successful in preventing agglomeration. Reducing the feed, decreasing the ratio between a “dangerous” fuel and a more “conservative” fuel and switching between fuels are rather common in industrial practice. This is, however, normally not reported in the open literature. 2.5.1.2. Additives A large group of publications is concerned with additives introduced into fluidized beds in order to decrease or avoid agglomeration. For many components, the basic underlying mechanism is the provision of alternative reactions with the alkalis, which avoids the formation of silicates with low melting points. The addition of “easily grindable particles” has been presented in the patent literature [145]: A “non-grindable” material, such as sand, is combined with “easily grindable particles”, such as e.g. limestone or dolomite. The easily grindable material will be pulverized (particle size decrease) in the fluidized bed, while binding ash at this same time. In some experimental results, carried out in a lab-scale circulating fluidized bed, it is illustrated that the biomass gasification with a difficult fuel can be operated without agglomeration continuously for about 10 hours. With this strategy one has to keep in mind potential excessive dust formation, which can lead to blocking of cyclones. The addition of silica sand of a different particle size has been demonstrated in [146]. Lochiel coal (1.3 wt% Na2O) has been combusted in a 7.6 cm lab-scale spouting fluidized bed with silica sand (99.8 wt% SiO2) with a particle size of 0.5-0.85 mm. Silica sand with a larger particle size of 0.85-1.0 mm and with smaller particle size of
Chapter 2
78
0.15-0.25 mm was added separately, with a feed rate of 15 wt% of the coal feed. The average bed temperature was 800°C. The reference case without any additives was operated for 190 minutes until being stopped due to defluidization. With addition of the larger sand particles the bed was operated for 235 minutes until it defluidized; with the addition of the smaller sand particles it was operated for 410 minutes, when the operation was terminated without defluidization. Nevertheless, it was observed that the bed particles had a thicker coating at this point. Given that only one comparison between the reference case and the addition of larger sand particles was carried out, it remains questionable whether this relatively small difference in defluidization time is statistical significant. An increase in inertia (see [94]) and a dilution effect could be responsible for prolonged operation. Dilution itself appears to not be the major effect as the dilution in terms of mass was the same for each addition. The beneficial effect of smaller particles, however, is surprising. The authors suspected that the fine particles capture the agglomerating components due to their larger surface area and are consecutively elutriated from the bed with the fly ash. In fact, the distribution of Na in bed material and fly ash indeed revealed that ~45 % of the Na ended up in the fly ash in case of addition of fines, as compared to ~30 % without additive. Yet, this percentage in case of the addition of the larger sand particles was also higher (~40 %). Another possible explanation is that the added fine sand particles capture alkalis on their surfaces, thereby only slightly increasing their size, or that several fine sand particles form small agglomerates, which are still small enough to be homogenously fluidized and do not lead to agglomeration problems. Iron(III) oxide (Fe 2O3) has been mentioned [22] to be a potentially useful additive. Together with K2O / Na2O and K2CO3 / Na2CO3 it can react to K2Fe2O4 / Na2Fe2O4 with a melting point of 1135°C. Hydrated alumino & magnesium silicates Hydrated alumino silicates and hydrated magnesium silicates have been suggested as additives in [147] to suppress agglomerate formation during fluidized bed combustion. The hydrated alumino silicates comprise kaolinite, montmorillonite, illite, pyrophillite, halloysite, nacrite, dickite, or a mixture of those; hydrated magnesium silicates comprise talc, serpentine, hectorite, or a mixture of those. The particle size of the additives should be in the same range as the carbonaceous material being introduced into the bed. The rate at which the additives are introduced should be chosen so that the additives in the bed make up between 2 and 20 wt% based on the carbonaceous material in the bed. Twelve different alumino silicates, including kaolin, have been investigated [148] for their suitability of binding sodium, applied to two different low-rank coals (with Na = 0.06 and 0.33 wt%) in a muffle furnace. Besides the observation that different additives were successful in binding sodium, it has been observed that even relatively small amounts of additive were sufficient to bind a large fraction of sodium: Samples with only 1 wt% of additive were enough to bind generally about 50-90 wt% sodium, depending on the fuel and operating conditions. An Al-Si-based clay material (category of hydrated alumino silicates), has been proposed [82]. The utilized additives were an Al-Si-based clay material (used as agglomeration inhibitor, composition not further specified) and limestone (used for SO2 capture) and were mixed in ratios of 15 and 30 wt% with fuel at a temperature of 600°C. Without additive, the compression strength of that mixture was ~2.5 N/mm2,
Agglomeration in fluidized beds: Mechanisms, Detection and Prevention
79
addition of 15 wt% and 30 wt% limestone resulted in a compression strength of ~1 N/mm2, addition of 15 wt% and 30 wt% clay resulted in a compression strength of ~0.25 N/mm2 and ~0.15 N/mm2, respectively. For both additives, addition of already 15 wt% was responsible for the largest decrease in the measured compression strength (no smaller amounts were investigated). This suggests that even small amounts of additives have a very beneficial effect on agglomeration prevention. Yet, it also has been observed that at higher temperatures (700°C) the compression strength can actually increase upon the addition of 15 wt% clay or limestone. This effect occurred due to the temperature being already above the sintering temperature of the pure ash. Yet, for a further increase in temperature the compression strength decreases again; it is not clear why this effect occurs. Two other types of clay, CW clay (rich in kaolinite and sillimanite (Al 2SiO5)) and DV clay (rich in kaolinite and quartz), have been investigated [150]. In lab-scale combustion tests with silica sand as bed material the addition of DV clay leads to slightly increased deposition on the bed material as compared to the deposition increase of the reference case without additives. The addition of CW clay leads to a significantly smaller weight increase than the reference case. From this perspective one would only consider the CW as suitable; however, it is also important to consider the physical properties of the depositions when assessing their benefit: Both additives generally formed a non-sticky ash, therefore not causing agglomeration. The addition of the sodium-binding additives kaolin, alumina (Al2O3) and gibbsite (Al(OH) 3) to low-rank coal has been suggested [139,140,149,150]. Synthetic ash mixtures of sodium-chloride, sodium-acetate and sodium sulphate with kaolin, silica and alumina have been prepared in solution, dried, pulverized and consecutively fired in a so-called “drop-tube” reactor. Results show that the ash products formed when adding kaolin and alumina can reduce agglomeration due to the formation of less sticky ash. The suitable size and amount of kaolin and alumina have been estimated to particle size between 10-20 µm and 2-3 wt% of the fuel (coal). Gibbsite has also shown to significantly reduce ash deposition in lab-scale fluidized bed combustion [150]. Andalusite (Al2SiO5) and gibbsite (Al(OH)3) have also been proposed [151]. A reduction in compression strength varying between “not detectible” and up to ~50% (depending on the fuel) has been observed in this case. Gibbsite (Al(OH)3) has also been investigated [77]; here, however, it was found not to affect the agglomeration temperature. Moreover, gibbsite (Al(OH)3) (called “alumina hydrate” here) and alumina, each of particle size 0.075-0.15 mm have also been investigated [146] with coal combustion in a 7.6 cm lab-scale spouting fluidized bed with silica sand (99.8 wt% SiO2) of a particle size of 0.5-0.85 mm. The additive was 15 wt% of the fuel feed. In case of alumina hydrate the reference case without any additives was operated for 190 minutes until stopped due to defluidization, while with the alumina hydrate additive one could be operated for 420 minutes without defluidization occurring, although the coating thickness increased. Similar results were observed with alumina, resulting in trouble-free operation of 420 minutes as compared to 235 minutes for the reference case without additive. Kaolin (mainly consisting of kaolinite (Al2O3•2SiO2•2H2O)) belongs in the group of hydrated alumino silicates and has received considerable attention in the literature [77,152,153,154,155]. It has been observed that kaolin can increase the agglomeration temperature by at least 60°C if adding ~2 wt% to the fuel feed and can increase the agglomeration temperature by ~30°C if adding ~3 wt% during combustion of biomass in a different 5 kW lab-scale
Chapter 2
80
installation [77]. It has been observed that the addition of kaolin increased the critical temperature for initial bed agglomeration by different degrees, depending on the fuel [152]. Agglomeration experiments were carried out in a bench-scale fluidized bed with sand and 10 wt% kaolin powder (<200 µm). The critical initial agglomeration temperature was raised from 739 to 886°C for wheat straw and from 988 to 1000°C in the case of bark as a fuel. The addition of kaolin results in coatings with different composition, mainly potassium-depleted. With the help of two ternary diagrams (K2O-CaO-SiO2 and K2O-Al2O3-SiO2) it is illustrated that coatings with altered composition have increased melting temperatures compared to normal silica sand. In a following investigation [153] the utilization of kaolin was investigated during the combustion of a combination of RDF (refuse-derive fuels) and MBM (meat and bonemeal). The particle size of kaolin was <200 µm and the bed material 200-250 µm; kaolin was added with a feed rate of 5 wt% of the fuel. The bed was operated at 730°C for ashing, after which the temperature was increased by external heating until defluidization. As compared to an agglomeration temperature of 830°C for the reference case without additive, adding kaolin raised the agglomeration temperature to 905°C. The capture of alkali metals with the help of kaolin in a fixed bed reactor has also been investigated [154]. The system was equipped with a surface ionization detector, which accurately measured the alkali-concentrations. It was shown that kaolin can be very suitable in capturing alkali metals in the gas phase. K2SO4 has been captured much less (~46 % uptake) in the experiments than KCl and KOH (~70-75 % uptake). In general, alkali removal efficiency decreased with higher temperature. This capture was shown to be irreversible (at 850°C in air) and did not produce sticky particles; it therefore appears to be a promising tool in counteracting agglomeration. The gasification of low-rank coal together with kaolin in a horizontal tube furnace has been investigated [155]. Different pre-treated samples (1 wt% Na, 10 wt% kaolin) have been exposed to temperature and gas composition in the furnace corresponding to fluidized bed gasification conditions. Mainly the amorphous sodium alumino silicate nepheline (Na2•Al 2O3•2SiO2) was formed, whereas at increasing temperatures (650-850°C) in steam also other amorphous components formed. Although these experiments were not carried out in a real fluidized bed, they illustrate the formation of high-temperature melting amorphous structures and confirm that kaolin is a useful additive to prevent agglomeration. Carbonates and oxides of alkaline earth metals (calcium, magnesium, barium) The two main groups of carbonates and oxides of calcium, magnesium or barium as well as mixtures thereof have been proposed [156] to prevent agglomeration problems in fluidized beds. The following agents are specifically proposed: Limestone composed largely of CaCO3, dolomitic limestone and marble. It is recommended that the bed should preferentially contain anywhere between 5-35 wt% of one of these agents with an average particle size of at least 0.5 mm; it is, however, not shown how those limits were obtained. The beneficial effect of small amounts of calcium oxide (CaO) in suppressing agglomeration has been presented [20]. The authors carried out agglomeration experiments in a bench-scale fluidized bed combustor (5 kW, bed diameter 10 cm). They showed that a major fraction (>90%) of the coating is limited to the ternary system K2O•CaO•SiO2. The melting points of certain silicates can be as low as 720°C. Addition of small amounts of calcium can shift the melting temperature to 1080°C, but the melting behaviour appears also to be very sensitive to relative amounts of potassium
Agglomeration in fluidized beds: Mechanisms, Detection and Prevention
81
and calcium. The addition of calcium oxide has been reported [22] to be potentially problematic. Although pure CaO has a melting point above 2500°C, if added to a Na2-SiO2 system it can form liquid-phase silicates and even low-melting eutectics Na2O•CaO•5SiO2 and 3Na2O•8SiO2 with melting points as low as 755°C at a CaO-content of only 5%. Although not investigated, it could therefore potentially lead to agglomeration. The presence of Ca can also have some negative influence on the agglomerate structure. Sometimes potassium in combination with alkaline earth elements, such as calcium, reacts with silicates deposited as fly ash to form molten glassy phases leading to tightly sintered structures [60]. Those agglomerates would be harder to break up again. Dolomite (mainly CaMg(CO3)2) has been proposed in [77] as an additive where it has shown to be able to increase the agglomeration temperature by at least 60°C if adding ~2 wt% to the fuel feed, measured during gasification of biomass in a 5 kW lab-scale installation. Dolomite has also been investigated in [153] during the combustion of a combination of RDF (refuse-derive fuels) and MBM (meat and bonemeal). The particle size of dolomite has been <200 µm and the bed material 200-250 µm; dolomite has been added with a feed rate of 5 wt% of the fuel. The bed was first operated at 730°C for ashing, after which the temperature was increased by external heating until defluidization. As compared to an agglomeration temperature of 830°C for the reference case without additive, adding dolomite raised the agglomeration temperature to 860-890°C. The addition of magnesium oxide (MgO) has also been proposed [77,157]. The basic idea [157] is to alter the evolving silicates of the resultant ash to raise the melting point and substantially reduce agglomeration of ash and sand. The authors illustrate this in a phase diagram for the material combination MgO-SiO2-K2O, indicating the melting temperatures of the mixture at different ratios. It has been observed that the addition of MgO to a mixture of sand, ash and some CaO lead to significantly reduced agglomeration as well as reduced endothermic peaks in a DTA analysis; this indicates reduced melting of compounds formed by ash reacting with the bed and/or within the ash itself. Moreover, the successful application of MgO addition in a parallel entrainment fluidized bed gasifier/combustor system is presented. MgO can reduce the agglomeration temperature by at least 60°C if adding ~2 wt% to the fuel feed (gasification of biomass in a 5 kW lab-scale installation) [77]. Summary The utilization of additives to prevent agglomeration has been investigated in numerous studies. There are many different additives that have been shown to prevent agglomeration. A few major additive groups appear to be hydrated alumino silicates and hydrated magnesium silicates as well as carbonates or oxides of calcium, magnesium or barium. In the process, certain elements and/or components from the additives participate in a chemical reaction with the alkalis. The different resulting silicates have higher melting points than components formed with only silica from the sand. The actual presence of certain elements and/or components is of primary importance, whereas the specific composition seems to be of secondary importance only. Given the fact that different materials are technically suitable, the cost of the additive will be a primary factor for the applicability in industry and has to be considered for each individual process. Adding bed material with increased particle size appears to have a
Chapter 2
82
delaying effect on agglomeration although this can partly originate from dilution. Other additives, such as fly ash from the process, could be another option. Finally, one must consider the contamination of the bed ash with the additive, i.e. whether or not this would have any consequences related to the process operation or costs for bed material treatment. 2.5.1.3. Alternative bed materials A different way of preventing agglomeration phenomena is the utilization of alternative bed materials, as compared to the commonly utilized silica sand. The silica from the sand forms a crucial part in the agglomeration process via the formation of low-melting point silicates with alkali salts from the fuel; a bed material low in or free of silica can therefore cause less or no agglomeration related problems. Alumina (Al 2O3) has been proposed in various forms as alternative bed material, directly as alumina, also called corundum [21,134], as well as alumina sand [22,135,158,159]. In fluidized bed combustion tests with normal silica sand some agglomeration has been observed from 700°C on at 1.5 % alkali content, whereas for alumina similar effects have been observed at 800°C at 2.4 % alkali content [134]. Elsewhere [21,22] alumina has been proposed without further experimental results. Alumina sand (85-90% Al2O3, 8-10% SiO2, rest others) [158] has been investigated as bed material intended for fluidized bed solid fuel conversion. The actual experiments were not carried out in a fluidized bed, but in a muffle furnace at elevated temperatures. Mixtures of alumina sand, straw and char/ash have been introduced into the furnace. Visual observations of the heat-treated alumina sand-straw ash mixtures showed some loose bonding of alumina particles at the lower temperatures (620°C and 740°C). These bonds were most likely physical in nature as there was not any apparent chemical interaction taking place between the alumina and the straw ash. A weak bonding of particles has been observed at 850°C and agglomerates with a hard and brittle structure formed at 1000°C, indicating that some chemical interactions between the alumina sand and the ash appeared to have taken place. In another study [160], silica sand was utilized under the same operating conditions; in that case no problems occurred at 620°C and 740°C and a hard and brittle structure formed at 850°C. In a subsequent paper [161] the application of alumina sand as bed material was investigated during fluidized bed gasification of straw pellets in a 400 kW bubbling fluidized bed gasifier with 25.5 cm internal diameter. During a gradual temperature increase the bed material started agglomerating and formed clusters of 3-5 mm in size at 920°C. Once the temperature exceeded 920°C, the entire bed material formed a big agglomerate about 2-3 minutes after the first indications of agglomeration. In an earlier study, the authors utilized silica sand as bed material; in this case it was not possible to operate the fluidized bed above 800°C due to the occurrence of severe agglomeration. This shows that the utilization of alumina sand as compared to silica sand increases the feasible operating temperatures. Alumina sand has been used for the combustion of peanut-hull pellets and propane gas [159]. Alumina was chosen as a replacement for silica sand, for which serious agglomeration occurred at about 1030°C. The alumina sand did not cause any agglomeration under the same operating conditions.
Agglomeration in fluidized beds: Mechanisms, Detection and Prevention
83
So-called mullite-sand (2SiO2•3Al2O3) [135] has been used as bed material in a heated batch fluidized bed with the addition of a fixed amount of alkali salts or alkali carbonates. As compared to silica sand, the bed did not defluidize up until 1100°C for different cases, with the exception of some slight agglomeration tendencies at ~800°C in one case. Compared to silica sand this is a significant improvement. Sillimanite (Al 2SiO5) has been proposed by Vuthaluru et al. [140,141,162]. Combustion experiments in a lab-scale spouted bed combustor were carried out with silica sand and calcined sillimanite as bed material at 800°C and 850°C [140]. The authors observed that operating times until defluidization could be significantly increased with those bed materials: 1.2 h and 0.5 h with silica sand compared to 7.7 h and 3.6 h with calcined sillimanite at 800°C and 850°C, respectively. Sillimanite (53.3% Al2O3, 43.7% SiO2) has been utilized [141,162] with a particle size in the same range as the reference silica sand, in the range of 0.85–1.0 mm. For a combustion temperature of 800°C, the silica sand bed defluidized after 1.2 h, whereas the sillimanite bed defluidized only after 7.7 h. XRD and SEM analysis showed that ash coatings from the combustion runs showed the presence of aluminum rich phases. In the presence of those aluminum rich phases, the silicates become less sticky at typical fluidized-bed combustion temperatures and thus enabled prolonged operation. Magnesium oxide (MgO) has been proposed [110,135]. MgO has been used as bed material in a heated batch fluidized bed with the addition of a fixed amount of alkali salts or alkali carbonates [135]. Compared to silica sand, the bed defluidized at somewhat higher temperatures as compared to the silica sand. In [110], MgO has been applied in a in a lab-scale fluidized bed setup in combustion mode firing straw, where it appears somewhat less prone to agglomeration. A major issue with MgO as bed material as compared to silica sand is that the agglomeration mechanisms differ: In case of MgO there is a slow decrease in pressure drop over the bed. This indicates that the bed, or parts of it, gradually defluidized and eventually totally defluidized. With silica sand the point of total defluidization was much more sudden and the pressure drop did not indicate the onset of the agglomeration process. Magnesite (MgCO3) has been proposed as alternative bed material [21,141,162]. The particle size of the magnesite bed material was the same as the reference silica sand, in the range of 0.85–1.0 mm. For a combustion temperature of 800°C, the silica sand bed defluidized after 1.2 h, whereas magnesite did not defluidize during 11.6 h of continuous operation. It is, however, not sure if magnesite would have agglomerated later as apparently the experiment was stopped at this point. Low melting compounds appear to have lost their liquid character in the presence of magnesium rich phases, rendering them less sticky at fluid bed temperatures. Magnesium also enhanced the presence of anhydrite, calcite, lime, periclase, dolomite, talc and feldspar phases and was therefore diluting the low-melting silicates, ultimately responsible for reducing the agglomeration tendency. Calcite (CaCO3), also called limestone, has been investigated and proposed in [141,162,163]. Calcite has been applied as bed material in a lab-scale fluidized bed combustor [141,162]. The particle size of the calcite bed material was chosen the same as the
Chapter 2
84
reference silica sand, in the range of 0.85–1.0 mm. For a combustion temperature of 800°C, the silica sand bed defluidized after 1.2 h, whereas calcite only defluidized after 9.9 h. As in the case of magnesium, calcium was diluting the low-melting silicates and therefore reduced the agglomeration tendency. Limestone, another term for calcite, was compared with silica sand in a 1 MWth cylindrical bubbling fluidized bed combustor with 1.1 m internal diameter [163]. The combustor was operated with brassica, thistle and almond shell at 775°C ± 75°C for ~ 8 h (if possible) under steady state conditions. Particle sizes were in the range of 0.25-2 mm for silica as well as limestone, with both material having very similar minimum fluidization velocities. Whereas silica as bed material led to the formation of agglomerates in case of thistle and almond shell, limestone as bed material did not yield any agglomerates during the experiments. It has also been observed that the alkali substances in the biomass fuel escape the bed mainly via the fly ash. The authors also suggest that the beneficial effect of limestone as bed material originates from adsorption of alkaline salts on the surface of the bed particles - it is therefore not clear if this could be a limitation for longer lasting (industrial) operation as adsorption is limited. In addition, deposition on the downstream heat exchangers was reduced for limestone as bed material as compared to silica. Dolomite (mainly CaMg(CO3)2) has been proposed as an alternative bed material being less prone to agglomeration; however, no data on its applicability has been presented [21]. In light of the beneficial effect of Mg and Ca as additives, it is expected to be a suitable bed material as well. Pre-calcined dolomite (CaO•MgO) has been used as bed material in a heated batch fluidized bed with the addition of a fixed amount of alkali salts or alkali carbonates [135]. Up to operating temperatures of 1100°C the bed did not defluidize. Yet, it is also stated that the resistance to abrasion could be an issue that would have to be improved, especially for circulating fluidized beds. Ferric Oxide (Fe2O3) has been proposed in [21,134]. In fluidized bed combustion tests [134] normal silica sand has shown some agglomeration behavior above 700°C at 1.5 % alkali content, whereas ferric oxide did not exhibit agglomeration up to 900°C with more than 20% alkali content (besides a few small agglomerates). Bauxite (high in Al) has been proposed [140,141,162]. Combustion experiments in a lab-scale spouted bed combustor [140] were carried out with silica sand as well as bauxite at temperatures of 800°C and 850°C. The authors observed that operating times until defluidization could be significantly increased with bauxite: 1.2 h and 0.5 h with sand as compared to 11.4 h and 5 h with bauxite at 800°C and 850°C, respectively. Bauxite with a composition of 60.7 % Al2O3 and 26.4 % Fe2O3 has also been applied as bed material in a lab-scale fluidized bed combustor in [162] and [141]. The particle size of the calcite was chosen in the same size range as the reference silica sand, 0.85–1.0 mm. For a combustion temperature of 800°C, the silica sand bed defluidized after 1.2 h, whereas bauxite defluidized after 11.4 h. From XRD and SEM analysis the authors observed that ash coatings from the combustion runs with sillimanite and bauxite bed materials showed the presence of aluminum rich phases. In the presence of those phases, the silicates became less sticky at typical fluidized-bed combustion temperatures, thus allowing prolonged operation.
Agglomeration in fluidized beds: Mechanisms, Detection and Prevention
85
Zirconium sand (ZrSiO4) has been used as bed material in a heated batch fluidized bed with the addition of a fixed amount of alkali salts [135]. For two results with different salts, the bed defluidized once at similar temperatures as silica sand (~800°C), for the other result it showed some defluidization tendency above 1000°C only. The benefit of zirconium sand therefore remains questionable. The utilization of a Nickel-Magnesium catalyst has been presented as a potential solution in terms of agglomeration problems [164]. Three different catalysts, Ni-MgO, Ni/MgO (15% atomic Ni/(Ni+Mg)) and Ni0.03Mg0.97O were used. Gasification of pine sawdust were carried out in a lab-scale bubbling fluidized bed (internal diameter of 2 cm), operated at temperatures of 650-850°C. The NiO-MgO catalyst was used for ~100 h; assessments via tar conversion as well as XRD (X-ray powder diffraction) indicate that no significant deactivation took place during this time period. It is not clear in which regard the utilized fuel as well as the catalyst is prone to the common agglomeration phenomena in fluidized beds for energy conversion, where low-melting silicates formed by alkali-salts from the biomass and the silica from the bed material play the major role in the agglomeration process. A reference experiment with silica sand as bed material to clarify this was not carried out. The increased conversion due to using a catalyst instead of inert bed material could increase the overall profitability of the process, although this is very questionable in the energy sector. One should also consider potential accumulation of nickel into the ash, which could increase cost and effort for recycling. The influence of particle size of silica sand on the defluidization time due to agglomeration has been investigated [23,94]. The effect of two different particle sizes on the defluidization time in a lab-scale combustor has been investigated [23]. An increase in particle size from 275 to 328 µm reduced the defluidization time by roughly 10-20%, at absolute defluidization times of 12-22 minutes (at different temperatures). This effect is explained by a lower specific surface area of the larger particles, which subsequently results in a thicker coating layer than with the smaller particle bed material for the same time period. In these experiments the absolute fluidizing gas velocity was the same for both particle sizes; this yields a lower ratio of actual gas velocity to minimum fluidization velocity (U0/Umf) for the larger particles. Any effects potentially increasing the defluidization time due to increased inertia are therefore excluded. As observed by Chirone et al. [94] during pine seed shell combustion on lab-scale, a particle size range of 600-850 µm resulted in the defluidization time being approximately doubled from ~320 to ~700 min compared to a particle size range of 212-400 µm. The fluidizing gas velocities were very similar. In this case this behavior is ascribed to the larger inertia of larger particles, leading to more energetic collisions and therefore a smaller likelihood of adhering to each other permanently. This observation is opposite to that of Lin et al. [23], although the applied operating conditions and fuel differed. Therefore it is not possible to draw a general conclusion on the effect of particle size in this stage. Also note that in none of those cases agglomeration was actually avoided. An alternative commercial bed material for fluidized bed combustion is presented is “GR GRANULE” [165]. The composition of this material is not further specified. Plywood waste, with 33% Na2O of the ash, was utilized during combustion in 4
Chapter 2
86
different bubbling fluidized bed boilers (5-25 MW). During operation for 9 months in a heating plant no agglomerate formation was observed except in the proximity of sources of silica that were unintentionally but occasionally present in the bed. The commercial, proprietary bed material AGGLOSTOPTM (Aker Kvaerner) [166] is a quartz-free bed material for fluidized beds and produced as a byproduct of rock crushing; no further details on the materials composition are revealed. This bed material has been applied in two industrial-scale bubbling fluidized beds of 15 and 74 MWth. For the 15MWth installation an operational period of 42 days with average bed temperatures of ~920°C was reported. For the 74 MWth installation, it was only reported that there were no agglomeration problems. Summary Many different bed materials have been suggested and investigated to avoid agglomeration. The basic idea for all materials is to substitute the silica normally present in regular silica sand, since silica participates in the formation of low-melting silicates. The major components of most bed materials comprise aluminum (Al), magnesium (Mg), calcium (Ca), iron (Fe) and mixtures thereof. In general, agglomeration is not necessarily avoided, but the agglomeration tendency is significantly reduced so that trouble-free operation is also extended. Lately, also some undisclosed commercial bed materials have become available, which seem to work well, according to limited information. The effect of particle size is not clear, as both smaller and larger particles have been observed to postpone, but not avoid defluidization. One additional important remark on alternative bed materials has to be made: Avoiding silica in the bed material itself may not necessarily be sufficient to avoid agglomeration if the fuel itself contains silica, like e.g. straw as indicated in [22] or rice hulls. Besides the technical issues, the material cost will determine the economic viability and plays a major role in deciding on the specific material. 2.5.2. Improved reactor design A number of patents describe different variations of the basic idea to remove developing agglomerates from the bed, often with the help of a grid at the bottom. A patent by the Institute of Gas Technology (IGTE) [167] describes an integrated system for withdrawal of agglomerates in a fluidized bed coal gasification process (‘U-Gas’). It consists of at least one grid-shaped withdrawal chamber below the fluidized bed. With a high-velocity gas stream an inverted cone in the withdrawal chamber is formed. By adjusting the velocity of this gas stream, agglomerates are removed (falling) downwards through the withdrawal chamber. A variant of the previously presented withdrawal systems for agglomerates is described by Vorres [168]. In fact, the design of this gasification process is such to stimulate local agglomerate formation instead of preventing this, in order to facilitate ash removal and handling. Another variant was presented by Rehmat et al. [90], based on a single or several conical grates with fluidizing gas ports through which gas is injected in order to fluidize the bed; at the same time agglomerates are discharged vertically through a pipe leading downwards. Further details on the grate design and performance are shown in the
Agglomeration in fluidized beds: Mechanisms, Detection and Prevention
87
description of the so-called “U-Gas Coal Gasification Process” [169]. Reufast et al. [170] present a similar approach, with agglomerates discharged through a pipe at the centre of a bottom grid. In a patent by Bryan et al. [171] a similar approach is presented as in [90], utilizing a perforated sloping support grid within the fluidized bed. At the base of this grid is an opening with a nozzle through which a discharge control gas is injected into the fluidized bed. Within this nozzle there is a central jet pipe through which fuel and oxidant are injected into the bed. They create a hot temperature zone directly above the nozzle, which provides the heat for maintaining the bulk-bed temperature. There are additional burners at the wall of the bed. The temperature in those hot zones is stated to be preferably 1093-2760°C. Please note that the high upper temperature boundary is probably not technically relevant but legally motivated, as these values are coming from a patent. Ash in the hot temperature zones softens and agglomerates. The agglomerates are fluidized by the gas injected from the base of the perforated sloping support until they reach a critical size at which they cannot be fluidized and fall into a solids withdrawal conduit. A “hydro beam floor” is applied in certain Aker Kvaerner fluidized bed boilers [166]. This floor enables evacuation of coarse bed material from the bottom over the whole cross section. This special floor is combined with a bed material (size) screening and consecutive return of useable bed material. However, no further details are provided. A high-velocity gas stream promoting break-up of agglomerates is presented in a patent by Less et al. [172], in which the authors describe a fluidized bed process for the conversion of a solid carbonaceous fuel. The bed is equipped with a gas nozzle, providing a high-velocity (230-1524 m/s) gas stream into the bed. This gas stream is described to provide a substantial portion of the overall mechanical energy input to disperse the fuel particles as well break-up agglomerates. The authors report that the high-velocity nozzles are also applicable for existing fluidized bed processes, although no further information is presented to support this statement. The utilization of a conical-shape fluidized bed is suggested by Aguado et al. [173]. In this work the authors present a spouted bed reactor for the pyrolysis of different plastics. The plastic covers the bed material to some degree with agglomeration potentially taking place. As a solution to prevent agglomeration, the authors present a conical shaped bed with increasing bed diameter with increasing bed height. Due to the conical shape of the bed a vigorous cyclic particle movement evolves, which can prevent agglomeration via mechanical break-up. For more adhesive Geldart-C cryogel particles it has been shown that a conical design can avoid the formation of agglomerates and defluidization compared to a cylindrical design, e.g. [174]. Conical beds are also often used for fluidized bed drying and granulation applications, where very wide particle size distributions can be present. In general, we consider a conical bed geometry as potentially beneficial to avoid agglomeration, also for the conversion of coal and biomass. Also there the mixing within the bed during the presence of agglomerates is expected to increase due to the circulation patterns with generally less dead zones. Yet, the authors are not aware of any further open literature specifically addressing the performance of conical geometries regarding the agglomeration behaviour in solid fuel conversion.
Chapter 2
88
A novel cyclone reactor without any inert bed material has been presented [175]. This reactor type has been demonstrated with the combustion of rice husk. Some agglomeration of needle-like agglomerates was observed with this reactor type. The authors solved this by installing a stirrer to break up the agglomerates. This concept is unlikely to be applicable in regular fluidized beds, but restricted to this reactor type and probably only to agglomerates that break up easily. Summary Several reactor designs to prevent agglomeration related operational problems have been presented in the literature. A large group of patents suggests a special bottom plate design, not to avoid the formation of agglomerates, but to remove agglomerates during operation. Despite appearing to be promising, it is not clear from the literature, mainly patents, to what extent these designs are also implemented in industry and how they actually perform in practice. Other potentially relevant techniques are concerned with local higher gas velocities or internal stirring to break up agglomerates; for any internals it remains highly questionable whether the relatively high design effort would be economically attractive as well as operationally robust in practice. Finally, it is remarked that “regular” fluidized beds are often tailored to specific fuels and bed materials that are locally available. Those modifications are normally less extensive than those presented here and often concern aspects such as fuel feed, bed material, heat exchange and recirculation of particles.
2.6. Conclusions This review on high-temperature agglomeration in fluidized beds is structured into three parts: Mechanisms responsible for agglomerate formation, methods to identify agglomeration – both measurement sources and analysis methods – and methods to counteract agglomeration. The applicability of detection and counteraction methods in an industrial environment receives special attention. Agglomeration mechanisms involve a complex interaction of phenomena, comprising aspects of hydrodynamics, chemical transformations and particle interaction mechanisms. Hydrodynamic aspects are concerned with interparticle forces in the same order of magnitude as the gravitational force. This effect is also referred to as an increased “stickiness” of bed particles and can refer to van der Waals and electrostatic forces and/or the presence of a liquid (melt) phase. Chemical transformations play an important role during the agglomeration in high-temperature solid fuel conversion processes. Alkalis can be volatilized and react to chlorides, hydroxides, oxides, sulphates or carbonates in the gas phase. Consecutive gas-solid and gas-gas reactions can take place and influence the formation of different silicates, the formation of sub-micron-particles and their condensation behaviour. Particle interaction mechanisms relate to the consequences of liquid-phase silicates between bed/ash particles. Those silicates can originate from inorganic components deposited on the surface via condensation and subsequent chemical reactions and/or direct ash melting due to locally high temperatures. The sticky silicates can either be distributed homogeneously over the
Agglomeration in fluidized beds: Mechanisms, Detection and Prevention
89
surface of the bed particles, eventually forming permanent bonds upon collision, or directly “glue” particles together upon localized deposition. Agglomeration detection methods are distinguished into off-line (ex-situ) fuel analysis methods and methods based on on-line process measurements. Ex-situ methods are based on the characterization of different rheological fuel properties and yield good predictive correlations in a few cases, but the overall picture does not suggest this approach to be reliable enough in practical applications. Reasons for this include principal differences in the agglomeration process in a testing device compared to the fluidized bed and changing fuels or fluctuating fuel properties. On-line process measurements can be realized with different measurement sources. Absolute pressure, absolute pressure fluctuations and pressure differences form an important group; specifically pressure fluctuation measurements are suitable as they characterize the overall hydrodynamics of the bed. Relatively simple methods such as the average pressure drop over the bed or standard deviation and variance have shown to work in some cases; however, they are not considered industrially applicable as they are either not reliable or too sensitive to other process changes, i.e. producing false alarms. Principal Component Analysis is not straightforward to apply in its current state, but could have interesting future potential. A comparably large number of publications advocate non-linear methods, to a large degree involving a state-space projection (=attractor) of high-frequency absolute or differential pressure fluctuation measurements. Attractor comparison has been shown to be suitable as an early warning tool in fluidized bed agglomeration tests. The Kullback-Leibler distance and the W-statistic have also been shown to be sensitive to agglomeration, but their sensitivities towards other process changes remain unclear. Bed temperature differences and temperature fluctuations as well as its variance have provided some positive results. Compared to pressure, temperature measurements have slower dynamics and a more local characteristic. Temperature inhomogeneties are generally considered to be a consequence of decreased mixing and therefore indicate potential agglomeration problems at a later stage than pressure. Acoustic emissions of fluidized beds have been researched for non-agglomeration related purposes; their suitability for agglomeration detection is worthwhile to investigate. Gas phase alkali measurements cannot be well related to agglomeration. Agglomeration counteraction strategies are categorized into manipulating operating conditions (including bed & fuel pre-treatment), using additives or alternative bed materials as well as adapted fluidized bed design. Operational strategies can involve drastic measures to avoid shutdowns in urgent cases, such as temperature decrease or stopping the fuel feed. More gradual methods involve increased bed recycle via a sieving installation, changing the ratio between two fuels or switching between fuels; those are already practiced in industry, but usually not published. Fuel pre-treatment has also been shown to be capable of successfully reducing agglomeration. Many publications are concerned with additives or alternative bed materials to prevent agglomeration. For additives the underlying principle is to avoid formation of a sticky layer of liquid-phase silicates by offering the preferred formation of other components with higher melting points. For alternative bed materials the principal idea is to avoid molten silicates by avoiding silica itself. Both have shown to successfully postpone or even avoid agglomeration. The most suitable additives and bed materials contain Ca,
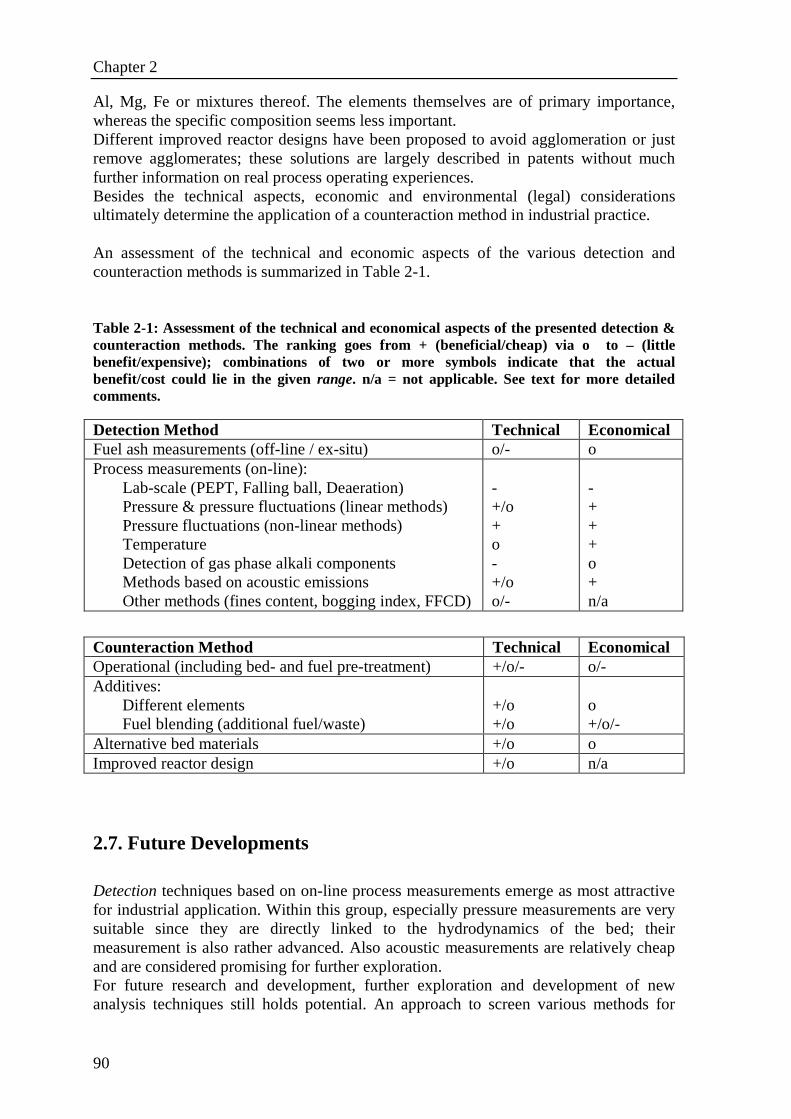
Chapter 2
90
Al, Mg, Fe or mixtures thereof. The elements themselves are of primary importance, whereas the specific composition seems less important. Different improved reactor designs have been proposed to avoid agglomeration or just remove agglomerates; these solutions are largely described in patents without much further information on real process operating experiences. Besides the technical aspects, economic and environmental (legal) considerations ultimately determine the application of a counteraction method in industrial practice. An assessment of the technical and economic aspects of the various detection and counteraction methods is summarized in Table 2-1. Table 2-1: Assessment of the technical and economical aspects of the presented detection & counteraction methods. The ranking goes from + (beneficial/cheap) via o to – (little benefit/expensive); combinations of two or more symbols indicate that the actual benefit/cost could lie in the given range. n/a = not applicable. See text for more detailed comments.
2.7. Future Developments Detection techniques based on on-line process measurements emerge as most attractive for industrial application. Within this group, especially pressure measurements are very suitable since they are directly linked to the hydrodynamics of the bed; their measurement is also rather advanced. Also acoustic measurements are relatively cheap and are considered promising for further exploration. For future research and development, further exploration and development of new analysis techniques still holds potential. An approach to screen various methods for
Detection Method Technical Economical Fuel ash measurements (off-line / ex-situ) o/- o Process measurements (on-line):
Lab-scale (PEPT, Falling ball, Deaeration) Pressure & pressure fluctuations (linear methods) Pressure fluctuations (non-linear methods) Temperature Detection of gas phase alkali components Methods based on acoustic emissions Other methods (fines content, bogging index, FFCD)
- +/o + o - +/o o/-
- + + + o + n/a
Counteraction Method Technical Economical Operational (including bed- and fuel pre-treatment) +/o/- o/- Additives:
Different elements Fuel blending (additional fuel/waste)
+/o +/o
o +/o/-
Alternative bed materials +/o o Improved reactor design +/o n/a
Agglomeration in fluidized beds: Mechanisms, Detection and Prevention
91
their suitability to selectively detect agglomeration has been introduced by us [176]. Also the application of several complementary analysis methods in parallel is considered rather promising to increase overall reliability, with computational resources being relatively cheap and powerful. Further development of monitoring techniques will not only be beneficial for agglomeration detection, but they should been seen in a broader context of improving efficiency by operating closer to process limits (optimization). For counteracting agglomeration, the utilization of inorganic additives and changes in the fuel composition have been shown to be most attractive in practice. More attention should be paid to the mechanical stability of alternative bed materials and additives, especially for Circulating Fluidized Beds which are widely used in large-scale industrial energy conversion. Economical aspects and local availabilities of fuel and bed material will play a great role in the choice of a suitable counteraction strategy and require special attention. Also the link with detection methods should be emphasized: Reliable monitoring methods can help to optimize the counteraction strategy, e.g. to minimize the amount of additives, thereby saving energy and resources. Furthermore, ash handling has to be taken into consideration. Does an additive or alternative bed material allow reuse or does it increase the cost of waste handling? The latter question is related to the current handling of the waste bed material, largely being used as a landfill. If the bound minerals are not leached back into the natural mineral cycle, one has to consider the impact of this mineral net-removal from the ground, especially related to the growth of future vegetation and agriculture.
2.8. References [1] Kunii D, Levenspiel O. “Fluidization Engineering”, Butterworth-Heinemann Ltd,
USA, 1991 [2] McKendry P. Energy production from biomass (part 2): conversion technologies.
Bioresource Technology 2002;83(1):47-54 [3] McKendry P. Energy production from biomass (part 3): gasification technologies.
Bioresource Technology 2002;83(1):55-63 [4] “Energy technologies at the cutting edge”, International Energy Agency (IEA); 2005 [5] “Renewables in Global Energy Supply – An IEA Fact Sheet”, International Energy
Agency (IEA); 2003 [6] Commission of the European Communities, 997 White Paper for a community
strategy and action plan: energy for the future: renewable sources of energy. 1997; COM (97) 599, Brussels
[7] Faaij APC. Bio-energy in Europe: changing technology choices. Energy Policy 2006;34:322–342
[8] Yerushalmi J, Kolodney M, Graff RA, Squires AM. Agglomeration of Ash in Fluidized-Beds Gasifying Coal - Godel Phenomenon. Science 1975;187(4177):646-648
[9] Gluckman, M.J., Yerushalmi, J. and Squires, A.M., Defluidization characteristics of sticky materials on agglomerating bed, Fluidization Technology, Vol. 2, (ed. Keairns, D.L.), 1976, p. 395 – 422
Chapter 2
92
[10] Ergun, S. (1952). Fluid flow through packed columns, Chemical Engineering Progress 1952;48:89–94
[11] Atakül, H. and Ekinci, E., Agglomeration of Turkish lignites in Fluidised-bed combustion, Journal of Institute of Energy 1989;62(450):56-61
[12] Rizeq, R.G. and Shadman, F. Alkali-induced agglomeration of solid particles in coal combustions and gasifiers, Chemical Engineering Communication 1989;81:83-96
[13] Dawson, M.R. and Brown, C.R. Bed material cohesion and loss of fluidization during fluidized bed combustion of midwestern coal, Fuel 1992;71:585-592
[14] Manzoori, A.R. and Agarwal, P.K. The fate of organically bound inorganic elements and sodium chlo-ride during fluidized bed combustion of high sodium, high sulphur low rank coals, Fuel 1992;71:513-522
[15] Conn, RE. Laboratory techniques for evaluating ash agglomeration potential in petroleum coke fired circulating fluidized bed combustors. Fuel Processing Technology 1995;44(1-3),95-103
[16] Anthony EJ, Jia L. Agglomeration and strength development of deposits in CFBC boilers firing high-sulfur fuels. Fuel 2000;79(15):1933-1942
[17] Ergüdenler A, Ghaly AE. Agglomeration of silica sand in a fluidized bed gasifier operating on wheat straw. Biomass and Bioenergy 1993;4(2):135-147
[18] Salour D, Jenkins BM, Vafaei M, Kayhanian M. Control of in-bed agglomeration by fuel blending in a pilot scale straw and wood fueled AFBC. Biomass and Bioenergy 1993;4(2):117-133
[19] Lin W, Krusholm G, Dam-Johansen K, Musahl E, Bank L. Agglomeration phenomena in fluidized bed combustion of straw, Proceedings of the 14th International Conference on Fluidized Bed Combustion, (Ed. Preto), ASME 1997, p. 831-838
[20] Öhman M, Nordin A, Skrifvars B-J, Backman R, Hupa M. Bed Agglomeration Characteristics during Fluidized Bed Combustion of Biomass Fuels. Energy & Fuels 2000;14(1):169-178
[21] Werther J, Saenger M, Hartge E.-U., Ogada T, Siagi Z. Combustion of agricultural residues. Progress in Energy and Combustion Science 2000;26(1):1-27
[22] Olofson G, Ye Z, Bjerle I, Andersson A. Bed Agglomeration Problems in Fluidized-Bed Biomass Combustion. Ind.Eng.Chem.Res. 2002;41:2888-2894
[23] Lin W, Dam-Johansen K, Frandsen F. Agglomeration in bio-fuel fired fluidized bed combustors. Chemical Engineering Journal 2003;96(1-3):171-185
[24] Arena U, Mastellone ML. The phenomenology of bed defluidization during the pyrolysis of a food-packaging plastic waste. Powder Technology 2001;120(1-2):127-133
[25] Laursen K, Grace JR. Some implications of co-combustion of biomass and coal in a fluidized bed boiler. Fuel Processing Technology 2002;76(2):77-89
[26] Yan R, Liang DT, Laursen K, Li Y, Tsen L, Tay JH. Formation of bed agglomeration in a fluidized multi-waste incinerator. Fuel 2003;82(7):843-851
[27] Yiannoulakis H, Yiagopoulos A, Kiparissides C. Recent developments in the particle size distribution modeling of fluidized-bed olefin polymerization reactors. Chemical Engineering Science 2001;56(3):917-25
[28] Marco E, Santos A, Menendez M, Santamaria J. Fluidization of agglomerating particles: influence of the gas temperature and composition on the fluidization of a Li/MgO catalyst. Powder Technology 1997;92(1):47-52
Agglomeration in fluidized beds: Mechanisms, Detection and Prevention
93
[29] Mikami T, Kamiya H, Horio M. The mechanism of defluidization of iron particles in a fluidized bed. Powder Technology 1996;89(3):231-238
[30] Rodriguez JM, Sanchez JR, Alvaro A, Florea DF, Estevez, AM. Fluidization and elutriation of iron oxide particles. A study of attrition and agglomeration processes in fluidized beds. Powder Technology 2000;111(3):218-230
[31] Delvinquier V, Fatah N, Pietrzyk S, Dauphin JY, Berte P, Bruyet B. Defluidization at high temperature in fluidized bed of sand by addition of calcium carbonate, Proceedings of 15th International Conference on Fluidized Bed Combustion, Vol. 2, (Heinschel, ed.), ASME, 1995; p. 801-806
[32] Frankenhaeuser M. Agglomeration in a Straw Fired Fluidized Bed Combustor, MSc. Thesis, Department of Chemical Engineering, Technical University of Denmark (1998)
[33] Basu P. A Study of Agglomeration of Coal-Ash in Fluidized-Beds. Canadian Journal of Chemical Engineering 1982;60(6):791-795
[34] Basu P, Sarka A. Agglomeration of coal ash in fluidized beds. Fuel 1983;62(8):924-926
[35] Siegell, JH. High-temperature defluidization. Powder Technology 1984;38(1):13-22
[36] Seville JPK, Silomon-Pflug H, Knight PC. Modelling of sintering in high temperature gas fluidisation. Powder Technology 1998;97(2):160-169
[37] Guo QJ, Suda T, Sato J, Yue GX. Agglomeration behavior in a bubbling fluidized bed at high temperature. Chemical Engineering Communications 2004;191(10):1329-1342
[38] Liss B, Blake TR, Squires AM, Bryson R. Incipient defluidization of sinterable solids. Fluidization IV (eds. Kunii, D. et al.) 1984, p.249-256
[39] Moseley JL, O’brien TJ. A model for agglomeration in a fluidized-bed. Chemical Engineering Science 1993;48(17):3043-3050
[40] Geldart D. Types of gas fluidization. Powder Technology 1973;7(5):285-292 [41] Molerus O. Interpretation of Geldart Type-A, Type-B, Type-C and Type-D
Powders by Taking into Account Interparticle Cohesion Forces. Powder Technology 1982;33(1):81-87
[42] Visser J. Van der Waals and other cohesive forces affecting powder fluidization. Powder Technology 1989;58(1):1-10
[43] Seville JPK, Willett CD, Knight PC. Interparticle forces in fluidisation: a review. Powder Technology 2000;113(3):261-268
[44] Seville JPK, Clift R. The effect of thin liquid layers on fluidisation characteristics. Powder Technology 1984;37(1):117-129
[45] Ennis BJ, Tardos G, Pfeffer R. A Microlevel-Based Characterization of Granulation Phenomena. Powder Technology 1991;65(1-3):257-272
[46] Lin W. Theories and mechanisms of particles sticking or capturing to other surfaces upon collision, CHEC report, Department of Chemical Engineering, Technical University of Denmark, 1999
[47] Yates JG. Effects of temperature and pressure on gas-solid fluidization. Chemical Engineering Science 1996;51(2):167-205
[48] Borch S. Agglomeration in fluidized bed combustion of straw, MSc. Thesis, Department of Chemical Engineering, Technical University of Denmark, 1997
[49] Schügerl, K. Rheological behaviour of fluidized systems. In: Davidson JF, Harrison D. editors. Fluidization, Chapter 6, Academic Press, London; 1971, p. 261
Chapter 2
94
[50] Atakül H, Ekinci E. Agglomeration in Lignite Ash Flotsam-Rich and Jetsam-Rich Systems. Powder Technology 1990;60(2):77-82
[51] Ekinci E, Atakül H, Tolay M. Detection of Segregation Tendencies in a Fluidized-Bed Using Temperature Profiles. Powder Technology 1990;61(2):185-192
[52] Lin W, Dam-Johansen K. Sintering in Biofuel and coal-biofuel fired FBC, Final report to EC Joule III, Department of Chemical Engineering, Technical University of Denmark (1997)
[53] Manzoori AR, Lindner ER, Agarwal PK, Inorganic transformation during the circulating fluid bed combustion of low-rank coals with high content of sodium and sulphur, Proc. of the Eng. Foud. Conf. on Inorganic Transformations and ash deposition during combustion, Palm Coast, Florida, USA, March 10 - 15, 1991, p. 735-762
[54] Anthony EJ, Iribarne AP, Iribarne JV. A new mechanism for FBC agglomeration and fouling when firing 100% petroleum coke, Proceedings of the 13th International Conference on FBC, Vol. 1; 1995, p. 523-533
[55] Anthony EJ, Jia L, Preto F, Iribarne AP, Iribarne JV. Agglomeration and fouling in petroleum coke fired boilers, Paper presented at the 32nd IEA FBC Conversion Meeting, Gothenburg, Sweden, June 27 - 30, 1996
[56] Olanders B, Steenari B-M. Characterization pf ashes from wood and straw, Biomass and Bio-energy 1995;8:105-115
[57] Jenkins BM, Baxter LL, Miles TR, Miles Jr. TR, Oden LL, Bryers RW, Winther E. Composition of ash deposits in biomass fuelled boilers: Results of full-scale experiments and laboratory simulations, Paper presented at 1994 Int. ASAE Summer Meeting, Kansas City, Kansas, June 19-24, 1994
[58] Knudsen JN, Jensen PA, Dam-Johansen K. Transformation and Release to the Gas Phase of Cl, K, and S during Combustion of Annual Biomass. Energy Fuels 2004;18(5):1385-1399
[59] Benson SA, Sondreal EA, Hurley JP. Status of coal ash behavior research. Fuel Processing Technology 1995;44(1-3):1-12
[60] Baxter LL, Miles TR, Miles TR, Jenkins BM, Milne T, Dayton D, Bryers RW, Oden LL. The behavior of inorganic material in biomass-fired power boilers: field and laboratory experiences. Fuel Processing Technology 1998;54(1-3):47-78
[61] Visser HJM, van Lith SC, Kiel JHA. Biomass ash-bed material interactions leading to agglomeration in FBC. Proceedings of the 17th International Conference on Fluidized Bed Combustion 2003, paper 150, ASME, New York, USA; 2003
[62] Levin EM, Robbins CR, McMudie HF. Phase diagrams for ceramists, Vol. 1, The American Ceramic Society, Inc., 1964, p.87
[63] Lin W, Dam-Johansen K. Sulphur Capture by Alkali Content of Straw during Co-firing with Coal in FBC. Prospects for Coal Science in the 21st Century, Ed. B.Q.Li and Z.Y.Liu, 1999, pp. 1421-1424
[64] Sander B, Henriksen N, Larsen OH, Skriver A, Ramsgaard-Nielsen C, Jensen JN, Stærkind K, Livbjerg H, Thellefsen M, Dam-Johansen K, Frandsen FJ, van der Lans R, Hansen J. Emissions, Corrosion and Alkali Chemistry in Straw-Fired Combined Heat and Power Plants. 1st World Conference on Biomass for Energy and Industry, June 2000, Sevilla, Spain
[65] Visser HJM. The influence of fuel composition on agglomeration behaviour in fluidised-bed combustion. ECN (Energy research Centre of the Netherlands) report ECN-C--04-054 (2004)
Agglomeration in fluidized beds: Mechanisms, Detection and Prevention
95
[66] Palchonok GI, Breitholtz C, Thunman H, Leckner B. Impact of Heat and Mass Transfer on Combustion of a Fuel Particle in CFB Boilers. Proceedings of the 14th International Conference on Fluidized Bed Combustion, (Ed. Preto), Vol. 2, ASME 1997, pp. 871–878
[67] Manzoori AR, Agarwal PK. Agglomeration and defluidization under simulated circulating fluidized-bed combustion conditions. Fuel 1994;73(4):563-568
[68] Chirone R, Salatino P, Scala F. The Relevance of Attrition on the Fate of Ashes during Fluidized-bed Combustion of a Biomass. Proceedings of the Combustion Institute 2000;28:2279-2286
[69] Anthony EJ, Iribarne AP, Iribarne JV. A New Mechanism for FBC Agglomeration and Fouling in 100 Percent Firing of Petroleum Coke. Journal of Energy Resources Technology 1997;119:55-61
[70] Anthony EJ, Jia L, Preto F, Iribarne JV. Agglomeration and Fouling in Petroleum Coke Fired Boilers. Proceedings of the 14th International Conference on Fluidized Bed Combustion (Ed. Preto), Vol. 2, ASME 1997, p. 839-846
[71] Skrifvars BJ, Hupa M, Anthony EJ. Mechanisms of Bed Material Agglomeration in a Petroleum Coke-Fires Circulating Fluidized Bed Boiler. Journal of Energy Resources Technology 1998;120:215-218
[72] Wright PC. Letter to the Editor. AIChE Journal 1998;44(9):2135 [73] Raask E. Sintering Characteristics of Coal Ashes by Simultaneous Dilatomery-
Electrical Conductance Measurements. Journal of Thermal Analysis 1979;16:91-102
[74] Conn RE, Austin LG. Studies of sintering of coal ash relevant to pulverized coal utility boilers: 1. Examination of the Raask shrinkage—electrical resistance method. Fuel 1984;63(12):1664-1670
[75] Stallmann JJ, Neavel RC. Technique to measure the temperature of agglomeration of coal ash. Fuel 1980;59(8):584-586
[76] Huffman GP, Huggins FE, Dunmyre GR. Investigation of the high-temperature behaviour of coal ash in reducing and oxidizing atmospheres. Fuel 1981;60(7):585-597
[77] van der Drift A, Olsen A. Conversion of biomass, prediction and solution methods for ash agglomeration and related problems. Report ECN-C--99-090 (1999)
[78] Skrifvars B-J, Öhman M, Nordin A, Hupa M. Predicting Bed Agglomeration Tendencies for Biomass Fuels Fired in FBC Boilers: A Comparison of Three Different Prediction Methods. Energy Fuels 1999;13(2):359-363
[79] Compo P, Pfeffer R, Tardos GI. Minimum sintering temperatures and defluidization characteristics of fluidizable particles. Powder Technology 1987;51(1):85-101
[80] He Y. Characterisation of spouting behaviour of coal ash with thermo-mechanical analysis. Fuel Processing Technology 1999;60(1):69-79
[81] Skrifvars B-J, Backman R, Hupa M. Characterization of the sintering tendency of ten biomass ashes in FBC conditions by a laboratory test and by phase equilibrium calculations. Fuel Processing Technology 1998;56(1-2):55-67
[82] Skrifvars BJ, Hupa M, Hiltunen M. Sintering of ash during fluidized bed combustion. Industrial & Engineering Chemistry Research 1992;31:1026-1030
[83] Fernandez Llorente MJ, Carrasco García JE. Comparing methods for predicting the sintering of biomass ash in combustion. Fuel 2005;84(14-15):1893-1900
[84] Hupa M, Skrifvars B-J, Moilanen A. Measuring the sintering tendency of ash by a laboratory method. Journal of the Institute of Energy 1989;62:131-137
Chapter 2
96
[85] Tonmukayakul N, Nguyen QD. A new rheometer for direct measurement of the flow properties of coal ash at high temperatures. Fuel 2002;81(4):397-404
[86] Bridgwater J, Forrest S, Parker DJ. PEPT for agglomeration? Powder Technology 2004;140(3):187-193
[87] McDougall S, Saberian M, Briens C, Berruti F, Chan E. Using dynamic pressure signals to assess the effects of injected liquid on fluidized bed properties. Chemical Engineering and Processing 2005;44(7):701-708
[88] Geldart D, Wong ACY. Fluidization of powders showing degrees of cohesiveness—II. Experiments on rates of de-aeration. Chemical Engineering Science 1985;40(4):653-661
[89] Werther J. Measurement Techniques in Fluidized Beds. Powder Technology 1999;102:15-36
[90] Rehmat AG, Patel JG; Inst. Gas Technology (IGTE); “Controlling and maintaining fluidised beds - under non-steady state conditions in ash agglomerating fluidised beds” Patent US4544375-A (1985)
[91] Kai T, Furusaki S. Methanation of carbon dioxide and fluidization quality in a fluid bed reactor - the influence of a decrease in gas volume. Chemical Engineering Science 1987;42(2):335-339
[92] Davies CE, Fenton K. Pressure fluctuations in a fluidized bed: A potential route to the continuous estimation of particle size. IPENZ Transactions 1997;24(1):12-20
[93] Weinstein H, Shabaker RH, Tiller ML, Taylor JH, Pitzer DR; Exxonmobil Res & Eng CO (ESSO); “Process for detecting, monitoring changes in property of particulate to produce synthesis gas involves sensing pressure in fluidized bed, processing collected pressure fluctuation data and comparing it over time’, Patent WO 00/43118-A (2000)
[94] Chirone R, Miccio F, Scala F. Mechanism and prediction of bed agglomeration during fluidized bed combustion of a biomass fuel: Effect of the reactor scale. Chemical Engineering Journal 2006;123(3):71-80
[95] Fuller TA, Flynn TJ, Daw CS, Halow JS. Interpretation of Pilot-Scale, Fluidized-Bed Behavior Using Chaotic Time Series Analysis. Proceedings of the 12th International FBC Conference 1993, Edited by L.N. Rubow, Vol.1, 141-155
[96] Öhman M, Nordin A. A New Method for Quantification of Fluidized Bed Agglomeration Tendencies: A Sensitivity Analysis. Energy & Fuels 1998;12:90-94
[97] Daw CS, Hawk JA; US Dept. Energy (USAT); “Fluidisation quality analyser for fluidised beds in fluidised bed reactor - uses fast response pressure transducer to measure overall or part bed pressure drop and processes pressure drop signal to produce output voltage which changes with degree of fluidisation turbulence”, Patent US5435972-A (1995)
[98] van Ommen JR, Schouten JC, van den Bleek CM. An Early-Warning-Method for Detecting Bed agglomeration in Fluidized Bed Combustors. Paper No. FBC99-0150, Proc. 15th Int. Conf. on Fluidized Bed Combustion 1999, R. B. Reuther, ed., ASME, New York
[99] Takens F. Detecting Strange Attractors in Turbulence. Lecture Notes in Mathematics, Vol. 898, Dynamical Systems and Turbulence, D.A. Rand and L.-S. Young (Ed.), Springer Verlag, Berlin, Germany; 1981, p. 366
[100] Daw CS, Finney CEA, Nguyen K, Halow JS. Symbol Statistics: A new tool for understanding multiphase flow phenomena, in: Proceedings of the ASME Heat Transfer Division 1998, Vol. 5, R.A. Nelson Jr., T. Chopin, S.T. Thynell (Eds.), ASME, New York 1998, p. 221-229
Agglomeration in fluidized beds: Mechanisms, Detection and Prevention
97
[101] Finney CEA, Nguyen K, Daw CS, Halow JS. Symbol-sequence statistics for monitoring fluidization, in: Proceedings of the ASME Heat Transfer Division 1998, Vol. 5, R.A. Nelson Jr., T. Chopin, S.T. Thynell (Eds.), ASME, New York 1998, p. 405-411
[102] van der Stappen MLM, Schouten JC, van den Bleek CM. Deterministic chaos analysis of the dynamical behaviour of slugging and bubbling fluidized beds. In: Rubow L, Commonwealth G. (Eds.) Proc. 12th International Conference on Fluidized Bed Combustion. Vol. 1, ASME, New York, U.S.A.; 1993, p. 129-140
[103] Skrzycke DP, Nguyen K, Daw CS. Characterization of the fluidization behavior of different solid types based on chaotic time series analysis of pressure signals. In: Rubow L, Commonwealth G. (Eds.) Proc. 12th International Conference on Fluidized Bed Combustion. Vol. 1, ASME, New York, U.S.A., 1993, p. 155-166
[104] Wright J. Monitoring changes in time of chaotic nonlinear systems. Chaos 1995;5(2):356-366
[105] Schouten JC, van den Bleek CM. Monitoring the Quality of Fluidization Using the Short-Term Predictability of Pressure Fluctuations. AIChE Journal 1998;44(1):48-60
[106] van Ommen JR, Coppens MO, van den Bleek CM, Schouten JC. Early Warning of agglomeration in Fluidized Beds by Attractor Comparison. AIChE Journal 2000;46:2183-2197
[107] Diks C, van Zwet WR, Takens F, DeGoede J. Detecting the differences between delay vector distributions. Physical Review E 1996;53:2169
[108] van Ommen JR, Schouten JC, Coppens MO, van den Bleek CM. Monitoring fluidized bed hydrodynamics to detect changes in particle size distribution. In: Proc. 10th Engineering Foundation Conf. on Fluidization (Fluidization X), UEF New York; Editors: M. Kwauk, J. Li, W.-C. Yang, Beijing, China; 2001, 787-794, p. 787-794
[109] van Ommen JR. Monitoring Fluidized Bed Hydrodynamics. (PhD Thesis) Technical University of Delft, Delft, The Netherlands; 2001
[110] van Ommen JR, Schouten JC, Coppens M-O, Lin W, Dam-Johansen K, van den Bleek CM. Timely detection of agglomeration in biomass fired fluidized beds. Proceedings of the 16th International Conference on Fluidized Bed Combustion 2001, p. 1146-1159
[111] Korbee R, van Ommen JR, Lensselink J, Nijenhuis J, Kiel JHA, van den Bleek CM. Early Agglomeration Recognition System (EARS). Proceedings of the 17th International Conference on Fluidized Bed Combustion 2003, paper 151, ASME, New York, USA
[112] Nijenhuis J, Korbee R, Lensselink J, Kiel JHA, van Ommen JR. A method for agglomeration detection and control in full-scale biomass fired fluidized beds. Chemical Engineering Science 2007;62(1-2):644-54
[113] Korbee R, Lensselink J, van Ommen JR, Nijenhuis J, van Gemert M, Haasnoot K. Early Agglomeration Recognition System - EARS: From bench-scale testing to industrial prototype. ECN (Energy research Centre of the Netherlands) report ECN-C--04-052 (2004)
[114] Bartels M, Nijenhuis J, van de Kamp W, Lensselink J, Kiel J, Dek M, Adrichem T, Kapteijn F, van Ommen JR. Early Agglomeration Recognition System (EARS) for Industrial Circulating Fluidized Bed Conversion; 19th International Conference on Fluidized Bed Combustion, Vienna, in: Proceedings 19th FBC Conference, Part 2, Editor: F. Winter, ISBN: 3-200-00645-5 (2006)
Chapter 2
98
[115] Gheorghiu S, van Ommen JR, Coppens MO. Monitoring fluidized bed hydrodynamics using power law statistics of pressure fluctuations. in: U. Arena, R. Chirone, M. Miccio, and P. Salatino (ed.), Fluidization XI, Engineering Conferences International, 2004; p. 403-410
[116] Portoghese F, Berruti F, Briens C. Use of triboelectric probes for on-line monitoring of liquid concentration in wet gas–solid fluidized beds. Chemical Engineering Science 2005;60(22):6043-6048
[117] Leach MF, Rubin GA, Williams JC. Particle size determination from acoustic emissions. Powder Technology 1977;16(2):153-158
[118] Leach MF, Rubin GA, Williams JC. Analysis of Gaussian size distribution of rigid particles from their acoustic emission. Powder Technology 1978;19(2):189-195
[119] śukowski W. Acoustic effects during the combustion of gaseous fuels in a bubbling fluidized bed. Combustion and Flame 1999;117(3):629-635
[120] śukowski W. The pressure pulses generated by the combustion of natural gas in bubbling fluidized beds. Combustion and Flame 2002;30(1-2):15-26
[121] Tsujimoto H, Yokoyama T, Huang CC, Sekiguchi I. Monitoring particle fluidization in a fluidized bed granulator with an acoustic emission sensor. Powder Technology 2000;113(1-2):88-96
[122] śukowski W. An acoustic method of studying sequential explosions during gas combustion in bubbling fluidized beds. Combustion and Flame 2001;125(3):1075-1082
[123] Finney CEA, Daw CS, Halow JS. Measuring slugging bed dynamics with acoustic sensors. KONA: Powder and Particle 1998;16:125-135
[124] Halstensen M, de Bakker P, Esbensen KH. Acoustic chemometric monitoring of an industrial granulation production process - a PAT feasibility study. Chemometrics and Intelligent Laboratory Systems 2006;84(1-2):88-97
[125] Flåten GR, Belchamber R, Collins M, Walmsley AD. Caterpillar—an adaptive algorithm for detecting process changes from acoustic emission signals. Analytica Chimica Acta 2005;544(1-2):280-291
[126] Lau IT, Whalley BJP. A differential thermal probe for anticipation of defluidization of caking coals. Fuel Processing Technology 1981;4(2-3):101-115
[127] Scala F, Chirone R. Characterization and Early Detection of Bed Agglomeration during the Fluidized Bed Combustion of Olive Husk. Energy & Fuels 2006;20(1):120-132
[128] Häyrinen V, Hernberg R, Aho M. Demonstration of plasma excited atomic resonance line spectroscopy for on-line measurement of alkali metals in a 20 kW bubbling fluidized bed. Fuel 2004;83(7-8):791-797
[129] Glazer MP, Nafees AK, de Jong W, Spliethoff H, Schürmann H, Monkhouse P. Alkali Metals in Circulating Fluidized Bed Combustion of Biomass and Coal: Measurements and Chemical Equilibrium Analysis. Energy & Fuels 2005;19:1889-1897
[130] Monkhouse P. On-line diagnostic methods for metal species in industrial process gas. Progress in Energy and Combustion Science 2002;28(4):331-381
[131] Knudsen CW (KNUD-Individual), “Coal gasification using fluidized bed of char particles - to which coal is fed with carrier gas producing controlled attrition of agglomerates”, Patent US3927996-A (1975)
[132] Briens C, McDougall S, Chan E. On-line detection of bed fluidity in a fluidized bed coker. Powder Technology 2003;138(2-3):160-168
Agglomeration in fluidized beds: Mechanisms, Detection and Prevention
99
[133] Krouse DP, Davies CE. Signal Analysis for Distinguishing Similar Powder with a Flow Fluctuation Characterization Device. Journal of Chemical Engineering of Japan 2004;37(2):365-369
[134] Grubor BD, Oka SN, Ilic MS, Dakic, DV, Arsic, BT. Biomass FBC Combustion – Bed Agglomeration Problems. Proceedings of the 13th International Conference on Fluidized Bed Combustion 1995 (Editor K.J. Heinschel), Vol.1, p.515-522
[135] Zintl F, Öhman T. Alkali-induced particle agglomeration and bed-defluidization on CFB-combustion of biomass – Test of common and alternative bed materials. Biomass for Energy and Industry, Proceedings of the International Conference, Würzburg, Germany, 8-11 June 1998, Ed. by Kopetz, Weber, Palz, Chartier and Ferrero, C.A.R.M.E.N., Rimpar Germany; 1998, p. 1581-1584
[136] Wang XS, Rhodes MJ. Using pulsed flow to overcome defluidization. Chemical Engineering Science 2005;60(18):5177-5181
[137] Ryabov GA, Litoun DS, Dik EP. Agglomeration of bed material: Influence of efficiency of biofuel fluidized bed boiler. Thermal Science 2003;7(1):5-16
[138] Vuthaluru NB, Domazetis G, Wall TF, Vleeskens JM. Reducing fly ash deposition by pretreatment of brown coal: Effect of aluminium on ash character. Fuel Processing Technology 1996;46(2):117-132
[139] Vuthaluru HB. Remediation of ash problems in pulverised coal-fired boilers. Fuel 1999;78(15):1789-1803
[140] Vuthaluru HB, Zhang DK, Linjewile TM. Behaviour of inorganic constituents and ash characteristics during fluidised-bed combustion of several Australian low-rank coals. Fuel Processing Technology 2000;67(3):165-76
[141] Vuthaluru HB, Zhang DK. Effect of Ca- and Mg-bearing minerals on particle agglomeration defluidisation during fluidised-bed combustion of a South Australian lignite. Fuel Processing Technology 2001;69(1):13-27
[142] Arvelakis S, Vourliotis P, Kakaras E, Koukios EG. Effect of leaching on the ash behavior of wheat straw and olive residue during fluidized bed combustion. Biomass and Bioenergy 2001;20(6),459-470
[143] Davidsson KO, Korsgren JG, Pettersson JBC, Jäglid U. The effects of fuel washing techniques on alkali release from biomass. Fuel 2002; 81(2):137-142
[144] Vuthaluru HB, Zhang DK. Effect of coal blending on particle agglomeration and defluidisation during spouted-bed combustion of low-rank coals. Fuel Processing Technology 2001;70(1):41-51
[145] Kurkela E, Moilanen A, Kangasmaa K. (Valtion Teknillinen Tutkimuskeskus (VALW)) Gasification of biofuel comprises maintaining circulation through reactor containing fluidized particles and gasifying at a temperature higher than melting or sintering point of ashes produced from fuel. Patent WO0011115-A (2000)
[146] Bhattacharya SP, Harttig M. Control of Agglomeration and Defluidization Burning High-Alkali, High-Sulfur Lignites in a Small Fluidized Bed Combustor-Effect of Additive Size and Type, and the Role of Calcium. Energy & Fuels 2003;17(4):1014-1021
[147] Brown LD. (Exxon Res & Eng CO (ESSO)) Fluidised-bed gasification or carbonaceous solids - with alumino- or magnesium silicate addn. to inhibit ash sintering”, Patent EP88194-A (1983)
[148] Kyi S, Chadwick BL. Screening of potential mineral additives for use as fouling preventatives in Victorian brown coal combustion. Fuel 1999;78(7):845-855
[149] Vuthaluru HB, Vleeskens JM, Wall TF. Reducing fouling from brown coals by sodium-binding additives. Fuel Processing Technology 1998;55(2):161-173
Chapter 2
100
[150] Vuthaluru HM, Linjewile TM, Zhang DK, Manzoori AR. Investigations into the control of agglomeration and defluidisation during fluidised-bed combustion of low-rank coals. Fuel 1999;78(4):419-425
[151] Tangsathitkulchai C, Tangsathitkulchai M. Effect of bed materials and additives on the sintering of coal ashes relevant to agglomeration in fluidized bed combustion. Fuel Processing Technology 2001;72(3):163-183
[152] Öhman M, Nordin A. The Role of Kaolin in Prevention of Bed Agglomeration during Fluidized Bed Combustion of Biomass Fuels. Energy & Fuels 2000;14:618-624
[153] Öhman M, Nordin A, Lundholm K, Boström D, Hebman H, Lundberg M. Ash Transformations during Combustion of Meat-, Bonemeal, and RDF in a (bench-scale) Fluidized Bed Combustor. Energy & Fuels 2003;17:1153-1159
[154] Tran KQ, Iisa K, Steenari B-M, Lindqvist O. A kinetic study of gaseous alkali capture by kaolin in the fixed bed reactor equipped with an alkali detector. Fuel 2005;84(2-3):169-175
[155] Kosminski A, Ross DP, Agnew JB. Reactions between sodium and kaolin during gasification of a low-rank coal. Fuel Processing Technology 2006;87(12):1051-1062
[156] Fan L, Walawender WP. (Univ. Kansas (UNIV)) Pyrolysis of carbonaceous solids in fluidised bed of quartz sand - using e.g ground limestone as anti-agglomerant. Patent US4448589-A (1984)
[157] Paisley MA (Future Energy Resources Corp. (FUTU-Non-standard)), Paisley MA (PAIS-Individual), Ferco Enterprises Inc (FERC-Non-standard), JAW Enterprises LLC (JAWE-Non-standard). Reduction of ash agglomeration in parallel entrainment fluidized bed gasifier/combustor system involves supplementing carbonaceous feedstock with magnesium oxide before introducing feedstock into system. Patent WO200250214-A (2002)
[158] Ghaly, AE, Ergüdenler A, Laufer E. Agglomeration characteristics of alumina sand-straw ash mixtures at elevated temperatures. Biomass and Bioenergy 1993;5(6):467-480
[159] Saxena SC, Rao NS, Kasi AN. Fluidized bed incineration of peanut-hull pellets. Proceedings of the 12th International Conference on Fluidized Bed Combustion, San Diego, CA, New York, NY, Editor: Rubow LN, ASME 1993, p.1189-1199
[160] Ghaly, AE, Ergüedenler A, Laufer, E. Study of agglomeration characteristics of silica sand-straw ash mixtures using scanning electronic microscopy and energy dispersion X-ray techniques. Bioresource Technology 1994;48(2):127-134
[161] Ergüdenler A, Ghaly AE. Agglomeration of alumina sand in a fluidized bed straw gasifier at elevated temperatures. Bioresource Technology 1993;43(3):467-480
[162] Vuthaluru HB, Zhang DK. Remediation of ash problems in fluidised-bed combustors. Fuel 2001;80(4):583-598
[163] Fernández Llorente MJ, Cuadrado RE, Murillo Laplaza JM, Carrasco García JE. Combustion in bubbling fluidised bed with bed material of limestone to reduce the biomass ash agglomeration and sintering. Fuel 2006;85(14-15):2081-2092
[164] Wang T, Chang J, Cui X, Zhang Q, Fu Y. Reforming of raw fuel gas from biomass gasification to syngas over highly stable nickel–magnesium solid solution catalysts. Fuel Processing Technology 2006;87(5):421-428
[165] Daavitsainen JH, Laitinen RS, Nuutinen LH, Ollila HJ, Tiainen MS, Virtanen ME. Effect of GR GRANULE used as Bed Material to Reduce Agglomeration in BFB Combustion of Biomass with High Alkali Metal Content. In: Progress in
Agglomeration in fluidized beds: Mechanisms, Detection and Prevention
101
Thermochemical Biomass Conversion: Iea Bioenergy, Bridgwater AV (1st author); 2001, p.705-712, ISBN 0632055332
[166] Silvennoinen J. A new method to inhibit bed agglomeration problems in fluidized bed boilers. Proceedings of the 17th International Conference on Fluidized Bed Combustion, Publisher: American Society of Mechanical Engineers, 2003, p.377-385
[167] Inst. Gas Technology (IGTE). Coal ash agglomeration device - has fluidized bed in withdrawal chamber for high velocity gas stream. Patent US3935825-A (1976)
[168] Vorres KS. (Inst. Gas Technology (IGTE)) Withdrawing agglomerated particles from fluidised bed - via venturi passage with helical guide to increase discharge rate. Patent US4435364-A (1984)
[169] Goyal A, Rehmat A, Knowlton TM, Leppin D, Waibel RT, Patel JG. Support studies for the U-GAS coal gasification process. Part I: Fluidization. Fuel Processing Technology 1987;17(2):169-186
[170] Reufast C. (BP Chem Ltd. (BRPE)) Fluidised bed apparatus - has circular bed grid with form of two truncated conical surfaces vertices orientated downwards. Patent EP202076-A1 (1986)
[171] Bryan BG, Khinkis MJ, Rehmat AG. (Inst. Gas Technology (IGTE)). Thermal ash agglomeration in fluidised bed gasification appts. - by fuel-oxidant injection to create local zones where temp. is above bulk bed temp. and ash agglomeration temp. Patent US5158449-A (1992)
[172] Liss B, Welter CR, Liss B (LISS-Individual), Union Carbide Corp. (UNIC). Prevention of defluidization in the treatment of caking carbonaceous solids. Patent US4200495-A (1980)
[173] Aguado R, Prieto R, San José MJ, Alvarez S, Olazar M, Bilbao J. Defluidization modelling of pyrolysis of plastics in a conical spouted bed reactor. Chemical Engineering and Processing 2005;44(2):231-235
[174] Venkatesh RD, Chaouki J, Klvana D. Fluidization of cryogels in a conical column. Powder Technology 2000;89(3):179-186
[175] Madhiyanon T, Lapirattanakun A, Sathitruangsak P, Soponronnarit S. A novel cyclonic fluidized-bed combustor (ψ-FBC): Combustion and thermal efficiency, temperature distributions, combustion intensity, and emission of pollutants. Combustion and Flame 2006;146(1-2):232-245
[176] Bartels M, Vermeer B, Nijenhuis N, van Ommen R, Kapteijn F. Towards Selective Agglomeration Detection in Fluidized Beds Using Advanced Signal Analysis Methods. in: X. Bi, F. Berruti, T. Pugsley (ed.), Fluidization XII, Engineering Conferences International, 2007; p. 441-448 (ISBN: 978-0-918902-57-3)

102
103
Chapter 3
Detection of agglomeration and gradual particle size changes in circulating fluidized beds
As shown in the review of different agglomeration detection methods in the previous chapter, the attractor comparison method has been successfully applied in bubbling fluidized beds both on lab-scale and industrial scale. In this chapter it is investigated whether the attractor comparison can also be applied for the early detection of agglomeration in circulating fluidized beds. This investigation is motivated by the fact that circulating fluidized beds have become widely applied, especially for energy conversion. In addition to agglomeration detection, it is also investigated whether attractor comparison is sensitive to small (uni-modal) changes in particle size so that it can be used for on-line monitoring of the particle size. The analysis is based on high-frequency pressure measurements and different measuring locations are considered to determine optimal implementation of the method. Experiments have been carried out on lab-scale as well as industrial scale circulating fluidized beds. Small particle size changes on lab-scale have been realized by addition or substitution of bed material with a different size. For the industrial scale investigation the occurring changes in particle size during normal operation were measured by bed material sampling. Agglomeration has been realized under gasification conditions with biomass as fuel and has also been simulated by the addition of small model agglomerates in a cold-flow system, both on lab-scale. This chapter has been submitted for publication: Malte Bartels, John Nijenhuis, Freek Kapteijn, J Ruud van Ommen. Detection of agglomeration and gradual particle size changes in circulating fluidized beds. Powder Technology (2008)
Chapter 3
104
3.1. Abstract The monitoring of fluidized bed processes is important for the optimization of operational efficiency and avoiding unscheduled shut-downs in industrial practice. We here focus on two important applications for the industrially widely applied circulating fluidized beds (CFBs): the detection of small, gradual changes in particle size and the early detection of agglomeration. Based on high-frequency pressure fluctuation measurements we have applied the attractor comparison method in different CFBs to investigate its suitability as a monitoring tool for the two proposed applications. Attractor comparison has shown to be generally sensitive to small, gradual particle size changes in a lab-scale CFB. The sensitivity normally depends on the measurement location (downcomer, return system, riser) and is often larger in the downcomer section. From the results, detection limits for the particle size have been identified. In an industrial installation the sensitivity and applicability of the method for measurements in the riser has been confirmed. With the help of model agglomerates it has been shown that attractor comparison can also detect the presence of small shares of agglomerates on lab-scale; here, filtering the pressure fluctuation data before the analysis has shown to improve the method. The suitability of the method for agglomeration detection has been confirmed with a lab-scale agglomeration incident; in this case the approaching defluidization has been detected with an early time of about 30 min based on measurements in horizontal return-leg and lower riser.
3.2. Introduction Fluidized bed reactors are applied in a wide variety of processes in industry, comprising e.g. catalytic cracking, gas-phase polymerization and drying (e.g. [1]). They are also used in solid fuel conversion, where combustion is currently the most important application in terms of capacity, but also gasification is becoming increasingly important. Amongst other reasons especially geo-political considerations as well as the strongly increasing crude oil price have made coal attractive again lately. For the same reason, but also in light of environmental considerations, biomass usage is currently quickly increasing. Fluidized beds are generally very flexible with respect to the utilized fuel (e.g. [2]), which makes changes to other solid fuel sources as well as co-combustion of biomass and other fuels relatively easy to implement. Consequently, fluidized beds have become widely applied, mainly in rapidly developing countries in south-east Asia [3]. Still, solid fuel conversion in fluidized bed processes is facing technical difficulties; specifically agglomeration can be a major operational problem. Usually, the conversion of the solid fuel is carried out with silica sand as the bed material. Inorganic alkali components from the fuel, especially potassium (K) but also sodium (Na), can be a source of agglomeration. The content of this critical inorganic material can vary much between fuels; especially in the case of certain types of biomass (e.g. straw) as well as some low-rank coal types their content is often rather high. When both alkalis and silica are present in the bed they can form alkali silicates that are characterized by a lower melting point than the individual components. This lower melting point is often lower
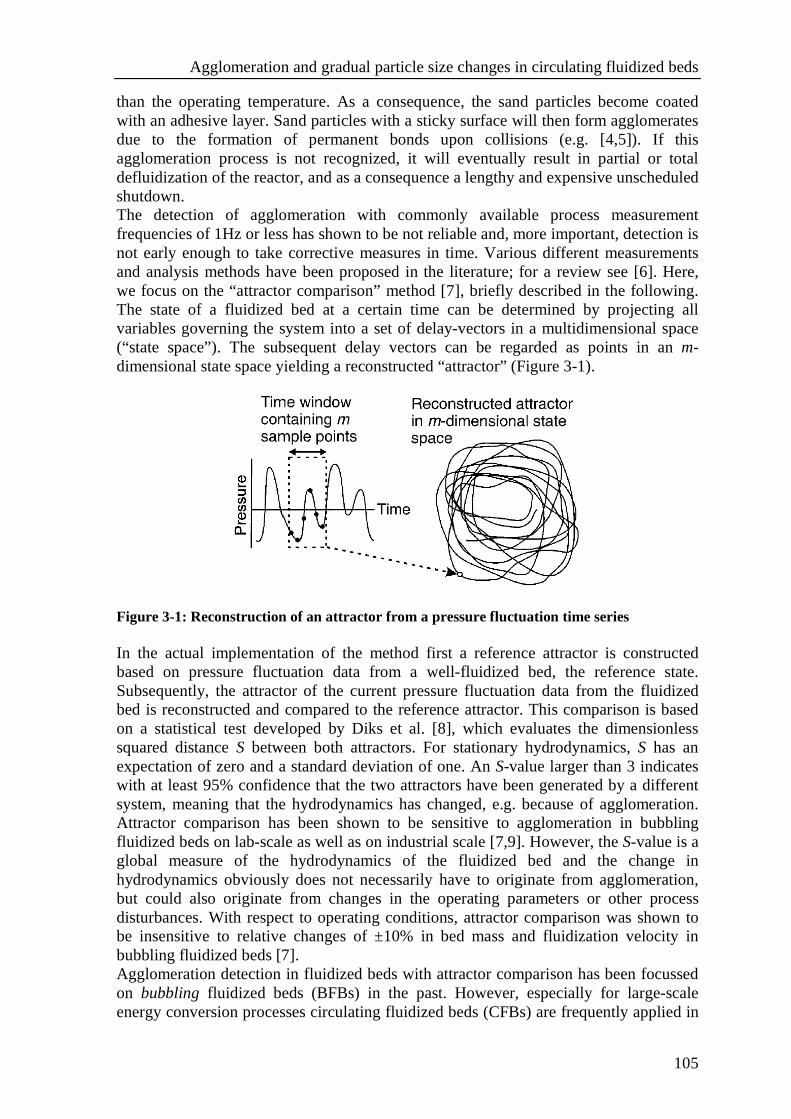
Agglomeration and gradual particle size changes in circulating fluidized beds
105
than the operating temperature. As a consequence, the sand particles become coated with an adhesive layer. Sand particles with a sticky surface will then form agglomerates due to the formation of permanent bonds upon collisions (e.g. [4,5]). If this agglomeration process is not recognized, it will eventually result in partial or total defluidization of the reactor, and as a consequence a lengthy and expensive unscheduled shutdown. The detection of agglomeration with commonly available process measurement frequencies of 1Hz or less has shown to be not reliable and, more important, detection is not early enough to take corrective measures in time. Various different measurements and analysis methods have been proposed in the literature; for a review see [6]. Here, we focus on the “attractor comparison” method [7], briefly described in the following. The state of a fluidized bed at a certain time can be determined by projecting all variables governing the system into a set of delay-vectors in a multidimensional space (“state space”). The subsequent delay vectors can be regarded as points in an m-dimensional state space yielding a reconstructed “attractor” (Figure 3-1).
Figure 3-1: Reconstruction of an attractor from a pressure fluctuation time series In the actual implementation of the method first a reference attractor is constructed based on pressure fluctuation data from a well-fluidized bed, the reference state. Subsequently, the attractor of the current pressure fluctuation data from the fluidized bed is reconstructed and compared to the reference attractor. This comparison is based on a statistical test developed by Diks et al. [8], which evaluates the dimensionless squared distance S between both attractors. For stationary hydrodynamics, S has an expectation of zero and a standard deviation of one. An S-value larger than 3 indicates with at least 95% confidence that the two attractors have been generated by a different system, meaning that the hydrodynamics has changed, e.g. because of agglomeration. Attractor comparison has been shown to be sensitive to agglomeration in bubbling fluidized beds on lab-scale as well as on industrial scale [7,9]. However, the S-value is a global measure of the hydrodynamics of the fluidized bed and the change in hydrodynamics obviously does not necessarily have to originate from agglomeration, but could also originate from changes in the operating parameters or other process disturbances. With respect to operating conditions, attractor comparison was shown to be insensitive to relative changes of ±10% in bed mass and fluidization velocity in bubbling fluidized beds [7]. Agglomeration detection in fluidized beds with attractor comparison has been focussed on bubbling fluidized beds (BFBs) in the past. However, especially for large-scale energy conversion processes circulating fluidized beds (CFBs) are frequently applied in
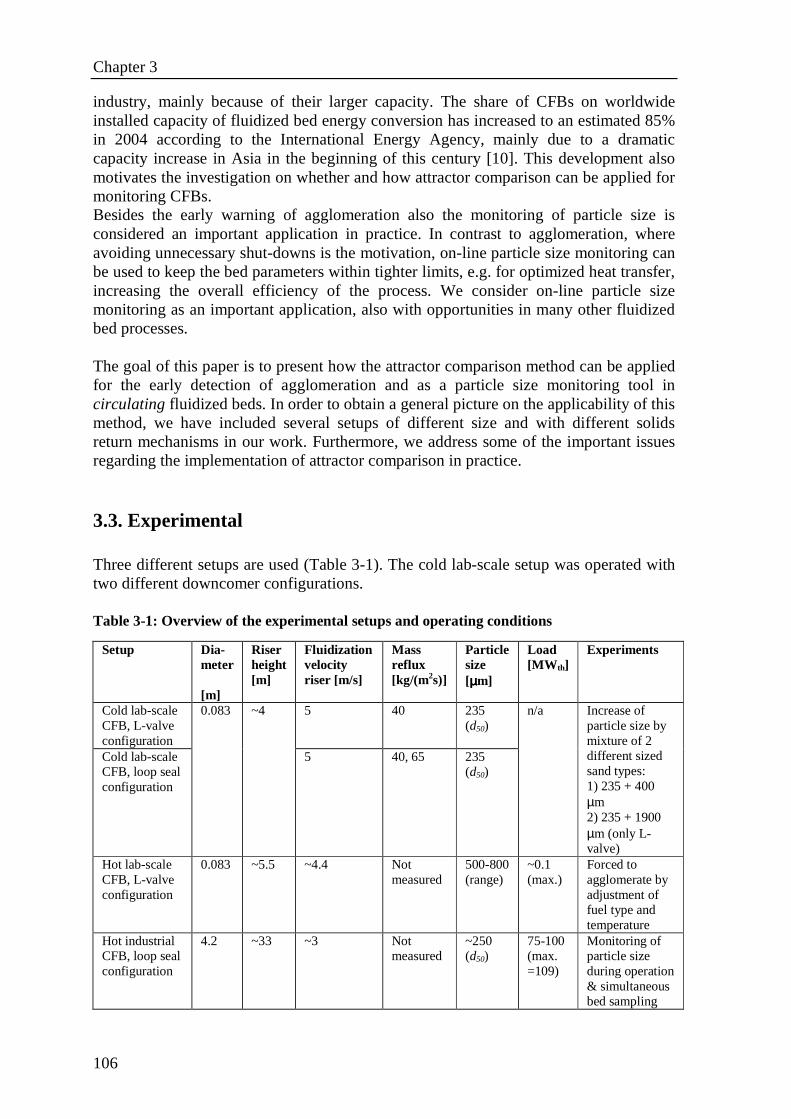
Chapter 3
106
industry, mainly because of their larger capacity. The share of CFBs on worldwide installed capacity of fluidized bed energy conversion has increased to an estimated 85% in 2004 according to the International Energy Agency, mainly due to a dramatic capacity increase in Asia in the beginning of this century [10]. This development also motivates the investigation on whether and how attractor comparison can be applied for monitoring CFBs. Besides the early warning of agglomeration also the monitoring of particle size is considered an important application in practice. In contrast to agglomeration, where avoiding unnecessary shut-downs is the motivation, on-line particle size monitoring can be used to keep the bed parameters within tighter limits, e.g. for optimized heat transfer, increasing the overall efficiency of the process. We consider on-line particle size monitoring as an important application, also with opportunities in many other fluidized bed processes. The goal of this paper is to present how the attractor comparison method can be applied for the early detection of agglomeration and as a particle size monitoring tool in circulating fluidized beds. In order to obtain a general picture on the applicability of this method, we have included several setups of different size and with different solids return mechanisms in our work. Furthermore, we address some of the important issues regarding the implementation of attractor comparison in practice.
3.3. Experimental Three different setups are used (Table 3-1). The cold lab-scale setup was operated with two different downcomer configurations. Table 3-1: Overview of the experimental setups and operating conditions
Setup Dia- meter [m]
Riser height [m]
Fluidization velocity riser [m/s]
Mass reflux [kg/(m2s)]
Particle size [µµµµm]
Load [MW th]
Experiments
Cold lab-scale CFB, L-valve configuration
5 40 235 (d50)
Cold lab-scale CFB, loop seal configuration
0.083 ~4
5 40, 65 235 (d50)
n/a Increase of particle size by mixture of 2 different sized sand types: 1) 235 + 400 µm 2) 235 + 1900 µm (only L-valve)
Hot lab-scale CFB, L-valve configuration
0.083 ~5.5 ~4.4 Not measured
500-800 (range)
~0.1 (max.)
Forced to agglomerate by adjustment of fuel type and temperature
Hot industrial CFB, loop seal configuration
4.2 ~33 ~3 Not measured
~250 (d50)
75-100 (max. =109)
Monitoring of particle size during operation & simultaneous bed sampling
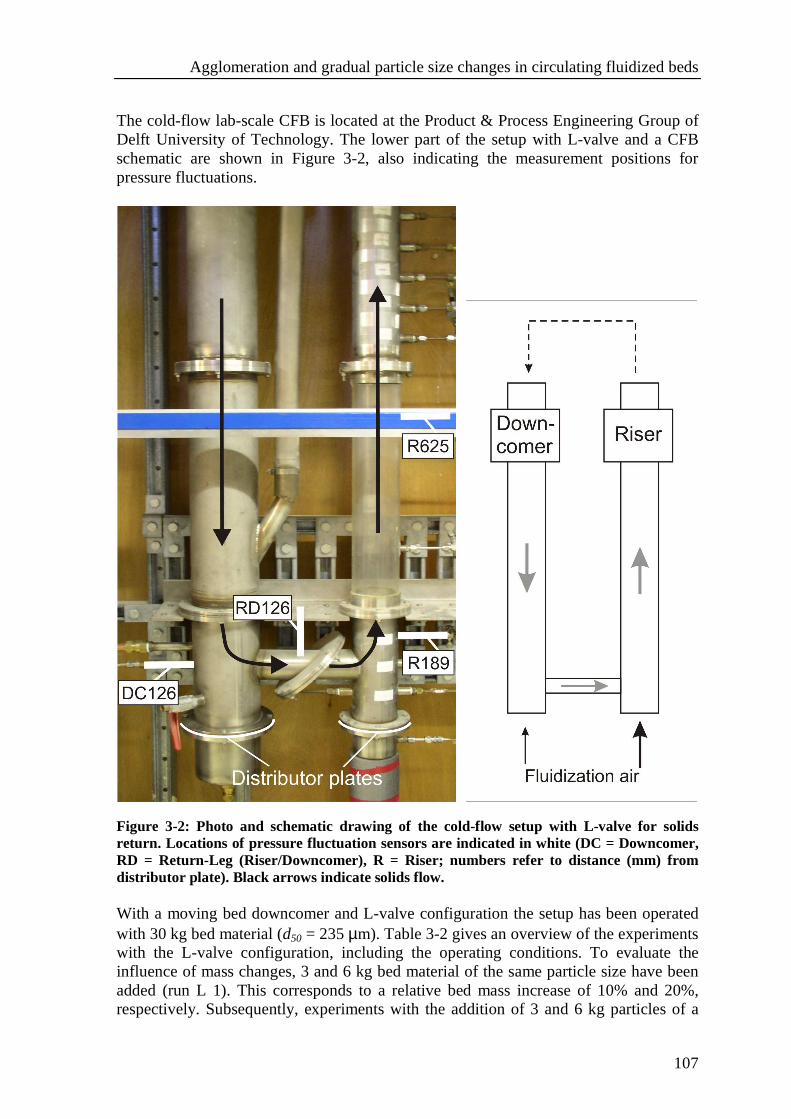
Agglomeration and gradual particle size changes in circulating fluidized beds
107
The cold-flow lab-scale CFB is located at the Product & Process Engineering Group of Delft University of Technology. The lower part of the setup with L-valve and a CFB schematic are shown in Figure 3-2, also indicating the measurement positions for pressure fluctuations.
Figure 3-2: Photo and schematic drawing of the cold-flow setup with L-valve for solids return. Locations of pressure fluctuation sensors are indicated in white (DC = Downcomer, RD = Return-Leg (Riser/Downcomer), R = Riser; numbers refer to distance (mm) from distributor plate). Black arrows indicate solids flow. With a moving bed downcomer and L-valve configuration the setup has been operated with 30 kg bed material (d50 = 235 µm). Table 3-2 gives an overview of the experiments with the L-valve configuration, including the operating conditions. To evaluate the influence of mass changes, 3 and 6 kg bed material of the same particle size have been added (run L 1). This corresponds to a relative bed mass increase of 10% and 20%, respectively. Subsequently, experiments with the addition of 3 and 6 kg particles of a
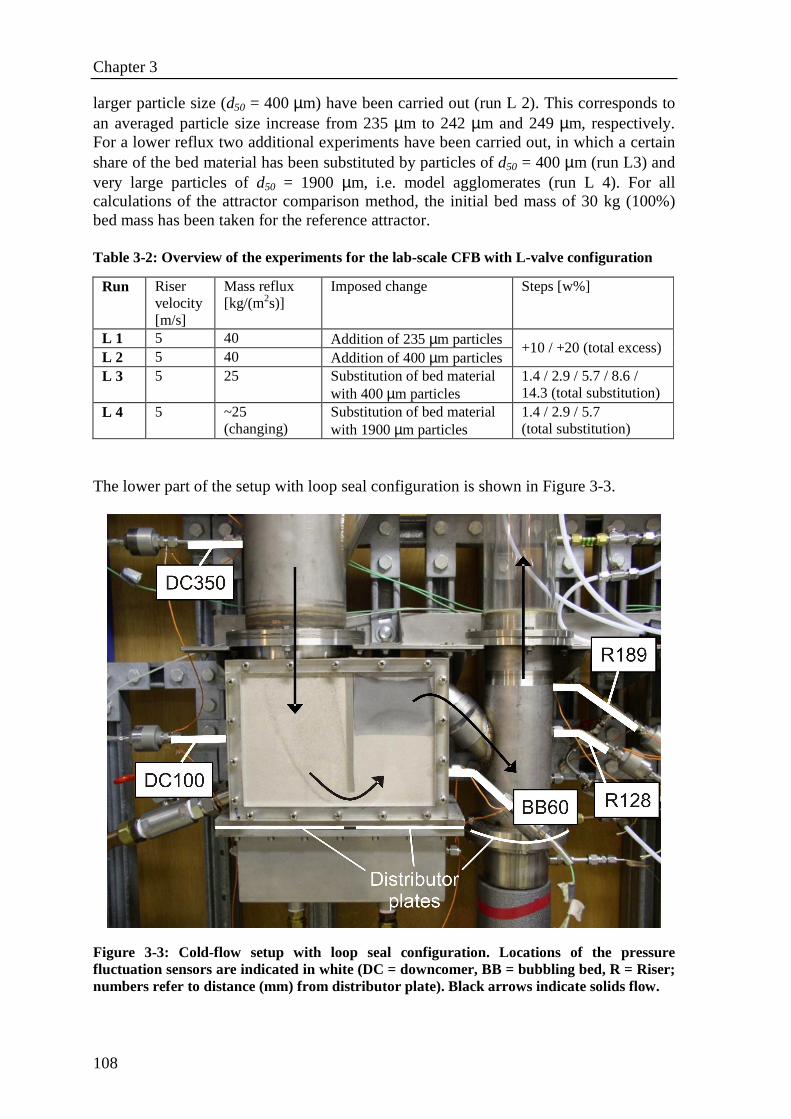
Chapter 3
108
larger particle size (d50 = 400 µm) have been carried out (run L 2). This corresponds to an averaged particle size increase from 235 µm to 242 µm and 249 µm, respectively. For a lower reflux two additional experiments have been carried out, in which a certain share of the bed material has been substituted by particles of d50 = 400 µm (run L3) and very large particles of d50 = 1900 µm, i.e. model agglomerates (run L 4). For all calculations of the attractor comparison method, the initial bed mass of 30 kg (100%) bed mass has been taken for the reference attractor. Table 3-2: Overview of the experiments for the lab-scale CFB with L-valve configuration
Run Riser velocity [m/s]
Mass reflux [kg/(m2s)]
Imposed change Steps [w%]
L 1 5 40 Addition of 235 µm particles L 2 5 40 Addition of 400 µm particles
+10 / +20 (total excess)
L 3 5 25 Substitution of bed material with 400 µm particles
1.4 / 2.9 / 5.7 / 8.6 / 14.3 (total substitution)
L 4 5 ~25 (changing)
Substitution of bed material with 1900 µm particles
1.4 / 2.9 / 5.7 (total substitution)
The lower part of the setup with loop seal configuration is shown in Figure 3-3.
Figure 3-3: Cold-flow setup with loop seal configuration. Locations of the pressure fluctuation sensors are indicated in white (DC = downcomer, BB = bubbling bed, R = Riser; numbers refer to distance (mm) from distributor plate). Black arrows indicate solids flow.
Agglomeration and gradual particle size changes in circulating fluidized beds
109
With the loop seal configuration the setup has been operated with 35 kg bed material due to the increased volume of the modified downcomer. The relative mass changes of 10 and 20%, however, are kept the same here. In this case, 20% bed mass have ultimately been removed again after the addition in two steps, thereby returning to the original amount of bed mass. The same two sand types have been used as for the CFB in Figure 3-2. The reflux has been measured during operation at specific times and in certain cases re-adjusted by adapting the gas flow. For the gas flows in this configuration, the total riser gas flow has been corrected for the gas flow coming from the bubbling bed as this gas also enters the riser due to the pressure conditions; the total riser flow including the bubbling bed gas flow results in a velocity of 5 m/s. Table 3-3 gives an overview of the experiments with the loop seal configuration, including the operating conditions. In all experiments two times 10% bed material has been added and subsequently 20% has been removed again to return to the original bed mass. The resulting median particle size changed from d50 = 235 µm to d50 = 242 µm and d50 = 249 µm upon the addition. Next, the mass reflux has been re-adjusted to its normal value in case it had changed significantly. For experiment LS 3 and LS 4 the operating conditions were changed to a larger reflux and lower bubbling bed velocity to investigate whether the performance of the method changes for a different operating condition. Table 3-3: Overview of the experiments for the lab-scale CFB with loop seal configuration
Run Riser velocity [m/s]
Mass reflux [kg/(m2s)]
Bubbling bed velocity [Multiple of Umf,
fine (5.3 cm/s)]
Imposed change
Steps [w%]
LS 1 5 40 5 Addition of 235 µm particles
LS 2 5 40 5 Addition of 400 µm particles
+10 / +20 / 0 (total excess)
LS 3 5 65 3 Addition of 235 µm particles
LS 4 a/b (duplicating)
5 65 3 Addition of 400 µm particles
+10 / +20 / 0 (total excess)
Note that for both the moving bed configuration and the loop seal configuration a small stagnant zone in the lower downcomer is present and estimated to contain 2-3% of the total bed mass. This effect has not been taken into account here, the true changes in bed mass and particle size therefore will be slightly higher. The hot lab-scale CFB (Figure 3-4) is located at the Energy Technology Section of Delft University of Technology. With regard to the dimensions this setup is very similar to the cold lab-scale setup and also has a moving bed downcomer with an L-valve for the solids return. Pressure fluctuations have been measured at different locations in riser and downcomer; however, many positions got blocked during operation due to insufficient purging. Only the two positions used in this study, in the horizontal return-leg and lower riser, are indicated in Figure 3-4.
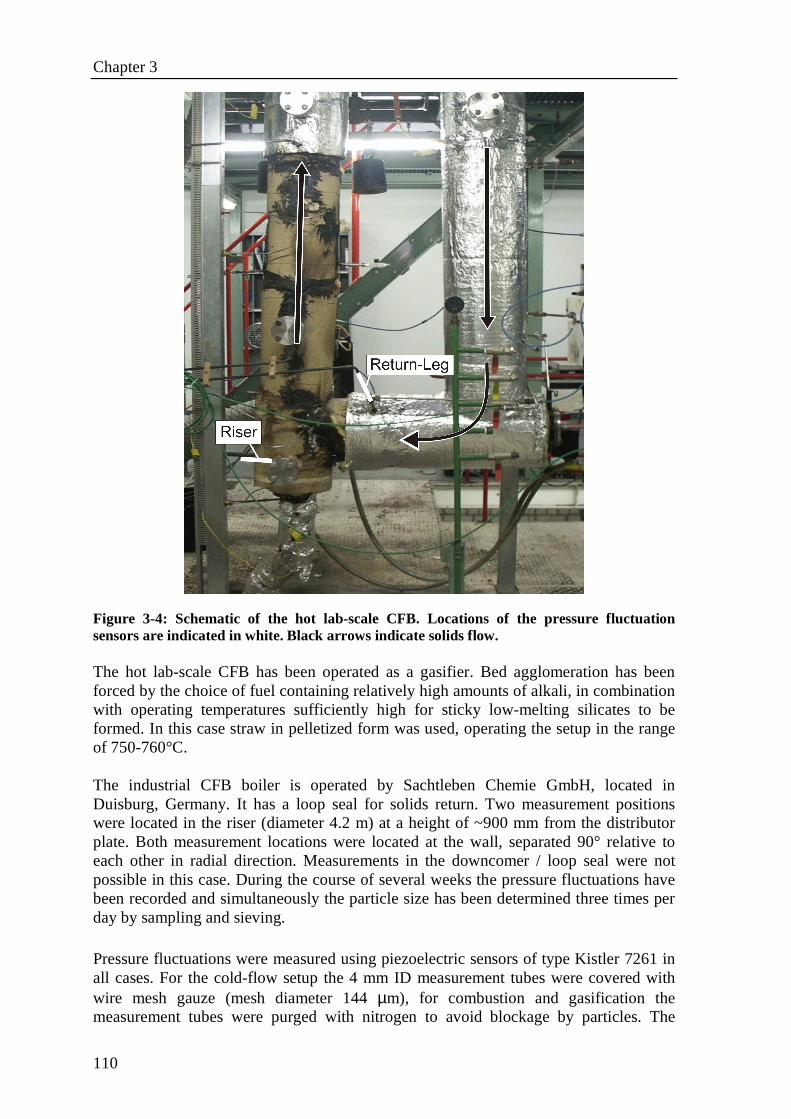
Chapter 3
110
Figure 3-4: Schematic of the hot lab-scale CFB. Locations of the pressure fluctuation sensors are indicated in white. Black arrows indicate solids flow. The hot lab-scale CFB has been operated as a gasifier. Bed agglomeration has been forced by the choice of fuel containing relatively high amounts of alkali, in combination with operating temperatures sufficiently high for sticky low-melting silicates to be formed. In this case straw in pelletized form was used, operating the setup in the range of 750-760°C. The industrial CFB boiler is operated by Sachtleben Chemie GmbH, located in Duisburg, Germany. It has a loop seal for solids return. Two measurement positions were located in the riser (diameter 4.2 m) at a height of ~900 mm from the distributor plate. Both measurement locations were located at the wall, separated 90° relative to each other in radial direction. Measurements in the downcomer / loop seal were not possible in this case. During the course of several weeks the pressure fluctuations have been recorded and simultaneously the particle size has been determined three times per day by sampling and sieving. Pressure fluctuations were measured using piezoelectric sensors of type Kistler 7261 in all cases. For the cold-flow setup the 4 mm ID measurement tubes were covered with wire mesh gauze (mesh diameter 144 µm), for combustion and gasification the measurement tubes were purged with nitrogen to avoid blockage by particles. The
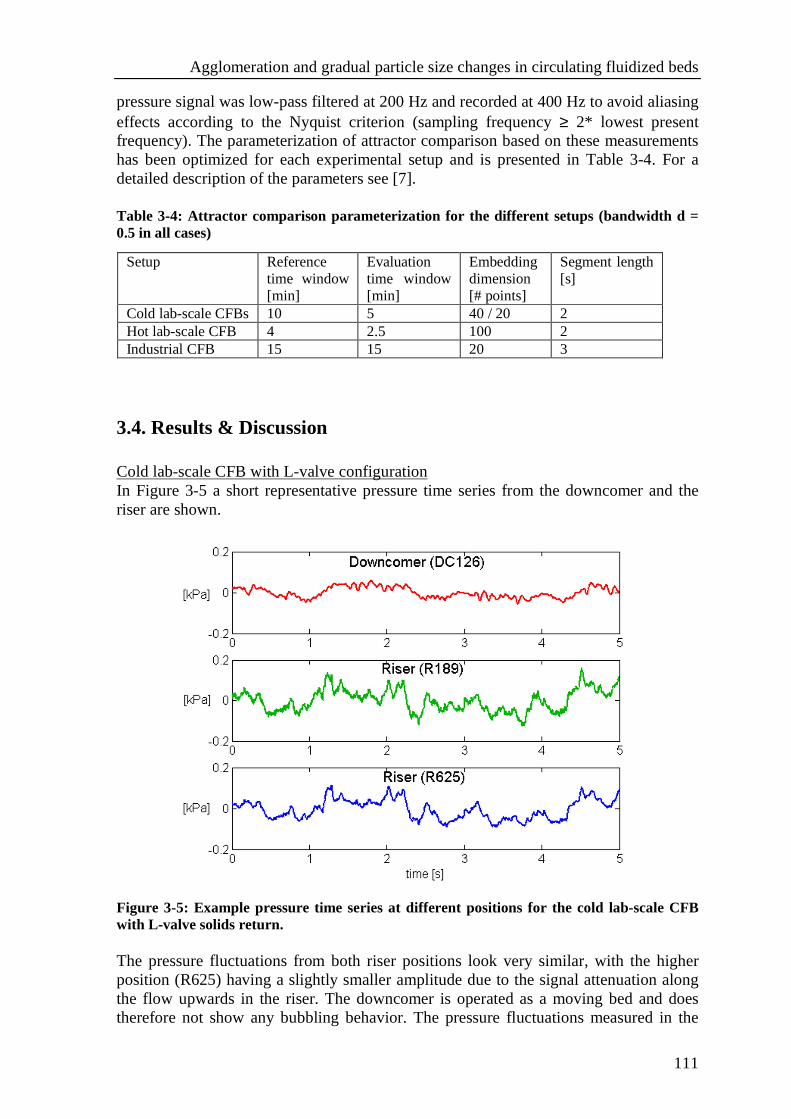
Agglomeration and gradual particle size changes in circulating fluidized beds
111
pressure signal was low-pass filtered at 200 Hz and recorded at 400 Hz to avoid aliasing effects according to the Nyquist criterion (sampling frequency ≥ 2* lowest present frequency). The parameterization of attractor comparison based on these measurements has been optimized for each experimental setup and is presented in Table 3-4. For a detailed description of the parameters see [7]. Table 3-4: Attractor comparison parameterization for the different setups (bandwidth d = 0.5 in all cases)
Setup Reference time window [min]
Evaluation time window [min]
Embedding dimension [# points]
Segment length [s]
Cold lab-scale CFBs 10 5 40 / 20 2 Hot lab-scale CFB 4 2.5 100 2 Industrial CFB 15 15 20 3
3.4. Results & Discussion Cold lab-scale CFB with L-valve configuration In Figure 3-5 a short representative pressure time series from the downcomer and the riser are shown.
Figure 3-5: Example pressure time series at different positions for the cold lab-scale CFB with L-valve solids return. The pressure fluctuations from both riser positions look very similar, with the higher position (R625) having a slightly smaller amplitude due to the signal attenuation along the flow upwards in the riser. The downcomer is operated as a moving bed and does therefore not show any bubbling behavior. The pressure fluctuations measured in the
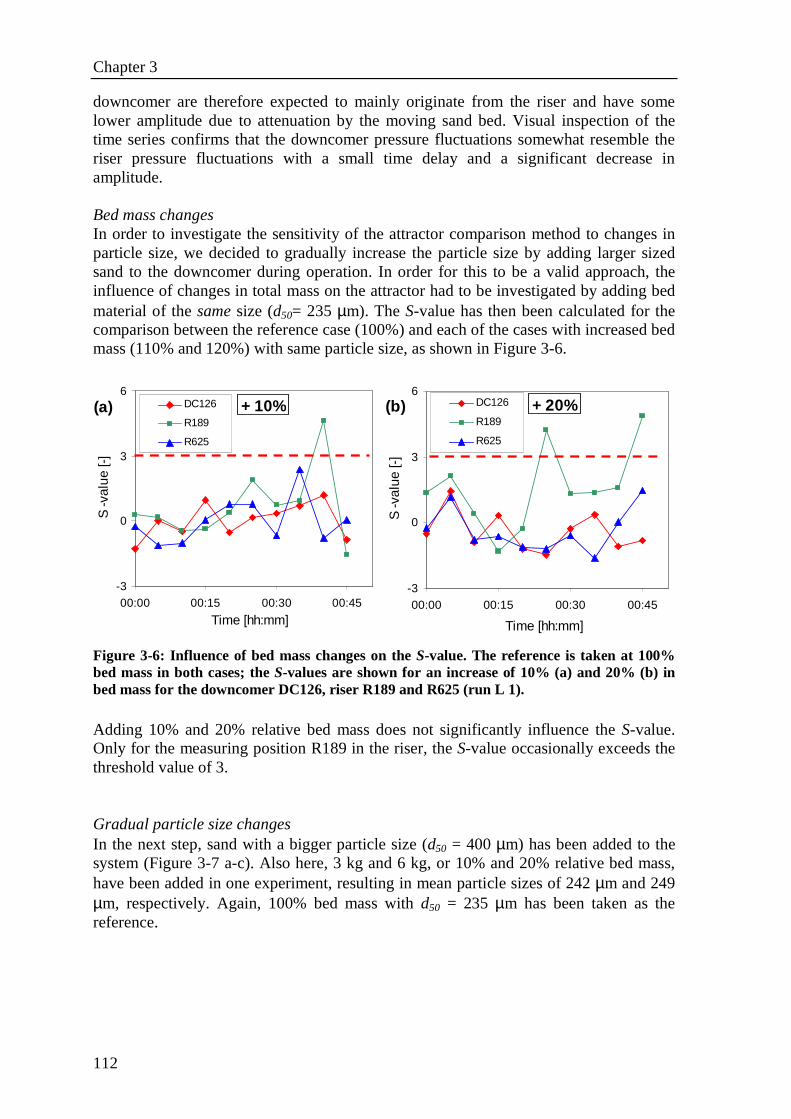
Chapter 3
112
downcomer are therefore expected to mainly originate from the riser and have some lower amplitude due to attenuation by the moving sand bed. Visual inspection of the time series confirms that the downcomer pressure fluctuations somewhat resemble the riser pressure fluctuations with a small time delay and a significant decrease in amplitude. Bed mass changes In order to investigate the sensitivity of the attractor comparison method to changes in particle size, we decided to gradually increase the particle size by adding larger sized sand to the downcomer during operation. In order for this to be a valid approach, the influence of changes in total mass on the attractor had to be investigated by adding bed material of the same size (d50= 235 µm). The S-value has then been calculated for the comparison between the reference case (100%) and each of the cases with increased bed mass (110% and 120%) with same particle size, as shown in Figure 3-6.
-3
0
3
6
00:00 00:15 00:30 00:45
Time [hh:mm]
S-v
alue
[-]
DC126
R189
R625
+ 10%(a)
-3
0
3
6
00:00 00:15 00:30 00:45
Time [hh:mm]
S-v
alue
[-]
DC126
R189
R625
+ 20%(b)
Figure 3-6: Influence of bed mass changes on the S-value. The reference is taken at 100% bed mass in both cases; the S-values are shown for an increase of 10% (a) and 20% (b) in bed mass for the downcomer DC126, riser R189 and R625 (run L 1).
Adding 10% and 20% relative bed mass does not significantly influence the S-value. Only for the measuring position R189 in the riser, the S-value occasionally exceeds the threshold value of 3. Gradual particle size changes In the next step, sand with a bigger particle size (d50 = 400 µm) has been added to the system (Figure 3-7 a-c). Also here, 3 kg and 6 kg, or 10% and 20% relative bed mass, have been added in one experiment, resulting in mean particle sizes of 242 µm and 249 µm, respectively. Again, 100% bed mass with d50 = 235 µm has been taken as the reference.
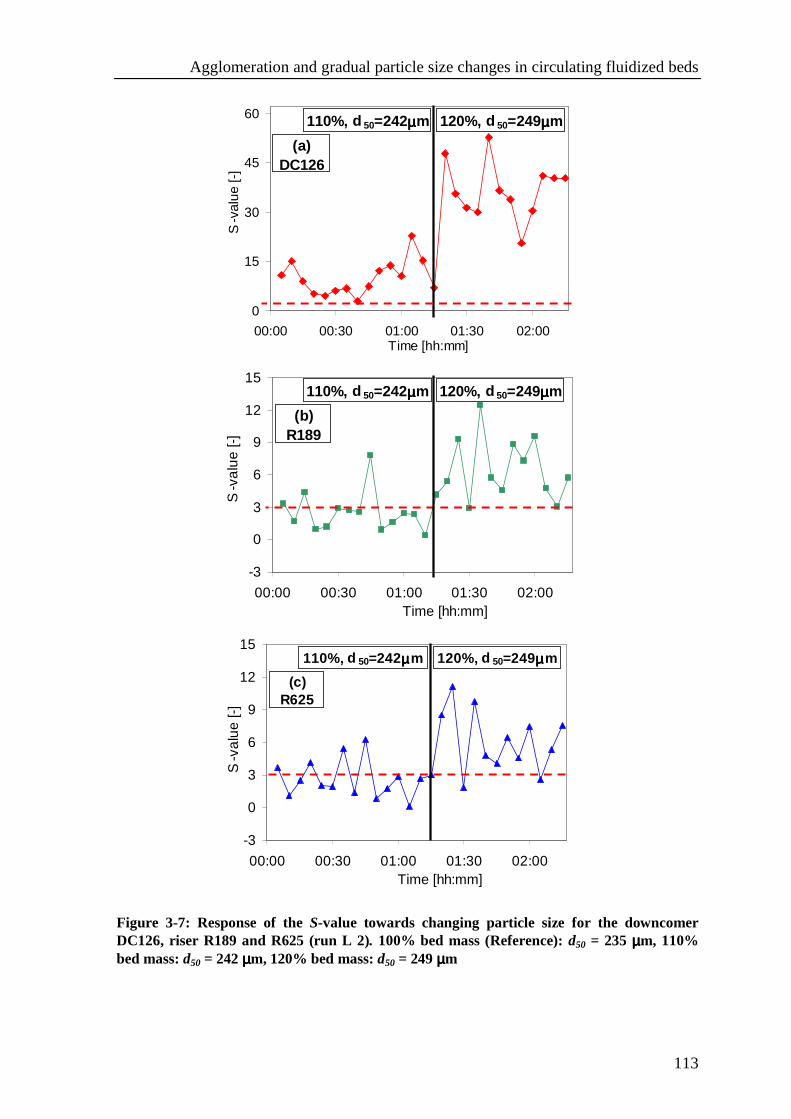
Agglomeration and gradual particle size changes in circulating fluidized beds
113
0
15
30
45
60
00:00 00:30 01:00 01:30 02:00Time [hh:mm]
S-v
alue
[-]
(a)DC126
110%, d 50=242µµµµm 120%, d 50=249µµµµm
-3
0
3
6
9
12
15
00:00 00:30 01:00 01:30 02:00Time [hh:mm]
S-v
alue
[-]
(b)R189
110%, d 50=242µµµµm 120%, d 50=249µµµµm
-3
0
3
6
9
12
15
00:00 00:30 01:00 01:30 02:00Time [hh:mm]
S-v
alu
e [-
]
(c)R625
110%, d 50=242µµµµm 120%, d 50=249µµµµm
Figure 3-7: Response of the S-value towards changing particle size for the downcomer DC126, riser R189 and R625 (run L 2). 100% bed mass (Reference): d50 = 235 µµµµm, 110% bed mass: d50 = 242 µµµµm, 120% bed mass: d50 = 249 µµµµm
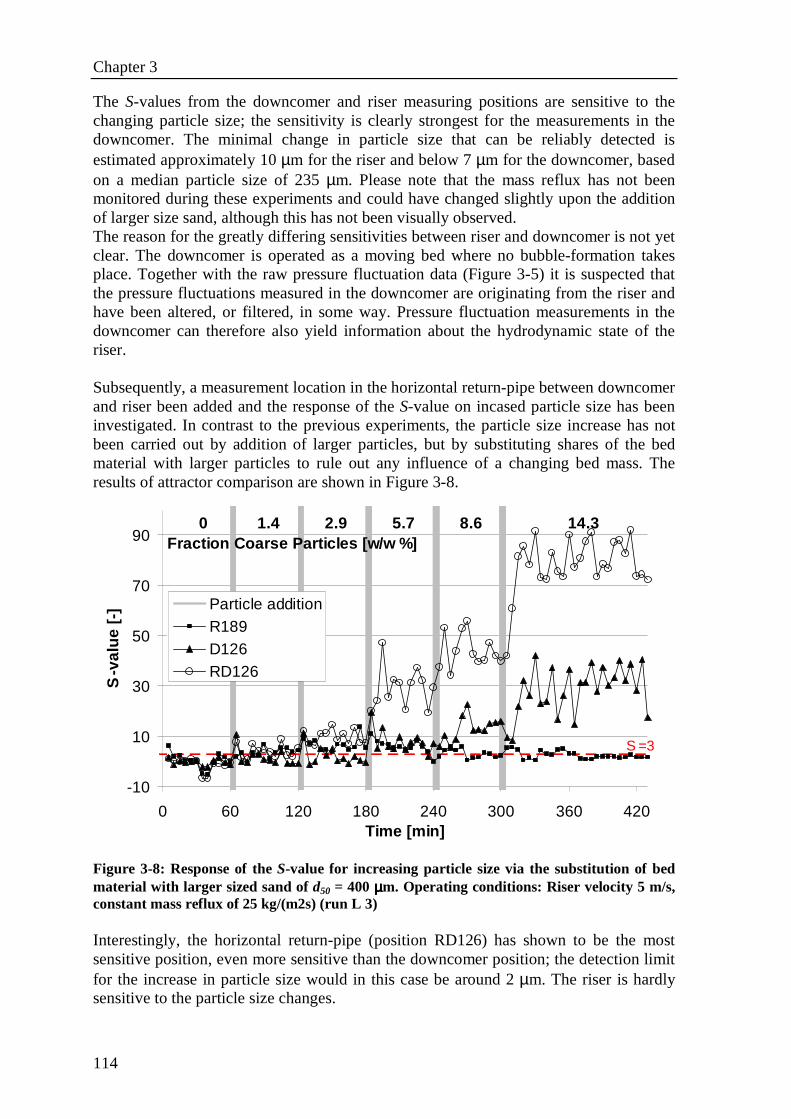
Chapter 3
114
The S-values from the downcomer and riser measuring positions are sensitive to the changing particle size; the sensitivity is clearly strongest for the measurements in the downcomer. The minimal change in particle size that can be reliably detected is estimated approximately 10 µm for the riser and below 7 µm for the downcomer, based on a median particle size of 235 µm. Please note that the mass reflux has not been monitored during these experiments and could have changed slightly upon the addition of larger size sand, although this has not been visually observed. The reason for the greatly differing sensitivities between riser and downcomer is not yet clear. The downcomer is operated as a moving bed where no bubble-formation takes place. Together with the raw pressure fluctuation data (Figure 3-5) it is suspected that the pressure fluctuations measured in the downcomer are originating from the riser and have been altered, or filtered, in some way. Pressure fluctuation measurements in the downcomer can therefore also yield information about the hydrodynamic state of the riser. Subsequently, a measurement location in the horizontal return-pipe between downcomer and riser been added and the response of the S-value on incased particle size has been investigated. In contrast to the previous experiments, the particle size increase has not been carried out by addition of larger particles, but by substituting shares of the bed material with larger particles to rule out any influence of a changing bed mass. The results of attractor comparison are shown in Figure 3-8.
-10
10
30
50
70
90
0 60 120 180 240 300 360 420Time [min]
S-v
alue
[-] Particle addition
R189D126RD126
0 1.4 2.9 5.7 8.6 14.3Fraction Coarse Particles [w/w %]
S =3
Figure 3-8: Response of the S-value for increasing particle size via the substitution of bed material with larger sized sand of d50 = 400 µµµµm. Operating conditions: Riser velocity 5 m/s, constant mass reflux of 25 kg/(m2s) (run L 3) Interestingly, the horizontal return-pipe (position RD126) has shown to be the most sensitive position, even more sensitive than the downcomer position; the detection limit for the increase in particle size would in this case be around 2 µm. The riser is hardly sensitive to the particle size changes.
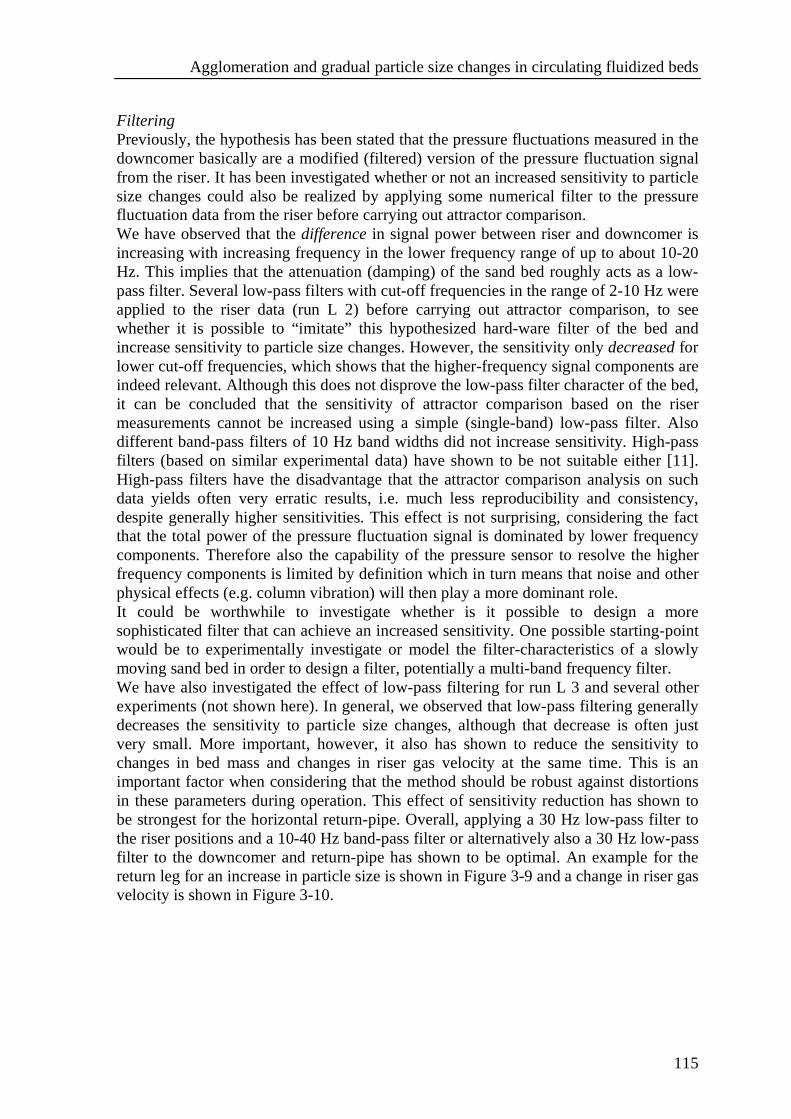
Agglomeration and gradual particle size changes in circulating fluidized beds
115
Filtering Previously, the hypothesis has been stated that the pressure fluctuations measured in the downcomer basically are a modified (filtered) version of the pressure fluctuation signal from the riser. It has been investigated whether or not an increased sensitivity to particle size changes could also be realized by applying some numerical filter to the pressure fluctuation data from the riser before carrying out attractor comparison. We have observed that the difference in signal power between riser and downcomer is increasing with increasing frequency in the lower frequency range of up to about 10-20 Hz. This implies that the attenuation (damping) of the sand bed roughly acts as a low-pass filter. Several low-pass filters with cut-off frequencies in the range of 2-10 Hz were applied to the riser data (run L 2) before carrying out attractor comparison, to see whether it is possible to “imitate” this hypothesized hard-ware filter of the bed and increase sensitivity to particle size changes. However, the sensitivity only decreased for lower cut-off frequencies, which shows that the higher-frequency signal components are indeed relevant. Although this does not disprove the low-pass filter character of the bed, it can be concluded that the sensitivity of attractor comparison based on the riser measurements cannot be increased using a simple (single-band) low-pass filter. Also different band-pass filters of 10 Hz band widths did not increase sensitivity. High-pass filters (based on similar experimental data) have shown to be not suitable either [11]. High-pass filters have the disadvantage that the attractor comparison analysis on such data yields often very erratic results, i.e. much less reproducibility and consistency, despite generally higher sensitivities. This effect is not surprising, considering the fact that the total power of the pressure fluctuation signal is dominated by lower frequency components. Therefore also the capability of the pressure sensor to resolve the higher frequency components is limited by definition which in turn means that noise and other physical effects (e.g. column vibration) will then play a more dominant role. It could be worthwhile to investigate whether is it possible to design a more sophisticated filter that can achieve an increased sensitivity. One possible starting-point would be to experimentally investigate or model the filter-characteristics of a slowly moving sand bed in order to design a filter, potentially a multi-band frequency filter. We have also investigated the effect of low-pass filtering for run L 3 and several other experiments (not shown here). In general, we observed that low-pass filtering generally decreases the sensitivity to particle size changes, although that decrease is often just very small. More important, however, it also has shown to reduce the sensitivity to changes in bed mass and changes in riser gas velocity at the same time. This is an important factor when considering that the method should be robust against distortions in these parameters during operation. This effect of sensitivity reduction has shown to be strongest for the horizontal return-pipe. Overall, applying a 30 Hz low-pass filter to the riser positions and a 10-40 Hz band-pass filter or alternatively also a 30 Hz low-pass filter to the downcomer and return-pipe has shown to be optimal. An example for the return leg for an increase in particle size is shown in Figure 3-9 and a change in riser gas velocity is shown in Figure 3-10.
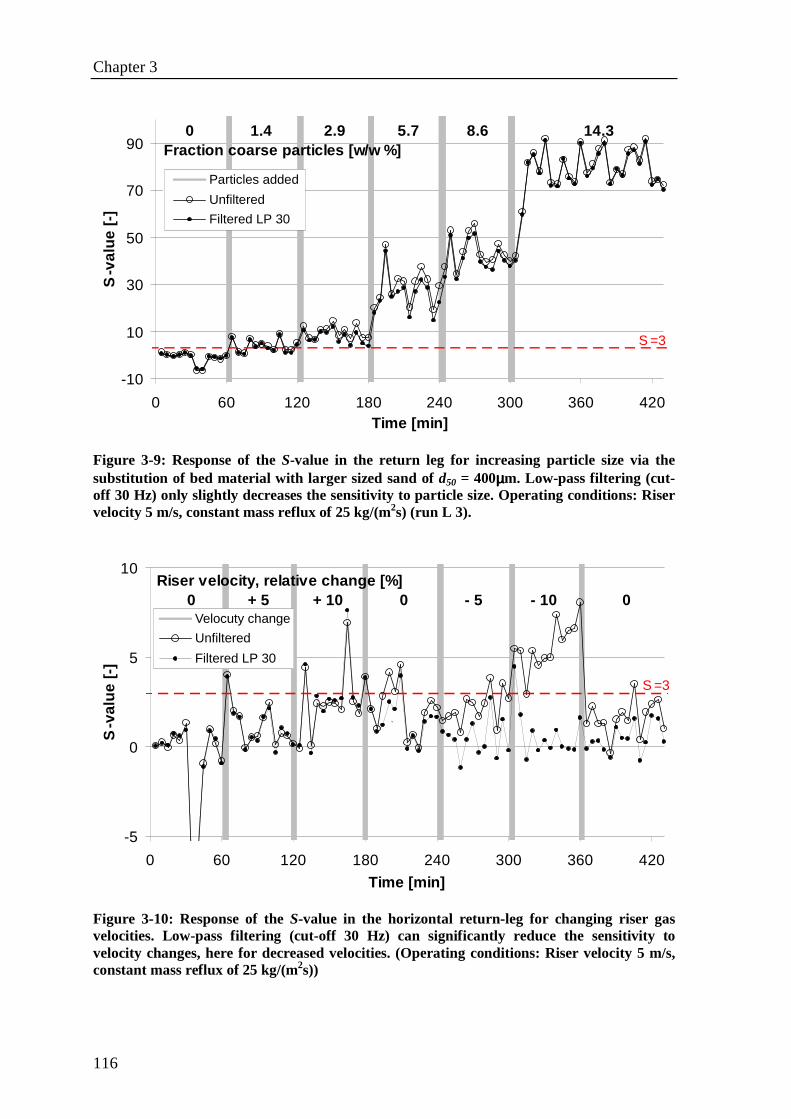
Chapter 3
116
-10
10
30
50
70
90
0 60 120 180 240 300 360 420Time [min]
S-v
alue
[-]
Particles added
Unfiltered
Filtered LP 30
0 1.4 2.9 5.7 8.6 14.3Fraction coarse particles [w/w %]
S =3
Figure 3-9: Response of the S-value in the return leg for increasing particle size via the substitution of bed material with larger sized sand of d50 = 400µµµµm. Low-pass filtering (cut-off 30 Hz) only slightly decreases the sensitivity to particle size. Operating conditions: Riser velocity 5 m/s, constant mass reflux of 25 kg/(m2s) (run L 3).
-5
0
5
10
0 60 120 180 240 300 360 420
Time [min]
S-v
alue
[-]
Velocuty change
Unfiltered
Filtered LP 30
Riser velocity, relative change [%] 0 + 5 + 10 0 - 5 - 10 0
`
S =3
Figure 3-10: Response of the S-value in the horizontal return-leg for changing riser gas velocities. Low-pass filtering (cut-off 30 Hz) can significantly reduce the sensitivity to velocity changes, here for decreased velocities. (Operating conditions: Riser velocity 5 m/s, constant mass reflux of 25 kg/(m2s))
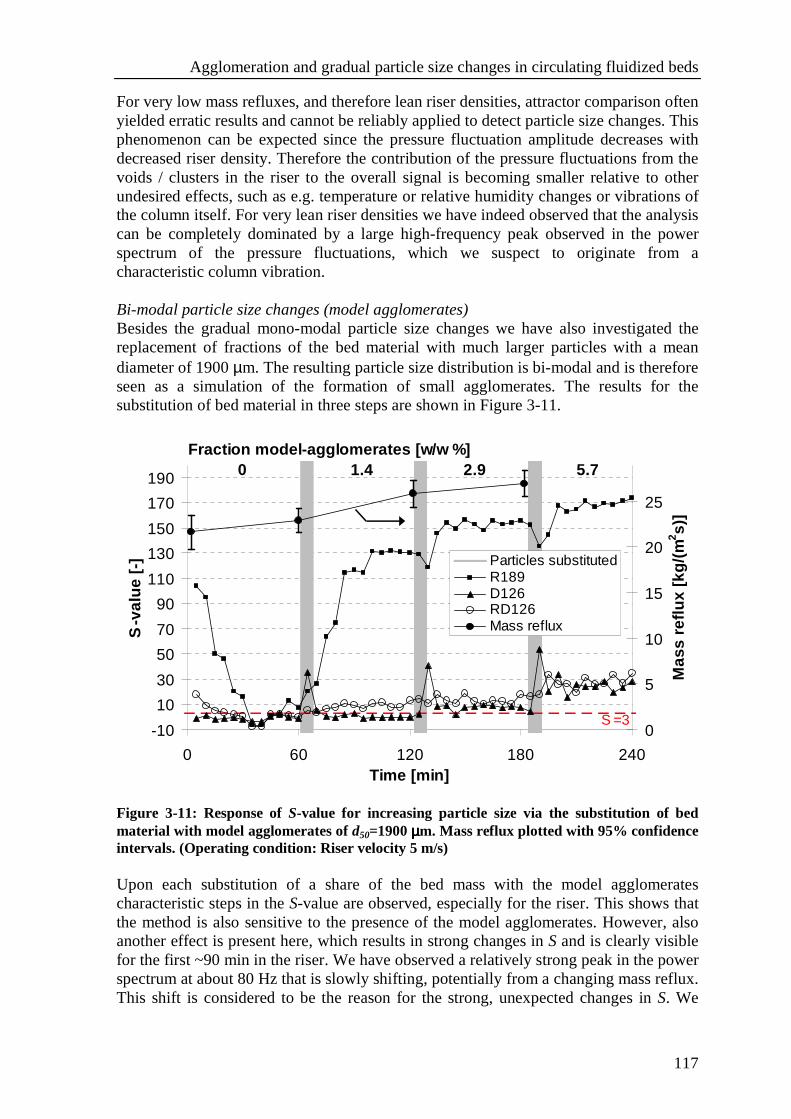
Agglomeration and gradual particle size changes in circulating fluidized beds
117
For very low mass refluxes, and therefore lean riser densities, attractor comparison often yielded erratic results and cannot be reliably applied to detect particle size changes. This phenomenon can be expected since the pressure fluctuation amplitude decreases with decreased riser density. Therefore the contribution of the pressure fluctuations from the voids / clusters in the riser to the overall signal is becoming smaller relative to other undesired effects, such as e.g. temperature or relative humidity changes or vibrations of the column itself. For very lean riser densities we have indeed observed that the analysis can be completely dominated by a large high-frequency peak observed in the power spectrum of the pressure fluctuations, which we suspect to originate from a characteristic column vibration. Bi-modal particle size changes (model agglomerates) Besides the gradual mono-modal particle size changes we have also investigated the replacement of fractions of the bed material with much larger particles with a mean diameter of 1900 µm. The resulting particle size distribution is bi-modal and is therefore seen as a simulation of the formation of small agglomerates. The results for the substitution of bed material in three steps are shown in Figure 3-11.
-10
10
30
50
70
90
110
130
150
170
190
0 60 120 180 240Time [min]
S-v
alue
[-]
0
5
10
15
20
25
Mas
s re
flux
[kg/
(m2 s)
]
Particles substitutedR189D126RD126Mass reflux
Fraction model-agglomerates [w/w %] 0 1.4 2.9 5.7
S =3
Figure 3-11: Response of S-value for increasing particle size via the substitution of bed material with model agglomerates of d50=1900 µµµµm. Mass reflux plotted with 95% confidence intervals. (Operating condition: Riser velocity 5 m/s) Upon each substitution of a share of the bed mass with the model agglomerates characteristic steps in the S-value are observed, especially for the riser. This shows that the method is also sensitive to the presence of the model agglomerates. However, also another effect is present here, which results in strong changes in S and is clearly visible for the first ~90 min in the riser. We have observed a relatively strong peak in the power spectrum at about 80 Hz that is slowly shifting, potentially from a changing mass reflux. This shift is considered to be the reason for the strong, unexpected changes in S. We
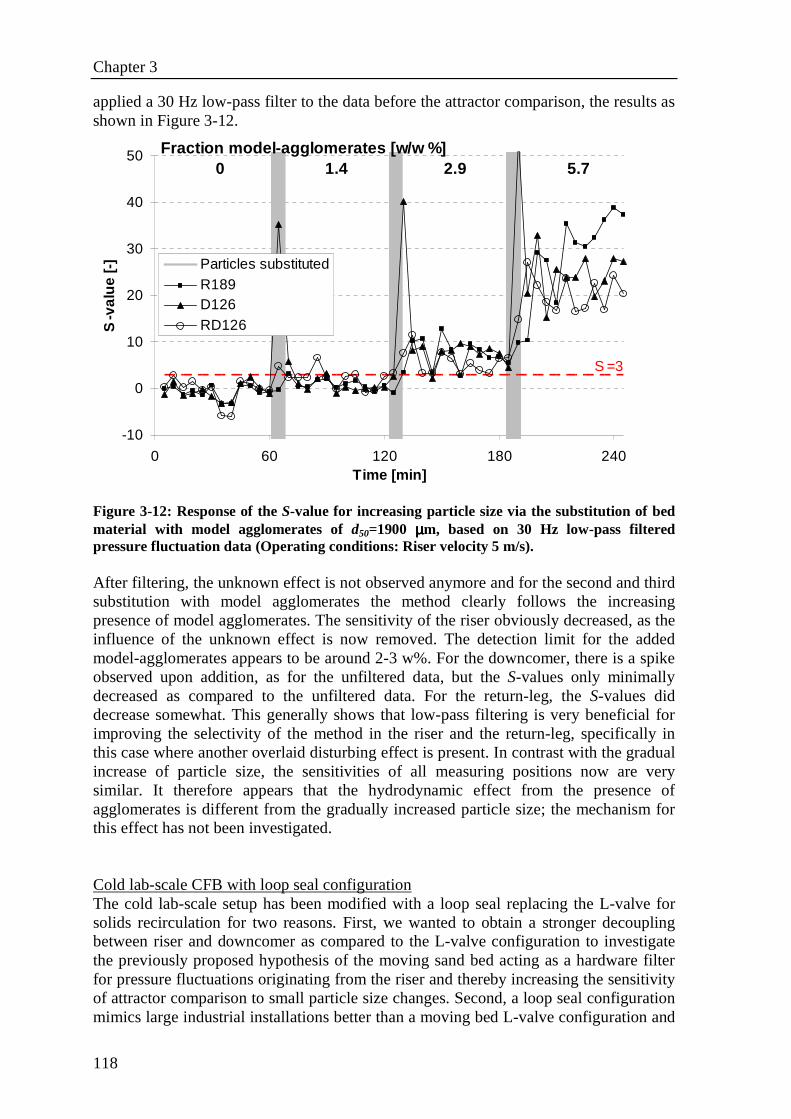
Chapter 3
118
applied a 30 Hz low-pass filter to the data before the attractor comparison, the results as shown in Figure 3-12.
-10
0
10
20
30
40
50
0 60 120 180 240Time [min]
S-v
alue
[-] Particles substituted
R189D126RD126
Fraction model-agglomerates [w/w %] 0 1.4 2.9 5.7
S =3
Figure 3-12: Response of the S-value for increasing particle size via the substitution of bed material with model agglomerates of d50=1900 µµµµm, based on 30 Hz low-pass filtered pressure fluctuation data (Operating conditions: Riser velocity 5 m/s). After filtering, the unknown effect is not observed anymore and for the second and third substitution with model agglomerates the method clearly follows the increasing presence of model agglomerates. The sensitivity of the riser obviously decreased, as the influence of the unknown effect is now removed. The detection limit for the added model-agglomerates appears to be around 2-3 w%. For the downcomer, there is a spike observed upon addition, as for the unfiltered data, but the S-values only minimally decreased as compared to the unfiltered data. For the return-leg, the S-values did decrease somewhat. This generally shows that low-pass filtering is very beneficial for improving the selectivity of the method in the riser and the return-leg, specifically in this case where another overlaid disturbing effect is present. In contrast with the gradual increase of particle size, the sensitivities of all measuring positions now are very similar. It therefore appears that the hydrodynamic effect from the presence of agglomerates is different from the gradually increased particle size; the mechanism for this effect has not been investigated. Cold lab-scale CFB with loop seal configuration The cold lab-scale setup has been modified with a loop seal replacing the L-valve for solids recirculation for two reasons. First, we wanted to obtain a stronger decoupling between riser and downcomer as compared to the L-valve configuration to investigate the previously proposed hypothesis of the moving sand bed acting as a hardware filter for pressure fluctuations originating from the riser and thereby increasing the sensitivity of attractor comparison to small particle size changes. Second, a loop seal configuration mimics large industrial installations better than a moving bed L-valve configuration and
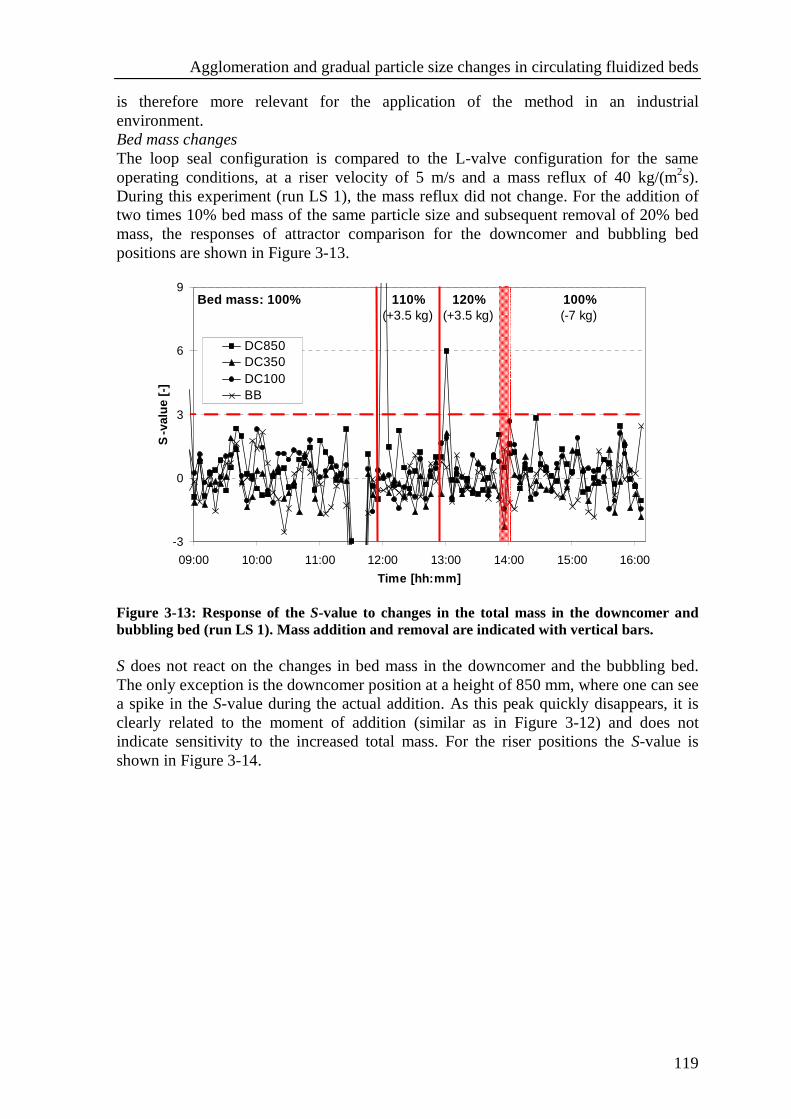
Agglomeration and gradual particle size changes in circulating fluidized beds
119
is therefore more relevant for the application of the method in an industrial environment. Bed mass changes The loop seal configuration is compared to the L-valve configuration for the same operating conditions, at a riser velocity of 5 m/s and a mass reflux of 40 kg/(m2s). During this experiment (run LS 1), the mass reflux did not change. For the addition of two times 10% bed mass of the same particle size and subsequent removal of 20% bed mass, the responses of attractor comparison for the downcomer and bubbling bed positions are shown in Figure 3-13.
-3
0
3
6
9
09:00 10:00 11:00 12:00 13:00 14:00 15:00 16:00
Time [hh:mm]
S-v
alue
[-]
DC850DC350DC100BB
Bed mass: 100% 110% 120% 100% (+3.5 kg) (+3.5 kg) (-7 kg)
Figure 3-13: Response of the S-value to changes in the total mass in the downcomer and bubbling bed (run LS 1). Mass addition and removal are indicated with vertical bars. S does not react on the changes in bed mass in the downcomer and the bubbling bed. The only exception is the downcomer position at a height of 850 mm, where one can see a spike in the S-value during the actual addition. As this peak quickly disappears, it is clearly related to the moment of addition (similar as in Figure 3-12) and does not indicate sensitivity to the increased total mass. For the riser positions the S-value is shown in Figure 3-14.
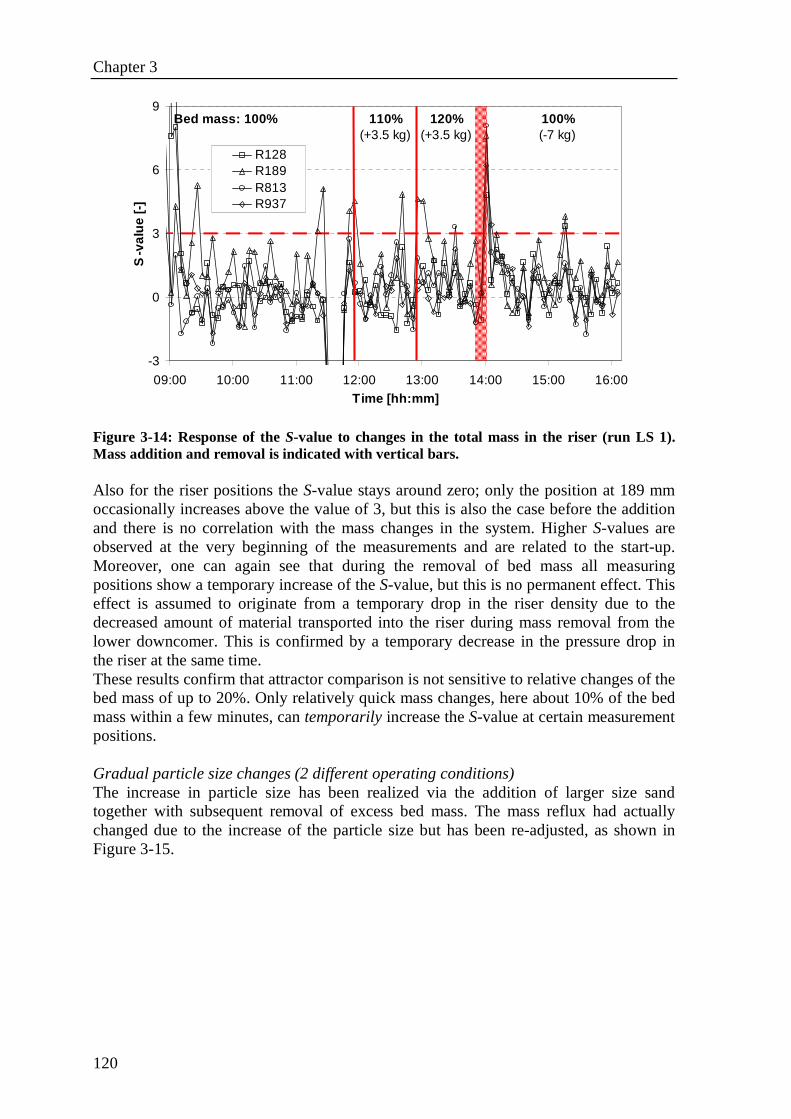
Chapter 3
120
-3
0
3
6
9
09:00 10:00 11:00 12:00 13:00 14:00 15:00 16:00Time [hh:mm]
S-v
alue
[-]
R128R189R813R937
Bed mass: 100% 110% 120% 100% (+3.5 kg) (+3.5 kg) (-7 kg)
Figure 3-14: Response of the S-value to changes in the total mass in the riser (run LS 1). Mass addition and removal is indicated with vertical bars. Also for the riser positions the S-value stays around zero; only the position at 189 mm occasionally increases above the value of 3, but this is also the case before the addition and there is no correlation with the mass changes in the system. Higher S-values are observed at the very beginning of the measurements and are related to the start-up. Moreover, one can again see that during the removal of bed mass all measuring positions show a temporary increase of the S-value, but this is no permanent effect. This effect is assumed to originate from a temporary drop in the riser density due to the decreased amount of material transported into the riser during mass removal from the lower downcomer. This is confirmed by a temporary decrease in the pressure drop in the riser at the same time. These results confirm that attractor comparison is not sensitive to relative changes of the bed mass of up to 20%. Only relatively quick mass changes, here about 10% of the bed mass within a few minutes, can temporarily increase the S-value at certain measurement positions. Gradual particle size changes (2 different operating conditions) The increase in particle size has been realized via the addition of larger size sand together with subsequent removal of excess bed mass. The mass reflux had actually changed due to the increase of the particle size but has been re-adjusted, as shown in Figure 3-15.
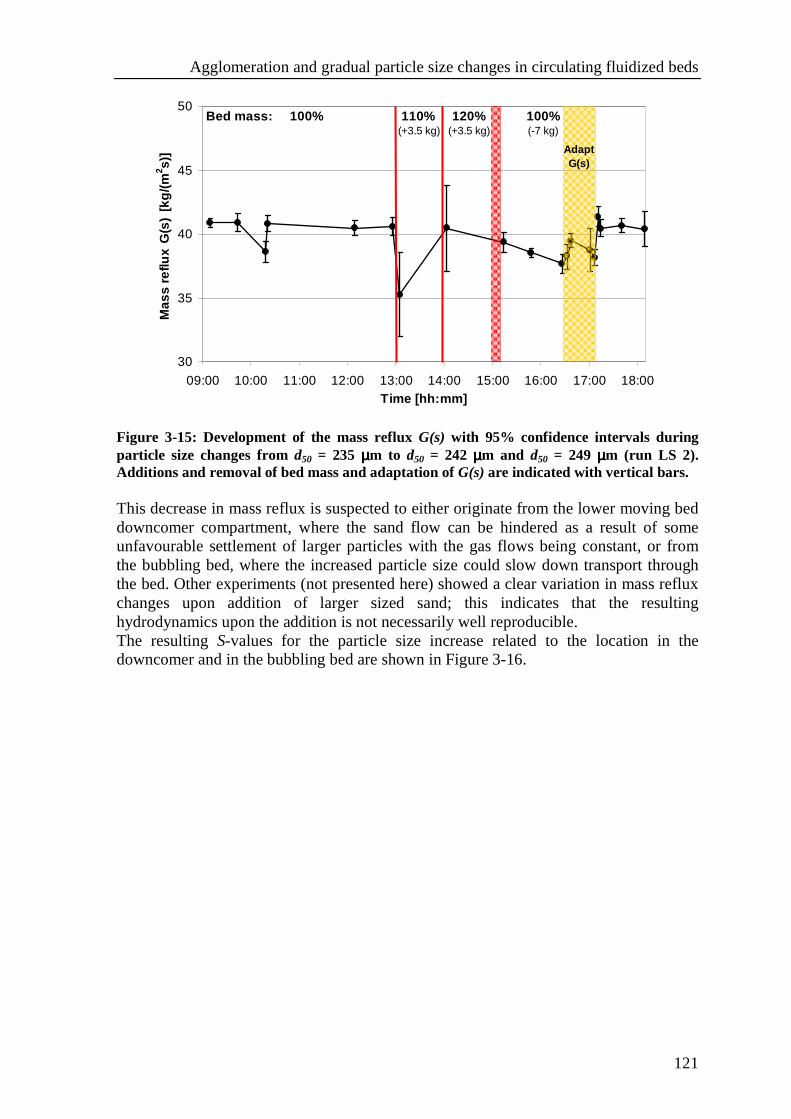
Agglomeration and gradual particle size changes in circulating fluidized beds
121
30
35
40
45
50
09:00 10:00 11:00 12:00 13:00 14:00 15:00 16:00 17:00 18:00Time [hh:mm]
Mas
s re
flux
G(s
) [k
g/(m
2 s)] Adapt
G(s)
Bed mass: 100% 110% 120% 100% (+3.5 kg) (+3.5 kg) (-7 kg)
Figure 3-15: Development of the mass reflux G(s) with 95% confidence intervals during particle size changes from d50 = 235 µµµµm to d50 = 242 µµµµm and d50 = 249 µµµµm (run LS 2). Additions and removal of bed mass and adaptation of G(s) are indicated with vertical bars. This decrease in mass reflux is suspected to either originate from the lower moving bed downcomer compartment, where the sand flow can be hindered as a result of some unfavourable settlement of larger particles with the gas flows being constant, or from the bubbling bed, where the increased particle size could slow down transport through the bed. Other experiments (not presented here) showed a clear variation in mass reflux changes upon addition of larger sized sand; this indicates that the resulting hydrodynamics upon the addition is not necessarily well reproducible. The resulting S-values for the particle size increase related to the location in the downcomer and in the bubbling bed are shown in Figure 3-16.
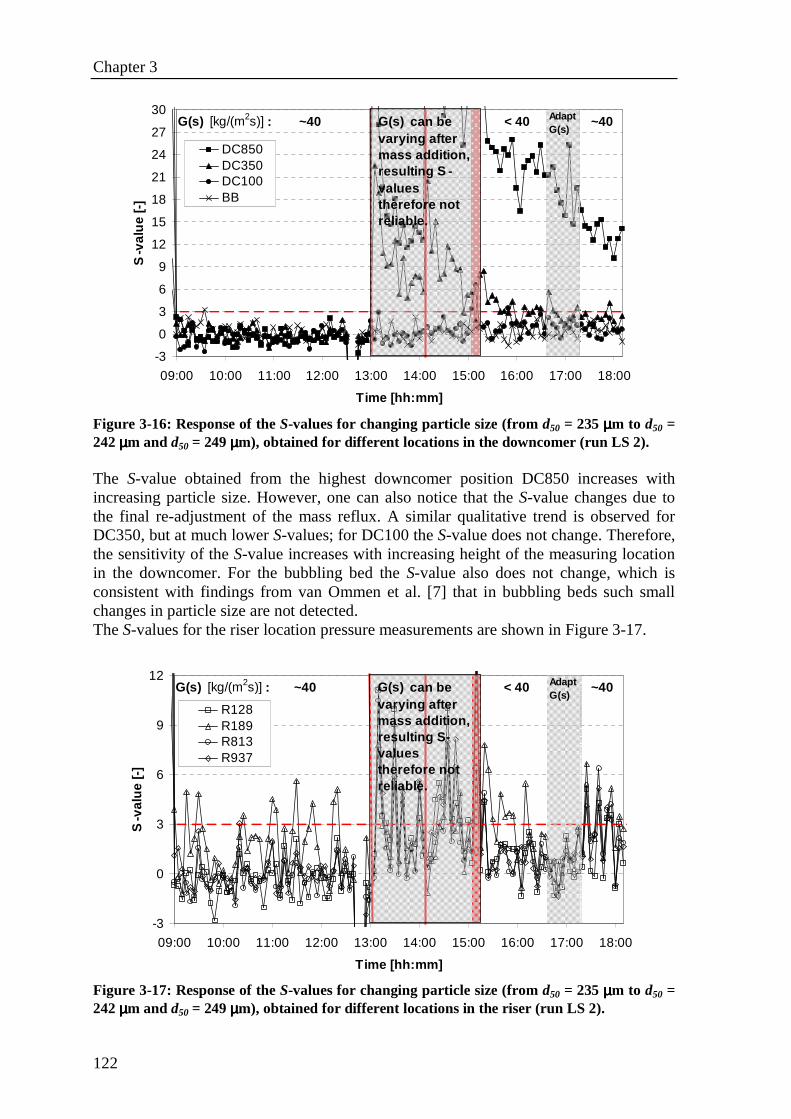
Chapter 3
122
-3
0
3
6
9
12
15
18
21
24
27
30
09:00 10:00 11:00 12:00 13:00 14:00 15:00 16:00 17:00 18:00
Time [hh:mm]
S-v
alue
[-]
DC850DC350DC100BB
G(s) can be varying after mass addition, resulting S -values therefore not reliable.
Adapt G(s)
G(s) [kg/(m2s)] : ~40 < 40 ~40
Figure 3-16: Response of the S-values for changing particle size (from d50 = 235 µµµµm to d50 = 242 µµµµm and d50 = 249 µµµµm), obtained for different locations in the downcomer (run LS 2). The S-value obtained from the highest downcomer position DC850 increases with increasing particle size. However, one can also notice that the S-value changes due to the final re-adjustment of the mass reflux. A similar qualitative trend is observed for DC350, but at much lower S-values; for DC100 the S-value does not change. Therefore, the sensitivity of the S-value increases with increasing height of the measuring location in the downcomer. For the bubbling bed the S-value also does not change, which is consistent with findings from van Ommen et al. [7] that in bubbling beds such small changes in particle size are not detected. The S-values for the riser location pressure measurements are shown in Figure 3-17.
-3
0
3
6
9
12
09:00 10:00 11:00 12:00 13:00 14:00 15:00 16:00 17:00 18:00
Time [hh:mm]
S-v
alue
[-]
R128R189R813R937
G(s) can be varying after mass addition, resulting S-values therefore not reliable.
Adapt G(s)
G(s) [kg/(m2s)] : ~40 < 40 ~40
Figure 3-17: Response of the S-values for changing particle size (from d50 = 235 µµµµm to d50 = 242 µµµµm and d50 = 249 µµµµm), obtained for different locations in the riser (run LS 2).
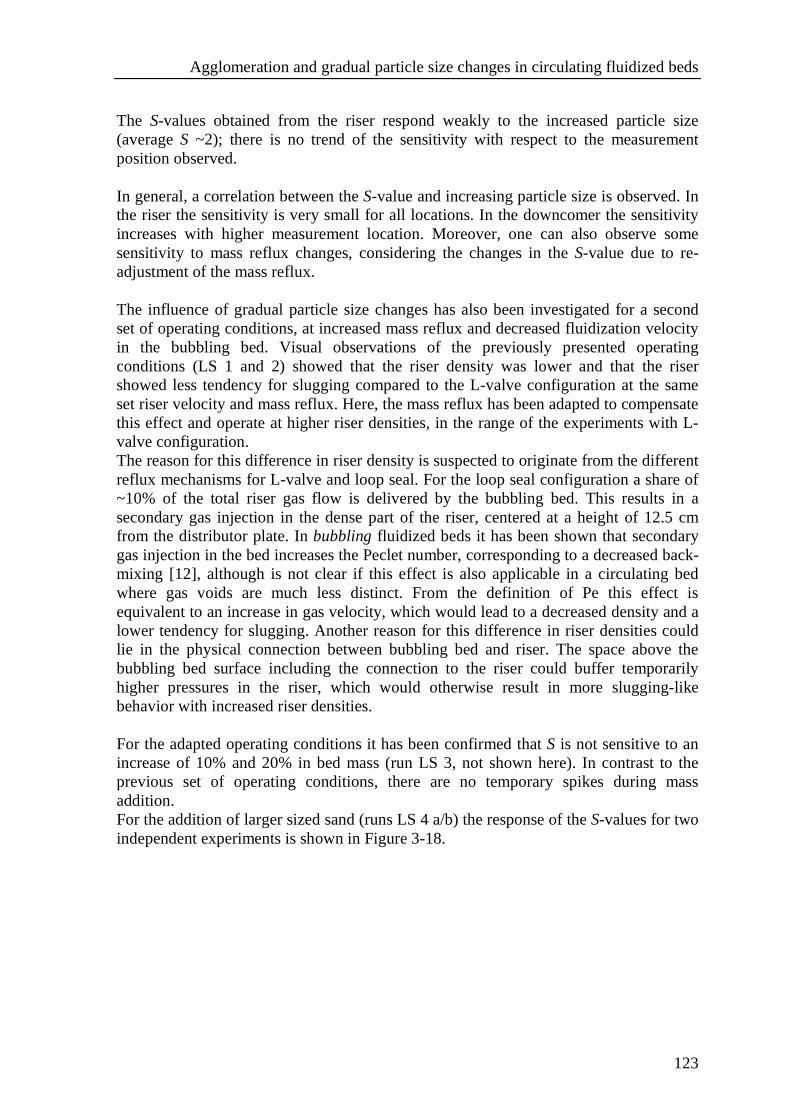
Agglomeration and gradual particle size changes in circulating fluidized beds
123
The S-values obtained from the riser respond weakly to the increased particle size (average S ~2); there is no trend of the sensitivity with respect to the measurement position observed. In general, a correlation between the S-value and increasing particle size is observed. In the riser the sensitivity is very small for all locations. In the downcomer the sensitivity increases with higher measurement location. Moreover, one can also observe some sensitivity to mass reflux changes, considering the changes in the S-value due to re-adjustment of the mass reflux. The influence of gradual particle size changes has also been investigated for a second set of operating conditions, at increased mass reflux and decreased fluidization velocity in the bubbling bed. Visual observations of the previously presented operating conditions (LS 1 and 2) showed that the riser density was lower and that the riser showed less tendency for slugging compared to the L-valve configuration at the same set riser velocity and mass reflux. Here, the mass reflux has been adapted to compensate this effect and operate at higher riser densities, in the range of the experiments with L-valve configuration. The reason for this difference in riser density is suspected to originate from the different reflux mechanisms for L-valve and loop seal. For the loop seal configuration a share of ~10% of the total riser gas flow is delivered by the bubbling bed. This results in a secondary gas injection in the dense part of the riser, centered at a height of 12.5 cm from the distributor plate. In bubbling fluidized beds it has been shown that secondary gas injection in the bed increases the Peclet number, corresponding to a decreased back-mixing [12], although is not clear if this effect is also applicable in a circulating bed where gas voids are much less distinct. From the definition of Pe this effect is equivalent to an increase in gas velocity, which would lead to a decreased density and a lower tendency for slugging. Another reason for this difference in riser densities could lie in the physical connection between bubbling bed and riser. The space above the bubbling bed surface including the connection to the riser could buffer temporarily higher pressures in the riser, which would otherwise result in more slugging-like behavior with increased riser densities. For the adapted operating conditions it has been confirmed that S is not sensitive to an increase of 10% and 20% in bed mass (run LS 3, not shown here). In contrast to the previous set of operating conditions, there are no temporary spikes during mass addition. For the addition of larger sized sand (runs LS 4 a/b) the response of the S-values for two independent experiments is shown in Figure 3-18.
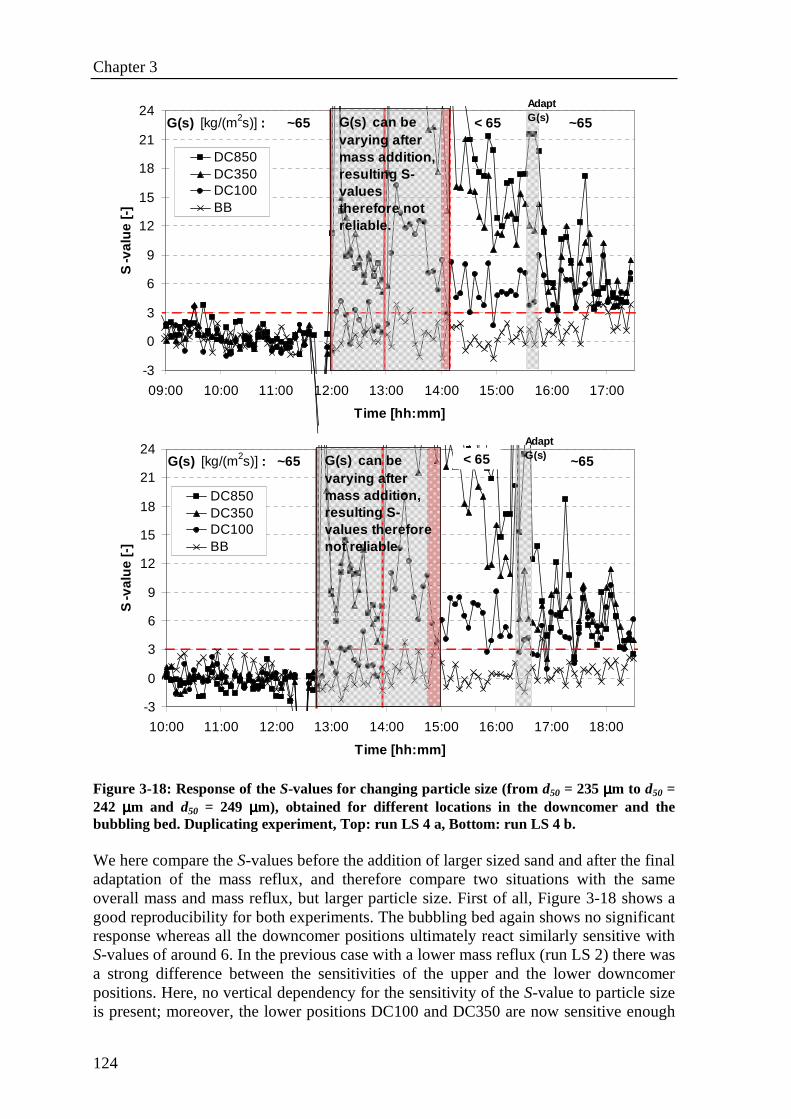
Chapter 3
124
-3
0
3
6
9
12
15
18
21
24
09:00 10:00 11:00 12:00 13:00 14:00 15:00 16:00 17:00
Time [hh:mm]
S-v
alue
[-]
DC850DC350DC100BB
G(s) can be varying after mass addition, resulting S-values therefore not reliable.
Adapt G(s)G(s) [kg/(m2s)] : ~65 < 65 ~65
-3
0
3
6
9
12
15
18
21
24
10:00 11:00 12:00 13:00 14:00 15:00 16:00 17:00 18:00
Time [hh:mm]
S-v
alue
[-]
DC850DC350DC100BB
G(s) can be varying after mass addition, resulting S-values therefore not reliable.
Adapt G(s)G(s) [kg/(m2s)] : ~65 ~65< 65
Figure 3-18: Response of the S-values for changing particle size (from d50 = 235 µµµµm to d50 = 242 µµµµm and d50 = 249 µµµµm), obtained for different locations in the downcomer and the bubbling bed. Duplicating experiment, Top: run LS 4 a, Bottom: run LS 4 b. We here compare the S-values before the addition of larger sized sand and after the final adaptation of the mass reflux, and therefore compare two situations with the same overall mass and mass reflux, but larger particle size. First of all, Figure 3-18 shows a good reproducibility for both experiments. The bubbling bed again shows no significant response whereas all the downcomer positions ultimately react similarly sensitive with S-values of around 6. In the previous case with a lower mass reflux (run LS 2) there was a strong difference between the sensitivities of the upper and the lower downcomer positions. Here, no vertical dependency for the sensitivity of the S-value to particle size is present; moreover, the lower positions DC100 and DC350 are now sensitive enough
Agglomeration and gradual particle size changes in circulating fluidized beds
125
to detect the applied particle size changes. A possible explanation for this phenomenon is that the lower velocity in the bubbling bed (run LS 4) causes less interference with the downcomer; in addition, the riser pressure fluctuations have a higher amplitude here due to a higher density/reflux and therefore propagate stronger into the downcomer. In contrast to the lower downcomer positions, the upper position DC850 strongly decreased in sensitivity as compared to run LS 2; the reason for this decrease is not clear. It is also important to notice that in combination with a lower mass reflux, i.e. before its final adaptation (G(s) < 65 kg/(m2s) in Figure 3-18), the vertical dependence of the sensitivity is indeed still observed. It is only after the re-adjustment back to 65 kg/(m2s) that this vertical dependence disappears. For the riser the S-values for two independent experiments are shown in Figure 3-19. Also for the riser, the reproducibility for both experiments is good. The S-values are in the range of approx. 5-10. The sensitivity has increased as compared to the previous case of lower mass reflux and riser density (run LS 2, Figure 3-17). Again, there is no clear dependency of the sensitivity with respect to height, only R128 is somewhat less sensitive here. This decreased sensitivity could have to do with entrance-effects of the recycling bed material from the downcomer, with R128 being directly opposite to the riser inlet. The S-values in the riser now roughly correspond with the S-values observed in the riser of the L-valve configuration (Figure 3-7 b/c) with the same riser velocity but a reflux of 40 kg/(m2s). The riser densities, however, are roughly similar in both cases. In contrast, for the loop seal configuration at a reflux of 40 kg/(m2s) both the resulting riser density and sensitivity to particle size changes were lower. This indicates that the absolute S-values are related to the resulting riser density rather than the chosen mass reflux. This is understandable due to the direct relation of more intense pressure fluctuations (increased amplitude) with increased bed density. The sensitivity of the method increases with higher mass reflux / riser density, with the highest downcomer position being the only exception to this rule. The reductions in mass reflux in these two experiments after addition and removal of sand were both approximately 10-12%. In comparison, the reduction in mass reflux for the case of adding the same sized material as a reference case (not shown) has been maximal approximately 7%; however, in that case there was no change in the S-value. Overall, as already the case for the previous operating conditions one can observe a sensitivity of the S-value to particle size changes and to mass reflux changes. The resulting S-values in case of a changing mass reflux here are higher than for the case of adding same sized particles (run LS 3, not shown), but the relative change in mass reflux is also higher here. The sensitivity to particle size has also increased for the riser and the lower downcomer part, only exception is the upper downcomer with a sensitivity decrease.
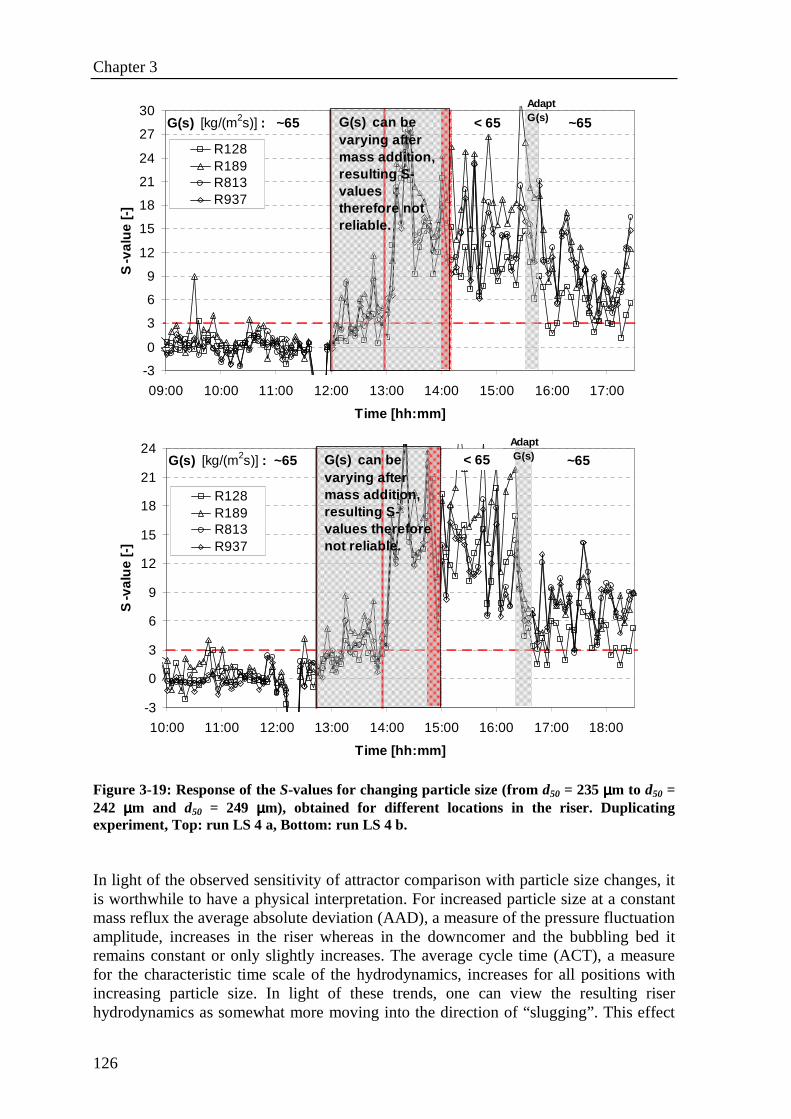
Chapter 3
126
-3
0
3
6
9
12
15
18
21
24
27
30
09:00 10:00 11:00 12:00 13:00 14:00 15:00 16:00 17:00
Time [hh:mm]
S-v
alue
[-]
R128R189R813R937
G(s) can be varying after mass addition, resulting S-values therefore not reliable.
Adapt G(s)G(s) [kg/(m2s)] : ~65 < 65 ~65
-3
0
3
6
9
12
15
18
21
24
10:00 11:00 12:00 13:00 14:00 15:00 16:00 17:00 18:00
Time [hh:mm]
S-v
alue
[-]
R128R189R813R937
G(s) can be varying after mass addition, resulting S-values therefore not reliable.
Adapt G(s)G(s) [kg/(m2s)] : ~65 ~65< 65
Figure 3-19: Response of the S-values for changing particle size (from d50 = 235 µµµµm to d50 = 242 µµµµm and d50 = 249 µµµµm), obtained for different locations in the riser. Duplicating experiment, Top: run LS 4 a, Bottom: run LS 4 b. In light of the observed sensitivity of attractor comparison with particle size changes, it is worthwhile to have a physical interpretation. For increased particle size at a constant mass reflux the average absolute deviation (AAD), a measure of the pressure fluctuation amplitude, increases in the riser whereas in the downcomer and the bubbling bed it remains constant or only slightly increases. The average cycle time (ACT), a measure for the characteristic time scale of the hydrodynamics, increases for all positions with increasing particle size. In light of these trends, one can view the resulting riser hydrodynamics as somewhat more moving into the direction of “slugging”. This effect
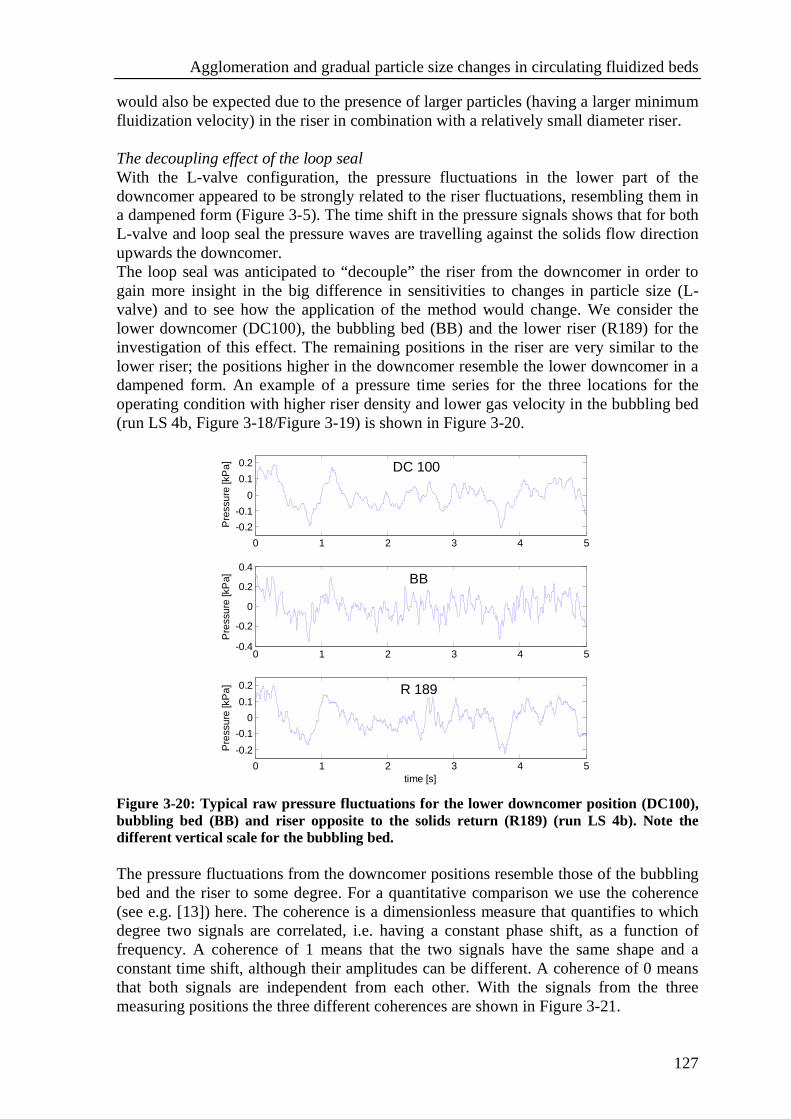
Agglomeration and gradual particle size changes in circulating fluidized beds
127
would also be expected due to the presence of larger particles (having a larger minimum fluidization velocity) in the riser in combination with a relatively small diameter riser. The decoupling effect of the loop seal With the L-valve configuration, the pressure fluctuations in the lower part of the downcomer appeared to be strongly related to the riser fluctuations, resembling them in a dampened form (Figure 3-5). The time shift in the pressure signals shows that for both L-valve and loop seal the pressure waves are travelling against the solids flow direction upwards the downcomer. The loop seal was anticipated to “decouple” the riser from the downcomer in order to gain more insight in the big difference in sensitivities to changes in particle size (L-valve) and to see how the application of the method would change. We consider the lower downcomer (DC100), the bubbling bed (BB) and the lower riser (R189) for the investigation of this effect. The remaining positions in the riser are very similar to the lower riser; the positions higher in the downcomer resemble the lower downcomer in a dampened form. An example of a pressure time series for the three locations for the operating condition with higher riser density and lower gas velocity in the bubbling bed (run LS 4b, Figure 3-18/Figure 3-19) is shown in Figure 3-20.
0 1 2 3 4 5
-0.2
-0.1
0
0.1
0.2
Pre
ssur
e [k
Pa]
0 1 2 3 4 5-0.4
-0.2
0
0.2
0.4
Pre
ssur
e [k
Pa]
0 1 2 3 4 5
-0.2
-0.1
0
0.1
0.2
Pre
ssur
e [k
Pa]
time [s]
DC 100
BB
R 189
Figure 3-20: Typical raw pressure fluctuations for the lower downcomer position (DC100), bubbling bed (BB) and riser opposite to the solids return (R189) (run LS 4b). Note the different vertical scale for the bubbling bed. The pressure fluctuations from the downcomer positions resemble those of the bubbling bed and the riser to some degree. For a quantitative comparison we use the coherence (see e.g. [13]) here. The coherence is a dimensionless measure that quantifies to which degree two signals are correlated, i.e. having a constant phase shift, as a function of frequency. A coherence of 1 means that the two signals have the same shape and a constant time shift, although their amplitudes can be different. A coherence of 0 means that both signals are independent from each other. With the signals from the three measuring positions the three different coherences are shown in Figure 3-21.
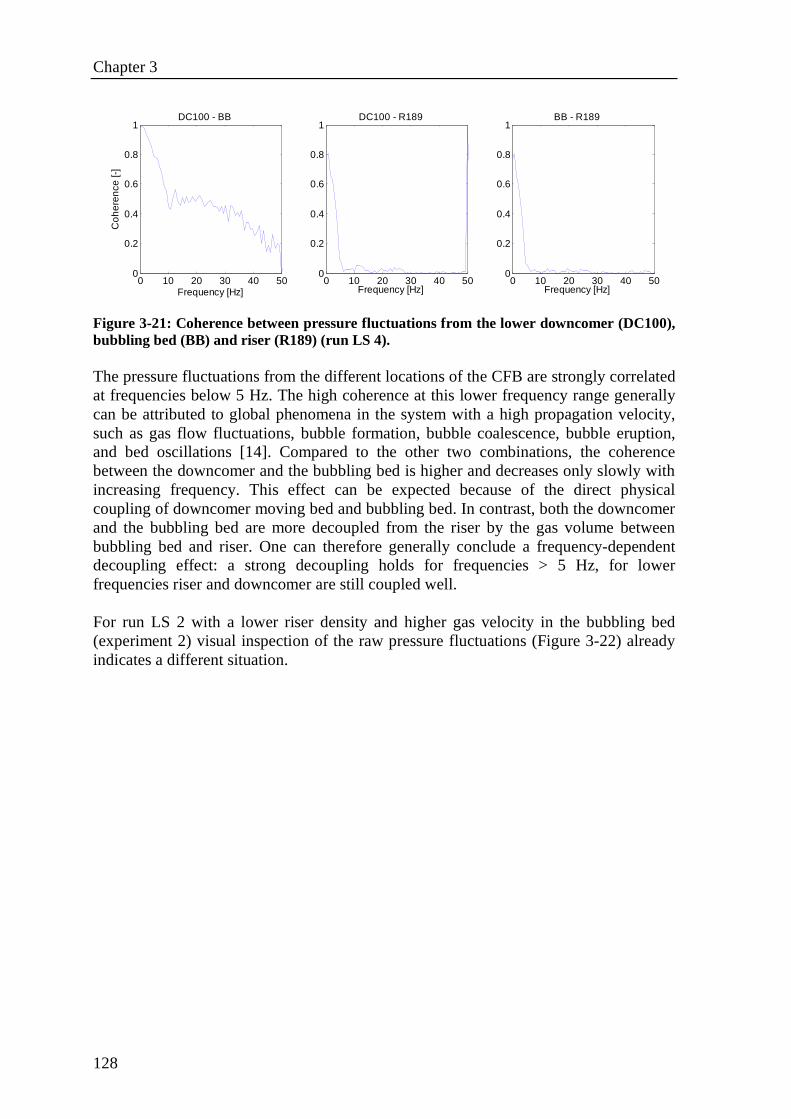
Chapter 3
128
0 10 20 30 40 500
0.2
0.4
0.6
0.8
1
Frequency [Hz]
Co
her
ence
[-]
DC100 - BB
0 10 20 30 40 500
0.2
0.4
0.6
0.8
1
Frequency [Hz]
DC100 - R189
0 10 20 30 40 500
0.2
0.4
0.6
0.8
1
Frequency [Hz]
BB - R189
Figure 3-21: Coherence between pressure fluctuations from the lower downcomer (DC100), bubbling bed (BB) and riser (R189) (run LS 4). The pressure fluctuations from the different locations of the CFB are strongly correlated at frequencies below 5 Hz. The high coherence at this lower frequency range generally can be attributed to global phenomena in the system with a high propagation velocity, such as gas flow fluctuations, bubble formation, bubble coalescence, bubble eruption, and bed oscillations [14]. Compared to the other two combinations, the coherence between the downcomer and the bubbling bed is higher and decreases only slowly with increasing frequency. This effect can be expected because of the direct physical coupling of downcomer moving bed and bubbling bed. In contrast, both the downcomer and the bubbling bed are more decoupled from the riser by the gas volume between bubbling bed and riser. One can therefore generally conclude a frequency-dependent decoupling effect: a strong decoupling holds for frequencies > 5 Hz, for lower frequencies riser and downcomer are still coupled well. For run LS 2 with a lower riser density and higher gas velocity in the bubbling bed (experiment 2) visual inspection of the raw pressure fluctuations (Figure 3-22) already indicates a different situation.
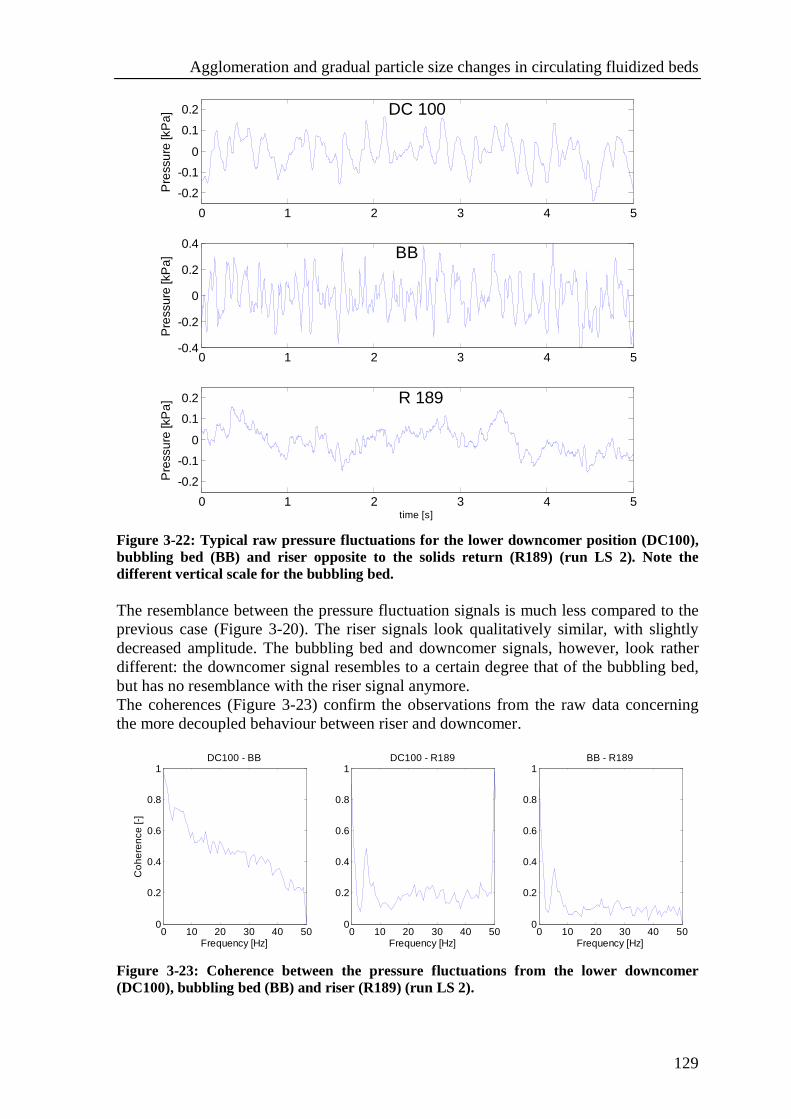
Agglomeration and gradual particle size changes in circulating fluidized beds
129
0 1 2 3 4 5
-0.2
-0.1
0
0.1
0.2
Pre
ssur
e [k
Pa]
0 1 2 3 4 5-0.4
-0.2
0
0.2
0.4
Pre
ssur
e [k
Pa]
0 1 2 3 4 5
-0.2
-0.1
0
0.1
0.2
Pre
ssur
e [k
Pa]
time [s]
DC 100
BB
R 189
Figure 3-22: Typical raw pressure fluctuations for the lower downcomer position (DC100), bubbling bed (BB) and riser opposite to the solids return (R189) (run LS 2). Note the different vertical scale for the bubbling bed. The resemblance between the pressure fluctuation signals is much less compared to the previous case (Figure 3-20). The riser signals look qualitatively similar, with slightly decreased amplitude. The bubbling bed and downcomer signals, however, look rather different: the downcomer signal resembles to a certain degree that of the bubbling bed, but has no resemblance with the riser signal anymore. The coherences (Figure 3-23) confirm the observations from the raw data concerning the more decoupled behaviour between riser and downcomer.
0 10 20 30 40 500
0.2
0.4
0.6
0.8
1
Frequency [Hz]
Co
here
nce
[-]
DC100 - BB
0 10 20 30 40 500
0.2
0.4
0.6
0.8
1
Frequency [Hz]
DC100 - R189
0 10 20 30 40 500
0.2
0.4
0.6
0.8
1
Frequency [Hz]
BB - R189
Figure 3-23: Coherence between the pressure fluctuations from the lower downcomer (DC100), bubbling bed (BB) and riser (R189) (run LS 2).
Chapter 3
130
As compared to run LS 4 one can observe a decreased coherence between the riser and both other positions at low frequencies of approximately 0-3 Hz. Moreover, one can observe a clear peak at around 5 Hz in all coherence plots; in case of coherence between downcomer and bubbling bed this effect appears somewhat masked by an overall high coherence, in the other cases it is clearly visible. From the power spectra (not shown) this 5 Hz peak is identified to correspond to the dominant frequency in the bubbling bed, but not in the riser at this frequency. Together with the high correlation, this means that the 5 Hz signal originates from the bubbling bed and is strongly attenuated as it propagates into the riser (the coherence is not dependent on amplitude). The coherence between downcomer and bubbling bed has not significantly changed as compared to run LS 4 and is still high due to the more direct coupling via the moving sand bed. One should keep in mind that the setup with a loop seal does not simply decouple the riser pressure fluctuations from the downcomer to a higher degree, but also introduces the bubbling bed as an additional source for pressure fluctuations. A change in the degree of decoupling between riser and downcomer could explain the increased sensitivity to particle size changes for the lower downcomer positions at the high riser density and low bubbling bed velocity (run LS 4a/b). The pressure fluctuations measured in the downcomer are more coupled with those in the riser in that case; therefore hydrodynamic changes in the riser will have a more significant contribution in the downcomer. This also implies that the riser is still the main source for information from pressure fluctuations regarding the changing particle size. Comparing the L-valve configuration (Figure 3-7) with the loop seal configuration (Figure 3-18/Figure 3-19) the sensitivity to particle size changes in the riser is very similar in both cases (S-values around 6), whereas the very high sensitivity in the lower downcomer with L-valve configuration (S-values around 40) is greatly reduced for the loop seal configuration (S-values around 6). This strengthens the hypothesis that the very high sensitivity to particle size changes in the downcomer with L-valve configuration is indeed a result of the riser pressure fluctuations that are modified (filtered) as they travel from riser to downcomer. Finally, the question remains how the decoupling effect would change when going to larger-scale industrial CFBs. Measurements in an industrial size CFB riser, loop seal and downcomer are therefore highly desirable to check the scale-dependency of the decoupling hypothesis. Monitoring average riser pressure drop One could raise the question whether the average pressure drop – often a readily available process variable in industrial installations – would be sufficient for monitoring particle size and detect agglomeration. In the experiments with the loop seal we have also measured the pressure drop over five consecutive vertical segments in the riser. Generally, some correlation was observed with the changing mass reflux as well as disturbances originating from addition and removal of material. The sensitivity to mass reflux changes is to be expected because they directly influence the riser density profile. However, there was no correlation observed with particle size. It is concluded that simple pressure drop measurements are not suitable for monitoring particle size changes.
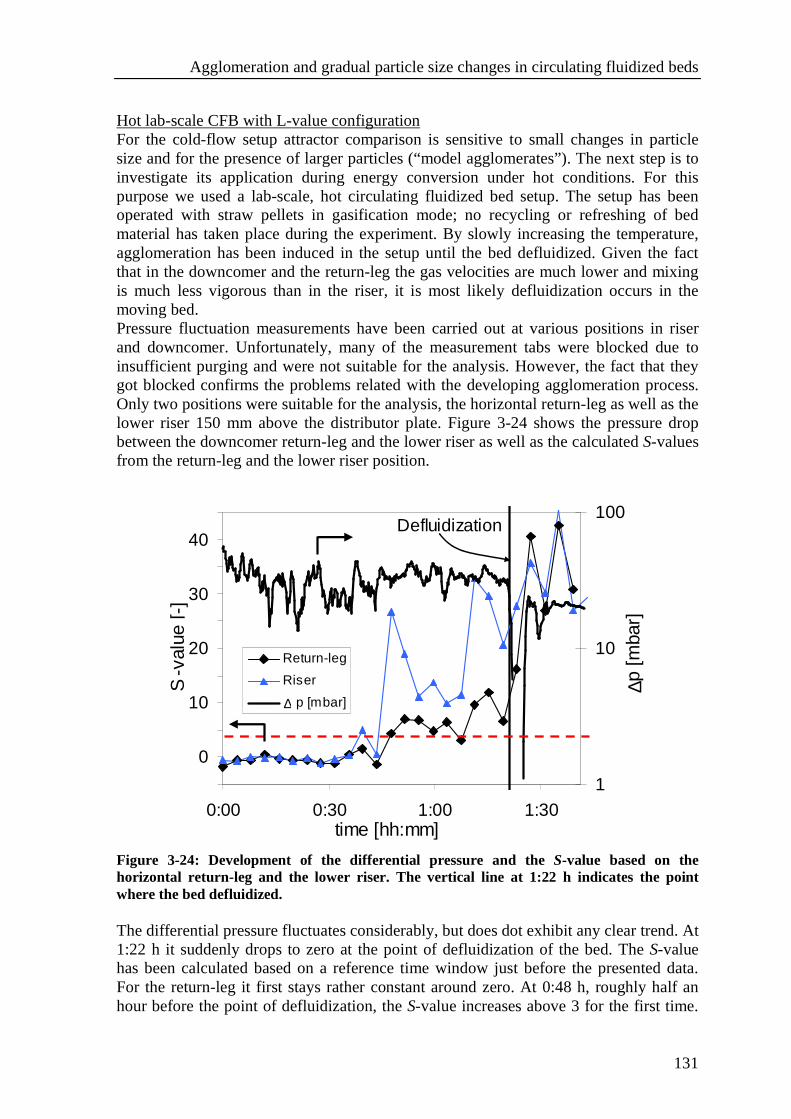
Agglomeration and gradual particle size changes in circulating fluidized beds
131
Hot lab-scale CFB with L-value configuration For the cold-flow setup attractor comparison is sensitive to small changes in particle size and for the presence of larger particles (“model agglomerates”). The next step is to investigate its application during energy conversion under hot conditions. For this purpose we used a lab-scale, hot circulating fluidized bed setup. The setup has been operated with straw pellets in gasification mode; no recycling or refreshing of bed material has taken place during the experiment. By slowly increasing the temperature, agglomeration has been induced in the setup until the bed defluidized. Given the fact that in the downcomer and the return-leg the gas velocities are much lower and mixing is much less vigorous than in the riser, it is most likely defluidization occurs in the moving bed. Pressure fluctuation measurements have been carried out at various positions in riser and downcomer. Unfortunately, many of the measurement tabs were blocked due to insufficient purging and were not suitable for the analysis. However, the fact that they got blocked confirms the problems related with the developing agglomeration process. Only two positions were suitable for the analysis, the horizontal return-leg as well as the lower riser 150 mm above the distributor plate. Figure 3-24 shows the pressure drop between the downcomer return-leg and the lower riser as well as the calculated S-values from the return-leg and the lower riser position.
-5
0
5
10
15
20
25
30
35
40
45
0:00 0:30 1:00 1:30time [hh:mm]
S-v
alue
[-]
1
10
100
∆p [
mba
r]Return-leg
Riser
p [mbar]∆
Defluidization
Figure 3-24: Development of the differential pressure and the S-value based on the horizontal return-leg and the lower riser. The vertical line at 1:22 h indicates the point where the bed defluidized. The differential pressure fluctuates considerably, but does dot exhibit any clear trend. At 1:22 h it suddenly drops to zero at the point of defluidization of the bed. The S-value has been calculated based on a reference time window just before the presented data. For the return-leg it first stays rather constant around zero. At 0:48 h, roughly half an hour before the point of defluidization, the S-value increases above 3 for the first time.
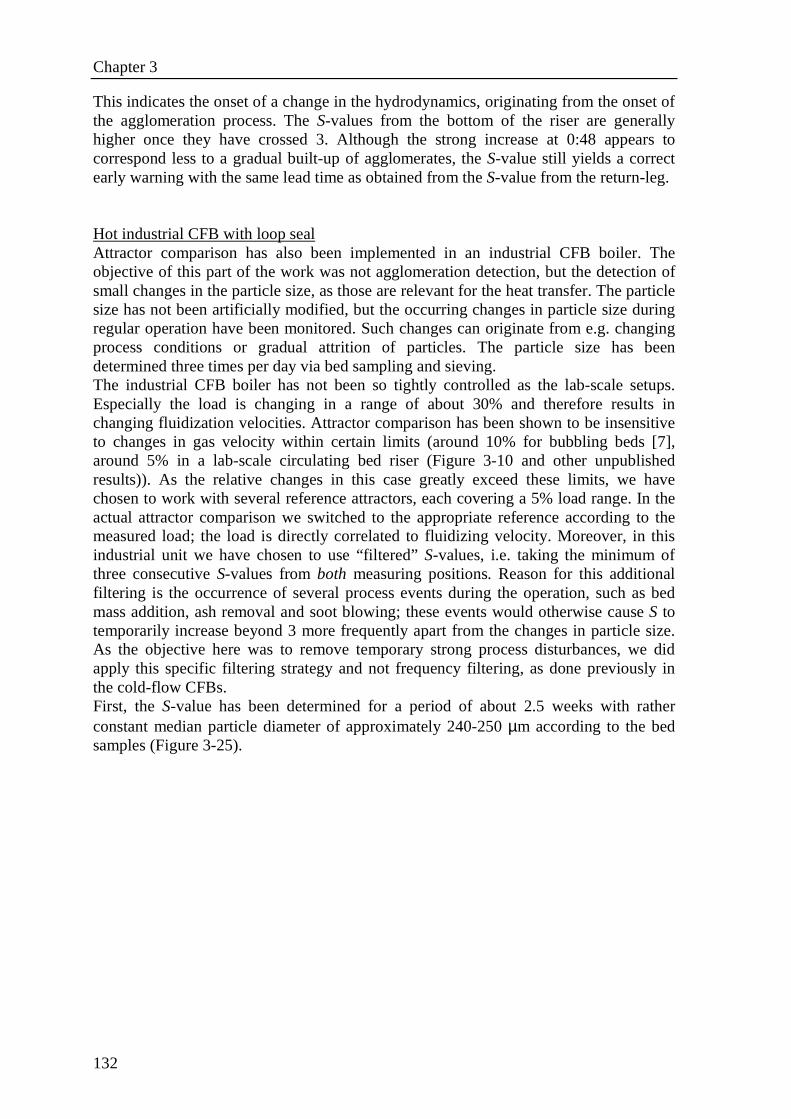
Chapter 3
132
This indicates the onset of a change in the hydrodynamics, originating from the onset of the agglomeration process. The S-values from the bottom of the riser are generally higher once they have crossed 3. Although the strong increase at 0:48 appears to correspond less to a gradual built-up of agglomerates, the S-value still yields a correct early warning with the same lead time as obtained from the S-value from the return-leg. Hot industrial CFB with loop seal Attractor comparison has also been implemented in an industrial CFB boiler. The objective of this part of the work was not agglomeration detection, but the detection of small changes in the particle size, as those are relevant for the heat transfer. The particle size has not been artificially modified, but the occurring changes in particle size during regular operation have been monitored. Such changes can originate from e.g. changing process conditions or gradual attrition of particles. The particle size has been determined three times per day via bed sampling and sieving. The industrial CFB boiler has not been so tightly controlled as the lab-scale setups. Especially the load is changing in a range of about 30% and therefore results in changing fluidization velocities. Attractor comparison has been shown to be insensitive to changes in gas velocity within certain limits (around 10% for bubbling beds [7], around 5% in a lab-scale circulating bed riser (Figure 3-10 and other unpublished results)). As the relative changes in this case greatly exceed these limits, we have chosen to work with several reference attractors, each covering a 5% load range. In the actual attractor comparison we switched to the appropriate reference according to the measured load; the load is directly correlated to fluidizing velocity. Moreover, in this industrial unit we have chosen to use “filtered” S-values, i.e. taking the minimum of three consecutive S-values from both measuring positions. Reason for this additional filtering is the occurrence of several process events during the operation, such as bed mass addition, ash removal and soot blowing; these events would otherwise cause S to temporarily increase beyond 3 more frequently apart from the changes in particle size. As the objective here was to remove temporary strong process disturbances, we did apply this specific filtering strategy and not frequency filtering, as done previously in the cold-flow CFBs. First, the S-value has been determined for a period of about 2.5 weeks with rather constant median particle diameter of approximately 240-250 µm according to the bed samples (Figure 3-25).
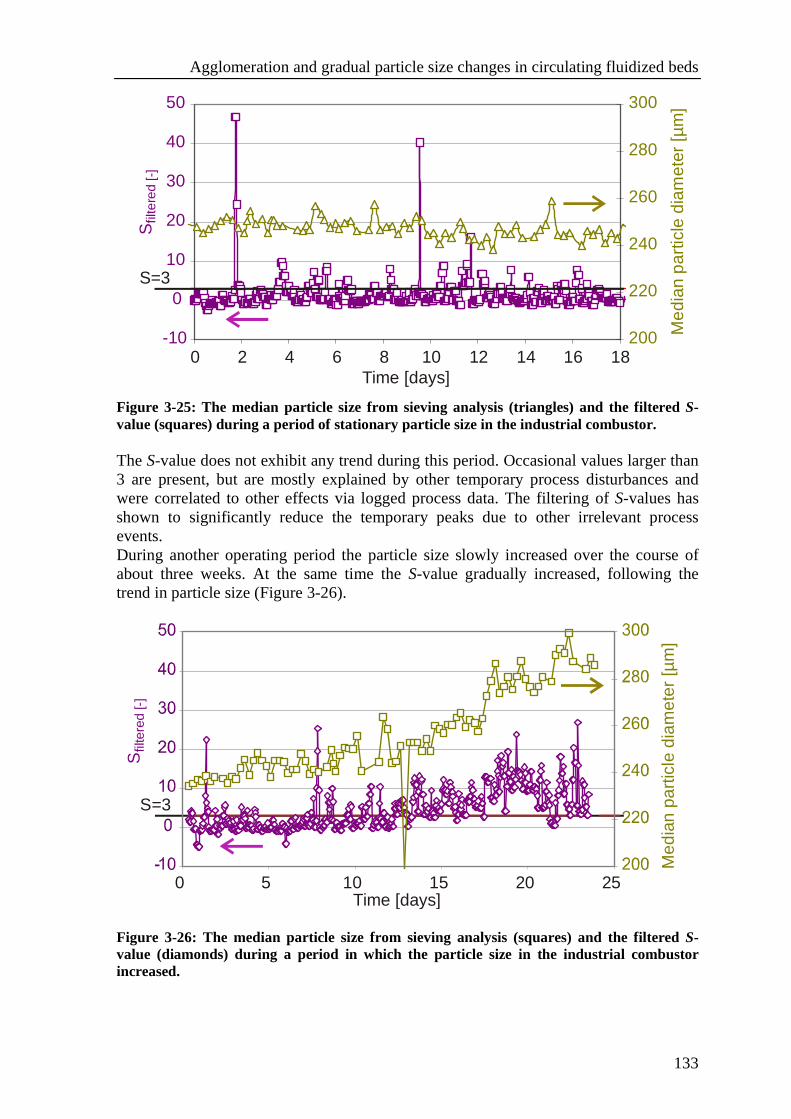
Agglomeration and gradual particle size changes in circulating fluidized beds
133
-10
0
10
20
30
40
50
Sfil
tere
d [-
]
200
Time [days]
Med
ian
part
icle
dia
met
er [
m]
µ
220
240
260
280
300
S=3
0 2 4 6 8 10 12 14 16 18
Figure 3-25: The median particle size from sieving analysis (triangles) and the filtered S-value (squares) during a period of stationary particle size in the industrial combustor. The S-value does not exhibit any trend during this period. Occasional values larger than 3 are present, but are mostly explained by other temporary process disturbances and were correlated to other effects via logged process data. The filtering of S-values has shown to significantly reduce the temporary peaks due to other irrelevant process events. During another operating period the particle size slowly increased over the course of about three weeks. At the same time the S-value gradually increased, following the trend in particle size (Figure 3-26).
Sfil
tere
d [-
]
Time [days]
Med
ian
part
icle
dia
met
er [
m]
µ
S=3
0 5 10 15 20 25
Figure 3-26: The median particle size from sieving analysis (squares) and the filtered S-value (diamonds) during a period in which the particle size in the industrial combustor increased.
Chapter 3
134
Within this correlation between the S-value and the median particle size one can observe a significant change in S clearly crossing the value of 3 around day 13-15, when the median particle diameter has increased by approx. 20 µm compared to the reference median particle diameter of approx. 240 µm. Keeping in mind that the S-value is a measure relative to the chosen reference condition, one could actually not a-priori determine whether the particle size increases or decreases as the S-value only increases. To distinguish increasing and decreasing particle size during operation without simultaneous sampling it is possible to use several reference attractors (at least two), each at a different particle size. One can then match the current attractor with the corresponding reference from such a database to obtain the currently present particle size.
3.5. Conclusions The attractor comparison method can be used for the detection of gradual particle size changes as well as the early detection of agglomeration in various circulating fluidized beds. In a cold-flow lab-scale circulating fluidized bed (CFB) with an L-valve for solids return attractor comparison is sensitive to small changes in particle size. For a median particle size of 235 µm the detection limit in the riser is a size change of approx. 10 µm. For the downcomer the method is much more sensitive, with a detection limit of a size change well below 7 µm for the lower vertical downcomer section and approx. 2 µm in the horizontal return-leg. Changes in bed mass up to 20% do not disturb the method. Applying a low-pass filter can be beneficial as it greatly reduces sensitivity to fluctuations in bed mass and gas flow, but only marginally reduces sensitivity to particle size changes. The method has also been shown to be sensitive to the presence of model agglomerates (d50 = 1900 µm). Applying a 30 Hz low-pass filter has shown to successfully remove sensitivity to changes in mass reflux, especially in the riser. With such a filter, the sensitivities from riser, downcomer and return-leg are very similar; the resulting detection limit is approx. 2-3 w% of model agglomerates. With a loop seal for the solids return, attractor comparison is sensitive to changes in particle size of 14 µm relative to the median particle size of 235 µm. For the downcomer, there can be a strong sensitivity gradient, with higher sensitivities at higher measuring positions; the lower positions in the downcomer do not detect the imposed changes. At operating conditions with higher mass reflux and riser density, however, this gradient in sensitivity disappears and all positions become equally suitable. The bubbling bed does not detect such small changes in particle size, consistent with [7]. The riser is only slightly sensitive to particle size changes when operating with a lower riser density, and more sensitive at higher riser densities. Despite a large vertical density gradient in the riser, no significant vertical sensitivity gradients were observed. The method is not sensitive to mass changes up to 20% and not sensitive to relative changes of about 7% in mass reflux. However, the method is sensitive to a resulting 10-12% decreased mass reflux due to the addition of larger sized sand, which is thought to originate from settling effects in the moving bed.
Agglomeration and gradual particle size changes in circulating fluidized beds
135
In both the loop seal and L-valve configuration the pressure waves are traveling against the solids flow direction in the downcomer. The application of a loop-seal as compared to an L-valve leads to less coupling between the downcomer pressure fluctuations and riser pressure fluctuations. This coupling is quantified by the coherence between riser and downcomer pressure fluctuations and is frequency dependent: At higher frequencies the coherence is low, whereas for low frequencies smaller than ~ 5 Hz (global hydrodynamic phenomena) it is generally high. Under actual gasification conditions in a lab-scale CFB with very similar geometry as the cold-flow setup, attractor comparison was applied to a real agglomeration case. The S-values from the horizontal return-leg as well as the lower downcomer can be used to detect the developing agglomeration process and indicate the approaching defluidization with an early warning time of about 30 min in advance. In an industrial CFB boiler with gradually changing particle size during regular operation, attractor comparison detects gradual changes in the median particle size, based on measurements in the lower dense bed riser. Here the method detects an increase of ~20 µm relative to the median bed particle diameter of ~240 µm.
3.6. Recommendations for Implementation Based on the results from the different experimental investigations, we propose the following guidelines for the implementation of the attractor comparison method in CFBs. Riser: Small particle size changes as well as agglomeration can be detected, with increasing sensitivity at higher riser densities. It will therefore be useful to measure in the lower, dense part of the riser; very lean regions in the upper part should not be considered. The sensitivity and detection limits therefore also improve with operation conditions of higher riser densities. Downcomer: The analysis based on measurements in the downcomer has shown to be often more sensitive than in the riser. A vertical sensitivity gradient can be present, depending on the operating conditions. It is therefore recommended to measure low as well as high in the dense bed downcomer, if possible, also to gain more insight on the optimal position. L-valve or loop seal: The solids return mechanism in CFBs can be carried out with L-valve or loop seal. In case of an L-valve a measurement position in the horizontal return-pipe is highly recommended; in addition low-pass filtering before the analysis of the data might be necessary for robust monitoring. In case of a loop seal configuration small particle size changes were not detected in the bubbling bed. Nevertheless, this measuring position is still recommended especially when agglomeration should be detected, which is motivated by multiple positive experiences of agglomeration detection in bubbling beds (e.g. [9]).
Chapter 3
136
3.7. Acknowledgements The authors thank Roderik Bohlken for his work on the cold CFB within his Masters thesis project, Marcin Siedlecki & Wiebren de Jong for their assistance with the hot lab-scale CFB and the Sachtleben Chemie GmbH for permission to use the presented data from their plant.
3.8. References [1] Kunii, D., Levenspiel, O., “Fluidization Engineering”, Butterworth-Heinemann Ltd,
USA, 1991 [2] McKendry P. Energy production from biomass (part 3): gasification technologies.
Bioresource Technology 2002;83(1):55-63 [3] Koornneef J, Junginger M, Faaij A. Development of fluidized bed combustion - An
overview of trends, performance and cost. Progress in Energy and Combustion Science 2007;33(1):19-55
[4] Öhman M, Nordin A, Skrifvars B-J, Backman R, Hupa M. Bed Agglomeration Characteristics during Fluidized Bed Combustion of Biomass Fuels. Energy & Fuels 2000;14(1):169-178
[5] Visser HJM. The influence of fuel composition on agglomeration behaviour in fluidised-bed combustion. ECN (Energy research Centre of the Netherlands) report ECN-C--04-054 (2004)
[6] Bartels M, Lin W, Nijenhuis J, Kapteijn F, van Ommen R. Agglomeration in fluidized beds at high temperatures: Mechanisms, Detection and Prevention. Progress in Energy and Combustion Science (doi:10.1016/j.pecs.2008.04.002)
[7] van Ommen JR, Coppens MO, van den Bleek CM, Schouten JC. Early Warning of agglomeration in Fluidized Beds by Attractor Comparison. AIChE Journal 2000;46:2183-2197
[8] Diks C, van Zwet WR, Takens F, DeGoede J. Detecting the differences between delay vector distributions. Phys. Rev. E 1996;53:2169
[9] Nijenhuis J, Korbee R, Lensselink J, Kiel JHA, van Ommen JR. A method for agglomeration detection and control in full-scale biomass fired fluidized beds. Chemical Engineering Science 2007;62(1-2):644-54
[10] “Energy technologies at the cutting edge”, International Energy Agency (IEA); 2007
[11] Bohlken, R. Dynamic Monitoring of Gas-Solid Circulating Fluidized Beds. M.Sc. Thesis, Delft University of Technology 2007
[12] Christensen D, Nijenhuis J, van Ommen JR, Coppens MO. Residence times in fluidized beds with secondary gas injection. Powder Technology 2008;180(3):321-331
[13] Priestley MB. Spectral Analysis and Time Series. Academic Press LTD., London, 1981
[14] van der Schaaf J, Schouten JC, van den Bleek CM. Origin, propagation, and attenuation of pressure waves in gas-solid fluidized beds. Powder Technology 1998;95:220-233
137
Chapter 4
Methodology for the screening of signal analysis methods for selective detection of hydrodynamic changes in
multiphase reactors Different methods for the early detection of agglomeration in fluidized beds have been proposed in the literature – they are reviewed in chapter 2. Unfortunately, often only the sensitivity of the method to agglomeration is investigated, but the cross-sensitivity to other effects is seldom considered. This aspect of selectivity is important for the implementation in an industrial environment, where fluctuations in other process variables can be common and would lead to false alarms if a method is not selective enough. Therefore, a new methodology is proposed that consists of screening many different signal analysis methods in combination with pre-treatment (filtering) methods with the goal to find those combinations that are sensitive and selective to a specific cause for a change in the hydrodynamics. With a screening approach, the suitability of each combination is assessed and expressed by a selectivity index. This methodology is not restricted to fluidized beds, but can also be used for other systems, specifically for multiphase reactors. In this chapter the methodology is presented in detail, in addition some illustrating examples are shown. A more detailed investigation of different case studies is presented in chapter 5. This chapter has been submitted for publication: Malte Bartels, Bart Vermeer, Peter Verheijen, John Nijenhuis, Freek Kapteijn, J. Ruud van Ommen. Methodology for the screening of signal analysis methods for selective detection of hydrodynamic changes in multiphase reactors. Ind. Eng. Chem. Res. (2008)
Chapter 4
138
4.1. Abstract Various multiphase reactor systems need to be monitored, e.g. for increasing efficiency or for avoiding catastrophic events such as defluidization, excessive foaming or flooding. In addition to the commonly available average process variables, high-frequency pressure signals have been shown to contain relevant information about the process state. There are many different analysis techniques available that can be used for the data analysis of such signals. However, only sufficiently selective methods will be suitable for an unambiguous detection of a specific change in the process, i.e. the identification of the cause. In this paper, a new methodology is presented for screening many different signal analysis methods in combination with various signal pre-treatment methods with the goal to find those combinations that are selective towards a specific process change. This methodology can generally be applied for any specific process change; here we focus on the detection of agglomeration in fluidized beds. The presented methodology is illustrated with some fluidized bed datasets, demonstrating the validity and the benefit of this approach.
4.2. Introduction Multiphase reactors are used for variety of processes in industry. Typical examples are trickle beds (gas-liquid-solid), monolith reactors (gas-liquid-solid), bubble columns (gas-liquid), slurry bubble columns (gas-liquid-solid) and fluidized beds (gas-solid). Each of these reactor types can exhibit specific operational problems. For trickle beds liquid maldistribution should be avoided. Operated in counter-current mode flooding can occur even at low gas and liquid velocities (e.g. [1]). Bubble and slurry bubble columns, e.g. used for waste water treatment and in the biotechnology area, can exhibit excessive foaming or regime transitions (e.g. [2,3]). For fluidized beds the formation of unwanted agglomerates can lead to defluidization of the bed (e.g. [4]). Prevention of unwanted behaviour in multiphase reactors using an early warning system is therefore important to ensure trouble-free operation. Fluidized bed monitoring applications Gas-solid fluidized beds as a specific multiphase reactor type are utilized for a variety of processes in the chemical industry, such as catalytic reactions, drying, coating and energy conversion (e.g. [5]). Different operating parameters play a role in fluidized beds. Besides the operating parameters such as flows, pressures and temperatures, the operation of a particulate process is also determined by the particle properties – mainly size distribution, density, shape-factor and the coefficient of restitution (quantifying the elasticity of the particle collisions). Changes in those parameters can significantly influence the hydrodynamic behaviour of the bed. Knowledge of the process conditions is of great importance not only for the operability and safety of the process but also for its economics, operating at optimal conditions and avoiding unscheduled shutdowns. Therefore, there is a clear need for on-line monitoring methods of various fluidized bed applications. The goal of each monitoring method can vary, however. Generally, one can think of a method that would allow reliably operating
Methodology for screening of signal analysis methods
139
the process closer to the optimal conditions, e.g. controlling the bed hydrodynamics and resulting heat transfer by keeping the particle size within specific limits. Another important objective is the early detection of catastrophic events, leading to an undesired shut-down of the installation. The importance of process monitoring is illustrated by two examples of different fluidized bed processes. In case of fluidized bed drying of powders an optimal moisture content and particle size distribution are mainly defining the desired product quality. During the drying process moisture evaporates and larger agglomerates will break up into smaller entities. As the moisture reaches a critical lower level, the temperature of the bed will quickly rise due to the heat continuously provided from the fluidization gas. This can have negative effects on product quality and should be avoided, i.e. a defined drying “end-point” should not be exceeded. In this case process monitoring is necessary to accurately determine the optimal point to stop the drying process [6]. In the area of combustion and gasification often fluidized beds with inert bed material are used to obtain a uniform heat distribution from the burning solid fuel. Silica sand is commonly used as heat reservoir to ensure homogeneous heat distribution. In this process sand particles can become covered with a sticky layer due to the occurrence of eutectic mixtures with melting points below the operating temperature. The sand particles consecutively adhere to each other and larger agglomerates are formed (e.g. [4,7]). This effect is undesired, as it decreases the degree of mixing and results in inhomogeneous heat distribution. Ultimately, it can lead to partial or total defluidization and a costly shut-down of the installation. A monitoring technique providing an early detection of this phenomenon is therefore crucial for preventing such events [8]. Conventional vs. advanced detection methods In industrial fluidized beds installations, temperature and pressure measurements are in general rather simple and robust, which explains their wide application in process monitoring [9]; mainly pressure drop over the whole bed or a part of it, and/or temperature differences in the bed are utilized. The actual sensors are used to obtain average process variables, i.e. they are sampled at a relatively low sampling frequency, normally below 1 Hz. Those average (low-frequency) measurements have often shown to reliably detect a process event only at a very late stage in the process, e.g. approaching defluidization in fluidized bed combustion [8]. This leaves insufficient time to counteract the agglomeration process and return to normal operating conditions. Pressure fluctuation measurements have been shown to be a suitable to overcome this dilemma. The pressure fluctuations characterize the hydrodynamics of the bed, which is mainly dominated by the different bubble phenomena – formation, rise, coalescence & break-up and eruption. The bubble phenomena are, in turn, influenced by the particle properties. Therefore the pressure fluctuations indirectly also contain information about the changing particle properties involved in the early stages of agglomeration, which makes them a suitable measurement source for monitoring techniques. The pressure fluctuations have to be measured at high sampling frequencies in order to resolve the occurring high-frequency phenomena. Typical sampling frequencies are in the order of magnitude of 100-400 Hz. In the literature several methods have been proposed for monitoring fluidized beds and the early detection of agglomeration. The proposed methods can vary in terms of complexity. Only a short overview is presented here, for a thorough summary the reader is referred to [10]. Relatively simple methods employ existing average process measurements at the available sampling frequencies for process variables, usually well
Chapter 4
140
below 1 Hz. The average pressure drop over the bed has been proposed (e.g. [11]), its standard deviation and variance (e.g. [12,13]) as well as principal component analysis based on pressure drop (e.g. [14]). These methods generally do detect particle size changes and/or agglomeration, but only in a relatively late stage. Their response towards other process changes has either not been investigated or has been shown to be rather sensitive, e.g. for changes in the fluidizing gas flow [15]. Based on pressure fluctuation data, different more complex methods have been presented, e.g. attractor comparison [16] and the W-statistic [17]. From those methods only attractor comparison has been explicitly investigated for its sensitivity towards other process parameters and has been shown to be insensitive towards relative changes of gas velocity and bed mass within 10% for bubbling beds. Selectivity Many of the presented methods for agglomeration detection in the literature have indeed shown to be sensitive towards the actual agglomeration process. Ideally, a method would be exclusively sensitive towards the agglomeration process and not to any other process changes. However, the different methods can also exhibit some sensitivity towards other process changes, which also affect the hydrodynamics of the bed, i.e. suffer from cross-sensitivity. The investigation of this aspect is often neglected in the literature. Changes in the fluidizing gas velocity and total bed mass are considered the most common process changes. For the case of agglomeration detection it is undesired that any given method will be sensitive towards another process change, as this would falsely indicate an agglomeration event (“false alarm”). However, a method is still useful if its sensitivity towards agglomeration relative to its sensitivity towards other process changes is big. Therefore, it is important to consider the relative difference of any given method towards the different process changes. Moreover, along the same rationale one can also consider a method that is sensitive towards a specific other process change, e.g. gas velocity, and not towards agglomeration. Such a method can be very valuable as a “countercheck”, i.e. to check whether an observed change in the process can be attributed to a phenomenon other than agglomeration. Lead time For a ready-to-use monitoring application one also has to consider the lead time of a method, i.e. the time between the reliable detection of the event and the event itself. Whether or not a method can be considered suitable depends on its lead time in combination with the time scales of the process to still prevent the event. With the current methodology we only focus on the sensitivity and selectivity for a specified process change. The lead time of any given method can subsequently be extracted from the results together with a threshold (alarm) definition. Goal The goal of this chapter is to present a new generic methodology for screening various signal analysis methods and signal pre-treatment methods in order to identify suitable methods which are selectively sensitive towards specific process changes. Suitable methods therefore should satisfy two requirements: A high sensitivity towards the desired process change and a minimum cross-sensitivity for other process changes (high selectivity). The methodology should not be confused with the on-line monitoring itself,
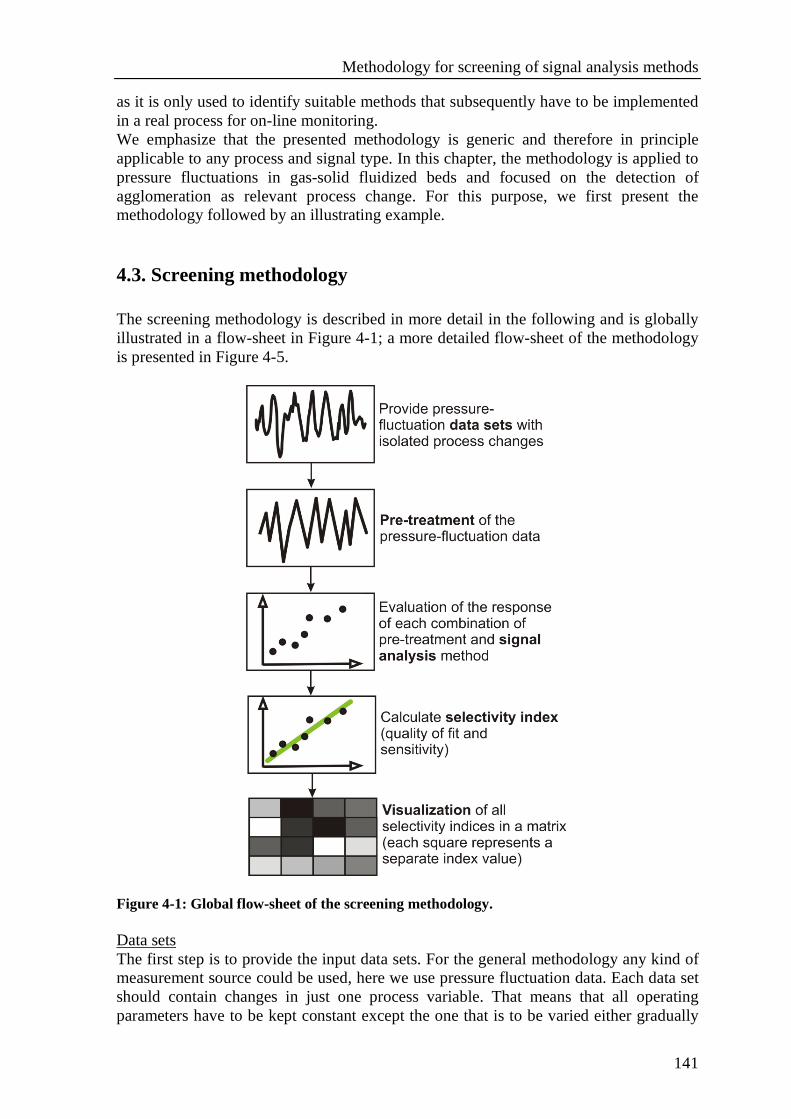
Methodology for screening of signal analysis methods
141
as it is only used to identify suitable methods that subsequently have to be implemented in a real process for on-line monitoring. We emphasize that the presented methodology is generic and therefore in principle applicable to any process and signal type. In this chapter, the methodology is applied to pressure fluctuations in gas-solid fluidized beds and focused on the detection of agglomeration as relevant process change. For this purpose, we first present the methodology followed by an illustrating example.
4.3. Screening methodology The screening methodology is described in more detail in the following and is globally illustrated in a flow-sheet in Figure 4-1; a more detailed flow-sheet of the methodology is presented in Figure 4-5.
Figure 4-1: Global flow-sheet of the screening methodology. Data sets The first step is to provide the input data sets. For the general methodology any kind of measurement source could be used, here we use pressure fluctuation data. Each data set should contain changes in just one process variable. That means that all operating parameters have to be kept constant except the one that is to be varied either gradually
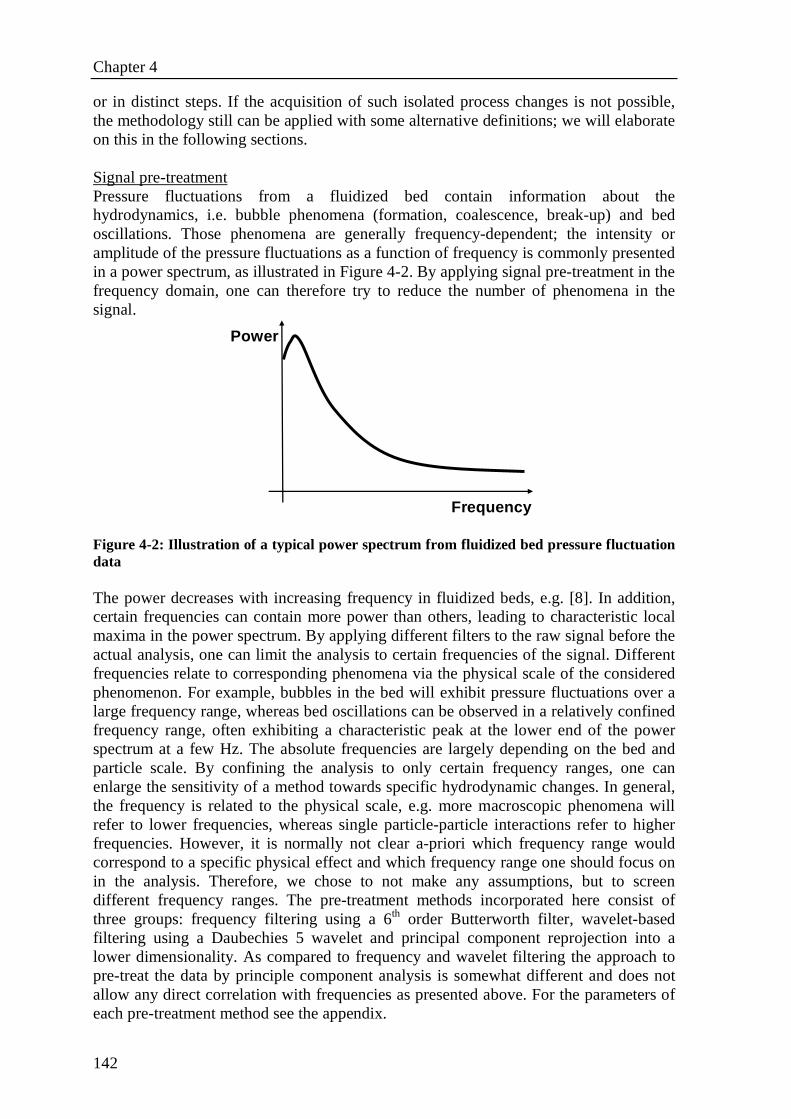
Chapter 4
142
or in distinct steps. If the acquisition of such isolated process changes is not possible, the methodology still can be applied with some alternative definitions; we will elaborate on this in the following sections. Signal pre-treatment Pressure fluctuations from a fluidized bed contain information about the hydrodynamics, i.e. bubble phenomena (formation, coalescence, break-up) and bed oscillations. Those phenomena are generally frequency-dependent; the intensity or amplitude of the pressure fluctuations as a function of frequency is commonly presented in a power spectrum, as illustrated in Figure 4-2. By applying signal pre-treatment in the frequency domain, one can therefore try to reduce the number of phenomena in the signal.
Frequency
Power
Figure 4-2: Illustration of a typical power spectrum from fluidized bed pressure fluctuation data The power decreases with increasing frequency in fluidized beds, e.g. [8]. In addition, certain frequencies can contain more power than others, leading to characteristic local maxima in the power spectrum. By applying different filters to the raw signal before the actual analysis, one can limit the analysis to certain frequencies of the signal. Different frequencies relate to corresponding phenomena via the physical scale of the considered phenomenon. For example, bubbles in the bed will exhibit pressure fluctuations over a large frequency range, whereas bed oscillations can be observed in a relatively confined frequency range, often exhibiting a characteristic peak at the lower end of the power spectrum at a few Hz. The absolute frequencies are largely depending on the bed and particle scale. By confining the analysis to only certain frequency ranges, one can enlarge the sensitivity of a method towards specific hydrodynamic changes. In general, the frequency is related to the physical scale, e.g. more macroscopic phenomena will refer to lower frequencies, whereas single particle-particle interactions refer to higher frequencies. However, it is normally not clear a-priori which frequency range would correspond to a specific physical effect and which frequency range one should focus on in the analysis. Therefore, we chose to not make any assumptions, but to screen different frequency ranges. The pre-treatment methods incorporated here consist of three groups: frequency filtering using a 6th order Butterworth filter, wavelet-based filtering using a Daubechies 5 wavelet and principal component reprojection into a lower dimensionality. As compared to frequency and wavelet filtering the approach to pre-treat the data by principle component analysis is somewhat different and does not allow any direct correlation with frequencies as presented above. For the parameters of each pre-treatment method see the appendix.
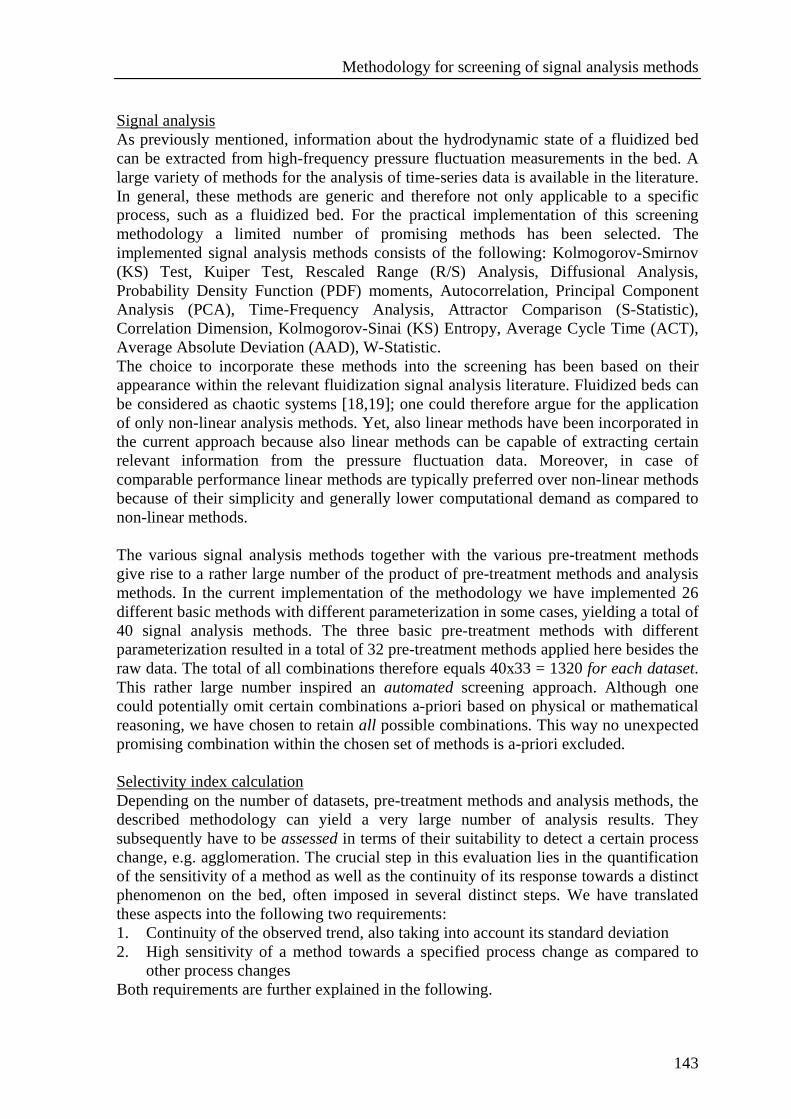
Methodology for screening of signal analysis methods
143
Signal analysis As previously mentioned, information about the hydrodynamic state of a fluidized bed can be extracted from high-frequency pressure fluctuation measurements in the bed. A large variety of methods for the analysis of time-series data is available in the literature. In general, these methods are generic and therefore not only applicable to a specific process, such as a fluidized bed. For the practical implementation of this screening methodology a limited number of promising methods has been selected. The implemented signal analysis methods consists of the following: Kolmogorov-Smirnov (KS) Test, Kuiper Test, Rescaled Range (R/S) Analysis, Diffusional Analysis, Probability Density Function (PDF) moments, Autocorrelation, Principal Component Analysis (PCA), Time-Frequency Analysis, Attractor Comparison (S-Statistic), Correlation Dimension, Kolmogorov-Sinai (KS) Entropy, Average Cycle Time (ACT), Average Absolute Deviation (AAD), W-Statistic. The choice to incorporate these methods into the screening has been based on their appearance within the relevant fluidization signal analysis literature. Fluidized beds can be considered as chaotic systems [18,19]; one could therefore argue for the application of only non-linear analysis methods. Yet, also linear methods have been incorporated in the current approach because also linear methods can be capable of extracting certain relevant information from the pressure fluctuation data. Moreover, in case of comparable performance linear methods are typically preferred over non-linear methods because of their simplicity and generally lower computational demand as compared to non-linear methods. The various signal analysis methods together with the various pre-treatment methods give rise to a rather large number of the product of pre-treatment methods and analysis methods. In the current implementation of the methodology we have implemented 26 different basic methods with different parameterization in some cases, yielding a total of 40 signal analysis methods. The three basic pre-treatment methods with different parameterization resulted in a total of 32 pre-treatment methods applied here besides the raw data. The total of all combinations therefore equals 40x33 = 1320 for each dataset. This rather large number inspired an automated screening approach. Although one could potentially omit certain combinations a-priori based on physical or mathematical reasoning, we have chosen to retain all possible combinations. This way no unexpected promising combination within the chosen set of methods is a-priori excluded. Selectivity index calculation Depending on the number of datasets, pre-treatment methods and analysis methods, the described methodology can yield a very large number of analysis results. They subsequently have to be assessed in terms of their suitability to detect a certain process change, e.g. agglomeration. The crucial step in this evaluation lies in the quantification of the sensitivity of a method as well as the continuity of its response towards a distinct phenomenon on the bed, often imposed in several distinct steps. We have translated these aspects into the following two requirements: 1. Continuity of the observed trend, also taking into account its standard deviation 2. High sensitivity of a method towards a specified process change as compared to
other process changes Both requirements are further explained in the following.
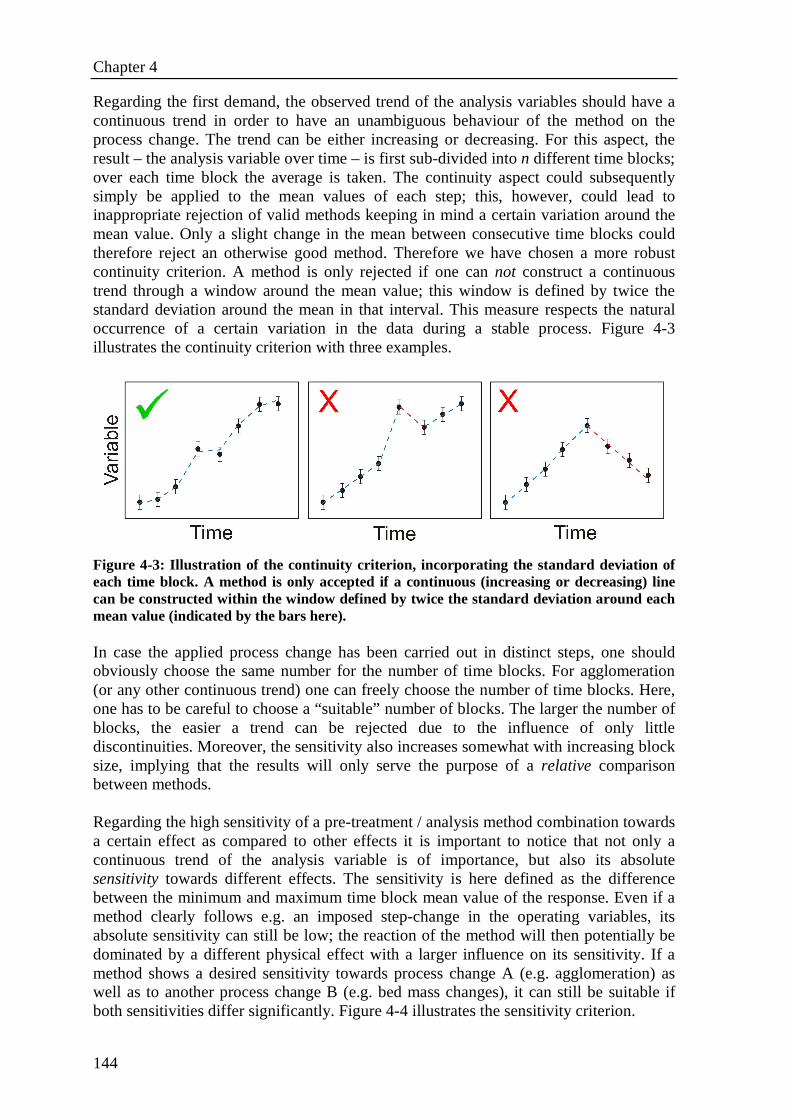
Chapter 4
144
Regarding the first demand, the observed trend of the analysis variables should have a continuous trend in order to have an unambiguous behaviour of the method on the process change. The trend can be either increasing or decreasing. For this aspect, the result – the analysis variable over time – is first sub-divided into n different time blocks; over each time block the average is taken. The continuity aspect could subsequently simply be applied to the mean values of each step; this, however, could lead to inappropriate rejection of valid methods keeping in mind a certain variation around the mean value. Only a slight change in the mean between consecutive time blocks could therefore reject an otherwise good method. Therefore we have chosen a more robust continuity criterion. A method is only rejected if one can not construct a continuous trend through a window around the mean value; this window is defined by twice the standard deviation around the mean in that interval. This measure respects the natural occurrence of a certain variation in the data during a stable process. Figure 4-3 illustrates the continuity criterion with three examples.
Figure 4-3: Illustration of the continuity criterio n, incorporating the standard deviation of each time block. A method is only accepted if a continuous (increasing or decreasing) line can be constructed within the window defined by twice the standard deviation around each mean value (indicated by the bars here). In case the applied process change has been carried out in distinct steps, one should obviously choose the same number for the number of time blocks. For agglomeration (or any other continuous trend) one can freely choose the number of time blocks. Here, one has to be careful to choose a “suitable” number of blocks. The larger the number of blocks, the easier a trend can be rejected due to the influence of only little discontinuities. Moreover, the sensitivity also increases somewhat with increasing block size, implying that the results will only serve the purpose of a relative comparison between methods. Regarding the high sensitivity of a pre-treatment / analysis method combination towards a certain effect as compared to other effects it is important to notice that not only a continuous trend of the analysis variable is of importance, but also its absolute sensitivity towards different effects. The sensitivity is here defined as the difference between the minimum and maximum time block mean value of the response. Even if a method clearly follows e.g. an imposed step-change in the operating variables, its absolute sensitivity can still be low; the reaction of the method will then potentially be dominated by a different physical effect with a larger influence on its sensitivity. If a method shows a desired sensitivity towards process change A (e.g. agglomeration) as well as to another process change B (e.g. bed mass changes), it can still be suitable if both sensitivities differ significantly. Figure 4-4 illustrates the sensitivity criterion.
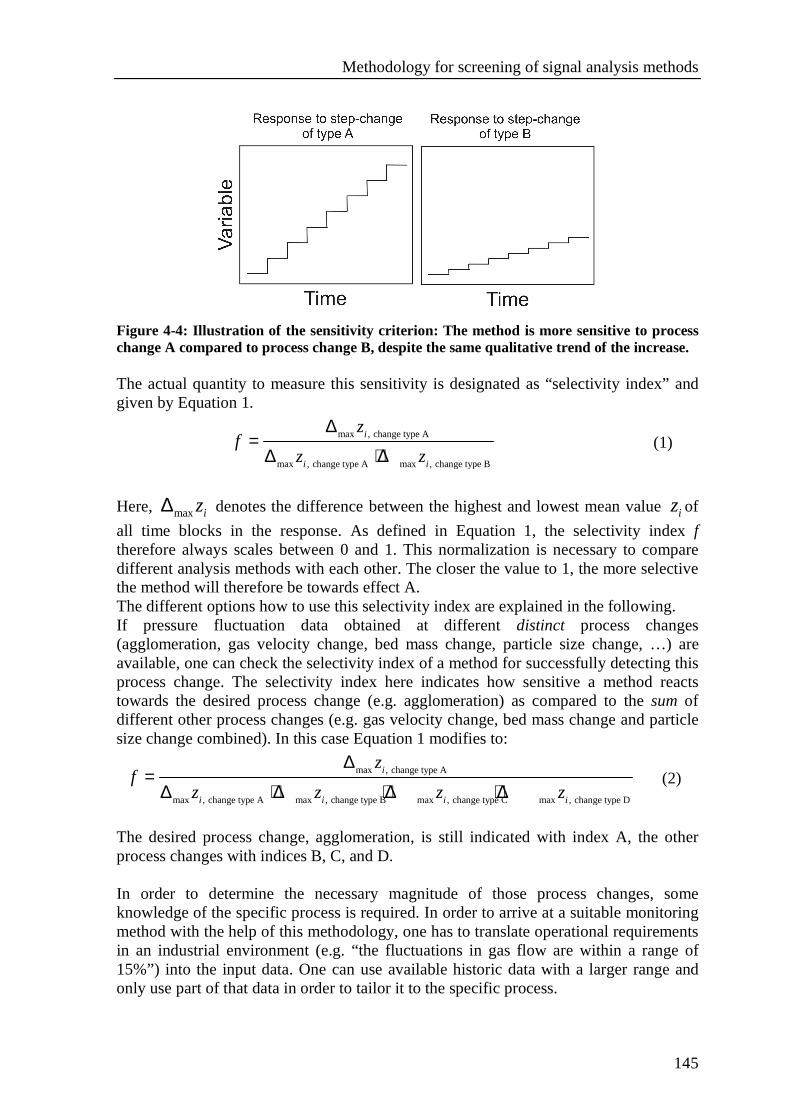
Methodology for screening of signal analysis methods
145
Figure 4-4: Illustration of the sensitivity criteri on: The method is more sensitive to process change A compared to process change B, despite the same qualitative trend of the increase. The actual quantity to measure this sensitivity is designated as “selectivity index” and given by Equation 1.
max , change type A
max , change type A max , change type B
i
i i
zf
z z
∆=
∆ + ∆ (1)
Here, max iz∆ denotes the difference between the highest and lowest mean value iz of
all time blocks in the response. As defined in Equation 1, the selectivity index f therefore always scales between 0 and 1. This normalization is necessary to compare different analysis methods with each other. The closer the value to 1, the more selective the method will therefore be towards effect A. The different options how to use this selectivity index are explained in the following. If pressure fluctuation data obtained at different distinct process changes (agglomeration, gas velocity change, bed mass change, particle size change, …) are available, one can check the selectivity index of a method for successfully detecting this process change. The selectivity index here indicates how sensitive a method reacts towards the desired process change (e.g. agglomeration) as compared to the sum of different other process changes (e.g. gas velocity change, bed mass change and particle size change combined). In this case Equation 1 modifies to:
max , change type A
max , change type A max , change type B max , change type C max , change type D
i
i i i i
zf
z z z z
∆=
∆ + ∆ + ∆ + ∆ (2)
The desired process change, agglomeration, is still indicated with index A, the other process changes with indices B, C, and D. In order to determine the necessary magnitude of those process changes, some knowledge of the specific process is required. In order to arrive at a suitable monitoring method with the help of this methodology, one has to translate operational requirements in an industrial environment (e.g. “the fluctuations in gas flow are within a range of 15%”) into the input data. One can use available historic data with a larger range and only use part of that data in order to tailor it to the specific process.
Chapter 4
146
Ideally, the raw pressure fluctuation data is obtained from the same measuring location of the same setup under the same operating conditions besides the imposed process change as a reference case. Historical data can be used for the analysis. However, if they are not available it is often not feasible to obtain data of such isolated process changes, especially in industrial practice. For once, the fluidized bed installation will always exhibit common process fluctuations. In a laboratory this effect principally also occurs, but is typically significantly smaller, as the operating conditions of such a setup can be much better controlled. Secondly, exposing the setup to changes in specific operating conditions could be unfeasible with respect to safety and/or process economics. If it is not possible to obtain all the relevant isolated process changes in a single fluidized bed, two alternative strategies are possible. Firstly, one can choose to combine data originating from different fluidized bed setups. With this approach, one has to keep in mind that methods which perform well in this way will not necessarily have to perform well under other conditions or vice versa. Secondly, one can choose to not relate the relevant process change (e.g. agglomeration) to other isolated process changes, but to the variation within the common process operation. Equation 2 then simplifies to:
max , change type A
max , change type A max , normal process changes
i
i i
zf
z z
∆=
∆ + ∆ (3)
This approach therefore relates the sensitivity of a method towards effect A to the common process operation. This common process condition has to contain a representative part of the normal process changes, which will contain several different physical effects occurring simultaneously. The choice of such data should be made based on knowledge and experience of the process. One also has to consider that in this case one does not have to make any explicit choices on the magnitude of occurring process changes (e.g. “gas velocity fluctuates within a relative range of 15%”), as compared to the previous approach with data sets containing isolated process changes. The only other requirement in this case is that the relevant process change (e.g. agglomeration) has indeed been observed and measured. So, two basic approaches, which are related to different goals, can be distinguished. The first approach, using data from different isolated process changes (Eqn. 2) will be applicable when trying to gain more insight into which methods will be sensitive towards which specific process changes and why this is the case, including physical insight of the process. Here, it is possible to only focus on the desired process change, but also to investigate whether certain methods are selectively sensitive towards specific other process changes. Those methods then can serve as “counterchecks”, avoiding false alarms. The second approach can be seen as a practical engineering approach, to be used as a tool for finding a method suitable for a specific fluidized bed process. For a different process, the methodology would then probably have to be carried out again. On the contrary, if the first approach should be used for any practical purpose, one has to make a choice on which other process changes to include and also on the magnitude of each process change. This choice can only be made with the relevant process knowledge and experience.
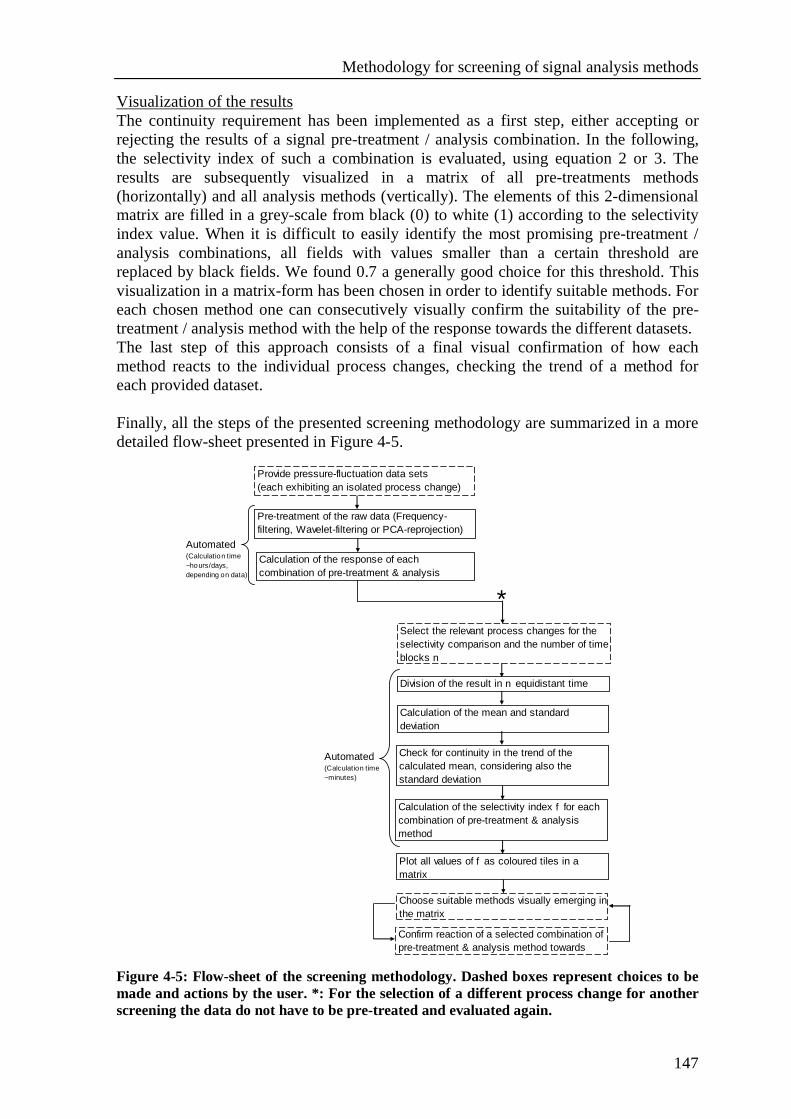
Methodology for screening of signal analysis methods
147
Visualization of the results The continuity requirement has been implemented as a first step, either accepting or rejecting the results of a signal pre-treatment / analysis combination. In the following, the selectivity index of such a combination is evaluated, using equation 2 or 3. The results are subsequently visualized in a matrix of all pre-treatments methods (horizontally) and all analysis methods (vertically). The elements of this 2-dimensional matrix are filled in a grey-scale from black (0) to white (1) according to the selectivity index value. When it is difficult to easily identify the most promising pre-treatment / analysis combinations, all fields with values smaller than a certain threshold are replaced by black fields. We found 0.7 a generally good choice for this threshold. This visualization in a matrix-form has been chosen in order to identify suitable methods. For each chosen method one can consecutively visually confirm the suitability of the pre-treatment / analysis method with the help of the response towards the different datasets. The last step of this approach consists of a final visual confirmation of how each method reacts to the individual process changes, checking the trend of a method for each provided dataset. Finally, all the steps of the presented screening methodology are summarized in a more detailed flow-sheet presented in Figure 4-5.
Provide pressure-fluctuation data sets(each exhibiting an isolated process change)
Pre-treatment of the raw data (Frequency-filtering, Wavelet-filtering or PCA-reprojection)
Calculation of the response of each combination of pre-treatment & analysis method
Division of the result in n equidistant time blocks
Calculation of the mean and standard deviation
Check for continuity in the trend of the calculated mean, considering also the standard deviation
Calculation of the selectivity index f for each combination of pre-treatment & analysis method
Plot all values of f as coloured tiles in a matrix
Choose suitable methods visually emerging in the matrix
Confirm reaction of a selected combination of pre-treatment & analysis method towards
Automated(Calculation time ~hours/days,depending on data)
Select the relevant process changes for the selectivity comparison and the number of time blocks n
Automated(Calculation time ~minutes)
*
Figure 4-5: Flow-sheet of the screening methodology. Dashed boxes represent choices to be made and actions by the user. *: For the selection of a different process change for another screening the data do not have to be pre-treated and evaluated again.
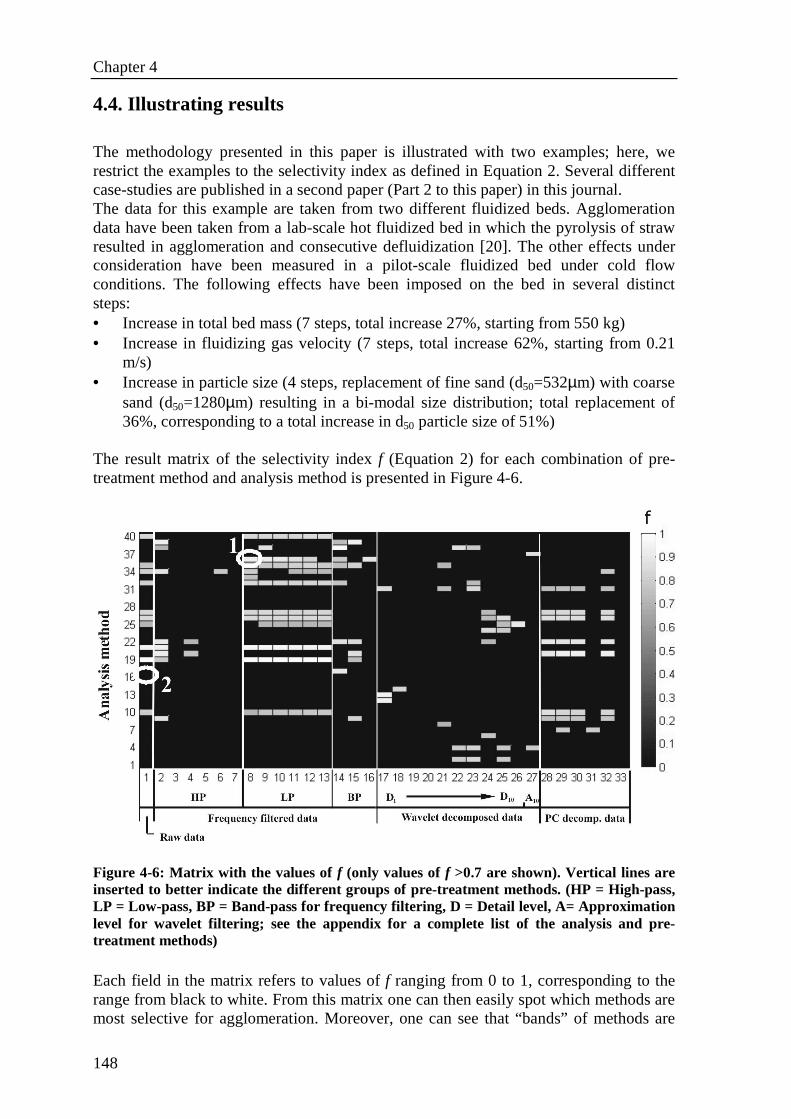
Chapter 4
148
4.4. Illustrating results The methodology presented in this paper is illustrated with two examples; here, we restrict the examples to the selectivity index as defined in Equation 2. Several different case-studies are published in a second paper (Part 2 to this paper) in this journal. The data for this example are taken from two different fluidized beds. Agglomeration data have been taken from a lab-scale hot fluidized bed in which the pyrolysis of straw resulted in agglomeration and consecutive defluidization [20]. The other effects under consideration have been measured in a pilot-scale fluidized bed under cold flow conditions. The following effects have been imposed on the bed in several distinct steps: • Increase in total bed mass (7 steps, total increase 27%, starting from 550 kg) • Increase in fluidizing gas velocity (7 steps, total increase 62%, starting from 0.21
m/s) • Increase in particle size (4 steps, replacement of fine sand (d50=532µm) with coarse
sand (d50=1280µm) resulting in a bi-modal size distribution; total replacement of 36%, corresponding to a total increase in d50 particle size of 51%)
The result matrix of the selectivity index f (Equation 2) for each combination of pre-treatment method and analysis method is presented in Figure 4-6.
Figure 4-6: Matrix with the values of f (only values of f >0.7 are shown). Vertical lines are inserted to better indicate the different groups of pre-treatment methods. (HP = High-pass, LP = Low-pass, BP = Band-pass for frequency filtering, D = Detail level, A= Approximation level for wavelet filtering; see the appendix for a complete list of the analysis and pre-treatment methods) Each field in the matrix refers to values of f ranging from 0 to 1, corresponding to the range from black to white. From this matrix one can then easily spot which methods are most selective for agglomeration. Moreover, one can see that “bands” of methods are
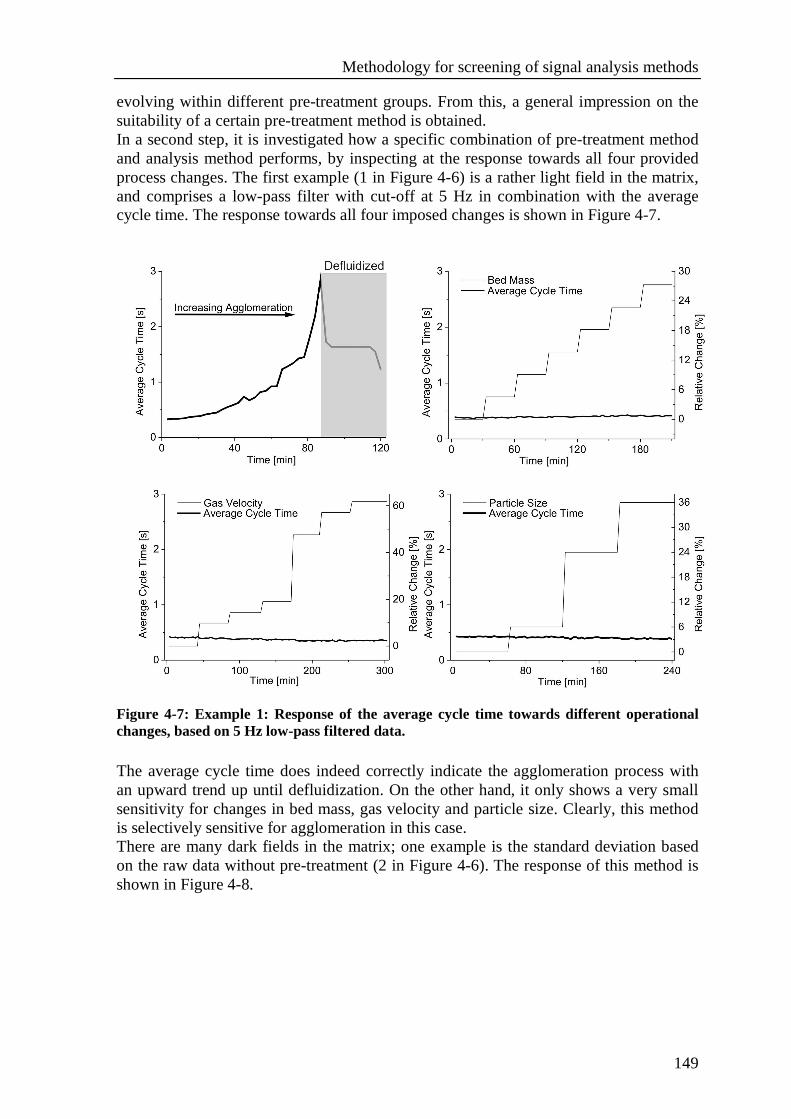
Methodology for screening of signal analysis methods
149
evolving within different pre-treatment groups. From this, a general impression on the suitability of a certain pre-treatment method is obtained. In a second step, it is investigated how a specific combination of pre-treatment method and analysis method performs, by inspecting at the response towards all four provided process changes. The first example (1 in Figure 4-6) is a rather light field in the matrix, and comprises a low-pass filter with cut-off at 5 Hz in combination with the average cycle time. The response towards all four imposed changes is shown in Figure 4-7.
Figure 4-7: Example 1: Response of the average cycle time towards different operational changes, based on 5 Hz low-pass filtered data. The average cycle time does indeed correctly indicate the agglomeration process with an upward trend up until defluidization. On the other hand, it only shows a very small sensitivity for changes in bed mass, gas velocity and particle size. Clearly, this method is selectively sensitive for agglomeration in this case. There are many dark fields in the matrix; one example is the standard deviation based on the raw data without pre-treatment (2 in Figure 4-6). The response of this method is shown in Figure 4-8.
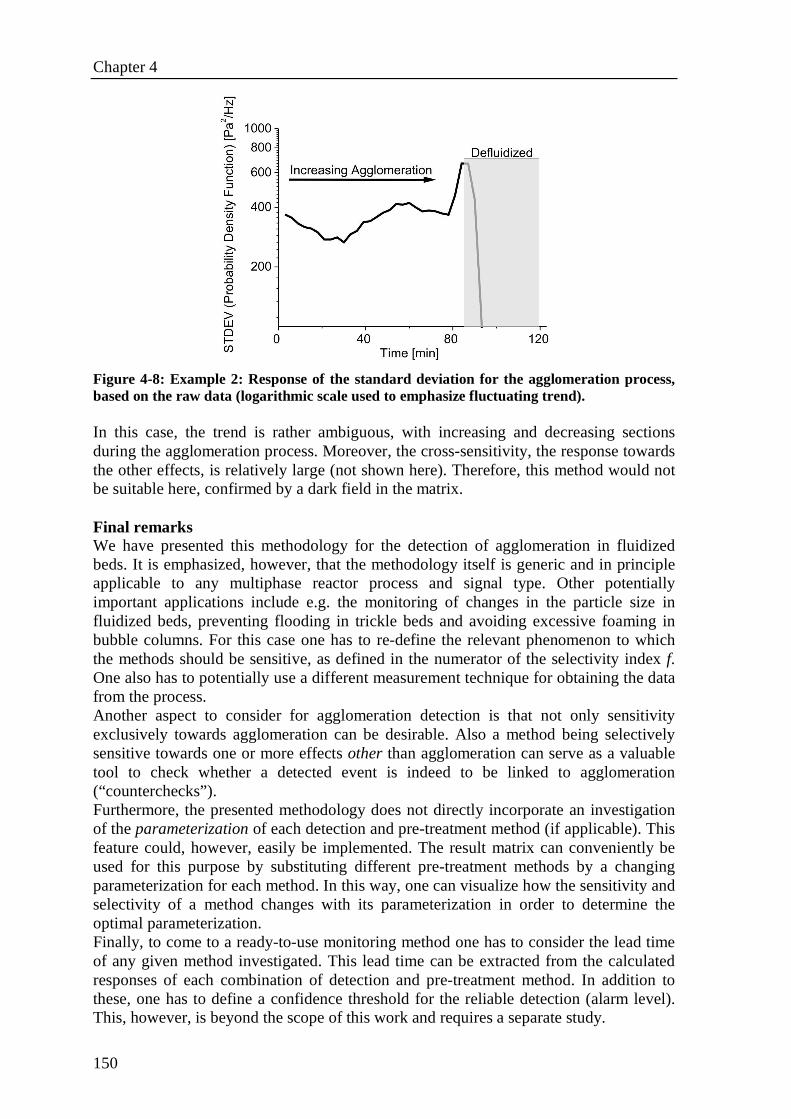
Chapter 4
150
Figure 4-8: Example 2: Response of the standard deviation for the agglomeration process, based on the raw data (logarithmic scale used to emphasize fluctuating trend). In this case, the trend is rather ambiguous, with increasing and decreasing sections during the agglomeration process. Moreover, the cross-sensitivity, the response towards the other effects, is relatively large (not shown here). Therefore, this method would not be suitable here, confirmed by a dark field in the matrix. Final remarks We have presented this methodology for the detection of agglomeration in fluidized beds. It is emphasized, however, that the methodology itself is generic and in principle applicable to any multiphase reactor process and signal type. Other potentially important applications include e.g. the monitoring of changes in the particle size in fluidized beds, preventing flooding in trickle beds and avoiding excessive foaming in bubble columns. For this case one has to re-define the relevant phenomenon to which the methods should be sensitive, as defined in the numerator of the selectivity index f. One also has to potentially use a different measurement technique for obtaining the data from the process. Another aspect to consider for agglomeration detection is that not only sensitivity exclusively towards agglomeration can be desirable. Also a method being selectively sensitive towards one or more effects other than agglomeration can serve as a valuable tool to check whether a detected event is indeed to be linked to agglomeration (“counterchecks”). Furthermore, the presented methodology does not directly incorporate an investigation of the parameterization of each detection and pre-treatment method (if applicable). This feature could, however, easily be implemented. The result matrix can conveniently be used for this purpose by substituting different pre-treatment methods by a changing parameterization for each method. In this way, one can visualize how the sensitivity and selectivity of a method changes with its parameterization in order to determine the optimal parameterization. Finally, to come to a ready-to-use monitoring method one has to consider the lead time of any given method investigated. This lead time can be extracted from the calculated responses of each combination of detection and pre-treatment method. In addition to these, one has to define a confidence threshold for the reliable detection (alarm level). This, however, is beyond the scope of this work and requires a separate study.
Methodology for screening of signal analysis methods
151
4.5. Conclusions A new methodology is presented for efficient screening of a large number of signal analysis methods in order to find those methods that are sensitive as well as selective for specific process changes in multiphase reactors. The detection of agglomeration in a fluidized bed served as an example for an application. The results from all investigated methods, in combination with different pre-treatment methods, are expressed in terms of a relative sensitivity index f that is a measure for the sensitivity and selectivity of such a combination to detect a specific process change. The sensitivity indices f of all different combinations are collected and visualized in a matrix, from which suitable methods visually emerge. As a last step, one should inspect the actual temporal response of the method for the cases with high selectivity indices to ensure the temporal response is indeed suitable for on-line monitoring. Using pressure fluctuation data from fluidized beds exhibiting different isolated process changes – agglomeration, gas velocity, bed mass and particle size – the methodology has been illustrated and has shown to be an efficient tool. The application of this methodology in more case studies, analysing data ranging from laboratory to industrial scale installations, will be presented in the next chapter.
4.6. References [1] Breijer AAJ, Nijenhuis J, Ruud van Ommen JR. Prevention of flooding in a
countercurrent trickle-bed reactor using additional void space. Chemical Engineering Journal 2008;138(1-3):333-340
[2] Villa J, van Ommen JR, van den Bleek CM. Early detection of foam formation in bubble columns by attractor comparison. AIChE Journal 2003;49(9):2442-2444
[3] Ruthiya KC, Chilekar VP, Warnier MJF, van der Schaaf J, Kuster BFM, Schouten JC, van Ommen JC. Detecting regime transitions in slurry bubble columns using pressure time series. AIChE Journal 2005;51(7):1951-1965
[4] Öhman M, Nordin A, Skrifvars B-J, Backman R, Hupa M. Bed Agglomeration Characteristics during Fluidized Bed Combustion of Biomass Fuels. Energy & Fuels 2000;14(1):169-178
[5] Kunii D, Levenspiel O. “Fluidization Engineering”, Butterworth-Heinemann Ltd, USA, 1991
[6] Chaplin G, Pugsley T, Winters C. The S-statistic as an early warning of entrainment in a fluidized bed dryer containing pharmaceutical granule. Powder Technology 2005;149(2-3):148-156
[7] Visser HJM. The influence of fuel composition on agglomeration behaviour in fluidised-bed combustion. ECN (Energy research Centre of the Netherlands) report ECN-C--04-054 (2004)
[8] Nijenhuis J, Korbee R, Lensselink J, Kiel JHA, van Ommen JR. A method for agglomeration detection and control in full-scale biomass fired fluidized beds. Chemical Engineering Science 2007;62(1-2):644-54
[9] Werther J. Measurement Techniques in Fluidized Beds. Powder Technology 1999;102:15-36
Chapter 4
152
[10] Bartels M, Lin W, Nijenhuis J, Kapteijn F, van Ommen R. Agglomeration in fluidized beds at high temperatures: Mechanisms, Detection and Prevention. Progress in Energy and Combustion Science, doi:10.1016/j.pecs.2008.04.002
[11] Rehmat AG, Patel JG; Inst. Gas Technology (IGTE); “Controlling and maintaining fluidised beds - under non-steady state conditions in ash agglomerating fluidised beds” Patent US4544375-A (1985)
[12] Davies CE, Fenton K. Pressure fluctuations in a fluidized bed: A potential route to the continuous estimation of particle size. IPENZ Transactions 1997;24(1)(EMCh)
[13] Chrione R, Miccio F, Scala F. Mechanism and prediction of bed agglomeration during fluidized bed combustion of a biomass fuel: Effect of the reactor scale. Chemical Engineering Journal 2006;123(3):71-80
[14] Fuller TA, Flynn TJ, Daw CS, Halow JS. Interpretation of Pilot-Scale, Fluidized-Bed Behavior Using Chaotic Time Series Analysis. Proceedings of the 12th International FBC Conference 1993, Edited by L.N. Rubow, Vol.1, 141-155
[15] van Ommen JR, Schouten JC, van den Bleek CM. An Early-Warning-Method for Detecting Bed agglomeration in Fluidized Bed Combustors. Paper No. FBC99-0150, Proc. 15th Int. Conf. on Fluidized Bed Combustion 1999, R. B. Reuther, ed., ASME, New York
[16] van Ommen JR, Coppens MO, van den Bleek CM, Schouten JC. Early Warning of agglomeration in Fluidized Beds by Attractor Comparison. AIChE Journal 2000;46:2183-2197
[17] Briens C, McDougall S, Chan E. On-line detection of bed fluidity in a fluidized bed coker. Powder Technology 2003;138(2-3):160-168
[18] van der Stappen, M.L.M., 1996. Chaotic hydrodynamics of fluidized beds. Thesis, Delft University Press, Delft
[19] Johnsson F, Zijerveld RC, Schouten JC, van den Bleek CM, Leckner B. Characterization of fluidization regimes by time-series analysis of pressure fluctuations. International Journal of Multiphase Flow 2000;26:663-715
[20] van Ommen JR, Schouten JC, Coppens M-O, Lin W, Dam-Johansen K, van den Bleek CM. Timely detection of agglomeration in biomass fired fluidized beds. Proceedings of the 16th International Conference on Fluidized Bed Combustion 2001, p. 1146-1159
[21] Press WH, Teukolsky SA, Vetterling WT, Flannery BP, “Numerical Recipes in C : The Art of Scientific Computing, 2nd Ed., Cambridge University Press, UK, 1992
[22] Zhao G-B, Yang Y-R, AIChE Journal 2003;49(4):869-882 [23] Giona M, Paglianti A, Soldati A. The application of diffusional techniques in time-
series analysis to identify complex fluid dynamic regimes. Fractals 1994;4:503-520 [24] Carlson GE, “Signal and Linear System Analysis”, John Wiley & Sons, Inc., New
York, 1998 [25] Everitt B, Dunn G, “Applied Multivariate Data Analysis”, Hodder Arnold,
London, 2001 [26] Diks C, Van Zwet WR, Takens F, DeGoede J. Phys, Rev. E 1996;53(3):2169-2176 [27] Kantz H, Schreiber T. “Nonlinear Time Series Analysis”, Cambridge University
Press, UK, 2000 [28] Schouten JC, Takens F, van den Bleek CM. Estimation of the dimension of a noisy
attractor. Phys. Rev. E 1994;50:1851-1861 [29] Schouten JC, Takens F, van den Bleek CM. Maximum-likelihood estimation of the
entropy of an attractor. Phys. Rev. E 1994;49:126-129
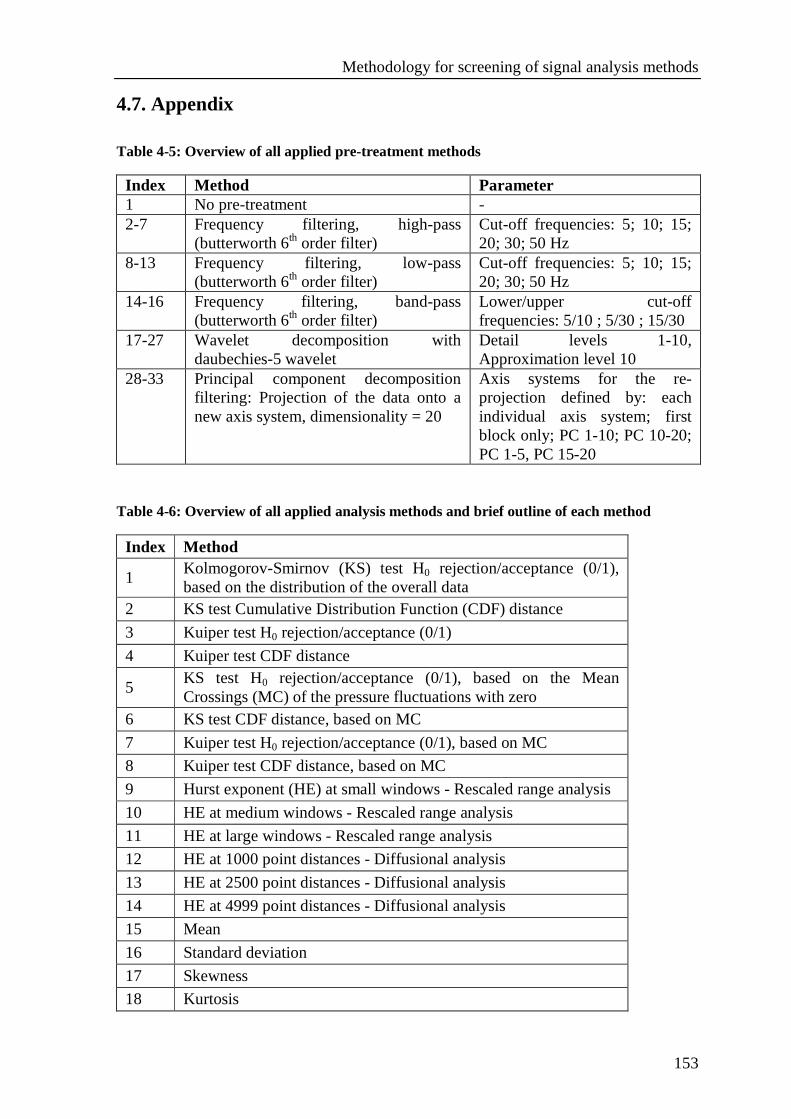
Methodology for screening of signal analysis methods
153
4.7. Appendix Table 4-5: Overview of all applied pre-treatment methods Index Method Parameter 1 No pre-treatment - 2-7 Frequency filtering, high-pass
(butterworth 6th order filter) Cut-off frequencies: 5; 10; 15; 20; 30; 50 Hz
8-13 Frequency filtering, low-pass (butterworth 6th order filter)
Cut-off frequencies: 5; 10; 15; 20; 30; 50 Hz
14-16 Frequency filtering, band-pass (butterworth 6th order filter)
Lower/upper cut-off frequencies: 5/10 ; 5/30 ; 15/30
17-27 Wavelet decomposition with daubechies-5 wavelet
Detail levels 1-10, Approximation level 10
28-33 Principal component decomposition filtering: Projection of the data onto a new axis system, dimensionality = 20
Axis systems for the re-projection defined by: each individual axis system; first block only; PC 1-10; PC 10-20; PC 1-5, PC 15-20
Table 4-6: Overview of all applied analysis methods and brief outline of each method
Index Method
1 Kolmogorov-Smirnov (KS) test H0 rejection/acceptance (0/1), based on the distribution of the overall data
2 KS test Cumulative Distribution Function (CDF) distance
3 Kuiper test H0 rejection/acceptance (0/1)
4 Kuiper test CDF distance
5 KS test H0 rejection/acceptance (0/1), based on the Mean Crossings (MC) of the pressure fluctuations with zero
6 KS test CDF distance, based on MC
7 Kuiper test H0 rejection/acceptance (0/1), based on MC
8 Kuiper test CDF distance, based on MC
9 Hurst exponent (HE) at small windows - Rescaled range analysis
10 HE at medium windows - Rescaled range analysis
11 HE at large windows - Rescaled range analysis
12 HE at 1000 point distances - Diffusional analysis
13 HE at 2500 point distances - Diffusional analysis
14 HE at 4999 point distances - Diffusional analysis
15 Mean
16 Standard deviation
17 Skewness
18 Kurtosis
Chapter 4
154
19 Autocorrelation 63% decay time with 0.1 min maximum lag
20 Autocorrelation 63% decay time with 0.01 min maximum lag
21 Autocorrelation 37% decay time with 0.1 min maximum lag
22 Autocorrelation 37% decay time with 0.01 min maximum lag
23 PCA Principal component 1 variance contribution fraction
24 PCA Principal component 2 variance contribution fraction
25 PCA Principal component 5 variance contribution fraction
26 PCA Principal component 10 variance contribution fraction
27 PCA Principal component 20 variance contribution fraction
28 Power Spectral Density (PSD) Power at 2 Hz
29 PSD Power at 25 Hz
30 PSD Power at 60 Hz
31 Attractor Comparsion (S – Statistic)
32 Correlation Dimension - Maximum likelihood
33 Correlation Dimension - Best fit
34 Kolmogorov-Sinai Entropy - bits/s
35 Kolmogorov-Sinai Entropy - bits/cycle
36 Average Cycle Time (ACT)
37 Average Absolute Deviation (AAD)
38 W – Statistic, thresholding up to detail level 1
39 W – Statistic, thresholding up to detail level 5
40 W – Statistic, thresholding up to detail level 10 1, 2, 5, 6: The Kolmogorov-Smirnov (KS) Test (e.g. [21]) compares the similarity of two probability distributions by the maximum distance of two cumulative distribution functions (CDF). For once, the actual distance is calculated/monitored (method 2&6). Moreover, a null-hypothesis of both CDFs being similar based on a 95% confidence interval is either rejected or accepted (0/1) (method 1&5). The KS-test is applied to the distribution of the pressure fluctuation data (CDF distance - method 1&2) as well as to the distribution of the lengths between consecutive crossings of the pressure fluctuation signal with zero (MC - method 5&6). 3, 4, 7, 8: The Kuiper Test (e.g. [21]) is analogous to the KS Test, but uses the sum of the maximum distances on both distribution sides for the probability calculation. 10-11: The Rescaled Range (R/S) Analysis, e.g. [22], is a measure for the self-similarity of a dataset, as expressed by the Hurst exponent. 12-14: Diffusional Analysis (e.g. [23]) monitors two different Hurst exponents over time, one related to long-term effects and one to short-term effects. 15-18: The first four Probability Density Function (PDF) moments describe different properties of the distribution of data: The mean, the standard deviation, the skewness (a
Methodology for screening of signal analysis methods
155
measure for the asymmetry of a distribution) and the kurtosis (a measure for the peakedness of a distribution). 19-22: The Autocorrelation (e.g. [24]) of a signal is the cross-correlation of the signal with a time-shifted version of itself. The values of specific decay times for the cross-correlation coefficients to drop to 37% (1/e) and 63% (1-1/e) of the autocorrelation and for lag-times of 0.1 and 0.01 min are monitored along time. 23-27: Principal Component Analysis (PCA) (e.g. [25]) describes the variation in a set of multivariate data in terms of a new set of uncorrelated variables. The data are consecutively re-projected onto the subspace defined by these uncorrelated variables. Here, the contribution of a specific component (1,2,5,10,20) to the overall variability of all components of the data, i.e. the percentage of the total variability explained by that component, is calculated. 28-30: Within Time-Frequency Analysis, the power in a power spectrum (obtained by Fourier transformation) at different frequencies is monitored. 31: In the Attractor Comparison method [16] the data is projected into a multidimensional state-space, yielding an attractor. Consecutively, this attractor compared to a reference attractor as obtained from a reference condition using a statistical test [26] which assesses the dimensionless distance S between both attractors. 32-33: The Correlation Dimension signifies the integral dimension of an object. It is therefore a measure for the complexity of the attractor. (General definition e.g. [27], calculation carried out here [28].) 34-35: The Kolmogorov-Sinai (KS) Entropy is a measure for the predictability of an attractor, expressed in bit/s (34). Alternatively, it can be divided by the average cycle time and is then expressed in bit/cycle (35). (General definition e.g. [27], calculation carried out here [29].) 36: The Average Cycle Time (ACT) is the average time for three sub-sequent crossings of the time-series with its mean value. 37: The Average Absolute Deviation (AAD) is the average of the absolute deviations from the mean value. 38-40: The W-Statistic [17] calculates the so-called small pressure fluctuations component (obtained by subtracting a wavelet-smoothed signal from the raw signal) in relation to the original signal. The signal is first decomposed up to a certain level (1, 5 and 10 here), after which the smallest coefficients in the detail coefficient vectors (smallest 60% here) are set to zero and the smoothed version of the signal is reconstructed. Subsequently, the smoothened signal is subtracted from the original signal.

156
157
Chapter 5
Case studies for selective agglomeration detection in fluidized beds:
Application of a new screening methodology In the previous chapter a new methodology has been presented that consists of screening many different signal analysis methods in combination with pre-treatment (filtering) methods with the goal to find those combinations that are sensitive and selective to a specific cause for a change in the hydrodynamics. In this chapter this methodology is applied for several case studies using data from a pilot-scale bubbling fluidized bed (BFB) exhibiting agglomeration and other isolated process changes, from an industrial BFB biomass combustor during agglomeration and from a lab-scale circulating fluidized bed (CFB) during agglomeration. From those case studies, several suitable methods are identified and the effect of data pre-treatment is evaluated. In addition, a simple descriptive model for the development of the pressure fluctuations during different agglomeration incidents is proposed. This chapter has been submitted for publication: Malte Bartels, John Nijenhuis, Freek Kapteijn, J. Ruud van Ommen. Case studies for selective agglomeration detection in fluidized beds: Application of a new screening methodology. Powder Technology (2008)
Chapter 5
158
5.1. Abstract We have presented a new methodology for screening different signal analysis methods in combination with signal pre-treatment methods with the goal to effectively identify those combinations that are highly selective towards a specific process change (chapter 4). The main outcome of the methodology is visually represented in an overall result matrix with coloured tiles illustrating a measure for the suitability of each combination of analysis method and signal pre-treatment. Suitable methods can be visually identified very quickly. For the early detection of agglomeration in fluidized beds we illustrate this methodology by four different cases: two cases from a pilot-scale bubbling bed, one from an industrial scale bubbling bed and one case from a lab-scale circulating bed. With the result matrix for each case several suitable methods are identified. The data are also evaluated to identify methods that are more generally applicable for a range of different cases. The suitability of a positively identified method is subsequently analyzed for its temporal response to both agglomeration and other effects. The influence of the different data pre-treatment methods is also addressed.
5.2. Introduction Gas-solid fluidized beds are utilized for a variety of processes in the chemical industry, such as catalytic reactions, drying, coating and energy conversion (e.g. [1]). Knowledge of the bed hydrodynamics is of great importance not only for the safety of the process but also for its economics, operating at optimal conditions and avoiding unscheduled shutdowns. For example, unwanted agglomeration can be a major operational problem. Increased particle adhesiveness / stickiness, which can be caused by different mechanisms, can lead to permanent bonds between colliding particles. Relevant processes for this problem are found in the area of polyolefin production and energy conversion. In the gas-phase polymerization in fluidized beds for the production of polyethylene and polypropylene, the growing polymer particles can become sticky and form agglomerates within the bed and sheets on the reactor wall. Agglomeration also occurs in fluidized bed energy conversion process, where low-melting alkali silicates are responsible for agglomerate formation via increased particle stickiness (e.g. [2]). Ultimately, agglomeration can lead to partial or total defluidization when the agglomerates get too large to still be fluidized. Besides agglomeration the reverse process can occur, e.g. in the drying of powders, where particle size decreases during the process. Here, the detection of the “end-point” of the drying process to avoid overheating is an important application (e.g. [3]). Ideally, a suitable early warning method is very sensitive to a specified process change, e.g. agglomeration. However, this is not the only requirement: a suitable method should also be as insensitive as possible towards other process changes to avoid false alarms. Unfortunately, the latter aspect is often neglected in the literature on monitoring multiphase reactors. This was the starting point for the development of our screening methodology, which has been presented in detail elsewhere (chapter 4). The goal for this methodology is to screen different signal analysis methods and assess them for their suitability as a monitoring tool, i.e. being sensitive and selective.
Case studies for the application of the screening methodology
159
The goal of this paper is to identify signal analysis methods that are selectively sensitive to agglomeration and insensitive to other phenomena, applied to fluidized beds. We focus on method selectivity and sensitivity; the dynamics of the response of a method is not investigated explicitly, but based on the results we give some indication in this regard. We show how our newly developed screening methodology can be used to achieve this goal by four selected cases of agglomeration in fluidized beds. Although we only apply the methodology to pressure fluctuation data from fluidized beds in this paper, the methodology itself is more universally applicable, also outside the area of fluidization.
5.3. Methodology The methodology applied here has been developed to screen different data analysis methods in combination with different pre-treatment methods, to find methods that are selective towards specific process changes. In the following, we present a short summary of the methodology. A detailed description of the methodology can be found in chapter 4. The methodology consists of five steps: 1. Provision of pressure-fluctuation data sets with isolated process changes 2. Pre-treatment of the pressure-fluctuation data 3. Evaluation of the response of each combination of pre-treatment and signal
analysis method 4. Calculation of the selectivity index f (a measure of the quality of the trend of the
response of a method, and its selectivity compared to other effects) 5. Visualization of all selectivity indices in a matrix (each square represents a
separate index value) First, suitable data sets have to be provided for the analysis. It is desired to detect a specific process change but no other process changes, i.e. to have an as high as possible sensitivity for the specified change and a low as possible cross-sensitivity for other process changes. For the analysis one therefore should ideally provide all considered process changes isolated from each other. Where this is not feasible, an alternative approach is to provide data containing typical process changes that occur during normal operation for the comparison (“normal process changes”). In the next step the data sets are pre-treated with one of the different methods. The pre-treatment, or filtering, extracts only specific components from the signal on which the subsequent analysis is based. Underlying motivation is that certain process changes can manifest themselves stronger in specific signal components and that sensitivity of an analysis method can therefore be enhanced. The subsequent and most time-consuming step is to evaluate the response of each combination of pre-treatment method and signal analysis method to the provided datasets. With a large number of pre-treatment and signal analysis methods the total number of combinations, the product of both, can be very large. In this case it is 33 x 40 = 1320. For this reason the evaluation is automated and is carried out in MatLab here. The evaluation is applied to consecutive time series of 3 minutes and the results are stored in individual files. After this, each individual calculated response has to be assessed in terms of sensitivity, i.e. overall change of the analysis variable upon the imposed change, and quality of the trend, i.e. a monotonically increasing or decreasing trend. For the evaluation of this trend quality the variation of the response is taken into account, i.e. the fluctuations
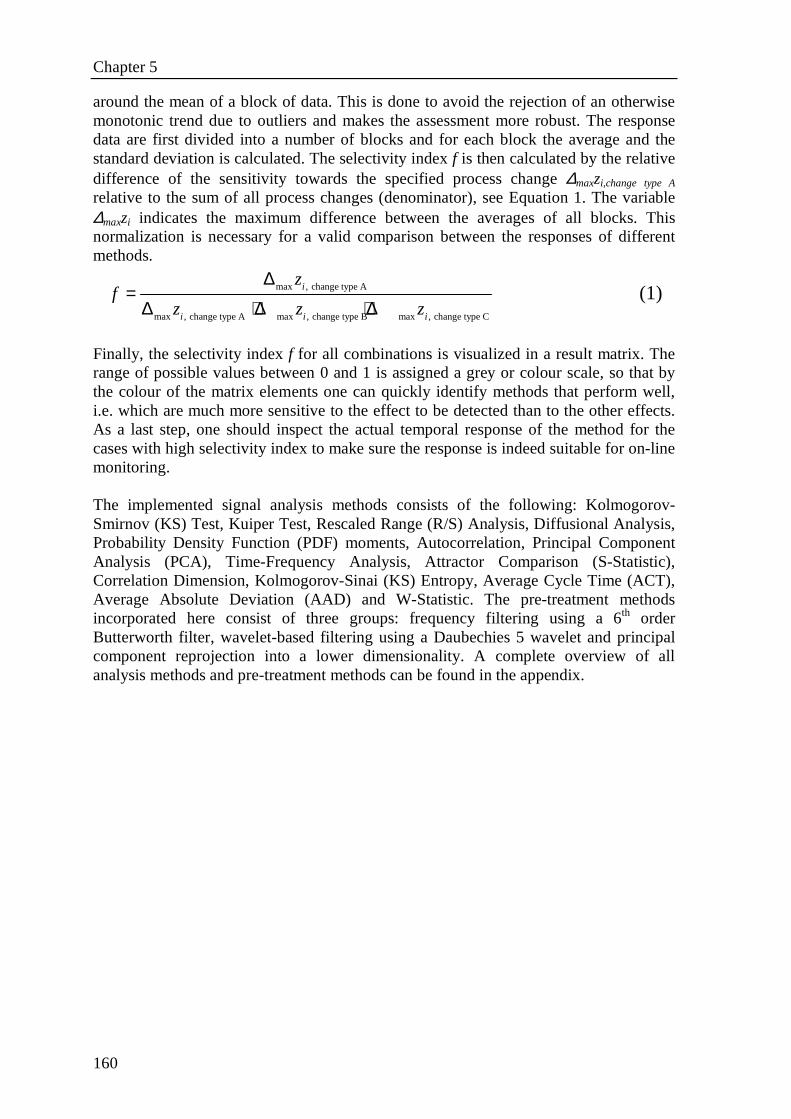
Chapter 5
160
around the mean of a block of data. This is done to avoid the rejection of an otherwise monotonic trend due to outliers and makes the assessment more robust. The response data are first divided into a number of blocks and for each block the average and the standard deviation is calculated. The selectivity index f is then calculated by the relative difference of the sensitivity towards the specified process change ∆maxzi,change type A relative to the sum of all process changes (denominator), see Equation 1. The variable ∆maxzi indicates the maximum difference between the averages of all blocks. This normalization is necessary for a valid comparison between the responses of different methods.
max , change type A
max , change type A max , change type B max , change type C
i
i i i
zf
z z z
∆=
∆ + ∆ + ∆ (1)
Finally, the selectivity index f for all combinations is visualized in a result matrix. The range of possible values between 0 and 1 is assigned a grey or colour scale, so that by the colour of the matrix elements one can quickly identify methods that perform well, i.e. which are much more sensitive to the effect to be detected than to the other effects. As a last step, one should inspect the actual temporal response of the method for the cases with high selectivity index to make sure the response is indeed suitable for on-line monitoring. The implemented signal analysis methods consists of the following: Kolmogorov-Smirnov (KS) Test, Kuiper Test, Rescaled Range (R/S) Analysis, Diffusional Analysis, Probability Density Function (PDF) moments, Autocorrelation, Principal Component Analysis (PCA), Time-Frequency Analysis, Attractor Comparison (S-Statistic), Correlation Dimension, Kolmogorov-Sinai (KS) Entropy, Average Cycle Time (ACT), Average Absolute Deviation (AAD) and W-Statistic. The pre-treatment methods incorporated here consist of three groups: frequency filtering using a 6th order Butterworth filter, wavelet-based filtering using a Daubechies 5 wavelet and principal component reprojection into a lower dimensionality. A complete overview of all analysis methods and pre-treatment methods can be found in the appendix.
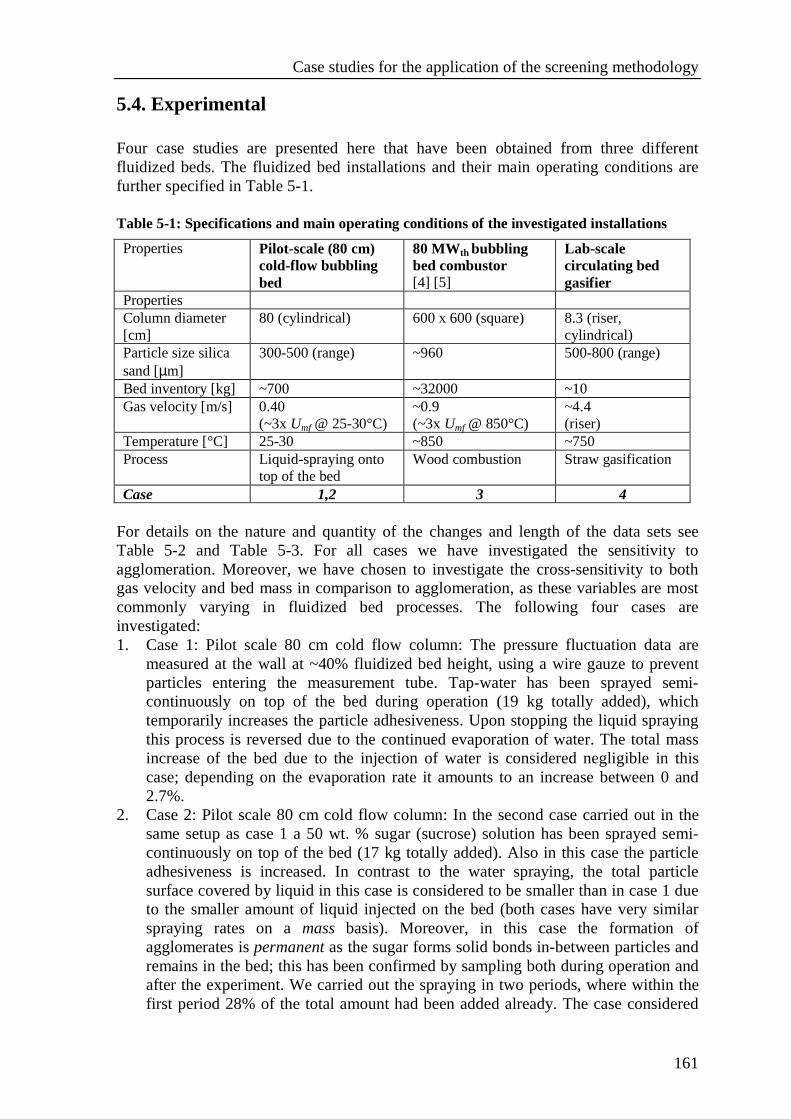
Case studies for the application of the screening methodology
161
5.4. Experimental Four case studies are presented here that have been obtained from three different fluidized beds. The fluidized bed installations and their main operating conditions are further specified in Table 5-1. Table 5-1: Specifications and main operating conditions of the investigated installations
Properties Pilot-scale (80 cm) cold-flow bubbling bed
80 MWth bubbling bed combustor [4] [5]
Lab-scale circulating bed gasifier
Properties Column diameter [cm]
80 (cylindrical) 600 x 600 (square) 8.3 (riser, cylindrical)
Particle size silica sand [µm]
300-500 (range) ~960 500-800 (range)
Bed inventory [kg] ~700 ~32000 ~10 Gas velocity [m/s] 0.40
(~3x Umf @ 25-30°C) ~0.9 (~3x Umf @ 850°C)
~4.4 (riser)
Temperature [°C] 25-30 ~850 ~750 Process Liquid-spraying onto
top of the bed Wood combustion Straw gasification
Case 1,2 3 4 For details on the nature and quantity of the changes and length of the data sets see Table 5-2 and Table 5-3. For all cases we have investigated the sensitivity to agglomeration. Moreover, we have chosen to investigate the cross-sensitivity to both gas velocity and bed mass in comparison to agglomeration, as these variables are most commonly varying in fluidized bed processes. The following four cases are investigated: 1. Case 1: Pilot scale 80 cm cold flow column: The pressure fluctuation data are
measured at the wall at ~40% fluidized bed height, using a wire gauze to prevent particles entering the measurement tube. Tap-water has been sprayed semi-continuously on top of the bed during operation (19 kg totally added), which temporarily increases the particle adhesiveness. Upon stopping the liquid spraying this process is reversed due to the continued evaporation of water. The total mass increase of the bed due to the injection of water is considered negligible in this case; depending on the evaporation rate it amounts to an increase between 0 and 2.7%.
2. Case 2: Pilot scale 80 cm cold flow column: In the second case carried out in the same setup as case 1 a 50 wt. % sugar (sucrose) solution has been sprayed semi-continuously on top of the bed (17 kg totally added). Also in this case the particle adhesiveness is increased. In contrast to the water spraying, the total particle surface covered by liquid in this case is considered to be smaller than in case 1 due to the smaller amount of liquid injected on the bed (both cases have very similar spraying rates on a mass basis). Moreover, in this case the formation of agglomerates is permanent as the sugar forms solid bonds in-between particles and remains in the bed; this has been confirmed by sampling both during operation and after the experiment. We carried out the spraying in two periods, where within the first period 28% of the total amount had been added already. The case considered
Chapter 5
162
here refers to the second spraying period and therefore simulates the presence of some agglomerates in the bed (not quantified). Such a scenario is considered valid for industrial practice, where also smaller amounts of agglomerates can already be present in the bed. The total mass increase of the bed due to the injection of sugar solution is considered negligible in this case. The sugar is assumed to remain in the bed and the water is partially evaporated; even without any evaporation (worst-case) the relative mass increase would only be 2.4% due to the spraying.
3. Case 3: Industrial agglomeration case (80 MWth combustor): The pressure fluctuation data are measured within the dense bed at ~50% fluidized bed height (~30 cm above the air nozzles with total bed height ~55-60 cm), using a purge flow to prevent particles entering the measurement tube. In this case, some gradual increase in the particle size fraction of 1.00-1.25 mm has been observed during production [5]. Shortly after, the installation had a regular maintenance stop and agglomerates were found in the bed, which agrees with the gradual increase in the larger particle size fraction. This size increase has been observed during the period of several days. For this case study, we have taken four fragments of approx. 2h each from the whole period to limit calculation time. For the agglomeration dataset the first two fragments are for the constant (small) particle size, the third fragment is for an increased particle size and the fourth fragment for a further increased particle size. For the reference condition, four fragments from the period of constant (small) particle size were taken. The maximum range of gas velocity fluctuations is ~12% for the agglomeration case and ~9% for the normal process changes. Although the range is higher for the agglomeration case due to an overall slightly decreasing gas velocity, they are still comparable. The maximum range of fluctuations in bed mass was calculated based on pressure drop measurements and is about 3-4% for both cases. For this case the calculations were carried out for time windows of 6 min due to the longer dataset with a lower sampling frequency.
4. Case 4: Lab-scale circulating bed: This lab-scale circulating fluidized bed has an L-valve as solids return mechanism from downcomer to the riser. The pressure fluctuation data are measured at the wall of the horizontal return-leg, using a purge flow to prevent particles entering the measurement tube. Agglomeration has been forced by operating with a fuel with high-alkali content at operating temperatures slightly above 750°C (typical onset of alkali silicates melting). The utilized data spans some stable operation in the beginning with subsequent agglomeration, until the point of defluidization. For the agglomeration case the total dataset is taken for the methodology; for the reference condition (“normal process changes”) only the first period of the dataset is taken.
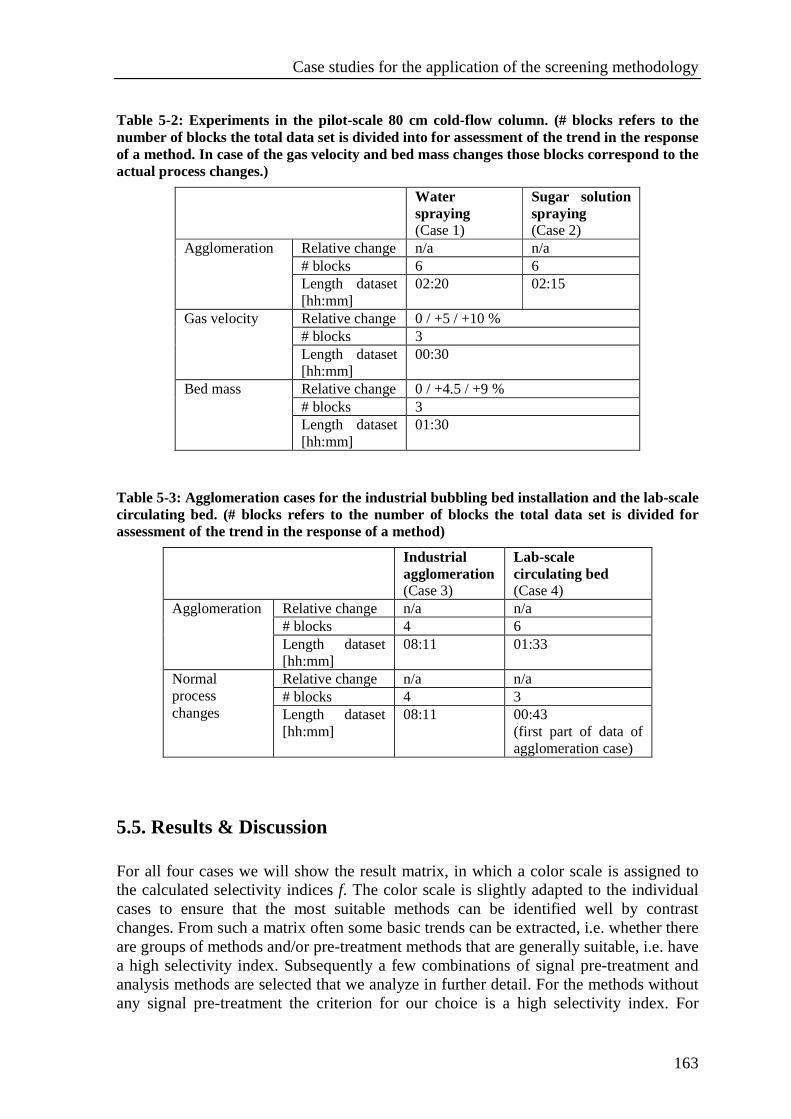
Case studies for the application of the screening methodology
163
Table 5-2: Experiments in the pilot-scale 80 cm cold-flow column. (# blocks refers to the number of blocks the total data set is divided into for assessment of the trend in the response of a method. In case of the gas velocity and bed mass changes those blocks correspond to the actual process changes.)
Water spraying (Case 1)
Sugar solution spraying (Case 2)
Relative change n/a n/a # blocks 6 6
Agglomeration
Length dataset [hh:mm]
02:20 02:15
Relative change 0 / +5 / +10 % # blocks 3
Gas velocity
Length dataset [hh:mm]
00:30
Relative change 0 / +4.5 / +9 % # blocks 3
Bed mass
Length dataset [hh:mm]
01:30
Table 5-3: Agglomeration cases for the industrial bubbling bed installation and the lab-scale circulating bed. (# blocks refers to the number of blocks the total data set is divided for assessment of the trend in the response of a method)
Industrial agglomeration (Case 3)
Lab-scale circulating bed (Case 4)
Relative change n/a n/a # blocks 4 6
Agglomeration
Length dataset [hh:mm]
08:11 01:33
Relative change n/a n/a # blocks 4 3
Normal process changes Length dataset
[hh:mm] 08:11 00:43
(first part of data of agglomeration case)
5.5. Results & Discussion For all four cases we will show the result matrix, in which a color scale is assigned to the calculated selectivity indices f. The color scale is slightly adapted to the individual cases to ensure that the most suitable methods can be identified well by contrast changes. From such a matrix often some basic trends can be extracted, i.e. whether there are groups of methods and/or pre-treatment methods that are generally suitable, i.e. have a high selectivity index. Subsequently a few combinations of signal pre-treatment and analysis methods are selected that we analyze in further detail. For the methods without any signal pre-treatment the criterion for our choice is a high selectivity index. For
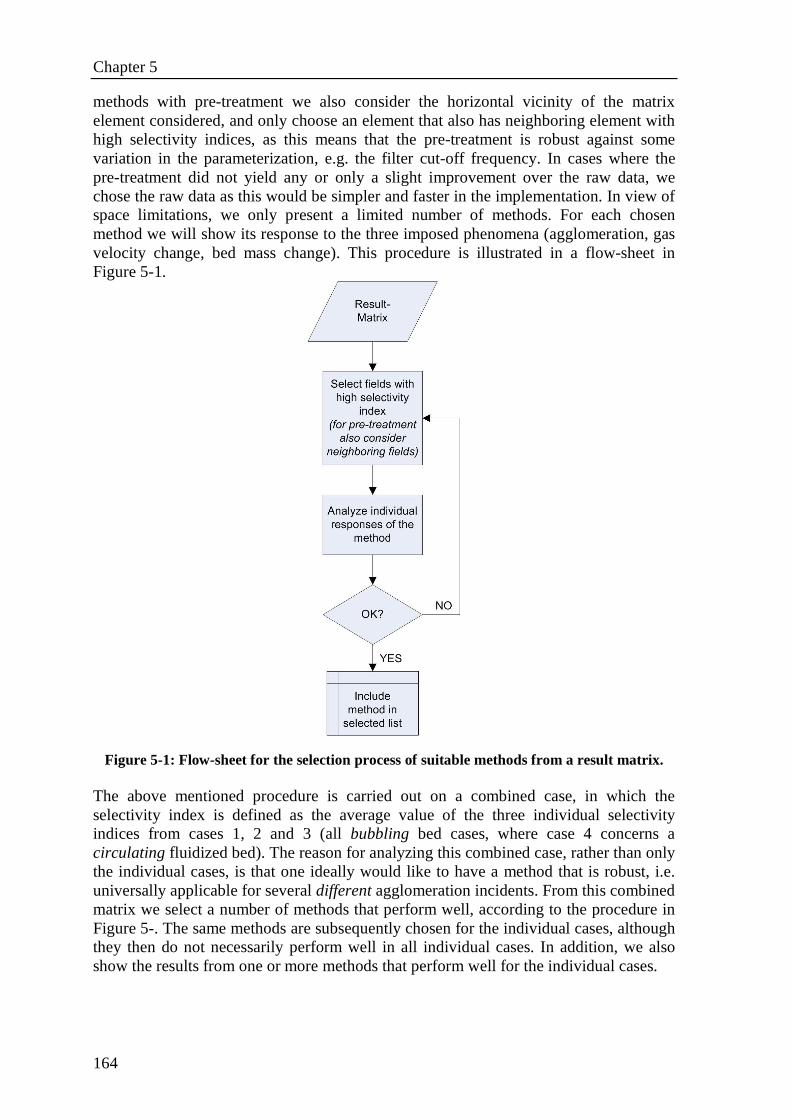
Chapter 5
164
methods with pre-treatment we also consider the horizontal vicinity of the matrix element considered, and only choose an element that also has neighboring element with high selectivity indices, as this means that the pre-treatment is robust against some variation in the parameterization, e.g. the filter cut-off frequency. In cases where the pre-treatment did not yield any or only a slight improvement over the raw data, we chose the raw data as this would be simpler and faster in the implementation. In view of space limitations, we only present a limited number of methods. For each chosen method we will show its response to the three imposed phenomena (agglomeration, gas velocity change, bed mass change). This procedure is illustrated in a flow-sheet in Figure 5-1.
Figure 5-1: Flow-sheet for the selection process of suitable methods from a result matrix. The above mentioned procedure is carried out on a combined case, in which the selectivity index is defined as the average value of the three individual selectivity indices from cases 1, 2 and 3 (all bubbling bed cases, where case 4 concerns a circulating fluidized bed). The reason for analyzing this combined case, rather than only the individual cases, is that one ideally would like to have a method that is robust, i.e. universally applicable for several different agglomeration incidents. From this combined matrix we select a number of methods that perform well, according to the procedure in Figure 5-. The same methods are subsequently chosen for the individual cases, although they then do not necessarily perform well in all individual cases. In addition, we also show the results from one or more methods that perform well for the individual cases.
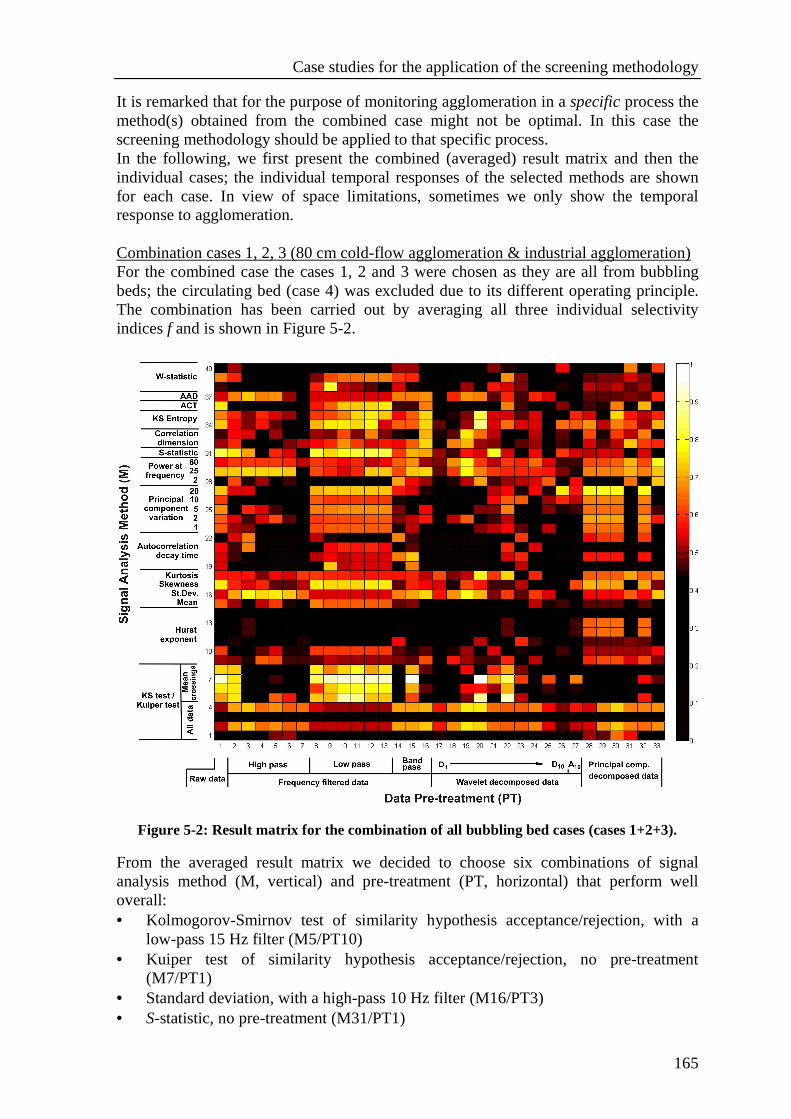
Case studies for the application of the screening methodology
165
It is remarked that for the purpose of monitoring agglomeration in a specific process the method(s) obtained from the combined case might not be optimal. In this case the screening methodology should be applied to that specific process. In the following, we first present the combined (averaged) result matrix and then the individual cases; the individual temporal responses of the selected methods are shown for each case. In view of space limitations, sometimes we only show the temporal response to agglomeration. Combination cases 1, 2, 3 (80 cm cold-flow agglomeration & industrial agglomeration) For the combined case the cases 1, 2 and 3 were chosen as they are all from bubbling beds; the circulating bed (case 4) was excluded due to its different operating principle. The combination has been carried out by averaging all three individual selectivity indices f and is shown in Figure 5-2.
Figure 5-2: Result matrix for the combination of all bubbling bed cases (cases 1+2+3). From the averaged result matrix we decided to choose six combinations of signal analysis method (M, vertical) and pre-treatment (PT, horizontal) that perform well overall: • Kolmogorov-Smirnov test of similarity hypothesis acceptance/rejection, with a
low-pass 15 Hz filter (M5/PT10) • Kuiper test of similarity hypothesis acceptance/rejection, no pre-treatment
(M7/PT1) • Standard deviation, with a high-pass 10 Hz filter (M16/PT3) • S-statistic, no pre-treatment (M31/PT1)
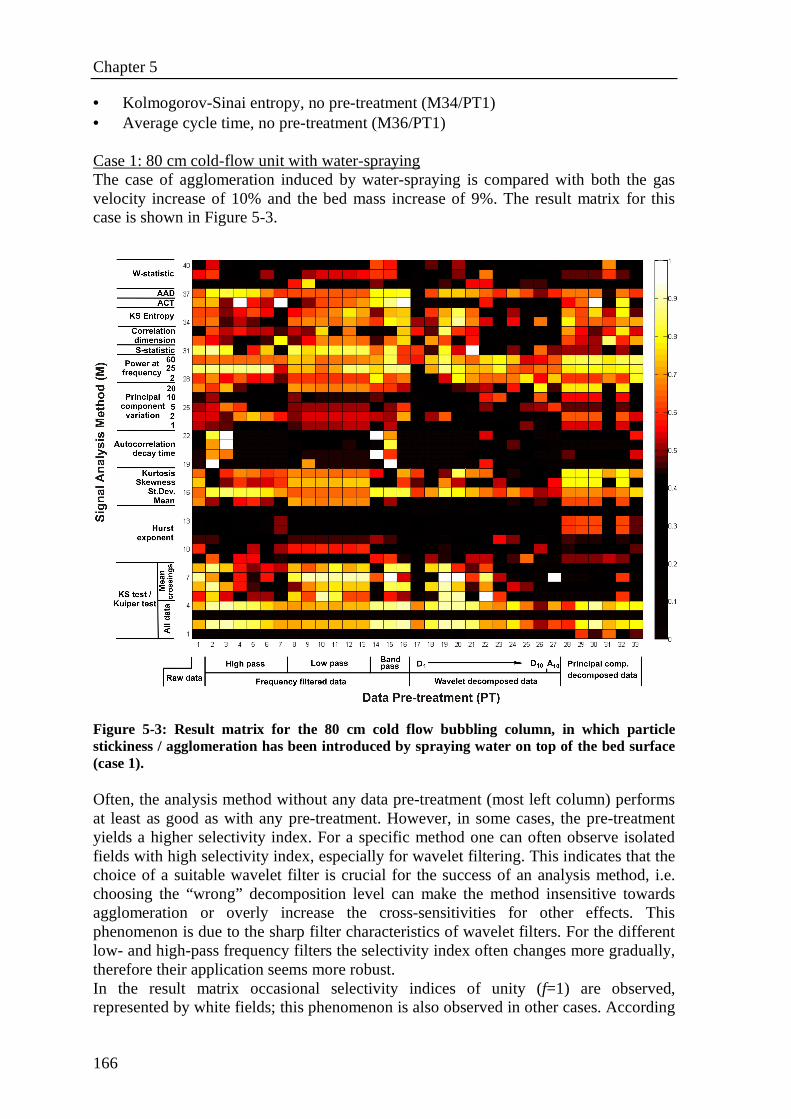
Chapter 5
166
• Kolmogorov-Sinai entropy, no pre-treatment (M34/PT1) • Average cycle time, no pre-treatment (M36/PT1) Case 1: 80 cm cold-flow unit with water-spraying The case of agglomeration induced by water-spraying is compared with both the gas velocity increase of 10% and the bed mass increase of 9%. The result matrix for this case is shown in Figure 5-3.
Figure 5-3: Result matrix for the 80 cm cold flow bubbling column, in which particle stickiness / agglomeration has been introduced by spraying water on top of the bed surface (case 1). Often, the analysis method without any data pre-treatment (most left column) performs at least as good as with any pre-treatment. However, in some cases, the pre-treatment yields a higher selectivity index. For a specific method one can often observe isolated fields with high selectivity index, especially for wavelet filtering. This indicates that the choice of a suitable wavelet filter is crucial for the success of an analysis method, i.e. choosing the “wrong” decomposition level can make the method insensitive towards agglomeration or overly increase the cross-sensitivities for other effects. This phenomenon is due to the sharp filter characteristics of wavelet filters. For the different low- and high-pass frequency filters the selectivity index often changes more gradually, therefore their application seems more robust. In the result matrix occasional selectivity indices of unity (f=1) are observed, represented by white fields; this phenomenon is also observed in other cases. According
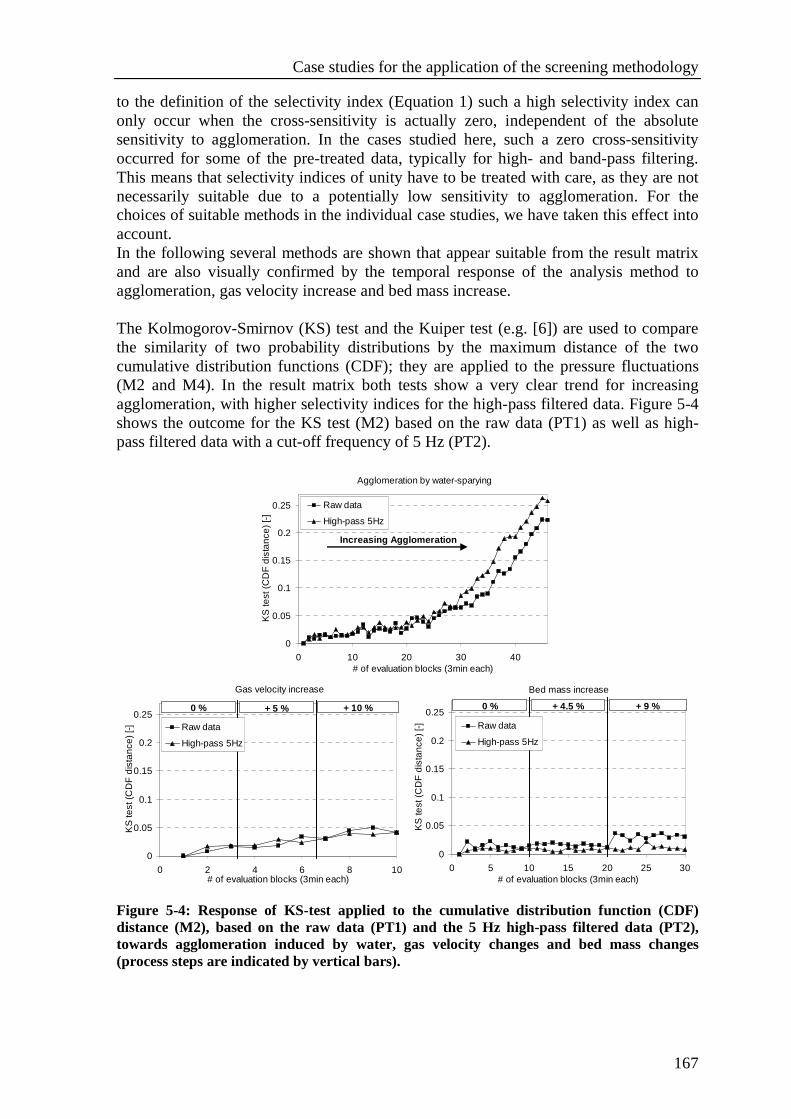
Case studies for the application of the screening methodology
167
to the definition of the selectivity index (Equation 1) such a high selectivity index can only occur when the cross-sensitivity is actually zero, independent of the absolute sensitivity to agglomeration. In the cases studied here, such a zero cross-sensitivity occurred for some of the pre-treated data, typically for high- and band-pass filtering. This means that selectivity indices of unity have to be treated with care, as they are not necessarily suitable due to a potentially low sensitivity to agglomeration. For the choices of suitable methods in the individual case studies, we have taken this effect into account. In the following several methods are shown that appear suitable from the result matrix and are also visually confirmed by the temporal response of the analysis method to agglomeration, gas velocity increase and bed mass increase. The Kolmogorov-Smirnov (KS) test and the Kuiper test (e.g. [6]) are used to compare the similarity of two probability distributions by the maximum distance of the two cumulative distribution functions (CDF); they are applied to the pressure fluctuations (M2 and M4). In the result matrix both tests show a very clear trend for increasing agglomeration, with higher selectivity indices for the high-pass filtered data. Figure 5-4 shows the outcome for the KS test (M2) based on the raw data (PT1) as well as high-pass filtered data with a cut-off frequency of 5 Hz (PT2).
Agglomeration by water-sparying
0
0.05
0.1
0.15
0.2
0.25
0 10 20 30 40# of evaluation blocks (3min each)
KS
test
(C
DF
dis
tan
ce)
[-]
Raw data
High-pass 5Hz
Increasing Agglomeration
Gas velocity increase
0
0.05
0.1
0.15
0.2
0.25
0 2 4 6 8 10# of evaluation blocks (3min each)
KS
test
(CD
F d
ista
nce)
[-] Raw data
High-pass 5Hz
0 % + 5 % + 10 %
Bed mass increase
0
0.05
0.1
0.15
0.2
0.25
0 5 10 15 20 25 30# of evaluation blocks (3min each)
KS
test
(C
DF
dis
tan
ce)
[-] Raw data
High-pass 5Hz
0 % + 4.5 % + 9 %
Figure 5-4: Response of KS-test applied to the cumulative distribution function (CDF) distance (M2), based on the raw data (PT1) and the 5 Hz high-pass filtered data (PT2), towards agglomeration induced by water, gas velocity changes and bed mass changes (process steps are indicated by vertical bars).
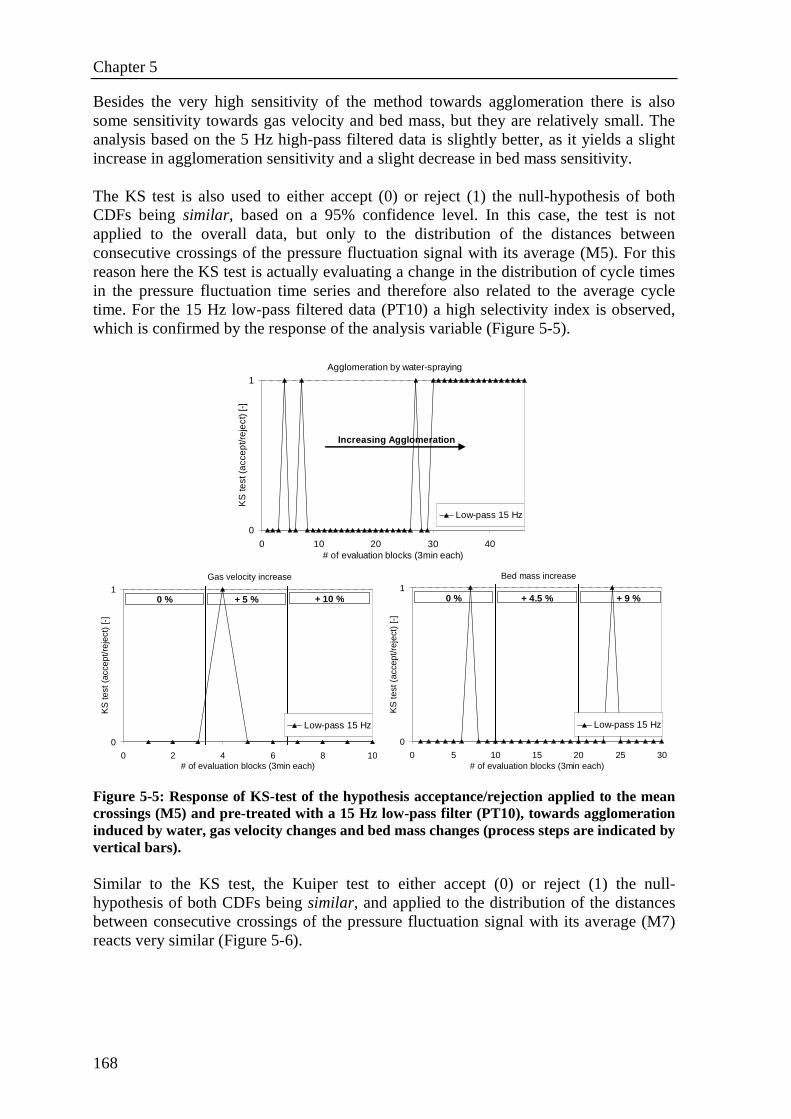
Chapter 5
168
Besides the very high sensitivity of the method towards agglomeration there is also some sensitivity towards gas velocity and bed mass, but they are relatively small. The analysis based on the 5 Hz high-pass filtered data is slightly better, as it yields a slight increase in agglomeration sensitivity and a slight decrease in bed mass sensitivity. The KS test is also used to either accept (0) or reject (1) the null-hypothesis of both CDFs being similar, based on a 95% confidence level. In this case, the test is not applied to the overall data, but only to the distribution of the distances between consecutive crossings of the pressure fluctuation signal with its average (M5). For this reason here the KS test is actually evaluating a change in the distribution of cycle times in the pressure fluctuation time series and therefore also related to the average cycle time. For the 15 Hz low-pass filtered data (PT10) a high selectivity index is observed, which is confirmed by the response of the analysis variable (Figure 5-5).
Agglomeration by water-spraying
0
1
0 10 20 30 40# of evaluation blocks (3min each)
KS
test
(a
cce
pt/r
eje
ct)
[-]
Low-pass 15 Hz
Increasing Agglomeration
Gas velocity increase
0
1
0 2 4 6 8 10# of evaluation blocks (3min each)
KS
test
(ac
cept
/rej
ect)
[-]
Low-pass 15 Hz
0 % + 5 % + 10 %
Bed mass increase
0
1
0 5 10 15 20 25 30# of evaluation blocks (3min each)
KS
test
(ac
cept
/rej
ect)
[-]
Low-pass 15 Hz
0 % + 4.5 % + 9 %
Figure 5-5: Response of KS-test of the hypothesis acceptance/rejection applied to the mean crossings (M5) and pre-treated with a 15 Hz low-pass filter (PT10), towards agglomeration induced by water, gas velocity changes and bed mass changes (process steps are indicated by vertical bars). Similar to the KS test, the Kuiper test to either accept (0) or reject (1) the null-hypothesis of both CDFs being similar, and applied to the distribution of the distances between consecutive crossings of the pressure fluctuation signal with its average (M7) reacts very similar (Figure 5-6).
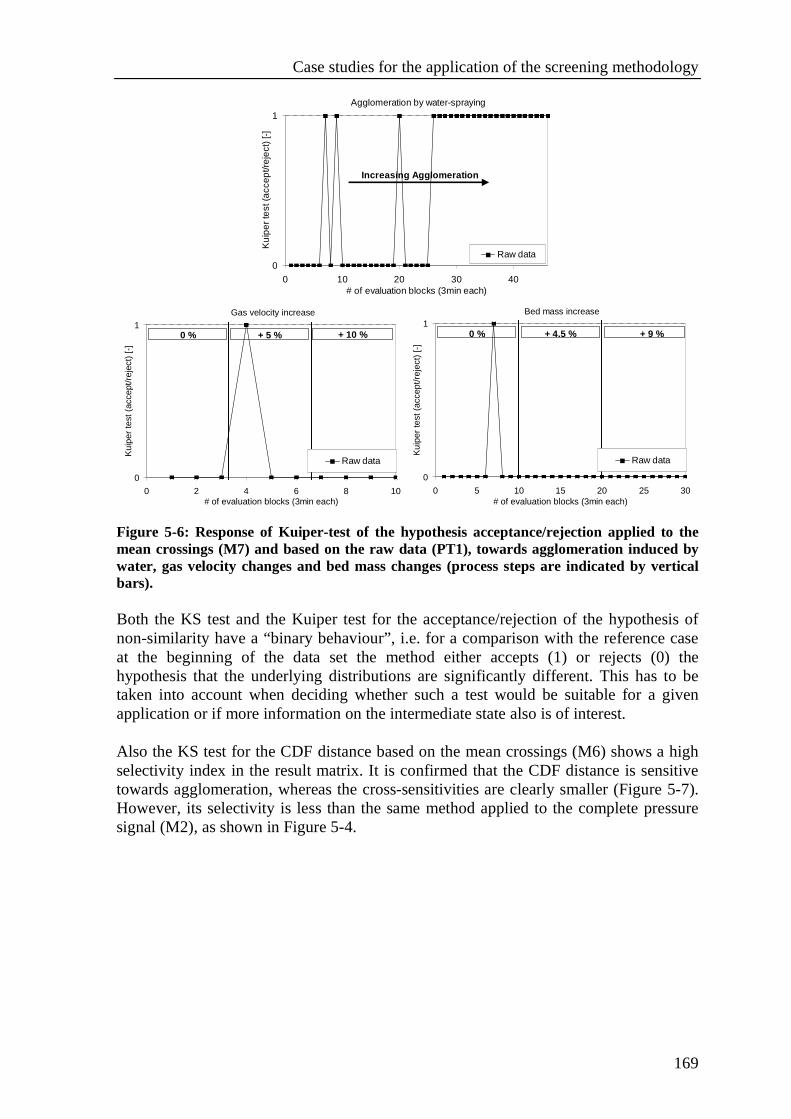
Case studies for the application of the screening methodology
169
Agglomeration by water-spraying
0
1
0 10 20 30 40# of evaluation blocks (3min each)
Ku
ipe
r te
st (
acc
ept/r
eje
ct)
[-]Raw data
Increasing Agglomeration
Gas velocity increase
0
1
0 2 4 6 8 10# of evaluation blocks (3min each)
Kui
per
test
(ac
cept
/rej
ect)
[-]
Raw data
0 % + 5 % + 10 %
Bed mass increase
0
1
0 5 10 15 20 25 30# of evaluation blocks (3min each)
Kui
per
test
(ac
cept
/rej
ect)
[-]
Raw data
0 % + 4.5 % + 9 %
Figure 5-6: Response of Kuiper-test of the hypothesis acceptance/rejection applied to the mean crossings (M7) and based on the raw data (PT1), towards agglomeration induced by water, gas velocity changes and bed mass changes (process steps are indicated by vertical bars). Both the KS test and the Kuiper test for the acceptance/rejection of the hypothesis of non-similarity have a “binary behaviour”, i.e. for a comparison with the reference case at the beginning of the data set the method either accepts (1) or rejects (0) the hypothesis that the underlying distributions are significantly different. This has to be taken into account when deciding whether such a test would be suitable for a given application or if more information on the intermediate state also is of interest. Also the KS test for the CDF distance based on the mean crossings (M6) shows a high selectivity index in the result matrix. It is confirmed that the CDF distance is sensitive towards agglomeration, whereas the cross-sensitivities are clearly smaller (Figure 5-7). However, its selectivity is less than the same method applied to the complete pressure signal (M2), as shown in Figure 5-4.
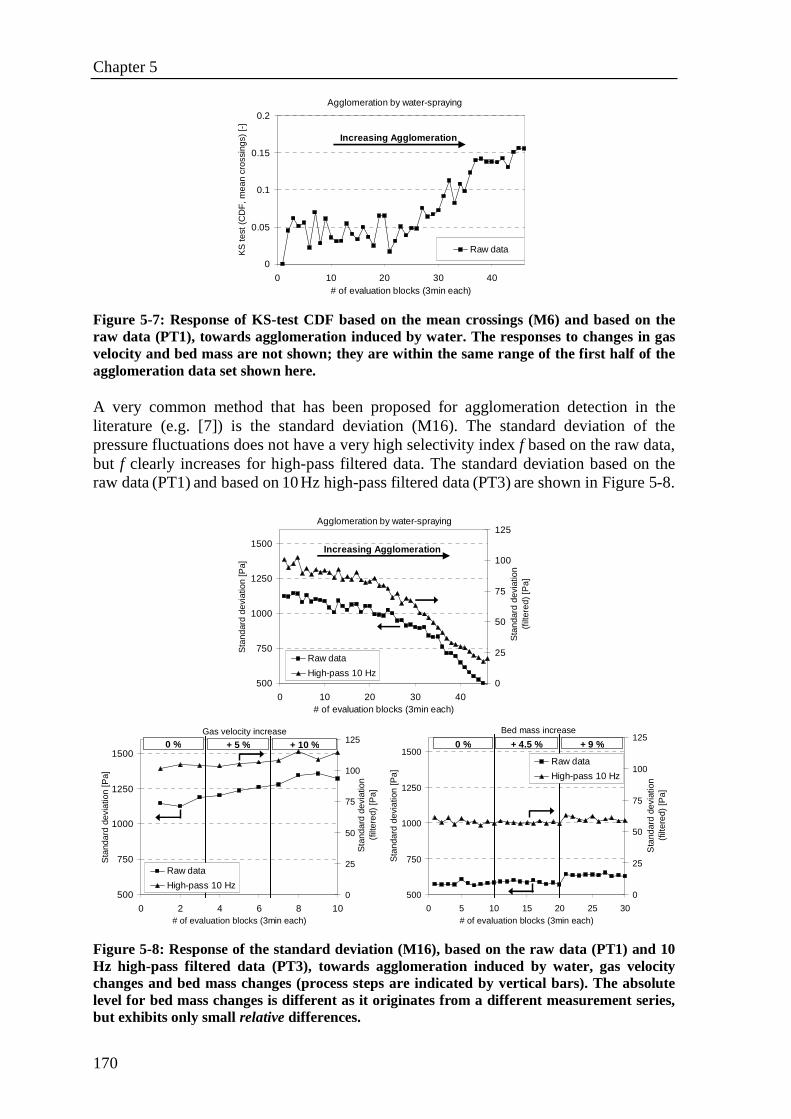
Chapter 5
170
Agglomeration by water-spraying
0
0.05
0.1
0.15
0.2
0 10 20 30 40# of evaluation blocks (3min each)
KS
test
(C
DF
, mea
n cr
ossi
ngs)
[-]
Raw data
Increasing Agglomeration
Figure 5-7: Response of KS-test CDF based on the mean crossings (M6) and based on the raw data (PT1), towards agglomeration induced by water. The responses to changes in gas velocity and bed mass are not shown; they are within the same range of the first half of the agglomeration data set shown here. A very common method that has been proposed for agglomeration detection in the literature (e.g. [7]) is the standard deviation (M16). The standard deviation of the pressure fluctuations does not have a very high selectivity index f based on the raw data, but f clearly increases for high-pass filtered data. The standard deviation based on the raw data (PT1) and based on 10 Hz high-pass filtered data (PT3) are shown in Figure 5-8.
Agglomeration by water-spraying
500
750
1000
1250
1500
0 10 20 30 40# of evaluation blocks (3min each)
Sta
ndar
d de
viat
ion
[Pa]
0
25
50
75
100
125
Sta
ndar
d de
viat
ion
(filt
ered
) [P
a]
Raw data
High-pass 10 Hz
Increasing Agglomeration
Gas velocity increase
500
750
1000
1250
1500
0 2 4 6 8 10# of evaluation blocks (3min each)
Sta
ndar
d de
viat
ion
[Pa]
0
25
50
75
100
125
Sta
ndar
d de
viat
ion
(filt
ered
) [P
a]
Raw data
High-pass 10 Hz
0 % + 5 % + 10 %
Bed mass increase
500
750
1000
1250
1500
0 5 10 15 20 25 30# of evaluation blocks (3min each)
Sta
ndar
d de
viat
ion
[Pa]
0
25
50
75
100
125
Sta
ndar
d de
viat
ion
(filt
ered
) [P
a]
Raw data
High-pass 10 Hz
0 % + 4.5 % + 9 %
Figure 5-8: Response of the standard deviation (M16), based on the raw data (PT1) and 10 Hz high-pass filtered data (PT3), towards agglomeration induced by water, gas velocity changes and bed mass changes (process steps are indicated by vertical bars). The absolute level for bed mass changes is different as it originates from a different measurement series, but exhibits only small relative differences.
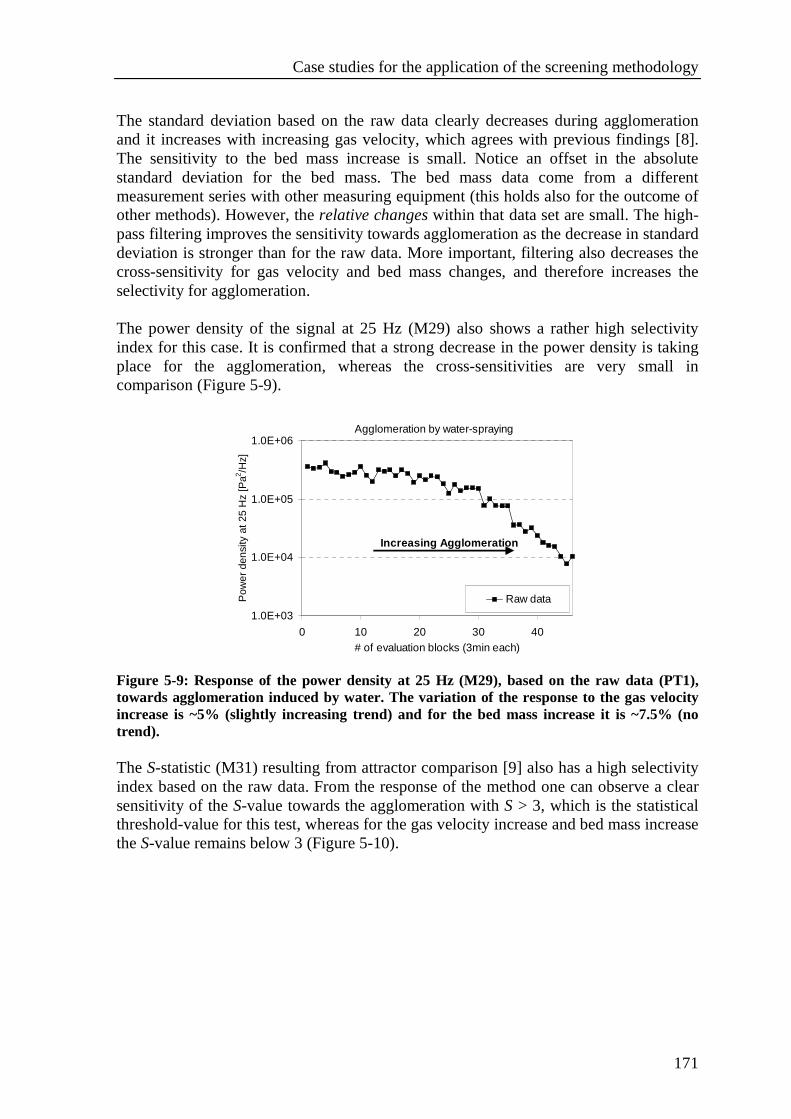
Case studies for the application of the screening methodology
171
The standard deviation based on the raw data clearly decreases during agglomeration and it increases with increasing gas velocity, which agrees with previous findings [8]. The sensitivity to the bed mass increase is small. Notice an offset in the absolute standard deviation for the bed mass. The bed mass data come from a different measurement series with other measuring equipment (this holds also for the outcome of other methods). However, the relative changes within that data set are small. The high-pass filtering improves the sensitivity towards agglomeration as the decrease in standard deviation is stronger than for the raw data. More important, filtering also decreases the cross-sensitivity for gas velocity and bed mass changes, and therefore increases the selectivity for agglomeration. The power density of the signal at 25 Hz (M29) also shows a rather high selectivity index for this case. It is confirmed that a strong decrease in the power density is taking place for the agglomeration, whereas the cross-sensitivities are very small in comparison (Figure 5-9).
Agglomeration by water-spraying
1.0E+03
1.0E+04
1.0E+05
1.0E+06
0 10 20 30 40# of evaluation blocks (3min each)
Pow
er d
ensi
ty a
t 25
Hz
[Pa2 /H
z]
Raw data
Increasing Agglomeration
Figure 5-9: Response of the power density at 25 Hz (M29), based on the raw data (PT1), towards agglomeration induced by water. The variation of the response to the gas velocity increase is ~5% (slightly increasing trend) and for the bed mass increase it is ~7.5% (no trend). The S-statistic (M31) resulting from attractor comparison [9] also has a high selectivity index based on the raw data. From the response of the method one can observe a clear sensitivity of the S-value towards the agglomeration with S > 3, which is the statistical threshold-value for this test, whereas for the gas velocity increase and bed mass increase the S-value remains below 3 (Figure 5-10).
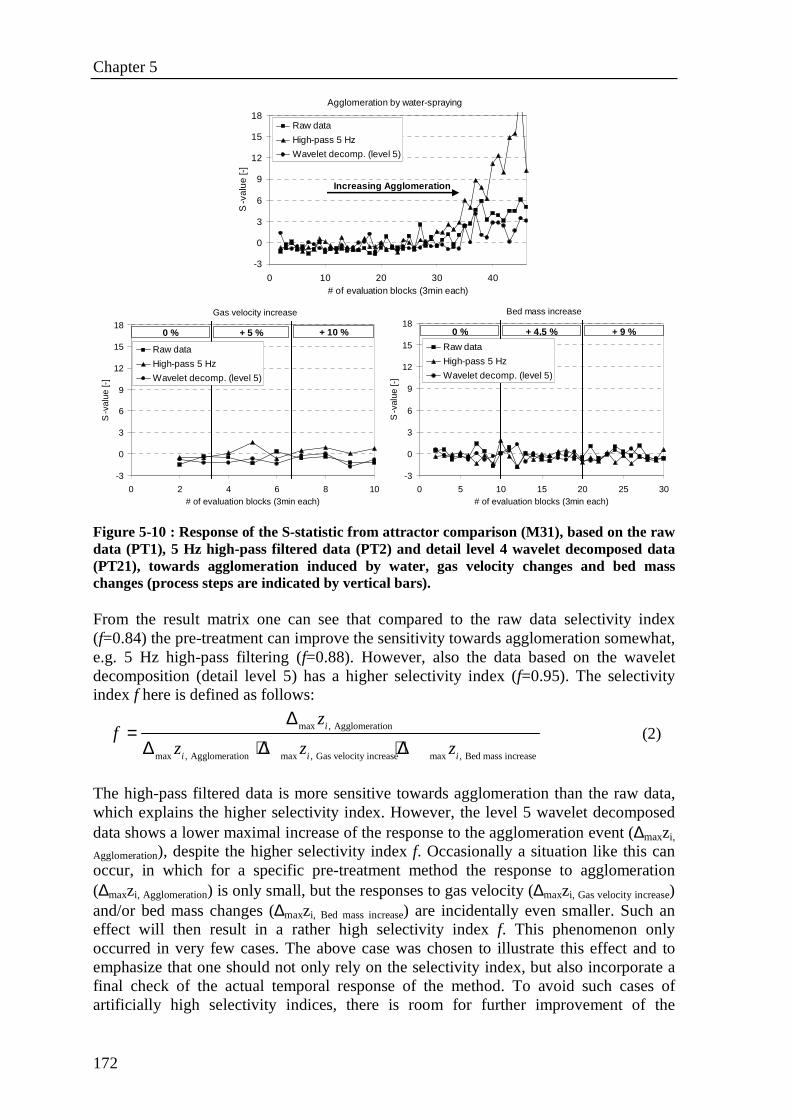
Chapter 5
172
Agglomeration by water-spraying
-3
0
3
6
9
12
15
18
0 10 20 30 40# of evaluation blocks (3min each)
S-v
alu
e [-
]
Raw data
High-pass 5 Hz
Wavelet decomp. (level 5)
Increasing Agglomeration
Gas velocity increase
-3
0
3
6
9
12
15
18
0 2 4 6 8 10# of evaluation blocks (3min each)
S-v
alue
[-]
Raw data
High-pass 5 Hz
Wavelet decomp. (level 5)
0 % + 5 % + 10 %
Bed mass increase
-3
0
3
6
9
12
15
18
0 5 10 15 20 25 30# of evaluation blocks (3min each)
S-v
alue
[-]
Raw data
High-pass 5 Hz
Wavelet decomp. (level 5)
0 % + 4.5 % + 9 %
Figure 5-10 : Response of the S-statistic from attractor comparison (M31), based on the raw data (PT1), 5 Hz high-pass filtered data (PT2) and detail level 4 wavelet decomposed data (PT21), towards agglomeration induced by water, gas velocity changes and bed mass changes (process steps are indicated by vertical bars). From the result matrix one can see that compared to the raw data selectivity index (f=0.84) the pre-treatment can improve the sensitivity towards agglomeration somewhat, e.g. 5 Hz high-pass filtering (f=0.88). However, also the data based on the wavelet decomposition (detail level 5) has a higher selectivity index (f=0.95). The selectivity index f here is defined as follows:
max , Agglomeration
max , Agglomeration max , Gas velocity increase max , Bed mass increase
i
i i i
zf
z z z
∆=
∆ + ∆ + ∆ (2)
The high-pass filtered data is more sensitive towards agglomeration than the raw data, which explains the higher selectivity index. However, the level 5 wavelet decomposed data shows a lower maximal increase of the response to the agglomeration event (∆maxzi,
Agglomeration), despite the higher selectivity index f. Occasionally a situation like this can occur, in which for a specific pre-treatment method the response to agglomeration (∆maxzi, Agglomeration) is only small, but the responses to gas velocity (∆maxzi, Gas velocity increase) and/or bed mass changes (∆maxzi, Bed mass increase) are incidentally even smaller. Such an effect will then result in a rather high selectivity index f. This phenomenon only occurred in very few cases. The above case was chosen to illustrate this effect and to emphasize that one should not only rely on the selectivity index, but also incorporate a final check of the actual temporal response of the method. To avoid such cases of artificially high selectivity indices, there is room for further improvement of the
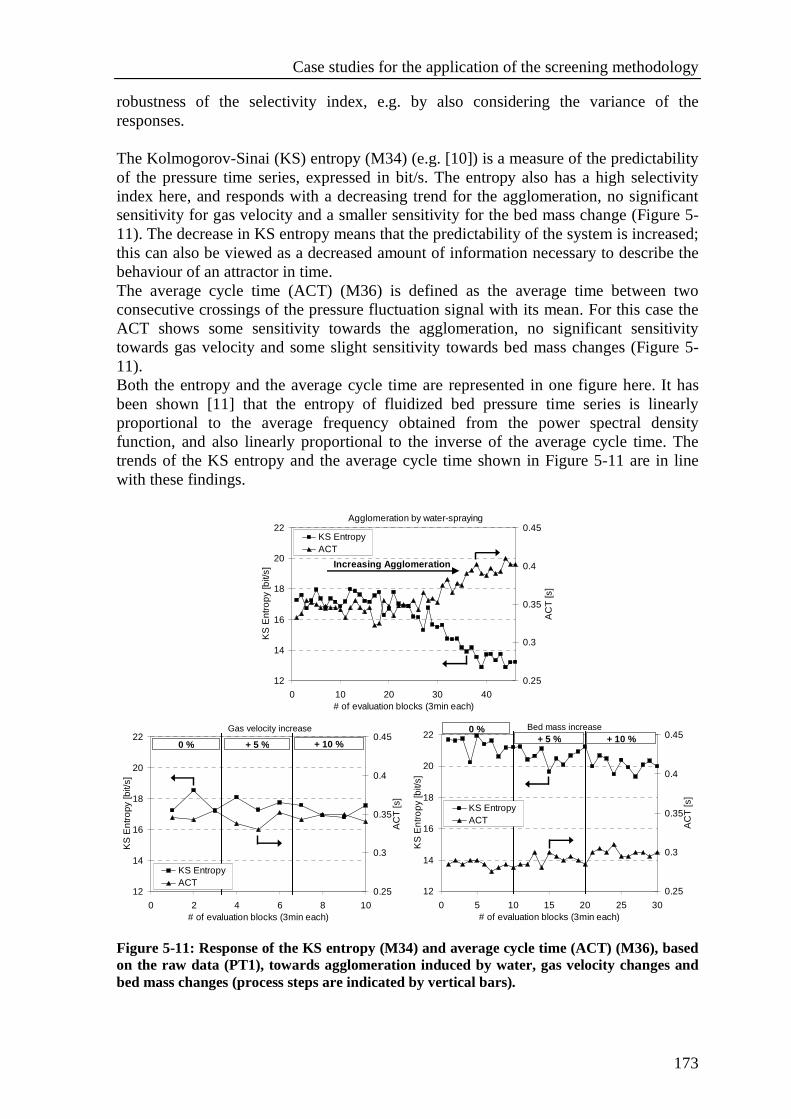
Case studies for the application of the screening methodology
173
robustness of the selectivity index, e.g. by also considering the variance of the responses. The Kolmogorov-Sinai (KS) entropy (M34) (e.g. [10]) is a measure of the predictability of the pressure time series, expressed in bit/s. The entropy also has a high selectivity index here, and responds with a decreasing trend for the agglomeration, no significant sensitivity for gas velocity and a smaller sensitivity for the bed mass change (Figure 5-11). The decrease in KS entropy means that the predictability of the system is increased; this can also be viewed as a decreased amount of information necessary to describe the behaviour of an attractor in time. The average cycle time (ACT) (M36) is defined as the average time between two consecutive crossings of the pressure fluctuation signal with its mean. For this case the ACT shows some sensitivity towards the agglomeration, no significant sensitivity towards gas velocity and some slight sensitivity towards bed mass changes (Figure 5-11). Both the entropy and the average cycle time are represented in one figure here. It has been shown [11] that the entropy of fluidized bed pressure time series is linearly proportional to the average frequency obtained from the power spectral density function, and also linearly proportional to the inverse of the average cycle time. The trends of the KS entropy and the average cycle time shown in Figure 5-11 are in line with these findings.
Agglomeration by water-spraying
12
14
16
18
20
22
0 10 20 30 40# of evaluation blocks (3min each)
KS
Ent
rop
y [b
it/s]
0.25
0.3
0.35
0.4
0.45
AC
T [s
]KS EntropyACT
Increasing Agglomeration
Gas velocity increase
12
14
16
18
20
22
0 2 4 6 8 10# of evaluation blocks (3min each)
KS
En
tro
py [b
it/s]
0.25
0.3
0.35
0.4
0.45
AC
T [s
]
KS EntropyACT
0 % + 5 % + 10 %
Bed mass increase
12
14
16
18
20
22
0 5 10 15 20 25 30# of evaluation blocks (3min each)
KS
En
tro
py
[bit/
s]
0.25
0.3
0.35
0.4
0.45
AC
T [s
]
KS EntropyACT
0 %+ 5 % + 10 %
Figure 5-11: Response of the KS entropy (M34) and average cycle time (ACT) (M36), based on the raw data (PT1), towards agglomeration induced by water, gas velocity changes and bed mass changes (process steps are indicated by vertical bars).
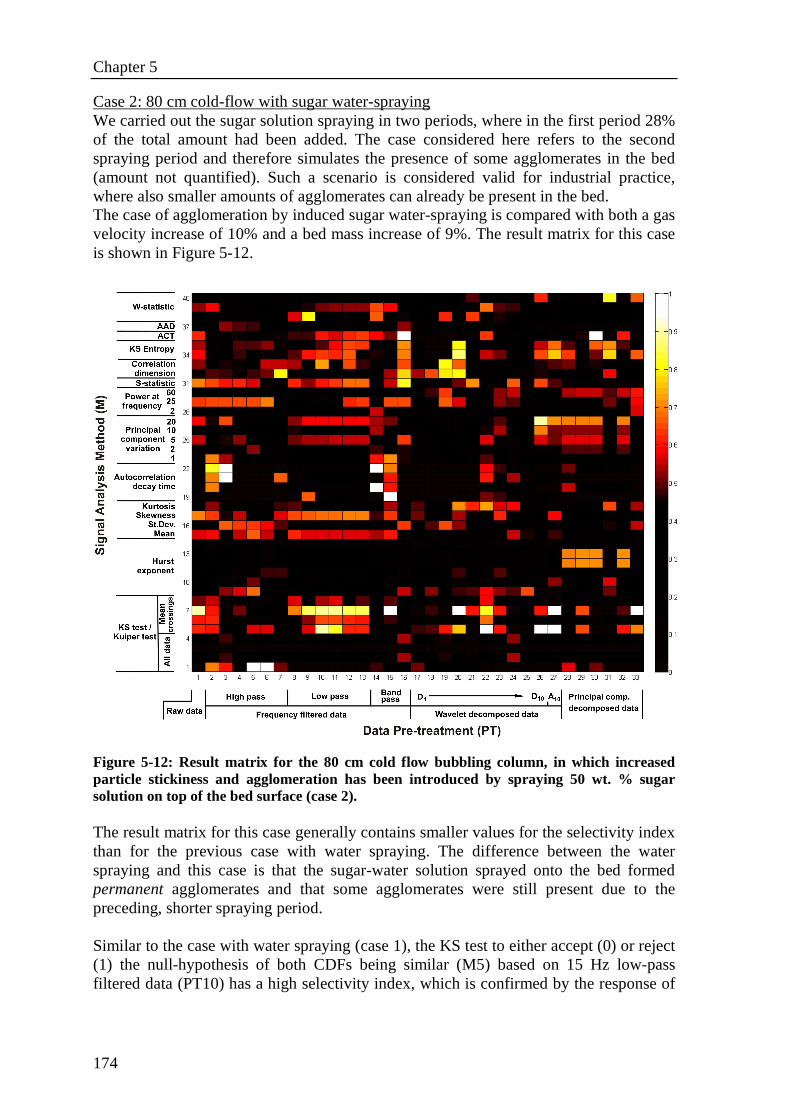
Chapter 5
174
Case 2: 80 cm cold-flow with sugar water-spraying We carried out the sugar solution spraying in two periods, where in the first period 28% of the total amount had been added. The case considered here refers to the second spraying period and therefore simulates the presence of some agglomerates in the bed (amount not quantified). Such a scenario is considered valid for industrial practice, where also smaller amounts of agglomerates can already be present in the bed. The case of agglomeration by induced sugar water-spraying is compared with both a gas velocity increase of 10% and a bed mass increase of 9%. The result matrix for this case is shown in Figure 5-12.
Figure 5-12: Result matrix for the 80 cm cold flow bubbling column, in which increased particle stickiness and agglomeration has been introduced by spraying 50 wt. % sugar solution on top of the bed surface (case 2). The result matrix for this case generally contains smaller values for the selectivity index than for the previous case with water spraying. The difference between the water spraying and this case is that the sugar-water solution sprayed onto the bed formed permanent agglomerates and that some agglomerates were still present due to the preceding, shorter spraying period. Similar to the case with water spraying (case 1), the KS test to either accept (0) or reject (1) the null-hypothesis of both CDFs being similar (M5) based on 15 Hz low-pass filtered data (PT10) has a high selectivity index, which is confirmed by the response of
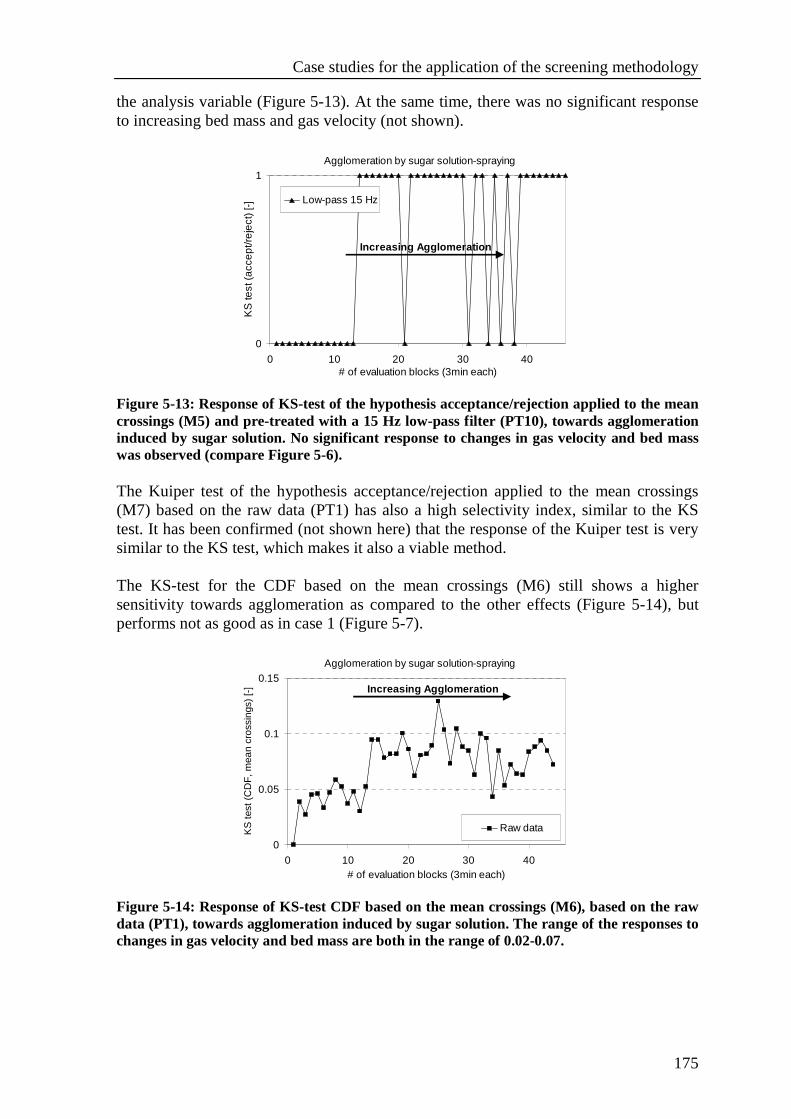
Case studies for the application of the screening methodology
175
the analysis variable (Figure 5-13). At the same time, there was no significant response to increasing bed mass and gas velocity (not shown).
Agglomeration by sugar solution-spraying
0
1
0 10 20 30 40# of evaluation blocks (3min each)
KS
test
(a
cce
pt/r
eje
ct)
[-] Low-pass 15 Hz
Increasing Agglomeration
Figure 5-13: Response of KS-test of the hypothesis acceptance/rejection applied to the mean crossings (M5) and pre-treated with a 15 Hz low-pass filter (PT10), towards agglomeration induced by sugar solution. No significant response to changes in gas velocity and bed mass was observed (compare Figure 5-6). The Kuiper test of the hypothesis acceptance/rejection applied to the mean crossings (M7) based on the raw data (PT1) has also a high selectivity index, similar to the KS test. It has been confirmed (not shown here) that the response of the Kuiper test is very similar to the KS test, which makes it also a viable method. The KS-test for the CDF based on the mean crossings (M6) still shows a higher sensitivity towards agglomeration as compared to the other effects (Figure 5-14), but performs not as good as in case 1 (Figure 5-7).
Agglomeration by sugar solution-spraying
0
0.05
0.1
0.15
0 10 20 30 40# of evaluation blocks (3min each)
KS
test
(C
DF
, mea
n cr
ossi
ngs)
[-]
Raw data
Increasing Agglomeration
Figure 5-14: Response of KS-test CDF based on the mean crossings (M6), based on the raw data (PT1), towards agglomeration induced by sugar solution. The range of the responses to changes in gas velocity and bed mass are both in the range of 0.02-0.07.
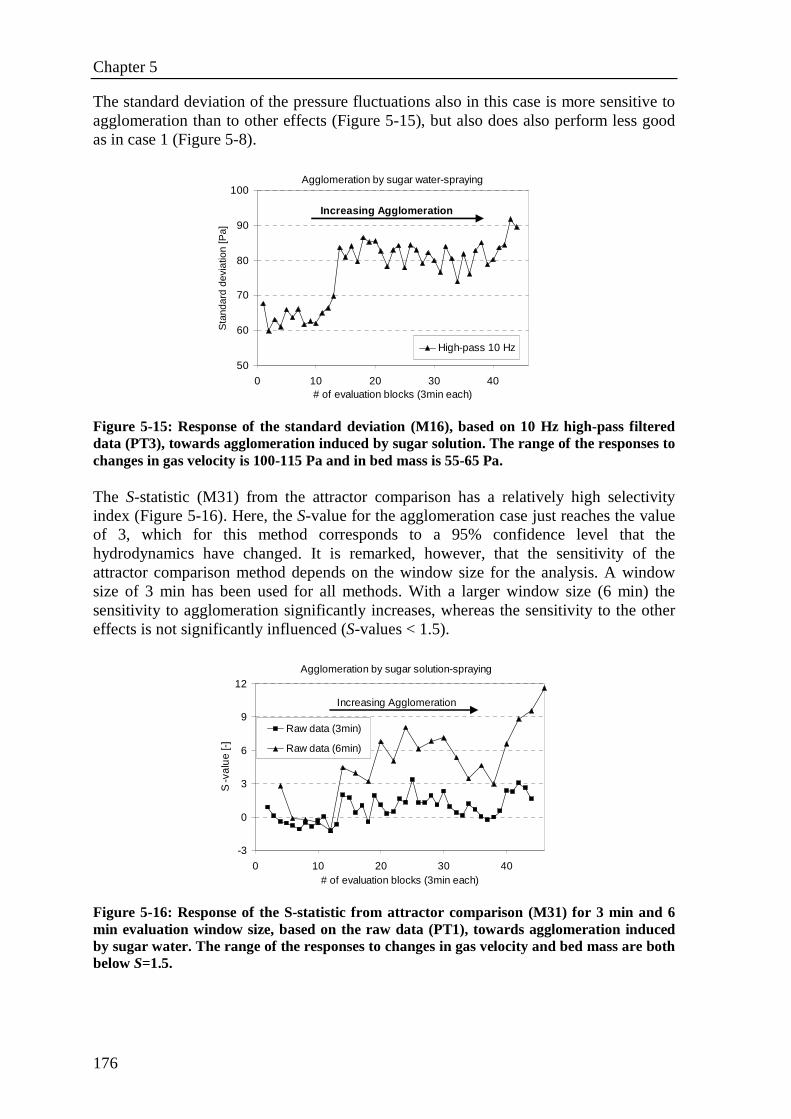
Chapter 5
176
The standard deviation of the pressure fluctuations also in this case is more sensitive to agglomeration than to other effects (Figure 5-15), but also does also perform less good as in case 1 (Figure 5-8).
Agglomeration by sugar water-spraying
50
60
70
80
90
100
0 10 20 30 40# of evaluation blocks (3min each)
Sta
ndar
d de
viat
ion
[Pa]
High-pass 10 Hz
Increasing Agglomeration
Figure 5-15: Response of the standard deviation (M16), based on 10 Hz high-pass filtered data (PT3), towards agglomeration induced by sugar solution. The range of the responses to changes in gas velocity is 100-115 Pa and in bed mass is 55-65 Pa. The S-statistic (M31) from the attractor comparison has a relatively high selectivity index (Figure 5-16). Here, the S-value for the agglomeration case just reaches the value of 3, which for this method corresponds to a 95% confidence level that the hydrodynamics have changed. It is remarked, however, that the sensitivity of the attractor comparison method depends on the window size for the analysis. A window size of 3 min has been used for all methods. With a larger window size (6 min) the sensitivity to agglomeration significantly increases, whereas the sensitivity to the other effects is not significantly influenced (S-values < 1.5).
Agglomeration by sugar solution-spraying
-3
0
3
6
9
12
0 10 20 30 40# of evaluation blocks (3min each)
S-v
alu
e [-
]
Raw data (3min)
Raw data (6min)
Increasing Agglomeration
Figure 5-16: Response of the S-statistic from attractor comparison (M31) for 3 min and 6 min evaluation window size, based on the raw data (PT1), towards agglomeration induced by sugar water. The range of the responses to changes in gas velocity and bed mass are both below S=1.5.
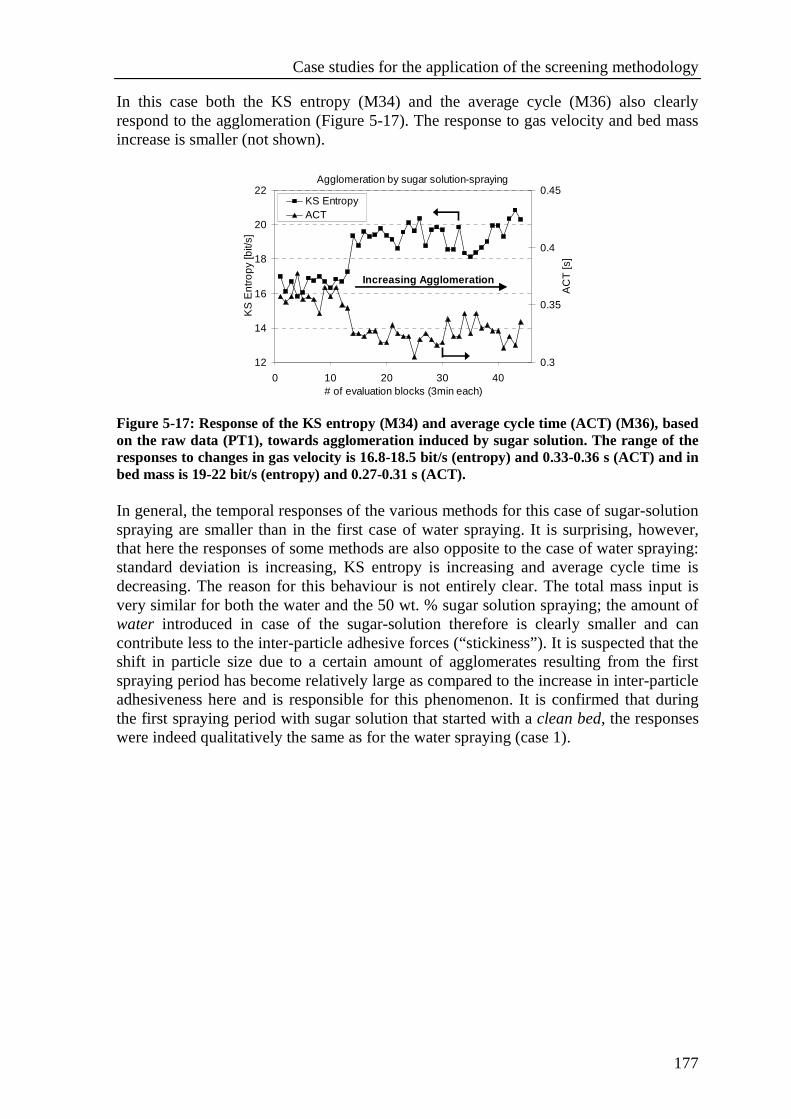
Case studies for the application of the screening methodology
177
In this case both the KS entropy (M34) and the average cycle (M36) also clearly respond to the agglomeration (Figure 5-17). The response to gas velocity and bed mass increase is smaller (not shown).
Agglomeration by sugar solution-spraying
12
14
16
18
20
22
0 10 20 30 40# of evaluation blocks (3min each)
KS
Ent
ropy
[bit/
s]
0.3
0.35
0.4
0.45
AC
T [s
]
KS EntropyACT
Increasing Agglomeration
Figure 5-17: Response of the KS entropy (M34) and average cycle time (ACT) (M36), based on the raw data (PT1), towards agglomeration induced by sugar solution. The range of the responses to changes in gas velocity is 16.8-18.5 bit/s (entropy) and 0.33-0.36 s (ACT) and in bed mass is 19-22 bit/s (entropy) and 0.27-0.31 s (ACT). In general, the temporal responses of the various methods for this case of sugar-solution spraying are smaller than in the first case of water spraying. It is surprising, however, that here the responses of some methods are also opposite to the case of water spraying: standard deviation is increasing, KS entropy is increasing and average cycle time is decreasing. The reason for this behaviour is not entirely clear. The total mass input is very similar for both the water and the 50 wt. % sugar solution spraying; the amount of water introduced in case of the sugar-solution therefore is clearly smaller and can contribute less to the inter-particle adhesive forces (“stickiness”). It is suspected that the shift in particle size due to a certain amount of agglomerates resulting from the first spraying period has become relatively large as compared to the increase in inter-particle adhesiveness here and is responsible for this phenomenon. It is confirmed that during the first spraying period with sugar solution that started with a clean bed, the responses were indeed qualitatively the same as for the water spraying (case 1).
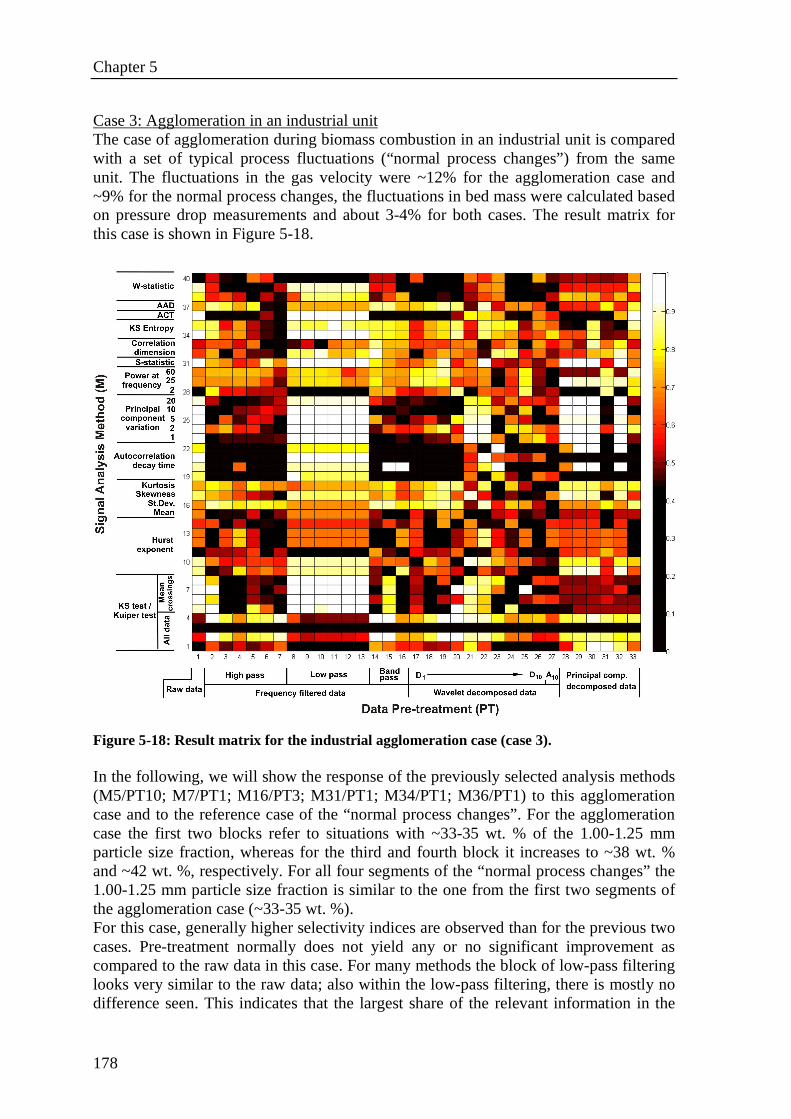
Chapter 5
178
Case 3: Agglomeration in an industrial unit The case of agglomeration during biomass combustion in an industrial unit is compared with a set of typical process fluctuations (“normal process changes”) from the same unit. The fluctuations in the gas velocity were ~12% for the agglomeration case and ~9% for the normal process changes, the fluctuations in bed mass were calculated based on pressure drop measurements and about 3-4% for both cases. The result matrix for this case is shown in Figure 5-18.
Figure 5-18: Result matrix for the industrial agglomeration case (case 3). In the following, we will show the response of the previously selected analysis methods (M5/PT10; M7/PT1; M16/PT3; M31/PT1; M34/PT1; M36/PT1) to this agglomeration case and to the reference case of the “normal process changes”. For the agglomeration case the first two blocks refer to situations with ~33-35 wt. % of the 1.00-1.25 mm particle size fraction, whereas for the third and fourth block it increases to ~38 wt. % and ~42 wt. %, respectively. For all four segments of the “normal process changes” the 1.00-1.25 mm particle size fraction is similar to the one from the first two segments of the agglomeration case (~33-35 wt. %). For this case, generally higher selectivity indices are observed than for the previous two cases. Pre-treatment normally does not yield any or no significant improvement as compared to the raw data in this case. For many methods the block of low-pass filtering looks very similar to the raw data; also within the low-pass filtering, there is mostly no difference seen. This indicates that the largest share of the relevant information in the
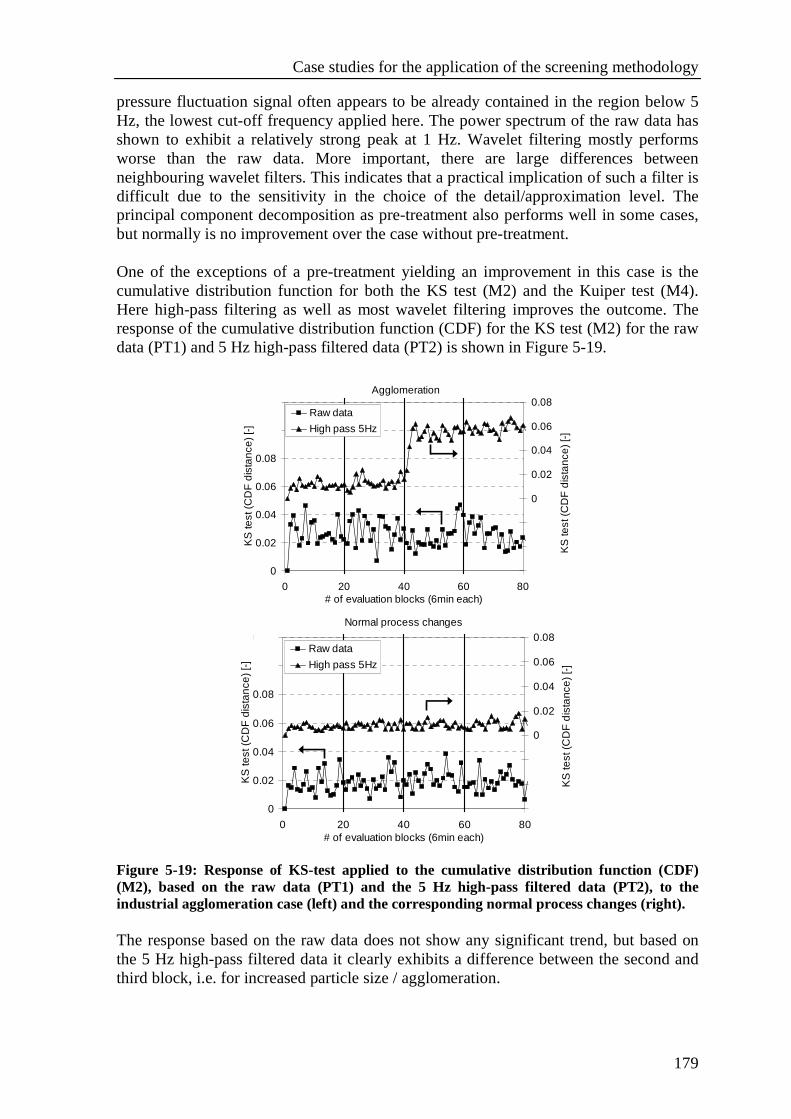
Case studies for the application of the screening methodology
179
pressure fluctuation signal often appears to be already contained in the region below 5 Hz, the lowest cut-off frequency applied here. The power spectrum of the raw data has shown to exhibit a relatively strong peak at 1 Hz. Wavelet filtering mostly performs worse than the raw data. More important, there are large differences between neighbouring wavelet filters. This indicates that a practical implication of such a filter is difficult due to the sensitivity in the choice of the detail/approximation level. The principal component decomposition as pre-treatment also performs well in some cases, but normally is no improvement over the case without pre-treatment. One of the exceptions of a pre-treatment yielding an improvement in this case is the cumulative distribution function for both the KS test (M2) and the Kuiper test (M4). Here high-pass filtering as well as most wavelet filtering improves the outcome. The response of the cumulative distribution function (CDF) for the KS test (M2) for the raw data (PT1) and 5 Hz high-pass filtered data (PT2) is shown in Figure 5-19.
Agglomeration
0
0.02
0.04
0.06
0.08
0.1
0.12
0 20 40 60 80# of evaluation blocks (6min each)
KS
test
(C
DF
dis
tan
ce)
[-]
-0.06
-0.04
-0.02
0
0.02
0.04
0.06
0.08
KS
test
(C
DF
dis
tan
ce)
[-]
Raw data
High pass 5Hz
Normal process changes
0
0.02
0.04
0.06
0.08
0.1
0.12
0 20 40 60 80# of evaluation blocks (6min each)
KS
test
(CD
F d
ista
nce
) [-]
-0.06
-0.04
-0.02
0
0.02
0.04
0.06
0.08
KS
test
(C
DF
dis
tanc
e)
[-]
Raw data
High pass 5Hz
Figure 5-19: Response of KS-test applied to the cumulative distribution function (CDF) (M2), based on the raw data (PT1) and the 5 Hz high-pass filtered data (PT2), to the industrial agglomeration case (left) and the corresponding normal process changes (right). The response based on the raw data does not show any significant trend, but based on the 5 Hz high-pass filtered data it clearly exhibits a difference between the second and third block, i.e. for increased particle size / agglomeration.
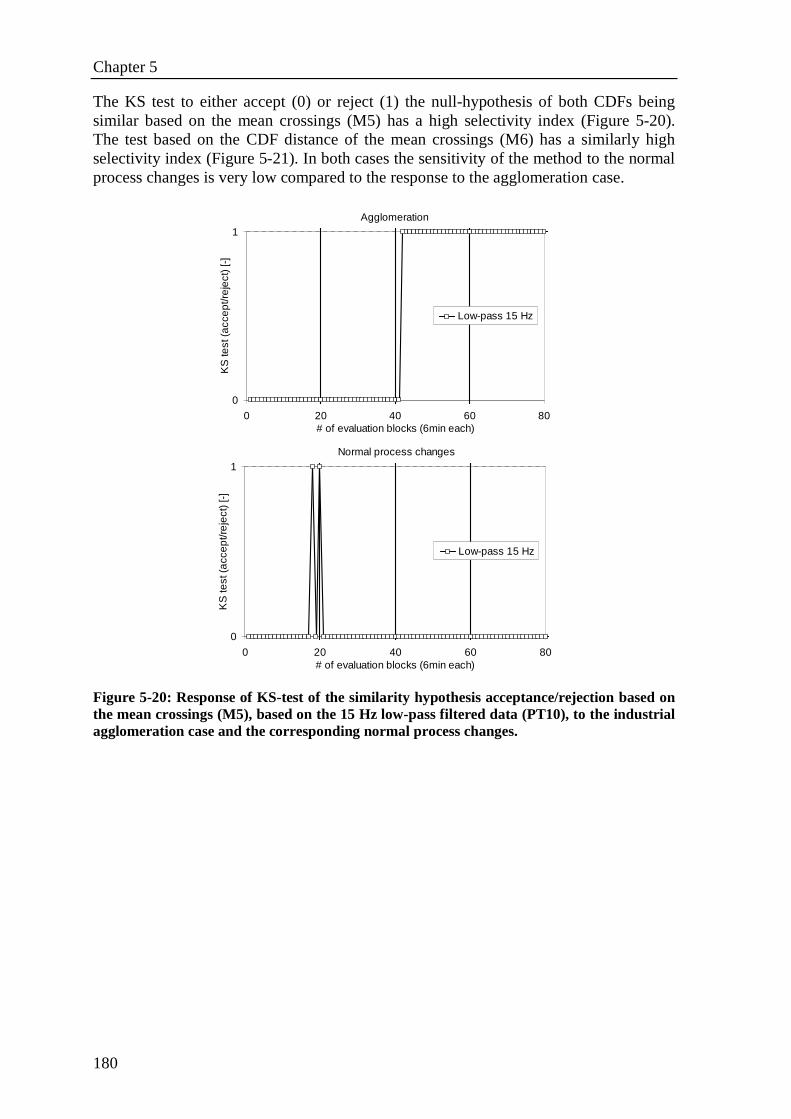
Chapter 5
180
The KS test to either accept (0) or reject (1) the null-hypothesis of both CDFs being similar based on the mean crossings (M5) has a high selectivity index (Figure 5-20). The test based on the CDF distance of the mean crossings (M6) has a similarly high selectivity index (Figure 5-21). In both cases the sensitivity of the method to the normal process changes is very low compared to the response to the agglomeration case.
Agglomeration
0
1
0 20 40 60 80# of evaluation blocks (6min each)
KS
test
(a
cce
pt/r
eje
ct)
[-]
Low-pass 15 Hz
Normal process changes
0
1
0 20 40 60 80# of evaluation blocks (6min each)
KS
test
(acc
ept/r
eje
ct) [
-]
Low-pass 15 Hz
Figure 5-20: Response of KS-test of the similarity hypothesis acceptance/rejection based on the mean crossings (M5), based on the 15 Hz low-pass filtered data (PT10), to the industrial agglomeration case and the corresponding normal process changes.
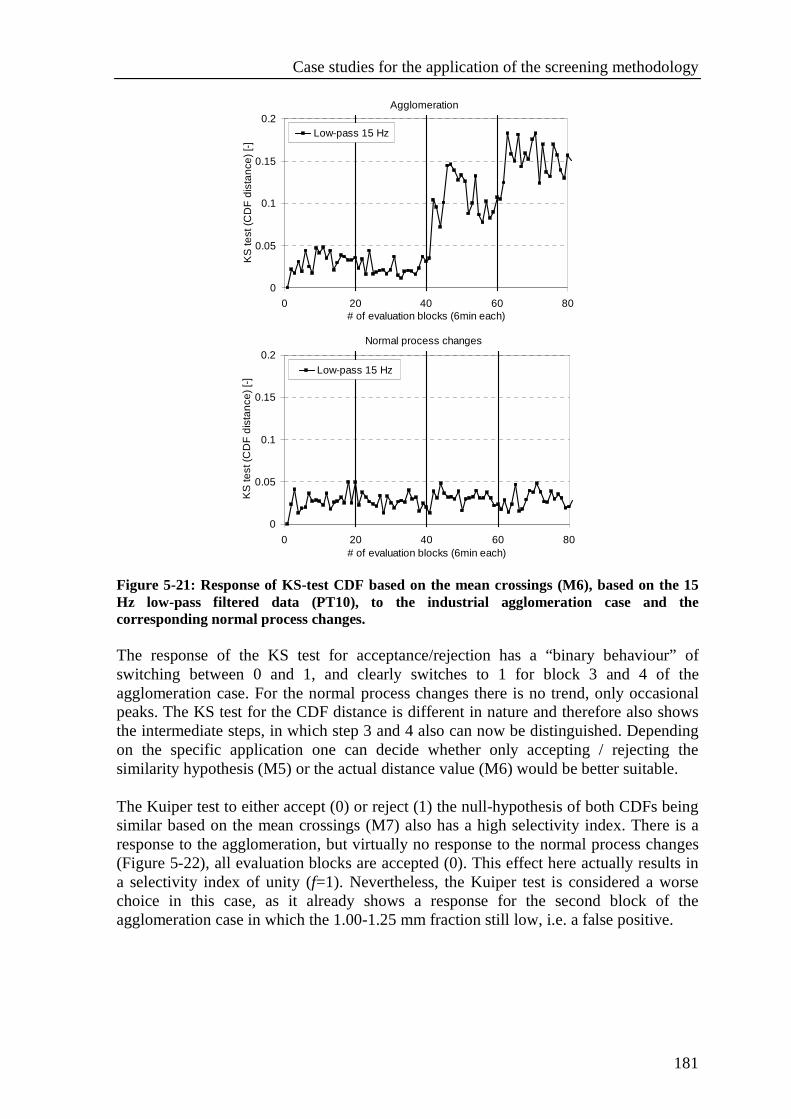
Case studies for the application of the screening methodology
181
Agglomeration
0
0.05
0.1
0.15
0.2
0 20 40 60 80# of evaluation blocks (6min each)
KS
test
(CD
F d
ista
nce)
[-]
Low-pass 15 Hz
Normal process changes
0
0.05
0.1
0.15
0.2
0 20 40 60 80# of evaluation blocks (6min each)
KS
test
(CD
F d
ista
nce)
[-]
Low-pass 15 Hz
Figure 5-21: Response of KS-test CDF based on the mean crossings (M6), based on the 15 Hz low-pass filtered data (PT10), to the industrial agglomeration case and the corresponding normal process changes. The response of the KS test for acceptance/rejection has a “binary behaviour” of switching between 0 and 1, and clearly switches to 1 for block 3 and 4 of the agglomeration case. For the normal process changes there is no trend, only occasional peaks. The KS test for the CDF distance is different in nature and therefore also shows the intermediate steps, in which step 3 and 4 also can now be distinguished. Depending on the specific application one can decide whether only accepting / rejecting the similarity hypothesis (M5) or the actual distance value (M6) would be better suitable. The Kuiper test to either accept (0) or reject (1) the null-hypothesis of both CDFs being similar based on the mean crossings (M7) also has a high selectivity index. There is a response to the agglomeration, but virtually no response to the normal process changes (Figure 5-22), all evaluation blocks are accepted (0). This effect here actually results in a selectivity index of unity (f=1). Nevertheless, the Kuiper test is considered a worse choice in this case, as it already shows a response for the second block of the agglomeration case in which the 1.00-1.25 mm fraction still low, i.e. a false positive.
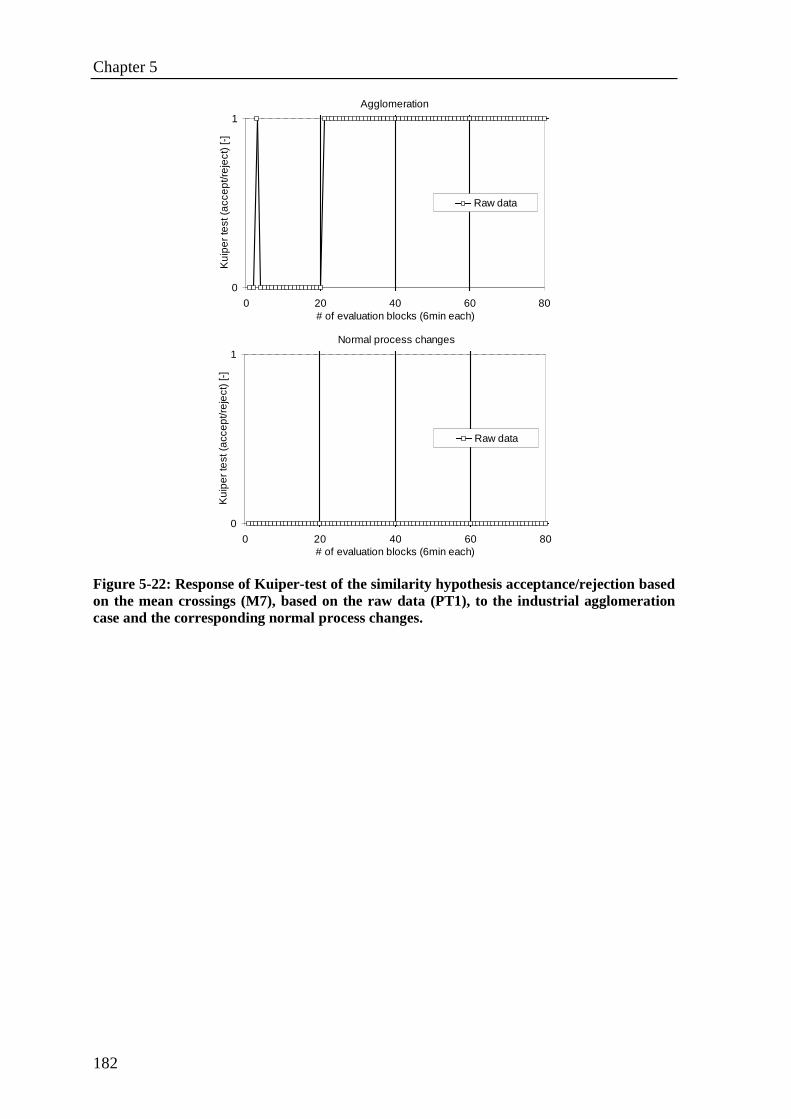
Chapter 5
182
Agglomeration
0
1
0 20 40 60 80# of evaluation blocks (6min each)
Kui
per
test
(acc
ept/r
ejec
t) [-]
Raw data
Normal process changes
0
1
0 20 40 60 80# of evaluation blocks (6min each)
Kui
per t
est
(acc
ept/r
eje
ct)
[-]
Raw data
Figure 5-22: Response of Kuiper-test of the similarity hypothesis acceptance/rejection based on the mean crossings (M7), based on the raw data (PT1), to the industrial agglomeration case and the corresponding normal process changes.
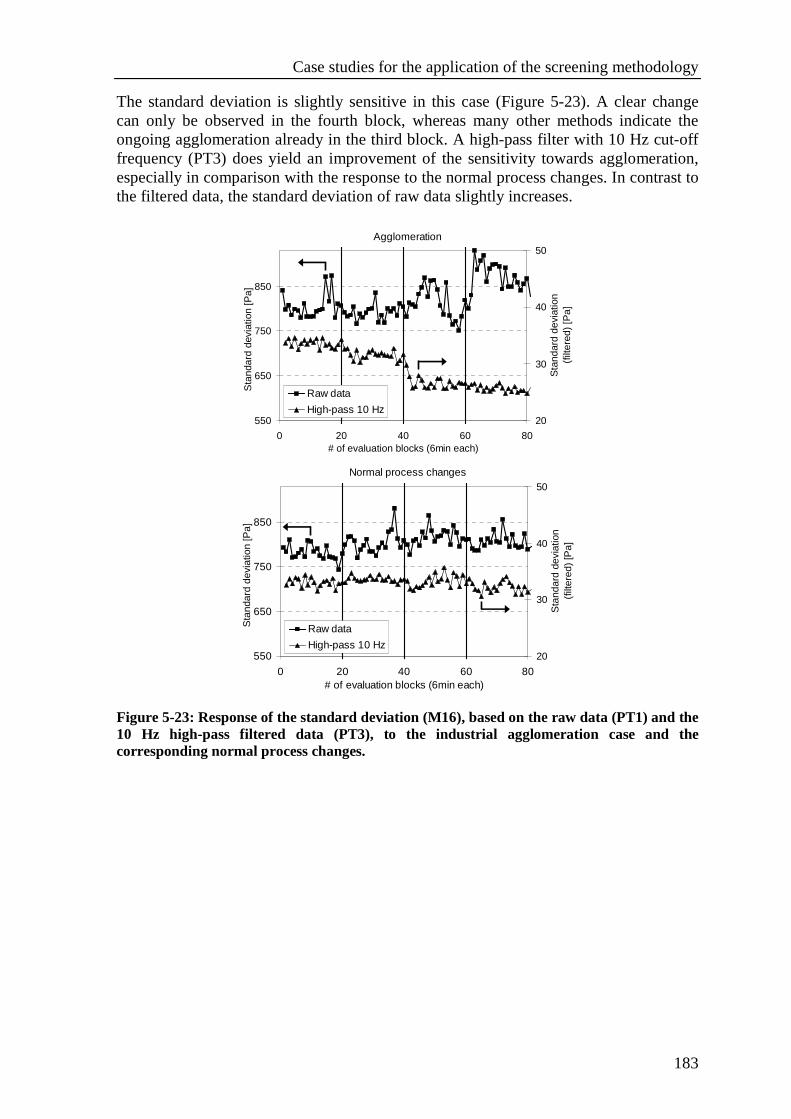
Case studies for the application of the screening methodology
183
The standard deviation is slightly sensitive in this case (Figure 5-23). A clear change can only be observed in the fourth block, whereas many other methods indicate the ongoing agglomeration already in the third block. A high-pass filter with 10 Hz cut-off frequency (PT3) does yield an improvement of the sensitivity towards agglomeration, especially in comparison with the response to the normal process changes. In contrast to the filtered data, the standard deviation of raw data slightly increases.
Agglomeration
550
650
750
850
0 20 40 60 80# of evaluation blocks (6min each)
Sta
ndar
d de
viat
ion
[Pa]
20
30
40
50
Sta
ndar
d de
viat
ion
(filt
ered
) [P
a]
Raw data
High-pass 10 Hz
Normal process changes
550
650
750
850
0 20 40 60 80# of evaluation blocks (6min each)
Sta
ndar
d de
viat
ion
[Pa]
20
30
40
50
Sta
ndar
d de
viat
ion
(filt
ered
) [P
a]
Raw data
High-pass 10 Hz
Figure 5-23: Response of the standard deviation (M16), based on the raw data (PT1) and the 10 Hz high-pass filtered data (PT3), to the industrial agglomeration case and the corresponding normal process changes.
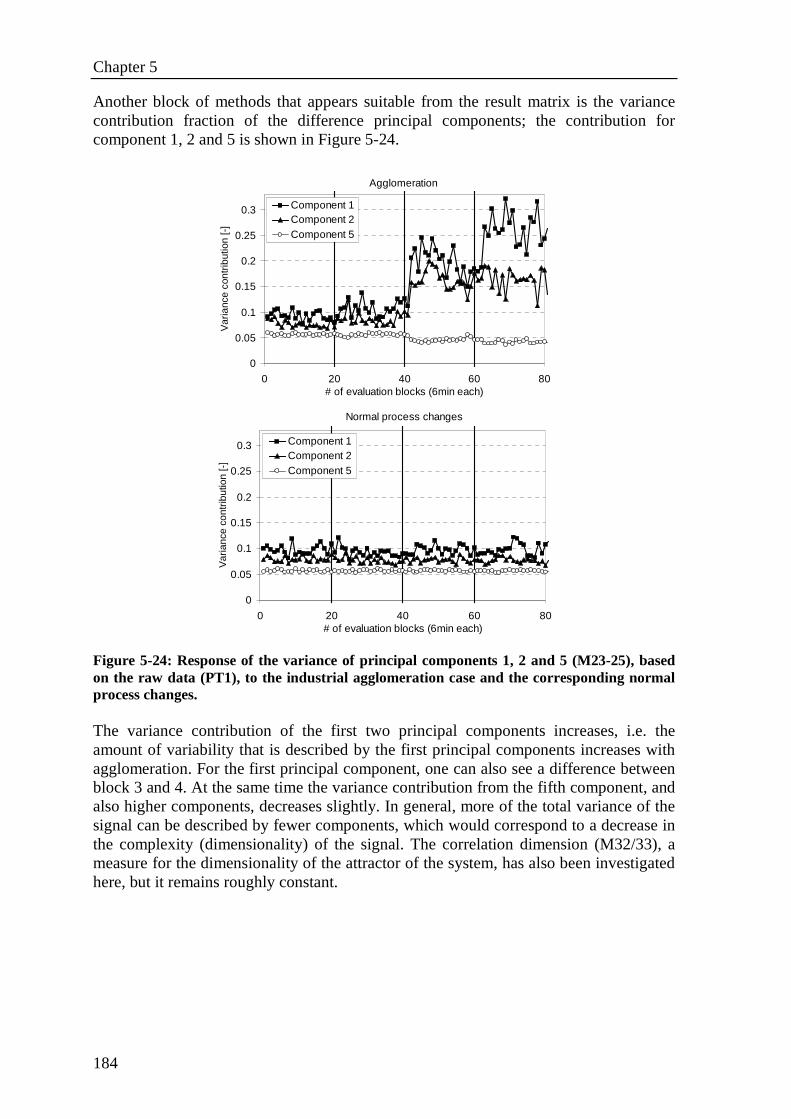
Chapter 5
184
Another block of methods that appears suitable from the result matrix is the variance contribution fraction of the difference principal components; the contribution for component 1, 2 and 5 is shown in Figure 5-24.
Agglomeration
0
0.05
0.1
0.15
0.2
0.25
0.3
0 20 40 60 80# of evaluation blocks (6min each)
Var
ianc
e co
ntrib
utio
n [-
]
Component 1Component 2Component 5
Normal process changes
0
0.05
0.1
0.15
0.2
0.25
0.3
0 20 40 60 80# of evaluation blocks (6min each)
Var
ianc
e co
ntrib
utio
n [-
]
Component 1Component 2Component 5
Figure 5-24: Response of the variance of principal components 1, 2 and 5 (M23-25), based on the raw data (PT1), to the industrial agglomeration case and the corresponding normal process changes. The variance contribution of the first two principal components increases, i.e. the amount of variability that is described by the first principal components increases with agglomeration. For the first principal component, one can also see a difference between block 3 and 4. At the same time the variance contribution from the fifth component, and also higher components, decreases slightly. In general, more of the total variance of the signal can be described by fewer components, which would correspond to a decrease in the complexity (dimensionality) of the signal. The correlation dimension (M32/33), a measure for the dimensionality of the attractor of the system, has also been investigated here, but it remains roughly constant.
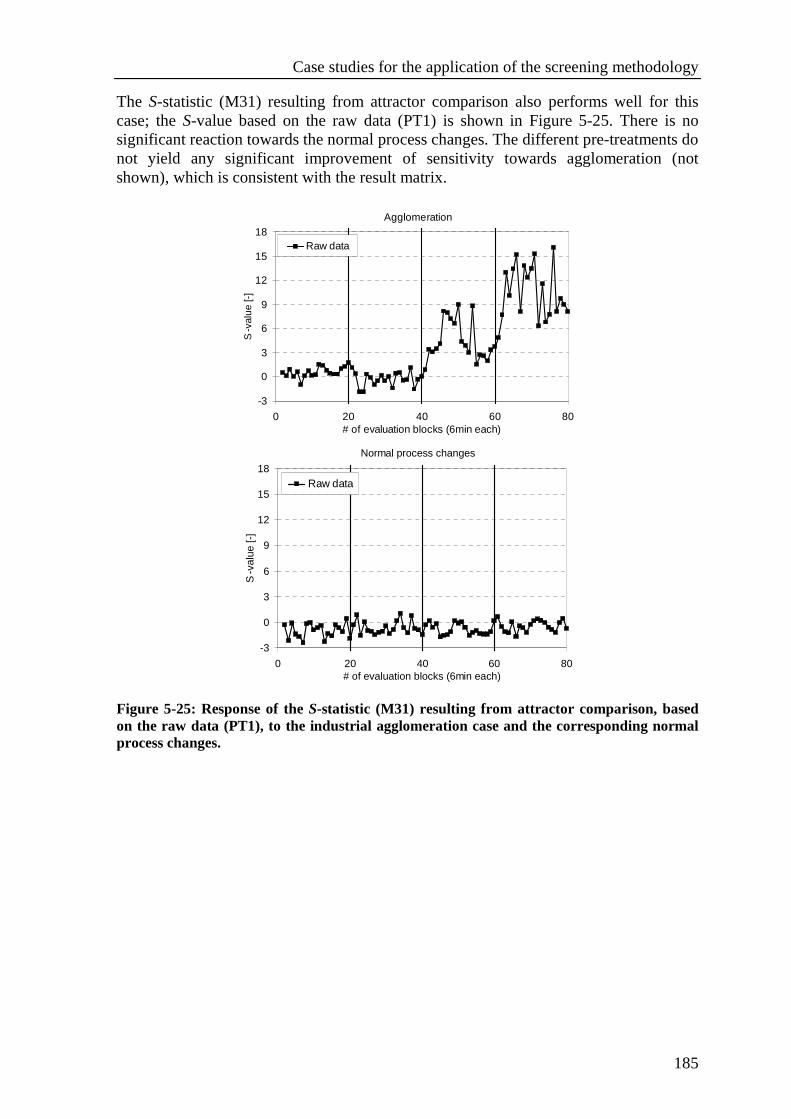
Case studies for the application of the screening methodology
185
The S-statistic (M31) resulting from attractor comparison also performs well for this case; the S-value based on the raw data (PT1) is shown in Figure 5-25. There is no significant reaction towards the normal process changes. The different pre-treatments do not yield any significant improvement of sensitivity towards agglomeration (not shown), which is consistent with the result matrix.
Agglomeration
-3
0
3
6
9
12
15
18
0 20 40 60 80# of evaluation blocks (6min each)
S-v
alue
[-]
Raw data
Normal process changes
-3
0
3
6
9
12
15
18
0 20 40 60 80# of evaluation blocks (6min each)
S-v
alue
[-]
Raw data
Figure 5-25: Response of the S-statistic (M31) resulting from attractor comparison, based on the raw data (PT1), to the industrial agglomeration case and the corresponding normal process changes.
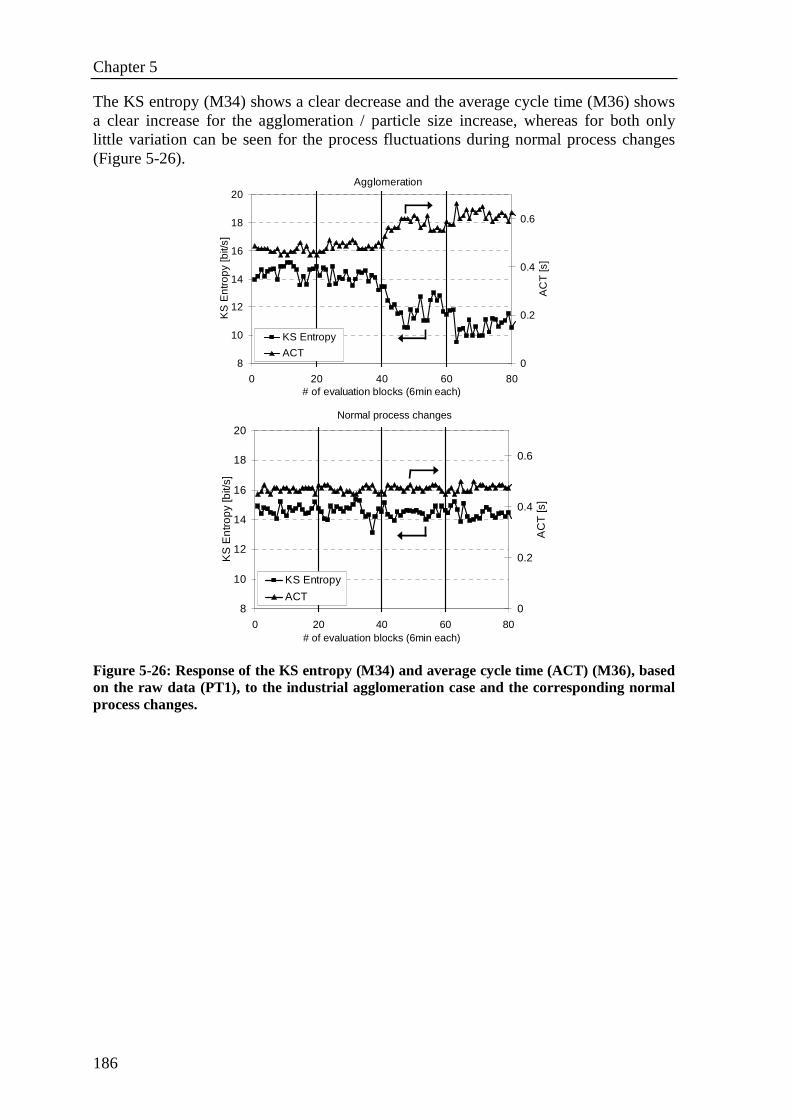
Chapter 5
186
The KS entropy (M34) shows a clear decrease and the average cycle time (M36) shows a clear increase for the agglomeration / particle size increase, whereas for both only little variation can be seen for the process fluctuations during normal process changes (Figure 5-26).
Agglomeration
8
10
12
14
16
18
20
0 20 40 60 80# of evaluation blocks (6min each)
KS
Ent
ropy
[bit/
s]
0
0.2
0.4
0.6
AC
T [s
]
KS Entropy
ACT
Normal process changes
8
10
12
14
16
18
20
0 20 40 60 80# of evaluation blocks (6min each)
KS
En
tro
py
[bit/
s]
0
0.2
0.4
0.6
AC
T [s
]
KS Entropy
ACT
Figure 5-26: Response of the KS entropy (M34) and average cycle time (ACT) (M36), based on the raw data (PT1), to the industrial agglomeration case and the corresponding normal process changes.
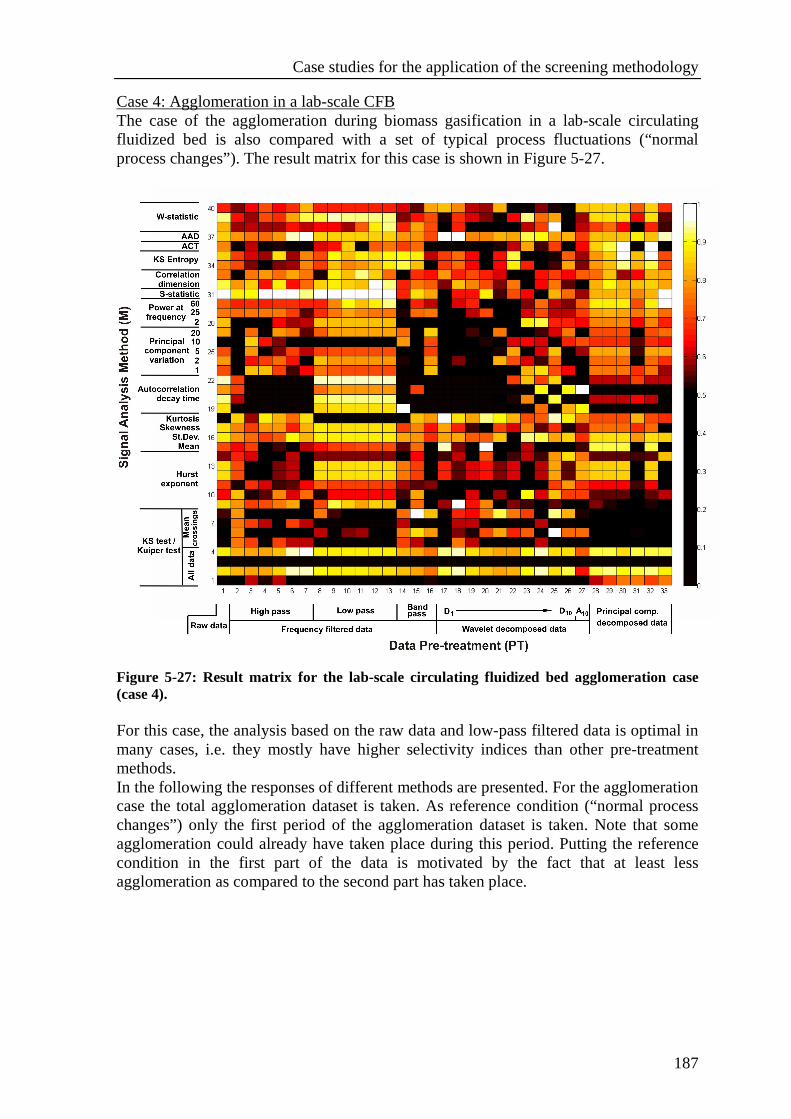
Case studies for the application of the screening methodology
187
Case 4: Agglomeration in a lab-scale CFB The case of the agglomeration during biomass gasification in a lab-scale circulating fluidized bed is also compared with a set of typical process fluctuations (“normal process changes”). The result matrix for this case is shown in Figure 5-27.
Figure 5-27: Result matrix for the lab-scale circulating fluidized bed agglomeration case (case 4). For this case, the analysis based on the raw data and low-pass filtered data is optimal in many cases, i.e. they mostly have higher selectivity indices than other pre-treatment methods. In the following the responses of different methods are presented. For the agglomeration case the total agglomeration dataset is taken. As reference condition (“normal process changes”) only the first period of the agglomeration dataset is taken. Note that some agglomeration could already have taken place during this period. Putting the reference condition in the first part of the data is motivated by the fact that at least less agglomeration as compared to the second part has taken place.
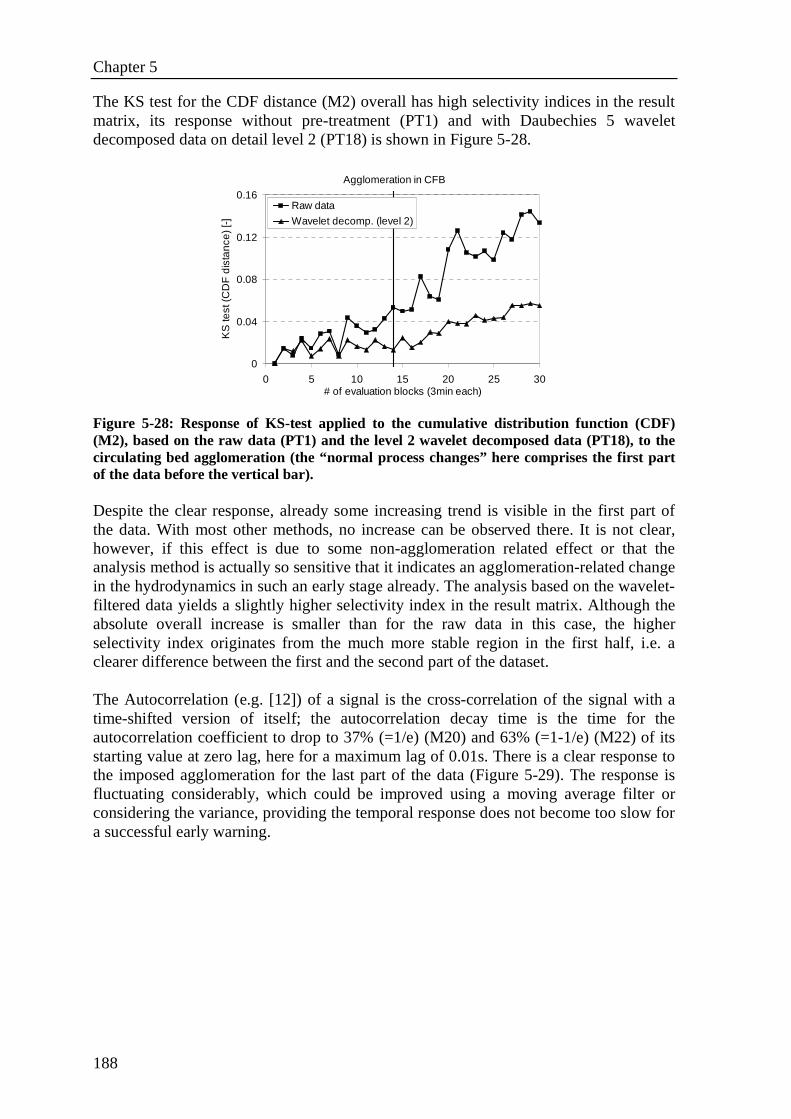
Chapter 5
188
The KS test for the CDF distance (M2) overall has high selectivity indices in the result matrix, its response without pre-treatment (PT1) and with Daubechies 5 wavelet decomposed data on detail level 2 (PT18) is shown in Figure 5-28.
Agglomeration in CFB
0
0.04
0.08
0.12
0.16
0 5 10 15 20 25 30# of evaluation blocks (3min each)
KS
test
(C
DF
dis
tan
ce)
[-]
Raw data
Wavelet decomp. (level 2)
Figure 5-28: Response of KS-test applied to the cumulative distribution function (CDF) (M2), based on the raw data (PT1) and the level 2 wavelet decomposed data (PT18), to the circulating bed agglomeration (the “normal process changes” here comprises the first part of the data before the vertical bar). Despite the clear response, already some increasing trend is visible in the first part of the data. With most other methods, no increase can be observed there. It is not clear, however, if this effect is due to some non-agglomeration related effect or that the analysis method is actually so sensitive that it indicates an agglomeration-related change in the hydrodynamics in such an early stage already. The analysis based on the wavelet-filtered data yields a slightly higher selectivity index in the result matrix. Although the absolute overall increase is smaller than for the raw data in this case, the higher selectivity index originates from the much more stable region in the first half, i.e. a clearer difference between the first and the second part of the dataset. The Autocorrelation (e.g. [12]) of a signal is the cross-correlation of the signal with a time-shifted version of itself; the autocorrelation decay time is the time for the autocorrelation coefficient to drop to 37% (=1/e) (M20) and 63% (=1-1/e) (M22) of its starting value at zero lag, here for a maximum lag of 0.01s. There is a clear response to the imposed agglomeration for the last part of the data (Figure 5-29). The response is fluctuating considerably, which could be improved using a moving average filter or considering the variance, providing the temporal response does not become too slow for a successful early warning.
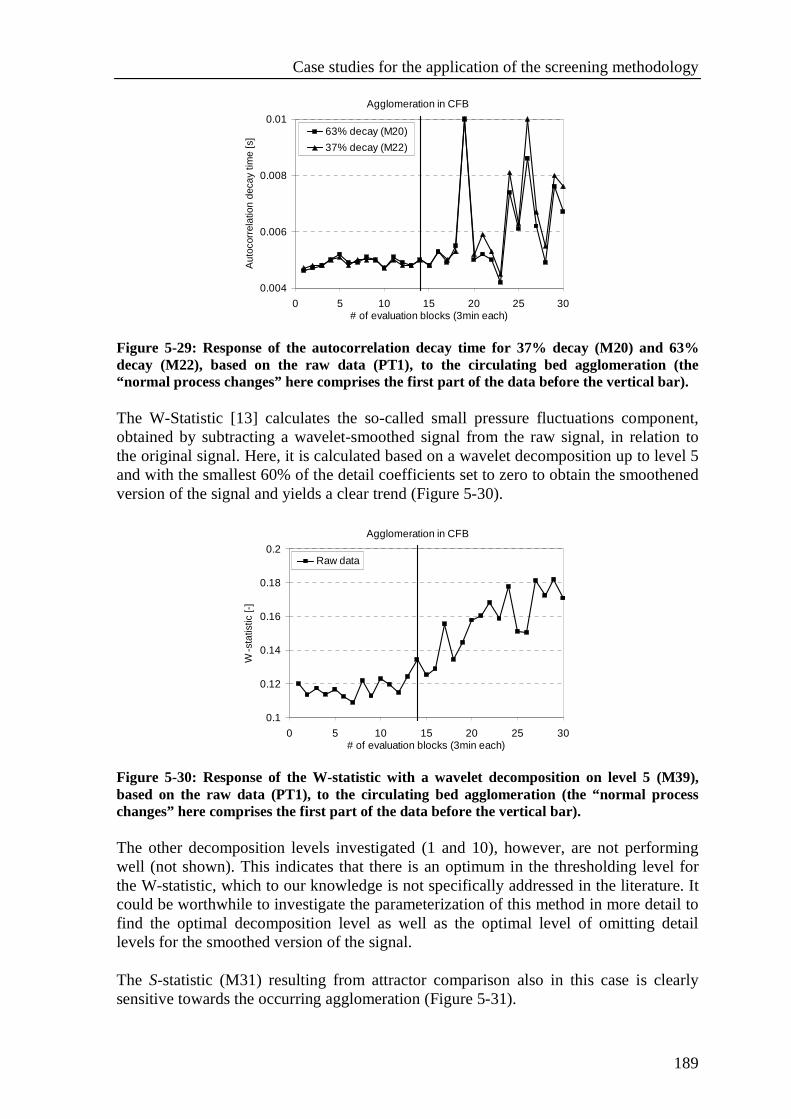
Case studies for the application of the screening methodology
189
Agglomeration in CFB
0.004
0.006
0.008
0.01
0 5 10 15 20 25 30# of evaluation blocks (3min each)
Aut
ocor
rela
tion
deca
y tim
e [s
]
63% decay (M20)
37% decay (M22)
Figure 5-29: Response of the autocorrelation decay time for 37% decay (M20) and 63% decay (M22), based on the raw data (PT1), to the circulating bed agglomeration (the “normal process changes” here comprises the first part of the data before the vertical bar). The W-Statistic [13] calculates the so-called small pressure fluctuations component, obtained by subtracting a wavelet-smoothed signal from the raw signal, in relation to the original signal. Here, it is calculated based on a wavelet decomposition up to level 5 and with the smallest 60% of the detail coefficients set to zero to obtain the smoothened version of the signal and yields a clear trend (Figure 5-30).
Agglomeration in CFB
0.1
0.12
0.14
0.16
0.18
0.2
0 5 10 15 20 25 30# of evaluation blocks (3min each)
W-s
tatis
tic [-
]
Raw data
Figure 5-30: Response of the W-statistic with a wavelet decomposition on level 5 (M39), based on the raw data (PT1), to the circulating bed agglomeration (the “normal process changes” here comprises the first part of the data before the vertical bar). The other decomposition levels investigated (1 and 10), however, are not performing well (not shown). This indicates that there is an optimum in the thresholding level for the W-statistic, which to our knowledge is not specifically addressed in the literature. It could be worthwhile to investigate the parameterization of this method in more detail to find the optimal decomposition level as well as the optimal level of omitting detail levels for the smoothed version of the signal. The S-statistic (M31) resulting from attractor comparison also in this case is clearly sensitive towards the occurring agglomeration (Figure 5-31).
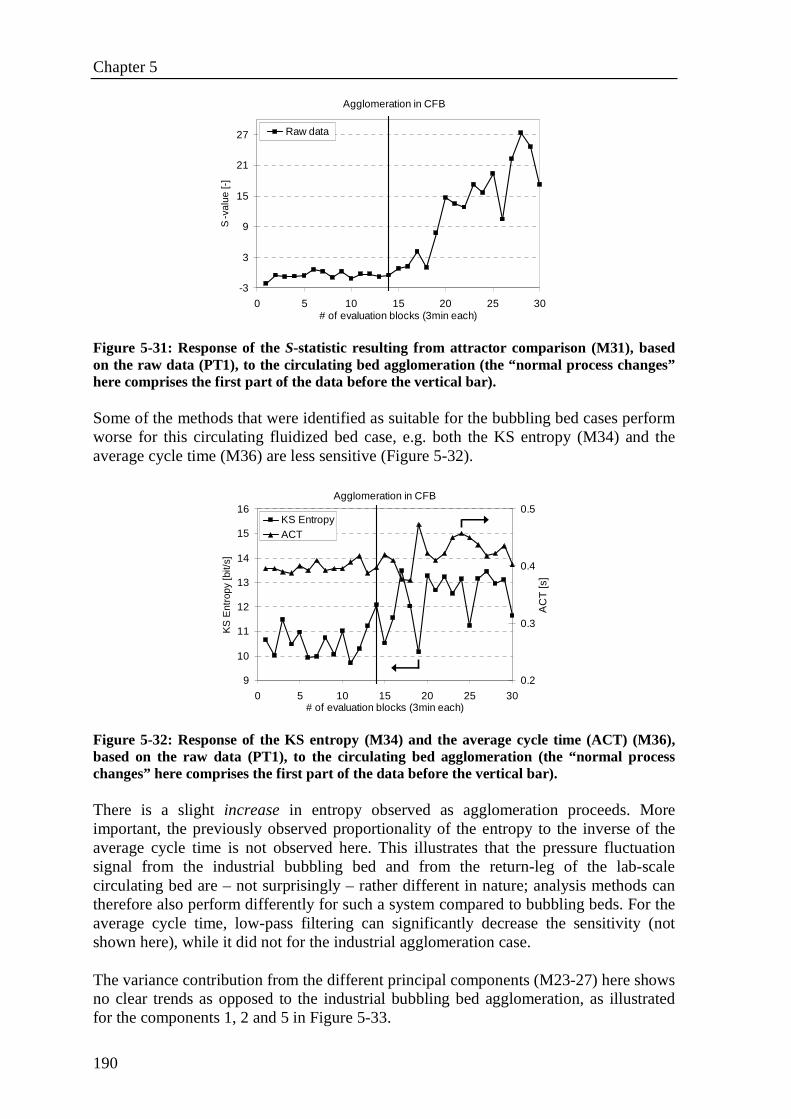
Chapter 5
190
Agglomeration in CFB
-3
3
9
15
21
27
0 5 10 15 20 25 30# of evaluation blocks (3min each)
S-v
alue
[-]
Raw data
Figure 5-31: Response of the S-statistic resulting from attractor comparison (M31), based on the raw data (PT1), to the circulating bed agglomeration (the “normal process changes” here comprises the first part of the data before the vertical bar). Some of the methods that were identified as suitable for the bubbling bed cases perform worse for this circulating fluidized bed case, e.g. both the KS entropy (M34) and the average cycle time (M36) are less sensitive (Figure 5-32).
Agglomeration in CFB
9
10
11
12
13
14
15
16
0 5 10 15 20 25 30# of evaluation blocks (3min each)
KS
Ent
ropy
[bit/
s]
0.2
0.3
0.4
0.5
AC
T [s
]
KS EntropyACT
Figure 5-32: Response of the KS entropy (M34) and the average cycle time (ACT) (M36), based on the raw data (PT1), to the circulating bed agglomeration (the “normal process changes” here comprises the first part of the data before the vertical bar). There is a slight increase in entropy observed as agglomeration proceeds. More important, the previously observed proportionality of the entropy to the inverse of the average cycle time is not observed here. This illustrates that the pressure fluctuation signal from the industrial bubbling bed and from the return-leg of the lab-scale circulating bed are – not surprisingly – rather different in nature; analysis methods can therefore also perform differently for such a system compared to bubbling beds. For the average cycle time, low-pass filtering can significantly decrease the sensitivity (not shown here), while it did not for the industrial agglomeration case. The variance contribution from the different principal components (M23-27) here shows no clear trends as opposed to the industrial bubbling bed agglomeration, as illustrated for the components 1, 2 and 5 in Figure 5-33.
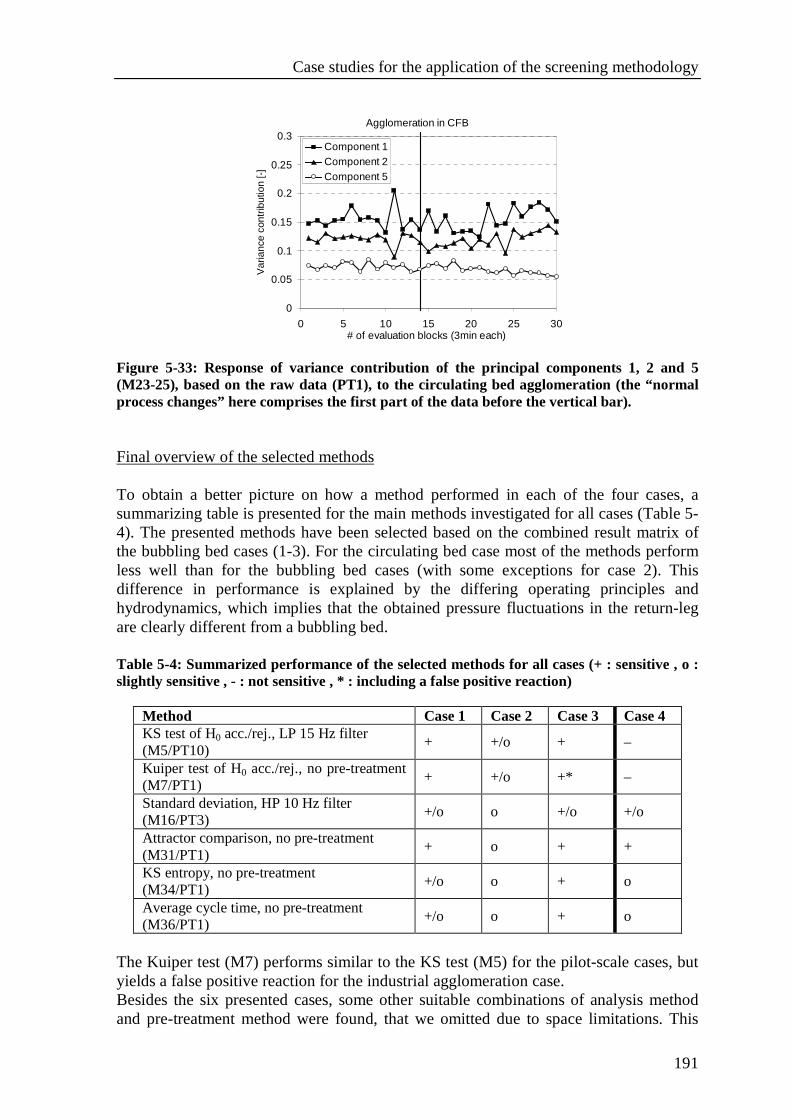
Case studies for the application of the screening methodology
191
Agglomeration in CFB
0
0.05
0.1
0.15
0.2
0.25
0.3
0 5 10 15 20 25 30# of evaluation blocks (3min each)
Var
ianc
e co
ntrib
utio
n [-
]
Component 1Component 2Component 5
Figure 5-33: Response of variance contribution of the principal components 1, 2 and 5 (M23-25), based on the raw data (PT1), to the circulating bed agglomeration (the “normal process changes” here comprises the first part of the data before the vertical bar). Final overview of the selected methods To obtain a better picture on how a method performed in each of the four cases, a summarizing table is presented for the main methods investigated for all cases (Table 5-4). The presented methods have been selected based on the combined result matrix of the bubbling bed cases (1-3). For the circulating bed case most of the methods perform less well than for the bubbling bed cases (with some exceptions for case 2). This difference in performance is explained by the differing operating principles and hydrodynamics, which implies that the obtained pressure fluctuations in the return-leg are clearly different from a bubbling bed. Table 5-4: Summarized performance of the selected methods for all cases (+ : sensitive , o : slightly sensitive , - : not sensitive , * : including a false positive reaction)
Method Case 1 Case 2 Case 3 Case 4 KS test of H0 acc./rej., LP 15 Hz filter (M5/PT10)
+ +/o + –
Kuiper test of H0 acc./rej., no pre-treatment (M7/PT1)
+ +/o +* –
Standard deviation, HP 10 Hz filter (M16/PT3)
+/o o +/o +/o
Attractor comparison, no pre-treatment (M31/PT1)
+ o + +
KS entropy, no pre-treatment (M34/PT1)
+/o o + o
Average cycle time, no pre-treatment (M36/PT1)
+/o o + o
The Kuiper test (M7) performs similar to the KS test (M5) for the pilot-scale cases, but yields a false positive reaction for the industrial agglomeration case. Besides the six presented cases, some other suitable combinations of analysis method and pre-treatment method were found, that we omitted due to space limitations. This
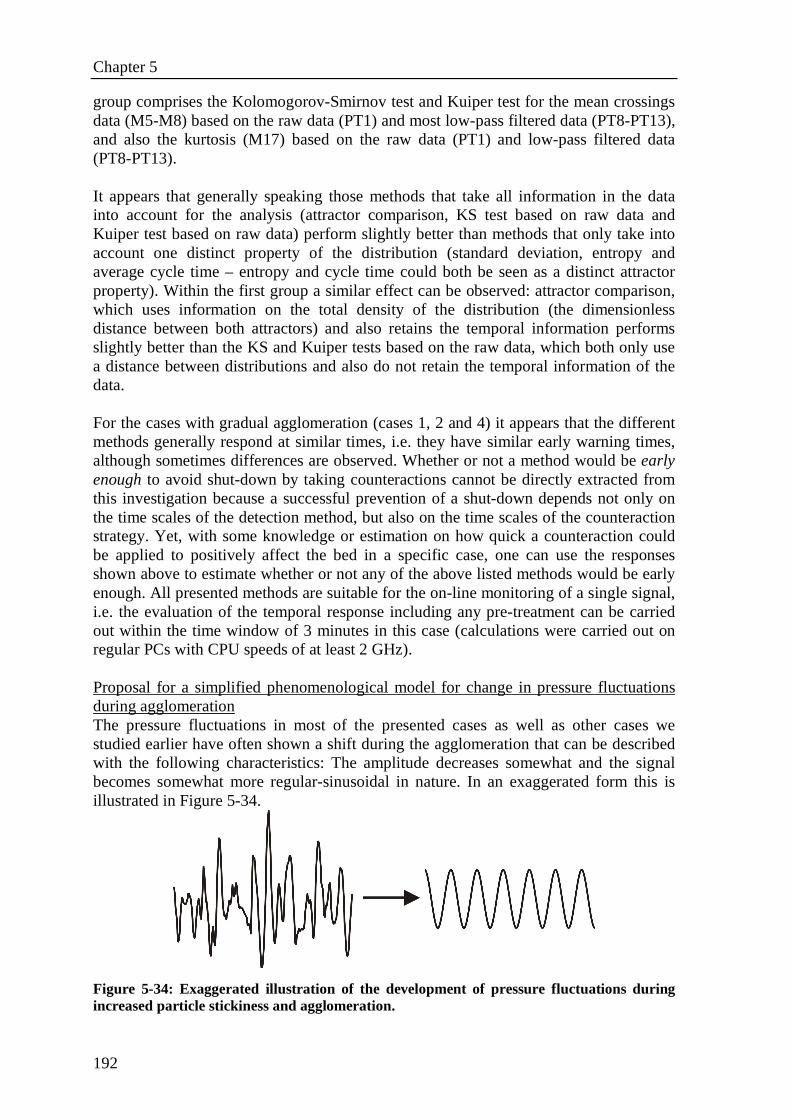
Chapter 5
192
group comprises the Kolomogorov-Smirnov test and Kuiper test for the mean crossings data (M5-M8) based on the raw data (PT1) and most low-pass filtered data (PT8-PT13), and also the kurtosis (M17) based on the raw data (PT1) and low-pass filtered data (PT8-PT13). It appears that generally speaking those methods that take all information in the data into account for the analysis (attractor comparison, KS test based on raw data and Kuiper test based on raw data) perform slightly better than methods that only take into account one distinct property of the distribution (standard deviation, entropy and average cycle time – entropy and cycle time could both be seen as a distinct attractor property). Within the first group a similar effect can be observed: attractor comparison, which uses information on the total density of the distribution (the dimensionless distance between both attractors) and also retains the temporal information performs slightly better than the KS and Kuiper tests based on the raw data, which both only use a distance between distributions and also do not retain the temporal information of the data. For the cases with gradual agglomeration (cases 1, 2 and 4) it appears that the different methods generally respond at similar times, i.e. they have similar early warning times, although sometimes differences are observed. Whether or not a method would be early enough to avoid shut-down by taking counteractions cannot be directly extracted from this investigation because a successful prevention of a shut-down depends not only on the time scales of the detection method, but also on the time scales of the counteraction strategy. Yet, with some knowledge or estimation on how quick a counteraction could be applied to positively affect the bed in a specific case, one can use the responses shown above to estimate whether or not any of the above listed methods would be early enough. All presented methods are suitable for the on-line monitoring of a single signal, i.e. the evaluation of the temporal response including any pre-treatment can be carried out within the time window of 3 minutes in this case (calculations were carried out on regular PCs with CPU speeds of at least 2 GHz). Proposal for a simplified phenomenological model for change in pressure fluctuations during agglomeration The pressure fluctuations in most of the presented cases as well as other cases we studied earlier have often shown a shift during the agglomeration that can be described with the following characteristics: The amplitude decreases somewhat and the signal becomes somewhat more regular-sinusoidal in nature. In an exaggerated form this is illustrated in Figure 5-34.
Figure 5-34: Exaggerated illustration of the development of pressure fluctuations during increased particle stickiness and agglomeration.
Case studies for the application of the screening methodology
193
The phenomenon of decreased signal amplitude for developing agglomeration in fluidized beds has been reported in the literature, e.g. expressed by the standard deviation [8] or the variance [7]. The relatively strongly decreased amplitude especially of the high frequency components has been suggested by Briens et al. [13]. This simplified model view overall corresponds, with some exceptions, with the suitable methods that emerge from the combined matrix: • The standard deviation normally shows a decreasing response to agglomeration.
However, the standard deviation is not directly suitable for agglomeration detection due to its sensitivity to gas velocity changes. The standard deviation of the high-frequent part of the signal (obtained by high-pass filtering) generally also shows a response, but is less sensitive towards gas velocity changes.
• The power spectrum of the pressure fluctuations confirms the proposed model for the industrial agglomeration case: there is an increase in the dominating frequency around 2 Hz. The power at lower frequencies remains relatively constant, the power at higher frequency decreases with increasing frequency. For the water spraying the power decreased for all frequencies, however, the decrease was clearly less in the low-frequency region (about 0-5 Hz) compared to the higher frequencies. For the sugar solution spraying the power remained constant in the lower frequency region and decreased in the higher frequency regions. All these cases point towards the phenomenon that the high-frequency components are more strongly attenuated during agglomeration than low-frequency components of the pressure fluctuations.
• The average cycle time (ACT) is increasing, i.e. less crossings of zero occur as the high-frequency components are decreased. At the same time the KS entropy is decreasing. Van der Schaaf et al. [11] have shown that entropy and average cycle time are inversely proportional for different fluidized bed systems.
• The variance contribution of the different principal components shows a clear shift towards more variability of the signal being explained by the lower components for the industrial agglomeration case, but no clear shift for the other cases; the reason for this difference is not clear. The correlation dimension, a measure for the dimensionality or degrees of freedom of a system, decreases for the water spraying but shows no clear trend in the other cases. Both examples show that the signal complexity/dimensionality can decrease, but this is not necessarily always the case.
5.6. Conclusions Several case studies were presented that illustrate the use and benefit of a newly developed screening methodology (chapter 4). The goal of this methodology is to efficiently identify suitable methods for monitoring multiphase reactor hydrodynamics. This is done by screening different signal analysis methods and assessing them for their sensitivity, but also selectivity to detect specific hydrodynamic changes. The case studies presented here focus on the detection of agglomeration in fluidized beds. The overall result matrix illustrates the selectivity index f, a performance measure for each combination of signal pre-treatment and analysis method, with the help of coloured tiles. This matrix yields a convenient overview of the performance of combinations of pre-treatment and analysis method, from which optimal combination were successfully identified for each specific case. Combinations are considered suitable if they have a
Chapter 5
194
high selectivity index and in case of pre-treatment also high selectivity indices in the horizontal vicinity; if pre-treatment is not yielding any clear advantage the raw data are preferred. The responses of the different pre-treatment / analysis methods to agglomeration as well as changes in gas velocity and bed mass are illustrated to show the characteristics of the method (step-change vs. gradual response character). Pre-treatment of the data often does not yield a big advantage; especially the analysis based on low-pass filtered data is often similar to the analysis based on the raw data. However, in some specific cases, pre-treatment significantly improves the response (e.g. high-pass filtering for the standard deviation). Moreover, wavelet filters are often only suitable for a specific decomposition level. Although they can improve the response, they bear the potential danger of choosing the “wrong” decomposition level with a significantly worse response, and therefore are considered less robust. The methodology can be applied to find methods suitable for one specific process. When searching for methods that are more universally applicable for different agglomeration processes and reactor scales, one can choose to combine the result-matrices from different cases. Carrying out this combination by averaging we have identified several suitable methods for the given cases and have shown their temporal response to the individual cases. Specifically for agglomeration in bubbling beds we found several methods suitable, among which the Kolmogorov-Smirnov test based on the mean crossing data with a 15 Hz low-pass filter, the Kuiper test based on the mean crossing data, the standard deviation with a 10 Hz high-pass filter, attractor comparison, Kolmogorov-Sinai entropy, and average cycle time. A simplified phenomenological model is proposed for the changes in the pressure fluctuations for developing agglomeration in bubbling beds. The basic characteristics of this model comprise a reduction in amplitude, especially of the higher frequency components, an increase in average cycle time (and decreased entropy) and sometimes a decrease of dimensionality/complexity.
5.7. Acknowledgements Peter Verheijen (Delft University of Technology) is gratefully acknowledged for his helpful comments in the development of this work.
5.8. References [1] Kunii D, Levenspiel O. “Fluidization Engineering”, Butterworth-Heinemann Ltd,
USA, 1991 [2] Öhman M, Nordin A, Skrifvars B-J, Backman R, Hupa M. Bed Agglomeration
Characteristics during Fluidized Bed Combustion of Biomass Fuels. Energy & Fuels 2000;14(1):169-178
[3] Chaplin G, Pugsley T, Winters C. The S-statistic as an early warning of entrainment in a fluidized bed dryer containing pharmaceutical granule. Powder Technology 2005,149(2-3),148-156
[4] Korbee R, Lensselink J, van Ommen JR, Nijenhuis J, van Gemert M, Haasnoot K. Early Agglomeration Recognition System - EARS: From bench-scale testing to industrial prototype. ECN (Energy research Centre of the Netherlands) report ECN-C--04-052 (2004)
Case studies for the application of the screening methodology
195
[5] Nijenhuis J, Korbee R, Lensselink J, Kiel JHA, van Ommen JR. A method for agglomeration detection and control in full-scale biomass fired fluidized beds. Chemical Engineering Science 2007;62(1-2):644-54
[6] Press WH, Teukolsky SA, Vetterling WT, Flannery BP. “Numerical Recipes in C : The Art of Scientific Computing, 2nd Ed., Cambridge University Press, UK, 1992
[7] Chrione R, Miccio F, Scala F. Mechanism and prediction of bed agglomeration during fluidized bed combustion of a biomass fuel: Effect of the reactor scale. Chemical Engineering Journal 2006;123(3):71-80
[8] van Ommen JR, Schouten JC, van den Bleek CM. An Early-Warning-Method for Detecting Bed agglomeration in Fluidized Bed Combustors. Paper No. FBC99-0150, Proc. 15th Int. Conf. on Fluidized Bed Combustion 1999, R. B. Reuther, ed., ASME, New York
[9] van Ommen JR, Coppens M-O, van den Bleek CM, Schouten JC. Early Warning of agglomeration in Fluidized Beds by Attractor Comparison, AIChE Journal 2000;46:2183-2197
[10] Kantz, H. Schreiber, T., “Nonlinear Time Series Analysis”, Cambridge University Press, UK, 2000
[11] van der Schaaf J, van Ommen JR, Takens F, Schouten JC, van den Bleek CM. Similarity between chaos analysis and frequency analysis of pressure fluctuations in fluidized beds. Chemical Engineering Science 2004;59(8-9):1829-1840
[12] Carlson GE. “Signal and Linear System Analysis”, John Wiley & Sons, Inc., New York, 1998
[13] Briens C, McDougall S, Chan E. On-line detection of bed fluidity in a fluidized bed coker. Powder Technology 2003;138(2-3):160-168
5.9. Appendix For an overview of all applied pre-treatment methods and analysis methods see the appendix of chapter 4.

196
197
Chapter 6
Detecting and counteracting agglomeration in fluidized bed biomass combustion
The detection of agglomeration was the focus of the previous chapters, investigating the applicability of the attractor comparison method in circulating fluidized beds and screening other signal analysis methods for their suitability as an agglomeration detection tool. Once agglomeration is successfully detected, the necessary subsequent step is to apply counteractions to avoid further agglomeration, defluidization of the bed and ultimately shut-down of the installation. In this chapter different counteractions are assessed in terms of their suitability to avoid defluidization and ensure continuous operation. This assessment is done using the attractor comparison method. Furthermore, it is investigated whether the attractor comparison method is detecting the agglomeration early enough to avoid defluidization. The experimental work has been carried out on both a lab-scale and a pilot-scale bubbling fluidized bed installation. This chapter has been submitted for publication: Malte Bartels, John Nijenhuis, Jasper Lensselink, Marcin Siedlecki, Wiebren de Jong, Freek Kapteijn, J. Ruud van Ommen. Detecting and counteracting agglomeration in fluidized bed biomass combustion. Energy & Fuels (2008)
Chapter 6
198
6.1. Abstract Agglomeration in fluidized bed combustion can be a big operational problem, leading to unwanted defluidization and shut-down of the installation. Therefore, the onset of such events has to be reliably detected in an early stage and combined with counteractions to avoid further agglomeration and defluidization. The suitability of the attractor comparison method to detect agglomeration in combination with different counteraction strategies is investigated on a lab-scale (~1 kWth) and a small commercial-scale scale (~1 MWth) fluidized bed combustor. The agglomeration characteristics and the time until defluidization occurs can vary considerably depending on scale and process conditions, but also for similar operating conditions on the same scale. In all cases attractor comparison has shown to detect the approach of defluidization early enough to prevent defluidization if a suitable counteraction strategy is applied. A temporary increase of fluidization velocity to promote agglomerate break-up is not a useful method to avoid agglomeration on lab-scale. A decrease in operating temperature below the melting points of potassium silicates can be a successful emergency strategy to ensure continued trouble-free operation. However, a subsequent temperature increase leads to further agglomeration, potentially very rapid, with alkali still present in the bed; therefore some strategy to replace the bed content or neutralize the alkali is necessary. Semi-continuous replacement of bed material is shown to be a successful permanent solution to avoid defluidization. Yet, its application requires careful economic consideration. For larger reactor scales agglomeration can occur more localized, which justifies several measuring positions. Especially for monitoring transition regions, e.g. start-up, the application of a moving reference that has a constant negative time offset to the evaluation window is advantageous.
6.2. Introduction Fluidized bed energy conversion and agglomeration Fluidized bed conversion (combustion and gasification) of carbonaceous solid material (e.g. coal, biomass and waste) at high temperatures is industrial practice to generate steam, electricity and syngas. The solid fuel is added to the fluidized bed of inert solid material, which acts as a heat reservoir. Silica sand is most commonly used as bed material. The actual amount of the fuel itself in the bed as compared to the inert bed material is relatively low, in the order of a few percent. The fluidized bed ensures good mixing of the fuel, which is continuously fed, as well as a good distribution of the produced heat. The resulting homogeneous temperature distribution is one of the important advantages of fluidized beds over other reactor concepts. Moreover, fluidized beds have the advantage of being flexible for a variety of fuels, see e.g. [1]. Despite its broad application, solid fuel conversion in fluidized bed processes is still struggling with technical difficulties. Agglomeration can be a major operational problem; its mechanisms are reviewed in e.g. [2]. Inorganic alkali components from the fuel, mainly potassium (K) and sodium (Na), can be a source for agglomeration due to the formation of low-melting silicates with the silica from the bed material. At common
Counteracting agglomeration in biomass combustion
199
operating temperatures, often around 850°C, the sand/ash particles can then get covered with an adhesive layer of molten alkali silicates and subsequently form larger agglomerates due to the formation of permanent bonds upon collisions. If this process is not recognized, it eventually propagates to partial or total defluidization of the bed, which in turn results in a lengthy and expensive unscheduled shutdown of the installation. Biomass as a feedstock for energy conversion has received considerable attention as it is CO2-neutral and often widely available. However, the alkali content can vary considerably between different fuels. Especially for certain types of biomass, often cheap agricultural residues, as well as some low-rank coal types the alkali content is often rather high. The wider application of biomass fuels in fluidized beds can be jeopardized for this reason. Reliable operation has to be ensured in industrial practice to make the use of biomass more attractive and acceptable. Agglomeration detection Detection methods for agglomeration can be based on different types of measurements, but especially for industrial fluidized beds the measurement of pressure is one of the most suitable options [3]. Relatively simple analysis methods such as the average pressure drop over the bed (e.g. [4]) or standard deviation and variance (e.g. [5]) have been applied. However, they are not considered suitable as they often react ambiguously, only detect agglomeration at a very late stage before actual defluidization or are too cross-sensitive to other process changes, i.e. producing false alarms. High-frequency pressure fluctuation measurements have been shown to be viable for further analysis, as they contain information about the hydrodynamics of the bed [6]. They can therefore be useful for the detection of events, such as agglomeration, via the detection of their precursors. Attractor comparison [7] has been developed specifically for agglomeration detection and is based on pressure fluctuation measurements in the bed. The principle of this method consists of reconstructing and comparing attractors. An attractor is the collection of points that results from projection of consecutive points from a pressure-time series into an n-dimensional state space. One first records a reference (well-fluidized) operating state of the bed from which a reference attractor is generated. Subsequently, the attractor of the current operating state is reconstructed and compared to the reference attractor. This comparison is based on a statistical test [8] that evaluates the dimensionless squared distance S between two attractors. S has an expectation of 0 and a standard deviation of 1 for stationary hydrodynamics. S-values larger than 3 indicate with more than 95% confidence that the hydrodynamics have significantly changed, e.g. due to agglomeration. Attractor comparison has been applied for early agglomeration detection on lab-scale and industrial scale and has shown to be suitable as an early warning tool in fluidized bed agglomeration [9]. The method has shown to be insensitive (S-value < 3) for relative changes of less than approx. 10% in gas flow and bed mass, which is important in light of avoiding false alarms due to common process fluctuations. Agglomeration counteractions Methods for counteracting agglomeration are often designed for implementation in existing processes. They can be distinguished into operational actions, utilization of additives fed to the process and alternative bed materials. Operational strategies can involve drastic measures to avoid shutdowns in urgent cases, such as a strong temperature decrease (e.g. [10]) or stopping the fuel feed (e.g. [11]).
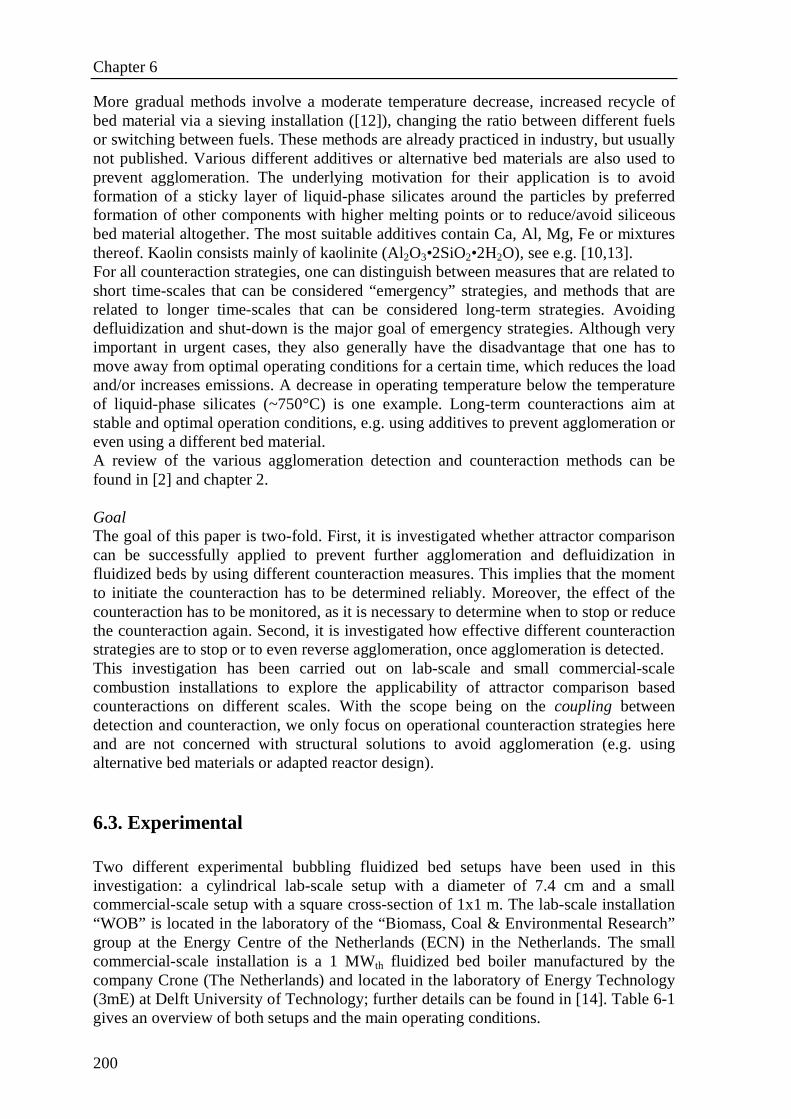
Chapter 6
200
More gradual methods involve a moderate temperature decrease, increased recycle of bed material via a sieving installation ([12]), changing the ratio between different fuels or switching between fuels. These methods are already practiced in industry, but usually not published. Various different additives or alternative bed materials are also used to prevent agglomeration. The underlying motivation for their application is to avoid formation of a sticky layer of liquid-phase silicates around the particles by preferred formation of other components with higher melting points or to reduce/avoid siliceous bed material altogether. The most suitable additives contain Ca, Al, Mg, Fe or mixtures thereof. Kaolin consists mainly of kaolinite (Al2O3•2SiO2•2H2O), see e.g. [10,13]. For all counteraction strategies, one can distinguish between measures that are related to short time-scales that can be considered “emergency” strategies, and methods that are related to longer time-scales that can be considered long-term strategies. Avoiding defluidization and shut-down is the major goal of emergency strategies. Although very important in urgent cases, they also generally have the disadvantage that one has to move away from optimal operating conditions for a certain time, which reduces the load and/or increases emissions. A decrease in operating temperature below the temperature of liquid-phase silicates (~750°C) is one example. Long-term counteractions aim at stable and optimal operation conditions, e.g. using additives to prevent agglomeration or even using a different bed material. A review of the various agglomeration detection and counteraction methods can be found in [2] and chapter 2. Goal The goal of this paper is two-fold. First, it is investigated whether attractor comparison can be successfully applied to prevent further agglomeration and defluidization in fluidized beds by using different counteraction measures. This implies that the moment to initiate the counteraction has to be determined reliably. Moreover, the effect of the counteraction has to be monitored, as it is necessary to determine when to stop or reduce the counteraction again. Second, it is investigated how effective different counteraction strategies are to stop or to even reverse agglomeration, once agglomeration is detected. This investigation has been carried out on lab-scale and small commercial-scale combustion installations to explore the applicability of attractor comparison based counteractions on different scales. With the scope being on the coupling between detection and counteraction, we only focus on operational counteraction strategies here and are not concerned with structural solutions to avoid agglomeration (e.g. using alternative bed materials or adapted reactor design).
6.3. Experimental Two different experimental bubbling fluidized bed setups have been used in this investigation: a cylindrical lab-scale setup with a diameter of 7.4 cm and a small commercial-scale setup with a square cross-section of 1x1 m. The lab-scale installation “WOB” is located in the laboratory of the “Biomass, Coal & Environmental Research” group at the Energy Centre of the Netherlands (ECN) in the Netherlands. The small commercial-scale installation is a 1 MWth fluidized bed boiler manufactured by the company Crone (The Netherlands) and located in the laboratory of Energy Technology (3mE) at Delft University of Technology; further details can be found in [14]. Table 6-1 gives an overview of both setups and the main operating conditions.
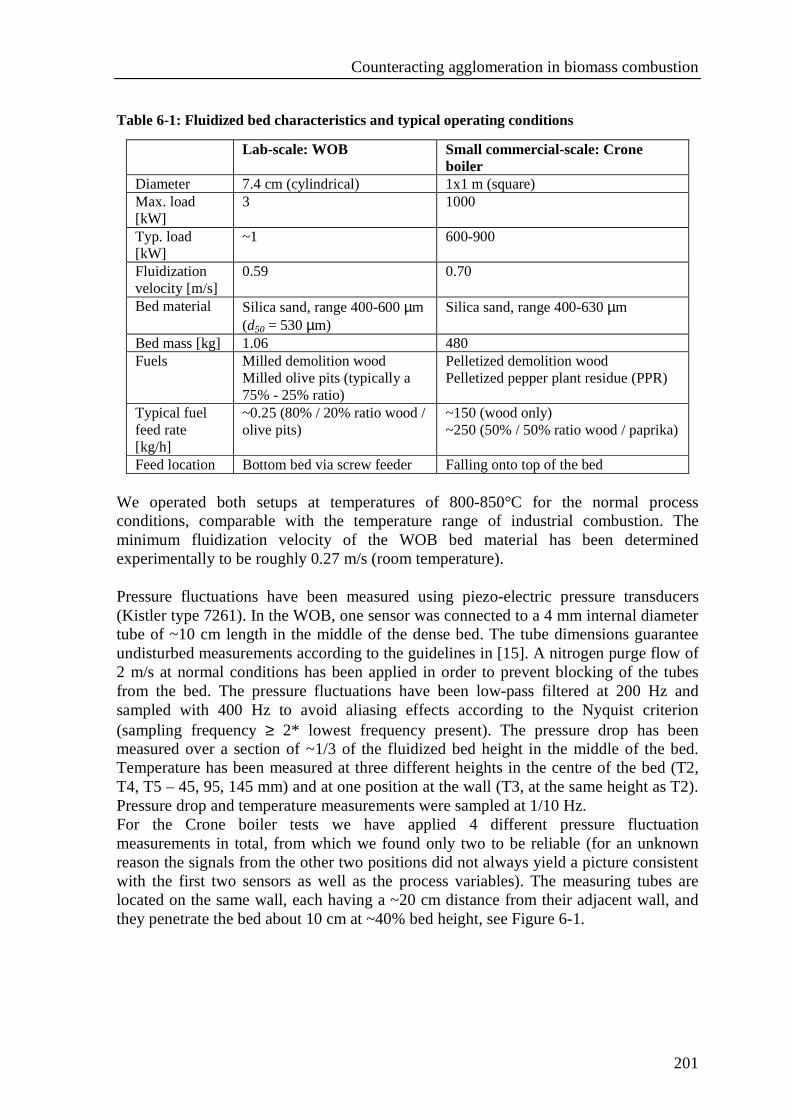
Counteracting agglomeration in biomass combustion
201
Table 6-1: Fluidized bed characteristics and typical operating conditions
Lab-scale: WOB Small commercial-scale: Crone boiler
Diameter 7.4 cm (cylindrical) 1x1 m (square) Max. load [kW]
3 1000
Typ. load [kW]
~1 600-900
Fluidization velocity [m/s]
0.59 0.70
Bed material Silica sand, range 400-600 µm (d50 = 530 µm)
Silica sand, range 400-630 µm
Bed mass [kg] 1.06 480 Fuels Milled demolition wood
Milled olive pits (typically a 75% - 25% ratio)
Pelletized demolition wood Pelletized pepper plant residue (PPR)
Typical fuel feed rate [kg/h]
~0.25 (80% / 20% ratio wood / olive pits)
~150 (wood only) ~250 (50% / 50% ratio wood / paprika)
Feed location Bottom bed via screw feeder Falling onto top of the bed We operated both setups at temperatures of 800-850°C for the normal process conditions, comparable with the temperature range of industrial combustion. The minimum fluidization velocity of the WOB bed material has been determined experimentally to be roughly 0.27 m/s (room temperature). Pressure fluctuations have been measured using piezo-electric pressure transducers (Kistler type 7261). In the WOB, one sensor was connected to a 4 mm internal diameter tube of ~10 cm length in the middle of the dense bed. The tube dimensions guarantee undisturbed measurements according to the guidelines in [15]. A nitrogen purge flow of 2 m/s at normal conditions has been applied in order to prevent blocking of the tubes from the bed. The pressure fluctuations have been low-pass filtered at 200 Hz and sampled with 400 Hz to avoid aliasing effects according to the Nyquist criterion (sampling frequency ≥ 2* lowest frequency present). The pressure drop has been measured over a section of ~1/3 of the fluidized bed height in the middle of the bed. Temperature has been measured at three different heights in the centre of the bed (T2, T4, T5 – 45, 95, 145 mm) and at one position at the wall (T3, at the same height as T2). Pressure drop and temperature measurements were sampled at 1/10 Hz. For the Crone boiler tests we have applied 4 different pressure fluctuation measurements in total, from which we found only two to be reliable (for an unknown reason the signals from the other two positions did not always yield a picture consistent with the first two sensors as well as the process variables). The measuring tubes are located on the same wall, each having a ~20 cm distance from their adjacent wall, and they penetrate the bed about 10 cm at ~40% bed height, see Figure 6-1.
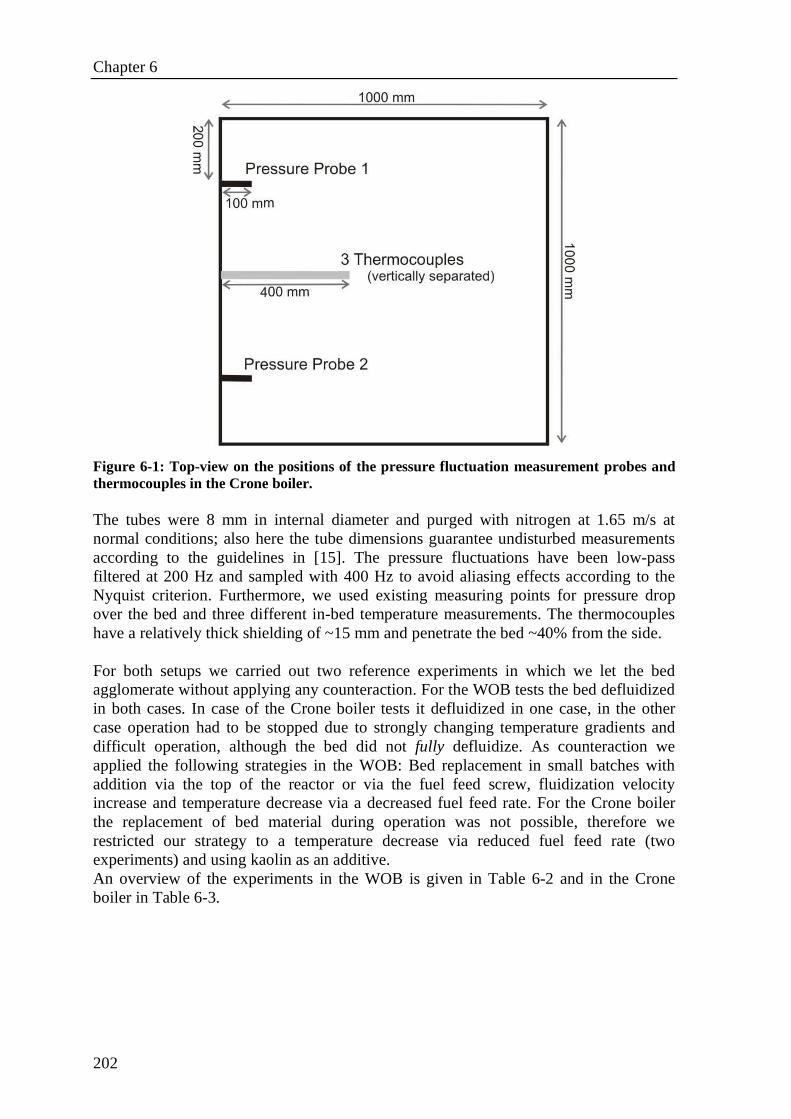
Chapter 6
202
Figure 6-1: Top-view on the positions of the pressure fluctuation measurement probes and thermocouples in the Crone boiler. The tubes were 8 mm in internal diameter and purged with nitrogen at 1.65 m/s at normal conditions; also here the tube dimensions guarantee undisturbed measurements according to the guidelines in [15]. The pressure fluctuations have been low-pass filtered at 200 Hz and sampled with 400 Hz to avoid aliasing effects according to the Nyquist criterion. Furthermore, we used existing measuring points for pressure drop over the bed and three different in-bed temperature measurements. The thermocouples have a relatively thick shielding of ~15 mm and penetrate the bed ~40% from the side. For both setups we carried out two reference experiments in which we let the bed agglomerate without applying any counteraction. For the WOB tests the bed defluidized in both cases. In case of the Crone boiler tests it defluidized in one case, in the other case operation had to be stopped due to strongly changing temperature gradients and difficult operation, although the bed did not fully defluidize. As counteraction we applied the following strategies in the WOB: Bed replacement in small batches with addition via the top of the reactor or via the fuel feed screw, fluidization velocity increase and temperature decrease via a decreased fuel feed rate. For the Crone boiler the replacement of bed material during operation was not possible, therefore we restricted our strategy to a temperature decrease via reduced fuel feed rate (two experiments) and using kaolin as an additive. An overview of the experiments in the WOB is given in Table 6-2 and in the Crone boiler in Table 6-3.
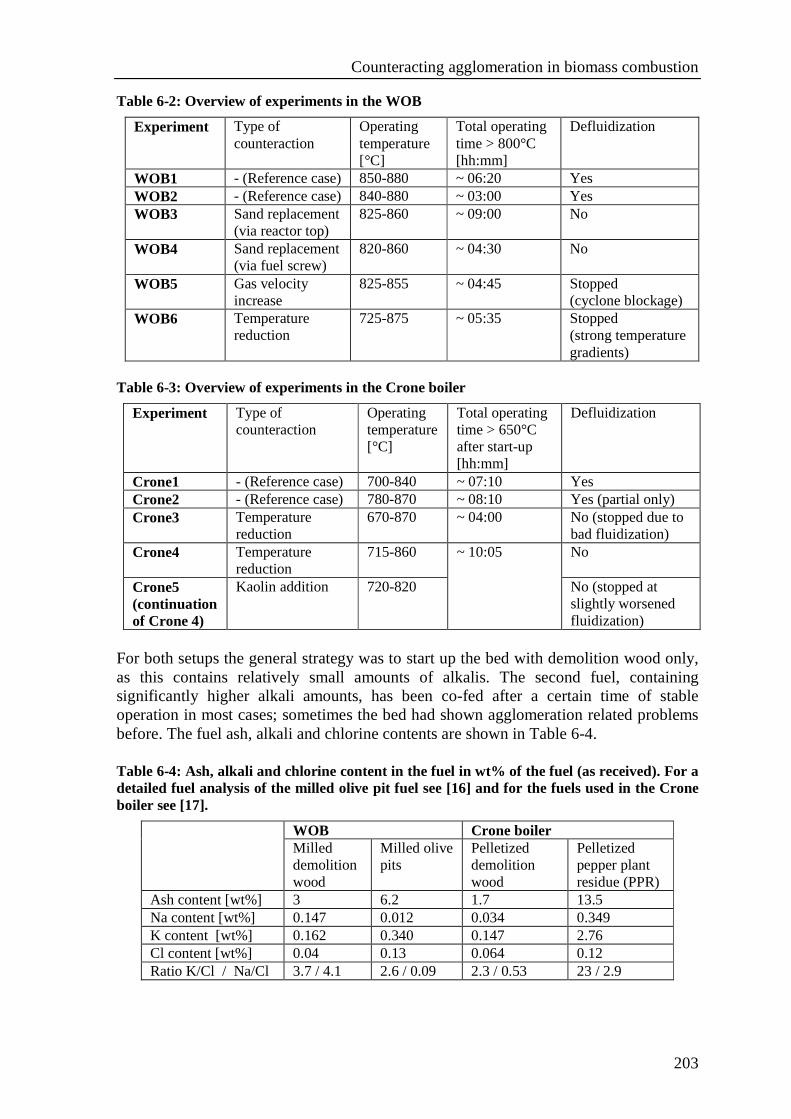
Counteracting agglomeration in biomass combustion
203
Table 6-2: Overview of experiments in the WOB
Table 6-3: Overview of experiments in the Crone boiler
For both setups the general strategy was to start up the bed with demolition wood only, as this contains relatively small amounts of alkalis. The second fuel, containing significantly higher alkali amounts, has been co-fed after a certain time of stable operation in most cases; sometimes the bed had shown agglomeration related problems before. The fuel ash, alkali and chlorine contents are shown in Table 6-4. Table 6-4: Ash, alkali and chlorine content in the fuel in wt% of the fuel (as received). For a detailed fuel analysis of the milled olive pit fuel see [16] and for the fuels used in the Crone boiler see [17].
WOB Crone boiler Milled demolition wood
Milled olive pits
Pelletized demolition wood
Pelletized pepper plant residue (PPR)
Ash content [wt%] 3 6.2 1.7 13.5 Na content [wt%] 0.147 0.012 0.034 0.349 K content [wt%] 0.162 0.340 0.147 2.76 Cl content [wt%] 0.04 0.13 0.064 0.12 Ratio K/Cl / Na/Cl 3.7 / 4.1 2.6 / 0.09 2.3 / 0.53 23 / 2.9
Experiment Type of counteraction
Operating temperature [°C]
Total operating time > 800°C [hh:mm]
Defluidization
WOB1 - (Reference case) 850-880 ~ 06:20 Yes WOB2 - (Reference case) 840-880 ~ 03:00 Yes WOB3 Sand replacement
(via reactor top) 825-860 ~ 09:00 No
WOB4 Sand replacement (via fuel screw)
820-860 ~ 04:30 No
WOB5 Gas velocity increase
825-855 ~ 04:45 Stopped (cyclone blockage)
WOB6 Temperature reduction
725-875 ~ 05:35 Stopped (strong temperature gradients)
Experiment Type of counteraction
Operating temperature [°C]
Total operating time > 650°C after start-up [hh:mm]
Defluidization
Crone1 - (Reference case) 700-840 ~ 07:10 Yes Crone2 - (Reference case) 780-870 ~ 08:10 Yes (partial only) Crone3 Temperature
reduction 670-870 ~ 04:00 No (stopped due to
bad fluidization) Crone4 Temperature
reduction 715-860 No
Crone5 (continuation of Crone 4)
Kaolin addition 720-820
~ 10:05
No (stopped at slightly worsened fluidization)
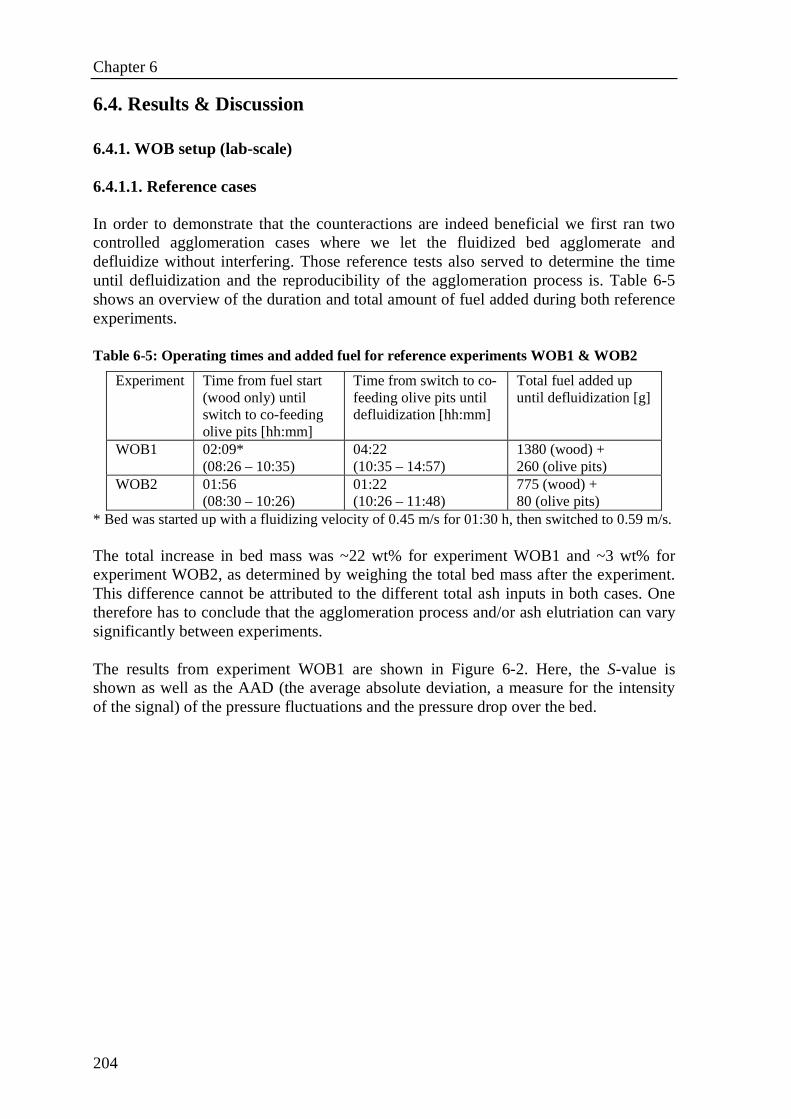
Chapter 6
204
6.4. Results & Discussion 6.4.1. WOB setup (lab-scale) 6.4.1.1. Reference cases In order to demonstrate that the counteractions are indeed beneficial we first ran two controlled agglomeration cases where we let the fluidized bed agglomerate and defluidize without interfering. Those reference tests also served to determine the time until defluidization and the reproducibility of the agglomeration process is. Table 6-5 shows an overview of the duration and total amount of fuel added during both reference experiments. Table 6-5: Operating times and added fuel for reference experiments WOB1 & WOB2
Experiment Time from fuel start (wood only) until switch to co-feeding olive pits [hh:mm]
Time from switch to co-feeding olive pits until defluidization [hh:mm]
Total fuel added up until defluidization [g]
WOB1 02:09* (08:26 – 10:35)
04:22 (10:35 – 14:57)
1380 (wood) + 260 (olive pits)
WOB2 01:56 (08:30 – 10:26)
01:22 (10:26 – 11:48)
775 (wood) + 80 (olive pits)
* Bed was started up with a fluidizing velocity of 0.45 m/s for 01:30 h, then switched to 0.59 m/s. The total increase in bed mass was ~22 wt% for experiment WOB1 and ~3 wt% for experiment WOB2, as determined by weighing the total bed mass after the experiment. This difference cannot be attributed to the different total ash inputs in both cases. One therefore has to conclude that the agglomeration process and/or ash elutriation can vary significantly between experiments. The results from experiment WOB1 are shown in Figure 6-2. Here, the S-value is shown as well as the AAD (the average absolute deviation, a measure for the intensity of the signal) of the pressure fluctuations and the pressure drop over the bed.
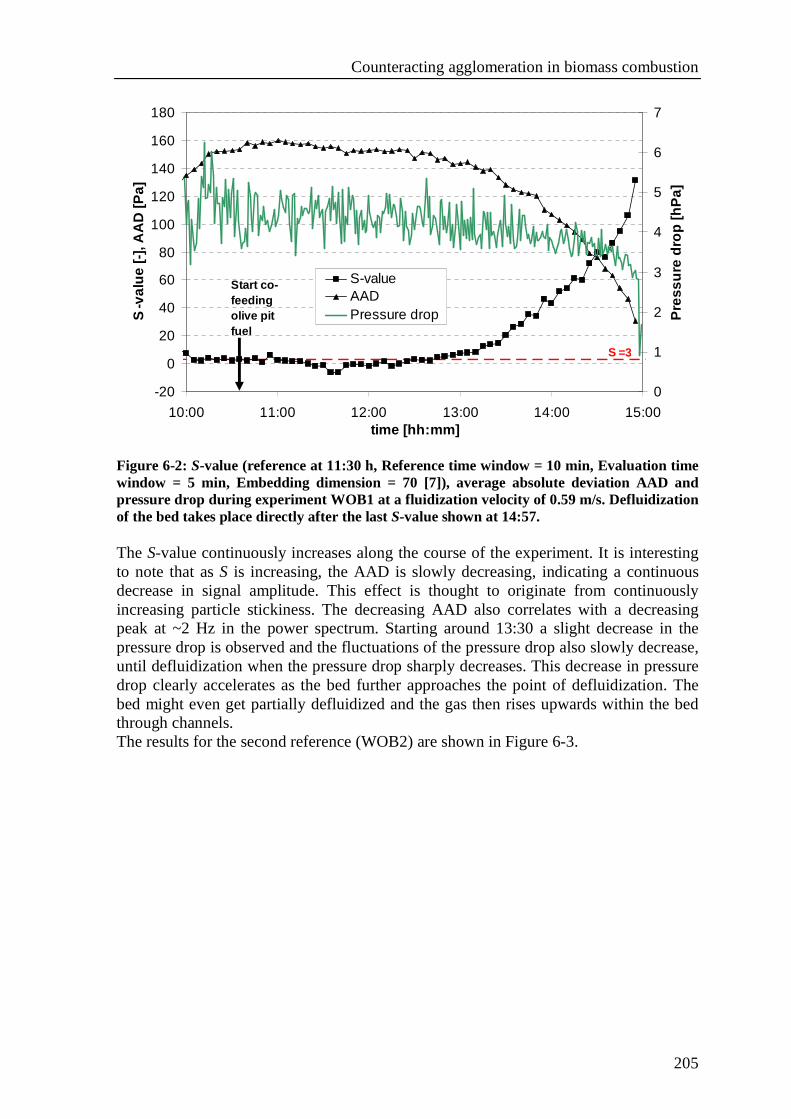
Counteracting agglomeration in biomass combustion
205
-20
0
20
40
60
80
100
120
140
160
180
10:00 11:00 12:00 13:00 14:00 15:00time [hh:mm]
S-v
alue
[-],
AA
D [P
a]
0
1
2
3
4
5
6
7
Pre
ssur
e dr
op [h
Pa]
S-valueAADPressure drop
S =3
Start co-feeding olive pit fuel
Figure 6-2: S-value (reference at 11:30 h, Reference time window = 10 min, Evaluation time window = 5 min, Embedding dimension = 70 [7]), average absolute deviation AAD and pressure drop during experiment WOB1 at a fluidization velocity of 0.59 m/s. Defluidization of the bed takes place directly after the last S-value shown at 14:57. The S-value continuously increases along the course of the experiment. It is interesting to note that as S is increasing, the AAD is slowly decreasing, indicating a continuous decrease in signal amplitude. This effect is thought to originate from continuously increasing particle stickiness. The decreasing AAD also correlates with a decreasing peak at ~2 Hz in the power spectrum. Starting around 13:30 a slight decrease in the pressure drop is observed and the fluctuations of the pressure drop also slowly decrease, until defluidization when the pressure drop sharply decreases. This decrease in pressure drop clearly accelerates as the bed further approaches the point of defluidization. The bed might even get partially defluidized and the gas then rises upwards within the bed through channels. The results for the second reference (WOB2) are shown in Figure 6-3.
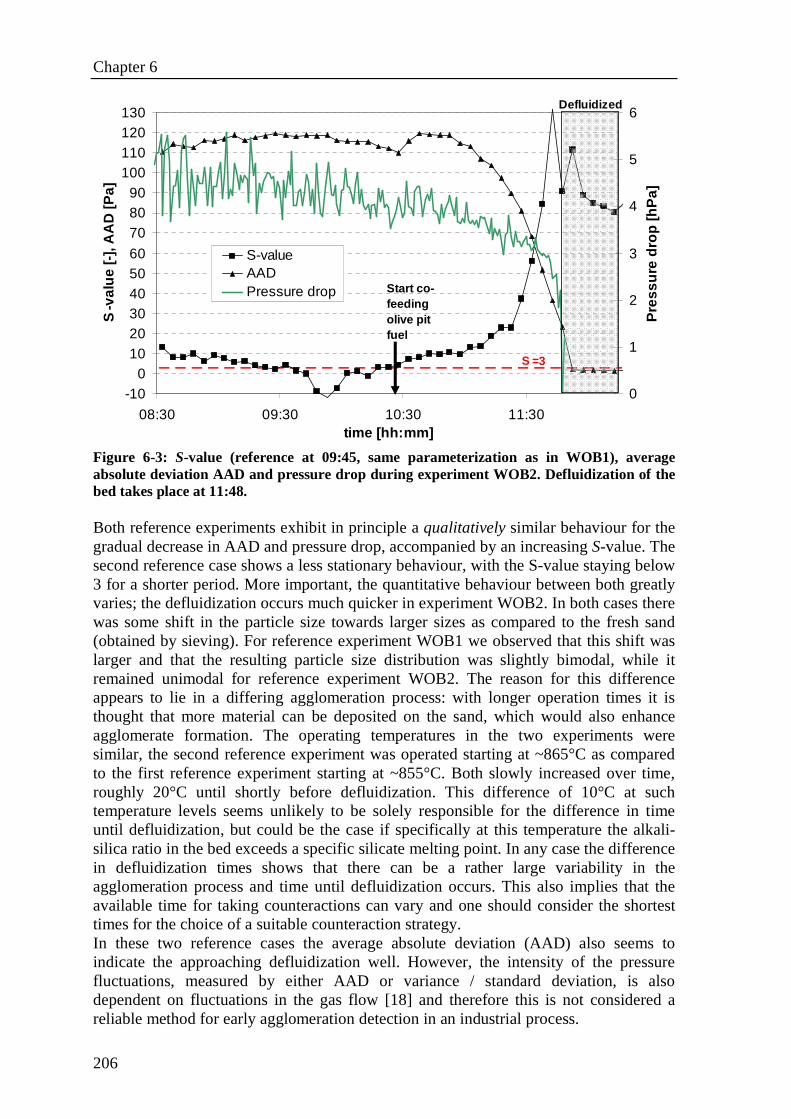
Chapter 6
206
-100
102030405060
708090
100110120130
08:30 09:30 10:30 11:30time [hh:mm]
S-v
alue
[-],
AA
D [P
a]
0
1
2
3
4
5
6
Pre
ssur
e dr
op [h
Pa]
S-valueAADPressure drop
S =3
Defluidized
Start co-feeding olive pit fuel
Figure 6-3: S-value (reference at 09:45, same parameterization as in WOB1), average absolute deviation AAD and pressure drop during experiment WOB2. Defluidization of the bed takes place at 11:48. Both reference experiments exhibit in principle a qualitatively similar behaviour for the gradual decrease in AAD and pressure drop, accompanied by an increasing S-value. The second reference case shows a less stationary behaviour, with the S-value staying below 3 for a shorter period. More important, the quantitative behaviour between both greatly varies; the defluidization occurs much quicker in experiment WOB2. In both cases there was some shift in the particle size towards larger sizes as compared to the fresh sand (obtained by sieving). For reference experiment WOB1 we observed that this shift was larger and that the resulting particle size distribution was slightly bimodal, while it remained unimodal for reference experiment WOB2. The reason for this difference appears to lie in a differing agglomeration process: with longer operation times it is thought that more material can be deposited on the sand, which would also enhance agglomerate formation. The operating temperatures in the two experiments were similar, the second reference experiment was operated starting at ~865°C as compared to the first reference experiment starting at ~855°C. Both slowly increased over time, roughly 20°C until shortly before defluidization. This difference of 10°C at such temperature levels seems unlikely to be solely responsible for the difference in time until defluidization, but could be the case if specifically at this temperature the alkali-silica ratio in the bed exceeds a specific silicate melting point. In any case the difference in defluidization times shows that there can be a rather large variability in the agglomeration process and time until defluidization occurs. This also implies that the available time for taking counteractions can vary and one should consider the shortest times for the choice of a suitable counteraction strategy. In these two reference cases the average absolute deviation (AAD) also seems to indicate the approaching defluidization well. However, the intensity of the pressure fluctuations, measured by either AAD or variance / standard deviation, is also dependent on fluctuations in the gas flow [18] and therefore this is not considered a reliable method for early agglomeration detection in an industrial process.
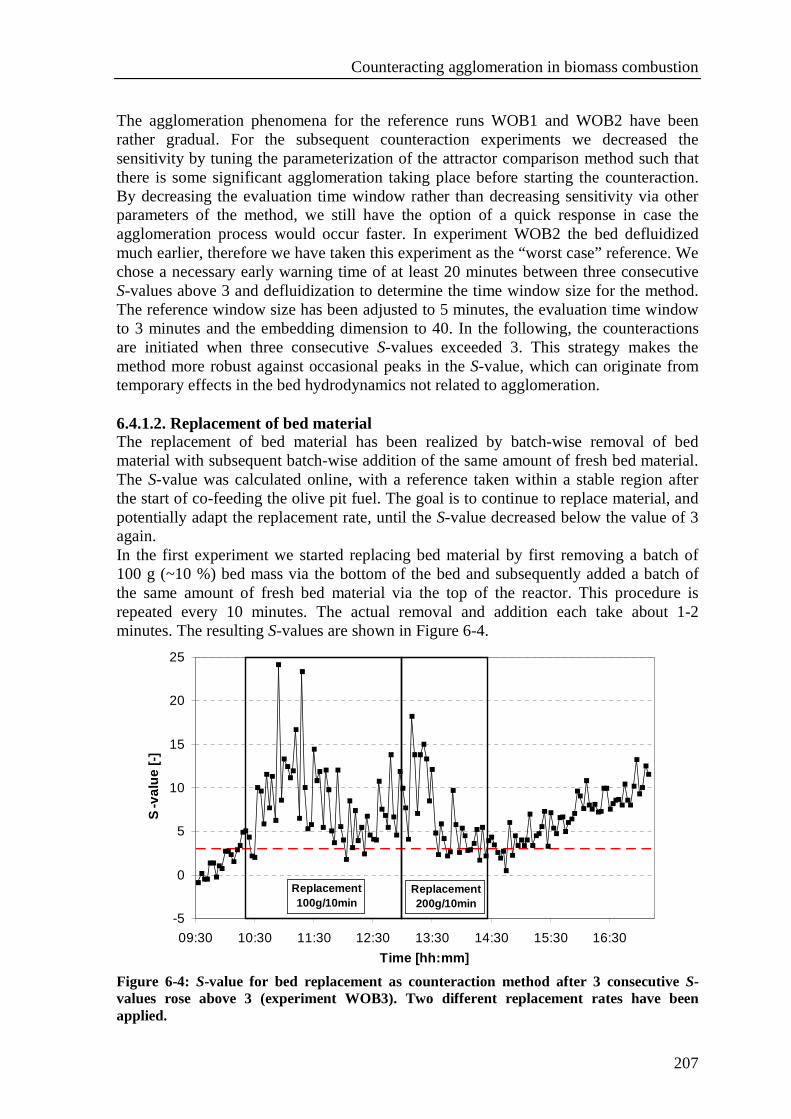
Counteracting agglomeration in biomass combustion
207
The agglomeration phenomena for the reference runs WOB1 and WOB2 have been rather gradual. For the subsequent counteraction experiments we decreased the sensitivity by tuning the parameterization of the attractor comparison method such that there is some significant agglomeration taking place before starting the counteraction. By decreasing the evaluation time window rather than decreasing sensitivity via other parameters of the method, we still have the option of a quick response in case the agglomeration process would occur faster. In experiment WOB2 the bed defluidized much earlier, therefore we have taken this experiment as the “worst case” reference. We chose a necessary early warning time of at least 20 minutes between three consecutive S-values above 3 and defluidization to determine the time window size for the method. The reference window size has been adjusted to 5 minutes, the evaluation time window to 3 minutes and the embedding dimension to 40. In the following, the counteractions are initiated when three consecutive S-values exceeded 3. This strategy makes the method more robust against occasional peaks in the S-value, which can originate from temporary effects in the bed hydrodynamics not related to agglomeration. 6.4.1.2. Replacement of bed material The replacement of bed material has been realized by batch-wise removal of bed material with subsequent batch-wise addition of the same amount of fresh bed material. The S-value was calculated online, with a reference taken within a stable region after the start of co-feeding the olive pit fuel. The goal is to continue to replace material, and potentially adapt the replacement rate, until the S-value decreased below the value of 3 again. In the first experiment we started replacing bed material by first removing a batch of 100 g (~10 %) bed mass via the bottom of the bed and subsequently added a batch of the same amount of fresh bed material via the top of the reactor. This procedure is repeated every 10 minutes. The actual removal and addition each take about 1-2 minutes. The resulting S-values are shown in Figure 6-4.
-5
0
5
10
15
20
25
09:30 10:30 11:30 12:30 13:30 14:30 15:30 16:30
Time [hh:mm]
S-v
alue
[-]
Replacement100g/10min
Replacement 200g/10min
Figure 6-4: S-value for bed replacement as counteraction method after 3 consecutive S-values rose above 3 (experiment WOB3). Two different replacement rates have been applied.
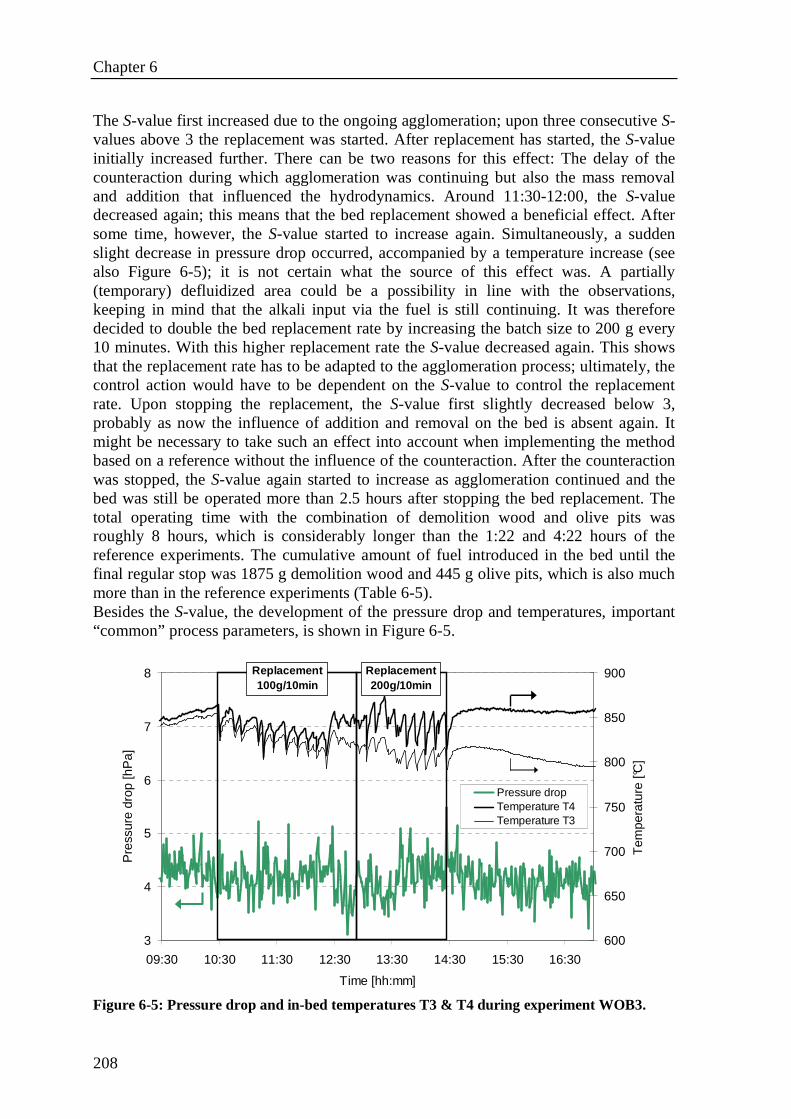
Chapter 6
208
The S-value first increased due to the ongoing agglomeration; upon three consecutive S-values above 3 the replacement was started. After replacement has started, the S-value initially increased further. There can be two reasons for this effect: The delay of the counteraction during which agglomeration was continuing but also the mass removal and addition that influenced the hydrodynamics. Around 11:30-12:00, the S-value decreased again; this means that the bed replacement showed a beneficial effect. After some time, however, the S-value started to increase again. Simultaneously, a sudden slight decrease in pressure drop occurred, accompanied by a temperature increase (see also Figure 6-5); it is not certain what the source of this effect was. A partially (temporary) defluidized area could be a possibility in line with the observations, keeping in mind that the alkali input via the fuel is still continuing. It was therefore decided to double the bed replacement rate by increasing the batch size to 200 g every 10 minutes. With this higher replacement rate the S-value decreased again. This shows that the replacement rate has to be adapted to the agglomeration process; ultimately, the control action would have to be dependent on the S-value to control the replacement rate. Upon stopping the replacement, the S-value first slightly decreased below 3, probably as now the influence of addition and removal on the bed is absent again. It might be necessary to take such an effect into account when implementing the method based on a reference without the influence of the counteraction. After the counteraction was stopped, the S-value again started to increase as agglomeration continued and the bed was still be operated more than 2.5 hours after stopping the bed replacement. The total operating time with the combination of demolition wood and olive pits was roughly 8 hours, which is considerably longer than the 1:22 and 4:22 hours of the reference experiments. The cumulative amount of fuel introduced in the bed until the final regular stop was 1875 g demolition wood and 445 g olive pits, which is also much more than in the reference experiments (Table 6-5). Besides the S-value, the development of the pressure drop and temperatures, important “common” process parameters, is shown in Figure 6-5.
3
4
5
6
7
8
09:30 10:30 11:30 12:30 13:30 14:30 15:30 16:30
Time [hh:mm]
Pre
ssur
e dr
op [h
Pa]
600
650
700
750
800
850
900
Tem
pera
ture
[°C
]
Pressure dropTemperature T4Temperature T3
Replacement100g/10min
Replacement 200g/10min
Figure 6-5: Pressure drop and in-bed temperatures T3 & T4 during experiment WOB3.
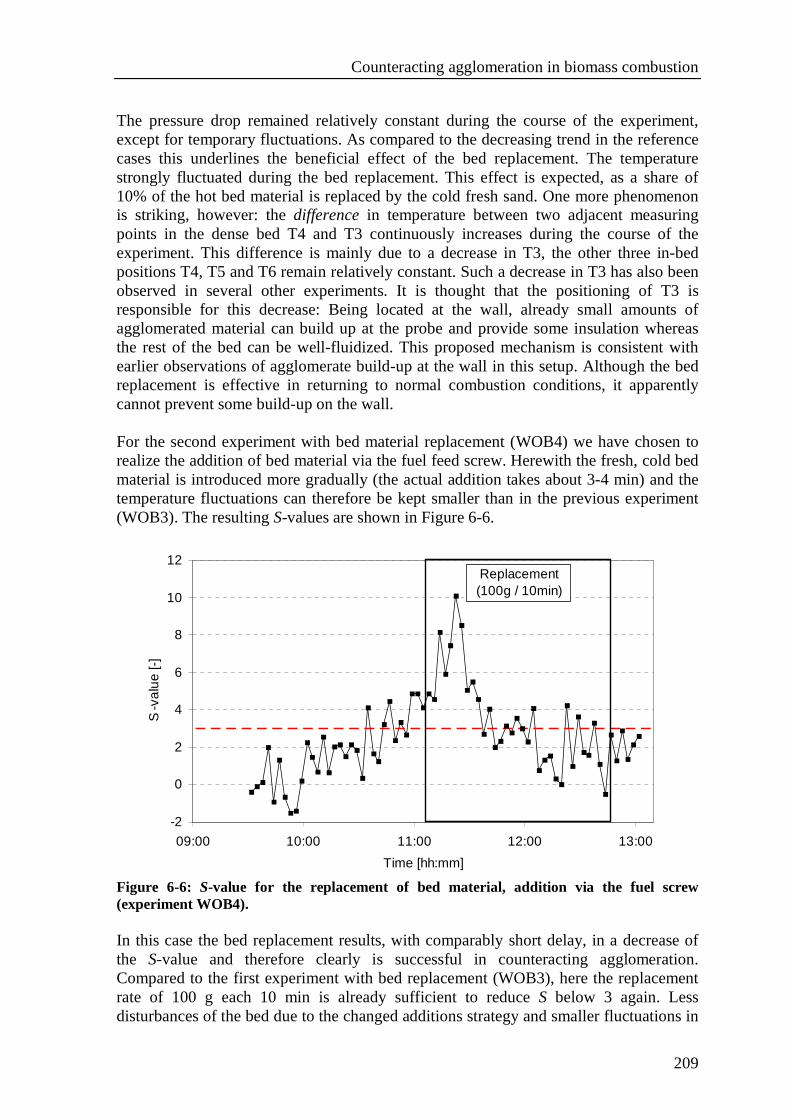
Counteracting agglomeration in biomass combustion
209
The pressure drop remained relatively constant during the course of the experiment, except for temporary fluctuations. As compared to the decreasing trend in the reference cases this underlines the beneficial effect of the bed replacement. The temperature strongly fluctuated during the bed replacement. This effect is expected, as a share of 10% of the hot bed material is replaced by the cold fresh sand. One more phenomenon is striking, however: the difference in temperature between two adjacent measuring points in the dense bed T4 and T3 continuously increases during the course of the experiment. This difference is mainly due to a decrease in T3, the other three in-bed positions T4, T5 and T6 remain relatively constant. Such a decrease in T3 has also been observed in several other experiments. It is thought that the positioning of T3 is responsible for this decrease: Being located at the wall, already small amounts of agglomerated material can build up at the probe and provide some insulation whereas the rest of the bed can be well-fluidized. This proposed mechanism is consistent with earlier observations of agglomerate build-up at the wall in this setup. Although the bed replacement is effective in returning to normal combustion conditions, it apparently cannot prevent some build-up on the wall. For the second experiment with bed material replacement (WOB4) we have chosen to realize the addition of bed material via the fuel feed screw. Herewith the fresh, cold bed material is introduced more gradually (the actual addition takes about 3-4 min) and the temperature fluctuations can therefore be kept smaller than in the previous experiment (WOB3). The resulting S-values are shown in Figure 6-6.
-2
0
2
4
6
8
10
12
09:00 10:00 11:00 12:00 13:00
Time [hh:mm]
S-v
alue
[-]
Replacement(100g / 10min)
Figure 6-6: S-value for the replacement of bed material, addition via the fuel screw (experiment WOB4). In this case the bed replacement results, with comparably short delay, in a decrease of the S-value and therefore clearly is successful in counteracting agglomeration. Compared to the first experiment with bed replacement (WOB3), here the replacement rate of 100 g each 10 min is already sufficient to reduce S below 3 again. Less disturbances of the bed due to the changed additions strategy and smaller fluctuations in
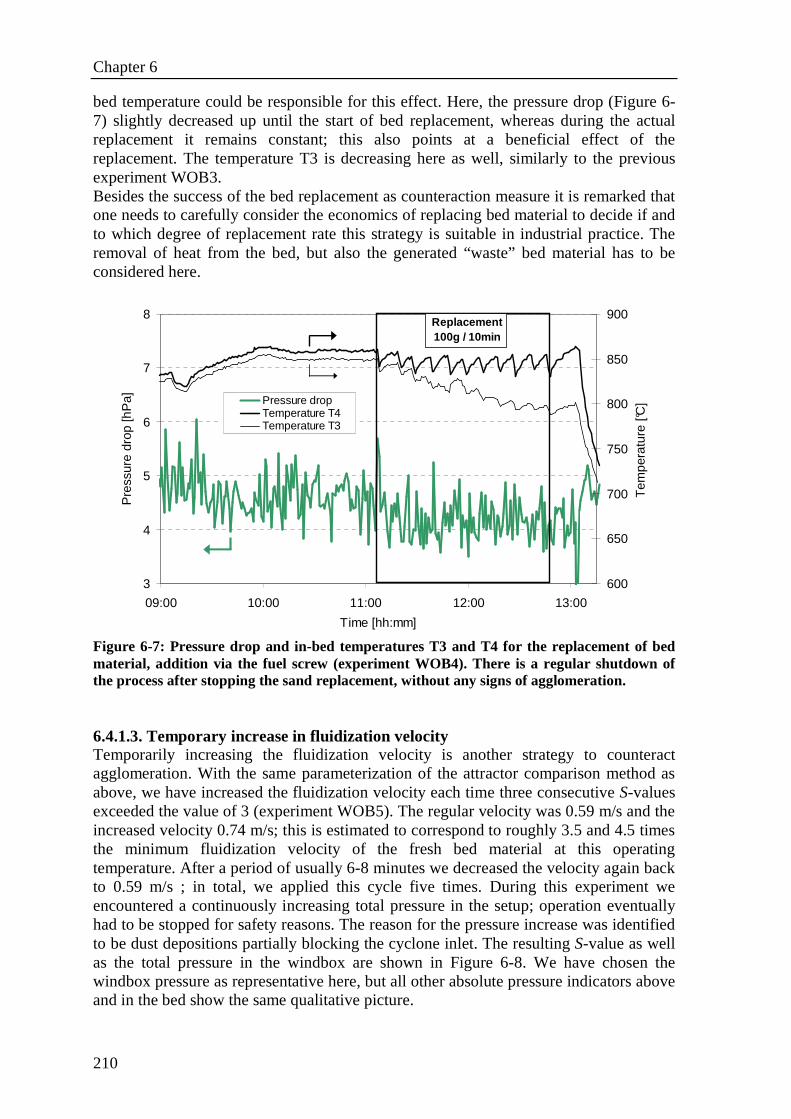
Chapter 6
210
bed temperature could be responsible for this effect. Here, the pressure drop (Figure 6-7) slightly decreased up until the start of bed replacement, whereas during the actual replacement it remains constant; this also points at a beneficial effect of the replacement. The temperature T3 is decreasing here as well, similarly to the previous experiment WOB3. Besides the success of the bed replacement as counteraction measure it is remarked that one needs to carefully consider the economics of replacing bed material to decide if and to which degree of replacement rate this strategy is suitable in industrial practice. The removal of heat from the bed, but also the generated “waste” bed material has to be considered here.
3
4
5
6
7
8
09:00 10:00 11:00 12:00 13:00
Time [hh:mm]
Pre
ssur
e dr
op [h
Pa]
600
650
700
750
800
850
900
Tem
pera
ture
[°C
]Pressure dropTemperature T4Temperature T3
Replacement100g / 10min
Figure 6-7: Pressure drop and in-bed temperatures T3 and T4 for the replacement of bed material, addition via the fuel screw (experiment WOB4). There is a regular shutdown of the process after stopping the sand replacement, without any signs of agglomeration. 6.4.1.3. Temporary increase in fluidization velocity Temporarily increasing the fluidization velocity is another strategy to counteract agglomeration. With the same parameterization of the attractor comparison method as above, we have increased the fluidization velocity each time three consecutive S-values exceeded the value of 3 (experiment WOB5). The regular velocity was 0.59 m/s and the increased velocity 0.74 m/s; this is estimated to correspond to roughly 3.5 and 4.5 times the minimum fluidization velocity of the fresh bed material at this operating temperature. After a period of usually 6-8 minutes we decreased the velocity again back to 0.59 m/s ; in total, we applied this cycle five times. During this experiment we encountered a continuously increasing total pressure in the setup; operation eventually had to be stopped for safety reasons. The reason for the pressure increase was identified to be dust depositions partially blocking the cyclone inlet. The resulting S-value as well as the total pressure in the windbox are shown in Figure 6-8. We have chosen the windbox pressure as representative here, but all other absolute pressure indicators above and in the bed show the same qualitative picture.
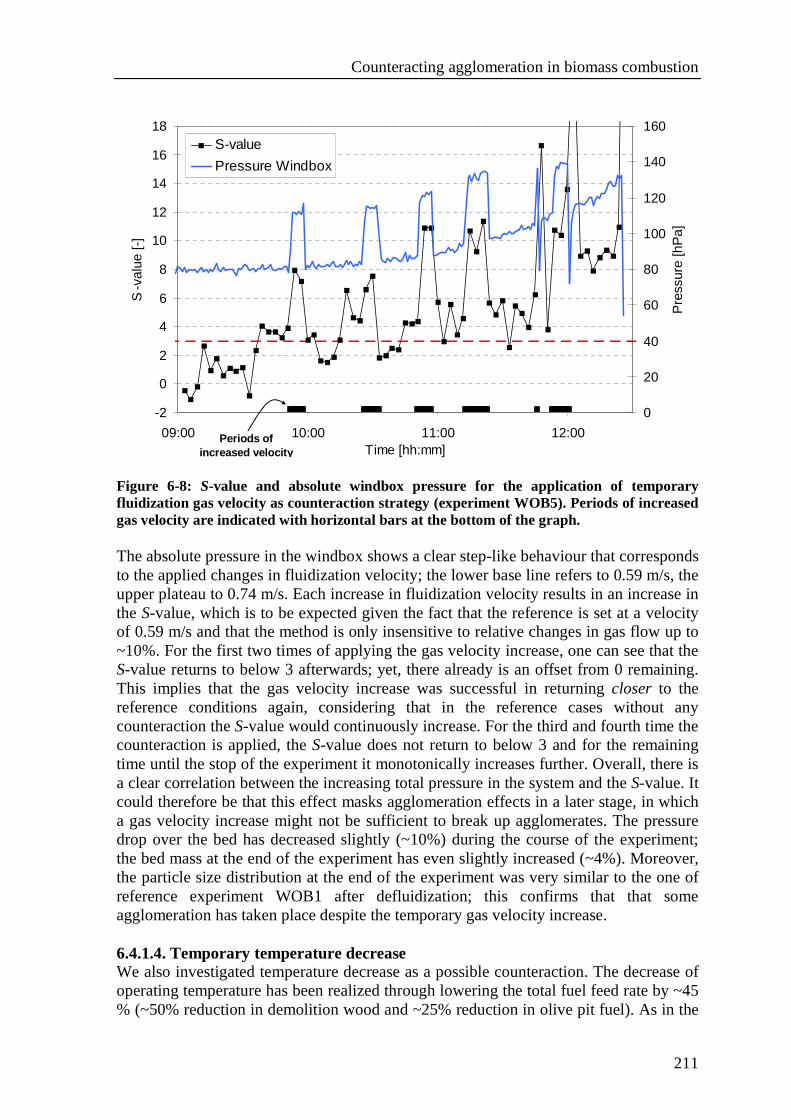
Counteracting agglomeration in biomass combustion
211
-2
0
2
4
6
8
10
12
14
16
18
09:00 10:00 11:00 12:00Time [hh:mm]
S-v
alue
[-]
0
20
40
60
80
100
120
140
160
Pre
ssur
e [h
Pa]
S-value
Pressure Windbox
Periods of increased velocity
Figure 6-8: S-value and absolute windbox pressure for the application of temporary fluidization gas velocity as counteraction strategy (experiment WOB5). Periods of increased gas velocity are indicated with horizontal bars at the bottom of the graph. The absolute pressure in the windbox shows a clear step-like behaviour that corresponds to the applied changes in fluidization velocity; the lower base line refers to 0.59 m/s, the upper plateau to 0.74 m/s. Each increase in fluidization velocity results in an increase in the S-value, which is to be expected given the fact that the reference is set at a velocity of 0.59 m/s and that the method is only insensitive to relative changes in gas flow up to ~10%. For the first two times of applying the gas velocity increase, one can see that the S-value returns to below 3 afterwards; yet, there already is an offset from 0 remaining. This implies that the gas velocity increase was successful in returning closer to the reference conditions again, considering that in the reference cases without any counteraction the S-value would continuously increase. For the third and fourth time the counteraction is applied, the S-value does not return to below 3 and for the remaining time until the stop of the experiment it monotonically increases further. Overall, there is a clear correlation between the increasing total pressure in the system and the S-value. It could therefore be that this effect masks agglomeration effects in a later stage, in which a gas velocity increase might not be sufficient to break up agglomerates. The pressure drop over the bed has decreased slightly (~10%) during the course of the experiment; the bed mass at the end of the experiment has even slightly increased (~4%). Moreover, the particle size distribution at the end of the experiment was very similar to the one of reference experiment WOB1 after defluidization; this confirms that that some agglomeration has taken place despite the temporary gas velocity increase. 6.4.1.4. Temporary temperature decrease We also investigated temperature decrease as a possible counteraction. The decrease of operating temperature has been realized through lowering the total fuel feed rate by ~45 % (~50% reduction in demolition wood and ~25% reduction in olive pit fuel). As in the
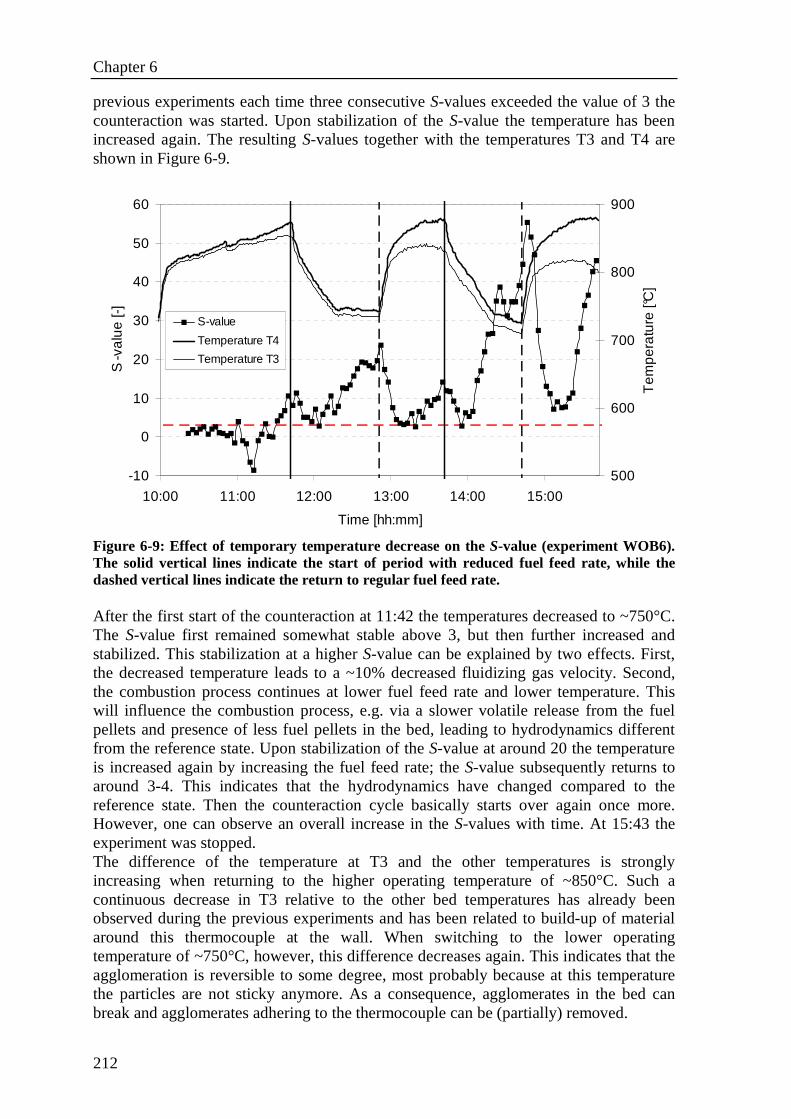
Chapter 6
212
previous experiments each time three consecutive S-values exceeded the value of 3 the counteraction was started. Upon stabilization of the S-value the temperature has been increased again. The resulting S-values together with the temperatures T3 and T4 are shown in Figure 6-9.
-10
0
10
20
30
40
50
60
10:00 11:00 12:00 13:00 14:00 15:00
Time [hh:mm]
S-v
alu
e [-
]
500
600
700
800
900
Tem
per
atu
re [°
C]
S-value
Temperature T4
Temperature T3
Figure 6-9: Effect of temporary temperature decrease on the S-value (experiment WOB6). The solid vertical lines indicate the start of period with reduced fuel feed rate, while the dashed vertical lines indicate the return to regular fuel feed rate. After the first start of the counteraction at 11:42 the temperatures decreased to ~750°C. The S-value first remained somewhat stable above 3, but then further increased and stabilized. This stabilization at a higher S-value can be explained by two effects. First, the decreased temperature leads to a ~10% decreased fluidizing gas velocity. Second, the combustion process continues at lower fuel feed rate and lower temperature. This will influence the combustion process, e.g. via a slower volatile release from the fuel pellets and presence of less fuel pellets in the bed, leading to hydrodynamics different from the reference state. Upon stabilization of the S-value at around 20 the temperature is increased again by increasing the fuel feed rate; the S-value subsequently returns to around 3-4. This indicates that the hydrodynamics have changed compared to the reference state. Then the counteraction cycle basically starts over again once more. However, one can observe an overall increase in the S-values with time. At 15:43 the experiment was stopped. The difference of the temperature at T3 and the other temperatures is strongly increasing when returning to the higher operating temperature of ~850°C. Such a continuous decrease in T3 relative to the other bed temperatures has already been observed during the previous experiments and has been related to build-up of material around this thermocouple at the wall. When switching to the lower operating temperature of ~750°C, however, this difference decreases again. This indicates that the agglomeration is reversible to some degree, most probably because at this temperature the particles are not sticky anymore. As a consequence, agglomerates in the bed can break and agglomerates adhering to the thermocouple can be (partially) removed.
Counteracting agglomeration in biomass combustion
213
Overall, it appears that the temperature decrease to some degree counteracts the agglomeration process. The agglomeration process is not completely reversed, as there is a growing offset in S-value compared to the reference state. Moreover, the longer the setup operates, the quicker the S-value rises upon temperature increase (compare 12:00-12:30 and 14:00-14:30 in Figure 6-9). This effect is expected considering that the ash is not removed. The increasing amount of potassium-containing ash in the bed can then relatively quickly form new agglomerates when the operating temperature exceeds the melting point of low-melting silicates. The effect of temperature reduction is therefore only temporary. A permanent solution for this issue could only be realized with additional effort, e.g. a system to refresh the sand bed. Whether or not further agglomeration and defluidization can actually be avoided by decreasing the temperature will depend on the time scale during which the bed can be cooled down as compared to the time scale for the bed to further agglomerate and defluidize. With the most important melting temperatures of silicates starting around 750°C and typical operating temperatures of 850°C one therefore has to realize roughly a 100°C temperature decrease. In this case we only applied a reduction in fuel feed rate of about 20%, taking about 30 minutes for a reduction of 100°C. With a quicker strategy, e.g. temporarily stopping the fuel feed, possibly in combination with increased gas flow, we consider it realistic to achieve such a temperature decrease within 15 minutes here. 6.4.2. Crone boiler setup (small commercial scale) The suitability of the attractor comparison method has also been tested on larger scale in a 1 MWth bubbling fluidized bed combustor. This installation does not have the possibility of bed replacement during operation. The counteractions applied here have been limited to reducing the operating temperature via a reduction in fuel feed rate as well as using an additive. Results of five experiments are presented. The first two experiments serve as a reference case in which we let the bed agglomerate and do not apply any counteraction. The third experiment comprises reducing the operating temperature via decreasing fuel feed rate, with consecutive efforts to continue operation at higher temperatures. The fourth experiment also applies temperature reduction as counteraction strategy, in this case with continued operation at a low temperature level. In the fifth experiment, the addition of small amounts of kaolin to prevent agglomeration is tested. 6.4.2.1. Reference cases The first reference experiment has been started with demolition wood (DW) as fuel with typical operating temperatures of 830-840°C. After starting to co-feed ~70 weight-% pepper plant residue (PPR), the temperature greatly decreased to levels of 700-750°C. The PPR has a roughly 30% smaller heating value than DW, but the total fuel feed rate was increased to make sure the total energy input is the same as before the co-feeding. The reason for this strong temperature reduction is therefore thought to originate from the properties of the PPR, which appears to burn in a very non-optimal manner, i.e. having slow mass and energy transfer within the pellet and difficult disintegration. Visual observations confirmed that burning pellets maintain their structure quite well during combustion. This phenomenon is attributed to the rather strong fibrous structure of the pellets. In addition, the operation with PPR also yielded very high CO-
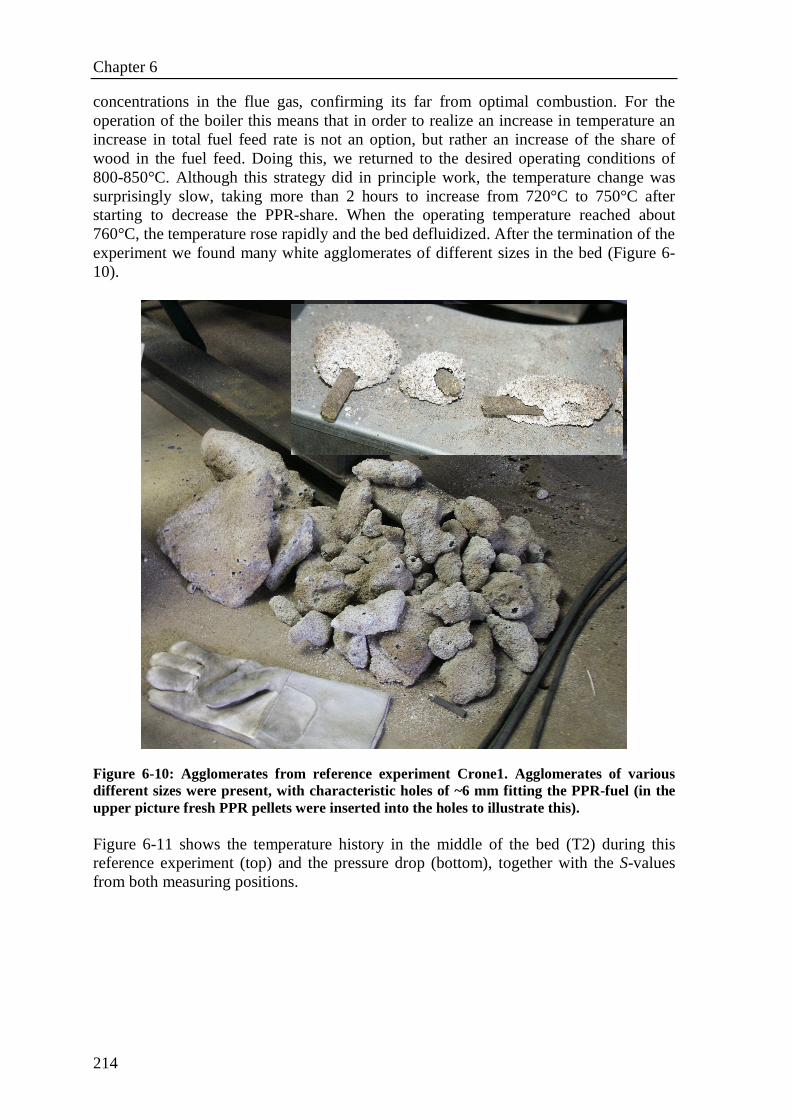
Chapter 6
214
concentrations in the flue gas, confirming its far from optimal combustion. For the operation of the boiler this means that in order to realize an increase in temperature an increase in total fuel feed rate is not an option, but rather an increase of the share of wood in the fuel feed. Doing this, we returned to the desired operating conditions of 800-850°C. Although this strategy did in principle work, the temperature change was surprisingly slow, taking more than 2 hours to increase from 720°C to 750°C after starting to decrease the PPR-share. When the operating temperature reached about 760°C, the temperature rose rapidly and the bed defluidized. After the termination of the experiment we found many white agglomerates of different sizes in the bed (Figure 6-10).
Figure 6-10: Agglomerates from reference experiment Crone1. Agglomerates of various different sizes were present, with characteristic holes of ~6 mm fitting the PPR-fuel (in the upper picture fresh PPR pellets were inserted into the holes to illustrate this). Figure 6-11 shows the temperature history in the middle of the bed (T2) during this reference experiment (top) and the pressure drop (bottom), together with the S-values from both measuring positions.
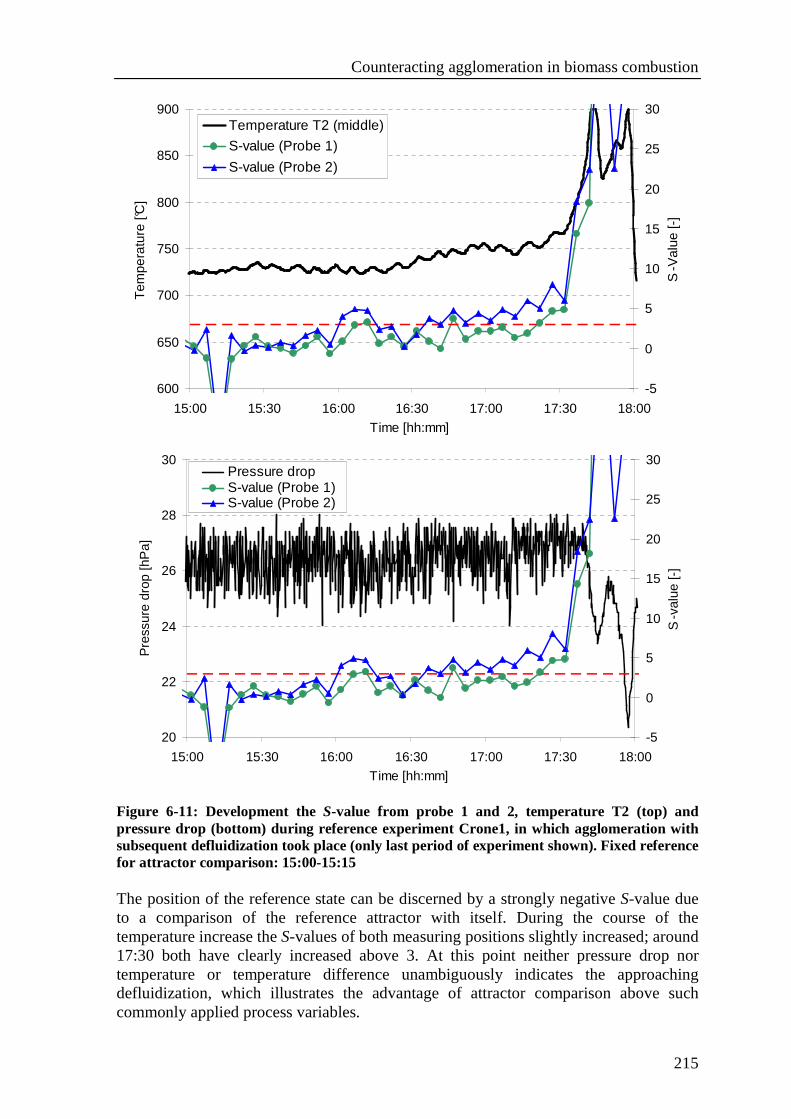
Counteracting agglomeration in biomass combustion
215
600
650
700
750
800
850
900
15:00 15:30 16:00 16:30 17:00 17:30 18:00
Time [hh:mm]
Tem
pera
ture
[°C
]
-5
0
5
10
15
20
25
30
S-V
alue
[-]
Temperature T2 (middle)
S-value (Probe 1)
S-value (Probe 2)
20
22
24
26
28
30
15:00 15:30 16:00 16:30 17:00 17:30 18:00
Time [hh:mm]
Pre
ssur
e dr
op [h
Pa]
-5
0
5
10
15
20
25
30
S-v
alue
[-]
Pressure dropS-value (Probe 1)S-value (Probe 2)
Figure 6-11: Development the S-value from probe 1 and 2, temperature T2 (top) and pressure drop (bottom) during reference experiment Crone1, in which agglomeration with subsequent defluidization took place (only last period of experiment shown). Fixed reference for attractor comparison: 15:00-15:15 The position of the reference state can be discerned by a strongly negative S-value due to a comparison of the reference attractor with itself. During the course of the temperature increase the S-values of both measuring positions slightly increased; around 17:30 both have clearly increased above 3. At this point neither pressure drop nor temperature or temperature difference unambiguously indicates the approaching defluidization, which illustrates the advantage of attractor comparison above such commonly applied process variables.
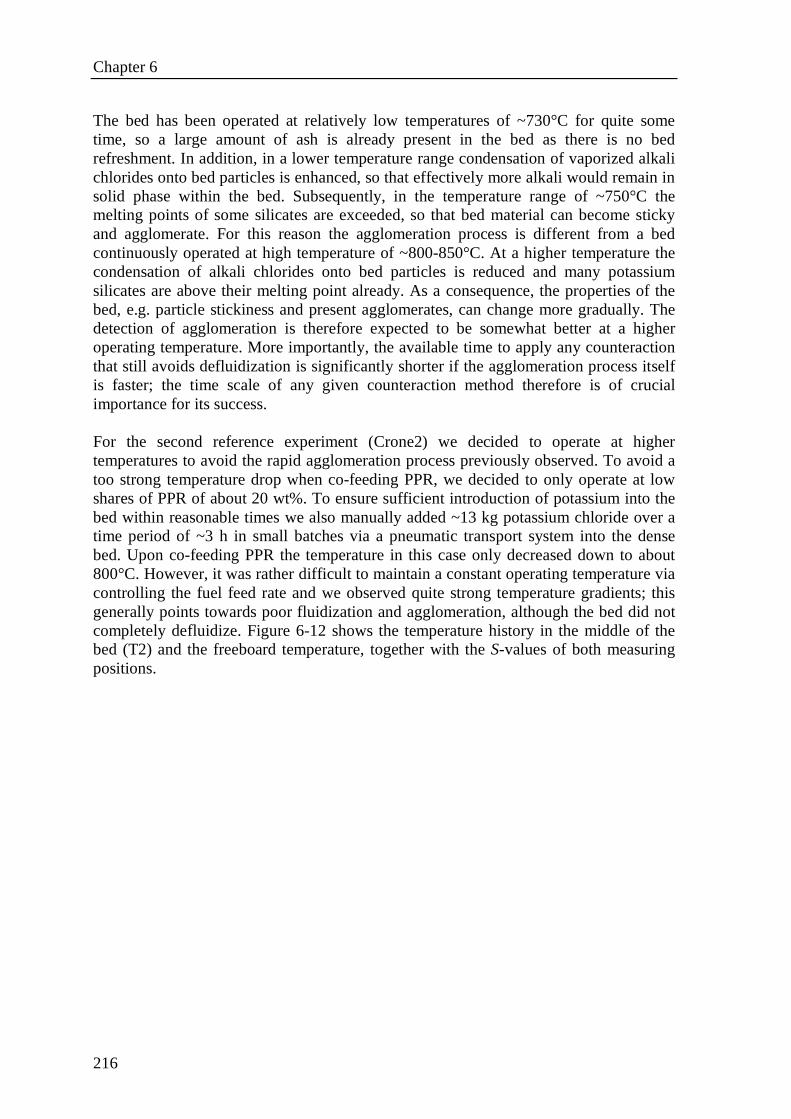
Chapter 6
216
The bed has been operated at relatively low temperatures of ~730°C for quite some time, so a large amount of ash is already present in the bed as there is no bed refreshment. In addition, in a lower temperature range condensation of vaporized alkali chlorides onto bed particles is enhanced, so that effectively more alkali would remain in solid phase within the bed. Subsequently, in the temperature range of ~750°C the melting points of some silicates are exceeded, so that bed material can become sticky and agglomerate. For this reason the agglomeration process is different from a bed continuously operated at high temperature of ~800-850°C. At a higher temperature the condensation of alkali chlorides onto bed particles is reduced and many potassium silicates are above their melting point already. As a consequence, the properties of the bed, e.g. particle stickiness and present agglomerates, can change more gradually. The detection of agglomeration is therefore expected to be somewhat better at a higher operating temperature. More importantly, the available time to apply any counteraction that still avoids defluidization is significantly shorter if the agglomeration process itself is faster; the time scale of any given counteraction method therefore is of crucial importance for its success. For the second reference experiment (Crone2) we decided to operate at higher temperatures to avoid the rapid agglomeration process previously observed. To avoid a too strong temperature drop when co-feeding PPR, we decided to only operate at low shares of PPR of about 20 wt%. To ensure sufficient introduction of potassium into the bed within reasonable times we also manually added ~13 kg potassium chloride over a time period of ~3 h in small batches via a pneumatic transport system into the dense bed. Upon co-feeding PPR the temperature in this case only decreased down to about 800°C. However, it was rather difficult to maintain a constant operating temperature via controlling the fuel feed rate and we observed quite strong temperature gradients; this generally points towards poor fluidization and agglomeration, although the bed did not completely defluidize. Figure 6-12 shows the temperature history in the middle of the bed (T2) and the freeboard temperature, together with the S-values of both measuring positions.
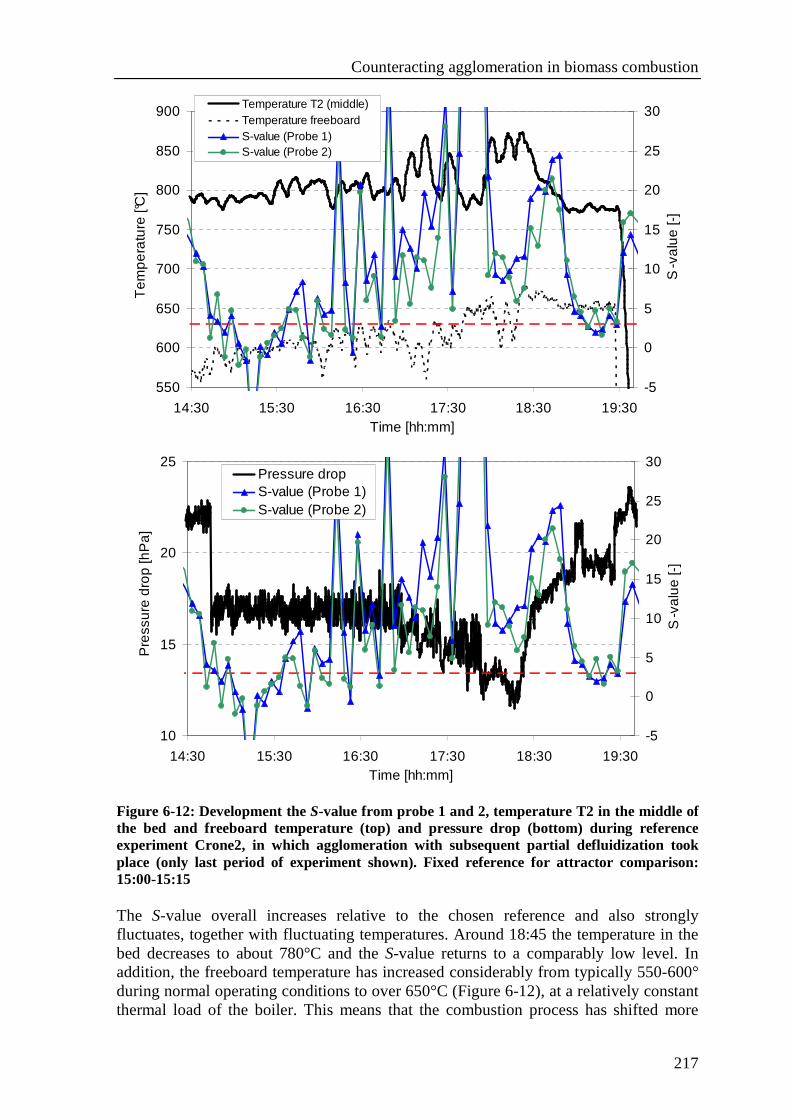
Counteracting agglomeration in biomass combustion
217
550
600
650
700
750
800
850
900
14:30 15:30 16:30 17:30 18:30 19:30Time [hh:mm]
Tem
pe
ratu
re [°
C]
-5
0
5
10
15
20
25
30
S-v
alu
e [-
]
Temperature T2 (middle)Temperature freeboardS-value (Probe 1)S-value (Probe 2)
10
15
20
25
14:30 15:30 16:30 17:30 18:30 19:30Time [hh:mm]
Pre
ssur
e dr
op
[hP
a]
-5
0
5
10
15
20
25
30
S-v
alue
[-]
Pressure dropS-value (Probe 1)S-value (Probe 2)
Figure 6-12: Development the S-value from probe 1 and 2, temperature T2 in the middle of the bed and freeboard temperature (top) and pressure drop (bottom) during reference experiment Crone2, in which agglomeration with subsequent partial defluidization took place (only last period of experiment shown). Fixed reference for attractor comparison: 15:00-15:15 The S-value overall increases relative to the chosen reference and also strongly fluctuates, together with fluctuating temperatures. Around 18:45 the temperature in the bed decreases to about 780°C and the S-value returns to a comparably low level. In addition, the freeboard temperature has increased considerably from typically 550-600° during normal operating conditions to over 650°C (Figure 6-12), at a relatively constant thermal load of the boiler. This means that the combustion process has shifted more
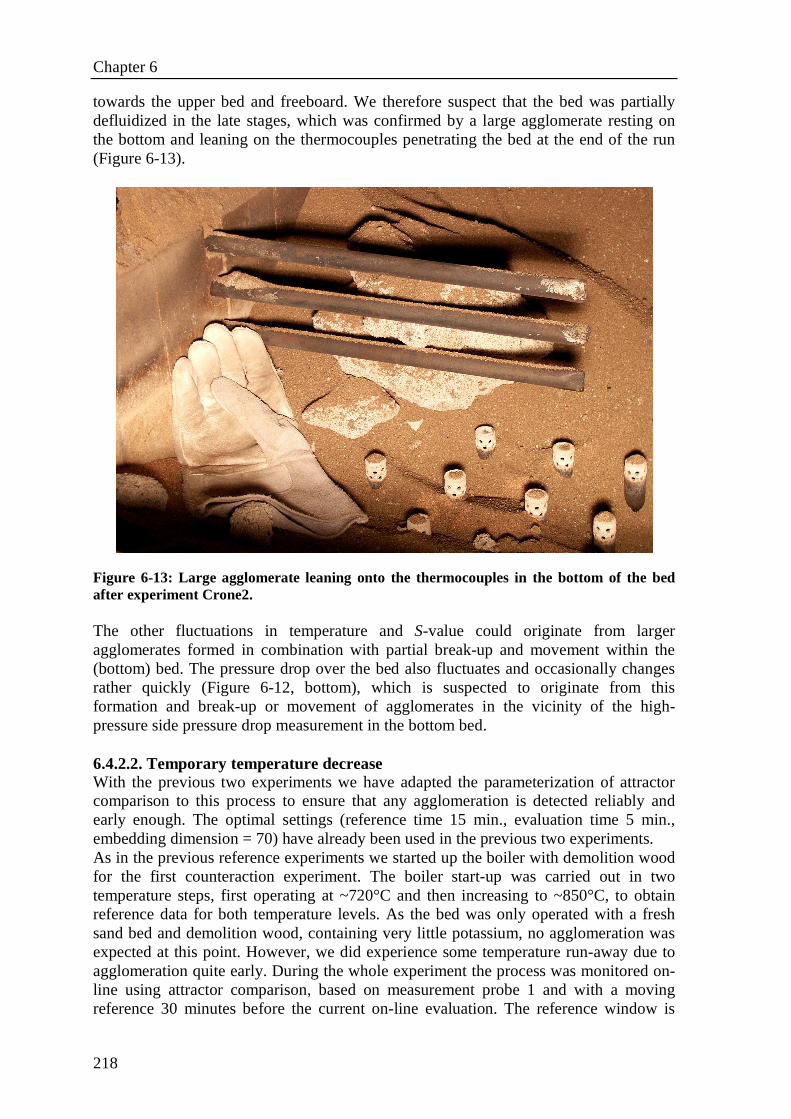
Chapter 6
218
towards the upper bed and freeboard. We therefore suspect that the bed was partially defluidized in the late stages, which was confirmed by a large agglomerate resting on the bottom and leaning on the thermocouples penetrating the bed at the end of the run (Figure 6-13).
Figure 6-13: Large agglomerate leaning onto the thermocouples in the bottom of the bed after experiment Crone2. The other fluctuations in temperature and S-value could originate from larger agglomerates formed in combination with partial break-up and movement within the (bottom) bed. The pressure drop over the bed also fluctuates and occasionally changes rather quickly (Figure 6-12, bottom), which is suspected to originate from this formation and break-up or movement of agglomerates in the vicinity of the high-pressure side pressure drop measurement in the bottom bed. 6.4.2.2. Temporary temperature decrease With the previous two experiments we have adapted the parameterization of attractor comparison to this process to ensure that any agglomeration is detected reliably and early enough. The optimal settings (reference time 15 min., evaluation time 5 min., embedding dimension = 70) have already been used in the previous two experiments. As in the previous reference experiments we started up the boiler with demolition wood for the first counteraction experiment. The boiler start-up was carried out in two temperature steps, first operating at ~720°C and then increasing to ~850°C, to obtain reference data for both temperature levels. As the bed was only operated with a fresh sand bed and demolition wood, containing very little potassium, no agglomeration was expected at this point. However, we did experience some temperature run-away due to agglomeration quite early. During the whole experiment the process was monitored on-line using attractor comparison, based on measurement probe 1 and with a moving reference 30 minutes before the current on-line evaluation. The reference window is
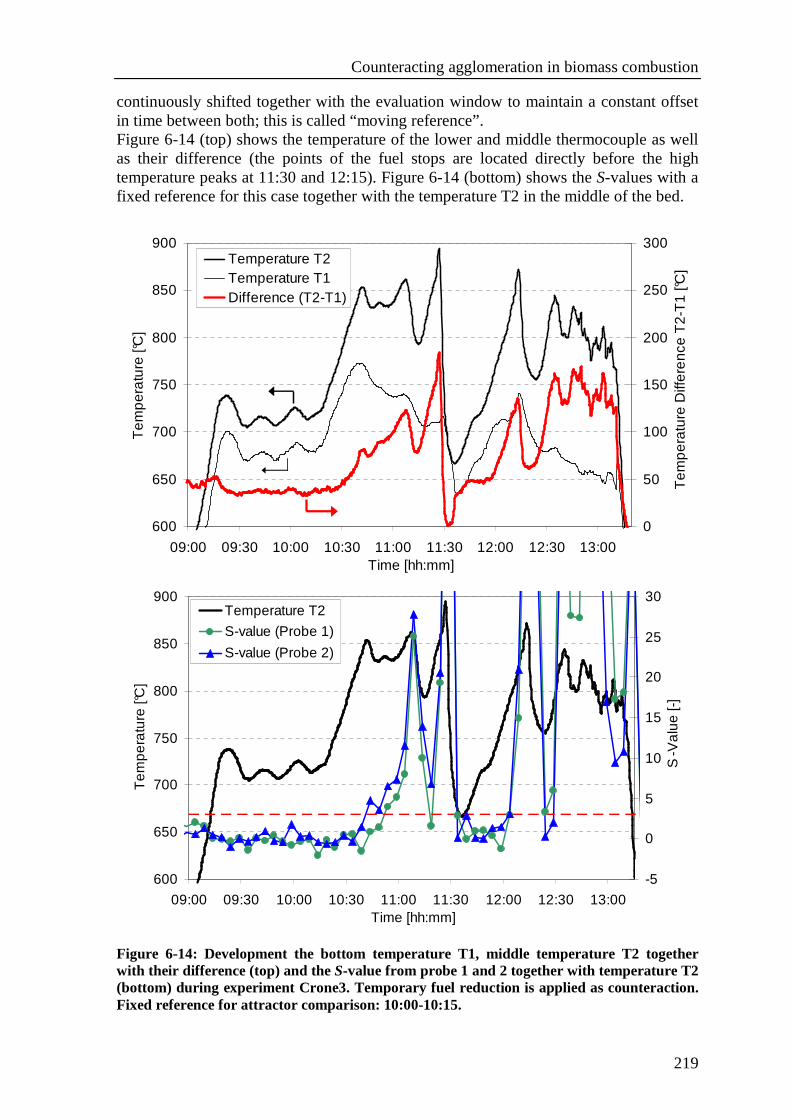
Counteracting agglomeration in biomass combustion
219
continuously shifted together with the evaluation window to maintain a constant offset in time between both; this is called “moving reference”. Figure 6-14 (top) shows the temperature of the lower and middle thermocouple as well as their difference (the points of the fuel stops are located directly before the high temperature peaks at 11:30 and 12:15). Figure 6-14 (bottom) shows the S-values with a fixed reference for this case together with the temperature T2 in the middle of the bed.
600
650
700
750
800
850
900
09:00 09:30 10:00 10:30 11:00 11:30 12:00 12:30 13:00Time [hh:mm]
Tem
per
atu
re [°
C]
0
50
100
150
200
250
300
Tem
per
atur
e D
iffer
enc
e T
2-T
1 [°
C]
Temperature T2Temperature T1Difference (T2-T1)
600
650
700
750
800
850
900
09:00 09:30 10:00 10:30 11:00 11:30 12:00 12:30 13:00Time [hh:mm]
Te
mp
era
ture
[°C
]
-5
0
5
10
15
20
25
30
S-V
alu
e [-
]
Temperature T2
S-value (Probe 1)
S-value (Probe 2)
Figure 6-14: Development the bottom temperature T1, middle temperature T2 together with their difference (top) and the S-value from probe 1 and 2 together with temperature T2 (bottom) during experiment Crone3. Temporary fuel reduction is applied as counteraction. Fixed reference for attractor comparison: 10:00-10:15.
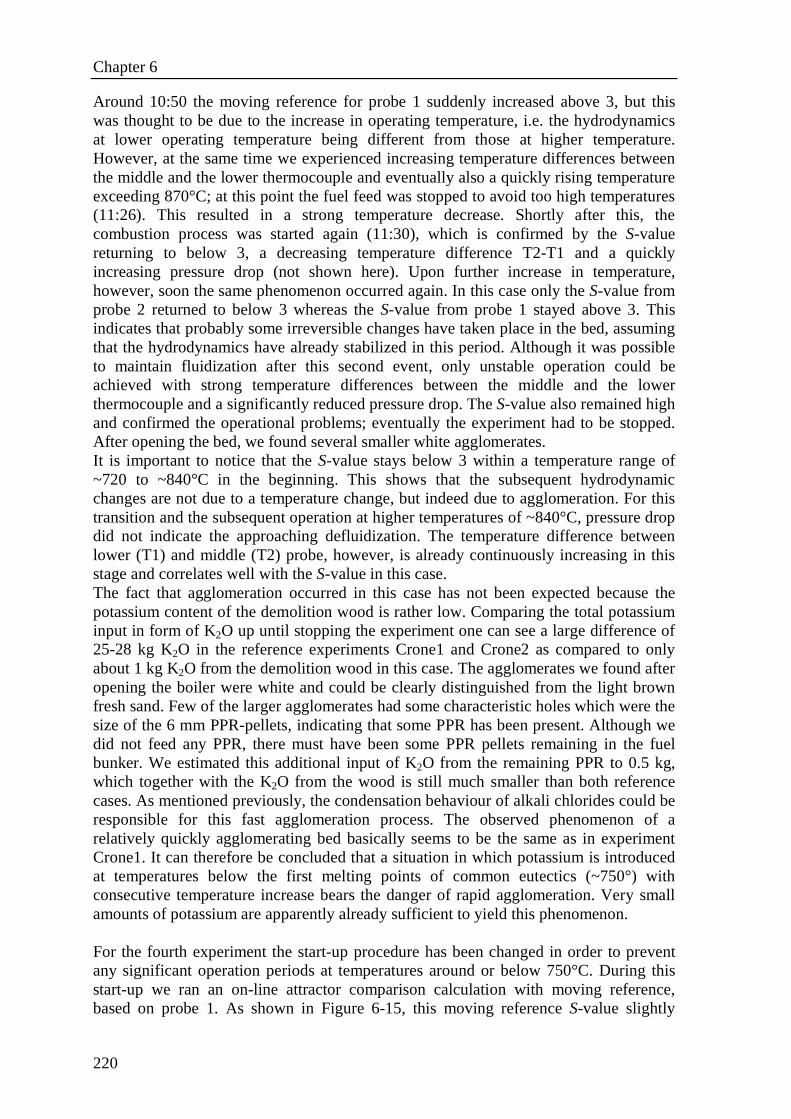
Chapter 6
220
Around 10:50 the moving reference for probe 1 suddenly increased above 3, but this was thought to be due to the increase in operating temperature, i.e. the hydrodynamics at lower operating temperature being different from those at higher temperature. However, at the same time we experienced increasing temperature differences between the middle and the lower thermocouple and eventually also a quickly rising temperature exceeding 870°C; at this point the fuel feed was stopped to avoid too high temperatures (11:26). This resulted in a strong temperature decrease. Shortly after this, the combustion process was started again (11:30), which is confirmed by the S-value returning to below 3, a decreasing temperature difference T2-T1 and a quickly increasing pressure drop (not shown here). Upon further increase in temperature, however, soon the same phenomenon occurred again. In this case only the S-value from probe 2 returned to below 3 whereas the S-value from probe 1 stayed above 3. This indicates that probably some irreversible changes have taken place in the bed, assuming that the hydrodynamics have already stabilized in this period. Although it was possible to maintain fluidization after this second event, only unstable operation could be achieved with strong temperature differences between the middle and the lower thermocouple and a significantly reduced pressure drop. The S-value also remained high and confirmed the operational problems; eventually the experiment had to be stopped. After opening the bed, we found several smaller white agglomerates. It is important to notice that the S-value stays below 3 within a temperature range of ~720 to ~840°C in the beginning. This shows that the subsequent hydrodynamic changes are not due to a temperature change, but indeed due to agglomeration. For this transition and the subsequent operation at higher temperatures of ~840°C, pressure drop did not indicate the approaching defluidization. The temperature difference between lower (T1) and middle (T2) probe, however, is already continuously increasing in this stage and correlates well with the S-value in this case. The fact that agglomeration occurred in this case has not been expected because the potassium content of the demolition wood is rather low. Comparing the total potassium input in form of K2O up until stopping the experiment one can see a large difference of 25-28 kg K2O in the reference experiments Crone1 and Crone2 as compared to only about 1 kg K2O from the demolition wood in this case. The agglomerates we found after opening the boiler were white and could be clearly distinguished from the light brown fresh sand. Few of the larger agglomerates had some characteristic holes which were the size of the 6 mm PPR-pellets, indicating that some PPR has been present. Although we did not feed any PPR, there must have been some PPR pellets remaining in the fuel bunker. We estimated this additional input of K2O from the remaining PPR to 0.5 kg, which together with the K2O from the wood is still much smaller than both reference cases. As mentioned previously, the condensation behaviour of alkali chlorides could be responsible for this fast agglomeration process. The observed phenomenon of a relatively quickly agglomerating bed basically seems to be the same as in experiment Crone1. It can therefore be concluded that a situation in which potassium is introduced at temperatures below the first melting points of common eutectics (~750°) with consecutive temperature increase bears the danger of rapid agglomeration. Very small amounts of potassium are apparently already sufficient to yield this phenomenon. For the fourth experiment the start-up procedure has been changed in order to prevent any significant operation periods at temperatures around or below 750°C. During this start-up we ran an on-line attractor comparison calculation with moving reference, based on probe 1. As shown in Figure 6-15, this moving reference S-value slightly
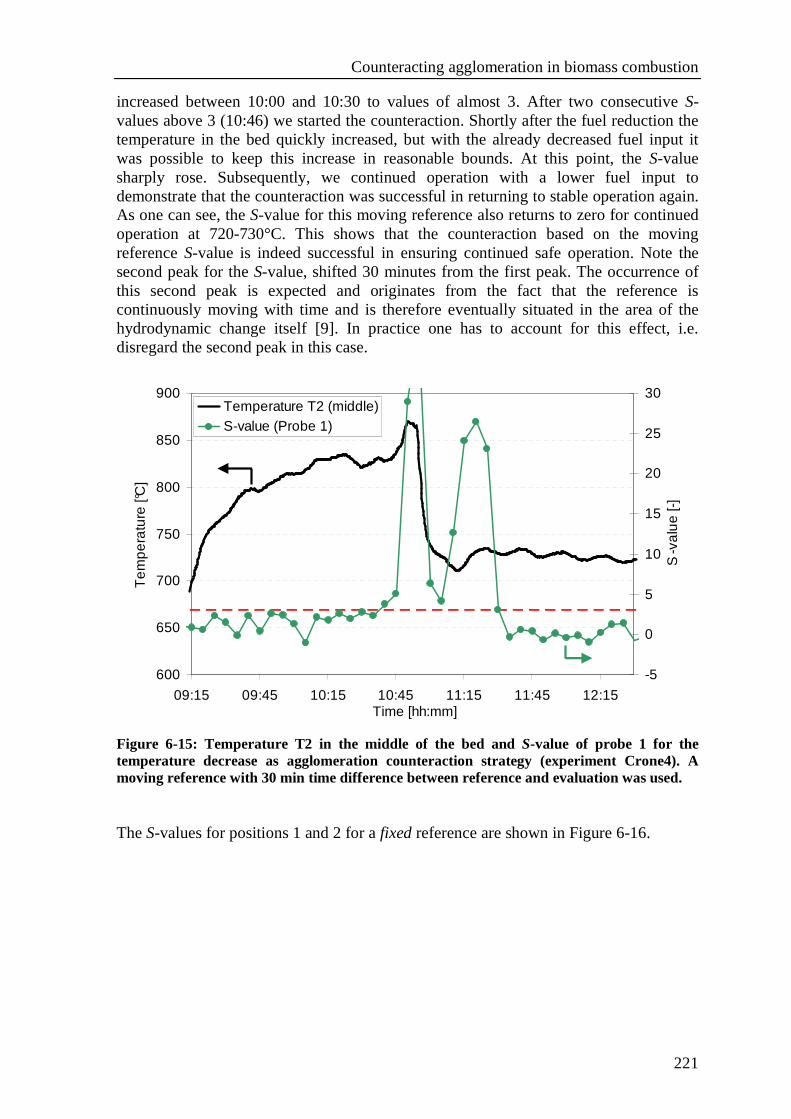
Counteracting agglomeration in biomass combustion
221
increased between 10:00 and 10:30 to values of almost 3. After two consecutive S-values above 3 (10:46) we started the counteraction. Shortly after the fuel reduction the temperature in the bed quickly increased, but with the already decreased fuel input it was possible to keep this increase in reasonable bounds. At this point, the S-value sharply rose. Subsequently, we continued operation with a lower fuel input to demonstrate that the counteraction was successful in returning to stable operation again. As one can see, the S-value for this moving reference also returns to zero for continued operation at 720-730°C. This shows that the counteraction based on the moving reference S-value is indeed successful in ensuring continued safe operation. Note the second peak for the S-value, shifted 30 minutes from the first peak. The occurrence of this second peak is expected and originates from the fact that the reference is continuously moving with time and is therefore eventually situated in the area of the hydrodynamic change itself [9]. In practice one has to account for this effect, i.e. disregard the second peak in this case.
600
650
700
750
800
850
900
09:15 09:45 10:15 10:45 11:15 11:45 12:15Time [hh:mm]
Te
mp
era
ture
[°C
]
-5
0
5
10
15
20
25
30
S-v
alu
e [-
]
Temperature T2 (middle)S-value (Probe 1)
Figure 6-15: Temperature T2 in the middle of the bed and S-value of probe 1 for the temperature decrease as agglomeration counteraction strategy (experiment Crone4). A moving reference with 30 min time difference between reference and evaluation was used. The S-values for positions 1 and 2 for a fixed reference are shown in Figure 6-16.
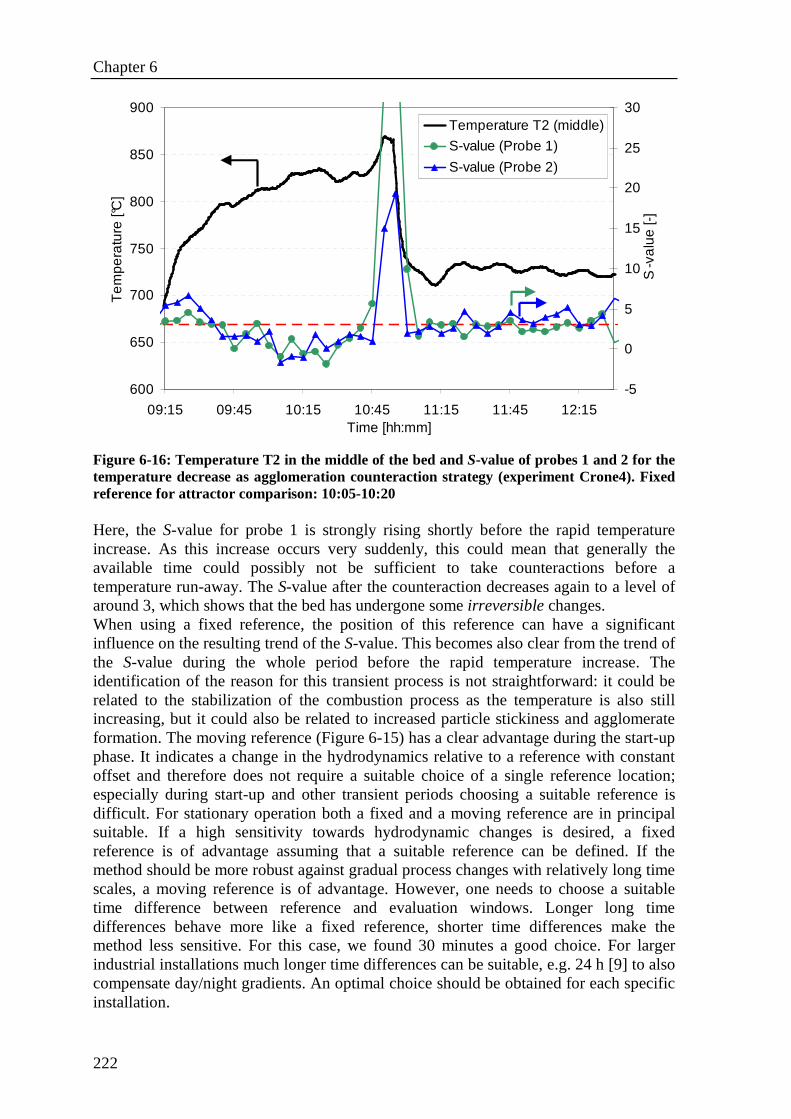
Chapter 6
222
600
650
700
750
800
850
900
09:15 09:45 10:15 10:45 11:15 11:45 12:15Time [hh:mm]
Te
mpe
ratu
re [°
C]
-5
0
5
10
15
20
25
30
S-v
alu
e [-
]
Temperature T2 (middle)
S-value (Probe 1)
S-value (Probe 2)
Figure 6-16: Temperature T2 in the middle of the bed and S-value of probes 1 and 2 for the temperature decrease as agglomeration counteraction strategy (experiment Crone4). Fixed reference for attractor comparison: 10:05-10:20 Here, the S-value for probe 1 is strongly rising shortly before the rapid temperature increase. As this increase occurs very suddenly, this could mean that generally the available time could possibly not be sufficient to take counteractions before a temperature run-away. The S-value after the counteraction decreases again to a level of around 3, which shows that the bed has undergone some irreversible changes. When using a fixed reference, the position of this reference can have a significant influence on the resulting trend of the S-value. This becomes also clear from the trend of the S-value during the whole period before the rapid temperature increase. The identification of the reason for this transient process is not straightforward: it could be related to the stabilization of the combustion process as the temperature is also still increasing, but it could also be related to increased particle stickiness and agglomerate formation. The moving reference (Figure 6-15) has a clear advantage during the start-up phase. It indicates a change in the hydrodynamics relative to a reference with constant offset and therefore does not require a suitable choice of a single reference location; especially during start-up and other transient periods choosing a suitable reference is difficult. For stationary operation both a fixed and a moving reference are in principal suitable. If a high sensitivity towards hydrodynamic changes is desired, a fixed reference is of advantage assuming that a suitable reference can be defined. If the method should be more robust against gradual process changes with relatively long time scales, a moving reference is of advantage. However, one needs to choose a suitable time difference between reference and evaluation windows. Longer long time differences behave more like a fixed reference, shorter time differences make the method less sensitive. For this case, we found 30 minutes a good choice. For larger industrial installations much longer time differences can be suitable, e.g. 24 h [9] to also compensate day/night gradients. An optimal choice should be obtained for each specific installation.
Counteracting agglomeration in biomass combustion
223
Another relevant observation is that the S-value from position 2 does not respond until just before the actual temperature increase. This effect is related to the choice of the reference location and becomes clear when considering the moving reference for position 2 (Figure 6-17): an intermediate peak appears around 10:15-10:20, which then decays again.
600
650
700
750
800
850
900
09:15 09:45 10:15 10:45 11:15 11:45 12:15Time [hh:mm]
Te
mpe
ratu
re [°
C]
-5
0
5
10
15
20
25
30
S-v
alu
e [-
]
Temperature T2 (middle)S-value (Probe 2)
Figure 6-17: Temperature T2 in the middle of the bed and S-value of probe 2 for the temperature decrease as agglomeration counteraction strategy (experiment Crone4). A moving reference with 30 min time difference between reference and evaluation was used. This peak already indicates some agglomeration related problems, considering that the agglomeration process can occur locally in the bed and that during this process agglomerates can form, break up and potentially move within the bed. It has been shown that the use of several pressure fluctuation sensors is important as the detection distance of each sensor within the fluidized (dense) bed is limited to ~0.5 m [19]. One possible explanation in this case is that agglomerates have been formed in the vicinity of probe 2, but then either broke up again or moved within the bed. If the location of the reference is chosen within the time window of such an effect, the reference already includes agglomeration effects and therefore becomes less sensitive for additional agglomeration. This is confirmed by the lower peak in S for the rapid temperature increase (~10:50) in Figure 6-17. As compared to the WOB, where we achieved a 100°C in about 30 minutes, we here achieved a ~140°C decrease within 15 minutes only by regulating fuel feed rate. The time to reduce the operating temperature ~100°C is expected to be in the same order of magnitude for larger-scale industrial fluidized beds. In practice, a strong reduction in fuel feed rate will have a stronger influence on the boiler load and production than e.g. refreshing bed material or increasing gas velocity, and will therefore probably only be considered suitable for emergency cases. Overall, one can conclude that during start-up the application of a fixed reference has limitations and a moving reference is strongly recommended. Especially in combination
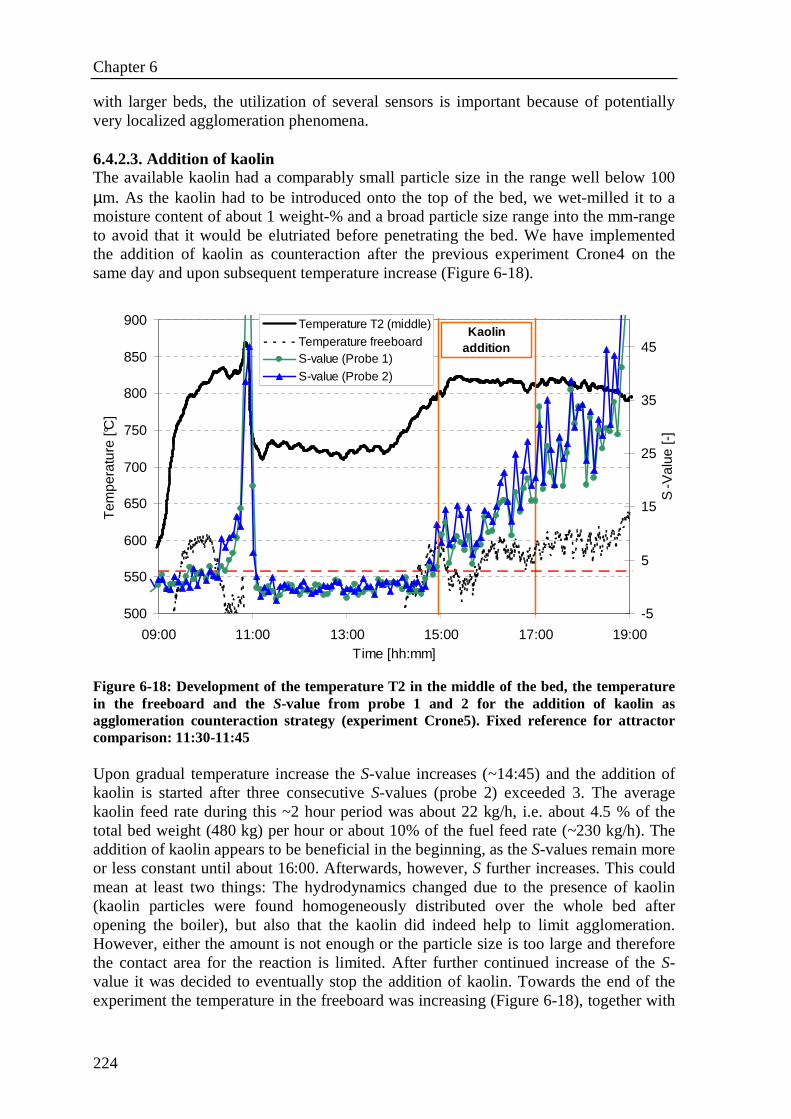
Chapter 6
224
with larger beds, the utilization of several sensors is important because of potentially very localized agglomeration phenomena. 6.4.2.3. Addition of kaolin The available kaolin had a comparably small particle size in the range well below 100 µm. As the kaolin had to be introduced onto the top of the bed, we wet-milled it to a moisture content of about 1 weight-% and a broad particle size range into the mm-range to avoid that it would be elutriated before penetrating the bed. We have implemented the addition of kaolin as counteraction after the previous experiment Crone4 on the same day and upon subsequent temperature increase (Figure 6-18).
500
550
600
650
700
750
800
850
900
09:00 11:00 13:00 15:00 17:00 19:00Time [hh:mm]
Tem
pera
ture
[°C
]
-5
5
15
25
35
45
S-V
alue
[-]
Temperature T2 (middle)Temperature freeboardS-value (Probe 1)S-value (Probe 2)
Kaolinaddition
Figure 6-18: Development of the temperature T2 in the middle of the bed, the temperature in the freeboard and the S-value from probe 1 and 2 for the addition of kaolin as agglomeration counteraction strategy (experiment Crone5). Fixed reference for attractor comparison: 11:30-11:45 Upon gradual temperature increase the S-value increases (~14:45) and the addition of kaolin is started after three consecutive S-values (probe 2) exceeded 3. The average kaolin feed rate during this ~2 hour period was about 22 kg/h, i.e. about 4.5 % of the total bed weight (480 kg) per hour or about 10% of the fuel feed rate (~230 kg/h). The addition of kaolin appears to be beneficial in the beginning, as the S-values remain more or less constant until about 16:00. Afterwards, however, S further increases. This could mean at least two things: The hydrodynamics changed due to the presence of kaolin (kaolin particles were found homogeneously distributed over the whole bed after opening the boiler), but also that the kaolin did indeed help to limit agglomeration. However, either the amount is not enough or the particle size is too large and therefore the contact area for the reaction is limited. After further continued increase of the S-value it was decided to eventually stop the addition of kaolin. Towards the end of the experiment the temperature in the freeboard was increasing (Figure 6-18), together with
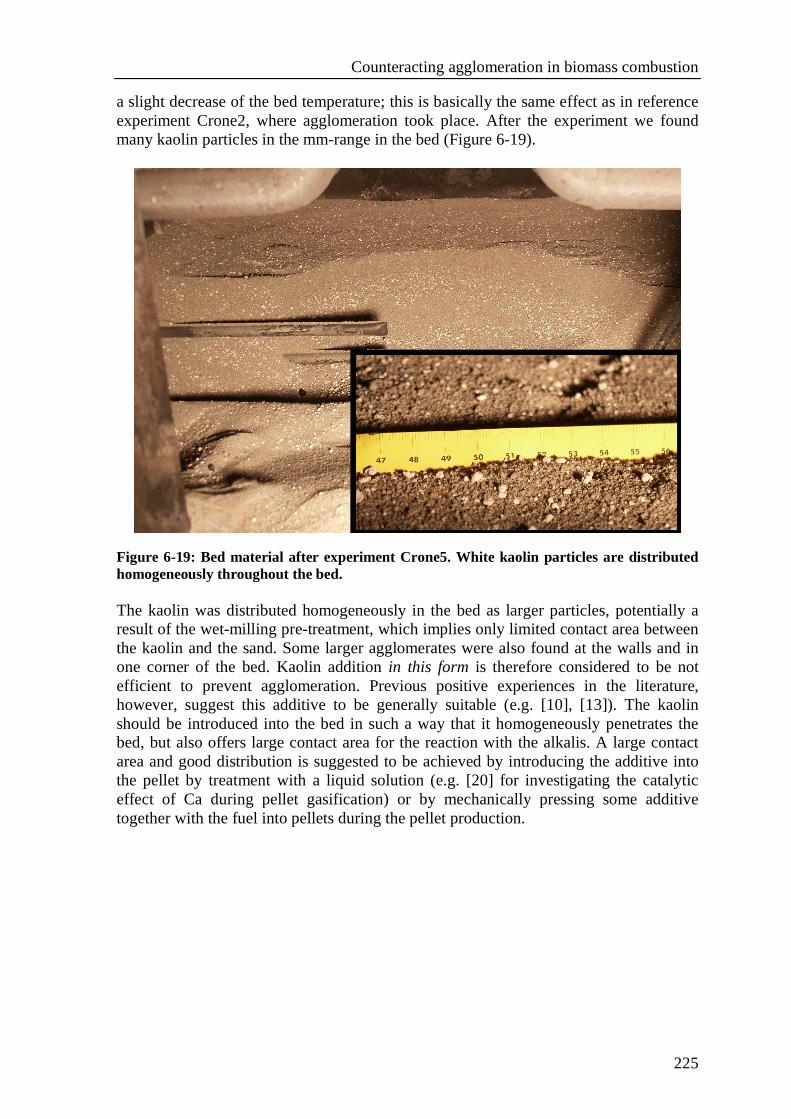
Counteracting agglomeration in biomass combustion
225
a slight decrease of the bed temperature; this is basically the same effect as in reference experiment Crone2, where agglomeration took place. After the experiment we found many kaolin particles in the mm-range in the bed (Figure 6-19).
Figure 6-19: Bed material after experiment Crone5. White kaolin particles are distributed homogeneously throughout the bed. The kaolin was distributed homogeneously in the bed as larger particles, potentially a result of the wet-milling pre-treatment, which implies only limited contact area between the kaolin and the sand. Some larger agglomerates were also found at the walls and in one corner of the bed. Kaolin addition in this form is therefore considered to be not efficient to prevent agglomeration. Previous positive experiences in the literature, however, suggest this additive to be generally suitable (e.g. [10], [13]). The kaolin should be introduced into the bed in such a way that it homogeneously penetrates the bed, but also offers large contact area for the reaction with the alkalis. A large contact area and good distribution is suggested to be achieved by introducing the additive into the pellet by treatment with a liquid solution (e.g. [20] for investigating the catalytic effect of Ca during pellet gasification) or by mechanically pressing some additive together with the fuel into pellets during the pellet production.
Chapter 6
226
6.5. Conclusions Attractor comparison was applied for early agglomeration detection in a lab-scale and small commercial-scale fluidized bed combustor, where it was used to determine the starting point for taking counteractions against the agglomeration. Together with a suitable counteraction strategy, defluidization of the bed can be successfully prevented or delayed. In the lab-scale setup (WOB) the agglomeration process was very gradual if no counteractions are taken. Although the two reference cases were qualitatively similar, there was a large difference in the operation time until defluidization. The semi-continuous replacement of bed material as counteraction measure was successful to prevent defluidization and return to a well-fluidized bed. This strategy can be considered as a permanent solution as ash and potassium silicates are removed from the bed, although the process economics (heat loss, waste bed material) have to be carefully considered. A temporary increase in gas velocity as counteraction measure resulted in a blocked cyclone inlet in this case and did not prevent agglomerate formation, indicated by an increase in the bed particle size. A temporary decrease in temperature as counteraction measure did help to reduce the S-value, but upon subsequent temperature increase the S-value rose again and reached even higher values, i.e. bed material properties have irreversibly changed and agglomeration continued. Both increased gas velocity and decreased temperature can therefore only be considered as a temporary strategy as they do not remove or convert the accumulated alkali species in the bed. For the small commercial-scale setup (Crone) the agglomeration events were different from the lab-scale setup: Temperature run-away and defluidization of the bed occurred much faster. Agglomeration related problems specifically occurred at transitions in operating temperature. Still, attractor comparison was able to detect the approaching defluidization in an early stage. In such an early stage pressure drop did not indicate any approaching defluidization, whereas temperature differences often already showed a continuously increasing trend. A subsequent temperature decrease to below 750°C has shown to be a successful strategy to prevent defluidization and continue trouble-free operation. However, operation at such low temperatures in combination with subsequent temperature increase can lead to rapid agglomeration, even for small amounts of alkali in the bed. Before the temperature increase the present alkali should therefore be removed or neutralized (reacted). A positive effect of using kaolin as additive is not demonstrated, as some agglomeration was observed in this case. Agglomeration can occur localized in the bed, indicating that for larger units several measurement positions might be necessary for reliable monitoring. The results of the attractor comparison have often shown to be quite sensitive to the position of a fixed reference. During transient operation the application of a moving reference is advantageous, as no fixed reference bed condition has to be determined. Agglomeration events outside transition regions are considered to be detected and counteracted in an earlier stage, as they progress more gradual compared to the proven cases here.
6.6. Acknowledgements Funding from the Delft Research Centre for Sustainable Energy is gratefully acknowledged.
Counteracting agglomeration in biomass combustion
227
6.7. References [1] McKendry P. Energy production from biomass (part 3): gasification technologies.
Bioresource Technology 2002;83(1):55-63 [2] Bartels M, Lin W, Nijenhuis J, Kapteijn F, van Ommen JR. Agglomeration in
fluidized beds at high temperatures: Mechanisms, Detection and Prevention. Progress in Energy and Combustion Science (2008) doi:10.1016/j.pecs.2008.04.002
[3] Werther J. Measurement Techniques in Fluidized Beds. Powder Technology 1999;102:15-36
[4] Rehmat AG, Patel JG; Inst. Gas Technology (IGTE); “Controlling and maintaining fluidised beds - under non-steady state conditions in ash agglomerating fluidised beds” Patent US4544375-A (1985)
[5] Chirone R, Miccio F, Scala F. Mechanism and prediction of bed agglomeration during fluidized bed combustion of a biomass fuel: Effect of the reactor scale. Chemical Engineering Journal 2006;123(3):71-80
[6] Johnsson F, Zijerveld RC, Schouten JC, Van den Bleek CM, Leckner B. Characterization of fluidization regimes by time-series analysis of pressure fluctuations. International Journal of Multiphase Flow 2000;26,663–715
[7] van Ommen JR, Coppens MO, van den Bleek CM, Schouten JC. Early Warning of agglomeration in Fluidized Beds by Attractor Comparison. AIChE Journal 2000;46:2183-2197
[8] Diks C, van Zwet WR, Takens F, DeGoede J. Detecting the differences between delay vector distributions. Phys. Rev. E 1996;53:2169
[9] Nijenhuis J, Korbee R, Lensselink J, Kiel JHA, van Ommen JR. A method for agglomeration detection and control in full-scale biomass fired fluidized beds. Chemical Engineering Science 2007;62(1-2):644-54
[10] van der Drift A, Olsen A. Conversion of biomass, prediction and solution methods for ash agglomeration and related problems. Report ECN-C--99-090 (1999)
[11] Ergüdenler A, Ghaly AE. Agglomeration of silica sand in a fluidized bed gasifier operating on wheat straw. Biomass and Bioenergy 1993;4(2):135-147
[12] Korbee R, Lensselink J, van Ommen JR, Nijenhuis J, van Gemert M, Haasnoot K. Early Agglomeration Recognition System - EARS: From bench-scale testing to industrial prototype. ECN (Energy research Centre of the Netherlands) report ECN-C--04-052 (2004)
[13] Öhman M, Nordin A. The Role of Kaolin in Prevention of Bed Agglomeration during Fluidized Bed Combustion of Biomass Fuels. Energy & Fuels 2000;14:618-624
[14] A. A. Khan, W. de Jong, and H. Spliethoff, ‘A fluidized bed combustion model with discretized population balance. 2. Experimental studies and model validation’, Energy Fuels, vol. 21, no. 6, pp. 3709-3717, 2007
[15] J. Ruud van Ommen, Jaap C. Schouten, Michel L. M. van der Stappen, Cor M. van den Bleek. Response characteristics of probe–transducer systems for pressure measurements in gas–solid fluidized beds: how to prevent pitfalls in dynamic pressure measurements. Powder Technology 1999;106(3):199-218
[16] Visser HJM. The influence of fuel composition on agglomeration behaviour in fluidised-bed combustion. ECN (Energy research Centre of the Netherlands) report ECN-C--04-054 (2004)
Chapter 6
228
[17] A. A. Tortosa Masiá, B. J. P. Buhre, R. P. Gupta, and T. F. Wall, ‘Characterising ash of biomass and waste’ Fuel Process. Technol., vol. 88, no. 11-12, pp. 1071-1081
[18] van Ommen JR, Schouten JC, van den Bleek CM. An Early-Warning-Method for Detecting Bed agglomeration in Fluidized Bed Combustors. Paper No. FBC99-0150, Proc. 15th Int. Conf. on Fluidized Bed Combustion 1999, R. B. Reuther, ed., ASME, New York
[19] van Ommen JR, van der Schaaf J, Schouten JC, van Wachem BGM, Coppens M-O, van den Bleek CM. Optimal placement of probes for dynamic pressure measurements in large-scale fluidized beds. Powder Technology 2004;139(3):264-276
[20] H. Risnes, J. Fjellerup, U. Henriksen, A. Moilanen, P. Norby, K. Papadakis, D. Posselt, L. H. Sørensen. Calcium addition in straw gasification. Fuel, Volume 82, Issue 6, April 2003, Pages 641-651

229
Chapter 7
Conclusions & Recommendations
Chapter 7
230
In this work it has been investigated how agglomeration in fluidized beds can be efficiently detected and counteracted. This chapter first quickly reiterates the problem of agglomeration, then concludes the main findings of this work and finally gives recommendations for future research. Agglomeration in fluidized beds The occurrence of unwanted agglomeration in fluidized beds processes can be a major problem in industrial practice. In the area of energy conversion, normally combustion and gasification of coal, biomass and waste, reports of agglomeration are numerous, e.g. [1,2,3]. Subsequent defluidization often results in a lengthy and expensive shut-down of the installation. This calls for a monitoring system that gives the process operator an early warning to take measures preventing shutdown. The on-line monitoring of fluidized bed hydrodynamics therefore is an important area of research and motivates this work. Besides applications for early agglomeration detection, on-line monitoring is also of use for processes in which the particle properties influence the bed hydrodynamics and therefore the process efficiency.
In case of energy conversion the main mechanism of agglomeration involves the simultaneous presence of alkali components from the fuel and silica from the bed material and the fuel, which can lead to formation of alkali silicates that have a melting point well below the typical operating temperatures of ~850°C. This results in increased particle stickiness and formation of agglomerates. If this process continues unrecognized, it can result in defluidization of the bed. Besides agglomeration, also the particle size distribution of the bed material can be an important process parameter, especially in the riser section of circulating fluidized beds where the size distribution determines the efficiency of the heat transfer to heat exchangers.
Other processes where on-line monitoring for early agglomeration detection or improved process efficiency is desirable, comprise the gas-phase polymerization of polyethylene (PE) and polypropylene (PP), and drying of pharmaceutical and food powders. Measurement & analysis methods Many different signal analysis methods have been suggested for the detection of agglomeration and the monitoring of bed hydrodynamics, as reviewed in chapter 2. The attractor comparison method [4] has been successfully applied for the early detection of agglomeration in bubbling fluidized beds [4,5]. Its application in circulating fluidized beds and its coupling with counteraction measures is investigated in this thesis. Besides attractor comparison also the potential of other methods to detect agglomeration is investigated. High-frequency measurements of the pressure fluctuations relative to the local average pressure form the basis for all analysis methods considered in this thesis. The measurements were carried out accounting for previously recommended probe design criteria [6], probe positioning criteria [7] and signal filtering and data acquisition criteria [4]. Additional low-frequency process measurements (e.g. temperatures, flow rates, process events) were used for the analysis and interpretation.
Conclusions & Recommendations
231
7.1. Conclusions Attractor comparison in circulating fluidized beds In the research described in this thesis, experimental work has been carried out on different reactor scales (lab-scale and industrial scale) with different solids return mechanisms (L-valve and loop seal).
At the lab-scale the attractor comparison method has shown to be sensitive to small, uni-modal changes in particle size in the order of 5%, based on a median size of 235 µm. The method is also sensitive to the presence of model agglomerates (d50 = 1900 µm) in the order of 3% on mass basis. With an L-valve for solids return the sensitivity to particle size changes is much higher in the downcomer, and especially in the horizontal return-leg, than the riser. With a loop seal this difference gets generally smaller, and depends on the operating conditions. The application of a loop-seal as compared to an L-valve leads to less coupling between the downcomer pressure fluctuations and riser pressure fluctuations. For the applied particle size changes no sensitivity is observed in the bubbling bed compartment of a loop seal. For both the L-valve and the loop seal configuration the sensitivity to particle size changes in the riser increases with operating conditions leading to increased riser density, i.e. a larger mass reflux or a lower superficial gas velocity in the riser. However, no dependency of sensitivity with height is observed. For the downcomer the sensitivity can change with height, but based on the obtained data no general rules can be extracted. The method is not sensitive to an increase in solids inventory of at least 20%, a change in riser gas velocity of about 5%, and a change in mass reflux of about 5-10%. The increased sensitivity to particle size in the downcomer in case of the L-valve configuration has led to the hypothesis that the moving sand bed works as a hardware filter for the pressure fluctuations that originate from the riser, and thereby increases sensitivity. The observations support this hypothesis, although the actual mechanism is not known yet. Some simple electronic low-pass filters have in some cases shown to improve the selectivity of the method for particle size changes as compared to gas velocity and mass reflux changes.
On industrial scale the method is sensitive to small, uni-modal changes in particle size in the order of 8%, based on a median size of 240 µm and measurements in the bottom bed of the riser.
During biomass gasification at the lab-scale, accompanied by agglomeration, the method detected the approaching defluidization with an early warning time of ~30 min, based on measurements in the lower riser and the horizontal return-leg. Screening approach for identifying selective agglomeration detection methods Various methods to detect agglomeration have been suggested in the literature for monitoring fluidized beds. Often, only the response of the method to agglomeration is investigated, i.e. its sensitivity. However, the cross-sensitivity to other effects, such as changes in gas velocity and bed mass, is seldom considered. This aspect of selectivity is important for the implementation in an industrial environment, where fluctuations in other process variables can be common and would lead to false alarms if a method is not
Chapter 7
232
selective enough. A new methodology is proposed for screening many different signal analysis methods in combination with pre-treatment (filtering) methods. Pressure fluctuation measurements form the basis for the analysis. The goal of this methodology is to find combinations of pre-treatment and analysis methods that are sensitive and selective to agglomeration. The suitability of a method is expressed by a selectivity index that assesses the temporal response of the method to different process changes in terms of the trend of continuity, sensitivity to agglomeration and selectivity to agglomeration compared to other effects. With the help of a result matrix, which graphically represents the values of all selectivity indices as colored tiles, one can quickly identify suitable methods and pre-treatment methods.
The screening approach is applied to different case studies for pilot-scale and industrial scale data from bubbling beds and for lab-scale data from a circulating bed. The selectivity indices from different cases have been combined by averaging to reveal which methods are suitable for different agglomeration cases, i.e. which are robust and more generally applicable.
For the combined bubbling bed agglomeration cases several suitable methods were found: • Kolmogorov-Smirnov test of similarity hypothesis acceptance/rejection, based on
the mean crossings data of the pressure fluctuations with zero and with a 15 Hz low-pass filter
• Kuiper test of similarity hypothesis acceptance/rejection, based on the mean crossings data of the pressure fluctuations with zero
• Standard deviation with a 10 Hz high-pass filter • Attractor comparison • Kolmogorov-Sinai entropy • Average cycle time
Apart from this approach to average results from different installations, the
screening methodology can of course be applied to a single process and identify suitable methods specific for that process.
Based on the cases studies and previous investigations a simple model to describe the development of the pressure fluctuations during agglomeration incidents is proposed. This model is characterized by a reduction in amplitude, especially of the higher frequency components, an increase in average cycle time in combination with decreased entropy and a possible decrease of dimensionality and complexity. Agglomeration counteractions Once agglomeration has been detected, counteraction measures have to be taken to avoid further agglomeration and defluidization of the bed. Here, it was investigated whether the attractor comparison method can provide an early enough alarm, based on which counteractions can be taken to avoid defluidization. Furthermore, different counteraction strategies were assessed for their effectiveness. Tests have been carried out on a lab-scale (~1 kWth) and a small commercial scale (~1 MWth) installation.
Without any counteraction, operating times until defluidization of the bed have been shown to vary greatly, considering small variations in the process conditions to be unavoidable. The fact that the agglomeration process is not well reproducible forms
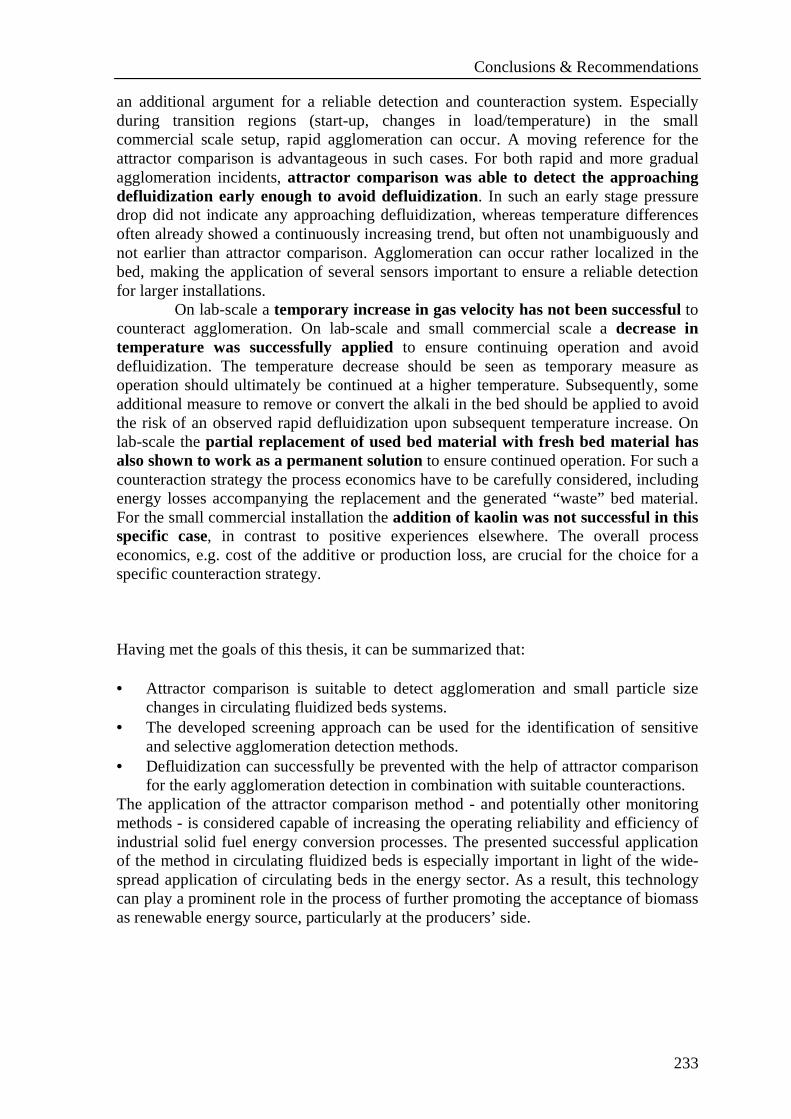
Conclusions & Recommendations
233
an additional argument for a reliable detection and counteraction system. Especially during transition regions (start-up, changes in load/temperature) in the small commercial scale setup, rapid agglomeration can occur. A moving reference for the attractor comparison is advantageous in such cases. For both rapid and more gradual agglomeration incidents, attractor comparison was able to detect the approaching defluidization early enough to avoid defluidization. In such an early stage pressure drop did not indicate any approaching defluidization, whereas temperature differences often already showed a continuously increasing trend, but often not unambiguously and not earlier than attractor comparison. Agglomeration can occur rather localized in the bed, making the application of several sensors important to ensure a reliable detection for larger installations.
On lab-scale a temporary increase in gas velocity has not been successful to counteract agglomeration. On lab-scale and small commercial scale a decrease in temperature was successfully applied to ensure continuing operation and avoid defluidization. The temperature decrease should be seen as temporary measure as operation should ultimately be continued at a higher temperature. Subsequently, some additional measure to remove or convert the alkali in the bed should be applied to avoid the risk of an observed rapid defluidization upon subsequent temperature increase. On lab-scale the partial replacement of used bed material with fresh bed material has also shown to work as a permanent solution to ensure continued operation. For such a counteraction strategy the process economics have to be carefully considered, including energy losses accompanying the replacement and the generated “waste” bed material. For the small commercial installation the addition of kaolin was not successful in this specific case, in contrast to positive experiences elsewhere. The overall process economics, e.g. cost of the additive or production loss, are crucial for the choice for a specific counteraction strategy. Having met the goals of this thesis, it can be summarized that: • Attractor comparison is suitable to detect agglomeration and small particle size
changes in circulating fluidized beds systems. • The developed screening approach can be used for the identification of sensitive
and selective agglomeration detection methods. • Defluidization can successfully be prevented with the help of attractor comparison
for the early agglomeration detection in combination with suitable counteractions. The application of the attractor comparison method - and potentially other monitoring methods - is considered capable of increasing the operating reliability and efficiency of industrial solid fuel energy conversion processes. The presented successful application of the method in circulating fluidized beds is especially important in light of the wide-spread application of circulating beds in the energy sector. As a result, this technology can play a prominent role in the process of further promoting the acceptance of biomass as renewable energy source, particularly at the producers’ side.
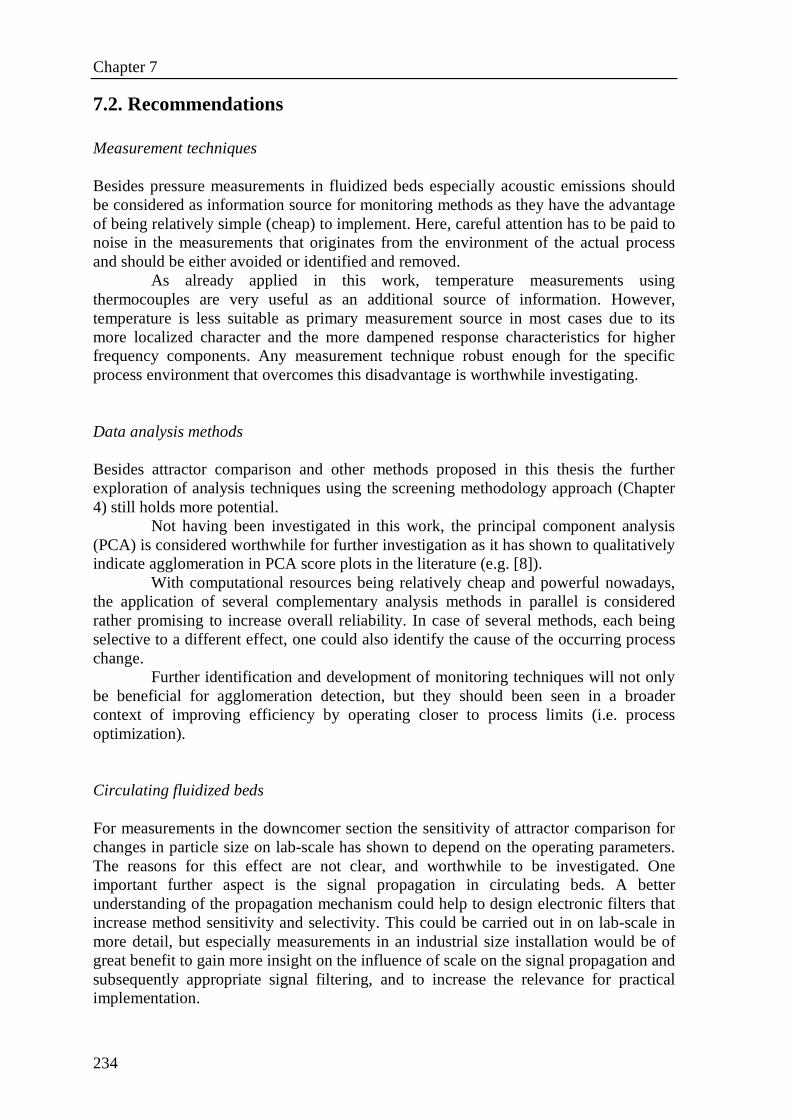
Chapter 7
234
7.2. Recommendations Measurement techniques Besides pressure measurements in fluidized beds especially acoustic emissions should be considered as information source for monitoring methods as they have the advantage of being relatively simple (cheap) to implement. Here, careful attention has to be paid to noise in the measurements that originates from the environment of the actual process and should be either avoided or identified and removed.
As already applied in this work, temperature measurements using thermocouples are very useful as an additional source of information. However, temperature is less suitable as primary measurement source in most cases due to its more localized character and the more dampened response characteristics for higher frequency components. Any measurement technique robust enough for the specific process environment that overcomes this disadvantage is worthwhile investigating. Data analysis methods Besides attractor comparison and other methods proposed in this thesis the further exploration of analysis techniques using the screening methodology approach (Chapter 4) still holds more potential.
Not having been investigated in this work, the principal component analysis (PCA) is considered worthwhile for further investigation as it has shown to qualitatively indicate agglomeration in PCA score plots in the literature (e.g. [8]).
With computational resources being relatively cheap and powerful nowadays, the application of several complementary analysis methods in parallel is considered rather promising to increase overall reliability. In case of several methods, each being selective to a different effect, one could also identify the cause of the occurring process change.
Further identification and development of monitoring techniques will not only be beneficial for agglomeration detection, but they should been seen in a broader context of improving efficiency by operating closer to process limits (i.e. process optimization). Circulating fluidized beds For measurements in the downcomer section the sensitivity of attractor comparison for changes in particle size on lab-scale has shown to depend on the operating parameters. The reasons for this effect are not clear, and worthwhile to be investigated. One important further aspect is the signal propagation in circulating beds. A better understanding of the propagation mechanism could help to design electronic filters that increase method sensitivity and selectivity. This could be carried out in on lab-scale in more detail, but especially measurements in an industrial size installation would be of great benefit to gain more insight on the influence of scale on the signal propagation and subsequently appropriate signal filtering, and to increase the relevance for practical implementation.
Conclusions & Recommendations
235
Screening methodology Besides the presented application of the screening methodology to identify methods sensitive and selective for specific hydrodynamic changes, the methodology will also be useful for the optimization of pre-treatment and method parameters (where applicable). The methodology can be slightly re-defined so that the result matrix will show e.g. only one pre-treatment method with several different parameterizations to identify an optimal parameterization.
The investigation of more band-pass filters should be considered. In this study the pre-treatment did not show any clear improvement over the raw data in most cases, but the number of band-pass filters was limited. Given the fact that much of the signal power in the pressure fluctuations is contained in the lower frequency range, narrow frequency bands at the lower end of the frequency spectrum (up to approx. 10 Hz) should be considered. Agglomeration counteractions Agglomeration counteractions controlled by attractor comparison, or any other potentially useful method, should be implemented in a continuously operated pilot plant to demonstrate that their coupling can be successfully applied also in that case. For this purpose firstly suitable counteraction strategies should be investigated. Preferably a “dual” strategy should be chosen, consisting of one strategy that acts more gradual on longer time scales, e.g. to control the sand replacement rate or additive being fed to the bed, and one “emergency strategy” to avoid defluidization on shorter time scales, e.g. bed temperature reduction. Such a demonstration in a continuously operated pilot plant should also include a quantitative assessment of the process economics, which should comprise avoided shut-downs, bed material replacement and costs for an additive.
For additives against agglomeration it should be investigated how to obtain an optimal distribution of the additive in the bed. An optimal distribution is important to limit excessive material use that negatively effects the overall process economics due to the costs of the additive and potential waste. The processing of additive within fuel pellets appears a promising approach; in this case the additive is more likely to be in the vicinity of the potassium components from the fuel during the conversion process.
7.3. References [1] Ergüdenler A, Ghaly AE. Agglomeration of silica sand in a fluidized bed gasifier
operating on wheat straw. Biomass and Bioenergy 1993;4(2):135-147 [2] Öhman M, Nordin A, Skrifvars B-J, Backman R, Hupa M. Bed Agglomeration
Characteristics during Fluidized Bed Combustion of Biomass Fuels. Energy & Fuels 2000;14(1):169-178
[3] Werther J, Saenger M, Hartge E.-U., Ogada T, Siagi Z. Combustion of agricultural residues. Progress in Energy and Combustion Science 2000;26(1):1-27
[4] van Ommen JR, Coppens MO, van den Bleek CM, Schouten JC. Early Warning of agglomeration in Fluidized Beds by Attractor Comparison. AIChE Journal 2000;46:2183-2197
Chapter 7
236
[5] Nijenhuis J, Korbee R, Lensselink J, Kiel JHA, van Ommen JR. A method for agglomeration detection and control in full-scale biomass fired fluidized beds. Chemical Engineering Science 2007;62(1-2):644-54
[6] van Ommen JR, Schouten JC, van der Stappen MLM, van den Bleek CM. Response characteristics of probe–transducer systems for pressure measurements in gas–solid fluidized beds: how to prevent pitfalls in dynamic pressure measurements. Powder Technology 1999;106(3):199-218 +Erratum
[7] van Ommen JR, van der Schaaf J, Schouten JC, van Wachem BGM, Coppens M-O, van den Bleek CM. Optimal placement of probes for dynamic pressure measurements in large-scale fluidized beds. Powder Technology 2004;139(3):264-276
[8] Öhman M, Nordin A. A New Method for Quantification of Fluidized Bed Agglomeration Tendencies: A Sensitivity Analysis. Energy & Fuels 1998;12:90-94
237
List of publications Malte Bartels, J Ruud van Ommen, John Nijenhuis, Freek Kapteijn. Early Detection of Agglomeration in Circulating Fluidized Bed Gasifiers and Combustors using Attractor Comparison. In: Proceedings of the 8th International Conference on Circulating Fluidized Beds, Hangzhou, China, May 10-13 (2005), ISBN: 7-5062-7442-6 Malte Bartels, John Nijenhuis, Willem van de Kamp, Jasper Lensselink, Jaap Kiel, Marco Dek, Thijl Adrichem, Freek Kapteijn, J Ruud van Ommen. Early Agglomeration Recognition System (EARS) for Industrial Circulating Fluidized Bed Conversion. 19th International Conference on Fluidized Bed Combustion, Vienna (May 21-24 2006); In: "PROCEEDINGS 19th FBC Conference", Part 2 (2006), ISBN 3-200-00645-5 J Ruud van Ommen, John Nijenhuis, Malte Bartels, Flip Kleijn van Willigen, Marco Dek, Filip Loossens, Ton CPM Backx. Monitoring industrial polymerisation reactors for early detection of agglomeration. In: Dhodpkar, S., Klinzing, G., Hrenya, C., Proceedings of the Fifth World Congress on Particle Technology, Orlando, USA, paper 78e (2006) Maykel Verschueren, Ruud Verdurmen, Ton Backx, Johan EAM van der Knaap, Malte Bartels, John Nijenhuis, J Ruud van Ommen. Dynamic stickiness measurements by attractor comparison: a feasibility study. In: Proceedings 10th International Conference on Liquid Atomization and Spray Systems (CD-Rom), ICLASS-2006, Kyoto, Japan, August 27 - September 1, pp. 1-5 (2006) Malte Bartels, Bart Vermeer, John Nijenhuis, J Ruud van Ommen, Freek Kapteijn. Towards Selective Agglomeration Detection in Fluidized Beds Using Advanced Signal Analysis Methods. In: The 12th International Conference on Fluidization - New Horizons in Fluidization Engineering, p.441-448, ISBN: 978-0-918902-57-3 (2007) J Ruud van Ommen, Malte Bartels, Jasper Lensselink, Flip Kleijn van Willigen, Willem van de Kamp, John Nijenhuis. Early Agglomeration Recognition Systems (EARS): Monitoring Industrial Circulating Fluidized Bed Conversion. In: Proceedings of the 9th International Conference on Circulating Fluidized Beds, May 13-16, 2008, Hamburg, Germany Malte Bartels, Weigang Lin, John Nijenhuis, Freek Kapteijn, J Ruud van Ommen. Agglomeration in fluidized beds at high temperatures: Mechanisms, Detection and Prevention. Progress in Energy and Combustion Science 2008;34(5):633-666 Malte Bartels, J Ruud van Ommen, John Nijenhuis, Marcin Siedlecki, Wiebren de Jong. Detecting and Counteracting Agglomeration during Combustion of Agricultural Residues and Wood in a 1 MWth Bubbling Fluidized Bed Boiler. In: Proceedings of the 16th European Biomass Conference & Exhibition, p. 1551-1559 (June 2-6, 2008, Valencia, Spain) ISBN: 978-88-89407-58-1
238
Malte Bartels, John Nijenhuis, Freek Kapteijn, J Ruud van Ommen. Detection of agglomeration and gradual particle size changes in circulating fluidized beds. Powder Technology (submitted, 2008) Malte Bartels, Bart Vermeer, Peter Verheijen, John Nijenhuis, Freek Kapteijn, J Ruud van Ommen. Methodology for the screening of signal analysis methods for selective detection of hydrodynamic changes in multiphase reactors. Ind. Eng. Chem. Res. (submitted, 2008) Malte Bartels, John Nijenhuis, Freek Kapteijn, J Ruud van Ommen. Case studies for selective agglomeration detection in fluidized beds: Application of a new screening methodology. Powder Technology (submitted, 2008) Malte Bartels, John Nijenhuis, Jasper Lensselink, Marcin Siedlecki, Wiebren de Jong, Freek Kapteijn, J Ruud van Ommen. Detecting and counteracting agglomeration in fluidized bed biomass combustion. Energy & Fuels (submitted, 2008)
239
Acknowledgements There is much I am thankful for, without the contribution and support of many different people the successful completion of this work would not have been possible. In de eerste plaats dank ik mijn directe begeleider Ruud. Ruud, jij hebt het mogelijk gemaakt dat ik een goede start en ook succes met mijn project had. Je hebt me vakinhoudelijk geduldig begeleid, vaak de weg bereid voor interessante externe samenwerkingen en me veel ruimte voor ontwikkeling binnen dit project gegeven. Veel van jouw werk was op de achtergrond en daarom vaak niet direct zichtbaar – daarom speciale waardering en dank hiervoor. Tegelijkertijd is jouw enthousiasme voor de wetenschap en onderwijs voor mij altijd motiverend geweest. Mijn dank ook voor jouw luisterend oor en advies rondom mijn vragen en ideeën rondom geloof en toekomstperspectief. John, jij hebt me op veel vlakken begeleid en uitgedaagd, mijn dank hiervoor! In dit rijtje staat natuurlijk alles rondom experimenteel werk in de Proeffabriek, veel over projectmanagement, “politiek”, duurzaamheid, geloof en bewustwording van sterktes/valkuilen van mezelf en anderen – maar ook persoonlijke dingen. En niet te vergeten jouw vragen bij werkbesprekingen of ik e.e.a. aanname wel “ook wel gecheckt heb” en of ik niet wel een moving referentie wil gaan gebruiken: belangrijk om scherp te blijven, dus ook mijn dank hiervoor. Freek, mijn dank gaat aan jou voor een scherpe blik en nieuwe impulsen van buitenaf wanneer ik met mijn neus te dicht op het werk zat. Ondanks jouw drukke agenda was je er voor alle belangrijke vragen en commentaar. Ook al het commentaar in hoofdstukken en papers om het nog compacter te formuleren waren zeer leerzaam voor mij. Meerdere afstudeerders hebben een belangrijke bijdrage aan dit werk geleverd. Roos, jij hebt een cruciale start gemaakt met het onderzoek rondom het monitoren van CFBs. Patrick, door jou werk hebben wij meer inzicht en kennis gekregen rondom het maken van agglomeraten op lab-schaal. Johan, jij hebt nieuwe inzichten over de toepassing van monitoren in het droogproces voor melkpoeder verworven. Roderik, jij hebt niet alleen belangrijke inzicht over agglomeratie detectie in CFBs opgedaan, maar ook een drietal sub-projecten heel goed kunnen managen. Bart, jij hebt een handige toolbox voor het screenen van signaal analyse technieken opgezet, wat ook voor volgend onderzoek cruciaal was. Hélène, you have obtained many nice agglomeration data sets and successfully applied our toolbox. Ik ben dankbaar voor het vele werk dat jullie verricht hebben, maar ook dat ik jullie mocht begeleiden! Within my PhD project, I had the opportunity to work together with different people from outside the department. From the Energy Technology group at TU Delft I thank Wiebren de Jong, Atif Khan and especially Marcin Siedlecki for their input within our cooperation and experimental support, both with the CFB and the Crone boiler. From ECN I thank Jasper Lensselink for all his help, support and answering the many questions in the various projects we have cooperated in. I thank Peter Verheijen from former DCT and now biotechnology department for his helpful critique on all signal analysis related topics and all

240
stimulating ideas. From Ipcos Technologies I thank Flip Kleijn van Willigen and Marko Dek for their help and support with DyMonT. From Chalmers University I thank Filip Johnsson, Lars-Erik Åmand, Srdjan Sasic, Andreas Johansson and Johannes Öhlin for all their support during my measurement campaign at the CFB boiler. From the Kramers Lab I thank Jaap van Raamt for his help with the big fluidized bed. From within the department I thank Jacob Moulijn, through whom I laid the first contact with TU Delft. Flip, thank you for the nice birthday balloons back then and your help with different experimental issues. Dana, thank you for your experimental support and being a nice partner for fruitful discussions. Stefan, thank you for all support related to signal analysis. Ruud (Monna), dank voor jouw ondersteuning, die altijd uiterst “handig” voor mij was. Els, Elly, Caroline, bedankt ook voor jullie hulp bij het regelen van alle praktische zaken. Daniel en Johan, dank voor de samenwerking bij CARE. David (Vervloet), bedankt voor de wetenschappelijke en leuke discussies. David (Newsome), ter oefening van jouw Nederlands: bedankt voor alle gesprekken en dat het me je nooit saai wordt in de Proeffabriek. Renske, Mark, Bogdan, bedankt ook voor jullie. Final thanks are to former Proeffabriekers Koroush, Vijay, Prashant, Kalyani, Eivind, Søren, all Vincents, Ali, Mike, Alex, Jeroen, Aylin, Hamed, Birol, Ronald, Andres, Marnix, Sijbe, Michael, Koos - plus all other CE & PPE members! Besides supervisors and colleagues also many other friends and my family have helped and supported me during this PhD project. Ich danke meinen Eltern Klaus und Anita, meinem Bruder Frank und meinem Onkel Klaus für alle Unterstützung, Fragen und Ideen. Ihr ward, auch wenn etwas weiter weg, der konstante Faktor! Hiernaast ben ik gesteund door veel mensen van Xperiment, dank aan jullie allemaal. Mijn speciale dank aan de mannen van het kernteam, bijzonder dank aan Karsten, voor jullie gebed en steun - Spreuken 27:17! De Morgenstond-kring in wisselende bezetting was ook erg belangrijk voor mij, bijzonder dank aan Mark een Aafke. Niet te vergeten de hele groep van de Discipelschapstraining, met Petra en Marieke naast mij. My final thankful words go to Jesus Christ, both my Saviour and Lord, who was there for me at all times. He is at the bottom of this list, forming the foundation upon this work has been built.
241
About the author Malte Bartels was born on July 3rd 1977 in Flensburg, Germany. In 1997 he obtained his high-school diploma (Abitur), also in Flensburg. After a 6-month internship in a shipbuilding company he enrolled at the University of Applied Sciences (Fachhochschule) Flensburg in Process Engineering (Verfahrenstechnik). In 2001, he won a Fulbright scholarship and moved to Cleveland (Ohio, USA) to study at Cleveland State University. There he carried out a research project on the stability analysis of autothermal radial flow reactors at the “Reaction Engineering Group” of the Department of Chemical Engineering under the supervision of Prof. Dr. Jorge E. Gatica. Based on a sub-topic of this project, he completed his German thesis under the supervision of Prof. Dr. Hans-Horst Erdmann and received his engineering diploma (Diplom-Ingenieur (FH)) from the University of Applied Sciences Flensburg in 2002. He subsequently also completed his research project at the Cleveland State University and received his degree as Master of Science in Chemical Engineering from Cleveland State University at the end of 2003. In early 2004 Malte Bartels started as a PhD-student at the Delft University of Technology (Delft, The Netherlands) in the Reactor & Catalysis Engineering group (later Product & Process Engineering), under the supervision of Prof.dr. Freek Kapteijn, Dr.ir. Ruud van Ommen and Ir. John Nijenhuis. The topic of his research was the investigation of methods for the early detection and counteraction of agglomeration in fluidized beds, specifically applied to combustion and gasification of biomass. During this work, he spent 1.5 months as a visiting PhD-student at the Energy Technology group at Chalmers University of Technology (Gothenburg, Sweden). His PhD-work was completed in 2008 and its results are presented in this thesis.
242
Related Documents