Welcome message from author
This document is posted to help you gain knowledge. Please leave a comment to let me know what you think about it! Share it to your friends and learn new things together.
Transcript


Agenda of the Tour
2
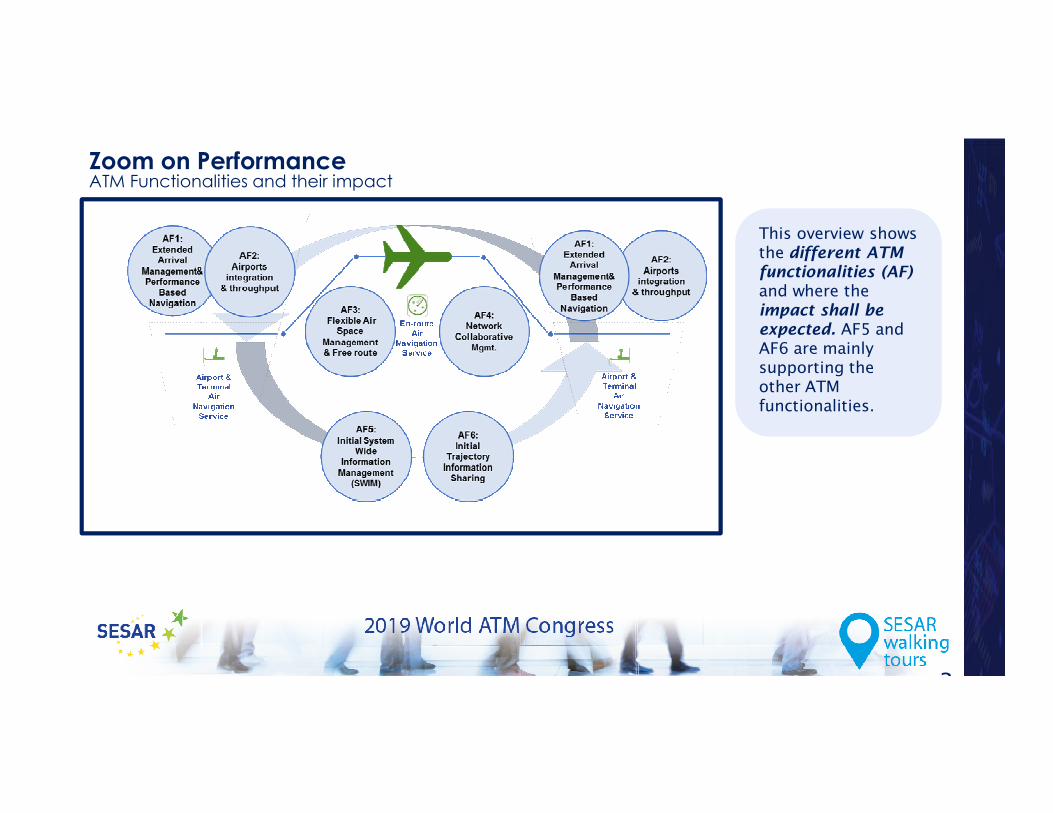
Zoom on PerformanceATM Functionalities and their impact
This overview shows the different ATM functionalities (AF) and where the impact shall be expected. AF5 and AF6 are mainly supporting the other ATM functionalities.
3

Zoom on PerformanceKey Performance Indicators
In green, KPIs referring to strategic inefficiencies (planned)
In blue, KPIs referring to tactical inefficiencies (unplanned)
4
This figure shows the Key Performance Indicators that are used in the Performance assessment. Units can be minutes, tons of fuel/CO2, or Euros
En-route
Horizontal En-Route flight efficiency
En-Route determined unit cost
En-Route Air Traffic Flow Management delay
Taxi
Airport &Terminal
Air Navigation
Service
Approach
Airport &Terminal
Air Navigation
Service
Air Traffic Control Delay
Terminal Air Navigation Service Costs
Airport Air Traffic Flow Management delay
Additional time in taxi-in
Unimpeded time in Arrival Sequencing and Metering Area
Additional time in Arrival Sequencing and Metering Area
Cancellations
Unimpeded time in taxi-out
Additional time in taxi-out
Taxi
Fuel Co2 Flight
time
Zoom on PerformanceKey Performance Areas
This table shows the classification of Key Performance Indicators (KPI) into the 4 main Key Performance Areas (KPA)
5
KPAs (Key Performance Areas) KPIs (Key Performance Indicators)
Cost Efficiency Gate to Gate ANS cost (in €)
Capacity Departure Delay (in minutes):
• Airport ATFM Delay
• En-Route ATFM Delay
• ATC Delay
Cancellations (in number of events)
Operational Efficiency Flight Time (in minute):
• Unimpeded ASMA Time
• Additional ASMA Time
• Unimpeded Taxi-in Time
• Additional Taxi-in Time
• Unimpeded Taxi-out Time
• Additional Taxi-out Time
• Horizontal Flight Time
Fuel consumption (in tons of fuel)
Environment CO2 emissions (in tons of CO2)

Extended Flight
Plan
Rolling Airspace
Capacity
Management
Extended Arrival
Management
Network Collaborative
Management
STAM Phase 2 in
Combination with
Target Times
Free Route
Zoom on PerformanceGate2Gate

Zoom on PerformanceMaster Plan ambitions for 2035
This figure shows, foreach KPI, the MasterPlan targets (or“ambitions“) definedfor 2035 (note that aMaster Plan update isongoing)
7

Zoom on PerformancePortfolio of completed projects (end of 2018)
8
€ 2.188 M
* Undiscounted values
€ 2.85 billion Investment
349Projects
Benefits expectations presented bothin units and Euros, for the portfolio of100 completed projects (end of 2018)
Operational
Efficiency
738
thousandMinutes saved
29 millionEUR saved
KPI-specific unit MonetizedKPA
Expected savings, 2019*
Environment
12.2
thousandTons fuel saved38.3 thousand
Tons CO2 saved
10 millionEUR saved
134 millionEUR saved
Capacity 363
thousandMinutes saved
10 millionEUR saved
178 millionEUR saved
484 millionEUR saved
Monetized
Exp. Cumulative
savings 2014-2030*
71 Completed IPs
delivering sustainable
benefits
€ 90 M
€ 313 M
€ 2,428 M
249

Thank you
Ralph Schwarzendahl,
Senior Expert Cost Benefit
SESAR Deployment Manager
9
€ 2.188 M
€ 90 mio
€ 313 mio
€ 2,428 mio


Traffic Complexity Tools
• Implementation period: 02/2016 – 11/2018
• Costs: €1.45M
• Co-funded by EU under SESAR Deployment Programme
Identified benefits cumulated until 2030
Airport ATFM
Delay reduction
320K
Minutes
KPI
Units
Savings of €8.9M

Traffic Complexity Tools
How does it work?

Traffic Complexity Tools
TCM main functions:
• Presentation of the occupancy counts of the selected sectors
• Support of handling sector overload (What-if Analysis)
• Presentation of load of adjacent FIRs (Sectors adjacent to LKAA)
In the FMP position, it is possible to visually compare the occupancy prediction of the
traffic load with the occupancy on the simulated sectors.
When OC exceeds maximum OC defined for the sector, TCM helps to spread the traffic
into the Lower sectors. TCM shows all A/C in this period and highlighted the
candidates for descent.
Note: Traffic which will descent anyway due to LoA with adjacent sectors.

Traffic Complexity Tools
1st Step:
Traffic
Analysis

Traffic Complexity Tools
2nd Step:
Implementation
of Changes

Traffic Complexity Tools
3rd Step:
What-if
Analysis

Traffic Complexity Tools
4th Step:
Implementation
of Changes
If you are satisfied with the result,
you should call the FMP of the
neighboring sector(s) and ask them
to apply these changes.

Traffic Complexity Tools
TCM other functions:
• Highlighting of the prohibited areas, which appears during the
activation time according AUP/UUP
• Presentation of future traffic situation via „radar picture like“ window
Future development
• Provide updates to NMOC (RWY in use, sectorization)
• Replace AFTN by B2B for DPI, AFP messages
• Further development of FMP functions


TRAFFIC COMPLEXITY
ASSESSMENT TOOL
(tCAT)

ANALYSIS OF THE
COMPLEXITY OF THE ATC
OPERATIONS
COMBINATION OF THE
PREDICTED TRAFFIC
AND A SET OF
OPERATIONAL MODELS
ACCURATE PLANNING OF
ANSP RESOURCES
COGNITIVE WORKLOAD
ASSESSMENT
GENERAL
MANAGE THE COMPLEXITY
IN AN EFFICIENT AND
COST-EFFECTIVE MANNER
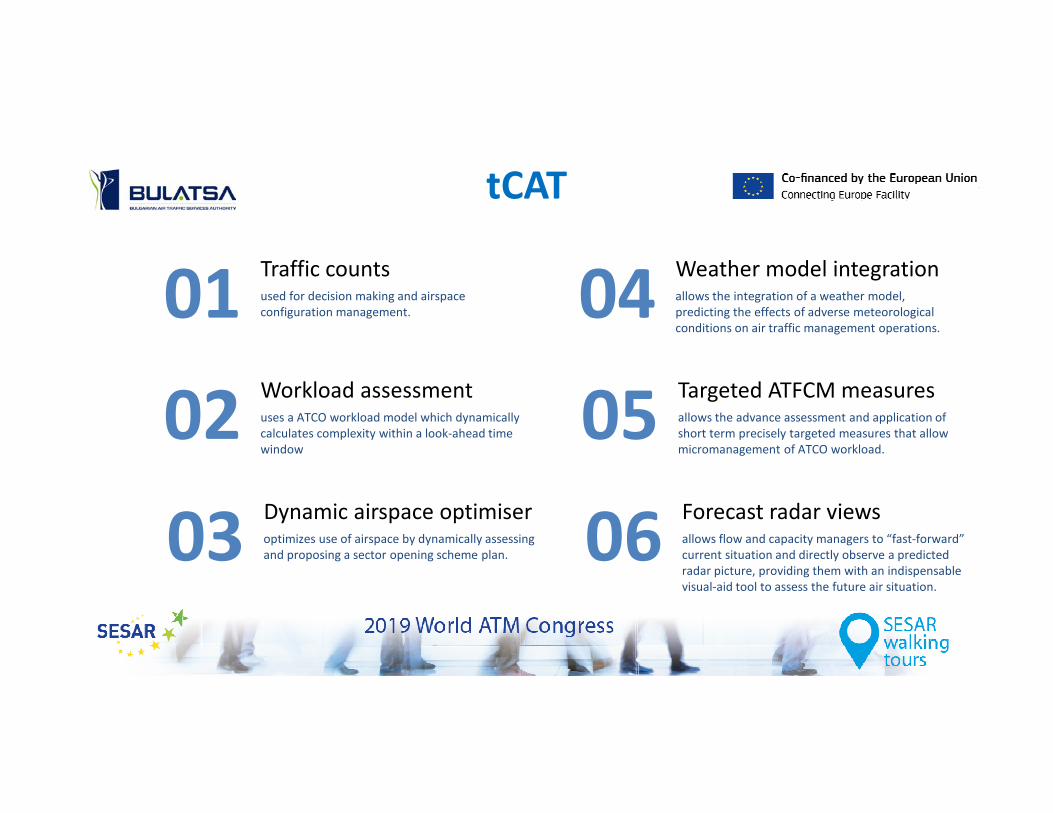
01Traffic countsused for decision making and airspace
configuration management. 04Weather model integrationallows the integration of a weather model,
predicting the effects of adverse meteorological
conditions on air traffic management operations.
02Workload assessmentuses a ATCO workload model which dynamically
calculates complexity within a look-ahead time
window
05Targeted ATFCM measuresallows the advance assessment and application of
short term precisely targeted measures that allow
micromanagement of ATCO workload.
03Dynamic airspace optimiseroptimizes use of airspace by dynamically assessing
and proposing a sector opening scheme plan. 06Forecast radar viewsallows flow and capacity managers to “fast-forward”
current situation and directly observe a predicted
radar picture, providing them with an indispensable
visual-aid tool to assess the future air situation.
tCAT
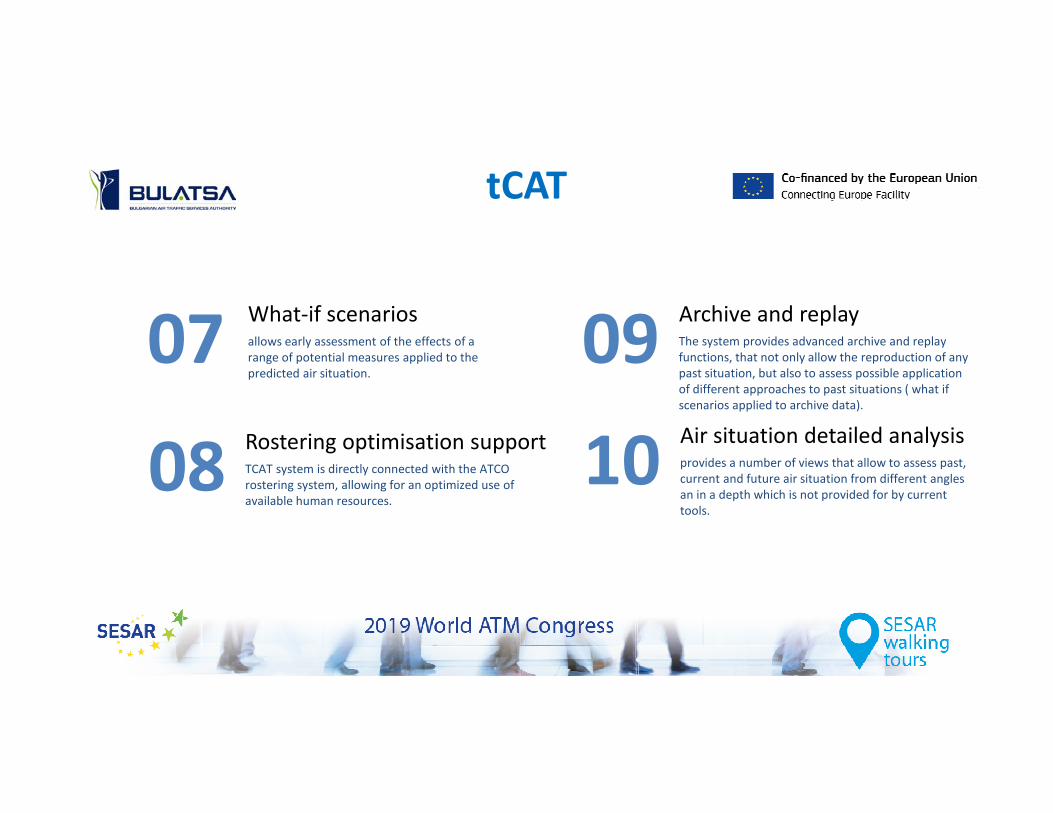
tCAT
07What-if scenariosallows early assessment of the effects of a
range of potential measures applied to the
predicted air situation.
09Archive and replayThe system provides advanced archive and replay
functions, that not only allow the reproduction of any
past situation, but also to assess possible application
of different approaches to past situations ( what if
scenarios applied to archive data).
08Rostering optimisation supportTCAT system is directly connected with the ATCO
rostering system, allowing for an optimized use of
available human resources.
10Air situation detailed analysisprovides a number of views that allow to assess past,
current and future air situation from different angles
an in a depth which is not provided for by current
tools.

2015 2016 2017 2018 2019 202020142013
Pre-Feasibility Study
CEF Call 2015 Application
Best Practice Study
CONOPS & Specs
Implementation and
Validation
Approvals
Monitoring
DecisionGrant
Agreement
Grant
Agreement
Supplier
Contract
Supplier
ContractOperations Benefits
THE PROJECT
Safety Activities
Procurement
Today

THANK YOU


SESAR 2020 PJ 07-OAUO
Optimised Airspace Users Operations REUBER, Edgar
EUROCONTROL
DECMA, CMC, ARD
DELCOURTE, Kris
Project Manager PJ07
EUROCONTROL

What is OAUO?
• Industrial Research (IR) Project of SESAR 2020 Programme
• Situated in the domain of the Network Management
• Central focus on the Airspace Users
• Optimising Airspace Users tools and processes in their
interaction with the Network Management processes and
tools
• Organised in 3 Solutions
Solution 1 AU Processes for Trajectory Definition
• (Civil) Planning Service in the preliminary Flight Planning phase
• Better integration of Flight Planning and DCB processes and more automation
• enriched Demand and Capacity Balancing (DCB) information to AUs (hotspots,
congestion indicators)
• AU preferences as input to DCB
• Part of the FF-ICE Concept (ICAO)

Solution 2 AU’s Fleet Prioritisation with UDPP, the User-Driven Prioritisation Process
• Provides AU flexibility to reduce impact of delay on their operations
• Allows AUs to prioritise on flights in case of delay in Pre-Flight phase
• Via collaborative processes at airports and in network DCB processes
• In collaboration with Airport Operation Centre (APOC), validation of UDPP in
Arrival Constraint
• Exploratory Research on:– Low Volume Users
– Absolute Priorities for Selecting Flights in DCB measures

Solution 3: Mission Trajectory Driven Processes
• Wing Operation Centers (WOC) and their interactions with other ATM
stakeholders (e.g. ATC), especially with the Network Manager
• Refine the Mission trajectory concept
• Focus on harmonisation of improved OAT flight plans
• Integration of the improved OAT flight plans in the ATM Network:– preparation and submission of the iOAT flight plans by WOC
– processing and distribution of iOAT by NM function
– ASM interaction with WOC and NM
– WOC and ATC interaction
• In Planning and Execution phase

Total cost of Delay in 2018: 17.6 billion €
Solution 1 Business Trajectory
Better planning and stability of the traffic due to taking Network constraints into account in preliminary Planning phase
Improved Predictability and Fuel Efficiency
Better use of spare capacity
Solution 2 UDPP
Potential cost savings for the AUs: 4900€ per slot swap
In a hotspot: 5 to 15% of cost reduction
Selective Flight Protection will improve punctuality
Potential of saving 100 millions of Euros over 20 years
Solution 3 Mission Trajectory
Better Network View of ALL traffic allowing better predictability of the network (leading to improved capacity planning)
PJ07 Benefits
PJ07 Will bring tangible Benefits for the AUs taking into account the overall
Network impact


Airport Post Operations Analysis
• Allows an airport to:
– Compare daily
operations against
benchmarks
– Set realist targets
– Find correlations
– Make predictions
– Improve A-CDM
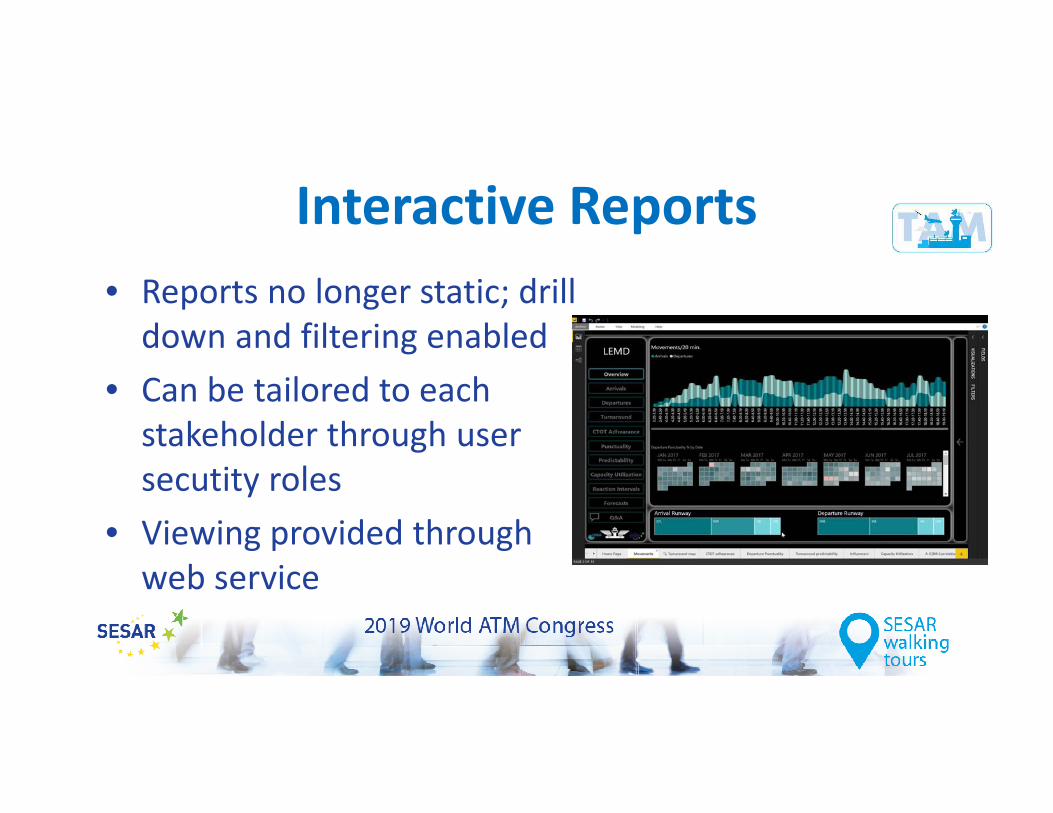
Interactive Reports
• Reports no longer static; drill
down and filtering enabled
• Can be tailored to each
stakeholder through user
secutity roles
• Viewing provided through
web service
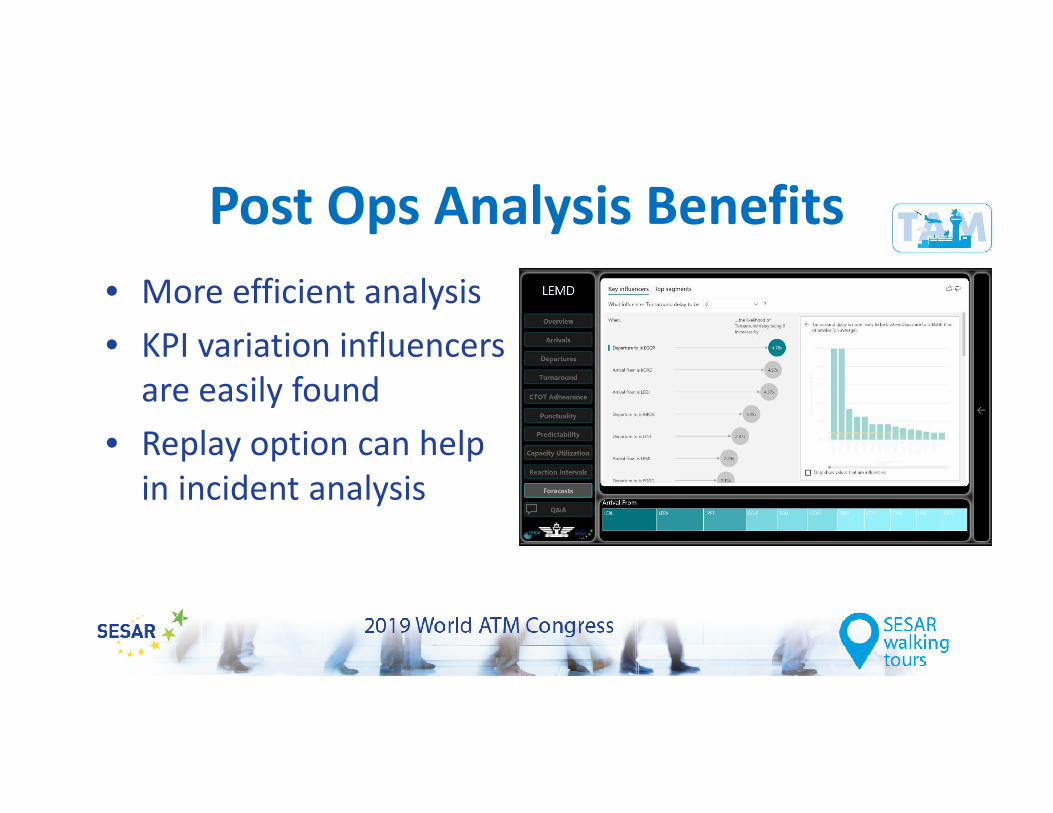
Post Ops Analysis Benefits
• More efficient analysis
• KPI variation influencers
are easily found
• Replay option can help
in incident analysis

Feedback to Operations
• Current work
– Probabilities to fed into the Execution
phase
• Example
– On-time departure probability for flight
ABC1234 given an (x)min. arrival delay
– Confidence interval for that prediction
• Current work
– Probabilities to feed
into Execution phase

Thanks for your time
More information: SESAR JU PJ04
https://www.sesarju.eu/projects/TAM


What is eCOMMET?enhanced COMplexity ManagEment Tool
eCOMMET is a
supporting tool based
on Complexity to
balance demand and
capacity

eCOMMET Foundations• Research Goal: Achieve a set of
metrics to assess complexity considering:– Traffic Controller cognitive
limitations
– Prediction in short-term
– Meaningful information for demand and capacity decisions
• Multidisciplinary group composed by Engineers, Cognitive Psychologists and ATC operational staff.

Cognitive Complexity*• Cognitive Complexity represents the
cognitive difficulty of controlling an air traffic situation.
– Cognitive challenge of ATC is one of the fundamental limits of airspace capacity
• ATM inherent structure is an important factor in cognitive complexity
– Not considered on most complexity metrics (acft densities, occupancy, potential conflicts)
• Structured-Based Abstractions are mechanisms of cognitive simplification to reduce complexity *[Histon & Hansman, 2008]

Structured-Based Abstractions
• Standard Flows– Aircraft classified into standard and non-standard
classes
– Simplify dynamics calculations
• Groupings– Common properties (FLs, performances, origin,
destination) define non-interacting groups of aircraft
– Simplify projections and pair-wise comparisons
• Critical Points– High Priority regions where ATCO expect
recurring problems (conflicts)
– Simplify the problem from 4D to 1D “time-of-arrival”
*[Histon & Hansman, 2008]

Complexity Metrics
Standard Flows
Groupings
Critical Points
Flights out of standard flows
Standard Flows Interactions
Aircraft with non common performance within a flow
Flights in Evolution vs. Established Flights
Potential Conflicts not belonging to Critical Points
COGNITIVE
COMPLEXITY
COGNITIVE
COMPLEXITY

The Tool Prototype used in SESAR JU PJ09 validation activities

Thanks for your time!
More information: SESAR JU PJ09
https://www.sesarju.eu/projects/dcb


First European Implementation of PInS
Procedures to Support Medical Emergency
Operations
(G. Graziano)

HEMS Operations, constrains and expectations
Helicopter Emergency Medical Services,
especially in complex environment or when a
prompt intervention is crucial, represent the
best mean to treat patients in a reasonable
time frame and improve survival probability
On the other hand HEMS operations
represent one of the most expensive
prehospital systems thus Health Service
Managers expect to maximise the use of such
“infrastructure”
Majority of HEMS interventions are conducted between secondary landing locations (e.g. helipad at
hospitals) thus very often not supported by radionavigation aids and subject to VFR. In several places
especially the lack of VMC represents a strong limiting factor for operations.
GNSS (EGNOS) Point In Space (PInS) procedures provide flexible solutions specific for helicopters and can
be successfully used to improve operations of HEMS
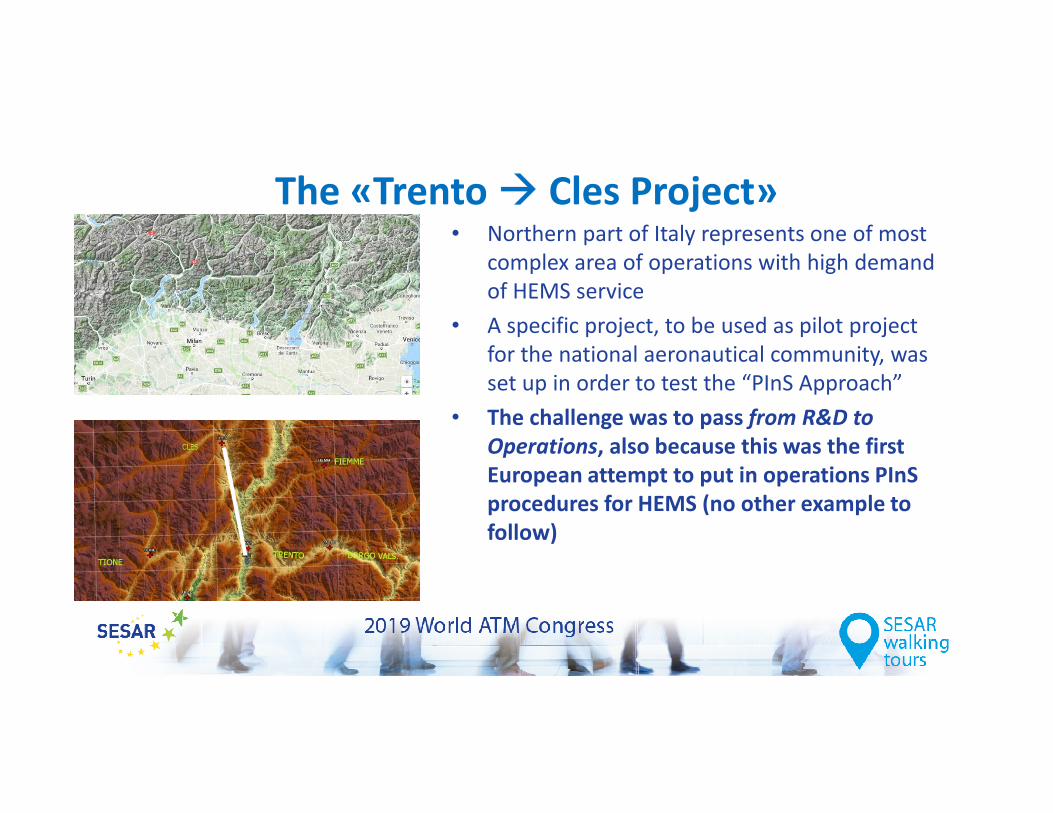
The «Trento Cles Project»• Northern part of Italy represents one of most
complex area of operations with high demand
of HEMS service
• A specific project, to be used as pilot project
for the national aeronautical community, was
set up in order to test the “PInS Approach”
• The challenge was to pass from R&D to
Operations, also because this was the first
European attempt to put in operations PInS
procedures for HEMS (no other example to
follow)

The «Trento Cles Project»
Main elements of complexity are:
• Orography
• PInS developed in Class G Airspace
• poor radio coverage In some valleys
• Interaction of PInS with existing IFPs of
Bolzano and Trento Airport
• Possible lack of EGNOS coverage
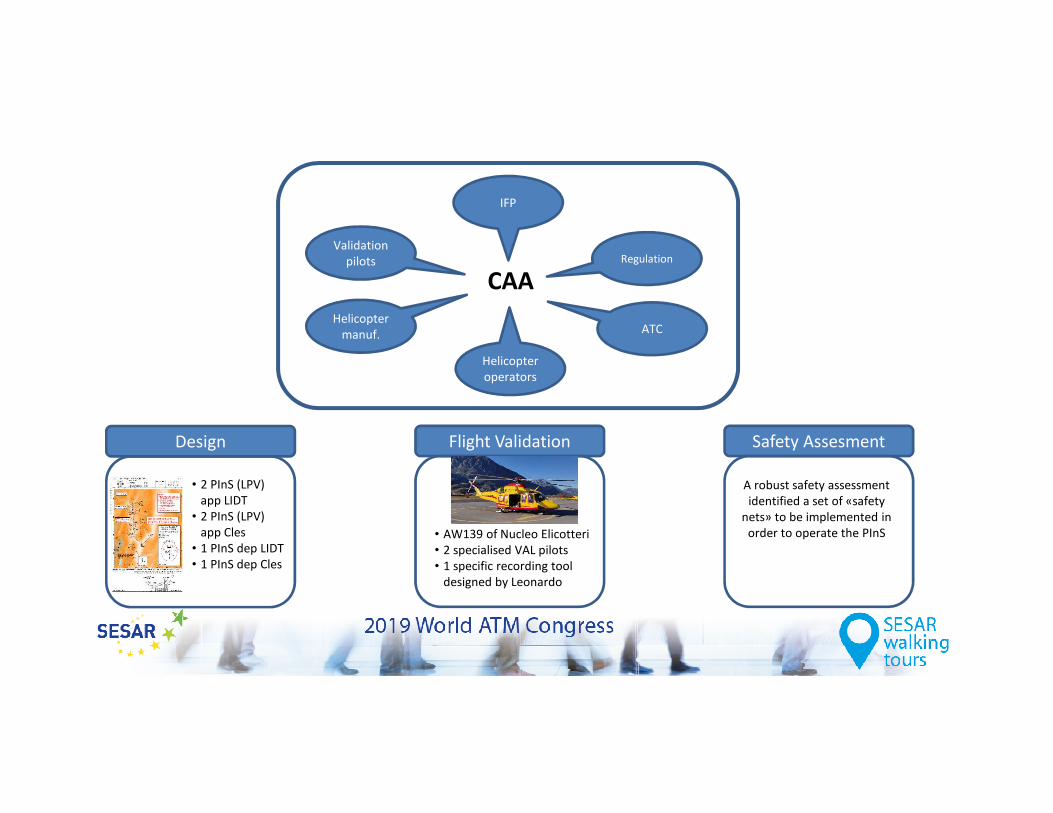
Regulation
ATC
IFP
Helicopter
operators
Validation
pilots
Helicopter
manuf.
CAA
Design Safety AssesmentFlight Validation
• 2 PInS (LPV)
app LIDT
• 2 PInS (LPV)
app Cles
• 1 PInS dep LIDT
• 1 PInS dep Cles
• AW139 of Nucleo Elicotteri
• 2 specialised VAL pilots
• 1 specific recording tool
designed by Leonardo
A robust safety assessment
identified a set of «safety
nets» to be implemented in
order to operate the PInS
• Mid 2018 the Italian CAA approved all the elements of the project
(design, validation, safety) giving the green light to publication (AIP)
• The only prescription is related to an “experimental period” of six months
to collect operational feedbacks and technical data. In this period the
procedure can be flown only under VMC conditions
• The procedures have been published in AIP SUP S15/2018 (effective date
31/01/2019) … they are alive and kicking!!

Credits
PROVINCIA AUTONOMA DI TRENTO

Improved parallel approaches
PJ.01.03A
WAC Madrid, 12th March 2019
Introduction
Context: study conducted as part of SESAR2020 project 1, solution 3A,
with Paris-CDG
Focus: independent parallel approach operations
Motivations: reinforce safety at ILS intercept, reduce environmental
impact (noise)
Solution: use of performance based navigation (PBN) connecting to
final approach (ILS) with dedicated ATC procedures
[Insert name of the presentation] 2

Baseline: vectoring to ILS
Consequences: trajectory dispersion at low altitude, high controller
workload, limited pilot situational awareness, no standardised
intercept, runway crossing near final
[Insert name of the presentation] 3

Solution: PBN to ILS
Principles: segregation of arrival flows, standardised operating method
Elements:
• initial PBN segments to facilitate sequencing (direct to merge point)
• final PBN to ILS segments to guarantee standard intercept
• crossing downwing segments to reduce need for crossing near final
[Insert name of the presentation] 4

Outcomes
• Operability: feasible and usable in a typical dense and complex
environment
• Systematisation: limited radar vectoring and systematic use of
direct-to instructions
• Safety: effective segregation of arrival flows with regular traffic
patterns
• Environment: slightly higher vertical profiles and limited dispersion
at low altitude
[Insert name of the presentation] 5
Related Documents