AGENDA ITEM EXECUTIVE SUMMARY: School-Specific Academic Goals Request Kaizen Education Foundation dba Colegio Petite Arizona (“Charter Holder”) operates Colegio Petite Arizona (“School”) which serves a special population that does not have an achievement profile for state accountability. The School is petitioning the Board for the use of the School-Specific Academic Goals for FY 2018 and beyond. On March 29, 2019, the Charter Holder submitted a petition to the Board to adopt school-specific academic performance goals for FY 2018 and FY 2019. See Appendix A: School Specific Academic Goals School-Specific Academic Goals School Name Colegio Petite Arizona Mission Statement The mission of Colegio Petite Arizona is to provide a rich, bilingual K-8 environment that offers a robust program of academics steeped in arts, multi-cultural experiences, and technology. Grade Levels Served K-5 Population Colegio Petite Arizona operates a Spanish-English dual language program in Nogales. The population served by the School is 97% Free and Reduced Lunch and 99% Hispanic or Latino. 76% of students enrolled at the School are identified as English Language Learners. Summary of Proposed Goals Goal Staff Analysis Student Growth – Reading 25% of students will meet growth goal on NWEA benchmark assessment. Exceeds: 26% or more Meets: 20% to 25% Does Not Meet: 15% to 19% Falls Far Below: 14% or less The Charter Holder proposes growth targets for all students measured using the projected growth goals from the beginning to the end of the year as determined by the NWEA MAP assessment. These growth goals are based on the student’s grade level and mean Rasch UnIT (“RIT”) score, and are set by the NWEA assessment system. NWEA assessments are conducted three times yearly. NWEA does not take into account the English proficiency level of the student when setting the growth goal; therefore, a target of 20–25% of students meeting the goal was set based on trends in the School’s data. Student Growth – Math 25% of students will meet growth goal on NWEA benchmark assessment. Exceeds: 26% or more Meets: 20% to 25% Does Not Meet: 15% to 19% Falls Far Below: 14% or less The Charter Holder proposes growth targets for all students measured using the projected growth goals from the beginning to the end of the year as determined by the NWEA MAP assessment. NWEA does not take into account the English proficiency level of the student when setting the growth goal; therefore, a target of 20–25% was set based on trends in the School’s data. Student Achievement – Reading Goal 1: Goal 1: The Charter Holder proposes targets for non-ELL students measured using the RIT scores as determined by the NWEA MAP assessment.

Welcome message from author
This document is posted to help you gain knowledge. Please leave a comment to let me know what you think about it! Share it to your friends and learn new things together.
Transcript

AGENDA ITEM EXECUTIVE SUMMARY: School-Specific Academic Goals Request Kaizen Education Foundation dba Colegio Petite Arizona (“Charter Holder”) operates Colegio Petite Arizona (“School”) which serves a special population that does not have an achievement profile for state accountability. The School is petitioning the Board for the use of the School-Specific Academic Goals for FY 2018 and beyond. On March 29, 2019, the Charter Holder submitted a petition to the Board to adopt school-specific academic performance goals for FY 2018 and FY 2019. See Appendix A: School Specific Academic Goals
School-Specific Academic Goals
School Name Colegio Petite Arizona Mission Statement The mission of Colegio Petite Arizona is to provide a rich, bilingual K-8 environment that
offers a robust program of academics steeped in arts, multi-cultural experiences, and technology.
Grade Levels Served K-5 Population Colegio Petite Arizona operates a Spanish-English dual language program in Nogales. The
population served by the School is 97% Free and Reduced Lunch and 99% Hispanic or Latino. 76% of students enrolled at the School are identified as English Language Learners.
Summary of Proposed Goals
Goal Staff Analysis
Student Growth – Reading 25% of students will meet growth goal on NWEA benchmark assessment. Exceeds: 26% or more Meets: 20% to 25% Does Not Meet: 15% to 19% Falls Far Below: 14% or less
The Charter Holder proposes growth targets for all students measured using the projected growth goals from the beginning to the end of the year as determined by the NWEA MAP assessment. These growth goals are based on the student’s grade level and mean Rasch UnIT (“RIT”) score, and are set by the NWEA assessment system. NWEA assessments are conducted three times yearly. NWEA does not take into account the English proficiency level of the student when setting the growth goal; therefore, a target of 20–25% of students meeting the goal was set based on trends in the School’s data.
Student Growth – Math 25% of students will meet growth goal on NWEA benchmark assessment. Exceeds: 26% or more Meets: 20% to 25% Does Not Meet: 15% to 19% Falls Far Below: 14% or less
The Charter Holder proposes growth targets for all students measured using the projected growth goals from the beginning to the end of the year as determined by the NWEA MAP assessment. NWEA does not take into account the English proficiency level of the student when setting the growth goal; therefore, a target of 20–25% was set based on trends in the School’s data.
Student Achievement – Reading
Goal 1:
Goal 1: The Charter Holder proposes targets for non-ELL students measured using the RIT scores as determined by the NWEA MAP assessment.
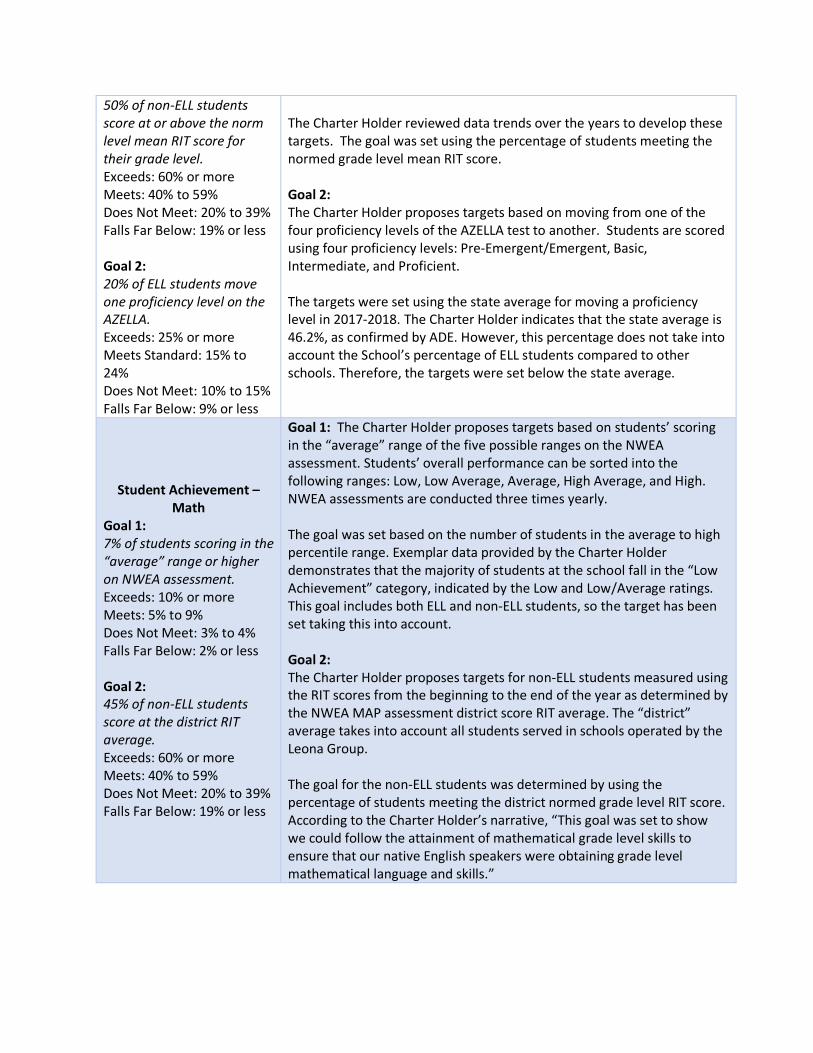
50% of non-ELL students score at or above the norm level mean RIT score for their grade level. Exceeds: 60% or more Meets: 40% to 59% Does Not Meet: 20% to 39% Falls Far Below: 19% or less Goal 2: 20% of ELL students move one proficiency level on the AZELLA. Exceeds: 25% or more Meets Standard: 15% to 24% Does Not Meet: 10% to 15% Falls Far Below: 9% or less
The Charter Holder reviewed data trends over the years to develop these targets. The goal was set using the percentage of students meeting the normed grade level mean RIT score. Goal 2: The Charter Holder proposes targets based on moving from one of the four proficiency levels of the AZELLA test to another. Students are scored using four proficiency levels: Pre-Emergent/Emergent, Basic, Intermediate, and Proficient. The targets were set using the state average for moving a proficiency level in 2017-2018. The Charter Holder indicates that the state average is 46.2%, as confirmed by ADE. However, this percentage does not take into account the School’s percentage of ELL students compared to other schools. Therefore, the targets were set below the state average.
Student Achievement – Math
Goal 1: 7% of students scoring in the “average” range or higher on NWEA assessment. Exceeds: 10% or more Meets: 5% to 9% Does Not Meet: 3% to 4% Falls Far Below: 2% or less Goal 2: 45% of non-ELL students score at the district RIT average. Exceeds: 60% or more Meets: 40% to 59% Does Not Meet: 20% to 39% Falls Far Below: 19% or less
Goal 1: The Charter Holder proposes targets based on students’ scoring in the “average” range of the five possible ranges on the NWEA assessment. Students’ overall performance can be sorted into the following ranges: Low, Low Average, Average, High Average, and High. NWEA assessments are conducted three times yearly. The goal was set based on the number of students in the average to high percentile range. Exemplar data provided by the Charter Holder demonstrates that the majority of students at the school fall in the “Low Achievement” category, indicated by the Low and Low/Average ratings. This goal includes both ELL and non-ELL students, so the target has been set taking this into account. Goal 2: The Charter Holder proposes targets for non-ELL students measured using the RIT scores from the beginning to the end of the year as determined by the NWEA MAP assessment district score RIT average. The “district” average takes into account all students served in schools operated by the Leona Group. The goal for the non-ELL students was determined by using the percentage of students meeting the district normed grade level RIT score. According to the Charter Holder’s narrative, “This goal was set to show we could follow the attainment of mathematical grade level skills to ensure that our native English speakers were obtaining grade level mathematical language and skills.”

Governance
Corporate Board Members Jessica Brown Gina Conflitti
Theodore Frederick Janna Wiseman
School Profile The Charter Holder was granted a new charter in 2014.
+FY 18 State Average Passing *If the percentage of students is 0% or 100%, or the group includes less than 10 students, the percentage for that group is redacted.
Student Engagement Goal 1: FAY students will demonstrate 87% or higher attendance rate. Exceeds: 92% or more Meets: 86% to 91% Does Not Meet: 80% to 85% Falls Far Below: 79% or less Goal 2: 50% reduction of chronic absenteeism for Kindergarten students. Exceeds: 51% or more Meets: 40% to 50% Does Not Meet: 30% to 39% Fall Far Below: 29% or less
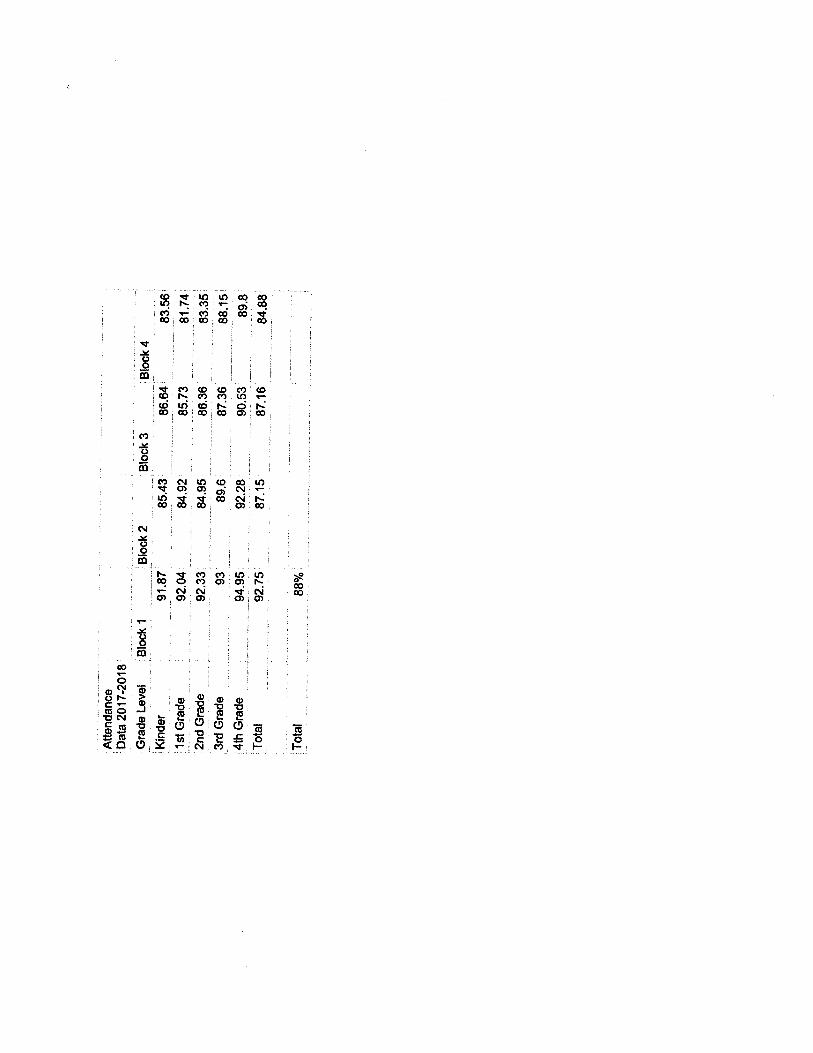
Goal 1: The Charter Holder proposes increasing its attendance rate to 87% or higher for all FAY students, as measured by attendance data in its Student Information System. The Charter Holder uses Synergy to report attendance data to the Arizona Department of Education. In FY 2018, the school’s overall attendance rate was 88%. The Charter Holder states in its narrative that “Consistent attendance is key to closing the achievement gap and helping our students learn English to increase student outcomes.” Goal 2: The Charter Holder proposes decreasing its chronic absenteeism rate by 50% for all Kindergarten students, as measured by its Student Information System. The Charter Holder reported a 48% chronic absentee rate for FY 2017, and 53% for FY 2018, with the majority of these students being at the Kindergarten level. The Charter Holder states that tackling absenteeism at the Kindergarten level will improve its overall attendance rates.
Profile
School Name Colegio Petite Arizona Date Open August 2016 Location Nogales FY 18 Letter Grade F FY 16 FY 17 FY 18 ELA AzMERIT (41%+) N/A 13% 6% Math AzMERIT (41%+) N/A 29% 8% Science AIMS (52%+) N/A * 8%

Enrollment and Demographic Data
60.765128.211 181.751
0
100
200
300
400
500
600
FY 2017 FY 2018 FY 2019
Enrollment Cap and 100th Day Average Daily Membership for Kaizen Education Foundation dba Colegio Petite Arizona
FY 2017-2019
Colegio Petite Arizona Enrollment Cap
2017-2018 Subgroup Data
Free and Reduced Lunch 97% English Language Learners 76%
Special Education * *If the percentage of students is 0% or 100%, or the group includes less than 10 students, the percentage for that group is redacted.

APPENDIX A
SCHOOL SPECIFIC ACADEMIC GOALS

1
SCHOOL-SPECIFIC ACADEMIC GOALS
CHARTER INFORMATION
Charter Holder Name Kaizen Education Foundation School Colegio Petite
Charter Holder Entity ID 92989 Eligibility Based On Choose an item.
Submission Date March 29, 2019 At Least 70% ELL
Review the School-Specific Academic Goals instructions for completing this template. Each indicator and measure requires at least one goal. For additional goals under each indicator, copy and paste the “Goal” and “Narrative” tables.
Indicator: Student Growth - Reading Student growth is academic improvement over time in Reading on valid and reliable state assessment data.
Goal
Targets Metrics
(Method of evaluating a measure) Documentation
By June 2018, 25% of the students in grades K-4 will meet their growth goal as measured by the NWEA benchmark assessment in Reading. By June 2019, 25% of the students in grades K-5 will meet their growth goal as measured by the NWEA benchmark assessment in Reading.
Exceeds Standard: An average of 26% or more of the students reached their growth goal. Meets Standard: An average of 20 to 25% of the students reached their growth goal. Does Not Meet Standard: An average of 15 to 19% of the students reached their growth goal. Falls Far Below Standard: An average of less than 15% of the students reached their growth goal
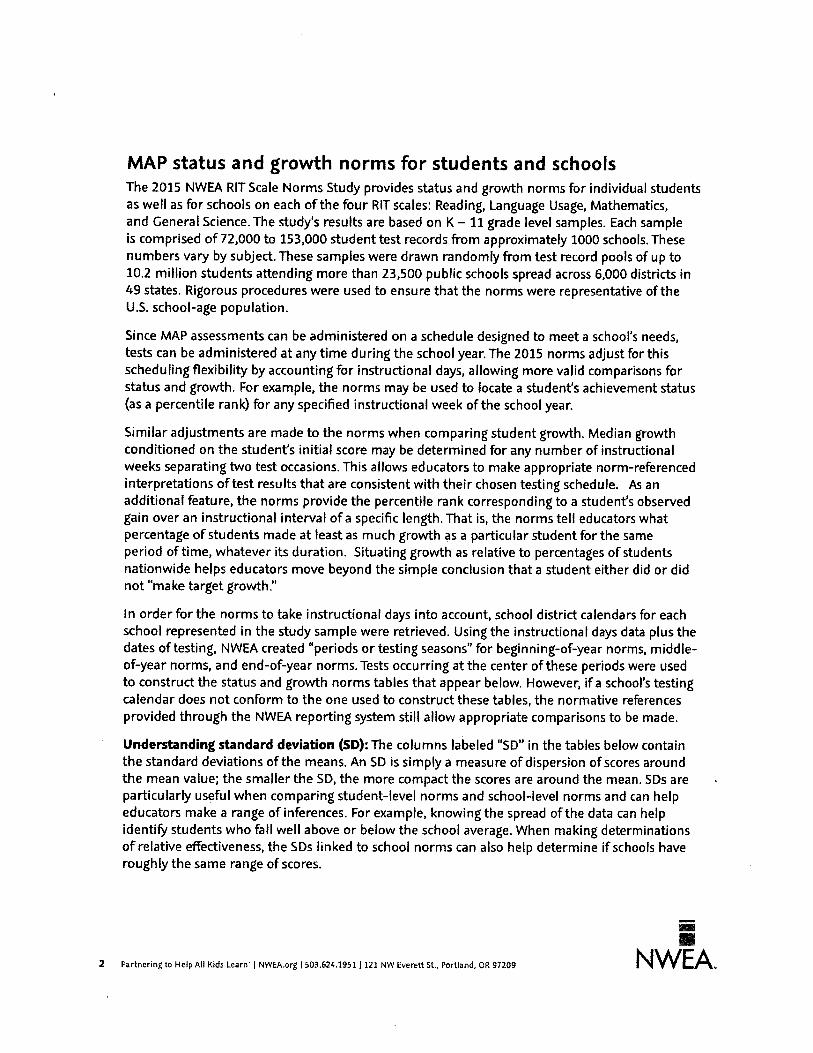
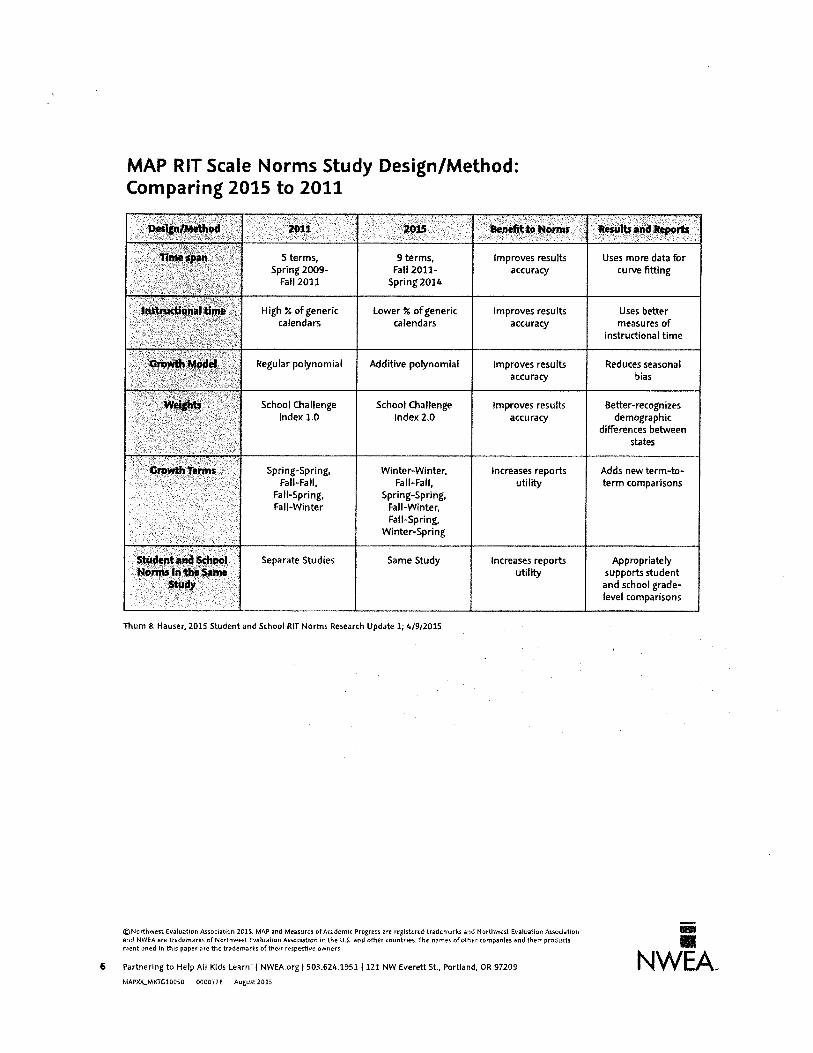
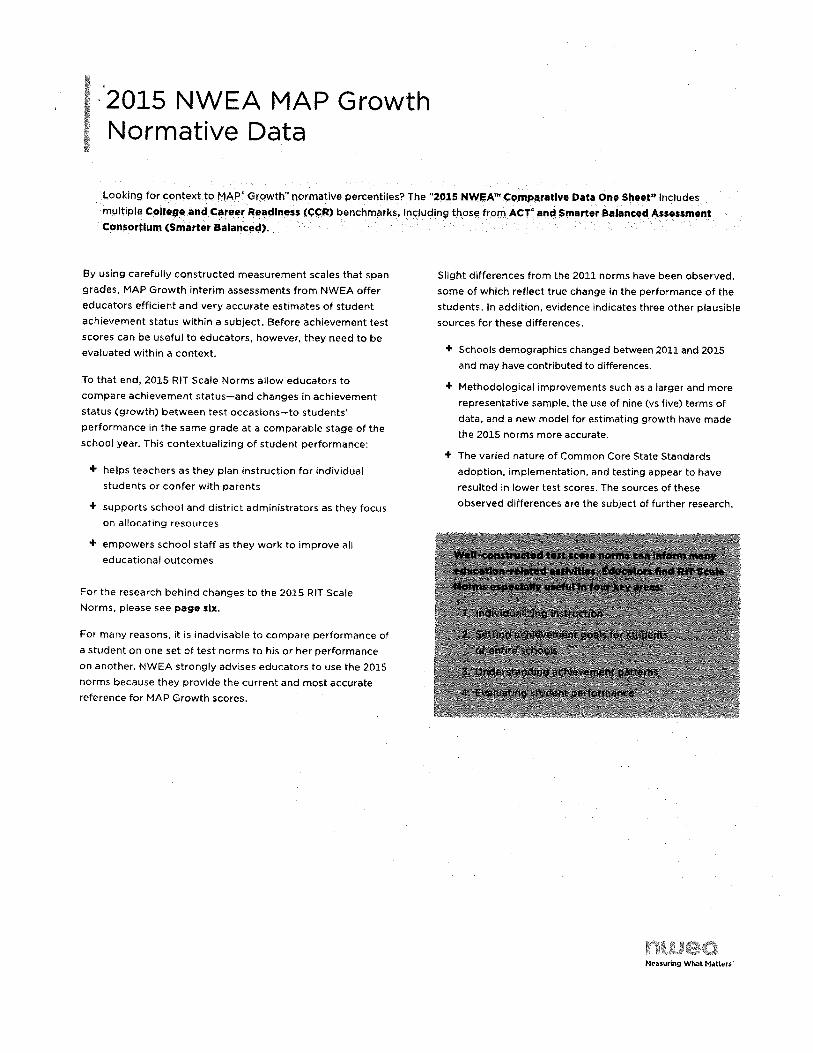
The NWEA has established test norms for students based on their RIT score. Each student’s observed growth is compared to this normed expected growth to determine if students met their growth goal.
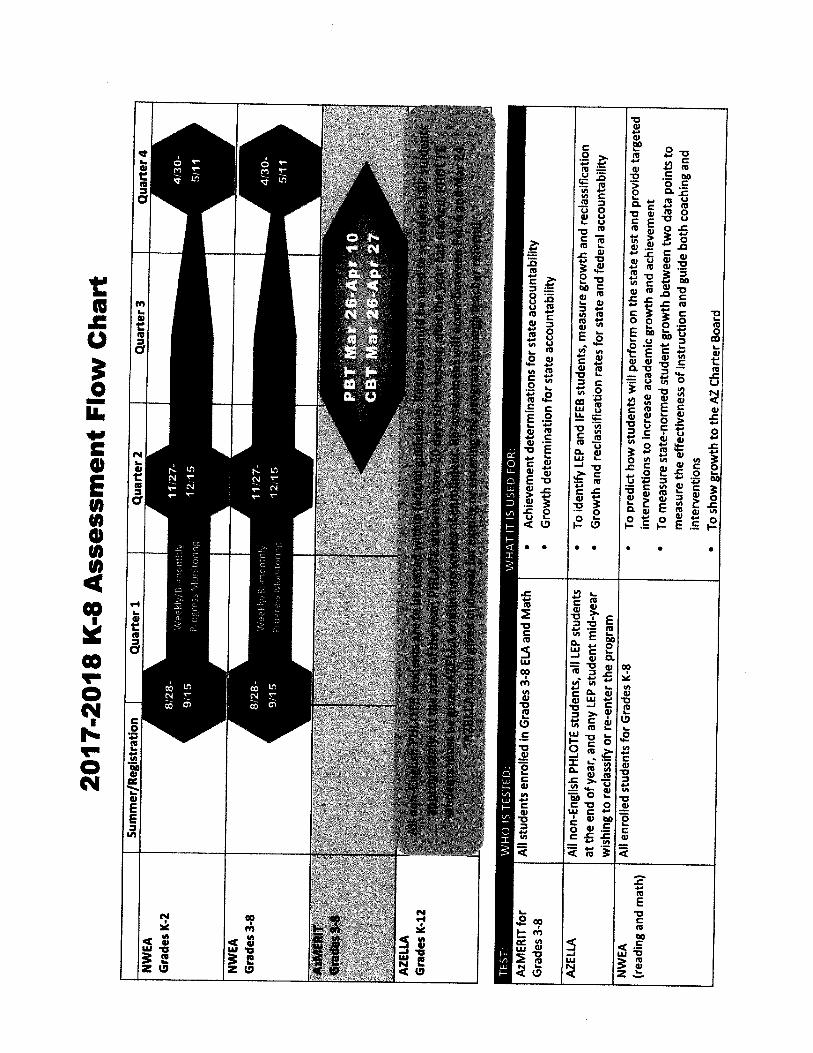
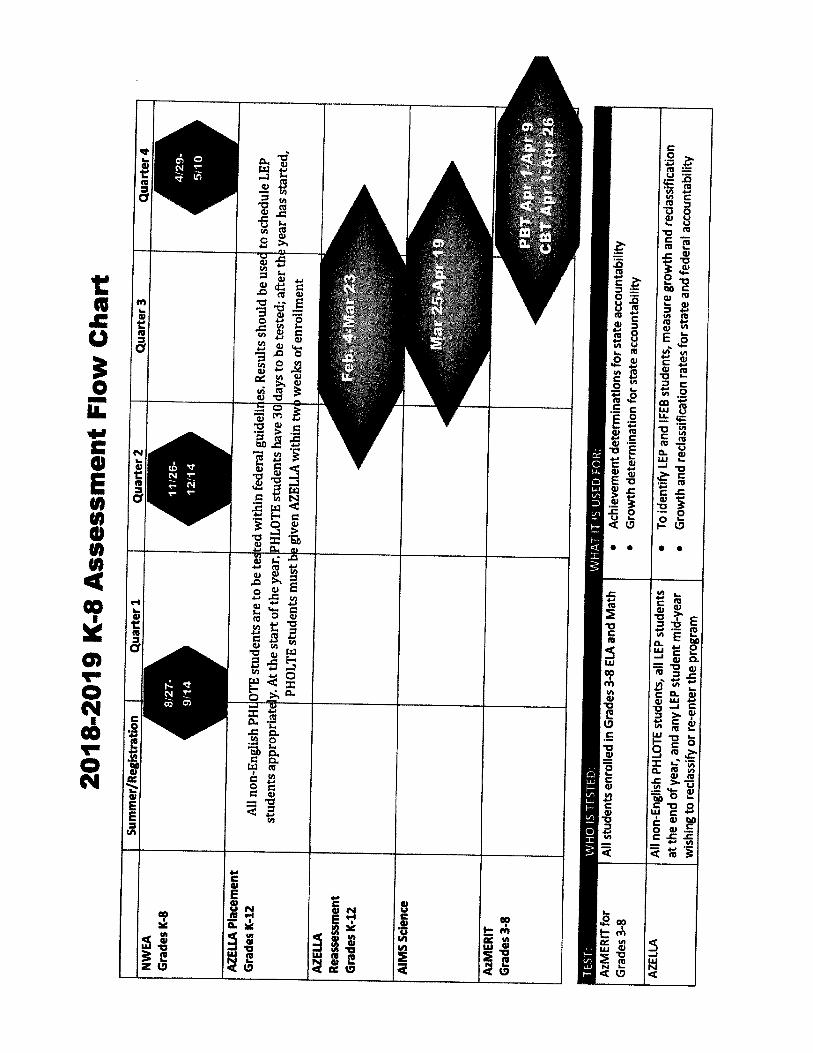
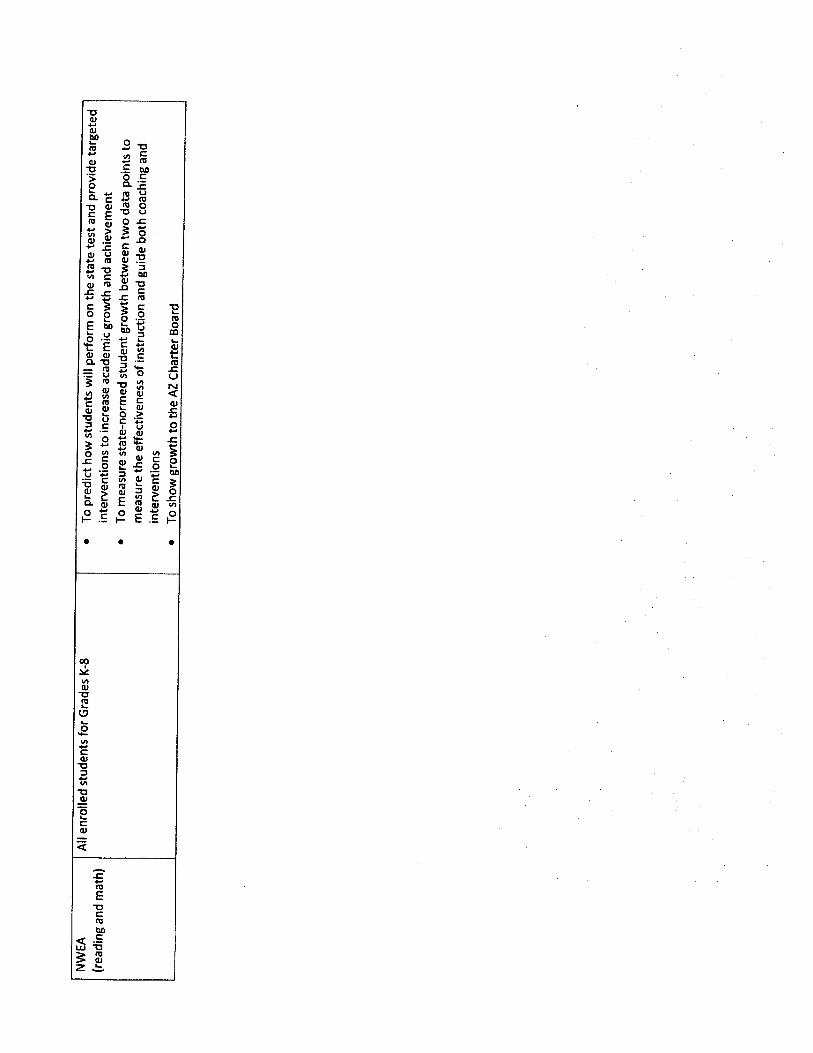
Exhibit A: NWEA Measures of Academic Progress Normative Data/ NWEA MAP Growth Normative Data Exhibit B: Assessment Flow Charts Exhibit C: NWEA MAP Achievement Status and Growth Summary Report (redacted) Exhibit D: AZELLA Roster Report (redacted)

2
In the box below provide a narrative that describes:
• The rationale for each Goal and its Targets • How the goal was determined • How the goal aligns to the mission and philosophy of the charter • How the goal is appropriate for the students served at the school
Narrative Rationale for Goal and Targets The NWEA assessment sets RIT (Rasch UnIT) score goals from the beginning of the year to the end of the year based on normed data. Each student’s growth goal is based on his/her grade level and his/her RIT score. The RIT score measures each student’s progress at each student’s individual level. It is not based on grade level proficiency. Our goals and targets are based on the percentage of students who met their RIT score growth goal. How the Goal was Determined After reviewing trends in our data and looking at the growth students were able to make during the 17-18 school year, we determined that 25% of our students meeting their growth goal was a rigorous and achievable goal. Their goals are calculated by comparing students across the nation in the same grade level with similar scores and determining the average growth among students with the same scores. Our students have a limited grasp of the English language. In the 2017-2018 school year, 64 % scored at the Pre–Emergent/Emergent or Basic English level as measured by AZELLA. Currently in the 2018-2019, 74% scored at the Pre–Emergent/Emergent or Basic English level as measured by AZELLA. NWEA compares growth of students regardless of the student’s English proficiency level. Therefore, our students meeting the growth goal on a norm referenced assessment demonstrates their improvement/ growth in their ability to read in English. How the Goal Aligns to the Mission and Philosophy of the Charter The goal of our school is to provide an environment that integrates linguistic development and the development of academic skills. To do this, it is important to meet the students where they are in their English language development and ensure each student is meeting individual growth goals. Colegio Petite invests in students as a whole and strives to create an environment where students are able to grow throughout the year and teachers are able to target their instruction to help students increase their English language proficiency. How the Goal is appropriate for the Students Served at the School Colegio Petite serves students who are growing daily both academically and linguistically. A high number of our students are also working against the added stress of coming to a new school in the middle of their elementary career and even, at times, in the middle of an academic year. This creates a unique set of challenges that students must overcome even before they demonstrate their grade level knowledge as it pertains to state standards. For our students to be successful, they must continually and consistently show growth. This goal is appropriate for both ELL students and non-ELL students as growth is set at individual levels based on students with similar initial scores.
Indicator: Student Growth - Math

3
Student growth is academic improvement over time in Math on valid and reliable state assessment data.
Goal
Targets Metrics
(Method of evaluating a measure) Documentation
By June 2018, 25% of the students in grades K-4 will meet their growth goal as measured by the NWEA benchmark assessment in math. By June 2019, 25% of the students in grades K-5 will meet their growth goal as measured by the NWEA benchmark assessment in math.
Exceeds Standard: An average of 26% or more of the students reached their growth goal. Meets Standard: An average of 20 to 25% of the students reached their growth goal. Does Not Meet Standard: An average of 15 to 19% of the students reached their growth goal. Falls Far Below Standard: An average of less than 15% of the students reached their growth goal
The NWEA has established test norms for students based on their RIT score. Each student’s observed growth is compared to this normed expected growth to determine if students met their growth goal.
NWEA Benchmark Summary Reports
In the box below provide a narrative that describes:
• The rationale for each Goal and its Targets • How the goal was determined • How the goal aligns to the mission and philosophy of the charter • How the goal is appropriate for the students served at the school
Narrative Rationale for Goal and Targets The NWEA assessment sets RIT (Rasch UnIT) score goals from the beginning of the year to the end of the year based on normed data. Each student’s growth goal is based on his/her grade level and his/her RIT score. The RIT score measures each student’s progress at each student’s individual level. It is not based on grade level proficiency. Our goals and targets are based on the percentage of students who met their RIT score growth goal. How the Goal was Determined After reviewing trends in our data and looking at the growth students were able to make during the 17-18 school year, we determined that 25% of our students meeting their growth goal was a rigorous and achievable goal. Their goals are calculated by comparing students across the nation in the same grade level with similar scores and determining the average growth among students with the same scores. Our students have a limited grasp of the English
4
language. In the 2017-2018 school year, 64 % scored at the Pre–Emergent/Emergent or Basic English level as measured by AZELLA. Currently in the 2018-2019, 74% scored at the Pre–Emergent/Emergent or Basic English level as measured by AZELLA. NWEA compares growth of students regardless of the student’s English proficiency level. Therefore, our students making a growth goal on a norm referenced assessment demonstrates their improvement/ growth in their math ability and their understanding of English. How the Goal Aligns to the Mission and Philosophy of the Charter The goal of our school is to provide an environment that integrates linguistic development and the development of academic skills. To do this, it is important to meet the students where they are in their English language development and ensure each student is meeting individual growth goals. Colegio Petite invests in students as a whole and strives to create an environment where students are able to grow throughout the year and teachers are able to target their instruction to help students increase their English language proficiency. How the Goal is appropriate for the Students Served at the School Colegio Petite serves students who are growing daily both academically and linguistically. A high number of our students are also working against the added stress of coming to a new school in the middle of their elementary career and even, at times, in the middle of an academic year. This creates a unique set of challenges that students must overcome even before they demonstrate their grade level knowledge as it pertains to state standards. For our students to be successful, they must continually and consistently show growth. This goal is appropriate for both ELL students and non-ELL students as growth is set at individual levels based on students with similar initial scores.
Indicator: Student Achievement - Reading Student achievement is academic proficiency in Reading on valid and reliable state assessment data.
Goal
Targets Metrics
(Method of evaluating a measure) Documentation
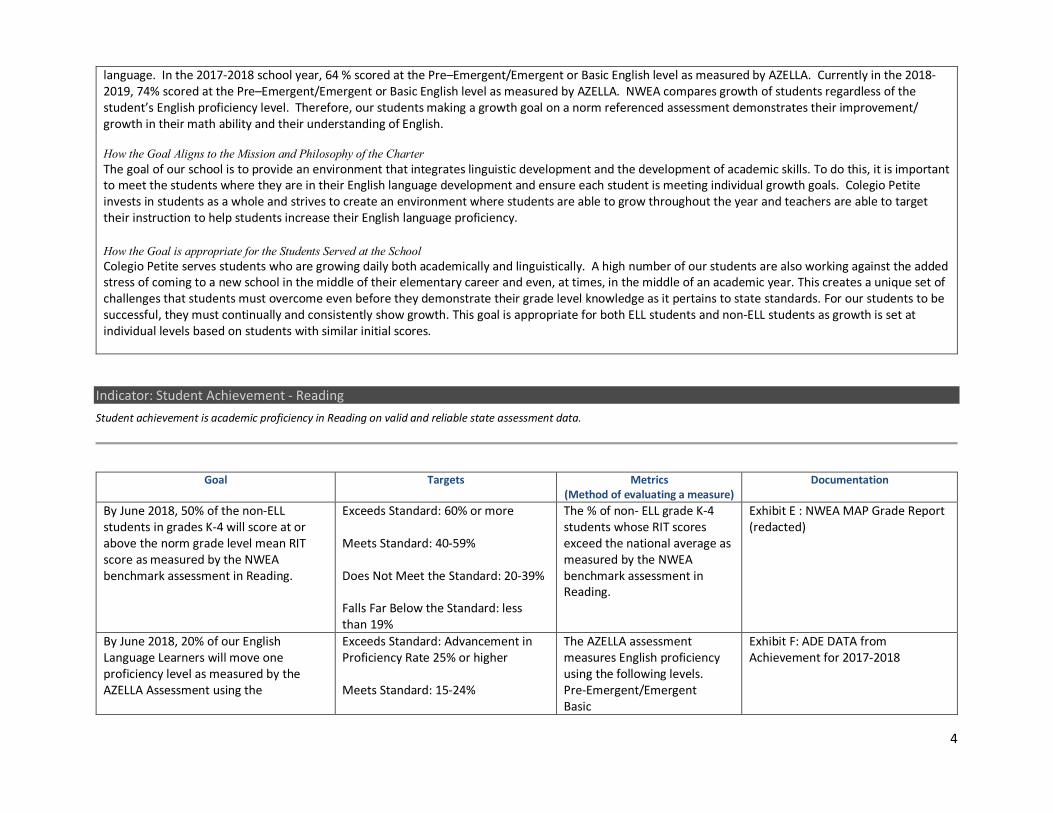
By June 2018, 50% of the non-ELL students in grades K-4 will score at or above the norm grade level mean RIT score as measured by the NWEA benchmark assessment in Reading.
Exceeds Standard: 60% or more Meets Standard: 40-59% Does Not Meet the Standard: 20-39% Falls Far Below the Standard: less than 19%
The % of non- ELL grade K-4 students whose RIT scores exceed the national average as measured by the NWEA benchmark assessment in Reading.
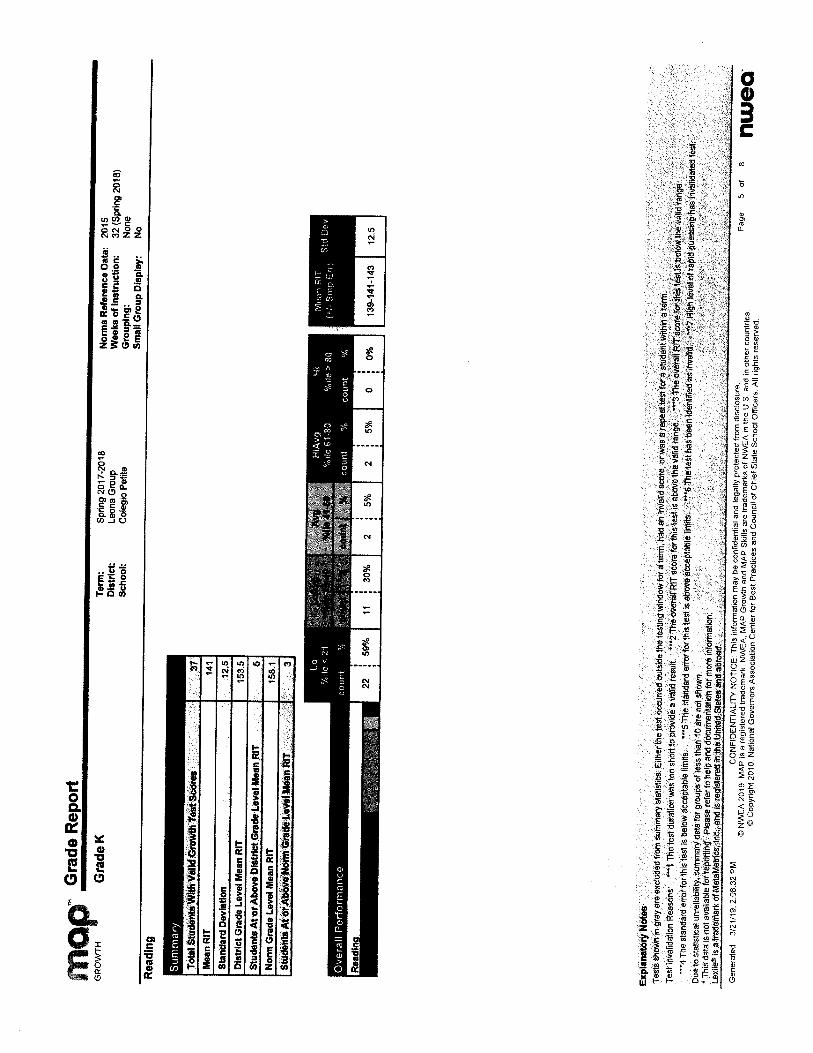
Exhibit E : NWEA MAP Grade Report (redacted)
By June 2018, 20% of our English Language Learners will move one proficiency level as measured by the AZELLA Assessment using the
Exceeds Standard: Advancement in Proficiency Rate 25% or higher Meets Standard: 15-24%
The AZELLA assessment measures English proficiency using the following levels. Pre-Emergent/Emergent Basic
Exhibit F: ADE DATA from Achievement for 2017-2018

5
transformed proficiency as calculated by the ADE.
Does Not Meet the Standard: 10-14% Falls Far Below the Standard: 9% or lower
Intermediate Proficient
By June 2019, 50% of the non-ELL students in grades K-5 will score at or above the norm grade level mean RIT score as measured by the NWEA benchmark assessment in reading.
Exceeds Standard: 60% or more Meets Standard: 40-59% Does Not Meet the Standard: 20-39% Falls Far Below the Standard: 19% or lower
The % of non- ELL grade K-5 students whose RIT scores exceed the national average as measured by the NWEA benchmark assessment in Reading. The state then calculates the % of movement of students on AZELLA levels.
Exhibit G: NWEA MAP Grade Reports
By June 2019, 20% of our English Language Learners will move one proficiency level as measured by the AZELLA Assessment using the transformed proficiency as calculated by the ADE.
Exceeds Standard: Advancement in Proficiency Rate 25% or higher Meets Standard: 15-24% Does Not Meet the Standard: 10-14% Falls Far Below the Standard: 9% or lower
The AZELLA assessment measures English proficiency using the following levels. Pre-Emergent/Emergent Basic Intermediate Proficient The state then calculates the % of movement of students on AZELLA levels.
We will use ADE DATA from Achievement for 2018-2019
In the box below provide a narrative that describes:
• The rationale for each Goal and its Targets • How the goal was determined • How the goal aligns to the mission and philosophy of the charter • How the goal is appropriate for the students served at the school
Narrative Rationale for Goal and Targets Colegio Petite faces some unique challenges that affect students’ academic achievement. In 2017-18 school year, 88% of the students were classified as English Language Learners (ELL) with 64% of the students at the Pre-Emergent/Emergent or Basic level. In the 2018-2019 school year, 91% of the students were classified as English Language Learners (ELL) with 74% of the students at the Pre-Emergent/Emergent or Basic level. The school also faces a high mobility rate as students enroll and withdraw throughout the school year. In order to calculate stability rates, we used students who were with us for the full year versus the total number of enrollments during the year. Our stability rates have steadily increased from 2017 to 2019 from 51% to 65% and we are

6
currently at 71% of our students stay enrolled at our school. This means, this year so far 29% of our students were not stable (they started after the start of the year and/or left during the year). These rates impact what is happening in the classroom. Stability data will be provided as source data. Another factor that hinders English Language Learners development is the limited exposure to English. The primary language spoken at home of 88% of our students is Spanish. To measure student proficiency in Reading for our non-ELL students, we have chosen to use data from the NWEA MAP assessment. This benchmark assessment is administered three times a year and we are using the end of year data. Using our NWEA data, as opposed to AZ Merit data, allows us to see how our students are performing compared to national averages. For our ELL students, we used the AZELLA assessment. This assessment measures English Language Proficiency in speaking, listening, reading and writing within the English language. Since most of our student population is learning the English language, this assessment measures their progress and proficiency increase in English. The AZELLA goal was determined by looking at the number of students moving achievement categorical levels. We used the same levels recognized by the state of Arizona Pre-Emergent/Emergent, Basic, Intermediate, and Proficient. The state uses the average number of students who obtain a new proficiency level to set the state’s goal. Our goal for mastering ELL standards was based off of looking at student progress and also recognizing some of the challenges that are students face: attendance, mobility, exposure to English and an evolving school model. We are addressing attendance, exposure to English and our school model and expect that we will need to increase our goals in the future. We have increased the exposure to English from 50% during the school day to 90% and have added a summer school program. We have also hired a national expert on English language acquisition to work with our teachers and staff. We set the targets based on the transformed data that the state uses for accountability. The state transformed average average for moving levels was 63.87 % for 2017-2018. When checking with the state to confirm this average we were given the average of 46.2%. Given both pieces of information we set our target at 20%. How the Goal was Determined NWEA is a nationally recognized norm- referenced benchmark assessment. The goal for our non-ELL students was determined by using the percentage of students meeting the normed grade level mean RIT score. The targets are based on five categories of percentile ranges which are Lo (<21%), LoAverage (21%-40%), Average (41%-60%), HiAverage (61%-80%) and Hi (>80%) The AZELLA goal was determined by looking at the number of students moving achievement categorical levels and recognizing some of the challenges that our students face: attendance, mobility, exposure to English and an evolving school model. The goal was set at 20%. How the Goal Aligns to the Mission and Philosophy of the Charter Colegio Petite serves students who are growing daily both academically and linguistically. To do this, it is important to meet the students where they are and set goals that are attainable. Colegio Petite is dedicated to helping students increase their proficiency in English and to increase grade level proficiency for all students. How the Goal is appropriate for the Students Served at the School For the non-ELL students, we believe the goal is appropriate as they are measured against normed averages for proficiency. For ELL students, the goal is appropriate because our students must first master the English Language Proficiency standards as measured by AZELLA before being measured against grade level proficiency standards. Our goal is for students to continually be moving toward English proficiency by demonstrating the movement of proficiency levels.
7
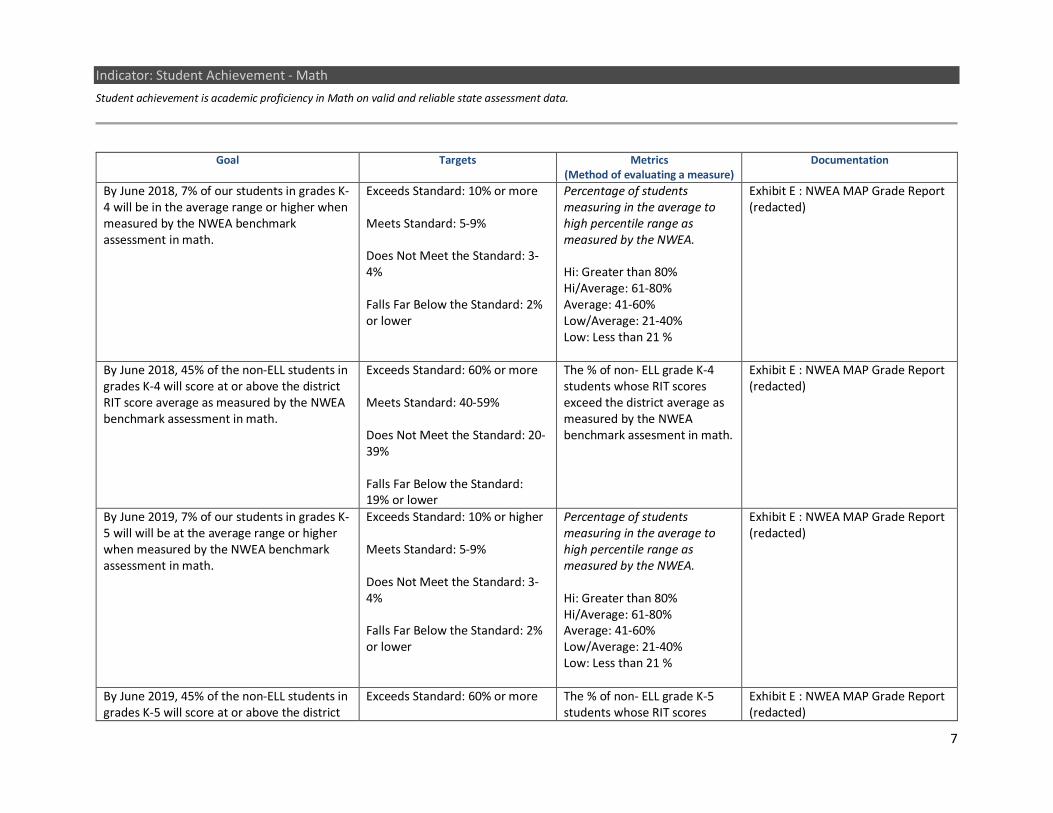
Indicator: Student Achievement - Math Student achievement is academic proficiency in Math on valid and reliable state assessment data.
Goal
Targets Metrics
(Method of evaluating a measure) Documentation
By June 2018, 7% of our students in grades K-4 will be in the average range or higher when measured by the NWEA benchmark assessment in math.
Exceeds Standard: 10% or more Meets Standard: 5-9% Does Not Meet the Standard: 3-4% Falls Far Below the Standard: 2% or lower
Percentage of students measuring in the average to high percentile range as measured by the NWEA. Hi: Greater than 80% Hi/Average: 61-80% Average: 41-60% Low/Average: 21-40% Low: Less than 21 %
Exhibit E : NWEA MAP Grade Report (redacted)
By June 2018, 45% of the non-ELL students in grades K-4 will score at or above the district RIT score average as measured by the NWEA benchmark assessment in math.
Exceeds Standard: 60% or more Meets Standard: 40-59% Does Not Meet the Standard: 20-39% Falls Far Below the Standard: 19% or lower
The % of non- ELL grade K-4 students whose RIT scores exceed the district average as measured by the NWEA benchmark assesment in math.
Exhibit E : NWEA MAP Grade Report (redacted)
By June 2019, 7% of our students in grades K-5 will will be at the average range or higher when measured by the NWEA benchmark assessment in math.
Exceeds Standard: 10% or higher Meets Standard: 5-9% Does Not Meet the Standard: 3-4% Falls Far Below the Standard: 2% or lower
Percentage of students measuring in the average to high percentile range as measured by the NWEA. Hi: Greater than 80% Hi/Average: 61-80% Average: 41-60% Low/Average: 21-40% Low: Less than 21 %
Exhibit E : NWEA MAP Grade Report (redacted)
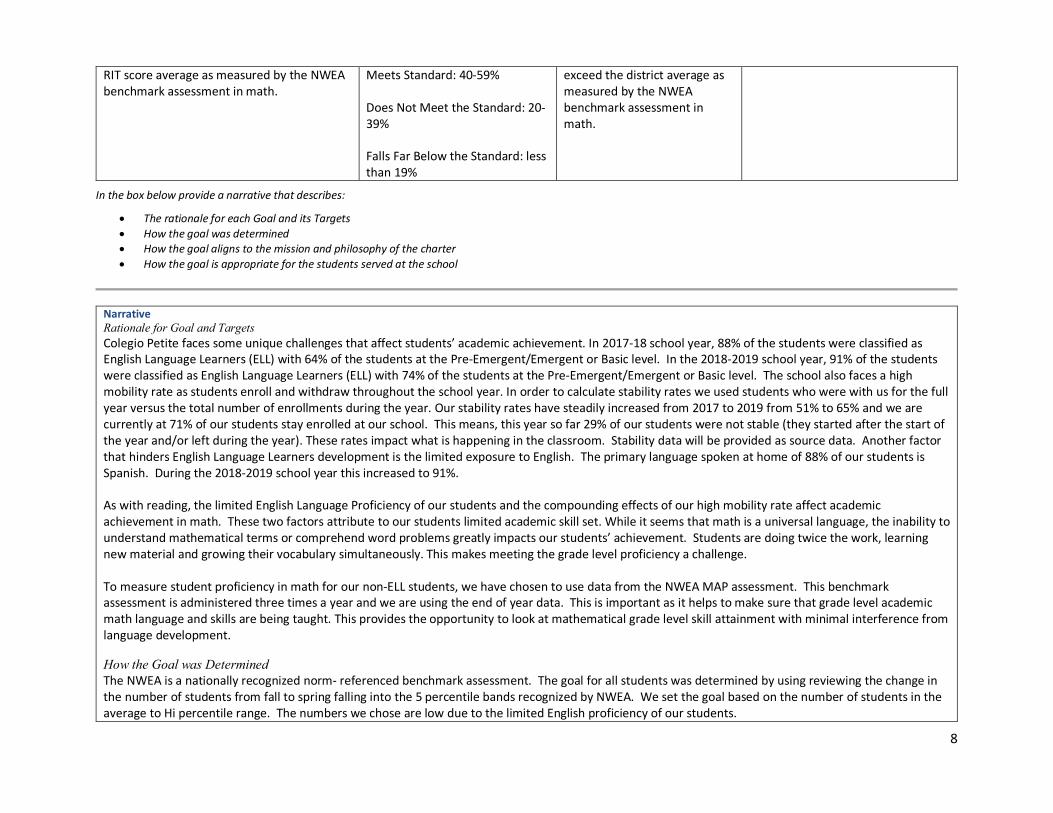
By June 2019, 45% of the non-ELL students in grades K-5 will score at or above the district
Exceeds Standard: 60% or more
The % of non- ELL grade K-5 students whose RIT scores
Exhibit E : NWEA MAP Grade Report (redacted)
8
RIT score average as measured by the NWEA benchmark assessment in math.
Meets Standard: 40-59% Does Not Meet the Standard: 20-39% Falls Far Below the Standard: less than 19%
exceed the district average as measured by the NWEA benchmark assessment in math.
In the box below provide a narrative that describes:
• The rationale for each Goal and its Targets • How the goal was determined • How the goal aligns to the mission and philosophy of the charter • How the goal is appropriate for the students served at the school
Narrative Rationale for Goal and Targets Colegio Petite faces some unique challenges that affect students’ academic achievement. In 2017-18 school year, 88% of the students were classified as English Language Learners (ELL) with 64% of the students at the Pre-Emergent/Emergent or Basic level. In the 2018-2019 school year, 91% of the students were classified as English Language Learners (ELL) with 74% of the students at the Pre-Emergent/Emergent or Basic level. The school also faces a high mobility rate as students enroll and withdraw throughout the school year. In order to calculate stability rates we used students who were with us for the full year versus the total number of enrollments during the year. Our stability rates have steadily increased from 2017 to 2019 from 51% to 65% and we are currently at 71% of our students stay enrolled at our school. This means, this year so far 29% of our students were not stable (they started after the start of the year and/or left during the year). These rates impact what is happening in the classroom. Stability data will be provided as source data. Another factor that hinders English Language Learners development is the limited exposure to English. The primary language spoken at home of 88% of our students is Spanish. During the 2018-2019 school year this increased to 91%. As with reading, the limited English Language Proficiency of our students and the compounding effects of our high mobility rate affect academic achievement in math. These two factors attribute to our students limited academic skill set. While it seems that math is a universal language, the inability to understand mathematical terms or comprehend word problems greatly impacts our students’ achievement. Students are doing twice the work, learning new material and growing their vocabulary simultaneously. This makes meeting the grade level proficiency a challenge. To measure student proficiency in math for our non-ELL students, we have chosen to use data from the NWEA MAP assessment. This benchmark assessment is administered three times a year and we are using the end of year data. This is important as it helps to make sure that grade level academic math language and skills are being taught. This provides the opportunity to look at mathematical grade level skill attainment with minimal interference from language development. How the Goal was Determined The NWEA is a nationally recognized norm- referenced benchmark assessment. The goal for all students was determined by using reviewing the change in the number of students from fall to spring falling into the 5 percentile bands recognized by NWEA. We set the goal based on the number of students in the average to Hi percentile range. The numbers we chose are low due to the limited English proficiency of our students.

9
An additional goal for our non-ELL students was determined by using the percentage of students meeting the district normed grade level RIT score. The targets are based on four categories of percentage ranges. This goal was set to show we could follow the attainment of mathematical grade level skills to ensure that our native English speakers (non-ELL) were obtaining grade level mathematical language and skills. How the Goal Aligns to the Mission and Philosophy of the Charter Colegio Petite serves students who are growing daily both academically and linguistically. Colegio Petite is dedicated to helping students obtain English Language proficiency so they can demonstrate math proficiency and ensuring that all students are being exposed to grade level academic content. How the Goal is appropriate for the Students Served at the School These goals are appropriate as they take into account the needs of both ELL students as well as non-ELL students. The goals set for non-ELL students help the school monitor the exposure of students to grade level mathematical standards by measuring proficiency against district level proficiency. The goals set for ELL students help ensure that students are moving in proficiency bands despite the lack of English proficiency skills.
Indicator: Post-secondary Readiness (High School only) Post-secondary readiness includes outcomes in key subjects that indicate future success and that are aligned to college and career readiness such as graduation rates, SAT/ACT performance, workforce readiness, credit/course completion, or other metrics provided by the Department of Education.
Goal
Targets Metrics
(Method of evaluating a measure) Documentation
In the box below provide a narrative that describes:
• The rationale for each Goal and its Targets • How the goal was determined • How the goal aligns to the mission and philosophy of the charter • How the goal is appropriate for the students served at the school
Narrative
10
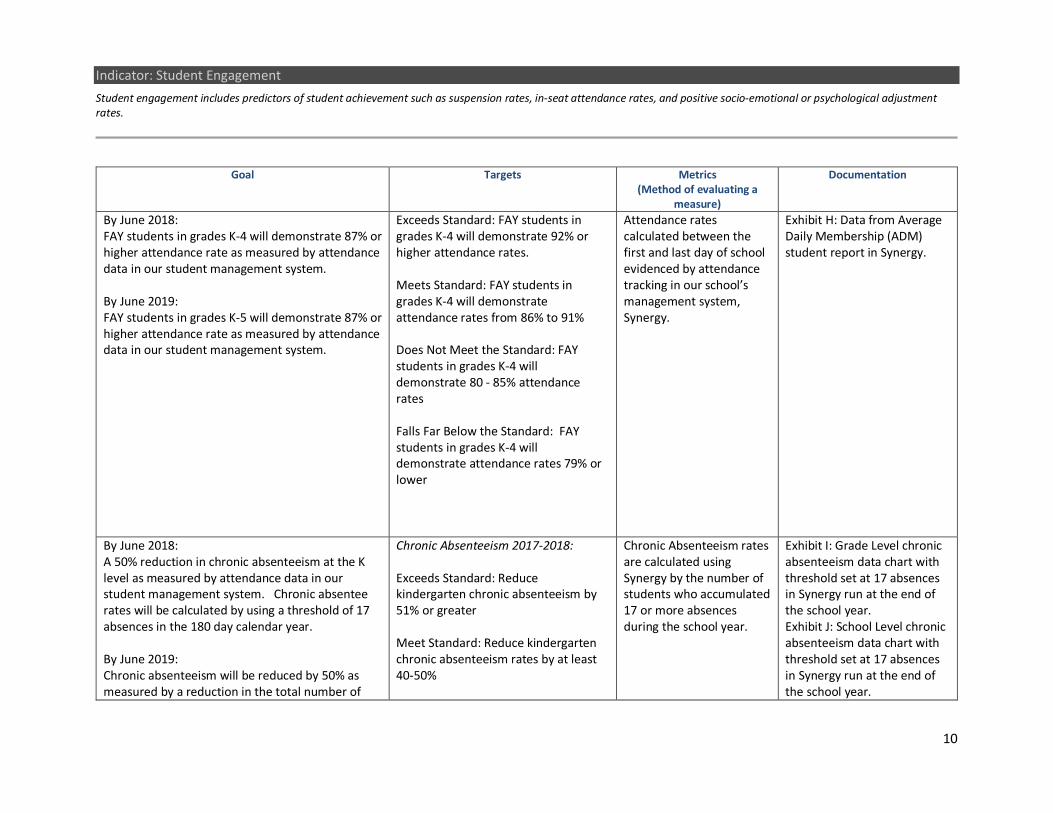
Indicator: Student Engagement Student engagement includes predictors of student achievement such as suspension rates, in-seat attendance rates, and positive socio-emotional or psychological adjustment rates.
Goal
Targets Metrics
(Method of evaluating a measure)
Documentation
By June 2018: FAY students in grades K-4 will demonstrate 87% or higher attendance rate as measured by attendance data in our student management system. By June 2019: FAY students in grades K-5 will demonstrate 87% or higher attendance rate as measured by attendance data in our student management system.
Exceeds Standard: FAY students in grades K-4 will demonstrate 92% or higher attendance rates. Meets Standard: FAY students in grades K-4 will demonstrate attendance rates from 86% to 91% Does Not Meet the Standard: FAY students in grades K-4 will demonstrate 80 - 85% attendance rates Falls Far Below the Standard: FAY students in grades K-4 will demonstrate attendance rates 79% or lower
Attendance rates calculated between the first and last day of school evidenced by attendance tracking in our school’s management system, Synergy.
Exhibit H: Data from Average Daily Membership (ADM) student report in Synergy.
By June 2018: A 50% reduction in chronic absenteeism at the K level as measured by attendance data in our student management system. Chronic absentee rates will be calculated by using a threshold of 17 absences in the 180 day calendar year. By June 2019: Chronic absenteeism will be reduced by 50% as measured by a reduction in the total number of
Chronic Absenteeism 2017-2018: Exceeds Standard: Reduce kindergarten chronic absenteeism by 51% or greater Meet Standard: Reduce kindergarten chronic absenteeism rates by at least 40-50%
Chronic Absenteeism rates are calculated using Synergy by the number of students who accumulated 17 or more absences during the school year.
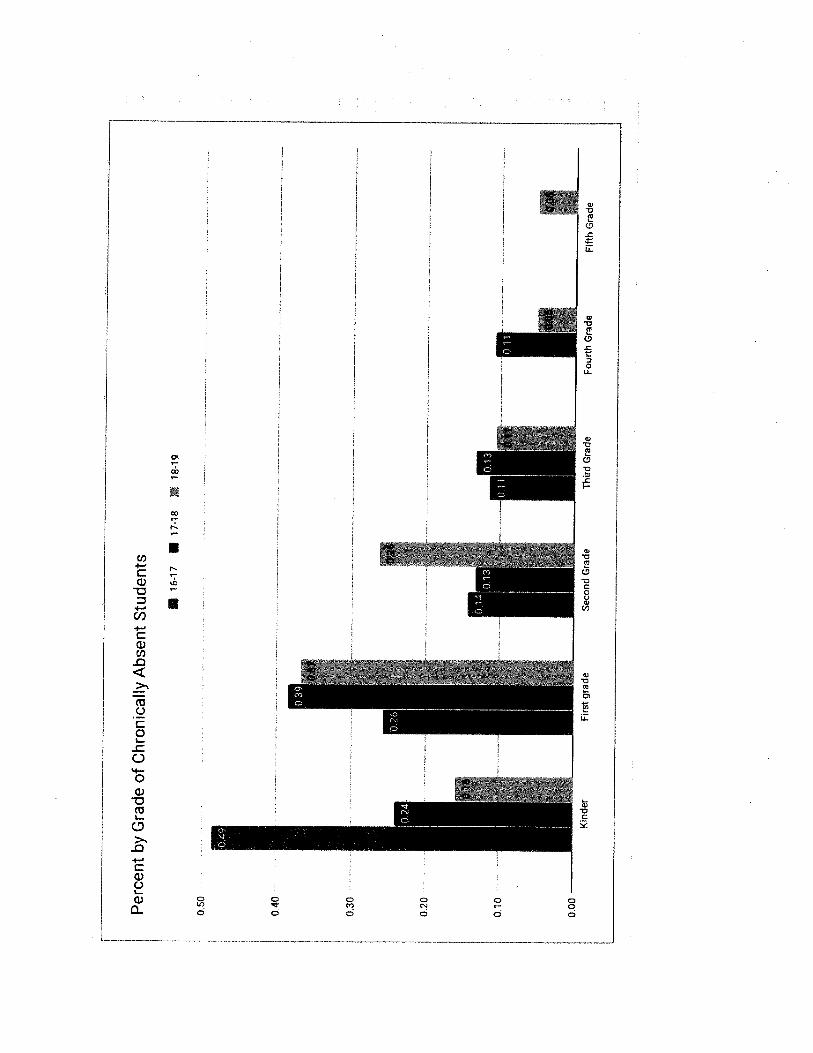
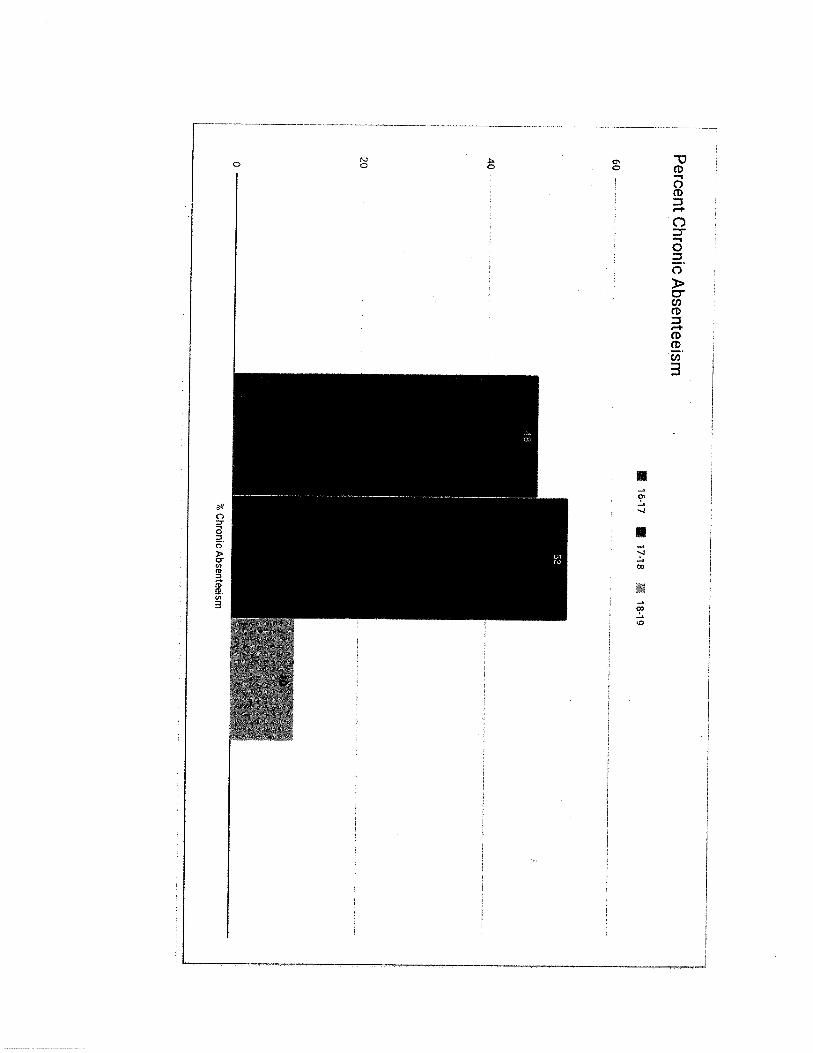
Exhibit I: Grade Level chronic absenteeism data chart with threshold set at 17 absences in Synergy run at the end of the school year. Exhibit J: School Level chronic absenteeism data chart with threshold set at 17 absences in Synergy run at the end of the school year.

11
chronically absent students from 2017-2018 compared to 2018-2019.
Does Not Meet Standard: Reduce kindergarten absentee rates by 30-39% Falls Far Below the Standard: Reduce kindergarten absentee rates 29% or lower. Chronic Absenteeism 2018-2019: Exceeds Standard: Reduce school-wide chronic absenteeism by 51% or greater Meet Standard: Reduce school-wide chronic absenteeism rates by at least 40-50% Does Not Meet Standard: Reduce school-wide chronic absentee rates by 30-39% Falls Far Below the Standard: Reduce school-wide chronic absentee rates 29% or lower
In the box below provide a narrative that describes:
• The rationale for each Goal and its Targets • How the goal was determined • How the goal aligns to the mission and philosophy of the charter • How the goal is appropriate for the students served at the school
Narrative Rationale for Goal and Targets Consistent attendance is key to closing the achievement gap and helping our students learn English to increase student outcomes. We reviewed our attendance patterns for each quarter using our Average Daily Membership (ADM) reports. In the 2016-2017 school year, the first year of operation, we had 73 students enrolled in our school in grades kindergarten through third grade. Our daily attendance rate was 89%. In the 2017-2018 school year, we had

12
140 students in kindergarten through fourth grade and our attendance rate was 88%. Addressing our attendance pattern will improve student outcomes. We also chose to review individual chronic absenteeism as students who consistently do not attend school are placing their achievement at risk. When we reviewed this data, we saw a chronic absentee rate at 48% for 16-17. From this we looked for attendance patterns and quickly noted that the majority of the chronically absent students were at the kindergarten level. We decided to set a goal at the kindergarten level as we thought that if we could tackle the attendance problem at the individual level at kindergarten we could help to curb absenteeism. We decided a reasonable goal was to aim for a 50% reduction in chronically absent kindergarten students. In 2017-2018, we again looked at our data and noted that chronically absent students were problematic at higher percentages in first grade and so decided to concentrate school-wide. We set a school wide goal of reducing chronic absenteeism by 50%. How the Goal was Determined We reviewed our attendance data quarterly to review quarterly patterns. We noticed a dip in attendance as the school year progressed. Our goal range was determined by reviewing the student attendance report trends from Synergy, our student information system. Due to an increase in our enrollment; we accounted for new families adjusting to our school’s culture and expectations. The school also faces a high mobility rate as students enroll and withdraw throughout the school year. In order to calculate stability rates we used students that were with us for the full year versus the total number of enrollments during the year. Our stability rates have steadily increased from 2017 to 2019 from 51% to 65% and we are currently at 71% of our students stay enrolled at our school. This means, this year so far 29% of our students were not stable (they started after the start of the year and/or left during the year). These rates impact what is happening in the classroom. Stability data will be provided as source data. In 2017-2018, 42% of our students were chronically absent in ADE reports but when we ran our reports and dropped our threshold to 17 days we were hitting 53% for chronic absenteeism so we decided to decrease the number of days absent that we used to measure chronic absenteeism. Student Attendance Rate Our first year in operation 2016-2017: Quarter 1: 91%, Quarter 2: 90%, Quarter 3 : 89% Quarter 4: 88% Chronic Absenteeism 48% with 49% of those students in Kindergarten. Our second year of operation 2017-2018: Quarter 1: 93%, Quarter 2: 87%, Quarter 3 : 87% Quarter 4: 85% Chronic absenteeism of 53% with 24% of those students in Kindergarten. How the Goal Aligns to the Mission and Philosophy of the Charter In order to increase the amount of time that students spend in school we leverage our partnership with families, the community, and relationships that are formed within the school community. In order to increase academic proficiency and growth students must consistently attend school. Development of social emotional skills is enhanced when students are in school and can take advantage of this aspect of skill development.

13
Colegio Petite’s Mission and Vision depends on students attending school on a regular basis so that students and families can take advantage of: • Family Engagement • Partnerships with Parents/Guardians • Development of Positive Relationships among Students and Teachers • Increasing Academic Proficiency and Growth • Development of Linguistic Competency in the English and Spanish Language • Development of Social Emotional Skills
How the Goal is appropriate for the Students Served at the School Many of our students arrive at our doors with limited English proficiency, academic backgrounds, and skill sets. By improving our student attendance, students will be on campus for lessons where we can personalize instruction to meet their academic needs and offer academic support. This in turn will improve outcomes for growth and proficiency. The improvement of our student attendance will help emphasize the importance of school through the family-school connection. We will promote communication to help our families acclimate to our school’s culture and expectations. By including chronic absenteeism we can also help focus on individual students who are missing inordinate amounts of time in school. Students need to be at school to be exposed to English Language proficiency standards in order to increase their English Language proficiency.


Related Documents


