1 Agenda • Objectives and outcome • Overview of portfolio management – why you should care • Moore’s Core/Context model – portfolio mgt. for strategy • GE/McKinsey model – analytical portfolio management • Case studies to consider • Some of our “less academic” learning’s about PM

Welcome message from author
This document is posted to help you gain knowledge. Please leave a comment to let me know what you think about it! Share it to your friends and learn new things together.
Transcript
1
Agenda
• Objectives and outcome
• Overview of portfolio management – why you should care
• Moore’s Core/Context model – portfolio mgt. for strategy
• GE/McKinsey model – analytical portfolio management
• Case studies to consider
• Some of our “less academic” learning’s about PM
2
Session Objectives
• Understand of the portfolio management process and its application.
• Gain insights into the key success factors, best practices and common pitfalls in portfolio planning.
• Apply what we learned from the classroom to strategic and operational decisions you face.
3
Portfolio Management has two flavors
1. Strategic/business/investment portfolio management
• The strategy development, evaluation, prioritization and optimal allocation of investment dollars for a set of competing opportunities: markets, businesses, strategic initiatives or investment projects
2. Operational/pipeline/resource portfolio management
• The allocation of resources (people, skillsets, capacity) to a set of competing projects or opportunities to maximize the value and throughput of the project pipeline or operation of the business
In both types of PM, the challenge is to:
• Optimize the value output for any given level of financial or human resource input.
• Align the portfolio in support of the organization’s overall strategy and strategic intent
4
The three high-level goals of PM are:
1. Strategic alignment—active investments are necessary and sufficient for the strategy to succeed • The active investments are on-strategy (Strategic Fit) • The active investments truly enable our strategic intent &
direction 2. Strategic balance—active investments have a “desired” mix or
balance across multiple important dimensions • Long-term vs. short-term, Core/Emerging/New markets • High-risk vs. low-risk, Risk vs. reward • Markets of Interest, Business Models, etc.
3. Maximum return • The portfolio is designed to make optimal use of scarce
resources to achieve desired objectives.
5
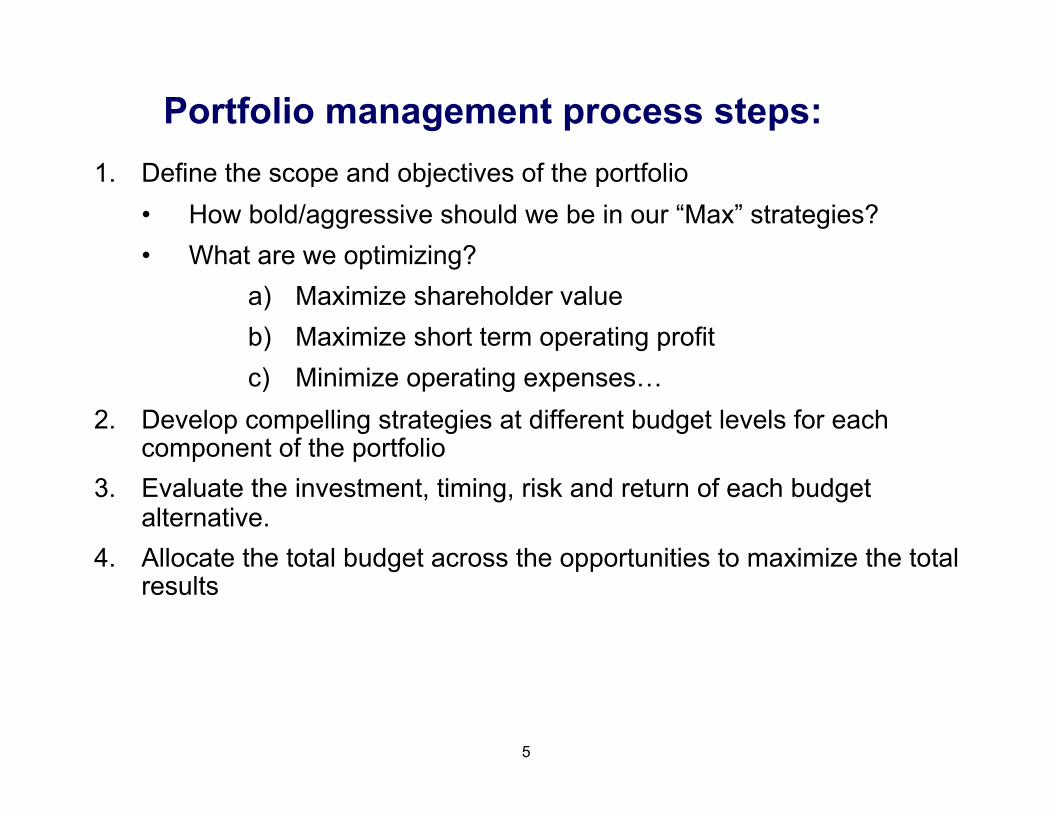
Portfolio management process steps: 1. Define the scope and objectives of the portfolio
• How bold/aggressive should we be in our “Max” strategies? • What are we optimizing?
a) Maximize shareholder value b) Maximize short term operating profit c) Minimize operating expenses…
2. Develop compelling strategies at different budget levels for each component of the portfolio
3. Evaluate the investment, timing, risk and return of each budget alternative.
4. Allocate the total budget across the opportunities to maximize the total results
6
7
Market Share-Market Growth Matrix (BCG Matrix)
8
LES Marketing (excludes FPM)
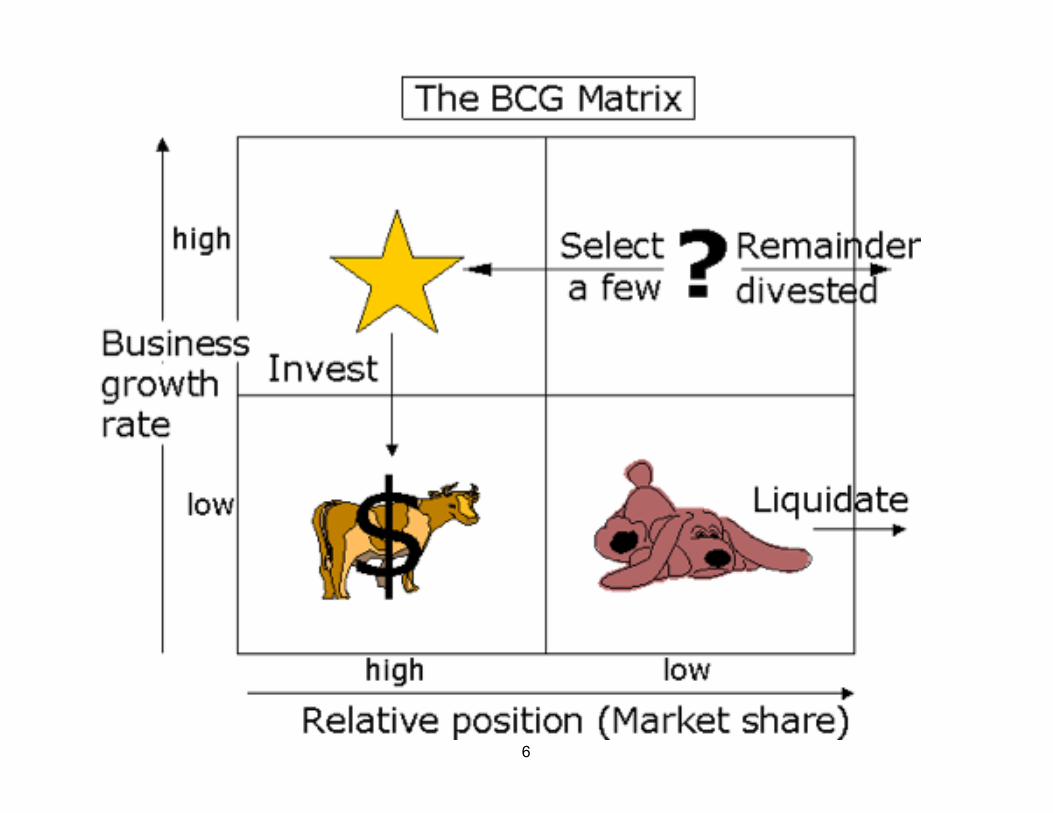
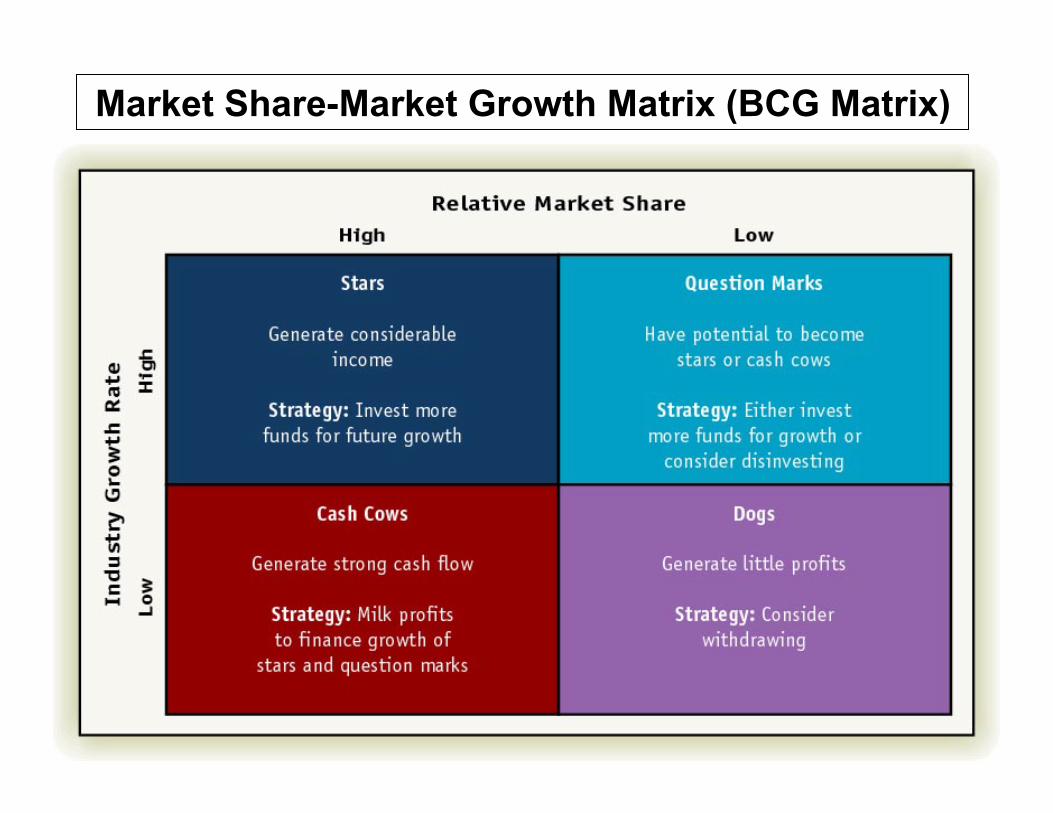
The BCG matrix method is based on the product life cycle theory that can be used to determine what priorities should be given in the product portfolio of a business unit.
To ensure long-term value creation, a company should have a portfolio of products that contains both high-growth products in need of cash inputs and low-growth products that generate a lot of cash.
It has 2 dimensions: market share and market growth. The basic idea behind it is the bigger the market share a product has or the faster the product’s market grows, the better it is for the company.
9
LES Marketing (excludes FPM)
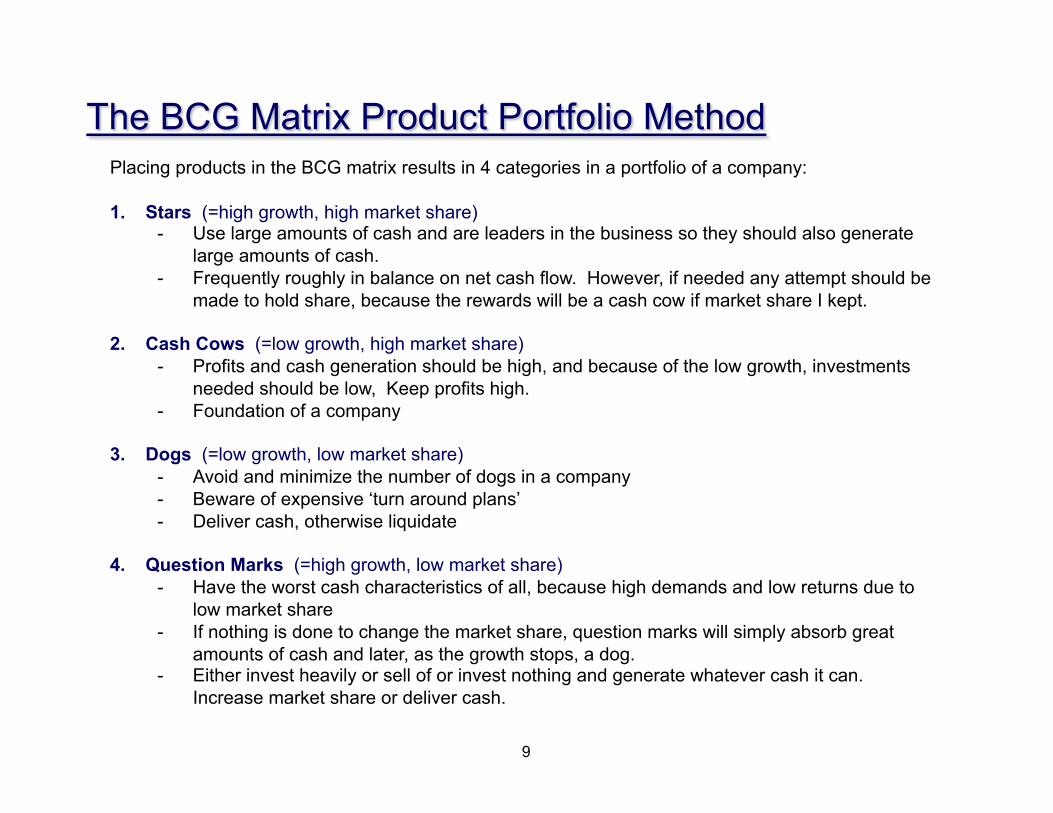
Placing products in the BCG matrix results in 4 categories in a portfolio of a company:
1. Stars (=high growth, high market share) - Use large amounts of cash and are leaders in the business so they should also generate
large amounts of cash. - Frequently roughly in balance on net cash flow. However, if needed any attempt should be
made to hold share, because the rewards will be a cash cow if market share I kept.
2. Cash Cows (=low growth, high market share) - Profits and cash generation should be high, and because of the low growth, investments
needed should be low, Keep profits high. - Foundation of a company
3. Dogs (=low growth, low market share) - Avoid and minimize the number of dogs in a company - Beware of expensive ‘turn around plans’ - Deliver cash, otherwise liquidate
4. Question Marks (=high growth, low market share) - Have the worst cash characteristics of all, because high demands and low returns due to
low market share - If nothing is done to change the market share, question marks will simply absorb great
amounts of cash and later, as the growth stops, a dog. - Either invest heavily or sell of or invest nothing and generate whatever cash it can.
Increase market share or deliver cash.
10
LES Marketing (excludes FPM)
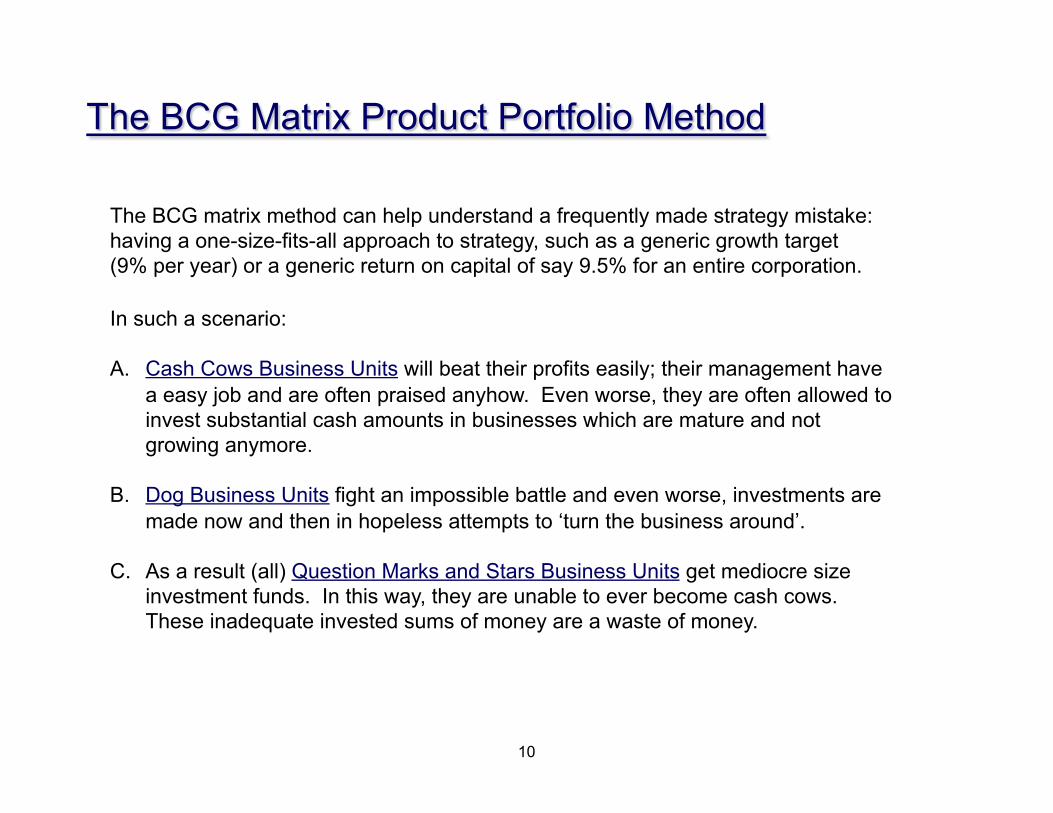
In such a scenario:
A. Cash Cows Business Units will beat their profits easily; their management have a easy job and are often praised anyhow. Even worse, they are often allowed to invest substantial cash amounts in businesses which are mature and not growing anymore.
B. Dog Business Units fight an impossible battle and even worse, investments are made now and then in hopeless attempts to ‘turn the business around’.
C. As a result (all) Question Marks and Stars Business Units get mediocre size investment funds. In this way, they are unable to ever become cash cows. These inadequate invested sums of money are a waste of money.
The BCG matrix method can help understand a frequently made strategy mistake: having a one-size-fits-all approach to strategy, such as a generic growth target (9% per year) or a generic return on capital of say 9.5% for an entire corporation.
11
LES Marketing (excludes FPM)
Some limitations of the Boston Consulting Group Matrix include:
• High market share is not the only success factor
• Market growth is not the only indicator for attractiveness of a market
• Sometimes dogs can earn as much cash as Cash Cows
12 Dealing with Darwin © 2006, TCG Advisors LLC
November 27, 2017
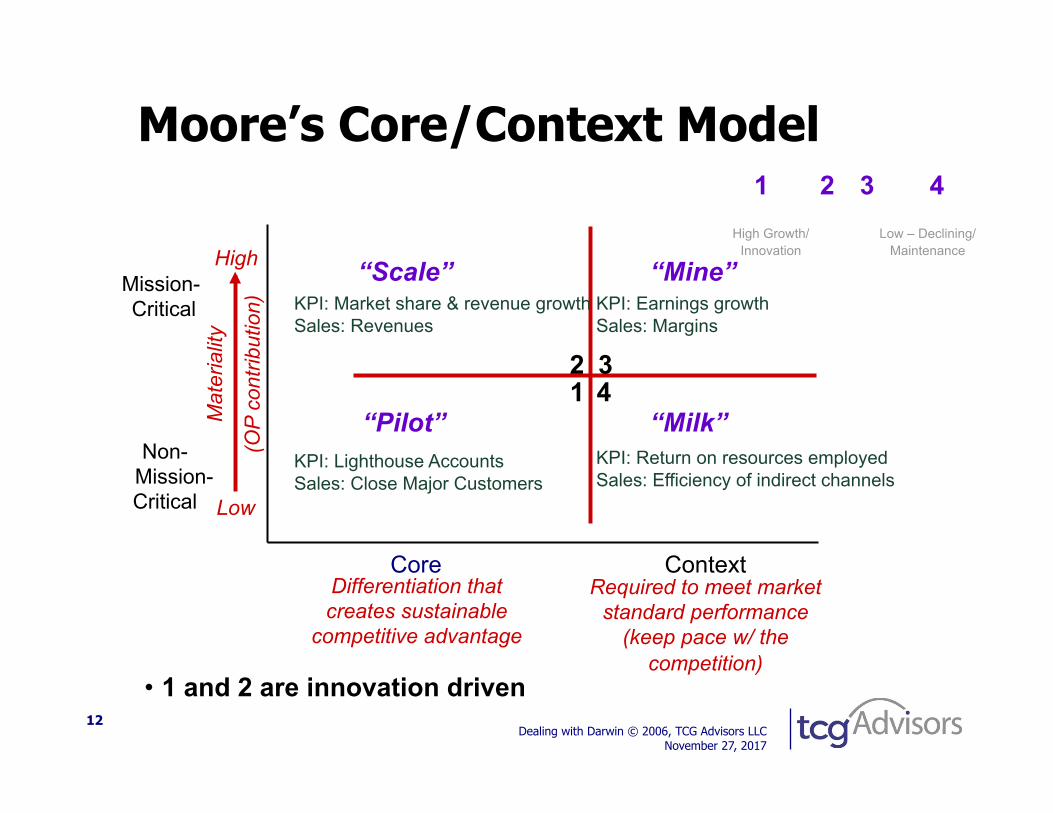
Moore’s Core/Context Model
Core Context
Mission- Critical
Non-Mission- Critical
KPI: Earnings growth Sales: Margins
KPI: Return on resources employed Sales: Efficiency of indirect channels
Mat
eria
lity
(OP
cont
ribut
ion)
Low
High
Differentiation that creates sustainable
competitive advantage
Required to meet market standard performance
(keep pace w/ the competition)
“Pilot”
“Scale” “Mine”
“Milk” 12 3
4
KPI: Lighthouse Accounts Sales: Close Major Customers
KPI: Market share & revenue growth Sales: Revenues
High Growth/ Innovation
Low – Declining/ Maintenance
• 1 and 2 are innovation driven
2 31 4
13
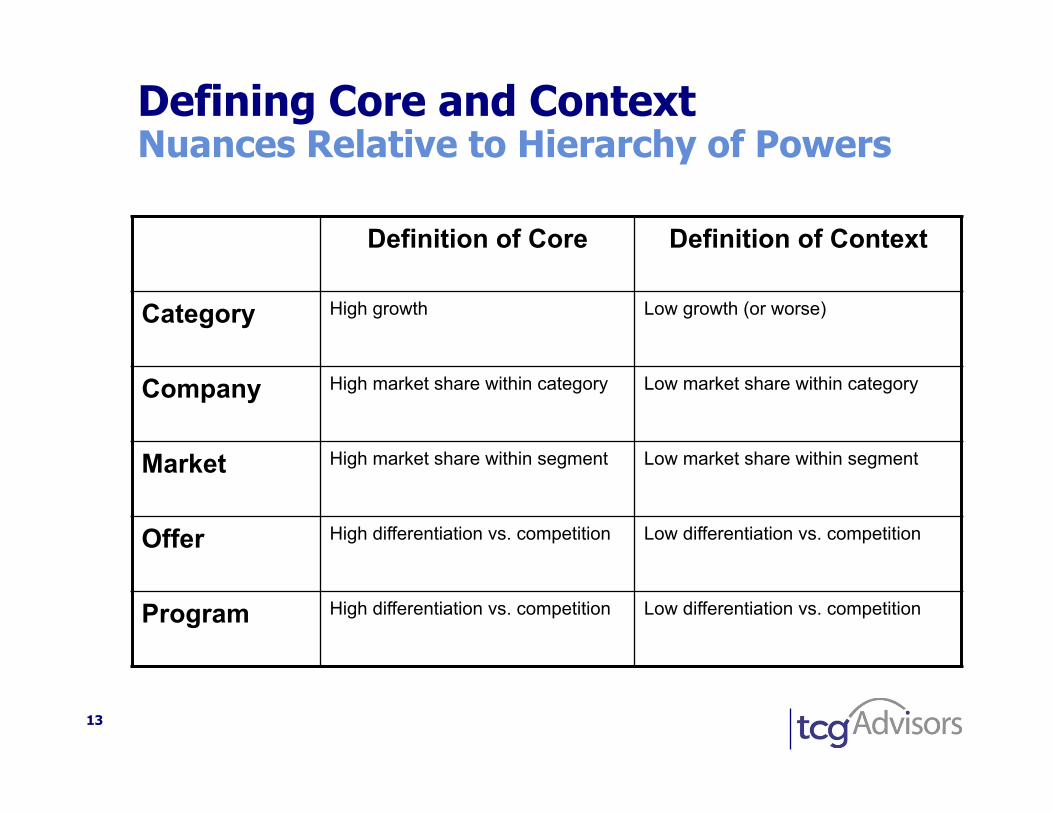
Defining Core and Context Nuances Relative to Hierarchy of Powers
Definition of Core Definition of Context
Category High growth Low growth (or worse)
Company High market share within category Low market share within category
Market High market share within segment Low market share within segment
Offer High differentiation vs. competition Low differentiation vs. competition
Program High differentiation vs. competition Low differentiation vs. competition
14
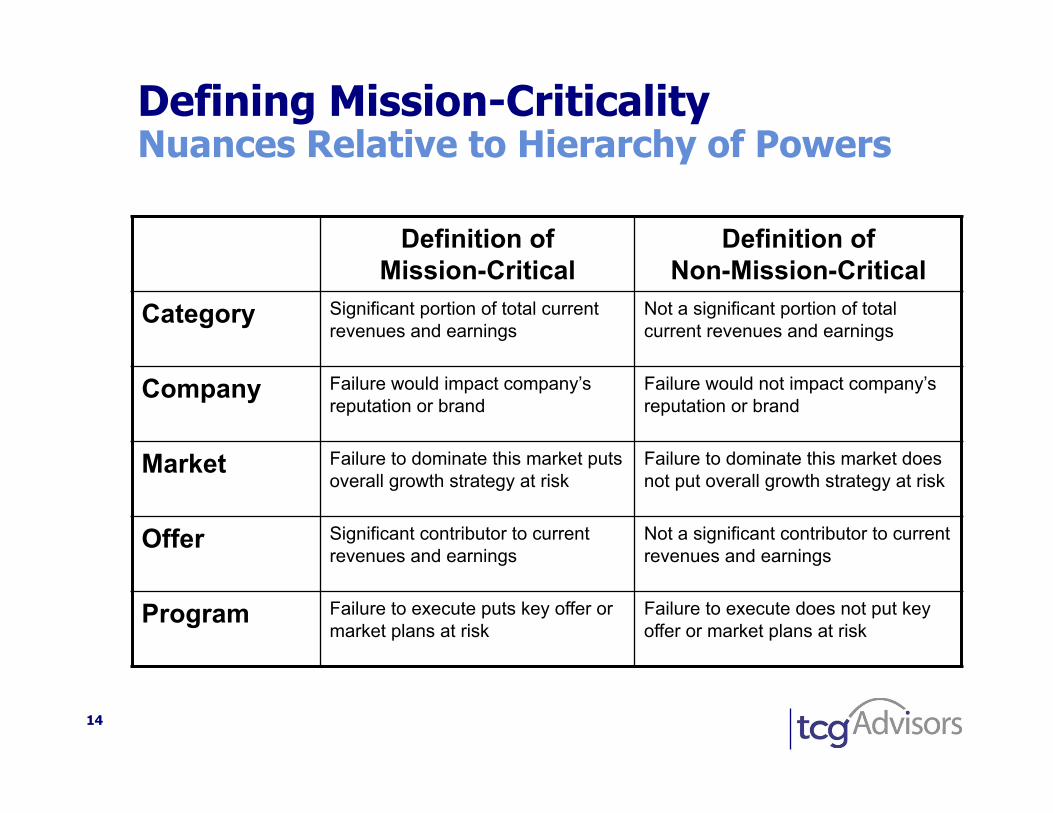
Defining Mission-Criticality Nuances Relative to Hierarchy of Powers
Definition of Mission-Critical
Definition of Non-Mission-Critical
Category Significant portion of total current revenues and earnings
Not a significant portion of total current revenues and earnings
Company Failure would impact company’s reputation or brand
Failure would not impact company’s reputation or brand
Market Failure to dominate this market puts overall growth strategy at risk
Failure to dominate this market does not put overall growth strategy at risk
Offer Significant contributor to current revenues and earnings
Not a significant contributor to current revenues and earnings
Program Failure to execute puts key offer or market plans at risk
Failure to execute does not put key offer or market plans at risk
15
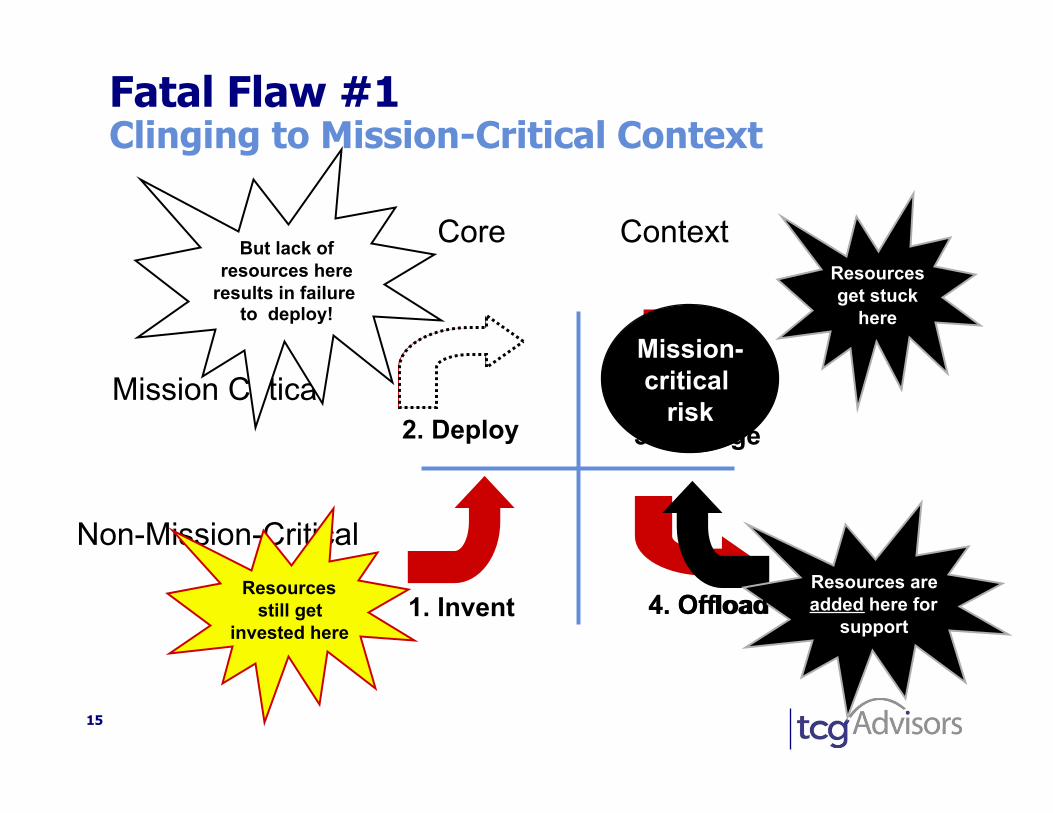
Mission Critical
Non-Mission-Critical
Fatal Flaw #1 Clinging to Mission-Critical Context
2. Deploy
1. Invent
3. Manage
4. Offload
Resources get stuck
here
Resources are added here for
support
Resources still get
invested here
But lack of resources here
results in failure to deploy!
4. Onload
Mission- critical
risk
Core Context
16
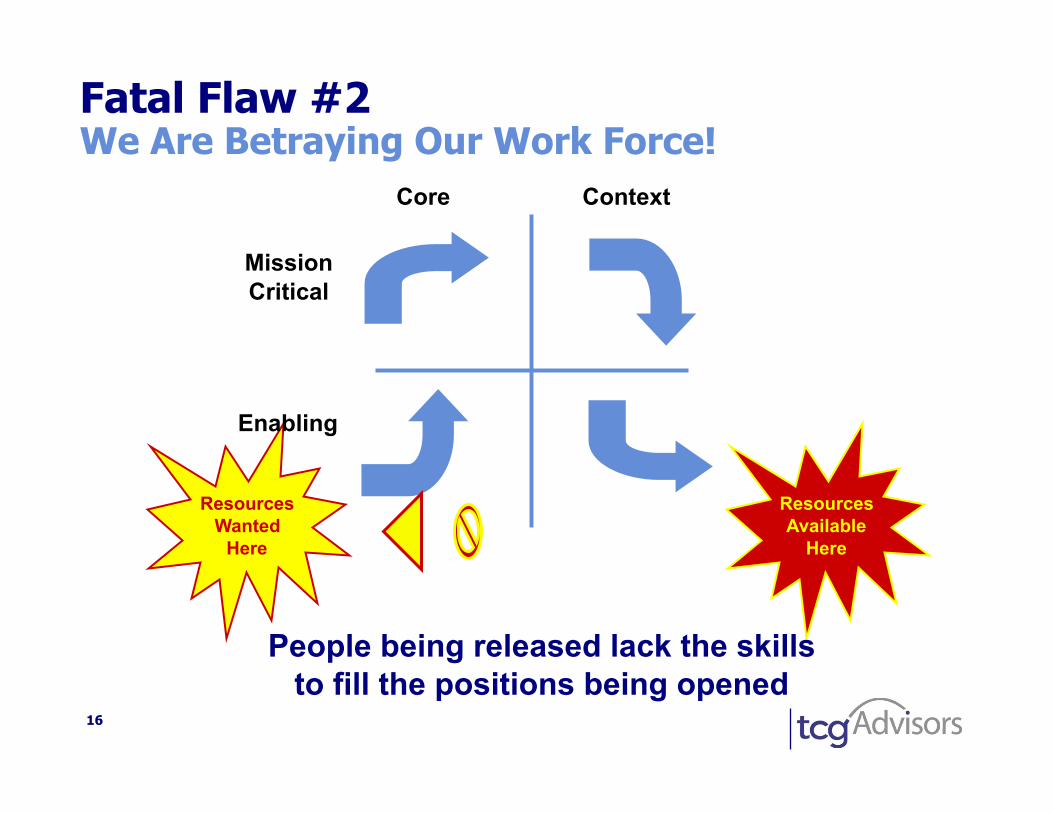
Fatal Flaw #2 We Are Betraying Our Work Force!
Resources Available
Here
Resources Wanted
Here
Core Context
Mission Critical
Enabling
People being released lack the skills to fill the positions being opened
Core Context
Non
-Mis
sion
Crit
ical
M
issi
on C
ritic
al
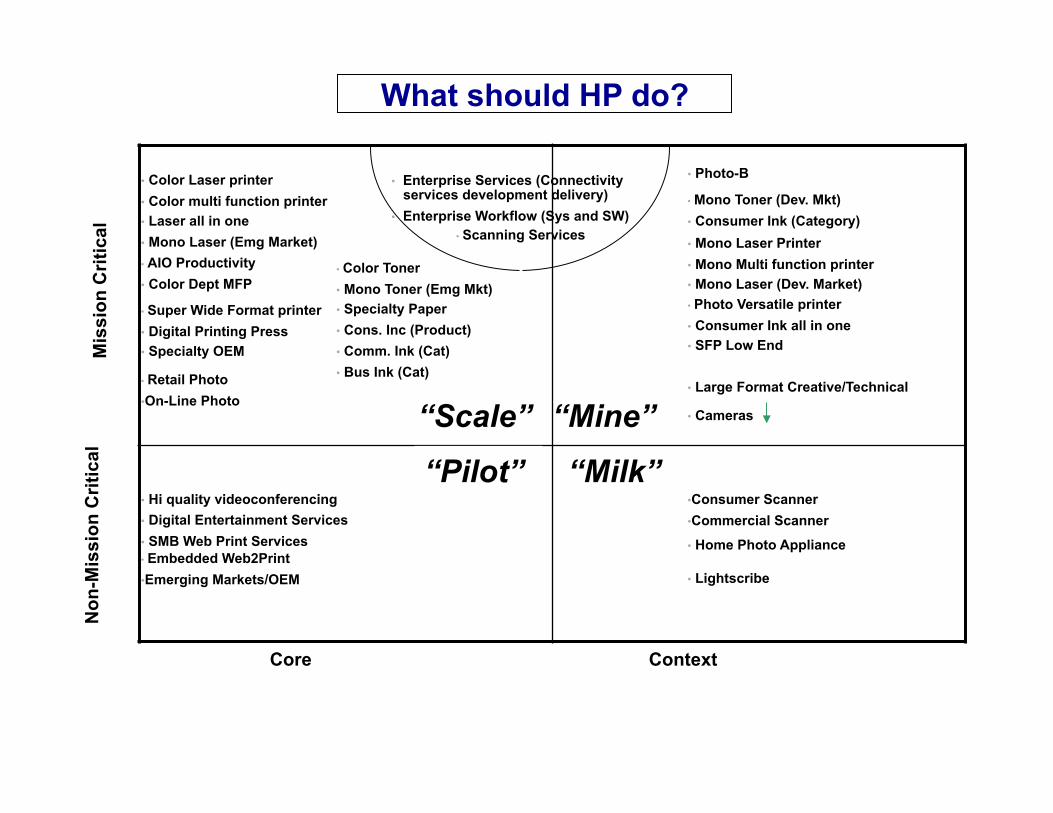
• Color Laser printer • Color multi function printer • Laser all in one • Mono Laser (Emg Market) • Mono Laser Printer
• Mono Multi function printer • Mono Laser (Dev. Market)
• Enterprise Services (Connectivity services development delivery)
• Enterprise Workflow (Sys and SW)
• AIO Productivity • Color Dept MFP
• Photo Versatile printer • Consumer Ink all in one • SFP Low End
• Consumer Scanner • Commercial Scanner
• Scanning Services
• Super Wide Format printer • Digital Printing Press • Specialty OEM
• Large Format Creative/Technical
• Lightscribe
• Hi quality videoconferencing
• Retail Photo • On-Line Photo
• Photo-B
• Cameras
• Home Photo Appliance
• Digital Entertainment Services • SMB Web Print Services
• Color Toner • Mono Toner (Emg Mkt) • Specialty Paper • Cons. Inc (Product) • Comm. Ink (Cat) • Bus Ink (Cat)
• Mono Toner (Dev. Mkt) • Consumer Ink (Category)
• Embedded Web2Print • Emerging Markets/OEM
1
What should HP do?
“Pilot”
“Scale” “Mine”
“Milk”
18
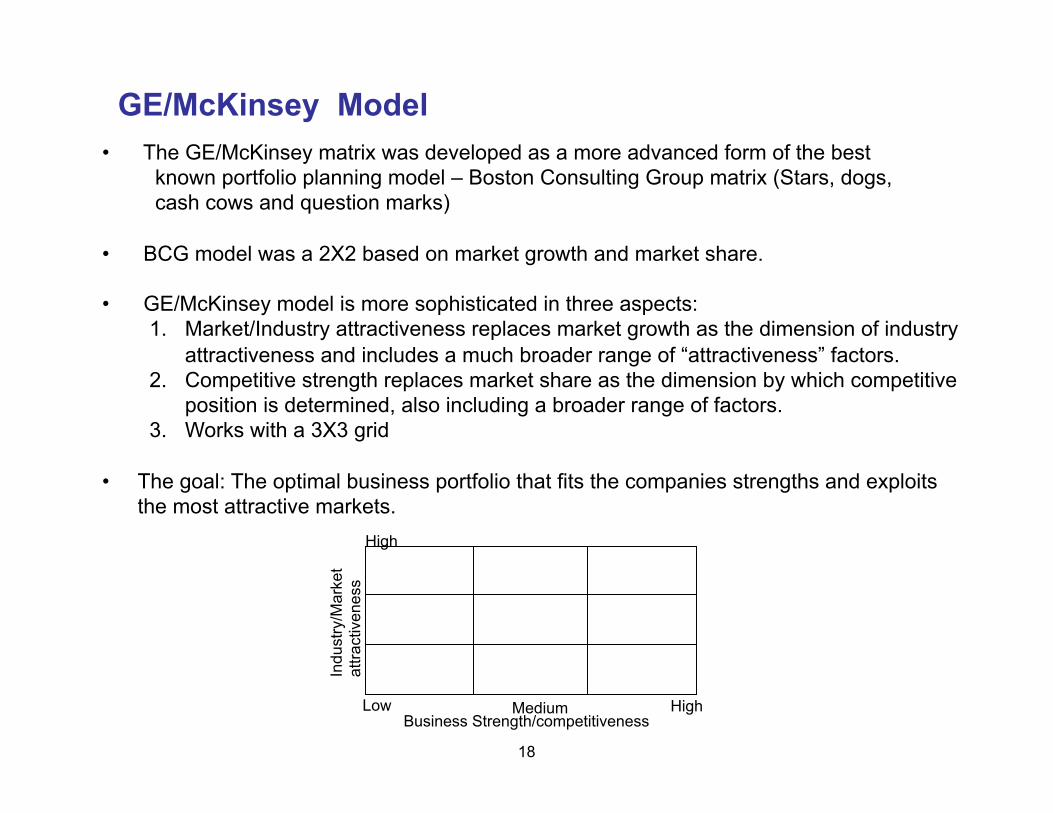
GE/McKinsey Model
Business Strength/competitiveness
Indu
stry
/Mar
ket
attra
ctiv
enes
s
Medium
High
High
• The GE/McKinsey matrix was developed as a more advanced form of the best known portfolio planning model – Boston Consulting Group matrix (Stars, dogs, cash cows and question marks)
• BCG model was a 2X2 based on market growth and market share.
• GE/McKinsey model is more sophisticated in three aspects: 1. Market/Industry attractiveness replaces market growth as the dimension of industry
attractiveness and includes a much broader range of “attractiveness” factors. 2. Competitive strength replaces market share as the dimension by which competitive
position is determined, also including a broader range of factors. 3. Works with a 3X3 grid
• The goal: The optimal business portfolio that fits the companies strengths and exploits the most attractive markets.
Low
19
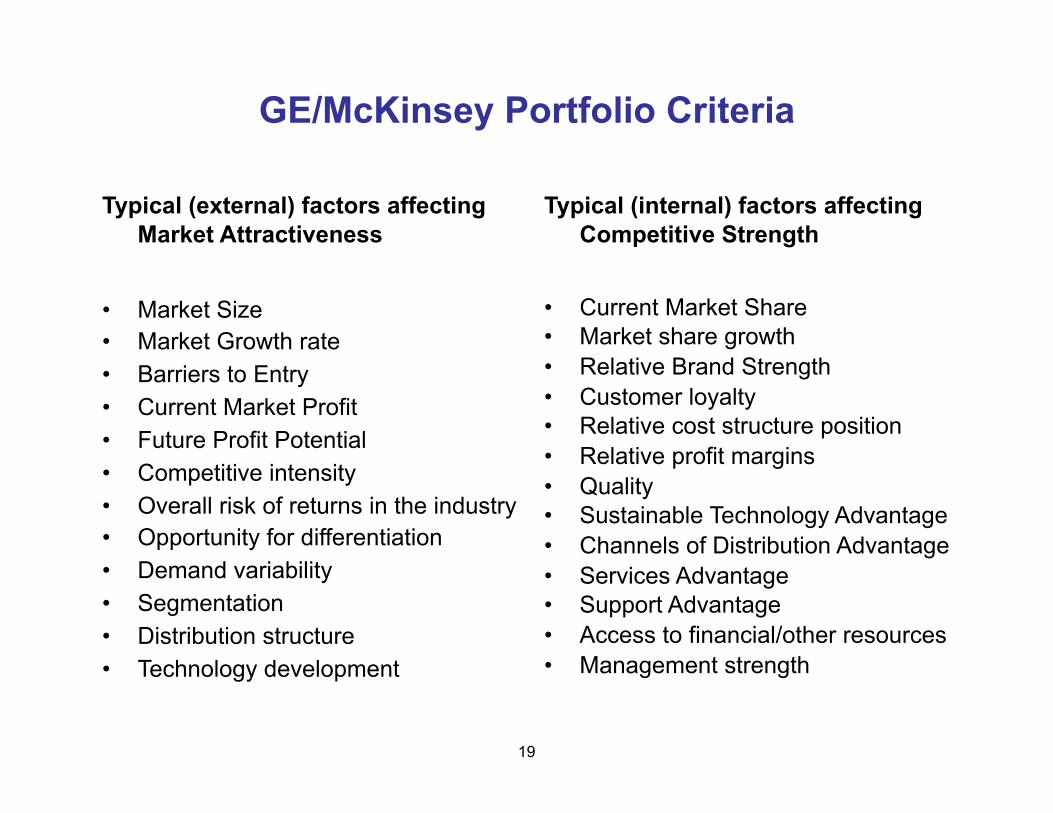
GE/McKinsey Portfolio Criteria
Typical (external) factors affecting Market Attractiveness
• Market Size • Market Growth rate • Barriers to Entry • Current Market Profit • Future Profit Potential • Competitive intensity • Overall risk of returns in the industry • Opportunity for differentiation • Demand variability • Segmentation • Distribution structure • Technology development
Typical (internal) factors affecting Competitive Strength
• Current Market Share • Market share growth • Relative Brand Strength • Customer loyalty • Relative cost structure position • Relative profit margins • Quality • Sustainable Technology Advantage • Channels of Distribution Advantage • Services Advantage • Support Advantage • Access to financial/other resources • Management strength
20
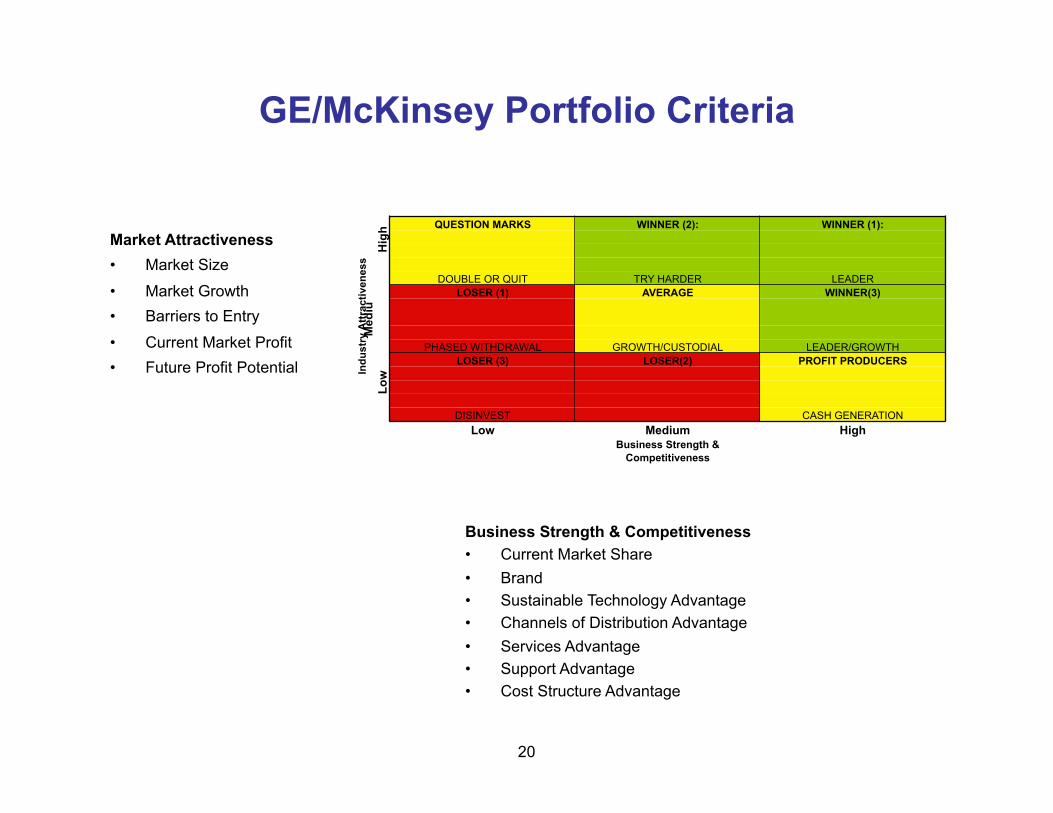
GE/McKinsey Portfolio Criteria
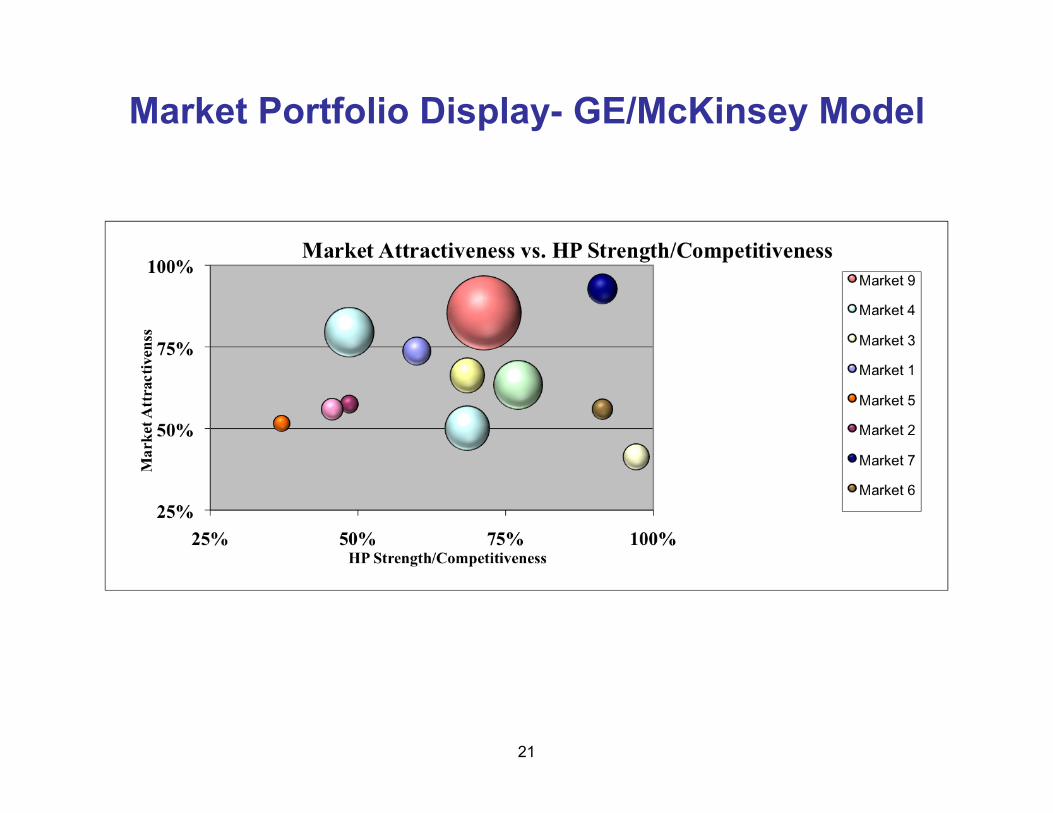
Market Attractiveness • Market Size
• Market Growth • Barriers to Entry
• Current Market Profit • Future Profit Potential
Business Strength & Competitiveness • Current Market Share • Brand • Sustainable Technology Advantage • Channels of Distribution Advantage • Services Advantage • Support Advantage • Cost Structure Advantage
Hig
h QUESTION MARKS WINNER (2): WINNER (1):
Indu
stry
Attr
activ
enes
s
DOUBLE OR QUIT TRY HARDER LEADER LOSER (1) AVERAGE WINNER(3)
Med
ium
PHASED WITHDRAWAL GROWTH/CUSTODIAL LEADER/GROWTH LOSER (3) LOSER(2) PROFIT PRODUCERS
Lo
w
DISINVEST CASH GENERATION Low Medium High
Business Strength & Competitiveness
21
Market Portfolio Display- GE/McKinsey Model
22
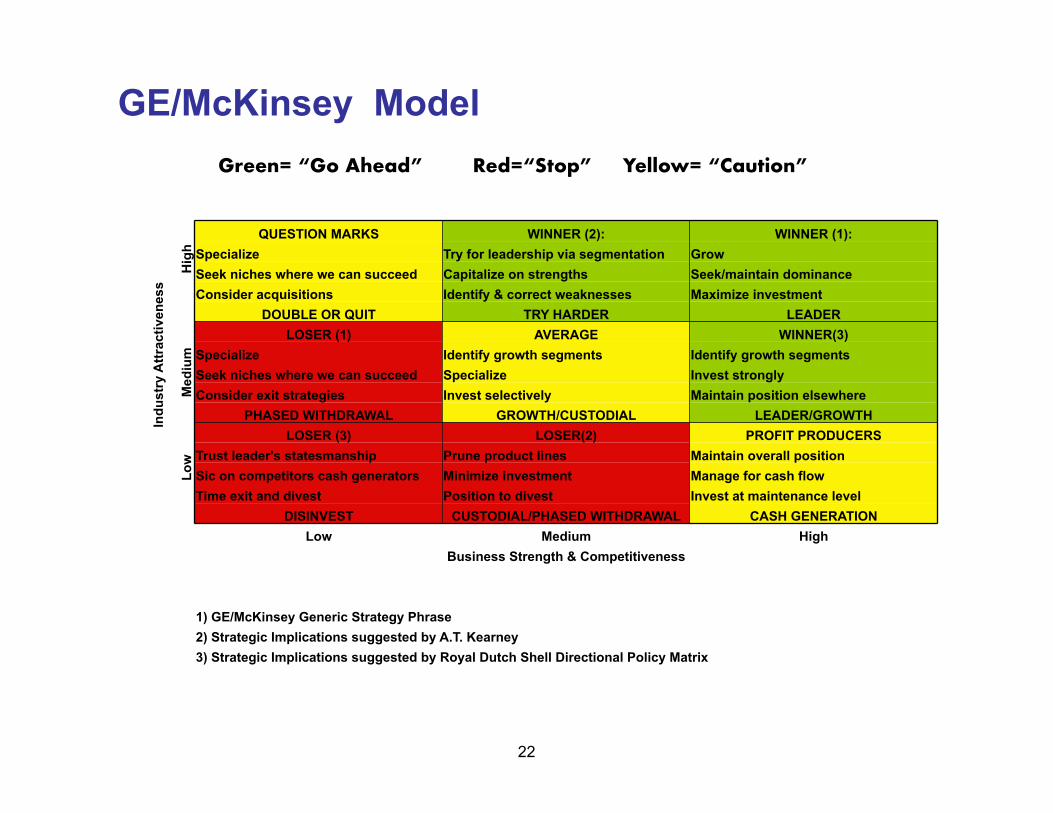
GE/McKinsey Model Green= “Go Ahead” Red=“Stop” Yellow= “Caution”
Hig
h
QUESTION MARKS WINNER (2): WINNER (1): Specialize Try for leadership via segmentation Grow Seek niches where we can succeed Capitalize on strengths Seek/maintain dominance
Indu
stry
Attr
activ
enes
s
Consider acquisitions Identify & correct weaknesses Maximize investment DOUBLE OR QUIT TRY HARDER LEADER
LOSER (1) AVERAGE WINNER(3)
Med
ium
Specialize Identify growth segments Identify growth segments Seek niches where we can succeed Specialize Invest strongly Consider exit strategies Invest selectively Maintain position elsewhere
PHASED WITHDRAWAL GROWTH/CUSTODIAL LEADER/GROWTH LOSER (3) LOSER(2) PROFIT PRODUCERS
Lo
w Trust leader's statesmanship Prune product lines Maintain overall position
Sic on competitors cash generators Minimize investment Manage for cash flow Time exit and divest Position to divest Invest at maintenance level
DISINVEST CUSTODIAL/PHASED WITHDRAWAL CASH GENERATION Low Medium High
Business Strength & Competitiveness
1) GE/McKinsey Generic Strategy Phrase 2) Strategic Implications suggested by A.T. Kearney 3) Strategic Implications suggested by Royal Dutch Shell Directional Policy Matrix
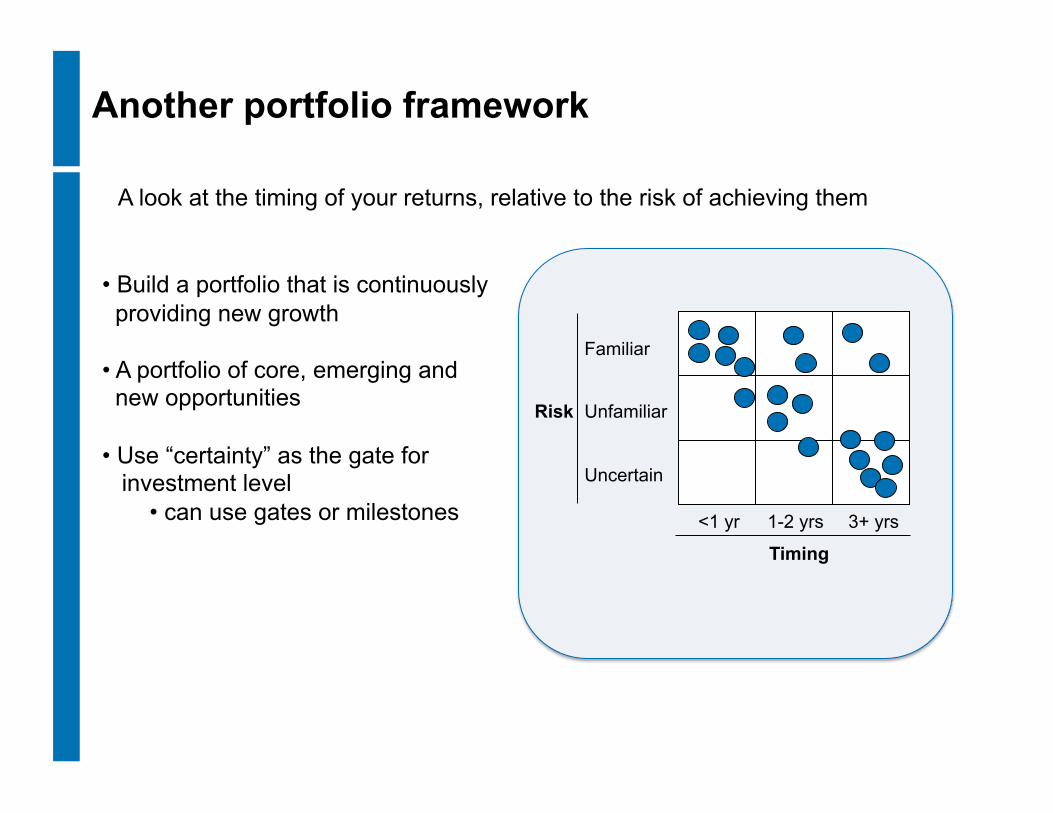
Another portfolio framework
Risk
Familiar
Unfamiliar
Uncertain
3+ yrs 1-2 yrs <1 yr
Timing
A look at the timing of your returns, relative to the risk of achieving them
• Build a portfolio that is continuously providing new growth
• A portfolio of core, emerging and new opportunities
• Use “certainty” as the gate for investment level
• can use gates or milestones
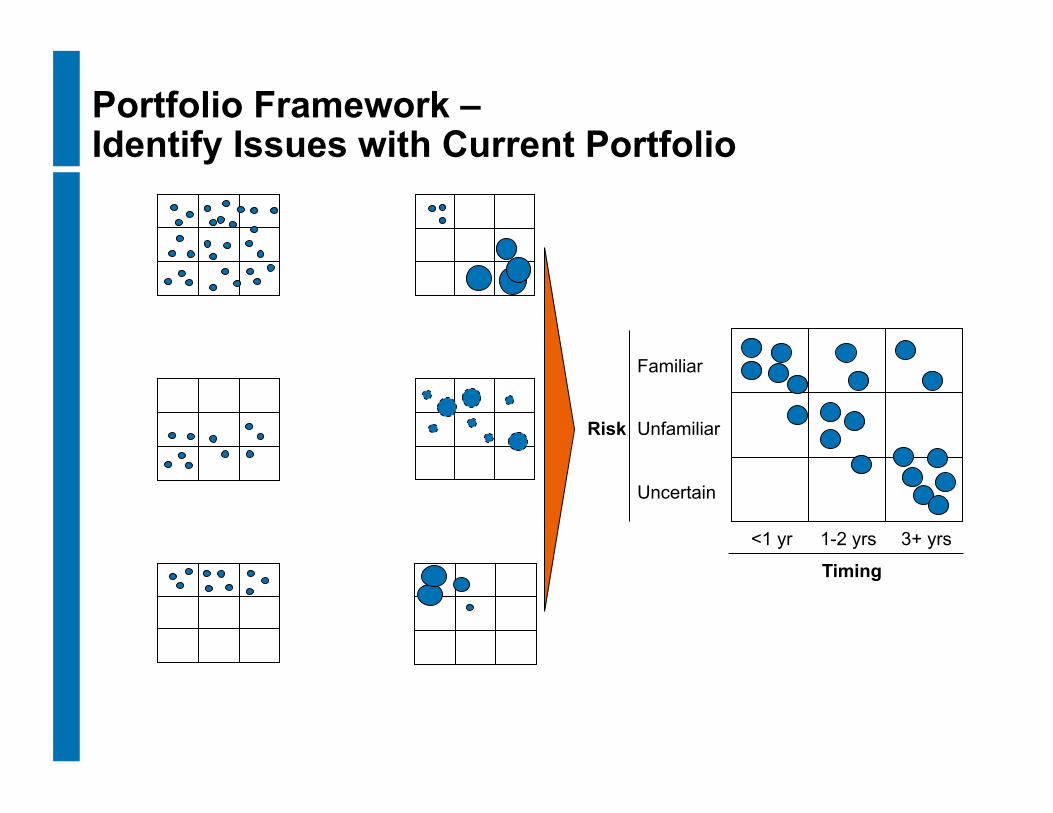
Portfolio Framework – Identify Issues with Current Portfolio
Risk
Familiar
Unfamiliar
Uncertain
3+ yrs 1-2 yrs <1 yr
Timing
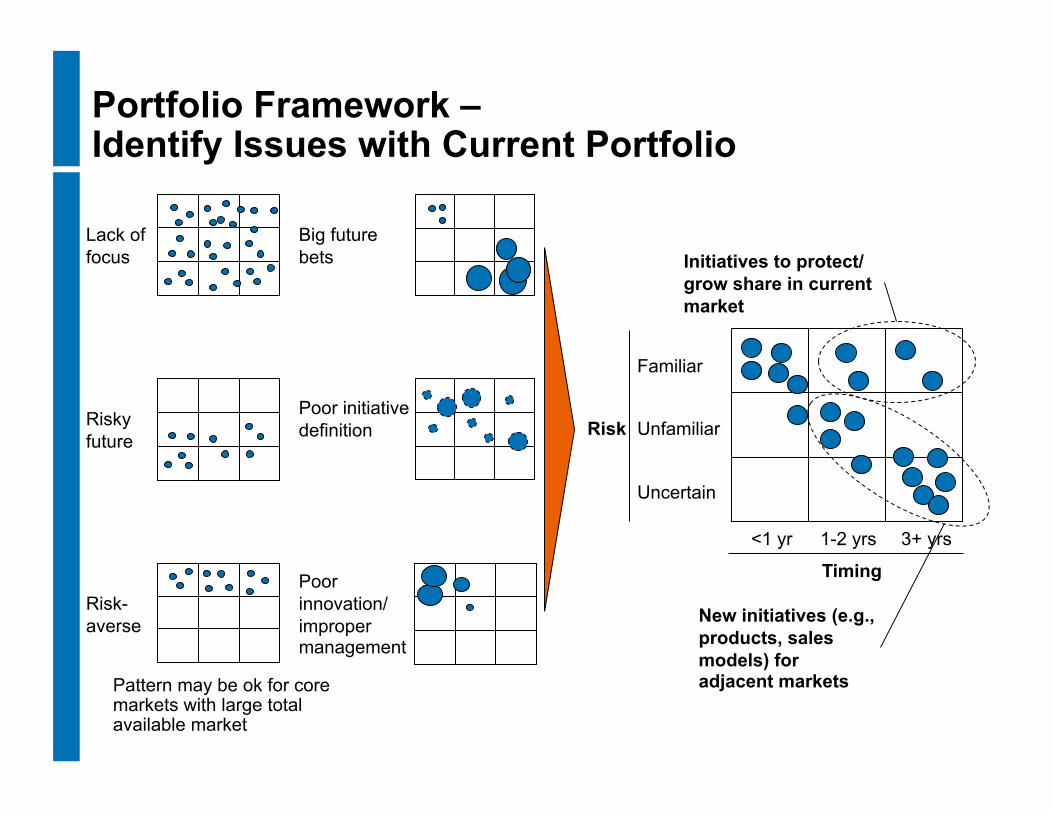
Portfolio Framework – Identify Issues with Current Portfolio
Lack of focus
Big future bets
Risky future
Poor initiative definition
Risk-averse
Poor innovation/ improper management
Pattern may be ok for core markets with large total available market
Initiatives to protect/grow share in current market
New initiatives (e.g., products, sales models) for adjacent markets
Risk
Familiar
Unfamiliar
Uncertain
3+ yrs 1-2 yrs <1 yr
Timing
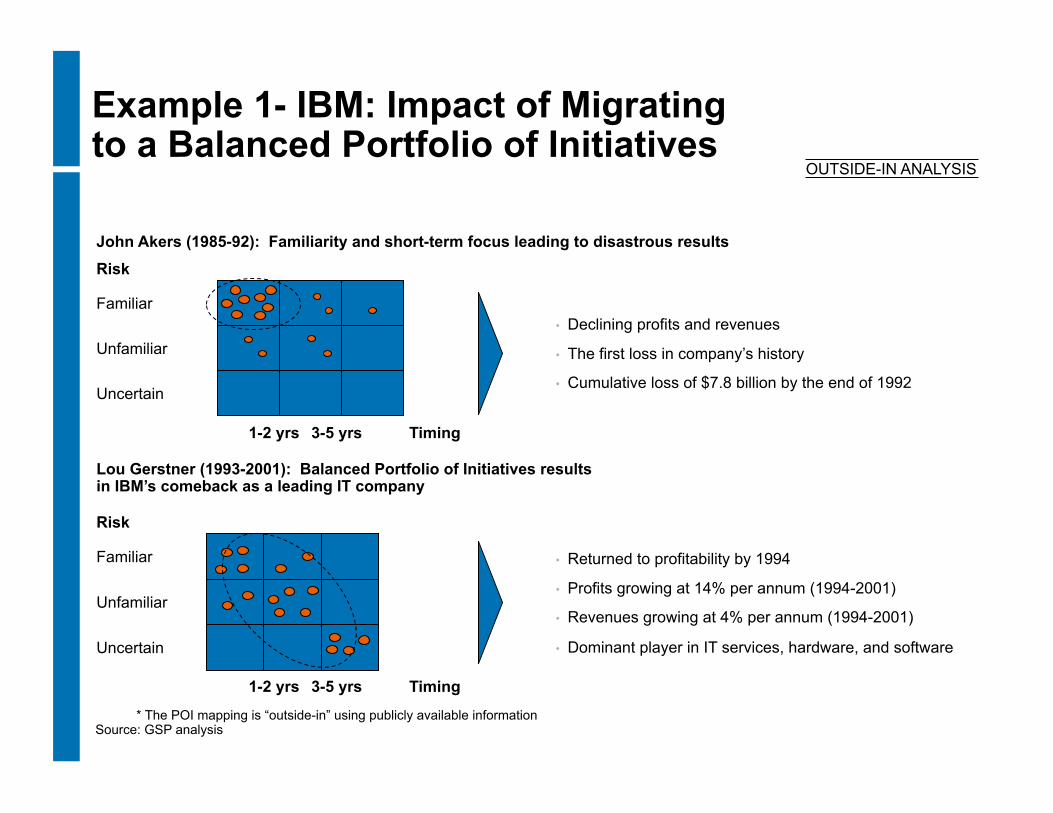
Example 1- IBM: Impact of Migrating to a Balanced Portfolio of Initiatives
Timing
Familiar
Uncertain
1-2 yrs 3-5 yrs
Unfamiliar
John Akers (1985-92): Familiarity and short-term focus leading to disastrous results
Lou Gerstner (1993-2001): Balanced Portfolio of Initiatives results in IBM’s comeback as a leading IT company
• Returned to profitability by 1994
• Profits growing at 14% per annum (1994-2001)
• Revenues growing at 4% per annum (1994-2001)
• Dominant player in IT services, hardware, and software
OUTSIDE-IN ANALYSIS
• Declining profits and revenues
• The first loss in company’s history
• Cumulative loss of $7.8 billion by the end of 1992
Timing
Familiar
Uncertain
1-2 yrs 3-5 yrs
Unfamiliar
Risk
Risk
* The POI mapping is “outside-in” using publicly available information Source: GSP analysis
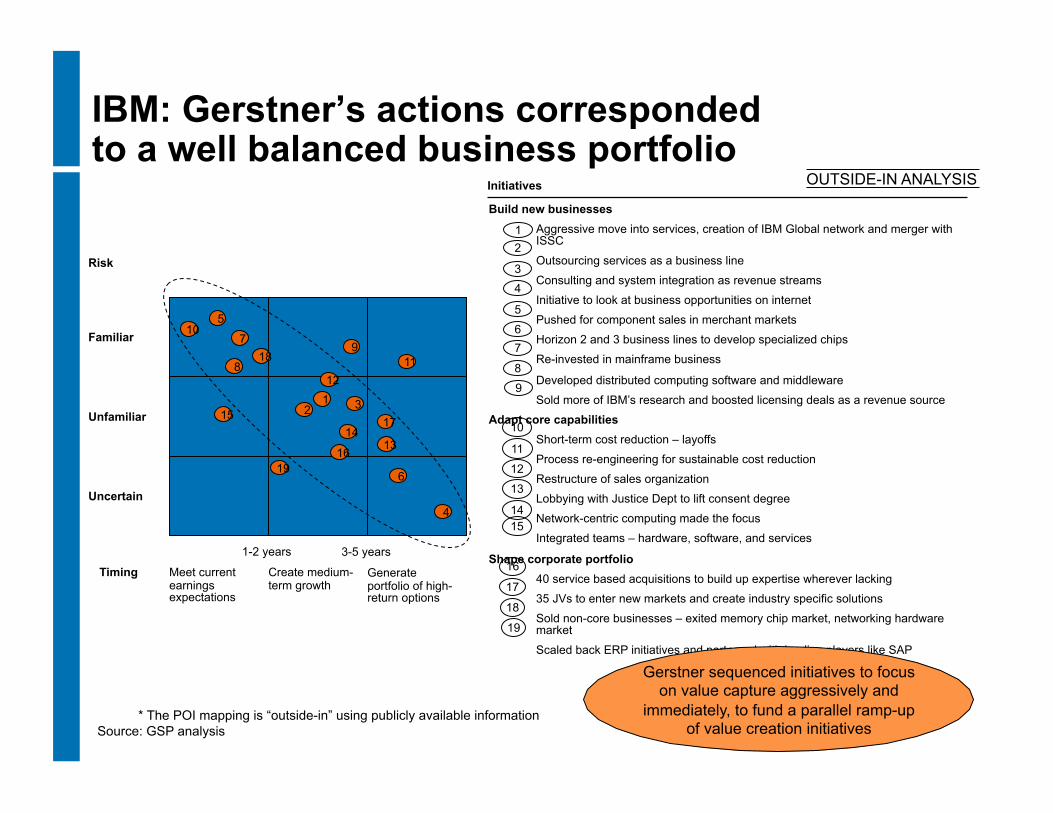
IBM: Gerstner’s actions corresponded to a well balanced business portfolio
* The POI mapping is “outside-in” using publicly available information Source: GSP analysis
Initiatives
Build new businesses Aggressive move into services, creation of IBM Global network and merger with ISSC
Outsourcing services as a business line
Consulting and system integration as revenue streams
Initiative to look at business opportunities on internet
Pushed for component sales in merchant markets
Horizon 2 and 3 business lines to develop specialized chips
Re-invested in mainframe business
Developed distributed computing software and middleware
Sold more of IBM’s research and boosted licensing deals as a revenue source
Adapt core capabilities Short-term cost reduction – layoffs
Process re-engineering for sustainable cost reduction
Restructure of sales organization
Lobbying with Justice Dept to lift consent degree
Network-centric computing made the focus
Integrated teams – hardware, software, and services
Shape corporate portfolio 40 service based acquisitions to build up expertise wherever lacking
35 JVs to enter new markets and create industry specific solutions
Sold non-core businesses – exited memory chip market, networking hardware market
Scaled back ERP initiatives and partnered with leading players like SAP
1 2
3
5
6 7
15
4
8
10
11
12
13
14
16
17
18
9
19
Uncertain
Unfamiliar
Familiar
Risk
Timing
5
7 10
14
8 12
1
13
18
3
4
6
11
19
2 15 17
16
1-2 years
Meet current earnings expectations
Create medium-term growth
Generate portfolio of high-return options
9
3-5 years
OUTSIDE-IN ANALYSIS
Gerstner sequenced initiatives to focus on value capture aggressively and
immediately, to fund a parallel ramp-up of value creation initiatives
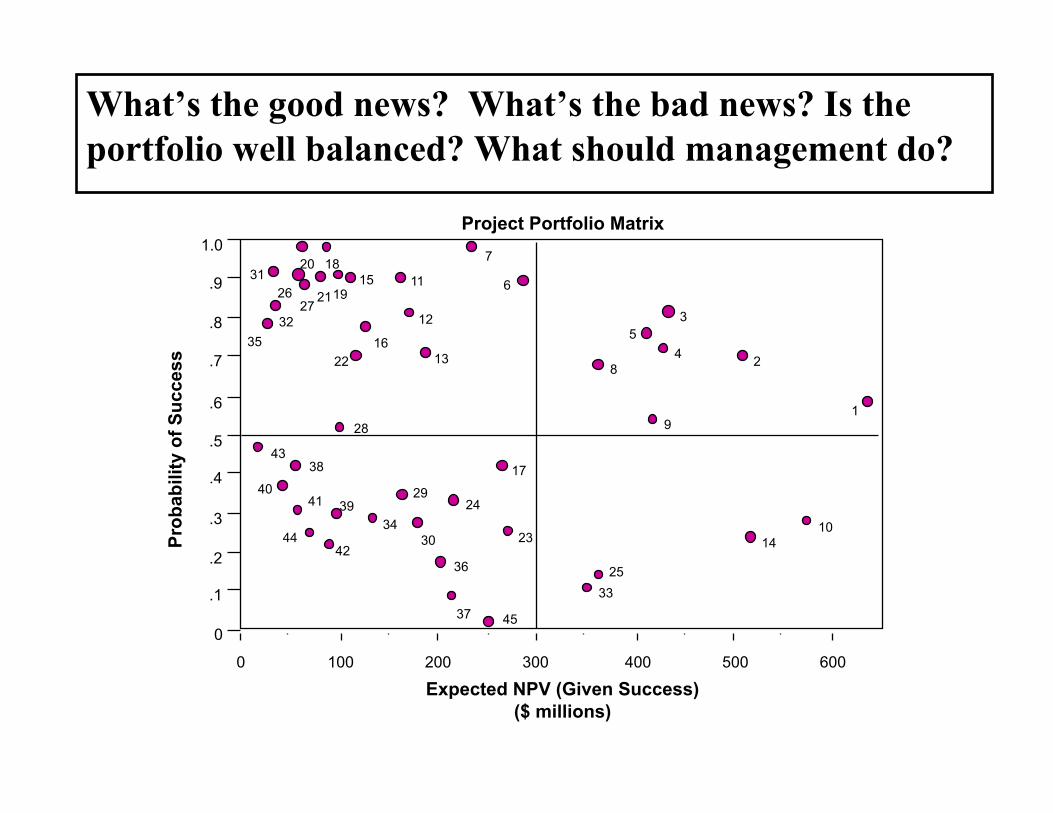
What’s the good news? What’s the bad news? Is the portfolio well balanced? What should management do?
0 300 600
Prob
abili
ty o
f Suc
cess
100 200 400 500
.1
.2
.3
.4
.5
.6
.7
.8
.9
1.0
0
40
27
25
23
17
15
13
11
9
7
1
4
6
8
10
12
14
22
24
28
30
33 37
39
43
45
32
34
36
38
42 44
3
2
19
16
18
21 26
20
29
31
35
41
5
Expected NPV (Given Success) ($ millions)
Project Portfolio Matrix
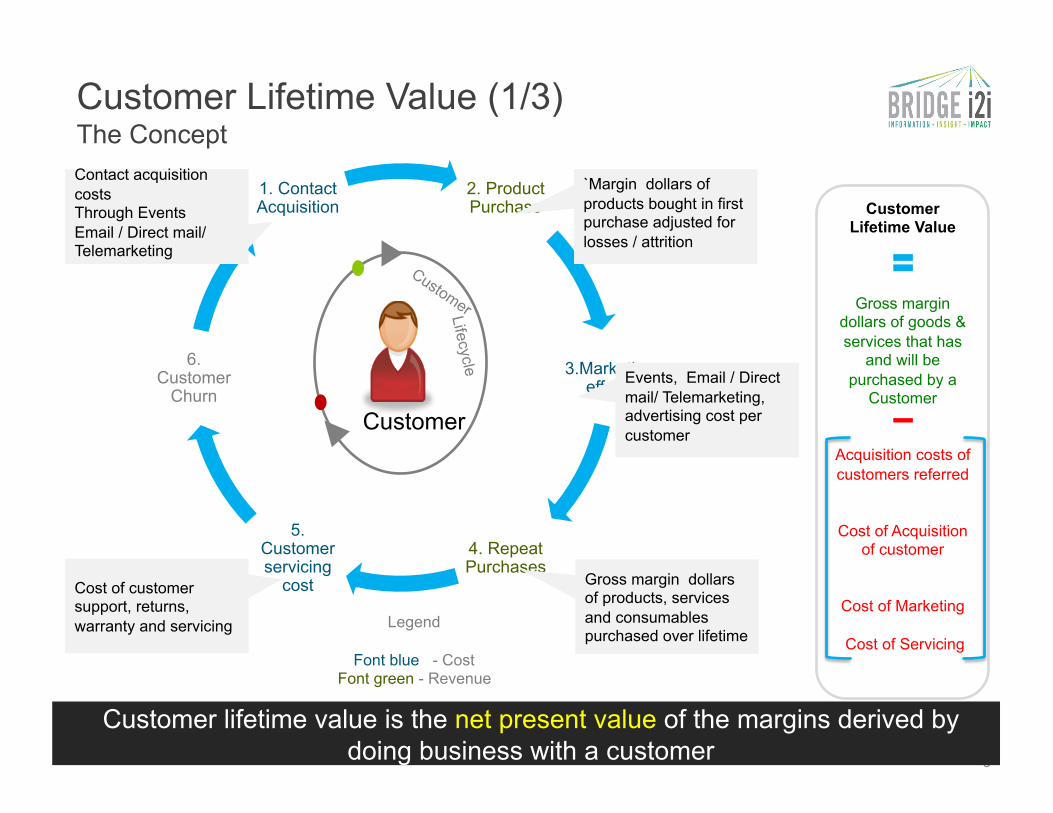
Customer Lifetime Value (1/3) The Concept
29
2. Product Purchase
3.Marketing efforts
4. Repeat Purchases
5. Customer servicing
cost
6. Customer
Churn
1. Contact Acquisition
Customer
Lifecycle
Legend
Font blue - Cost Font green - Revenue
Contact acquisition costs Through Events Email / Direct mail/ Telemarketing
`Margin dollars of products bought in first purchase adjusted for losses / attrition
Events, Email / Direct mail/ Telemarketing, advertising cost per customer
Gross margin dollars of products, services and consumables purchased over lifetime
Cost of customer support, returns, warranty and servicing
Customer lifetime value is the net present value of the margins derived by doing business with a customer
Customer Lifetime Value
Gross margin dollars of goods & services that has
and will be purchased by a
Customer
Acquisition costs of customers referred
Cost of Acquisition of customer
Cost of Marketing
Cost of Servicing
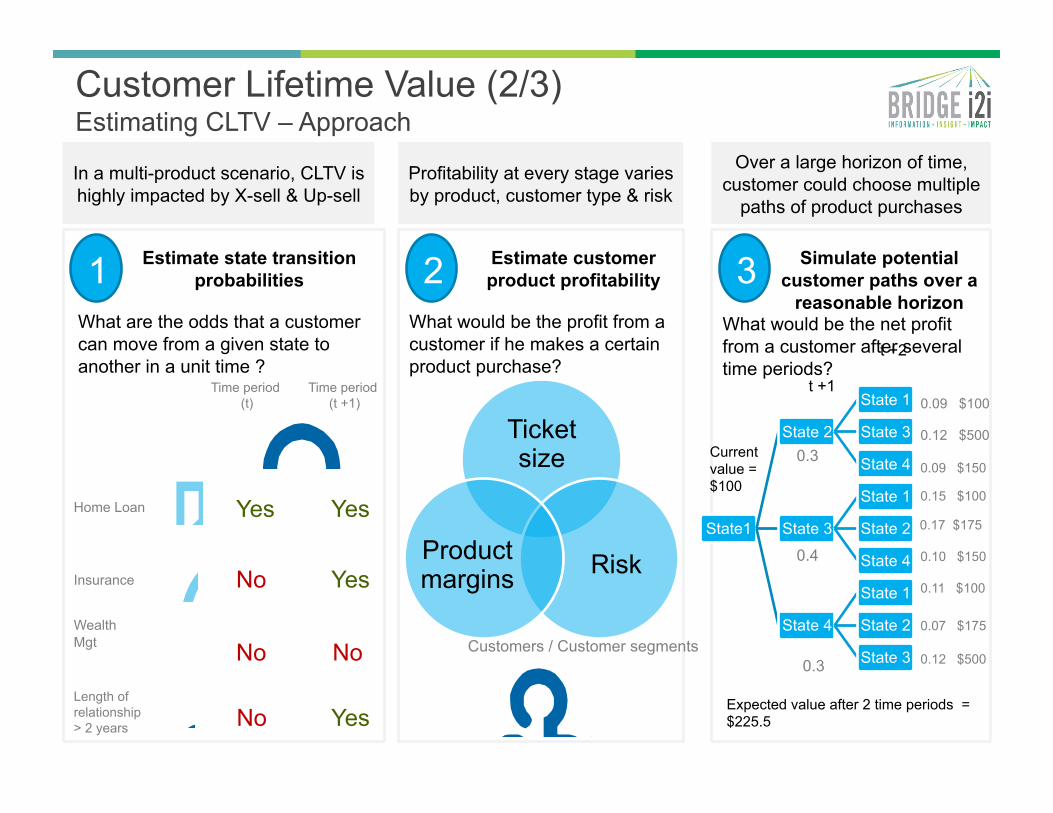
Customer Lifetime Value (2/3) Estimating CLTV – Approach
In a multi-product scenario, CLTV is highly impacted by X-sell & Up-sell
Home Loan
Insurance
Wealth Mgt
Yes
No
No
Yes
Yes
No
Time period (t)
Time period (t +1)
Length of relationship > 2 years No Yes
Profitability at every stage varies by product, customer type & risk
Over a large horizon of time, customer could choose multiple
paths of product purchases
1 Estimate state transition probabilities
What are the odds that a customer can move from a given state to another in a unit time ?
2 Estimate customer product profitability 3 Simulate potential
customer paths over a reasonable horizon
What would be the profit from a customer if he makes a certain product purchase?
What would be the net profit from a customer after several time periods?
Ticket size
Risk Product margins
Customers / Customer segments
State1
State 2
State 1
State 3
State 4
State 3
State 1
State 2
State 4
State 4
State 1
State 2
State 3
t +1
t +2
0.3
0.4
0.3
0.09 $100
0.12 $500
0.09 $150
0.15 $100
0.17 $175
0.10 $150
0.11 $100
0.07 $175
0.12 $500
Current value = $100
Expected value after 2 time periods = $225.5
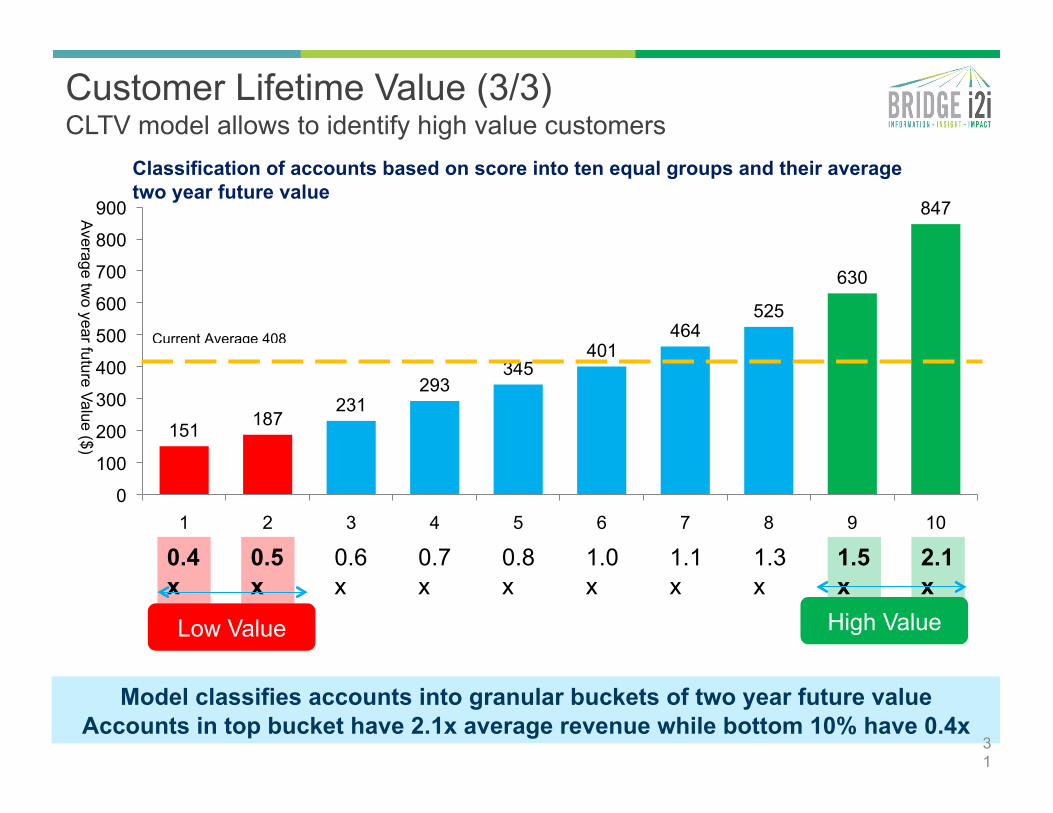
Customer Lifetime Value (3/3) CLTV model allows to identify high value customers
151 187 231
293 345
401 464
525
630
847
0
100
200
300
400
500
600
700
800
900
1 2 3 4 5 6 7 8 9 10
Current Average 408
0.4x
2.1x
1.5x
1.3x
1.1x
1.0x
0.8x
0.7x
0.6x
0.5x
Model classifies accounts into granular buckets of two year future value Accounts in top bucket have 2.1x average revenue while bottom 10% have 0.4x
Classification of accounts based on score into ten equal groups and their average two year future value
31
Average two year future Value ($)
Low Value High Value
Data exploration and basic customer
characteristics
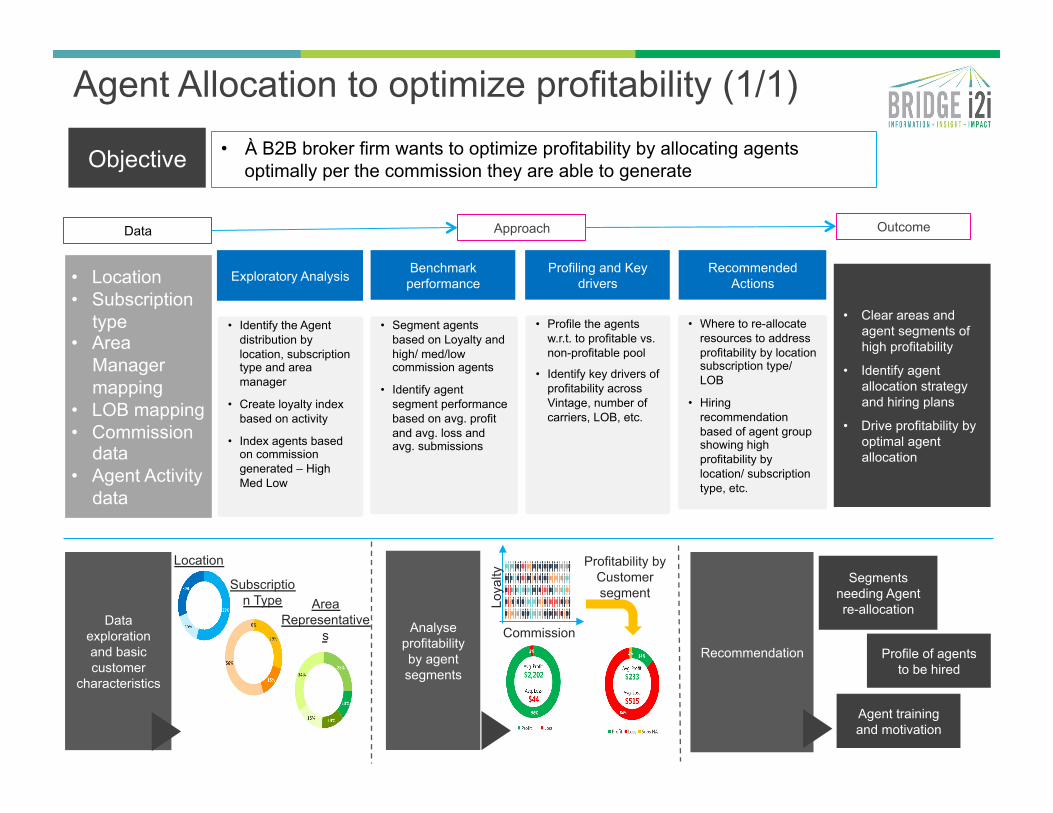
Agent Allocation to optimize profitability (1/1)
Data Approach Outcome
• Location • Subscription
type • Area
Manager mapping
• LOB mapping • Commission
data • Agent Activity
data
• À B2B broker firm wants to optimize profitability by allocating agents optimally per the commission they are able to generate Objective
Exploratory Analysis Benchmark performance
Profiling and Key drivers
• Identify the Agent distribution by location, subscription type and area manager
• Create loyalty index based on activity
• Index agents based on commission generated – High Med Low
• Segment agents based on Loyalty and high/ med/low commission agents
• Identify agent segment performance based on avg. profit and avg. loss and avg. submissions
• Clear areas and agent segments of high profitability
• Identify agent allocation strategy and hiring plans
• Drive profitability by optimal agent allocation
Recommended Actions
• Where to re-allocate resources to address profitability by location subscription type/ LOB
• Hiring recommendation based of agent group showing high profitability by location/ subscription type, etc.
• Profile the agents w.r.t. to profitable vs. non-profitable pool
• Identify key drivers of profitability across Vintage, number of carriers, LOB, etc.
Analyse profitability by agent segments
Recommendation Profile of agents to be hired
Segments needing Agent re-allocation
Subscription Type Area
Representatives
Location Profitability by Customer segment
Loya
lty
Commission
Agent training and motivation
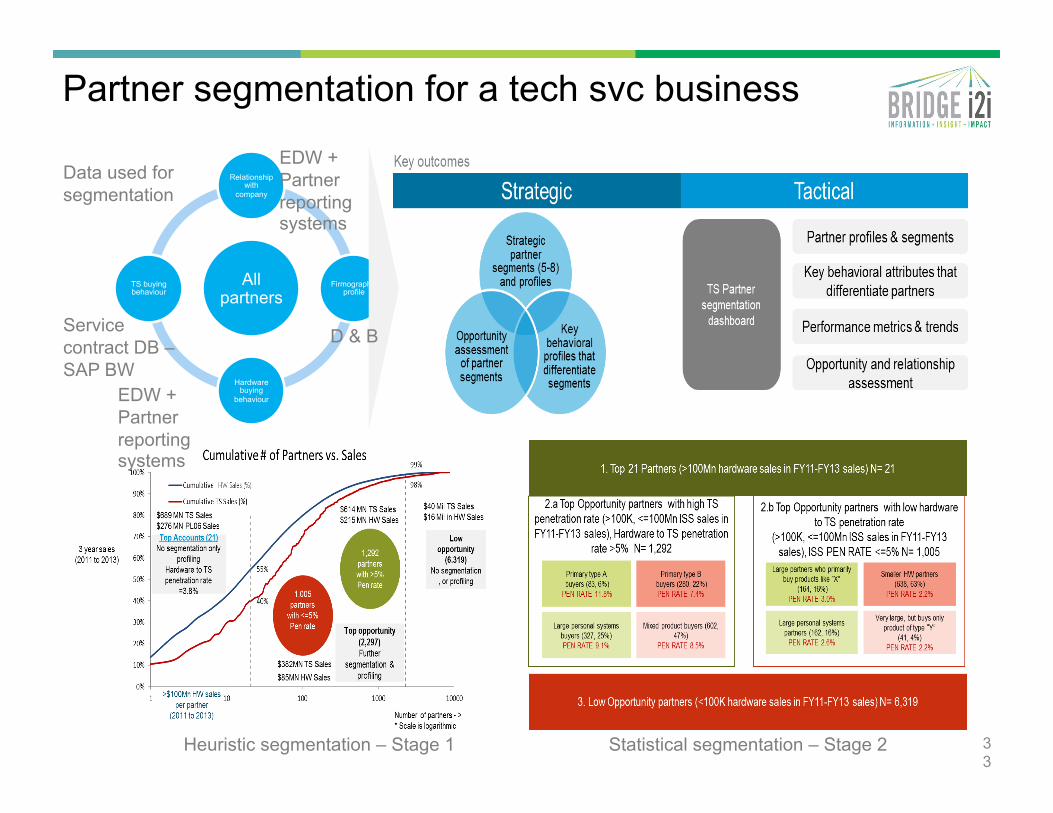
Partner segmentation for a tech svc business
33
All partners
Relationship with
company
Firmographic profile
Hardware buying
behaviour
TS buying behaviour
Data used for segmentation
Heuristic segmentation – Stage 1 Statistical segmentation – Stage 2
EDW + Partner reporting systems
EDW + Partner reporting systems
Service contract DB – SAP BW
D & B
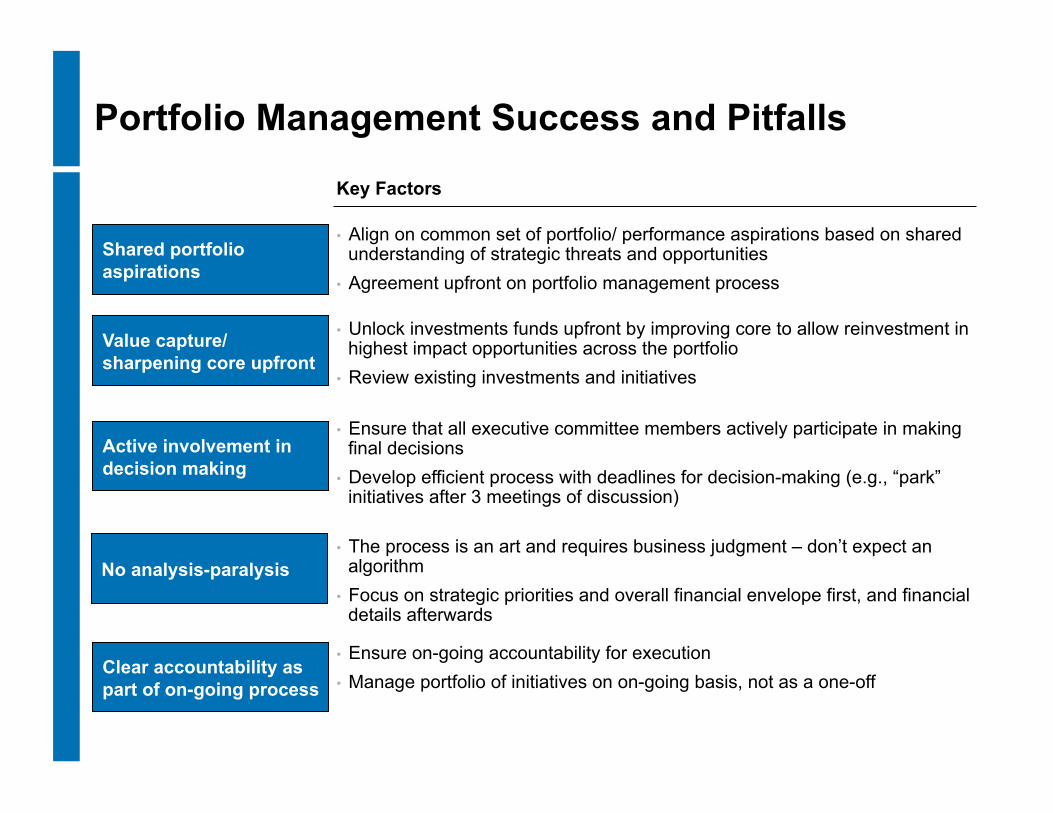
Portfolio Management Success and Pitfalls
• Align on common set of portfolio/ performance aspirations based on shared understanding of strategic threats and opportunities
• Agreement upfront on portfolio management process
Active involvement in decision making
Shared portfolio aspirations
Key Factors
• Ensure that all executive committee members actively participate in making final decisions
• Develop efficient process with deadlines for decision-making (e.g., “park” initiatives after 3 meetings of discussion)
Value capture/ sharpening core upfront
• Unlock investments funds upfront by improving core to allow reinvestment in highest impact opportunities across the portfolio
• Review existing investments and initiatives
• The process is an art and requires business judgment – don’t expect an algorithm
• Focus on strategic priorities and overall financial envelope first, and financial details afterwards
• Ensure on-going accountability for execution • Manage portfolio of initiatives on on-going basis, not as a one-off
Clear accountability as part of on-going process
No analysis-paralysis
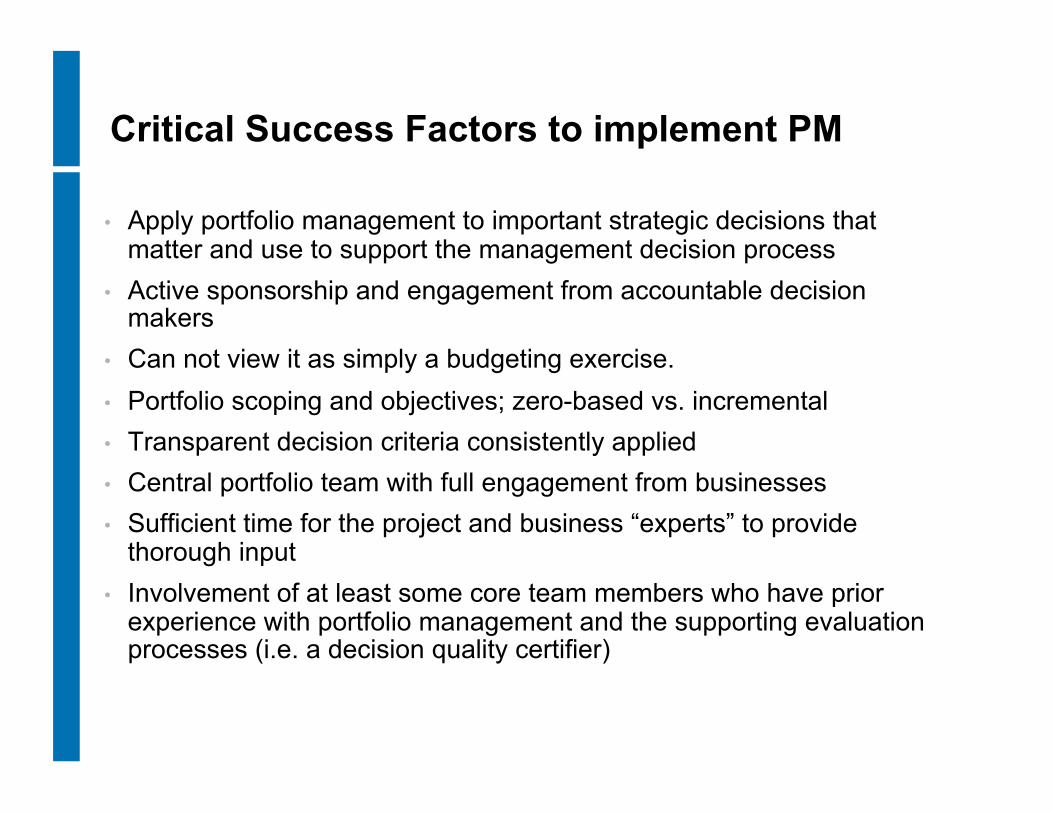
Critical Success Factors to implement PM
• Apply portfolio management to important strategic decisions that matter and use to support the management decision process
• Active sponsorship and engagement from accountable decision makers
• Can not view it as simply a budgeting exercise. • Portfolio scoping and objectives; zero-based vs. incremental • Transparent decision criteria consistently applied • Central portfolio team with full engagement from businesses • Sufficient time for the project and business “experts” to provide
thorough input • Involvement of at least some core team members who have prior
experience with portfolio management and the supporting evaluation processes (i.e. a decision quality certifier)
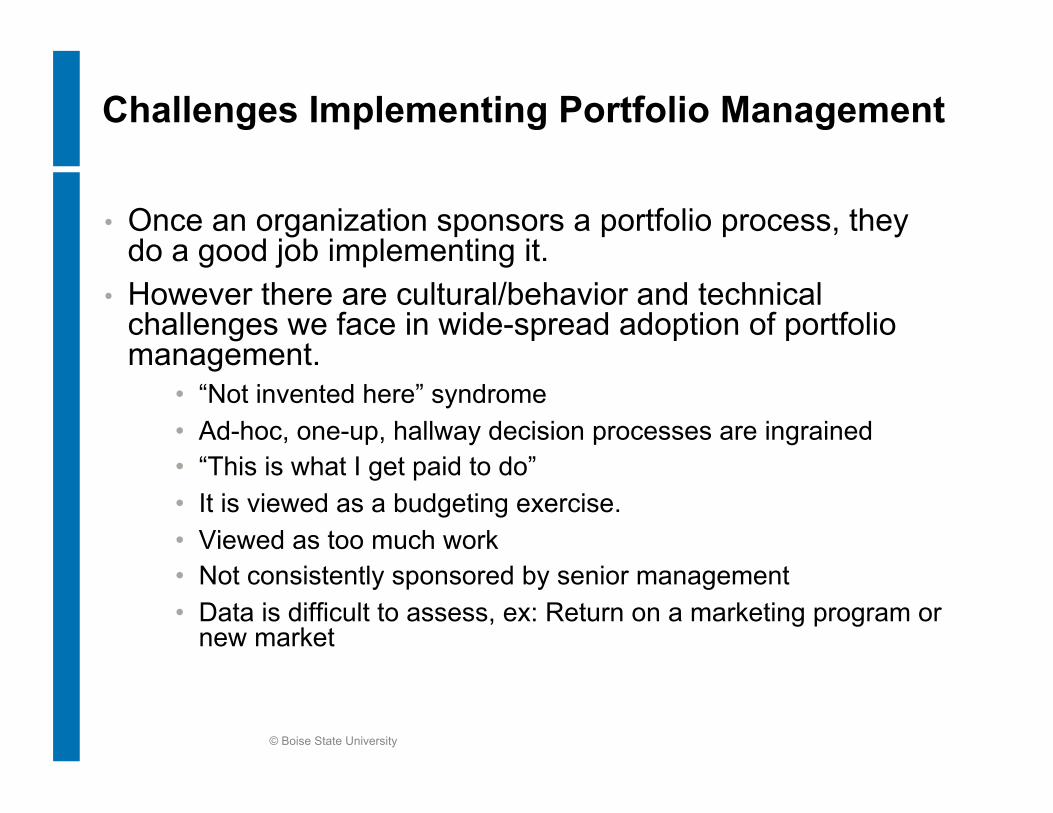
Challenges Implementing Portfolio Management
• Once an organization sponsors a portfolio process, they do a good job implementing it.
• However there are cultural/behavior and technical challenges we face in wide-spread adoption of portfolio management.
• “Not invented here” syndrome • Ad-hoc, one-up, hallway decision processes are ingrained • “This is what I get paid to do” • It is viewed as a budgeting exercise. • Viewed as too much work • Not consistently sponsored by senior management • Data is difficult to assess, ex: Return on a marketing program or
new market
© Boise State University
Considerations in portfolio management decisions
• Do you understand where, when and how profit is generated in the market you are considering entering?
• Do you have a realistic view of the competitive intensity? • Can you build the organizational capability needed to
succeed? • Good portfolio planning requires objectivity, ability to
treat data clinically? • Look past the best “sales pitch” and focus on the
comparative data.
© Boise State University
• In portfolio of core, emerging and new. Emerging is most challenging.
• Understand the biases in your organization and in the process.
• Get leaders involved who are willing to “tell it like it is”. • You are far from done, when the decisions are made.
Alignment and Execution are the most challenging. • Make sure the budgeting process is clear and agreed to
upfront.
Considerations in portfolio management decisions
© Boise State University
Politics in Portfolio Management? • “Where you sit, influences where you stand”. • Bosses’ pet projects or pet people • Back room and side deals being made • Powerful organizations wielding a big stick (usually “core”
businesses) • Fiddling with the denominators • Justification for the answer that is already known • Good portfolio management shouldn’t be about “win-win”.
There are winners and losers. • But, when there are winners and losers, it can throw some
folks in to backup mode • Getting to an answer is hard – implementing the changes
is harder © Boise State University
Some thoughts on implementing the changes
• Burning platform can act as spark to get change started, but need a “compelling destination” to sustain it.
• Give some thought to who has the most to lose from the change and then build plans to address.
• Think about how all of the “influence systems” in your business affect behavior.
• Find your informal leaders at every level and make them “insiders”. A part of the program.
• Set up performance based rewards. Hold people accountable and have high expectations – people rise to them.
© Boise State University
Some thoughts on implementing the changes
• Communicate. Look for ways to facilitate 2 way dialog and understanding. When you find resistance, ask “what”, not “why” questions.
• Don’t try to put lipstick on a pig – bad news, is bad news -- don’t risk eroding trust.
• Make sure you have measurable goals and break the work in to doable chunks -- both in terms of time (Quick wins are critical) and scope (try to keep ambiguity at senior mgr level).
• Remember, the stronger your business success has been, the harder it is going to be to change.
© Boise State University
42
Discussion—Portfolio management
• What have you learned that you can put to work immediately yourself?
• What have you learned that you can use at work, in this program?
• What have you learned that you would like to use but feel you need more help, support, permission, etc.?
• What obstacles or barriers do you anticipate in doing things to improve the way we make decisions and develop strategies? What could be done to reduce or eliminate these barriers?
43
References
Portfolio Management for New Products, Robert G. Cooper, Scott J. Edgett and Elko J Kleinschmidt, Perseus Books, 1998. The classic survey of methods for NPD portfolio management
“How SmithKline Beecham Makes Better Resource-Allocation Decisions”, Paul Sharpe and Tom Keelin, Harvard Business Review, March-April 1998, Reprint 98210
The Smart Organization, David Matheson & Jim Matheson, Harvard Business School Press, 1998. Chapters 10 discusses R&D portfolio strategy.
Business Portfolio Management, Michael Allen, John Wiley & Sons, New York et al., 2000 One of very few books devoted to business portfolio management
Related Documents