United States Solid Waste and EPA530-N-99-003 Environmental Protection Emergency Response July 1999 Agency (5306W) www.epa.gov/wastewise 1EPA WasteWise Update INSIDE Measurement Approaches . . . . 3 Data Collection. . 6 Calculating Benefits. . . . . . 12 THE MEASURE OF THE MEASURE OF SUCCESS—CALCULA SUCCESS—CALCULA TING TING W W ASTE REDUCTION ASTE REDUCTION 2 Printed on paper that contains at least 30 percent postconsumer fiber.

Welcome message from author
This document is posted to help you gain knowledge. Please leave a comment to let me know what you think about it! Share it to your friends and learn new things together.
Transcript

United States Solid Waste and EPA530-N-99-003 Environmental Protection Emergency Response July 1999Agency (5306W) www.epa.gov/wastewise
1EPA WasteWise Update
INSIDE
MeasurementApproaches . . . . 3
Data Collection. . 6
CalculatingBenefits. . . . . . 12
THE MEASURE OF THE MEASURE OF SUCCESS—CALCULASUCCESS—CALCULATINGTINGWWASTE REDUCTIONASTE REDUCTION
2 Printed on paper that contains at least 30 percent postconsumer fiber.
WWUp11-Mockup.qxd 6/9/99 10:46 AM Page 3

WasteWise Update 2
Why Measure?Measurement is critical to every component of a waste
reduction program—including waste prevention (preventingwaste before it is generated, also known as source reduction),recycling collection, and buying or manufacturing productswith recycled content. WasteWise partners report the follow-ing six main benefits of measurement:
• Justifies waste reduction programs to management.Measurement is an essential factor in perpetuating mostpartners’ waste reduction programs. “By tracking theresults of our waste reduction efforts, we are able to justifythe continuation of our program and maintain uppermanagement’s support,” explains Maureen Burke of BellAtlantic, a 1998 WasteWise Partner of the Year.
• Provides positive publicity opportunities. Public recogni-tion of an organization’s environmental stewardship is aconsiderable marketing asset. Just ask the eight organiza-tions recognized as WasteWise Partners of the Year in1998 (see page 3). But this type of positive publicity fromWasteWise or other programs is only possible when part-ners take the time to monitor and report their wastereduction successes.
• Reveals the economic value of waste reduction. By demon-strating economic benefits, measurement helps justify yourorganization’s continued involvement in environmentalactivities. Effective measurement reveals, for example, whichwaste reduction activities are most efficient and which savethe most money—vital information for your organization’sfuture allocation of resources. George Thomas of EastmanKodak Company, a 1998 WasteWise Program Champion,agrees, “Waste reduction measurement, including cost sav-ings results, is critical for obtaining top management sup-port for our efforts.” Management often finds clear,indisputable cost savings data to be the most persuasive.
• Uncovers opportunities for process efficiency. Measurementcan bolster the overall productivity of your organization.Careful measurement, for example, can reveal that your orga-nization is wasting money on materials that simply get thrownaway, such as unnecessary forms and paperwork.
• Motivates employees. Measurement also can be a valuabletool in motivating employees to participate in waste reduc-tion programs. Evidence that individual workers’ wastereduction efforts have made a real difference can be thekey to maintaining the energy and dedication to sustainsuccessful environmental programs.
• Fulfills a WasteWise partner responsibility. Yes,WasteWise is a voluntary program, but it also carries withit a few important responsibilities—in particular, theresponsibility to measure waste reduction results.Measuring results allows you to compare your organiza-tion’s efforts to others and contribute to the aggregatewaste reduction results published annually by WasteWise.
It Doesn’t Have to Be HardTo some companies, measurement might seem like a com-
plex, labor-intensive task. But, as WasteWise partners acrossthe nation have repeatedly shown, the most effective mea-surement systems often are simple and user-friendly. ThisUpdate provides step-by-step instructions on how to establishor improve your measurement system and explains a varietyof options requiring different levels of effort and expense.The key steps are:
• Selecting a measurement approach that’s right for yourorganization.
• Maintaining a dynamic data collection system.
• Determining what your “ounce of prevention” is worth.
To help you along the way, this Update also includes a listof measurement publications, tools, and Web sites.
Calculating WasteReduction
You developed a waste reduction program for yourorganization—now can you prove, in tons and dol-lars, that those efforts are making a difference? Yourwaste reduction activities benefit the environment andyour bottom line, but, until you measure them, their
true impact will remain unknown.
WWUp11-Mockup.qxd 6/9/99 10:48 AM Page 4

3 WasteWise Update
What Is the Scope of the WasteReduction Program?
The first step is to determine what your organizationneeds to measure. Some data collection techniques work bet-ter than others for certain waste reduction approaches,depending on the materials, activities, or locations involved.If your organization chooses to measure electronic equipmentsold or donated for reuse, for instance, it will be easier toobtain data by examining sales records or donation receiptsthan by examining hauler records. As a WasteWise partner,you probably already set goals in the areas of waste preven-tion, recycling collection, and buying or manufacturingproducts with recycled content, so start by reviewing yourWasteWise goals to determine the following:
• Range of materials covered. The types of wastes youmeasure will directly impact your data collection process.To justify material-specific programs or goals, you needto collect data on a material-specific level. To measureoffice paper reduction, for example, records of how muchpaper your organization purchases will show particularlyuseful data.
• Types of activities captured. To justify waste reduction ingeneral, an aggregate result based on hauler records mightbe sufficient. To justify discrete waste reduction activities,such as getting suppliers to switch to reusable containers,you need to measure results on an activity-specific level. Asurvey of employees responsible for coordinating reuse ofcontainers with the supplier, for example, might help toestimate the number of reusable containers used in a given
time period. These estimates would help demonstrate theamount of transport packaging conserved and could betranslated into cost savings as well.
• Operational areas included. Consider the type and size ofyour organization’s operations and whether you includeone or more facilities in your waste reduction operations.Are your waste removal and purchasing operations cen-tralized for all facilities, for example, or would you needto coordinate with several facility managers to obtain thedata you need?
The larger the facility and the more complex the wastestream, the more data you might need to collect and themore complicated the ultimate analysis might be. If yourorganization has several facilities, you might designate a teamof employees (e.g., one at each facility) to collect the datathat will ultimately be combined into one report.
What Data Sources AreAvailable?
After determining the scope and possible resource constraintsfor your measurement project, you can now evaluate the sourcesavailable to find the data you need. Options include:
• Examining hauler, purchasing, or sales records.
• Conducting a facility walk-through.
• Surveying your employees to find out how much waste isbeing generated and reduced.
• Conducting a waste sort.
Table 1 (page 4) provides an overview of the variousoptions for collecting waste generation data and compares thestrengths and limitations of each. If your organization doesnot have much experience in waste reduction and measure-ment activities or if you have resource constraints at this time,you might consider beginning with just one of theseapproaches. Later, you can expand the scope of your projectand use a combination of approaches as necessary.
For more detailed information, see the following section,Maintaining a Dynamic Data Collection System.
1998 Partners of the Year: BankAmerica Corporation
Bell Atlantic Target Stores
Public Service Electric & Gas CompanySchlegel Systems, Inc. Southern Mills, Inc.
Applied Specialties, Inc. Sligo Adventist School
Selecting the Right ApproachNow that you know why you should measure your organization’s waste reduction efforts, where do you begin?Answering the key questions below will help you draft a measurement plan that works for your organization.
WWUp11-Mockup.qxd 6/9/99 10:49 AM Page 5

WasteWise Update 4
Hauler Records Waste and recycling haulers can pro-vide your organization with regular(e.g., biweekly or monthly) records ofthe tonnage of waste recyclables gen-erated and collected.
• Information can be required as partof a hauler’s contract if you request it.
• Can provide recyclables tonnage ona commodity-specific basis if yourequest it in your contract.
• Might provide total weight or vol-ume of waste generated at a facility.
Data Source Strengths
TABLE 1: Where Can I Find the Data?Limitations
• Detailed records might not exist if youdon’t ask for them in your contract.
• Might not provide component-specific information if materials arecombined before being discarded orcollected for recycling.
• Can be difficult to use if you sharedumpsters with others or if haulerpicks up from multiple sites.
Purchasing RecordsAn internal examination of your pur-chasing records can reveal how muchmoney was spent on different productsfrom one year to the next, as well asquantities purchased. Organizationsalso can ask their suppliers for invoic-es, which contain the same kind ofinformation.
• Can provide data for estimates ofwaste generation of specific materials.
• Tracks potential wastes from thepoint of origin.
• Can track low-volume or seasonalwaste materials.
• Helps identify the most expensivecomponents of an organization’swaste.
• Can identify and track recycled-content or source-reduced purchases.
• Might provide incomplete picture ofwaste generation if all materialsare not tracked from the point ofpurchase.
• Can be difficult to track if you havedecentralized purchasing.
• Tracks quantity purchased, not vol-ume or weight.
• Might be difficult to correlate pur-chase date with use or discard dateif materials are stored for longperiods of time.
Sales Records Sales records can provide informationon revenue from resale of surplusequipment or materials.
• Documents the financial benefits ofreuse including total revenues and(potentially) avoided disposal costs.
• Only valid for those items that arereusable.
• Typically does not provide data onweight or volume of items resold.
Employee SurveysPeriodic surveys of employees that dealdirectly with waste generation, dispos-al, and recycling of a particular prod-uct can yield specific data on wastegeneration and reduction.
• Can monitor the effectiveness ofemployee education programs andindicate behavior changes.
• Can provide information about spe-cific waste components.
• Can be a burden depending onscope and frequency of survey.
• Most likely relies on estimatesrather than exact measurements.
Facility Walk-ThroughA facility walk-through involves touringan entire facility or a portion thereof(e.g., the administrative office but notthe manufacturing plant) to observethe activities of different departmentsand talk with employees about waste-producing activities and equipment.
• Allows first-hand examination offacility operations and raises aware-ness of all involved.
• Can provide qualitative informationabout major waste components andwaste-generating processes.
• Allows interviews with personnel,which can reveal waste prevention,recycling, and purchasing opportu-nities.
• Might not identify all wastes generated.
• Might not be representative if onlyconducted once.
• Relies on estimates of waste gener-ation.
Waste Sort
A waste sort involves the physical col-lection, sorting, and weighing of anorganization’s waste. The goal of thesort is to identify each waste compo-nent and calculate its percentage ofthe overall waste stream.
• Provides the most accurate wastegeneration data for an entire facilityor functional area, depending onscope.
• Might require multiple staff andsignificant workspace.
• Might not be representative or sta-tistically valid if only conductedonce or on a small sample.
• Does not provide qualitative infor-mation on how or why wastes aregenerated.
* See Table 2 on page 8 for information on how to collect data for specific activities and materials.
RRRReeee
ssss oooouuuu
rrrr cccceeee
IIIInnnn
tttt eeeennnn
ssss iiiitttt yyyy
HHHHiiii gggg
hhhhLLLLoooo
wwww
WWUp11-Mockup.qxd 6/9/99 10:49 AM Page 6

How Can You MaximizeYour MeasurementInvestment?
Keep in mind that for WasteWisereporting purposes, material-specificestimates based on best professionaljudgment are all you need. Butfor the many reasons discussedat the beginning of this Update,you might want to conduct moredetailed measurement activities,which usually require higher resourceinvestments. Conducting a wastesort, for example, oftenrequires more time andresources than workingwith hauler or purchasingrecords. Making the decisions discussed in the previoussection—how your organization will use its waste reduc-tion data and what approaches and sources to use—willhelp you target your measurement resources.
A good way to maximize time and resources is to estab-lish a waste reduction team to coordinate measurementefforts among appropriate departments. Teamwork cangenerate useful input and perspectives throughout anorganization. An employee in purchasing, for example,will be more familiar with how much of a given item theorganization purchases, while an employee in field opera-tions will know more about how that item is used and dis-carded. Another way to streamline your measurementresponsibilities is to piggyback the project on existingtraining, reporting, invoicing, or auditing activities.
Also, consider the following ideas to help you maximizeavailable resources as you begin to collect data:
Conduct a Pilot Test
Initially, your organization might opt to implement itswaste reduction activities on a small scale, and measureresults to reveal how effective these activities are. If yourorganization already has an established waste reductionprogram, you might consider pilot testing measurementapproaches first with a specific facility, material, or activi-ty to determine the feasibility of each approach.
Use Established Estimates
It is sometimes helpful to use default weights when cal-culating pounds of waste prevented. In determining theamount of waste prevented through an office paper reduc-tion program, for example, you might only know the totalnumber of paper purchases (e.g., reams) avoided. Knowing
that one ream (500 sheets) of 8-1/2 by 11-inch copierpaper is equivalent to approximately 5 pounds can help
you calculate the total tonnage of waste prevented.Refer to page 11 for information on default prod-uct weights and estimated number of reuses forproducts used in typical business operations. Forselected volume-to-weight conversion factors,visit <www.epa.gov/epaoswer/non-hw/recycle/recmeas/conversn.htm>. In addition, thewaste characterization database developed byWasteWise partner California Integrated WasteManagement Board (CIWMB) provides typical
waste profiles and compositions for differentindustries. The database is available throughCIWMB’s Web site at <www.ciwmb.ca.gov/WasteChar/bizdata.htm>.
Enlist Support
University students can help collect data and design ameasurement strategy for a minimal cost. Organizationswith more resources available also might consider usingconsultants with experience in measurement who can helptailor a program to fit a particular organization.
5 WasteWise Update
Bell Atlantic Makes theWaste Reduction Connection Bell Atlantic established a waste reduction team com-prised of employees from seven different departments.This team helped Bell Atlantic measure the waste iteliminated in 1997—more than 2.9 millionpounds—and the dollars it saved—more than $6million. In working to achieve its waste reduction goalsand measure the results, the team consolidates andsynthesizes a variety of data “inputs” from throughoutthe organization, ranging from waste prevention andrecycling data to legislative trends and market informa-tion. The team evaluates and addresses these inputs tohelp produce and organize a series of “outputs,”including internal and external reports and updatedwaste reduction guidelines.
WWUp11-Mockup.qxd 6/9/99 10:51 AM Page 7
Maintaining a DynamicData Collection System
Once you determine the scope of your waste reductionmeasurement effort and consider the merits ofvarious measurement approaches, it’s time tocollect your data. While the details of mea-surement processes will vary from program
to program, the basic steps are the same.
Step One:Establish theBaseline
A baseline, or set of data representing the conditions fromwhich you start, serves a number of purposes. First, it providesa frame of reference for your waste reduction program. To mea-sure waste prevention progress, for example, you need to knowhow much waste your organization was generating before youimplemented your prevention program. Establishing this base-line and periodically collecting waste generation data are thecore activities of waste prevention measurement.
Developing a baseline also helps your organization estab-lish a consistent data collection procedure. Before starting awaste reduction program, take the time to answer the plan-ning questions described on pages 3 through 5 and make thekey measurement decisions discussed there. You don’t have toget it absolutely right the first time. The trial and error ofsetting a baseline is an opportunity to explore which datacollection approach works best. Once you decide on a mea-surement approach, however, you should stick with it. Makesure you’re satisfied with the data collection method and becertain your data sources are likely to remain available. Anorganization that establishes a waste generation baselineusing purchasing records, but later switches to hauler records,for example, probably would find the data from the twosources difficult to compare.
Finally, baseline setting provides an opportunity toinventory current waste prevention activities. Your baselineshould take these activities into account so your previousaccomplishments are recorded when you measure yourprogress. This inventory of current prevention practices canhelp define the scope of the waste prevention program. Youmight realize, for example, that the prevention practicesoccurring in one area might work in others—a shipping
department’s successfulpallet return program with a rou-tine customer might inspire the purchasingdepartment to include a pallet return provision into othersupplier contracts.
Step Two:ContinueDataCollection
Waste reduction is a dynamic process. Once your wasteprevention program is underway, you’ll need to continue col-lecting data to evaluate the program’s effectiveness. Evaluatethe program periodically to accomplish the following:
• Track program successes and build upon them.
• Identify areas needing improvement.
• Determine the effect of any changes to the program, suchas new waste prevention activities.
• Develop new ideas for waste reduction.
• Keep employees informed and motivated.
• Document compliance with state and local regulations.
Collect a second set of data after the program has been inplace long enough to affect your organization’s waste genera-tion rate, usually 6 months to 1 year. Since you have alreadydeveloped a data collection process to determine your base-line, subsequent data collection should be much easier. It alsomight be worthwhile to conduct additional waste assessmentsperiodically to determine further changes in the compositionof your organization’s waste. Trends in waste generation
• Establish a baseline
WasteWise Update 6
• Collect data on a routine basis
• Make allowances forvariables
• Calculate wastereduction results
WWUp11-Mockup.qxd 6/9/99 10:57 AM Page 8
7 WasteWise Update
might indicate changes should be made to your waste pre-vention program. If new incoming supplies are creating largeamounts of excess polystyrene, for example, a companymight consider working with the supplier to develop alterna-tive or reusable packaging options. As you add new materialsto your waste prevention program, make sure to develop anddocument appropriate baseline waste generation rates forthose materials as well.
Data Collection for Specific Materials and Activities
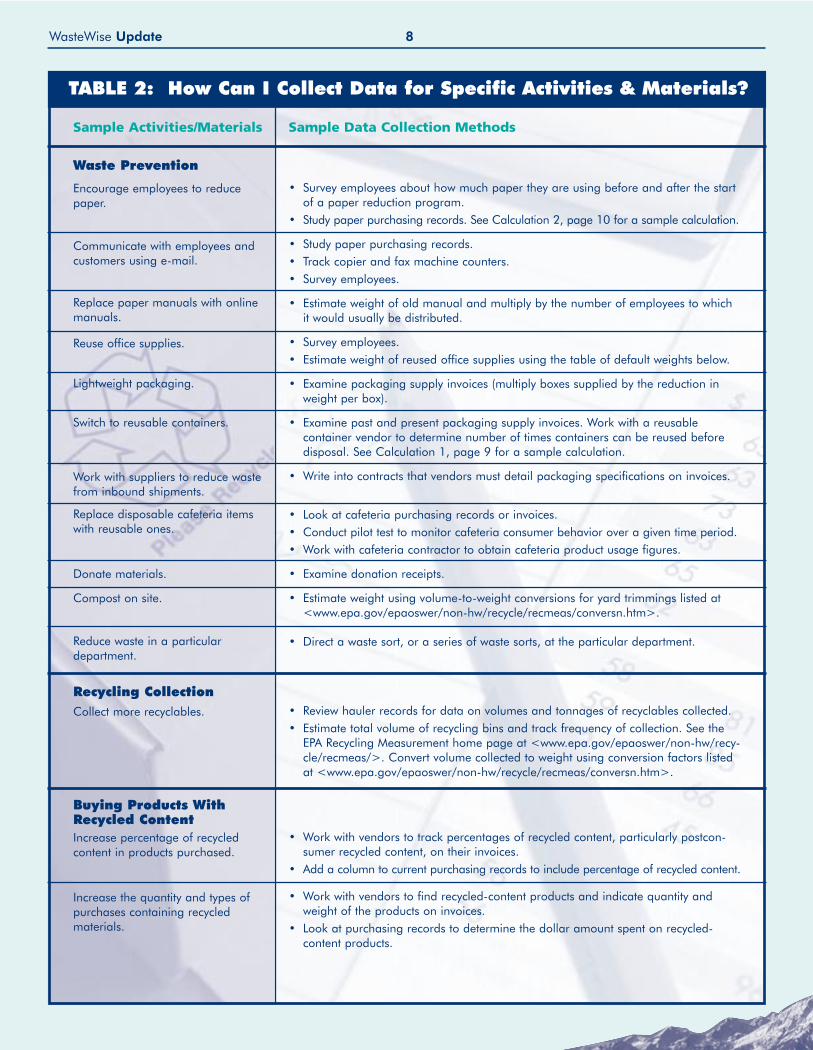
Certain data collection methods, such as examining haulerrecords, can be a good indicator of overall waste reduction.But what if your organization wants waste prevention orrecycling data for specific materials or activities? Or what ifyou need data on the quantity or types of products pur-chased with recycled content or information on the percent-age of postconsumer recycled content in those products?Some data collection techniques are better than others forcertain goals, materials, and activities. Table 2 (page 8) pro-vides a few examples.
Step Three:CalculateResults
Before preparing your waste prevention results, consider thelevel of detail your organization needs to evaluate the effectivenessof its waste prevention program. Some organizations might notneed extremely detailed results. Depending on the level of accura-cy you require, how you collect data, and how much time youwant to spend on waste prevention measurement, calculations canrange from simple estimates to more complex equations.
Once you determine the level of detail required, yourorganization is ready to calculate its waste prevention resultsby comparing the baseline to subsequent waste generationdata. When measuring the amount of waste prevented, selectthe time period (e.g., weeks or months) easiest for you tomeasure. Multiply these figures by the appropriate annualmultiplier to come up with an estimate of the amount ofwaste reduced per year. Annual waste prevented should alsobe converted to either weight or volume figures. If you arecharged for waste removal based on weight, you can convertthe amount of waste reduced to a standard measure (i.e.,tons). If you are charged for waste removal by volume or perpull, you can convert this amount to cubic yards.
The sample calculations on pages 9 and 10 will help youdetermine results for two common waste prevention activi-ties: multiple-use packaging and paper reduction.
Baseline Setting atBaxter InternationalWhen WasteWise partner Baxter International, a globalmedical products manufacturer, decided to implement acomprehensive waste reduction program, it knew it wasgoing to have to cast a wide net to get the waste genera-tion data it needed. With more than 100 facilities, 45,000employees, and an extremely diverse waste stream, Baxterwanted a measure that would capture companywide wastegeneration without overburdening field staff, many ofwhom did not have experience conducting waste audits.
Baxter’s solution? To obtain the weight of each municipalsolid waste dumpster load from each facility, with coopera-tion from local waste haulers. The company planned tototal these weights at the end of each year to develop anannual nonhazardous waste generation figure at eachfacility, each division, and finally for the company as awhole. This corporate-level approach did not target anyspecific materials, it allowed the individual facilities to tai-lor their programs to the composition of their waste.
While this method of establishing a waste generationbaseline was fairly straightforward, the company did facesome challenges. Some Baxter facilities used contractwaste haulers that did not weigh individual dumpsterloads. For facilities using these haulers, Baxter developeda table of dumpster default weights that allowed the facili-ties to estimate the weight of different types of dumpsterloads: “full but loose,” “full and compacted,” “half fulland compacted,” and so on.
Using the hauler information and dumpster defaultweights, Baxter compiled its companywide waste genera-tion baseline in 1989, allowing the company to measureits progress toward its goal of reducing all nonhazardouswaste by 65 percent (per unit) over the next 7 years.According to Baxter’s director of environmental engineer-ing Ron Meissen, “To conduct a waste reduction programyou have to have a challenging but achievable goal.” Andthe best way to determine if you’re meeting those goals isto measure your progress toward them.
WWUp11-Mockup.qxd 6/9/99 11:03 AM Page 9
WasteWise Update 8
Waste Prevention
Encourage employees to reducepaper.
Communicate with employees andcustomers using e-mail.
Replace paper manuals with onlinemanuals.
Reuse office supplies.
Lightweight packaging.
Switch to reusable containers.
Work with suppliers to reduce wastefrom inbound shipments.
Replace disposable cafeteria itemswith reusable ones.
Donate materials.
Compost on site.
Reduce waste in a particulardepartment.
Recycling CollectionCollect more recyclables.
Buying Products WithRecycled ContentIncrease percentage of recycledcontent in products purchased.
Increase the quantity and types ofpurchases containing recycledmaterials.
• Survey employees about how much paper they are using before and after the startof a paper reduction program.
• Study paper purchasing records. See Calculation 2, page 10 for a sample calculation.
• Study paper purchasing records.• Track copier and fax machine counters.• Survey employees.
• Estimate weight of old manual and multiply by the number of employees to whichit would usually be distributed.
• Survey employees. • Estimate weight of reused office supplies using the table of default weights below.
• Examine packaging supply invoices (multiply boxes supplied by the reduction inweight per box).
• Examine past and present packaging supply invoices. Work with a reusable container vendor to determine number of times containers can be reused beforedisposal. See Calculation 1, page 9 for a sample calculation.
• Write into contracts that vendors must detail packaging specifications on invoices.
• Look at cafeteria purchasing records or invoices.• Conduct pilot test to monitor cafeteria consumer behavior over a given time period.• Work with cafeteria contractor to obtain cafeteria product usage figures.
• Examine donation receipts.
• Estimate weight using volume-to-weight conversions for yard trimmings listed at<www.epa.gov/epaoswer/non-hw/recycle/recmeas/conversn.htm>.
• Direct a waste sort, or a series of waste sorts, at the particular department.
• Review hauler records for data on volumes and tonnages of recyclables collected.• Estimate total volume of recycling bins and track frequency of collection. See the
EPA Recycling Measurement home page at <www.epa.gov/epaoswer/non-hw/recy-cle/recmeas/>. Convert volume collected to weight using conversion factors listedat <www.epa.gov/epaoswer/non-hw/recycle/recmeas/conversn.htm>.
• Work with vendors to track percentages of recycled content, particularly postcon-sumer recycled content, on their invoices.
• Add a column to current purchasing records to include percentage of recycled content.
• Work with vendors to find recycled-content products and indicate quantity andweight of the products on invoices.
• Look at purchasing records to determine the dollar amount spent on recycled-content products.
Sample Activities/Materials Sample Data Collection Methods
TABLE 2: How Can I Collect Data for Specific Activities & Materials?
WWUp11-Mockup.qxd 6/9/99 11:04 AM Page 10

9 WasteWise Update
Calculation 1: Single-Use Versus Multiple-Use Containers
This method calculates the amount ofpackaging materials conserved resultingfrom a switch from disposable (single-use)
to reusable (multiple-use) containers. Reusingcontainers can lead to significant cost savings and wastereduction. Corrugated containers generally can be used upto 12 times, while plastic containers might be reusable 250times. To estimate the weight of the single- and multiple-usecontainers, you can weigh them, obtain a figure from themanufacturer, or use the values presented in the table ofdefault weights on page 11.
To calculate the packaging reduced, obtain the followinginformation:
INPUTS:
Weightsingle = Weight of the disposable container previ-ously used.
Numbermulti = The number of reusable containers pur-chased by your company. This informa-tion should be available from yourpurchasing department.
Weightmulti = Weight of the multiple-use container.
Tripsannual = The number of trips expected to be madeannually. If your business needs have notchanged, this should equal the number ofsingle-use containers previously purchasedper year.
Discardedmulti = The number of multiple-use containersdiscarded each year, because reusable con-tainers will eventually need to be recycledor, if not recyclable, thrown away. To esti-mate this figure, divide the number oftrips made per year (Tripsannual) by theestimated number of trips each multiple-use container can make in its lifetime(Reusesmulti). (This information shouldbe available from the manufacturer or youcan use estimates in the table of defaultweights on page 11.)
OUTPUTS:
By focusing on annual figures, this equation assumes youwill dispose of an equal number of reusable containers eachyear. In reality, your organization might not dispose of anyof the reusable containers in the early years of implementa-tion. Instead, you might need to throw away or recycle allcontainers in the final years of their estimated lives. If youprefer, you can calculate the total waste reduction benefitover the entire lifespan of the product rather than annually.This calculation also assumes that the manufacturer’s esti-mated life projection is correct. If the container’s lifespan isshorter or longer than expected, the waste reduction benefitswill be decreased or increased, respectively.
Example
A business purchases 200 reusable plastic containersweighing 5.5 pounds each. It plans to use these containersto transport calculators an average of 1,000 times permonth, for a total of 12,000 trips annually. The estimatedlife of each container is 250 trips. The new containersreplace corrugated containers, weighing 1.5 pounds each,which were used one time and discarded.
Numbermulti = 200 containers
Reusesmulti = 250 trips/container
Weightsingle = 1.5 lb
Weightmulti = 5.5 lb
Tripsannual = 12,000 trips
Discardedmulti = 48 multiple-use containers per year
To calculate the waste reduced annually, the business firstestimated the number of reusable containers that it wouldhave to throw away each year:
(12,000 trips)/(250 trips/container) = 48 containers discarded or recycled per year
The firm used this information to calculate the annualreduction in packaging:
(12,000 trips × 1.5 lb) - (48 containers × 5.5 lb) = 18,000 lb - 264 lb = 17,736 lb
Annual reduction in packaging:
Reduction = (Tripsannual × Weightsingle) –(Discardedmulti × Weightmulti)
Discardedmulti = (Tripsannual) / (Reusesmulti)
WWUp11-Mockup.qxd 6/9/99 11:09 AM Page 11

Calculation 2: Reducing the Number of Pages Used
To measure a specific paper reductionactivity where document length is known orcan be easily estimated, you will need to
obtain or estimate the following information:
INPUTS:
Sheetsbefore = Sheets of paper that would have beenused before implementing the officepaper reduction activity.
Sheetsafter = Sheets of paper used after implement-ing the activity.
Frequency = Number of times per time period (e.g.,week or month) the document is distributed.
Distribution = Number of people to whom the docu-ment is distributed.
Weight = Weight of the paper. If you are unableto actually weigh the paper, you shouldbe able to estimate the weight using thetable of default weights on page 11.
Reduction Factor = Percentage of reduction from the activity:
(Sheetsbefore – Sheetsafter) / Sheetsbefore
OUTPUTS:
Example
A government (still in the process of updating its electronicnetwork to allow e-mail) encouraged its departments to begindouble-sided printing for its 25-page interdepartmental projectupdates. Each of the 10 departments distribute approximatelyone update per week to 200 people. By duplexing, they wereable to reduce the amount of paper used.
Sheetsbefore = 25 sheetsSheetsafter = 13 sheetsDistribution = 200 peopleFrequency = 10 times per week Weight = 1 sheet × (5 lb/500sheets) = 0.01 lbReduction Factor = (25 sheets - 13 sheets)/25 sheets = .48Weekly paper reduction = (25 sheets) × (10/wk) × (200 people)
× (0.01 lb/sheet) × (0.48) = 240 lbAnnual paper reduction = (240 lb/yr) × (52 wk/yr):
12,480 lb/yrTable 3 (on the right) provides default weights for a range
of packaging materials and office products.
WasteWise Update 10
Reduction = Sheetsbefore x Frequency xDistribution x Weight x Reduction Factor
Keeping Tabs on Paper Reduction at Janus FundsSurveys can be very effective measurement tools for widely used materials like office paper. Janus Funds, a financial services com-pany with approximately 1,000 employees, used an electronic survey to gauge the number and performance of paper reductionactivities companywide. A waste reduction team met with each department and asked for a commitment to three paper reductiongoals. After the departments began implementing some of their paper reduction ideas, the team circulated the following form via e-mail asking the departments to indicate the different ways they had reduced paper usage, noting that estimates were acceptable.
Sample Janus Capital Paper Reduction E-mail Survey Form
The questions about whether the department implemented the activity before or after the meeting helped the team determine whichactivities were a result of their efforts. The form also included a space to suggest ideas that other departments might find helpful.The form allowed the waste reduction team to measure paper reduction companywide without a substantial amount of effort.
Although this form was developed specifically for paper reduction, organizations can use a similar tool to measure reductions ofother widely used materials such as file folders and binders. Surveys also are useful for assessing the waste prevention activities of vendors and suppliers.
Item # of Pages Frequency Distribution New Method
2 1/wk YES 16 pgs./wk
2 on avg. 3.5/wk YES 700 pgs./wk
Started This Before the Team Meeting?
Result of theTeam Meeting?
EstimatedSavings
Goes to 1 personfrom 8 people
Weekly statusreport
Now we use e-mail
Inter-deptmemos
Goes to 200 people
Now we use double-sided
WWUp11-Mockup.qxd 6/9/99 11:12 AM Page 12

Step Four: MakeAllowances forVariables
Once you prepare your initial results, you need to analyzethat information more closely to develop an accurate pictureof waste prevention in your organization. After all, wasteprevention measurement often requires more than just sub-tracting the baseline waste generation from the organiza-tion’s current waste generation. There also are externalvariables that might affect the waste generation figures.These can include:
• Variations in the prices of supplies
• Changes in the size of the workforce
• Seasonal variations in production
• Changes in the type of materials used
These variables can have significant impacts on wastegeneration and, depending on how waste generation ismeasured, might cause an inaccurate estimate of the
effectiveness of waste prevention activities. One organiza-tion that measured waste generation by examining pur-chasing records, for example, discovered that itspurchasing agents bought paper based on paper prices,rather than on actual paper consumption. Basing wastegeneration data only on the amount purchased wouldhave yielded a less accurate estimate, because much of thepaper bought was not being used.
Another business noticed that its overall paper consump-tion actually increased during its waste prevention programdue to a significant increase in staff. This was not an indica-tion that waste prevention was not taking place. Rather, thefirm determined that its waste prevention program waseffective because the paper waste generation rate peremployee decreased as a result of the waste prevention activi-ties. To measure the paper waste prevented, therefore, thebusiness compared the amount of paper that would havebeen generated at the paper consumption rate before paperreduction activities were initiated with the amount of papergenerated per employee after the activities were implement-ed. The difference between those figures provided an esti-mate of the paper waste prevented.
11 WasteWise Update
Corrugated (single-wall) 14.25 × 12 × 9.25 2 0.5 4
Corrugated (one-way) N/A 2 1.5 2
Reusable Corrugated N/A 2 2.2 5
Corrugated (single-wall) 18 x 18 x 16 3 2.0 12
Reusable Plastic N/A 2 5.5 250
Source: D. Saphire. 1994. Delivering the Goods: Benefits of Reusable Shipping Containers; WestPack Conference. October 18, 1995.
White Ledger 8.5 × 11 500 sheets per 5 lbs 200,000 sheets per ton
Computer 9.5 × 11 1,650 sheets per 15 lbs 220,000 sheets per ton
Desk Double Pedestal Laminate 72 × 36 299.50
Desk Double Pedestal Metal 72 × 36 224.67
Bookcase 2 Shelves Wood 36 wide 57.20
Bookcase 5 Shelves Wood 36 wide 138.80
File Cabinet 4 Drawer, Vertical Metal Letter Size 107.60
Chair Swivel Arm N/A N/A 45.25
Personal Computer CPU N/A N/A 26.00
Computer Monitor N/A N/A N/A 30.00
Source: JC Penney’s, Office Depot, Sears N/A = Not available
Type of Container Dimension (in) Volume (ft3) Container Weight (lb) Number of Reuses
Type of Paper Dimension (in) Sheets Per Pound Sheets Per Ton
Item Type Material Size (in) Avg. Weight (lb)
CO
NTA
INER
PA
PER
OFF
ICE
FUR
NIT
UR
E
TABLE 3: Default Weights for Selected Materials and Products
WWUp11-Mockup.qxd 6/9/99 11:14 AM Page 13

For WasteWisePartners, BeingGreen MeansSaving Green
“Management listens when you can convey actions interms of profits,” says Terry Bedell of The Clorox Company,a 1998 WasteWise Program Champion. Demonstrating thefinancial impacts of your measurements can go a long waytoward garnering management support for your organiza-tion’s waste reduction program. The financial benefits ofwaste reduction include the following areas: Operational Efficiencies
An often overlooked benefit of certain waste reductionactivities is cost savings through more streamlined workpractices. A division of WasteWise partner State of Ohio’sDepartment of Administrative Services, for example,replaced a time-consuming manual paper ordering requestsystem with an online system, recovering more than 470hours of human resources previously spent making copiesand an additional 520 hours previously spent filing, mailing,and locating orders in the request process. Similarly, by out-lining detailed specifications to suppliers for packagingreductions, Target Stores, 1998 WasteWise Partner of theYear, recovered $4.5 million that would have gone towardmanually unwrapping merchandise. To determine if wastereduction would streamline operations in your organization,it is helpful to survey employees on the time required forvarious activities. For more information on how TargetStores’ packaging reduction efforts helped streamline opera-tions, see Alameda County, California’s, report ProfitingFrom Source Reduction: Measuring the Hidden Benefits, listedon the Resources insert included with this issue, or theWasteWise Update: A Fresh Look at Packaging (available onthe WasteWise Web site at <www.epa.gov/wastewise>).
Avoided Waste Removal Costs
WasteWise partners also have saved millions of dollars byreducing the amount of solid waste that contractors haul tothe landfill. Waste removal costs vary depending on themethod haulers use to charge clients. Some haulers charge byweight or volume of material, while others might charge a flatfee or charge per pull. The Oak Hill Semiconductor ProductSector facility of WasteWise partner Motorola, Inc., reducedthe number of pulls—and their disposal costs by approxi-mately $60,000—after the company’s hauling vendorinstalled pressure gauges on its compactors to more accuratelydetermine when pickup was needed. WasteWise partner StateFarm Mutual Automobile Insurance Company generated lesswaste and reduced its disposal costs by almost 50 percent byencouraging its individual locations to establish 1-year pickup “as needed” contracts with local haulers to provide morefrequent opportunities for renegotiation of rates and terms.For more information on reducing disposal costs, see EPA’spublication Pick Up Savings: Adjusting Hauling Services WhileReducing Waste (EPA530-F-96-016), which also is available onthe WasteWise Web site at <www.epa.gov/wastewise>.Avoided Purchasing Costs
Many activities, such as reducing paper consumption orreusing office supplies and equipment, show up more inavoided purchasing costs than in avoided waste removalcosts. Implementing a double-sided copying policy, forexample, might allow your organization to purchase fewerreams of paper in a given time period. Profits From Reselling
Used materials might still have value; you can sell them toa recycler, but keep in mind that revenues will vary consider-ably depending on factors such as geographic location andmarket price fluctuations. You also might consider repairingand refurbishing certain products for reuse or for sale.
See page 14 for illustrations of several waste reductionactivities and how to calculate the associated cost savings.
WasteWise Update 12
Determining What an Ounce of Prevention Is Worth
An ounce of prevention might be worth hundreds of dollars, anacre of trees, a metric ton of greenhouse gas, or a cubic meterof landfill space, depending on how you calculate it. Beforeyou share the results of your waste reduction activities, consid-er how those pounds of waste reduced translate into cost sav-
ings, environmental benefits, and additional hidden profits.
WWUp11-Mockup.qxd 6/9/99 11:17 AM Page 14
Calculating EnvironmentalSavings
Waste reduction measurements also can tell you howmuch your organization has saved in another green area—the environment. Among the environmental benefits ofwaste reduction are reductions in greenhouse gas emissionsand in the consumption of natural resources and energy.Environmental impacts exist through all stages of a product’slife cycle, from the initial extraction of raw materials to theproduct’s disposal. Waste prevention and recycling can mini-mize these impacts, and your measurements can help youquantify the environmental savings. Use EPA’s WAste Reduction Model
To calculate how your waste reduction measurementsbenefit climate change, EPA has developed the WAsteReduction Model (WARM). WARM calculates greenhousegas (GHG) emissions reductions from various waste reduc-tion activities. Greenhouse gases, which contribute to globalclimate change, are emitted in nearly every stage of a prod-uct’s life cycle, even when the product is in a landfill. Theamount of GHG emitted depends on the waste manage-ment activity and the material type. Waste prevention, orreducing waste at the source, is the best option for reducingGHG emissions. Recycling is the next best choice for reduc-ing emissions; generally, it takes less energy to make newproducts from recycled, rather than virgin, materials.
To calculate the GHG emission reductions of waste reduc-tion activities, WARM uses “emissions factors,” which repre-sent the GHG impact—calculated over the full life cycle ofthe material—of handling 1 ton of a given material using aparticular waste management option (i.e., waste prevention,recycling, landfilling, combusting). The emissions factors arein terms of metric tons of carbon equivalent (MTCE), aninternationally recognized unit of measurement that accountsfor different warming potentials among various GHGs suchas methane and carbon dioxide. To put MTCE in perspec-tive, reducing emissions by 1 million MTCE is equivalent totaking 750,000 cars off the road for 1 year.
WARM is a useful tool for calculating emissions reductionsand provides an important step toward gauging the impacts ofwaste reduction programs on climate change. Here’s an exam-ple from a WasteWise partner. In 1997, The Procter andGamble Company prevented more than 22 million poundsof corrugated waste by lightweighting secondary and transportpackaging. According to WARM, the company reducedGHG emissions by more than 9,000 MTCE. To calculateGHG emission reductions from your organization’s wastereduction efforts, visit EPA’s Climate Change and Waste Website at <www.epa.gov/mswclimate>, where WARM is availablefor downloading in Microsoft Excel format.
You also can convert your organization’s waste reductionnumbers into measurements of other environmental benefitssuch as natural resource and energy consumption. Recyclingaluminum cans, for example, saves 95 percent of the energyrequired to make aluminum cans from virgin bauxite ore.1To put these numbers into perspective, recycling 125 canssaves almost the same amount of energy consumed by theaverage household in 1 day.2 WasteWise partner Anheuser-Busch Companies, a beverage manufacturer and aluminumrecycler, recycled 20 billion cans in 1997, saving enoughenergy to power approximately 160 million households for 1 day, or nearly 444,000 households for an entire year!
Accounting for the “Hidden”Benefits
A successful waste reduction program can yield additionalbenefits for your organization. The following benefits areless obvious and more difficult to measure than cost savingsand environmental benefits, but they also can impact yourbottom line—by increasing productivity and consumerproduct recognition.Employee Morale
Having employees suggest their own waste reductionideas can pay off in several ways. First, employees often arein the best position to suggest how resources could be used
13 WasteWise Update
Investing in Waste ReductionWhile tracking the financial aspects of waste reduc-tion, you might notice that certain waste reductionactivities add costs to one area of your organizationwhile reducing costs in another area. In someinstances, the initial costs might be greater than theinitial savings. Switching to reusable containers, forexample, might initially cost more than it would save.In the long run, however, the cost savings will accu-mulate. You should examine short- versus long-termcosts just as you would for any business investment.
WWUp11-Mockup.qxd 6/9/99 11:18 AM Page 15
WasteWise Update 14
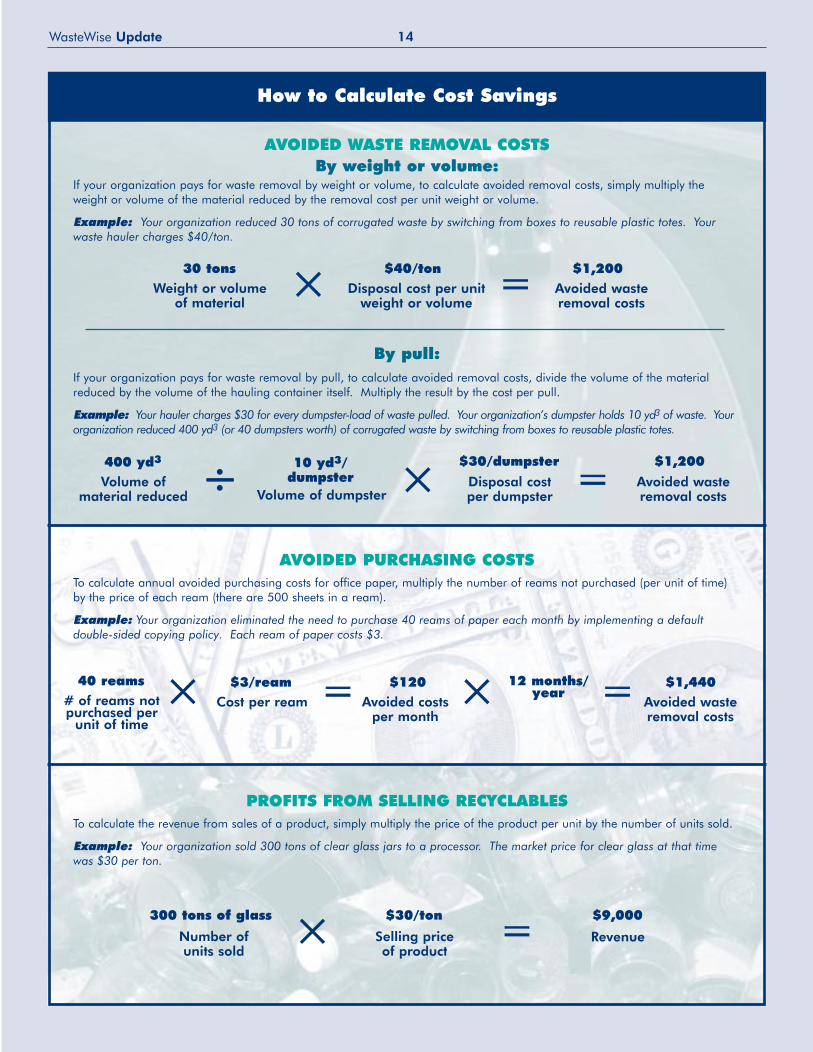
How to Calculate Cost Savings
AVOIDED WASTE REMOVAL COSTSBy weight or volume:
If your organization pays for waste removal by weight or volume, to calculate avoided removal costs, simply multiply theweight or volume of the material reduced by the removal cost per unit weight or volume.
Example: Your organization reduced 30 tons of corrugated waste by switching from boxes to reusable plastic totes. Yourwaste hauler charges $40/ton.
By pull: If your organization pays for waste removal by pull, to calculate avoided removal costs, divide the volume of the materialreduced by the volume of the hauling container itself. Multiply the result by the cost per pull.
Example: Your hauler charges $30 for every dumpster-load of waste pulled. Your organization’s dumpster holds 10 yd3 of waste. Yourorganization reduced 400 yd3 (or 40 dumpsters worth) of corrugated waste by switching from boxes to reusable plastic totes.
AVOIDED PURCHASING COSTSTo calculate annual avoided purchasing costs for office paper, multiply the number of reams not purchased (per unit of time)by the price of each ream (there are 500 sheets in a ream).
Example: Your organization eliminated the need to purchase 40 reams of paper each month by implementing a default double-sided copying policy. Each ream of paper costs $3.
PROFITS FROM SELLING RECYCLABLESTo calculate the revenue from sales of a product, simply multiply the price of the product per unit by the number of units sold.
Example: Your organization sold 300 tons of clear glass jars to a processor. The market price for clear glass at that timewas $30 per ton.
30 tons $40/tonDisposal cost per unit
weight or volumeAvoided waste removal costs
!! ""Weight or volume of material
400 yd3 10 yd3/dumpster
$1,200
Volume of dumpsterAvoided waste removal costs## ""Volume of
material reduced
$30/dumpsterDisposal cost per dumpster!!
40 reams $3/ream $1,440Cost per ream Avoided waste
removal costs!!# of reams not
purchased per unit of time
$120Avoided costs
per month"" 12 months/
year!! ""
300 tons of glass $30/ton $9,000
Number of units sold
Revenue!! ""Selling price of product
$1,200
WWUp11-Mockup.qxd 6/21/99 12:45 PM Page 16
more efficiently, because they are the most knowledgeableabout your operating processes. Second, rewarding them fortheir suggestions by sharing the resulting cost savings andenvironmental benefits with them can help improve employ-ee morale and motivation. Increased motivation, in turn,can improve productivity. Public Image
Waste reduction programs and activities, if well publi-cized, can have a positive impact on an organization’s publicrelations. Having such programs can show the public thatyour organization has a vested interest in the community inwhich it is based and in society at large. For governments,such programs can demonstrate that they “practice whatthey preach.” Meanwhile, corporate environmental con-sciousness is becoming a vital part of success in today’s busi-ness world. Consumers and shareholders are increasinglyinterested in the environmental impact and practices of thecompanies with which they deal. In fact, a survey by WalkerResearch, a marketing analysis company, found that 78 per-cent of the nation’s customers avoid businesses that have anirresponsible corporate environmental attitude.3 An articlein the quarterly journal of the management consulting firmMcKinsey and Company also suggests that the public takesenvironmental benefits into consideration in products andservices. Issues “such as environmental friendliness are prov-ing to be the tie-breaker for otherwise almost indistinguish-able products and services.”4
To communicate environmental accomplishments to thepublic, you should consistently provide objective, simpledata on the effectiveness of your environmental activities. Inthis manner, WasteWise partners are proving and publicizingtheir “greenness.” Jim Bosch, with Target Stores, 1998WasteWise Partner of the Year, notes, “As an engineer, I haveto come up with a lot of measurements [in waste preventionand waste reduction]. Measuring allows us to establishbenchmarks, which in turn, also help us present data to ourcustomers and shareholders.” Waste reduction numbers thatcan be easily understood by employees and outsiders arevaluable displays of an environmentally positive organiza-tional philosophy.
1 Aluminum Association, Inc.: <www.aluminum.org/default2.cfm/4/34>.
2 Average household energy consumption (71,500 kcal of ener-gy per day) based on data from Household EnergyConsumption and Expenditures 1993, U.S. Department ofEnergy, 1995.
Aluminum can recycling figures (manufacturing one aluminumcan requires approximately 600 kcal using virgin bauxite orebut only 30 kcal using recycled cans) based on estimates fromLife-Cycle Inventory Report, The Aluminum Association, 1998,and correspondence with Alcan Aluminum Corporation, 1999.
3 Metcalf, K.R, P.L. Willams, R.J. Minter, and C.M. Hobson. 1995.“An Assessment of Corporate Environmental Programs andTheir Performance Measurement Systems.” Journal ofEnvironmental Health 58:9,9.
4 Christensen, Paul D. 1995. “The Environment: It’s Not Time toRelax.” The McKinsey Quarterly No. 4,147.
5 Aluminum recycling conversion factor based on estimates fromHousehold Energy Consumption and Expenditures 1993, U.S.Department of Energy, 1995; Life-Cycle Inventory Report, TheAluminum Association, 1998, and correspondence with AlcanAluminum Corporation, 1999. Glass recycling conversion fac-tors from Recycling and Buy Recycled Fact Sheets, AmericaRecycles Day 1998. Steel recycling conversion factors fromSchool and College Magazine, June 1993.
Note: Additional environmental factoids can be found at <envirosystemsinc.com/factoidsnew.html>.
15 WasteWise Update
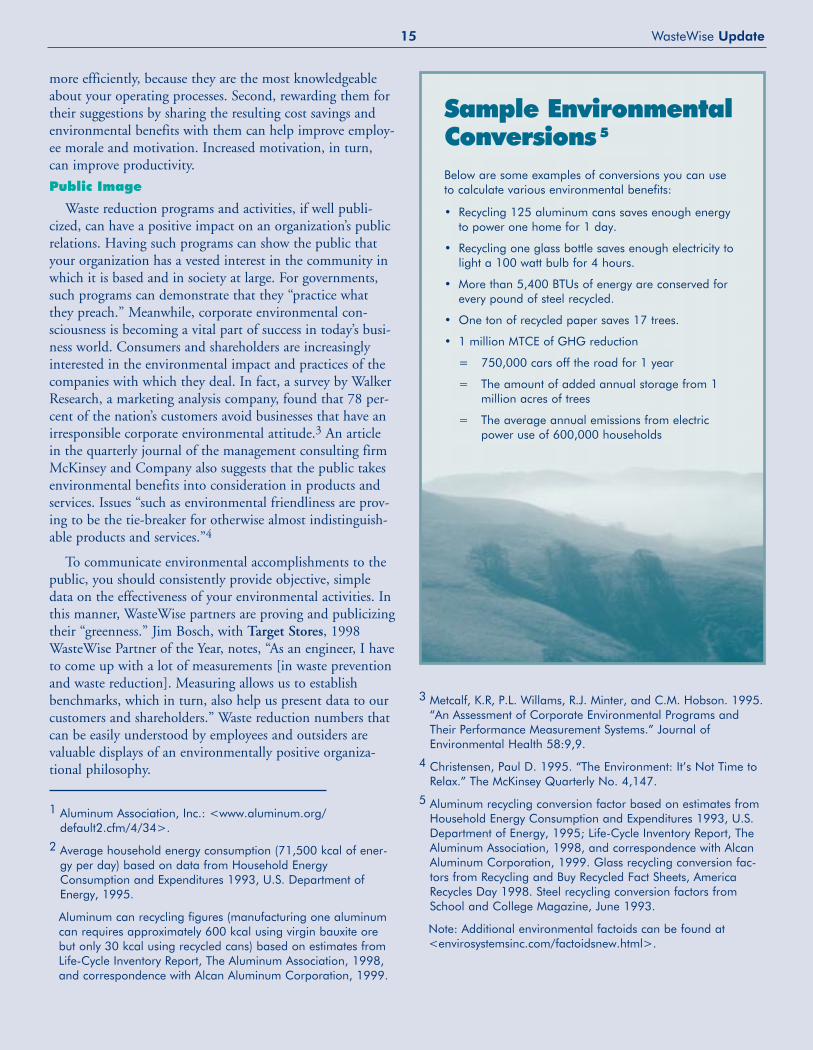
Sample EnvironmentalConversionsBelow are some examples of conversions you can useto calculate various environmental benefits:
• Recycling 125 aluminum cans saves enough energyto power one home for 1 day.
• Recycling one glass bottle saves enough electricity tolight a 100 watt bulb for 4 hours.
• More than 5,400 BTUs of energy are conserved forevery pound of steel recycled.
• One ton of recycled paper saves 17 trees.
• 1 million MTCE of GHG reduction
= 750,000 cars off the road for 1 year
= The amount of added annual storage from 1million acres of trees
= The average annual emissions from electricpower use of 600,000 households
5
WWUp11-Mockup.qxd 6/9/99 11:19 AM Page 17
1EPAUnited StatesEnvironmental Protection Agency(5306W)Washington, DC 20460
Official BusinessPenalty for Private Use$300
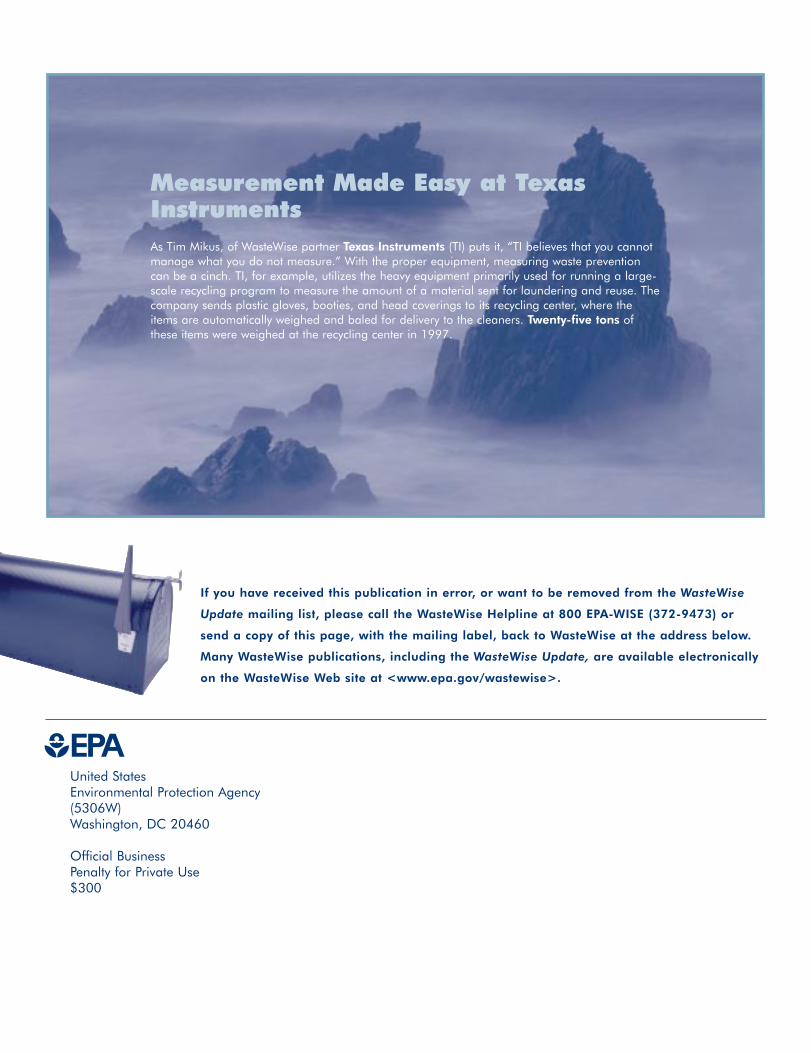
Measurement Made Easy at TexasInstrumentsAs Tim Mikus, of WasteWise partner Texas Instruments (TI) puts it, “TI believes that you cannotmanage what you do not measure.” With the proper equipment, measuring waste preventioncan be a cinch. TI, for example, utilizes the heavy equipment primarily used for running a large-scale recycling program to measure the amount of a material sent for laundering and reuse. Thecompany sends plastic gloves, booties, and head coverings to its recycling center, where theitems are automatically weighed and baled for delivery to the cleaners. Twenty-five tons ofthese items were weighed at the recycling center in 1997.
If you have received this publication in error, or want to be removed from the WasteWise
Update mailing list, please call the WasteWise Helpline at 800 EPA-WISE (372-9473) or
send a copy of this page, with the mailing label, back to WasteWise at the address below.
Many WasteWise publications, including the WasteWise Update, are available electronically
on the WasteWise Web site at <www.epa.gov/wastewise>.
WWUp11-Mockup.qxd 6/9/99 10:46 AM Page 2
R e s o u r c e s
▼Business Guide toReducing Solid Waste (EPA530-K-92-004)The U.S. Environmental ProtectionAgency (EPA) developed this guideto assist businesses, governments,and other organizations in estab-lishing waste reduction programs.This guide not only discusses thedevelopment and implementationof waste reduction programs butalso explains waste assessmentsand how to monitor and measurewaste reduction techniques. Toorder, contact EPA’s RCRA Hotlineat 800 424-9346.▼Buy-Recycled Training Manual The Northeast Maryland WasteDisposal Authority (NMWDA) pre-pared this manual to help publicand private agencies developbuy-recycled programs and moni-tor the progress of those pro-grams. For more information,contact Richard Keller atMaryland Environmental Serviceat 410 974-7254 or e-mail<[email protected]>.▼Profiting From SourceReduction: Measuring theHidden Benefits Alameda County, California, pro-duced this report to demonstratesource reduction measurement
tools and benefits for businessesand governments, including basicsource reduction cost analysis andproductivity modeling. The reportcan be downloaded fromAlameda County’s Web site<www.stopwaste.org/srcred> orordered in hard copy from TomPadia at 510 614-1699. The costof reproduction is $20.▼Source Reduction Now! This manual, by the MinnesotaOffice of Waste Management, pro-vides information on how to mea-sure product and behavior changesthat prevent waste, along with otherinformation on how to implementsuccessful source reduction pro-grams. The manual describes prob-lems and suggests well-tested solu-tions. For more information, visitMinnesota’s Office of WasteManagement Web site at<www.moea.state.mn.us/berc/srndl.cfm> or call 800 877-6300.▼Uncovering Value:Integrating Environmentaland Financial PerformanceThis 1998 Aspen Institute reportrecommends that companies findeffective ways to measure internalenvironmental activities. Thereport’s findings indicate thatcompanies experience a competi-tive advantage when they inte-grate environmental considera-tions into core business strategies.In fact, the report specifically findsthat financial institutions place ahigher value on organizationswith this type of integrated envi-ronmental planning. To downloada copy of the report, go to<www.aspeninst.org/dir/polpro/eee/ny/eeenyrep.pdf>.
▼Accounting SoftwareApplication for PollutionPrevention (ASAPP) The Electric Power ResearchInstitute (EPRI) developed wasteaccounting software for use byany industry that generatesbyproducts or wastes. The soft-ware allows companies to trackboth hazardous and nonhaz-ardous waste generation, man-agement, reduction activities, andcosts. It provides a means togather data from multiple facili-ties and operations and to ana-lyze, graph, compile, and reporta variety of waste managementinformation. Users can analyzewaste generation data and wastemanagement costs for an entirecompany or facility or for a spe-cific activity. To obtain the ASAPPsoftware, contact EPRI at 415855-2487.▼Business Recycling CostModel Green Solutions created this flex-ible model to help organizationsevaluate solid waste manage-ment options by projecting costsand results for recycling andwaste reduction. To order, callGreen Solutions at 360 897-9533 for more information.
T o o l sPublications
Resources-Insert.qxd 6/9/99 1:00 PM Page 1
▼CIWMB WasteCharacterization Databaseand Buy-Recycled Database California Integrated WasteManagement Board (CIWMB)designed this database to providelocal governments with a tool todetermine what’s being disposed ofin their waste streams, how to divertmaterials from disposal, and how toconserve resources. See CIWMB’sWeb site at <www.ciwmb.ca.gov/wastechar/> for the waste charac-terization database and<www.ciwmb.ca.gov/rcp/> for thebuy recycled database.▼Source Reduction ProgramPotential Manual andReduceIt Software (EPA530-E97-001) EPA developed this manual to evalu-ate the potential impact of varioussource reduction options for localgovernments’ residential programs.An organization can calculate thepotential for a particular sourcereduction program to reduce wasteusing example scenarios and work-sheets. In addition to the manual, theReduceIt software, an electronic ver-sion of the program potential work-sheets, helps calculate waste genera-tion data, program potential factors,and savings estimates. The manualand software can be obtainedthrough the RCRA Hotline at 800424-9346 or downloaded fromEPA’s Web site at <www.epa.gov/epaoswer/non-hw/reduce/reduceit/index.htm>.▼WasteNot System This tracking software, created by Ecology Action, helps organiza-tions conduct waste assessmentsand measurements. It serves as aguide for collecting relevant infor-mation and creates detailedreports showing successful wastereduction efforts. For more infor-mation, contact Ecology Action at
<[email protected]> or<www.ecoact.org>. ▼WAste Reduction Model(WARM) WARM is a Microsoft Excel spread-sheet application created by EPAto help solid waste planners andorganizations track and voluntarilyreport greenhouse gas (GHG)emission reductions. The modelcalculates and totals GHG emis-sions of baseline and alternativewaste management practicesincluding source reduction, recy-cling, combustion, composting,and landfilling. WARM can bedownloaded from EPA’s Web siteat <www.epa.gov/mswclimate>.
▼California Integrated WasteManagement Board Web Site www.ciwmb.ca.gov/
The CIWMB Web site contains awealth of waste reduction informa-tion, including two pages focusedon measurement. For informationon measuring waste streams anddetermining base-year waste gen-eration and adjustment methods,go to <www.ciwmb.ca.gov/lgtools/measure/>. For the factsheet, Measuring the Success ofOffice Paper Reduction Efforts,which helps organizations measurethe impact of office paper reductionactivities and determine cost sav-ings, go to <www.ciwmb.ca.gov/bizwaste/officepaper/measure.htm>.
▼Cutting Paper Web Siteeetd.LBL.gov/paper
The Cutting Paper Web site investi-gates how paper is used in officesand provides strategies for reduc-ing its cost and quantity. Topicsinclude ideas for saving paper,actions to cut down paper use, tipson how to measure and count sav-ings, and miscellaneous informa-tion about reducing paper use andrelated topics.▼Environmental Accounting Project Web Sitewww.epa.gov/opptintr/acctg
Developed by EPA, this Web siteis intended to encourage andmotivate businesses to under-stand the full spectrum of theirenvironmental costs and integratethese costs into their decision-making. A list of helpful resourcesis available, including both EPAand non-EPA publications, andinformation sources on environ-mental accounting. ▼Recycling Measurement Web Site www.epa.gov/epaoswer/non-hw/recycle/recmeas
This EPA Web site provides astandard methodology for stateand local governments to usewhen measuring recycling rates.The site includes several recyclingmeasurement documents,detailed instructions, worksheets,sample survey forms, planningchecklists, helpful tips, a recom-mended timeline for developinga measurement program, andstandard volume-to-weight con-version factors.
W e b S i t e s
Resources-Insert.qxd 6/9/99 1:02 PM Page 2
Related Documents