Age Structure and Growth of California Black Oak (Quercus kelloggii) in the Central Sierra Nevada, California 1 Barrett A. Garrison, 2 Christopher D. Otahal, 3 and Matthew L. Triggs 4 Abstract Age structure and growth of California black oak (Quercus kelloggii) was determined from tagged trees at four 26.1-acre study stands in Placer County, California. Stands were dominated by large diameter (>20 inch dbh) California black oak and ponderosa pine (Pinus ponderosa). Randomly selected trees were tagged in June-August 1998 and harvested under a group selection timber harvest in October-November 1998 and May-June 1999. Trees averaged 148 years of age (range = 58 to 356 years, n = 108), and ages differed among the four stands (P < 0.006). Stands had uneven distributions of tree ages, diameters, and heights. A nonlinear regression model was developed that predicted tree age based on diameter (R 2 = 0.74). The average 10-year increment of radial growth was 0.72 inches (range = 0.14-2.26 inches, n = 122), and radial growth decreased as basal area increased (nonlinear regression, R 2 = 0.34). If average growth rates are desired, basal area retention should average around 100- 115 ft 2 /acre and 200-225 ft 2 /acre for California black oak and all trees, respectively, for stands in the central Sierra Nevada with attributes that are similar to our study stands. Introduction California black oak (Quercus kelloggii) is widely distributed throughout California's montane environments (Bolsinger 1988, Griffin and Critchfield 1972). Occurring in mostly pure stands or mixed with conifers, California black oak is shade intolerant and a vigorous sprouter (McDonald 1969, 1990). Trees regenerate through stump sprouting or acorn germination, and sprouting is the primary method of regeneration (McDonald 1969, 1990). Because of its sprouting ability, California black oak is thought to primarily occur in even-aged stands as fire is the primary mode of stand replacement (McDonald 1969, 1990; McDonald and Tappeiner 1996). Tree cutting (primarily firewood and occasionally sawlogs) is the land use most affecting this species, but California black oak remains mostly underutilized commercially despite its wide distribution and large timber volume (Bolsinger 1988, McDonald and Huber 1995). In places, California black oak appears to be declining 1 An abbreviated version of this paper was presented at the Fifth Symposium on Oak Woodlands: Oaks in California’s Changing Landscapes, October 22-25, 2001, San Diego, California. 2 Staff Environmental Scientist, California Department of Fish and Game, 1701 Nimbus Road, Suite A, Rancho Cordova, California 95670 (e-mail: [email protected]) 3 Fish and Wildlife Biologist, 21 Vineyard Court, Hollister, California 95023 (e-mail: [email protected]) 4 District Wildlife Biologist, USDA Forest Service, Tahoe National Forest, Foresthill Ranger District, 22380 Foresthill Road, Foresthill, California 95631 (e-mail: [email protected]) USDA Forest Service Gen. Tech. Rep. PSW-GTR-184. 2002. 665

Welcome message from author
This document is posted to help you gain knowledge. Please leave a comment to let me know what you think about it! Share it to your friends and learn new things together.
Transcript

Age Structure and Growth of California Black Oak (Quercus kelloggii) in the Central Sierra Nevada, California1
Barrett A. Garrison,2 Christopher D. Otahal,3 and Matthew L. Triggs4 Abstract Age structure and growth of California black oak (Quercus kelloggii) was determined from tagged trees at four 26.1-acre study stands in Placer County, California. Stands were dominated by large diameter (>20 inch dbh) California black oak and ponderosa pine (Pinus ponderosa). Randomly selected trees were tagged in June-August 1998 and harvested under a group selection timber harvest in October-November 1998 and May-June 1999. Trees averaged 148 years of age (range = 58 to 356 years, n = 108), and ages differed among the four stands (P < 0.006). Stands had uneven distributions of tree ages, diameters, and heights. A nonlinear regression model was developed that predicted tree age based on diameter (R2 = 0.74). The average 10-year increment of radial growth was 0.72 inches (range = 0.14-2.26 inches, n = 122), and radial growth decreased as basal area increased (nonlinear regression, R2 = 0.34). If average growth rates are desired, basal area retention should average around 100-115 ft2/acre and 200-225 ft2/acre for California black oak and all trees, respectively, for stands in the central Sierra Nevada with attributes that are similar to our study stands.
Introduction California black oak (Quercus kelloggii) is widely distributed throughout
California's montane environments (Bolsinger 1988, Griffin and Critchfield 1972). Occurring in mostly pure stands or mixed with conifers, California black oak is shade intolerant and a vigorous sprouter (McDonald 1969, 1990). Trees regenerate through stump sprouting or acorn germination, and sprouting is the primary method of regeneration (McDonald 1969, 1990). Because of its sprouting ability, California black oak is thought to primarily occur in even-aged stands as fire is the primary mode of stand replacement (McDonald 1969, 1990; McDonald and Tappeiner 1996). Tree cutting (primarily firewood and occasionally sawlogs) is the land use most affecting this species, but California black oak remains mostly underutilized commercially despite its wide distribution and large timber volume (Bolsinger 1988, McDonald and Huber 1995). In places, California black oak appears to be declining
1 An abbreviated version of this paper was presented at the Fifth Symposium on Oak Woodlands: Oaks in California’s Changing Landscapes, October 22-25, 2001, San Diego, California. 2 Staff Environmental Scientist, California Department of Fish and Game, 1701 Nimbus Road, Suite A, Rancho Cordova, California 95670 (e-mail: [email protected]) 3 Fish and Wildlife Biologist, 21 Vineyard Court, Hollister, California 95023 (e-mail: [email protected]) 4 District Wildlife Biologist, USDA Forest Service, Tahoe National Forest, Foresthill Ranger District, 22380 Foresthill Road, Foresthill, California 95631 (e-mail: [email protected])
USDA Forest Service Gen. Tech. Rep. PSW-GTR-184. 2002. 665

California Black Oak Age Structure—Garrison, Otahal, and Triggs
as older trees die and are not replaced by younger trees because conifers shade them in mixed-conifer stands (McDonald and Tappeiner 1996, personal observations).
Surprisingly little information exists on the dynamics of California black oak. For sprout-origin trees, a diameter growth model exists for trees from even-aged stands that are < 120 years of age, and a height growth model exists for trees < 170 years of age (McDonald 1969). Powers (1972) developed index curves from higher index sites, and McDonald's (1983) model is based on growth of young trees growing in overstocked conditions where trees had not reached their maximum size and height. Volume tables exist for trees < 30 inches in diameter. A non-quantitative model of diameter-age relationships was described by McDonald (1990), and Savage (1994) developed a linear regression model for diameter-age relationships for trees < 140 years of age. These models are not based on radial stem growth of known age trees from stands with mature trees and cannot predict age from a given diameter beyond 160 years of age. Radial growth is known for trees < 160 years of age, but a statistical model for radial growth was not developed (Gemmill 1980). Seedling occurrence has been associated positively with oak canopy cover and reduced solar radiation (Standiford and others 1997).
Single-tree aging and radial growth models from sites with mature trees would help managers because they would likely differ from models developed with younger California black oaks. Mature trees from uneven-aged stands might also yield different aging and growth equations. In addition, no published information exists on ages of California black oak in mature stands.
We undertook this study of California black oak dynamics, including age and growth, to fill these information gaps. Our objectives were to: (1) determine age structure of several California black oak-dominated stands; (2) develop a model to predict tree age from tree attributes such as diameter and height; and (3) develop a single-tree radial growth model based on several sites in the central Sierra Nevada.
Study Area
We conducted this study primarily on four 26.1-ac study stands in southern Placer County, California. Some additional data were collected from adjacent paired 26.1-ac stands at each site (see below). Elevations ranged from 4,040 to 4,360 ft, and the stands were located on the plateaus and upper portions of steep river canyons that characterize the study area. At the four stands, aspects were W, SE, SW, and S, while slopes were 6 percent, 7 percent, 12 percent, and 33 percent. Study stands were located in larger size, homogeneous forest stands with a tree layer dominated by large diameter (>20 inch diameter breast height [dbh]) California black oak and ponderosa pine (Pinus ponderosa). Other less dominant tree species included interior live oak (Q. wislizenii), Douglas-fir (Pseudotsuga menziesii), white fir (Abies concolor), sugar pine (P. lambertiana), and incense cedar (Calocedrus decurrens). Seedling and sapling California black oak and ponderosa pine dominated the subcanopy at one stand, while the other stands had little subcanopy. The shrub layer was generally sparse, and deerbrush (Ceanothus integerrimus) and manzanita (Arctostaphylos spp.) were the most common shrubs. The herbaceous layer was dominated by a sparse to dense cover of mountain misery (Chamaebatia foliolosa).
USDA Forest Service Gen. Tech. Rep. PSW-GTR-184. 2002. 666

California Black Oak Age Structure—Garrison, Otahal, and Triggs
Methods Age (ring count) and growth data were collected from 184 California black oak
trees that were harvested in October-November 1998 and May-June 1999 at the four stands. The trees were randomly selected from four 1.5-ac harvest units randomly located in each stand. Stem diameter (inches) at 4.5 ft (dbh) and height (ft) were measured from each tree, which was tagged at ground level with a numbered aluminum tag prior to harvesting. Stumps of the tagged trees were relocated after harvesting. Data were collected during September 1999-April 2000. Tree age (years) based on counts of growth rings was determined from cross-sectional rounds or quarter rounds cut from stumps. Two observers conducted independent counts of growth rings, and their counts were averaged to determine tree age. Average difference in ring counts between observers was 3.8 years (SE = 0.3 years, n = 108) (paired t-test, t = -1.26, df = 107, P = 0.212). Radial growth (inches) for the most recent 10 years (Kertis and others 1993) was determined by measuring the radial distance for the most recent 10 growth rings measured from the outside edge of the cambium into the pith. Two measurements were taken approximately 90° apart, and averaged to estimate radial growth for each tree.
Vegetation characteristics were sampled from 12 0.01-ac plots per stand. Plots were centered on grid intersection points (see below) closest to each tagged tree used for the age and growth models, and three plots were sampled from each 1.5-ac harvest unit. One plot was located at the center of the harvest unit, and the remaining two plots were located on the same or adjacent transect within 82-90 ft of the center plot. Vegetation characteristics measured in each plot were diameter distribution, tree heights, overstory canopy cover, and density (number/ac) and basal area (ft2/ac) of all live stems > 5 inches dbh.
Timber harvests were conducted on four 1.5-ac circular plots randomly selected from the 15 0.1-ac circular plots in the 26.1-ac stand randomly selected for harvesting. All trees of merchantable size (approximately 8 inches dbh for conifers and 10 inches dbh for hardwoods) were harvested within each 1.5-ac circular harvest unit using a group selection harvest strategy (Davis and Johnson 1987). Stands 3 and 4 were harvested in October-November 1998, and Stands 1 and 2 were harvested in May-June 1999. The staggered harvest was not intentional but resulted from logistic and weather constraints.
Most data did not meet assumptions and distribution requirements for parametric statistics so data were transformed (Zar 1996). Normal probability plots, frequency histograms, and calculations of skewness and kurtosis were used to assess normality of tree and vegetation data, and transformations were selected for each data set that resulted in maximum improvement in each data. Transformations improved normality and equalized variances. Logrithmic10 transformations (log10 + 1) were used with tree age, diameter, and heights; crown radius; basal areas; stem densities; and tree diameters and heights from the 12 circular plots. Square root transformations (square root + 0.5) were given to radial growth measurements from individual trees and averages for radial growth of each plot. Canopy cover for all trees, hardwoods, and conifers were given arcsine transformations [arcsine radian degrees (square root (proportion canopy cover + 1))]. Untransformed data were analyzed with some of the nonlinear regressions when the resulting model performed better than models using transformed data or the regression equation used logarithms. Model performance was evaluated based on residual plots and statistical significance of the regressions.
USDA Forest Service Gen. Tech. Rep. PSW-GTR-184. 2002. 667

California Black Oak Age Structure—Garrison, Otahal, and Triggs
Radial growth was modeled using a distance independent model approach where distances among adjacent trees are not included in the model (Davis and Johnson 1987). Nonlinear regression was used to develop predictive relationships between radial growth and tree age with various attributes of individual trees using a. Simple linear correlation analysis was used to determine initial relationships between vegetation attributes and tree and plot radial growth and age. The variable with the greatest r value from the simple linear correlation analysis was used in nonlinear regressions. T-tests were used to determine differences between (1) diameter, height, and crown radius of aged trees and trees that were not aged; and (2) radial growth of trees with and without heartrot. Analysis of variance (ANOVA) was used to determine differences between stands, and Bonferroni pairwise comparisons were used to determine differences between pairs of stands. Kolmogorov-Smirnov two-sample tests were used to determine differences in distributions of ages, diameters, and heights of trees between pairs of stands. P-values were adjusted for multiple comparisons. Statistical analyses were conducted using SYSTAT (SPSS Incorporated 1999a, 1999b).
Data were pseudo replicated (Hurlbert 1984) for analysis because tagged trees and vegetation plots from the four stands were treated as replicates in linear and nonlinear regressions and general linear models to increase number of replicates. The four stands are true replicates, but relationships between age and growth with vegetation attributes could not be elucidated with only four replicates. For most regression analyses, summary statistics and scatterplots for each stand are presented to assist interpretation of regression results. Our results and discussion should be cautiously interpreted because of the pseudo replication.
Results Stand Attributes
The four stands consisted of relatively large diameter California black oaks (dbh average = 18.7 inches + 1.0 inch SE, n = 4) and smaller diameter conifers (dbh average = 14.3 inches + 2.3 inches SE, n = 4). Average diameter of all trees was 16.1 inches + 1.0 inches SE (n = 4). Average tree height of California black oak was 62 ft + 3 ft SE (n = 4), while average tree height of conifers was 64 ft + 14 ft SE (n = 4). The stands had large amounts of basal area (average = 200 ft2/acre + 21 ft2/acre SE, n = 4), moderate stem densities (average = 126 trees/acre + 13 trees/acre SE, n = 4), and closed canopies (average = 61.8 percent + 3.5 percent SE, n = 4). Basal area of California black oak and conifers averaged 115.5 ft2/acre + 11.2 ft2/acre SE (n = 4) and 84.7 ft2/acre + 21.7 ft2/acre (n = 4), respectively. Stem densities of California black oak and conifers averaged 60 trees/acre + 11 trees/acre SE (n = 4) and 66 trees/acre + 11 trees/acre SE (n = 4), respectively. Most vegetation attributes were equivalent among the four stands (F < 2.21; df = 3-4, 10-44; P > 0.100), except stem densities of California black oak (F = 3.11; df = 3, 43; P = 0.036) and conifer stem diameters (F = 2.97; df = 3, 36; P = 0.044). Stand 1 had a more even distribution of diameter classes for hardwoods than Stand 4 (Kolmogorov-Smirnov two-sample test, P = 0.007), while Stands 2 and 3 and Stands 3 and 4 had different diameter distributions of hardwoods (Kolmogorov-Smirnov two-sample test, P < 0.034) (fig. 1).
USDA Forest Service Gen. Tech. Rep. PSW-GTR-184. 2002. 668

California Black Oak Age Structure—Garrison, Otahal, and Triggs
(Figure 1 continued on next page)
Figure 1—Frequency distributions of 5-in diameter (DBH) classes for trees > 5 in DBH from four 26.1-ac stands in Placer County, California. Individual bars represent total number of conifer and hardwood trees while pattered portions are for conifers (solid portion) and hardwoods (cross hatched portion) separately.
USDA Forest Service Gen. Tech. Rep. PSW-GTR-184. 2002. 669

California Black Oak Age Structure—Garrison, Otahal, and Triggs
(Figure 1 continued)
Figure 1—Frequency distributions of 5-in diameter (DBH) classes for trees > 5 in DBH from four 26.1-ac stands in Placer County, California. Individual bars represent total number of conifer and hardwood trees while pattered portions are for conifers (solid portion) and hardwoods (cross hatched portion) separately.
USDA Forest Service Gen. Tech. Rep. PSW-GTR-184. 2002. 670

California Black Oak Age Structure—Garrison, Otahal, and Triggs
Age Stand Comparisons
In all stands, harvested trees averaged 147.4 years + 6.9 years SE old (n = 108) and ranged from 58 to 356 years old (table 1, fig. 2). Ages were different among Stands 1, 2, and 4 (F = 5.46; df = 2, 95; P = 0.006) (table 1, fig. 2) (Stand 3 was not included because of its small sample size). Trees were older in Stand 1 than Stand 2 (Bonferroni pairwise comparison P = 0.009), while trees in Stand 2 were younger than Stand 4 (Bonferroni pairwise comparison P = 0.049) (table 1, fig. 2). Trees were equivalent in age between Stands 1 and 4 (Bonferroni pairwise comparison P = 1.000). There were no differences in diameters of trees that were aged versus not aged for all stands combined (t = 0.067, df = 178.9, P = 0.947) or separately for each stand (t = -0.926 to 0.875, df = 11.1-38.4, P > 0.361).
The four stands had uneven age structures (fig. 2). Stands 2 and 4 had a skewed distribution with many trees < 200 years old, and a few trees > 200 years old. Stands 1 and 3 had an equal distribution of trees among age classes (fig. 2). A group of similarly aged trees occurred in Stand 2 where 35 percent (n = 14) of the aged trees were 71-75 years of age. Distributions differed between Stands 1 and 2 (Kolmogorov-Smirnov test, P = 0.009) and Stands 2 and 4 (Kolmogorov-Smirnov test, P = 0.001) (pairwise comparisons did not include Stand 3).
Table 1—Attributes of harvested California black oaks from four 26.1-acre stands in Placer County, California. Attribute Stand Mean SE SD Minimum Maximum Age (yr) 1 (29)1 175.7 17.1 92.1 64 356 2 (40) 122.7 9.9 62.4 58 315 3 (10) 145.7 16.9 53.4 68 203 4 (29) 153.8 10.5 56.4 80 305 All (108) 147.4 6.9 71.9 58 356 Diameter (in) 1 21.9 2.0 10.6 9.8 46.9 2 17.5 1.6 10.1 5.9 51.2 3 19.0 2.5 8.0 8.0 30.7 4 18.2 1.4 7.7 8.2 38.4 All 19.0 0.9 9.6 5.9 51.2 Height (ft) 1 75.9 5.8 31.2 20 131 2 62.7 3.4 21.3 15 104 3 65.1 7.0 22.2 25 102 4 56.1 3.0 16.0 20 85 All 64.7 2.3 24.2 15 131 Crown radius (ft) 1 15.5 1.3 6.9 3.5 33.5 2 10.4 0.9 5.8 1.0 26.0 3 12.1 1.2 3.7 6.5 18.0 4 11.6 1.1 5.7 4.0 29.0 All 12.3 0.6 6.2 1.0 33.5 1Sample size for each stand and all attributes.
USDA Forest Service Gen. Tech. Rep. PSW-GTR-184. 2002. 671

California Black Oak Age Structure—Garrison, Otahal, and Triggs
Figure 2—Age class distribution of harvested California black oak (Quercus kelloggii) (n = 10-40) from four 26.1-ac stands in Placer County, California. Aging Model
Average tree age from the 0.1-plots (n = 42-46) was positively correlated with basal area (r = 0.393, P < 0.01), average dbh (r = 0.449, P < 0.01), and average height (r = 0.321, P < 0.05) of all trees. Average tree age was also positively correlated with basal area (r = 0.572, P < 0.001), average dbh (r = 0.791, P < 0.001), and average height (r = 0.427, P < 0.05) of all California black oak in the 0.1-acre plots (n = 41-46). Age was not associated with any conifer attributes (P > 0.1).
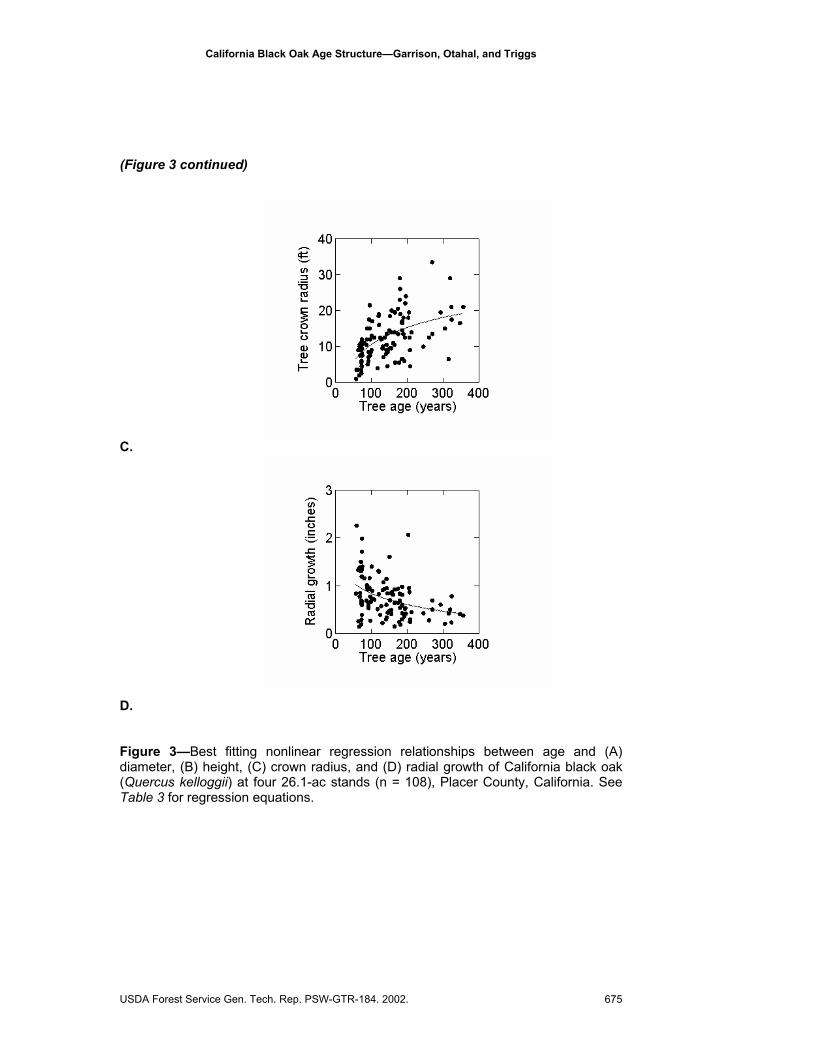
Tree age was significantly related to tree diameter, height, and crown radius (table 2, fig. 3). The best fitting nonlinear model (R2 = 0.74) included a quadratic term for diameter. A similar model (R2 = 0.74) was developed with diameter as the independent variable and tree age as the dependent variable (table 2, fig. 3). Models had poorer fits (R2 = 0.15-0.29) for those developed for other tree attributes with age as independent and dependent variables indicating that factors other than age affect these attributes or there is wide variation in the data. We believe that differences in model fit were largely due to variances with the dependent variables. The age-relationship regression lines had a tighter fit along the tree diameter gradient and a
USDA Forest Service Gen. Tech. Rep. PSW-GTR-184. 2002. 672

California Black Oak Age Structure—Garrison, Otahal, and Triggs
poorer fit along gradients of tree height and crown radius (fig. 3). In particular, tree heights and crown radii varied widely for trees > 200 years of age.
Table 2—Best fitting nonlinear regression models for various attributes of California black oaks from four 26.1-ac stands in Placer County, California. Mean squares Attribute Equation r2 df Regression Residual Age as independent variable Diameter1 -1.69 + 1.85*(age) –
0.22*(age)2 0.74 3,105 55.35 0.01
Height 21.67 + 0.43*(age) – 0.01*(age)2
0.26 3,105 155,884.07 440.50
Crown radius -21.83 + 16.08*log10(age + 1) 0.29 2,106 8,711.54 27.79 Radial growth 2.41 – 0.78*log10(age + 1) 0.15 2,104 30.77 0.15 Age as dependent variable Diameter1 -1.06 + 0.92*(dbh) –
0.04*(dbh)2 0.74 3,105 162.90 0.01
Height 1.20 + 0.52*log10(height) 0.21 2,106 243.15 0.03 Crown radius 1.68 + 0.43*log10(radius) 0.28 2,106 234.30 0.03 1Log10 transformations to independent and dependent variables.
Growth
Ten-year radial growth for individual trees averaged 0.72 inches + 0.04 inches SE (range 0.14-2.26 inches; n = 122). Growth differed among stands (F = 3.77; df = 3,118; P = 0.013), and Stand 4 had less growth (average = 0.54 inches + 0.05 inches SE, range = 0.15-1.16 inches, n = 32) than Stand 2 (average = 0.86 inches + 0.08 inches SE, range = 0.14-2.26 inches, n = 40) (Bonferroni comparison, P = 0.007). Growth in Stand 1 averaged 0.70 inches + 0.07 inches SE (range = 0.19-1.40 inches, n = 29), while growth in Stand 3 averaged 0.75 inches + 0.10 inches SE (range = 0.19-2.07 inches, n = 21). Growth averaged 0.72 inches (range 0.19-1.62, n = 46) when calculated on a 0.1-acre plot basis within each stand indicating that plot measures were similar to individual tree measures. Growth within the 0.1-acre plots, however, was equivalent among stands (F = 2.42; df = 3,42; P = 0.079) indicating that it was less sensitive to stand differences; smaller sample sizes with plot data may also have contributed to less discrimination among stands.
USDA Forest Service Gen. Tech. Rep. PSW-GTR-184. 2002. 673

California Black Oak Age Structure—Garrison, Otahal, and Triggs
A poor fitting model was developed for radial growth and age (r2 = 0.15) (table 2, fig. 3). There was considerable variation in radial growth for trees < 100 years of age and less variation for trees > 200 years of age (fig. 3). Radial growth from plots was inversely correlated (P < 0.01) with basal area of all trees (r = -0.568) and conifers (r = -0.457) and average diameter of all trees (r = -0.398) and conifers (r = -0.435) (fig. 4). A single outlying datum of low basal area and slow growth reduced the correlation coefficient. Radial growth was variously affected by basal area within each stand (r = -0.182- -0.766, n = 11-12, P = 0.004-0.572) but growth consistently declined as basal area increased. This inverse relationship was stronger for two of the four stands than for data from all stands combined (fig. 4).
A.
B. (Figure 3 continued on next page) Figure 3—Best fitting nonlinear regression relationships between age and (A) diameter, (B) height, (C) crown radius, and (D) radial growth of California black oak (Quercus kelloggii) at four 26.1-ac stands (n = 108), Placer County, California. See Table 3 for regression equations.
USDA Forest Service Gen. Tech. Rep. PSW-GTR-184. 2002. 674
California Black Oak Age Structure—Garrison, Otahal, and Triggs
(Figure 3 continued)
C.
D. Figure 3—Best fitting nonlinear regression relationships between age and (A) diameter, (B) height, (C) crown radius, and (D) radial growth of California black oak (Quercus kelloggii) at four 26.1-ac stands (n = 108), Placer County, California. See Table 3 for regression equations.
USDA Forest Service Gen. Tech. Rep. PSW-GTR-184. 2002. 675

California Black Oak Age Structure—Garrison, Otahal, and Triggs
A.
B. Figure 4—Scatterplots of radial growth of California black oak (Quercus kelloggii) and plot basal area from (A) each 26.1-ac stand (n = 11-12) and (B) all stands combined (n = 46) for 0.1-ac plots with > 1 tree measured for radial growth. Lines represent quadratic smoothing and values are correlation results.
USDA Forest Service Gen. Tech. Rep. PSW-GTR-184. 2002. 676

California Black Oak Age Structure—Garrison, Otahal, and Triggs
Discussion Stand Attributes
Stands were similar in all vegetation attributes except stem densities of California black oak and diameters of conifers. Our study stands were typical of those dominated by larger diameter and older California black oaks in the central Sierra Nevada, although few stands like this occur in the area. Study stands were selected from over 20 different stands dominated by mature California black oak based on accessibility, high wildlife habitat values, and operability for timber harvesting. California black oak is relatively widespread throughout the study area but occurs in many different stand conditions. Many forestlands in the area, including private and public, have younger trees due to timber harvesting or fire. These age and growth results should apply to most stands with a mixture of California black oak and ponderosa pine that have similar stand attributes.
Age Trees ranged in age from 58 to 356 years, and there was considerable age
variation within each stand. Age distributions were consistent with those of uneven-aged stands (Davis and Johnson 1987). California black oaks generally grow in even-aged stands because trees are replaced by stump sprouting after stand disturbances such as fire and logging top kill trees (McDonald 1978), but uneven-aged trees do occur (Savage 1994). Most previous research on aging, however, has been done on stands with younger trees (< 160 years) and earlier successional stages (Gemmill 1980, McDonald 1978, Savage 1994).
We observed two stand regeneration patterns. The flat age class distribution of Stand 1 indicates regeneration that is sporadic but continuous. Stands 2 and 4 had skewed and bell-shaped distributions, respectively, suggesting that regeneration occurred in pulses. The large number of trees 70-75 years old in Stand 2 indicates a regeneration pulse.
The strong predictive relationship between age and diameter (r2 = 0.74) means that managers have a simple model that can be used to estimate tree age based on diameter. Using these relationships, however, to estimate age structure of a stand of trees should be cautiously done because they produce estimates of age structure that are considerably more continuous than the actual age structure which can be discontinuous (McClaran and Bartolome 1990). The linear regression model developed by Savage (1994) for California black oak had an r2 = 0.54. Poorer fitting models for radial growth, crown radius, and tree height indicate that these attributes are influenced by factors other than age.
Growth Radial growth over the last 10 years averaged 0.72 inches (range = 0.14-2.26
inches), and variation in growth was greatest with trees < 150 years of age. Radial growth varied within and among stands, and site and stand attributes affected growth. Radial growth over a 60 year period for < 160-year old California black oaks in the San Bernardino Mountains ranged between 0.1-1.1 inches (Gemmill 1980) which was considerably less than radial growth rates from our study. Growth was inversely related to basal area such that growth declined as basal area increased. Average
USDA Forest Service Gen. Tech. Rep. PSW-GTR-184. 2002. 677

California Black Oak Age Structure—Garrison, Otahal, and Triggs
growth occurred at approximately 200 ft2/acre of which California black oak represented 55-60 percent of the basal area. Growth similarly declines as the number of stems per trees increases (Gemmill 1980). Radial growth of California black oaks from our study in the central Sierra Nevada as well as those in the San Bernardino Mountains (Gemmill 1980) declines as the trees get older.
Acknowledgments Funding was provided by the University of California's Integrated Hardwood
Range Management Program (IHRMP) and the California Department of Forestry and Fire Protection (CDF). We thank Rick Standiford and Doug McCreary of the IHRMP and Steve Jones of CDF for their help in getting funding. Rick Standiford, Doug McCreary, and Phil McDonald provided guidance on all aspects of this study. Karen Durand, Robin Wachs, and Richard Burg assisted with the field work. The Federal Aid in Wildlife Restoration (Pittman-Robertson) Act provided partial support for the staff time of Barrett Garrison to conduct this study. We thank two anonymous reviewers and Frank Davis for reviewing this paper.
References Bolsinger, C. L. 1988. The hardwoods of California's timberlands, woodlands, and
savannas. Res. Bulletin PNW-RB-148. Portland, OR: Pacific Northwest Research Station, Forest Service, U.S. Department of Agriculture; 148 p.
Davis, L. S.; Johnson, K. N. 1987. Forest management. Third edition. New York: McGraw-Hill Book Company; 790 p.
Gemmill, B. 1980. Radial growth of California black oak in the San Bernardino Mountains. In: Plumb, T. R., technical coordinator. Proceedings of the symposium on ecology, management, and utilization of California oaks; 1979 June 26-28; San Luis Obispo, CA. Gen. Tech. Rep. PSW-GTR-44. Berkeley, CA: Pacific Southwest Research Station, Forest Service, U.S. Department of Agriculture; 128-135.
Griffin, J. R., Critchfield, W. B. 1972. The distribution of forest trees in California. Res. Paper PSW-82/1972. Berkeley, CA: Pacific Southwest Forest and Range Experiment Station, Forest Service, U.S. Department of Agriculture; 118 p.
Hurlbert, S. H. 1984. Pseudoreplication and the design of ecological field experiments. Ecological Monographs 54:187-211.
Kertis, J. A.; Peterson, D. L.; Arbaugh, M. J.; Standiford, R. B.; McCreary, D. D. 1993. Growth trends of blue oak (Quercus douglasii) in California. Canadian Journal of Forest Research 23:1720-1724.
McClaran, M. P., Bartolome, J. W. 1990. Comparison of actual and predicted blue oak age structure. Journal of Range Management 43:61-63.
McDonald, P. M. 1969. Silvical characteristics of California black oak (Quercus kelloggii Newb.). Res. Paper PSW-53. Berkeley, CA: Pacific Southwest Forest and Range Experiment Station, Forest Service, U.S. Department of Agriculture; 20 p.
McDonald, P. M. 1978. Silviculture-ecology of three native California hardwoods on high sites in north central California. Corvallis, OR: Oregon State University; 354 p. Ph.D. dissertation .
McDonald, P. M. 1980. Growth of thinned and unthinned hardwood stands in the northern Sierra Nevada... preliminary findings. In: Plumb, T. R., technical
USDA Forest Service Gen. Tech. Rep. PSW-GTR-184. 2002. 678

California Black Oak Age Structure—Garrison, Otahal, and Triggs
coordinator. Proceedings of the symposium on ecology, management, and utilization of California oaks; 1979 June 26-28; San Luis Obispo, CA. Gen. Tech. Rep. PSW-GTR-44. Berkeley, CA: Pacific Southwest Research Station, Forest Service, U.S. Department of Agriculture; 119-127.
McDonald, P. M. 1983. Local volume tables for Pacific madrone, tanoak, and California black oak in north-central California. Res. Note PSW-362. Berkeley, CA: Pacific Southwest Forest and Range Experiment Station, Forest Service, U.S. Department of Agriculture; 6 p.
McDonald, P. M. 1990. Quercus kelloggii Newb. California black oak. In: Burns, R. M.; Honkala, B.H., technical coordinators. Silvics of North America. Volume 2, hardwoods. Agric. Handb. 654. Washington, DC: U.S. Department of Agriculture; 661-671.
McDonald, P. M.; Huber, D. W. 1995. California's hardwood resource: managing for wildlife, water, pleasing scenery, and wood products. Gen. Technical Report PSW-GTR-154. Albany, CA: Pacific Southwest Forest and Range Experiment Station, Forest Service, U.S. Department of Agriculture; 23 p.
McDonald, P. M.; Tappeiner, J. C. 1996. Silviculture-ecology of forest-zone hardwoods in the Sierra Nevada. In: Sierra Nevada Ecosystem Project: final report to Congress. Volume III, assessments, commissioned reports, and background information. Davis, CA: University of California, Centers for Water and Wildlife Resources; 621-636.
Powers, R. F. 1972. Site index curves for unmanaged stands of California black oak. Res. Note PSW-262. Berkeley, CA: Pacific Southwest Forest and Range Experiment Station, Forest Service, U.S. Department of Agriculture; 5 p.
Savage, M. 1994. Anthropogenic and natural disturbance and patterns of mortality in a mixed forest in California. Canadian Journal of Forest Research 24:1149-1159.
SPSS Incorporated. 1999a. SYSTAT(©) 9 Statistics I. Chicago, IL: SPSS Incorporated; 660 p
SPSS Incorporated. 1999b. SYSTAT(©) 9 Statistics II. Chicago, IL: SPSS Incorporated; 552 p.
Standiford, R. B.; McDougald, N.; Frost, W.; Phillips, R. 1997. Factors influencing the probability of oak regeneration on southern Sierra Nevada woodlands in California. Madroño 44:170-183.
Zar, J. H. 1996. Biostatistical analysis. 3rd ed. Upper Saddle River, NJ: Prentice Hall; 662 p.
USDA Forest Service Gen. Tech. Rep. PSW-GTR-184. 2002. 679
Related Documents