Age-specific variation in survival, reproductive success and offspring quality in red squirrels: evidence of senescence Se ´bastien Descamps, Stan Boutin, Dominique Berteaux and Jean-Michel Gaillard S. Descamps and D. Berteaux ([email protected]), Chaire de Recherche du Canada en Conservation des E ´ cosyste`mesNordiques et Centre d’E ´ tudes Nordiques, Univ. du Que´bec a`Rimouski, 300 alle´e des Ursulines, Rimouski, Que´bec, G5L3A1, Canada. SD and J.-M. Gaillard, Laboratoire de Biome´trie et Biologie E ´ volutive (UMR 5558); CNRS; Univ. Lyon 1, 43 boul. du 11 Novembre 1918, FR69622, Villeurbanne Cedex, France. S. Boutin, Dept of Biological Sciences, CW405, Biological Sciences Centre, Univ. of Alberta, Edmonton, Alberta, T6G2E9, Canada. Individual performance is expected to decrease with age because of senescence. We analyzed long-term data collected on a North American red squirrel population to assess the influence of age on body mass, survival and reproductive performance, and to study the effects of sex and of environmental conditions during early life on senescence patterns. Mass of males and females did not decrease at the end of life, possibly because body mass mostly reflects overall size in income breeders such as red squirrels. On the other hand, we found evidence of senescence in survival of both sexes and, to a lesser extent, in female reproductive traits. When compared to females, males had both higher survival and delayed decrease in survival, suggesting a weaker senescence in males. The offspring survival from weaning to one year of age also decreased with increasing mother age. This suggests that older females produce juveniles of lower quality, providing evidence of an intergenerational effect of mother’s age on juveniles’ fitness. Finally, our results indicate that variations in food conditions during early life influenced the reproductive tactics of females in the first years of their life, but not senescence patterns. The assessment of life history changes with age in animal populations is a key issue in ecology. Most vertebrate populations are strongly age-structured (Charlesworth 1994) so that age-specific life history traits are required to understand both the evolution of life histories (Partridge and Harvey 1988) and population dynamics (Caswell 2001). Life history theory predicts that both survival and reproduction should decrease with age because of senes- cence, a decrease in functional capacities at old ages (Hamilton 1966, Comfort 1979). The study of senescence in wild populations has proven to be challenging because of the need for long-term monitoring of individuals. Evidence for senescence has been reviewed by Bennett and Owens (2002) for birds and by Gaillard et al. (2003a) for large mammalian herbivores. Both studies concluded that senes- cence in survival and reproductive success is pervasive in those species. Evidence for senescence in free-ranging populations of small mammals has been more limited (Slade 1995), but some studies reported decreased survival (Broussard et al. 2005) or reproduction (Morris 1996, Broussard et al. 2003) with increasing age. We have been monitoring the survival and reproductive performance of individual North American red squirrels in the southwestern Yukon for 15 years. Red squirrels are active year round (Humphries et al. 2005), and do not store energy in the form of fat but rather cache conifer cones that are collected in autumn (before they shed their seed) and stored unopened underground. Squirrels rely on this food cache through winter and into the following spring. North American red squirrels are part of a consumerresource pulse system, with the main food resource (i.e. seeds of white spruce) exhibiting dramatic yearly variations (Boutin et al. 2006). Seed production is highly variable because the conifer trees in the area show mast behaviour and many life history traits in this red squirrel population are strongly affected by seed production (Humphries and Boutin 2000, McAdam and Boutin 2003, Boutin et al. 2006). Among the theories proposed to explain the occurrence of senescence, the antagonistic pleiotropy theory (Williams 1957) has received the most support in animals (Partridge 2001). In the context of life history evolution, this antagonistic pleiotropy theory involves a tradeoff between a positive effect of genes at a young age and a negative effect of the same genes at old age that should shape age-specific allocation to reproduction. From a life history viewpoint, this has led to the concept of the disposable soma (Kirk- wood and Rose 1991). There should therefore be a direct link between senescence and reproductive tactics of in- dividuals (see Nussey et al. 2006 for a recent example in red deer). Environmental conditions in the year of birth have been reported to influence reproductive tactics, so that individuals born in good years, or more generally in good Oikos 117: 14061416, 2008 doi: 10.1111/j.2008.0030-1299.16545.x, # 2008 The Authors. Journal compilation # 2008 Oikos Subject Editor: John Vucetich. Accepted 25 April 2008 1406

Welcome message from author
This document is posted to help you gain knowledge. Please leave a comment to let me know what you think about it! Share it to your friends and learn new things together.
Transcript
Age-specific variation in survival, reproductive success and offspringquality in red squirrels: evidence of senescence
Sebastien Descamps, Stan Boutin, Dominique Berteaux and Jean-Michel Gaillard
S. Descamps and D. Berteaux ([email protected]), Chaire de Recherche du Canada en Conservation des Ecosystemes Nordiqueset Centre d’Etudes Nordiques, Univ. du Quebec a Rimouski, 300 allee des Ursulines, Rimouski, Quebec, G5L3A1, Canada. � SD and J.-M.Gaillard, Laboratoire de Biometrie et Biologie Evolutive (UMR 5558); CNRS; Univ. Lyon 1, 43 boul. du 11 Novembre 1918, FR�69622,Villeurbanne Cedex, France. � S. Boutin, Dept of Biological Sciences, CW405, Biological Sciences Centre, Univ. of Alberta, Edmonton, Alberta,T6G2E9, Canada.
Individual performance is expected to decrease with age because of senescence. We analyzed long-term data collected on aNorth American red squirrel population to assess the influence of age on body mass, survival and reproductiveperformance, and to study the effects of sex and of environmental conditions during early life on senescence patterns.Mass of males and females did not decrease at the end of life, possibly because body mass mostly reflects overall size inincome breeders such as red squirrels. On the other hand, we found evidence of senescence in survival of both sexes and,to a lesser extent, in female reproductive traits. When compared to females, males had both higher survival and delayeddecrease in survival, suggesting a weaker senescence in males. The offspring survival from weaning to one year of age alsodecreased with increasing mother age. This suggests that older females produce juveniles of lower quality, providingevidence of an intergenerational effect of mother’s age on juveniles’ fitness. Finally, our results indicate that variations infood conditions during early life influenced the reproductive tactics of females in the first years of their life, but notsenescence patterns.
The assessment of life history changes with age in animalpopulations is a key issue in ecology. Most vertebratepopulations are strongly age-structured (Charlesworth1994) so that age-specific life history traits are required tounderstand both the evolution of life histories (Partridgeand Harvey 1988) and population dynamics (Caswell2001). Life history theory predicts that both survival andreproduction should decrease with age because of senes-cence, a decrease in functional capacities at old ages(Hamilton 1966, Comfort 1979). The study of senescencein wild populations has proven to be challenging because ofthe need for long-term monitoring of individuals. Evidencefor senescence has been reviewed by Bennett and Owens(2002) for birds and by Gaillard et al. (2003a) for largemammalian herbivores. Both studies concluded that senes-cence in survival and reproductive success is pervasive inthose species. Evidence for senescence in free-rangingpopulations of small mammals has been more limited(Slade 1995), but some studies reported decreased survival(Broussard et al. 2005) or reproduction (Morris 1996,Broussard et al. 2003) with increasing age.
We have been monitoring the survival and reproductiveperformance of individual North American red squirrels inthe southwestern Yukon for 15 years. Red squirrels areactive year round (Humphries et al. 2005), and do not storeenergy in the form of fat but rather cache conifer cones that
are collected in autumn (before they shed their seed) andstored unopened underground. Squirrels rely on this foodcache through winter and into the following spring. NorthAmerican red squirrels are part of a consumer�resourcepulse system, with the main food resource (i.e. seeds ofwhite spruce) exhibiting dramatic yearly variations (Boutinet al. 2006). Seed production is highly variable because theconifer trees in the area show mast behaviour and many lifehistory traits in this red squirrel population are stronglyaffected by seed production (Humphries and Boutin 2000,McAdam and Boutin 2003, Boutin et al. 2006).
Among the theories proposed to explain the occurrenceof senescence, the antagonistic pleiotropy theory (Williams1957) has received the most support in animals (Partridge2001). In the context of life history evolution, thisantagonistic pleiotropy theory involves a tradeoff betweena positive effect of genes at a young age and a negative effectof the same genes at old age that should shape age-specificallocation to reproduction. From a life history viewpoint,this has led to the concept of the disposable soma (Kirk-wood and Rose 1991). There should therefore be a directlink between senescence and reproductive tactics of in-dividuals (see Nussey et al. 2006 for a recent example in reddeer). Environmental conditions in the year of birth havebeen reported to influence reproductive tactics, so thatindividuals born in good years, or more generally in good
Oikos 117: 1406�1416, 2008
doi: 10.1111/j.2008.0030-1299.16545.x,
# 2008 The Authors. Journal compilation # 2008 Oikos
Subject Editor: John Vucetich. Accepted 25 April 2008
1406
environments, begin to reproduce earlier in life and/orbreed more intensively than individuals born in poor years(Langvatn et al. 1996, Forchhammer et al. 2001, Becker-man et al. 2003). These individuals might, however, pay thecost of a good start in terms of lower reproductive values atold ages (Alonso-Alvarez et al. 2006). The dramatic yearlyvariation in food supply for red squirrels in this population(Boutin et al. 2006) offered us a unique opportunity toinvestigate the influence of environmental conditionsduring early life on senescence patterns in a short-livedspecies.
Given the biology and life history of red squirrels, wemade the following predictions. First, given that redsquirrels are iteroparous vertebrates with age-structuredpopulations, we expected senescence to affect both repro-ductive and survival traits (Hamilton 1966, Charlesworth1994). Also, following Hamilton’s (1966) prediction andJones et al.’s (2008) empirical report of an increase in thestrength of senescence with decreasing generation length, wepredicted higher effects of senescence on survival andreproduction (i.e. a larger decrease in those traits withincreasing age) in red squirrels than in long-lived vertebratessuch as large mammals.
Male squirrels are only slightly (5�10%) larger thanfemales (Boutin and Larsen 1993), and have the sameduration of reproductive life as females. We thereforepredicted that males and females should experience similarrates of senescence (Clutton-Brock and Isvaran 2007).
Reproductive senescence in natural populations is gen-erally assessed through a decrease in reproductive success.However, senescent individuals may raise the same numberof offspring, although of lower quality (Kern et al. 2001).When simply considering the number of juveniles weanedby a female to assess reproductive senescence, the rate ofsenescence may thus be underestimated. We thus measuredwhether post-weaning survival of juvenile squirrels had anyrelation to age of their mother, with the assumption thatpost-weaning survival reflects the quality of juveniles. Wepredicted that post-weaning survival of juveniles producedby old females should be lower than that of juvenilesproduced by prime-aged females.
Lastly, we predicted that cohorts born during high foodyears should have higher senescence rates than cohorts bornduring low food years because high-food cohorts shouldreproduce earlier and more intensely than low-food cohorts,and thereby suffer higher reproductive costs (Kirkwood andRose 1991, Metcalfe and Monaghan 2001).
Methods
Study area and field methods
The study was conducted near Kluane Lake, Yukon,Canada (618N, 1388W) and began in 1987 (Berteaux andBoutin 2000, McAdam et al. 2007). We report results forthe years 1987�2003 for two 40 ha grids separated by theAlaska Highway. All squirrels were marked with numberedear tags and a unique color combination of wires foridentification at a distance. Fates of male and femalesquirrels were determined through live-trapping, visualobservations and/or radio-telemetry from April to August.
Reproductive females were weighed after parturition,and males and females were weighed each time they weretrapped (to the nearest gram with a pesola scale). Young ofthe year were counted, weighed, and sexed soon after birth,tagged and weighed at about 20�25 days of age, andweighed within a week of weaning (around 70 days of age).The average dispersal distance after weaning is less than100 m (Berteaux and Boutin 2000), so that most youngwere followed from birth to death. The habitat was borealforest with white spruce Picea glauca as the dominant treespecies and spruce seeds husked from cones were the mainfood resource (McAdam and Boutin 2003). Red squirrelsstore unopened cones at hoarding sites (middens) thatthey defend actively throughout the year. Food availablefor reproduction in a given year is a function of coneproduction the previous year (McAdam and Boutin 2003).We estimated spruce cone production each year, whencones were fully formed, but harvesting by squirrels had notyet begun (usually at the end of July). We counted thenumber of new cones in the top three meters of170 randomly selected trees. Average yearly cone produc-tion ranged from about 1 to 283 cones per tree (average60920 SE).
Analyses of the influence of age on mass andreproduction
Our data set included repeated measurements of the sameindividuals at different ages (from 1.3 to 2.4 measures perindividual on average, depending on the trait considered;range 1�6). We thus first fitted mixed models (with theMIXED procedure and GLIMMIX macro of SAS ver. 9,Littell et al. 1996) with individual identity included as arandom effect to take into account this non-independencein our data set and to avoid pseudo-replication problems(Hurlbert 1984). However, considering that linear modelswith and without a random effect of individual identity ledto the same results, and considering the small number ofobservations per individual, we also performed linearmodels without random effect to study age-specific varia-tion in mass (of adult males and females, and of juveniles atweaning), litter size (at birth and at weaning), and numberof juveniles recruited, and we only presented these results.We used the GLM and NLIN (to fit piecewise regressions,see below) procedures of SAS ver. 9 for the mass of malesand females, mass of juveniles at weaning, litter size at birthand number of recruited juveniles, and the NLMIXEDprocedure for the number of weaned juveniles. For traitsanalysed with the GLM and NLIN procedures (modelsbased on a normal error distribution), normality of residualswas assessed with Kolmogorov�Smirnov tests. A normalerror distribution was rejected only for litter size (mass offemales: p�0.15; mass of males: p�0.091; litter size atbirth: p�0.011; average mass of juveniles at weaning:p�0.15; number of recruited juveniles: p�0.15). How-ever, the Kolmogorov�Smirnov test is very conservative(Quinn and Keough 2002) and a graphical inspection ofresiduals plotted against fitted values of litter size did notreveal any tendency. We thus analyzed variation in litter sizeat birth with a normal error distribution. For the number ofweaned juvenile, we used a Poisson error distribution. The
1407
dispersion parameter (c) was close to 1 (c�1.13), indicat-ing negligible over-dispersion (Burnham and Anderson2002).
To assess age-dependence in the life history traits ofsquirrels, we fitted and compared a set of continuous(linear, quadratic, inverse effect of age) and discrete (two orthree age-classes) models (Table 1a). Each model considered(Table 1a) can be seen as a specific hypothesis regardingage-specific variation (Burnham and Anderson 2002) andsupport for models showing decreasing values with agecould be considered as evidence for the existence ofsenescence (Table 1a). Because there were many moreyoung individuals than old ones in our database, theselection of a significant negative quadratic effect for agiven trait could have arisen when the trait increased withage and then levelled of. Therefore, we also consideredpiecewise regression models that test for the existence ofbreakpoints, after which traits are declining (Toms andLesperance 2003). We fitted models with different thresh-old ages (i.e. breakpoint at age 3, 4, 5 or 6 years of age;Table 1a) with the NLIN and NLMIXED procedure inSAS ver. 9. We also fitted models including a quadratic or alinear effect of age before the breakpoint and a linear or noeffect of age after the breakpoint (Table 1a).
Model selection was based on the Akaike informationcriterion (AIC), as recommended when several non-nestedmodels have been fitted (Burnham and Anderson 2002).AIC-based model selection has proved to be a very efficientway to test ecological hypotheses and can be seen as a‘multiple working hypotheses’ framework (Chamberlin1890, Anderson et al. 2000). We based our model selectionon DAICc (difference in AICc, a variant of AIC correctedfor small sample sizes, between a given model and the modelwith lowest AICc) and models’ weight (wi). Wi measures therelative likelihood that a given model is the best among a setof models fitted (Burnham and Anderson 2002).
We first tested for an age effect on the mass of squirrels(used as a proxy of body condition). For females, weconsidered mass after parturition (taking litter size intoaccount) as these data were available for most females andwere standardized for the same breeding period. For males,we used the average mass in May because May was a periodof high trapping activity, and most males present on thestudy area were trapped at least once during this period. Wethen studied the effect of females’ age on litter size at birth(taking mother’s mass after parturition into account), onthe number of juveniles weaned (whether taking litter size atbirth into account or not) and on the juvenile mass atweaning (mean mass per litter after accounting for variationin litter size at birth). Finally, we investigated the effect ofmothers’ age on the number of juveniles recruited (i.e.number of juveniles weaned surviving to one year of age in agiven litter). We only included breeding females foranalyzing the age-variation in weaning success and onlyfemales who weaned at least one juvenile for analyzing theage variation in recruitment.
It has been found that old females bequeath all or part oftheir territory to their young more often than younger ones(Berteaux and Boutin 2000, Descamps et al. 2007). Thisbehaviour likely influenced survival of young after weaning.To test the effect of mother’s age on recruitment, we thusincluded in our models a factor called bequeathal thatdescribed mother’s behaviour at weaning (with threemodalities: female kept its territory, female gave part ofits territory to one or several of its juveniles, and female gaveall its territory to one or several of its juveniles).
No known-age individual �5 years old was present inthe study population before 1993 because tagging ofsquirrels started in 1987. Therefore, to account for potentialvariations in environmental conditions experienced bydifferent age-classes, we included in our models a discretevariable year.
Survival analyses
Survival analyses were carried out using capture�mark�recapture methods (Lebreton et al. 1992), implemented inthe software M-SURGE 1.7 (Choquet et al. 2004, 2005).Goodness-of-fit tests were performed with the softwareU-CARE (Choquet et al. 2003). As we focused onsenescence patterns, we only considered squirrels greaterthan one year of age. Our dataset consisted of 343 femalesand 216 males of known age, tagged as juveniles between1987 and 2001. Male and female data fitted the Cormack�Jolly�Seber model (females: x2
26�32.57, p�0.18; males:
Table 1. Relation of mass, survival and reproductive performance toage and food conditions in the year of birth in a population of NorthAmerican red squirrels, Kluane, Yukon, Canada.(a) Variables describing age effect used to test the shape of therelationship between life-history traits and age.
Age effect Notation
Full-age model: 8 classes(1 class per year)
age (8 classes)
linear regression agequadratic regression age�age2
inverse regression* 1/age1 juvenile class (1 year) and
1 adult class (]2 year)(yearling, adult)
1 prime-age class (1�6 years) and1 senescent class (]7 years)
(prime age 1�6,senescent ]7)
1 prime-age class (1�5 years) and1 senescent class (]6 years)
(prime age 1�5,senescent ]6)
1 prime-age class (1�4 years) and1 senescent class (]5 years)
(prime age 1�4,senescent ]5)
1 juvenile class (1 year),1 prime-age class (2�6 years),1 senescent class (]7 years)
(yearling, prime age 1�6,senescent ]7)
1 juvenile class (1 year),1 prime-age class (2�5 years),1 senescent class (]6 years)
(yearling, prime age 1�5,senescent ]6)
1juvenile class (1 year),1 prime-age class (2�4 years),1 senescent class (]5 years)
(yearling, prime age 1�4,senescent ]5)
Linear regression before and afterbreakpoint (a)$
(linear1�a�lineara�8)
Quadratic regression beforebreakpoint and linear after (a)$
(quad1�a�lineara�8)
Linear regression beforebreakpoint and constant after (a)$
(linear1�a�constant a�8)
Quadratic regression beforebreakpoint and constant after (a)$
(quad1�a�constanta�8)
*: this model corresponds to a non linear effect of age (increase inthe life history trait at the lowest ages gradually followed by aplateau at the highest ages).$: 4 different threshold (a) ages have been considered: 3, 4, 5 and 6years.
1408
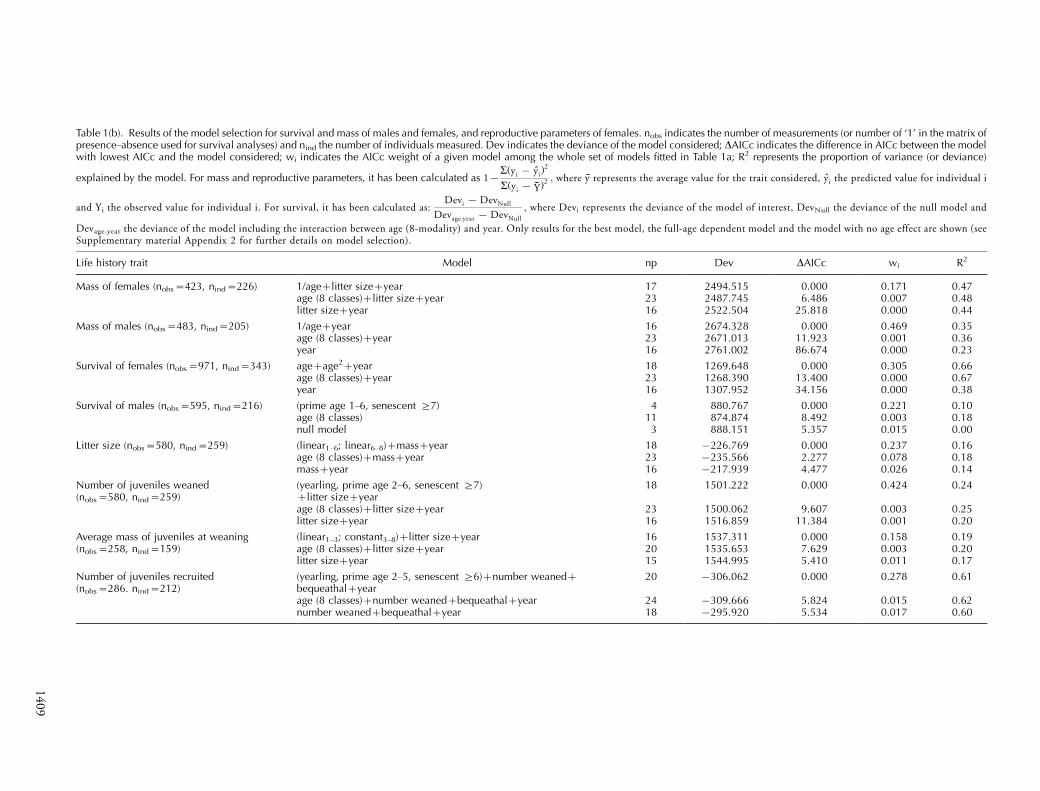
Table 1(b). Results of the model selection for survival and mass of males and females, and reproductive parameters of females. nobs indicates the number of measurements (or number of ‘1’ in the matrix ofpresence�absence used for survival analyses) and nind the number of individuals measured. Dev indicates the deviance of the model considered; DAICc indicates the difference in AICc between the modelwith lowest AICc and the model considered; wi indicates the AICc weight of a given model among the whole set of models fitted in Table 1a; R2 represents the proportion of variance (or deviance)
explained by the model. For mass and reproductive parameters, it has been calculated as 1�a(yi � yi)
2
a(yi � Y)2 ; where y represents the average value for the trait considered, yi the predicted value for individual i
and Yi the observed value for individual i. For survival, it has been calculated as:Devi � DevNull
Devage:year � DevNull
; where Devi represents the deviance of the model of interest, DevNull the deviance of the null model and
Devage.year the deviance of the model including the interaction between age (8-modality) and year. Only results for the best model, the full-age dependent model and the model with no age effect are shown (seeSupplementary material Appendix 2 for further details on model selection).
Life history trait Model np Dev DAICc wi R2
Mass of females (nobs�423, nind�226) 1/age�litter size�year 17 2494.515 0.000 0.171 0.47age (8 classes)�litter size�year 23 2487.745 6.486 0.007 0.48litter size�year 16 2522.504 25.818 0.000 0.44
Mass of males (nobs�483, nind�205) 1/age�year 16 2674.328 0.000 0.469 0.35age (8 classes)�year 23 2671.013 11.923 0.001 0.36year 16 2761.002 86.674 0.000 0.23
Survival of females (nobs�971, nind�343) age�age2�year 18 1269.648 0.000 0.305 0.66age (8 classes)�year 23 1268.390 13.400 0.000 0.67year 16 1307.952 34.156 0.000 0.38
Survival of males (nobs�595, nind�216) (prime age 1�6, senescent ]7) 4 880.767 0.000 0.221 0.10age (8 classes) 11 874.874 8.492 0.003 0.18null model 3 888.151 5.357 0.015 0.00
Litter size (nobs�580, nind�259) (linear1�6; linear6�8)�mass�year 18 �226.769 0.000 0.237 0.16age (8 classes)�mass�year 23 �235.566 2.277 0.078 0.18mass�year 16 �217.939 4.477 0.026 0.14
Number of juveniles weaned(nobs�580, nind�259)
(yearling, prime age 2�6, senescent ]7)�litter size�year
18 1501.222 0.000 0.424 0.24
age (8 classes)�litter size�year 23 1500.062 9.607 0.003 0.25litter size�year 16 1516.859 11.384 0.001 0.20
Average mass of juveniles at weaning(nobs�258, nind�159)
(linear1�3; constant3�8)�litter size�year 16 1537.311 0.000 0.158 0.19age (8 classes)�litter size�year 20 1535.653 7.629 0.003 0.20litter size�year 15 1544.995 5.410 0.011 0.17
Number of juveniles recruited(nobs�286. nind�212)
(yearling, prime age 2�5, senescent ]6)�number weaned�bequeathal�year
20 �306.062 0.000 0.278 0.61
age (8 classes)�number weaned�bequeathal�year 24 �309.666 5.824 0.015 0.62number weaned�bequeathal�year 18 �295.920 5.534 0.017 0.60
14
09
x233�28.56, p�0.69), which was thus used as a starting
point for model selection. Because preliminary analysesindicated that recapture probabilities and survival were sex-dependent, we analyzed age-specific variation in survival byconsidering sexes separately. We used trapping and visualobservations from mid-April to mid-June, which corre-sponded to a period of high trapping intensity (i.e. censusof all squirrels in the study area) to identify the individualcapture histories. As survival rates were the parameters ofinterest in our study, we first modelled capture rates to havemore statistical power when modeling survival (Lebretonet al. 1992). We compared among models with constant,time-dependent, age-dependent capture rates and capturerates that were a function of capture effort (defined as theaverage number of times squirrels were captured every yearbetween mid-April and mid-June). For males, the selectedmodel included capture rates that were a function of captureeffort, and for females, the selected model included constantcapture rates (average capture rates9SE were 0.8890.02and 0.9590.01 for males and females, respectively; Supple-mentary material Appendix 1). As for analyses of massand reproduction, model selection was based on DAICc andweights of models (Burnham and Anderson 2002), andnotation and biological meaning of models are reported inTable 1a.
Analyses of cohort effects
To investigate how food conditions in the year of birthinfluenced patterns of age-specific variation, we included inthe previously retained models a variable describing foodconditions during rearing (i.e. cone production the yearbefore birth, McAdam and Boutin 2003). For each trait, wecompared a model with no cohort effect, a model with anadditive effect of cohort, and a model with interactiveeffects between age and cohort, based on AICc. FollowingMcAdam and Boutin (2003), we considered as high-foodcohorts squirrels born in years when previous coneproduction was �50 cones tree�1 (range: 73�283 conestree�1; 5 years out of 17), and as low-food cohorts squirrelsborn in years when previous cone production was B50cones tree�1 (range: 1�47 cones tree�1; 12 years out of17).
All results are reported as mean9SE.
Results
Effects of age on mass
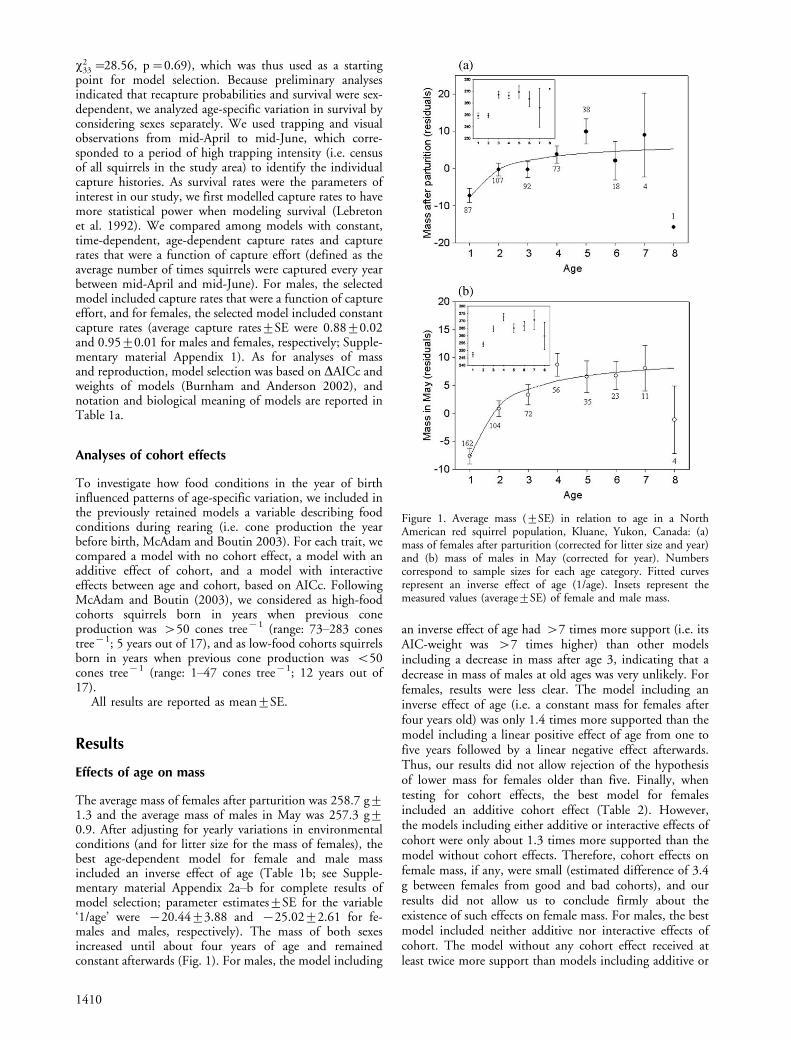
The average mass of females after parturition was 258.7 g91.3 and the average mass of males in May was 257.3 g90.9. After adjusting for yearly variations in environmentalconditions (and for litter size for the mass of females), thebest age-dependent model for female and male massincluded an inverse effect of age (Table 1b; see Supple-mentary material Appendix 2a�b for complete results ofmodel selection; parameter estimates9SE for the variable‘1/age’ were �20.4493.88 and �25.0292.61 for fe-males and males, respectively). The mass of both sexesincreased until about four years of age and remainedconstant afterwards (Fig. 1). For males, the model including
an inverse effect of age had �7 times more support (i.e. itsAIC-weight was �7 times higher) than other modelsincluding a decrease in mass after age 3, indicating that adecrease in mass of males at old ages was very unlikely. Forfemales, results were less clear. The model including aninverse effect of age (i.e. a constant mass for females afterfour years old) was only 1.4 times more supported than themodel including a linear positive effect of age from one tofive years followed by a linear negative effect afterwards.Thus, our results did not allow rejection of the hypothesisof lower mass for females older than five. Finally, whentesting for cohort effects, the best model for femalesincluded an additive cohort effect (Table 2). However,the models including either additive or interactive effects ofcohort were only about 1.3 times more supported than themodel without cohort effects. Therefore, cohort effects onfemale mass, if any, were small (estimated difference of 3.4g between females from good and bad cohorts), and ourresults did not allow us to conclude firmly about theexistence of such effects on female mass. For males, the bestmodel included neither additive nor interactive effects ofcohort. The model without any cohort effect received atleast twice more support than models including additive or
Figure 1. Average mass (9SE) in relation to age in a NorthAmerican red squirrel population, Kluane, Yukon, Canada: (a)mass of females after parturition (corrected for litter size and year)and (b) mass of males in May (corrected for year). Numberscorrespond to sample sizes for each age category. Fitted curvesrepresent an inverse effect of age (1/age). Insets represent themeasured values (average9SE) of female and male mass.
1410

interactive cohort effects (Table 2), indicating that foodconditions in the year of birth did not influence male mass.
Effects of age on survival
Female survivalFemale survival showed clear age-variation and decreasedfrom three years of age onwards (Fig. 2). The modelcontrolling for year effects and including a quadratic effectof age (Table 1b; Supplementary material Appendix 2c) hadthe highest statistical support (AICc weight of 0.305),whereas all models that did not include a decrease insurvival with age had no support at all (AICc weights lessthan 0.001). This strongly supports the existence of survivalsenescence in female red squirrels. Female survival decreasedby about 29% between 4 and 6 years of age, and then byabout 70% between 6 and 8 years (Fig. 2). Food conditionsin the year of birth did not influence female survival (i.e.models including additive or interactive cohort effects wereat least 2.3 times less supported than the model withoutcohort effect; Table 2).
Male survivalSurvival of males decreased at oldest ages (Fig. 2) and didnot show significant yearly variations. The model with twoage classes (1�7 and ]7 years old) provided the best fit tothe data (Table 1b; Supplementary material Appendix 2d).This model was more than 14 times more supported than
any model that did not include a decrease in survival,indicating strong evidence of senescence in male survival.Survival of prime-age males was 47% higher than that ofold males (Fig. 2). Food conditions in the year of birth didnot influence male survival as models including eitheradditive or interactive cohort effects were at least 2.75 timesless supported than the model without any cohort effect(Table 2).
Effects of age on female reproductive traits
Litter sizeLitter size at birth varied from one to six, with an average of3.0090.04, and was age-dependent. After adjusting foryearly variations in environmental conditions and for themass of mothers, the best model of litter size variationsincluded a linear increase with mother’s age until six years,followed by a linear decrease (Fig. 3a; Table 1b; seeSupplementary material Appendix 2e for complete resultsof model selection; parameter estimates9SE for thevariable ‘age’ before and after six years old, respectively:0.07190.031 and �0.6890.29). This model receivedmore than four times more support than any model that didnot include senescence. However, the observed decrease inlitter size at birth after 6 years of age was driven by the verysmall litter size of one single 8-years old female (Fig. 3a).
When testing for cohort effects, the best model includedinteractive effects of food conditions in the year of birth andage (Table 2), indicating that females from high-food
Table 2. Effect of food conditions in the year of birth on mass, survival (of both sexes), and reproductive parameters (of females) in apopulation of North American red squirrels, Kluane, Yukon. Cohort represents a two-level variable (i.e. high-food and low-food cohorts,based on the food availability during early life). Dev indicates the deviance of the model considered; DAICc indicates the difference in AICcbetween the model with lowest AICc and the model considered; wi indicates the AICc weight of a given model (calculated considering only aset of three models: the model without any cohort effect, the model with an additive cohort effect, and the model with a cohort effect and aninteraction between age and cohort).
Trait Model np Dev DAICc wi
Mass of females 1/age�litter size�year 17 2494.515 0.575 0.2761/age�litter size�year�cohort 18 2491.758 0.000 0.3681/age�litter size�year�cohort�cohort�age 19 2489.627 0.062 0.356
Mass of males 1/age�year 17 2398.222 0.000 0.523
1/age�year�cohort 18 2397.442 1.378 0.2601/age�year�cohort�cohort�age 19 2395.607 1.710 0.217
Survival of females age�age2�year 18 1269.648 0.000 0.664age�age2�year�cohort 19 1269.266 1.699 0.284age�age2�year�cohort�cohort�age 21 1268.506 5.114 0.052
Survival of males (prime age 1�6, senescent ]7)�year 4 880.767 0.000 0.649(prime age 1�6, senescent ]7)�year�cohort 5 880.766 2.020 0.236(prime age 1�6, senescent ]7) �year�cohort�cohort�age 6 880.196 3.475 0.114
Litter size (linear1�6; linear6�8)�mass�year 18 �226.769 3.227 0.157(linear1�6; linear6�8)�mass�year�cohort 19 �226.818 5.370 0.054(linear1�6; linear6�8)�mass�year�cohort�cohort�age 21 �236.606 0.000 0.789
Number of juvenilesweaned
(yearling, prime age 2�6, senescent ]7)�litter size�year 18 1501.222 0.000 0.681(yearling, prime age 2�6, senescent ]7)�litter size�year�cohort 19 1501.039 1.954 0.256(yearling, prime age 2�6, senescent ]7)�litter size�year�cohort�cohort�age
21 1499.561 4.775 0.063
Average mass ofjuveniles at weaning
(linear1�3; constant3�8)�litter size�year 16 1537.311 0.000 0.694(linear1�3; constant3�8)�litter size�year�cohort 17 1537.261 2.242 0.226(linear1�3; constant3�8)�litter size�year�cohort�cohort�age 18 1537.019 4.312 0.080
Number of juvenilesrecruited
(yearling, prime age 2�5, senescent ]6)�number weaned�bequeathal�year
20 �306.062 0.000 0.472
(yearling, prime age 2�5, senescent ]6)�number weaned�bequeathal�year�cohort
21 �308.227 0.165 0.435
(yearling, prime age 2�5, senescent ]6)�number weaned�bequeathal�year�cohort�cohort�age
23 �309.846 3.260 0.093
1411
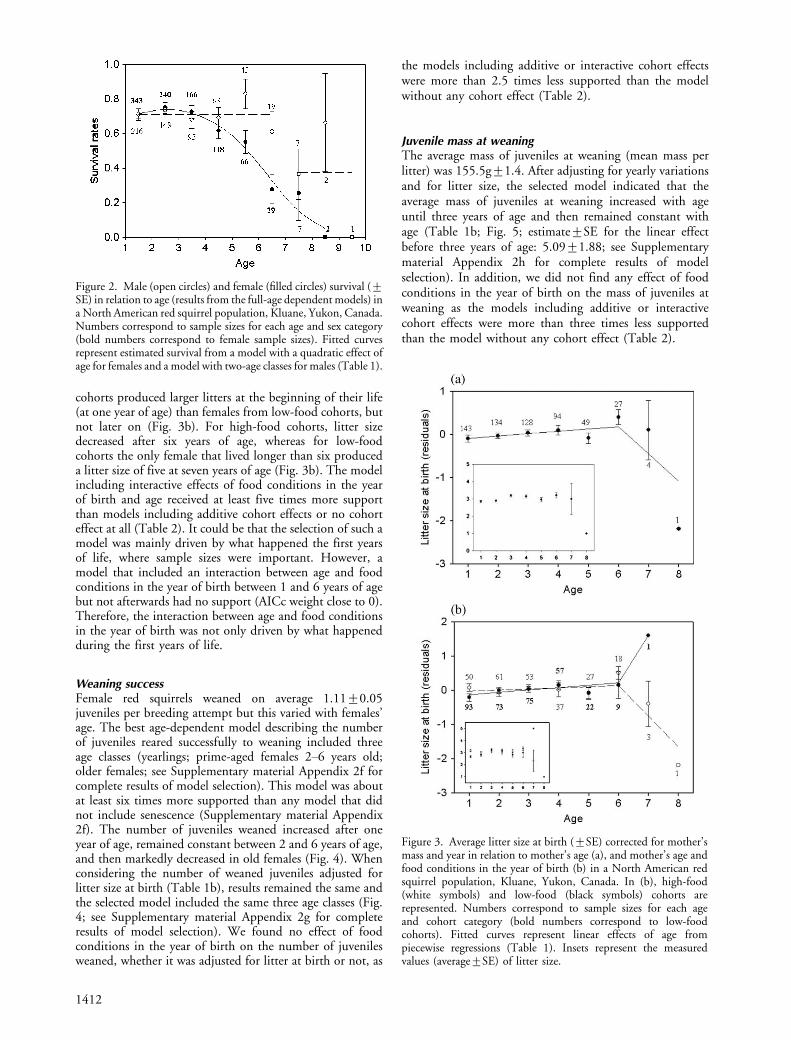
cohorts produced larger litters at the beginning of their life(at one year of age) than females from low-food cohorts, butnot later on (Fig. 3b). For high-food cohorts, litter sizedecreased after six years of age, whereas for low-foodcohorts the only female that lived longer than six produceda litter size of five at seven years of age (Fig. 3b). The modelincluding interactive effects of food conditions in the yearof birth and age received at least five times more supportthan models including additive cohort effects or no cohorteffect at all (Table 2). It could be that the selection of such amodel was mainly driven by what happened the first yearsof life, where sample sizes were important. However, amodel that included an interaction between age and foodconditions in the year of birth between 1 and 6 years of agebut not afterwards had no support (AICc weight close to 0).Therefore, the interaction between age and food conditionsin the year of birth was not only driven by what happenedduring the first years of life.
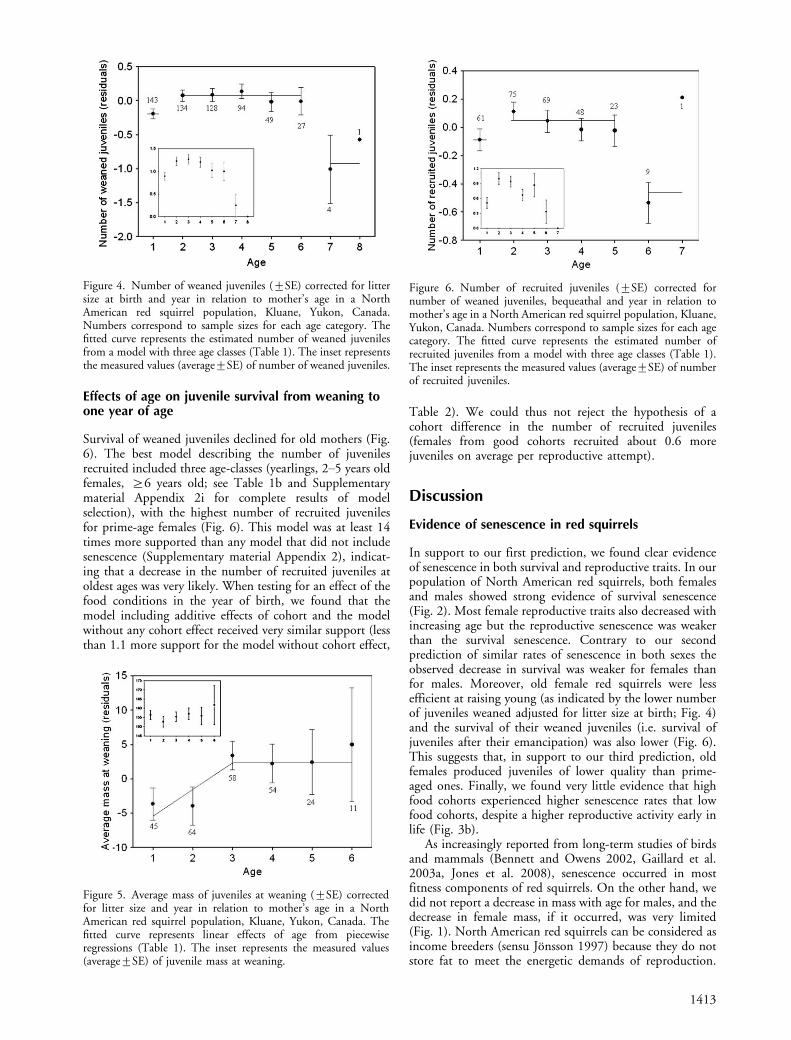
Weaning successFemale red squirrels weaned on average 1.1190.05juveniles per breeding attempt but this varied with females’age. The best age-dependent model describing the numberof juveniles reared successfully to weaning included threeage classes (yearlings; prime-aged females 2�6 years old;older females; see Supplementary material Appendix 2f forcomplete results of model selection). This model was aboutat least six times more supported than any model that didnot include senescence (Supplementary material Appendix2f). The number of juveniles weaned increased after oneyear of age, remained constant between 2 and 6 years of age,and then markedly decreased in old females (Fig. 4). Whenconsidering the number of weaned juveniles adjusted forlitter size at birth (Table 1b), results remained the same andthe selected model included the same three age classes (Fig.4; see Supplementary material Appendix 2g for completeresults of model selection). We found no effect of foodconditions in the year of birth on the number of juvenilesweaned, whether it was adjusted for litter at birth or not, as
the models including additive or interactive cohort effectswere more than 2.5 times less supported than the modelwithout any cohort effect (Table 2).
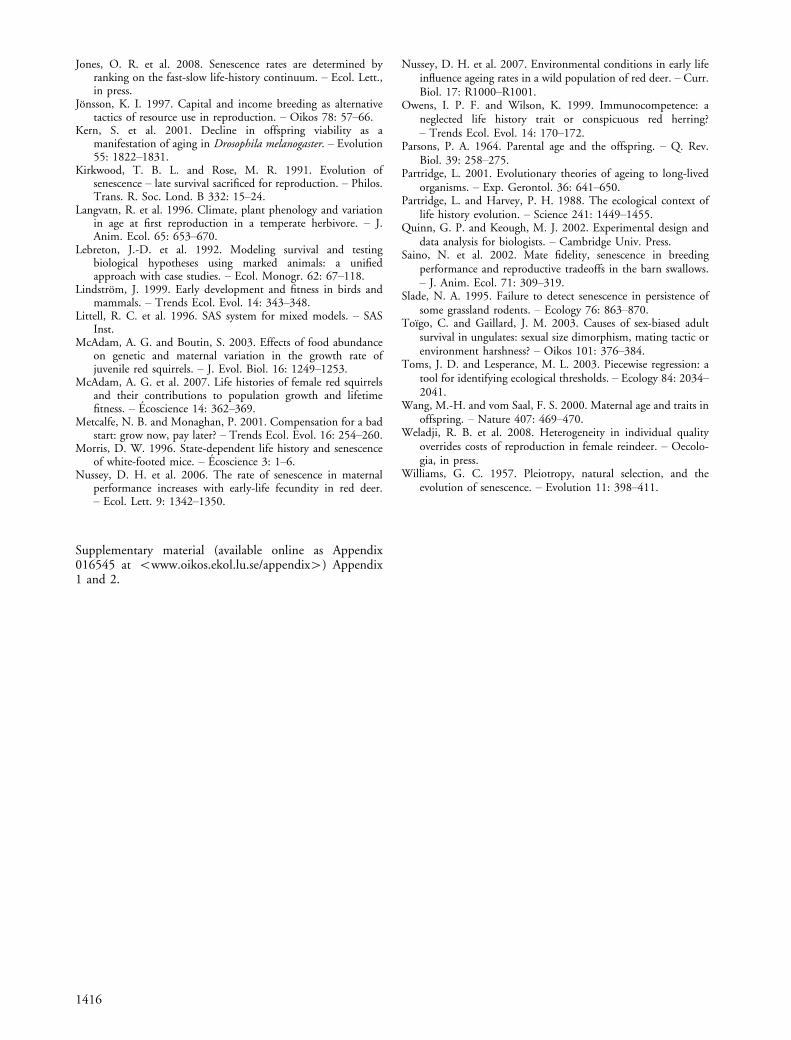
Juvenile mass at weaningThe average mass of juveniles at weaning (mean mass perlitter) was 155.5g91.4. After adjusting for yearly variationsand for litter size, the selected model indicated that theaverage mass of juveniles at weaning increased with ageuntil three years of age and then remained constant withage (Table 1b; Fig. 5; estimate9SE for the linear effectbefore three years of age: 5.0991.88; see Supplementarymaterial Appendix 2h for complete results of modelselection). In addition, we did not find any effect of foodconditions in the year of birth on the mass of juveniles atweaning as the models including additive or interactivecohort effects were more than three times less supportedthan the model without any cohort effect (Table 2).
Figure 2. Male (open circles) and female (filled circles) survival (9SE) in relation to age (results from the full-age dependent models) ina North American red squirrel population, Kluane, Yukon, Canada.Numbers correspond to sample sizes for each age and sex category(bold numbers correspond to female sample sizes). Fitted curvesrepresent estimated survival from a model with a quadratic effect ofage for females and a model with two-age classes for males (Table 1).
Figure 3. Average litter size at birth (9SE) corrected for mother’smass and year in relation to mother’s age (a), and mother’s age andfood conditions in the year of birth (b) in a North American redsquirrel population, Kluane, Yukon, Canada. In (b), high-food(white symbols) and low-food (black symbols) cohorts arerepresented. Numbers correspond to sample sizes for each ageand cohort category (bold numbers correspond to low-foodcohorts). Fitted curves represent linear effects of age frompiecewise regressions (Table 1). Insets represent the measuredvalues (average9SE) of litter size.
1412
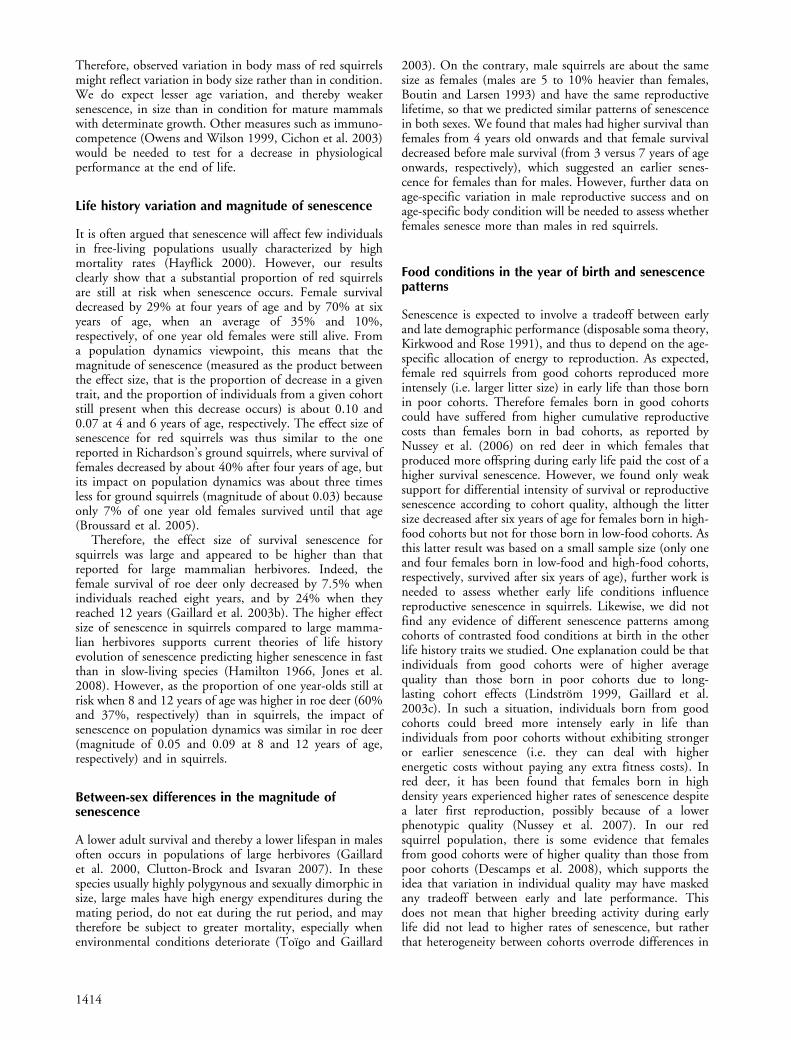
Effects of age on juvenile survival from weaning toone year of age
Survival of weaned juveniles declined for old mothers (Fig.6). The best model describing the number of juvenilesrecruited included three age-classes (yearlings, 2�5 years oldfemales, ]6 years old; see Table 1b and Supplementarymaterial Appendix 2i for complete results of modelselection), with the highest number of recruited juvenilesfor prime-age females (Fig. 6). This model was at least 14times more supported than any model that did not includesenescence (Supplementary material Appendix 2), indicat-ing that a decrease in the number of recruited juveniles atoldest ages was very likely. When testing for an effect of thefood conditions in the year of birth, we found that themodel including additive effects of cohort and the modelwithout any cohort effect received very similar support (lessthan 1.1 more support for the model without cohort effect,
Table 2). We could thus not reject the hypothesis of acohort difference in the number of recruited juveniles(females from good cohorts recruited about 0.6 morejuveniles on average per reproductive attempt).
Discussion
Evidence of senescence in red squirrels
In support to our first prediction, we found clear evidenceof senescence in both survival and reproductive traits. In ourpopulation of North American red squirrels, both femalesand males showed strong evidence of survival senescence(Fig. 2). Most female reproductive traits also decreased withincreasing age but the reproductive senescence was weakerthan the survival senescence. Contrary to our secondprediction of similar rates of senescence in both sexes theobserved decrease in survival was weaker for females thanfor males. Moreover, old female red squirrels were lessefficient at raising young (as indicated by the lower numberof juveniles weaned adjusted for litter size at birth; Fig. 4)and the survival of their weaned juveniles (i.e. survival ofjuveniles after their emancipation) was also lower (Fig. 6).This suggests that, in support to our third prediction, oldfemales produced juveniles of lower quality than prime-aged ones. Finally, we found very little evidence that highfood cohorts experienced higher senescence rates that lowfood cohorts, despite a higher reproductive activity early inlife (Fig. 3b).
As increasingly reported from long-term studies of birdsand mammals (Bennett and Owens 2002, Gaillard et al.2003a, Jones et al. 2008), senescence occurred in mostfitness components of red squirrels. On the other hand, wedid not report a decrease in mass with age for males, and thedecrease in female mass, if it occurred, was very limited(Fig. 1). North American red squirrels can be considered asincome breeders (sensu Jonsson 1997) because they do notstore fat to meet the energetic demands of reproduction.
Figure 4. Number of weaned juveniles (9SE) corrected for littersize at birth and year in relation to mother’s age in a NorthAmerican red squirrel population, Kluane, Yukon, Canada.Numbers correspond to sample sizes for each age category. Thefitted curve represents the estimated number of weaned juvenilesfrom a model with three age classes (Table 1). The inset representsthe measured values (average9SE) of number of weaned juveniles.
Figure 5. Average mass of juveniles at weaning (9SE) correctedfor litter size and year in relation to mother’s age in a NorthAmerican red squirrel population, Kluane, Yukon, Canada. Thefitted curve represents linear effects of age from piecewiseregressions (Table 1). The inset represents the measured values(average9SE) of juvenile mass at weaning.
Figure 6. Number of recruited juveniles (9SE) corrected fornumber of weaned juveniles, bequeathal and year in relation tomother’s age in a North American red squirrel population, Kluane,Yukon, Canada. Numbers correspond to sample sizes for each agecategory. The fitted curve represents the estimated number ofrecruited juveniles from a model with three age classes (Table 1).The inset represents the measured values (average9SE) of numberof recruited juveniles.
1413
Therefore, observed variation in body mass of red squirrelsmight reflect variation in body size rather than in condition.We do expect lesser age variation, and thereby weakersenescence, in size than in condition for mature mammalswith determinate growth. Other measures such as immuno-competence (Owens and Wilson 1999, Cichon et al. 2003)would be needed to test for a decrease in physiologicalperformance at the end of life.
Life history variation and magnitude of senescence
It is often argued that senescence will affect few individualsin free-living populations usually characterized by highmortality rates (Hayflick 2000). However, our resultsclearly show that a substantial proportion of red squirrelsare still at risk when senescence occurs. Female survivaldecreased by 29% at four years of age and by 70% at sixyears of age, when an average of 35% and 10%,respectively, of one year old females were still alive. Froma population dynamics viewpoint, this means that themagnitude of senescence (measured as the product betweenthe effect size, that is the proportion of decrease in a giventrait, and the proportion of individuals from a given cohortstill present when this decrease occurs) is about 0.10 and0.07 at 4 and 6 years of age, respectively. The effect size ofsenescence for red squirrels was thus similar to the onereported in Richardson’s ground squirrels, where survival offemales decreased by about 40% after four years of age, butits impact on population dynamics was about three timesless for ground squirrels (magnitude of about 0.03) becauseonly 7% of one year old females survived until that age(Broussard et al. 2005).
Therefore, the effect size of survival senescence forsquirrels was large and appeared to be higher than thatreported for large mammalian herbivores. Indeed, thefemale survival of roe deer only decreased by 7.5% whenindividuals reached eight years, and by 24% when theyreached 12 years (Gaillard et al. 2003b). The higher effectsize of senescence in squirrels compared to large mamma-lian herbivores supports current theories of life historyevolution of senescence predicting higher senescence in fastthan in slow-living species (Hamilton 1966, Jones et al.2008). However, as the proportion of one year-olds still atrisk when 8 and 12 years of age was higher in roe deer (60%and 37%, respectively) than in squirrels, the impact ofsenescence on population dynamics was similar in roe deer(magnitude of 0.05 and 0.09 at 8 and 12 years of age,respectively) and in squirrels.
Between-sex differences in the magnitude ofsenescence
A lower adult survival and thereby a lower lifespan in malesoften occurs in populations of large herbivores (Gaillardet al. 2000, Clutton-Brock and Isvaran 2007). In thesespecies usually highly polygynous and sexually dimorphic insize, large males have high energy expenditures during themating period, do not eat during the rut period, and maytherefore be subject to greater mortality, especially whenenvironmental conditions deteriorate (Toıgo and Gaillard
2003). On the contrary, male squirrels are about the samesize as females (males are 5 to 10% heavier than females,Boutin and Larsen 1993) and have the same reproductivelifetime, so that we predicted similar patterns of senescencein both sexes. We found that males had higher survival thanfemales from 4 years old onwards and that female survivaldecreased before male survival (from 3 versus 7 years of ageonwards, respectively), which suggested an earlier senes-cence for females than for males. However, further data onage-specific variation in male reproductive success and onage-specific body condition will be needed to assess whetherfemales senesce more than males in red squirrels.
Food conditions in the year of birth and senescencepatterns
Senescence is expected to involve a tradeoff between earlyand late demographic performance (disposable soma theory,Kirkwood and Rose 1991), and thus to depend on the age-specific allocation of energy to reproduction. As expected,female red squirrels from good cohorts reproduced moreintensely (i.e. larger litter size) in early life than those bornin poor cohorts. Therefore females born in good cohortscould have suffered from higher cumulative reproductivecosts than females born in bad cohorts, as reported byNussey et al. (2006) on red deer in which females thatproduced more offspring during early life paid the cost of ahigher survival senescence. However, we found only weaksupport for differential intensity of survival or reproductivesenescence according to cohort quality, although the littersize decreased after six years of age for females born in high-food cohorts but not for those born in low-food cohorts. Asthis latter result was based on a small sample size (only oneand four females born in low-food and high-food cohorts,respectively, survived after six years of age), further work isneeded to assess whether early life conditions influencereproductive senescence in squirrels. Likewise, we did notfind any evidence of different senescence patterns amongcohorts of contrasted food conditions at birth in the otherlife history traits we studied. One explanation could be thatindividuals from good cohorts were of higher averagequality than those born in poor cohorts due to long-lasting cohort effects (Lindstrom 1999, Gaillard et al.2003c). In such a situation, individuals born from goodcohorts could breed more intensely early in life thanindividuals from poor cohorts without exhibiting strongeror earlier senescence (i.e. they can deal with higherenergetic costs without paying any extra fitness costs). Inred deer, it has been found that females born in highdensity years experienced higher rates of senescence despitea later first reproduction, possibly because of a lowerphenotypic quality (Nussey et al. 2007). In our redsquirrel population, there is some evidence that femalesfrom good cohorts were of higher quality than those frompoor cohorts (Descamps et al. 2008), which supports theidea that variation in individual quality may have maskedany tradeoff between early and late performance. Thisdoes not mean that higher breeding activity during earlylife did not lead to higher rates of senescence, but ratherthat heterogeneity between cohorts overrode differences in
1414

reproductive costs (see Weladji et al. 2008 for similarfindings on large herbivores).
Intergenerational effects of senescence: age ofmother and quality of juveniles
Weaned juveniles born to old females (]six years old) had alower survival to one year of age than weaned juveniles bornto prime-age females, which suggests that old femalesproduced juveniles of lower quality. Such decreases inoffspring quality as mothers age have been reported ininsects (Kern et al. 2001), rodents studied in laboratory(Wang and vom Saal 2000), cattle (Fuerst-Waltl et al.2004), deer (DelGuidice et al. 2007), humans (Parsons1964), and birds (Saino et al. 2002). Nevertheless, evidenceof intergenerational effects of mother’s age in free-livingpopulations of vertebrates is still scarce despite its evolu-tionary and demographic importance (Kern et al. 2001).Indeed, when simply considering the number of juvenilesweaned by a female to assess reproductive senescence, theoverall decrease in reproductive values at oldest ages may beunderestimated. For females in our red squirrel population,senescence was expressed in three different ways: a decreasein survival, a decrease in reproductive success and a decreasein the quality of offspring produced.
Acknowledgements � Field data collection was supported by grantsto SB from the Natural Sciences and Engineering ResearchCouncil of Canada (NSERC). Data analyses were supported bya grant to DB from NSERC and the Canada Research Chairs(CRC) program. We wish to thank the summer research assistantswho collected the long-term data, Mike Blower, Susan Antpoehler,Ainsley Sykes and Elizabeth Anderson who served as headtechnicians over the study and Geraldine Mabille, Marco Festa-Bianchet and Bob Ricklefs for very helpful comments on firstdrafts of the manuscript. This is publication no. 40 of the KluaneRed Squirrel Project.
References
Alonso-Alvarez, C. et al. 2006. An experimental manipulation oflife-history trajectories and resistance to oxidative stress.� Evolution 60: 1913�1924.
Anderson, D. R. et al. 2000. Null hypothesis testing: problems,prevalence, and an alternative. � J. Wildlife Manage. 64: 912�923.
Beckerman, A. P. et al. 2003. Talkin’ bout my generation:environmental variability and cohort effects. � Am. Nat. 162:754�767.
Bennett, P. M. and Owens, I. P. F. 2002. Evolutionary ecology ofbirds. � Oxford Univ. Press.
Berteaux, D. and Boutin, S. 2000. Breeding dispersal in femaleNorth American red squirrels. � Ecology 81: 1311�1326.
Boutin, S. and Larsen, K. W. 1993. Does food availability affectgrowth and survival of males and females differently in apromiscuous small mammal, Tamiasciurus hudsonicus? � J.Anim. Ecol. 62: 364�370.
Boutin, S. et al. 2006. Anticipatory reproduction and populationgrowth in seed predators. � Science 314: 1928�1930.
Broussard, D. R. et al. 2003. Senescence and age-relatedreproduction of female Columbian ground squirrels. � J.Anim. Ecol. 72: 212�219.
Broussard, D. R. et al. 2005. Somatic senescence: evidence fromfemale Richardson’s ground squirrels. � Oikos 108: 591�601.
Burnham, K. P. and Anderson, D. R. 2002. Model selection andmultimodel inference: a practical information-theoretic ap-proach. � Springer.
Caswell, H. 2001. Matrix population models: construction,analysis, and interpretation. � Sinauer.
Chamberlin, T. C. 1890. The method of multiple workinghypotheses. � Science XV: 92�96.
Charlesworth, B. 1994. Evolution in age-structured populations.� Cambridge Univ. Press.
Choquet, R. et al. 2003. User’s manual for U-CARE� mimeographed document, CEFE/CNRS, Montpellier(Bftp://ftp.cefe.cnrs-mop.fr/biom/Soft-CR�).
Choquet, R. et al. 2004. M-Surge: new software specificallydesigned for multistate capture-recapture models. � Anim.Biodiv. Conserv. 27: 207�215.
Choquet, R. et al. 2005. M-SURGE 1.7 user’s manual. � CEFE-CNRS, Montpellier (Bhttp://ftp.cefe.cnrs.fr/biom/Soft-CR/�).
Cichon, M. et al. 2003. Age-related decline in humoral immunefunction in collared flycatchers. � J. Evol. Ecol. 16: 1205�1210.
Clutton-Brock, T. H. and Isvaran, K. 2007. Sex differences inageing in natural populations of vertebrates. � Proc. R. Soc.Lond. B 274: 3097�3104.
Comfort, A. 1979. The biology of senescence. � Elsevier.DelGuidice, G. D. et al. 2007. Age-specific fertility and fecundity
in northern free-ranging white-tailed deer: evidence forreproductive senescence? � J. Mammal. 88: 427�435.
Descamps, S. et al. 2007. Female red squirrels fit William’shypothesis of increasing reproductive effort with increasingage. � J. Anim. Ecol. 76: 1192�1201.
Descamps, S. et al. 2008. Cohort effects in red squirrels: theinfluence of density, food abundance and temperature onfuture survival and reproductive success. � J. Anim. Ecol. 77:305�314.
Forchhammer, M. C. et al. 2001. Climate and population densityinduce long-term cohort variation in a northern ungulate. � J.Anim. Ecol. 70: 721�729.
Fuerst-Waltl, B. et al. 2004. Effect of maternal age on milkproduction traits, fertility, and longevity in cattle. � J. DairySci. 87: 2293�2298.
Gaillard, J.-M. et al. 2000. Temporal variation in fitnesscomponents and population dynamics of large herbivores.� Annu. Rev. Ecol. Syst. 31: 367�393.
Gaillard, J.-M. et al. 2003a. Ecological correlates of life span inpopulations of large herbivorous mammals. � Popul. Dev.Rev. 29 (Suppl.): 39�56.
Gaillard, J. M. et al. 2003b. Effects of hurricane Lothar on thepopulation dynamics of European roe deer. � J. WildlifeManage. 67: 767�773.
Gaillard, J. M. et al. 2003c. Cohort effects and deer populationdynamics. � Ecoscience 10: 412�420.
Hamilton, W. D. 1966. The moulding of senescence by naturalselection. � J. Theor. Biol. 12: 12�45.
Hayflick, L. 2000. The future of ageing. � Nature 408: 267�269.Humphries, M. M. and Boutin, S. 2000. The determinants of
optimal litter size in free-ranging red squirrels. � Ecology 81:2867�2877.
Humphries, M. M. et al. 2005. Expenditure freeze: the metabolicresponse of small mammals to cold environments. � Ecol.Letters 8: 1326�1333.
Hurlbert, S. H. 1984. Pseudoreplication and the design ofecological field experiments. � Ecol. Monographs 54: 187�211.
1415
Jones, O. R. et al. 2008. Senescence rates are determined byranking on the fast-slow life-history continuum. � Ecol. Lett.,in press.
Jonsson, K. I. 1997. Capital and income breeding as alternativetactics of resource use in reproduction. � Oikos 78: 57�66.
Kern, S. et al. 2001. Decline in offspring viability as amanifestation of aging in Drosophila melanogaster. � Evolution55: 1822�1831.
Kirkwood, T. B. L. and Rose, M. R. 1991. Evolution ofsenescence � late survival sacrificed for reproduction. � Philos.Trans. R. Soc. Lond. B 332: 15�24.
Langvatn, R. et al. 1996. Climate, plant phenology and variationin age at first reproduction in a temperate herbivore. � J.Anim. Ecol. 65: 653�670.
Lebreton, J.-D. et al. 1992. Modeling survival and testingbiological hypotheses using marked animals: a unifiedapproach with case studies. � Ecol. Monogr. 62: 67�118.
Lindstrom, J. 1999. Early development and fitness in birds andmammals. � Trends Ecol. Evol. 14: 343�348.
Littell, R. C. et al. 1996. SAS system for mixed models. � SASInst.
McAdam, A. G. and Boutin, S. 2003. Effects of food abundanceon genetic and maternal variation in the growth rate ofjuvenile red squirrels. � J. Evol. Biol. 16: 1249�1253.
McAdam, A. G. et al. 2007. Life histories of female red squirrelsand their contributions to population growth and lifetimefitness. � Ecoscience 14: 362�369.
Metcalfe, N. B. and Monaghan, P. 2001. Compensation for a badstart: grow now, pay later? � Trends Ecol. Evol. 16: 254�260.
Morris, D. W. 1996. State-dependent life history and senescenceof white-footed mice. � Ecoscience 3: 1�6.
Nussey, D. H. et al. 2006. The rate of senescence in maternalperformance increases with early-life fecundity in red deer.� Ecol. Lett. 9: 1342�1350.
Nussey, D. H. et al. 2007. Environmental conditions in early lifeinfluence ageing rates in a wild population of red deer. � Curr.Biol. 17: R1000�R1001.
Owens, I. P. F. and Wilson, K. 1999. Immunocompetence: aneglected life history trait or conspicuous red herring?� Trends Ecol. Evol. 14: 170�172.
Parsons, P. A. 1964. Parental age and the offspring. � Q. Rev.Biol. 39: 258�275.
Partridge, L. 2001. Evolutionary theories of ageing to long-livedorganisms. � Exp. Gerontol. 36: 641�650.
Partridge, L. and Harvey, P. H. 1988. The ecological context oflife history evolution. � Science 241: 1449�1455.
Quinn, G. P. and Keough, M. J. 2002. Experimental design anddata analysis for biologists. � Cambridge Univ. Press.
Saino, N. et al. 2002. Mate fidelity, senescence in breedingperformance and reproductive tradeoffs in the barn swallows.� J. Anim. Ecol. 71: 309�319.
Slade, N. A. 1995. Failure to detect senescence in persistence ofsome grassland rodents. � Ecology 76: 863�870.
Toıgo, C. and Gaillard, J. M. 2003. Causes of sex-biased adultsurvival in ungulates: sexual size dimorphism, mating tactic orenvironment harshness? � Oikos 101: 376�384.
Toms, J. D. and Lesperance, M. L. 2003. Piecewise regression: atool for identifying ecological thresholds. � Ecology 84: 2034�2041.
Wang, M.-H. and vom Saal, F. S. 2000. Maternal age and traits inoffspring. � Nature 407: 469�470.
Weladji, R. B. et al. 2008. Heterogeneity in individual qualityoverrides costs of reproduction in female reindeer. � Oecolo-gia, in press.
Williams, G. C. 1957. Pleiotropy, natural selection, and theevolution of senescence. � Evolution 11: 398�411.
Supplementary material (available online as Appendix016545 at Bwww.oikos.ekol.lu.se/appendix�) Appendix1 and 2.
1416
Related Documents