International Journal of Industrial Ergonomics 28 (2001) 153–163 Age-related decline in color perception and difficulties with daily activities–measurement, questionnaire, optical and computer-graphics simulation studies Keiko Ishihara a, *, Shigekazu Ishihara a , Mitsuo Nagamachi a , Sugaru Hiramatsu b , Hirokazu Osaki c a College of Human and Social Environment, Hiroshima International University, 555-36, Gakuendai, Kurose-cho, Kamo-gun, Hiroshima 724-0695, Japan b Onomichi University, 1600, Hisayamada, Onomichi, Hiroshima 722-8506, Japan c Faculty of Engineering, Okayama University, 3-1-1, Tsushima-naka, Okayama 700-0082, Japan Received 19 March 1999; received in revised form 8 November 1999; accepted 21 June 2000 Abstract In aging societies, the age-related decline in visual ability is a particularly important problem. To identify problems in daily living caused by this decline in visual ability, we simulated vision in the elderly using yellowed lenses. A questionnaire study was then conducted to investigate the population and age group that has visual deficits about issues identified in the optical study. Subjective responses related to yellowing in vision became prominent in people over 75 years old. A color judgment experiment was carried out using subjects aged 80 or older. Confusing color combinations are; yellow/white, blue/green, dark blue/black and purple/dark red. Based on this color confusion data, we used computer graphics to simulate vision in the elderly. Simulated views of public signs are shown. Relevance to industry This study shows what colors tend to be confused by the elderly and provides essential data for developing products for older adults. Color combinations on interfaces such as switches, indicators and displays have to be considered carefully. Optical and computer-graphics simulations of the yellowed vision of the elderly based on color tests are powerful tools for improvement through experience. r 2001 Elsevier Science B.V. All rights reserved. Keywords: Vision in the elderly; Decline in vision; Simulation; Improvements for the elderly; Older adults 1. Introduction In recent decades, the population of older adults grew rapidly in Japan. A new social problem is to eliminate any barriers in houses and towns, resulting from the diminished physical capabilities that accompany aging. Unfortunately, it is difficult for young or non-handicapped people to be aware of some of these barriers. This study focuses on the visual abilities of the elderly. Many visual functions change with age, including light sensitivity, susceptibility to glare, color perception, static and dynamic acuity, *Corresponding author. Present address: College of Human and Social Environment, Hiroshima International University, 555-36, Gakuendai, Kurose-cho, Kamo-gun, Hiroshima, 724-0695, Japan. E-mail address: [email protected] (K. Ishihara). 0169-8141/01/$ - see front matter r 2001 Elsevier Science B.V. All rights reserved. PII:S0169-8141(01)00028-2

Welcome message from author
This document is posted to help you gain knowledge. Please leave a comment to let me know what you think about it! Share it to your friends and learn new things together.
Transcript
International Journal of Industrial Ergonomics 28 (2001) 153–163
Age-related decline in color perception and difficulties withdaily activities–measurement, questionnaire, optical and
computer-graphics simulation studies
Keiko Ishiharaa,*, Shigekazu Ishiharaa, Mitsuo Nagamachia, Sugaru Hiramatsub,Hirokazu Osakic
aCollege of Human and Social Environment, Hiroshima International University, 555-36, Gakuendai, Kurose-cho, Kamo-gun,
Hiroshima 724-0695, JapanbOnomichi University, 1600, Hisayamada, Onomichi, Hiroshima 722-8506, Japan
cFaculty of Engineering, Okayama University, 3-1-1, Tsushima-naka, Okayama 700-0082, Japan
Received 19 March 1999; received in revised form 8 November 1999; accepted 21 June 2000
Abstract
In aging societies, the age-related decline in visual ability is a particularly important problem. To identify problems indaily living caused by this decline in visual ability, we simulated vision in the elderly using yellowed lenses. A
questionnaire study was then conducted to investigate the population and age group that has visual deficits about issuesidentified in the optical study. Subjective responses related to yellowing in vision became prominent in people over 75years old. A color judgment experiment was carried out using subjects aged 80 or older. Confusing color combinations
are; yellow/white, blue/green, dark blue/black and purple/dark red. Based on this color confusion data, we usedcomputer graphics to simulate vision in the elderly. Simulated views of public signs are shown.
Relevance to industry
This study shows what colors tend to be confused by the elderly and provides essential data for developing products
for older adults. Color combinations on interfaces such as switches, indicators and displays have to be consideredcarefully. Optical and computer-graphics simulations of the yellowed vision of the elderly based on color tests arepowerful tools for improvement through experience. r 2001 Elsevier Science B.V. All rights reserved.
Keywords: Vision in the elderly; Decline in vision; Simulation; Improvements for the elderly; Older adults
1. Introduction
In recent decades, the population of older adultsgrew rapidly in Japan. A new social problem is to
eliminate any barriers in houses and towns,resulting from the diminished physical capabilitiesthat accompany aging. Unfortunately, it is difficultfor young or non-handicapped people to be awareof some of these barriers.This study focuses on the visual abilities of the
elderly. Many visual functions change with age,including light sensitivity, susceptibility to glare,color perception, static and dynamic acuity,
*Corresponding author. Present address: College of Human and
Social Environment, Hiroshima International University, 555-36,
Gakuendai, Kurose-cho, Kamo-gun, Hiroshima, 724-0695, Japan.
E-mail address: [email protected] (K. Ishihara).
0169-8141/01/$ - see front matter r 2001 Elsevier Science B.V. All rights reserved.
PII: S 0 1 6 9 - 8 1 4 1 ( 0 1 ) 0 0 0 2 8 - 2
peripheral vision and depth perception (Kline andScialfa, 1997). Both optical and sensorineuralmechanisms suffer age-related declines.The lens continues its cellular growth through-
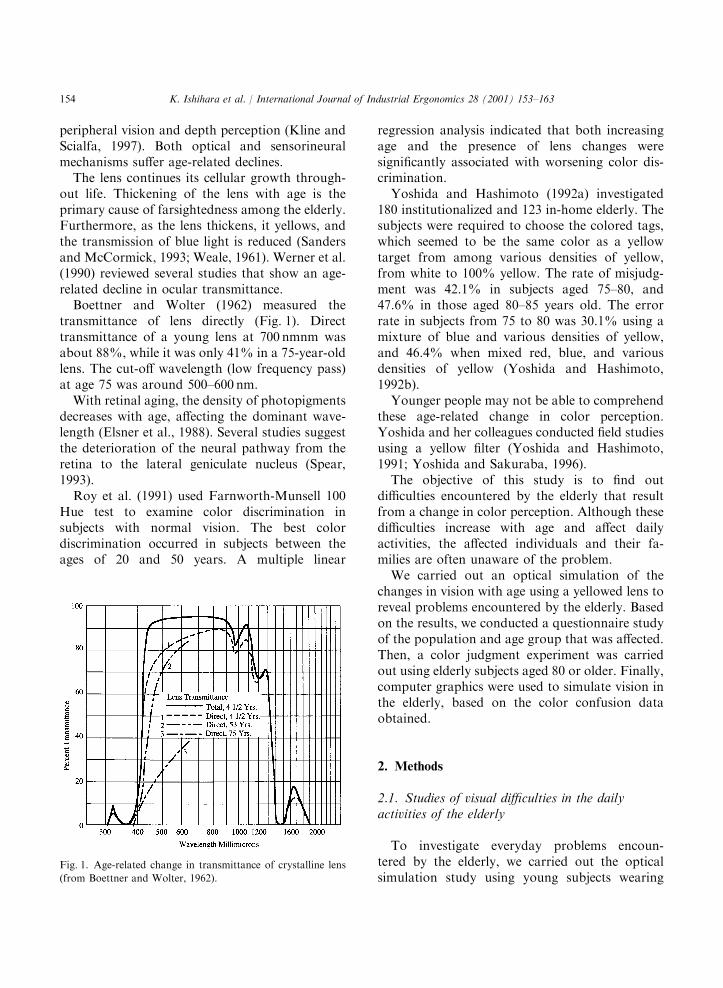
out life. Thickening of the lens with age is theprimary cause of farsightedness among the elderly.Furthermore, as the lens thickens, it yellows, andthe transmission of blue light is reduced (Sandersand McCormick, 1993; Weale, 1961). Werner et al.(1990) reviewed several studies that show an age-related decline in ocular transmittance.Boettner and Wolter (1962) measured the
transmittance of lens directly (Fig. 1). Directtransmittance of a young lens at 700 nmnm wasabout 88%, while it was only 41% in a 75-year-oldlens. The cut-off wavelength (low frequency pass)at age 75 was around 500–600 nm.With retinal aging, the density of photopigments
decreases with age, affecting the dominant wave-length (Elsner et al., 1988). Several studies suggestthe deterioration of the neural pathway from theretina to the lateral geniculate nucleus (Spear,1993).Roy et al. (1991) used Farnworth-Munsell 100
Hue test to examine color discrimination insubjects with normal vision. The best colordiscrimination occurred in subjects between theages of 20 and 50 years. A multiple linear
regression analysis indicated that both increasingage and the presence of lens changes weresignificantly associated with worsening color dis-crimination.Yoshida and Hashimoto (1992a) investigated
180 institutionalized and 123 in-home elderly. Thesubjects were required to choose the colored tags,which seemed to be the same color as a yellowtarget from among various densities of yellow,from white to 100% yellow. The rate of misjudg-ment was 42.1% in subjects aged 75–80, and47.6% in those aged 80–85 years old. The errorrate in subjects from 75 to 80 was 30.1% using amixture of blue and various densities of yellow,and 46.4% when mixed red, blue, and variousdensities of yellow (Yoshida and Hashimoto,1992b).Younger people may not be able to comprehend
these age-related change in color perception.Yoshida and her colleagues conducted field studiesusing a yellow filter (Yoshida and Hashimoto,1991; Yoshida and Sakuraba, 1996).The objective of this study is to find out
difficulties encountered by the elderly that resultfrom a change in color perception. Although thesedifficulties increase with age and affect dailyactivities, the affected individuals and their fa-milies are often unaware of the problem.We carried out an optical simulation of the
changes in vision with age using a yellowed lens toreveal problems encountered by the elderly. Basedon the results, we conducted a questionnaire studyof the population and age group that was affected.Then, a color judgment experiment was carriedout using elderly subjects aged 80 or older. Finally,computer graphics were used to simulate vision inthe elderly, based on the color confusion dataobtained.
2. Methods
2.1. Studies of visual difficulties in the dailyactivities of the elderly
To investigate everyday problems encoun-tered by the elderly, we carried out the opticalsimulation study using young subjects wearing
Fig. 1. Age-related change in transmittance of crystalline lens
(from Boettner and Wolter, 1962).
K. Ishihara et al. / International Journal of Industrial Ergonomics 28 (2001) 153–163154
a yellow filter, based on Boettner and Wolter’s(1962) measurements. Part of the results waspresented in Ishihara et al. (1997). Next, weconducted a survey to assess the visual difficul-ties that older people encounter in their dailyactivities.
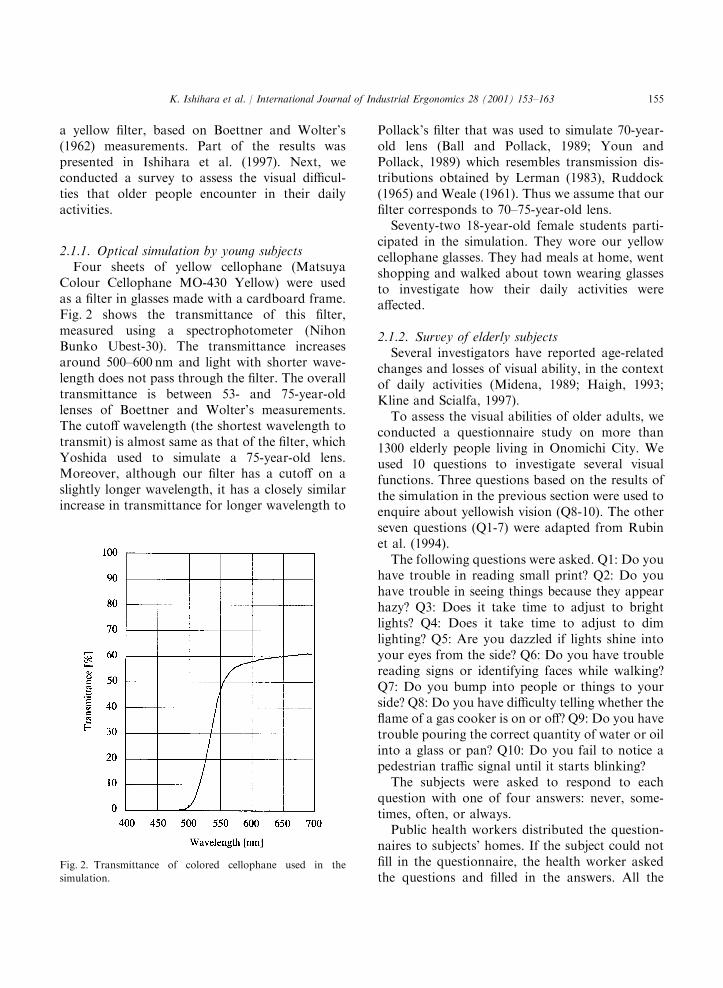
2.1.1. Optical simulation by young subjectsFour sheets of yellow cellophane (Matsuya
Colour Cellophane MO-430 Yellow) were usedas a filter in glasses made with a cardboard frame.Fig. 2 shows the transmittance of this filter,measured using a spectrophotometer (NihonBunko Ubest-30). The transmittance increasesaround 500–600 nm and light with shorter wave-length does not pass through the filter. The overalltransmittance is between 53- and 75-year-oldlenses of Boettner and Wolter’s measurements.The cutoff wavelength (the shortest wavelength totransmit) is almost same as that of the filter, whichYoshida used to simulate a 75-year-old lens.Moreover, although our filter has a cutoff on aslightly longer wavelength, it has a closely similarincrease in transmittance for longer wavelength to
Pollack’s filter that was used to simulate 70-year-old lens (Ball and Pollack, 1989; Youn andPollack, 1989) which resembles transmission dis-tributions obtained by Lerman (1983), Ruddock(1965) and Weale (1961). Thus we assume that ourfilter corresponds to 70–75-year-old lens.Seventy-two 18-year-old female students parti-
cipated in the simulation. They wore our yellowcellophane glasses. They had meals at home, wentshopping and walked about town wearing glassesto investigate how their daily activities wereaffected.
2.1.2. Survey of elderly subjectsSeveral investigators have reported age-related
changes and losses of visual ability, in the contextof daily activities (Midena, 1989; Haigh, 1993;Kline and Scialfa, 1997).To assess the visual abilities of older adults, we
conducted a questionnaire study on more than1300 elderly people living in Onomichi City. Weused 10 questions to investigate several visualfunctions. Three questions based on the results ofthe simulation in the previous section were used toenquire about yellowish vision (Q8-10). The otherseven questions (Q1-7) were adapted from Rubinet al. (1994).The following questions were asked. Q1: Do you
have trouble in reading small print? Q2: Do youhave trouble in seeing things because they appearhazy? Q3: Does it take time to adjust to brightlights? Q4: Does it take time to adjust to dimlighting? Q5: Are you dazzled if lights shine intoyour eyes from the side? Q6: Do you have troublereading signs or identifying faces while walking?Q7: Do you bump into people or things to yourside? Q8: Do you have difficulty telling whether theflame of a gas cooker is on or off? Q9: Do you havetrouble pouring the correct quantity of water or oilinto a glass or pan? Q10: Do you fail to notice apedestrian traffic signal until it starts blinking?The subjects were asked to respond to each
question with one of four answers: never, some-times, often, or always.Public health workers distributed the question-
naires to subjects’ homes. If the subject could notfill in the questionnaire, the health worker askedthe questions and filled in the answers. All the
Fig. 2. Transmittance of colored cellophane used in the
simulation.
K. Ishihara et al. / International Journal of Industrial Ergonomics 28 (2001) 153–163 155
subjects were older than 60 years and none wereinstitutionalized. There were 1322 subjects; 584were male and 738 were females. The subjects livedin eight different regions of Onomichi City,including an old, densely built-up district, asuburban town, a rather remote area, and anisland fishing community.
2.2. Experiment on misjudgment of colors by theelderly
We conducted an experiment to investigate howwell the elderly judge colors and what kind ofdifficulties they have in their daily lives. We askedelderly people to judge whether the combination oftwo colors was the same or different.
2.2.1. SubjectsSix men between 80 and 86 years old volun-
teered to participate in this study. All the subjectswere active, healthy people who lived at home, anddid not require help for ordinary activities.
2.2.2. Experimental designThe target colors for judgment were chosen
from the combinations that the simulation sug-gested were confused. The combinations of targetcolors are listed in Table 1. The colors in the tableare named according to the Japanese IndustrialStandard (JIS), which is based on the Munsellcolor system. The target combinations were yellowand white (A–D in Table 1), blue and green (E–I),dark blue and black (J–L), purple and dark red(M–Q). These combinations appeared similarwhen viewed through the yellow cellophane usedin the simulation. We employed 17 combinationsincluding pairs of the same color as controls. Thestimulus was illuminated with sunlight at 440–460Lx.Two sets of 17 combinations (34 stimuli) were
presented in random order to each subject. Thesubject observed the stimulus for about 1 s from adistance of 60–80 cm without wearing glasses, thenstated whether the targets were the same ordifferent colors. If the subject responded ‘‘same’’when the targets were different colors this wascounted as an error.
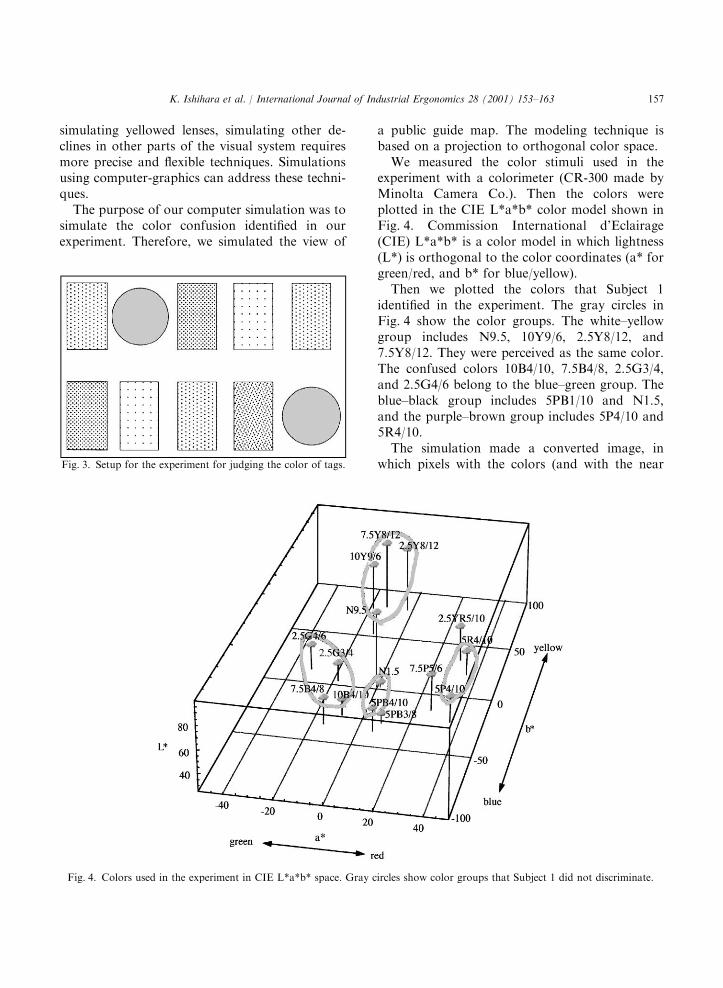
2.2.3. StimulusWe placed 10 colored tags on a piece of gray
paper as a stimulus. Two of the colored tags weretargets for the judgment test and the eight othertags were distracters. The arrangement of thecolored tags is shown in Fig. 3.The distracters were chosen from the rest of
the hues selecting those with moderate brightnessand chromas of those of the targets. The distrac-ters were 5YR8/6, 5GY5/6, 2.5BG7/6, 10PB3/6,7.5R6/12, 10RP7/8, 2.5B7/6, and 2.5RP6/6. Thedistracters were placed in all stimuli in differentpositions in each test.The targets were circular tags with a diameter of
5.17 cm and the distracters were rectangular tags(6� 3.5 cm) with the same area. The backgroundwas a sheet of A4 (21� 29.7 cm) sized gray (N4)paper.
2.3. Computer-graphics simulating how the elderlysee
Since the visual system involves optical, neuro-nal, and motor mechanisms, the age-relateddecline is caused by multiple factors. Althoughan optical filter technique has many advantages for
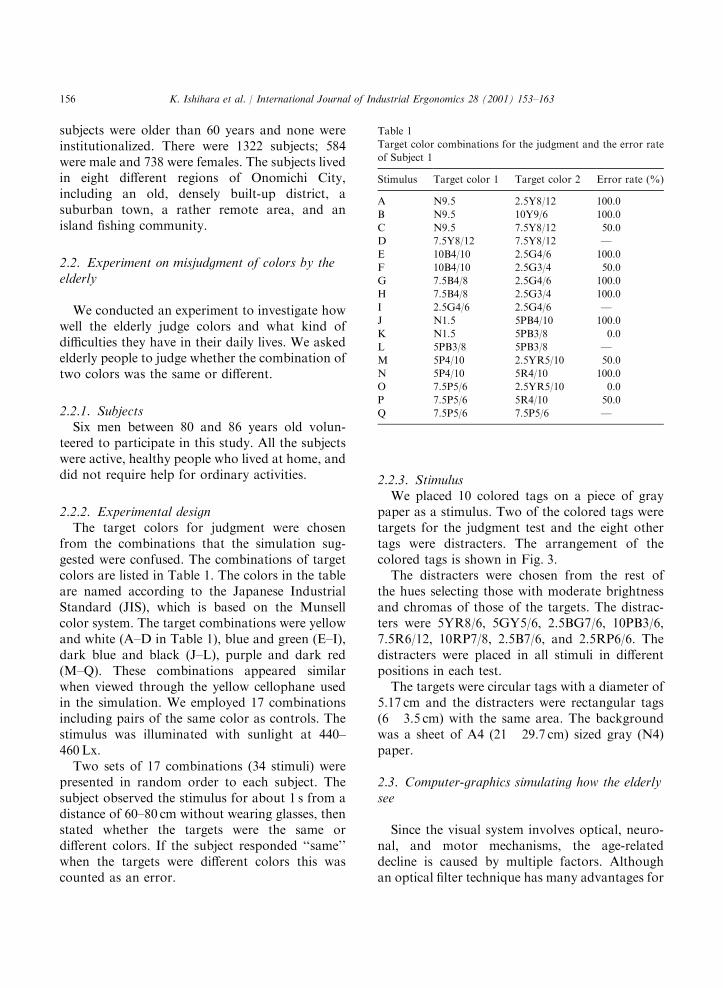
Table 1
Target color combinations for the judgment and the error rate
of Subject 1
Stimulus Target color 1 Target color 2 Error rate (%)
A N9.5 2.5Y8/12 100.0
B N9.5 10Y9/6 100.0
C N9.5 7.5Y8/12 50.0
D 7.5Y8/12 7.5Y8/12 FE 10B4/10 2.5G4/6 100.0
F 10B4/10 2.5G3/4 50.0
G 7.5B4/8 2.5G4/6 100.0
H 7.5B4/8 2.5G3/4 100.0
I 2.5G4/6 2.5G4/6 FJ N1.5 5PB4/10 100.0
K N1.5 5PB3/8 0.0
L 5PB3/8 5PB3/8 FM 5P4/10 2.5YR5/10 50.0
N 5P4/10 5R4/10 100.0
O 7.5P5/6 2.5YR5/10 0.0
P 7.5P5/6 5R4/10 50.0
Q 7.5P5/6 7.5P5/6 F
K. Ishihara et al. / International Journal of Industrial Ergonomics 28 (2001) 153–163156
simulating yellowed lenses, simulating other de-clines in other parts of the visual system requiresmore precise and flexible techniques. Simulationsusing computer-graphics can address these techni-ques.The purpose of our computer simulation was to
simulate the color confusion identified in ourexperiment. Therefore, we simulated the view of
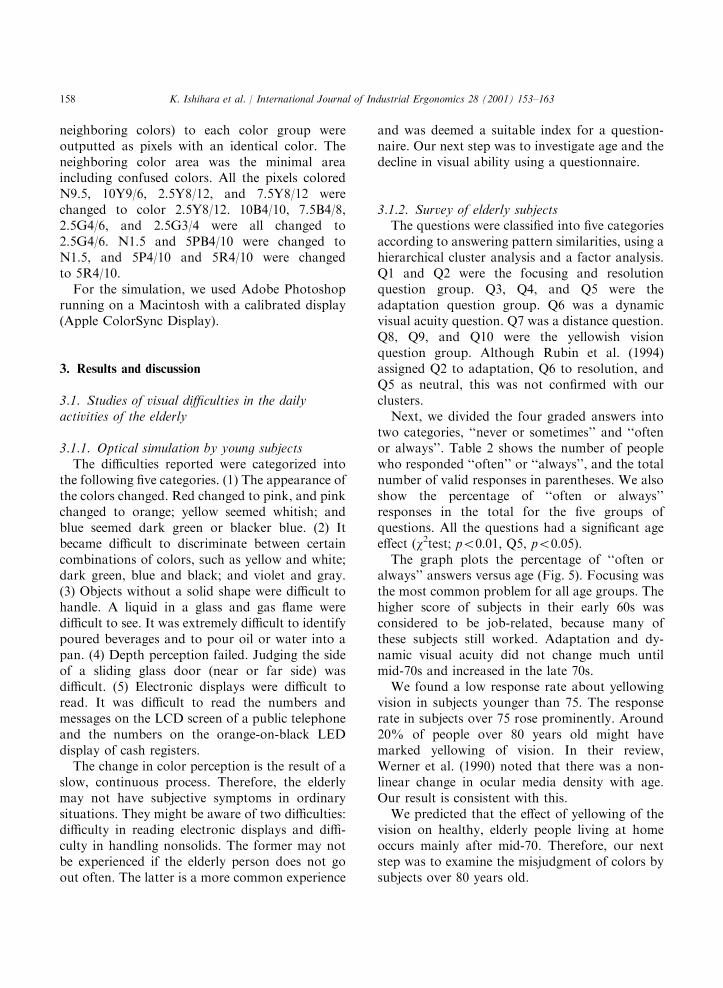
a public guide map. The modeling technique isbased on a projection to orthogonal color space.We measured the color stimuli used in the
experiment with a colorimeter (CR-300 made byMinolta Camera Co.). Then the colors wereplotted in the CIE L*a*b* color model shown inFig. 4. Commission International d’Eclairage(CIE) L*a*b* is a color model in which lightness(L*) is orthogonal to the color coordinates (a* forgreen/red, and b* for blue/yellow).Then we plotted the colors that Subject 1
identified in the experiment. The gray circles inFig. 4 show the color groups. The white–yellowgroup includes N9.5, 10Y9/6, 2.5Y8/12, and7.5Y8/12. They were perceived as the same color.The confused colors 10B4/10, 7.5B4/8, 2.5G3/4,and 2.5G4/6 belong to the blue–green group. Theblue–black group includes 5PB1/10 and N1.5,and the purple–brown group includes 5P4/10 and5R4/10.The simulation made a converted image, in
which pixels with the colors (and with the nearFig. 3. Setup for the experiment for judging the color of tags.
Fig. 4. Colors used in the experiment in CIE L*a*b* space. Gray circles show color groups that Subject 1 did not discriminate.
K. Ishihara et al. / International Journal of Industrial Ergonomics 28 (2001) 153–163 157
neighboring colors) to each color group wereoutputted as pixels with an identical color. Theneighboring color area was the minimal areaincluding confused colors. All the pixels coloredN9.5, 10Y9/6, 2.5Y8/12, and 7.5Y8/12 werechanged to color 2.5Y8/12. 10B4/10, 7.5B4/8,2.5G4/6, and 2.5G3/4 were all changed to2.5G4/6. N1.5 and 5PB4/10 were changed toN1.5, and 5P4/10 and 5R4/10 were changedto 5R4/10.For the simulation, we used Adobe Photoshop
running on a Macintosh with a calibrated display(Apple ColorSync Display).
3. Results and discussion
3.1. Studies of visual difficulties in the dailyactivities of the elderly
3.1.1. Optical simulation by young subjectsThe difficulties reported were categorized into
the following five categories. (1) The appearance ofthe colors changed. Red changed to pink, and pinkchanged to orange; yellow seemed whitish; andblue seemed dark green or blacker blue. (2) Itbecame difficult to discriminate between certaincombinations of colors, such as yellow and white;dark green, blue and black; and violet and gray.(3) Objects without a solid shape were difficult tohandle. A liquid in a glass and gas flame weredifficult to see. It was extremely difficult to identifypoured beverages and to pour oil or water into apan. (4) Depth perception failed. Judging the sideof a sliding glass door (near or far side) wasdifficult. (5) Electronic displays were difficult toread. It was difficult to read the numbers andmessages on the LCD screen of a public telephoneand the numbers on the orange-on-black LEDdisplay of cash registers.The change in color perception is the result of a
slow, continuous process. Therefore, the elderlymay not have subjective symptoms in ordinarysituations. They might be aware of two difficulties:difficulty in reading electronic displays and diffi-culty in handling nonsolids. The former may notbe experienced if the elderly person does not goout often. The latter is a more common experience
and was deemed a suitable index for a question-naire. Our next step was to investigate age and thedecline in visual ability using a questionnaire.
3.1.2. Survey of elderly subjectsThe questions were classified into five categories
according to answering pattern similarities, using ahierarchical cluster analysis and a factor analysis.Q1 and Q2 were the focusing and resolutionquestion group. Q3, Q4, and Q5 were theadaptation question group. Q6 was a dynamicvisual acuity question. Q7 was a distance question.Q8, Q9, and Q10 were the yellowish visionquestion group. Although Rubin et al. (1994)assigned Q2 to adaptation, Q6 to resolution, andQ5 as neutral, this was not confirmed with ourclusters.Next, we divided the four graded answers into
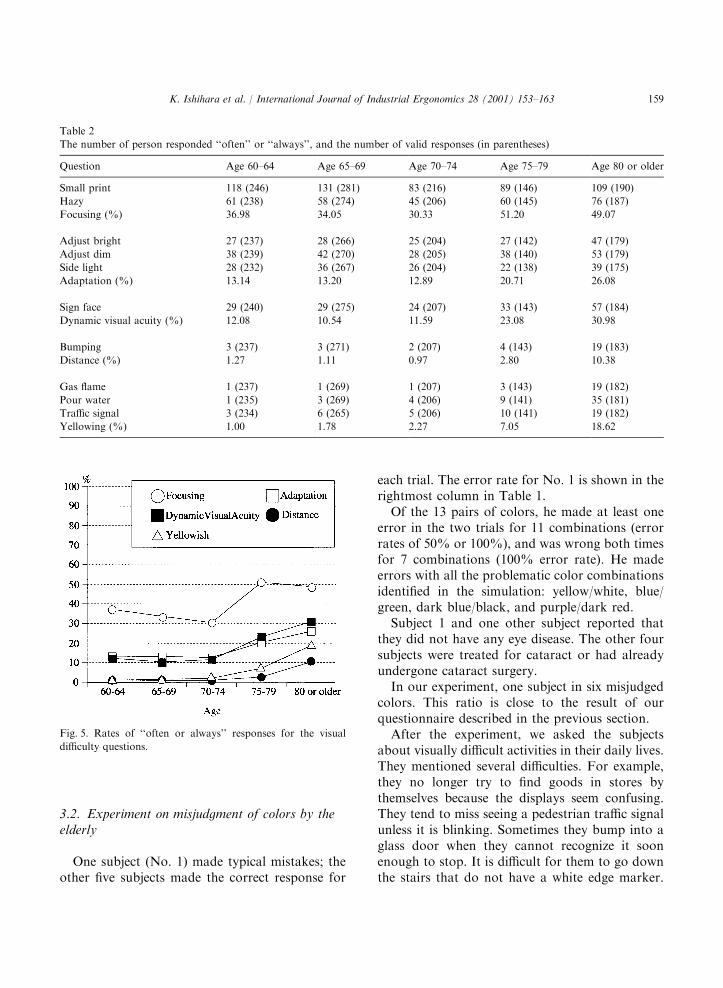
two categories, ‘‘never or sometimes’’ and ‘‘oftenor always’’. Table 2 shows the number of peoplewho responded ‘‘often’’ or ‘‘always’’, and the totalnumber of valid responses in parentheses. We alsoshow the percentage of ‘‘often or always’’responses in the total for the five groups ofquestions. All the questions had a significant ageeffect (w2test; po0:01; Q5, po0:05).The graph plots the percentage of ‘‘often or
always’’ answers versus age (Fig. 5). Focusing wasthe most common problem for all age groups. Thehigher score of subjects in their early 60s wasconsidered to be job-related, because many ofthese subjects still worked. Adaptation and dy-namic visual acuity did not change much untilmid-70s and increased in the late 70s.We found a low response rate about yellowing
vision in subjects younger than 75. The responserate in subjects over 75 rose prominently. Around20% of people over 80 years old might havemarked yellowing of vision. In their review,Werner et al. (1990) noted that there was a non-linear change in ocular media density with age.Our result is consistent with this.We predicted that the effect of yellowing of the
vision on healthy, elderly people living at homeoccurs mainly after mid-70. Therefore, our nextstep was to examine the misjudgment of colors bysubjects over 80 years old.
K. Ishihara et al. / International Journal of Industrial Ergonomics 28 (2001) 153–163158
3.2. Experiment on misjudgment of colors by theelderly
One subject (No. 1) made typical mistakes; theother five subjects made the correct response for
each trial. The error rate for No. 1 is shown in therightmost column in Table 1.Of the 13 pairs of colors, he made at least one
error in the two trials for 11 combinations (errorrates of 50% or 100%), and was wrong both timesfor 7 combinations (100% error rate). He madeerrors with all the problematic color combinationsidentified in the simulation: yellow/white, blue/green, dark blue/black, and purple/dark red.Subject 1 and one other subject reported that
they did not have any eye disease. The other foursubjects were treated for cataract or had alreadyundergone cataract surgery.In our experiment, one subject in six misjudged
colors. This ratio is close to the result of ourquestionnaire described in the previous section.After the experiment, we asked the subjects
about visually difficult activities in their daily lives.They mentioned several difficulties. For example,they no longer try to find goods in stores bythemselves because the displays seem confusing.They tend to miss seeing a pedestrian traffic signalunless it is blinking. Sometimes they bump into aglass door when they cannot recognize it soonenough to stop. It is difficult for them to go downthe stairs that do not have a white edge marker.
Table 2
The number of person responded ‘‘often’’ or ‘‘always’’, and the number of valid responses (in parentheses)
Question Age 60–64 Age 65–69 Age 70–74 Age 75–79 Age 80 or older
Small print 118 (246) 131 (281) 83 (216) 89 (146) 109 (190)
Hazy 61 (238) 58 (274) 45 (206) 60 (145) 76 (187)
Focusing (%) 36.98 34.05 30.33 51.20 49.07
Adjust bright 27 (237) 28 (266) 25 (204) 27 (142) 47 (179)
Adjust dim 38 (239) 42 (270) 28 (205) 38 (140) 53 (179)
Side light 28 (232) 36 (267) 26 (204) 22 (138) 39 (175)
Adaptation (%) 13.14 13.20 12.89 20.71 26.08
Sign face 29 (240) 29 (275) 24 (207) 33 (143) 57 (184)
Dynamic visual acuity (%) 12.08 10.54 11.59 23.08 30.98
Bumping 3 (237) 3 (271) 2 (207) 4 (143) 19 (183)
Distance (%) 1.27 1.11 0.97 2.80 10.38
Gas flame 1 (237) 1 (269) 1 (207) 3 (143) 19 (182)
Pour water 1 (235) 3 (269) 4 (206) 9 (141) 35 (181)
Traffic signal 3 (234) 6 (265) 5 (206) 10 (141) 19 (182)
Yellowing (%) 1.00 1.78 2.27 7.05 18.62
Fig. 5. Rates of ‘‘often or always’’ responses for the visual
difficulty questions.
K. Ishihara et al. / International Journal of Industrial Ergonomics 28 (2001) 153–163 159
Signs with black on white are easy to read, whilemany guide maps on city streets that are drawnwith red, blue, and yellow on white are difficult toread because the yellow parts are dim.
3.3. Computer-graphics simulating how the elderlysee
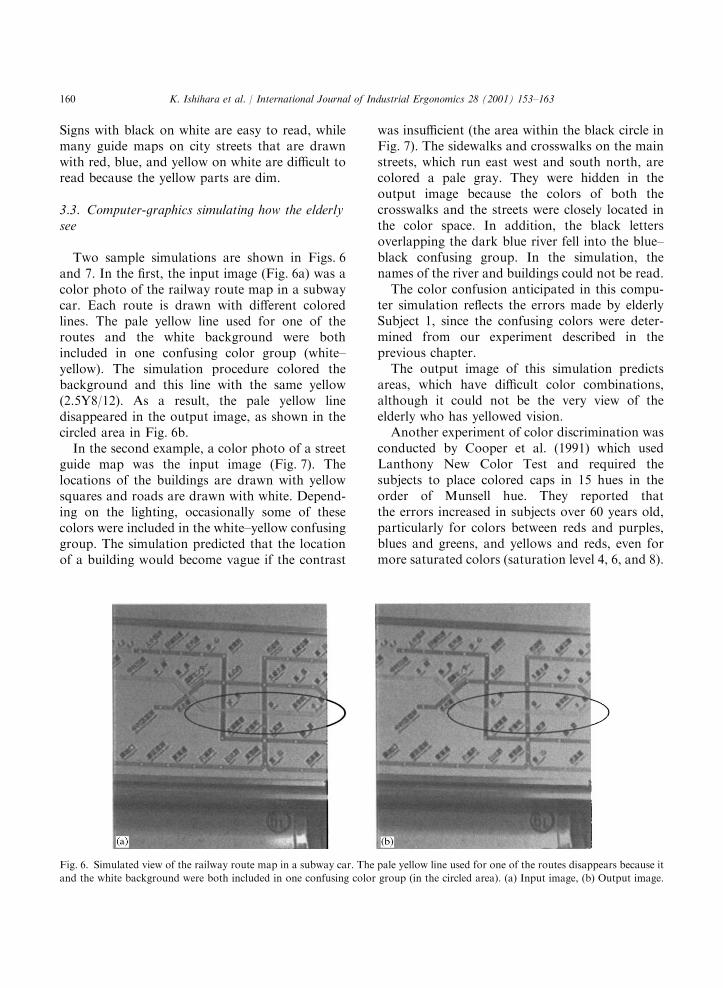
Two sample simulations are shown in Figs. 6and 7. In the first, the input image (Fig. 6a) was acolor photo of the railway route map in a subwaycar. Each route is drawn with different coloredlines. The pale yellow line used for one of theroutes and the white background were bothincluded in one confusing color group (white–yellow). The simulation procedure colored thebackground and this line with the same yellow(2.5Y8/12). As a result, the pale yellow linedisappeared in the output image, as shown in thecircled area in Fig. 6b.In the second example, a color photo of a street
guide map was the input image (Fig. 7). Thelocations of the buildings are drawn with yellowsquares and roads are drawn with white. Depend-ing on the lighting, occasionally some of thesecolors were included in the white–yellow confusinggroup. The simulation predicted that the locationof a building would become vague if the contrast
was insufficient (the area within the black circle inFig. 7). The sidewalks and crosswalks on the mainstreets, which run east west and south north, arecolored a pale gray. They were hidden in theoutput image because the colors of both thecrosswalks and the streets were closely located inthe color space. In addition, the black lettersoverlapping the dark blue river fell into the blue–black confusing group. In the simulation, thenames of the river and buildings could not be read.The color confusion anticipated in this compu-
ter simulation reflects the errors made by elderlySubject 1, since the confusing colors were deter-mined from our experiment described in theprevious chapter.The output image of this simulation predicts
areas, which have difficult color combinations,although it could not be the very view of theelderly who has yellowed vision.Another experiment of color discrimination was
conducted by Cooper et al. (1991) which usedLanthony New Color Test and required thesubjects to place colored caps in 15 hues in theorder of Munsell hue. They reported thatthe errors increased in subjects over 60 years old,particularly for colors between reds and purples,blues and greens, and yellows and reds, even formore saturated colors (saturation level 4, 6, and 8).
Fig. 6. Simulated view of the railway route map in a subway car. The pale yellow line used for one of the routes disappears because it
and the white background were both included in one confusing color group (in the circled area). (a) Input image, (b) Output image.
K. Ishihara et al. / International Journal of Industrial Ergonomics 28 (2001) 153–163160
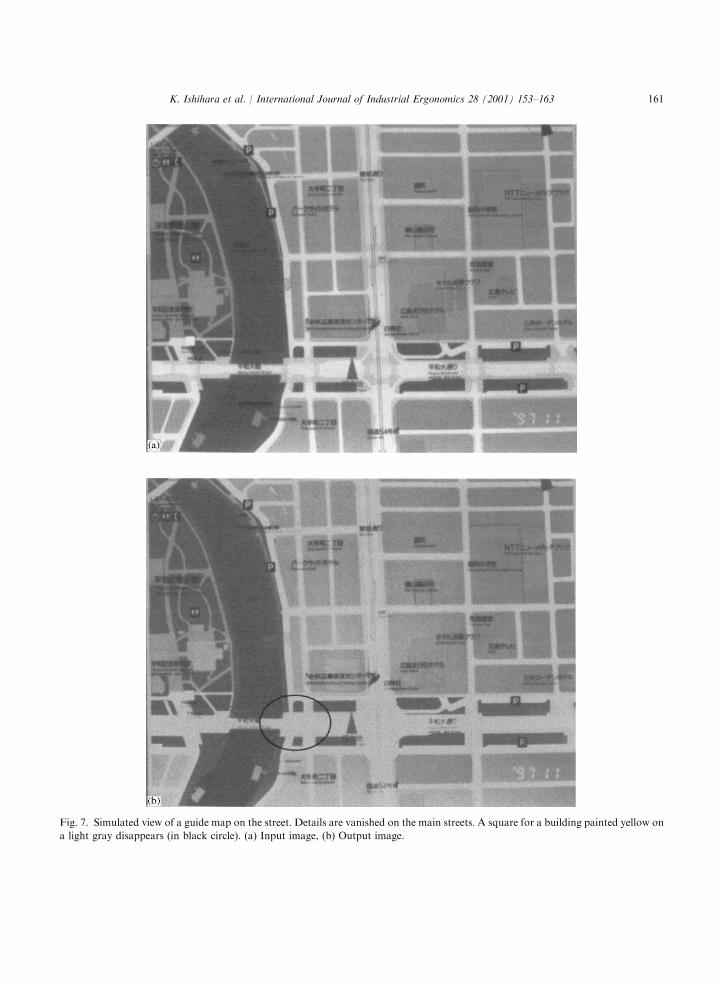
Fig. 7. Simulated view of a guide map on the street. Details are vanished on the main streets. A square for a building painted yellow on
a light gray disappears (in black circle). (a) Input image, (b) Output image.
K. Ishihara et al. / International Journal of Industrial Ergonomics 28 (2001) 153–163 161
When compared to our experimental results, theresults of confusion accord in blue/green and red/purple. However, they did not use brighter andmore saturated yellows and white, and darkerpurplish blue and black that we found undiscri-minable.
4. Conclusion
This study examined the age-related decline incolor perception and difficulties in daily activitiescaused by a yellowing of vision.The optical simulation performed by young
subjects suggested various difficulties in dailyactivities that might be encountered by elderlypeople who have a yellowing of vision. Thereported inconveniences were classified into fivecategories: changed appearance of colors, loss incolor discrimination, difficulty in handling liquidsand flames, failure of depth perception, anddifficulty in reading electronic displays.The results of a questionnaire study showed that
difficulties caused by yellowing vision increasedafter around age 75. Around 20% of the peopleaged 80 or older may have considerable yellowingof vision.The color discrimination experiment supported
the hypothesis that some elderly people fail todiscriminate between some combinations of col-ors, such as yellow/white, blue/green, dark blue/black, and purple/dark red. In interviews, theelderly mentioned difficulties in their daily livesresulting from their misjudgment of colors thatmight result from the age-related yellowing ofvision.A computer-graphics simulation model of color
confusion was constructed according to thediscrimination errors identified in our experiment.It predicted several difficulties in reading a signboard and a guide map. Further work is requiredto establish a complete map of color confusion.Simulation of what the elderly see, either by
optical observation or computer simulation, canreveal potential difficulties that young people maybe unaware of. This should be valuable fordesigning working and living environments forthe elderly that enhance safety and function.
References
Ball, L.J., Pollack, R.H., 1989. The effects of color and
preretinal aging on embedded figures test performance: a
failure to replicate. Experimental Aging Research 15 (4),
177–180.
Boettner, E.A., Wolter, J.R., 1962. Transmission of the ocular
media. Investigative Ophthalmology 1 (6), 776–783.
Cooper, A.B., Ward, M., Gowland, C.A., McIntosh, J.M.,
1991. The use of the Lanthony New Color test in
determining the effects of aging on color vision. Journal of
Gerontology: Psychological Sciences 46 (6), 320–324.
Elsner, A.E., Berk, L., Burns, S.A., Rosenberg, P.R., 1988.
Aging and human cone photopigments. Journal of Optical
Society of America A 5 (12), 2106–2112.
Haigh, R., 1993. The aging process: a challenge for design.
Applied Ergonomics 24 (1), 9–14.
Ishihara, K., Ishihara, S., Nagamachi, M., Osaki, H., 1997.
Difficulties for elderly people caused by age-related yellow-
ing vision. Proceedings of 13th Triennial Congress of the
International Ergonomics Association 5, pp. 579–581.
Kline, D.W., Scialfa, C.T., 1997. Sensory and perceptual
functioning: basic research and human factors implications.
In: Fisk, A.D., Rogers, W.A. (Eds.), Handbook of Human
Factors and the Older Adult. Academic Press, San Diego,
pp. 27–54.
Lerman, S., 1983. An experimental and clinical evaluation of
lens transparency and aging. Journal of Gerontology 38 (3),
293–307.
Midena, E., 1989. Psychophysics and visual aging, metabolic.
Pediatric and Systemic Ophthalmology 12 (1), 28–31.
Roy, M.S., Podgor, M.J., Collier, B., Gunkel, R.D., 1991.
Color vision and age in a normal North American
population. Graefe’s Archive for Clinical and Experimental
Ophthalmology 229, 139–144.
Rubin, G.S., Bandeen Roche, K., Prasada-Rao, P., Fried, L.P.,
1994. Visual impairment and disability in older adults.
Optometry and Vision Science 71 (12), 750–760.
Ruddock, K.H., 1965. The effect of age upon color visionFII.
Changes with age in light transmission of the ocular media.
Vision Research 5, 47–58.
Sanders, M.S., McCormick, E.J., 1993. Human Factors in
Engineering and Design, Seventh Edition. McGraw-Hill,
New York.
Spear, P.D., 1993. Neural bases of visual deficits during aging.
Vision Research 33 (18), 2589–2609.
Weale, R.A., 1961. Retinal illumination and age. Transaction
of Illumination Engineering Society 26 (2), 95–100.
Werner, J.S., Peterzell, D.H., Scheetz, A.J., 1990. Light, vision,
and aging. Optometry and Vision Science 67 (3), 214–229.
Yoshida, C.A., Hashimoto, T., 1991. Disappeared signs
analyzed by spectral-transmissivityF1. Study of yellow
vision field by age. Proceedings of the Annual Meeting of
Architectural Institute of Japan, D: 669–670 (in Japanese).
Yoshida, C.A., Hashimoto, T., 1992a. Investigations of age-
related vision losses in color distinctions–(1) A case of
decrease of yellow-deepness in uni-color of Y-, Proceedings
K. Ishihara et al. / International Journal of Industrial Ergonomics 28 (2001) 153–163162
of the Annual Meeting of Architectural Institute of Japan,
D, 949–950 (in Japanese).
Yoshida, C.A., Hashimoto, T., 1992b. Investigations of age-
related vision losses in color distinctions–(2) Cases of
decreases of yellow-deepness in mixed-color of R.B. &
Y.—, Proceedings of the Annual Meeting of Architectural
Institute of Japan, D, 951–952 (in Japanese).
Yoshida, C.A., Sakuraba, S., 1996. The use of films to simulate
age-related declines in yellow vision. Journal of Occupa-
tional Rehabilitation 6 (2), 119–134.
Youn, G., Pollack, R.H., 1989. The magnitude of the Mueller–
Lyer illusion as a function of hue, saturation, fundus
pigmentation, and simulated aging. Experimental Aging
Research 15 (1), 19–25.
K. Ishihara et al. / International Journal of Industrial Ergonomics 28 (2001) 153–163 163
Related Documents