Agarose Gel Agarose Gel Electrophoresis Electrophoresis

Agarose Gel Electrophoresis.ppt
Jan 01, 2016
ppt presentation about agarose electrophoresis
Welcome message from author
This document is posted to help you gain knowledge. Please leave a comment to let me know what you think about it! Share it to your friends and learn new things together.
Transcript
Agarose Gel Agarose Gel ElectrophoresisElectrophoresis

Agarose Gel ElectrophoresisAgarose Gel Electrophoresis
• Gel electrophoresis– separates molecules – different rates of
movement through a gel under the influence of an electrical field( “carrying within electricity”)
– widely used technique for the analysis of:
• nucleic acids (Agarose Gel Electrophoresis)
• Proteins (SDS-PAGE)
+-
Power
+-
Power
DNA (-)DNA (-)
smalllarge

Agarose GelAgarose Gel
• Agarose is a linear polymer derived from red seaweed.
• Malasian word: “agar-agar”.
• Pores = sieve• Increasing agarose
concentration:– decreases pore size– limits the size range of
molecules that can be separated.
Agarose
D-galactose 3,6-anhydroL-galactose
1% agarose 2% agarose
Scanning Electron Micrograph
of Agarose Gel (1×1 µm)

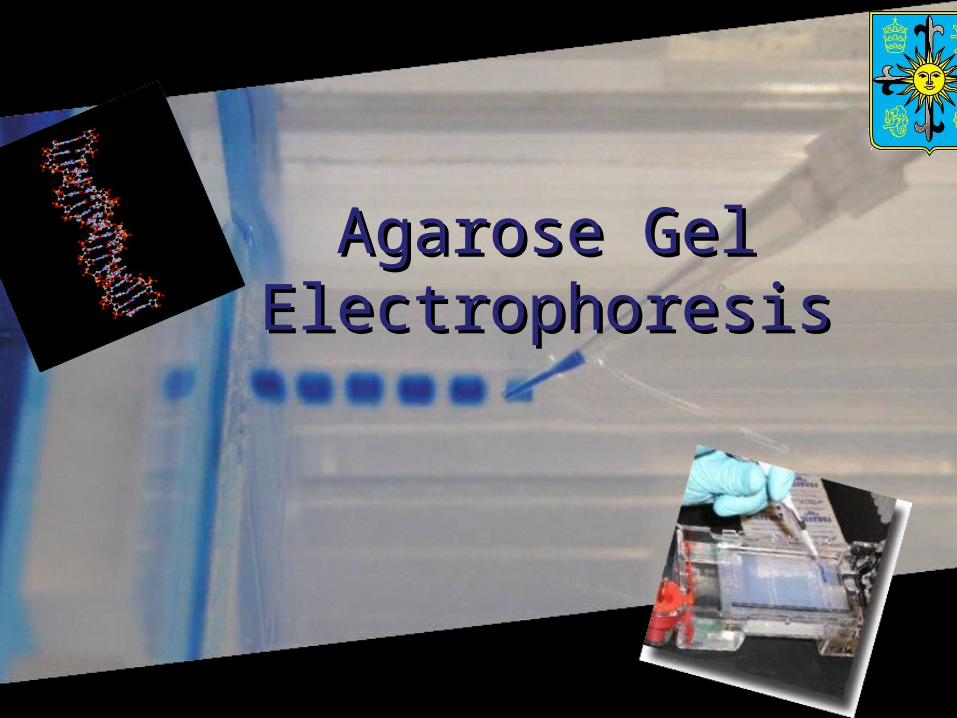
buffer
Cathode(negative)
Anode(positive)
wells
DNA
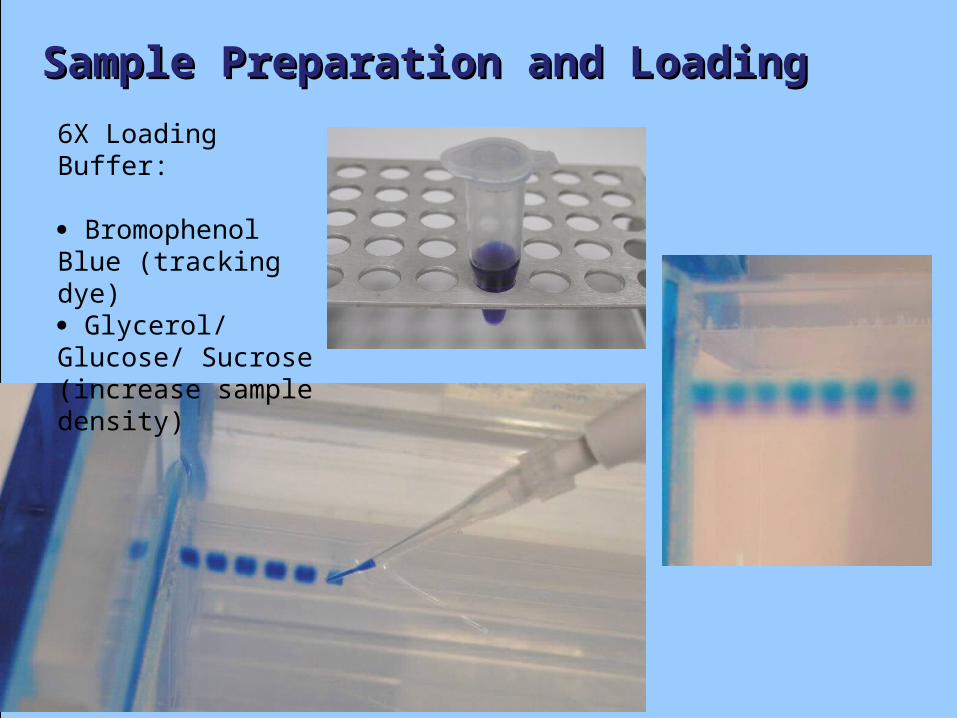
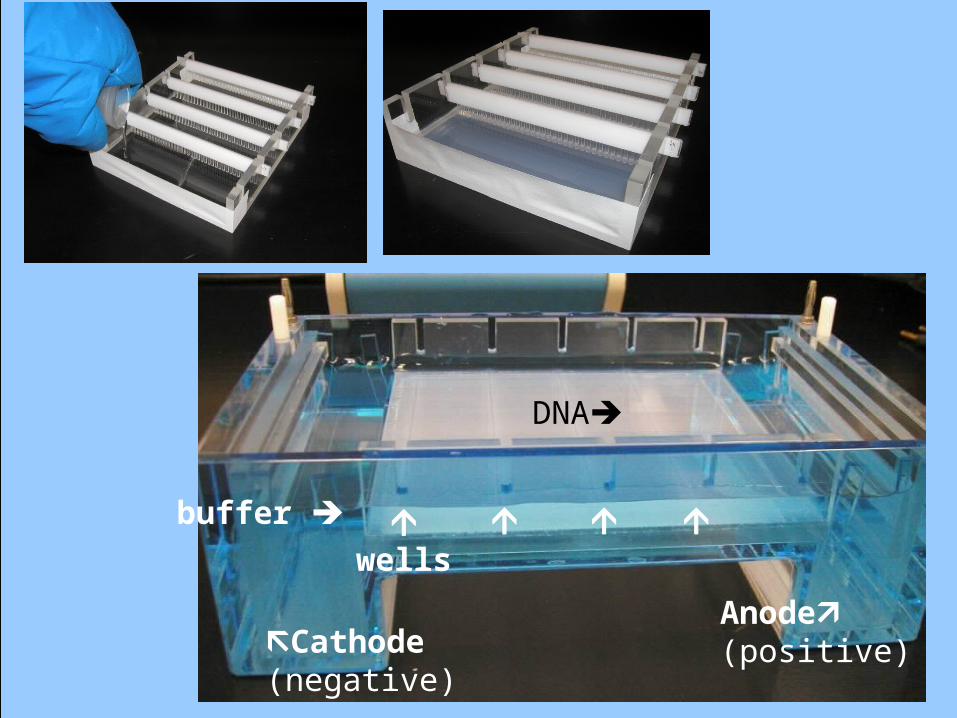
Sample Preparation and Sample Preparation and LoadingLoading6X Loading Buffer:
Bromophenol Blue (tracking dye) Glycerol/ Glucose/ Sucrose (increase sample density)
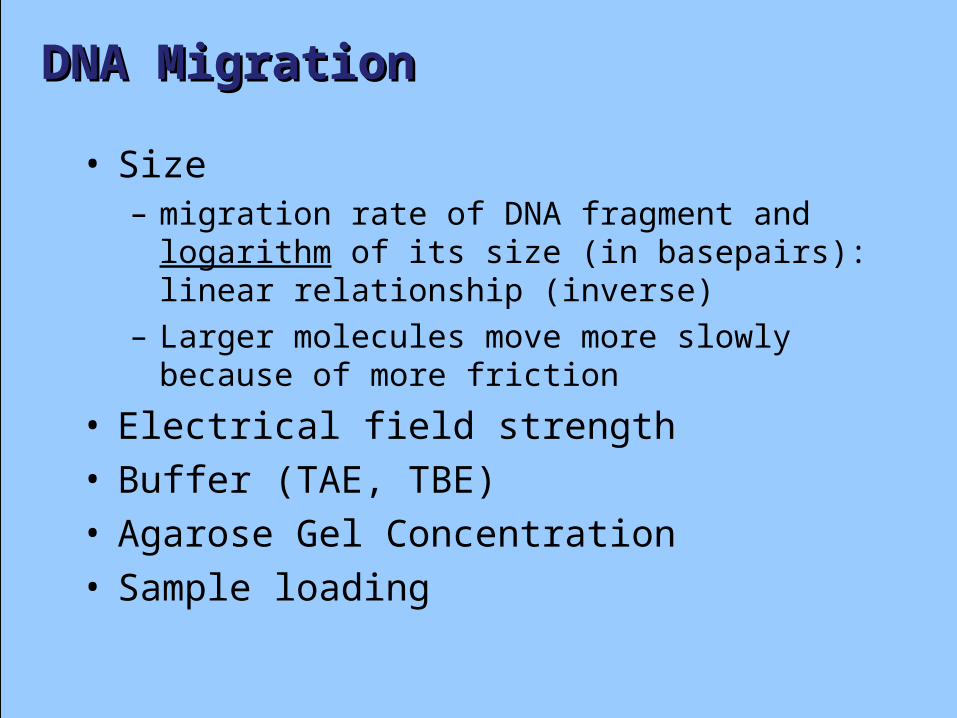
DNA MigrationDNA Migration
• Size– migration rate of DNA fragment and logarithm of its
size (in basepairs): linear relationship (inverse)– Larger molecules move more slowly because of more
friction
• Electrical field strength• Buffer (TAE, TBE)• Agarose Gel Concentration• Sample loading

DNA Ladder Standard
Serves as a marker to determine the sizes of unknown DNAs.
100 200 300
1,650
1,000
500
850
650
400
12,000 bp
5,000
2,000
-
+
DNAmigration
bromophenol blue

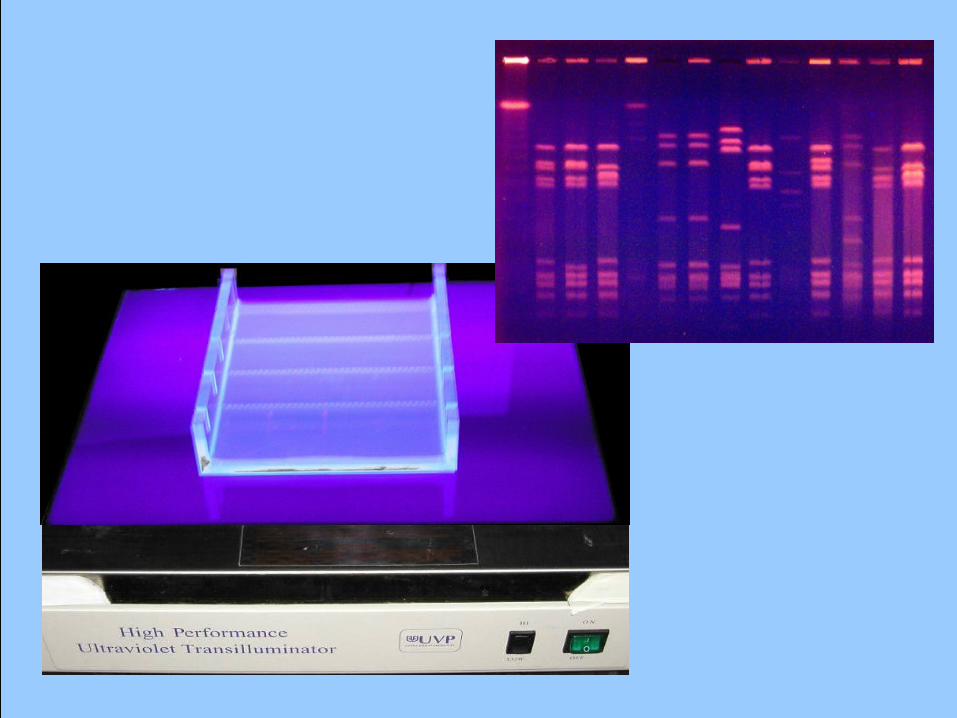
Visualization
• Ethidium bromide– binds to DNA and fluoresces
under UV light– can be added to the gel and/or
running buffer before electrophoresis or used as developing solution after electrophoresis
– CAUTION: Powerful mutagen and moderately toxic
– Decontamination • Lunn and Sansone Method : + 20
mL 5% hydrophosphorous acid and 12 mL 0. 5 M sodium Nitrate for every 100 mL EtBr (20 hrs)
• Armour method: Bleach (2-3 days)
• Charcoal Filtration

advantagesInexpensiveLess toxicNo UV light requiredNo hazardous waste disposal
disadvantagesLess sensitiveMore DNA needed on gelLonger staining/destaining time
Safer Alternatives to Ethidium Safer Alternatives to Ethidium BromideBromide
• Methylene Blue
• BioRAD - Bio-Safe DNA Stain
• Ward’s - QUIKView DNA Stain
• Carolina BLU Stain

Visualizing the DNA (QuikVIEW stain)Visualizing the DNA (QuikVIEW stain)
250
1,500 1,000
500 750
2,000 bp
DNA ladder
PCRProduct
wells
+ - - - - + + - - + - +
Samples # 1, 6, 7, 10 & 12 were positive for Wolbachia DNA

Distance migrated
base
pai
rs
Determining sample sizeDetermining sample size
• DNA migration rate and logarithm of its size (in basepairs): inverse linear relationship
DNA ladder
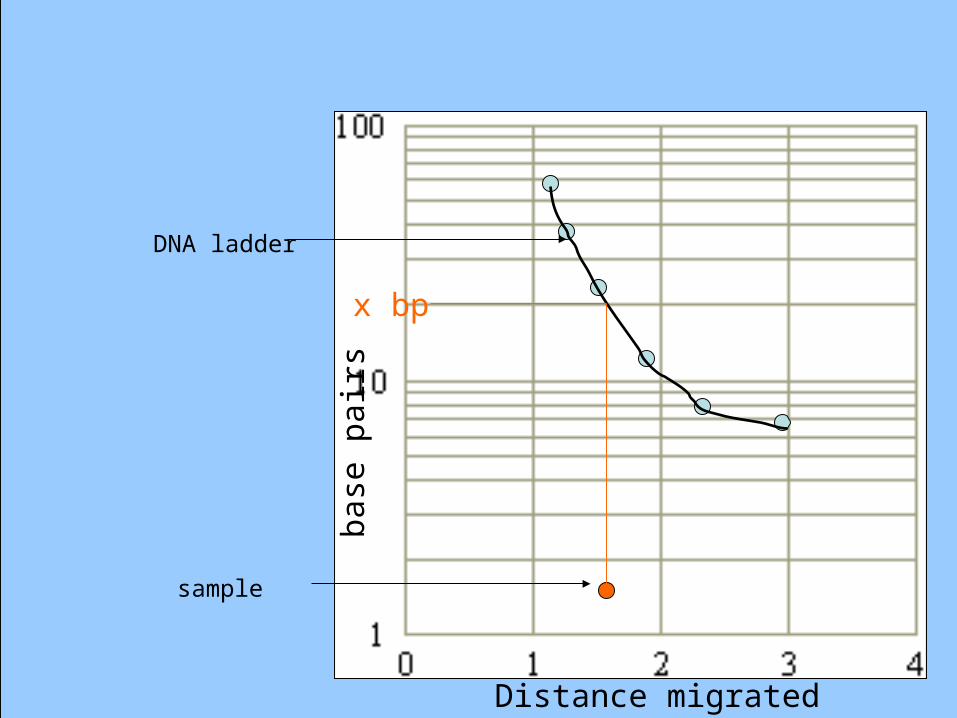
Distance migrated
base
pai
rs
x bp
DNA ladder
sample

ResultsResults

wells
10,000 bp
8,000
6,000 5,000 4,000
3,000 2,500
2,000
1,500
1,000
750
ma
rke
r
Grp
. 1
Grp
. 2
Grp
. 3
Grp
. 4
Grp
. 5
Grp
. 6
Grp
. 7
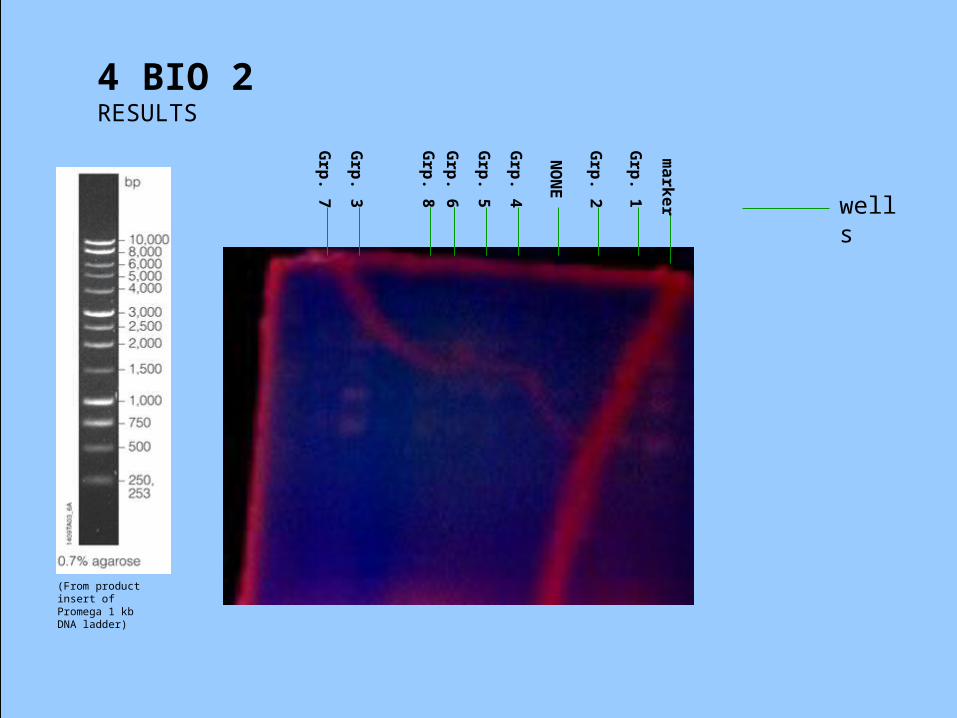
(From product insert of Promega 1 kb DNA ladder)
4 BIO 4 RESULTS

wells
Grp
. 8
Grp
. 6
Grp
. 5
Grp
. 4
Grp
. 2
Grp
. 1
(From product insert of Promega 1 kb DNA ladder)
4 BIO 3 RESULTS m
ark
er
Grp
. 7
Grp
. 3

wells
ma
rke
r
Grp
. 1
Grp
. 2
Grp
. 3
Grp
. 4
Grp
. 5
Grp
. 6
Grp
. 7
(From product insert of Promega 1 kb DNA ladder)
4 BIO 5 RESULTS
SA
MP
LE
1
SA
MP
LE
2
SA
MP
LE
3
wells
(From product insert of Promega 1 kb DNA ladder)
4 BIO 2 RESULTS
Grp
. 7
Grp
. 6
Grp
. 5
Grp
. 4
Grp
. 2
Grp
. 1
ma
rke
r
Grp
. 3
NO
NE
Grp
. 8

wells
10,000 bp
8,000
6,000 5,000 4,000
3,000 2,500
2,000
1,500
1,000
750
ma
rke
r
Grp
. 1
Grp
. 2
Grp
. 3
Grp
. 4
Grp
. 5
Grp
. 6
Grp
. 7
(From product insert of Promega 1 kb DNA ladder)
4 BIO 6 RESULTS
Related Documents