Measurement of Gas by Multipath Ultrasonic Meters ... :," , . '" . . . . Transmission Measurement Committee Report No. 9 ·Adh. American Gas Association Copyright © 1998,2000 American Gas Association ÁII Rights Reserved :-'. '. No. XQ9801 2" Printing June 2000

Welcome message from author
This document is posted to help you gain knowledge. Please leave a comment to let me know what you think about it! Share it to your friends and learn new things together.
Transcript
Measurement of Gas by
Multipath Ultrasonic Meters...:," , . '" . . .
.Transmission Measurement CommitteeReport No. 9
·Adh.American Gas Association
Copyright © 1998,2000 American Gas AssociationÁII Rights Reserved
:-'. '.
Catalo~ No. XQ98012" PrintingJune 2000

DISCLAIMERS AND COPYRIGHT
Nothing contained in any American Gas Association (AGA) publication is to be construed os grantingony right, by implication or otherwise, for the manufacture, sale or use in connection with any method;apparatus or product covered by letters patent, nor as insuring anyone against liability for infringementof letters patent.
This AGApublication may be used by anyone desiring 10 do so. Efforts have been made to ensure theaccuracy and reliability of the data contained in this publication; however, AGA makes norepresentation, warranty or guarantee in connection with AGA publications and hereby expresslydisclaims any liability or responsibility for loss or damage resulting from their use; for any violation ofany federal, state or municipal regulation with which an AGA publication may conflict; or for theinfringement ofany patent from the use ofany AGA publication. Nothing contained in this report shouldbe viewed as an endorsement by AGA oi al1Y particular manufacturer's products.
\\11\\1 \\11\ \1\1\ 1\\1\ \\11\ \\111 ¡:'.28511320
International Loan, Return Alrmail withlweeks of date of recelpt unlees racallad\,
R""Mi1H''2 876 T 19 7 PHOT:.
lfno otherlibrary Indlcated pisase return \The Brltlsh Ubrary Document Supply CentWetherby, WestYorkshlre, UnltedKlngdorr
Copyright © 1998, 2000 American Gas Association, All Rights Reserved
Additional copies of this report may be ordered from:
AGA Distribntion Center
P.O. Box 79230
Baltimore, MD 21279-0230
U.S.A.
Phone: (301) 617-7819
Fax: (301) 206-9789
Web site: www.aga.org/catalog
11
Ththeac:ap
AlAlmwlh
Re:h1<J1
dei
•
FOREWORD
This report is published as a recomrnended practice and is not issued as a standard. It has been writlen inthe forro of a perforrnance-based specification. Multipath ultrasonic meters should meet or exceed theaccuracy, functional and testing requirements specified in this report and users should foIlow theapplicable instaIlation recommendations.
AGA Engineering Technical Note M-96-2-3, Ultrasonic Flow Measuremenr [or Narural GasApplicatiolls, is included in Appendix C, as a source of background inforroation on ultrasonic gasmetering. Contents of this technical note were based on the information avaiJable when the note waswrítten in March 1996. Therefore, in case of any conflict between the information in the main report andthe technical note (Appendix C) the content in the main report prevails.
Research test results and flow-rneter calibration data have indicated that multipath ultrasonic flow meterscan accurately measure gas flow rate when installed with upstream piping lengths sufficient to producefuIly developed turbulent flow-velocity profiles. Various combinations of upstream fittings, valves andlengths of straight pipe can produce profile disrurbances at the meter inlet that may result in flow-ratemeasurement errors. The amount of meter error will depend on the magnitude of the inlet velocity profiledistortion produced by the upstream piping configuration and the meter's ability to compensate for thisdístortion. Other effects that may also result in flow-rate measurement errors for a given installationinelude levels of pulsation, range of operating pressures and ambient temperature conditions,
A flow calibratíon of each meter may be necessary to meet the accuracy requirements specified in thisreporto Flow-calibration guidelines are provided for occasions when a flow calibration is requested by theuser to verify the meter' s accuracy or to apply a calibration factor to minimize the measurementuncertainty (see Appendix A).
Unlike most traditional gas meters, multipath ultrasonic meters inherent1y have an ernbeddedmicroprocessor system. Therefore, this report ineludes, by reference, a standardized set of internationaltesting specifications applicable to electronic gas meters. These tests, sumrnarized in Appendix B, areused to demonstrate the acceptable performance of the rnultipath ultrasonic meter' s electronic systerndesigu under different influences and disturbanees.
This report offers general eriteria for the measurement of gas by multipath ultrasonic meters, It is thecumulative result of years of experience of many individuals and organizations acquainted withmeasuring gas flow rate. Changes to this report may beeome neeessary from time to time. When anyrevisions are deerned advisable, recommendations should be forwarded to: Operating Section,American Gas Association, 400 North Capitol Street, NW, 4th Floor, Washington, De 20001, U.S.A.A forro is included for that purpose at the end of this reporto
111
ACKNOWLEDGMENTSReport No. 9, Measurement af Gas by Multipatb Ultrasonic Meters, was developed by a TransmissionMeasurement Committee (TMC) task group, ehaired by John W. Stuart, Paciñc Gas and Eleetrie Co.Subsequently, a special subcomrnittee of the task group was formed to evaluate and resolve tbecornments received tbrougb balloting and prepare a final reporto
Tbe members of tbe special subcornrnittee wbo devoted many hours of tbeir valuable time and deservespecial tbanks and appreciation are:
Faeilitator
Daniel G. Harris, Columbia Gas Transmission Corp.
Members
Edgar B. Bowles, Jr., Southwest Researcb Institute
Frank Brown, Duke Energy Corp.
Paul D. Ceglia, Panametrics, Inc.
Pau] J. LaNasa, CPL & Assoeiates
Jobn Lansing, Instromet Ultrasonic Tecbnologies, Inc.
Jeffrey L Savídge, Gas Researcb Institute
Jobn W. Stuart, Pacific Gas and Electric Co.
Kevin L Warner, Daniel Flow Products, Inc.
James N. Wilte, Tennessee Gas Pipeline Co.
Staff Exeeutive
AJi M. Quraishi, American Gas Association
Three otber perseos, who belped tbe subcomrnittee and made substantial contributions, sbould also betbanked. Tbey are:
Jeffrey M. Dowdell, CNG Transmission Corp,
Terry A. Grimiey, Southwest Research Institute
Henry W. Poellnitz, III, Soutbern Natural Gas Co.
Task group members of tbe TMC (in addition to those mentioned aboye) who bad contributed to thedevelopment and finaJization of tbe report and deserve tbanks are:
Mark E. Anderson, Great Lakes Gas Transmission Co.
Pbilip P. Barg and Mike Rogi, NOVA Gas Transmission LId.
Claire Becker-Castle, Southern California Gas Co.
Jim S. Beeson, NorAm Gas Transmission
Cary Carter, Williams Gas Pipelines - Texas Gas
Iv
e
ssione Co,e the
serve
so be
lO the
Thornas R. Cornerford, Mercury Instruments, Ine.
GaryP. Corpron and Daniel W. Peace,Equimeter, Ine.
Glenn Dehler, formerly with TransCanadaPípel.ines, Ltd.
Robert D. MeLean, ANR PipelineCo,
George E. Mattingly, National Institute of Standards
KevinM. Moir, Michigan Consolidated Gas Co,
Ronald D. Rieh, Natural Gas PipelineCo,
Jerry Paul Smith, Transeontinental Gas PipeUne
Rick Wilsaekand Armin Bergmann, TransCanada PipeLines,Ltd,
Other members of the TMC who reviewed the doeument and responded, and should also be thanked are:
James P. Avioli, WiIliams Gas Pipelines- Transeo
MichaelT. Brown, NOVA Gas Transmission Ltd.
Craig A. Caldwel!, National Fuel Gas SupplyCorp,
Walter E. Fitzgerald, SEMCOEnergy, Inc,
James H. Gríffeth, Bristol Babcock, Inc,
James A. Jaekson, Dresser Industries, Inc.
Richard O. Lee, MeasurernentManagement Serviees
WiIliamR. Loll, Consumers Energy
Joseph R. Ranney, Southern California Gas Co,
Robert J. Schacht, Northern IndianaPubJie Service Co.
Tushar K. Shah, Amerieam Meter Co. - Auto System
KennethE. Starling, Starling Associates, Inc,
Fred Wenzel, Applied Autornation, Inc.
Daniel A. Zirnmerman,Reynolds EquipmentCo.
The fol!owing persons are not frorn AGA member or associate member eompanies, but they madeeontributions to the preparationof this reporto Their eontributionsare aeknowledged with thanks.
Stephen Baldwin, UnoealCorp.
R.E. (Ron) Beaty, AMOCO Corp.
Jan Bosio and Reidar Sakariassen, Statoil/K-Lab
StephenP. Chamberlain, AmericanPetroleumInstitute,:.'
Zaki D. Husain, Texaco, Inc,
Jan Drenthen, Instromet Ultrasonics, B.V.
v
Emrys Jones, Chevron Oil Field Research Co,
Gert Sloet, Gasunie Research
STo (Steve) Stark, Williams Energy Group
Fred Van Orsdol, Mid-AmericanPipeline Co.
AGA's Transmission Measurement Committee members represent a broad base oC experience innatural gas rneasurement technologies. Through its committee structure, AGA provídes themechanism by whlch these committee members' experiences and technical expertise are usedcollectively lo prepare industry guidelines, recommendations and reports,
lee ins theused
TABLE OF CONTENTS
1 Introduction .., 1
1.1 Scope 1
1.2 Principie 01 Measurement ·1
2 Terminology 1
3 Operating Conditions 2
3.1 Gas Qualily 2
3.2 Pressures 2
3.3 Temperatures, Gas and Ambient 2
3.4 Gas Flow Considerations 2
3.5 Upstream Piping and Flow Proliles 2
4 Meter Requirements : 3
4.1 Codes and Regulations 3
4.2 Meter Body 34.2.1 Maxlmum Operatlng Pressure 34.2.2 Corroslon Reslstanee 34.2.3 Meter Body Lengths and Bores 34.2.4 Ultrasonle Transdueer Ports 34.2.5 Pressure Tap 44.2.6 Mlseellaneous 44.2.7 Meter Body Marklngs 4
4.3 Ultrasonic Transducers 54.3.1 Speellleatlons 54.3.2 Rate 01 Pressure Change 54.3.3 Exehange 54.3.4 Transdueer Tests 5
4.4 Eleetronics 54.4.1 General Requlrements 54.4.2 Output Slgnal Speclfieatlons 64.4.3 Electrleal Salety Deslgn Requlrements 6
4.5 Computer Programs ~ 64.5.1 Firmware : 64.5.2 Conllguration and Malntenance Software 7
vII
4.5.3 Inspecllon and Audltlng Funcllons 74.5.4 Alarms 74.5.5 Olagnosllc Measuremenls , 74.5.6 Englneerlng Unlls 8
4.6 Oocumenlallon 84.6.1 After Recelpl 01Order , 94.6.2 Belore Shlpmenl 9
5 Performance Requirements 9
5.1 Deflnilions , , 1O
5.2 General., 115.2.1 Large Meler Accuracy 115.2.2 Small Meler Accuracy 12
5.3 Pressure, Temperalure and Gas Composilion Influences 12
6 Individual Meter Testing Requirements 13
6.1 Leakage TesIs 13
6.2 Dimensional Measuremen.ls 13
6.3 Zero·Flow Verificalion Test (Zero Test) 13
6.4 Flow·Calibration Test 146A.1 Callbralion Faclors Adjuslment 156.4.2 Test Reports 15
6.5 Quality Assurance 15
71nstallation Requirements 16
7.1 Environmental Considerations 167.1.1 Temperature 167.1.2 Vlbralion 167.1.3 Eleclrlcal Nolse 16
7.2 Piping Configuration 167.2.1 Flow Olreclion 167.2.2 Plping Inslallallons 167.2.3 Prolrusions 177.2.4 Internal Surface 177.2.5 Thermowells 177.2.6 Acousllc Nolse Interlerence 187.2.7 Flow Condllloners 187.2.8 Orientallon 01 Meter : 187.2.9 Flllrallon 18
viii
".....,.•.• 7............7............ 7...........8
.......... 8........... 9........... 9
.........9
........10
........11
......... 11
......... 12
.......12
...... 13
.......13
.......13
.......13
.......14
........ 15'"...... 15
.......15
..... 16
......16....... 16....... 16....... 16
......16....... 16,"..... 16.......17· 17......17·...... 18......18......18...... 18
7.3 Associated Flow Computer 187.3.1 Flow·Computer Calculatlons , , 18
7.4 Maintenance , , 19
8 Field Verification Tests 19
9 Reference List 20
APPENDIX A : Multipath Ultrasonic Meter Flow-Calibration Issues A-l
APPENDIX B : Electronic Design Testing - a s1andardized set of international
testing specifications applicable to electronic gas meters B·l
APPENDIX C : AGA Engineering Technical Note M-96-2·3, Ultrasonic Flow
Measurement for Natural Gas Applications, March 1996 C-l
FORM FOR PROPOSALS ON AGA REPORT NO. 9 P-l
Ix

r"
1 Introduction
1.1 Seope
Tbis report was developed for multipath u1trasonic transit-time flow meters, typically 6" and larger indiameter, used for the measurement of natural gas. Multipath ultrasonic meters have at least twoindependent pairs of measuring transducers (acoustic paths). Typical applications inelude measuring theflow of large volumes of gas through production facilities, transmission pipelines, storage facilities,distribution systemsand large end-usecustomer meter sets.
1.2 Principie of Measurement
Multipath u1trasonic meters are inferential meters that derive the gas flow rate by measuring the transittimes of high-frequency sound pulses. Transit times are measured for sound pulses traveling diagonallyacross the pipe, downstream with the gas flow and upstream against the gas flow. The difference in thesetransit times is related to the average gas flow velocity along the acoustic paths. Numerical calculationtechniques are then used to compute the average axial gas flow velocity and the gas volume flow rate atlineconditions through the meter.
Theaccuracy of an ultrasonicgas meter depends on several factors, such as
• precise geometry 01 the meter body and u1trasonic transducerlocations
• the integration techniqueinherent in the design of the meter
• the quality of the flow profile, levels of pulsation that exist in the flowing gas stream and gasuniforrnity
• the accuracyof the transit-timemeasurements
Theaccuracy of the transit-time measurement depends on
• the electronic clock stability
• consistent detectionof soundpulse wave reference positions
• proper compensation for signa!delays of electroniccomponents and transducers
2 Terminology
Forthe purposes of this report, the followingdefinitions apply:
auditor Representative of the operator or other interested party that audits operation of multipathultrasonicmeter.
designer
inspector
manufacturer
operator
SPU
UM
Company that designs and constructs metering facilities and purchases multipathultrasonic meters,
Representative of the designer who visits the manufacturer's facilities for qualityassurancepurposes.
Companythat designs, manufactures, sells and deliversmultipath ultrasonic meters.
Company that operates multipathultrasonic meters and performs normal maíntenance,
Signal Processing Unit, the portion of the multipath ultrasonic meter that is made up ofthe electronicrnicroprocessor system. "
Multipathultrasonicmeter for measuringgas flow rates.
3 Operating Conditions
3.1 Gas Quality
The meter shall, as a minimum requirement, operate witb any of tbe "normal range" natural gascomposition mixtures specified in AGA Report No. 8. Tbis includes relative densities between 0.554(pure methane) and 0.87.
The manufacturer sbould be consulted if any of tbe fol1owing are expected: 1) acoustic wave attenuatingcarbon dioxide levels are aboye 10%, 2) operation near the critical density of the natural gas mixture, or3) total sulfur level exceeds 20 grains per lOO cubic feet (320 PPM approx.), including mercaptans, R2S
and elemental sulfur compounds.
Deposits due to normal gas pipeline conditions (e.g., condensates or traces of oil mixed witb míll-scale,dirt 01' sand) may affect tbe meter's accuracy by reducing the meter's cross-sectional area, Deposits mayalso attenuate or obstruct tbe ultrasonic sound waves emitted from and received by tbe u1trasonictransducers, and in sorne designs reflected by tbe internal wall of tbe meter.
3.2 Pressures
Ultrasonic transducers used in UMs require a minimum gas density (a fonction of pressure) to ensureacoustic coupling of tbe sound pulses to and from tbe gas. Therefore, tbe designer shall specify tbeexpected mínimum operating pressure as well as tbe maxirnum operating pressure.
3.3 Temperatures, Gas and Ambient
The UM should operate over a flowing gas temperature range of -130 to 1310 F (-25 0 to 550 C). Thedesigner shall specify tbe expected operating gas temperature range.
The operating ambient air temperature range sbould be at a minimum -130 to 1310 F (_250 to 55 0 C). Thisambient temperature range applies to the meter body witb and without gas flow, fíeld-mountedelectronics, ultrasonic transducers, cabling, etc.
The manufacturer shall state the flowing gas and ambient air temperature specifications for the multipatbultrasonic meter, if tbey differ from tbe above.
3.4 Gas Flow Considerations
The flow-rate limits that can be measured by a UM are determined by tbe actual velocity of tbe flowinggas. The designer should determine the expected gas flow rates and verify tbat these values are within theq,,;", q, and q""" specified by the manufacturer (see Section 5.1 for definitions). The accuracyrequirernents for operation within qmm, q, and q_ are stated in Sections 5.2, 52.1 and 5.2.2 of tbis reportoThe designer is cautioned to examine careful1y the maxirnum velocity for noise and piping safety(erosion, thermowel1 vibrations, etc.) concerns,
UMs have the inherent capability of measuring flow in either direction wíth equal accuracy; i.e., they arebi-directional, The designer should specify if bi-directional measurernent is required so that themanufacturer can properly configure the SPU parameters.
3.5 Upstream Piping and Flow Profiles
Upstream piping configurations may adversely affect tbe gas velocity profile entering a UM to such anextent that measurement error occurs, The magnitude of tbe error, if any, willbe a fonction of the meter' sability to correctly compensate for such conditions, Research work on meter installation effects isongoing, and the designer should consult the manufacturer and review the latest meter test results to
2
rd
4.2.4 Ullrasonlc Transducer Ports
evaluate how the aecuraey of a UM may be affected by a particular piping installation configuration.Further recommendations are provided in Section 722 of this reporto
4 Meter Requirements
4.1 Codes and Regulations
The meter body and all other parts, including the pressure-containing structures and external electroniecomponents, shall be designed and constructed of materials suitable for the serviee eonditions for whichthe meter is rated, and in aeeordanee with any eodes and regulations applieable to eaeh specifie meterinstallation, as speeified by the designer.
Unless otherwise speeified by the designer, the meter shall be suitable for operation in a facility suhjeetto the U"S" Department of Transportation's (DOT) regnlations in 49 C.ER. Part 192, Transportation ofNatural and Other Gas by Pipeline: Minimum Federal Safety Standards.
4.2 Meter Body
4.2.1 Maxlmum Operating Pressure
Meters should be manufactured to meet one of the eommon pipeline flange classes - ANSI Class 300,600, 900, etc. Tbe maximum design operating pressure of the meter should be the lowest of the maximumdesign operating pressure of the followíng: meter body, flanges, transdueer connections, transdueerassemblíes.
Tbe required maximum operating pressure shall be determined using the applieable eodes for thejurisdiction in which the meter will be operated and for the specified environmental temperature range.Tbe designer should provide the manufacturer with inforrnation on aII applieable eodes for theinstallation site and any other requirements speeifie to the operator.
4.2.2 Corroslon Reslslance
AI1 wetted parts of the meter shaII be manufactured of materials compatible with natural gas and relatedfluids.
AIl external parts of the meter should be made of a noneorrosive material or sealed with a eorrosionresistant eoating suitable for use in atmospheres typícally found in the natural gas índustry, and/or asspeeified by the designer,
4.2.3 Meter Body Lenglhs and Bores
The manufaeturers should publish their standard overall face-to-face length of the meter body withflanges, for eaeh ANSI flange class and diameter, Tbe designer, as an option, may speeify a differentlength to match existing piping requírernents.
Tbe UM bore and the adjaeent upstream pipe along with flanges should have the sarne inside diameter towithin 1% of eaeh other. For bi-direetional applications, both ends of the meter should be eonsidered"upstream."
"Because natural gas may eontain sorne impurities (e.g., ligbt oils or eondensates), transdueer ports shouldbe designed in a way that reduces the possibílity of liquids or solids aecumulating in the transducer ports.
3
If specified by tbe designer and available from tbe manufacturer, the meter should be equipped witbvalves and necessary additional devices, mounted on the transducer ports in order to make it possible toreplace the ultrasonic transducers witbout depressurizing tbe meter ron> In that case, a bleed valve may berequired in addition to tbe isolation valve to ensure that no pressure exists behind a transducer beforereleasing the extraction mechanism,
4>2.5 Pressure Tap
At least one pressure tap shall be provided for measuring the static pressure in the meter. Each pressuretap hole should be between 1/8" and 3/8" nominal in diameter and cylindrical over a length at least 2.5times tbe diameter of the tapping, measured from the inner wall of the meter body. The tap hole edges atthe intemal wall of the meter body should be free of burrs and wire edges, and have mínimum rounding.For a meter body with a wall thickness less than 5/16", the hole should be 118" nominal in diameter.
Female pipe threads should be provided at each pressure tap for a 1/4" NPT or 112" NPT isolation valve.Tuming radius clearance should be provided to alIow a valve body to be screwed directly into tbepressure tapo Pressure taps can be located at the top, left side, andlor right side of the meter body.Additional taps may provide the designer with flexibility in locating pressure transducers formaintenance access and proper drainage of gauge line condensates back into tbe meter body.
4.2.6 Mlscellaneous
The meter should be designed in such a way that the body will not rol! when resting on a smootb surfacewitb a slope of up to 10%. This is to prevent damage to tbe protruding transducers and SPU when theUM is temporarily set on the ground during installation or maintenance work.
The meter should be designed to permit easy and safe handling of the meter during transportation andinstallation. Hoisting eyes or clearance for lifting straps should be provided.
4.2.7 Meter Body Marklngs
A nameplate containing tbe fol!owing information should be affixed to tbe meter body.
• the manufacturer, model number, serial number and montb and year manufactured
• meter size, flange class and total weigbt
• intemal diameter
• maximum and minimum storage temperatures
• body design code and material, and flange design code and material
• maximum operating pressure and temperature range
• maximum and mínimum actual (at flowing conditions) volumetric flow rate per hour
• direction of positive or forward flow
• (optional) purchase order number, shop order number andlor user tag number
Each transducer port should be permanently marked with a unique designation for easy reference, Ifmarkings are stamped on the meter body, low-stress stamps that produce a rounded bottom impressionshould be used.
4
-
UI!rasonic Transducers
4.3.1 Speclllcatlons
The manufacturers should state the general specifications of their ultrasonic transducers, such as criticaldinlensions, maximum allowable operating pressure, operatíng pressure range, operating temperaturerange andgas composition limitations,
The manufacturer should specify the mínimum operating pressure based on the ultrasonic transducermodel. UM size and expected operating conditions, This mínimumpressure should be marked 01' taggedon the UM to alert the operator's field personnel that the meter may not register flow at reduced pipelinepressures.
4.3.2 Rate 01 Pressure Change
Sudden depressurization of an ultrasonic transducer can cause darnage if a trapped volume of gasexpands inside the transducer. If necessary, elear instructions should be provided by the manufacturerfordepressurization and pressurization of the meter and transducers during installation, start-up,maintenance and operation,
4.3.3 Exchange
It shall be possible to replace or relocate transducers without a significantchange in meter performance.This means that after an exchange of transducers and a possible change of SPU software constantsdirected by the manufacturer, the resulting shift in the meter' s performance shall not be outside the limitsof the performance requirements specífied in Sections 5.2, 5.2.1 and 5.2.2. The manufacturer shouldspecify procedures to be used when transducers have to be exchanged, and possible mechanical,elec!rical or other measurements and adjustments have to be made,
4.3.4 Transducer Tes!s
Each transducer 01' pair of transducers should be tested by the manufacturer and the results documentedas par! of the UM's quality assurance prograrn, Each transducer should be marked 01' tagged wilh aperrnanent serial number and be províded with the general transducer data listed in Section 4.3.L If theSPU requires specific transducer characterization pararneters, each transducer 01' transducer pair shoulda1so be provided with test documentation that contains the specific calibration test data, calibrationmethod used and characterizationparameterfs),
4.4 Electronics
4.4.1 GeneralRequlremen!s
111e UM's electronics system, ineluding power supplies, mícrocomputer, signal processing componentsand ultrasonic transducer excitation circuits, may be housed in one al' more enelosures mounted on 01'
next to the meterand is referred to as a Signal Processing Unit (SPU).
Optionally, a remate unit containing the power supplies and the operator interface could be insta1led in anonhazardous area and connected to the SPU by multi-conductorcable.
111e SPU should operate over its entire specified environmental conditions within the meter performancerequiremems specified in Sections 5.2, 5.2.1 and 5.2.2. It should a1so be possible to replace the entireSPU 01' change any field replacement module wilhout a significant change in meter performance."Significant change" is explained in Section 4.3.3. "
5

The system should contain a watch-dog-timer function to ensure automatic restart of the SPU in the eventof a program fault or lock-up.
The meter should operate frorn a power supply of nominal 120V AC or 240V AC at 50 or 60 Hz or fromnominal 12V DC or 24V DC power supplylbattery systems, as specified by the designer,
4.4.2 Oulpul Signal Speclflcalions
The SPU should be equipped with at least one of the following outputs.
• serial data interface; e.g., RS-232, RS-485 01' equivalenl
• frequency, representing flow rate al line conditions
The meter may also be equipped wíth an analog (4-20mA, DC) output for flow rate al line conditions.
Flow-rate signal should be scaleable up lo 120% of the meter' s maximum flow rate, qllW<'
A low-flow cutoff function should be provided that sets the flow-rate output lo zero when the indicatedflow rate is below a minimum value (not applicable lo serial dala output).
Two separate flow-rate outputs and a directional state output or serial data values should be provided forbi-directional applications lo facilitate the separate accumulation of volumes by the associated flowcomputer(s) and directional state output signal.
AlI outputs should be isolated from ground and have the necessary voltage protection to meet theelectronics design testing requirements of Appendix B.
4.4.3 Electrlcal Satety Deslgn Requll'éments
The design of the UM, including the SPU, should be analyzed, tested and certified by an applicablelaboratory, and then each meter should be labeled as approved for operation in a National Electric CodeClass r, Division 2, Group D, Hazardous Area, at a minimum. Intrinsically safe designs and explosionproof enclosure designs are generally certified and labeled Ior Division 1 Iocations, The designer mayspecify the more severe Division 1 location requirement to achieve a more conservative installationdesigno
Cable jackets, rubber, plastic and other exposed parts should be resistant to ultraviolet light, f1ames, oiland grease,
4.5 Computer Programs
4.5.1 Firmware
Computer codes responsible for the control and operation of the meter should be stored in a nonvolatilememory, All f1ow-calculation constants and the operator-entered parameters should also be stored innonvolatile memory.
For auditing purposes, it should be possible to verify all f1ow-calculation constants and pararneters whilethe meter is in operation.
The manufacturer should maintain a record of all firmware revisions, including revisión serial number,date of revision, applicable meter models, circuit board revisions and a description of changes to thefirmware.
The firmware revision number, revisión date, serial number andlor checksum should be available to theauditor by visual inspection of the firmware chip, display or digital communications port.
6
.~
manufacturer may offer firmware upgrades from time to time to improve the performance of themeter or add additional features. The manufacturer shall notify the operator if the firmware revision willaffect theaccuracy of a flow-calibrated meter.
4.5.2 conftguration and Maintenance Software
The meter should be supplied with a capability for local or remote configuring of the SPU and formonitoring the operation of the meter, As a mínimum, the software should be able to display and recordthe following measurements: flow rate at line conditions, mean velocity, average speed of sound, speedof sound along each acoustic path and ultrasonic acoustic signal quality receíved by each transducer, Asan option, the manufacturer can provide these software functions as part of the meter's embeddedsoftWare.
4.5.3 Inspection and Auditing Functions
It should be possible for the auditor or the inspector to view and print the flow-rneasurernentconfignration parameters used by the SPU; e.g., calibration constants, meter dimensions, time averagingperiod andsamplingrateo
Provisions should be made to prevent an accidental or undetectable alteration of those parameters thataffects the performance of the meter. Suitable provisions include a sealable switch or jumper, apermanent programmable read-only memory chip or a passwordin the SPU. .
(Optional) It should be possible for the auditor to verify that all algorithms, constants and confignrationparameters being used, in any specific meter, are producing the same or better performance as when themeter design was originally flow-tested or when the specific meter was last flow-calibrated and anycalibration factors were changed. T\Je auditor may have to rely on the manufacturer for portions of thisverification because of the proprietary nature of sorneUM algorithms.
4.5.4 Alarms
The following alarm-status outputs should be provided in the form of fail-safe, dry, relay contacts orvoltage-free solid-stateswitches isolatedfromground.
• outputinvalid: when the indicated flow rate at line conditions is invalid
• (optional) trouble: when any of several monitoredpararneters fall outsideof normal operation fora significant period of time
• (optional) partial failure: whenone or more of the multipleultrasonic path results is not usable
4.5.5 Dlagnostic Measurements
The manufacturar should provide the following and other diagnostic measurements via a serial datainterface; e.g., RS-232, RS-485or equivalent.
• averageaxial flow velocity through the meter
• flow velocity for each acoustic path (or equivalentfor evaluation of the flowing velocityprofíle)
• speed of sound along each acoustic path
• averagespeed of sound
• velocitysamplinginterval
• averaging time interval
• percentageof acceptedpulsesfor each acoustic path
• status and measurement quality indicators
• a1arm and failure indicators
7
I
L_
4.5.6 Englneering Unlls
The following units should be used for the various values associated with the UM.
Parameter U.S. Units sr Units
density lb/cf kglm'
energy Btu J
mass lb kg
pipe diameter in mm
pressure psi 01' lbf/in' bar 01' Pa
temperature °F ocvelocity fús mis
viscosity, absolute dynarnic lb/íft-sec) cP or Pa-s
volume cf m'
actual (at flowing conditions) volume flow rate acflh am'lh
4.6 Documentation
Other sections of this report require documentation on accuracy, instaIlation effects, electronics,ultrasonic transducers and zero-flow verification, The manufacturer should also provide all necessarydata, certificates and documentation for a correct configuration, set-up and use of the particular meter sothat it opera tes correctly. This includes an operator' s manual, pressure test certificates, materialcertificates, measurernent report on all geometrical parameters of the spool piece and certificatesspecifying the zero-flow veriñcation parameters used. Quality-assurance documentation shouId beavailable for the inspector 01' the desiguer upon request.
The manufacturer should provide the following set of documents, at a minimum. All documentationshould be dated.
a. a description of the meter, giving the technical characteristics and the principIe of its operation
b. a perspective drawing 01' photograph of the meter
c. a nomenclature of parts wíth a description of constituent rnaterials of such parts
d. an assembly drawing with identification of the component parts listed in the nomenclature
e. a dimensioned drawing
f. a drawing showing the location of verification marks and seals
g, a dimensioned drawing of metrologically important components
h. a drawing of the data plate 01' face plate and of the arrangements for inscriptions
i. a drawíng of any auxiliary devices
j. instructions for installation, operation, periodic maintenance and trouble-shooting
k. maintenance documentation, including third-party drawings for any field-repairable components
1. a description of the electronic SPU and its arrangernent, and a general description of its operation
m. a description of the availabIe output siguals and any adjustment mechanisms
B
----_.• ,._----
n. a list of electronic interfaces and user wiring terrnination points with their esseutialcharacteristics
o, a description of software functions and SPU configuration parameters, inc1uding their defaultvalue and operating instructions
p. documentation that the design and construction comply with applicable safety codes andregulations
q, documentation that the meter's performance meets the requirements of Section 5, "PerformanceRequirements"
1', documentation that the meter' s design successfully passed the tests in Appendix B, "ElectronicsDesign Testing"
s, upstream and downstream piping configurations in minimum length that will not create anadditional flow-rate measurement error of more than ± 03%
t, maximum allowable flow-profile disturbance, which will not create an additional flow-ratemeasurement error of more than ± 0.3%
u, a field verification test procedure as described in Section 8
v, a list of the documents submitted
4.6.1 After Recelpt of Order
The manufacturer should fumish specific meter outline drawings, inc1uding overall flange face-to-facedimensions, inside diarneter, maintenance space clearances, conduit connection points and estimatedweight, '
The manufacturer should provide a recornmended Iist of spare parts.
The manufacturer should also fumish rneter-specific electrical drawings that show customer wiringtennination points and associated electrical schematics for al! circuit components back to the firstisolating component; e.g., optical isolator, relay, operational amplifier, etc. This will allow the designerto properly design the interfacing electronic circuíts.
4.6,2 Before Shlpment
Prior to shipment of the meter, the manufacturer should make the following avallable for the inspector' sreview: metallurgy reports, weld inspection reports, pressure test reports and final dimensionalmeasurements as required in Section 6.2.
5 Performance Requirements
This section specifies a set of minimum measurernent performance requirements that UMs must rneet, Ifa meter is not flow-calibrated, the manufacturer shall provide sufficient test data confirrning that eachmeter shall meet these performance requirements. The desígner may also specify that a meter be flowcalibrated per Section 6.4. If a meter is flow-calibrated, then it shall meet the same rninimummeasurement performance requirements before the application of any calibration-factor adjustmeut. Theamount of calíbratíon-factor adjustment, therefore, should be within the error lirnits stated in theperformance requírernents, This is to ensure that a major flaw in the meter iJ not masked by a largecalibratíon-factor adjustment. Calibration-factor adjustments are made lo rninirnize a meter' smeasurement bias error, The designer is referred to Appendix A and Section 6.4.1 for an explanation of
9
the metbods and henefits of flow-calibrating a meter and for calibration-factor adjustment. The designershould a1so follow carefully tbe installation recornrnendations of Section 7, as any installation effects willadd to the overall measurement uncertaínty.
For each meter design and size, the manufacturer shall specify flow-rate limits for qmin, q, and q"", asdefined in Section 5J. Each UM, whether flow-calibrated or not, shall perforrn wilhin the more accuratemeasurement range for gas flow rates frorn q, to q"", and within the less accurate range for gas flow ratesless than q, but greater than or equal to qmm, as defined in Sections 5.2, 5.2.1 and 5.2.2.
5.1 Definilions
Deviation The dífference between the actual volume flow rate (e.g.•flow rates in engineering units of acflh) measured by themeter under test and the actual volume flow rate measuredby a reference meter. Corrections shal1 be made for thedifferences in flowing gas pressure, temperature andcompressibility between the two meters. The deviation isa1so measured as a difference between the mass flow ratethrough the meter under test and the mass flow ratethrough the reference meter. Typical1y, three or more testruns are averaged to establish the deviation al eachnominal flow rate. These test runs can be used to determinethe repeatability as defmed below.
Errór The observed deviation of a meter calculated as: PercentError = [(Test Meter Reading - Reference Meter Reading)+ (Reference Meter Reading)] x 100.
Maximum Error The allowable error limit within the specified operationalrange of the meter, as shown in Fignre 1 and Sections 5.2.1and 5.2.2.
Maximum Peak-te-Peak Error The largest a1lowable difference between the upper-mosterror point and the lower-most error point as shown inFigore 1 and Section 5.2. This applies to a11 error values inthe flow-rate range between q, and q"",.
qmou The maximum gas flow rate through the UM that can bemeasured within the error Iimits, as shown in Sections5.2.1 and 5.2.2 for large and small meters, respectively.
q, The transition gas flow rate below which the expandederror limit is applicable, and where q, ~ O.lq"",. See Figorel and Sections 5.2.1 and 5.2.2.
qmln The minimum gas flow rate through the UM that can bemeasured within the expanded error limits, as shown inFigure 1 and Sections 52.1 and 52.2.
q, The actual measured gas flow rate passing through a UMunder a specific set of test conditions. '
10
Reference Meter A meter or measurement device of proven flowmeasurernent accuracy.
Repeatability The closeness of agreement among a number ofconsecutíve measurernents of the output of the test meterfor the same reference flow rate under the same operatingconditions, approaching from the same direction, for fullscale traverses. The repeatability shall correspond to the95% confidence interval oí the deviation based on theassumption of a normal distríbution. See Section 5.2.
Resolution The smallest step by which the change oí the flow velocityis indicated by the meter. See Seetion 5,2.
Velocity Sampling Interval The time interval between two succeeding gas velocitymeasurements by the fuli set of transducers or acousticpaths, Typicaliy, between 0.05 and 0.5 seconds, dependingon meter síze. See Section 5.2.
Zero-Flow Reading The maximum a1lowable flow-velocity reading when thegas is at rest; i.e., both the axial and the non-axial velocitycomponents are essentiaIly zero, See Section 5,2.
5.2 General
The general flow-measurernent performance of al/ UMs shall rneet the foliowing requirements, prior tomaking any calibration-factor adjustment,
Repeatability: 10.2% for q,S;q¡S;qmu
10,4% for qmin S;q¡< q,
Resolution: 0,003 ftls (0.001 rnfs)
Velocity Sampling Interval: ;;;1 second
Maximum Peak-te-Peak Error: 0.7% for q, S;q¡:>qmu
(See Figure 1)
Zero-FIow Reading: <0.040 ftls (12 mrnJs) for each acoustic path
5.2.1 Large Meter Accuracy
UMs of 12" (nominal) diameter size and larger shall meet the foliowing flow-rneasurernent accuracyrequirements, prior to making any calibration-factor adjustment.
-
Maximum Error: 10..7% for q,:> q, S;qmu
(See Figure 1) ±l,4% for q"", S;q¡ < q,
11
/,
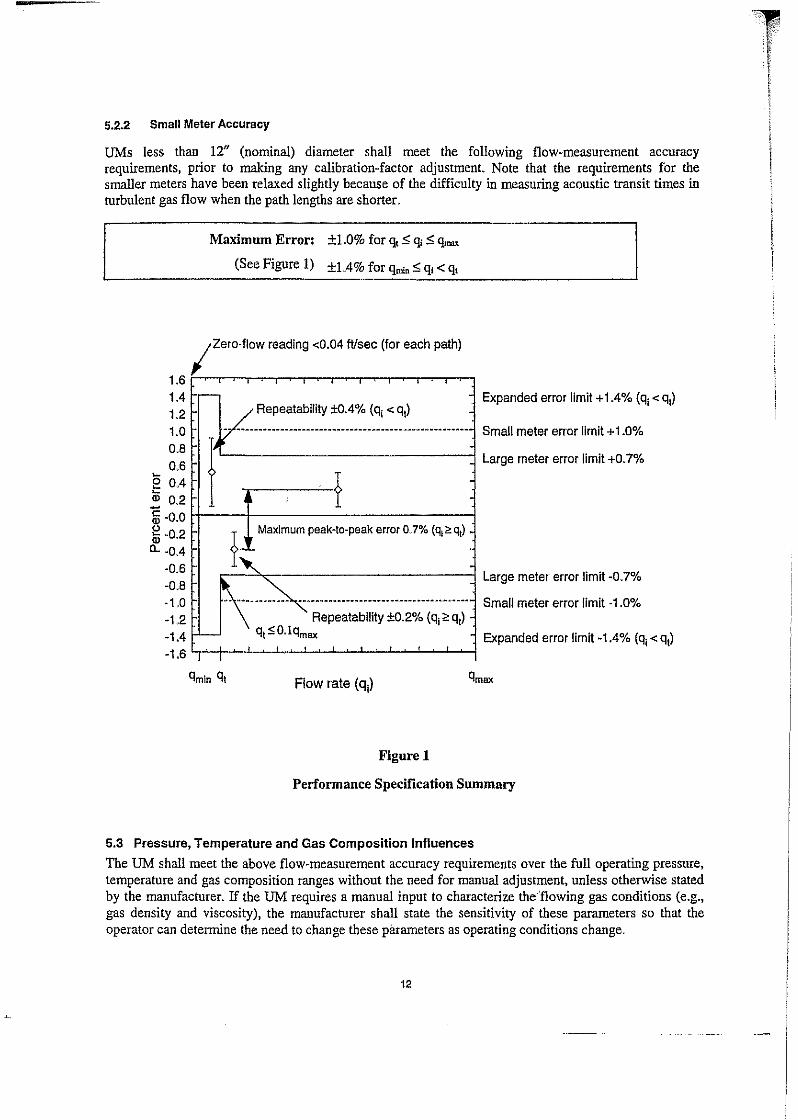
5.2.2 SmallMeler Accurecy
UMs less than 12" (nominal) diameter shal1 meet the following flow-measurernent accuracyrequirements, prior to making any calibration-factor adjustment. Note that the requirements for thesmaller meters have been re1axed slight1y because of the difficulty in measuring acoustic transit times inturbulent gas flow when the path lengths are shorter.
Maximurn Error: ±1.0%for q, S; q¡ S; _
(See Figure 1) +1 4'" f < <_ . 'lOor q";n _ q¡ q,
, , ,r-e--'
~_Repeatabllity±O.4% (q¡ < q,)- -__._.M_.____•__________•_____________•______________
I tt~ax¡mum peak-te-peak error 0.7% (q,",q,)
\·"~·~~~~~~~~i;i;;.;:;:(~:~·~;·- q,,,,O.lqmax---¡-~ , , , , , ,
I Zero-ftow reading <0.04 fVsec (foreach palh)
1.61.41.21.00.80.6g004
Ol 0.2
'53 -0.0oQ; -0.2a. -0.4
-0.6-0.8·1.0-1.2-1.4-1.6
Flow rate (q¡)
Figure 1
Expanded error IImit +1.4%(q¡ < q,)
Small meler errorIImi! +1.0%
Large metererror IImil +0.7%
Large meter error IImi! -0.7%
Small metererror IImi! -1.0%
Expanded error IImil·l.4% (q¡ < q,)
Performauce Specification Surnrnary
5.3 Pressure, Temperature and Gas Composition InfluencesThe UM shall meet the aboye flow-measurement accuracy requírernents over the fuIl operating pressure,temperature and gas composition ranges without the need for manual adjuslment, unless otherwise statedby the rnanufacturer. If the UM requires a manual input lo characterize theflowing gas conditions (e.g.,gas density and viscosity), the manufacturer shall state the sensitivity of these parameters so that theoperator can determine the need to change these parameters as operating conditions change.
12

6 Individual Meter Testing Requirements
prior to the shiprnent of each UM to the designer or the operator, the manufacturer sball perform tbefollowing tests and checks on each meter. The results of all tests and cbecks performed on each metershall be documented in a report (see Section 6.4.2) preparad by the manufacturer and submitted to tbedesigner or the operator.
6.1 Leakage Tests
Every UM, complete witb transducers and transducer ísolation valves (u used), shall be leak-tested bythe manufacturer after final assembly and prior to shipment to the designer or flow-calibration facility.The test medium should be an ínert gas, sucb as nitrogen. The leak test pressure shall be a mínimum of200 psig, maintained for a minimum of 15 minutes, with no leaks detectable with a noncorrosive liquidsolution or an ultrasonic leak detector as described in AS1M E 1002 - 93. Tbis leak test does notpreelude tbe requirements to perform a hydrostatic qualification test.
6.2 Dimensional Measurements
The manufacturer shall measure and document the average internal diameter of tbe meter, the length ofeach acoustic patb between transducer faces and tbe axial (meter body axis) distance between transducerpairs.
The average internal diameter should be calculated from a total of 12 inside diameter measurements orthe equivalent deterrníned by a coordinate measuring machíne. Four internal diameter measurements (onein tbe vertical plane, anotber in tbe horizontal plane and two in planes approximately 45° from tbevertical plane) shall be made at three meter cross-sections: 1) near tbe ser of upstream ultrasonictransducers, 2) near the set of downstream transducers and 3) half way between the two transducer sets.
If tbe acoustic patb lengths or tbe axial distances between ultrasonic transducer pairs cannot be directiymeasured, then tbe unknown distances shall be calculated using right-angle trigonometry and distancesthat can be measured directly. Where tbe measurement of angles is difficult and tbe result is imprecise,such measurements shall not be used to calculate tbe required distances.
The meter body temperature shall be measured at tbe time tbese dimensional measurements are made,The measured lengths shall be corrected to an equivalent length at a meter body temperature of 68° F(20° C) by applying the applicable coefficient of thermal expansion for tbe meter body material. Theindividual corrected lengths shall tben be averaged and reported to tbe nearest 0.0001" (0.01 mm).
AlI instruments used to perform tbese measurements sball have valid calibrations traceable to nationalstandards; e.g., NIST in U.S.A.
These measurements and calculations shall be documented on a certificate, along witb tbe name of tbemeter manufacturer, meter model, meter serial number, meter body temperature at tbe time dimensionalmeasurements were made, date, name of tbe individual wbo rnade tbe measurements and name of tbeinspector if present.
6.3 Zero-Flow Verification Test (Zero Test)
To verify tbe transit-tirne measurement system of eacb meter, the manufacturer shal1 perform a ZeroFlow Verification Test. Tbe manufacturer shall document and follow a detailed test procedure tbatineludes the following elernents, at a minimum.
• After blind flanges are attacbed to tbe ends of tbe meter body, the meter shall be purged of all airand pressurized witb a pure test gas or gas mixture. Tbe selection of tbe test gas shall be tbe
13
•
responsibility of the manufacturer. However, the acoustic properties of the test gas must be wellknown and documented.
• The gas pressure and temperature shall be allowed to stabilize at the outset of the test The gasvelocities for each acoustic path shall be recorded for at least 30 seconds. The mean gas velocityand standard deviation for each acoustic path shall then be calculated,
• Adjustments to the meter shall be made as necessary to bring the meter performance intocompliance with the manufacturer' s specifications and the specifications stated in this reporto
If the measured speed-of-sound values are compared with theoretical values, the theoretically deterrninedvalue shall be computed using a complete compositional analysis of the test gas, precise measurements ofthe test gas pressure and temperature and the equation of state used in AGA Report No. 8, "DetailCharacterization Method."
As part of the test procedure, the manufacturer shall document the ultrasonic transducer serial numbersand their relative locations in the meter body. The manufacturer shall also document all parameters usedby the meter; e.g., transducer/electronic transit-time delays, incremental timing corrections, and allacoustic path lengths, angles, diameters and other parameters used in the calculation of the gas velocityfor each acoustic path, The manufacturer should note if the constants are dependent on specifictransducer pairs.
The manufacturer may also implement a zero-flow offset factor, in engineering units of positive ornegative feet per second or meters per second. This zero-flow offset factor would be applied to themeter's flow-rate output, Use of this factor is intended to improve the accuracy of the low gas velocitymeasurements, while not significantly affecting the accuracy of the higher velocity measurements, Thiszero-flow offset factor, if use,d, shall be documented by the manufacturer.
6.4 Flow·Calibration Test
If specified by the designer, the UM should be flow-calibrated. If a flow calibration is performed, thefollowing nominal test flow rates are recornrnended, at a mínimum: qmin, 0.10 q""", 0.25 q""" , 0040 q""",0.70 q""", and q""". The designer may also specify additional flow calibration tests at other flow rates.(See the example in Appendix A, where additional tests at 0.15 q""" and/or 0.20 q"""could be useful).
Flow-calibration tests should be performed at a gas pressure, temperature and density near the expectedaverage operating conditions as specified by the designer, Tests at any other specific pressure,temperature and gas density range may be performed, if necessary. The designer may also requíre thatspecific piping confignrations and/or flow conditioners be used during flow calibration, understandingthat differences in upstream piping confignrations may influence meter performance.
It is recognized that it may not be possible to test large UMs up to their maximum capacity because of thelimítations of currently available test facilities. In such cases, the designer may specify a lower flow rateinstead of q""x- The manufacturer should state on all applicable documents if a reduced q""" was usedduring flow-calibration tests.
The upstream flange and piping internal diameters should match and be aligned with the meter under testas specified in Section 7.2.3, "Protrusions",
All test measurements perforrned by a flow-calibration facility should be traceable with currentcalibration certificates to the applicable national standards; e.. g., in the United States, traceable to NIST.Any property or thermophysical values (e.g.., density, compressibility, speed of sound, critical flowfactor, etc.) used during flow calibration shall be computed from AGA Report No. 8, "DetailedCharacterizatíon Method Equation of State",
."The designer and the operator are encouraged to release test results to the gas industry, including flow-measurement accuracy data before and after calibratiou factors are applied. This will enable the
14
1
manufacturers to dernonstrate UM performance and will facilitate research evaluation of current UMtechnology, The Gas Research Institute currently has a program to compile UM calihration data
6.4.1 Callbratlon Factors Adjustmant
lf a meter is flow-calibrated, the calibration factors should norrnally be applied to eliminate any indieatedmeter bias error. Sorne suggested rnethcds of applying calibration faetors are:
a) Using flow-weighted mean error (FWME) over the meter's expected flow range (the calculation ofFWME is shown in Appendix A)
b) Using a more sophistieated error correction scheme (e.g., a rnulti-point or polynornial algoríthm, apieeewise linear interpolation method, etc.) over the meter' s range of flow rates,
For bi-directional flow calibrations, a second set of ealibration factors may be used for reverse flow.
lf an offset factor was established during the zero-flow validation tests, it may be revised based on theresults of the flow calibration to optirnize the meter' s overall accuracy performance. The manufacturershall document such a change in this factor and alert the operator that the zero-flow output may havesorne intentional bias in order to improve aecuraey at qmin'
6.4.2 Test Reports
The results of each test required in Section 6, shall be documented in a written report supplied to thedesigner or the operator by the manufacturero For eaeh meter, the report shall include, at a minimum:
a, the name and address of the manufacrurer
b. the name and address of the test facility
c. the model and serial number
d. the SPU fumware revision number
e" the date(s) of the test
f. the name and title of the persones) who eondueted the tests
g. a written description of the test procedures
h. the upstream and downstream piping eonfignrations
i. a diagnostie report of the software configuration pararneters
j. all test data, ineluding flow rates, pressures, temperatures, gas composition and the measurernentuncertainty of the test faeility
k. a deserlption of any variations or deviations from the required test eonditions
At least one eopy of the complete report shall be sent to the designer or the operator and one eopyretained in the manufaeturer's files. The manufaeturer shall ensure that the complete report is available tothe operator on request, for a perlod of 10 years after shipment of any meter.
6.5 Ouality Assurance
The manufaeturer shall establish and follow a written comprehensive quality-assurance program for theassembly and testing of the meter and its electronie systern (e.g., ISO 9000, API Speeifieation Ql, etc.).This quality-assurance program should be available to the inspector.
,,'
15
7 Installation Requirements
This section is directed to the designer to ensure lhat lhe UM will be installed in a suitable environmentand in a piping confignration that allows the UM to meet the expected performance requirements.
7.1 Environmental Considerations
7.1.1 Temperature
The manufacturer shall provide ambient temperature specifications for the UM. Consideration should begiven to providing shade, heating andlor cooling to reduce the ambient temperature extremes.
7.1.2 Vlbratlon
UMs should not be installed where vibration levels 01' frequencies might excite the natural frequencies ofSPU boards, components 01' ultrasonic transducers. Tbe manufacturer shall provide specificationsregarding the natural frequencies of the UM components.
7.1.3 Eleclrlcal Noise
Tbe designer and the operator should not expose the UM 01' its connected wiring to any unnecessaryelectrical noise, including altemating current, solenoid transients 01' radio transmissions. Tbernanufacturer shall provide instrument specifications regarding electrical noise influences.
7.2 Piping Configuration
7.2.1 Flow Dlrectlon
For bi-directional applications, both ends of the meter should be considered "upstream,"
7.2.2 Piplng Installatlons
Various combinations of upstream fittings, valves and lengths of straight pipe can produce velocityprofile distortions at the meter inlet that may result in flow-rate measurement errors. Tbe amount ofmeter error will depend on the type and severity of the flow distortion produced by the upstream pipingconfiguration and the meter' s ability to compensate for this distortion. Research work on installationeffects is ongoing, so the designer should consult with the manufacturer to review the latest test resultsand evaluate how the accuracy of a specific UM design may be affected by the upstream pipingconfiguration of the planned installation. In order to achieve the desired meter performance, it may benecessary for the designer to alter the original piping configuration 01' include a flow conditioner as par!of the meter runo
1'0 ensure that the UM, when installed in the operator' s piping system, will perforrn wilhin the specifiedflow-rate measurement accuracy limits as shown in Sections 5.2, 5.2.1 and 5.2.2, the manufacturer shalldo one of the following as desired by the designer/operator:
1. Recornrnend upstream and downstream piping confignration in minimum length- one withont aflow conditioner and one with a flow conditioner - that will not create an additional flow-ratemeasurement error of more lhan ±O.3% due to the installation configuration. This error limitsbould apply for any gas flow rate between qmh> and qnnx' The recornrnendation should besupported by test data.
16
-
2. Specify the maximuma1lowable flow disturbance (e.g., the limits on swirl angle, velocity profileasyrnmetry, turbulence intensíty, etc.) at the meter' s upstream flange or at sorne specified axialdistance upstream of the meter that will not create an additional flow-rate measurement error ofmore than ±0.3% due to the installation configuration, This error limit should apply for any gasflow rate between qmi' and q""". The recomrnendation should be supportedby test data.
Instead of following the manufacturer's recornmendation in I or 2 aboye, the designer may choose toflow-calibrate the UM in si/u, or in a flow-calibration facility where the test piping configuration can bemade identical lo the planned installation,
Research has indicated that asyrnmetric velocity profiles may persíst for 50 pipe diameters or moredownstream from the point of initiation, Swirling velocity profiles may persist for 200 pipe diameters ormore. A flow conditíoner properly installed upstream of a 11M may help shorten the length of straíghtpiperequired to eliminate the effects of an upstreamflow disturbance. A UM may be able to compensatefor sorne level of f1ow-profile disturbance,Research is still being conducted to quantify the sensitivity ofdifferent UM designs to various flow-profile disturbances,
7.2.3 Protruslons
Changes in internal diameters and protrusions should be avoided at the UM inlet because they createlocal disturbances to the velocity profiles. The UM bore, flanges and adjacent upstream pipe should aIlhave the same inside diarneter, to within 1%, and be aligned carefully to minimize flow disturbances,especially at the upstream flange, The upstreamflange's internal weld should be ground smooth.
No part of the upstream gasket or flange face edge should protrude into the flow streamby more than 1%of the internal diameter, During installation, three or more insulating flange bolt sleeves can be used atthe 4,8 and 12 o'clock positions to keep the gasketcentered while tighteningthe nuts,
Thermowells, located as specified in Section 7.2.5, are excJudedfrom the aboyeprotrusion limits.
7.2.4 Internal Surface
The internal surface of the UM should be kept clean of any deposits due to condensares or traces of oilmixed with mill-scale, dirt or sand, which may affect the meter's cross-sectional area, The UM'soperation depends on a known cross-sectional area to convert mean gas velocity to a flow rate, If a layerof deposits accumulates inside the UM, the cross-sectional area will be reduced, causing a correspondingincrease in gas velocity and a positive measurement error.
Examples: Given a 6.000" internal diameterUM, a deposit layer of only 0.008" around the inside surfacewill cause a +0.53% flow-measurement error. For a 20.000" meter, the same 0.008" coating would causea +0.16% error. (For cornparison, 0.008" equals the thickness of two pieces of 20-pound copy machinepaper.)
7.2.5 Thermowells
For uni-directional flow, the designer should have the thennowell installed downstrearn of the meter. Thedistance from the downstream flange face to the thermowell should be between 2D and 5D. For bidirectional flow installations, the thermowell should be located at least 3D from either UM flange face,"D" is defined as the nominal diameter of the meter.
Research on the effects of thennowell placement is ongoing and the designer should consult with themanufacturerfor recornmendations based on the most current test data. The thermowell orientation withrespect to acoustic paths should a1so be recomrnended by the rnanufacturer.
The designer is cautioned that high gas velocities may cause flow-induced-thermowell vibration.Catastrophicmetal fatigue failure of the thermowell could eventually result from the vibration,
7.2.6 Accousllc Nolse Inlerierence
Sorne pressure-reducíng control valves, designed to reduce audible noise, may produce very high levelsof ultrasonic noise under certain flowing conditions. The ultrasonic noise from these "quíet" controlvalves can interfere with the operation of a nearby ultrasonic meter. Research work on ultrasonic noiseinterference is ongoing, so the manufacturer should be consulted when planning to install a UM near apressure-reducing control valve,
7.2.7 Flow Condltloners
FIow conditioners may 01' may not be necessary, depending on the manufacturer's meter design and theseverity of any upstream flow-profile disturbance, The designer should consult with the manufacturer todetermine the benefits, if any, of installing various types of flow conditioners, given the upstream pipingconfignration.
7.2.8 Orlentatlon 01 Meler
The designer should consult with the manufacturer to determine if there is a preferred meter orientationfor a given upstream piping configuration that is known to produce flow-profile distortíons.
7.2.9 Flltrallon
Filtration of the flowing gas is probably not necessary for most applications of a UM. However, theaccumulation of deposits due to a mixture of dirt, mill scale, condensates andlor lubricating oils shouldbe avoided. See Section 7.2.4. Filtration may be necessary if any of the above conditions is known toexist,
7.3 Associated Flow Computer
The UM's output is typically an uncorrected volume (actual volume at line conditions), either pel' unit oftime 01' accumulated. Therefore, an associated flow computer 01' corrector must be installed by thedesigner to correct the volume rate and accumulated volume for pressure, ternperature andcompressibility (to obtain standard cubic feet, for example), and to provide the necessary data retentionand audit trall. OptionalIy, the flow-cornputer functions could be integrated into the UM's SPU by themanufacturero
For bi-directional applications, the UM should be treated as two separate meters, associated with two"meter runs" in a single flow computer 01' with two separate flow cornputers.
For other applicable flow-cornputer requirements, the designer should refer to API MPMS Chapter 21.1,Flow Measurement Using Electronic Metering Systems. A UM would be considered a "linear meter" inthat document,
7.3.1 Flow-Compuler Calculatlons
The necessary calculations are similar to the equations described in AGA Report No. 7, Measurement ofGas by Turbine Meters, and are summarized in the foIlowing expressions:
Qb= Q¡(P¡lPb)(Tb/I'¡)(Zbl4>
Vb = JQb dt
Where:
Qb = flow rate at base conditions
Q¡ = flow rate at flowing conditions
18
T¡ =z, =Z¡ =v, =¡ =dt =
-
Ps = base pressure, typically 14,73 psía (101.325kPa)
P¡ = absolutestatic pressure of gas at flowing conditions
T» = base ternperature, typically 519.67° R (288.15°K)
absolute temperature of gas at flowíng conditíons
compressibility factor of gas at base conditions, per AGA Report No. 8
compressibility factor of gas at flowíng conditions, per AGA Report No. 8
accurnulated volume at base conditions
integratedover time
integration incrementsof time, typícally 1 second,
The first equatíon converts the flow rate at line condítions of pressure, temperature and compressibilityto a flow rate at base conditions, The second equation represents the accumulation process in which flowrates at base conditions are accumulated to volumes over time. For more details, refer to AGA ReportNo. 7.
7.4 Maintenance
The operator should follow the manufacturer's recommendations for maíntenance. Periodic maintenancecould be as simple as monitoringseveral SPU diagnostic measurements, such as signal quality and speedof sound for each acoustic path, For example, it may be possible to detect an accumulation of deposits onthe transducerfaces by measuring a reductíon in the received ultrasonicpulse strength.
When possible, the operator should verify that the UM measures near zero when no gas is flowingthrough the meter. When performing thís test, the operator should bypass or defeat any low flow cut-offfunction and be aware that any meter-ron ternperature differences will cause therma! convection currentsof gas to circulate inside the meter, which the UM may measure as a very low flow rateo
8 Field Verification Tests
The rnanufacturer shall provide a written field verification test procedure to the operator that will allowthe UM to be functionally tested to ensure that the meter is operatíng properly, These procedures mayinelude a combination of a zero-flow verification test, speed-of-sound measurement analysis, individualpath measurement analysis, intemal inspection, dimensional verification and other mechanical orelectrical tests.
The manufacturer should provide an uncertainty analysis to demonstrate that these field performanceverífication tests are sufficient to validate the meter' s specified physical and electrical performancecharacterístics. The manufacturer should make reference to the uncertainry methodused in this analysis.
Sorne performance aspects of the UM's condition should be evaluated by comparing the speed of soundreported from the meter with the speed of sound derived frorn the AGA Report No. 8, "DetailCharacterízation Method Equation of State." A chromatographic analysis from a sample of gas taken atthe time of speed-of-sound measurement is required for valid comparison, An extended analysis (heyondC6) may not be necessaryfor typical natural gas mixtures.
The decision to performperiodic transfer proving or flow calibration is left to the parties using the meter.
19
.-.- ..-. ---------------
-"
9 Reference List
• AGA Engineering Technical Note M-96-2-3, Ultrasonie Flow Measurement for Natural Gas Applieations,American Gas Association, 1515Wilson Boulevard, Arlington,VA 22209
• AGA TransmissionMeasurementCornmittee Report No. 7, Measurement of Gas by Turbine Meters, AmericanGas Associatíon, 1515Wilson Boulevard, Arlington, VA 22209
• AGA TransmissionMeasurementCommittee Repon No. 8, Compressibility Faetors ofNatural Gas and OtherRelated Hydrocarbon Gases, American Gas Association, 1515Wilson Boulevard,Arlington, VA 22209
• NFPA 70, Narional Eleetrical Code, 1996 Edition, National Fire Protection Association, Batterymarch Parle,Quincy,MA 02269
• API Manual of Petroleum Measurement Standards Chapter 21, September 1993, Flow Measurement UsingElectronic Metering Systems, AmericanPetroleurnInstitute, 1220L Street NW, Washington, DC 20005
• ASTM Designation: E 1002 - 96, Standard Test Method for Leaks Using Ultrasonics, American Society forTesting and Materials, 100 Barr Harbor Drive, West Conshohocken,PA 19428-2959, U.S.A.
• Code ofFederal Regulations, Title 49-Transportation, Part 192, (49 CFR 192), Transponation ofNatural Gasand Other Gas by Pipeline: Minimum Federal Safety Standards, U.S. GovemmentPrinting Office, Washington,DC20402
• GERG Technical Monograph 8 (1995), Present Status and Future Researeh on Muuí-patñ Ultrasonic Gas FlowMeters, Christian Michels¿n Research AS, the GERG Project Group and Programme Committee No. 2 Transmission and Storage, Groupe Européen De Recherches Gaziéres
• ISO 9951: 1993, Measurement ofgas flow in closed conduits - Turbine meters, Intemational OrganizationforStandardization,Case Postale 56, CH-1211 Genéve 20, SwitzerJand
• ISOrIR 12765: 1997(E),Measurement offluidflow in elosed conduits - Methods using transit time ultrasonicflowmeters, Intemational Organizationfor Standardization, Case Postale 56, CH-1211 Geneve 20, SwitzerJand
• OIML R 6 General provisions for gas volume meters, 1989 (E), Intemational Recommendation, OrganizationInternationale de Métrologie Légale, Bureau Intemational de Métrologie Légale, 11, me Turgot - 75009 Paris France
• OIML D 11 General requirements [or electronic measuring instruments, 1994 (E), Intemational Document,Organization Intemationale de Métrologie Légale, Bureau International de Métrologie Légale, 11, me Turgot 75009 París - France
20
b
APPENDIX A
Multipath Ultrasonic Meter Flow-Calibration Issues
A.1 Why Flow-Calibrate a Multipath lJltrasonic Meter?
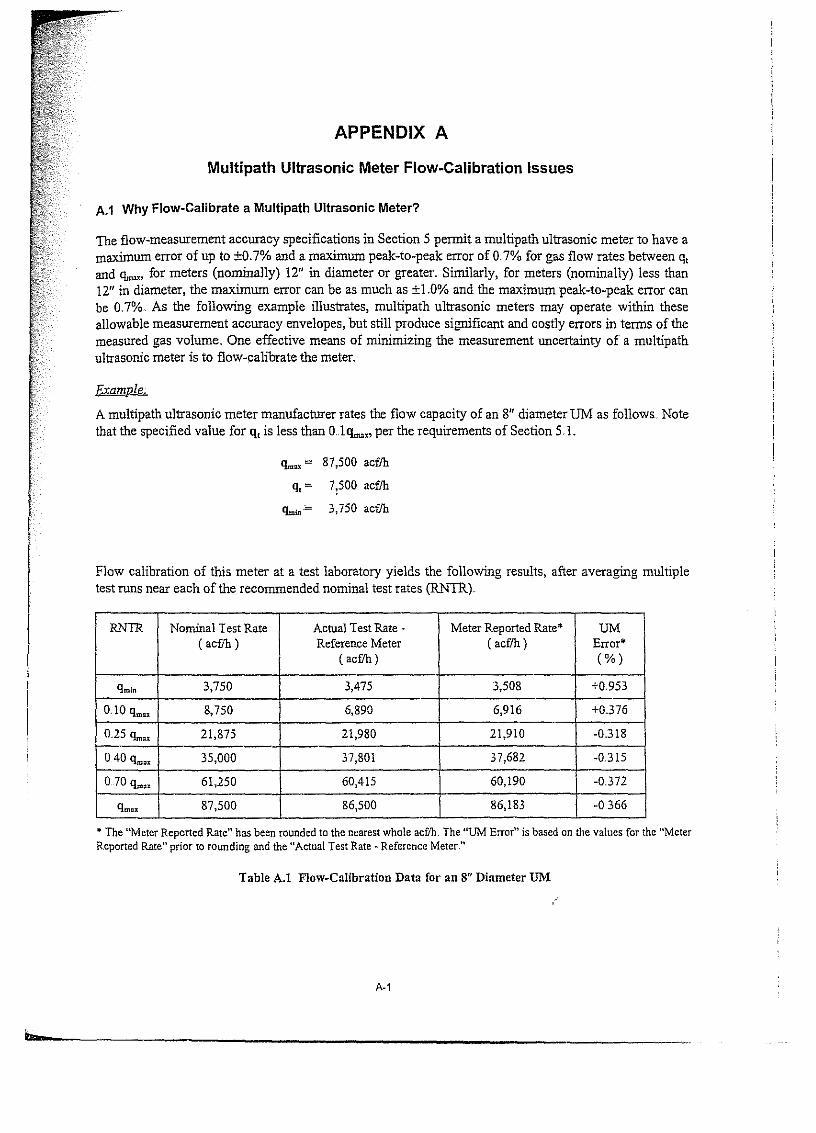
The f1ow-measurement accuracy specificationsin Section 5 permit a multipath ultrasonic meter to have amaximumerror ofup lo ±0.7% and a maximumpeak-te-peak error ofO.7% for gas flow rates between q,and q""" for meters (nominally) 12" in diameter or greater, Similarly, for meters (nominally) less than12" in diameter, the maximurn error can be as much as ±LO% and the maximum peak-te-peak error canbe 0,7%. Al; the following example iIIustrates, multipath ultrasonic meters rnay operate within theseallowable measurement accuracy envelopes, but still produce significant and costly errors in tenns of themeasured gas volume, One effective means of minimizing the measurement uncertainty of a multipathultrasonicmeter is to flow-calíbrate the meter.
Example:
A multipath ultrasonic meter manufacturerrates the flow capacity of an 8" diameterUM as follows. Notethat the specified value for q, is less than O,.lq""" per the requirements of Section 5,L
íb:u:= 87,500 acf1h
ql= 7,500 acf1h
q",,,,= 3,750 acf1h
Flow calibration of this meter al a test laboratory yields the following results, after averaging multiplelest runs near each of the recommended nominal test rates (RNTR),
RN1R Nominal Test Rate ActualTest Rate • Meter ReportedRate" UM( acf/h ) Reference Meter ( acflh ) Error
(acf1h ) (% )
qmin 3,750 3,475 3,508 +0,953
0.10 qmllX 8,750 6,890 6,916 +0.376
0..25 'lm" 21,875 21,980 21,910 -0.318
0.40 qm~~ 35,000 37,801 37,682 -0315
o70 q",,, 61,250 60,415 60,190 -0372
qmu 87,500 86,500 86,183 -0366
'" The "Meter Reported Rate" has been rounded to the nearest whole acflh. The "UM Error" is based on the values for the "MeterReported Rate" prior to rounding and the "Actual Test Rate - Reference Meter,"
Table A.l Flow-Calibration Data for an 8" Diameter UM
A·1
ji
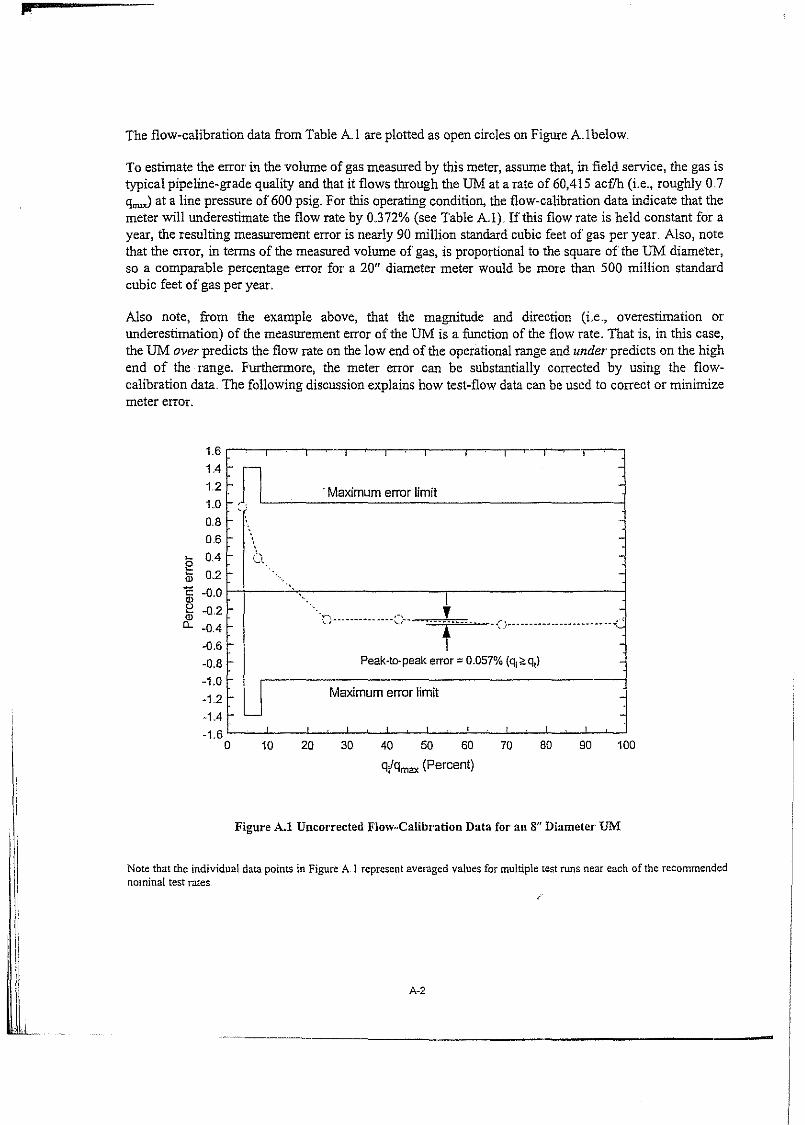
The flow-calibration data from Table A.l are plotted as open circles on Figure A,1below.
1'0 estirnate the error in the volume of gas measured by this meter, assume that, in field service, the gas istypical pipeline-grade quality and that it flows through the UM at arate of 60,415 acf/h (i.e. roughly 0,7q.",J at a line pressure of 600 psig. For this operating condition, the flow-calibration data indicate that themeter will underestimate the flow rate by 0.372% (see Table A.l), If this flow rate is held constant for ayear, the resulting measurement error is nearly 90 million standard cubic feet of gas per year. Also, notethat the error, in terrns of the measured volume of gas, is proportional to the square of the UM diameter,so a comparable percentage error for a 20" diameter meter would be more than 500 million standardcubic feet of gas per year.
Also note, from the example above, that the magnitude and direction (Le", overestirnation 01'
underestimation) of the measurement error of the UM is a funetion of the flow rate, That is, in this case,the UM over predicts the flow rate on the low end of the operational range and under predicts on the highend of the range. Furthermore, the meter error can be substantially corrected by using the flowcalibration data" The following diseussion explains how test-flow data can be used to correet or minimizemeter error.
, ,l- -
,Maximumerror limitr- ~'
i- ..
'.... t-
-,
"D....._. __.....c?.....,L.~ {.}~~ •••• ~._ • • • • • o ___ •• •• __ _ :~;
tl- Peak-to-peak error =0,057% (q,,,q,) -
U Maximumerror lirnit
,
1,6
1.41,2
1.0
080,6
Lo- OAgal 0,2
~ -0.0- -028: -04
-0,6
-0,8
-1,0
-12-14
-1,6O 10 20 30 40 50 60
q!qmax (Percent)
70 80 90 100
Figure A..l Uncorrected Flow-Calíbration Data COl' an 8" Díameter UM
Note thatthe individual data pcints in Figure A 1 represent averaged values formultiple testruns near each of the recomrnendednominal test t-ates
A·2
A.2 Methods for Correcting a UM's Flow-Measurement Error
The aboye example demonstrates the potential value of minimizing a UM's measurement inaccuracy oruncertainty. The total flow-measurement error 01' a UM consists of two parts: (J) random (or precision)errors and (2) systematic (or bias) errors, Random errors can be caused by various inf1uences on ameter' s operation. Random errors norrnally follow a certain statistical distribution, The magnitude oí therandom error can usually be reduced by acquiring multíple measurement samples and then applyingaccepted statistical princíples. Systematic errors norrnally cause repeated UM measurement readings tobe in error (for sorne unlmown reason) by roughly the same arnount. In most cases, flow calibration of aUM can help eliminate or, at least, minimize the measurement error of the meter. Operational experiencehas shown that, in most cases, the major portion of the total flow-measurernent error of an uncalibratedUM is due to systernatic errors.
Due to machining tolerances, variations in component manufacturing processes, variations in the meterassembly process and other factors, each UM has its own unique operating characteristics. Thus, tominimize a particular UM's flow-measurement uncertainty, the manufacturer can flow-calibrate a UMand then use the calibration data to correct or compensate for the UM's measurement error. More thanone error correction technique is available to the manufacturer, depending on the meter applicatíon andthe needs of the operator.
Following is a description of an error correction technique that utilizes a single calibration-factorcorrectíon - the flow-weighted mean error (FWME) factor If a UM's flow-rneasurement output islinear over the operational flow range of the meter, the FWME correction method is effective atminimizing the measurement uncertainty of the meter. Other single calibration-factor correctiontechniques are also avaílable. If ~ UM's flow-measurernent output is nonlinear over the meter'soperational range, more sophisticated error correction techniques can be applied. For instance, a higherorder curve fit algorithm, such as a second- or third-order polynomial equation can be used tocharacterize the meter's output, based on the available test data. An exhaustive discussion 01' the variousmeter error correction techniques is beyond the scope of this díscussion. The designer or operator shouldconsult with the manufacturer regarding the available options for a particular UM.
A.3 Example of a Flow-Weighted Mean Error (FWME) Calculation
The calculation of a rneter's FWME from actual flow-test data is a method of calibrating a meter whenonly a single calibration-factor correction is applíed to the meter's output, Application of this factor to aUM's output is similar to the use 01' an index gear ratio in a turbine or rotary flow meter. As noted aboye,use of the FWME factor is only one of several alternative methods of adjustment to a UM's calibrationto minimize the flow-measurement uncertainty of the meter (see Section 64 1).
The example used in Section A.l aboye will now be used to demonstrate how to calculate the FWME foran 8" diameter UM that has been flow-calíbrated under operating conditions similar to those that themeter would experience during field service A single calibration-factor (i.e .. , one FWME correctionfactor), F, is determined and then applied to the test results such that the resulting FWME is equal tozero The meter's performance, both before and after the calibration factor is applied, should becompared with the requirements specified in Sectíon 5.0
A-3l-----------------------
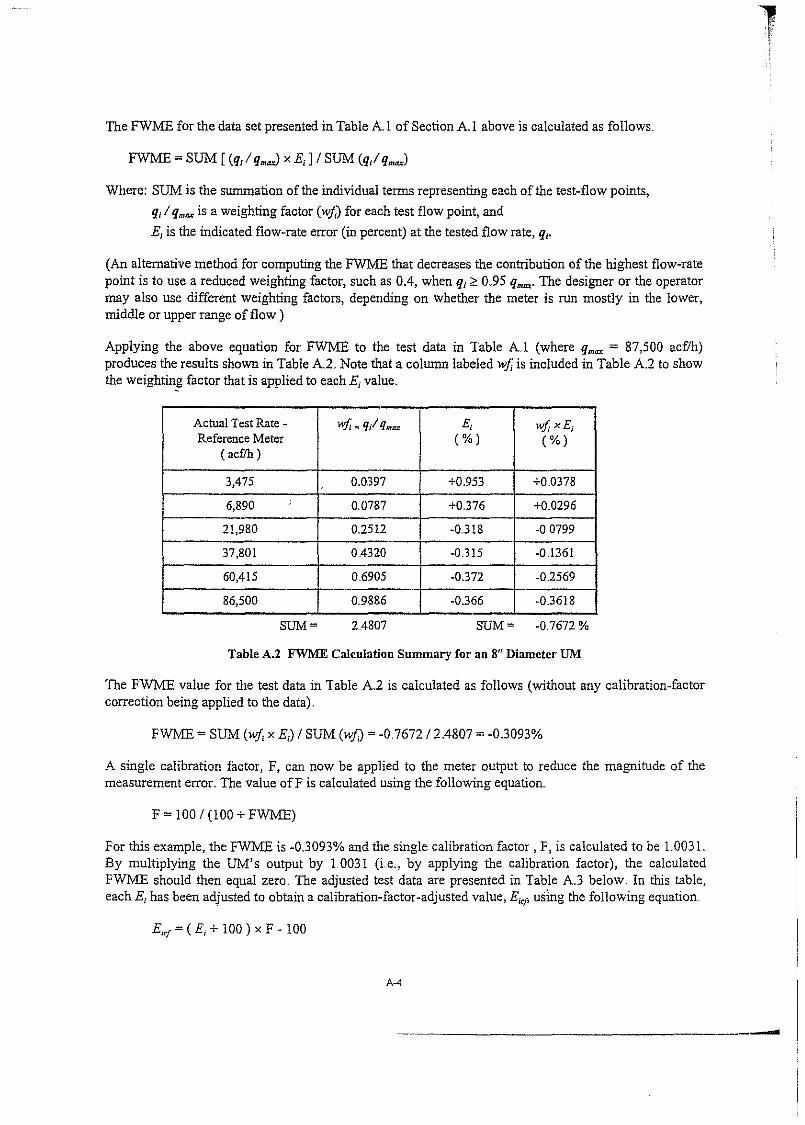
The FWME for the data set presented in Table A.l of Section Al aboye is calculated as follows.
FWME = SUM [ (q, / qmaJ x E,] / SUM (q/ qm~)
Where: SUM is the surnmation of the individual terms representing each of'the test-flow points,
q, / qm~ is a weighting factor (wj,) for each test flow point, and
E, is the indicated flow-rate error (in percent) at the tested flow rate, q"
(An alternative method for computing the FWMEthat decreases the contribution of the highest flow-ratepoint is to use a reduced weighting factor, such as 004, when q, ~ 0.95 qm~' The designer or the operatormay also use different weighting factors, depending on whether the meter is ron mostly in the lower,middle or upper range of flow.)
Applying the aboye equation for FWME to the test data in Table Al (where qm~ = 87,500 acflh)produces the results shown in Table A2. Note that a column labeled wf, is included in Table A2 to showthe weighting factor that is applied to each E, value.
Actual Test Rate - W¡; ..q/qmlU E, v.f, X E,Reference Meter (% ) (% )
(acf/h )
3,475 0.0397 +0.953 +0.0378
6,890 00787 +0376 +0.0296
21,980 0.2512 -0318 -O 0799
37,801 04320 -0315 -OJ361
60,415 0.6905 -0372 -0.2569
86,500 0.9886 -0366 -03618
1¡
SUM= 2.4807 SUM= -0.7672%
Table A.2 FWME Calculation Summary for an 8" Diameter UM
The FWME value for the test data in Table A.2 is calculated as follows (without any calibration-factorcorrection being applied to the data).
FWME = SUM (wj, x E,) / SUM (wfJ = -0.7672 / 2.4807 = -0.3093%
A single calibration factor, F, can now be applied to the meter output to reduce the magoitude of themeasurement error. The value ofF is calculated using the following equation..
F = 100 / (100 + FWME)
For this example, the FWME is -0.3093% and the single calibration factor, F, is calculated to be 1.0031.By multiplying the UM' s output by L0031 (i.e., by applying the calibration factor), the calculatedFWME should then equal zero. The adjusted test data are presented in Table A.3 below In this table,each E, has been adjusted to obtain a calibration-factor-adjusted value, E,q, using the following equation.
Elc¡=(E, + 100) xF-IOO
A-4
-
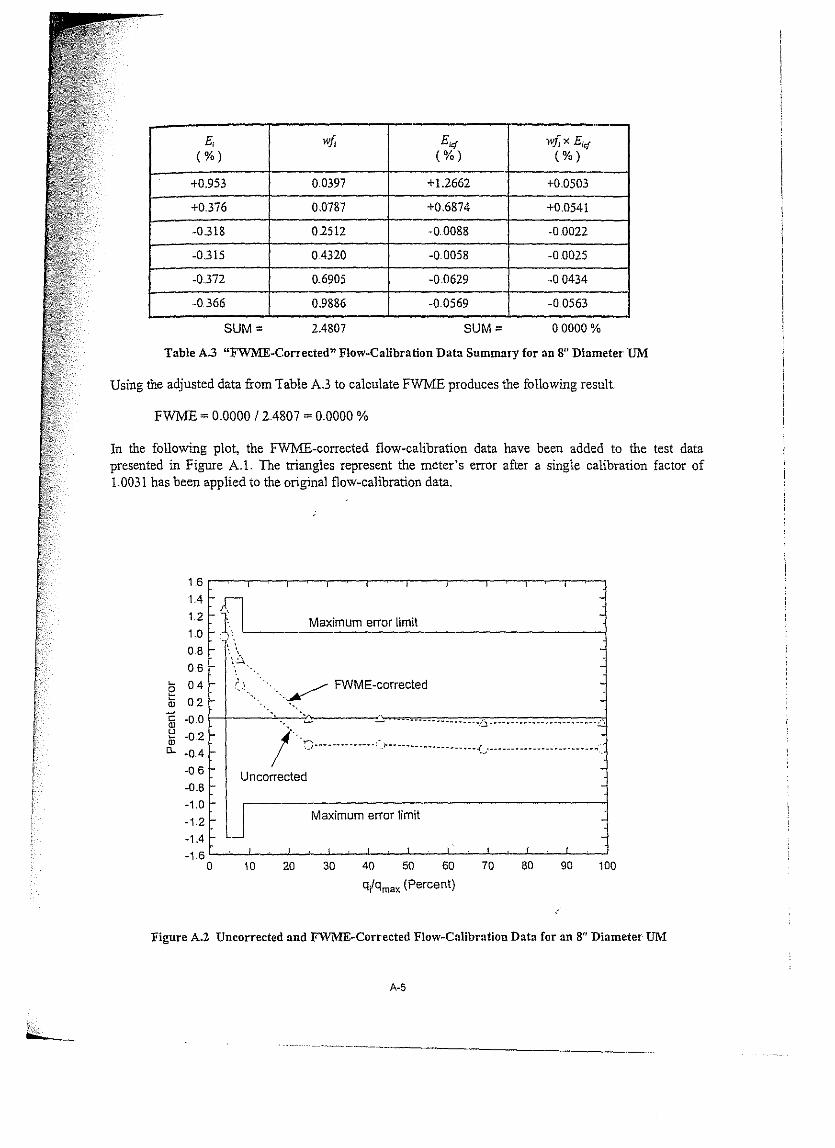
E; wf, Eiq wf, X El.(% ) ( %) (% )
+0.953 0.0397 +1.2662 +00503
+0376 00787 +06874 +00541
-0318 02512 -00088 .o.0022
-0315 OA320 -0.0058 -0..0025
-0372 0.6905 -0.0629 -0.0434
-0366 0.9886 -00569 -0.0563
SUM= 2.4807 SUM= 00000 %
Table A.3 "FWME-Corrected" Flow-Calibration Data Summary for an 8"Diameter UM
Usingthe adjusted data from Table A.3 to calculate FWME produces the following result.
FWME = 0.0000 / 2A807 = 0.0000 %
In the followíng plot, the FWME-corrected flow-calibration data have been added to the test datapresented in Figure AL The triangles represent the meter's error after a single calibration factor of1.0031 has been applied to the original flow-calibration data.
100
--
--
90
,8070
,,40 50 60
q¡lqmax (Percen!)
30
,
Maximum error lirnlt
20
,
...._/ FWME-correc!ed
10
16 "-~-'-~.-~-r~--r~--'r-~'-~-.~-r~.-~--,lA 1
121-11.0 '.J'. L.. "'-''''-''''-''''-''''-''''-' --j
08 -- '. '.\~0.6
~ 04gID 02C' ·00 f----+-----'~-"~---_::::-====,___;r_------""
~ :~: I~' -.. .»..::::::::::::::::::~~,::::::::::: ::::::::::::::~-08 Uncorrected _
-1.0 r~ J Maximum error limit __-1.2-1.4 ---16 L-~-'--~..l_.~....L-~-l.~__'_~L_~_'_~__'_~_L.~__'
O
Figure A.2 Uncor-rected and FW1\1E-Coff'ected Fjow-Caltbratiou Data Ior an 8" Díameter UM
A·5
L. ---------._._-------------
Figure A.2 shows that for gas flow rates aboye about 25% of the capacity of the meter, the measurementerror has been virtually eliminated by applying a single FWME calibration-factor adjustment to all of thetest flow data. However, for flow rates below about 25% of the meter's capacity, the single FWMEcalibration-factor adjustment does not completely eliminate the measurement error because the UM has anonlinear characteristic oyer this portion of its operating range. Therefore, the operator must eitheraccept the higher measurement error on the low end of the meter's operational range or apply a moresophisticated correctíon scheme to reduce or eliminate the measurement error on the low end of themeter's range ..
Note: The laboratory test data used in this example calculation of FWME were provided courtesy ofSouthwest Research lnstitute, San Antonio, Texas..
A-6
APPENDlX B
Electronics Design Testing
The design of the UM's electronics should be tested to demonstrate that the UM will continue to meet theperformance requirements of Section 5, while operating under the influences and disturbances specifiedin the current revisions of üIML R 6, General Provisions 01 Gas Volume Meters, and üIML D 11.General Requirements for Electronic Measuring Instruments. üIML is the ürganisation Internationalede Metrolocie Legale (i.e., the Intemational Organization of Legal Metrology). üIML publishes thesedocuments for the expressed purpose of hannonizing national performance requirements and testingprocedures for gas meters.
For the climatic conditions, the requirements shall be for class 4K3, "open locations with averageclimatic conditions, thus excluding polar and desert envíronments." For the mechanical conditions, therequirements shall be for class 3/4M5, "locations with significant or high levels of vibration and shock";e.g., transmitted from adjacent compressors, The combination of these two conditions leads to üIMLclass F for determining the severity level for each test.
These test requirements shall apply to the design of all circuit boards, ultrasonic transducers,interconnecting wiring and customer wiring terminals, The electronics shall be in operation, measuringzero flow, and remain 100% functional. during the tests In the case of high-voltage transient andelectrostatic discharge tests, the mete! may temporarily stop functioning but shall automatically recoverwithin 30 seconds,
During these tests, the ultrasonic transducers may be operated in a smaller and lighter test cell (or testcells) instead of a full meter body, However, the transducers shall actually be measuring zero flow andbe exposed to the same test conditions as other parts of the electronic system.
The following sections provide a brief description of the required tests and severity levels. Note that theseverity levels are listed here for infonnation only and may change in future revisions of the üIMLdocuments. For detailed testing procedures, the manufacture! may refer to the referenced üIMLdocuments, which, in turn, refer to applicable International Electrotechnical Commission (lEC)publications.
B.1 Static Temperature, Dry Heat
Exposure to a static temperature of 1310 F (550 C) during a period of two hours. The change ofternperature shall not exceed 1.80 F/min (lo C/min) during heating up and cooling down. The humidityof the aír shall be such that condensation is avoided at all times"
B.2 Static Temperature, Cold
Exposure to a static temperature of _13 0 F (_25 0 C) during a period of two hours. The change oftemperature shall not exceed 1.80 F/min (lo C/min) during heating up and cooling down. The humidityof the air shall be such that condensation is avoided at all times.
8-1
Iir ----,"".,,,-,
B.3 Damp Heat, Steady State
Exposure to a constant temperature of 86° F (300 C) and a constant relative humidity of93% for a periodof four days. The handling of!he electronics shall be such !hat no condensation of water occurs on thisunit.
B.4 Damp Heat, Cyclic
Exposure to cyclic temperature variations between 77° F and 131°F (25° e and 55° C), maintaining !herelative humidity above 95% during !he temperature change and low temperature phases, and at 93% atthe upper temperature phases. Condensation should occur on the electronics during !he temperature rise.The test consists of two cycles of24 hours each following the specified procedure per cycle.
B.5 Random Vibralion
Exposure to a random vibration level specified below.
Frequency range: lO-ISO Hz
Total RMS level: 5.25 ft/s' (L6 rnJs')
ASD level 10-20 Hz: (0.048 mJs')
ASD level 20-150 Hz: ·3 dE/octave
Number ofaxes:
Duration:
3
2 minutes or longer if necessary to check the various functions.
B.6 Sinusoidal Vibration
Exposure to a sinusoidal vibration by sweeping !he frequency in a range of 10-150 Hz at I octave perminute at an acceleration level of 6.56 ft/s' (2 m/s'). The electronics shal! be tested in three perpendicularaxes. The duration of the test is 20 cycles per axis.
B.7 Mechanical Shock
The electronic unit, standing in its normal position of use on a rigid surface, is tilted at one bottom edgeto a height of 1" (25 mm) and !hen is allowed to fal! freely onto the test surface - twice for each bottornedge.
B.8 Power Vollage Variation
Exposure to the specified power supply conditions for a period long enough to achieve temperaturestability and to perform checks on the performance of!he meter
Mains voltage:
Mains frequency:
Nominal mains voltage ± 10%
(50 Hz or 60 Hz) ± 2%
B.9 Short Time Power Reduction
Exposure to mains voltage interruptions and reductions specified below. The reductions shal! be repeated10 times with an interval of at least 10 seconds.
Reduction: 100% during 10 ms (milliseconds)
50% during 20 ms
8·2
8.10 8ursts (Transients)Exposure to bursts of voltage spikes having a double exponential wave forrn. Each spike shall have a risetime of 5 ns (nanoseconds) and a half amplitude duration of 50 ns The burst length shall be 15 ms; theburst period (repetition time interval) shall be 300 ros. The peak value shall be 05 kV.
8.11 Electrostatic Discharge
Exposure to 10 electrostatic discharges with a time interval between each discharge of 10 seconds. If theelectrode giving the discharge is in contact with the electronics, the test voltage shall be 6 kV. If theelectrode is approaching the electronics and the discharge occurs by spark, the test voltage shall be 8 kV.
8.12 Electromagnetic SusceptibilityExposure to a radiated electromagnetic field The frequency range shall be 0.. 1 lo 500 MHz, with a fieldstrength of 10 Volts/meter (V/m).
8·3

APPENDIXC
Ultrasonic Flow Measurement
for Natural Gas Applications
A.G.A. Operating Section Transmission Measnrement CommitteeEngineering Tecbnical Note M-96-2-3
This technical note contains reference information for measuring high-pressure natural gas using largecapacity ultrasonic flow meters, including principies of operation, technical issues, evaluation ofmeasurement performance, error analysis,calibration and reference literature.
Preparedby theUltrasonicMetering TaskGroup
©1996American Gas AssociatícnAH Rights Reserved
C·1
&.------------------
ACKNOWLEDGMENTS
Ibis technical note represents a great deal of work by tbe members of the Ultrasonic Task Group of tbeAG.A Transmission Measurement Committee. Large parts of tbe document were provided by JanDrentben, Ron McCartby and Huib Dane of Instromet Ultrasonic Technologies. Kevin Warner of DanielFlow Products provided another significant portion, along witb Jobn Stuart of Pacific Gas and Electric,Mike Rogi of NOVA Gas Transmission Ltd. and Jim Witte of Tenneco Valuable tecbnical input andtimely editing were provided by Terry Grimley of Soutbwest Research Institute.
The assistance and support of otber industry associations are also appreciated: in particular, RayTeyssandier and Steve Stark representing tbe American Petroleum Institute Committee on GasMeasurement, and Pieter van del' Kam representing the Groupe Européen de Recherches de Gasiéres(GERG) and its Ultraflow project.
The Gas Research Institute, represented by Jobn Gregor and Jeff Savidge, is acknowledged for itsgeneral support and provision of tbe speed-of-sound data.
The task group would also like to thank its first two chairrnen, Gene Tiemstra and Bob Pogue, botbformerly ofNOVA Gas Transmission Ltd., who laid the groundwork for the Tecbnical Note.
Phil Barg, ChairU1trasonic Task GroupMarch 1996
C-2
.....
...
TABLE OF CONTENTS
ACKNOWLEOGMENTS 2
1 Introduction 41.1 Task Group Scope .41.2 Engineering Technical Note Scope .4
2 Principie of Operation 42.1 Introduction 42.2 Theory of lJltrasonic Flow Measurement - 5
3 Technicallssues 123.1 Speed of Sound in Natural Gas 123.2 Installation Requirements 173.3 Meter Construction 193.4 Performance Characteristics 203.5 Field Checks 22
4 Evaluation of Measurement Performance 234.1 Signal Amplitude 244.2 Pulse Shape 244.3 Noise 254.4 Batch Diagnostics , ~ 25
5 Error Analysis 285.1 Bias 285.2 Variance 30
6 Calibration 316.1 Dry Callbration 316.2 Flow Calibration 326.3 Calibration Facilities 336.4 Transducer Replacement.. 33
7 Recommendations 347.1 Industry " 347.2 Users " 347.3 Manufacturers "..357.4 Researchers 35
ULTRASONIC METER RESEARCH LITERATURE ANO ACTIVITIES 36
REFERENCES 41
c.s
1 Introduction
The Transmission Measurernent Committee of the American Gas Association submits the followingreference information for measuring natural gas with ultrasonic flow meters.
Ultrasonic meters measure flow by measuring velocity in the gas stream using pulses of high-frequencysound By measuring the transit time, the average velocity of the gas is calculated. Volume and massflow rates are then calculated using standard equations of state (such as AG.A Report No 8,Compressibility Factors ofNatural Gas and Other Related Hydrocarbon Gases).
These meters have a number of important attributes for measuring large volumes of natural gas.. Forinstance, u1trasonic meters have a high turndown ratio and incur a small pressure 1055. The uncertainty ofthese meters is in line with other types of meters. However, care must be taken by the user in arder toensure a proper understanding of the characteristics and limitations of these meters, so that the expectedresuIts can be achieved.
Single-path and multipath meters are addressed. Where there is no reference to the number of paths, theparticular section can be assumed to apply to both. Multipath meters are used to reduce uncertainties,especial!y when dealing with non-uniform gas velocity profiIes and other disturbances such as swirl.
'Ibis is a compilation of infonnation by experts in the field at the time of publication. It is not intendedfor use as a reference in contracts.
1.1 Task Group Scope
a) Develop an AG.A Engineering Technical Note to address the fol1owing:
• Review the current state ofultrasonic meteríng technology.
• Share and disseminate operating experience with uItrasonic rneters. Leverage off of theexperience of the European Cornmunity.
• Develop an understanding of the potential applications and related business parameters ..
b) Identify technical issues al' Iimitations and related research needs.
e) Review current industry standards with a view to developing an AG.A report for the instal!ation andoperation ofultrasonic meters,
1.2 Engineering Technical Note Scope
This Technical Note is limited to ultrasonic meters in high-pressure natural gas transmission. Althoughreferences are made to ultrasonic meters for liquid flow applications, the general theme and therecornmendations relate specifical!y to high-pressure natural gas applications.
2 Principie of Operation
2.1 Introduction
An ultrasonic flow meter is a measurement device that consists of ultrásonic transducers, which aretypically Iocated along a pipe's walL The transducers are in direct contact with the gas stream and,
C4
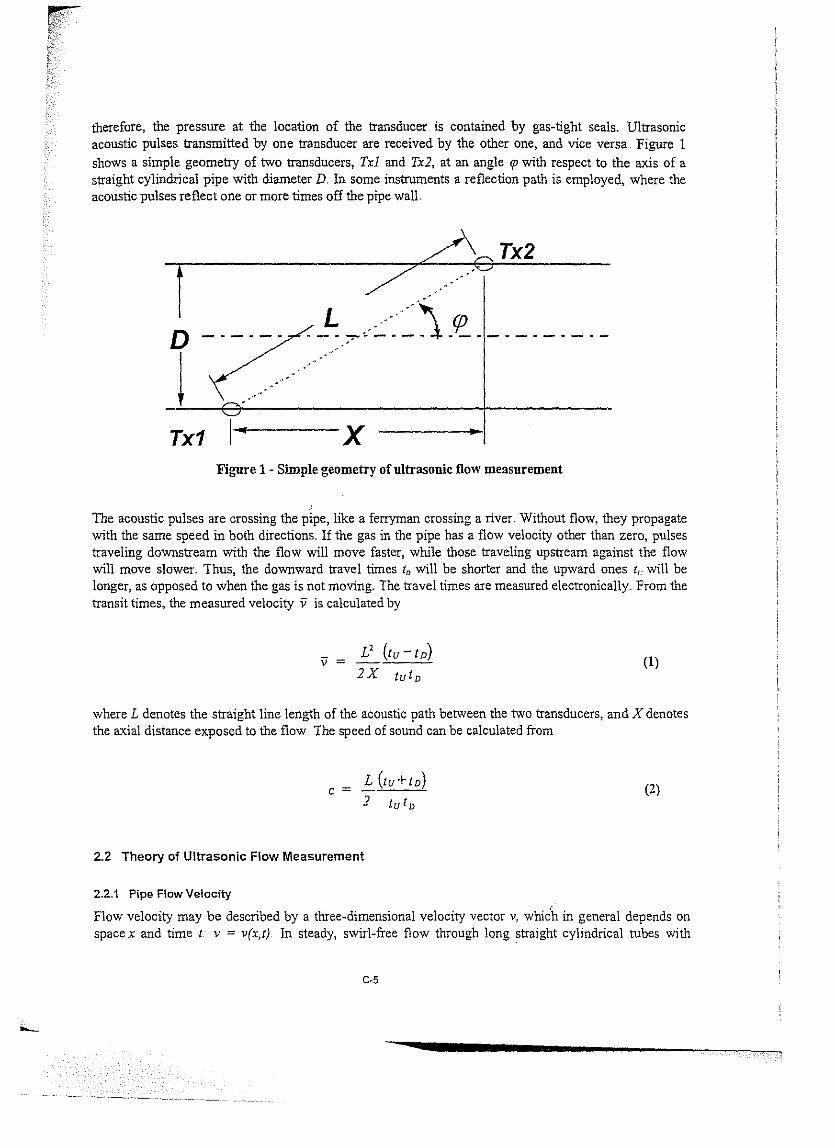
therefore, the pressure at the location of the transducer is contained by gas-tight seals. U1trasonicacoustic pulses transmitted by one transducer are received by the other one, and vice versa.. Figure I
shows a simple geometry of two transducers, Txl and Tx2, at an angle tp with respect to the axis of astraight cylindrical pipe with diameter D. In sorne instrurnents a reflection path is ernployed, where theacoustic pulses reflect one or more times off the pipe wall.
1D¡Tx1 ..
7~TX2
xFigure 1 - Simple geometry of ultrasonic flow measurement
The acoustic pulses are crossing the pipe, Iike a ferryman crossing a river. Without flow, they propagatewith the same speed in both directions. lf the gas in the pipe has a flow velocity other than zero, pulsestraveling downstream with the flow will move faster, while those traveling upstream against the flowwill move slower. Thus, the downward travel times In will be shorter and the upward ones 1,.. will belonger, as opposed to when the gas is not moving. The travel times are measured electronically. From thetransit times, the measured velocity i7 is calculated by
i7 = (1)
where L denotes the straight line length of the acoustic path between the two transducers, and X denotesthe axial distance exposed to the flow. The speed of sound can be calculated from
e = (2)
2.2 Theory of Ultrasonic Flow Measurement
2.2.1 Pipe Flow Velocity
F10w velocity may be described by a three-dimensional velocity vector Y, wnich in general depends onspace x and time I Y = vtx.t}. In steady, swirl-free flow through long straight cylindrical tubes with
e-s
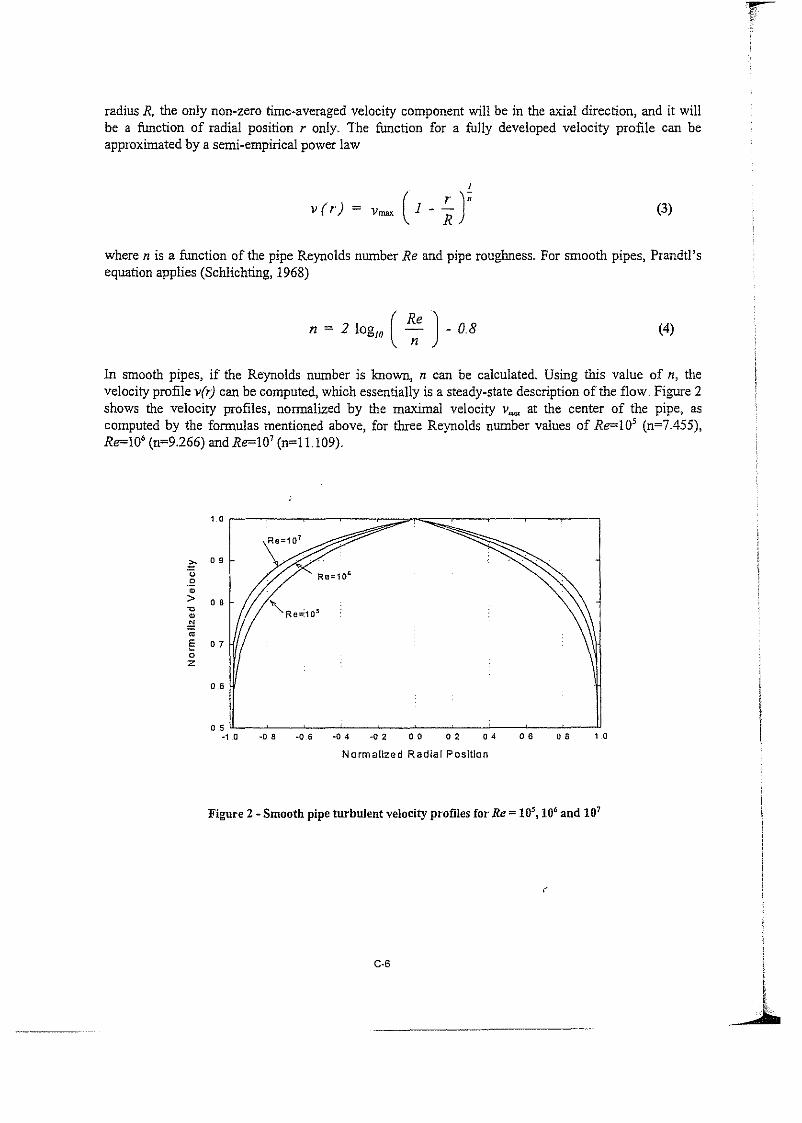
radius R, the only non-zero time-averaged velocity component will be in the axial direction, and it willbe a function of radial position r onIy. The function for a fully developed veIocity profile can beapproximated by a semi-empírical power law
v (r) = (. r )f1 -
R(3)
where n is a function ofthe pipe Reynolds number Re and pipe roughness. For smooth pipes, Prandtl'sequation applies (Schlichting, 1968)
n = 2 log., ( ~e J-O8 (4)
In smooth pipes, if the Reynolds number is known, n can be calculated. Using this value of n, thevelocity profiJe ver) Can be computed, which essentially is a steady-state description ofthe fJow.. Figure 2shows the velocity profiles, normalized by the rnaximal velocity v.~ at the center of the pipe, ascomputed by the formulas rnentioned aboye, for three Reynolds number values of Re=JO' (n=7.455),Re=lO' (n=9.266) and Re=JO' (n=l L109).
1 o
Re=10 7
""09
'ü Re=10'E•> 08 ~
"C "Re=:10s•f!ro
E 07oZ
06
00 02 04 06 o B 1 o
Normalized Radial Position
Figure 2 - Smoothpipe turbulent velocity proñles for Re = 10', 10' and lO'
e-s I¡,.-...Jí.
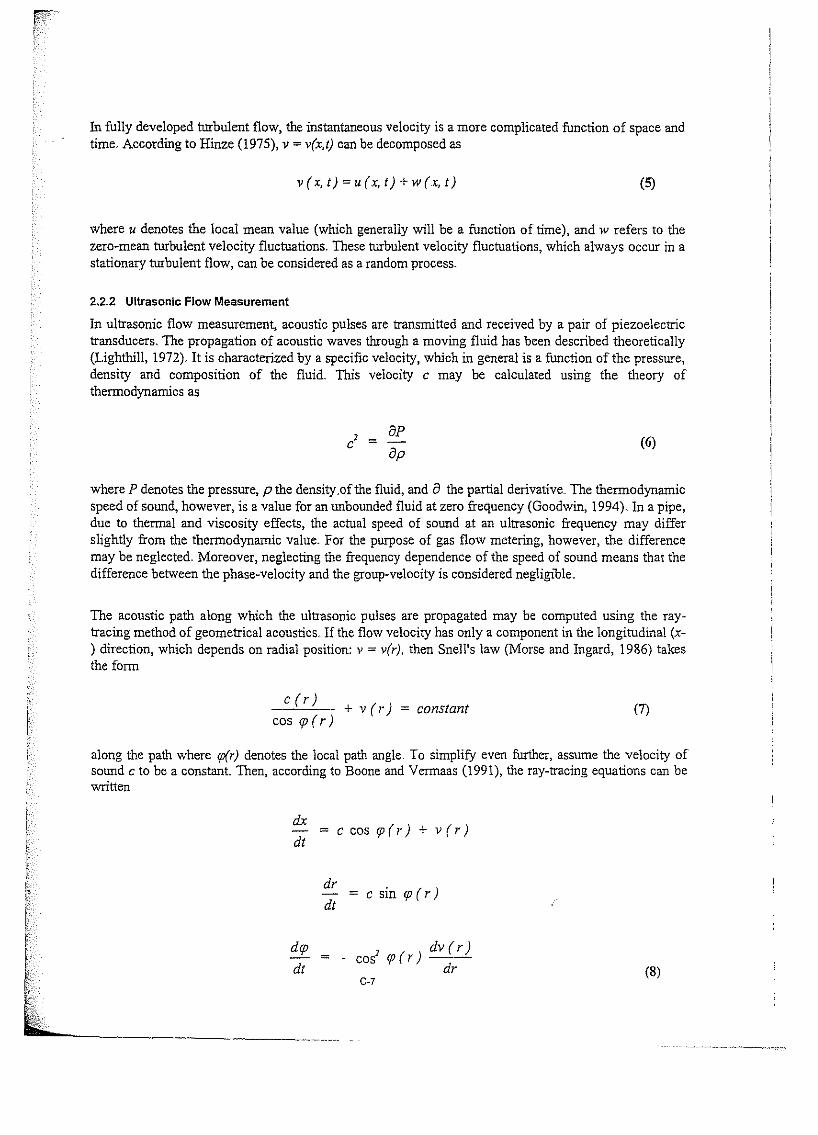
In fully developed turbulent f1ow, tbe instantaneous velocity is a more complicated function of space andtime. According to Hinze (1975), v = v(x,t) can be decomposed as
v (x, t) = u (x, t) + w (x, t) (5)
where u denotes the local mean value (which generally will be a function of time), and w refers to tbezero-mean turbulent velocity fluctuations. These turbulent velocity f1uctuations, which always occur in astationary turbulent f1ow, can be considered as a random process,
2..2.2 UltrasonícFlowMeasurement
In ultrasonic flow measurement, acoustic pulses are transrnitted and received by a pair of piezoelectrictransducers, The propagation of acoustic waves tbrough a moving fluid has been described theoretically(Lighthill, 1972). It is characterized by a specific velocity, which in general is a function of the pressure,density and composition of tbe fluid. This velocity c may be calculated using the theory oftherrnodynarnics as
8P
8p(6)
where P denotes tbe pressure, p tbe density.of the fluid, and 8 tbe partial derivative.. The tberrnodynarnicspeed of sound, however, is a value for an unbounded fluid at zero frequency (Goodwin, 1994). In a pipe,due to tberrnal and viscosity effects, tbe actual speed of sound at an ultrasonic frequency may differslightly from tbe therrnodynarnic value. For tbe purpose of gas flow metering, however, the differencemay be neglected. Moreover, neglecting tbe frequency dependence of tbe speed of sound means that thedifference between tbe phase-velocity and tbe group-velocity is considered negligíble.
The acoustic patb along which tbe ultrasonic pulses are propagated may be computed using tbe raytracing metbod of geometrical acoustics. If the flow velocity has only a component in tbe longitudinal (x) direction, which depends on radial position: v = vtr), tben Snell's law (Morse and Ingard, 1986) takesthe forrn
c (r)
cosrp(r)+ v ( r) = constant (7)
along tbe patb where rp(r) denotes tbe local patb angle. To simp1ify even furtber, assume tbe velocity ofsound c to be a constan! Then, according to Boone and Verrnaas (1991), the ray-tracíng equations can bewritten
dx
dt= c cos tp I r) + v(r)
dr=csinrp(r)
dt
drp =dt
,- cos
C·7
rp(r) dv(r)dr (8)
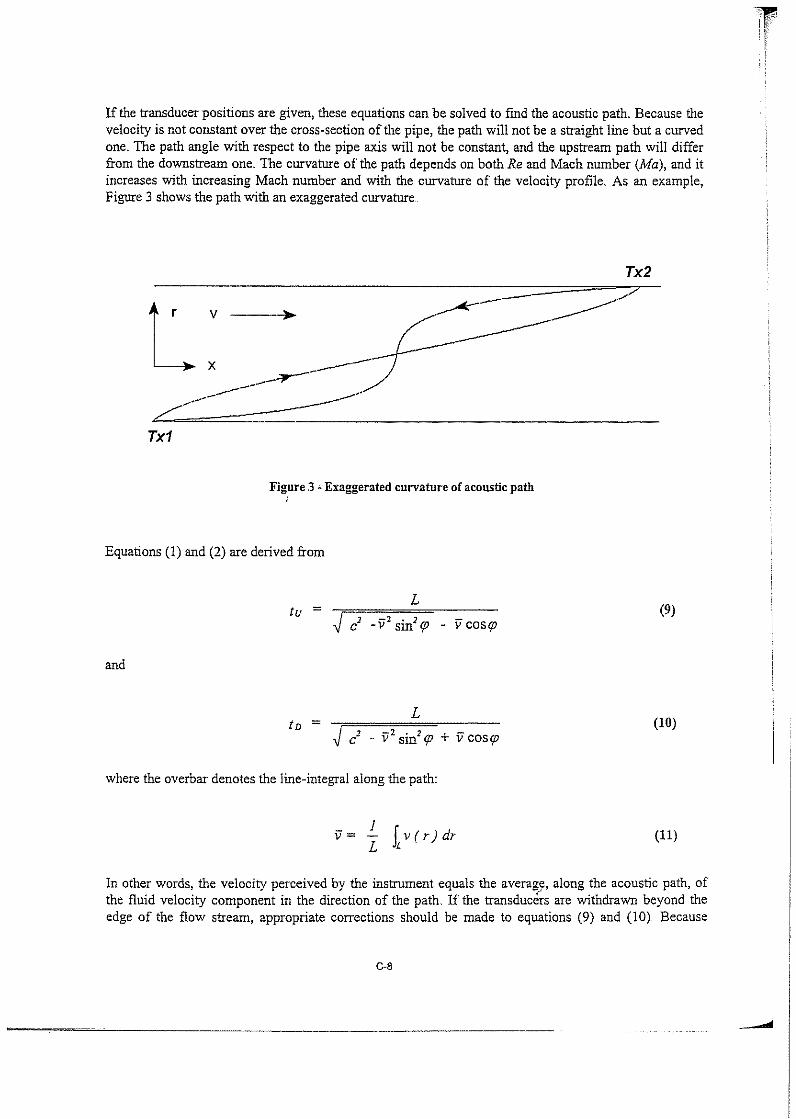
lf the transducer positions are given, these equations can be solved to fmd the acoustic path. Because thevelocity is not constant over the cross-section of the pipe, the path will not be a straight line but a curvedone" The path angle with respect to the pipe axis wíll not be constant, and the upstrearn path wíll differfrom the downstrearn one. The curvature of the path depends on both Re and Mach number (Ma), and itincreases wíth increasing Mach number and with the curvature 01' the velocity profile. As an example,Figure 3 shows the path with an exaggerated curvature
Tx2
LV - -+-
X -.:¡r--"-------- --....-- -
,../ -Tx1
Figure 3 -Exaggerated curvature of acousticpath
Equations (1) and (2) are derived from
and
tu = ~L
1 -2. 2 -e - v SIn rp - v COS rp(9)
t» = L~ 2 -2. 2 -e - v SIn rp + v COsrp
(10)
where the overbar denotes the line-integral along the path:
v= ~ Lv(r)dr (11)
In other words, the velocity perceived by the instrument equals the average, along the acoustic path, ofthe fluid velocity component in the direction of the path. If the transducérs are wíthdrawn beyond theedge of the flow stream, appropriate corrections should be made to equations (9) and (10) Because
e-s
velocity of sound effects can occur in the transducer pockets if temperature gradients exist, the generalrequirement is that the velocity of sound along the entíre acoustic path should be representative of thevelocity of sound where the fluid is in motion.
Nonnally a user is interested in the bulk mean velocity V of the medium, wbich means the velocityaveraged over the cross-section A of the pipe
v = ~ JL v (r) dA (12)
If v only has a component normal to the cross-section, tbis bulk mean velocity is computed from
where k, denotes the correction factor defined by
~ JL v (r) dAk, =
l. fv(r)dLL JL
(13)
(14)
wbich can be computed once v(r), L and A are known. Because v(r) is a function of Re, the correctionfactor is also a function of Re.. If the path is in aplane through the pipe axis, one approximation (ofmany) is gíven by
1
U2 - 0.011 log., Re(15)
for a fully developed turbulent flow, If the path is located outside aplane through the pipe axis(i.e., along a tilted chord), the k-factor and its dependency on Re will be different,
In many practical situations the Reynolds nurnber may not be known exactly However, the range of theReynolds number may be known so that a fixed value of the k-factor can be chosen in such a way as tominimize the deviation from the true value over the given range of the Reynolds number. For instance,when the lateral position p of the chord equals Rll, the average value of k, for the Reynolds number inthe range 10' to lO' is 0.996. For tbis particular lateral path position, the variation of k, is less than 0.4%over the specified Reynolds number range. Tbis method rnay also be applied in multipath configurations,which may reduce the errors associated with the flow-profíle deviation from the assumed axialsymmetric power law.
In a multipath meter, the transducers can be arranged in many different ways. The acoustical paths maybe parallel to each other, but other orientations are possible as well. The meter rnay employ either director reflected transmission along two or more tilted chords. The method ,,'used to combine themeasurements from the individual paths into an average velocity also varies with the specific meter
e-s
design.. It is important to note that not all methods require the use of the previously described k-factor forthe average flow calculation.
In a multipath meter, ji (p) 16is ca1culated for a set of discrete values ofp. Since V can be written as
R
V= 2 fji(p)~( R1- P')dp
A .R
(16)
where17 ji (p) is the average flow velocity along the path having a lateral position, p, the integral can
be approximated by applying a suitable numerical integration technique; for instance, Gauss integration..In this way, an estimate of V can be computed based on ji (p) 18 for each path
N
V = L: Wi ji(Pi);"'1
(17)
where W i are weighting factors dependíng on the applied integration technique and Pi are the lateralpositions of the ultrasonic transducers. This is a widely used technique for numerical integration. Ibismelhod has been implemented in various ways in rnultípath ultrasonic flow-rneters Depending on themethod used, the path locations can be chosen such that the weighting factors are constants that do notrequire an assumption ofvelocity profile ..
Multiplication of the average velocity by the flow area, A, yields the volumetric flow rate Q:
º = VA (18)
2..2.3 Generation of Ultrasonic Signals
The ultrasonic signals required for the flow measurement are generated and received by transducers.Piezoelectric transducers employ crystals or cerarnics, which are set into vibration when an altematingvoltage is applied to the piezoelectric element, The vibrating element generates sound waves in the fluidSince the piezoelectric effect is reversible, the element will become electrically polarized and producevoltages related to the mechanical strain when the crystal is distorted by the action of incident soundwaves Because the acoustic impedance of the gas is much smaller than that of the piezoelectric element,a layer of material is typically used between the gas and the piezoelectric element to maximize theacoustic efficiency. This layer of material has an acoustic impedance between those for the gas and forthe piezoelectric element.
Usually the surface of the transducer has a plane circular shape. The acoustic behavior of a plane circularpiston has been well documented (Stepanishen, 1971, and Harris, 1981) When continuously transrnittinga single frequency, the sound pressure field takes the form of an acoustic beam, the width of whichdepends on the ratio of acoustic wavelength to piston diameter: the larger this ratio, the wider the beamBecause the acoustic beam spreads, the sound pressure level gradually decreases along the beam.Furthermore, the sound is attenuated through absorption in the gas. Although in sorne gases absorptíonmay be considerable (for instance, carbon dioxide), in natural gas applicatíons it is usually negligibleover the length of the acoustic path.
C·10
___-J
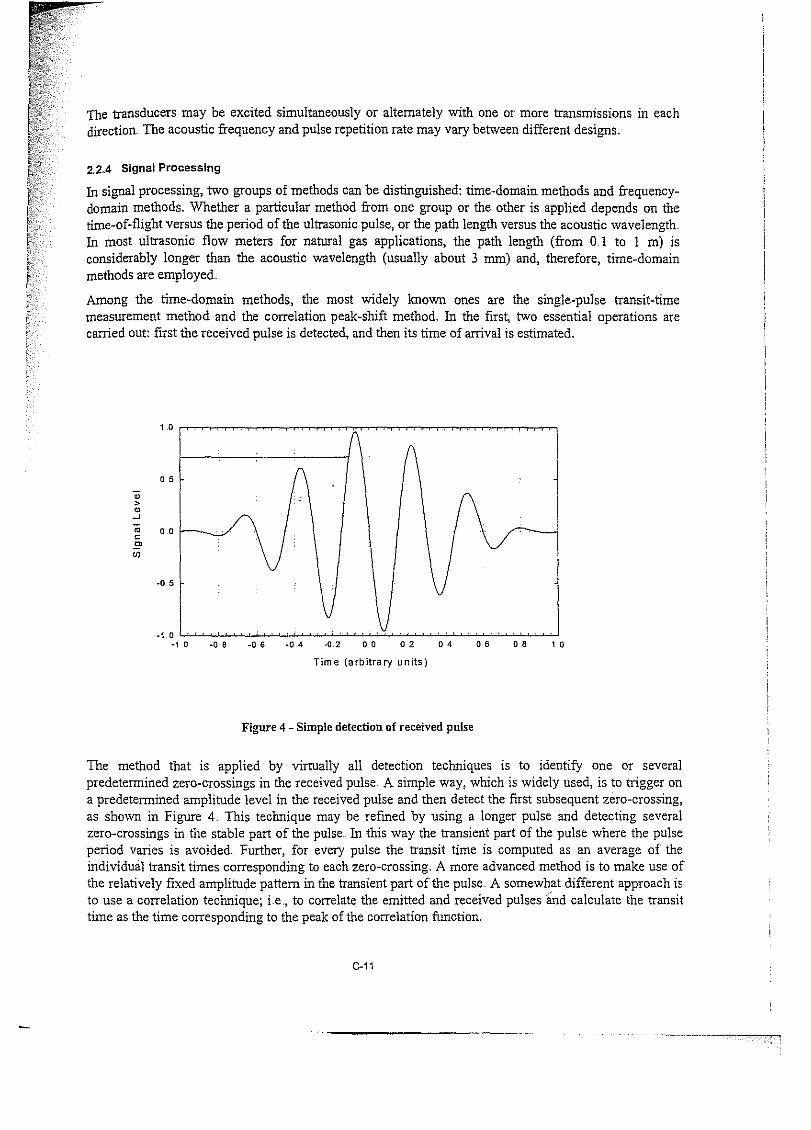
The transducers may be excited simultaneously or altemately wíth one or more transmissions in eachdirection" The acoustic frequency and pulse repetition rate may vary between different designs,
2"2"4 Signal Processing
In signal processing, two groups of methods can be distinguished: tirne-domain methods and frequencydomain methods, Whether a particular method from one group or the other is applied depends on thetime-of-flight versus the period of the ultrasonic pulse, or the path length versus the acoustic wavelengthIn most ultrasonic flow meters for natural gas applications, the path length (from 0,l to l m) isconsiderably longer than the acoustic wavelength (usually about 3 mm) and, therefore, time-domainmethods are employed,
Among the time-dornain methods, the most widely known ones are the single-pulse transit-timemeasurement method and the correlation peak-shift method, In the first, two essential operations arecarried out: first the received pulse is detected, and then its time of arrival is estimated.
o so;>~
.J
ro o oeE'
'"-05
Time (arbitra ry units)
Figure 4 - Simple deteelion 01received pnlse
The method that is applied by virtually all detection techniques is to identify one or severalpredeterrnined zero-crossings in the received pulse, A simple way, which is widely used, is to trigger ona predeterrnined amplitude level in the received pulse and then detect the first subsequent zero-crossing,as shown in Figure 4" This technique may be refined by using a longer pulse and detecting severalzero-crossings in the stable part of the pulse, In this way the transient part of the pulse where the pulseperiod varies is avoided. Further, for every pulse the transit time is computed as an average of theindividual transit times corresponding to each zero-crossing, A more advanced method is to make use ofthe relatively fixed amplitude pattem in the transient par! ofthe pulse, A somewhat different approach isto use a correlation technique; Le, to correlate the emitted and received pulses lÍnd calculate the transittime as the time corresponding to the peak of the correlation function,
C-11
When the acoustic signal gets corrupted, the signal detection becomes increasingly difficult. Two kindsof errors may occur: missed pulses and erroneous zero locations. The latter leads to tirning errors.Inconsistencies in the recognition of the correct timing point may be due to changes in receivedamplitude, changed wave forrn or noise. Through proper design of the detector, the occurrence of errorscan be minirnized. In practice, the consequence of an erroneous zero location may be more importantthan that of a rnissed pulse Corrupted signals, however, may be rejected based on validity tests asdiscussed in Section 4
The transit times norrnal1y are checked for spurious values, which can then be discarded from the dataset. A number of alternative melhods of checking are possible. The values should always be checked toensure that the velocity of the fluid and the velocity of sound that they suggest are physical1y possible,Final1y, based on a set of n upstream and n downstream measured transit times, the mean upstream anddownstream transit times can be calculated
3 Technical Issues
3.1 Speed of Sound in Natural Gas
Ultrasonic flow meters send "pings" of sound both upstream and downstream through the flowingnatural gas stream.. The upstream and downstream flight times for the pings are subtracted from eachother to obtain the difference.in flight time. Because ofthis subtraction, the effects oflhe speed 01' soundare canceled out. It is apparent from equation (1) that the velocity measured by an ultrasonic flow meterdoes not require lcnowledge of the speed of sound to measure the gas stream velocity. Equation (2) showsthat the ultrasonic meter can measure the speed of sound by dividing the path distance by the flight timeThis measured value of the speed of sound can be compared with a theoretical1y calculated value toevaluate the proper operation of the ultrasonic meter.
Therefore, it is valuable for the user of an ultrasonic meter to be familiar with how sound speed can beaffected by changes in gas properties: lhe speed of sound in natural gas is dependent on pressure,temperature, relative density and the composition mixture, as shown in the fol1owing graphs (see pagesC-14 through C·16) ..
The three natural gas mixtures plotted are GRI's reference natural gas mixtures from Report No GRI93/0181. These are the same as those referenced in A.G.A. Report No, 8 and have the characteristics andcompositions as shown in the fol1owing page.
C·12
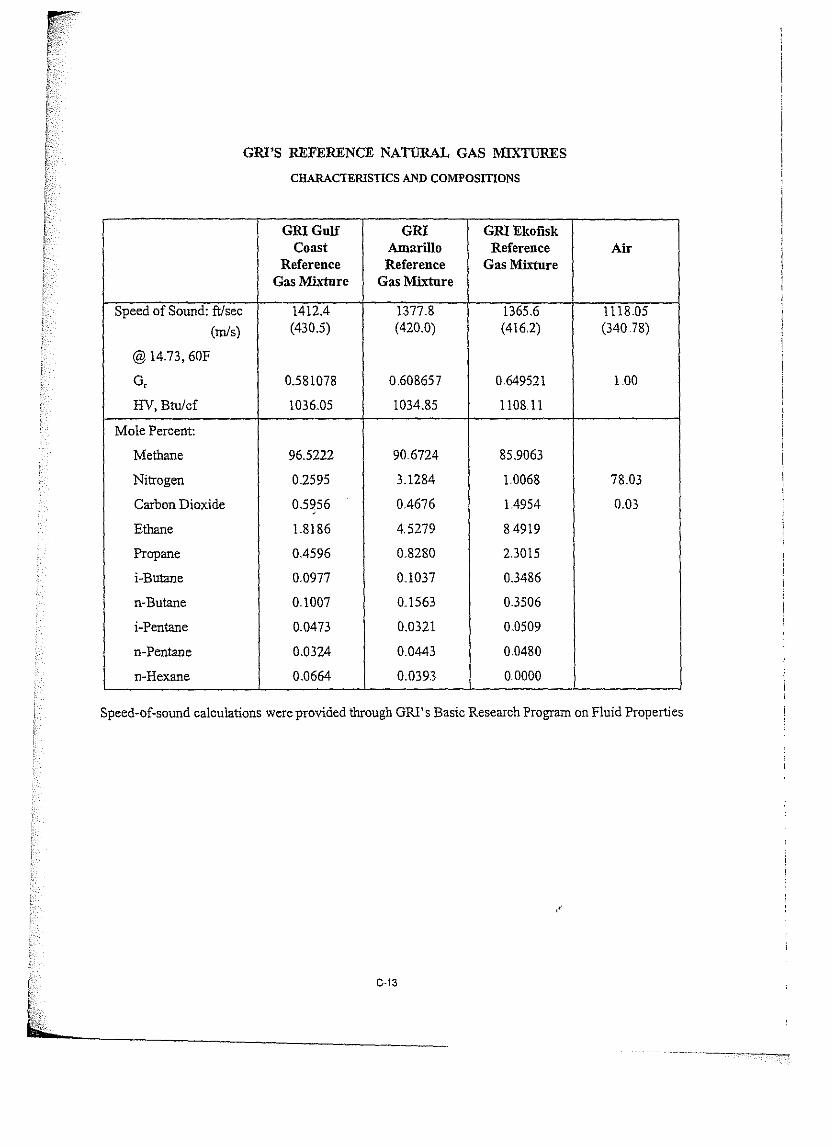
GRI'S REFERENCE NATIJRAL GAS MIXTURES
CHARACTERISnCS ANDCOMPOSITIONS
GRIGulf GRI GRIEkofiskCoast Amarillo Reference Air
Reference Reference Gas MixtureGas Mixture Gas Mixture
Speed of Sound: ftlsec 1412,4 1377.8 1365,6 1118,05
(mis) (430.5) (420.0) (4162) (340 ..78)
@ 14.73, 60F
G, 0581078 0,608657 0649521 1.00
HV, Btu/cf 1036.05 1034.85 110811
Mole Percent:
Methane 96.5222 90.6724 85.9063
Nitrogen 02595 3.1284 10068 78.03
Carbon Dioxide 0.5~56 04676 14954 0.03
Ethane 1.8186 4.5279 84919
Propane 0.4596 0.8280 23015
i-Butane 0.0977 0..1037 0.3486
n-Butane 0.1007 0..1563 0.3506
i-Pentane 0.0473 0.0321 00509
n-Pentane 0.0324 0..0443 0.0480
n-Hexane 0.0664 00393 00000
Speed-of-sound calculations wereprovided through GRl's Basic Research Program on Fluid Properties
C-13
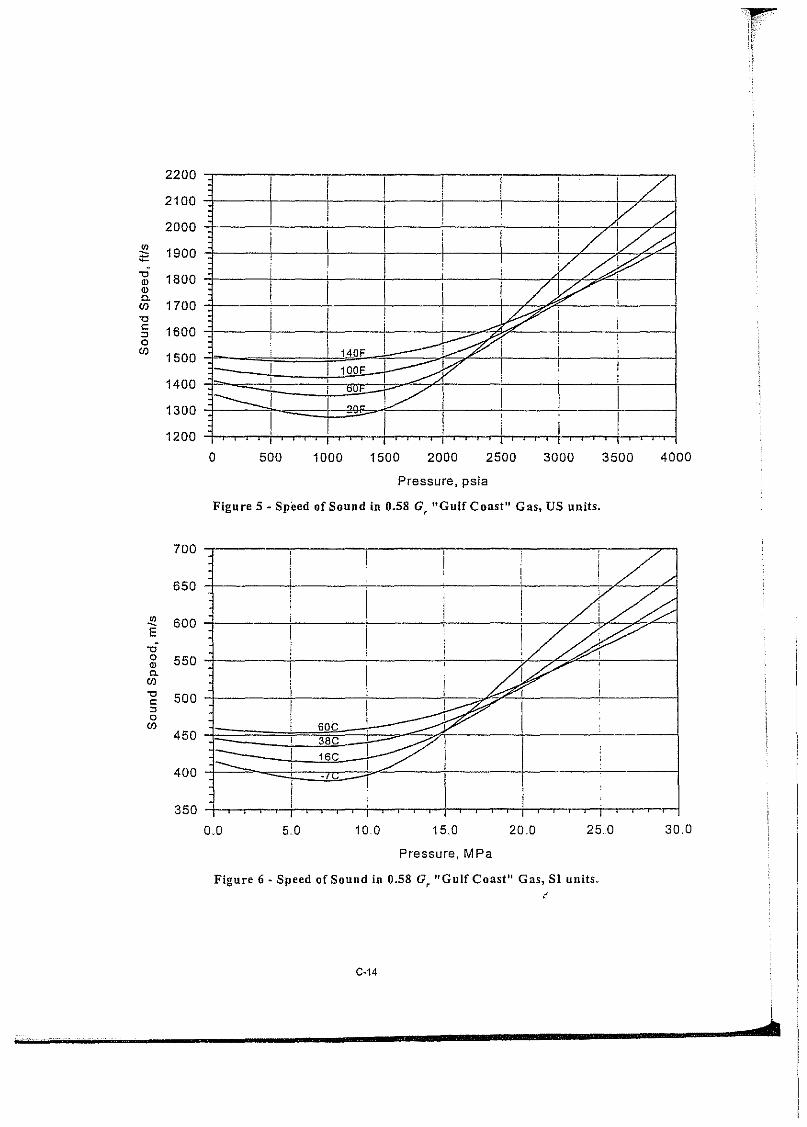
2200
2100
2000
'" 1900~
"O 1800alalO-
1700CJ)
"Oe 1600:JoCJ)
1500
1400
1300
1200
I I I,
/I i 1
1 ! I ! ! V ./,I ,
¡ i
1¡ /I/hi
! I ! ¡ V/Yi ,
I I I I .:V I,
I I ! !~Ii i i
i
i I~i!
140F I ¡
I I 100F ---::::Y I I II , i, i r>: I
I I----1 II
-I I
,¡ II
I I , , , I
o 500 1000 1500 2000 2500 3000 3500 4000
Pressure, psia
Figure 5 - Speed of Souod io 0.58 G, "Gulf Coasl" Gas, US uutts.
700
650
'" 600-E"O
" 550alO-
CJ)
"O 500c::Jo
CJ)
450
400
350
0"0 5.. 0
60e38C16C
¡ 1 ¡ I ' ¡ ¡
100
Pressure, M Pe
20,0 250 30,0
Figure 6 ~ Speed of Sound in 0.58 Gr "Gu lf Coast" Gas, SI uníts.¿
C·14
~............................ ,J.
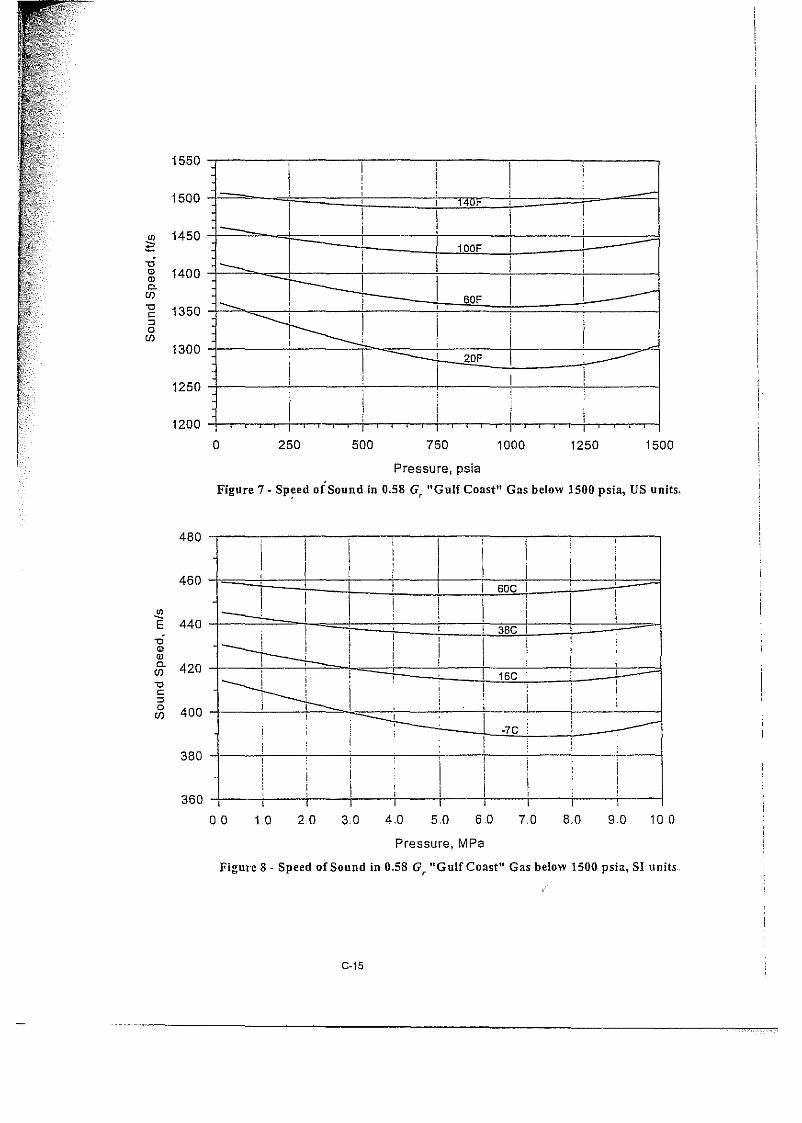
1550
1500
<J) 1450;:::"O
" 1400"el.
CJ)
"O 1350e:Jo
CJ)
1300
1250
1200
I1 ,
I! i, !1 1
, ,1 1 I 1
1I I I !,·1- i I ¡,
1DDF I Ii 1
1- I I :,----- I I I I, 6DF ! ----1--- ,I ,
------r----J i ! i
II, I1 ' ,
I -- ,2DF ---i I1 1 I
1i , !
I ! ¡ !I I, I !1 I I I I
o 250 500 750 1000 1250 1500
Pressure, psia
Figure 7 - Speed oiSound in 0.58 G "GulfCoast" Gas below 1500 psia, US unlts,. ,
iI
I : ,I
,I
II : I
II ,1 ¡ I 1, I
I ¡ I,
II 6DC 1I I i
! II ,
1- I, I Ii , ¡
I I ! 3BC I -i i i I 1
I II
I---+- I i I ¡, ! 1 Ii I i
I--+----LI I 16C ! 1
! ,I ,
Ii I ,
i i1
I i: ! i
j I , I I, ------+- I1 --¡ ,
·7C, !i,
i , i I i, ,i ,
II i i
j I I : 1I1 I !: I ,
I, I , , ,1 1 , , , 1 ,
480
460
<J)- 440E"O
""el. 420CJ)
"Oe:Jo 400CJ)
380
360
00 10 20 30 40 50 60 70 8.0 90 10 O
Pressure, MPa
Figure 8 - Speed ofSound in 0.58 G, "Gulf Coast" Gas below 1500 psía, SI units,
C·jS
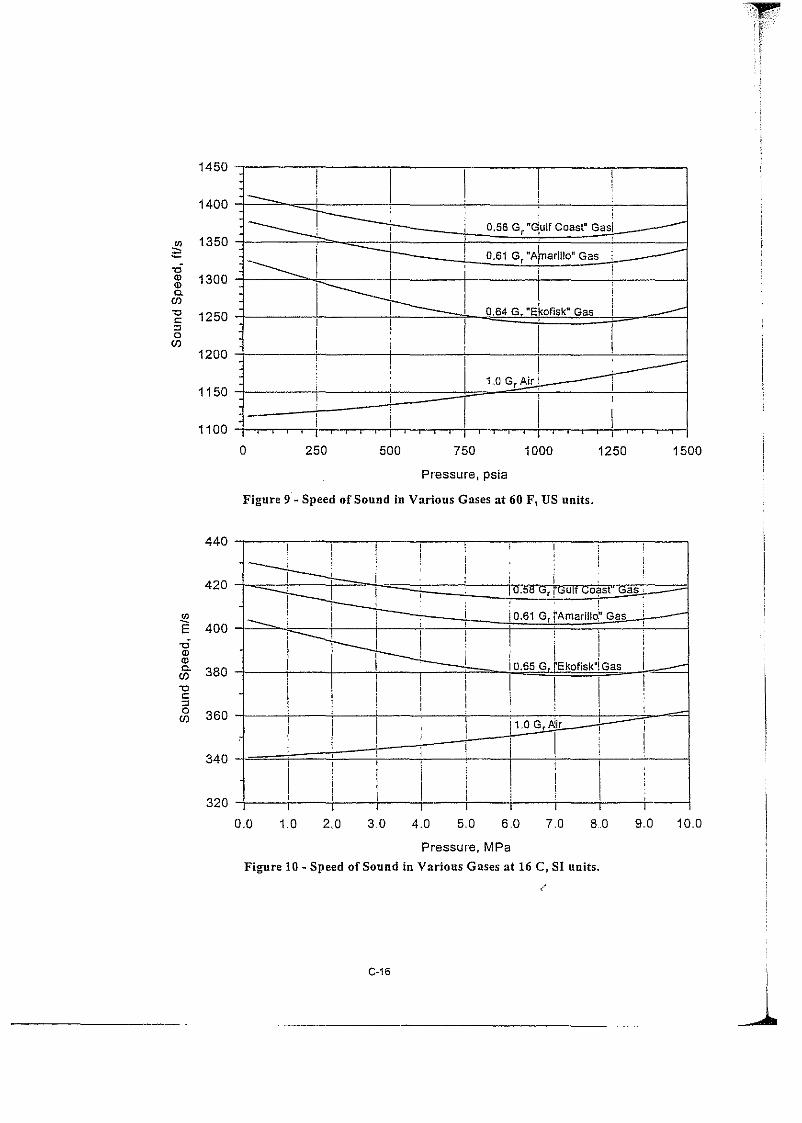
1450
1400
"' 1350:;:,--c<ll 1300<llO-
(/)
-o 1250c:::loin
1200
1150
1100
I I I1,, ,- , ,---=r-- , i
f; 0.58 G, "Cjulfccesr Gasl
1 ! 0.61 G, "A~arlllo' Gas ---'--------. I !;
I I i I
I-----+-- I !,!I ---I 0.64 G 'Ekofisk" Gas I
I ! ! I iI! I; I I I ---
•
1..0 GrAir!,, 1
1 i I II
I Ii i II1-'- , I I I I I I I I I ,
I I
o 250 500 750 1000 1250 1500
Pressure, psla
Figure 9 - Speed of Souud iu Various Gases at 60 F, US uníts.
440 -,---,----¡--r--,--,---¡-----;--.,--...,.---,
i i 'Ia.5S G, I'Gult Co~st'
10.0908 ..07.0
10.61 G, I'Amarill", Gas
i ! i, l' I, ,i0.65 G. rEkofisk'iGas
1 I !
, ,605.0
I
40
III
IIII
3.0
lI
2.0
II
I
10
340
400"'E-c<ll
~ 380 +--+---~--+_......::;:::::::?==-1.!L!~~gg~~~-t==::~"e::loo:
Pressure, MPa
Figure lO - Speed ofSound in Varíous Gases al 16 e, SI uníts.
é
C-16
J
3.2 Installation Requirements
Meters available from different manufacturers have differing recommended practices for installation.Given the different designs and proprietary features avaílable, this is not unreasonable. Manufacturerarnay recommend an installation based on A.G.A Report No. 7, Measurement ofGas by Turbine Meters,or there rnay be more or less stringent requirements, depending on testing the manufacturers have done.Single-palh meters will require considerably more stringent requirements and are still unlikely to matchthe performance of multipath rneters.
An importan! consideration for the user is that the body oftesting and research is still quite small relativeto the testing of other meter types, such as orifice rneters. Manufacturers may specify certainrequirements, based on their testing, but the particular installation may not produce the same results.
3.2.1 Installallon Configurations
Since the ultrasonic meter is a fluid-velocity measuring devíce, optimum performance wil1 be achievedwhen the piping configuration immediately upstream of the meter provides a well-developed flow profileentering the meter. Since a multipath ultrasonic meter measures the fluid velocity at severallocations, iteffectively tends to average the velocity profile of most normal flow conditions, thus minimizing theinfluence of minor flow distortions on meter performance
To minirnize possible flow-distortion effects, rnanufacturers may recommend a flow conditioner in thepiping upstream of the meter Flow swirl conditions may be caused by pipe fittings, valves or regulatorspreceding the meter inlet piping, Regardléss of location, sorne flow conditioners will not eliminate theeffect of strong jetting. ..
The installations recommended by manufacturers vary, but generally require a length of 5 to 10 nominalpipe diameters upstream of the meter and 3 nominal pipe diameters downstream of the meter. It shouldbe ernphasized that the 5 to 10 diarneters upstream length is based on a very limited amount of data andshould be considered as a minimum requirement, which is only valid when reasonable upstreamconditions exist (e.g., low levels of swirl, small asyrnmetries in flow profíle).
The inside diarneter ofboth inlet and outlet piping should be the same size as the meter. Further testing isrequired to establish the effect of small changes in diameter,
There should be no pipe connections wilhin the upstrearn or downstream píping other than pressure taps,temperature wells, densítometer connections or flow conditioners if they are used. The rnanufacturers'recornmendations for the upstream length for single-path meters are generally longer.
The ultrasonic meter' s design makes it inherently bi-directional In bi-directional installations, upstrearnpiping is required on both ends of lhe meter.
If a flow conditioner is used, the type and installation recommendations should be obtained from themanufacturer.
3.2.2 Pressure and Temperature Measurements
A pressure tap can be located on the body of the meter, or in close proximity (within 5D) Temperaturemeasurements should be located ID to 5D downstream to minimize the effects of the thermowell, Ifthere is two-way flow or downstream location is impracticaI, the effect of thermowell penetration on thevelocity profile should be minimized. Typically, a thennowell less than one-third of the pipe diameter,
. élocated between 3D and 5D 01 the meter, !S recornmended..
C-17
3.2.3 Oensity Measurement
Although it is desirable to sample the gas as elose as possible to the ultrasonic measuring sectionconditions when using densitometers, care must be exercísed not to disturb the meter inlet flow or tocreate an unmetered bypass, When used, densitometers should be instaIled downstream of the ultrasonicmeter References should be made to manuals on the various densitometers for further information.
3.2.4 Contamination, Strainers and Filters
Contamination of the transducers, including debris that sticks to the surface (such as grease or oil buildup), may attenuate the signal or alter the velocity calculation resulting in peor performance. 11'contamination is a problem with a particular gas stream, provision to remove and clean the transducersshould be rnade.
Due to the nonintrusive design of the ultrasonic meter, small amounts 01'debris and foreign particles,such as those found in normal pipeline-quality systems, may pass through the meter without damagingthe device, Measurement accuracy may be affected slightly, depending on the type, size and amount ofdebris passing through the meter. Even Iarge debris should not cause damage. Measurernent accuracywill be affected by debris that remaíns in the meter and restricts the bore or blocks a path.
If strainers or filters are used, they should be sized so that at máximum flow there is a minimum pressuredrop and flow distortion. It is recornmended that the differential pressure across a strainer or filter bemonitored to ensure the strainer or filter is in good condition so as to prevent flow distortion.
3.2.5 Over-Ranqe Protection
The ultrasonic meter wiIl not be darnaged by extreme gas velocities. Extreme gas velocities can occurwhen pressurizing, blowing down or purging the meter TUn Extreme gas velocities can also occur as aresult ofthe operatíon ofthe downstream piping system The accuracy of the meter may be affected oncethe flow exceeds the stated maximum velocities. Therefore, it is advisable to ensure that the meterínstallation flow rates are clearly stated at the design stage and that the size 01' the meter allows forexpected over-range conditions.
Rapid pressurization and depressurization of ultrasonic meters should be avoided since this can causedamage to the transducers.
3.2.6 Bypass
Bypassing for maintenance is not required for instaIlations in which the meter is fitted with isolationvalves that provide the capability of removing the transducers without interrupting the flow or flowmeasurement In instaIlations wíthout this capabílity, installations requiring proving or instal1ationsrequiring the removal of the entire meter for cleaning or inspecting, bypass piping is recommended ifflow interruption is not aIlowed
3.2..7 Pressure-Reductnq Valves and Noise
Interference with the meter' s signals has been a problem at some sites that have other equiprnent thatgenerates ultrasonic noise (such as control valves). One particular problem is that noise attenuating trimused on some control valves produces sound in the range that the meter is using.. In these applications, itmay be necessary to change the trim (although this is not always an option) or to physical1y separate themeter and the valve by a sufficient distance. Because of the potential for profile distortion andlor the
C-18
...
generation of ultrasonic noise, the instal1ation of a throttling device, such as a regulator or a partial1yclosed valve, in close proximity to the meter (especial1y upstream) is not recornmended.
General1y, noise in other frequencies is not as much of a problem, although high noise level or resonantfrequencies could interfere with the meter.
3.2.8 Vlbralion
Piping víbratíon should be kept to a mínimum, since the electronic apparatus mounted on the pipe will besusceptible to damage if the levels are hígh enough Specific levels should be specified by themanufacturer.
3.2.9 Orientalion
Generally, the meter will be designed to be instal1ed in a horizontal run of pipe, although otherorientations should work just as well, A primary consideration is whether the transducers are mounted inrecesses in the body and whether these wíll be susceptible to collecting dirt and liquids in the gas stream.The orientation of the transducers in the meter body díffers arnong manufacturers.
3.2.10 Pigglng
Sorne meter designs will allow pigs to pass without interference, while others may require retraction ofthe transducers. Where the transducers are recessed, provision to clean the transducer pocket should bemade on lines that may be pigged,
3.2.11 Pulsalion
Preliminary testing has shown that pulsation has little effect on ultrasonic meter performance. In theory,the impact is small, since any errors should average out
3.2.12 Gas Composltlon
Within the gas phase, composition should not have a large effect on performance. A high percentage ofliquids (beyond an entrained mist) will likely affect accuracy somewhat. Sorne information on thecomposition of the gas should be available from the speed of sound; however, this may be useful only asan indication that the composition is changing. A high percentage of carbón dioxide (CO,) in the gas maycause problems, as CO, tends to attenuate the signal,
3.2.13 Stress and Strain Issues
The meter should be designed to meet applicable mechanical codes and standards Information on thechange in meter factor resulting from high-pressure operation is either available from the manufactureror gained as the result of a calibration.
3.3 Meter Construction
3.3.1 General
The ultrasonic meter consists of two basic components:
L the body
2. the electronics
C-19
3.3.2 Body
The body and all other parts fonning the pressure-containing structures should be designed andconstructed of material suítable for the service condítíons for whích the meter is rated..
The body end connectíons should be designed in accordance wíth the appropríate flange and threadedconnectíon standards.
The body should be identífied to show the following
l. manufacturer' s name
2. maxímum and mínímum capacíties ín actual volume uníts - actual cubíc feet per hour
3.. máximum allowable operatíng pressure, psig
4. serial nurnber
5. date ofmanufacture.
6. body material
7. an arrow índícatíng the directíon of posítíve flow
8. mínímum operatíng pressure
3.3.3 Eleclronics
The electronícs include the círcuíts and devíces required to ernit and receíve ultrasoníc pulses, measurethe travel times of the ultrasoníc pulses (transit timeJ, calculate the actual flow rate and transmit thísinformatíon to a flow cornputer. .
The flow inforrnatíon can be transferred to a flow computer vía a serial cornmunícatíons port, through afrequency signal or by other analog methods, Sínce the ultrasonic meter is bi-directional, the electronicsprovíde flow informatíon in positíve or negatíve uníts to ídentífy flow direction. An arrow on the meterbody ídentifies the directíon of posítíve flow, If analog output ís provided, then analog status anddírectíon indícators should also be avaílable..
3,4 Performance Characteristics
3.4.1 Swirl Effect
The ultrasoníc meter ís desígned for a condítíon that approaches axíal flow at the meter ínlet If the fluidat the meter ínlet has sígnificant swirl (maínly tangentíal components), the indívídual path velocíties at agíven flow rate wíll be dífferent from that for axial flow. For accurate measurernent, such a swírl effectmust be reduced to an insigníficant level through proper installatíon practices, as described previously.The level at whích the swírl becomes insígníficant to the metering accuracy depends on the specificmeter design.
Circulatíon and cross-flow can be measured along suítable mid-radius and diameter paths ín the spoolpiece. Circulatíon and cross-flow can also be measured utílízing other path arrangements, such as thosecontained in a thíck flange or ín a short spool píece that specífically includes paths for sensíng suchsecondary flows. Their unwanted contributíon to the measured axial ñow can be minímízed orelíminated by use ofweightíng factors detennined theoretícally or empírícally
C·20
3.4.2 Meter Error, lJncertalnty and Accuracy
Manufacturers specify upper and lower bounds for the flow error, wilhin which the ultrasonic metershould operate, The upper and lower bounds may be a function oí the flow rate and will typically allowmore error near the lower end of the meter's operating range. There can also be a srnall zero offsetcaused by very srnall discrepancies in the measureroent of the upstrearn and downstrearn transit times atzero flow. This zero offset looks like a constant error in average velocity and will have a morepronounced effect at low flow rates, when expressed as a percentage of flow. The manufacturer's datasheet should be consulted for the magnitude of the zero offset
For increased accuracy, meters can be flow-calibrated. An optimum meter factor and zero offset are thencalculated so that the meter error at any given flow rate, within the operating range of the meter, wíll fallwithin the manufacturer's specified error band for a flow-calibrated meter, whích is typically ± 0.5%.
A complete statement of measurement error needs to include the measurement uncertainty of the proversystem,
3.4.3 Meter Performance Curve
The meter error at a given flow rate can be determined from a meter performance curve, which isproduced by testing each meter against a prover system at several different flow rates, then plotting thepercentage error in flow reading versus the prover flow rate. The error curve can be plotted against actualflow rate, average velocity or Reynolds number, depending on the intended purpose of the curves
When plotted against actual flow rate oro average velocity, the meter performance curves at variouspressures and ternperatures are generally a farnily of distinctive curves.
When the meter error is plotted against the Reynolds number, the meter performance curve tends to showflow-profile effects. This method ofplotting would normally be used only for specific experiments and isnot recommended for general use. It is important to consider lhat the presence of a small zero offset canobscure apparent profile effects, since the effect of the zero offset on the percentage error will vary as afunction of the Reynolds number.
3.4.4 Pressure Loss
The pressure loss of an ultrasonic meter is negligíble due to the design, which shows no significantprotrusions, obstructions or constrictions to the fluid flow
3.4.5 Maxlmum Flow Rate
Ultrasonic meters are generally designed for a maximum velocity, vm,m which is used to calculate themaximum actual flow rate, Qm.,o The maximum flow rate of the meter is generally lirnited by the abilityto receive undistorted ultrasonic pulses, which can be a function ofboth transducer design and the signalprocessing methods. The maximum flow rate typically remains the same for all pressures andtemperatures within the stated maximum meter operating range.
The maximum flow rate Q=, is a simple function of the maximum velocity given as
The maximum flow rate can also be expressed in terms of a "standard" f1~w rate by making theappropriate pressure, temperature and compressibility corrections
C-21
3.4.6 Minimum Flow Rate and Rangeabillly
The mínimum flow rate (01' mínimum capacity ratíng) for an ultrasonic meter ís the lowest flow rate atwhíeh the meter wí11 operate wíthín sorne speeífied uneertainty 01' error limit. Obviously, the minímumflow rate depends on the límít ehosen. Usually, thís aeeuraey lírnít ís set at ± 1.0%. Genera11y theminímum flow rate depends on the magnítude of the zero offset The mínimum flow rate can also beexpressed in terms of a "standard" flow rate by makíng the appropriate pressure, temperature andeompressíbílíty eorreetíons.
3.4.7 Pulsation Effects
In a number ofmeasurement applíeatíons (e.g., compressor statíons), the flow may be pulsatíng ínsteadoí steady.. Frequently thís can be reetífied by plaeing the meter farther from the pulsatíon souree 01' byadding a pulsatíon damper, but sometímes thís ís not possible. Thus, ít may be ímportant to knowwhether the magnítude of the error due to pulsating flow eondítíons ís signifieant. In theory, pulsatingflow should cause no signifieant error sinee the results are averaged over many measurements Errorseould oeeur ifthe pulsating flow is synehronízed wíth the transdueer firing rate.
3.4.8 Loss of Path
The loss of one 01' more paths in a multípath ultrasonie meter should cause the meter to generare analarm, but eontínue to operate .. The aeeuraey of a meter operatíng wíthout a11 paths aetíve will líkely beredueed.. The amount of the reduetíon in aeeuraey ís speeífie to the meter desígn, the path lost and theeompensatíon method .. It may also be influeneed by the flow eharaeterstíes ofthe speeifie installation.
3.5 Field Checks
3.5.1 General
The most eommonly applíed field eheeks are the visual inspeetíon and speed-of-sound test Operationalmeters measure the speed of sound in the gas If the gas eompositíon, pressure and temperature areaeeurately known, thís measured speed of sound can be eompared wíth a ealeulated speed of sound basedon AGA. Report No. 8 as indieated in Seetíon 3.1. Good agreement indíeates that the transit-tímemeasurement and one length measurement of the spool píeee are wíthín aeeeptsble limits.
3.5.2 Visual Inspection
In visual inspeetíons, the meter bore and transdueer ports should be inspeeted for aecumulation of solids,erosíon 01' other damage that would affeet meter performance.
3.5.3 Maintenance and Inspection Frequency
The ultrasoníe meter should alert the operator when a problem oeeurs wíth the operatíon of the meter,and general inspeetion of the meter should not be necessary untíl an alarm eonditíon exists. At dirty gasinsta11ations, periodie inspecticns can be established prior to expected alarm conditions to prevent theíroccurrence. The existence of an alarm condítíon does not mean that a11 flow measurement ís lost, sincethe ultrasonie meter can continue to funetíon wíth the loss of a11 but one of the path measurements
G-22
-
4 Evaluation of Measurement Performance
The performance of the ultrasonic flow meter is constantly verified through the meter's self-diagnosticsoftware. In addition to verifying that the meter is operating properly, the diagnostic software can attacha level of confidence to the flow measurernent. The ultimate goal of the self-diagnostics is to verify thatthe measurement is accurate without the periodic inspections associated with conventíonal meteringsystems. It is far better to identify poor measurement conditions at the time of metering rather than waitand then try to correct corrupted data. The self-diagnostics also allow an operator to identify the cause ofa metering problem, or at least have a good idea of the problem before going to the site, thus reducingmaintenance or down time. This section will discuss the role of diagnostic software in evaluating meterperformance and describe the major issues that can affect meter performance..
There are many levels of diagnostics in the ultrasonic flow meters - sorne very simple and others verycomplex. It may seern confusing because the conversations can become bogged down with discussionsabout signal detection, frequency content, timing, flow profiles, statistics or just about any other topic. Inreality, the subject of diagnostics is straight-forward once one understands the dífferent levels ofdiagnostics and the reason these levels exist, The next section will describe sorne of those levels, startingwith the simplest and working toward more complex ideas.
Who or What is the Diagnostician?
U1trasoníc flow meters produce an alarm and an alarm ID code when the processíng unít determines thata condition necessary for proper measurement has not been met. These conditions are often identified bysetting Iimíting mínimum and maximum values for diagnostic functions. For example, if the meter isused ín a natural gas service in which the natural gas speed of sound ís always known to remain between1,400 ftJsec and 1,500 ft/sec, alarm limits may be chosen to indicate an extraordínary eventoAnother typeof example, one which gauges the performance of the meter's components, ís amplifier gain setting (theamount of power required by the system to raíse the transducer sígnal level to a usable voltage). If themeter nonnal!y requires 70 dB to 100 dB, an alarm may be set at 120 dB to indicate the meter is workingoutside íts normal settings.. This may be an indication the transducer has weakened or an electricalcomponent is not working properly In most cases, the diagnostic tests can be changed, customized 01'
eliminated entirely. As the data base of experience grows, new díagnostícs can be added.
Simple Diagnostics: Is the Meter Working?
The simplest diagnostic is a reasonability check. If the meter is reading a reasonable number and if themeter doesn't have any obvíous mechanical or electrical defects, it ís considered working. A símplecontact alarm, 0/1, with very relaxed diagnostic tests will suffice for this case .. Recal! from the prevíousparagraph that alarm condítions do not need to change in arder to use a díscrete alarm; however, thealarm ID code may not be read without further action.. A serial link is needed to receíve the alarrn IDcede.
Ultrasonic Signal Diagnostics
Al! flow infonnation in ultrasoníc flow meter ís derived from transit-time measurements of ultrasonícsignals traveling through a movíng gas. One of the most crítical aspects of the ultrasoníc flow meterdiagnostic software ís to evaluate the indívidual ultrasoníc signals to detenníne if the sígnal ís acceptable
C-23
l
for an accurate transit-time measurement. If there is a problem with the ultrasonic signals themselves, thetransít-time measurement and, therefore, the flow measurement wilI be incorrecto It is impossible to statewhat an ultrasonic signal should look like in general, but essentialIy the signal needs to appear asexpected by the receiver and processing software (recalI digital meters use software to achieve signaldetection).
Individual transducers have their own characteristics, similar to each human voice 01' ear, and thesoftware must be able to handle sorne variation, When variations from the norm become too large, thesystem may experience detection problerns. A simple example of a detection problem is cycle skipping.In older analog meters, the threshold detection technique would determine a detection point by choosinga zero-crossing after a voltage threshold had been reached by the signa!. Unfortunately, the signalamplitude sometimes changes due to pressure changes and the threshold is crossed by a different portionof the ultrasonic signal al' at a different cycle .. The transit time would then be one period (1/f) differentfrom the previous transit time. At 100 kHz, the transit-tíme difference would be 10 microseconds,resulting in an appreciable error of several percent. This particular detection problem can be identified bychecking speed-of-sound measurements among different paths ..
An example list of specific diagnostic tests has been included, but a few of the more cornrnon signaleffects are discussed here for reference. These effects do not necessarily cause a measurement problem,since the goal of good detection software is to eliminate the need for extremely stable 01' predictablesignals..
4.1 Signal Amplitude
The amplitude al' strength of the ultrasonic signal (voltage on an oscilIoscope) depends on just aboutevery aspect of the measurement system. Even analog systerns eventualIy employed automatic gaincontrol because the effeet is so widespread. Sorne transducers are stronger than others, especially speeialdesigns (wet gas, corrosives, etc.). Pressure is directly related to acoustic impedanee in gases and,therefore, controls the amount of coupling between a gas and the transducer Higher pressures aregeneral1y assoeiated with stronger ultrasonic signals. Meter size and path length wil1 change theamplitude of the signal because of spreading and signal scattering within lhe gas. Very large meters haveweaker signals. Particulates 01' liquids in the gas may seatter the signal and weaken it. Dirt on transducerfaces may weaken the signaL Temperature also has sorne effect on the ultrasonic signal strength.
4.2 Pulse Shape
A pulse' s shape is important because the detection point within the pulse must be well-defined Theshape of any pulse is determined by the frequeney content of the pulse: generally, the broader thebandwídth of the transducer, the narrower the pulse. Ultrasonic flow meters use fairly broad-bandtransducers in order to produce pulses with well-defíned front edges that simplify detection. Much eouldbe said about the design of these transducers Suffice it to say that volumes have been written on thesubjeet, and it still isn't clear that anyone can predict the output of a eomplieated transdueer beforetesting it. The pulse shape can be affeeted by anything that distorts the signaL Flow rate itself has someeffect on the pulse shape. At high flow rates, the signals tend to be pul1ed apart by shear within the flowprofile. Irregular flow patterns may ehange the pulse shape. Edge effeets from the meter body itself onouter paths 01' in smalI meters may alter pulse shape. Near-critical gas components, such as CO, canseleetively attenuate certain frequencies within the ultrasonic signal and, therefore, ehange its shape
C·24
4.3 Noise
When u1trasonic signals contain a high level ofnoise, it becomes more difficult to identify the pulse fromthe transmitting transducer; therefore, the transit-time measurement is in jeopardy, Noise is only aproblem when it is ultrasonic, and it may be either gas-borne or direct (through the meter body). It maybe further characterized as either synchronous or nonsynchronous to the firing pulse.
Direct noise is usually generated by the transrnitter itself, but for sorne reason the signal elects to travelthough the meter body rather than, or in addition to, through the gas .. Since the speed of sound in steel issorne 10 times greater than in á typical gas, the signal though the body arrives at the receiver before thegas-borne signa!, and then echoes throughout the meter body for a long period of time. The cause ofdirect noise is usually an unintended coupling between the transducer element and the meter body by aliquid or solid material. Transducers and mounts should be designed to provide poor coupling into thebody. The effectiveness of a particular design will vary with operatíng conditions, and direct couplingmay still occur. Direct noise can then be eliminated only by removíng the unintended couplíng.
A cornmon source of gas-borne noise is a pressure reduction within the gas pipeline. Ironically, "quiet"valves and regulators are especially noisy in the ultrasonic spectrum because the audible quietoess isachieved by shifting the energy ofthe sound to a higher frequency (above 50 kHz). Gas-borne noise maybe overcome with signal processing techniques. Signal averaging, or "stackíng," is a techníque thateliminates nonsynchronous noise extremely well in steady flowing conditions. Essentially, severalultrasonic wave forros are added together and the sum-wave form is divided by the number of signalsadded to produce the average-wave formo Tbe noise in the wave form will tend to add to zero since it israndom, while the signal from the transducer will accumulate in the same wave form positíon. Thesignal-to-noise (SIN) ratio can be made arbitrarily large if enough samples are taken and ií the transducersignal is not moving (steady flow). Work has begun within the natural gas industry to study and reducethe level ofnoise from quiet valves and regulators that are in the ultrasonic flow meter range
The power level of the ultrasonic transducer is significant in noisy applications because the signal leveldirectly affects the S/N ratio. In almost every discussion on noisy applications, someone will ask, "Well,why don't you just increase the power to the transducer?" Tbe answer is multifaceted, but safety is themain reason the power to the transducer may be limíted, Since the transducer is in direct contact with thegas within the pipeline, sorne method must be used to control any ignition possibility in the event of atransducer failure. Most operators consider the inside of the pipeline to be a Division 1 area, and sornerequire the transducer to be intrinsically safe. The intrinsically safe requirement limits the amount ofpower that can be used to drive the transducer and, therefore, limits the initial signal level andsubsequent S/N ratio. In cases where intrinsic safety is not required or other methods, such as explosionprcof certified transducers, are accepted for internal pipeline safety, the power levels may be increasedThe power levels may also be increased (depending on the design of the metering facility) if thetransducer is outside the pressure boundary; that is, coupled to a buffer or flange where said buffer orflange is par! of the pressure boundary Higher power levels make it easier to check out and dry-calibratea spool piece in air or other gas at atrnospheric pressure
4.4 Batch Diagnostics
Individual transit-time measurements are normally not used to calculate a flow rate. Sets of transit-timemeasurements, or "batches," are used to calculate flow tates. Typical batch sizes are from 8 to 32 sets oftransit times. By using an average value for a batch, the output of an ultrasonic flow meter is more steadythan if a single pair of transit times is used. The ultrasonic flow meter is also more forgivíng, since a fewrejected individual signals (see signal diagnostics) do not trigger a flow-rate alarm and the batch is
C-25

simply evaluated on a smaller number of transit times Of course, if tbe total number of individualsignals rejected is very high, an alarrn will be generated.
The batch diagnostics are statistical. As an example, assume a batch size of 32 for a four-path meter. Thetotal number of transit-time measurernents would be 4 x 2 x 32 = 256, which provides a good base forthe calculation of statistical ínformation, A few simple examples of significant statistics should provemeaningful. The deviation from tbe norm value within any transit-tirne batch is important, For steadyflow, tbe transit times all may be witbin 0.1 microsecond; for unsteady flow, tbey may vary by a fewmicroseconds, The upper and lower extremes for transit-tirne measurements compared witb tbe upperand lower extremes in tbe delta transit times are signifícant. A strong indicator ofpulsations would be awide variation in transit times, but a narrow variation in tbe delta transit times. Cycle skipping may alsobe detected by examining tbe batch statistics among different patbs. Recall tbat speed of sound can bemeasured by tbe ultrasoníc flow meter and tbe measurement should be equal on all four patbs. If tbetransit times reflect a different speed of sound for one of tbe patbs, tbe cause should be ínvestigated.Flow-profile irregularities may also be identified by using tbe batch statistics. Equal speeds of sound incombination witb irregular velocity measurements may indicate flow-profile irregularities.
Just as in ultrasonic signal diagnostics, tbe batch diagnostics needed will depend somewhat on tbe userand application For higher accuracies, the requirements are more stringent. For simple checkmeasurement or control, tbe diagnostics should be relaxed to avoid unimportant alarrns. Cornpressorstations require a slight1y different setup; for example, relaxed limits on tbe transit-time variations due topulsation, AIl of tbese numbers are available and, in sorne cases, are logged at tbe request of tbe user.
Diagnostíc Message Block Example
The following is an example of a portion of tbe information available tbrough one manufacturer' sdiagnostic message block This block of data demonstrates tbe level of inforrnation available and howmessages are relayed to tbe user.
Message Block Example (transmitted by serial communications to a flow computer):
Register Itern Narne
62. STATA
63 STATB
64. STATC
65. STAID
66 .. STYSTAT
67, AIFAIL
68.. BIFAIL
69. CIFAIL
70. DIFAIL
71. A2FAIL
72. B2FAILi
73. C2FAIL
74. D2FAIL
C-26
Detailed explanatíon of codes in message block:
62 - 65, STAT A...D, Chord status definition (for chord A, B, C, D)
o=no error
bit Oset = reject signal if noise level exceeds limit.
bit 1 set = reject signal if S/N ratio below limit.
bit 2 set = reject signal ifmeasurement quality check failed.
bit 3 set = reject signal if speed of sound out of range.
bit 4 set = reject signal if delta time check failed.
bit 5 set = reject signal if span check failed
bit 6 set = reject signa! if polarity check failed,
bit 7 set = reject path if flow-profile check failed.
bit 8 set = reject signa1if peak pulse wídth exceeds limit
bit 9 set = reject signa! if signal quality below limit
bit 10 set = flow change indicator.
bit 11 set = reject path if intra-chord quality check out of range.
bit 12 set = reject path if speed-of-sound devíation out of range,
bit 13 set = path is manually set to be inactive,
bit 14 set =path failed
66, SYSSTAT, General system status
o=no error
bit 1 set = pulse accumulator error.
bit 2 set = processor RAM error.
bit 3 set = program memory error
bit 4 set = EEPROM error
bit 5 set = DSP program memory faílure
bit 6 set = DSP X memory error
bit 7 set = DSP y memory error.
bit 8 set = number or operating paths below minimum.
67 - 74, A"D FAIL 1.2, Number of failures per batch
A •.D designates which path in the multipath meter
1 or 2 designates which direction ultrasoníc pulse travels (upstream ordownstream).
C-27
5 Error Analysis
The principIes for calculating an estimate of the uncertainty in the measurement are laid down inISO 5168 and ISO 7066-1.
Three different kinds of factors may be distinguished as sources oferror.
• physical: related to the velocity profile of the flow
• mechanical: related to the geometry of the acoustic path
• electronic: related to the transit-time measurement
Usually errors are classified as being either systematic or random. On the other hand, in statistical terrnstwo concepts are defined to describe the properties of a measuring instrurnent: bias B and standarddeviation (J .. The root-sum-of-squares error e is given by
(20)
where B denotes the bias 01' systematic error and (J is the standard deviation of the random errors.
5.1 Bias
Because bias is a systematic error and not a random one, it can be reduced onIy by proper design,construction and installation of the instrument, not by averaging. In practice, it is the most important kindof error Bias occurs if the actual flow does not match the model that underlies the computation of thevelocity from the measured travel times 01' if the parameters used for the computations deviate from theactual geometrical configuration .. Bias can onIy be reduced by proper installation of the instrurnent andnot by averaging, because the error is systematic and not random. For ínstance, for the velocity profile toclosely approximate an axialIy symmetric form, sufficientIy long straight upstream and downstream pipelengths are necessary.
5.1.1 Factors Relating to Geometry
The diameter of the conduit (roundness, wall thickness) may differ from its nominal value or from itsvalue at the time of calibration because of expansion due to temperature 01' pressure. Then path lengthswill also be influenced. 10 get an impression of the magnitude of these effects, a smalI example ispresented here.
The volumetric flow rate can be described by combining equations (1), (17) and (18) to give thefollowing expression
(21)
The effect of changes in geometry on the reported flow rate can be obtained by forrning a ratio of theprevious equation for the different conditions. By elirninating alI the cornmon terms, the ratio reduces to
C·28
---
(22)
where the subscripls Oand 1 indicate the measurements al a reference condítion and al a new condition,respectively, Consider an ultrasonic flow meter consisting of a pipe with radius Ro al gas pressure Po (alwhich it is assurned perfectly accurale), wal1 thickness w, modulus of elasticity E and coefficienl oftherrnal expansion a For an increase in gas pressure lo PI' and assurning a purely elastic deformation,the new radius R, of the pipe is found as
R, = 1 + RoP,-PoRo Ew
(23)
There is also a change in the axial (X) measuremenl for the spool piece, which is influenced by the typesof support provided for the installatíon, For this example, the effect of pressure on the axial deformationis ignored.. Assurne for a particular spool piece numerical values are E: 2xl0' N/mm' (29xI06lb/inch'),
Ro = 154 mm (6.06 inch), P, - Po: 50 bar (5 N/mm', 725 psi) and w e 84 mm. (0.33 inch), then
= 1.000458 (24)
Ignoring the change in the X measurerhent and assurning a 45-degree path angle along the spool diarneter(X,=Xo=Do), the path lengths can be delermined from the spool geometry as Lo=435.5777 mm andL,=435,,6775 mm. From equation (22), the ratio of flow rates is then 100137. Therefore, frorn thischange of geometry, an error of -O.137% is estímated for this 50 bar (725 psi) increase of gas pressure.
The changes in geometry due lo thermal expansion can be expressed as:
B!- = L, = XI = 1+ a t.TRo Lo Xo
(25)
which leads to the followíng expressíon for the change in reported flow rale due lo a change in thetemperature of the spool piece.
Q\ = (1 +a t.T)'Qo
(26)
--.. ,
For a rise of temperature of t.T=50° C (90° F), using a: 14xl0·6 °K'\ (7,78xl0" °F'\) for the therrnalexpansión, the ratio of flow tates is then 10021, which indicates an error of -0,21%, This result isindependent of pipe radius and wal1 thickness of the instrurnent.
If lhe pipe is assumed to be round, but actual1yis not, a systernatic error will be the resulto This error maybe eilher positive or negative, depending on the oríentatíon of the acoustic path with respect to thedistorted part of the cross-section Usual1y the deviation from a perfect circle is less than 01% diarnetervariation.
C·29
The roughness oí the inner wall surface of the conduit is another geometrical factor, which actuallyinfluences the velocity profile in the boundary layer near the walL For practical applicatíons, the wallmay be considered smooth as long as its equivalent sand roughness is less than about 25 um {DeOOl ").Steel appears to be very sensitive to corrosion when exposed to air after being exposed to high-pressurenatural gas for sorne time. Therefore, the wall roughness may rapidly increase when an instrument isremoved from a gas line, unless it is protected either by a coating 01' by a thin film of oiL An increasedwall roughness may cause velocity-dependent reading errors.
5.1.2 Factors Relating to Calculation Techniques
The weights w, applied to the path measurements may be constant values, defined for the chosenmathematical method oí approximate integration, 01' they may he empirically determined as a result offlow testing and modeling and vary as a function of the measured path velocity. For a given number andposition of acoustic paths, the bias in using a particular set of weighting functions is influenced by theactual condition and shape of the velocity profíle. Evaluation of the cause and magnitude oí this biasrequires extensive testing of the flow meter under a variety of flow conditions.
5.1.3 Errors in the Time Measurement
Non-fluid contributions to the measured transit time may include time delay in cables, electronics andthe front face oí transducers; intemal computational precision; and the influence oí the ambient conditionon the electronics. There can also be flow-induced timingerrors resulting from turbulence, swirl andpulsation, and time delays in the transducer pockets.
Transducer time delays can cause' velocity offset errors (due to differential time delay) and relativevelocity errors (due to absolute time delay). The measurement of the transit times lu and ID may becorrupted by electronic phase differences between the upward and downward path. Since this isequivalent to a differential time delay 1" a velocity offset error (v,) will be the result, approxirnatelygiven by
-"..-1,; ;
2e l.Ve ::::::
2 X(27)
which, for a given differential delay, will be smaller for larger pipes
From equation (1) it is clear that the measured flow velocity does not depend on the velocity of soundTherefore, srnall errors in the velocity oí sound do not have a significant systematic influence on theaccuracy ofthe measured flow velocity.
5.2 Variance
The influence of randorn errors can be reduced by repeating the measurements and averaging them.Although normally variance has less consequence than bias, it is important for the interpretation ofobserved differences and in determining the sampling time for calibration oí the instrument,
Geornetrical factors hardly contribute to the variance oí the measurements, Measurement of the transittimes lu and ID is only slightly affected by analog electronic noise and the effects of time-quantization. Inmodero instruments the transit time of the pulses is typically measured using quartz-controlled digitalelectronics, which reduce the influence of analog electronic noise. Because the finite time interval of the
C-3D
1
clock chosen is sufficiently small, the effects of quantization noise can be neglected when operating wellaboye the mínimum flow rate. This leaves turbulent velocity variations, both in time and along theacoustic path, as the main cause of the random errors in ultrasonic measurement of a stationary ñow. Thevariation of the speed of sound, because it is slow, can be neglected as compared with turbulent velocityvariations. Equation (11) shows that the measured velocity actually is an average along the acoustic path.Thus, the longer the acoustic path length, the more the turbulent fluctuations are averaged out, resultingin greater accuracy. Therefore, not only can a systematic error like velocity offset be reduced, but alsothe random variations can be reduced in larger pipes as compared with smaller pipes, The remaininginfluence of random errors is reduced by repeating the measurements and averaging them, For a fixed
averaging period of one second and a sufficiently high repetition rate, the standard deviation C7y of themeasured velocity Vcan be written as
C7y = So + S, V (28)
where S, and S, are constants that depend on the electronic timing accuracy and on the geometry of theacoustic path. This relatíon expresses a lower bound for the acbievable standard deviation in ultrasonicvelocity measurernent. Dividing both sides by V yields an expression for the standard deviation of therelative error
::Dé.V
So=V
+ S, (29)
This expression clearly shows that as V approaches zero, the relative error becomes arbitrarily large,given a fixed length of measuring time Practical calibration procedures, therefore, should increase themeasuring time at 10w velocities as compared with higher enes.
6 Calibration
6.1 Dry Calibration
Dry calibration (without fluid flow) involves the accurate measurement of the dimensions of the spoolpiece, which include the spool diameter D, and for each of the paths, the dimensions L and X Errors inthe dimensions directly affect the measurement accuracy The expected uncertainty of a multipath meterthat has been dry-calibrated is claimed to be 1% or better. However, there are not enough data todemonstrate this conclusively, If higher accuracy is needed andlor traceability to a national standard isrequired, a flow calibration is recommended,
In addition to the measurements of the spool-piece geometry, the time delays can be measured for aspecific set of electronics and transducers.
One method is to mount two transducers in a pressurized test cell. The separation of the transducers mustbe accurately known. The chamber is filled with a gas (usually nitrogen) for which the velocity of soundis known, In this test cell, a zero-flow condition is present. The actual transit time of the signals in thefluid can be calculated from the ratio of path length and speed of sound, Bec~use the transit times forupstrearn and downstrearn are equal (zero flow), tu and tD can be calculated. The ultrasonic system
C-31
measures times that include time delays in the electronics, transducer, cables, etc. The time delays arecalculated as the subtraction of the calculated values from the measured values. This method requiresaccurate knowledge of'the velocity of sound in the test cell. Any errors in the velocity of sound in the testcell affect the flow-meter performance, similar to errors in L and D. This causes a systematic shift of theperformance curve, since errors in the assumed velocity of sound of the gas in the test cell cause asystematic offset in the applied time delays. 111e same method can be used for testing individualtransducers and can be used in the field as a check on the initial calibration.
Another method, which does not require knowledge of the velocity of sound, can be used for determiningthe time delay in the electronic cables and transducers. The method requires a setup in which the transittimes of a pair of transducers can be measured at two known and different path lengths at zero-flowconditions. The measurement must be perforrned under the same gas conditions for both path lengths.Since the transit-tirne measurement includes the same delay time for both path lengths, a system of twoequations with two unknowns (time delay and speed of sound) can be formed and solved explicit1y.
6.1.1 Velocity Distribulion
Depending on the calculation method used, multipath ultrasonic meters may 01' may not require that anassumption be made for the velocity distribution When required, the k-factor for a particular path can becalculated, based on the Reynolds number and the assumed flow profile (01' through prior extensive flowtesting). However, errors in the k-factor are not considered in a dry calibration. In a multipath meterarrangement, the multiple paths, path positioning and the calculation technique considerably reduce themeasurement uncertainty and the effect of non-ideal velocity prefijes.
6.2 Flow Calibralion
A flow calibration can be used to reduce errors resulting from inaccuracies in path length, path angle,pipe diameter and path location. '111e mean ratio between the output signal and the flow velocity(sometimes called "meter factor") can be deterrnined by a flow calibration. The calibration should beperforrned in a way to ensure that the test rig does not influence the test results.111is incorporates asteady, fully developed velocíty flow profiJe, free from swirl and pulsation.. Generally these requirementscan be achieved by using sufficient straight lengths of pipe upstream and downstream from the metertube. If necessary, an upstream flow conditioner may be installed. As a mínimum, the manufacturer'sreference to the installation conditions must be observed.
The calibration should be perforrned as closely as possible to the Reynolds number of the actual application. During the calibration, the meter output, which may be via serial communications 01' a frequencysignal, is compared with one 01' more reference instruments. If using analog output, the resolution of theconversion to a digital signal needs to be considered.
To improve accuracy, the calíbration should be conducted according to good laboratory practice and inaccordance with methods recognized by international standards (e.g., ISO 4185, ISO 8316, ISO 9300).Any flow calibration has a degree of uncertainty, depending on the methods of calibration and thefacílity. lt is determined by the random and systematic errors in measurement of the flow velocity and bythe random and systematic errors of the laboratory
The uncertainty ofthe laboratory can be as low as 0..2% to 03%.
The calibration should be made ayer a statistically significant number of runs and ayer a range of flowvelocities. A comrnon practice is to calibrate at least 6 01' 10 velocities, logarithmically spaced over themeter range, taking the mean of at least three measurements, of 100 seconds, at each velocity .. In the
C-32
-
lower par! of the range, the number of measurements rnay be inereased lo 5 or 10, In delermining thenumber of repeal points al each flow condition, the variability of the instrumenl under test should beconsidered, so that the random errors are sufficiently averaged and the remaining difference with respectlo the calibration standard is predominantly the bias of the instrument under test
6.3 Calibration Facilities
A significanl problem is the currenl lack of facilities capable of calibrating these meters, which typicallyneed lo be calibrated al. very high flow rates and pipeline pressures, Cosl of the calibration may be asignificant portion of the cost of the meter, and the test may only cover the lower end of the metercapacity.
Facilities lo calibrate meters larger than 12" in diameter are virtually nonexislent
6.4 Transducer Replacement
Ultrasonic meters are fitted with pairs of electrical ultrasonic transducers. In the event that a transducermust be removed due 1.0 malfunction or damage, single transducers or pairs of transducers are replaced,depending on the recornmendations of the specific manufacturero The procedure consists of two majorsteps, one mechanical and one computational, The mechanical replacemenl of the transducers follows aprocedure that is specific lo the manufacturer's model and transducer type
The effect on calibration of changing.transducers in the field is still being studied.
6.401 Mechanical Procedure
Mosl ultrasonic meters use flanges lo connect the ultrasonic transducers lo tne meter body. Theconfiguration of the transducer rnight inelude either isolation ball valves or insertion mechanisms. Thepurpose of the ball valve or insertion mechanism is lo allow the transducer replacement procedure 1.0 beperformed without relieving the pressure of the meter body. In other words, the transducers can bereplaced without "blowing-down" the metering section of the pipeline. This can be a sígnificant designadvantage when working with offshore systems where space is al a premium.
Another type of transducer assembly utilizes a buffer rod as par! of the fixed-pressure boundary, whichallows the "transducer" portion outside the pressure boundary lo be removed and replaced without theuse of an isolalion valve and without an insertion mechanism Thís possibility exists because removaland replacemenl of the transducer portion do not influence or jeopardize the pressure boundary.
6.4.2 Computalional Procedure
The computational procedure required for the replacement of transducers varies with the manufactureroMethods may inelude mechanically and electrically characterízing each transducer pair, ormanufacturing all transducers idenlically so that no changes are required in the computational setup
As was discussed in Section 6..1, the electronic time delay associated wíth an individual transducer paircan be rneasured prior 1.0 installation When using this method, the value of the delay time for thereplacement transducer pair is entered into the electronics of the ultrasonic meter al. the lime oftransducer replacernent and used in the flow calculatíon,
The goal of the replacement is lo change transducers without changing the calibration of the meter Achange in calibration can occur both because the overall length of the transducer palh can change and
C-33
because the eleetrical charaeteristics of each transducer may be difieren! The effect of the eleetricaIcharaeteristics on the measurement is a change in the deIay time, and thus a change in the detection pointin the sígnal-processing algorithm.
The physicallength of the transducer pair can be measured in parts, including the transducer length, theball valve length and the meter-body cavity length. The total path length is a sum of those numbers.When transducer pairs are changed, the new lengths assoeiated with the transducers can be entered intothe electronics of the ultrasonic meter and used in the flow calculation.
6.4.3 Verification
The verification of a successfuI field replacement can be accompIished by using severaI confideneecheeks. The following general ehecks can be used.
I . Verify that the velocity of sound, as measured by all transducer pairs, agrees to within aspeeified range (typically 1%)..
2. Verify tbat the velocity of sound, as measured by all transducer pairs, is reasonable for the givengas composition.
3 Verify that the flow profile has the same shape and weighting as before the exchange.
4. If possible, achieve absolute zero flow and verify that the meter is reading an aceeptabIe zeroflow [typically less than 0.003 m/see (0.01 ftlsee)].
7 Recommendations
7.1 Industry
The Iack of ealibration facilities for these meters needs to be addressed.. While it is convenient to assumethat the meters are inherent1y accurate frorn dry-calibratíon, this has not yet been proved to be the case ..These rneters have the potential to be very high-volume meters, and small errors can quickly rnultiply.Facilities that can economieally ealibrate the meters and that are recognized as being aceurate will allowthe users of ultrasonic meter teehnology to benefit from it, instead of turning it into a potentially eostlymistake ..
7.2 Users
Users of the uItrasonic meters deseribed in this teehnical note include gas producers, transporters andbuyers. Care should be taken by these parties to ensure that the meter will meet the requirements of theapplícation. It is Iikely that a flow calibration will be a requirement in a large number of cases, until suchtime as it has been established tbat this is not required
Users aIso need to get invoIved in advocacy efforts for research and development and should bedescribing potential benefits of the teehnology to the manufacturers, so that future generations of themeters will provide máximum benefit.
C-34
..
7.3 Manufacturers
Manufacturers should continue to develop lhe technology and strive to provide increased reliability andconsistent accuracy. The data-galhering and analysis necessary to increase lhe level oí trust in lhetechnology wi11 need to come in large par! from the manufacturers,
7.4 Researchers
Industry-funded research, as we11 as research funded by individual users, needs to augrnent work done bythe manufacturers. Research on various piping configurations will increase the confidence of a11 partiesin lhe technology.
G-35
L----
ULTRASONIC METER RESEARCH L1TERATURE AND ACTIVITIES
The following is a compilation of past, present and planned research and development work associatedwith transit-tirne ultrasonic flow meters. The list includes only published research by both rnanufacturersand users from around the world.
It is evident that work related to ultrasonic flow measurement is divided into two groups: pure researchto advance theoretical concepts and methodologies, and evaluatory work - new product evaluations 01'
product performance evaluations. In most instances, because of the proprietary sensítívity of evaluatorywork, resulta are not published 01' released to the publico Therefore, detailed information regardingevaluatory work is difficult to obtain .. In comparison, theoretícal 01' nonproprietary information andresults are relatively easy to obtain and make up the majority of the test work listed herein.
Table 1, U1trasonic Meter Research Literature, is a compilation of pertinent ultrasonic measurementpublications available to the general public Those research papers that are sponsored by privately fundedresearch programs (not for general release) are not included in this listing.
Table 2, U1trasonic Meter Research Activities, is a list of research work that has been identified inEurope, the U.S.A and Canada, The research work listed is related to custody-class measurement 01' theadvancement of custody-class rneasurement,
C-36
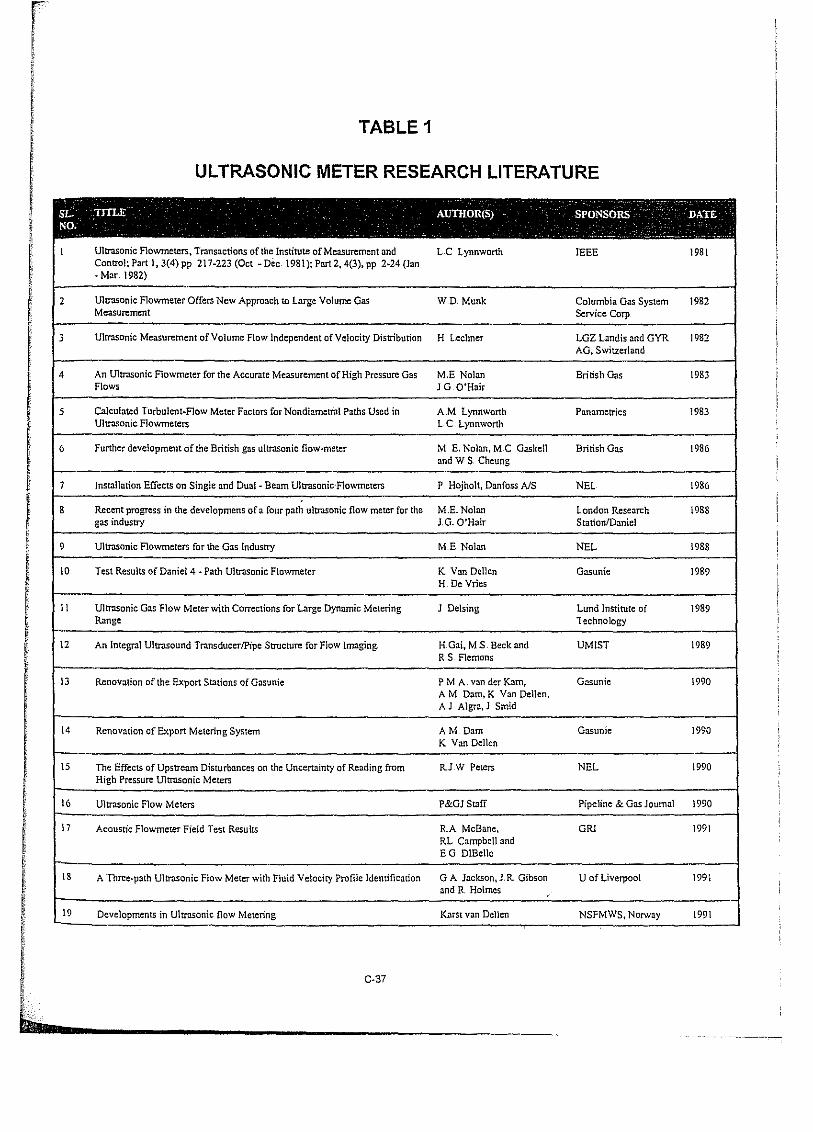
TABLE 1
ULTRA50NIC METER RE5EARCH L1TERATURE
C-37
- - - - - --- - --SL. T)TI;E AUTHOR(S) SPONSORS DATENO.
4" ••~ -,~- .~~ .. --1 Ultrasonic Flcwmeters, Transacticns of the Institute of Meesurementand Le Lynnworth IEEE 1981
Control; Par! 1, 3(4) pp 217-223 (Oct - Dec 1981); Part 2, 4(3), pp 2-24 (Jan-Mar 1982)
2 Ultrasonic Flowmeter Offers New Approach10Large Valume Gas WD. Munk Columbia Gas System 1982Measurement Service Corp
3 Ultrascnic Measurement of Vclume Flow lndependent ofVelocity Distribution H Lechner LQZ Landis and GYR 1982AG, Switaerland
4 An UltrasonicFlowmeter for the AccurateMeasurernern oC High PrcssureGas M.E Notan BritishGas 1983Flows J G. O'Hair
5 Calculated Turbulent-Flow Meter Factors for Nondiametral Paths Used in AM. Lynnworth Panametrica 1983Ultrasonic Flowrneters Le, Lynnworth
6 Further development of the British gas ultrasoníc Ilow-meter M E,Nolan,M,e GaskeJl British Gas 1986and W S, Cheung
7 lnstallation Eífects on Single und Dual - Beam Ultrasonic-Flowmeters P Hojholt, DanfossA/S NEL 1986
8 Recent progrese in the developmens oía fourpath ultrasoníc flow meter for the M,E.. Nclan London Research 1988gas Induetry Jo.,O'Hair StationlDaniel
9 UltrasonicFlowrneters for the Gas índustry M..E Nolan NEL 1988
10 Test Results of Daniel 4 ~ Path Uítrasonic Flowmeter K. Van Dellen Gasunie 1989H. De Vries--
11 UlrrasonicGas Flow Meter with Corrections for Large DynamicMeterlng J Delsing Lund lnstitute of 1989Range Technclogy
12 An Integral Ultrasound TransducerlPipe Structure for Flow lmaging H Gai, MS, Beck and UM1ST 1989R",S, Flemons
13 Renovationof the Export Stations oí Gasunie P M A. van der Karn, Gesunie 1990A M Dam, K Van Dellen,AJ· Algra, J Smld
14 Renovationof Export Meteríng Svstem AM Dam Gasunie 1990K Van Dellen
15 The Effects of Upstream Disturbances on the Uncertainty of Reading from R.1W Petera NEL 1990High PressureUltrasonic Meters
16 Ultrasonic Flow Meters P&GJ S13ff Pipeline & Gas Journal 1990
17 Acoustic Flowmeter Field Test Resulta RA McBane, GRJ 1991RL CampbeJJ andE,G DlBelJo
18 A Three-parh Ultrascnic Flow Meter with Fluid velociry Profile Identification G A Jeckson, J.R, Gibson U of Liverpocl 1991and R Hclmes
19 Developments in Ultrasonic ñow Meterlng Karst van DeBen NSFMWS, Norway 1991
!,!III!IIí;g
!
IL.... _
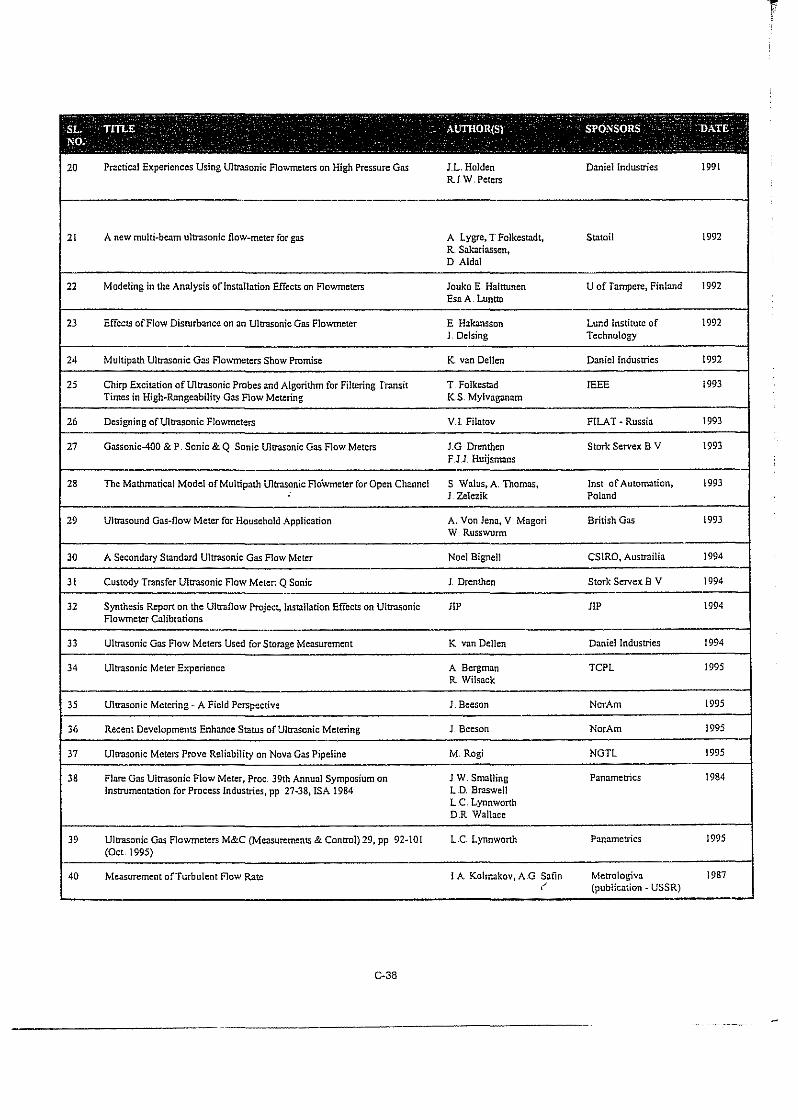
-- ___ ~o _ ••• - --, - - .. ,- - - -. _. -r,o- - ,- - -" ,
SL. TITLE - - AUTHOR(S) SPONSORS DATE - ,NO. - -
- .. - . , .'. - - . . . ~ ~ - , - - - ~-- _._--~ ..
20 Practica! ExperiencesUsing UltrasonicFlowmeters on High PressureGas JL,Holden Daniel Industries 1991RJW. Petera
.,
21 A new multi-beam ultrasonic Ilcw-meter for gas A. Lygre, 'I'Folkestadt, Statoil 1992R. Sakariassen,D Aldal
-22 Modeling in the Analysis of Installation Effects on Flowmeters Jouka E.. Halttunen U of Tampere, Finland 1992
Esa A" Luntta
23 EffectsofFlow Disturbance on no UltrasonicGas Flowmeter E Hakansson Lund Institute of 1992J.Delsing Technology
24 Multipath. Ultrasonic Gas FlowmetersShow Promise K van Dellen Daniel Industries 1992
25 Chirp ExcitationofUltrasonic Probes and AIgorithm for Filtering Iransit T" Folkestad IEEE 1993Timesin Hígh-Rangeabüity Gas FlowMeteriag K S"Mylvaganam
26 Designingof'Ultrasonic Flowmeters VJ Filatov FILAT ~ Russia 1993
27 Gassonic400 & P. Sonie & Q Sonie Ultrasonie Gas F10w Meters lG Drenthen Stork Servex B,V 1993FJJ Huijsmans
-28 The MathmaticalModel ofMultipath UltrasonicFlowmeter for Open Channel S Walus,A Thcmas, Inst. of Automation, 1993
J,Zelezik Poland
29 Ulnascund Gas-ñow Meter for Hcusehcld Application A. Van Jena, V Magori Brítish Gas 1993W. Russwurm
30 A SeeondaryStandard UltrasonicGas Flow Meter Noel Bignell CStRO, Austrailia 1994
31 Custody Transfer U1trasonic Flow Meter: Q Sanie J. Drenthen Stork Servex BV 1994
32 Synthesis Repon on the UltraflowProjeet, InstallationEffectson Ultrascnic llP llP 1994Flcwmeter Calibrations
--33 Ultrasonic Gas Flow Meters Used for StorageMeasurement K van Dellen Daniel Industries 1994
34 Ultrasoníc Meter Experience A Bergman Ten 1995R Wilsaek
35 Ulrrasonic Metering ~ A Field Perspective J Beeson NorAm 1995
36 Recent DevelopmentsEnhance Status of'UltrasontcMetering J Beeson NorAm 1995
37 Ultrasonie Meters Preve Reliability on NovaGas Pipeline M, Rogi NGTl 1995
38 Flare Gas Ultrasonie Flow Meter, Proc. 39th Annual Symposiumon JW, Smalling Panamerrics 1984Instrumentaticn for Procesa Industries, pp 27·38. ISA 1984 L.D. Braswell
Le, LynnworthD,R Wallace
39 UlrrasonícGas Flowmeters M&C (Measurernents & Control)29, pp 92-101 Le Lynnworth Panametrics 1995(OCl 1995)
40 Measurement ofTurbulent Flow Rate J A Kolmakov,AG Safin Metrolcgiva 1987
" (publication • USSR)
C-38
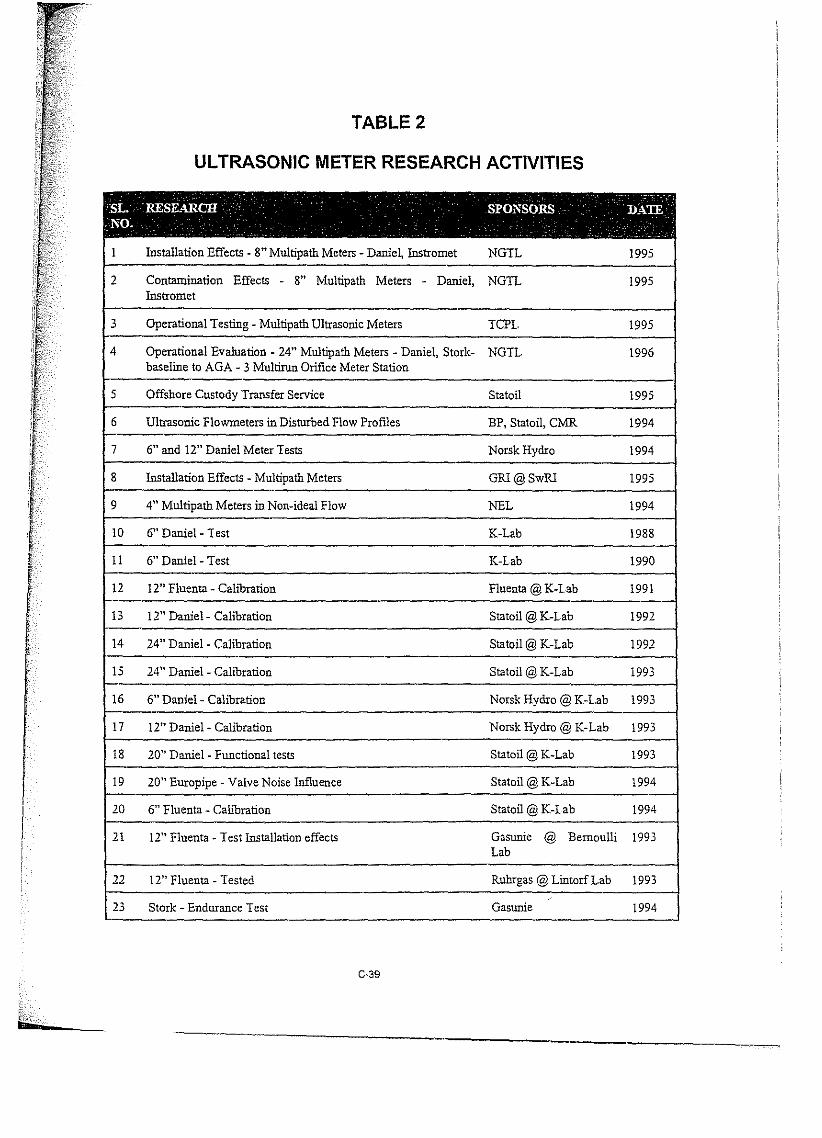
TABLE 2
ULTRA50NIC METER RE5EARCH ACTIVITIE5
- -SL. RESEARCH SPONSORS DATENO.
- - - " ~
1 Installation Effects - 8" Multipath Meters - Daniel, Instromet NGTL 1995
2 Contamination Effects - 8" Multipath Meters - Daniel) NGTL 1995Instromet
3 Operational Testing - Multipath Ultrasonic Meters TCPL. 1995
4 Operational Evaluation - 24" Multipath Meters - Daniel, Stork- NGTL 1996baseline to AGA - 3 Multirun Orifice Meter Station
5 Offsbore Custody Transfer Service Statoil 1995
6 Ultrasonic Flowmeters in Disturbed Flow Profiles BP, Statoíl, CMR 1994
7 6" and 12" Daniel Meter Tests NorskHydro 1994
8 Installation Effects - Multipath Meters GRI@SwRI 1995
9 4" Multipath Meters in Non-ideal Flow NEL 1994
10 6" Daniel - Test K-Lab 1988
11 6" Daniel- Test K-Lab 1990
12 12" Fluenta - Calibration Fluenta @ K-Lab 1991
13 12" Daniel- Calibration Statoil @ K-Lab 1992
14 24" Daniel- Calibration Statoil@ K-Lab 1992
15 24" Daniel- Calibration Statoil@ K-Lab 1993
16 6" Daniel- Calíbratíon Norsk Hydro @K-L.ab 1993
17 12" Daniel- Calibration Norsk Hydro @ K-Lab 1993
18 20" Daniel - Functional tests Statoil @ K-Lab 1993
19 20" Europipe - Valve Noise Influence Statoil @ K-Lab 1994
20 6" Fluenta - Calíbration Statoil @ K-Lab 1994
21 12" Fluenta - Test Installation effects Gasunie @ Bernoulli 1993Lab
22 12" Fluenta - Tested Ruhrgas @ Lintorf Lab 1993
23 Stork - Endurance Test Gasunie .... 1994
C-39
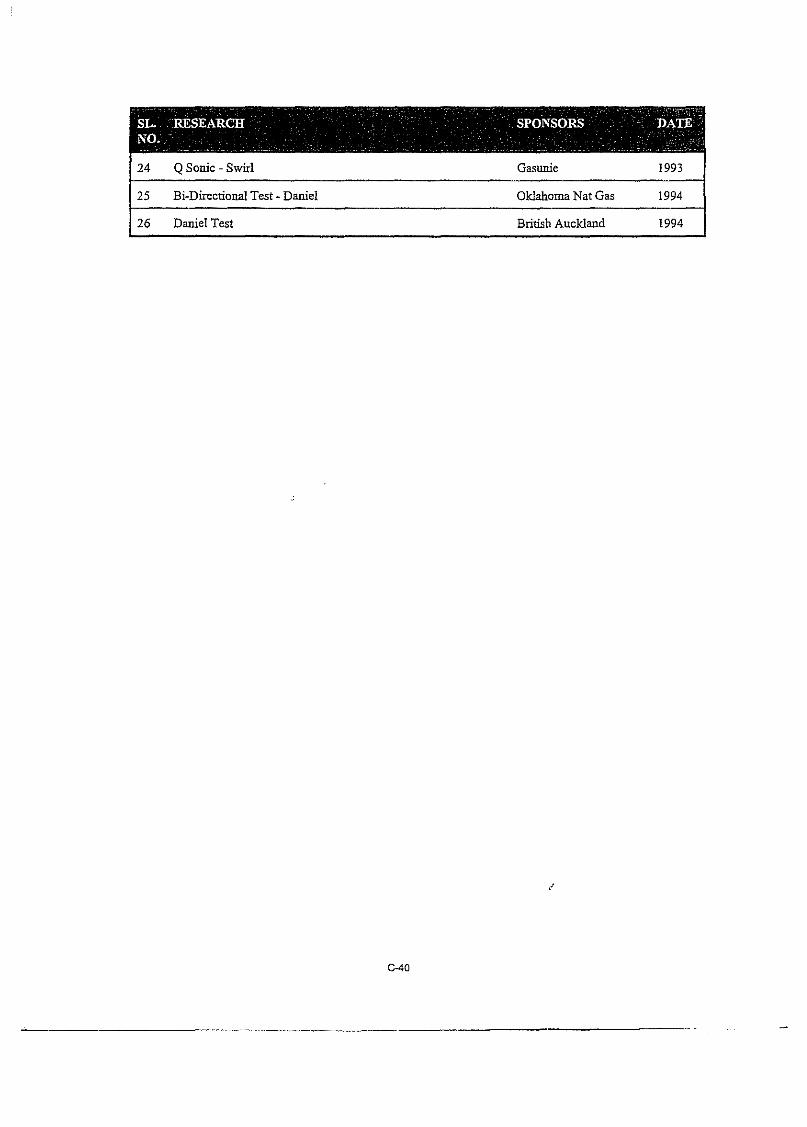
~ - . " - - '- -,--SL. RESEARCH SPONSORS DATENO. _ '1
~_w· _~ _" _ __ _ _ ___' __
24 QSonic - Swírl
25 Bi-Direetional Test - Daniel
26 Daniel Test
C-40
Gasunie
Oklahoma Nat Gas
British Auekland
1993
1994
1994
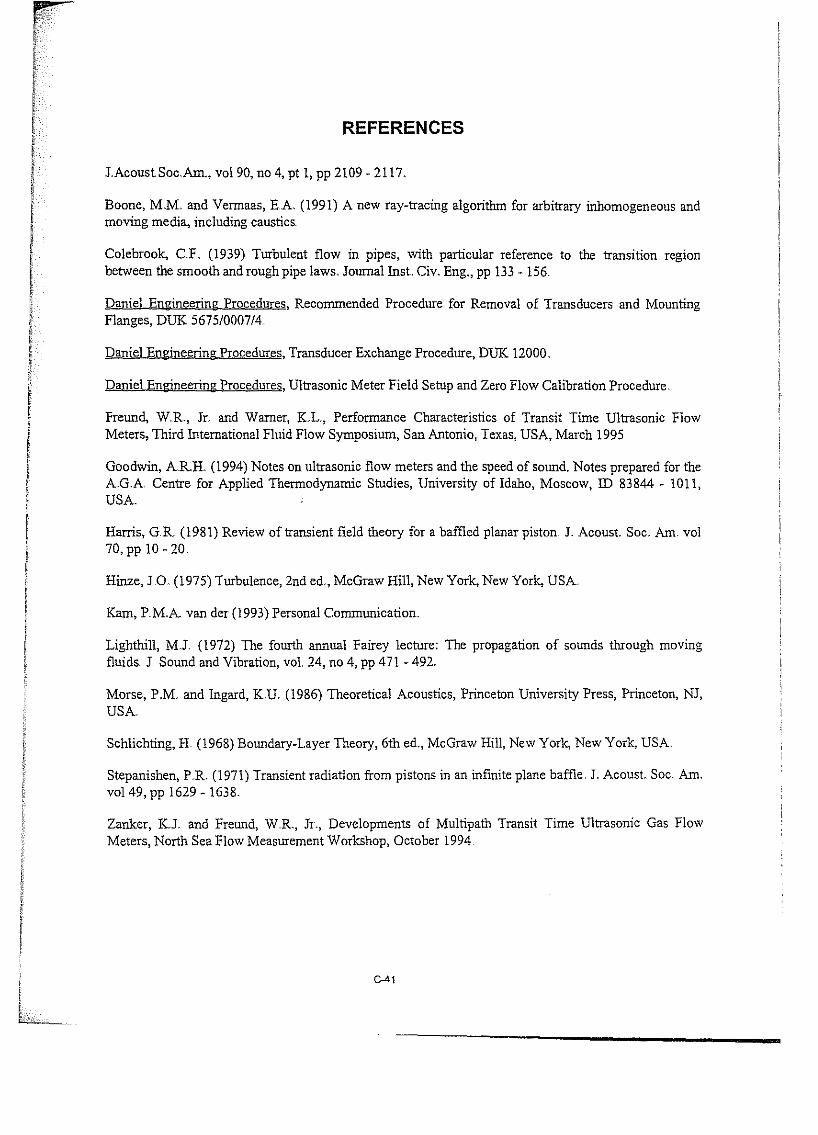
REFERENCES
IAcoust Soc.Am, vol 90, no 4, pt 1, pp 2109 - 2117,
Boone, M,M, and Vermaas, E.A (1991) A new ray-tracing algorithm for arbitrary inhomogeneous andmoving media, including caustics.
Colebrook, C,F, (1939) Turbulent flow in pipes, wíth particular reference to the transition regionbetween the smooth and rough pipe laws. Jouma1 Inst. Civ, Eng., pp 133 .. 156
Daniel Engineering Procedures, Recommended Procedure for Rernoval of Transducers and MountingFlanges, DUK 5675/0007/4
Daniel Engineering Procedures, Transducer Exchange Procedure, DUK 12000,
Daniel Engineering Procedures, Ultrasonic Meter Fie1d Setup and Zero Flow Calibration Procedure,
Freund, W,K, JI, and Wamer, KL., Performance Characteristics of Transit Time Ultrasonic FlowMeters, Third Intemational Fluid Flow Symposium, San Antonio, Texas, USA, March 1995.
Goodwin, AR.H. (1994) Notes on ultrasonic flow meters and the speed of sound, Notes prepared for theAG.A Centre for Applied Thermodynamic Studies, University of Idaho, Moscow, ID 83844 - 1011,USA.
Harris, GR. (1981) Review oftransient field theory for a baffled planar piston J. Acoust. Soco Am vol70, pp 10 - 20.
Hinze, 10 (1975) Turbulence, 2nd ed. McGraw Hill, NewYork, New York, USA
Kam, P,M.A. Van del' (1993) Personal Comrnunication.
Lighthill, MJ (1972) The fourth annual Fairey lecture: The propagation of sounds through movingfluids. 1 Sound and Vibration, vol 24, no 4, pp 471 - 492
Morse, P.M, and Ingard, KU, (1986) Theoretical Acoustics, Princeton University Press, Princeton, NI,USA.
Schlichting, H (1968) Boundary-Layer Theory, 6th ed. McGraw Hill, New York, New York, USA
Stepanishen, P.R, (1971) Transient radiation from pistons in an infinite plane baffle. J. Acoust. Soc Am,vol 49, pp 1629 - 1638,
Zanker, KJ, and Freund, W.K, Jr., Developments of Multipath Transit Time Ultrasonic Gas FlowMeters, North Sea F10wMeasurement Workshop, October 1994
C-41
Compnny _
Name _
Address _
Fax No.
Operating SectionAmerican Gas Association400 North Capitol Street, NW, 4" FloorWashington, DC 20001U.S.A.Fax: (202) 824·7082
FORM FOR PROPOSALS ON AGA REPORT NO. 9
Seod to:
Tel. No. _
2. Proposal Reeommends: (check one) O new textO revised textO deleted text
Please Indicare Organízation Representad (if any) _
1. Secticn/Paragraph _
3. Propasa) (inelude proposed new or revlsed wcrdlng, 0[' identificatioo of wordíng to be deleted, use sepárate sheet ünceded): (Proposed text should be in legislative formar: i .e., use underscoreto denote wording to be insertedOnserted wording) andstrike-through to denote wording to be deleted (aeleted wsrdiag),
4. Statement of Problem and Suhstantiation for Proposal (use separate sheet if needed): (State theproblem that wlll beresolved by ycur recornmendatton; give the specificreusen for your proposal including copiesof tests, researchpapers,etc.)
5. O This proposal is original material. (Note: Original material is considered to be the submitter's own idea based on or as aresult of hisfherown experíence, thoughtcr research and, to the best of hisfherkncwledge, is not copied fromanothersource.)O This proposal is not original material; its source (íf known) is as follows: _
Type or prlnt leglbly.H supplementary material (photographs, dlagrams, reports, etc) is lncluded, you may be requlred to submitsufficlent copies for all members of reviewing comrnittees or task forces.
1herebygratu theAmerican GasAssocíatíon the non-exclusive, royalty-free rígíns, including non-exclusive, royalty-free ríghtsin copyright, in this proposoland 1understand that 1acquíreno ríghts in anypublícation oj the AmericanGasAssociation in which thisproposal in this 01' anothersimilaror analogous fonn is used:
FOR OFFICE USE ONLY
Signature (Required) .-===-0;;:;::-;='---,Date: ----, _
Log# _
Date Rec'd _
P-l
m
Related Documents