2160 Bulletin of the Seismological Society of America, Vol. 93, No. 5, pp. 2160–2186, October 2003 Aftershocks and Triggered Events of the Great 1906 California Earthquake by Aron J. Meltzner and David J. Wald* Abstract The San Andreas fault is the longest fault in California and one of the longest strike-slip faults in the world, yet little is known about the aftershocks fol- lowing the most recent great event on the San Andreas, the M W 7.8 San Francisco earthquake on 18 April 1906. We conducted a study to locate and to estimate mag- nitudes for the largest aftershocks and triggered events of this earthquake. We ex- amined existing catalogs and historical documents for the period April 1906 to De- cember 1907, compiling data on the first 20 months of the aftershock sequence. We grouped felt reports temporally and assigned modified Mercalli intensities for the larger events based on the descriptions judged to be the most reliable. For onshore and near-shore events, a grid-search algorithm (derived from empirical analysis of modern earthquakes) was used to find the epicentral location and magnitude most consistent with the assigned intensities. For one event identified as far offshore, the event’s intensity distribution was compared with those of modern events, in order to constrain the event’s location and magnitude. The largest aftershock within the study period, an M 6.7 event, occurred 100 km west of Eureka on 23 April 1906. Although not within our study period, another M 6.7 aftershock occurred near Cape Mendocino on 28 October 1909. Other sig- nificant aftershocks included an M 5.6 event near San Juan Bautista on 17 May 1906 and an M 6.3 event near Shelter Cove on 11 August 1907. An M 4.9 aftershock occurred on the creeping segment of the San Andreas fault (southeast of the mainshock rupture) on 6 July 1906. The 1906 San Francisco earthquake also triggered events in southern California (including separate events in or near the Im- perial Valley, the Pomona Valley, and Santa Monica Bay), in western Nevada, in southern central Oregon, and in western Arizona, all within 2 days of the mainshock. Of these triggered events, the largest were an M 6.1 earthquake near Brawley and an M 5.0 event under or near Santa Monica Bay, 11.3 and 31.3 hr after the San Francisco mainshock, respectively. The western Arizona event is inferred to have been triggered dynamically. In general, the largest aftershocks occurred at the ends of the 1906 rupture or away from the rupture entirely; very few significant aftershocks occurred along the mainshock rupture itself. The total number of large aftershocks was less than predicted by a generic model based on typical California mainshock– aftershock statistics, and the 1906 sequence appears to have decayed more slowly than average California sequences. Similarities can be drawn between the 1906 after- shock sequence and that of the 1857 (M W 7.9) San Andreas fault earthquake. Introduction The 18 April 1906, 5:12 a.m. (unless noted otherwise, all times are given in Pacific Standard Time [PST]) M W 7.8 San Francisco earthquake, which broke the northern San An- dreas fault (SAF) from San Juan Bautista to near Shelter Cove (Fig. 1a), has been a centerpiece of seismological in- vestigation in California, yet little attention has been paid to its aftershocks and triggered events. Questions as to the size, *Present address: U.S. Geological Survey, Golden, Colorado. location, and timing of the largest aftershocks have not here- tofore been addressed, even though an earthquake as large as the 1906 mainshock might be expected to have potentially damaging aftershocks. At least one sizable triggered event occurred in the Imperial Valley in southern California (11.3 hr after the mainshock), but the possibility of additional trig- gered events in other locations has not been explored. This study is an attempt to shed light on some of these unresolved issues and to improve our understanding of the behavior of

Welcome message from author
This document is posted to help you gain knowledge. Please leave a comment to let me know what you think about it! Share it to your friends and learn new things together.
Transcript
2160
Bulletin of the Seismological Society of America, Vol. 93, No. 5, pp. 2160–2186, October 2003
Aftershocks and Triggered Events of the Great 1906 California Earthquake
by Aron J. Meltzner and David J. Wald*
Abstract The San Andreas fault is the longest fault in California and one of thelongest strike-slip faults in the world, yet little is known about the aftershocks fol-lowing the most recent great event on the San Andreas, the MW 7.8 San Franciscoearthquake on 18 April 1906. We conducted a study to locate and to estimate mag-nitudes for the largest aftershocks and triggered events of this earthquake. We ex-amined existing catalogs and historical documents for the period April 1906 to De-cember 1907, compiling data on the first 20 months of the aftershock sequence. Wegrouped felt reports temporally and assigned modified Mercalli intensities for thelarger events based on the descriptions judged to be the most reliable. For onshoreand near-shore events, a grid-search algorithm (derived from empirical analysis ofmodern earthquakes) was used to find the epicentral location and magnitude mostconsistent with the assigned intensities. For one event identified as far offshore, theevent’s intensity distribution was compared with those of modern events, in order toconstrain the event’s location and magnitude.
The largest aftershock within the study period, an M �6.7 event, occurred �100km west of Eureka on 23 April 1906. Although not within our study period, anotherM �6.7 aftershock occurred near Cape Mendocino on 28 October 1909. Other sig-nificant aftershocks included an M �5.6 event near San Juan Bautista on 17 May1906 and an M �6.3 event near Shelter Cove on 11 August 1907. An M �4.9aftershock occurred on the creeping segment of the San Andreas fault (southeast ofthe mainshock rupture) on 6 July 1906. The 1906 San Francisco earthquake alsotriggered events in southern California (including separate events in or near the Im-perial Valley, the Pomona Valley, and Santa Monica Bay), in western Nevada, insouthern central Oregon, and in western Arizona, all within 2 days of the mainshock.Of these triggered events, the largest were an M �6.1 earthquake near Brawley andan M �5.0 event under or near Santa Monica Bay, 11.3 and 31.3 hr after the SanFrancisco mainshock, respectively. The western Arizona event is inferred to havebeen triggered dynamically. In general, the largest aftershocks occurred at the endsof the 1906 rupture or away from the rupture entirely; very few significant aftershocksoccurred along the mainshock rupture itself. The total number of large aftershockswas less than predicted by a generic model based on typical California mainshock–aftershock statistics, and the 1906 sequence appears to have decayed more slowlythan average California sequences. Similarities can be drawn between the 1906 after-shock sequence and that of the 1857 (MW 7.9) San Andreas fault earthquake.
Introduction
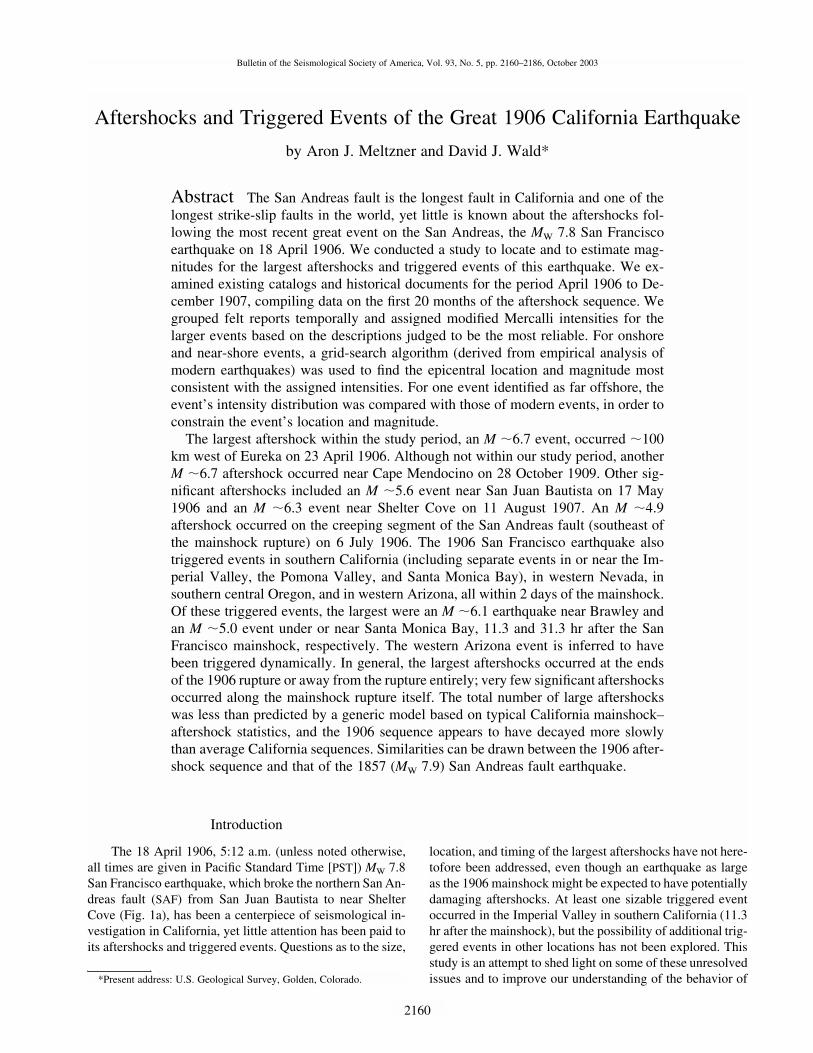
The 18 April 1906, 5:12 a.m. (unless noted otherwise,all times are given in Pacific Standard Time [PST]) MW 7.8San Francisco earthquake, which broke the northern San An-dreas fault (SAF) from San Juan Bautista to near ShelterCove (Fig. 1a), has been a centerpiece of seismological in-vestigation in California, yet little attention has been paid toits aftershocks and triggered events. Questions as to the size,
*Present address: U.S. Geological Survey, Golden, Colorado.
location, and timing of the largest aftershocks have not here-tofore been addressed, even though an earthquake as largeas the 1906 mainshock might be expected to have potentiallydamaging aftershocks. At least one sizable triggered eventoccurred in the Imperial Valley in southern California (11.3hr after the mainshock), but the possibility of additional trig-gered events in other locations has not been explored. Thisstudy is an attempt to shed light on some of these unresolvedissues and to improve our understanding of the behavior of
Aftershocks and Triggered Events of the Great 1906 California Earthquake 2161
126˚W 124˚W 122˚W 120˚W 118˚W 116˚W 114˚W 112˚W31˚N
32˚N
33˚N
34˚N
35˚N
36˚N
37˚N
38˚N
39˚N
40˚N
41˚N
42˚N
43˚N
44˚N
420
420
470
470
HF
126˚W 124˚W 122˚W 120˚W 118˚W 116˚W 114˚W 112˚W31˚N
32˚N
33˚N
34˚N
35˚N
36˚N
37˚N
38˚N
39˚N
40˚N
41˚N
42˚N
43˚N
44˚N
0 200 400
km
A
B
C
D
Arcata
Avalon (SCI)
Berkeley
Cape Mendocino
Coalinga
Crescent City
Eureka
Fernley
Fremont
Fresno Hanford
Hazen
King City Las Vegas
Livermore
LA
Los Banos Los Gatos
Mendocino
Napa
Needles
Oakdale
Olinghouse
Paisley
Phoenix
Point Arena
PV
Priest Valley
Punta Gorda
Reno
Salinas
Salome
San Bernardino
San Francisco
San Jacinto
San Jose
San Juan Bautista
San Luis Obispo
Santa Cruz
Shelter Cove
Sonoma
Ukiah
Upper Mattole
Venice Ventura
Visalia
Woodland
DN SISK
HUMB TRIN
MEND
TUOL
ImperialValley
(see Fig. 1b)
SMB
PLF
PVF
MFZ
1857 Minimum Felt Limit
1906 Approximate
FeltL
imit
1
2
(a)
Figure 1. Caption on next page.
aftershocks following large earthquakes on the SAF. It is alsoan attempt to expand our knowledge of historical earthquaketriggering. Until recently, the seismological community didnot generally appreciate the fact that large earthquakes arecapable of triggering events at distances far greater thanthose associated with classic aftershocks; since the 1992Landers, California, earthquake, however, numerous studieshave documented the reality of triggered earthquakes (e.g.,Hill et al., 1993; Anderson et al., 1994; Bodin and Gomberg,1994; Gomberg and Davis, 1996; Brodsky et al., 2000; Mo-hamad et al., 2000; Gomberg et al., 2001; Hough, 2001;Hough et al., 2001; Hough and Kanamori, 2002; Papado-poulos, 2002; Vilanova et al., 2003). Most recently, the No-vember 2002 MW 7.9 Denali fault, Alaska, earthquake trig-gered seismicity up to an epicentral distance of 3660 km(Hill et al., 2002; Husen et al., 2002; Johnston et al., 2002;Moran et al., 2002; Pankow et al., 2002). This report pro-vides additional data for triggering studies.
Although several efforts have been made to catalog theaftershocks and triggered events of the 1906 earthquake
(e.g., Lawson, 1908; Townley and Allen, 1939), those ef-forts were spotty in their completeness and often lacking inenough detail to permit reliable assessments or estimates ofmagnitude and location. Steeples and Steeples (1996) lookedat triggered events that occurred within 24 hr of the 1906San Francisco mainshock, but their data appear to be flawedby at least one substantial error. (Their erroneous datum—areport taken from Lawson [1908] of an event supposed tohave taken place at 12:31 p.m. on 18 April 1906 in LosAngeles—was not substantiated by a single newspaper ordiary in southern California; rather, it appears to be a mis-dated report of the earthquake that was widely documentedto have hit Los Angeles at 12:31 p.m. on 19 April 1906.)
In spite of this, the historical record is full of useful andvaluable information that can enhance the existing catalogs.For the present study, we have searched newspapers, diaries,and other historical documents for felt reports of potentialaftershocks and triggered events of the 1906 earthquake. (A“felt report” is any written statement in which the authordescribes shaking and/or effects caused by an earthquake or
2162 A. J. Meltzner and D. J. Wald
116°00' W 115°30' W 115°00' W32°30' N
33°00' N
33°30' N
0 50
km
Mexico
Imperial
Fault
SanAndreas
Fault
SHF
Elsinore Fault
ERF
Salton Sea
U.S.A.
Coyote Creek Fault
Superstition Mtn Fault
BS
Z
San Jacinto Fault Zone
BF
Coyote Cr Flt
Bombay Beach
Brawley
Calexico
Coachella
El Centro
Niland
Westmorland
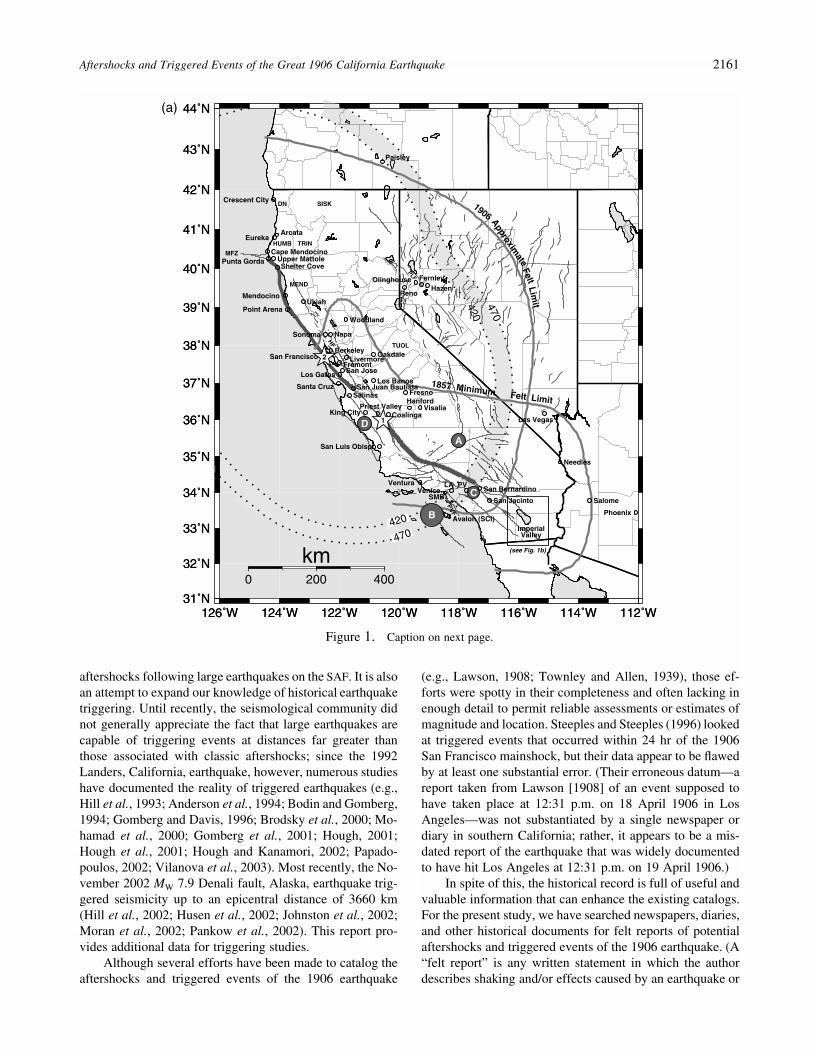
(b)Figure 1. (a) Comparison of the surface ruptures (thicklines adjacent to stars) of the 18 April 1906 (MW 7.8) and9 January 1857 (MW 7.9) earthquakes on the San Andreasfault. The map shows the 1906 epicenter (star 2) of Bolt(1968) and the 1857 epicenter (star 1) suggested by Sieh(1978b), as well as the approximate felt limit of the 1906earthquake (from Lawson, 1908) and the minimum felt limitof the 1857 earthquake (from Sieh, 1978a). Other faultswithin California and Nevada are shown as thin lines. Dis-tance contours of 420 and 470 km (the equivalent of onerupture length, given its uncertainties) from the 1906 main-shock rupture are shown as dotted lines. Also shown are thepreferred locations of the largest aftershocks (annotated cir-cles) of the 1857 earthquake: A, 9 January 1857, M �6.25;B, 16 January 1857, M �6.7; C, 16 December 1858, M �6;and D, 16 April 1860, M �6.3. The magnitudes and loca-tions for A, B, and D are from Meltzner and Wald (1999);C is from Ellsworth (1990). The reader should be remindedthat there are considerable uncertainties in magnitude andlocation for all four events. Superimposed on this map arelocations discussed in the text. LA, Los Angeles; PV, Po-mona Valley; SCI, Santa Catalina (Catalina) Island; SMB,Santa Monica Bay; HF, Hayward fault; MFZ, Mendocinofracture zone (Mendocino fault); PLF, Pyramid Lake fault;PVF, Palos Verdes fault. Counties: DN, Del Norte; HUMB,Humboldt; MEND, Mendocino; SISK, Siskiyou; TRIN,Trinity; TUOL, Tuolumne. The location of panel (b) is alsoshown. (b) Index map of the Imperial Valley vicinity showinglocations and faults discussed in the text. BF, Brawley fault;BSZ, Brawley Seismic Zone; ERF, Elmore Ranch fault;SHF, Superstition Hills fault. See panel (a) for general lo-cation.
in which the author simply notes that an earthquake wasfelt.) A catalog of these felt reports is published separatelyas a U.S. Geological Survey open-file report (Meltzner andWald, 2002). Altogether, this catalog represents the mostcomprehensive compilation to date of earthquake data fromthe historical record during the period immediately follow-ing the 1906 San Francisco earthquake.
In general, the distinction between an aftershock and atriggered event is based on the distance of said event fromits mainshock. An aftershock is generally defined as anyearthquake that occurs within one fault rupture length of itsmainshock (in this case, within 420–470 km of the main-shock rupture [Sieh, 1978a]) and during the span of timethat the seismicity rate in that region remains above its pre-mainshock background level (e.g., Hough and Jones, 1997).It is not clear that this general definition is applicable giventhe extraordinary length of the 1906 rupture. Likewise, nodefinition of a triggered event is universally accepted, but inthis report, the term “triggered event” will apply to anyearthquake that occurred more than 470 km from the main-shock rupture and days to weeks after the mainshock. It willalso apply to a number of earthquakes that occurred in ornear the periphery of the aftershock zone in Oregon andNevada—since these events occurred in the Basin and Rangeprovince, a tectonic region distinct from most of California,it was felt that they should not be classified as aftershocks—and also to several events that occurred in the periphery ofthe aftershock zone in southern California.
Hough and Jones (1997) suggested that the distinctionbetween aftershocks and triggered events may reflect impre-cise taxonomy rather than a clear distinction based on physi-cal processes. Indeed, Bak et al. (2002) argued that earth-quakes in California (and presumably elsewhere) behave ina hierarchical fashion in time, space, and magnitude, andthey proposed a unified scaling law for the waiting timesbetween earthquakes, whereby time, space, and magnitudeare not independent. If real, their results imply that there isno fundamental difference between aftershocks and trig-gered events. Nevertheless, the distinction is adopted in thisarticle as a means to emphasize the surprising number ofsignificant “far-field aftershocks” that occurred in the hoursand days following the San Francisco mainshock. It shouldbe emphasized that no particular mechanism of earthquaketriggering is being evaluated in this article; rather, we aremerely suggesting that these far-field aftershocks (which arenot aftershocks by conventional definitions) are triggered by(that is, they are related to) the mainshock.
This report includes only those triggered events that oc-curred within the first week of the mainshock and only thoseaftershocks that occurred within a 20-month period follow-ing the 1906 mainshock, that is, between April 1906 andDecember 1907. The cutoff of 1 week for triggered eventsseems logical, as there was a marked clustering of earth-quakes in the western U.S. during the first 48 hr followingthe mainshock, and this regional spurt of activity apparentlydied off rather soon thereafter. The cutoff of December 1907
Aftershocks and Triggered Events of the Great 1906 California Earthquake 2163
for aftershocks is arbitrary, however; analysis of earthquakesin existing catalogs (e.g., Townley and Allen, 1939) makesit clear that the aftershock sequence continued long after theyear 1907. Ellsworth et al. (1981) used the record of after-shocks felt at Berkeley to suggest that the aftershock se-quence lasted until about 1915. Nevertheless, an investiga-tion limited to the first 20 months has already been aformidable undertaking, and expanding the duration of thestudy period is left as a possible avenue for further research.
It may also be productive to compare the aftershocksequence of an earlier event on the SAF, the January 1857MW 7.9 Fort Tejon earthquake on the Carrizo and Mojavesegments of the fault, with that of the 1906 earthquake. Pre-vious work (Meltzner and Wald, 1999) has shown that theaftershock rate for the 1857 event was below average, butwithin one standard deviation of the number of aftershocksexpected based on statistics of modern southern Californiamainshock–aftershock sequences. The largest aftershocks ofthe 1857 earthquake included two significant events duringthe first 8 days of the sequence, with magnitudes M �6.25and �6.7, near the southern half of the rupture. Later after-shocks included an M �6 event near San Bernardino in De-cember 1858 and an M �6.3 event near the Parkfield seg-ment in April 1860. All of the largest 1857 aftershocksappear to have occurred off the SAF (Fig. 1a), although thereis considerable uncertainty in the aftershock locations as aresult of the ambiguous nature of some of those earlier data.
Methodology
Bakun and Wentworth (1997, 1999) developed amethod for the analysis of modified Mercalli intensity (MMI)values that results in an intensity magnitude MI calibrated toequal moment magnitude MW (Hanks and Kanamori, 1979).This method is an objective approach for analyzing intensitydata, even for earthquakes for which only a small numberof MMI values are known, and it provides objective uncer-tainties, empirically tied to confidence levels, for MW andfor source location. The method of analysis we employ inthis article is adapted from that of Bakun and Wentworth(1997, 1999). The modifications we made to their methodare discussed in the appendix of Meltzner and Wald (1999):specifically, for cases in which there are 30 or fewer intensitydata points, Bakun and Wentworth’s (1997) distance weight-ing function increases the error in their results, and conse-quently, we do not employ said function in this article. Themethod can be summarized in the following three steps:
1. Calculate the best magnitude, MI, at each point of a gridof trial source locations in the felt region. Here, MI is themean of Mi, and
M � [(MMI � C ) � 3.29i i i
� (0.0206 * D )]/1.68, (1)i
where MMIi is the MMI value at site i, Di is the distance
(km) from a trial source location to site i, and Ci is Bakunand Wentworth’s (1997) empirical MMI correction forsite i. Site corrections are not used in this study, so, ef-fectively, Ci � 0 for all i. Also compute the total rootmean square (rms) error between observed and predictedintensities, rms[MI], for the magnitude, MI, at the trialsource location. Here,
rms[M ] � [rms(M � M ) � rms (M � M )], (2)I I i 0 I i
where rms0(MI � Mi) is the minimum rms over the gridof trial source locations.
2. The rms[MI] contours bound the epicentral region. Thelevel of confidence can be assigned to each contour basedon the number of MMI observations. Values for therms[MI] contours corresponding to the 95%, 80%, and50% levels of confidence, for various quantities of MMIobservations, are taken (or interpolated) from Meltznerand Wald (1999). The trial source location for whichrms[MI] is minimum is the point source of seismic energythat best satisfies the available intensity data (Bakun,2000). This location, called the “intensity center,” cor-responds more to the moment centroid than to the epi-center (Bakun, 1999a). The contours of rms[MI] appro-priate for the 95%, 80%, and 50% levels of confidenceappear as solid gray lines in Figures 2–6 and 8–13, andthe intensity center appears as a white star. Generally, the“best” or “preferred” source location is assigned basedupon both the lowest rms [MI] contours and tectonic con-siderations; that is, we look for tectonically feasible lo-cations (i.e., faults large enough to support a given earth-quake magnitude) in light of the rms contours. Ourpreferred source location is indicated by either a shadedstar or a shaded box in the aforementioned figures. Likethe intensity center, the preferred location should corre-spond more to the moment centroid than to the epicenter.
3. The magnitude associated with a particular trial sourcelocation can be read from the magnitude contours for thegrid, which appear as dotted black lines in Figures 2–6and 8–13. MI at a tectonically feasible source locationwithin an appropriate confidence-level contour is the bestestimate of MW for that source location. The statisticaluncertainty in MW appropriate for the number of MMIobservations and the desired level of confidence are takenfrom Bakun and Wentworth (1999) and are listed in Ta-ble 1.
This method works in many cases, although there aresome considerable caveats. While the method is useful formost onshore and near-coast offshore events, Bakun (2000)established that the confidence contours for location gener-ally fail to usefully constrain the source regions for earth-quakes located more than a few tens of kilometers offshore.Bakun substantiated this problem while analyzing earth-quakes off California’s north coast, and it seems logical thatthis problem would exist any time an epicenter is far offshore
2164 A. J. Meltzner and D. J. Wald
125˚W 124˚W 123˚W 122˚W 121˚W 120˚W 119˚W35˚N
36˚N
37˚N
38˚N
39˚N
5
5.25.4
5.4
5.6
5.6
5.8
5.8
6
6
6
6.2
6.2
6.2
6.4
6.4
6.4
6.6
6.6
6.6
6.6
6.8
6.8
6.8
6.8
7
7
7
7
7.2
7.2
7.2
7.2
7.2
7.4
7.4
7.4
7.6
7.6
7.8
50%
50%
80%
95%
125˚W 124˚W 123˚W 122˚W 121˚W 120˚W 119˚W35˚N
36˚N
37˚N
38˚N
39˚N
0 50 100
km
III
IV
IV
IV
V
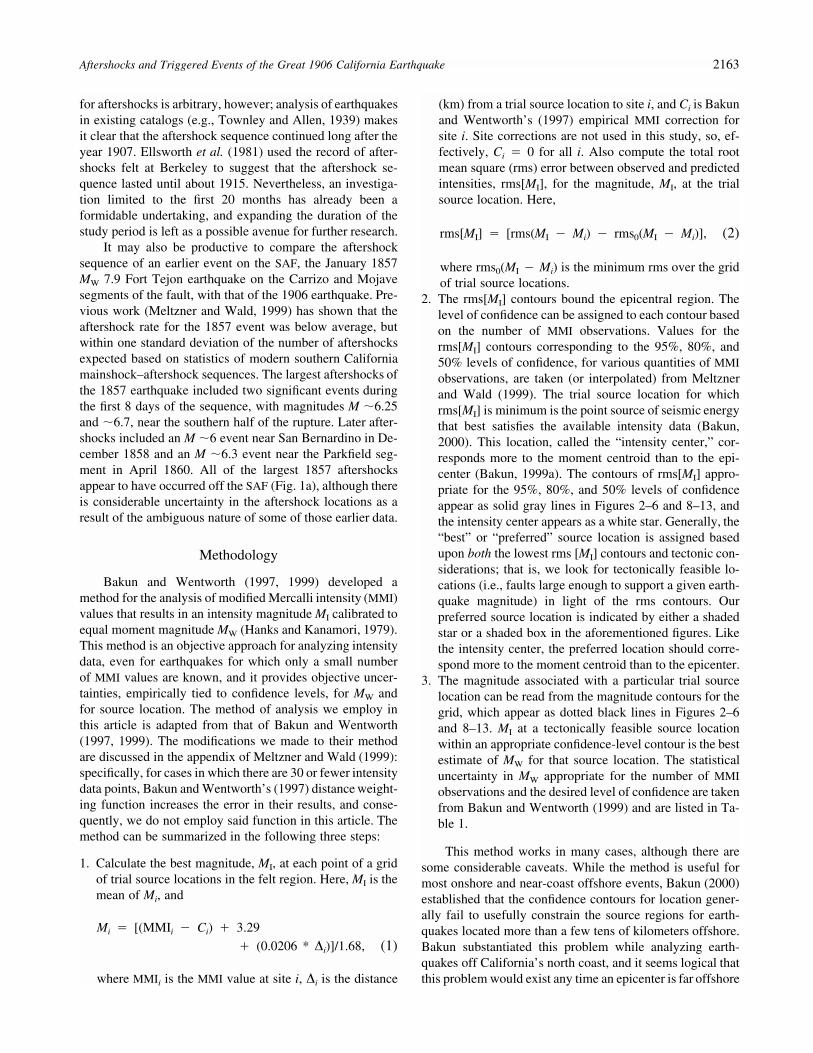
Figure 2. Map of the 18 April 1906 (14:28) after-shock. Triangles designate locations for which thereis intensity information; adjacent to each triangle is aRoman numeral that indicates the MMI value. (Onother figures, “NF” or “NF?” indicates that an eventwas reported or is inferred, respectively, to have notbeen felt at a particular location. Locations where theearthquake is reported to have been felt, but for whichan MMI value could not be determined, are notshown.) The rms[MI] contours corresponding to the50%, 80%, and 95% confidence levels for the locationare shown as solid lines. The intensity center is awhite star, and the preferred source location is shownas a dark star. Contours of MI are dotted lines. Thinlines are faults, and the thick line represents the 1906rupture. See Table 14 for the preferred magnitude andfor coordinates of the preferred location.
119˚W 118˚W 117˚W33˚N
34˚N
35˚N
5
5.2
5.2
5.4
5.4
5.4
5.6
5.6
5.6
5.6
5.8
5.8
5.8
5.8
5.8
6
50%
50%
80%
80%
80%
95%
119˚W 118˚W 117˚W33˚N
34˚N
35˚N
0 50
km
VIV
V
V V
VIV
IV
IV
IV
IV
III
III
III
III
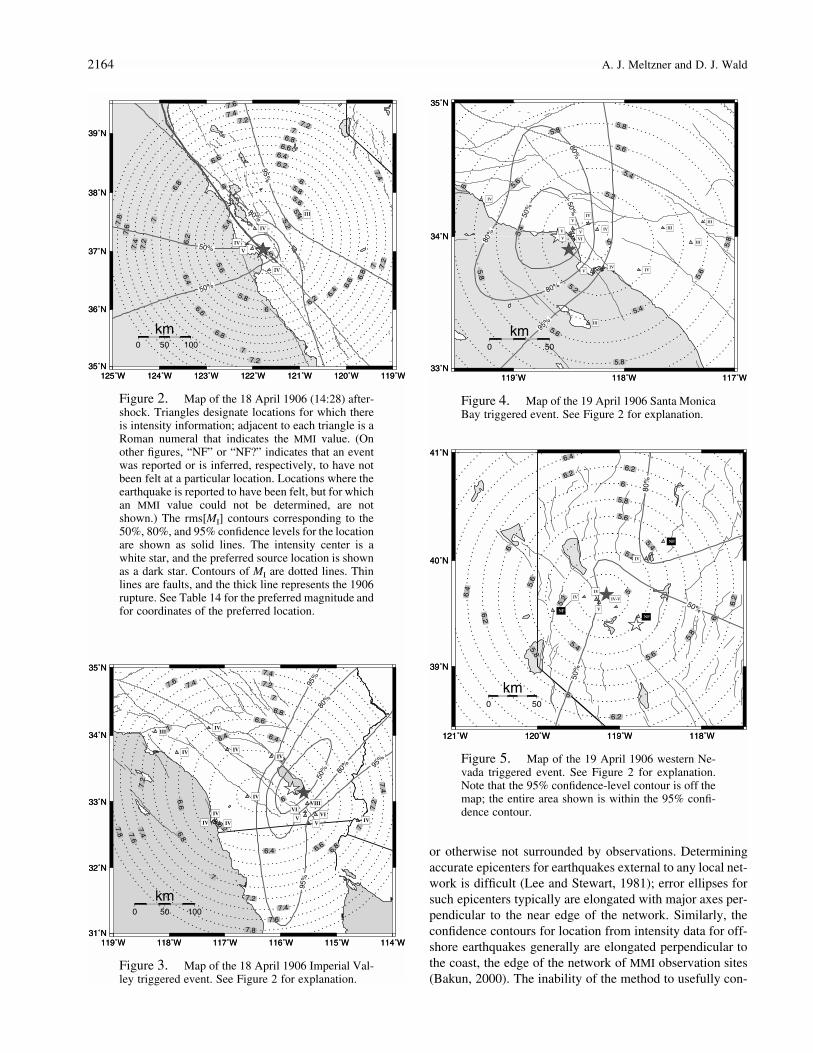
Figure 4. Map of the 19 April 1906 Santa MonicaBay triggered event. See Figure 2 for explanation.
121˚W 120˚W 119˚W 118˚W
39˚N
40˚N
41˚N
5
5.25.
2
5.4
5.4
5.6
5.6
5.6
5.8
5.8
5.8
6
6
6
6
6.2
6.2
6.2
6.2
6.26.
46.4
50%
50%
80%
121˚W 120˚W 119˚W 118˚W
39˚N
40˚N
41˚N
0 50
km
V
IV-V
IV
IVIV
NF
NF
NF
Figure 5. Map of the 19 April 1906 western Ne-vada triggered event. See Figure 2 for explanation.Note that the 95% confidence-level contour is off themap; the entire area shown is within the 95% confi-dence contour.
119˚W 118˚W 117˚W 116˚W 115˚W 114˚W31˚N
32˚N
33˚N
34˚N
35˚N
6
6.2
6.2
6.4
6.4
6.4
6.6
6.6
6.6
6.8
6.8
6.8
7
7
7
7
7.2
7.2
7.2
7.2
7.4
7.4
7.4
7.4
7.4
7.6
7.67.6
7.8
7.8
50% 80
%
80%
95%
95%
95%
119˚W 118˚W 117˚W 116˚W 115˚W 114˚W31˚N
32˚N
33˚N
34˚N
35˚N
0 50 100
km
VIIIVI
VIV
V
IVIV
IV
IV
IV
IV IV
IV
IV
III
Figure 3. Map of the 18 April 1906 Imperial Val-ley triggered event. See Figure 2 for explanation.
or otherwise not surrounded by observations. Determiningaccurate epicenters for earthquakes external to any local net-work is difficult (Lee and Stewart, 1981); error ellipses forsuch epicenters typically are elongated with major axes per-pendicular to the near edge of the network. Similarly, theconfidence contours for location from intensity data for off-shore earthquakes generally are elongated perpendicular tothe coast, the edge of the network of MMI observation sites(Bakun, 2000). The inability of the method to usefully con-
Aftershocks and Triggered Events of the Great 1906 California Earthquake 2165
126˚W 125˚W 124˚W 123˚W 122˚W 121˚W 120˚W38˚N
39˚N
40˚N
41˚N
42˚N
43˚N
66.2
6.2
6.4
6.4
6.6
6.6
6.6
6.8
6.8
6.8
7
7
7
77.2
7.2
7.2
7.2
7.4
7.4
7.4
7.4
7.6
7.6
7.6
7.6
7.6
7.8
7.8
7.8
7.8
8
8
8
8
50%
80%
95%
126˚W 125˚W 124˚W 123˚W 122˚W 121˚W 120˚W38˚N
39˚N
40˚N
41˚N
42˚N
43˚N
0 50 100
km
V
V
V
V
V
IV
IV
IV
IV
IV
IV
IV
IVIII
III
III
III
III
III
Bounds onPreferredLocation
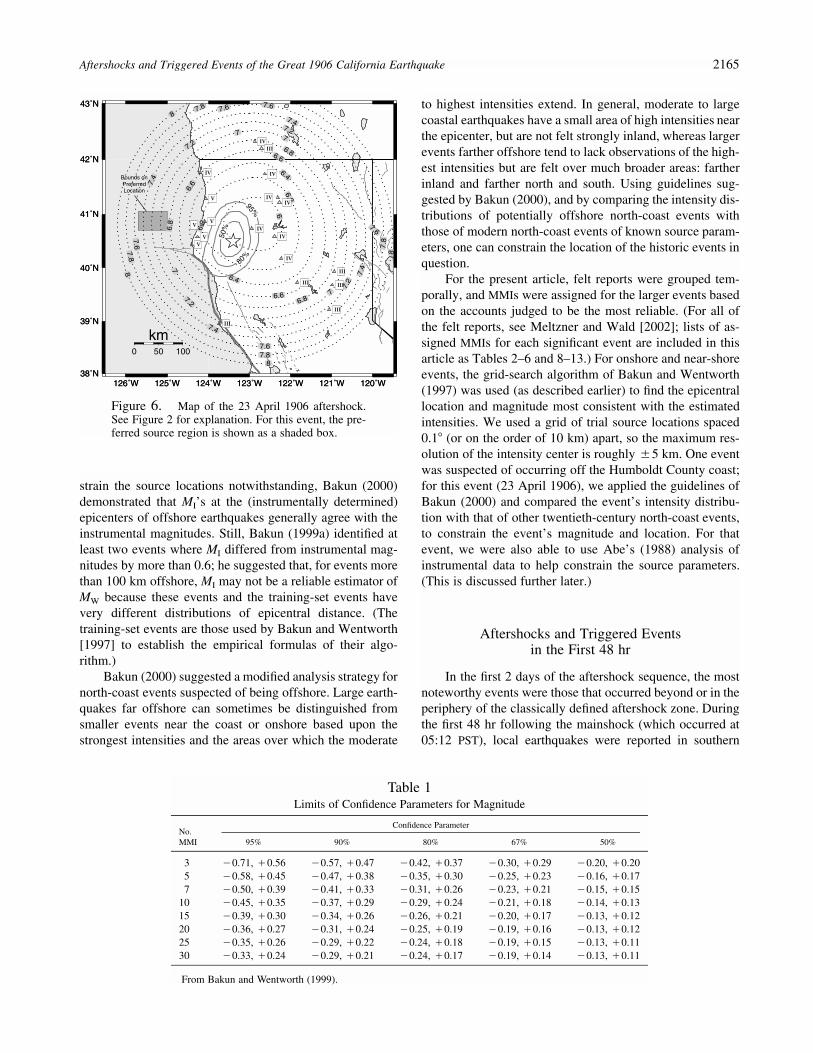
Figure 6. Map of the 23 April 1906 aftershock.See Figure 2 for explanation. For this event, the pre-ferred source region is shown as a shaded box.
strain the source locations notwithstanding, Bakun (2000)demonstrated that MI’s at the (instrumentally determined)epicenters of offshore earthquakes generally agree with theinstrumental magnitudes. Still, Bakun (1999a) identified atleast two events where MI differed from instrumental mag-nitudes by more than 0.6; he suggested that, for events morethan 100 km offshore, MI may not be a reliable estimator ofMW because these events and the training-set events havevery different distributions of epicentral distance. (Thetraining-set events are those used by Bakun and Wentworth[1997] to establish the empirical formulas of their algo-rithm.)
Bakun (2000) suggested a modified analysis strategy fornorth-coast events suspected of being offshore. Large earth-quakes far offshore can sometimes be distinguished fromsmaller events near the coast or onshore based upon thestrongest intensities and the areas over which the moderate
to highest intensities extend. In general, moderate to largecoastal earthquakes have a small area of high intensities nearthe epicenter, but are not felt strongly inland, whereas largerevents farther offshore tend to lack observations of the high-est intensities but are felt over much broader areas: fartherinland and farther north and south. Using guidelines sug-gested by Bakun (2000), and by comparing the intensity dis-tributions of potentially offshore north-coast events withthose of modern north-coast events of known source param-eters, one can constrain the location of the historic events inquestion.
For the present article, felt reports were grouped tem-porally, and MMIs were assigned for the larger events basedon the accounts judged to be the most reliable. (For all ofthe felt reports, see Meltzner and Wald [2002]; lists of as-signed MMIs for each significant event are included in thisarticle as Tables 2–6 and 8–13.) For onshore and near-shoreevents, the grid-search algorithm of Bakun and Wentworth(1997) was used (as described earlier) to find the epicentrallocation and magnitude most consistent with the estimatedintensities. We used a grid of trial source locations spaced0.1� (or on the order of 10 km) apart, so the maximum res-olution of the intensity center is roughly �5 km. One eventwas suspected of occurring off the Humboldt County coast;for this event (23 April 1906), we applied the guidelines ofBakun (2000) and compared the event’s intensity distribu-tion with that of other twentieth-century north-coast events,to constrain the event’s magnitude and location. For thatevent, we were also able to use Abe’s (1988) analysis ofinstrumental data to help constrain the source parameters.(This is discussed further later.)
Aftershocks and Triggered Eventsin the First 48 hr
In the first 2 days of the aftershock sequence, the mostnoteworthy events were those that occurred beyond or in theperiphery of the classically defined aftershock zone. Duringthe first 48 hr following the mainshock (which occurred at05:12 PST), local earthquakes were reported in southern
Table 1Limits of Confidence Parameters for Magnitude
Confidence ParameterNo.MMI 95% 90% 80% 67% 50%
3 �0.71, �0.56 �0.57, �0.47 �0.42, �0.37 �0.30, �0.29 �0.20, �0.205 �0.58, �0.45 �0.47, �0.38 �0.35, �0.30 �0.25, �0.23 �0.16, �0.177 �0.50, �0.39 �0.41, �0.33 �0.31, �0.26 �0.23, �0.21 �0.15, �0.15
10 �0.45, �0.35 �0.37, �0.29 �0.29, �0.24 �0.21, �0.18 �0.14, �0.1315 �0.39, �0.30 �0.34, �0.26 �0.26, �0.21 �0.20, �0.17 �0.13, �0.1220 �0.36, �0.27 �0.31, �0.24 �0.25, �0.19 �0.19, �0.16 �0.13, �0.1225 �0.35, �0.26 �0.29, �0.22 �0.24, �0.18 �0.19, �0.15 �0.13, �0.1130 �0.33, �0.24 �0.29, �0.21 �0.24, �0.17 �0.19, �0.14 �0.13, �0.11
From Bakun and Wentworth (1999).
2166 A. J. Meltzner and D. J. Wald
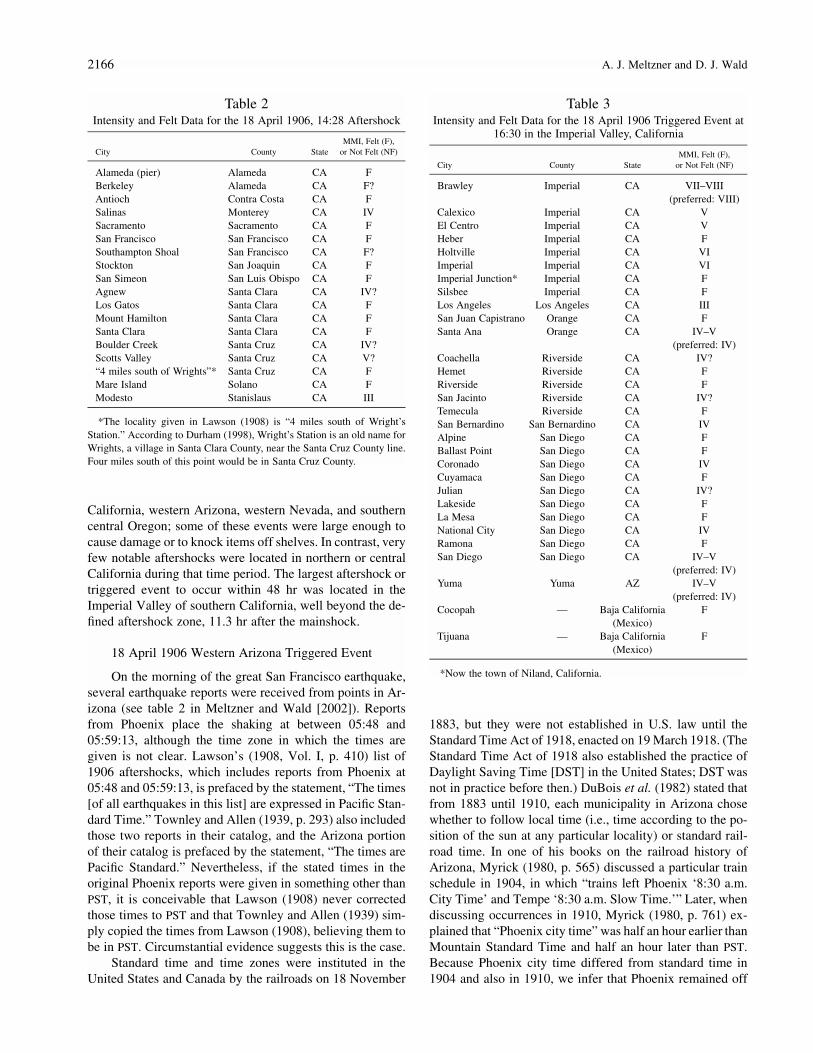
Table 2Intensity and Felt Data for the 18 April 1906, 14:28 Aftershock
City County StateMMI, Felt (F),
or Not Felt (NF)
Alameda (pier) Alameda CA FBerkeley Alameda CA F?Antioch Contra Costa CA FSalinas Monterey CA IVSacramento Sacramento CA FSan Francisco San Francisco CA FSouthampton Shoal San Francisco CA F?Stockton San Joaquin CA FSan Simeon San Luis Obispo CA FAgnew Santa Clara CA IV?Los Gatos Santa Clara CA FMount Hamilton Santa Clara CA FSanta Clara Santa Clara CA FBoulder Creek Santa Cruz CA IV?Scotts Valley Santa Cruz CA V?“4 miles south of Wrights”* Santa Cruz CA FMare Island Solano CA FModesto Stanislaus CA III
*The locality given in Lawson (1908) is “4 miles south of Wright’sStation.” According to Durham (1998), Wright’s Station is an old name forWrights, a village in Santa Clara County, near the Santa Cruz County line.Four miles south of this point would be in Santa Cruz County.
Table 3Intensity and Felt Data for the 18 April 1906 Triggered Event at
16:30 in the Imperial Valley, California
City County StateMMI, Felt (F),
or Not Felt (NF)
Brawley Imperial CA VII–VIII(preferred: VIII)
Calexico Imperial CA VEl Centro Imperial CA VHeber Imperial CA FHoltville Imperial CA VIImperial Imperial CA VIImperial Junction* Imperial CA FSilsbee Imperial CA FLos Angeles Los Angeles CA IIISan Juan Capistrano Orange CA FSanta Ana Orange CA IV–V
(preferred: IV)Coachella Riverside CA IV?Hemet Riverside CA FRiverside Riverside CA FSan Jacinto Riverside CA IV?Temecula Riverside CA FSan Bernardino San Bernardino CA IVAlpine San Diego CA FBallast Point San Diego CA FCoronado San Diego CA IVCuyamaca San Diego CA FJulian San Diego CA IV?Lakeside San Diego CA FLa Mesa San Diego CA FNational City San Diego CA IVRamona San Diego CA FSan Diego San Diego CA IV–V
(preferred: IV)Yuma Yuma AZ IV–V
(preferred: IV)Cocopah — Baja California
(Mexico)F
Tijuana — Baja California(Mexico)
F
*Now the town of Niland, California.
California, western Arizona, western Nevada, and southerncentral Oregon; some of these events were large enough tocause damage or to knock items off shelves. In contrast, veryfew notable aftershocks were located in northern or centralCalifornia during that time period. The largest aftershock ortriggered event to occur within 48 hr was located in theImperial Valley of southern California, well beyond the de-fined aftershock zone, 11.3 hr after the mainshock.
18 April 1906 Western Arizona Triggered Event
On the morning of the great San Francisco earthquake,several earthquake reports were received from points in Ar-izona (see table 2 in Meltzner and Wald [2002]). Reportsfrom Phoenix place the shaking at between 05:48 and05:59:13, although the time zone in which the times aregiven is not clear. Lawson’s (1908, Vol. I, p. 410) list of1906 aftershocks, which includes reports from Phoenix at05:48 and 05:59:13, is prefaced by the statement, “The times[of all earthquakes in this list] are expressed in Pacific Stan-dard Time.” Townley and Allen (1939, p. 293) also includedthose two reports in their catalog, and the Arizona portionof their catalog is prefaced by the statement, “The times arePacific Standard.” Nevertheless, if the stated times in theoriginal Phoenix reports were given in something other thanPST, it is conceivable that Lawson (1908) never correctedthose times to PST and that Townley and Allen (1939) sim-ply copied the times from Lawson (1908), believing them tobe in PST. Circumstantial evidence suggests this is the case.
Standard time and time zones were instituted in theUnited States and Canada by the railroads on 18 November
1883, but they were not established in U.S. law until theStandard Time Act of 1918, enacted on 19 March 1918. (TheStandard Time Act of 1918 also established the practice ofDaylight Saving Time [DST] in the United States; DST wasnot in practice before then.) DuBois et al. (1982) stated thatfrom 1883 until 1910, each municipality in Arizona chosewhether to follow local time (i.e., time according to the po-sition of the sun at any particular locality) or standard rail-road time. In one of his books on the railroad history ofArizona, Myrick (1980, p. 565) discussed a particular trainschedule in 1904, in which “trains left Phoenix ‘8:30 a.m.City Time’ and Tempe ‘8:30 a.m. Slow Time.’” Later, whendiscussing occurrences in 1910, Myrick (1980, p. 761) ex-plained that “Phoenix city time” was half an hour earlier thanMountain Standard Time and half an hour later than PST.Because Phoenix city time differed from standard time in1904 and also in 1910, we infer that Phoenix remained off
Aftershocks and Triggered Events of the Great 1906 California Earthquake 2167
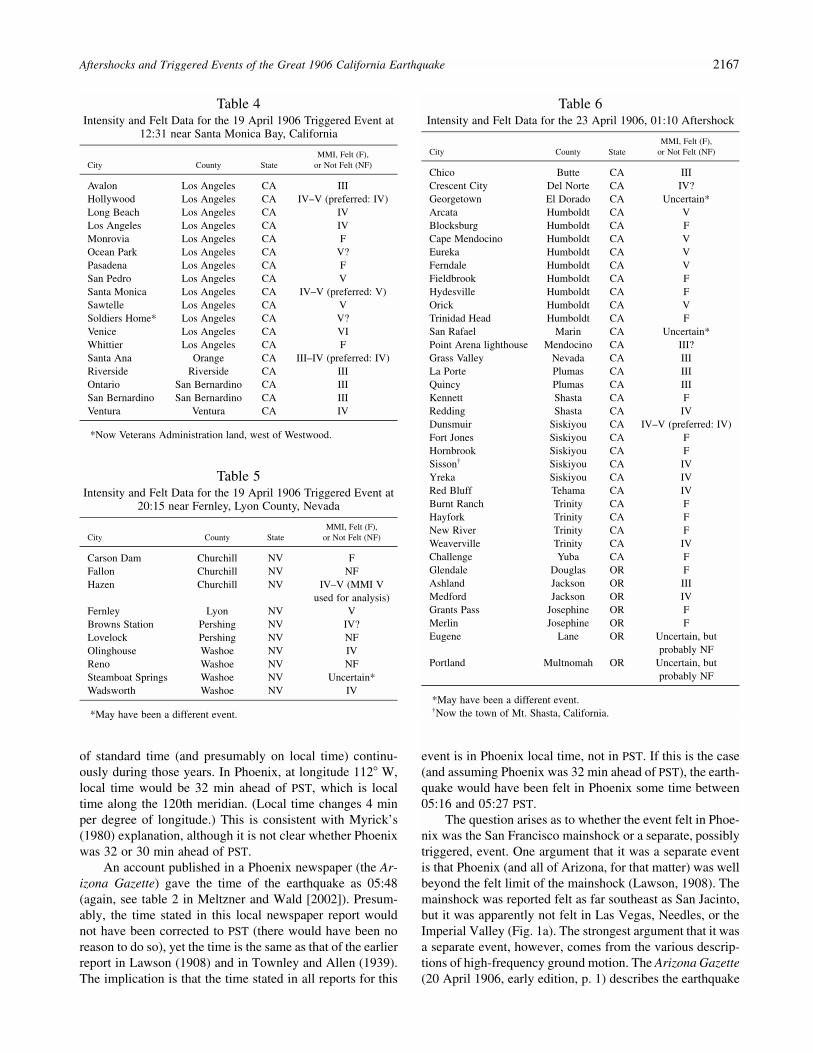
Table 4Intensity and Felt Data for the 19 April 1906 Triggered Event at
12:31 near Santa Monica Bay, California
City County StateMMI, Felt (F),
or Not Felt (NF)
Avalon Los Angeles CA IIIHollywood Los Angeles CA IV–V (preferred: IV)Long Beach Los Angeles CA IVLos Angeles Los Angeles CA IVMonrovia Los Angeles CA FOcean Park Los Angeles CA V?Pasadena Los Angeles CA FSan Pedro Los Angeles CA VSanta Monica Los Angeles CA IV–V (preferred: V)Sawtelle Los Angeles CA VSoldiers Home* Los Angeles CA V?Venice Los Angeles CA VIWhittier Los Angeles CA FSanta Ana Orange CA III–IV (preferred: IV)Riverside Riverside CA IIIOntario San Bernardino CA IIISan Bernardino San Bernardino CA IIIVentura Ventura CA IV
*Now Veterans Administration land, west of Westwood.
Table 5Intensity and Felt Data for the 19 April 1906 Triggered Event at
20:15 near Fernley, Lyon County, Nevada
City County StateMMI, Felt (F),
or Not Felt (NF)
Carson Dam Churchill NV FFallon Churchill NV NFHazen Churchill NV IV–V (MMI V
used for analysis)Fernley Lyon NV VBrowns Station Pershing NV IV?Lovelock Pershing NV NFOlinghouse Washoe NV IVReno Washoe NV NFSteamboat Springs Washoe NV Uncertain*Wadsworth Washoe NV IV
*May have been a different event.
Table 6Intensity and Felt Data for the 23 April 1906, 01:10 Aftershock
City County StateMMI, Felt (F),
or Not Felt (NF)
Chico Butte CA IIICrescent City Del Norte CA IV?Georgetown El Dorado CA Uncertain*Arcata Humboldt CA VBlocksburg Humboldt CA FCape Mendocino Humboldt CA VEureka Humboldt CA VFerndale Humboldt CA VFieldbrook Humboldt CA FHydesville Humboldt CA FOrick Humboldt CA VTrinidad Head Humboldt CA FSan Rafael Marin CA Uncertain*Point Arena lighthouse Mendocino CA III?Grass Valley Nevada CA IIILa Porte Plumas CA IIIQuincy Plumas CA IIIKennett Shasta CA FRedding Shasta CA IVDunsmuir Siskiyou CA IV–V (preferred: IV)Fort Jones Siskiyou CA FHornbrook Siskiyou CA FSisson† Siskiyou CA IVYreka Siskiyou CA IVRed Bluff Tehama CA IVBurnt Ranch Trinity CA FHayfork Trinity CA FNew River Trinity CA FWeaverville Trinity CA IVChallenge Yuba CA FGlendale Douglas OR FAshland Jackson OR IIIMedford Jackson OR IVGrants Pass Josephine OR FMerlin Josephine OR FEugene Lane OR Uncertain, but
probably NFPortland Multnomah OR Uncertain, but
probably NF
*May have been a different event.†Now the town of Mt. Shasta, California.
of standard time (and presumably on local time) continu-ously during those years. In Phoenix, at longitude 112� W,local time would be 32 min ahead of PST, which is localtime along the 120th meridian. (Local time changes 4 minper degree of longitude.) This is consistent with Myrick’s(1980) explanation, although it is not clear whether Phoenixwas 32 or 30 min ahead of PST.
An account published in a Phoenix newspaper (the Ar-izona Gazette) gave the time of the earthquake as 05:48(again, see table 2 in Meltzner and Wald [2002]). Presum-ably, the time stated in this local newspaper report wouldnot have been corrected to PST (there would have been noreason to do so), yet the time is the same as that of the earlierreport in Lawson (1908) and in Townley and Allen (1939).The implication is that the time stated in all reports for this
event is in Phoenix local time, not in PST. If this is the case(and assuming Phoenix was 32 min ahead of PST), the earth-quake would have been felt in Phoenix some time between05:16 and 05:27 PST.
The question arises as to whether the event felt in Phoe-nix was the San Francisco mainshock or a separate, possiblytriggered, event. One argument that it was a separate eventis that Phoenix (and all of Arizona, for that matter) was wellbeyond the felt limit of the mainshock (Lawson, 1908). Themainshock was reported felt as far southeast as San Jacinto,but it was apparently not felt in Las Vegas, Needles, or theImperial Valley (Fig. 1a). The strongest argument that it wasa separate event, however, comes from the various descrip-tions of high-frequency ground motion. The Arizona Gazette(20 April 1906, early edition, p. 1) describes the earthquake
2168 A. J. Meltzner and D. J. Wald
in Phoenix as a “distinct shaking of the earth,” with severalpeople having felt it “distinctly.” This description is not con-sistent with the long-period motion that would be expectedin the outskirts of the felt region of a great earthquake; rather,it suggests that the earthquake was a small-to-moderate localevent. (In contrast, many reports of the mainshock in Nevada[in the outskirts of the felt region] describe effects of long-period motion such as [1] long, gentle swaying, without anysharp or jerky movements; [2] the swaying of hanging ob-jects, without vibrations having been felt; [3] the sloshing orsplashing of water surfaces [in irrigation ditches], withoutvibrations having been felt; or [4] a dizzying or nauseatingsensation [Lawson, 1908; Nevada State Journal (Reno), 18April 1906 “Extra,” p. 1]).
In addition to the reports from Phoenix, there was onereport from Salome, 140 km west of Phoenix, in La PazCounty (see table 2 in Meltzner and Wald [2002]). Theearthquake was said to have been “distinctly noted” in Sa-lome. Mr. Pratt, the man giving the report, claimed to havebeen about 40 miles from Salome, in the mountains, at thetime of the earthquake; he and a friend were staying in acabin. The friend, who was inside at the time, said that thecabin “shook quite noticeably.” Mr. Pratt was outdoors and“plainly felt the quaking of the earth.” Although their loca-tion cannot be determined precisely, both their report andthe description from Salome are more consistent with theshort-period motion associated with a local event than withthe long-period motion expected for a very large but distantevent. The time of the shaking was not given precisely; it isonly stated to have occurred in the morning. Most likely,this is the earthquake that was felt in Phoenix, although wecannot rule out the possibility of two separate events. If itwas one event, it must have been large enough to be felt“distinctly” in two towns 140 km apart (M �4.0?); if therewere two events, the one nearer Salome must have beenlarge enough to be felt outdoors (MMI IV–V) at Mr. Pratt’slocation (M �3.5–4.0?).
Because of the temporal proximity of the Phoenix re-ports and the San Francisco mainshock, it may be informa-tive to determine the travel times of the seismic waves fromSan Francisco to Phoenix. Phoenix is located 1050 km (D� 9.44�) from the 1906 epicenter of Bolt (1968), just southof San Francisco (Fig. 1a). According to the Jeffreys–Bullen(1967) travel times, the predicted initial arrival times forvarious phases at a distance of D � 9.5� is P waves, 2 min17 sec; S waves, 4 min 4 sec; Love waves, �4.4 min; andRayleigh waves, �4.6 min. Using the mainshock origin timeof 05:12:21 PST of Bolt (1968), we would expect the P-wavearrival in Phoenix at 05:14:38, the S-wave arrival at05:16:25, and the initial surface waves to arrive at about05:16:45 PST. If the earthquake felt in Phoenix was not theSan Francisco mainshock, the Arizona event would haveoccurred during the time when the seismic waves from SanFrancisco were passing through Phoenix.
Our preferred interpretation of the Arizona reports isthat there was a single event, with M �4.0 and with an
epicenter somewhere between Phoenix and Salome. Al-though our calculation for the travel times of seismic wavesfrom the San Francisco mainshock assumed a Phoenix lo-cation for the triggered event, it is also applicable (as anapproximation) for a triggered event source nearer Salome.The various phases of seismic waves from San Franciscowould have arrived at a source near Salome roughly 15–30sec prior to reaching Phoenix; likewise, a triggered eventnear Salome would have started roughly 15–35 sec beforeshaking was felt in Phoenix. Of course, attempting to deter-mine the arrival times to the precision of a second is in thiscase a pointless task, as the uncertainty in the observers’reported times is at best a few minutes; additionally, themainshock radiated seismic energy for nearly 2 min (Waldet al., 1993). Wherever the Arizona triggered event was lo-cated, we propose that it was dynamically triggered by thetraveling waves of the San Francisco mainshock. At a dis-tance of D � 8.2�–9.4� (910–1050 km, the epicentral dis-tances of Salome and Phoenix, respectively), the surfacewaves would have the largest amplitudes and thereforewould be most likely to dynamically trigger an earthquake;nevertheless, limitations in our data preclude any conclusionto that effect. If there were two separate events in Arizona(our alternative interpretation), the event between 05:16 and05:27 PST would have occurred during the passage of theseismic waves from San Francisco and, accordingly, wewould propose that it was triggered dynamically.
The phenomenon of remote earthquake triggering dur-ing shaking from a mainshock has been documented in Cali-fornia in the cases of the 1992 MW 7.3 Landers earthquakeand the 1999 MW 7.1 Hector Mine earthquake. Followingthe Landers earthquake, triggered activity began in LongValley caldera (eastern California) and at the Geysers (north-western California) 30–40 sec after the S-wave arrivals fromthe Landers earthquake and during the passage of the large-amplitude Love and Rayleigh surface wave trains (Hill etal., 1993). The Hector Mine earthquake triggered an M 4.7event near the southern end of the Salton Sea (in southernCalifornia) within 30 sec of the P-wave arrival at that lo-cation, and the triggered event was followed by its own M4.4 aftershock within about 10 min (Hough and Kanamori,2002). Elsewhere, the MW 7.4 August 1999 Izmit, Turkey,earthquake triggered smaller earthquakes in Greece imme-diately after the passage of the largest-amplitude surfacewaves (Brodsky et al., 2000). And most recently, the No-vember 2002 MW 7.9 Denali fault, Alaska, earthquake trig-gered seismicity in a number of places in western NorthAmerica (including Yellowstone caldera in Wyoming; LongValley caldera, the Geysers, and the Coso geothermal fieldin California; Mount Rainier in Washington; the Intermoun-tain Seismic Belt in Utah, and the Katmai volcanic clusterin southwestern Alaska), with the triggered seismicity be-ginning in each place during the S-wave coda or the earlyphases of the surface wave arrivals (Hill et al., 2002; Husenet al., 2002; Johnston et al., 2002; Moran et al., 2002; Pan-kow et al., 2002).
Aftershocks and Triggered Events of the Great 1906 California Earthquake 2169
18 April 1906 Santa Cruz Area Aftershock
This aftershock occurred only hours after the main-shock, at a time when aftershocks were occurring at a veryhigh frequency. That there was a relatively large aftershockat about 14:28 on the afternoon of 18 April 1906 is inferredfrom a surge of widely spaced earthquake reports (see tables1 and 5 in Meltzner and Wald, [2002]) between 14:20 and14:30; a number of these reports describe the earthquake asbeing one of the stronger aftershocks up to that point. Never-theless, there are reports of two or more closely timed eventsfrom some of those locations, and in some cases it is notclear which reports describe which event. Although our pre-ferred interpretation is that there was a single large event ataround 14:28, with several smaller events a few minutes be-fore and after (hereafter, the single-event hypothesis), the datasupport an alternative interpretation: there may have been twolarge aftershocks, one near San Francisco at 14:25 and onenear Santa Cruz at 14:28 (the double-event hypothesis).
In Meltzner and Wald (2002) and here, using themethod of Bakun and Wentworth (1997) (as qualified ear-lier) to determine the best magnitude and location, we as-sume the single-event hypothesis. At each location, we usethe intensity from the strongest event between 14:20 and14:30 as the representative intensity for that location. If in-deed there was only one large event, the solution is appro-priate. If instead there were two large events, the true inten-sities would be lower near Santa Cruz for the 14:25 eventand lower near San Francisco for the 14:28 event; the so-lution would overestimate the size of each event. Either way,the magnitude suggested by the solution is a maximum forthe size of the event(s).
A list of the intensities used (where they could be de-termined) and all other points where this aftershock was feltis given in Table 2. The solution of the algorithm for thisevent is shown in Figure 2. The solid gray 95%, 80%, and50% confidence-level contours constrain the location. Be-cause of the relatively few observation points, the locationis not well constrained; nevertheless, the intensity center(white star) is very close to the SAF. Our preferred location(gray star) in this case is simply the point along the SAF withthe lowest rms error; it is just roughly between the towns ofAptos and Morgan Hill, in the Santa Cruz Mountains. MI atour preferred location is 4.9; incorporating the uncertaintyin the magnitude for five observation points at 95% confi-dence (Table 1), our magnitude for this event is MI 4.9(�0.6/�0.5). As stated earlier, this magnitude is an upperbound. Excluding triggered events, this was the largest af-tershock within 48 hr of the San Francisco mainshock; ob-serve that no known aftershock within the first 2 days ex-ceeded M 5.0 (M 5.4 at 95% confidence).
18 April 1906 Imperial Valley, California,Triggered Events
On the afternoon of 18 April 1906, a series of earth-quakes began in the Imperial Valley in southern California.
(For a regional map showing many of the locations to bediscussed in this section, see Fig. 1b; for the original reports,see table 2 in Meltzner and Wald [2002]). Initially, the earth-quakes must have been small, as only a few localities re-ported them: Brawley and Imperial Junction (now Niland)reported earthquakes beginning at 13:30, and Imperial re-ported its first “distinct” earthquake at 15:00. In other loca-tions, these earthquakes were either not felt or simply notrecorded.
Then, at 16:30 on 18 April 1906, 11.3 hr after the 05:12mainshock, the Imperial Valley swarm culminated with alarge earthquake that was felt over much of southern Cali-fornia and into Mexico and Arizona. This earthquake hasalready been the subject of several studies: Toppozada et al.(1978) estimated MI � 6.0 based mainly on the size of thetotal felt area, but Toppozada and Parke (1982) revised thatfigure downward to MI � 5.8 based on the areas shaken atMMI V and greater; Abe (1988) estimated a surface wavemagnitude based on Milne instrument data of MS � 6.2; andEllsworth (1990) assigned this event a summary magnitudeof M 6.2. In more recent work, Toppozada et al. (2000) andToppozada and Branum (2002) adopted the higher M of 6.2.For the location, Toppozada et al. (1978) estimated it to beat 32.5� N, 115.5� W, in the Mexicali Valley south of theinternational border, but Toppozada and Parke (1982)moved the epicenter north across the border to 32.9� N,115.5� W; Abe (1988) used the more southerly location ofToppozada et al. (1978), but all other papers published sincethen have assumed the more northerly location of Toppozadaand Parke (1982). In this study, we reinterpret old felt re-ports, assess newly found felt reports, and apply the methodof Bakun and Wentworth (1997) (as qualified earlier) to theintensity data set. (For the original felt reports for this event,see table 6 in Meltzner and Wald [2002].)
A list of the assigned intensities and all points wherethis aftershock was felt is given in Table 3, and the solutionof the algorithm is shown in Figure 3. Note that, in somecases, the intensities differ slightly from those of Toppozadaand Parke (1982). The highest intensity is in Brawley (MMIVIII), and the intensity drops off rapidly to the south. Theintensity also appears to drop off to the north of Brawley,but because of a lack of intensity data immediately north ofBrawley, we cannot be certain where one would draw iso-seismal curves. The intensity center is northwest of the Im-perial Valley, but it is biased by the distal reports to thenorthwest and lack of reports in the desert to the northeastand in Mexico to the south.
Our preferred location is in the Brawley Seismic Zonesoutheast of the Salton Sea, because we feel that it is themost likely location within the solution’s 50% confidence-level contour. Note that an M 4.7 triggered event occurredin that vicinity following the 1999 MW 7.1 Hector Mineearthquake (Hough and Kanamori, 2002). Still, other loca-tions in the Imperial Valley should be considered. The traceof the Brawley fault associated with the 1979 rupture (U.S.Geological Survey, 1982, Plate 1; Real, 1982) and the Im-
2170 A. J. Meltzner and D. J. Wald
perial fault north of El Centro are both plausible locations;however, the rapid southward decrease in intensity precludesa more southerly source location. (In the 1979 earthquake,which involved rupture on the Brawley fault and the Impe-rial fault south to the international border, the intensity wasuniformly MMI VII from Brawley to Calexico; see Reagoret al. [1982] and Nason [1982].) Alternatively, slip alongone of the northeast-trending cross faults southeast of theSalton Sea could be responsible; candidates include the faultinvolved in the strongest aftershock of the 1979 event (John-son and Hutton, 1982) and the fault involved in the 1981Westmorland earthquake (Nicholson et al., 1986). The Su-perstition Hills, Elmore Ranch, and Coyote Creek faults areless likely sources, as an M �6.1 event on one of those faultswould not be expected to produce the MMI VIII observed inBrawley in 1906. (The 1987 MW 6.2 Elmore Ranch earth-quake on the Lone Tree, Elmore Ranch, and Kane Springfaults produced MMI V in Brawley [J. Dewey, personalcomm., 1997], the 1987 MW 6.6 Superstition Hills earth-quake on the Superstition Hills and Wienert faults producedMMI VI in Brawley [J. Dewey, personal comm., 1997], andthe 1968 MW 6.5 Borrego Mountain earthquake on the Coy-ote Creek fault produced MMI VI in Brawley [SeismologicalField Survey, NOAA, 1972].) Paleoseismic evidence pre-cludes an earthquake with surface rupture on the SuperstitionMountain fault any time after A.D. 1637 (Gurrola and Rock-well, 1996). We also rule out a location on the SAF near ornorthwest of Bombay Beach because Bombay Beach is ap-proximately halfway between Brawley and Coachella, butthe intensities are much higher in Brawley and to the souththan they are in Coachella and to the north. (Observe thatthe amplification of intensity due to the underlying sedi-ments in the Imperial Valley should not be any greater thanit is in Coachella, which sits on similar materials.)
Fortuitously, MI does not vary much over the potentialsource region. At our preferred location, MI is 6.1, and atthe other possible locations, MI ranges from 6.1 to 6.2 (Fig.3). The statistical uncertainty in the magnitude for 15 ob-servation points at 95% confidence (Table 1) is �0.4/�0.3;hence, our magnitude for this event is 6.1–6.2 (�0.4/�0.3),or, roughly, MI 6.1 � 0.4. This magnitude is consistent withthose published previously (see earlier discussion), althoughour preferred source region is to the north: the location ismore consistent with the epicenter of Toppozada and Parke(1982). As expected, reports confirm that the Imperial Valleyearthquake was followed by its own sequence of aftershocks,although the aftershocks cannot be located any more pre-cisely than the Imperial Valley mainshock.
18 April 1906 Pomona Valley, California,Triggered Events
Late on the evening of 18 April 1906, a small swarm ofearthquakes occurred near San Dimas in the Pomona Valleyof southern California. Three “light” earthquakes were re-ported in Glendora: one at 20:45, one at 21:10, and the last
at 22:30. The second event was either located further eastthan the others or it was larger, as it was also reported inLordsburg (now La Verne) and in Chino. In Lordsburg (LaVerne) the second event was described as severe, and inChino it was described as slight. In addition, a diary kept byMr. Robert B. Waterman lists an event at 20:50 on 19 April1906; this may be a misdated account of one of the afore-mentioned 18 April events. At the time, Mr. Waterman wascamping several miles north of Azusa. (See table 2 in Meltz-ner and Wald [2002] for the original reports and for a dis-cussion on Mr. Waterman’s exact location.) Irrespective ofMr. Waterman’s report, the intensity distribution for the21:10 event is similar to the intensity distributions of at leasttwo modern events: an M 2.7 event 2 miles south of SanDimas on 8 January 2001 and an M 3.1 event 5 miles north-northeast of La Verne on 24 September 2000. (Intensity datafor the modern events is from the U.S. Geological Survey;see also Wald et al. [1999].) We estimate the magnitude ofthe largest Pomona Valley triggered event to be M �3 andthe others to be slightly smaller.
19 April 1906 Southern Oregon Triggered Events
Lawson (1908, Vol. I, p. 163) discussed an earthquakeswarm that occurred near Paisley, Oregon, in the early morn-ing hours of 19 April 1906. According to Lawson, “At Pais-ley no shock was noticed on April 18, but on Thursday, April19, about 1h 30m A.M., a tremor was felt, strong enough togenerally awaken people, and during the next hour and ahalf three more shocks were felt. Considerable excitementwas caused, some people going out-of-doors and one ratherdelicate woman being made sick. . . . ” A report in the LakeCounty Examiner (26 April 1906, p. 1), published in nearbyLakeview, Oregon, was vague in regard to the times of theevents but confirms that multiple “distinct” earthquakes werefelt in Paisley. The description of the 01:30 event is consis-tent with MMI IV–V at Paisley; the smallest earthquake ca-pable of producing such an intensity is approximately M 3.5.Madin and Mabey (1996) mapped an active fault near Pais-ley. If that fault were responsible, the magnitude of the 01:30event may have been as small as M 3.5; otherwise, if theepicenter were farther away, the magnitude would have beenhigher. Owing to the remoteness of the area, a precise lo-cation for this event cannot be determined.
19 April 1906 Santa Monica Bay, California,Triggered Event
At 12:31 PST on 19 April 1906, 31.3 hr after the SanFrancisco mainshock, a moderate earthquake struck the LosAngeles region. The event was felt with MMI III� fromSanta Catalina Island to San Bernardino to Ventura, and itwas most strongly felt on the west side of Los Angeles.(Venice had the strongest reported intensity at MMI VI.) Theintensities and locations where the earthquake was felt arelisted in Table 4, and the solution for this event is shown inFigure 4; for the original reports, see tables 2 and 7 in Meltz-
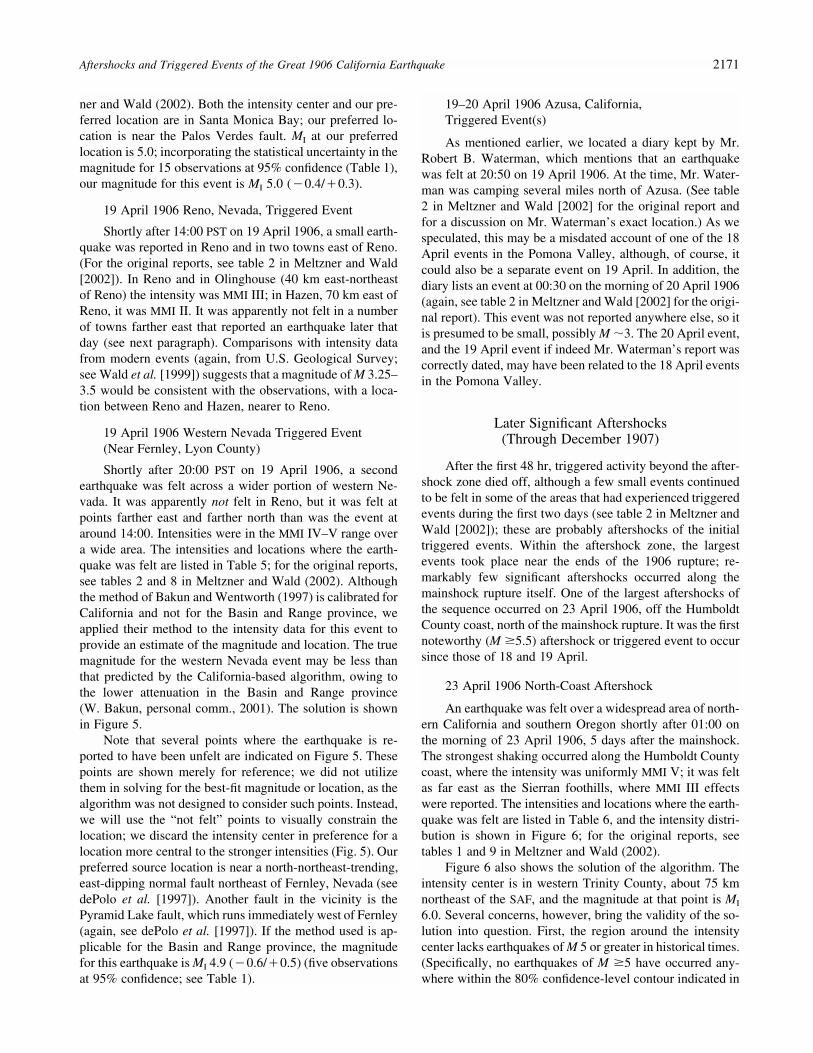
Aftershocks and Triggered Events of the Great 1906 California Earthquake 2171
ner and Wald (2002). Both the intensity center and our pre-ferred location are in Santa Monica Bay; our preferred lo-cation is near the Palos Verdes fault. MI at our preferredlocation is 5.0; incorporating the statistical uncertainty in themagnitude for 15 observations at 95% confidence (Table 1),our magnitude for this event is MI 5.0 (�0.4/�0.3).
19 April 1906 Reno, Nevada, Triggered Event
Shortly after 14:00 PST on 19 April 1906, a small earth-quake was reported in Reno and in two towns east of Reno.(For the original reports, see table 2 in Meltzner and Wald[2002]). In Reno and in Olinghouse (40 km east-northeastof Reno) the intensity was MMI III; in Hazen, 70 km east ofReno, it was MMI II. It was apparently not felt in a numberof towns farther east that reported an earthquake later thatday (see next paragraph). Comparisons with intensity datafrom modern events (again, from U.S. Geological Survey;see Wald et al. [1999]) suggests that a magnitude of M 3.25–3.5 would be consistent with the observations, with a loca-tion between Reno and Hazen, nearer to Reno.
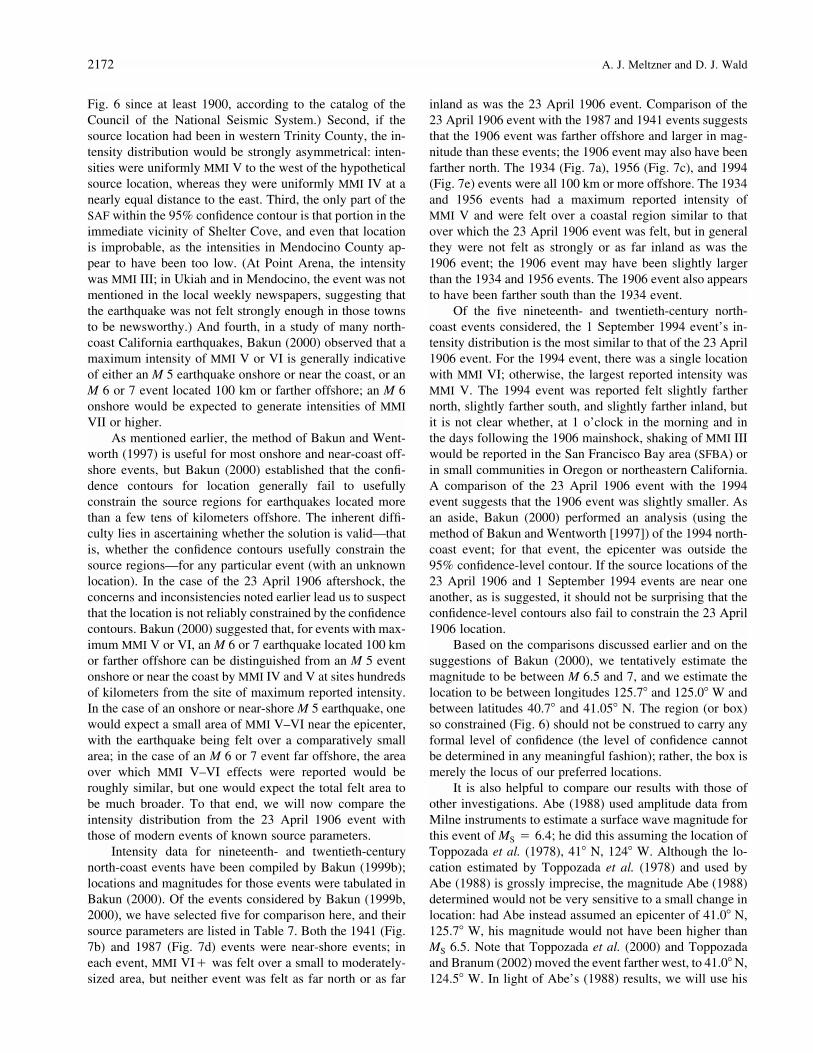
19 April 1906 Western Nevada Triggered Event(Near Fernley, Lyon County)
Shortly after 20:00 PST on 19 April 1906, a secondearthquake was felt across a wider portion of western Ne-vada. It was apparently not felt in Reno, but it was felt atpoints farther east and farther north than was the event ataround 14:00. Intensities were in the MMI IV–V range overa wide area. The intensities and locations where the earth-quake was felt are listed in Table 5; for the original reports,see tables 2 and 8 in Meltzner and Wald (2002). Althoughthe method of Bakun and Wentworth (1997) is calibrated forCalifornia and not for the Basin and Range province, weapplied their method to the intensity data for this event toprovide an estimate of the magnitude and location. The truemagnitude for the western Nevada event may be less thanthat predicted by the California-based algorithm, owing tothe lower attenuation in the Basin and Range province(W. Bakun, personal comm., 2001). The solution is shownin Figure 5.
Note that several points where the earthquake is re-ported to have been unfelt are indicated on Figure 5. Thesepoints are shown merely for reference; we did not utilizethem in solving for the best-fit magnitude or location, as thealgorithm was not designed to consider such points. Instead,we will use the “not felt” points to visually constrain thelocation; we discard the intensity center in preference for alocation more central to the stronger intensities (Fig. 5). Ourpreferred source location is near a north-northeast-trending,east-dipping normal fault northeast of Fernley, Nevada (seedePolo et al. [1997]). Another fault in the vicinity is thePyramid Lake fault, which runs immediately west of Fernley(again, see dePolo et al. [1997]). If the method used is ap-plicable for the Basin and Range province, the magnitudefor this earthquake is MI 4.9 (�0.6/�0.5) (five observationsat 95% confidence; see Table 1).
19–20 April 1906 Azusa, California,Triggered Event(s)
As mentioned earlier, we located a diary kept by Mr.Robert B. Waterman, which mentions that an earthquakewas felt at 20:50 on 19 April 1906. At the time, Mr. Water-man was camping several miles north of Azusa. (See table2 in Meltzner and Wald [2002] for the original report andfor a discussion on Mr. Waterman’s exact location.) As wespeculated, this may be a misdated account of one of the 18April events in the Pomona Valley, although, of course, itcould also be a separate event on 19 April. In addition, thediary lists an event at 00:30 on the morning of 20 April 1906(again, see table 2 in Meltzner and Wald [2002] for the origi-nal report). This event was not reported anywhere else, so itis presumed to be small, possibly M �3. The 20 April event,and the 19 April event if indeed Mr. Waterman’s report wascorrectly dated, may have been related to the 18 April eventsin the Pomona Valley.
Later Significant Aftershocks(Through December 1907)
After the first 48 hr, triggered activity beyond the after-shock zone died off, although a few small events continuedto be felt in some of the areas that had experienced triggeredevents during the first two days (see table 2 in Meltzner andWald [2002]); these are probably aftershocks of the initialtriggered events. Within the aftershock zone, the largestevents took place near the ends of the 1906 rupture; re-markably few significant aftershocks occurred along themainshock rupture itself. One of the largest aftershocks ofthe sequence occurred on 23 April 1906, off the HumboldtCounty coast, north of the mainshock rupture. It was the firstnoteworthy (M �5.5) aftershock or triggered event to occursince those of 18 and 19 April.
23 April 1906 North-Coast Aftershock
An earthquake was felt over a widespread area of north-ern California and southern Oregon shortly after 01:00 onthe morning of 23 April 1906, 5 days after the mainshock.The strongest shaking occurred along the Humboldt Countycoast, where the intensity was uniformly MMI V; it was feltas far east as the Sierran foothills, where MMI III effectswere reported. The intensities and locations where the earth-quake was felt are listed in Table 6, and the intensity distri-bution is shown in Figure 6; for the original reports, seetables 1 and 9 in Meltzner and Wald (2002).
Figure 6 also shows the solution of the algorithm. Theintensity center is in western Trinity County, about 75 kmnortheast of the SAF, and the magnitude at that point is MI
6.0. Several concerns, however, bring the validity of the so-lution into question. First, the region around the intensitycenter lacks earthquakes of M 5 or greater in historical times.(Specifically, no earthquakes of M �5 have occurred any-where within the 80% confidence-level contour indicated in
2172 A. J. Meltzner and D. J. Wald
Fig. 6 since at least 1900, according to the catalog of theCouncil of the National Seismic System.) Second, if thesource location had been in western Trinity County, the in-tensity distribution would be strongly asymmetrical: inten-sities were uniformly MMI V to the west of the hypotheticalsource location, whereas they were uniformly MMI IV at anearly equal distance to the east. Third, the only part of theSAF within the 95% confidence contour is that portion in theimmediate vicinity of Shelter Cove, and even that locationis improbable, as the intensities in Mendocino County ap-pear to have been too low. (At Point Arena, the intensitywas MMI III; in Ukiah and in Mendocino, the event was notmentioned in the local weekly newspapers, suggesting thatthe earthquake was not felt strongly enough in those townsto be newsworthy.) And fourth, in a study of many north-coast California earthquakes, Bakun (2000) observed that amaximum intensity of MMI V or VI is generally indicativeof either an M 5 earthquake onshore or near the coast, or anM 6 or 7 event located 100 km or farther offshore; an M 6onshore would be expected to generate intensities of MMIVII or higher.
As mentioned earlier, the method of Bakun and Went-worth (1997) is useful for most onshore and near-coast off-shore events, but Bakun (2000) established that the confi-dence contours for location generally fail to usefullyconstrain the source regions for earthquakes located morethan a few tens of kilometers offshore. The inherent diffi-culty lies in ascertaining whether the solution is valid—thatis, whether the confidence contours usefully constrain thesource regions—for any particular event (with an unknownlocation). In the case of the 23 April 1906 aftershock, theconcerns and inconsistencies noted earlier lead us to suspectthat the location is not reliably constrained by the confidencecontours. Bakun (2000) suggested that, for events with max-imum MMI V or VI, an M 6 or 7 earthquake located 100 kmor farther offshore can be distinguished from an M 5 eventonshore or near the coast by MMI IV and V at sites hundredsof kilometers from the site of maximum reported intensity.In the case of an onshore or near-shore M 5 earthquake, onewould expect a small area of MMI V–VI near the epicenter,with the earthquake being felt over a comparatively smallarea; in the case of an M 6 or 7 event far offshore, the areaover which MMI V–VI effects were reported would beroughly similar, but one would expect the total felt area tobe much broader. To that end, we will now compare theintensity distribution from the 23 April 1906 event withthose of modern events of known source parameters.
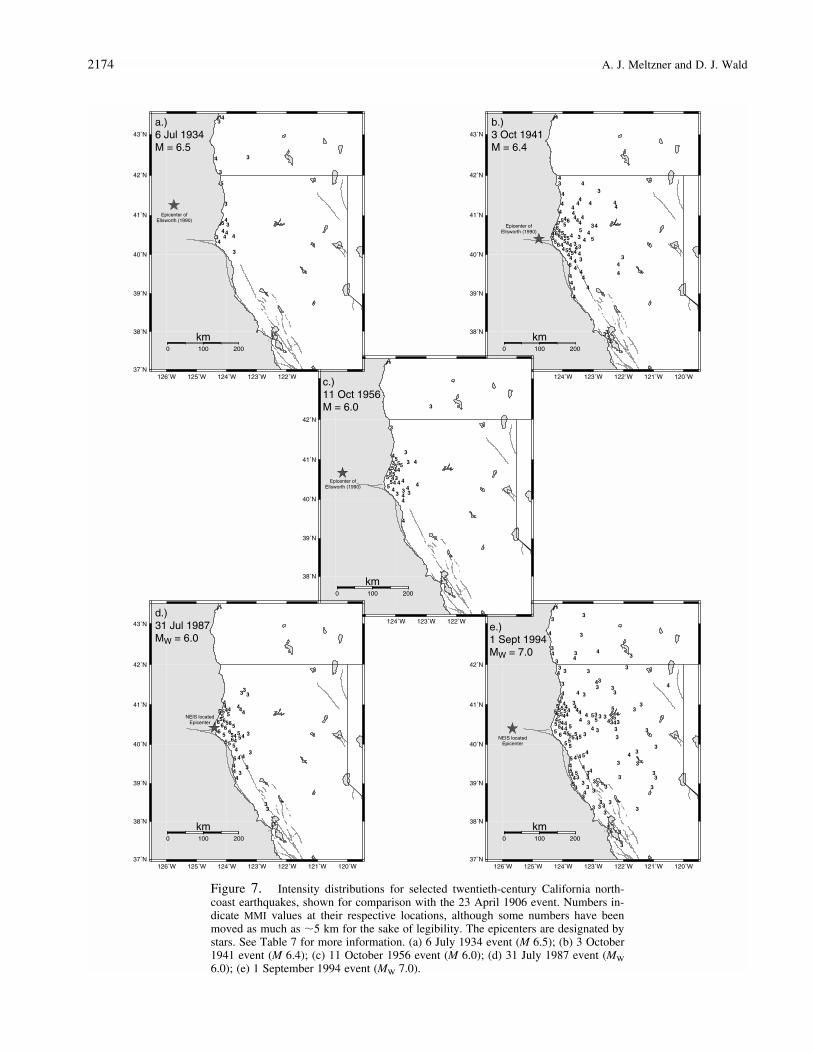
Intensity data for nineteenth- and twentieth-centurynorth-coast events have been compiled by Bakun (1999b);locations and magnitudes for those events were tabulated inBakun (2000). Of the events considered by Bakun (1999b,2000), we have selected five for comparison here, and theirsource parameters are listed in Table 7. Both the 1941 (Fig.7b) and 1987 (Fig. 7d) events were near-shore events; ineach event, MMI VI� was felt over a small to moderately-sized area, but neither event was felt as far north or as far
inland as was the 23 April 1906 event. Comparison of the23 April 1906 event with the 1987 and 1941 events suggeststhat the 1906 event was farther offshore and larger in mag-nitude than these events; the 1906 event may also have beenfarther north. The 1934 (Fig. 7a), 1956 (Fig. 7c), and 1994(Fig. 7e) events were all 100 km or more offshore. The 1934and 1956 events had a maximum reported intensity ofMMI V and were felt over a coastal region similar to thatover which the 23 April 1906 event was felt, but in generalthey were not felt as strongly or as far inland as was the1906 event; the 1906 event may have been slightly largerthan the 1934 and 1956 events. The 1906 event also appearsto have been farther south than the 1934 event.
Of the five nineteenth- and twentieth-century north-coast events considered, the 1 September 1994 event’s in-tensity distribution is the most similar to that of the 23 April1906 event. For the 1994 event, there was a single locationwith MMI VI; otherwise, the largest reported intensity wasMMI V. The 1994 event was reported felt slightly farthernorth, slightly farther south, and slightly farther inland, butit is not clear whether, at 1 o’clock in the morning and inthe days following the 1906 mainshock, shaking of MMI IIIwould be reported in the San Francisco Bay area (SFBA) orin small communities in Oregon or northeastern California.A comparison of the 23 April 1906 event with the 1994event suggests that the 1906 event was slightly smaller. Asan aside, Bakun (2000) performed an analysis (using themethod of Bakun and Wentworth [1997]) of the 1994 north-coast event; for that event, the epicenter was outside the95% confidence-level contour. If the source locations of the23 April 1906 and 1 September 1994 events are near oneanother, as is suggested, it should not be surprising that theconfidence-level contours also fail to constrain the 23 April1906 location.
Based on the comparisons discussed earlier and on thesuggestions of Bakun (2000), we tentatively estimate themagnitude to be between M 6.5 and 7, and we estimate thelocation to be between longitudes 125.7� and 125.0� W andbetween latitudes 40.7� and 41.05� N. The region (or box)so constrained (Fig. 6) should not be construed to carry anyformal level of confidence (the level of confidence cannotbe determined in any meaningful fashion); rather, the box ismerely the locus of our preferred locations.
It is also helpful to compare our results with those ofother investigations. Abe (1988) used amplitude data fromMilne instruments to estimate a surface wave magnitude forthis event of MS � 6.4; he did this assuming the location ofToppozada et al. (1978), 41� N, 124� W. Although the lo-cation estimated by Toppozada et al. (1978) and used byAbe (1988) is grossly imprecise, the magnitude Abe (1988)determined would not be very sensitive to a small change inlocation: had Abe instead assumed an epicenter of 41.0� N,125.7� W, his magnitude would not have been higher thanMS 6.5. Note that Toppozada et al. (2000) and Toppozadaand Branum (2002) moved the event farther west, to 41.0� N,124.5� W. In light of Abe’s (1988) results, we will use his
Aftershocks and Triggered Events of the Great 1906 California Earthquake 2173
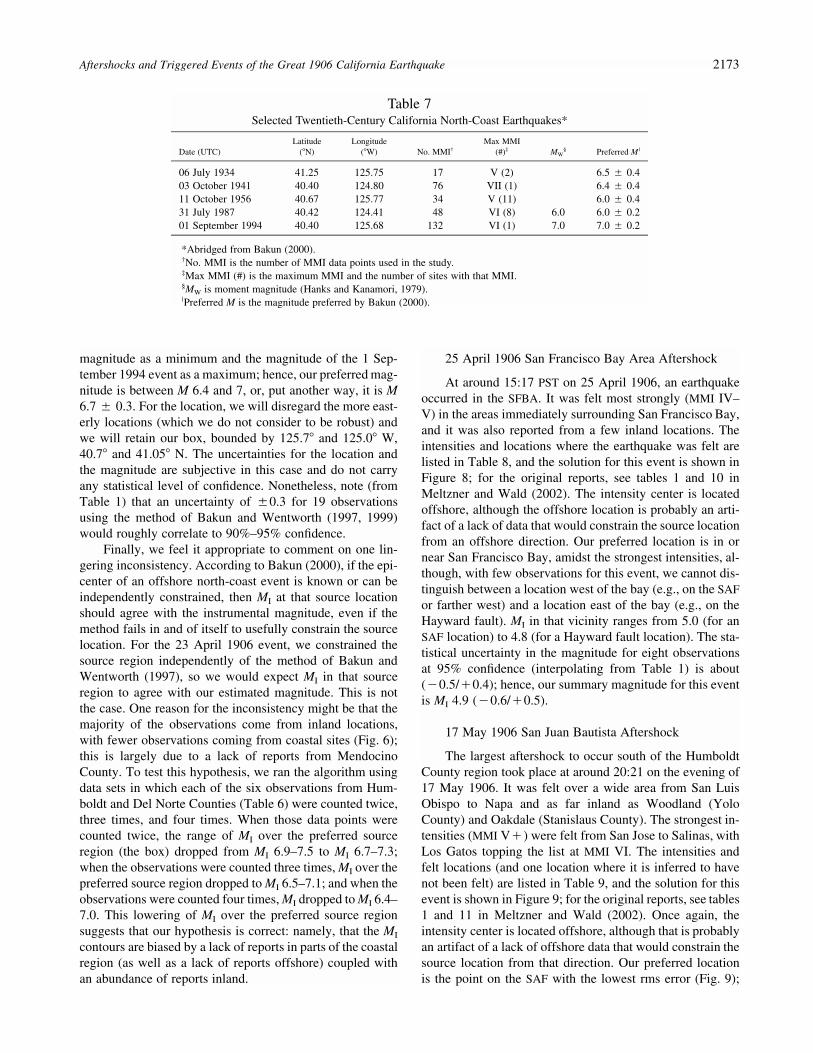
Table 7Selected Twentieth-Century California North-Coast Earthquakes*
Date (UTC)Latitude
(�N)Longitude
(�W) No. MMI†Max MMI
(#)‡ MW§ Preferred M |
06 July 1934 41.25 125.75 17 V (2) 6.5 � 0.403 October 1941 40.40 124.80 76 VII (1) 6.4 � 0.411 October 1956 40.67 125.77 34 V (11) 6.0 � 0.431 July 1987 40.42 124.41 48 VI (8) 6.0 6.0 � 0.201 September 1994 40.40 125.68 132 VI (1) 7.0 7.0 � 0.2
*Abridged from Bakun (2000).†No. MMI is the number of MMI data points used in the study.‡Max MMI (#) is the maximum MMI and the number of sites with that MMI.§MW is moment magnitude (Hanks and Kanamori, 1979).|Preferred M is the magnitude preferred by Bakun (2000).
magnitude as a minimum and the magnitude of the 1 Sep-tember 1994 event as a maximum; hence, our preferred mag-nitude is between M 6.4 and 7, or, put another way, it is M6.7 � 0.3. For the location, we will disregard the more east-erly locations (which we do not consider to be robust) andwe will retain our box, bounded by 125.7� and 125.0� W,40.7� and 41.05� N. The uncertainties for the location andthe magnitude are subjective in this case and do not carryany statistical level of confidence. Nonetheless, note (fromTable 1) that an uncertainty of �0.3 for 19 observationsusing the method of Bakun and Wentworth (1997, 1999)would roughly correlate to 90%–95% confidence.
Finally, we feel it appropriate to comment on one lin-gering inconsistency. According to Bakun (2000), if the epi-center of an offshore north-coast event is known or can beindependently constrained, then MI at that source locationshould agree with the instrumental magnitude, even if themethod fails in and of itself to usefully constrain the sourcelocation. For the 23 April 1906 event, we constrained thesource region independently of the method of Bakun andWentworth (1997), so we would expect MI in that sourceregion to agree with our estimated magnitude. This is notthe case. One reason for the inconsistency might be that themajority of the observations come from inland locations,with fewer observations coming from coastal sites (Fig. 6);this is largely due to a lack of reports from MendocinoCounty. To test this hypothesis, we ran the algorithm usingdata sets in which each of the six observations from Hum-boldt and Del Norte Counties (Table 6) were counted twice,three times, and four times. When those data points werecounted twice, the range of MI over the preferred sourceregion (the box) dropped from MI 6.9–7.5 to MI 6.7–7.3;when the observations were counted three times, MI over thepreferred source region dropped to MI 6.5–7.1; and when theobservations were counted four times, MI dropped to MI 6.4–7.0. This lowering of MI over the preferred source regionsuggests that our hypothesis is correct: namely, that the MI
contours are biased by a lack of reports in parts of the coastalregion (as well as a lack of reports offshore) coupled withan abundance of reports inland.
25 April 1906 San Francisco Bay Area Aftershock
At around 15:17 PST on 25 April 1906, an earthquakeoccurred in the SFBA. It was felt most strongly (MMI IV–V) in the areas immediately surrounding San Francisco Bay,and it was also reported from a few inland locations. Theintensities and locations where the earthquake was felt arelisted in Table 8, and the solution for this event is shown inFigure 8; for the original reports, see tables 1 and 10 inMeltzner and Wald (2002). The intensity center is locatedoffshore, although the offshore location is probably an arti-fact of a lack of data that would constrain the source locationfrom an offshore direction. Our preferred location is in ornear San Francisco Bay, amidst the strongest intensities, al-though, with few observations for this event, we cannot dis-tinguish between a location west of the bay (e.g., on the SAFor farther west) and a location east of the bay (e.g., on theHayward fault). MI in that vicinity ranges from 5.0 (for anSAF location) to 4.8 (for a Hayward fault location). The sta-tistical uncertainty in the magnitude for eight observationsat 95% confidence (interpolating from Table 1) is about(�0.5/�0.4); hence, our summary magnitude for this eventis MI 4.9 (�0.6/�0.5).
17 May 1906 San Juan Bautista Aftershock
The largest aftershock to occur south of the HumboldtCounty region took place at around 20:21 on the evening of17 May 1906. It was felt over a wide area from San LuisObispo to Napa and as far inland as Woodland (YoloCounty) and Oakdale (Stanislaus County). The strongest in-tensities (MMI V�) were felt from San Jose to Salinas, withLos Gatos topping the list at MMI VI. The intensities andfelt locations (and one location where it is inferred to havenot been felt) are listed in Table 9, and the solution for thisevent is shown in Figure 9; for the original reports, see tables1 and 11 in Meltzner and Wald (2002). Once again, theintensity center is located offshore, although that is probablyan artifact of a lack of offshore data that would constrain thesource location from that direction. Our preferred locationis the point on the SAF with the lowest rms error (Fig. 9);
2174 A. J. Meltzner and D. J. Wald
126˚W 125˚W 124˚W 123˚W 122˚W 121˚W 120˚W37˚N
38˚N
39˚N
40˚N
41˚N
42˚N
0 100 200
km
3
3
3
3
3
3
3
3
3
3
3
3
3
3
3
3
3
3
3
3
3
3
3
3
3
3
3
3
3
3
3
3
33
3
3
3
3
3
3
3
3
3
3
3
3
3 3
33
3
3
3
3
3
3
3
3
3
3
3
4
4
4
4
44
4
4
4
4
44
4
4
4
4
4
4
4444
4
4
4
4 44
4
4
4
4
4
44
4
4
4
4
4
455
55
5
5
55
555
5
55
5
55
5
555
5
5
5
5
5
5
556
e.)1 Sept 1994MW = 7.0
NEIS locatedEpicenter
124˚W 123˚W 122˚W 121˚W 120˚W
38˚N
39˚N
40˚N
41˚N
42˚N
43˚N
0 100 200
km
7
66
6
66
6
6
5
55
555
5
55
55
5 5
4
4
4
4
4
4
4
4
4
4
4
4
4
4
4
44
4
4
4
4
4
4
4
4
44
4
4
4
4
4
4
4
4
4
4
4
4
4
4
4
4
4
4
3
33
3
3
3
3
3
3
3
b.)3 Oct 1941M = 6.4
Epicenter ofEllsworth (1990)
124˚W 123˚W 122˚W
38˚N
39˚N
40˚N
41˚N
42˚N
0 100 200
km
555
5
555
5
5
554
44
4
4
4
4
4
44
4
4
4
4
3
3
3
3
3
3
3
3
3
c.)11 Oct 1956M = 6.0
Epicenter ofEllsworth (1990)
126˚W 125˚W 124˚W 123˚W 122˚W 121˚W 120˚W37˚N
38˚N
39˚N
40˚N
41˚N
42˚N
43˚N
0 100 200
km
66 6
66
666
55
5
55
5
5
55
5
5
5
5
5
5
44
4
4
4
4
4
44
4
4
4
44
4
4
3
3
33
3
3
3
3
3
d.)31 Jul 1987MW = 6.0
NEIS locatedEpicenter
126˚W 125˚W 124˚W 123˚W 122˚W37˚N
38˚N
39˚N
40˚N
41˚N
42˚N
43˚N
0 100 200
km
5
54
444
4
4
44
3
3
3
3
3
3
3
a.)6 Jul 1934M = 6.5
Epicenter ofEllsworth (1990)
Figure 7. Intensity distributions for selected twentieth-century California north-coast earthquakes, shown for comparison with the 23 April 1906 event. Numbers in-dicate MMI values at their respective locations, although some numbers have beenmoved as much as �5 km for the sake of legibility. The epicenters are designated bystars. See Table 7 for more information. (a) 6 July 1934 event (M 6.5); (b) 3 October1941 event (M 6.4); (c) 11 October 1956 event (M 6.0); (d) 31 July 1987 event (MW
6.0); (e) 1 September 1994 event (MW 7.0).
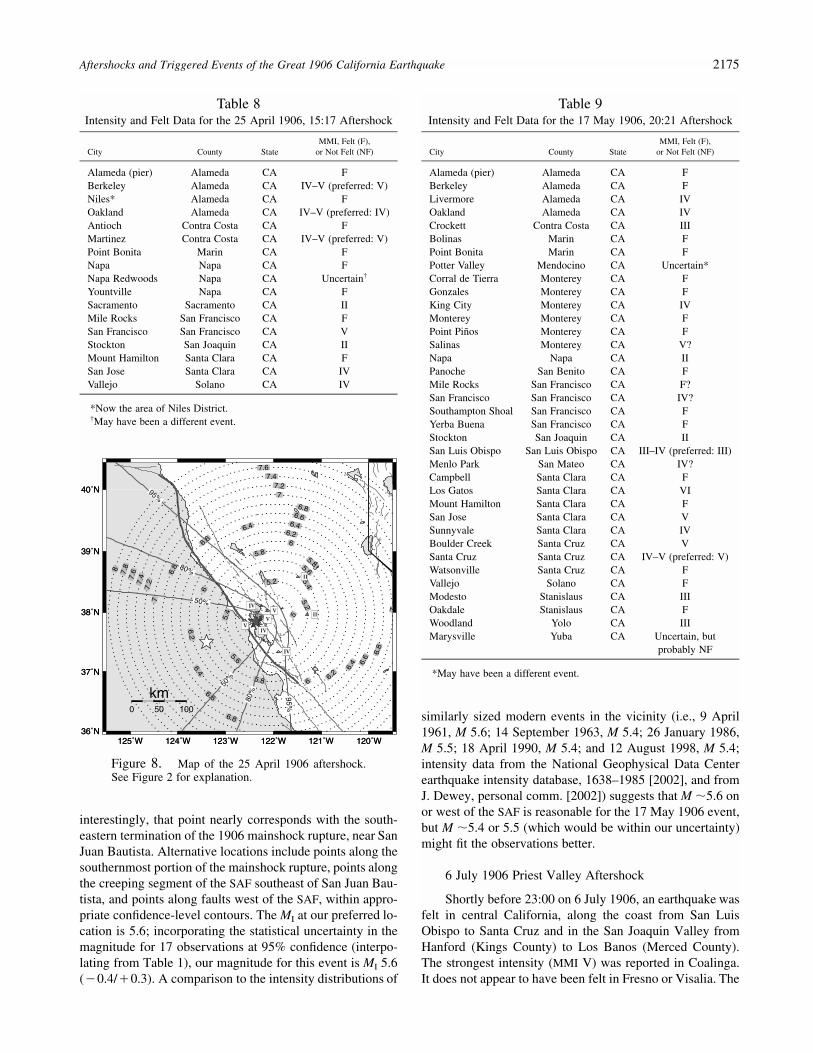
Aftershocks and Triggered Events of the Great 1906 California Earthquake 2175
Table 8Intensity and Felt Data for the 25 April 1906, 15:17 Aftershock
City County StateMMI, Felt (F),
or Not Felt (NF)
Alameda (pier) Alameda CA FBerkeley Alameda CA IV–V (preferred: V)Niles* Alameda CA FOakland Alameda CA IV–V (preferred: IV)Antioch Contra Costa CA FMartinez Contra Costa CA IV–V (preferred: V)Point Bonita Marin CA FNapa Napa CA FNapa Redwoods Napa CA Uncertain†
Yountville Napa CA FSacramento Sacramento CA IIMile Rocks San Francisco CA FSan Francisco San Francisco CA VStockton San Joaquin CA IIMount Hamilton Santa Clara CA FSan Jose Santa Clara CA IVVallejo Solano CA IV
*Now the area of Niles District.†May have been a different event.
125˚W 124˚W 123˚W 122˚W 121˚W 120˚W36˚N
37˚N
38˚N
39˚N
40˚N
4.8 5
5.2
5.2 5.4
5.4
5.6
5.6
5.8
5.8
5.86
6
6
6.2
6.2
6.2
6.4
6.46.4
6.4
6.6
6.6
6.6
6.6
6.8
6.8
6.8
6.8
7
7
7
7.2
7.2
7.4
7.4
7.6
7.6
7.88
50%
50%
80%
80%
95%
95%
125˚W 124˚W 123˚W 122˚W 121˚W 120˚W36˚N
37˚N
38˚N
39˚N
40˚N
0 50 100
km
II
II
IV
IV
IV
V
V
V
Figure 8. Map of the 25 April 1906 aftershock.See Figure 2 for explanation.
Table 9Intensity and Felt Data for the 17 May 1906, 20:21 Aftershock
City County StateMMI, Felt (F),
or Not Felt (NF)
Alameda (pier) Alameda CA FBerkeley Alameda CA FLivermore Alameda CA IVOakland Alameda CA IVCrockett Contra Costa CA IIIBolinas Marin CA FPoint Bonita Marin CA FPotter Valley Mendocino CA Uncertain*Corral de Tierra Monterey CA FGonzales Monterey CA FKing City Monterey CA IVMonterey Monterey CA FPoint Pinos Monterey CA FSalinas Monterey CA V?Napa Napa CA IIPanoche San Benito CA FMile Rocks San Francisco CA F?San Francisco San Francisco CA IV?Southampton Shoal San Francisco CA FYerba Buena San Francisco CA FStockton San Joaquin CA IISan Luis Obispo San Luis Obispo CA III–IV (preferred: III)Menlo Park San Mateo CA IV?Campbell Santa Clara CA FLos Gatos Santa Clara CA VIMount Hamilton Santa Clara CA FSan Jose Santa Clara CA VSunnyvale Santa Clara CA IVBoulder Creek Santa Cruz CA VSanta Cruz Santa Cruz CA IV–V (preferred: V)Watsonville Santa Cruz CA FVallejo Solano CA FModesto Stanislaus CA IIIOakdale Stanislaus CA FWoodland Yolo CA IIIMarysville Yuba CA Uncertain, but
probably NF
*May have been a different event.
interestingly, that point nearly corresponds with the south-eastern termination of the 1906 mainshock rupture, near SanJuan Bautista. Alternative locations include points along thesouthernmost portion of the mainshock rupture, points alongthe creeping segment of the SAF southeast of San Juan Bau-tista, and points along faults west of the SAF, within appro-priate confidence-level contours. The MI at our preferred lo-cation is 5.6; incorporating the statistical uncertainty in themagnitude for 17 observations at 95% confidence (interpo-lating from Table 1), our magnitude for this event is MI 5.6(�0.4/�0.3). A comparison to the intensity distributions of
similarly sized modern events in the vicinity (i.e., 9 April1961, M 5.6; 14 September 1963, M 5.4; 26 January 1986,M 5.5; 18 April 1990, M 5.4; and 12 August 1998, M 5.4;intensity data from the National Geophysical Data Centerearthquake intensity database, 1638–1985 [2002], and fromJ. Dewey, personal comm. [2002]) suggests that M �5.6 onor west of the SAF is reasonable for the 17 May 1906 event,but M �5.4 or 5.5 (which would be within our uncertainty)might fit the observations better.
6 July 1906 Priest Valley Aftershock
Shortly before 23:00 on 6 July 1906, an earthquake wasfelt in central California, along the coast from San LuisObispo to Santa Cruz and in the San Joaquin Valley fromHanford (Kings County) to Los Banos (Merced County).The strongest intensity (MMI V) was reported in Coalinga.It does not appear to have been felt in Fresno or Visalia. The
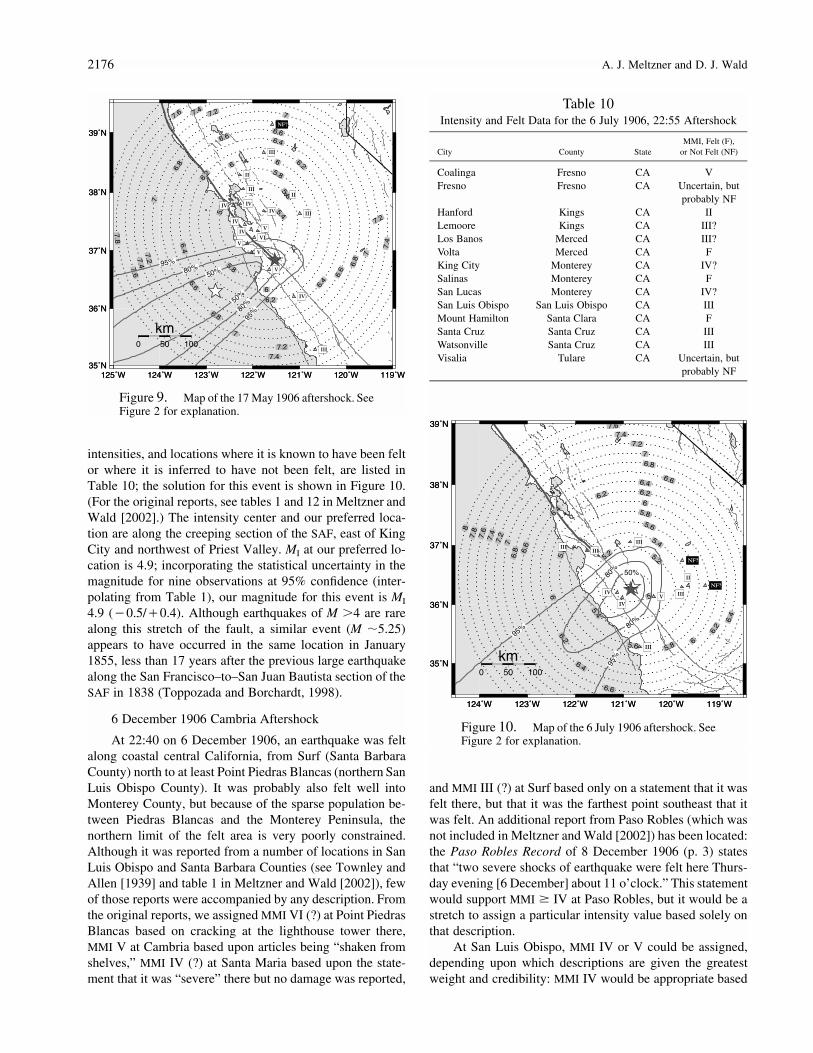
2176 A. J. Meltzner and D. J. Wald
125˚W 124˚W 123˚W 122˚W 121˚W 120˚W 119˚W35˚N
36˚N
37˚N
38˚N
39˚N
5.45.6
5.6
5.8
5.8
6
6
66.2
6.2
6.2
6.4
6.4
6.4
6.6
6.6
6.6
6.6
6.8
6.8
6.8
6.8
7
7
7
7
7.2
7.2
7.2
7.2
7.4
7.4
7.4
7.4
7.6
7.6
7.8
50%
50%
80%
80%
95%
95%
125˚W 124˚W 123˚W 122˚W 121˚W 120˚W 119˚W35˚N
36˚N
37˚N
38˚N
39˚N
0 50 100
km
VI
V
V
V
V
IVIV
IV
IV
IV
IV
III
III
III
III
II
II
NF?
Figure 9. Map of the 17 May 1906 aftershock. SeeFigure 2 for explanation.
Table 10Intensity and Felt Data for the 6 July 1906, 22:55 Aftershock
City County StateMMI, Felt (F),
or Not Felt (NF)
Coalinga Fresno CA VFresno Fresno CA Uncertain, but
probably NFHanford Kings CA IILemoore Kings CA III?Los Banos Merced CA III?Volta Merced CA FKing City Monterey CA IV?Salinas Monterey CA FSan Lucas Monterey CA IV?San Luis Obispo San Luis Obispo CA IIIMount Hamilton Santa Clara CA FSanta Cruz Santa Cruz CA IIIWatsonville Santa Cruz CA IIIVisalia Tulare CA Uncertain, but
probably NF
124˚W 123˚W 122˚W 121˚W 120˚W 119˚W
35˚N
36˚N
37˚N
38˚N
39˚N
5
5.25.2
5.4
5.4
5.6
5.6
5.8
5.8
5.8
6
6
6
6.2
6.2
6.2
6.2
6.4
6.4
6.4
6.4
6.6
6.6
6.6
6.8
6.8
7
7
7.2
7.2
7.4
7.4
7.6
7.6
7.88
50%80%
80%
95%
95%
124˚W 123˚W 122˚W 121˚W 120˚W 119˚W
35˚N
36˚N
37˚N
38˚N
39˚N
0 50 100
km
VIV
IV
III
III
III
IIIIII
II
NF?
NF?
Figure 10. Map of the 6 July 1906 aftershock. SeeFigure 2 for explanation.
intensities, and locations where it is known to have been feltor where it is inferred to have not been felt, are listed inTable 10; the solution for this event is shown in Figure 10.(For the original reports, see tables 1 and 12 in Meltzner andWald [2002].) The intensity center and our preferred loca-tion are along the creeping section of the SAF, east of KingCity and northwest of Priest Valley. MI at our preferred lo-cation is 4.9; incorporating the statistical uncertainty in themagnitude for nine observations at 95% confidence (inter-polating from Table 1), our magnitude for this event is MI
4.9 (�0.5/�0.4). Although earthquakes of M �4 are rarealong this stretch of the fault, a similar event (M �5.25)appears to have occurred in the same location in January1855, less than 17 years after the previous large earthquakealong the San Francisco–to–San Juan Bautista section of theSAF in 1838 (Toppozada and Borchardt, 1998).
6 December 1906 Cambria Aftershock
At 22:40 on 6 December 1906, an earthquake was feltalong coastal central California, from Surf (Santa BarbaraCounty) north to at least Point Piedras Blancas (northern SanLuis Obispo County). It was probably also felt well intoMonterey County, but because of the sparse population be-tween Piedras Blancas and the Monterey Peninsula, thenorthern limit of the felt area is very poorly constrained.Although it was reported from a number of locations in SanLuis Obispo and Santa Barbara Counties (see Townley andAllen [1939] and table 1 in Meltzner and Wald [2002]), fewof those reports were accompanied by any description. Fromthe original reports, we assigned MMI VI (?) at Point PiedrasBlancas based on cracking at the lighthouse tower there,MMI V at Cambria based upon articles being “shaken fromshelves,” MMI IV (?) at Santa Maria based upon the state-ment that it was “severe” there but no damage was reported,
and MMI III (?) at Surf based only on a statement that it wasfelt there, but that it was the farthest point southeast that itwas felt. An additional report from Paso Robles (which wasnot included in Meltzner and Wald [2002]) has been located:the Paso Robles Record of 8 December 1906 (p. 3) statesthat “two severe shocks of earthquake were felt here Thurs-day evening [6 December] about 11 o’clock.” This statementwould support MMI � IV at Paso Robles, but it would be astretch to assign a particular intensity value based solely onthat description.
At San Luis Obispo, MMI IV or V could be assigned,depending upon which descriptions are given the greatestweight and credibility: MMI IV would be appropriate based
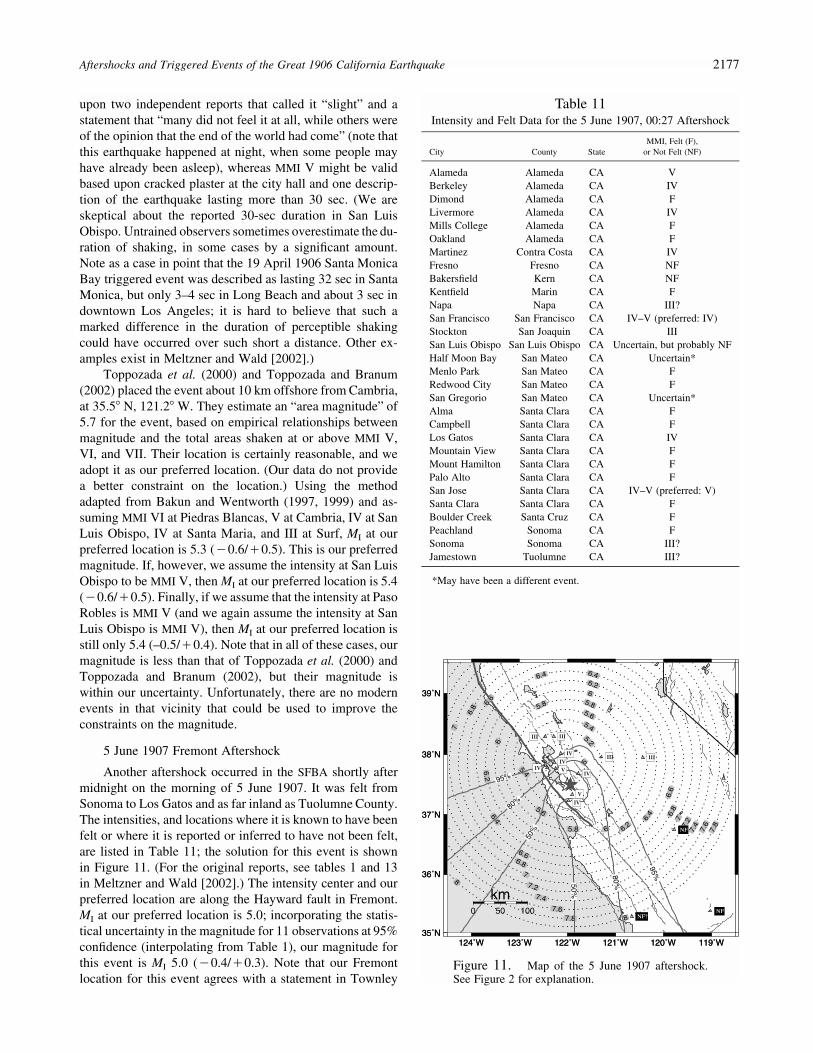
Aftershocks and Triggered Events of the Great 1906 California Earthquake 2177
Table 11Intensity and Felt Data for the 5 June 1907, 00:27 Aftershock
City County StateMMI, Felt (F),
or Not Felt (NF)
Alameda Alameda CA VBerkeley Alameda CA IVDimond Alameda CA FLivermore Alameda CA IVMills College Alameda CA FOakland Alameda CA FMartinez Contra Costa CA IVFresno Fresno CA NFBakersfield Kern CA NFKentfield Marin CA FNapa Napa CA III?San Francisco San Francisco CA IV–V (preferred: IV)Stockton San Joaquin CA IIISan Luis Obispo San Luis Obispo CA Uncertain, but probably NFHalf Moon Bay San Mateo CA Uncertain*Menlo Park San Mateo CA FRedwood City San Mateo CA FSan Gregorio San Mateo CA Uncertain*Alma Santa Clara CA FCampbell Santa Clara CA FLos Gatos Santa Clara CA IVMountain View Santa Clara CA FMount Hamilton Santa Clara CA FPalo Alto Santa Clara CA FSan Jose Santa Clara CA IV–V (preferred: V)Santa Clara Santa Clara CA FBoulder Creek Santa Cruz CA FPeachland Sonoma CA FSonoma Sonoma CA III?Jamestown Tuolumne CA III?
*May have been a different event.
124˚W 123˚W 122˚W 121˚W 120˚W 119˚W35˚N
36˚N
37˚N
38˚N
39˚N
5
5.2
5.4
5.4
5.6
5.6
5.8
5.8
5.8
6
6
6
6.2
6.2
6.2
6.4
6.46.4
6.46.
6
6.6
6.6
6.8
6.8
6.8
7
7
7
7.2
7.2
7.4
7.4
7.6
7.6
7.8
7.8 8
8
50%
50%
80%
80%
95%
95%
124˚W 123˚W 122˚W 121˚W 120˚W 119˚W35˚N
36˚N
37˚N
38˚N
39˚N
0 50 100
km
VIV
V
IV
IV
IV
IV
III
III
III
III
NF
NFNF?
Figure 11. Map of the 5 June 1907 aftershock.See Figure 2 for explanation.
upon two independent reports that called it “slight” and astatement that “many did not feel it at all, while others wereof the opinion that the end of the world had come” (note thatthis earthquake happened at night, when some people mayhave already been asleep), whereas MMI V might be validbased upon cracked plaster at the city hall and one descrip-tion of the earthquake lasting more than 30 sec. (We areskeptical about the reported 30-sec duration in San LuisObispo. Untrained observers sometimes overestimate the du-ration of shaking, in some cases by a significant amount.Note as a case in point that the 19 April 1906 Santa MonicaBay triggered event was described as lasting 32 sec in SantaMonica, but only 3–4 sec in Long Beach and about 3 sec indowntown Los Angeles; it is hard to believe that such amarked difference in the duration of perceptible shakingcould have occurred over such short a distance. Other ex-amples exist in Meltzner and Wald [2002].)
Toppozada et al. (2000) and Toppozada and Branum(2002) placed the event about 10 km offshore from Cambria,at 35.5� N, 121.2� W. They estimate an “area magnitude” of5.7 for the event, based on empirical relationships betweenmagnitude and the total areas shaken at or above MMI V,VI, and VII. Their location is certainly reasonable, and weadopt it as our preferred location. (Our data do not providea better constraint on the location.) Using the methodadapted from Bakun and Wentworth (1997, 1999) and as-suming MMI VI at Piedras Blancas, V at Cambria, IV at SanLuis Obispo, IV at Santa Maria, and III at Surf, MI at ourpreferred location is 5.3 (�0.6/�0.5). This is our preferredmagnitude. If, however, we assume the intensity at San LuisObispo to be MMI V, then MI at our preferred location is 5.4(�0.6/�0.5). Finally, if we assume that the intensity at PasoRobles is MMI V (and we again assume the intensity at SanLuis Obispo is MMI V), then MI at our preferred location isstill only 5.4 (–0.5/�0.4). Note that in all of these cases, ourmagnitude is less than that of Toppozada et al. (2000) andToppozada and Branum (2002), but their magnitude iswithin our uncertainty. Unfortunately, there are no modernevents in that vicinity that could be used to improve theconstraints on the magnitude.
5 June 1907 Fremont Aftershock
Another aftershock occurred in the SFBA shortly aftermidnight on the morning of 5 June 1907. It was felt fromSonoma to Los Gatos and as far inland as Tuolumne County.The intensities, and locations where it is known to have beenfelt or where it is reported or inferred to have not been felt,are listed in Table 11; the solution for this event is shownin Figure 11. (For the original reports, see tables 1 and 13in Meltzner and Wald [2002].) The intensity center and ourpreferred location are along the Hayward fault in Fremont.MI at our preferred location is 5.0; incorporating the statis-tical uncertainty in the magnitude for 11 observations at 95%confidence (interpolating from Table 1), our magnitude forthis event is MI 5.0 (�0.4/�0.3). Note that our Fremontlocation for this event agrees with a statement in Townley
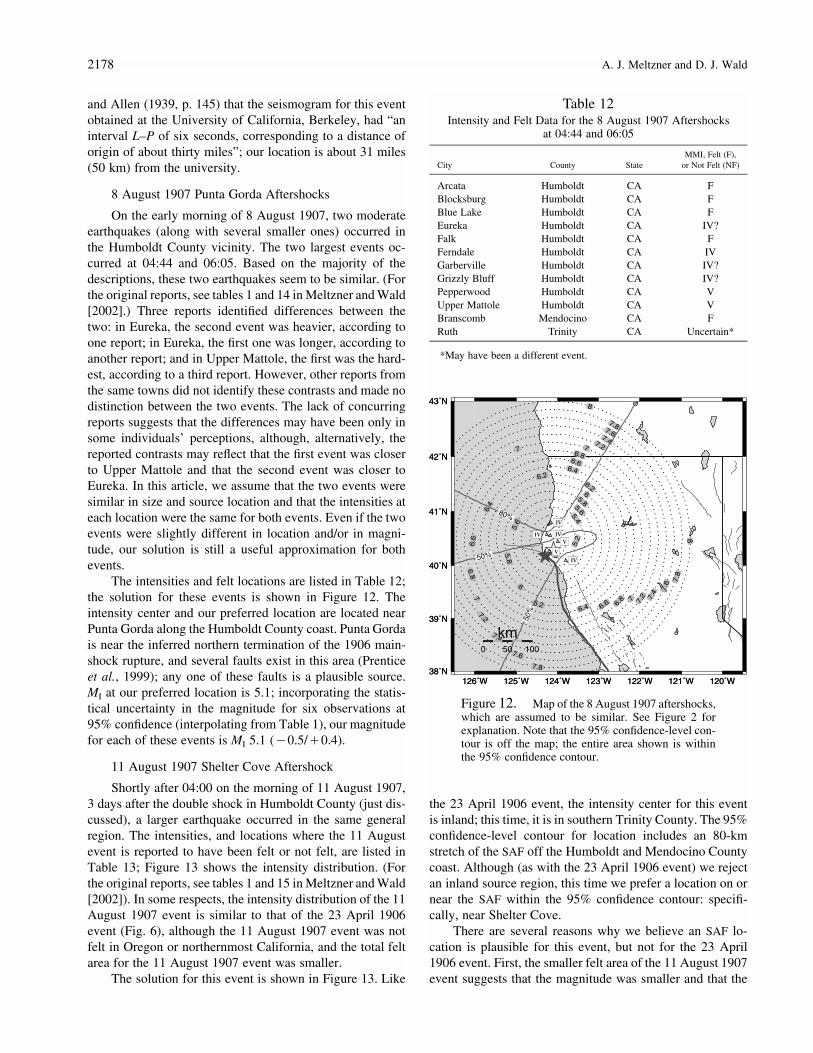
2178 A. J. Meltzner and D. J. Wald
Table 12Intensity and Felt Data for the 8 August 1907 Aftershocks
at 04:44 and 06:05
City County StateMMI, Felt (F),
or Not Felt (NF)
Arcata Humboldt CA FBlocksburg Humboldt CA FBlue Lake Humboldt CA FEureka Humboldt CA IV?Falk Humboldt CA FFerndale Humboldt CA IVGarberville Humboldt CA IV?Grizzly Bluff Humboldt CA IV?Pepperwood Humboldt CA VUpper Mattole Humboldt CA VBranscomb Mendocino CA FRuth Trinity CA Uncertain*
*May have been a different event.
126˚W 125˚W 124˚W 123˚W 122˚W 121˚W 120˚W38˚N
39˚N
40˚N
41˚N
42˚N
43˚N
5
5.2
5.45.6
5.6
5.8
5.8
6
6
6.2
6.2
6.26.4
6.4
6.4
6.6
6.6
6.6
6.8
6.8
6.8
7
77
77.2
7.2
7.2
7.4
7.4
7.4
7.6
7.6
7.6
7.8
7.8
7.8
8
8
50%
50%
80%
126˚W 125˚W 124˚W 123˚W 122˚W 121˚W 120˚W38˚N
39˚N
40˚N
41˚N
42˚N
43˚N
0 50 100
km
IV
IV
IV
IVV
V
Figure 12. Map of the 8 August 1907 aftershocks,which are assumed to be similar. See Figure 2 forexplanation. Note that the 95% confidence-level con-tour is off the map; the entire area shown is withinthe 95% confidence contour.
and Allen (1939, p. 145) that the seismogram for this eventobtained at the University of California, Berkeley, had “aninterval L–P of six seconds, corresponding to a distance oforigin of about thirty miles”; our location is about 31 miles(50 km) from the university.
8 August 1907 Punta Gorda Aftershocks
On the early morning of 8 August 1907, two moderateearthquakes (along with several smaller ones) occurred inthe Humboldt County vicinity. The two largest events oc-curred at 04:44 and 06:05. Based on the majority of thedescriptions, these two earthquakes seem to be similar. (Forthe original reports, see tables 1 and 14 in Meltzner and Wald[2002].) Three reports identified differences between thetwo: in Eureka, the second event was heavier, according toone report; in Eureka, the first one was longer, according toanother report; and in Upper Mattole, the first was the hard-est, according to a third report. However, other reports fromthe same towns did not identify these contrasts and made nodistinction between the two events. The lack of concurringreports suggests that the differences may have been only insome individuals’ perceptions, although, alternatively, thereported contrasts may reflect that the first event was closerto Upper Mattole and that the second event was closer toEureka. In this article, we assume that the two events weresimilar in size and source location and that the intensities ateach location were the same for both events. Even if the twoevents were slightly different in location and/or in magni-tude, our solution is still a useful approximation for bothevents.
The intensities and felt locations are listed in Table 12;the solution for these events is shown in Figure 12. Theintensity center and our preferred location are located nearPunta Gorda along the Humboldt County coast. Punta Gordais near the inferred northern termination of the 1906 main-shock rupture, and several faults exist in this area (Prenticeet al., 1999); any one of these faults is a plausible source.MI at our preferred location is 5.1; incorporating the statis-tical uncertainty in the magnitude for six observations at95% confidence (interpolating from Table 1), our magnitudefor each of these events is MI 5.1 (�0.5/�0.4).
11 August 1907 Shelter Cove Aftershock
Shortly after 04:00 on the morning of 11 August 1907,3 days after the double shock in Humboldt County (just dis-cussed), a larger earthquake occurred in the same generalregion. The intensities, and locations where the 11 Augustevent is reported to have been felt or not felt, are listed inTable 13; Figure 13 shows the intensity distribution. (Forthe original reports, see tables 1 and 15 in Meltzner and Wald[2002]). In some respects, the intensity distribution of the 11August 1907 event is similar to that of the 23 April 1906event (Fig. 6), although the 11 August 1907 event was notfelt in Oregon or northernmost California, and the total feltarea for the 11 August 1907 event was smaller.
The solution for this event is shown in Figure 13. Like
the 23 April 1906 event, the intensity center for this eventis inland; this time, it is in southern Trinity County. The 95%confidence-level contour for location includes an 80-kmstretch of the SAF off the Humboldt and Mendocino Countycoast. Although (as with the 23 April 1906 event) we rejectan inland source region, this time we prefer a location on ornear the SAF within the 95% confidence contour: specifi-cally, near Shelter Cove.
There are several reasons why we believe an SAF lo-cation is plausible for this event, but not for the 23 April1906 event. First, the smaller felt area of the 11 August 1907event suggests that the magnitude was smaller and that the
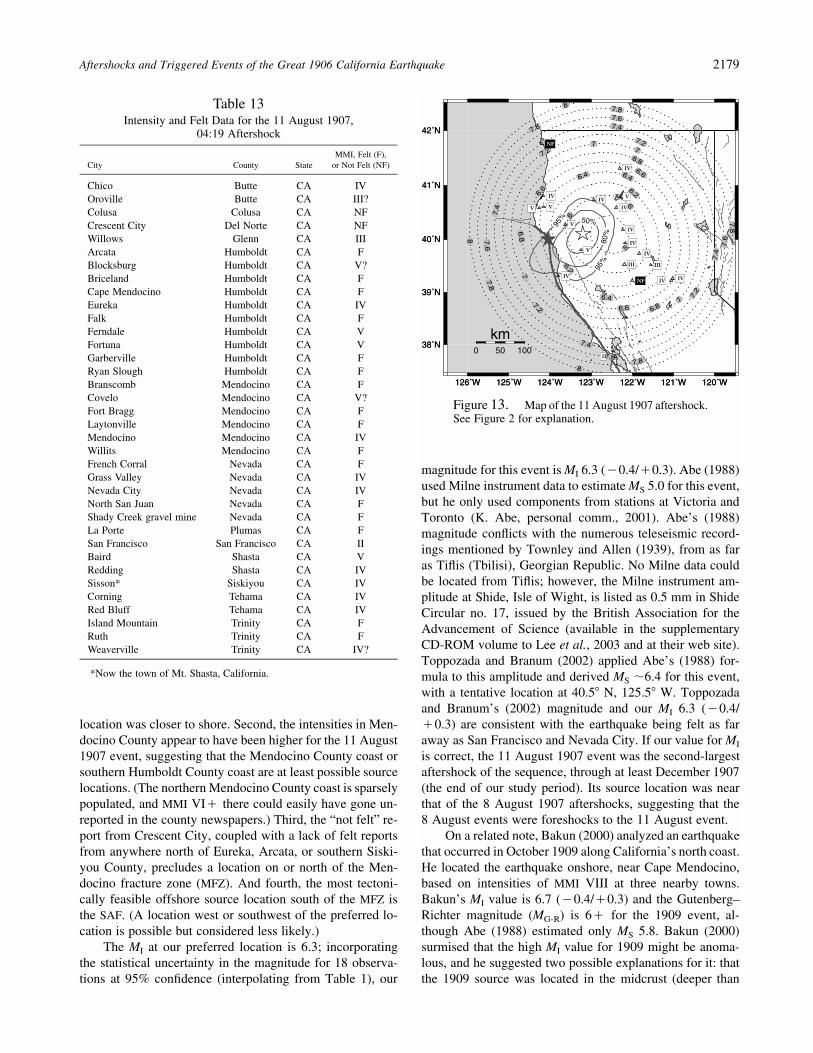
Aftershocks and Triggered Events of the Great 1906 California Earthquake 2179
Table 13Intensity and Felt Data for the 11 August 1907,
04:19 Aftershock
City County StateMMI, Felt (F),
or Not Felt (NF)
Chico Butte CA IVOroville Butte CA III?Colusa Colusa CA NFCrescent City Del Norte CA NFWillows Glenn CA IIIArcata Humboldt CA FBlocksburg Humboldt CA V?Briceland Humboldt CA FCape Mendocino Humboldt CA FEureka Humboldt CA IVFalk Humboldt CA FFerndale Humboldt CA VFortuna Humboldt CA VGarberville Humboldt CA FRyan Slough Humboldt CA FBranscomb Mendocino CA FCovelo Mendocino CA V?Fort Bragg Mendocino CA FLaytonville Mendocino CA FMendocino Mendocino CA IVWillits Mendocino CA FFrench Corral Nevada CA FGrass Valley Nevada CA IVNevada City Nevada CA IVNorth San Juan Nevada CA FShady Creek gravel mine Nevada CA FLa Porte Plumas CA FSan Francisco San Francisco CA IIBaird Shasta CA VRedding Shasta CA IVSisson* Siskiyou CA IVCorning Tehama CA IVRed Bluff Tehama CA IVIsland Mountain Trinity CA FRuth Trinity CA FWeaverville Trinity CA IV?
*Now the town of Mt. Shasta, California.
126˚W 125˚W 124˚W 123˚W 122˚W 121˚W 120˚W
38˚N
39˚N
40˚N
41˚N
42˚N
5.8
6
6
6.2
6.2
6.4
6.4
6.46.6
6.6
6.6
6.8
6.8
6.8
7
7
7
77.2
7.2
7.2
7.2
7.4
7.4
7.4
7.4
7.6
7.6
7.6
7.6
7.8
7.8
7.8
7.8
7.8
8
8
8
50%
80%
95%
95%
126˚W 125˚W 124˚W 123˚W 122˚W 121˚W 120˚W
38˚N
39˚N
40˚N
41˚N
42˚N
0 50 100
km
V
V V
V
V
IV
IV
IVIV IV
IV
IV
IV
IV
IV
IIIIII
II
NF
NF
Figure 13. Map of the 11 August 1907 aftershock.See Figure 2 for explanation.
location was closer to shore. Second, the intensities in Men-docino County appear to have been higher for the 11 August1907 event, suggesting that the Mendocino County coast orsouthern Humboldt County coast are at least possible sourcelocations. (The northern Mendocino County coast is sparselypopulated, and MMI VI� there could easily have gone un-reported in the county newspapers.) Third, the “not felt” re-port from Crescent City, coupled with a lack of felt reportsfrom anywhere north of Eureka, Arcata, or southern Siski-you County, precludes a location on or north of the Men-docino fracture zone (MFZ). And fourth, the most tectoni-cally feasible offshore source location south of the MFZ isthe SAF. (A location west or southwest of the preferred lo-cation is possible but considered less likely.)
The MI at our preferred location is 6.3; incorporatingthe statistical uncertainty in the magnitude for 18 observa-tions at 95% confidence (interpolating from Table 1), our
magnitude for this event is MI 6.3 (�0.4/�0.3). Abe (1988)used Milne instrument data to estimate MS 5.0 for this event,but he only used components from stations at Victoria andToronto (K. Abe, personal comm., 2001). Abe’s (1988)magnitude conflicts with the numerous teleseismic record-ings mentioned by Townley and Allen (1939), from as faras Tiflis (Tbilisi), Georgian Republic. No Milne data couldbe located from Tiflis; however, the Milne instrument am-plitude at Shide, Isle of Wight, is listed as 0.5 mm in ShideCircular no. 17, issued by the British Association for theAdvancement of Science (available in the supplementaryCD-ROM volume to Lee et al., 2003 and at their web site).Toppozada and Branum (2002) applied Abe’s (1988) for-mula to this amplitude and derived MS �6.4 for this event,with a tentative location at 40.5� N, 125.5� W. Toppozadaand Branum’s (2002) magnitude and our MI 6.3 (�0.4/�0.3) are consistent with the earthquake being felt as faraway as San Francisco and Nevada City. If our value for MI
is correct, the 11 August 1907 event was the second-largestaftershock of the sequence, through at least December 1907(the end of our study period). Its source location was nearthat of the 8 August 1907 aftershocks, suggesting that the8 August events were foreshocks to the 11 August event.
On a related note, Bakun (2000) analyzed an earthquakethat occurred in October 1909 along California’s north coast.He located the earthquake onshore, near Cape Mendocino,based on intensities of MMI VIII at three nearby towns.Bakun’s MI value is 6.7 (�0.4/�0.3) and the Gutenberg–Richter magnitude (MG-R) is 6� for the 1909 event, al-though Abe (1988) estimated only MS 5.8. Bakun (2000)surmised that the high MI value for 1909 might be anoma-lous, and he suggested two possible explanations for it: thatthe 1909 source was located in the midcrust (deeper than
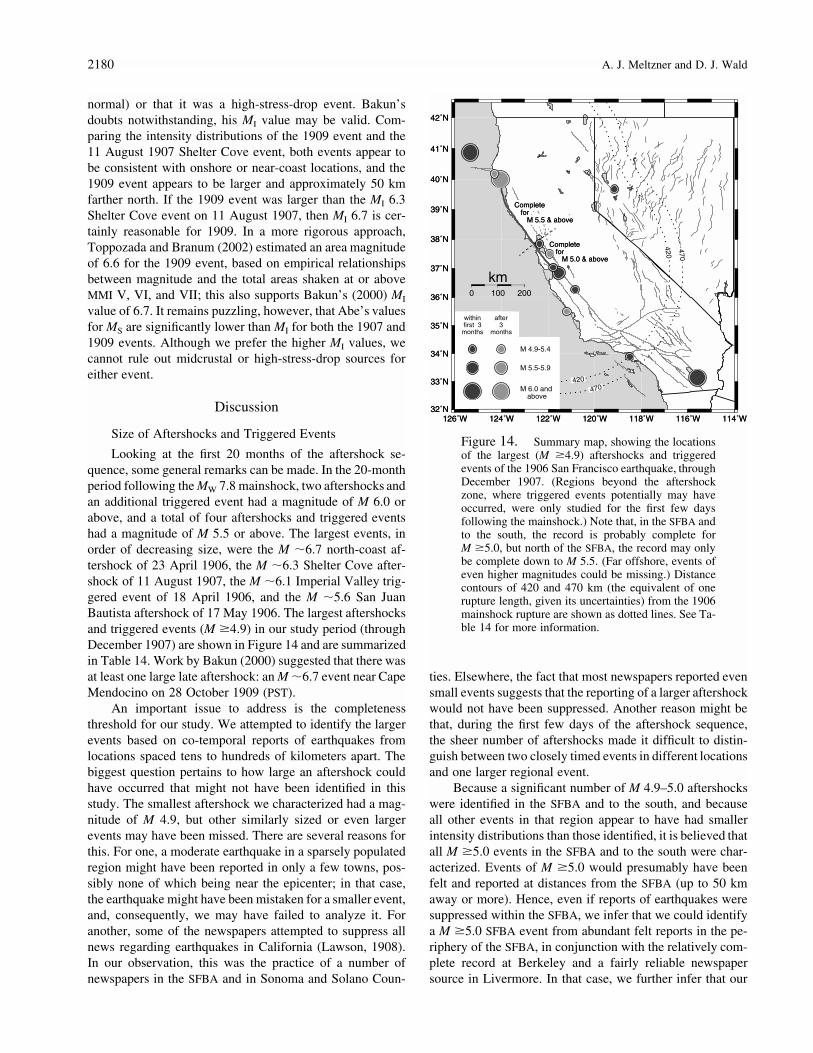
2180 A. J. Meltzner and D. J. Wald
126˚W 124˚W 122˚W 120˚W 118˚W 116˚W 114˚W32˚N
33˚N
34˚N
35˚N
36˚N
37˚N
38˚N
39˚N
40˚N
41˚N
42˚N
126˚W 124˚W 122˚W 120˚W 118˚W 116˚W 114˚W32˚N
33˚N
34˚N
35˚N
36˚N
37˚N
38˚N
39˚N
40˚N
41˚N
42˚N
0 100 200
km
420
420
470
470
withinfirst 3
months
after3
months
M 4.9-5.4
M 5.5-5.9
M 6.0 andabove
Completefor
M 5.5 & above
Completefor
M 5.0 & above
Completefor
M 5.5 & above
Completefor
M 5.0 & above
Figure 14. Summary map, showing the locationsof the largest (M �4.9) aftershocks and triggeredevents of the 1906 San Francisco earthquake, throughDecember 1907. (Regions beyond the aftershockzone, where triggered events potentially may haveoccurred, were only studied for the first few daysfollowing the mainshock.) Note that, in the SFBA andto the south, the record is probably complete forM �5.0, but north of the SFBA, the record may onlybe complete down to M 5.5. (Far offshore, events ofeven higher magnitudes could be missing.) Distancecontours of 420 and 470 km (the equivalent of onerupture length, given its uncertainties) from the 1906mainshock rupture are shown as dotted lines. See Ta-ble 14 for more information.
normal) or that it was a high-stress-drop event. Bakun’sdoubts notwithstanding, his MI value may be valid. Com-paring the intensity distributions of the 1909 event and the11 August 1907 Shelter Cove event, both events appear tobe consistent with onshore or near-coast locations, and the1909 event appears to be larger and approximately 50 kmfarther north. If the 1909 event was larger than the MI 6.3Shelter Cove event on 11 August 1907, then MI 6.7 is cer-tainly reasonable for 1909. In a more rigorous approach,Toppozada and Branum (2002) estimated an area magnitudeof 6.6 for the 1909 event, based on empirical relationshipsbetween magnitude and the total areas shaken at or aboveMMI V, VI, and VII; this also supports Bakun’s (2000) MI
value of 6.7. It remains puzzling, however, that Abe’s valuesfor MS are significantly lower than MI for both the 1907 and1909 events. Although we prefer the higher MI values, wecannot rule out midcrustal or high-stress-drop sources foreither event.
Discussion
Size of Aftershocks and Triggered Events
Looking at the first 20 months of the aftershock se-quence, some general remarks can be made. In the 20-monthperiod following the MW 7.8 mainshock, two aftershocks andan additional triggered event had a magnitude of M 6.0 orabove, and a total of four aftershocks and triggered eventshad a magnitude of M 5.5 or above. The largest events, inorder of decreasing size, were the M �6.7 north-coast af-tershock of 23 April 1906, the M �6.3 Shelter Cove after-shock of 11 August 1907, the M �6.1 Imperial Valley trig-gered event of 18 April 1906, and the M �5.6 San JuanBautista aftershock of 17 May 1906. The largest aftershocksand triggered events (M �4.9) in our study period (throughDecember 1907) are shown in Figure 14 and are summarizedin Table 14. Work by Bakun (2000) suggested that there wasat least one large late aftershock: an M �6.7 event near CapeMendocino on 28 October 1909 (PST).
An important issue to address is the completenessthreshold for our study. We attempted to identify the largerevents based on co-temporal reports of earthquakes fromlocations spaced tens to hundreds of kilometers apart. Thebiggest question pertains to how large an aftershock couldhave occurred that might not have been identified in thisstudy. The smallest aftershock we characterized had a mag-nitude of M 4.9, but other similarly sized or even largerevents may have been missed. There are several reasons forthis. For one, a moderate earthquake in a sparsely populatedregion might have been reported in only a few towns, pos-sibly none of which being near the epicenter; in that case,the earthquake might have been mistaken for a smaller event,and, consequently, we may have failed to analyze it. Foranother, some of the newspapers attempted to suppress allnews regarding earthquakes in California (Lawson, 1908).In our observation, this was the practice of a number ofnewspapers in the SFBA and in Sonoma and Solano Coun-
ties. Elsewhere, the fact that most newspapers reported evensmall events suggests that the reporting of a larger aftershockwould not have been suppressed. Another reason might bethat, during the first few days of the aftershock sequence,the sheer number of aftershocks made it difficult to distin-guish between two closely timed events in different locationsand one larger regional event.
Because a significant number of M 4.9–5.0 aftershockswere identified in the SFBA and to the south, and becauseall other events in that region appear to have had smallerintensity distributions than those identified, it is believed thatall M �5.0 events in the SFBA and to the south were char-acterized. Events of M �5.0 would presumably have beenfelt and reported at distances from the SFBA (up to 50 kmaway or more). Hence, even if reports of earthquakes weresuppressed within the SFBA, we infer that we could identifya M �5.0 SFBA event from abundant felt reports in the pe-riphery of the SFBA, in conjunction with the relatively com-plete record at Berkeley and a fairly reliable newspapersource in Livermore. In that case, we further infer that our
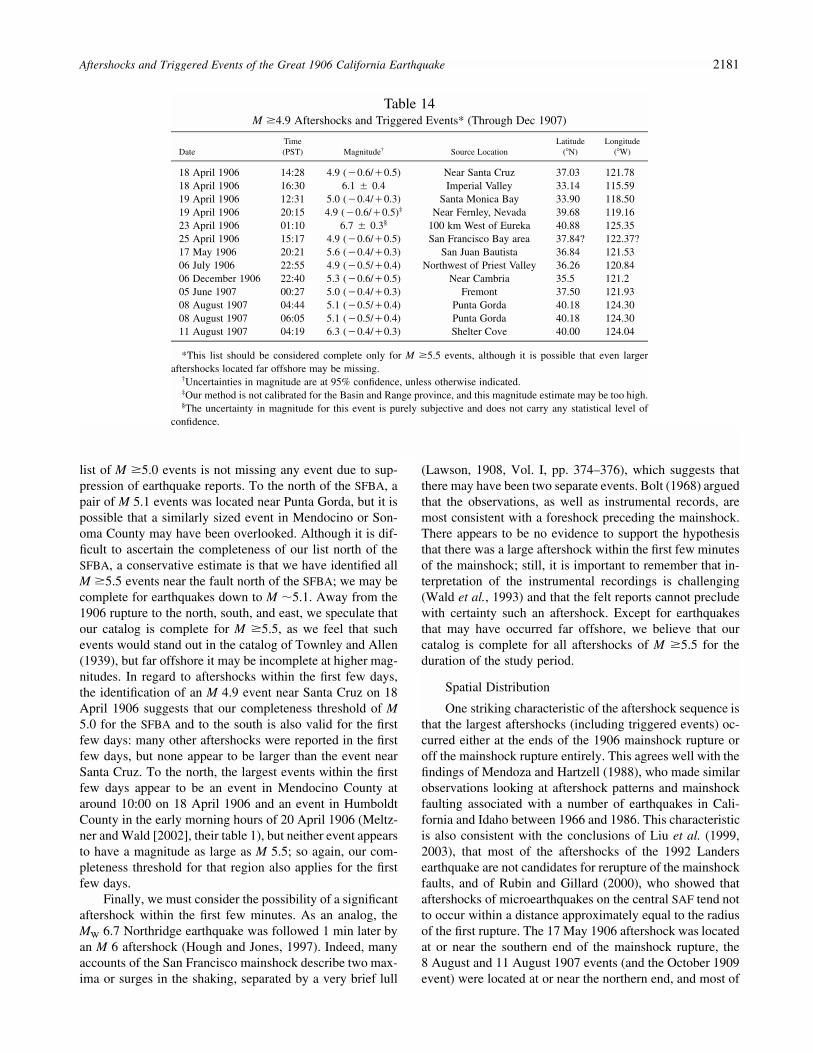
Aftershocks and Triggered Events of the Great 1906 California Earthquake 2181
Table 14M �4.9 Aftershocks and Triggered Events* (Through Dec 1907)
DateTime(PST) Magnitude† Source Location
Latitude(�N)
Longitude(�W)
18 April 1906 14:28 4.9 (�0.6/�0.5) Near Santa Cruz 37.03 121.7818 April 1906 16:30 6.1 � 0.4 Imperial Valley 33.14 115.5919 April 1906 12:31 5.0 (�0.4/�0.3) Santa Monica Bay 33.90 118.5019 April 1906 20:15 4.9 (�0.6/�0.5)‡ Near Fernley, Nevada 39.68 119.1623 April 1906 01:10 6.7 � 0.3§ 100 km West of Eureka 40.88 125.3525 April 1906 15:17 4.9 (�0.6/�0.5) San Francisco Bay area 37.84? 122.37?17 May 1906 20:21 5.6 (�0.4/�0.3) San Juan Bautista 36.84 121.5306 July 1906 22:55 4.9 (�0.5/�0.4) Northwest of Priest Valley 36.26 120.8406 December 1906 22:40 5.3 (�0.6/�0.5) Near Cambria 35.5 121.205 June 1907 00:27 5.0 (�0.4/�0.3) Fremont 37.50 121.9308 August 1907 04:44 5.1 (�0.5/�0.4) Punta Gorda 40.18 124.3008 August 1907 06:05 5.1 (�0.5/�0.4) Punta Gorda 40.18 124.3011 August 1907 04:19 6.3 (�0.4/�0.3) Shelter Cove 40.00 124.04
*This list should be considered complete only for M �5.5 events, although it is possible that even largeraftershocks located far offshore may be missing.
†Uncertainties in magnitude are at 95% confidence, unless otherwise indicated.‡Our method is not calibrated for the Basin and Range province, and this magnitude estimate may be too high.§The uncertainty in magnitude for this event is purely subjective and does not carry any statistical level of
confidence.
list of M �5.0 events is not missing any event due to sup-pression of earthquake reports. To the north of the SFBA, apair of M 5.1 events was located near Punta Gorda, but it ispossible that a similarly sized event in Mendocino or Son-oma County may have been overlooked. Although it is dif-ficult to ascertain the completeness of our list north of theSFBA, a conservative estimate is that we have identified allM �5.5 events near the fault north of the SFBA; we may becomplete for earthquakes down to M �5.1. Away from the1906 rupture to the north, south, and east, we speculate thatour catalog is complete for M �5.5, as we feel that suchevents would stand out in the catalog of Townley and Allen(1939), but far offshore it may be incomplete at higher mag-nitudes. In regard to aftershocks within the first few days,the identification of an M 4.9 event near Santa Cruz on 18April 1906 suggests that our completeness threshold of M5.0 for the SFBA and to the south is also valid for the firstfew days: many other aftershocks were reported in the firstfew days, but none appear to be larger than the event nearSanta Cruz. To the north, the largest events within the firstfew days appear to be an event in Mendocino County ataround 10:00 on 18 April 1906 and an event in HumboldtCounty in the early morning hours of 20 April 1906 (Meltz-ner and Wald [2002], their table 1), but neither event appearsto have a magnitude as large as M 5.5; so again, our com-pleteness threshold for that region also applies for the firstfew days.
Finally, we must consider the possibility of a significantaftershock within the first few minutes. As an analog, theMW 6.7 Northridge earthquake was followed 1 min later byan M 6 aftershock (Hough and Jones, 1997). Indeed, manyaccounts of the San Francisco mainshock describe two max-ima or surges in the shaking, separated by a very brief lull
(Lawson, 1908, Vol. I, pp. 374–376), which suggests thatthere may have been two separate events. Bolt (1968) arguedthat the observations, as well as instrumental records, aremost consistent with a foreshock preceding the mainshock.There appears to be no evidence to support the hypothesisthat there was a large aftershock within the first few minutesof the mainshock; still, it is important to remember that in-terpretation of the instrumental recordings is challenging(Wald et al., 1993) and that the felt reports cannot precludewith certainty such an aftershock. Except for earthquakesthat may have occurred far offshore, we believe that ourcatalog is complete for all aftershocks of M �5.5 for theduration of the study period.
Spatial Distribution
One striking characteristic of the aftershock sequence isthat the largest aftershocks (including triggered events) oc-curred either at the ends of the 1906 mainshock rupture oroff the mainshock rupture entirely. This agrees well with thefindings of Mendoza and Hartzell (1988), who made similarobservations looking at aftershock patterns and mainshockfaulting associated with a number of earthquakes in Cali-fornia and Idaho between 1966 and 1986. This characteristicis also consistent with the conclusions of Liu et al. (1999,2003), that most of the aftershocks of the 1992 Landersearthquake are not candidates for rerupture of the mainshockfaults, and of Rubin and Gillard (2000), who showed thataftershocks of microearthquakes on the central SAF tend notto occur within a distance approximately equal to the radiusof the first rupture. The 17 May 1906 aftershock was locatedat or near the southern end of the mainshock rupture, the8 August and 11 August 1907 events (and the October 1909event) were located at or near the northern end, and most of
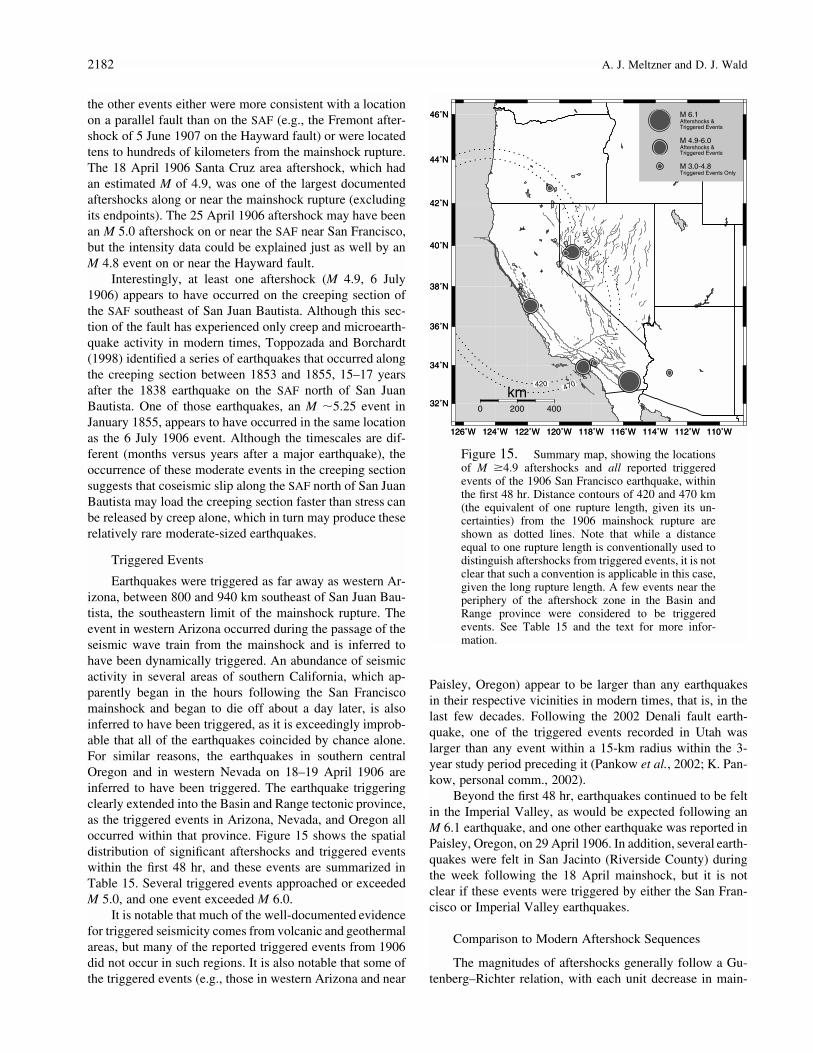
2182 A. J. Meltzner and D. J. Wald
126˚W 124˚W 122˚W 120˚W 118˚W 116˚W 114˚W 112˚W 110˚W
32˚N
34˚N
36˚N
38˚N
40˚N
42˚N
44˚N
46˚N M 6.1Aftershocks &Triggered Events
M 4.9-6.0Aftershocks &Triggered Events
M 3.0-4.8Triggered Events Only
126˚W 124˚W 122˚W 120˚W 118˚W 116˚W 114˚W 112˚W 110˚W
32˚N
34˚N
36˚N
38˚N
40˚N
42˚N
44˚N
46˚N
0 200 400
km
420
420
470
470
Figure 15. Summary map, showing the locationsof M �4.9 aftershocks and all reported triggeredevents of the 1906 San Francisco earthquake, withinthe first 48 hr. Distance contours of 420 and 470 km(the equivalent of one rupture length, given its un-certainties) from the 1906 mainshock rupture areshown as dotted lines. Note that while a distanceequal to one rupture length is conventionally used todistinguish aftershocks from triggered events, it is notclear that such a convention is applicable in this case,given the long rupture length. A few events near theperiphery of the aftershock zone in the Basin andRange province were considered to be triggeredevents. See Table 15 and the text for more infor-mation.
the other events either were more consistent with a locationon a parallel fault than on the SAF (e.g., the Fremont after-shock of 5 June 1907 on the Hayward fault) or were locatedtens to hundreds of kilometers from the mainshock rupture.The 18 April 1906 Santa Cruz area aftershock, which hadan estimated M of 4.9, was one of the largest documentedaftershocks along or near the mainshock rupture (excludingits endpoints). The 25 April 1906 aftershock may have beenan M 5.0 aftershock on or near the SAF near San Francisco,but the intensity data could be explained just as well by anM 4.8 event on or near the Hayward fault.
Interestingly, at least one aftershock (M 4.9, 6 July1906) appears to have occurred on the creeping section ofthe SAF southeast of San Juan Bautista. Although this sec-tion of the fault has experienced only creep and microearth-quake activity in modern times, Toppozada and Borchardt(1998) identified a series of earthquakes that occurred alongthe creeping section between 1853 and 1855, 15–17 yearsafter the 1838 earthquake on the SAF north of San JuanBautista. One of those earthquakes, an M �5.25 event inJanuary 1855, appears to have occurred in the same locationas the 6 July 1906 event. Although the timescales are dif-ferent (months versus years after a major earthquake), theoccurrence of these moderate events in the creeping sectionsuggests that coseismic slip along the SAF north of San JuanBautista may load the creeping section faster than stress canbe released by creep alone, which in turn may produce theserelatively rare moderate-sized earthquakes.
Triggered Events
Earthquakes were triggered as far away as western Ar-izona, between 800 and 940 km southeast of San Juan Bau-tista, the southeastern limit of the mainshock rupture. Theevent in western Arizona occurred during the passage of theseismic wave train from the mainshock and is inferred tohave been dynamically triggered. An abundance of seismicactivity in several areas of southern California, which ap-parently began in the hours following the San Franciscomainshock and began to die off about a day later, is alsoinferred to have been triggered, as it is exceedingly improb-able that all of the earthquakes coincided by chance alone.For similar reasons, the earthquakes in southern centralOregon and in western Nevada on 18–19 April 1906 areinferred to have been triggered. The earthquake triggeringclearly extended into the Basin and Range tectonic province,as the triggered events in Arizona, Nevada, and Oregon alloccurred within that province. Figure 15 shows the spatialdistribution of significant aftershocks and triggered eventswithin the first 48 hr, and these events are summarized inTable 15. Several triggered events approached or exceededM 5.0, and one event exceeded M 6.0.
It is notable that much of the well-documented evidencefor triggered seismicity comes from volcanic and geothermalareas, but many of the reported triggered events from 1906did not occur in such regions. It is also notable that some ofthe triggered events (e.g., those in western Arizona and near
Paisley, Oregon) appear to be larger than any earthquakesin their respective vicinities in modern times, that is, in thelast few decades. Following the 2002 Denali fault earth-quake, one of the triggered events recorded in Utah waslarger than any event within a 15-km radius within the 3-year study period preceding it (Pankow et al., 2002; K. Pan-kow, personal comm., 2002).
Beyond the first 48 hr, earthquakes continued to be feltin the Imperial Valley, as would be expected following anM 6.1 earthquake, and one other earthquake was reported inPaisley, Oregon, on 29 April 1906. In addition, several earth-quakes were felt in San Jacinto (Riverside County) duringthe week following the 18 April mainshock, but it is notclear if these events were triggered by either the San Fran-cisco or Imperial Valley earthquakes.
Comparison to Modern Aftershock Sequences
The magnitudes of aftershocks generally follow a Gu-tenberg–Richter relation, with each unit decrease in main-
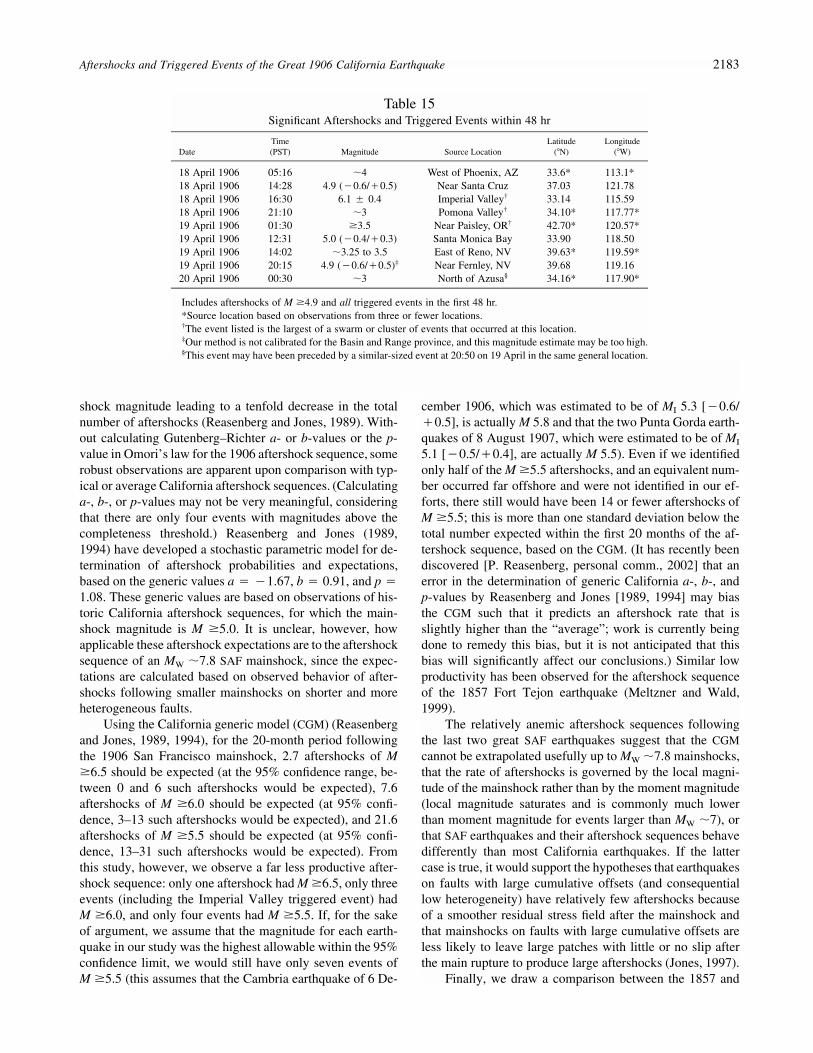
Aftershocks and Triggered Events of the Great 1906 California Earthquake 2183
Table 15Significant Aftershocks and Triggered Events within 48 hr
DateTime(PST) Magnitude Source Location
Latitude(�N)
Longitude(�W)
18 April 1906 05:16 �4 West of Phoenix, AZ 33.6* 113.1*18 April 1906 14:28 4.9 (�0.6/�0.5) Near Santa Cruz 37.03 121.7818 April 1906 16:30 6.1 � 0.4 Imperial Valley† 33.14 115.5918 April 1906 21:10 �3 Pomona Valley† 34.10* 117.77*19 April 1906 01:30 �3.5 Near Paisley, OR† 42.70* 120.57*19 April 1906 12:31 5.0 (�0.4/�0.3) Santa Monica Bay 33.90 118.5019 April 1906 14:02 �3.25 to 3.5 East of Reno, NV 39.63* 119.59*19 April 1906 20:15 4.9 (�0.6/�0.5)‡ Near Fernley, NV 39.68 119.1620 April 1906 00:30 �3 North of Azusa§ 34.16* 117.90*
Includes aftershocks of M �4.9 and all triggered events in the first 48 hr.*Source location based on observations from three or fewer locations.†The event listed is the largest of a swarm or cluster of events that occurred at this location.‡Our method is not calibrated for the Basin and Range province, and this magnitude estimate may be too high.§This event may have been preceded by a similar-sized event at 20:50 on 19 April in the same general location.
shock magnitude leading to a tenfold decrease in the totalnumber of aftershocks (Reasenberg and Jones, 1989). With-out calculating Gutenberg–Richter a- or b-values or the p-value in Omori’s law for the 1906 aftershock sequence, somerobust observations are apparent upon comparison with typ-ical or average California aftershock sequences. (Calculatinga-, b-, or p-values may not be very meaningful, consideringthat there are only four events with magnitudes above thecompleteness threshold.) Reasenberg and Jones (1989,1994) have developed a stochastic parametric model for de-termination of aftershock probabilities and expectations,based on the generic values a � �1.67, b � 0.91, and p �1.08. These generic values are based on observations of his-toric California aftershock sequences, for which the main-shock magnitude is M �5.0. It is unclear, however, howapplicable these aftershock expectations are to the aftershocksequence of an MW �7.8 SAF mainshock, since the expec-tations are calculated based on observed behavior of after-shocks following smaller mainshocks on shorter and moreheterogeneous faults.
Using the California generic model (CGM) (Reasenbergand Jones, 1989, 1994), for the 20-month period followingthe 1906 San Francisco mainshock, 2.7 aftershocks of M�6.5 should be expected (at the 95% confidence range, be-tween 0 and 6 such aftershocks would be expected), 7.6aftershocks of M �6.0 should be expected (at 95% confi-dence, 3–13 such aftershocks would be expected), and 21.6aftershocks of M �5.5 should be expected (at 95% confi-dence, 13–31 such aftershocks would be expected). Fromthis study, however, we observe a far less productive after-shock sequence: only one aftershock had M �6.5, only threeevents (including the Imperial Valley triggered event) hadM �6.0, and only four events had M �5.5. If, for the sakeof argument, we assume that the magnitude for each earth-quake in our study was the highest allowable within the 95%confidence limit, we would still have only seven events ofM �5.5 (this assumes that the Cambria earthquake of 6 De-
cember 1906, which was estimated to be of MI 5.3 [�0.6/�0.5], is actually M 5.8 and that the two Punta Gorda earth-quakes of 8 August 1907, which were estimated to be of MI
5.1 [�0.5/�0.4], are actually M 5.5). Even if we identifiedonly half of the M �5.5 aftershocks, and an equivalent num-ber occurred far offshore and were not identified in our ef-forts, there still would have been 14 or fewer aftershocks ofM �5.5; this is more than one standard deviation below thetotal number expected within the first 20 months of the af-tershock sequence, based on the CGM. (It has recently beendiscovered [P. Reasenberg, personal comm., 2002] that anerror in the determination of generic California a-, b-, andp-values by Reasenberg and Jones [1989, 1994] may biasthe CGM such that it predicts an aftershock rate that isslightly higher than the “average”; work is currently beingdone to remedy this bias, but it is not anticipated that thisbias will significantly affect our conclusions.) Similar lowproductivity has been observed for the aftershock sequenceof the 1857 Fort Tejon earthquake (Meltzner and Wald,1999).
The relatively anemic aftershock sequences followingthe last two great SAF earthquakes suggest that the CGMcannot be extrapolated usefully up to MW �7.8 mainshocks,that the rate of aftershocks is governed by the local magni-tude of the mainshock rather than by the moment magnitude(local magnitude saturates and is commonly much lowerthan moment magnitude for events larger than MW �7), orthat SAF earthquakes and their aftershock sequences behavedifferently than most California earthquakes. If the lattercase is true, it would support the hypotheses that earthquakeson faults with large cumulative offsets (and consequentiallow heterogeneity) have relatively few aftershocks becauseof a smoother residual stress field after the mainshock andthat mainshocks on faults with large cumulative offsets areless likely to leave large patches with little or no slip afterthe main rupture to produce large aftershocks (Jones, 1997).
Finally, we draw a comparison between the 1857 and
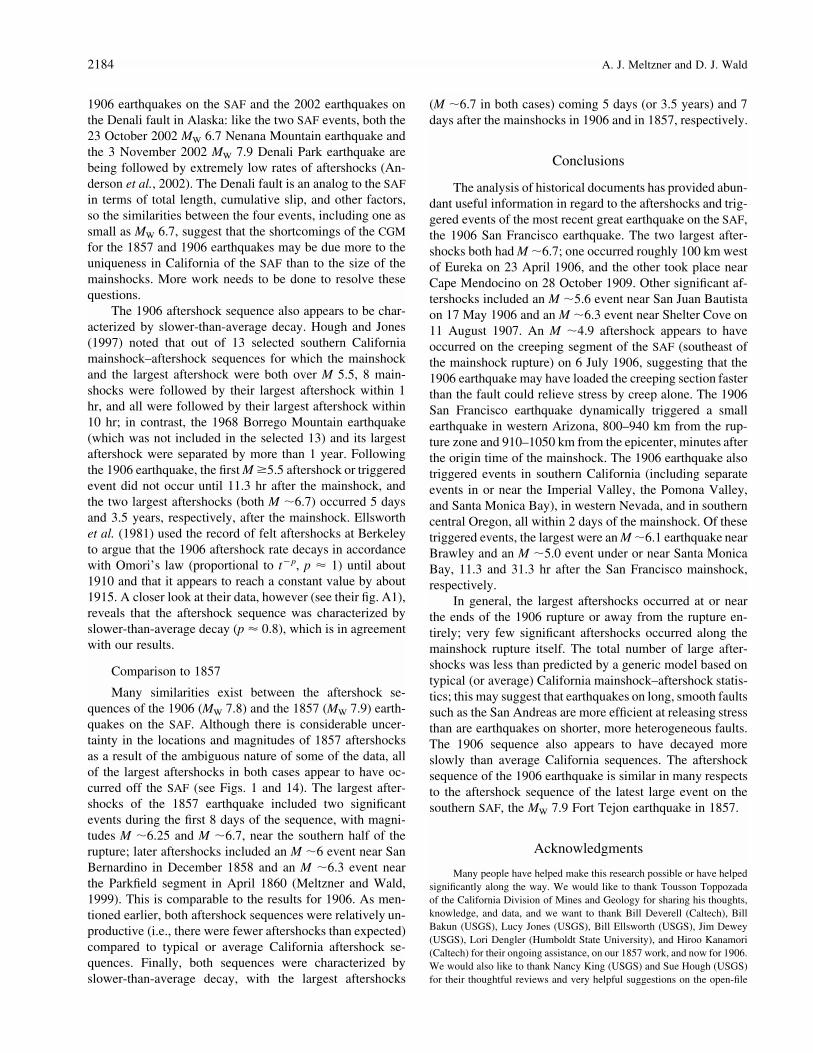
2184 A. J. Meltzner and D. J. Wald
1906 earthquakes on the SAF and the 2002 earthquakes onthe Denali fault in Alaska: like the two SAF events, both the23 October 2002 MW 6.7 Nenana Mountain earthquake andthe 3 November 2002 MW 7.9 Denali Park earthquake arebeing followed by extremely low rates of aftershocks (An-derson et al., 2002). The Denali fault is an analog to the SAFin terms of total length, cumulative slip, and other factors,so the similarities between the four events, including one assmall as MW 6.7, suggest that the shortcomings of the CGMfor the 1857 and 1906 earthquakes may be due more to theuniqueness in California of the SAF than to the size of themainshocks. More work needs to be done to resolve thesequestions.
The 1906 aftershock sequence also appears to be char-acterized by slower-than-average decay. Hough and Jones(1997) noted that out of 13 selected southern Californiamainshock–aftershock sequences for which the mainshockand the largest aftershock were both over M 5.5, 8 main-shocks were followed by their largest aftershock within 1hr, and all were followed by their largest aftershock within10 hr; in contrast, the 1968 Borrego Mountain earthquake(which was not included in the selected 13) and its largestaftershock were separated by more than 1 year. Followingthe 1906 earthquake, the first M �5.5 aftershock or triggeredevent did not occur until 11.3 hr after the mainshock, andthe two largest aftershocks (both M �6.7) occurred 5 daysand 3.5 years, respectively, after the mainshock. Ellsworthet al. (1981) used the record of felt aftershocks at Berkeleyto argue that the 1906 aftershock rate decays in accordancewith Omori’s law (proportional to t�p, p � 1) until about1910 and that it appears to reach a constant value by about1915. A closer look at their data, however (see their fig. A1),reveals that the aftershock sequence was characterized byslower-than-average decay (p � 0.8), which is in agreementwith our results.
Comparison to 1857
Many similarities exist between the aftershock se-quences of the 1906 (MW 7.8) and the 1857 (MW 7.9) earth-quakes on the SAF. Although there is considerable uncer-tainty in the locations and magnitudes of 1857 aftershocksas a result of the ambiguous nature of some of the data, allof the largest aftershocks in both cases appear to have oc-curred off the SAF (see Figs. 1 and 14). The largest after-shocks of the 1857 earthquake included two significantevents during the first 8 days of the sequence, with magni-tudes M �6.25 and M �6.7, near the southern half of therupture; later aftershocks included an M �6 event near SanBernardino in December 1858 and an M �6.3 event nearthe Parkfield segment in April 1860 (Meltzner and Wald,1999). This is comparable to the results for 1906. As men-tioned earlier, both aftershock sequences were relatively un-productive (i.e., there were fewer aftershocks than expected)compared to typical or average California aftershock se-quences. Finally, both sequences were characterized byslower-than-average decay, with the largest aftershocks
(M �6.7 in both cases) coming 5 days (or 3.5 years) and 7days after the mainshocks in 1906 and in 1857, respectively.
Conclusions
The analysis of historical documents has provided abun-dant useful information in regard to the aftershocks and trig-gered events of the most recent great earthquake on the SAF,the 1906 San Francisco earthquake. The two largest after-shocks both had M �6.7; one occurred roughly 100 km westof Eureka on 23 April 1906, and the other took place nearCape Mendocino on 28 October 1909. Other significant af-tershocks included an M �5.6 event near San Juan Bautistaon 17 May 1906 and an M �6.3 event near Shelter Cove on11 August 1907. An M �4.9 aftershock appears to haveoccurred on the creeping segment of the SAF (southeast ofthe mainshock rupture) on 6 July 1906, suggesting that the1906 earthquake may have loaded the creeping section fasterthan the fault could relieve stress by creep alone. The 1906San Francisco earthquake dynamically triggered a smallearthquake in western Arizona, 800–940 km from the rup-ture zone and 910–1050 km from the epicenter, minutes afterthe origin time of the mainshock. The 1906 earthquake alsotriggered events in southern California (including separateevents in or near the Imperial Valley, the Pomona Valley,and Santa Monica Bay), in western Nevada, and in southerncentral Oregon, all within 2 days of the mainshock. Of thesetriggered events, the largest were an M �6.1 earthquake nearBrawley and an M �5.0 event under or near Santa MonicaBay, 11.3 and 31.3 hr after the San Francisco mainshock,respectively.
In general, the largest aftershocks occurred at or nearthe ends of the 1906 rupture or away from the rupture en-tirely; very few significant aftershocks occurred along themainshock rupture itself. The total number of large after-shocks was less than predicted by a generic model based ontypical (or average) California mainshock–aftershock statis-tics; this may suggest that earthquakes on long, smooth faultssuch as the San Andreas are more efficient at releasing stressthan are earthquakes on shorter, more heterogeneous faults.The 1906 sequence also appears to have decayed moreslowly than average California sequences. The aftershocksequence of the 1906 earthquake is similar in many respectsto the aftershock sequence of the latest large event on thesouthern SAF, the MW 7.9 Fort Tejon earthquake in 1857.
Acknowledgments
Many people have helped make this research possible or have helpedsignificantly along the way. We would like to thank Tousson Toppozadaof the California Division of Mines and Geology for sharing his thoughts,knowledge, and data, and we want to thank Bill Deverell (Caltech), BillBakun (USGS), Lucy Jones (USGS), Bill Ellsworth (USGS), Jim Dewey(USGS), Lori Dengler (Humboldt State University), and Hiroo Kanamori(Caltech) for their ongoing assistance, on our 1857 work, and now for 1906.We would also like to thank Nancy King (USGS) and Sue Hough (USGS)for their thoughtful reviews and very helpful suggestions on the open-file
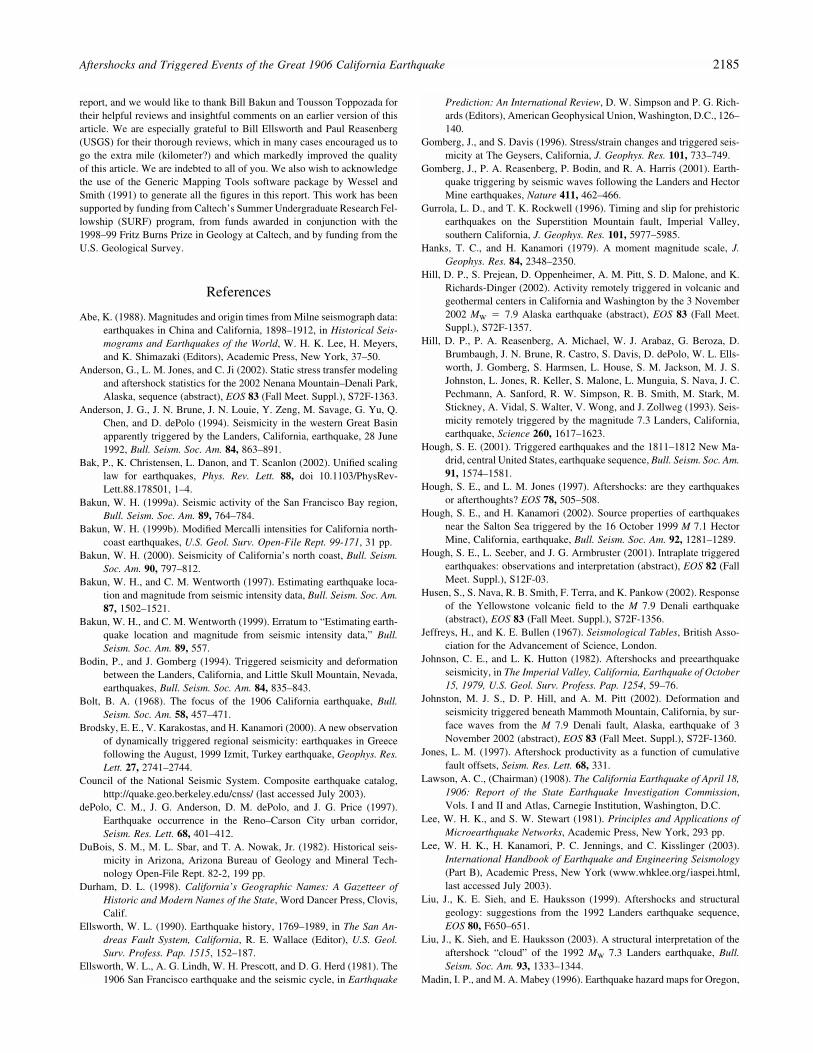
Aftershocks and Triggered Events of the Great 1906 California Earthquake 2185
report, and we would like to thank Bill Bakun and Tousson Toppozada fortheir helpful reviews and insightful comments on an earlier version of thisarticle. We are especially grateful to Bill Ellsworth and Paul Reasenberg(USGS) for their thorough reviews, which in many cases encouraged us togo the extra mile (kilometer?) and which markedly improved the qualityof this article. We are indebted to all of you. We also wish to acknowledgethe use of the Generic Mapping Tools software package by Wessel andSmith (1991) to generate all the figures in this report. This work has beensupported by funding from Caltech’s Summer Undergraduate Research Fel-lowship (SURF) program, from funds awarded in conjunction with the1998–99 Fritz Burns Prize in Geology at Caltech, and by funding from theU.S. Geological Survey.
References
Abe, K. (1988). Magnitudes and origin times from Milne seismograph data:earthquakes in China and California, 1898–1912, in Historical Seis-mograms and Earthquakes of the World, W. H. K. Lee, H. Meyers,and K. Shimazaki (Editors), Academic Press, New York, 37–50.
Anderson, G., L. M. Jones, and C. Ji (2002). Static stress transfer modelingand aftershock statistics for the 2002 Nenana Mountain–Denali Park,Alaska, sequence (abstract), EOS 83 (Fall Meet. Suppl.), S72F-1363.
Anderson, J. G., J. N. Brune, J. N. Louie, Y. Zeng, M. Savage, G. Yu, Q.Chen, and D. dePolo (1994). Seismicity in the western Great Basinapparently triggered by the Landers, California, earthquake, 28 June1992, Bull. Seism. Soc. Am. 84, 863–891.
Bak, P., K. Christensen, L. Danon, and T. Scanlon (2002). Unified scalinglaw for earthquakes, Phys. Rev. Lett. 88, doi 10.1103/PhysRev-Lett.88.178501, 1–4.
Bakun, W. H. (1999a). Seismic activity of the San Francisco Bay region,Bull. Seism. Soc. Am. 89, 764–784.
Bakun, W. H. (1999b). Modified Mercalli intensities for California north-coast earthquakes, U.S. Geol. Surv. Open-File Rept. 99-171, 31 pp.
Bakun, W. H. (2000). Seismicity of California’s north coast, Bull. Seism.Soc. Am. 90, 797–812.
Bakun, W. H., and C. M. Wentworth (1997). Estimating earthquake loca-tion and magnitude from seismic intensity data, Bull. Seism. Soc. Am.87, 1502–1521.
Bakun, W. H., and C. M. Wentworth (1999). Erratum to “Estimating earth-quake location and magnitude from seismic intensity data,” Bull.Seism. Soc. Am. 89, 557.
Bodin, P., and J. Gomberg (1994). Triggered seismicity and deformationbetween the Landers, California, and Little Skull Mountain, Nevada,earthquakes, Bull. Seism. Soc. Am. 84, 835–843.
Bolt, B. A. (1968). The focus of the 1906 California earthquake, Bull.Seism. Soc. Am. 58, 457–471.
Brodsky, E. E., V. Karakostas, and H. Kanamori (2000). A new observationof dynamically triggered regional seismicity: earthquakes in Greecefollowing the August, 1999 Izmit, Turkey earthquake, Geophys. Res.Lett. 27, 2741–2744.
Council of the National Seismic System. Composite earthquake catalog,http://quake.geo.berkeley.edu/cnss/ (last accessed July 2003).
dePolo, C. M., J. G. Anderson, D. M. dePolo, and J. G. Price (1997).Earthquake occurrence in the Reno–Carson City urban corridor,Seism. Res. Lett. 68, 401–412.
DuBois, S. M., M. L. Sbar, and T. A. Nowak, Jr. (1982). Historical seis-micity in Arizona, Arizona Bureau of Geology and Mineral Tech-nology Open-File Rept. 82-2, 199 pp.
Durham, D. L. (1998). California’s Geographic Names: A Gazetteer ofHistoric and Modern Names of the State, Word Dancer Press, Clovis,Calif.
Ellsworth, W. L. (1990). Earthquake history, 1769–1989, in The San An-dreas Fault System, California, R. E. Wallace (Editor), U.S. Geol.Surv. Profess. Pap. 1515, 152–187.
Ellsworth, W. L., A. G. Lindh, W. H. Prescott, and D. G. Herd (1981). The1906 San Francisco earthquake and the seismic cycle, in Earthquake
Prediction: An International Review, D. W. Simpson and P. G. Rich-ards (Editors), American Geophysical Union, Washington, D.C., 126–140.
Gomberg, J., and S. Davis (1996). Stress/strain changes and triggered seis-micity at The Geysers, California, J. Geophys. Res. 101, 733–749.
Gomberg, J., P. A. Reasenberg, P. Bodin, and R. A. Harris (2001). Earth-quake triggering by seismic waves following the Landers and HectorMine earthquakes, Nature 411, 462–466.
Gurrola, L. D., and T. K. Rockwell (1996). Timing and slip for prehistoricearthquakes on the Superstition Mountain fault, Imperial Valley,southern California, J. Geophys. Res. 101, 5977–5985.
Hanks, T. C., and H. Kanamori (1979). A moment magnitude scale, J.Geophys. Res. 84, 2348–2350.
Hill, D. P., S. Prejean, D. Oppenheimer, A. M. Pitt, S. D. Malone, and K.Richards-Dinger (2002). Activity remotely triggered in volcanic andgeothermal centers in California and Washington by the 3 November2002 MW � 7.9 Alaska earthquake (abstract), EOS 83 (Fall Meet.Suppl.), S72F-1357.
Hill, D. P., P. A. Reasenberg, A. Michael, W. J. Arabaz, G. Beroza, D.Brumbaugh, J. N. Brune, R. Castro, S. Davis, D. dePolo, W. L. Ells-worth, J. Gomberg, S. Harmsen, L. House, S. M. Jackson, M. J. S.Johnston, L. Jones, R. Keller, S. Malone, L. Munguia, S. Nava, J. C.Pechmann, A. Sanford, R. W. Simpson, R. B. Smith, M. Stark, M.Stickney, A. Vidal, S. Walter, V. Wong, and J. Zollweg (1993). Seis-micity remotely triggered by the magnitude 7.3 Landers, California,earthquake, Science 260, 1617–1623.
Hough, S. E. (2001). Triggered earthquakes and the 1811–1812 New Ma-drid, central United States, earthquake sequence, Bull. Seism. Soc. Am.91, 1574–1581.
Hough, S. E., and L. M. Jones (1997). Aftershocks: are they earthquakesor afterthoughts? EOS 78, 505–508.
Hough, S. E., and H. Kanamori (2002). Source properties of earthquakesnear the Salton Sea triggered by the 16 October 1999 M 7.1 HectorMine, California, earthquake, Bull. Seism. Soc. Am. 92, 1281–1289.
Hough, S. E., L. Seeber, and J. G. Armbruster (2001). Intraplate triggeredearthquakes: observations and interpretation (abstract), EOS 82 (FallMeet. Suppl.), S12F-03.
Husen, S., S. Nava, R. B. Smith, F. Terra, and K. Pankow (2002). Responseof the Yellowstone volcanic field to the M 7.9 Denali earthquake(abstract), EOS 83 (Fall Meet. Suppl.), S72F-1356.
Jeffreys, H., and K. E. Bullen (1967). Seismological Tables, British Asso-ciation for the Advancement of Science, London.
Johnson, C. E., and L. K. Hutton (1982). Aftershocks and preearthquakeseismicity, in The Imperial Valley, California, Earthquake of October15, 1979, U.S. Geol. Surv. Profess. Pap. 1254, 59–76.
Johnston, M. J. S., D. P. Hill, and A. M. Pitt (2002). Deformation andseismicity triggered beneath Mammoth Mountain, California, by sur-face waves from the M 7.9 Denali fault, Alaska, earthquake of 3November 2002 (abstract), EOS 83 (Fall Meet. Suppl.), S72F-1360.
Jones, L. M. (1997). Aftershock productivity as a function of cumulativefault offsets, Seism. Res. Lett. 68, 331.
Lawson, A. C., (Chairman) (1908). The California Earthquake of April 18,1906: Report of the State Earthquake Investigation Commission,Vols. I and II and Atlas, Carnegie Institution, Washington, D.C.
Lee, W. H. K., and S. W. Stewart (1981). Principles and Applications ofMicroearthquake Networks, Academic Press, New York, 293 pp.
Lee, W. H. K., H. Kanamori, P. C. Jennings, and C. Kisslinger (2003).International Handbook of Earthquake and Engineering Seismology(Part B), Academic Press, New York (www.whklee.org/iaspei.html,last accessed July 2003).
Liu, J., K. E. Sieh, and E. Hauksson (1999). Aftershocks and structuralgeology: suggestions from the 1992 Landers earthquake sequence,EOS 80, F650–651.
Liu, J., K. Sieh, and E. Hauksson (2003). A structural interpretation of theaftershock “cloud” of the 1992 MW 7.3 Landers earthquake, Bull.Seism. Soc. Am. 93, 1333–1344.
Madin, I. P., and M. A. Mabey (1996). Earthquake hazard maps for Oregon,
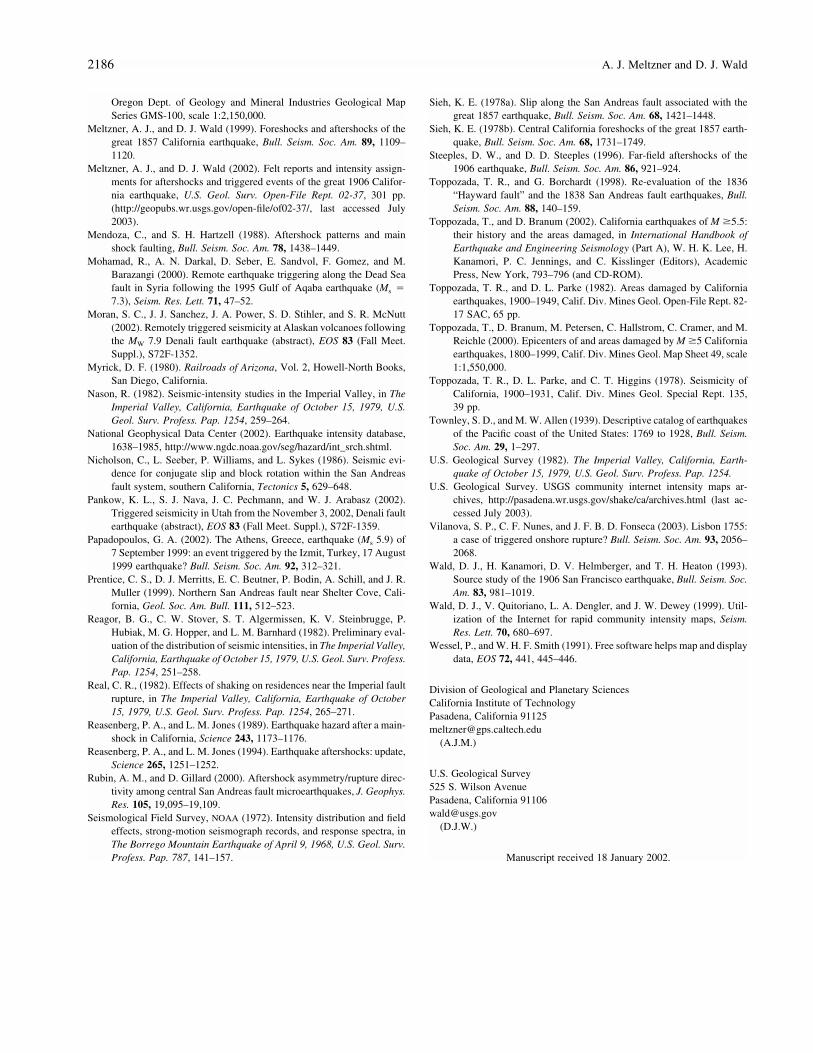
2186 A. J. Meltzner and D. J. Wald
Oregon Dept. of Geology and Mineral Industries Geological MapSeries GMS-100, scale 1:2,150,000.
Meltzner, A. J., and D. J. Wald (1999). Foreshocks and aftershocks of thegreat 1857 California earthquake, Bull. Seism. Soc. Am. 89, 1109–1120.
Meltzner, A. J., and D. J. Wald (2002). Felt reports and intensity assign-ments for aftershocks and triggered events of the great 1906 Califor-nia earthquake, U.S. Geol. Surv. Open-File Rept. 02-37, 301 pp.(http://geopubs.wr.usgs.gov/open-file/of02-37/, last accessed July2003).
Mendoza, C., and S. H. Hartzell (1988). Aftershock patterns and mainshock faulting, Bull. Seism. Soc. Am. 78, 1438–1449.
Mohamad, R., A. N. Darkal, D. Seber, E. Sandvol, F. Gomez, and M.Barazangi (2000). Remote earthquake triggering along the Dead Seafault in Syria following the 1995 Gulf of Aqaba earthquake (Ms �
7.3), Seism. Res. Lett. 71, 47–52.Moran, S. C., J. J. Sanchez, J. A. Power, S. D. Stihler, and S. R. McNutt
(2002). Remotely triggered seismicity at Alaskan volcanoes followingthe MW 7.9 Denali fault earthquake (abstract), EOS 83 (Fall Meet.Suppl.), S72F-1352.
Myrick, D. F. (1980). Railroads of Arizona, Vol. 2, Howell-North Books,San Diego, California.
Nason, R. (1982). Seismic-intensity studies in the Imperial Valley, in TheImperial Valley, California, Earthquake of October 15, 1979, U.S.Geol. Surv. Profess. Pap. 1254, 259–264.
National Geophysical Data Center (2002). Earthquake intensity database,1638–1985, http://www.ngdc.noaa.gov/seg/hazard/int_srch.shtml.
Nicholson, C., L. Seeber, P. Williams, and L. Sykes (1986). Seismic evi-dence for conjugate slip and block rotation within the San Andreasfault system, southern California, Tectonics 5, 629–648.
Pankow, K. L., S. J. Nava, J. C. Pechmann, and W. J. Arabasz (2002).Triggered seismicity in Utah from the November 3, 2002, Denali faultearthquake (abstract), EOS 83 (Fall Meet. Suppl.), S72F-1359.
Papadopoulos, G. A. (2002). The Athens, Greece, earthquake (Ms 5.9) of7 September 1999: an event triggered by the Izmit, Turkey, 17 August1999 earthquake? Bull. Seism. Soc. Am. 92, 312–321.
Prentice, C. S., D. J. Merritts, E. C. Beutner, P. Bodin, A. Schill, and J. R.Muller (1999). Northern San Andreas fault near Shelter Cove, Cali-fornia, Geol. Soc. Am. Bull. 111, 512–523.
Reagor, B. G., C. W. Stover, S. T. Algermissen, K. V. Steinbrugge, P.Hubiak, M. G. Hopper, and L. M. Barnhard (1982). Preliminary eval-uation of the distribution of seismic intensities, in The Imperial Valley,California, Earthquake of October 15, 1979, U.S. Geol. Surv. Profess.Pap. 1254, 251–258.
Real, C. R., (1982). Effects of shaking on residences near the Imperial faultrupture, in The Imperial Valley, California, Earthquake of October15, 1979, U.S. Geol. Surv. Profess. Pap. 1254, 265–271.
Reasenberg, P. A., and L. M. Jones (1989). Earthquake hazard after a main-shock in California, Science 243, 1173–1176.
Reasenberg, P. A., and L. M. Jones (1994). Earthquake aftershocks: update,Science 265, 1251–1252.
Rubin, A. M., and D. Gillard (2000). Aftershock asymmetry/rupture direc-tivity among central San Andreas fault microearthquakes, J. Geophys.Res. 105, 19,095–19,109.
Seismological Field Survey, NOAA (1972). Intensity distribution and fieldeffects, strong-motion seismograph records, and response spectra, inThe Borrego Mountain Earthquake of April 9, 1968, U.S. Geol. Surv.Profess. Pap. 787, 141–157.
Sieh, K. E. (1978a). Slip along the San Andreas fault associated with thegreat 1857 earthquake, Bull. Seism. Soc. Am. 68, 1421–1448.
Sieh, K. E. (1978b). Central California foreshocks of the great 1857 earth-quake, Bull. Seism. Soc. Am. 68, 1731–1749.
Steeples, D. W., and D. D. Steeples (1996). Far-field aftershocks of the1906 earthquake, Bull. Seism. Soc. Am. 86, 921–924.
Toppozada, T. R., and G. Borchardt (1998). Re-evaluation of the 1836“Hayward fault” and the 1838 San Andreas fault earthquakes, Bull.Seism. Soc. Am. 88, 140–159.
Toppozada, T., and D. Branum (2002). California earthquakes of M �5.5:their history and the areas damaged, in International Handbook ofEarthquake and Engineering Seismology (Part A), W. H. K. Lee, H.Kanamori, P. C. Jennings, and C. Kisslinger (Editors), AcademicPress, New York, 793–796 (and CD-ROM).
Toppozada, T. R., and D. L. Parke (1982). Areas damaged by Californiaearthquakes, 1900–1949, Calif. Div. Mines Geol. Open-File Rept. 82-17 SAC, 65 pp.
Toppozada, T., D. Branum, M. Petersen, C. Hallstrom, C. Cramer, and M.Reichle (2000). Epicenters of and areas damaged by M �5 Californiaearthquakes, 1800–1999, Calif. Div. Mines Geol. Map Sheet 49, scale1:1,550,000.
Toppozada, T. R., D. L. Parke, and C. T. Higgins (1978). Seismicity ofCalifornia, 1900–1931, Calif. Div. Mines Geol. Special Rept. 135,39 pp.
Townley, S. D., and M. W. Allen (1939). Descriptive catalog of earthquakesof the Pacific coast of the United States: 1769 to 1928, Bull. Seism.Soc. Am. 29, 1–297.
U.S. Geological Survey (1982). The Imperial Valley, California, Earth-quake of October 15, 1979, U.S. Geol. Surv. Profess. Pap. 1254.
U.S. Geological Survey. USGS community internet intensity maps ar-chives, http://pasadena.wr.usgs.gov/shake/ca/archives.html (last ac-cessed July 2003).
Vilanova, S. P., C. F. Nunes, and J. F. B. D. Fonseca (2003). Lisbon 1755:a case of triggered onshore rupture? Bull. Seism. Soc. Am. 93, 2056–2068.
Wald, D. J., H. Kanamori, D. V. Helmberger, and T. H. Heaton (1993).Source study of the 1906 San Francisco earthquake, Bull. Seism. Soc.Am. 83, 981–1019.
Wald, D. J., V. Quitoriano, L. A. Dengler, and J. W. Dewey (1999). Util-ization of the Internet for rapid community intensity maps, Seism.Res. Lett. 70, 680–697.
Wessel, P., and W. H. F. Smith (1991). Free software helps map and displaydata, EOS 72, 441, 445–446.
Division of Geological and Planetary SciencesCalifornia Institute of TechnologyPasadena, California [email protected]
(A.J.M.)
U.S. Geological Survey525 S. Wilson AvenuePasadena, California [email protected]
(D.J.W.)
Manuscript received 18 January 2002.
Related Documents