This presentation, including any supporting materials, is owned by Gartner, Inc. and/or its affiliates and is for the sole use of the intended Gartner audience or other authorized recipients. This presentation may contain information that is confidential, proprietary or otherwise legally protected, and it may not be further copied, distributed or publicly displayed without the express written permission of Gartner, Inc. or its affiliates. © 2010 Gartner, Inc. and/or its affiliates. All rights reserved. MEPTEC Luncheon September 14 & 15, 2011 Jim Walker Gartner After the 2010 Boom – Now What?

Welcome message from author
This document is posted to help you gain knowledge. Please leave a comment to let me know what you think about it! Share it to your friends and learn new things together.
Transcript
This presentation, including any supporting materials, is owned by Gartner, Inc. and/or its affiliates and is for the sole use of the intended Gartner audience or other authorized recipients. This presentation may contain information that is confidential, proprietary or otherwise legally protected, and it may not be further copied, distributed or publicly displayed without the express written permission of Gartner, Inc. or its affiliates.© 2010 Gartner, Inc. and/or its affiliates. All rights reserved.
MEPTEC LuncheonSeptember 14 & 15, 2011
Jim WalkerGartner
After the 2010 Boom – Now What?
Three Key Trends Shaping Forecast
• Inventory correction• Foundry and DRAM overcapacity• Macro economic trends affecting demand
1

Facts Exposing 3Q11 Inflection Point• Semiconductor companies 3Q11 guidance well below
seasonal norm and starting to see downward revisions- Current guidance points to flat 3Q11 when typical is up 8-9%- TI, Altera, Fairchild, and Vishay recently cut 3Q guidance by 5-10%
• Supply chain showing significant slowdown- TSMC’s original 3Q guidance was negative 6-8% when typical is
closer to plus 8-10%- Packaging and silicon wafer companies reporting significant
slowdown
• Semiconductor related inventory levels still elevated• Consumer confidence at 30 year low• Global Insights says odds of double-dip recession rose
from 25 to 40% in one month.
2
-6
2 3
-23-16
1720
9
1
95
-5
0
-1
0
0 -2
47
1
-30
-25
-20
-15
-10
-5
0
5
10
15
20
25
0
10
20
30
40
50
60
70
80
90
1Q08 3Q08 1Q09 3Q09 1Q10 3Q10 1Q11 3Q11 1Q12 3Q12
Revenue ($B)
Revenue Quarterly Sequential Growth
Quarterly Sequential Growth (%)
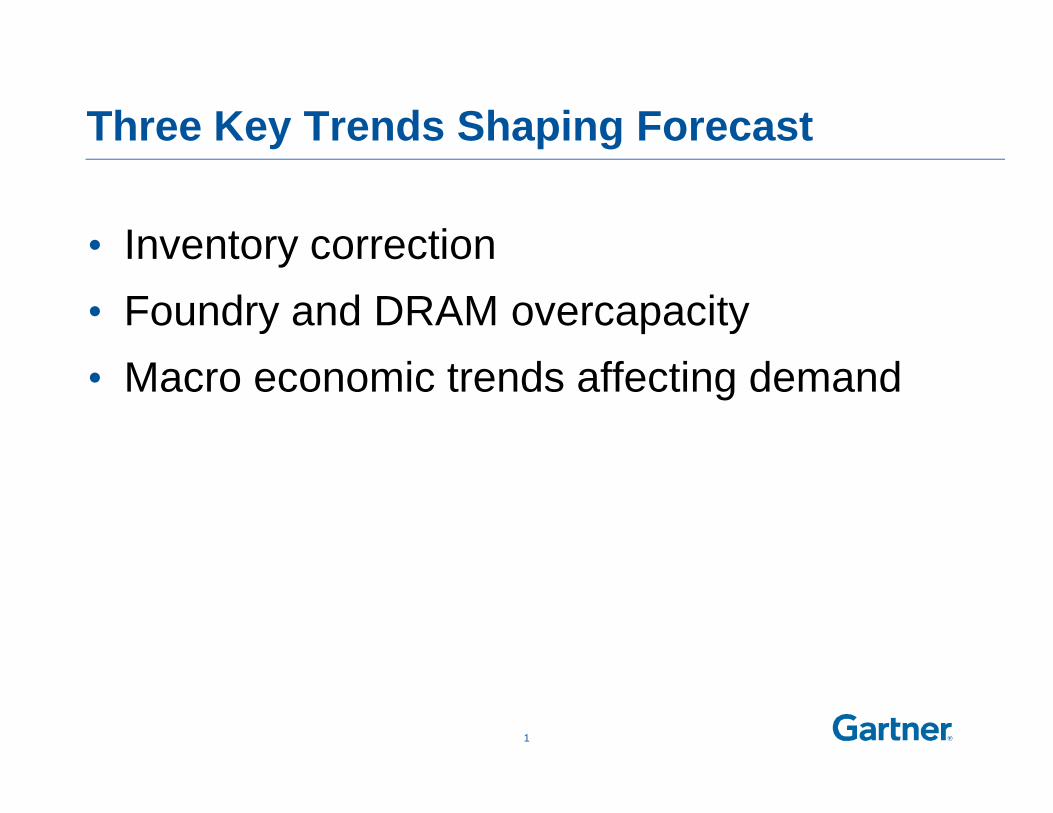
Semiconductor Quarterly Revenue Profile, 3Q11 Update: Correction and Brief Respite
Inventory Correction
Brief Recovery
Below Typical Due ToMacro Weakness
Inflection PointTypical Growth 8-9%
Source: Gartner (September 2011)
0.0
50.0
100.0
150.0
200.0
250.0
300.0
350.0
400.0
450.0
2007 2008 2009 2010 2011 2012 2013 2014 20152Q11 Forecast 3Q11 Forecast
Billions of Dollars and Revenue Growth
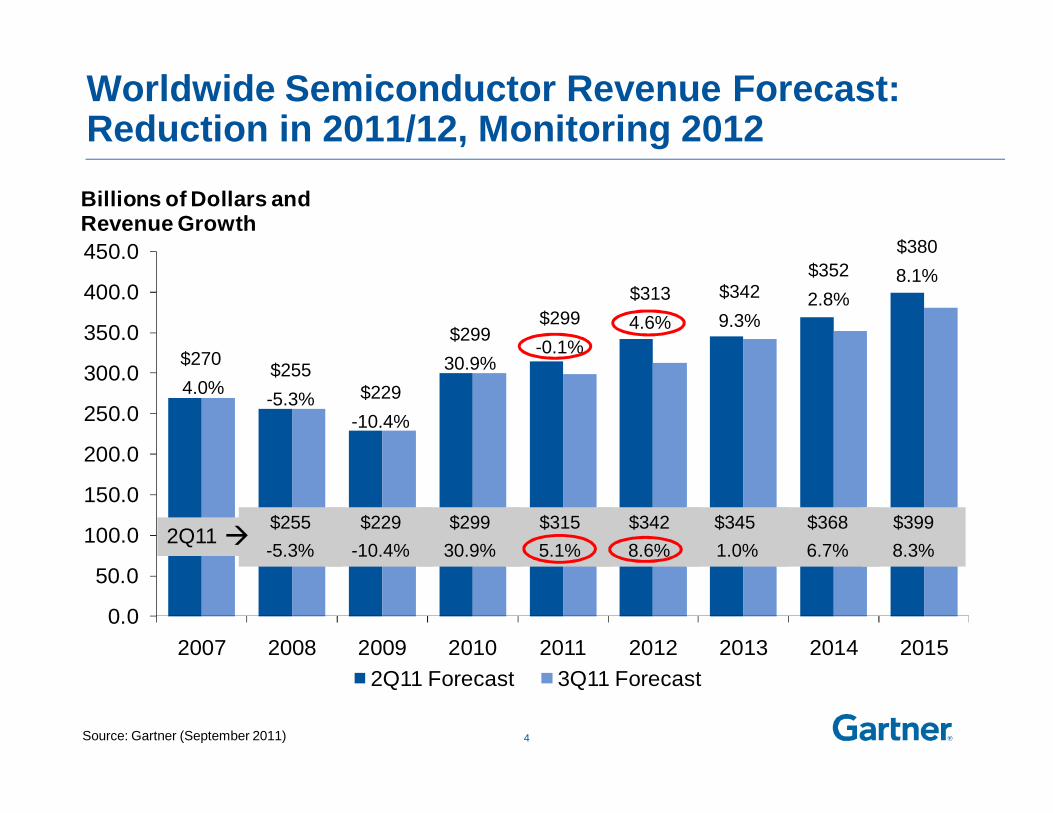
Worldwide Semiconductor Revenue Forecast: Reduction in 2011/12, Monitoring 2012
$2704.0% $229
-10.4%
$255-5.3%
$29930.9%
$299-0.1%
$3134.6%
$3429.3%
$3522.8%
$229-10.4%
$29930.9%
$3155.1%
$3428.6%
$345 1.0%
$3686.7%
$255-5.3%
2Q11
$3808.1%
4
$3998.3%
Source: Gartner (September 2011)
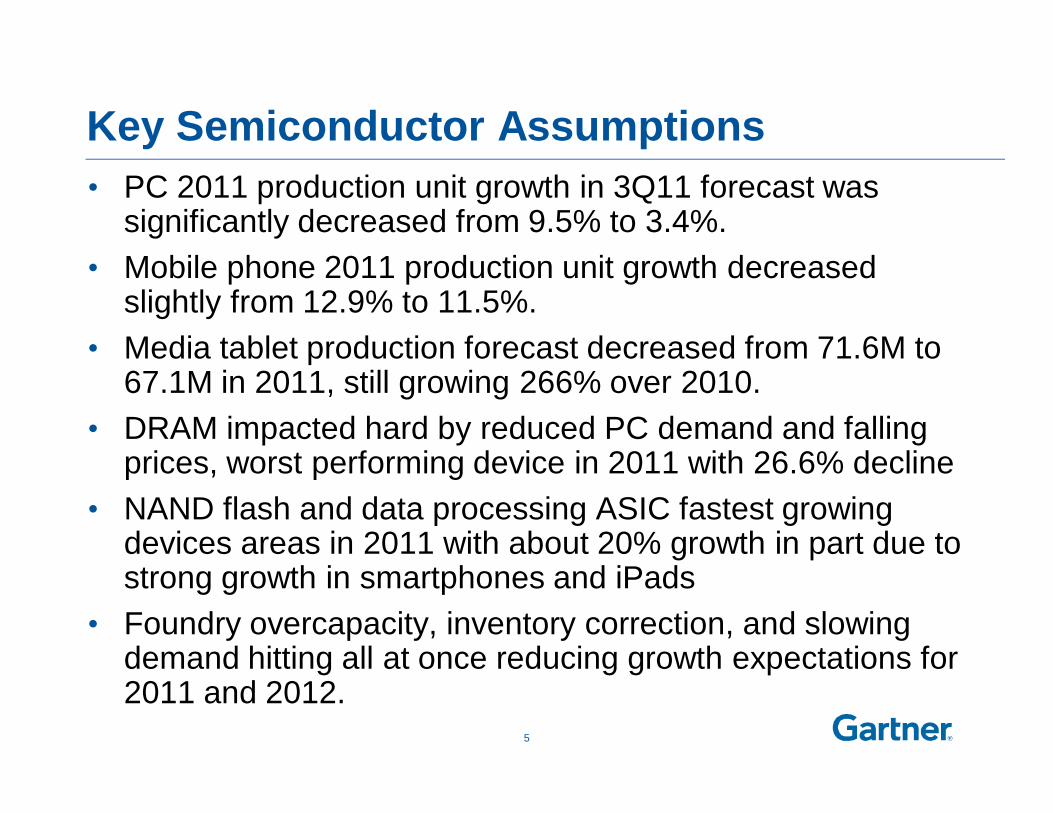
Key Semiconductor Assumptions• PC 2011 production unit growth in 3Q11 forecast was
significantly decreased from 9.5% to 3.4%.• Mobile phone 2011 production unit growth decreased
slightly from 12.9% to 11.5%.• Media tablet production forecast decreased from 71.6M to
67.1M in 2011, still growing 266% over 2010.• DRAM impacted hard by reduced PC demand and falling
prices, worst performing device in 2011 with 26.6% decline• NAND flash and data processing ASIC fastest growing
devices areas in 2011 with about 20% growth in part due to strong growth in smartphones and iPads
• Foundry overcapacity, inventory correction, and slowing demand hitting all at once reducing growth expectations for 2011 and 2012.
5

PCs and Mobile Phones Accounted for Lions Share of Reduction (Memory Market Woes lead to Half of Downside)
Applications2011 Change from Last Quarter ($B)
% of Total Decline
PC -6.0 38%
Mobile Phone -3.2 21%
Consumer -2.3 15%
Automotive -0.8 5%
Media Tablet -0.5 3%
All Other Applications -2.8 18%
Total Applications -15.6 100%Source: Gartner (September 2011)
0.40
0.60
0.80
1.00
1.20
1.40
1.60
1.80
1Q07
2Q07
3Q07
4Q07
1Q08
2Q08
3Q08
4Q08
1Q09
2Q09
3Q09
4Q09
1Q10
2Q10
3Q10
4Q10
1Q11
2Q11
3Q11
SevereExcess
CautionZone
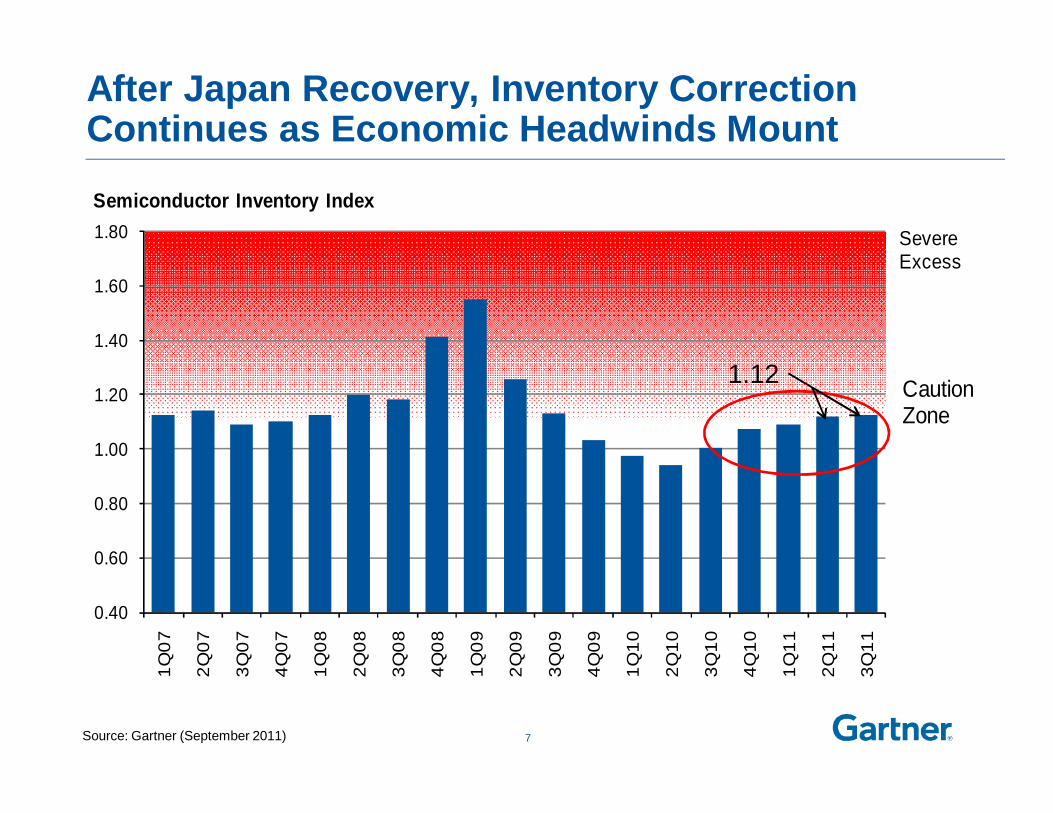
Semiconductor Inventory Index
After Japan Recovery, Inventory Correction Continues as Economic Headwinds Mount
7
1.12
Source: Gartner (September 2011)
-5 0 5 10
Other
LCD TV
Automotive
Comm Infra/Broadband
PC
Server
SSD
Media Tablet
SmartPhone
2012 Growth ($B)
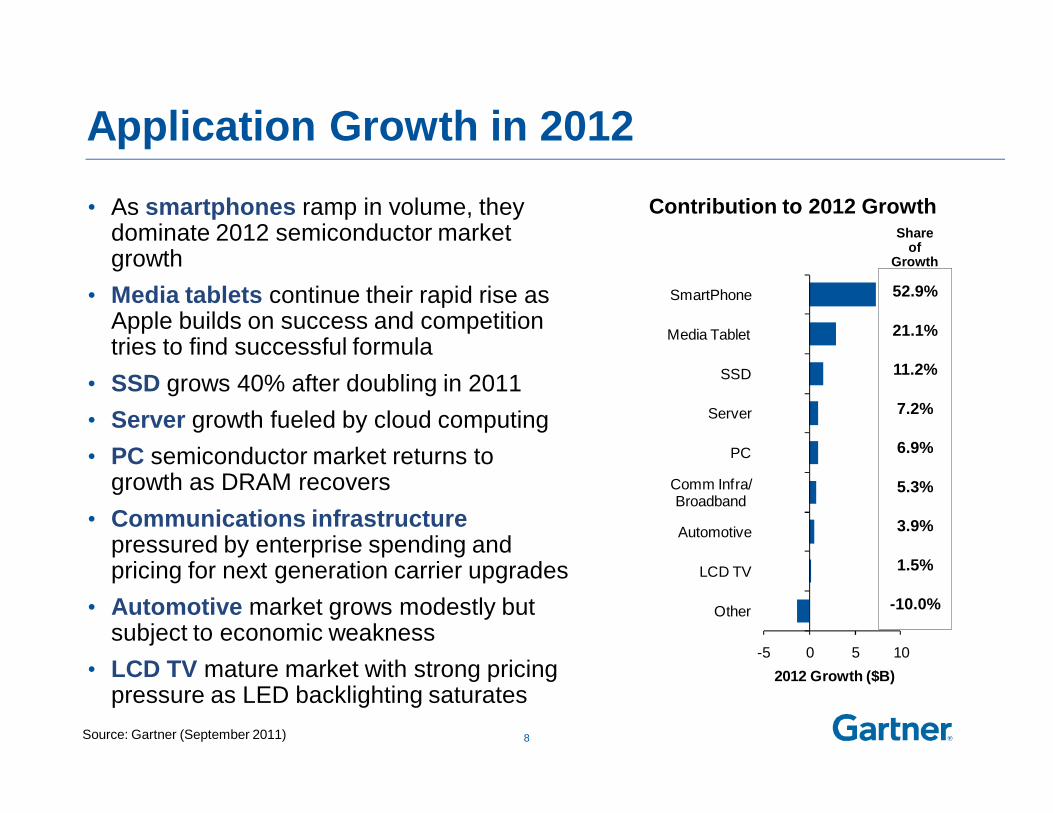
Application Growth in 2012
• As smartphones ramp in volume, they dominate 2012 semiconductor market growth
• Media tablets continue their rapid rise as Apple builds on success and competition tries to find successful formula
• SSD grows 40% after doubling in 2011• Server growth fueled by cloud computing• PC semiconductor market returns to
growth as DRAM recovers• Communications infrastructure
pressured by enterprise spending and pricing for next generation carrier upgrades
• Automotive market grows modestly but subject to economic weakness
• LCD TV mature market with strong pricing pressure as LED backlighting saturates
Contribution to 2012 GrowthShare
of Growth
8
52.9%
21.1%
11.2%
7.2%
6.9%
5.3%
3.9%
1.5%
-10.0%
Source: Gartner (September 2011)
0
50
100
150
200
250
300
350
2010 2011 2012 2013 2014 2015
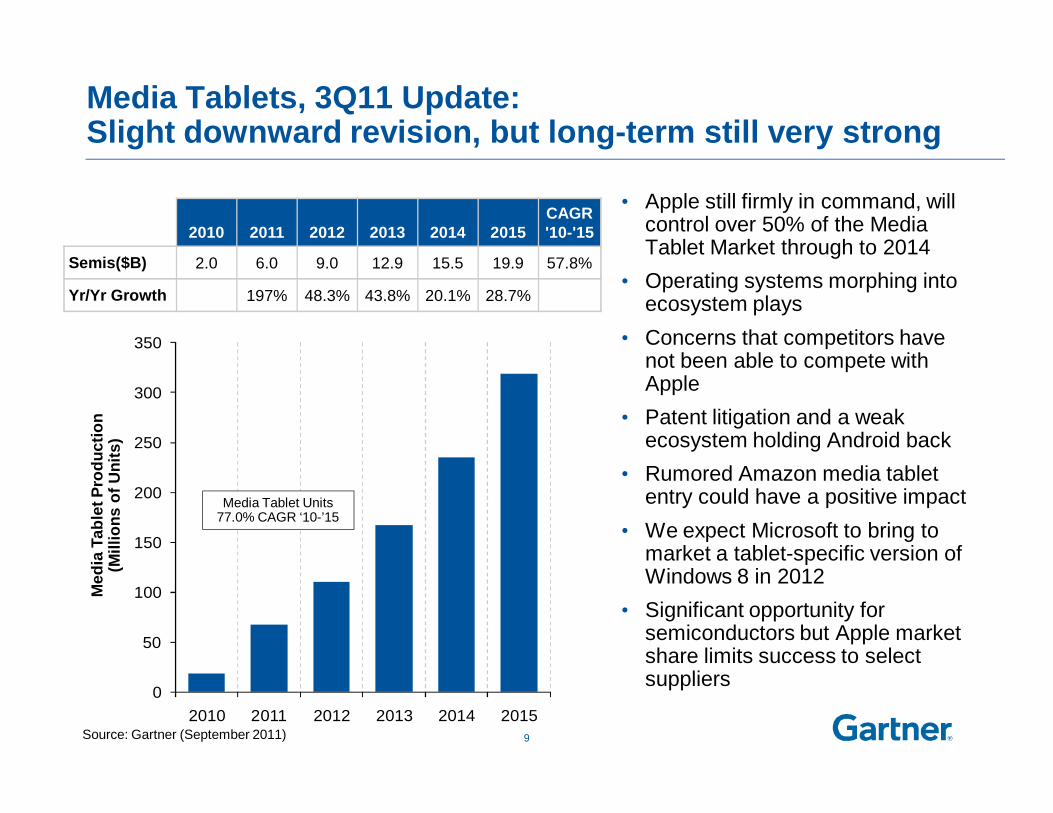
Media Tablets, 3Q11 Update: Slight downward revision, but long-term still very strong
• Apple still firmly in command, will control over 50% of the Media Tablet Market through to 2014
• Operating systems morphing into ecosystem plays
• Concerns that competitors have not been able to compete with Apple
• Patent litigation and a weak ecosystem holding Android back
• Rumored Amazon media tablet entry could have a positive impact
• We expect Microsoft to bring to market a tablet-specific version of Windows 8 in 2012
• Significant opportunity for semiconductors but Apple market share limits success to select suppliers
2010 2011 2012 2013 2014 2015 CAGR'10-'15
Semis($B) 2.0 6.0 9.0 12.9 15.5 19.9 57.8%
Yr/Yr Growth 197% 48.3% 43.8% 20.1% 28.7%
Media Tablet Units77.0% CAGR ‘10-’15
Med
ia T
able
t Pro
duct
ion
(Mill
ions
of U
nits
)
9Source: Gartner (September 2011)
Application Summary• Consumer spending focused on computing but attention is moving away from
PCs to alternatives including media tablets and smartphones• Large ecosystems will continue dominate the consumer and enterprise
mobile markets• As Apple’s market share in electronics increases, it reduces the growth
opportunity for semiconductor vendors without Apple design wins• As users adopt more devices, they are using them in a complementary
fashion across similar content or applications. These distinctions will keep substitution between devices to a minimum.
• Weakness in the PC market led to almost 40% of the reduction in 2011 semiconductor forecast
• With weakening economy enterprises will continue to find ways to extend the life of aging PCs and delay upgrading to Windows 7
• Nearly 85% of 2012 semiconductor growth will come from just 3 applications – out of over 100 applications tracked; big 3 represent 70% of growth through 2015
10
3Q11 DRAM Forecast • Significant changes to DRAM forecast over the next couple of years
• Faltering economy and slowdown in demand, especially in PCs, once again tipped the market into oversupply and pricing collapse
• Mainstream device pricing now close to or below variable cost for least efficient manufacturers
• We expect pricing to bottom-out and even increase slightly before year end due to mild seasonal demand & channel inventory correction
• Higher DRAM content growth in PCs and stronger production growth though 2012 will move the market back into undersupply
• Further mild increase in pricing in 2012 will move the vendors back into profitability
• Capacity expansion decisions will be delayed until mid 2012 with little or no new capacity coming online before 2014
11

Worldwide DRAM Supply & Demand
0
250
500
750
1,000
1,250
1,500
94%
96%
98%
100%
102%
104%
1Q08
2Q08
3Q08
4Q08
1Q09
2Q09
3Q09
4Q09
1Q10
2Q10
3Q10
4Q10
1Q11
2Q11
3Q11
4Q11
1Q12
2Q12
3Q12
4Q12
DRAM Supply DRAM Demand DRAM Sufficiency
Billions of MegabytesSupply/Demand Sufficiency
12
Source: Gartner, September 2011“Forecast: DRAM Supply and Demand, Worldwide, 1Q10-4Q12, 3Q11 Update” [G00217351]
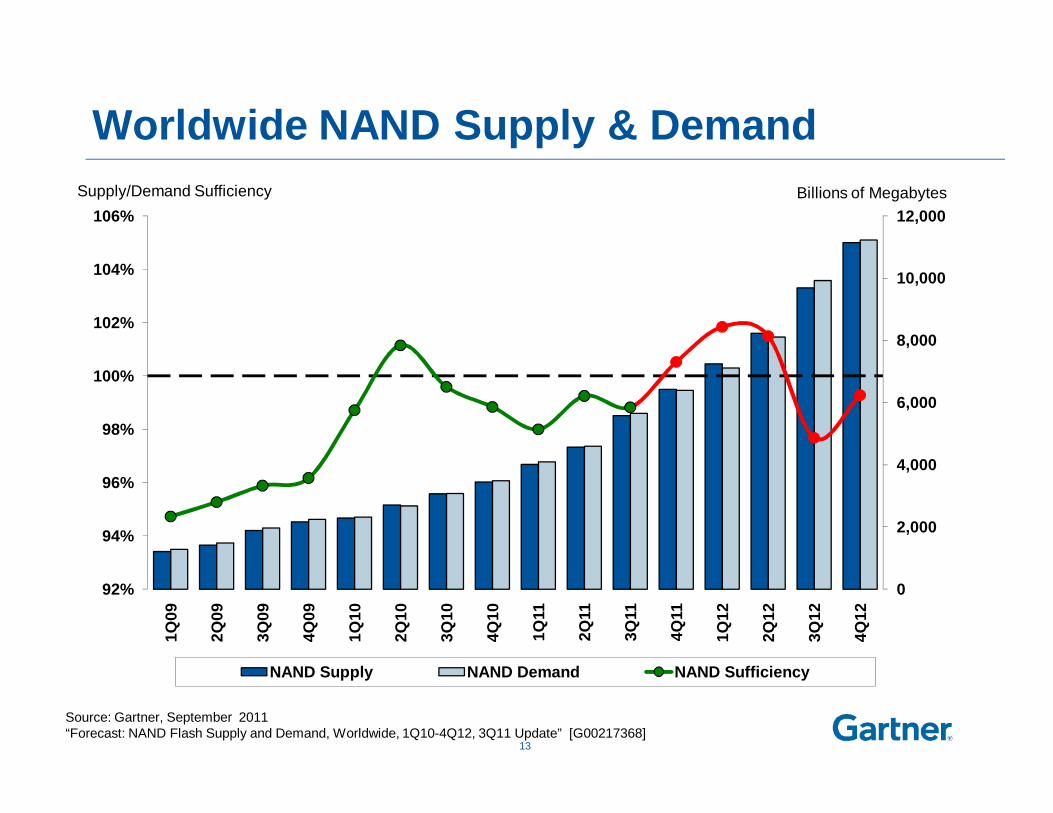
Worldwide NAND Supply & Demand
0
2,000
4,000
6,000
8,000
10,000
12,000
92%
94%
96%
98%
100%
102%
104%
106%
1Q09
2Q09
3Q09
4Q09
1Q10
2Q10
3Q10
4Q10
1Q11
2Q11
3Q11
4Q11
1Q12
2Q12
3Q12
4Q12
NAND Supply NAND Demand NAND Sufficiency
Billions of MegabytesSupply/Demand Sufficiency
13
Source: Gartner, September 2011“Forecast: NAND Flash Supply and Demand, Worldwide, 1Q10-4Q12, 3Q11 Update” [G00217368]

0
5,000
10,000
15,000
20,000
25,000
2004 2005 2006 2007 2008 2009 2010 2011 2012 2013 2014 2015
DRAM NAND Flash
Memory Spending: NAND Passes DRAM in 2011
$M
Source: Gartner (September 2011)
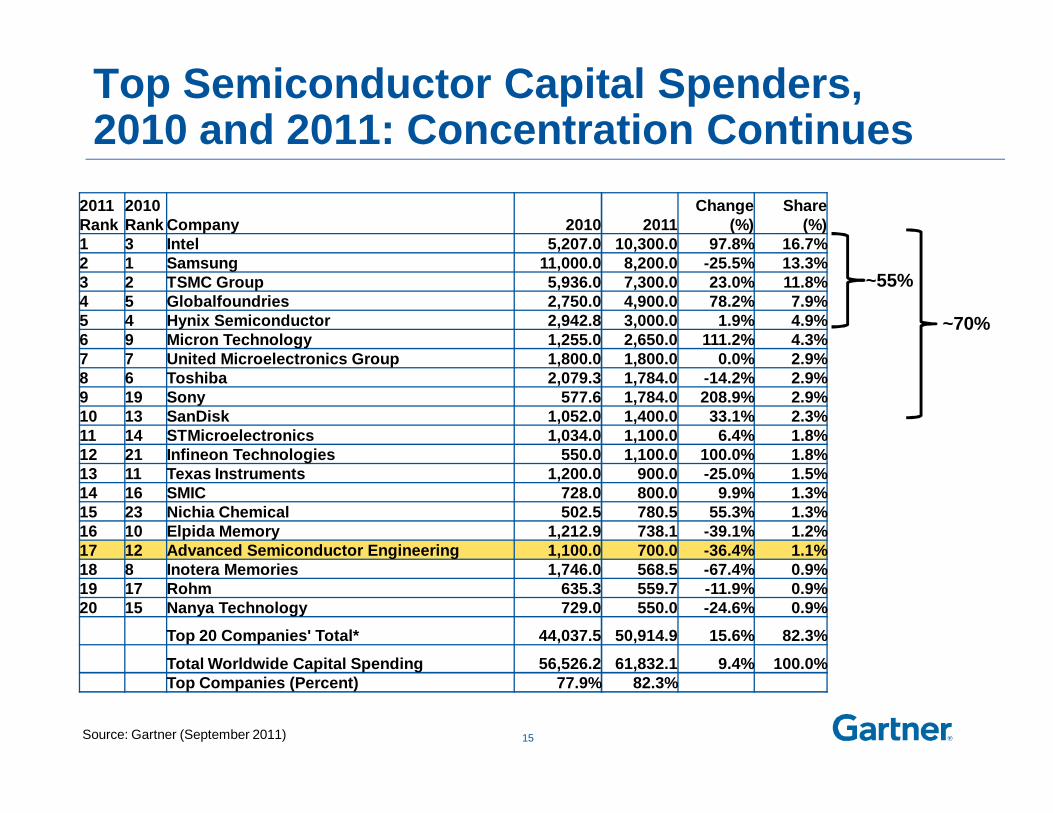
Top Semiconductor Capital Spenders, 2010 and 2011: Concentration Continues
15
2011 Rank
2010 Rank Company 2010 2011
Change (%)
Share (%)
1 3 Intel 5,207.0 10,300.0 97.8% 16.7%2 1 Samsung 11,000.0 8,200.0 -25.5% 13.3%3 2 TSMC Group 5,936.0 7,300.0 23.0% 11.8%4 5 Globalfoundries 2,750.0 4,900.0 78.2% 7.9%5 4 Hynix Semiconductor 2,942.8 3,000.0 1.9% 4.9%6 9 Micron Technology 1,255.0 2,650.0 111.2% 4.3%7 7 United Microelectronics Group 1,800.0 1,800.0 0.0% 2.9%8 6 Toshiba 2,079.3 1,784.0 -14.2% 2.9%9 19 Sony 577.6 1,784.0 208.9% 2.9%10 13 SanDisk 1,052.0 1,400.0 33.1% 2.3%11 14 STMicroelectronics 1,034.0 1,100.0 6.4% 1.8%12 21 Infineon Technologies 550.0 1,100.0 100.0% 1.8%13 11 Texas Instruments 1,200.0 900.0 -25.0% 1.5%14 16 SMIC 728.0 800.0 9.9% 1.3%15 23 Nichia Chemical 502.5 780.5 55.3% 1.3%16 10 Elpida Memory 1,212.9 738.1 -39.1% 1.2%17 12 Advanced Semiconductor Engineering 1,100.0 700.0 -36.4% 1.1%18 8 Inotera Memories 1,746.0 568.5 -67.4% 0.9%19 17 Rohm 635.3 559.7 -11.9% 0.9%20 15 Nanya Technology 729.0 550.0 -24.6% 0.9%
Top 20 Companies' Total* 44,037.5 50,914.9 15.6% 82.3%
Total Worldwide Capital Spending 56,526.2 61,832.1 9.4% 100.0%Top Companies (Percent) 77.9% 82.3%
~55%
~70%
Source: Gartner (September 2011)
16
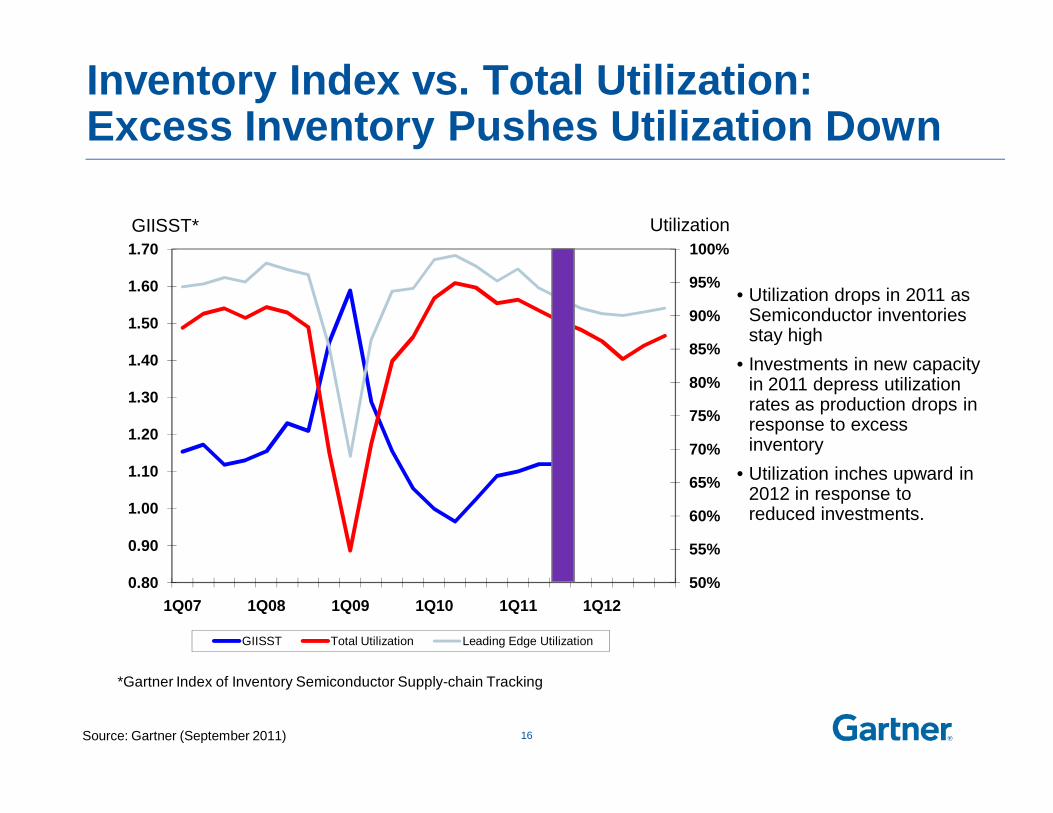
Inventory Index vs. Total Utilization:Excess Inventory Pushes Utilization Down
50%
55%
60%
65%
70%
75%
80%
85%
90%
95%
100%
0.80
0.90
1.00
1.10
1.20
1.30
1.40
1.50
1.60
1.70
1Q07 1Q08 1Q09 1Q10 1Q11 1Q12
GIISST Total Utilization Leading Edge Utilization
• Utilization drops in 2011 as Semiconductor inventories stay high
• Investments in new capacity in 2011 depress utilization rates as production drops in response to excess inventory
• Utilization inches upward in 2012 in response to reduced investments.
GIISST* Utilization
*Gartner Index of Inventory Semiconductor Supply-chain Tracking
Source: Gartner (September 2011)
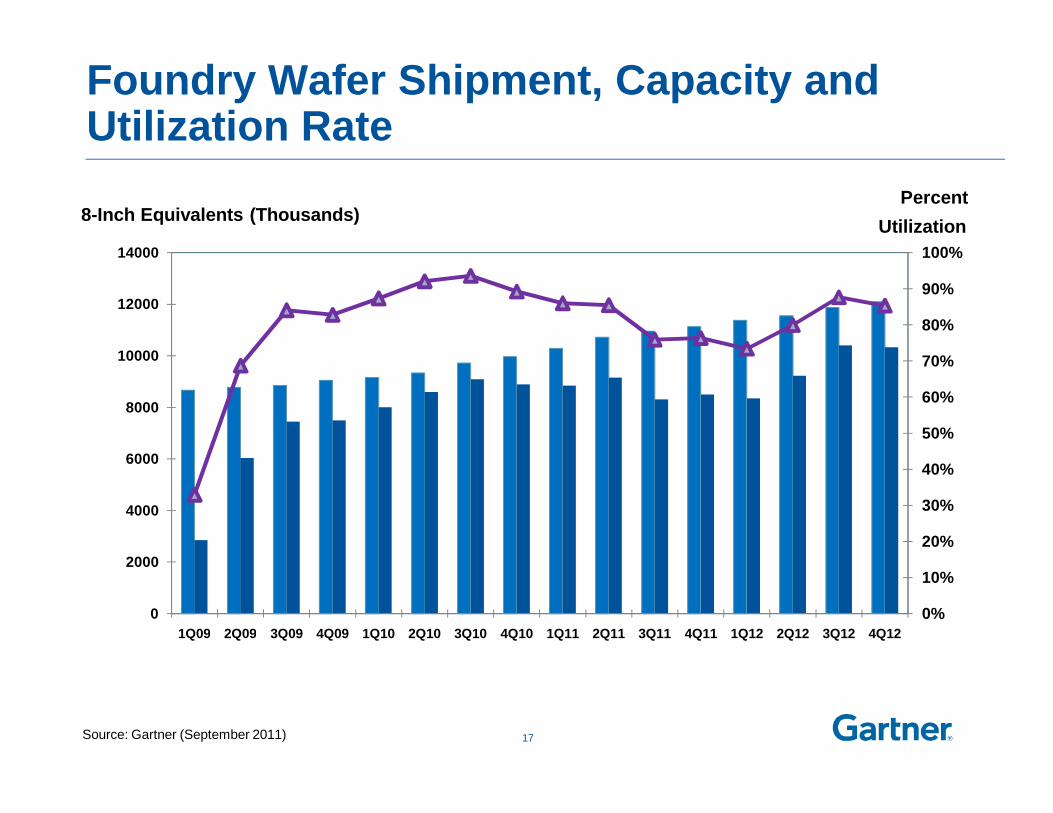
Foundry Wafer Shipment, Capacity and Utilization Rate
17
8-Inch Equivalents (Thousands)Percent
Utilization
0%
10%
20%
30%
40%
50%
60%
70%
80%
90%
100%
0
2000
4000
6000
8000
10000
12000
14000
1Q09 2Q09 3Q09 4Q09 1Q10 2Q10 3Q10 4Q10 1Q11 2Q11 3Q11 4Q11 1Q12 2Q12 3Q12 4Q12
Source: Gartner (September 2011)
SATS (OSAT) Market Overview
• The transition from gold to copper bonding will become widespread as gold approaches $2,000 oz.
• Move to lower cost Flip Chip (Cu Pillar) increasing as gold price increases.
• Utilization rates decreasing: Q2 was around 80% for most of the major SATS firms. Q3 to be same or slightly lower.
• Increased use of outsourcing model for capital conservation will be a major driver throughout forecast period.
• Advanced processes including flip chip, WLP and TSV will provide increased value-add for SATS providers.
18
19
The Rise of SATS
• Since 1997, the revenue growth of the SATS market has more than quadrupled from $5.1 Billion to $23.6 Billion in 2010.
• During this period, the SATS share of the total semiconductor packaging market grew from 19.6% to 48.7% in 2010.
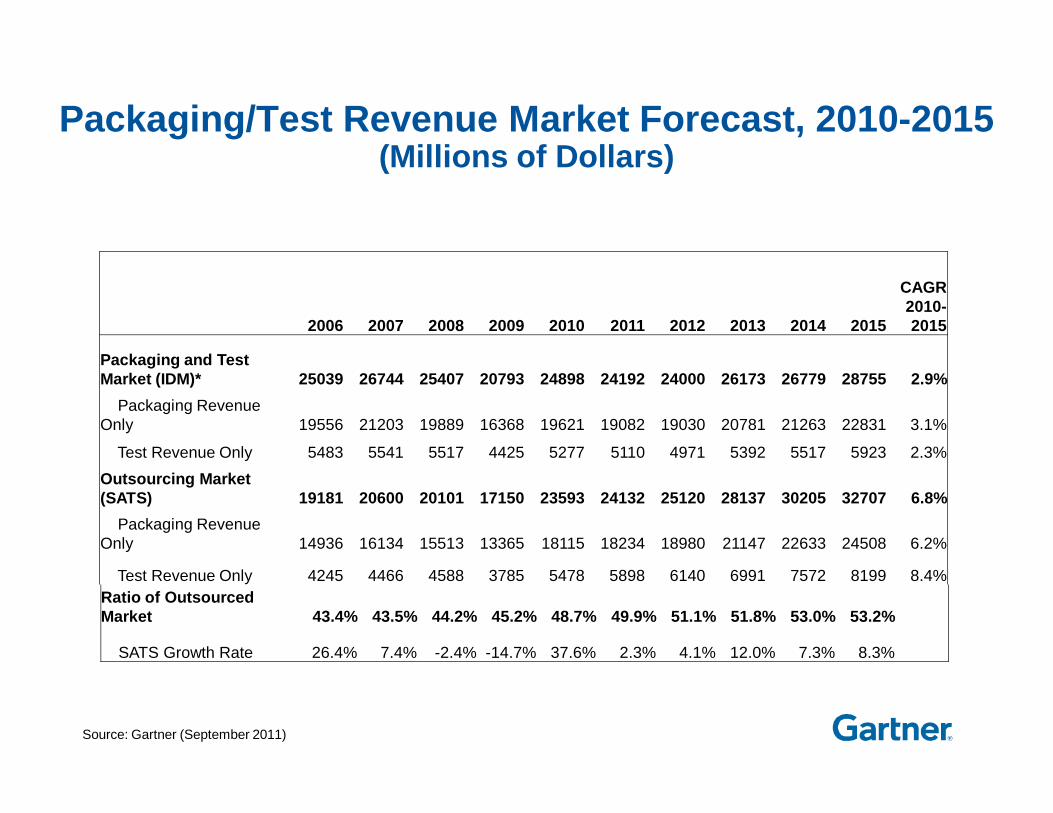
Packaging/Test Revenue Market Forecast, 2010-2015(Millions of Dollars)
Source: Gartner (September 2011)
2006 2007 2008 2009 2010 2011 2012 2013 2014 2015
CAGR 2010-2015
Packaging and Test Market (IDM)* 25039 26744 25407 20793 24898 24192 24000 26173 26779 28755 2.9%
Packaging Revenue Only 19556 21203 19889 16368 19621 19082 19030 20781 21263 22831 3.1%
Test Revenue Only 5483 5541 5517 4425 5277 5110 4971 5392 5517 5923 2.3%Outsourcing Market (SATS) 19181 20600 20101 17150 23593 24132 25120 28137 30205 32707 6.8%
Packaging Revenue Only 14936 16134 15513 13365 18115 18234 18980 21147 22633 24508 6.2%
Test Revenue Only 4245 4466 4588 3785 5478 5898 6140 6991 7572 8199 8.4%Ratio of Outsourced Market 43.4% 43.5% 44.2% 45.2% 48.7% 49.9% 51.1% 51.8% 53.0% 53.2%
SATS Growth Rate 26.4% 7.4% -2.4% -14.7% 37.6% 2.3% 4.1% 12.0% 7.3% 8.3%
21
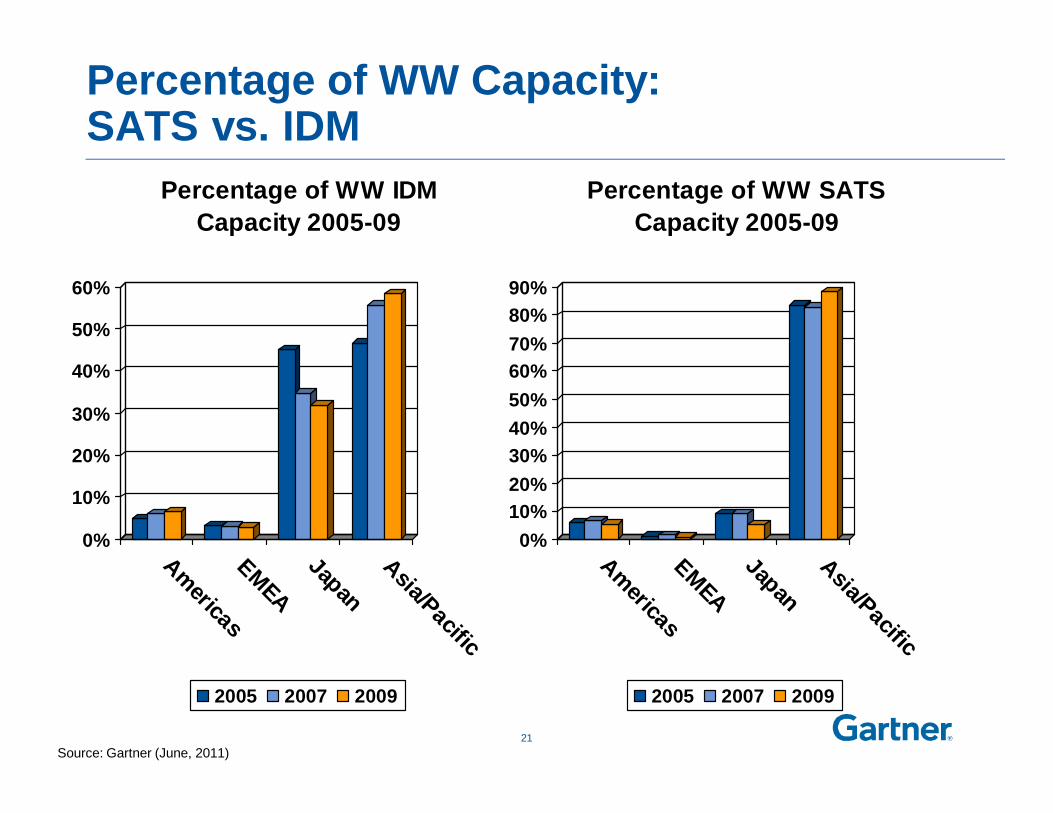
Percentage of WW Capacity: SATS vs. IDM
0%
10%
20%
30%
40%
50%
60%
AmericasEMEAJapanAsia/Pacific
Percentage of WW IDM Capacity 2005-09
2005 2007 2009
0%10%20%30%40%50%60%70%80%90%
AmericasEMEAJapanAsia/Pacific
Percentage of WW SATS Capacity 2005-09
2005 2007 2009
Source: Gartner (June, 2011)

SATS Market Share for 2010(Millions of US Dollars)
22
2009 Rank
2010 Rank
Change in Rank Company
2009 Revenue
2010 Revenue
Change 2009-2010
(%)
2010 Market
Share (%)1 1 0 ASE 2,547.0 3,902.7 53.2 16.52 2 0 Amkor Technology 2,179.1 2,939.0 34.9 12.53 3 0 SPIL 1,761.2 2,104.0 19.5 8.94 4 0 STATS ChipPAC 1,326.0 1,677.8 26.5 7.15 5 0 Powertech Technology 947.0 1,173.0 23.9 5.06 6 0 UTAC 601.0 925.0 53.9 3.9
19 7 12 J-Devices 165.0 600.0 263.6 2.57 8 -1 ChipMOS Technologies 380.3 590.6 55.3 2.5
8 9 -1Jiangsu Changjiang Electronics Technology 347.0 531.0 53.0 2.3
9 10 -1 King Yuan Electronics 318.0 490.0 54.1 2.110 11 -1 Unisem 300.0 433.3 44.4 1.817 12 5 Chipbond Technology 170.0 431.0 153.5 1.811 13 -2 Carsem Semiconductor 275.0 394.0 43.3 1.712 14 -2 Formosa Advanced Technologies 271.0 375.0 38.4 1.613 15 -2 Greatek 267.0 324.0 21.3 1.416 16 0 STS Semiconductor 180.0 322.0 78.9 1.418 17 1 Walton Advanced Engineering 168.3 260.0 54.5 1.115 18 -3 Nantong Fujitsu Microelectronics 181.0 253.6 40.1 1.126 19 7 Hana Micron 129.0 230.0 78.3 1.025 20 5 Hana Microelectronics 130.5 219.4 68.1 0.9
Top 20 Total 12,643.4 18,175.3 43.8 77.0Other Companies 4,506.6 5,417.2 20.2 23.0Total Market 17,150.0 23,592.5 37.6 100.0
Source: Gartner (June, 2011)
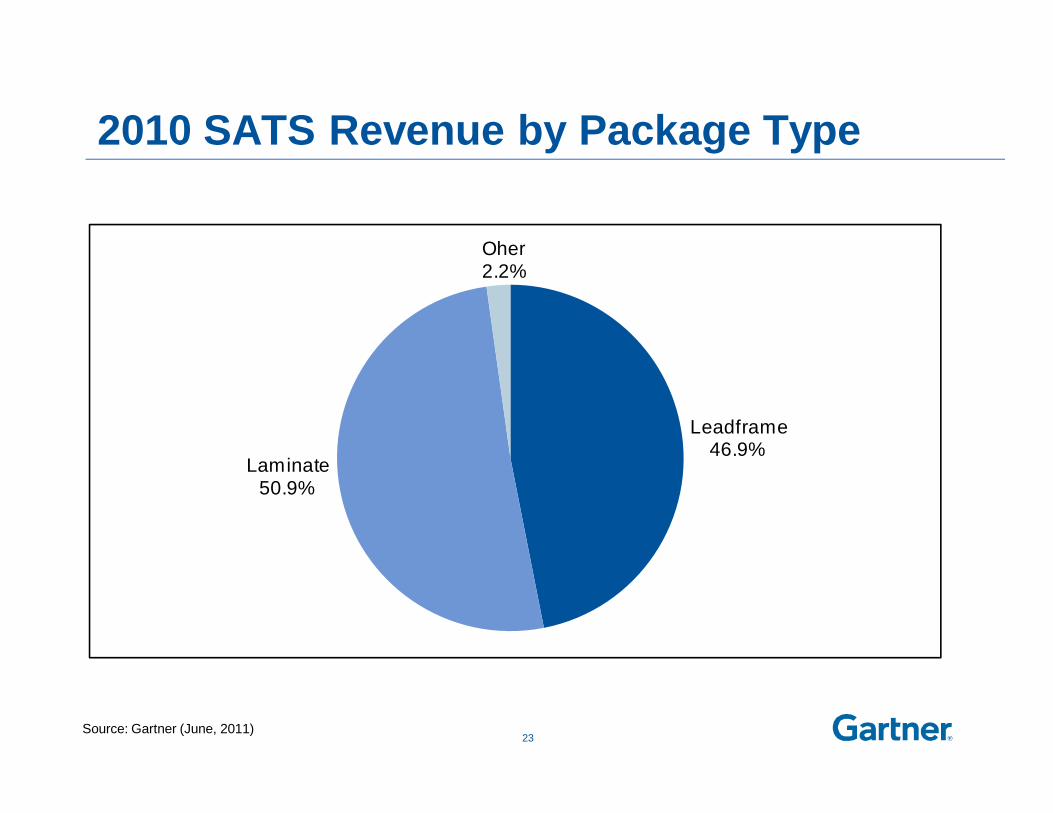
2010 SATS Revenue by Package Type
23
Leadframe46.9%
Laminate50.9%
Oher2.2%
Source: Gartner (June, 2011)

2010 SATS Revenue by Application
24
Communications39.3%
Computer23.6%
Consumer27.1%
Automotive4.9%
Other5.1%
Source: Gartner (June, 2011)

Top 10 SATS Capital Spenders (Millions of Dollars)
2011 2010Rank Rank Companies 2010 2011 Growth Share
1 1 Advanced Semiconductor Engineering 1,100.0 900.0 -18.2% 20.6%
2 2 SPIL 500.0 533.0 6.6% 12.2%
3 3 Amkor Technology 445.7 450.0 1.0% 10.3%
4 4 Powertech Technology 400.0 368.0 -8.0% 8.4%
5 5 STATS ChipPAC 286.0 260.0 -9.1% 5.9%
6 6 UTAC 235.0 254.7 8.4% 5.8%
7 10 Formosa Advanced Technologies 156.0 160.6 3.0% 3.7%
8 12 Jiangsu Changjiang Electronic (JCET) 115.2 124.9 8.4% 2.9%
9 11 Chipmos Technology Bermuda 145.4 105.0 -27.8% 2.4%
10 13 KYEC 105.0 105.0 0.0% 2.4%
Other Companies 1,311.1 1,114.3 -15.0% 25.5%
Total SATS Capex 4,799.4 4,375.6 -8.8% 100.0%Source: Gartner (June, 2011)

30 115
800
2200
0
500
1000
1500
2000
2500
1980 1990 2000 2010
Number of Packages
Package Selection Growth
Source: Gartner (June, 2011)
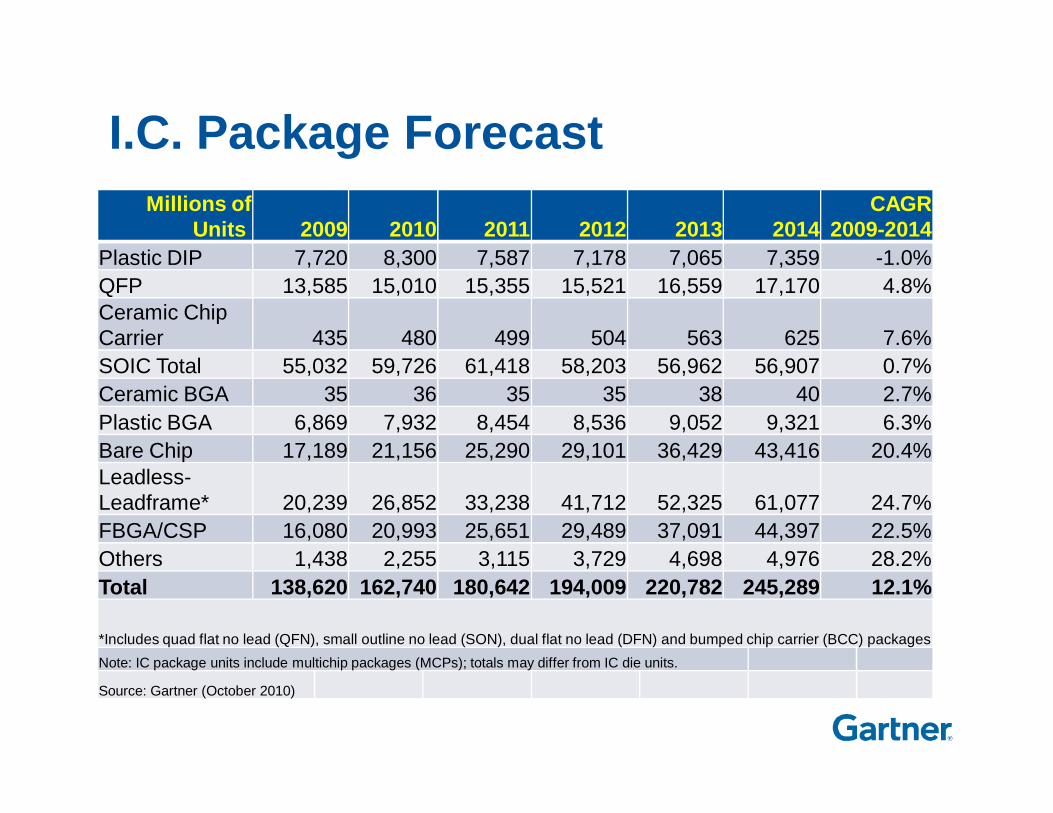
I.C. Package ForecastMillions of
Units 2009 2010 2011 2012 2013 2014CAGR
2009-2014Plastic DIP 7,720 8,300 7,587 7,178 7,065 7,359 -1.0%QFP 13,585 15,010 15,355 15,521 16,559 17,170 4.8%Ceramic Chip Carrier 435 480 499 504 563 625 7.6%SOIC Total 55,032 59,726 61,418 58,203 56,962 56,907 0.7%Ceramic BGA 35 36 35 35 38 40 2.7%Plastic BGA 6,869 7,932 8,454 8,536 9,052 9,321 6.3%Bare Chip 17,189 21,156 25,290 29,101 36,429 43,416 20.4%Leadless-Leadframe* 20,239 26,852 33,238 41,712 52,325 61,077 24.7%FBGA/CSP 16,080 20,993 25,651 29,489 37,091 44,397 22.5%Others 1,438 2,255 3,115 3,729 4,698 4,976 28.2%Total 138,620 162,740 180,642 194,009 220,782 245,289 12.1%
*Includes quad flat no lead (QFN), small outline no lead (SON), dual flat no lead (DFN) and bumped chip carrier (BCC) packagesNote: IC package units include multichip packages (MCPs); totals may differ from IC die units.
Source: Gartner (October 2010)

Source for GDP data: IHS Global Insight
Q3 Forecast Growth Scorecard Summary 2011 2012
Revenue Growth (%) -6 Mos -3 Mos Now -6 Mos -3 Mos NowGlobal Real GDP +3.5 +3.3 +2.9 +3.5 +3.7 +3.3U.S. Real GDP +3.2 +2.7 +1.6 +2.9 +2.9 +1.9Elec. Equipment1 +7.4 +7.5 +6.5 +7.0 +7.3 +6.2Semiconductor2 +6.2 +5.1 -0.1 +9.1 +8.6 +4.6Foundry +10.2 +9.0 +4.2 +11.1 +11.2 +6.1SATS +11.3 +8.0 +2.3 +10.5 +10.3 +4.1Capital Spending +11.9 +11.9 +9.4 -2.7 -2.6 -16.7Equip. Spending +12.4 +10.2 +7.1 -6.0 -6.1 -19.2WFE +13.2 +11.7 +9.4 -5.7 -3.3 -19.6PAE +9.6 +3.6 -1.4 +6.8 -15.5 -17.5ATE +10.1 +6.9 +0.4 +8.0 -18.7 -18.1
Silicon (MSI) +6.9 +4.2 +0.2 +8.7 +10.0 +3.41 Production revenue2 Excluding solar
Source: Gartner (September 2011)
Conclusions• Inventory correction and reduced holiday build having
major impact in 3Q11• Short-term growth impacted as all three major events are
hitting at once (inventory correction, overcapacity, and slowing demand)
• Macroeconomic picture will need to be watched closely to rebalance 2012 supply with demand
• Most-likely semiconductor growth for 2011 and 2012 to negative 0.1% and 4.6%, respectively
• Risk in 2011/2012 if economy takes a turn for the worse –negative case is -2.2% for 2011 and -4.9% for 2012
• 2013 rebounds as ASPs recover
29

Upcoming Gartner Semiconductor Events
Semiconductor Asia Pacific Roadshow • Singapore – 3 October 2011• Taipei – 6 October 2011 • Seoul – 11 October 2011For more information and to register, please visit
https://www.eiseverywhere.com/ehome/index.php?eventid=27998&
Save the dates!Gartner Semiconductor Local Briefings:• 1 November 2011, Egham, Surrey, U.K.• 3 November 2011, DoubleTree Hotel, San Jose, California
30
For more information, please contact Becky Tonnesen at [email protected]
Related Documents