AFRL-HE-WP-TR-1999-0152 UNITED STATES AIR FORCE RESEARCH LABORATORY THE EFFECTS OF HYPOBARIC HYPOXIA ON PSYCHOPHYSIOLOGICAL MEASURES OF COGNITIVE FUNCTIONING AND PERFORMANCE Carolyne A. Swain LOGICON TECHNICAL SERVICES, INC. P.O. BOX 317258 DAYTON OH 45431-7258 Chrysoula Kourtidou WRIGHT STATE UNIVERSITY SCHOOL OF MEDICINE DAYTON OH 45432 Glenn F. Wilson HUMAN EFFECTIVENESS DIRECTORATE CREW SYSTEM INTERFACE DIVISION WRIGHT-PATTERSON AFB OH 45433-7022 MARCH 1999 INTERIM REPORT FOR THE PERIOD MARCH 1994 TO MAY 1995 Approved for public release; distribution is unlimited Human Effectiveness Directorate Crew System Interface Division 2255 H Street Wright-Patterson AFB OH 45433-7022 DTIC QUALITY INSPECTED 4

Welcome message from author
This document is posted to help you gain knowledge. Please leave a comment to let me know what you think about it! Share it to your friends and learn new things together.
Transcript
AFRL-HE-WP-TR-1999-0152
UNITED STATES AIR FORCE RESEARCH LABORATORY
THE EFFECTS OF HYPOBARIC HYPOXIA ON PSYCHOPHYSIOLOGICAL MEASURES OF COGNITIVE
FUNCTIONING AND PERFORMANCE
Carolyne A. Swain LOGICON TECHNICAL SERVICES, INC.
P.O. BOX 317258 DAYTON OH 45431-7258
Chrysoula Kourtidou
WRIGHT STATE UNIVERSITY SCHOOL OF MEDICINE
DAYTON OH 45432
Glenn F. Wilson
HUMAN EFFECTIVENESS DIRECTORATE CREW SYSTEM INTERFACE DIVISION
WRIGHT-PATTERSON AFB OH 45433-7022
MARCH 1999
INTERIM REPORT FOR THE PERIOD MARCH 1994 TO MAY 1995
Approved for public release; distribution is unlimited Human Effectiveness Directorate Crew System Interface Division 2255 H Street Wright-Patterson AFB OH 45433-7022
DTIC QUALITY INSPECTED 4

NOTICES
When US Government drawings, specifications, or other data are used for any purpose other than a definitely related Government procurement operation, the Government thereby incurs no responsibility nor any obligation whatsoever, and the fact that the Government may have formulated, furnished, or in any way supplied the said drawings, specifications, or other data, is not to be regarded by implication or otherwise, as in any manner licensing the holder or any other person or corporation, or conveying any rights or permission to manufacture, use, or sell any patented invention that may in any way be related thereto.
Please do not request copies of this report from the Air Force Research Laboratory. Additional copies may be purchased from:
National Technical Information Service 5285 Port Royal Road Springfield, Virginia 22161
Federal Government agencies registered with the Defense Technical Information Center should direct requests for copies of this report to:
Defense Technical Information Center 8725 John J. Kingman Road, Suite 0944 Ft. Belvoir, Virginia 22060-6218
TECHNICAL REVIEW AND APPROVAL
AFRL-HE-WP-TR-1999-0152
This report has been reviewed by the Office of Public Affairs (PA) and is releasable to the National Technical Information Service (NTIS). At NTIS, it will be available to the general public, including foreign nations.
The voluntary informed consent of the subjects used in this research was obtained as required by Air Force Instruction 40-402.
This technical report has been reviewed and is approved for publication.
FOR THE COMMANDER
\KJJ\ HENDRICK W. RUCK, PhD Chief, Crew System Interface Division Air Force Research Laboratory
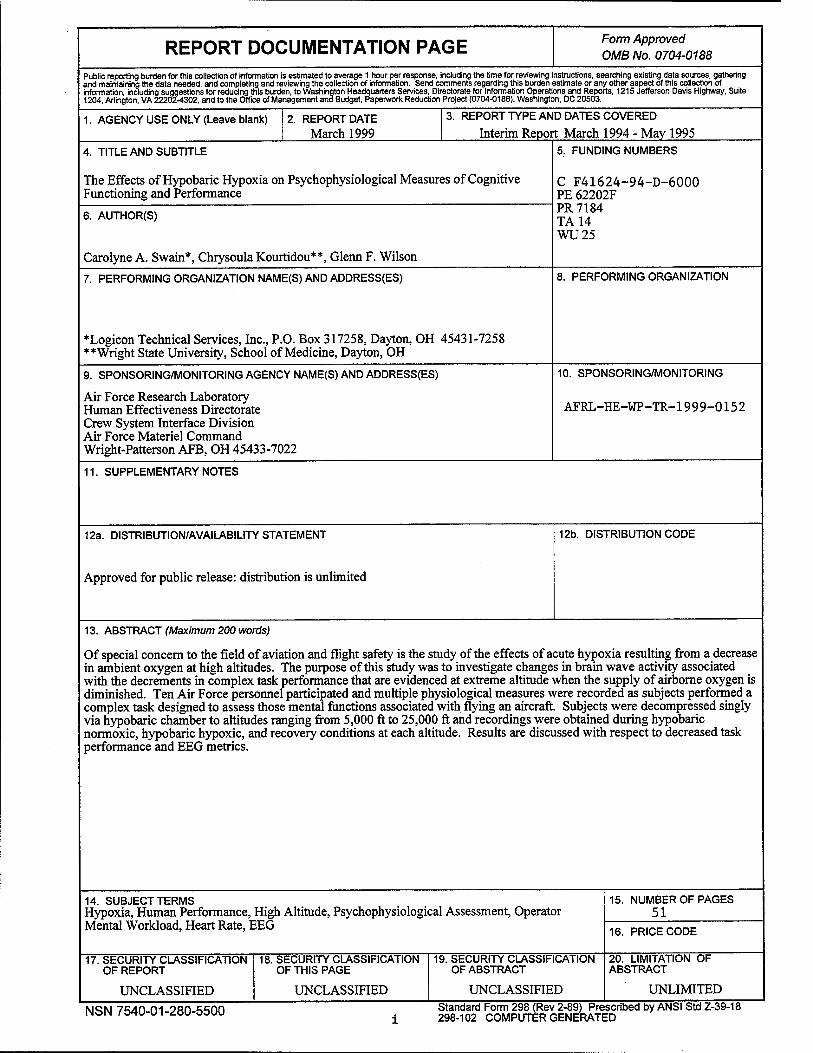
REPORT DOCUMENTATION PAGE Form Approved
OMB No. 0704-0188
Public reporting bunten for this collection of information is estimated to average 1 hour per response, including the time for reviewing instructions, searching existing data sources, gathering and maintaining the data needed, and completing and reviewing the collection of information. Send comments regarding this burden estimate or any other aspect of this collection of information including suggestions for reducing this burden, to Washington Headquarters Services, Directorate for Information Operations and Reports, 1215 Jefferson Davis Highway, Suite 1204, Arlington, VA 22202-4302, and to the Office of Management and Budget, Paperwork Reduction Project (0704-0188), Washington, DC 20503.
1. AGENCY USE ONLY (Leave blank) 2. REPORT DATE
March 1999 3. REPORT TYPE AND DATES COVERED
Interim Report March 1994 - May 1995 4. TITLE AND SUBTITLE
The Effects of Hypobaric Hypoxia on Psychophysiological Measures of Cognitive Functioning and Performance
6. AUTHOR(S)
Carolyne A. Swain*, Chrysoula Kourtidou**, Glenn F. Wilson
5. FUNDING NUMBERS
C F41624-94-D-6000 PE 62202F PR 7184 TA14 WU25
7. PERFORMING ORGANIZATION NAME(S) AND ADDRESS(ES)
*Logicon Technical Services, Inc., P.O. Box 317258, Dayton, OH 45431-7258 ** Wright State University, School of Medicine, Dayton, OH
8. PERFORMING ORGANIZATION
9. SPONSORING/MONITORING AGENCY NAME(S) AND ADDRESS(ES)
Air Force Research Laboratory Human Effectiveness Directorate Crew System Interface Division Air Force Materiel Command Wright-Patterson AFB, OH 45433-7022
10. SPONSORING/MONITORING
AFRL-HE-WP-TR-1999-0152
11. SUPPLEMENTARY NOTES
12a. DISTRIBUTION/AVAILABILITY STATEMENT
Approved for public release: distribution is unlimited
12b. DISTRIBUTION CODE
13. ABSTRACT (Maximum 200 words)
Of special concern to the field of aviation and flight safety is the study of the effects of acute hypoxia resulting from a decrease in ambient oxygen at high altitudes. The purpose of this study was to investigate changes in brain wave activity associated with the decrements in complex task performance that are evidenced at extreme altitude when the supply of airborne oxygen is diminished. Ten Air Force personnel participated and multiple physiological measures were recorded as subjects performed a complex task designed to assess those mental functions associated with flying an aircraft. Subjects were decompressed singly via hypobaric chamber to altitudes ranging from 5,000 ft to 25,000 ft and recordings were obtained during hypobaric normoxic, hypobaric hypoxic, and recovery conditions at each altitude. Results are discussed with respect to decreased task performance and EEG metrics.
14. SUBJECT TERMS Hypoxia, Human Performance, High Altitude, Psychophysiological Assessment, Operator Mental Workload, Heart Rate, EEG
15. NUMBER OF PAGES 51
16. PRICE CODE
17. SECURITY CLASSIFICATION OF REPORT
UNCLASSIFIED
18. SECURITY CLASSIFICATION OF THIS PAGE
UNCLASSIFIED
19. SECURITY CLASSIFICATION OF ABSTRACT
UNCLASSIFIED
20. LIMITATION OF ABSTRACT
UNLIMITED
NSN 7540-01-280-5500 Standard Form 298 (Rev 2-89) Prescribed by ANSI Std Z-39-18 298-102 COMPUTER GENERATED

THIS PAGE INTENTIONALLY LEFT BLANK

PREFACE
This effort was conducted by the Human Interface Technology Branch (AFRL/HECP), Human
Effectiveness Directorate (AFRL/HE) of the Air Force Research Laboratory, Wright-Patterson
Air Force Base, Ohio. The project was completed under Work Unit 71841425, "Operator
Workload Assessment." Logicon Technical Services, Inc. (LTSI),. Dayton, Ohio, provided
support under contract F41624-94-D-6000, Delivery Order 0004. Mr. Donald Monk was the
Contract Monitor.
The data were collected with the cooperation of the 645th Medical Group, Wright-Patterson Air
Force Base, Ohio who generously permitted access to the hypobaric chamber. The authors wish
to acknowledge the support of George Reis, Penny Fullenkamp, Chuck Goodyear and Barbara
Palmer of LTSI during data collection and analysis.
in

TABLE OF CONTENTS
PAGE
LIST OF FIGURES v
LIST OF TABLES vi
INTRODUCTION 1
METHODS 7
SUBJECTS AND TRAINING 7
TASK 8 Systems monitoring 9 Tracking 10 Fuel Management 10 Communications 10
DATA COLLECTION 10 DATA ANALYSIS 14
Performance 14 Peripheral physiological measures 15 EEGdata 15
RESULTS 16 Symptomschecklist 16 Performance 17 EOG 17 Respiration 19 ECG 21 Transcutaneous pC02, p02 22 EEG 24
10,000 ft and 15,000 ft 24 20,000 ft 29 25,000 ft 29
DISCUSSION 32
REFERENCES 37
IV

LIST OF FIGURES
Figure Page
1 MATBTask 9
2 Flight Profile 12
3 EEG Electrode Placement 14
4 Performance Results 18
5 Blink Amplitudes 19
6 Blink Rates 20
7 Breath Rates 21
8 Breath Amplitudes 22
9 Heart Rates 23
10 Time Course of Heart Rate Changes 24
11 pC02 Levels 25
12 p02 Levels 26
13 EEG Band Power at 20,000 ft 30
14 EEG Band Power at 25,000 ft 32

LIST OF TABLES
Table Page
1 Task Performance and Changes in EEG Power at 10,000 ft 27
2 Task Performance and Changes in EEG Power at 15,000 ft 28
3 Task Performance and Changes in EEG Power at 20,000 ft 31
4 Task Performance and Changes in EEG Power at 25,000 ft 33
VI
INTRODUCTION
In 1878, Paul Bert, the father of modern high altitude physiology, demonstrated that
oxygen deficiency resulted in specific syndromes which were due to the decrease in the partial
pressure of oxygen caused by a reduction of the total barometric pressure from either chamber
decompression or mountain ascension. Because oxygen pressure is diminished in direct
proportion to the reduction in atmospheric barometric pressure at high altitudes, the ability to
transport oxygen from the atmosphere to the cell is diminished (for a review of the oxygen
transport system, see Fulco & Cymerman, 1988). Since an adequate and continuous supply of
oxygen is necessary to maintain cellular integrity, the resultant hypoxemia (reduced blood
oxygen levels) means a reduction in the amount oxygen supplied to the brain, working muscles,
and other parts of the body. Consequently, exposure to hypoxic (reduced ambient oxygen)
environments has profound effects on cognitive and sensory processes, circadian rhythms, and
physical endurance (Banderet and Burse, 1991). The administration of oxygen to a hypoxic
subject usually results in a complete recovery as does an increase in environmental pressure that
restores normal levels of utilizable ambient oxygen.
The dangers inherent in high altitude environs have been noted since the earliest
experiences dealing with hypobaric chambers, high altitude balloon flights, and motorized
aviation (Houston, 1987). Before the dangers were fully understood, balloon flights were
sometimes fatal (Fisher, 1982) and hypoxia related errors in judgment and diminished mental
capacity are also believed to have been a major cause of deaths during climbs of mount Everest
(West, 1986). In high terrestrial settings like mountain climbing, some degree of acclimatization

occurs over a period of days or months that can minimize the consequences of oxygen
deprivation (for a review, see Cudaback, 1984). In a flight environment, however, the amount of
accommodation that can be achieved in minutes or even in hours is severely limited.
Within the field of aviation, there were few hypoxia related incidents reported until the
service ceiling of motorized aircraft exceeded 20,000 ft. But, after the entry of USA into World
War II, as more aircraft were designed for high altitude flight, thousands of men were exposed
daily to the hazards. From the extensive collection on file at the Army Institute of Pathology,
Lewis and Haymaker (1948) studied 75 cases in which death was attributed to high altitude
hypoxia. To help reduce the risks, current guidelines mandate supplemental oxygen or
pressurization to maintain effective cabin altitudes below 2438 m (8000 ft) to ensure crew
performance. And, because this is an area of special concern to military aviation, all branches
specifically address the issue in their service manuals (see Cudaback, 1984). However, these
standards cannot insure that errors or accidents resulting from the sudden loss of available
ambient oxygen are totally eliminated.
When challenged by an insufficient oxygen supply, a cascade of compensatory bodily
responses is activated. One of the body's first defenses is the hypoxic ventilatory response
(HVR), an increase in respiratory tidal volume (breath depth or amplitude) brought about by
acute hypoxia. The result is a more complete turn-over of alveolar gases (C02) with atmospheric
air. Rahn and Otis (1947) reported that the HVR does not usually begin until ambient oxygen is
reduced to a level equivalent to an altitude of 3000 m (9,850 ft), and studies have demonstrated
that if the exposure is extended or if the level of hypoxia is more severe, then breath rate also
increases (Gale, Torre-Bueno, Moon, Saltzman and Wagner, 1991; Rahn and Otis, 1947). West
(1984) further reported that extreme hyperventilation is characteristic of successful mountain
2

climbers. Lenfant and Sullivan (1971) showed that at altitudes of 3500 m (11,550 ft), there is a
net advantage to hyperventilation so that increasing hyperventilation appears to be one of the
most important ways in which the body protects itself against the severe hypoxia of extreme
altitudes (Lenfant, Torrance and Reynafarje, 1971).
As respiratory responses change, there is a corresponding increase in heart rate and a
generalized redistribution of blood flow to protect critical body organs and functions, especially
the brain. Because the brain consumes approximately 20% of the body's total oxygen intake, it is
especially susceptible to injury resulting from an acute reduction in the airborne supply (Gibson,
Pulsinelli, Blass and Duffy ,1981). Thus, hypoxia affects nervous tissue earlier and with greater
degree of severity than it does any other tissue. In addition, there is a progression in the
sensitivity of various nervous tissues to oxygen deprivation. Higher cortical centers appear to be
the most sensitive followed in order by the cerebellum, medulla, spinal cord, and sympathetic
ganglia. This may account for the earlier loss of higher level functioning (sensory and cognitive)
relative to simple motor responses (Drinker, 1938; Greene, 1957).
The specific mechanism underlying neurological deficits observed during hypoxia is
unknown. Gibson. Pulsinelli, Blass and Duffy (1981) proposed that the acute effects of
hypoxemia result from changes in neurotransmitter utilization and concentrations
(achetylcholine, serotonin and norepinephrine) and their premise is supported by animal studies
showing hypoxia related changes in hippocampal cholinergic function (Shukitt-Hale, 1993). In
addition, the HVR induces vasoconstriction of the cerebral arterioles The resultant profound
changes in cerebral blood flow and oxygen metabolism may account for some of the observed
changes in scalp recorded brain activity. Effects evidenced by continuously recorded scalp
electroencephalogram (EEG) include reduced fast wave activity coupled with increased slow
3

wave activity (Kraaier, Van Huffelen & Wieneke, 1988). Clinical studies have shown a
progressive increase in slower brain waves, first alpha, then theta and finally delta as the severity
of hypoxia increases and the EEG changes due to hypoxia are generally considered as similar to
those evidenced by ischaemia (Meyer and Waltz, 1960; Gibbs, Davis and Lennox, 1935).
Hockaday, Potts, & Epstein, 1965) defined 5 categories of EEGs in patients recovering from a
hypoxic episode:
grade 1: normal or almost normal record. Normal alpha with little or no theta.
grade 2 : mildly abnormal. Predominantly theta with some alpha or delta.
grade 3 : continuous delta with little faster activity.
grade 4 : periods of flattening.
grade 5 : nearly flat.
They pointed out that when delta waves become the predominant form of brain electrical activity,
unconsciousness results. In a similar vein, Fowler and Kelso (1992) used visually evoked
response potentials (ERPs) to assess cognitive processing during hypoxia and reported
significantly increased latencies of the P300 and N200 components that were positively
correlated with reaction times on a Go-No Go task. Similarly, Kida and Imai (1993) and
Wesensten, Crowley, Balkin, Kamimori, Iwanyk, Pearson, Devine, Belenky and Cymerman,
(1993) reported increased latencies in auditory evoked P300 components that were correlated
with increased response times. Since these endogenous components are believed to reflect
sensory evaluation and cognitive processing, it is clear that EEGs provide ah excellent measure
of hypoxia induced changes in mental functioning.
Subjectively, hypoxia has been reported to result in dizziness, headaches, visual
disturbances, and on occasion, an awareness of reduced performance. Crow and Kelman (1973)
4

reported that even relatively small reductions in arterial oxygen saturation can significantly
impair mental and motor coordination, personality, and judgment. Some individuals feel
euphoric, while others become irritable and/or uncooperative. In other cases, individuals deny
any detrimental effects. In susceptible individuals, measurable personality or performance
decrements can occur at altitudes of as low as 3,000 m (9850 ft) (Fulco and Cymerman, 1988).
However, overall impairment varies greatly between individuals probably due in part to
differences in the respiratory responses. In addition to the level of hypoxia, impairment is related
to factors such as: personality, motivation, experience in hypoxic environments, task
requirements, task complexity, task familiarity and whether the task has been learned prior to or
during the exposure (Bahrke and Shukitt-Hale, 1993; Crow and Kelman, 1973).
To determine those functions most susceptible to hypoxemia, numerous investigations
have measured performance on a variety of relatively simple tasks thought to tap specific
cognitive processes (for reviews see Banderet and Burse, 1991; Bahrke and Shukitt-Hale, 1993;
Cudaback, 1984). For example, Kennedy et al (1989) examined changes in human cognitive and
motor functions and found that hypoxia primarily affected global cognitive functioning such as
intelligence and reasoning and short term memory rather than motor capacity demonstrated by
simple motor tasks like finger tapping.
In an early report, McFarland (1937) suggested that visual perception and processing are
particularly sensitive to the effects of hypoxia although there is some acclimatization that can
occur (Kobrick, J.L., Crohn, E., Shukitt, B., Houston, C, Sutton, J. & Cymerman, 1988).
Kobrick and Dusek (1970) demonstrated that a loss of visual acuity interacts with peripherally
located visual stimuli to slow reaction times. In a hallmark study, Fowler and Porlier (1987)
suggested that the disruption of vision influenced the response time on a serial choice task. They
5

further demonstrated that the response was slowed in an altitude related dose dependent manner
with increasing altitudes and that there was a significant loss in function at 10,000 ft. This study
provided the threshold estimate of 9750 ft for cognitive performance decrements due to hypoxia.
Compared with the loss in visual acuity, auditory sensitivity appears unaffected (Heath and
Harris, 1981) although significantly longer reaction times to auditory tasks during hypoxia have
been reported (Kita and Imai, 1993; Wesenthal et al., 1993).
In the realm of motor functions, Shephard (1956) exposed 10 healthy individuals to a
simulated altitude of 20 000 ft for 10 minutes and reported that all evidenced significant
alterations in psychomotor performance, the most consistent being an increase in errors. The
effects of hypoxia on mental capacity have been studied by researchers such as Denison,
Ledwidth and Poulton (1966) who reported impairment of mental functions on tests for
immediate memory at altitudes as low as 6000 to 8000 ft. and also on tasks performed for the
first time. Others have reported similar effects at altitudes of 5000 ft (Ernsting, 1978) and 8000
ft (McFarland, 1971). Mitsubo and Akira (1993) also found that the deteriorative effects of
hypobaric hypoxia on reaction time occurred abruptly at simulated high altitudes, but pointed out
that individual differences in motivation improved performance and thus were a contributing
factor in overall performance. This concurred with a much earlier in a report by McFarland
(1937) suggesting that motivational factors contribute to performance outcomes.
Research that describes the negative effects of oxygen deprivation on complex mental
activity at very high altitudes is limited, in part because of the potential risks to both participants
and systems. A preponderance of studies have focused on the long term effects of insufficient
oxygen on mood, behavior and cognitive skills in terrestrial settings and the degree of recovery
that can be achieved through acclimatization. Others have measured performance and brain
6

activity at altitudes simulated by having participants inhale a gas mixture that mimics the ratio of
useable oxygen at a given height. In some cases, hypobaric chambers that can simulate global
atmospheric conditions have been used; but the typical behavioral tests employed have required
that participants complete one relatively simple task at a time at altitudes below 20000 feet. The
objective of this project was to study the effects of high altitude hypoxia on performance in
relation to the EEG and peripheral psychophysiological (heart rate, eye blink, respiration, and
p02 / pc02) measurements during different conditions (hypobaric normoxic, hypobaric hypoxic
and recovery) at hypobaric simulated high altitudes (25,000 ft, 20,000 ft, 15,000 ft, 10,000 ft).
The primary goals of the study were: 1) to examine the effects of acute hypoxia on complex
multi-task performance, 2) to identify the concomitant physiological indicators and 3) to
determine the relationship between brain activity and performance.
METHODS
Subjects and Training
Ten Air Force personnel (5 male, 5 female, ages 21-41 years) without physical disability
or limitations participated in this study. All Ss had undergone recent physical examinations. All
were right-handed and had normal or corrected to normal vision (20/20) vision. Two Ss were
private pilots and two others had previous experience in the hypobaric chamber. Each S gave
informed consent.
Before testing, Ss trained on the cognitive multi-task for two hours total in four separate
sessions on two consecutive days. During training, Ss were comfortably seated in front of a
computer screen, in a sound attenuated and electrically shielded chamber. Written instructions
7

for initializing the computer generated task were provided. They wore earphones and entered
their responses using a keyboard and a joystick During the final training session, Ss wore an
electrode cap and flight helmet, eye and chest electrodes, respiration bands and an oxygen mask
in order to familiarize them with instrumentation procedure,
After training, Ss attended a safety seminar at the chamber facility. The multi-person
capacity hypobaric chamber employed for this study can simulate a variety of global atmospheric
conditions by reduction of ambient atmospheric pressure in combination with precise control of
temperature and relative humidity. Low pressure atmospheres are created by removing air from
the internal compartments using liquid ring vacuum pumps. The chamber was equipped with
oxygen masks and helmets. Ss were briefed regarding both the procedures and the hazards of the
experimental phase of the study.
Task
A PC-based flight simulation, the Multi Attribute Task Battery (MATB) developed by
Comstock and Arnegard (1992) was used. The battery incorporates a set of tasks analogous to
those performed by aircraft crewmembers during flight. The subtests included: systems
monitoring (lights and gauges), fuel management (tanks), continuous tracking, and auditory
communications. See Figure 1. Ss completed a different 3 min task scenario under each condition
at each altitude. Task difficulty was not varied.

SYSTEM MONITORING TRACKING
FS F6
►_:
F1 F2 F3 F4
COMMUNICATIONS
Callsign NGT504
W NAV1 108.5 <-* NAV2 110.3 COM1 119.7 COM2 120.9
■O" + + -f- J
+ AUTO AVAIL MANUAL
RESOURCE MANAGEMENT
976 927
SCHEDULING
0- 1- 2- 3 4-H S 6 7 8-*
T C
PUMP STATUS i
Flow Rates 1 0 2 0 3 600 4 600 5 0 6 600 7 0 8 0
Figure 1. The MATB incorporated a set of tasks analogous to those performed by a pilot.
Systems monitoring
The monitoring task appears in the upper-left window in Figure 1. It consisted of four
vertical gauges with moving pointers and green (OK) and red (WARNING) lights. The scales for
the gauges were marked to indicate the temperature (TEMP1.TEMP2) and pressure
(PRES1,PRES2) of the two aircraft engines. The two boxes in the upper portion of this window
represented the warning lights. The light on the left was normally "on" as indicated by a green
area. Ss were required to detect the absence of the green light and press the "F5" key or the
presence of the red light and press the "F6" key. If the S did not detect either abnormality, the
situation reverted to normal status after the preselected timeout period Normally, the green light
was on and the pointers were moving within a fixed range (one line below and one line above
9

the center). In each 3 minute simulation, 25 malfunctions occurred when the pointer on one of
the four engine gauges went "off limits " and shifted its center position away from the middle of
the vertical gauge regardless of direction. Ss were responsible for detecting the pointer shifts and
responding by pressing one of the corresponding function keys (Tl,T2,Pl,or P2) If Ss failed to
detect a malfunction, the fault was automatically corrected after 10 s. Scores were based on
reaction times relative to warning lights and gauges. False alarms and time outs were counted as
errors.
Tracking
The demands of manual control were simulated by the tracking task located in the upper
middle window. Using the joystick, the Ss task was to keep the target in the center of the
window, within the dotted lines which form a rectangle. If no control input was applied, the
aircraft symbol drifted away from the center toward the edges of the window. The difficulty of
the tracking task (force and/or deviation) was not varied. Scores were computed based on the
Root Mean Square Error (RMSE, deviation from center).
Fuel management
This task located in the lower right quadrant of the display simulated actions needed to
manage the aircraft's fuel system. The display consisted of six rectangular regions. Ss were
required to maintain a specific fuel level within both of the main tanks by selectively activating
pumps to keep pace with the fuel consumption. Tanks were depleted of fuel at a constant rate.
The deviations from the optimal fuel level over the task period were computed.
10

Communications
The communication task simulated receiving audio messages from an Air-Traffic
Control. Ss had to recognize and respond to his/her callsign (NGT504) by executing frequency
changes as instructed using the keyboard arrow keys and pressing Enter to acknowledge the
change. In order to successfully complete the task, Ss had to: 1) select the proper channel
(navigation vs. communication), 2) change to the requested frequency, and 3) press the Enter.
Possible errors included: false alarms, incorrect frequency selection or a failure to respond before
another communication was generated.
Data Collection
On the day of data collection, Ss arrived one hour prior to the experiment for
instrumentation. For safety purposes, pregnancy tests were administered to all female Ss
immediately before exposure to the hypobaric chamber and negative test results were confirmed.
Electrodes were applied and positioned so that they did not interfere with movement or
equipment and Ss were fitted with flight helmets and oxygen masks. Each S was accompanied in
the chamber by a safety officer and was decompressed at a rate of 5000 ft/rnin and recompressed
at 2500 ft/min. All Ss completed the same chamber flight profile (Figure 2) and were
continuously monitored visually, acoustically and physiologically by personnel outside of the
chamber.
At initial ground level (5000 ft), Ss completed a 3 min practice task. During the 30 min
denitrogenation period, Ss were decompressed to 6000 ft to repudiate physiological trapped gas
anomalies and verify prevention methodology. After denitrogenation, Ss performed a pre-test
11

AB C
A —Oxygen B - Hypoxla C — Recovery
6000 « Test
30 min DenKrogenation Test Period
Figure 2. Subjects were decompressed singly and all completed the same flight profile.
baseline task. The chamber was then decompressed to the equivalent of 25000 ft. and after
altitude was achieved, the task was performed under the 3 different conditions. They were: 1)
hypobaric normoxic (100 % oxygen via mask), 2) hypobaric hypoxic (mask removed), and 3)
recovery (mask replaced). After the recovery task was completed, the chamber was
recompressed to the next lower altitude (20,000 ft). The same test and recompression profile was
completed at each test altitude of (25,000 ft, 20,000 ft, 15,000ft, and 10,000 ft). Venting
procedures were employed between the normoxic and the hypoxic conditions at each altitude to
maintain normal concentrations of atmospheric gas. The total time required to complete the
flight profile was approximately 1.5 hrs. Once Ss returned to ground level, a final post-test
baseline task was performed. After exiting the chamber, Ss completed a physical symptoms
checklist.
12

During testing, both vertical and horizontal electroocular activity (EOG) were monitored
via Ag/AgCl electrodes (impedance < 10 KOhm) positioned above and below the left eye and at
the outer canthus of both eyes. EOG signals were filtered (1-30 Hz) and amplified (x5000) using
Grass P511 amplifiers. Electrocardiogram (ECG) electrodes (impedance < 30 KOhm) were
positioned on the sternum and fifth intercostal space on the left side of the body. ECG signals
were amplified by 2000 and filtered at 1-30 Hz (Grass P511 amplifiers). A separate ground
electrode was positioned on the right side of the ribcage at the fifth intercostal space. Respiration
was monitored via inductive plethysmography (Respitrace Systems: AMI Ambulatory
Monitoring, Inc.). Outputs from elastic transducer bands positioned over the chest and abdomen
were summed and respiration amplitudes were individually calibrated prior to data collection.
EOG, ECG and respiration were sampled at 1000 Hz and stored for of-line analysis using a
Psychophysiological Assessment Test System (PATS, Wilson and Oliver, 1991). Transcutaneous
pC02 and p02 were monitored via a calibrated TCM3 microcomputer system with the sensor
positioned on the right forearm. Response times for the TCM3 are 20 s for a 90% p02
measurement and 50 s for a 90% pC02 measurement.
EEG data were recorded from 19 active sites distributed across the scalp in accordance
with the International 10-20 system (Figure 3) using a Biologic Brain Atlas m system and an
Electro-Cap referenced to linked mastoids. To aid in data analysis, a synch pulse marker was
stored on a separate channel. All impedances were maintained at less than 5K Ohm throughout
data collection. Data were filtered at 0.1 to 30 Hz, sampled at 100 Hz, viewed on a screen during
data collection and stored on disk for analysis.
13

Figure 3. EEG electrodes were positioned according to the International 10-20 system.
Data Analysis
For health and safety purposes, all subjects were initially decompressed to 25,000 ft then
recompressed at 5000 ft increments. Because all Ss completed the flight profile in the same
order, confounding variables such as learning, fatigue, boredom, and experience could not be
ruled out and altitude could not legitimately be included as a factor in the analysis. Therefore, all
statistical comparisons were made between the three experimental conditions within a given
altitude. Because of excessive environmental noise contamination, EEG data from one S was
eliminated from the analyses. Due to technical malfunctions, EOG and ECG data were not
obtained from one S and p02/pC02 data were not recorded from two other Ss
Performance
Subtests were scored individually based on event and response time files generated by
MATB. SAS was used to calculate the tracking RMSE, fuel tank deviations, systems monitoring
14

(lights and gauges) reaction times and completed auditory communications reaction times. Time
outs, incorrect responses, and false alarms were included in an error score. Scores were log
transformed to correct for skewness before averaging across the 3 min task trial and z-scores
were computed for each subtask. In addition, composite z-scores, weighted such that the
continuous tracking and monitoring tasks each contributed 1/3 and the remaining discrete event
scores (lights, gauges, communications, errors) each contributed 1/12 of the total, were
computed. Pairwise comparisons were used to determine significant changes (p <.05) in
performance between the hypoxic condition and the normoxic condition at each altitude.
Peripheral Physiological Measures
Digitized EOG, ECG and respiration data were reduced using PATS. Event recognition
parameters (i.e., ECG R-waves and eye-blinks) were individually calibrated and visually
reviewed to insure accurate identification of all events. Heart inter-beat intervals, blink rates and
amplitudes, and respiration cycles and amplitudes were calculated. S AS was used to compute
the average EOG, ECG, respiration and transcutaneous pC02 and p02 levels during contiguous
30 s intervals within a task and for the duration of each 3 min task. Statistical evaluations were
performed using repeated measures ANOVAs and pairwise contrasts. All results reported as
significant reached the criterion of p <.05.
EEG data
After application of a modified version of the eye movement correction procedure
(EMCP) developed by Grafton, Coles and Donchin (1983), FFTs (resolution 0.39 Hz) were
calculated over two different time periods. To assess overall changes in power, FFTs at each
15

electrode site were calculated based on the middle 2 min period of each 3 min task. For
comparisons, FFTs were grouped into Delta (0-3.9 Hz), Theta (4.3-7.8 Hz) and Alpha (8.3-11.9
Hz) bands. Statistical analyses were conducted with SAS using separate repeated measures
ANOVAs with a Geisser-Greenhouse correction for sphericity at each electrode site. Tukey's
Minimum Significant Difference scores served for post-hoc evaluations of significant effects
with p-values smaller than .01. Furthermore, to study changes due to hypoxia in a manner similar
to that reported by Kraaier, Van Huffelen and Wieneke (1988), spectra recorded during the
normoxic condition were subtracted from those recorded in the hypoxic condition and
differences were statistically compared using pairwise contrasts. Significance was determined by
p <.05.
RESULTS
Symptoms Checklist
The physical symptoms checklist that included those symptoms most commonly reported during
hypoxia (i.e., headache, nervousness, euphoria etc.) was completed by each S immediately after
completing the flight profile. No symptoms were reported by any subjects, under any conditions
at lower altitudes. But during the hypoxia at 25,000 ft, the number of Ss reporting specific
symptoms were as follows: All Ss reported feeling progressively confused and unable to
concentrated, eight reported light headaches; three experienced tingling fingers; three felt
nervous and one felt panic; one experienced tunnel vision and one reported that they were unable
to perform.
16

Performance
Analysis of the z-scores obtained on the MATB subtest via pairwise contrasts with the
normoxia condition indicated no significant hypoxia induced decrements in performance on the
Fuel Management or Communications tasks including the number of discrete errors made even
though all scores worsened under hypoxic conditions at 25,000 ft. With regard to the Systems
Monitoring, there were no significant differences in reaction times to the gauges during hypoxia
at any altitude but the reaction times to the lights increased significantly during hypoxia at 25,000
(p <.05). A significant increase in tracking RMSE also occurred at 25,000 ft. (p <.05). The
weighted (tracking 1/3, fuel management 1/3, discrete responses and errors 1/3) composite z-
score also indicated that performance deficits occurred only when Ss were deprived of oxygen at
the highest altitude (p <.05). Below 25,000 ft, Ss were generally able to maintain their overall
performance despite the lack of supplemental oxygen and corresponding signs of physiological
distress. A summary of these results is presented in Figure 4.
EOG
There were no significant changes in blink amplitudes (F =.73 (3,24), p < .54, Figure 5)
or blink rates (F = .38 (3,24), p < .77, Figure 6) across test conditions at any altitude. In general,
these results suggest that this response was unaffected by hypoxia and that the visual
requirements of the task remained constant throughout the experiment. However, other studies
have reported increases in both measures under similar conditions (Cahoon, 1970). As shown in
Figure 6, during the hypoxic condition, there were non-significant decreases in blink rates at all
altitudes plus increases in blink amplitudes at altitudes greater than 10,000 ft. These trends
suggests that: 1) generally speaking, Ss worked harder to meet the requirements under adverse
17

conditions that increased visual load and 2) there was enough individual variation in their
responses to render the results non-significant.
0.6-
0.3- o 8 0.0-
I N
-0.3-
-0.6-1
Composite
E]25000' D20000' 015000' El 10000'
Tracking
0.2H
g> o.H
HI 0.0' CO
i-o.1- -0.2-I
1 Tanks
0.2-1 co £ 0.1-
O 0.0- 1 "g-o.H Q
-0.2-
^
m Communication
0.06H
^ 0.03- CD Q "=- 0.00-
-0.03'
-0.06-1
^
Lights
0.2-1 •
^ 0.1- co o ^> n n- I P7771
l- = -0.1-
-0.2-
Scales Errors
CO o
0.2-
0.1-
0.0
-0.1-
-0.2-
4.00
2.00-I
fj 0.00- I2
-2.00-
-4.00-
I □
Figure 4. Significant performance decrements were only evident at 25,000 ft. Changes
from prehypoxic (• = p <0.05). 18

Pre 25000' Base
20000' 15000' 10000' Post Base
Figure 5. There were no significant differences in mean blink amplitudes between conditions at
any altitude.
Respiration
Pairwise contrasts yielded significant differences in breath rates (Figure 7) and
amplitudes (Figure 8) between conditions. Compared to the normoxic condition, breath rates
increased during hypoxia at 10,000 (p <.002), 15,000 (p <.04), and 20,000 ft (p <.02) and highly
increased but not significantly so at 25,000 ft (p <.06). During recovery, there was a
corresponding significant decrease in breath rates at the same altitudes (10,000 (p <.002), 15,000
(p <.04), and 20,000 ft (p <.03)) but no significant decrease at 25,000 ft (p <.06). During
hypoxia at 10,000 ft, there was also a significant decrease in breath amplitude (p < .05) while at
19

Pre 25000' Base
20000 15000' 10000' Post Base
Figure 6. There were no significant differences in blink rates between conditions at any
altitude.
25,000 ft breath amplitude increased significantly (p <.01). Examination of the data suggest that
the failure to find a significant change at 25,000 ft. may have been due to the already increased
breath rate during the normoxic condition at that altitude. Since it is known that stress can
increase respiration rates, this increase was most likely due to the novelty of the environment and
experimental conditions since this was the first test altitude for all Ss. The observed decrease in
breathing rates from the pre- to post-test baseline further supports this premise even though there
was no significant difference in the two baseline measures. These results support the presence of
the HVR expected to be triggered by hypoxia at all altitudes greater than 5000 ft.
20

ECG
The average heart rate varied significantly between conditions (F =9.62 (3,24), p < .0002,
Figures 9 & 10). Heart rate increased during hypoxia at 15,000 (p <.002), 20,000 (p <.0002), and
25,000 ft (p <.025), but not at 10,000 ft (p <.l 1). In addition there was a significant decrease in
heart rate during recovery only at 25,000 ft (p <.025) when the level of hypoxia experienced was
more severe. Because heart rate is influenced by many factors including the concentrations of
carbon dioxide and oxygen in the blood, and correspond to changes ventilation, the observed
changes in HR are as would be predicted during hypoxia.
Pre 25000 Base
10000' Post Base
Figure 7. Breath rates increased during hypoxia and decreased during recovery.
Significantly different from oxygen (* = p <0.05).
21

Transcutaneous pC02, p02
The time course of changes in the transcutaneous p02 and pC02 and the statistical
significance are presented in Figures 11 and 12 respectively). pC02 differed significantly
between the normoxic and hypoxic conditions at all altitudes (p <.01) and failed to completely
return to normoxic values during the 3 min recovery period at 25,000 ft although it did return to
pre-hypoxic levels during the recovery period at lower altitudes. Concomitantly, p02 decreased
155-
145-
0) 135- 3
5 125-
m 115-
105-
143
£
* 150
109
115
0 Oxygen □ Hypoxic M Recovery
127
120 J20
110
^
Pre 250O0' Base
I
108
20000* 15000'
134
Figure 8. Breath amplitudes increased significantly at 25,000 ft and decreased at
10,000 ft. Significantly different from oxygen (* = p <0.05).
during hypoxia compared with normoxic after 2 min at 10,000 ft, and after 1.5 min at 15,000,
22

20,000 and 25,000 ft. Oxygen levels then returned to the normoxic values during recovery after
1 min at 10,000, 15,000 and 20,000 ft, but it took 2 min to recover at 25,000 ft. As expected, a
decrease in oxygen partial pressure, and an increase in carbon dioxide partial pressure with
increasing altitude was evidenced. Furthermore, the degree of change and the prolonged
recovery times demonstrated the greater physiological distress induced at the highest altitude.
However, while the trends are evident, theTCM3 response time delay (20 s for p02 and 50s for
pC02) may have contributed to what appears to be a failure of the pC02 levels to return to
normal before the recovery period ended.
Pre 25000' Base
10000' Post Base
Figure 9. Average heart rates increased during hypoxia at the higher altitudes.
Significantly different from oxygen (* = p <0.05)
23

EEG
10.000 ft and 15.000 ft.
At the lower altitudes, there were no significant differences in the absolute power in any
of the bands between conditions nor were there any consistent differences in amount of change in
25000' 20000'
c JE CO to CD 3, CD CO
CC •e CO CD X
30 60 90 120 150 180 *****
**
15000' 115
105-
30 60 90 120 150 180 * * *
115
105-
30 60 90 120 150 180 * * * * **
10000' 115
105-
30 60 90 iTo 150 180
pre mean = 84.2 Time (sec) A—A Oxygen □---□Hypoxie
Recovery
Figure 10. The time course of the changes in heart rate every 30 seconds during each 3
minute condition at each altitude. Oxy vs. Hyp, ** = Oxy vs. Rec (* = p <0.05).
24

25000' 20000'
CM o Ü Q.
30 60 90 120 150 180 ** *****
** ** **
15000'
0 30 60 90 120 150 180 ** * * *
0 30 60 90 120 150 180 ** ** ** * * * *
10000'
0 30 60 90 1 20 1 50 1 80 ***** * * * *
pre mean = 31.3 Time (sec) A—A Oxygen D---a Hypoxie •—• Recovery
Figure 11. pC02 levels increased during hypoxia and returned to normal within 3 min
except at 25,000 ft. Oxy vs. Hyp, ** = Oxy vs. Rec (* = p <0.05).
25

25000'
O Q.
6 30 60 90 120150180 ** * * * *
15000' 100-
90-
■ --s
80-
70-
\ \ \ n \
60-
50-
40-
\ \
30- L.. . i i i i i 0 30 60 90 120 150 180
* * * *
20000' mn- s __*==*-—*—*
^ _*—p^*^~ 90-
80- / \ / s f \ 70- \ \
s
60-
50-
4U- *s« 30- XI
0 30 60 90 120150180 * * * *
10000'
0 30 60 90 120150180 * * *
pre mean = 100.0 Time (sec) A—▲ Oxygen D---D Hypoxie •—• Recovery
Figure 12. p02 levels decreased during hypoxia more quickly and returned to normal
more slowly at higher altitudes. Oxy vs. Hyp, ** = Oxy vs. Rec(* = p <0.05).
any band powers that are traditionally viewed as brain wave indices of hypoxia. There were no
widespread increases in either the Alpha or Theta bands and the Delta power recorded remained
relatively constant at all electrode sites. However, correlational comparisons between
26

performance and band powers did indicated that at 10,000 ft, overall performance and
performance of discrete visual monitoring tasks were positively related to the Alpha levels at
numerous sites and at 15,000 ft, tracking and discrete task errors were associated with Delta,
Theta and Alpha band powers at diffuse sites. It is interesting to note that measured brain wave
Table 1. At 10,000 ft, decrements in discrete visual and overall task performance were
associated with changes in Alpha band power recorded at multiple frontal, central and
parietal electrode sites.
Site Delta Theta Alpha
Fpl Fp2 F7 F3 T Fz PG F4 PTG F8 T3 CZ Cz G P PFGLC C4 PGLC T4 T5 P3 Pz PG P4 PTG T6 PTGC Ol G 02 PG
P = Performance Composite T = Tracking RMSE F = Fuel Management
L = Lights G = Gauges C = Communications E = Errors
27

Table 2. At 15,000 ft, decrements in tracking, the number of errors made and composite
task performance were associated with changes in the Alpha, Theta and Delta band
powers recorded primarily at frontal, tempero-parietal and occipital electrode sites.
Site Delta Theta Alpha
Fpl G Fp2 G F7 F3 T Fz F4 E PT F8 PE T3 E C3 Cz C4 T4 F T5 T G T P3 Pz G P4 T6 01 PTC 02 G
P = Performance Composite T = Tracking RMSE F = Fuel Management
L = Lights G = Gauges C = Communications E = Errors
(p<.05)
28

activity was related to the Ss ability to maintain performance even when those values did not
change significantly during the hypoxic condition compared to the normoxic conditions. For a
summary of these results, see the information provided in Tables 1 and 2
20,000 ft.
There were no significant differences in the absolute power in the Delta band between
conditions calculated across the 2 min period at any electrode sites, and only site T5 evidenced a
significant increase in power during hypoxia compared to normoxia during the same period.
There were however, significant increases in Alpha band power at several central scalp sites
during the hypoxic condition relative to the normoxic condition (see Figure 13). Based on the
increase in Alpha activity, at 20,000 ft, Ss evidenced changes in brain wave activity indicative of
low levels of hypoxia.
Analysis of the relationship between performance and EEG measures indicated that
overall performance, especially the tracking task that required continuous interaction was
positively related to increases in the level of Delta, and Theta band powers at multiple sites even
when the changes were not significant. Significant increases in Alpha power, on the other hand,
were related to decrements in the Ss ability to maintain performance on the fuel management task
(Table 3).
25.000 ft
There were no significant differences in the absolute power in the Delta band between
conditions calculated across the 2 min period at any electrode sites and only site T5 evidenced a
significant increase in Delta power during hypoxia compared to normoxia during the same
period. There were however, significant differences in the average absolute power and in the
amount of change in the Theta and Alpha band powers at numerous sites (see Figure 14). This
29

increase in slow activity suggests that at 25,000 ft, Ss were moderately hypoxic. In all cases,
those sites that yielded a main effect for condition evidenced a significant increase in power
during the hypoxic condition relative to the normoxic condition.
Delta Theta Alpha
Figure 13. There were significant increases in the Alpha band power during the hypoxic
condition at multiple frontal and central electrode sites at 20,000 ft. The arrows indicate
increased Alpha band power at the electrode sites indicated by their position on the head
(p<0.05).
Analysis of the relationship between performance and EEG measures indicated that
overall performance and especially the continuous tracking task and discrete task errors were
positively related to the level of Delta and Theta band waves while increases in Alpha power
were associated with poorer performance on the systems monitoring task at several electrode
locations. For a summary of these results, see Table 4. It is interesting to note that the presence
of Delta waves were highly related to the Ss ability to maintain performance even when the
increases in Delta during the hypoxic condition relative to the normoxic conditions were non-
30

significant.
Table 3. At 20,000 ft, decrements in the continuous tracking, and fuel management task,
plus the number of errors made, and overall task performance were associated with
changes in the Alpha, Theta and Delta band powers at multiple recording sites.
Site Delta Theta Alpha
Fpl PT PT TF Fp2 PE PE E F7 PT PF TF F3 PE P T Fz P T F4 PTE P F8 PT PT T T3 PT C3 P Cz T F C4 PTE P FL T4 L T5 P3 T PT TL Pz TF PTF TFL P4 P FL T6 P L Ol 02 PT F
P = Performance Composite T = Tracking RMSE F = Fuel Management
L = Lights C = Communications E = Errors (p <.05)
31

Delta Theta Alpha
Figure 14. There were widespread increases in Theta and Alpha power during hypoxia
but no absolute differences in the Delta band were evidenced. The arrows indicate
increased Alpha band power at the electrode sites indicated by their position on the head
(p<0.05).
DISCUSSION
Only moderate changes in physiology and performance were observed at 10,000 or
15,000 feet. Breathing rates and heart rates increased as blood oxygen levels decreased
suggesting the onset of the hyperventalitory response but no significant hypoxia related changes
in brain wave activity were seen. However, there was a positive correlation between how well
some discrete tasks, especially those requiring visual monitoring, were performed and the amount
of change in Alpha band activity under hypoxic conditions. Evaluation of the task scores
indicated that there were nonsignificant increases in the numbers of errors made and in response
times, but generally speaking the participants were able to maintain their overall performance
32

without supplemental oxygen. Using a single-task paradigm, Fowler and Porlier (1987)
estimated 10,000 ft to be the threshold level at which perceptual motor skills are grossly effected.
This study, using a multiple, continuous task paradigm and highly motivated Ss failed to show
any significant performance detriments at altitudes below 25,000 ft.
Table 4. At 25,000 ft, decrements in overall task performance, especially with regard to
continuous tracking and the number of errors made, was associated with increased power
in the Delta and Theta bands at multiple sites. Changes in Alpha were more associated
with decrements in the discrete visual monitoring tasks.
Site Delta Theta Alpha
Fpl PTE PT E FD2 PTE PE F7 PTE PT F3 PTE PTE G Fz PTE PTE G F4 PTE PTE F8 PTE PTE T3 PTE PTE C3 PTE PTE L Cz PTE PTE G C4 PTE PTE G T4 PTE PTE T5 PTE PT P3 PTE PT Pz PTE E L P4 PTE PT T6 PTE E 01 PTE P 02 PT L
P = Performance Composite T = Tracking RMSE
L = Lights G = Gauges E = Errors (p<.05)
At 20,000 feet, breath and heart rates rose while the blood oxygen levels dropped
33
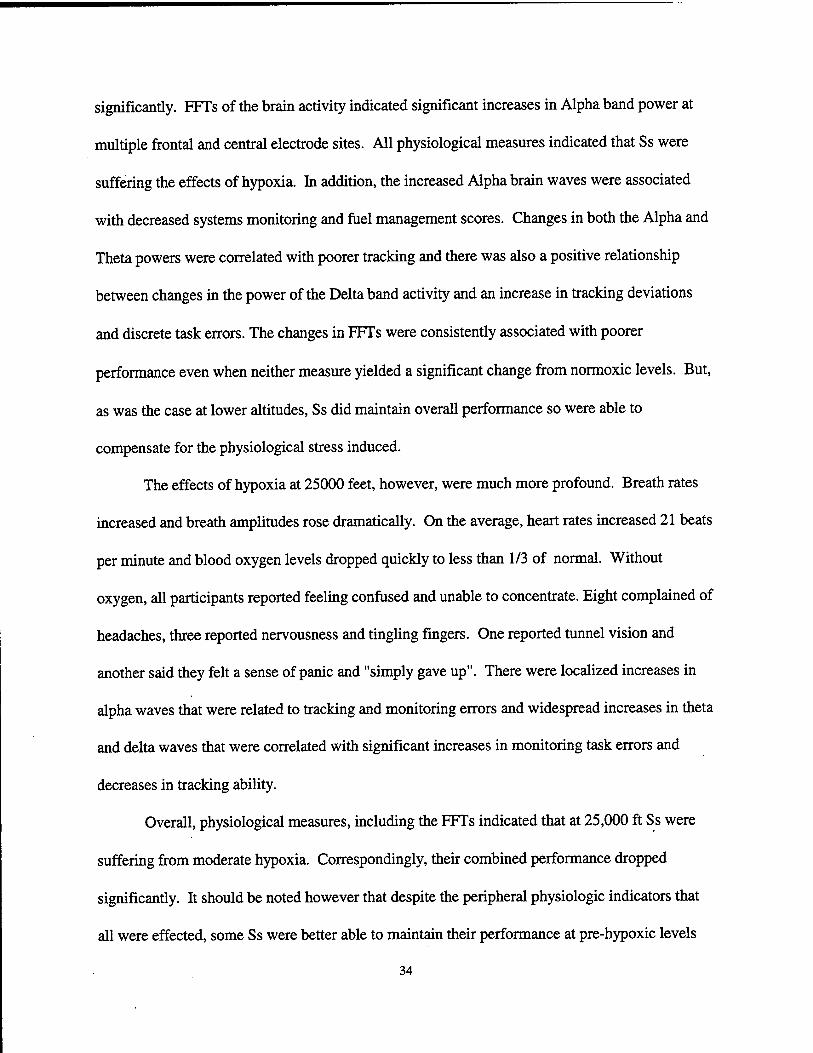
significantly. FFTs of the brain activity indicated significant increases in Alpha band power at
multiple frontal and central electrode sites. All physiological measures indicated that Ss were
suffering the effects of hypoxia. In addition, the increased Alpha brain waves were associated
with decreased systems monitoring and fuel management scores. Changes in both the Alpha and
Theta powers were correlated with poorer tracking and there was also a positive relationship
between changes in the power of the Delta band activity and an increase in tracking deviations
and discrete task errors. The changes in FFTs were consistently associated with poorer
performance even when neither measure yielded a significant change from normoxic levels. But,
as was the case at lower altitudes, Ss did maintain overall performance so were able to
compensate for the physiological stress induced.
The effects of hypoxia at 25000 feet, however, were much more profound. Breath rates
increased and breath amplitudes rose dramatically. On the average, heart rates increased 21 beats
per minute and blood oxygen levels dropped quickly to less than 1/3 of normal. Without
oxygen, all participants reported feeling confused and unable to concentrate. Eight complained of
headaches, three reported nervousness and tingling fingers. One reported tunnel vision and
another said they felt a sense of panic and "simply gave up". There were localized increases in
alpha waves that were related to tracking and monitoring errors and widespread increases in theta
and delta waves that were correlated with significant increases in monitoring task errors and
decreases in tracking ability.
Overall, physiological measures, including the FFTs indicated that at 25,000 ft Ss were
suffering from moderate hypoxia. Correspondingly, their combined performance dropped
significantly. It should be noted however that despite the peripheral physiologic indicators that
all were effected, some Ss were better able to maintain their performance at pre-hypoxic levels
34

and compared with the other measures, the EEG data appeared to be a better indicator of
performance. Evaluations of the EEG data from individual Ss indicated that in two subjects, a
male pilot and a female without flying experience, the FFT spectra remained unchanged even
though both evidenced severe hypoxia based on their pC02 and p02 levels. Alpha power
increased in all other subjects. Five subjects whose performance remained relatively strong
evidenced no change in Theta or Delta band activity during the hypoxic condition. Three
subjects with exceptionally poor performance evidenced increases in Delta band activity while
those subjects who performed well did not evidence comparable changes. The S with the poorest
performance evidenced increases in all bands and further stated that they felt confused, and
found it impossible to concentrate and just "gave up".
The results of this study showed that when participants were asked to simultaneously
manage an array of tasks as aviators are expected to do, some types of tasks were more
susceptible to the effects of hypoxia than were others. For example, under severely hypoxic
conditions, participants made significantly more errors in visual-manual tracking that requires
strong eye-hand coordination and in responding to lights, a skill that requires vigilance and visual
acuity. This agrees with earlier reports by McFarland (1937) and Kobrick and Dusek (1970) who
suggested that visual functions are most susceptible to the effects of hypoxia. In addition to the
more generalized decrease, the amount of time it took to respond to red lights increased 25%
during hypoxia but the time to respond to green lights increased 82%. This agrees with studies of
the effects of hypoxia on night vision (Kobrick, J.L., Zwick, H., Witt, C.E. & Devine, J.A., 1984)
that indicate an increased sensitivity of green receptors to decreases in ambient oxygen levels.
While intriguing, this conclusion should, however, be viewed with caution since in this particular
task the green light corresponded to an "off response while the red light was associated with an
35

"on" response. So, the differences may also represent that difference in task requirements and not
be solely dependent upon stimulus color. Of all the task components, the least effected by
hypoxia was the radio communications, this auditory task was rarely missed even if the response
was delayed. This concurs with other studies (Heath and Harris, 1981) that conclude that
auditory functions relatively impervious to hypoxia's effects.
As the complexity of flight systems and the demands placed upon operators increases, the
overall effects of high altitude flight environs must be thoroughly examined in order to properly
evaluate system design and response requirements that will minimize the possibility of pilot
error in the unfortunate and unexpected event of sudden oxygen loss. These data suggest that
monitoring of physiological responses may hold the key. Furthermore, changes in brain activity
were clearly the best indicator of even subtle changes in task performance. They more accurately
reflected hypoxia's cognitive effects than did the other measures employed, including blood
oxygen levels. This was especially true at the lower altitudes when overall performance did not
drop precipitously. The relationship between these measures and fluctuations in mental workload
are already well established and further investigations of their application in a flight environment
are warranted.
36

REFERENCES
Ashkenazi, I.E., Ribak, J & Avgar, D.M. (1982). Altitude and hypoxia as phase shift inducers.
Aviation, Space and Environmental Medicine. 53,342-346.
Bahrke, Michael S & Shukitt-Hale, Barbara (1993). Effects of altitude on mood, behaviour and
cognitive functioning. Sports Medicine 16,97-125.
Banderet, L. E. & Burse, R.L. (1991). Effects of high terrestrial altitude on military
performance. In: R. Gal & A.D. Mangelsdorff (Eds.), Handbook of military psychology. John
Wiley & Sons.
Bert, P. (1878). Barometric pressure: Researches in experimental physiology. Translated by
M.A. Hitchcock, 1943, Columbus,Ohio: College Book Co.
Comstock, J.R. & Arnegard, R.J. (1992). The multi-attribute task battery for human operator
workload and strategic behavior research. NASA Technical Memorandum 104174.
Cudaback, D.C. (1984). Four-Km altitude effects on performance and health. Publications of
the Astronomical Society of the Pacific. 96,463-477.
Crow, T.J. & Kelman, G.R. (1973). Psychological effects of mild acute hypoxia. British Journal
37

of Anesthesiology. 45, 335-337.
Denison, D.M., Ledwith. F & Poulton, E.C. (1966). Complex reaction times at simulated cabin
altitudes of 5000 ft and 8000 ft. Aerospace Medicine. 37,1010-1013.
Drinker, C.K. (1938) Carbon monoxide asphyxia. New York: Oxford Press.
Ernsting J. (1978). The 10th Annual Harry G Armstrong Lecture: Prevention of hypoxia:
Acceptable compromises. Aviation Space and Environmental Medicine. 49,495-502.
Ernsting, J. (1984). Mild hypoxia and the use of oxygen in flight. Aviation Space and
Environmental Medicine. 55,407-410.
Fisher, C.J. (1982). Hypoxia and hyperventilation. New Zealand Gliding Kiwi, 15,16-21
Fowler, B., Banner, J., & Pogue, J. (1993). The slowing of visual processing by hypoxia.
Ergonomics. 36,727-736.
Fowler, B. & Kelso, B. (1992). The effects of hypoxia on components of the human event-
related potential and relationship to reaction time. Aviation, Space and Environmental Medicine,
63,510-516.
Fowler, B. & Kelso, B. (1988). The effects of hypoxia on P300 and reaction time. North
38
Atlantic Treaty Association Advisory group for Aerospace Research and Development. AGARD
Conference Proceedings. 432,16-17.
Fowler, B., Paul M., Porlier, G., Elcombe, D.D. & Taylor, M. (1985). A re-evaluation of the
minimum altitude at which hypoxic performance decrements can be detected. Ergonomics, 28,
781-791.
Fowler B. & Porlier, G. (1987). The threshold of hypoxia effects on perceptual-motor
performance. Human Factors, 29, 61-66.
Frances, M. & Dyro, M.D. (1989). The EEG Handbook: Hvooxic Encephalopathv.
Fulco, C.S., & Cymerman, A. (1988). Human performance and acute hypoxia. In: K.B.
Pandolf, M.N. Sowka, & R.R Gonzales (Eds.), Human performance physiology and
environmental medicine at terrestrial extremes, pp. 467-496. Indianapolis: Benchmark Press.
Gale, G. E., Torre-Bueno, J.R., Moon, R.E., Saltzman, H.A. & Wagner, P.D. (1985).
Ventilation-perfusion inequality in normal humans during exercise at sea level and simulated
altitude. Journal of Applied Physiology. 58.978-988.
Gibbs, F.A., Davis, H.,& Lennox, W. G. (1935). The electroencephalogram in epilepsy and in
condition of impaired consciousness. Archives of Neurological Psychiatry. 34, 1133-1148.
39

Gibson, G.E., Pulsinelli, W., Blass, J.P. & Duffy, T. (1981). Brain dysfunction in mild to
moderate hypoxia. American Journal of Medicine, 70, 1247-1254.
Grafton, G., Coles, M.G.M. & Donchin, E. (1983), A new method for the removal of ocular
artifact. Electroencephalography and clinical Neurophysiology. 55,468-484.
Greene, R. (1957). Mental performance in chronic anoxia. British Medical Journal, 1(5026),
1028-1031.
Harding, R.M. (1987). Human respiratory responses during high performance flight.
AGARDograph. AGARD-AG-312, Neuilly sur Seine, France :NATO.
Hawkins, F.H. (1987). Human factors in flight. Aldershot, England: Gower Technical Press
Heath, D.W. & Harris, P. (1981). Man at high altitude: The pathophysiology of acclimatization
and adaptation. London: Churchill Livingstone.
Hockaday, J.M„ Potts, F, & Epstein, E. (1965). Electroencephalographic changes in acute
cerebral anoxia from cardiac or respiratory arrest. Electroencephalography and clinical
Neurophysiology, 18, 575-586.
Houston, C.S. (1987). Going higher. The story of man and altitude. Boston, MA: Little Brown
& Company.
40

Kennedy, R.S., Dunlap, M.S.,Banderet, L.E. & Smith, M.G. (1989). Cognitive performance
deficits in a simulated climb of Mount Everest: Operation Everest II. Aviation, Space and
Environmental Medicine. 60,99-104.
Kellogg, R. (1977). Oxygen and carbon dioxide in the regulation of respiration. Federation
Proceedings. 36,1658-1663.
Kellogg, R. (1964). Central chemical regulation of respiration. In, W O, Fenn & H. Rahn
(Eds.), Handbook of Physiology: Respiration, pp. 507-534. Washington, DC: American
Physiological Society.
Kida, M. & Imai, A. (1993). Cognitive performance and event-related brain potentials under
simulated high altitudes. Journal of Applied Physiology. 74,1735-1741.
Kobrick, J. L. & Dusek, E. (1970). Effects of hypoxia on voluntary response time to
peripherally located visual stimuli. Journal of Applied Physiology. 29,444-448.
Kobrick, J.L., Crohn, E., Shukitt, B., Houston, C, Sutton, J. & Cymerman. (1988). Operation
Everest E: Lack of an effect of extreme altitude on visual contrast sensitivity. Aviation. Space
and Environmental Medicine. 60,99-104.
Kobrick, J.L., Zwick, H., Witt, C.E. & Devine, J.A. (1984). Effects of extended hypoxia on
41

night vision. Aviation, Space and Environmental Medicine, 55,191-195.
Koukou, M, Lehmann, D. & Angst, J. (1980). Functional states of the brain: their determinants.
Elsevier: Amsterdam.
Kraaier.V., Van Huffelen, A.C. & Wieneke,G.H. (1988). Quantitative EEG changes due to
hypobaric hypoxia in normal subjects. Electroencephalographv and clinical Neurophysiologv,
69, 303-312.
Kramer, A. (1993). Cognitive function at high altitude. Human Factors. 35. 329-344.
Lenfant, C.& Sullivan, K. (1971). Adaptation to high altitude. New England Journal of
Medicine, 284,1298-1309.
Lewis, R.B. & Haymaker, W. (1948). High altitude hypoxia: Autopsy observations in 75 fatal
cases. School of Aviation Medicine, Randolph Field, Texas.
McFarland, R.A. (1971). Human factors in relation to the development of pressurized cabins.
Aerospace Medicine. 12,1303-1318.
McFarland, R.A. (1963). Experimental evidence of the relationship between aging and oxygen
want. Ergonomics, 6, 338-366.
42

McFarland, R.A. (1937). Psychophysiological studies at high altitude in the Andes. Journal of
Comparative Physiological Psychology, 24,189-220.
McFarland, R A. (1937a). Psycho-physiological studies at high altitude in the Andes: Sensory
and motor responses during acclimatization. Comparative Psychology. 23, 227-258
Meyer, J.S. & Waltz, A.G. (1960). arterial oxygen saturation and alveolar carbon dioxide during
electroencephalography. I. Comparison of subjects without brain disease. Archives of
Neurology. 2. 631-643.
Mitsubo, K. & Akira, I. (1993). Cognitive performance and event related brain potentials under
simulated high altitudes . Journal of Applied Physiology. 74,1735-1741.
Rann, H. & Otis, A.B. (1947). Alveolar air during simulated flights to high altitude. American
Journal: of Physiology. 150,202-221.
Sekiguchi, C , Hand, Y, Gotoh, M. (1978). Evaluation method of mental workload under flight
conditions. Aviation. Space and Environmental Medicine. 49, 920-925.
Shephard, RJ. (1956). Physiological changes and psychomotor performance during acute
hypoxia. Journal of Applied Physiology. 9.343-351.
Shukitt-Hale, B., Stillman, J.M., Welch, D.I., Levy, A., Devine, J.A. & Lieberman, H.R. (1994).
43

Hypobaric hypoxia impairs spatial memory in an elevation dependent fashion. Behavioral and
Neurological Biology, 62,244-252.
Vacher, John M & Miller, Jr., A T. (1968). Altitude-acclimatization: Its effect on hypoxia
induced performance decrements. Psvchopharmacologia, 12,250-257.
Ward, M. (1975). Mountain Medicine: A clinical study of cold and high altitude. Great Britain:
Crosby Lockward Staples.
Wesensten,N.J., Crowley, J., Balkin, T., Kamimori,G., Iwanyk,E., Pearson, N. DevineJ.,
Belenky, G. & Cymerman, A. (1993). Effects of simulated high altitude exposure on long-
latency event-related brain potentials and performance. Aviation, Space and Environmental
Medicine, 64, 30-36.
West, J.B. (1984). Human physiology at extreme altitudes on Mount Everest. Science, 223,
784-788.
West, J.B. (1986). Do climbs to extreme altitude cause brain damage? Lancet, 85, 387-388.
West, J.B. (1979). Respiratory physiology: The essentials. Baltimore: Williams and Wilkins Co.
Wilson, G F, Oliver, C G (1991). PATS: Psychological Assessment Test System. In: E.Farmer
(ed.), Stress and error in aviation : Proceedings of the XVJJJ WEAAP conference (vol. 2, pp. 15-
44

25). Worcester: Billing and Son Ltd.
45
Related Documents