PI\J· /0 q 'iC&"'1 AFRICA NUTRITION Nutrition and Health Status of Young Children and Mothers in Mozambique Findings from the 1997 Mozambique Demographic and Health Survey mmD ........ u.s. Agency for International Development 'ijjW MACRGI Macro International Inc. ,,,,.

Welcome message from author
This document is posted to help you gain knowledge. Please leave a comment to let me know what you think about it! Share it to your friends and learn new things together.
Transcript
PI\J· A-CL-'9.q~ /0 q 'iC&"'1
AFRICA NUTRITION
Nutrition and Health Status of Young Children and Mothers in Mozambique
Findings from the 1997 Mozambique Demographic and Health Survey
mmD ~ ........ u.s. Agency for International Development 'ijjW
MACRGI Macro International Inc. 's'r'~.~~""~" ,,,,.
Nutrition and Health Status of Young Children
and Mothers in Mozambique
Findings from the 1997 Mozambiqne
Demographic and Health Snrvey
Donna Espeut 1
Maria de Lourdes Fidalgo2
Carina Hassane Sulma1gy Ismae12
Robert Johnson3
Altrena Mukuria3
Macro International Inc. Calverton, Maryland USA
February 2001
I Johns Hopkins University School of Hygiene and Public Health, 2 Ministry of HeaJth, Mozambique, 3 Macro
International Inc.
CONTENTS
Page
Tables ................................................................................................................................................. v Figures ............................................................................................................................................. vii Acknowledgments ............................................................................................................................. ix Executive Summary ........................................................................................................................... xi Acronyms ......................................................................................................................................... xv Map of Mozambique ........................................................................................................................ xvi
CHAPTER I INTRODUCTION ..................................................................................................... 1
l.1 The Social and Economic Context... ........................................................................... 1 1.2 The Political Context ................................................................................................. 2 1.3 Agriculture and Diet... ................................................................................................ 2 1.4 Food Security ............................................................................................................. 3 l.5 Nutrition and Health Policies in Mozambique ............................................................ 3 l.6 The Need for Nutritional and Health Data in Mozambique ........................................ .4 l. 7 Data Source and Type of Information Collected ......................................................... 5
CHAPTER 2 NUTRITIONAL STATUS OF INFANTS AND CHILDREN .................................... 7
2.1 Effects of Malnutrition ............................................................................................... 7 2.2 Basic Indicators of Nutritional Status ......................................................................... 9 2.3 Study Data and Methodology ................................................................................... 10 2.4 Birth Weight ............................................................................................................ 10 2.5 Overall Prevalence of Malnutrition ........................................................................... 12 2.6 Geographic Variations in Malnutrition ..................................................................... 13 2.7 Malnutrition according to Age .................................................................................. 16 2.8 Comparison with Other Sub-Saharan Countries ........................................................ 16 2.9 Summary ................................................................................................................. 17 2.10 Recommendations .................................................................................................... 17
CHAPTER 3 INFANT AND CHILD FEEDING PRACTICES ..................................................... 19
3.1 Optimal Infant and Child Feeding Practices .............................................................. 19 3.2 Initiation of Breastfeeding ........................................................................................ 20 3.3 Exclusive Breastfeeding ........................................................................................... 22 3.4 Introduction of SOlid Foods ...................................................................................... 24 3.5 Duration of Breastfeeding ........................................................................................ 27 3.6 Reasons for Weaning ............................................................................................... 29 3.7 Comparison with Other Sub-Saharan Countries ........................................................ 31 3.8 Summary ................................................................................................................. 31 3.9 Recommendations .................................................................................................... 31
CHAPTER 4 MORTALITY AND MORBIDITy .......................................................................... 33
4.1 Infant and Under-five Mortality ............................................................................... 33 4.2 Comparison with other Sub-Saharan Countries ......................................................... 35 4.3 The Relationship between Malnutrition and Mortality .............................................. 35
iii
4.4 4.5 4.6 4.7
4.8 4.9 4.10
CHAPTERS
5.1 5.2 5.3 5.4 5.5 5.6 5.7 5.8 5.9
CHAPTER 6
6.1 6.2 6.3 6.4 6.5 6.6 6.7
CHAPTER 7
7.1 7.2 7.3 7.4 7.5 7.6
Page
Contribution of Malnutrition to Under-five Mortality ............................................... 36 Regional and Age-specific Patterns of Morbidity ...................................................... 36 Patterns of Care-seeking and Treatment for Common Childhood Illnesses ................ 39 Maternal Knowledge and Attitudes Regarding Treatment of Diarrhea in Children ............................................................................................................... 42 Factors Associated with Diarrhea ............................................................................. 44 Summary ................................................................................................................. 50 Recommendations .................................................................................................... 50
FACTORS ASSOCIATED WITH MALNUTRITION ............................................. 53
Biological and Health Characteristics of Stunting ..................................................... 53 Biological and Health Characteristics of Wasting ..................................................... 55 Socioeconomic and Demographic Characteristics of Stunting ................................... 55 Socioeconomic and Demographic Characteristics ofWasting ................................... 58 Multivariate Regression Analysis ............................................................................. 58 Risk Factors for Stunting .......................................................................................... 61 Risk Factors for Wasting .......................................................................................... 63 Summary ................................................................................................................. 64 Recommendations .................................................................................................... 64
NUTRITIONAL STATUS OF WOMEN ................................................................. 67
Background .................................................................................................... '" ...... 67 Data Collected ......................................................................................................... 68 Indicators of Maternal Nutritional Status .................................................................. 70 Height, Weight and Body Mass Index ...................................................................... 71 Maternal Chronic Energy Deficiency ....................................................................... 76 Summary ................................................................................................................. 76 Recommendations .................................................................................................... 77
KEY RECOMMENDATIONS ................................................................................ 79
Food Security ........................................................................................................... 79 Women's Welfare .................................................................................................... 80 Primary Health Care ................................................................................................ 80 Breastfeeding and Child Nutrition ............................................................................ 81 Information, Education and Communication ............................................. '" ............ 81 Research .................................................................................................................. 81
REFERENCES ................................................................................................................................ 83
APPENDIX A: Sample Design ........................................................................................................ 91 APPENDIX B: Household and Respondent Background Characteristics .......................................... 75 APPENDIX C: AnthropometriC Data Verification .......................................................................... 109 APPENDIX D: Malnutrition among Children 3 to 35 Months ........................................................ 113 APPENDIX E: Regional, Residential, and Gender Differences in the Prevalence
of Malnutrition by Child's Age, Mozambique 1997 ................................................ 119 APPENDIX F: Feeding Practices by Age ....................................................................................... 123 APPENDIX G: Logistic Regression Analysis ................................................................................. 127
iv
Table 2.1 Table 2.2
Table 3.1 Table 3.2 Table 3.3 Table 304 Table 3.5 Table 3.6
Table 4.1 Table 4.2 Table 4.3 Table 404 Table 4.5 Table 4.6 Table 4.7
Table 5.1 Table 5.2 Table 5.3
Table 6.1 Table 6.2 Table 6.3
Table 6.4 Table 6.5 Table 6.6
Table B.I Table B.2 TableB.3 Table Bo4 TableB.5 TableB.6 Table B.7 TableB.8 TableB.9 Table B.1O Table B.II Table B.12 Table B.l3 Table B.14 Table B.15 Table B.16
TABLES
Page
Birth weight and size at birth for children under three years ......................................... II
Stunting, wasting, and underweight ............................................................................. 14
Initial breastfeeding ..................................................................................................... 21
Prevalence of exclusive breastfeeding ......................................................................... 23
Types of foods received by children in preceding 24 hours .......................................... 26
Types of foods received by nonbreastfeeding children in preceding 24 hours ............... 27
Median duration and frequency of breastfeeding .......................................................... 28
Reason for weaning ..................................................................................................... 39
Infant and under-five mortality rates ............................................................................ 34
Prevalence and treatment of diarrhea, fever, and cough ............................................... 37
Source of treatment for diarrrhea and cough ............................................................... .40
Attitudes and practices concerning diarrhea care ........................................................ .41
Knowledge of diarrhea care ......................................................................................... 43
Use of oral rehydration therapy for treatment of diarrhea ............................................. 44
Prevalence and estimate of net relative odds of diarrhea among
children under three years ........................................................................................... 45
Stunting and wasting by biological characteristics ....................................................... 54
Stunting and wasting by socioeconomic characteristics ................................................ 57
Estimated net relative odds of stunting and wasting ..................................................... 62
Recommended total weight-gain ranges for pregnant womelL ...................................... 68
Distribution of mothers' ages ...................................................................................... 69
Height, weight, and body mass index (BMI) for allwomen and for
nonpregnant women .................................................................................................... 69
Distribution of mother's height. ................................................................................... 71
Distribution of mother's weight and BMI .................................................................... 71
Prevalence and estimated net relative odds of low body mass
among nonpregnant women ......................................................................................... 72
Distribution of children by residence ........................................................................... 97
Anthropometric measurement of children .................................................................... 98
Mean number of living and dead children .................................................................... 98
Mother's age ............................................................................................................... 99
Mother's education ..................................................................................................... 99
Mother's occupation ................................................................................................. 100
Usual caretaker of childrenof women working outside the home ................................ 101
Sex of household head ............................................................................................... 101
Mother's marital status .............................................................................................. 102
Mother's partner's education ..................................................................................... 103
Mother's partner's occupation ................................................................................... 103
Toilet facility ............................................................................................................ 104
Source of drinking water ..................................................................................... '" ... 104
Type of floor ............................................................................................................. 105
Exposure to the mass media ...................................................................................... 106
Socioeconomic status ................................................................................................ 106
v
Table B.17 Table B. 18
Table C.I TableC.2
Table D.I
TableE.1 TableE.2
TableF.l
Page
Antenatal care provider ............................................................................................. 107 Assistance at delivery ................................................................................................ 108
Characteristics of children with missing anthropometric data ..................................... I I I Digit preference in anthropometric data ..................................................................... 1 12
Malnutrition among children age 3 to 35 months ....................................................... I IS
Malnutrition by residence, sex, and age ..................................................................... 121 Malnutrition by socioeconOmic status and age ........................................................... 122
Feeding practices by age .............................................................................. , ............ 125
vi
Figure 2.1 Figure 2.2 Figure 2.3 Figure 2.4 Figure 2.5 Figure 2.6
Figure 3.1 Figure 3.2
Figure 3.3 Figure 3.4
Figure 4.1
Figure 4.2 Figure 4.3 Figure 4.4
Figure 6.1
FIGURES
Page
Causes of malnutrition .. , ............................................................................................... 8 Malnutrition among children under 3 years ................................................................. 13 Stunting and wasting among children under 3 years by urban-rural residence .............. 15 Stunting and wasting among children under 3 years by region ..................................... 15 Stunting, wasting, and underweight by age .................................................................. 16 Stunting among children under 3 years in sub-Saharan countries ................................. 17
Feedinng practices for infants under 6 months ............................................................. 23 Exclusive breastfeeding among infants under 6 months by residence and region ................................................................................................................... 24 Feeding praL'tlces for infants age 6 to 9 months ............................................................ 25 Breastfeeding with solid foods among infants age 6 to 9 months by residence and region .................................................................................................... 25
Under-five child mortality in Mozambique compared with other sub-Saharan countries ..................................................................................................................... 35 Malnutrition and under-five mortality .......................................................................... 36 Diarrhea and wasting by age of child ........................................................................... 38 Fever and cough by age of child .................................................................................. 39
Kurz and Johnson-Welch Framework for Women's Nutrition (2000) ........................... 73
vii
ACKNOWLEDGMENTS
The authors would like to thank a number of individuals for their valuable contributions to this project. In Mozambique, we would like to thank Mr. Chad MacArthur of Hellen Keller International (Maputo) for his logistical support during the visit of one of the authors to Mozambique in August 1999. We would also like to thank USAlD/Mozambique for its support of the visit to Mozambique as well as the viSit of the Mozambican authors to Calverton, Maryland in January and February 2000.
In the United States, we would like to thank Ms. Hope Sukin in the USAlD Africa Bureau, who was the driving force behind this report.
Several individuals from Macro International contributed to the project. Ms. Theresa Richardson and Ms. Stephanie Kratz organized all the logistics for the working party and assisted the Mozambican team during its visit to the United States. Special thanks go to Casey Wisecarver, who was involved in the final report revisions. Finally, the efforts of Kaye Mitchell, who prepared the report for publication, and Sidney Moore, who edited the report, are greatly appreciated.
ix
EXECUTIVE SUMMARY
Malnutrition is one of the most important health and welfare problems among infants and young children in Mozambique, resulting in serious health and economic consequences for both the individual and nation. Thirty-six percent of Mozambican children 0 to 35 months of age are stunted, 8 percent are wasted, and 26 percent are underweight. Of the children who are stunted, 44 percent are severely stunted. Likewise, more than one-quarter of the wasted children are severely wasted. The high level of severe stunting is most likely a consequence of food insecurity due to long-term food shortages (International Monetary Fund (IMF, 1996» and may reflect high morbidity, in particular, diarrheal disease (Molbak et a!., 1997; Cliff and Noormahomed, 1993; Miulstry of Health and Eduardo Mondlane University Fac-lllty of Medicine, 1988).
There is a distinct age-specific pattern of stunting and wasting in children up to three years. In Mozambique, there is a general upward trend in the prevalence of stunting with increasing age. This trend peaks at 60 percent around the age of 25 months, drops during the earlier part of the third year of life, and begins to rise again by the end of that year. The general age pattern of underweight mirrors that of stunting. Age variations in wasting prevalence are not as marked as stunting and underweight, although an age pattern still exists. Wasting prevalence peaks much earlier than stunting at around 16 months of age, with a prevalence rate slightly less than 20 percent. The prevalence of wasting remains close to 10 percent for the latter part of the second year and the early part of the third year of life. After the 26th
month, the prevalence declines further and plateaus at near -zero levels for the remainder of the third year of life.
It should be noted that during the early stages of infancy, the age pattern of wasting loosely mirrors age patterns in infant feeding. With the introduction of complementary liquids and foods, wasting increases. Among children under the age of three, the median duration of exclusive breastfeeding is slightly less than 1 month. Although breastfeeding practices during the first 6 months of life are less than optimal in Mozambique, the median duration of full breastfeeding is almost 4 months. For the most part, children are breastfed well into the second year of life. Eighty-five percent of all children 6 to 9 months of age were receiving complementary foods in addition to breast milk. The overall duration of any breastfeeding was 22 months, which is consistent with optimal breastfeeding standards. Nevertheless, the early age at which cereals and other foods are introduced increases the child's chances of becoming malnourished or ill. Thus, there is a need to raise awareness regarding the benefits of exclusive breastfeeding and age-appropriate weaning practices.
In Mozambique, 135 infants out of every 1,000 born die before their first birthday. Among all children under 5 years, 201 of every 1,000 will die before reaching their fifth birthday. Malnutrition is an important factor in the deaths of young children. Indeed, an estimated 44 percent of all deaths among children under the age of 5 years are related to malnutrition. Moderate malnutrition accounts for a larger proportion of under-five mortality than severe malnutrition (33 percent versus 11 percent). Consequently, nutrition interventions aimed at the prevention, detection, and timely treatment of all types of malnutrition, in particular mild-to-moderate cases, can have a tremendous impact on child survival in Mozambique.
Among the children studied, 21 percent had diarrhea in the 2 weeks preceding the survey. Diarrhea follows a similar age pattern to wasting, with an upward trend throughout infancy, peaking between 14 and 16 months of age. Diarrhea frequently results in fluid loss and dehydration, decreased food and fluid intake due to anorexia, and malabsorption and increased nutrient loss, illustrating the similar age patterns between diarrhea and wasting. Oral rehydration therapy (aRT) is used to treat the dehydration that accompanies diarrhea. The most common forms of aRT are (1) a solution prepared by mixing water with oral rehydration salts (ORS) and (2) recommended home fluids (RHF) made from
xi
domestically available products (typically sugar, salt, and water). The use of ORT (either ORS or RHF) was reported by less than one-half of mothers with children who had diarrhea in the previous two weeks. However, 44 percent of diarrhea-affected children received increased amounts of fluids.
Women's nutritional status before conception and during pregnancy is important both as an indicator of overall women's health and as a predictor of pregnancy outcome for both mother and infant. In Mozambique, 12 percent of nonlactating and I I percent of lactating, nonpregnant Mozambican women experience chronic energy deficiency (CED), which can put women and their current and future pregnancies at risk. At the other end of the spectrum, 14 percent of non-lactating mothers and 8 percent of lactating, non-pregnant Mozambican women are overweight, which may put them at risk for diabetes and cardiovascular disease.
Analyses of the factors related to both child and maternal nutrition point to the multidimensional nature of the nutrition problem in Mozambique. However, because the immediate causes of malnutrition are inadequate food intake and illness, both short- and long-term strategies are needed. Selected important strategies that are recommended include the following:
Food Availability
• Guarantee the security of land tenure as means by which peasants and private farmers are encouraged to improve and diversify production in a sustainable manner.
• Promote the transfer of technology to farmers to increase production and productivity and to reduce postharvest losses.
• Continue researching the possibility of creating a maintenance system for reserve food stocks at the district, provincial, and national levels.
• Strengthen SOCial-assistance services for populations living in vulnerable areas.
Economic Access to Available Food
• Improve rural infrastructure (e.g., roads, water supply, health facilities, schools) by means of laborintensive employment programs targeting food-insecure and displaced people.
• Provide income-generating activities by means of professional training and credit for starting small businesses in urban areas where the household preference is to buy commercial food rather than to rely on agricultural subsistence.
• In an effort to scale down foreign food aid, use food aid as a part of wage payments for individuals employed in labor -intensive public works programs.
Women's Welfare
• Increase women's access to credit and other financial services.
• Improve educational opportunities for females.
• Within the National Program for Women and Children, create a snbdivision that addresses women's nutritional and health status beyond the purview of motherhood and reproduction.
xii

• Establish micronutrient supplementation programs (e.g., iron, folate, vitamin A) that target pregnant
and lactating women.
Primary Health Care
• Establish integrated health and nutrition intervention projects with family planning, nutrition, and
primary-health-care components.
• To address the limited access to care, establish small rural outposts that focus on primary and
secondary prevention of malnutrition and illnesses.
• Promote Integrated Management of Childhood Illness (IMCI )
Breastfeeding and Child Nutrition
• Develop a national policy concerning HIV and breastfeeding.
• Train medical professionals on the importance of early and sustained breastfeeding and age
appropriate feeding practices (e.g., the introduction of complementary foods, appropriate weaning
age).
• Establish and maintain compliance of all hospitals with standards of the International Baby-Friendly
Hospital Initiative.
• Establish special nutrition and primary-health-care programs targeting the estimated 200,000
Mozambican children who are orphaned or have been separated from their families.
Information, Education, and Communication
• Use mass media to promote ideal nutritional standards and behaviors that will enhance the health of
women and children.
Re.~earch
• Support qualitative research studies that investigate factors related to care-seeking and community
perceptions regarding infant feeding, HIV, the acceptance of local micronutrient-rich foods,
adolescent health, and maternal nutrition.
xiii
BMI
CDD CED CIHI CIUEM
EPI
FAO
GAPVU
IMF 10M IUGR
LBW
MCH MDHS
NSA
ORT
PTB
RENAMO
SD SMF
UNICEF
WHO
ACRONYMS
body mass index
control of diarrheal diseases program chronic energy deficiency Center for International Health Information Centro de Informatica da Universidade Eduardo Mondlane (Information Center ofthe Eduardo Mondlane University)
National Expanded Program on Immunization
Food and Agriculture Organization
Grupo de Trabalho para 0 Apoio dos Segmentos Populacionais (Task Force for Support of Vulnerable Population Segments)
International Monetary Fund Institute of Medicine intrauterine growth retarded births
low birth weight
maternal and child health program Mozambique Demographic and Health Survey
Novo Sistema de Abastecimento (New System of Food Supply)
oral rehydration therapy
preterm birth
Resistencia Nacional M09ambicana (Mozambique National Resistance)
standard deviation Social Fund for Medicine and Infant Food Supplement Program
United Nations Children's Fund
World Health Organization
xv
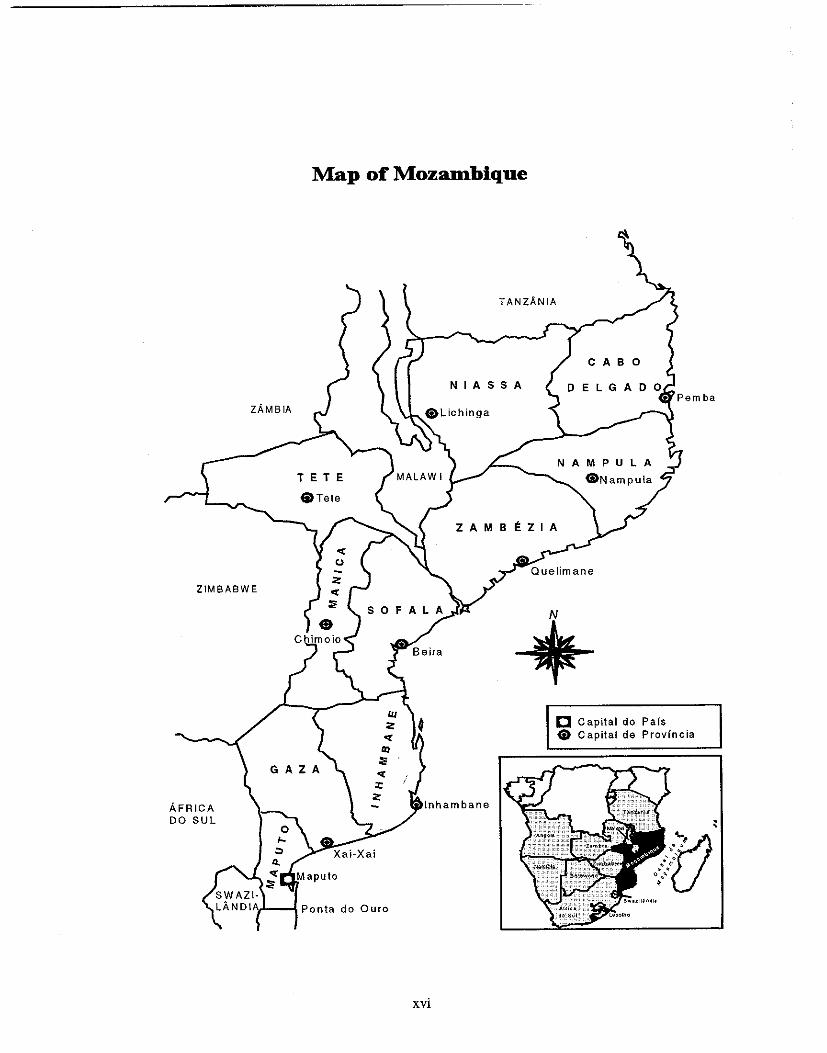
Map of MozaJnbique
TANZANIA
ZAMBIA
ZIMBABWE
AFRICA DO SUL
IA,I_~ Ponta do Duro
NIASSA
Inhambane
xvi
CAB 0
E L GAD
C Capital do Pals e Capital de Provfncia
CHAPTERl
INTRODUCTION
1.1 The Social and Economic Context
Located in southern Africa, the Republic of Mozambique is a sparsely populated country of 17 million people. The official language is Portuguese although a number of indigenous languages are also spoken. Mozambique is composed almost entirely of indigenous ethnic groups such as the Shangaan, Chokwe, Manyika, Sena, and Makua (Informational Center of the Eduardo Mondlane University (CIDEM), 1999). Europeans, Indians, and other groups account for less than I percent of the total population. With respect to religion, the majority of the population subscribes to indigenous beliefs, with the remainder being Christian, Muslim, and Hindu (CIDEM, 1999).
The population in Mozambique is predominantly rural; less than one-third is officially defined as urban (IMF, 1996). With a 1997 estimated per capita income below US$100 (United Nations Children's Fund (UNICEF), 1998), poverty is widespread. Approximately 60 percent of.the population live below the poverty line and almost 70 percent of all poor households reside in rural areas (IMF, 1996). In addition, access to clean drinking water is a luxury for most Mozambicans: only 66 percent of urban residents and 12 percent of rural residents have water and sanitation services (Government of Mozambique et al., 1998). In spite of these less-than-optimal living conditions, Mozambique exceeds many poor nations in critical areas of social development such as life expectancy (47 years), primary school enrollment (60 percent), and adult literacy (40 percent) (UNICEF, 1998).
Although economic gains have been made in recent years, the civil war of the 1980s destroyed much of the country's infrastructure and created major impediments to development. In addition, approximately four million displaced people fled from their homes during rural insurgencies and at least two milIion Mozambicans sought refuge in neighboring African countries (World Bank, 1997; Cliff and Noormahomed, 1993). This high degree of population displacement has had major social and demographic ramifications. One such consequence is widespread rural-to-urban migration. Mozambique's urban population is growing at a rate of almost 9 percent annually-the fastest urban growth rate in the world (Center for International Health Information (CIHI), 1995). Urban growth has occurred with little planning or organization, resulting in problems such as overcrowding and inadequate water and sanitation services (Ministry of Co-operation and UNICEF, 1990)--conditions that jeopardize the well-being of urban residents, especially children. In 1992, the civil war ended, and the majority of refugees returned to Mozambique by the end of 1994 (CIHI, 1995). The process of social reintegration has been complicated; and former refugees face a number of social and economic difficulties as they try to reestablish some semblance of their prewar lives.
In spite of events during the recent past, Mozambique is in the midst of a transition from war to peace. The government is attempting to revitalize the economy; rebuild infrastructure; and improve the social, economic, and health status of its citizens. A number of donor agencies and multinational organizations also support economic, health, and development efforts throughout the country.
Given its large tracts of fertile, uncultivated land and its natural resources such as coal, titanium, and natural gas, there is a tremendous potential for economic growth in Mozambique. As Mozambique moves from dependence on foreign aid to a higher degree of economic self-sufficiency, there is the potential to increase production of traditional export crops such as citrus fruits and cashews and to expand the export of commodities such as cotton and shrimp. Involvement in the export industry would provide the average Mozambican family with an additional source of income, which in turn may improve their social, economic, and health outcomes.
I
With respect to family income, agriculture is the mainstay of the rural household economy, in spite of being characterized primarily by subsistence farming (IMP, 1996), Only 29 percent of rural households sell their agricultural production (IMF, 1996). Women are essential to the rural family economy, accounting for 61 percent of the agricnltural workforce (Ministry of Co-operation and UNICEF, 1990). In contrast to rural areas, activities within the informal sector, such as small-scale trading, are the primary sources of income for urban households. This high dependence upon the informal sector is a direct consequence of high unemployment and a decline in real wages in urban areas (IMF, 1996). Poor women, who lack the capital as well as the educational and occupational skills to engage in more profitable activities, are the primary entrepreneurs within the informal sector. Although poor urban women lack formal training, they exhibit a considerable amount of business savvy and are critical in sustaining the urban family. Despite their integral role in both rural and urban family economies, Mozambican women are often forced to pursue income-generating activities at the expense of other activities such as health care or child rearing (Ministry of Co-operation and UNICEF, 1990).
1.2 The Political Context
In 1975, Mozambique gained independence from Portugal. Shortly thereafter, dissidents to the newly founded government formed the Resistencia Nacional Mo~ambicana (RENAMO). This armed resistance movement, which was backed by the South African Government from 1985 to 1992, launched a full-scale destabilization effort in Mozambique (Cliff and Noormahomed, 1993). The civil war was concentrated primarily in rural areas, disrupting social organization and destroying rural infrastructure, particularly in the agricultural, health, and education sectors.
After years of social and economic upheaval, Mozambique is finally making the transition from war to peace. Today, there are three major political parties: the Frente de Liberata~ao de Mo~ambique (Frelimo), the Resistencia Nacional M~ambicana (RENAMO), and the Democratic Union (DU). Mozambique held its first democratic elections in October 1994, resulting in the election of President Joaquim Chissano, a member of the Frelimo party (CIHI, 1995).
The Republic of Mozambique has a democratic form of government. There are 10 provinces that serve as administrative units: Cabo Delgado, Gaza, Inhambane, Manica, Maputo, Nampula, Niassa, Sofala, Tete, and Zambezia. Mozambique's capital, Maputo City, functions as a separate entity from Maputo Province and is regarded as its own administrative unit. Thus, there are 11 administrative divisions within the country. There has been a recent movement toward a more decentralized government, allowing each province a substantial amount of freedom to make decisions and allocate resources.
1.3 Agriculture and Diet
Agriculture, which is dominated by small family farms, is the primary sector in Mozambique. Recently, the Mozambican government has begun to expand the export markets for such crops as maize, rice, manioc, and millet, in addition to other commodities including citrus, shrimp, and sugar. Some agricultural families, particularly in the northern provinces, generate additional income by means of cash crops such as coconut, cotton, and cashews. Unlike their rural counterparts, urban Mozambicans are generally not involved in agricultural activities; however, though a small proportion of them serve as migrant labor both domestically and in neighboring African countries.
Approximately 80 percent of Mozambicans rely upon subsistence farming to meet their dietary needs. Subsistence crops such as maize, rice, manioc, and millet are staples of the Mozambican diet. Vegetable oil and sugar are also commonly used. Despite its importance to the average family, the agricultural industry has been one of the biggest casualties of war. During the 1980' s, crop production
2
declined substantially, providing less than 10 percent of the total estimated requirements for the country's urban and displaced rural populations (Ministry of Co-operation and UNICEF, 1990). Daily caloric intake in Mozambique is quite low; the average diet provides only 77 percent of dietary requirements (CIHI, 1995). Although the government is taking measures to reconstruct the agricultural sector and stabilize the national economy, there is valid concern for the present and future nutritional status of Mozambicans.
1.4 Food Security
Food security entails food availability and accessibility, both of which are problems in Mozambique. Decreased rural crop production has reduced the self-provisioning capabilities of many rural households to obtain adequate diets (Ministry of Co-operation and UNICEF, 1990). A lengthy period of social instability and economic depression has further exacerbated poverty conditions in urban areas. As a result, many rural and urban families do not have the financial resources to purchase sufficient food.
For many years, Mozambique did not have sufficient production to provide adequate levels of food for the whole population. Commercial importation of food was not possible during that time due to a shortage of foreign exchange in the economy. Consequently, Mozambique relied on foreign food aid to meet some of the nutritional needs of its citizens. Today the situation is different. Eighty percent of the cereal that the country needs is produced in the country and only 20 percent comes from foreign food aid (Government of Mozambique et a!., 1998).
1.5 Nutrition and Health Policies in Mozambique
Government attempts at alleviating current food supply problems have focused on economic reform and a revitalization of the struggling agricultural sector. One such initiative is the Economic Recovery Program (Food and Agriculture Organization (FAO), 1987). Through donor support, a number of monetary and agricultural policy reforms have arisen out of this program. In 1990, the Task Force for Support of Vulnerable Population Segments (GAPVU) was established to provide food subsidies and direct income assistance to poor households who meet at least one of the following criteria: (1) infant malnutrition, (2) maternal underweight, (3) poverty among the elderly, or (4) physical disability in adults. The initial scheme supported 2,000 households in Maputo but has since expanded coverage to 90,000 households. The Poverty Alleviation Strategy of 1995 aimed to improve safety-net programs such as the School Lunch Program and the Social Fund for Medicine and Infant Food Supplement Program (SMP) (IMP, 1996).
Shortly after achieving independence in 1975, the Mozambican Government established a set of health policies that mandated free preventive and curative services, drugs, and diagnostic procedures for all citizens. Given financial and other resource constraints, the government was forced to redefine many of its health policies, however. User fees were introduced for a selected number of medical services, creating a major barrier to access for many poor Mozambicans (Ministry of Co-operation and UNICEF, 1990). In addition to financial barriers to access, poor health infrastructure has also impeded care: less than one-half of the population lives within one hour of modern health services (CIHI, 1995).
In response to limited health service coverage, the National Health Strategy was adopted in 1995 and aims to increase national health coverage to 60 percent by the year 2000 (IMP, 1996). Emphasis is placed upon improving both coverage and quality of primary-health-care services. Women and children are particular targets of the strategy. Since the war, national progress has been made in terms of immunization coverage. The National Expanded Program on Immunization (EPI), which was established in 1981, administers vaccines at "well baby" clinics (Cutts et a!., 1994). A1lbough the EPr program is not a nutrition intervention program per se, it aims to reduce the prevalence of communicable diseases, such
3
as measles, which may compromise child nutritional status. Immunization coverage rates are substantially higher in the capital city of Maputo relative to other areas of the country; however, it is speculated that coverage will improve with increasing social stability in rural areas (CIHI, 1995).
The high prevalence of diarrheal disease among Mozambican children, coupled with the poor management of diarrheal disease within the health system, has been linked to widespread malnutrition (Cliff and Noormahomed, 1993; Ministry of Health and Eduardo Mondlane University Faculty of Medicine, 1988). The diarrheal disease control program (COD) in Mozambique has focused on the promotion of oral rehydration therapy as the main strategy in managing diarrheal disease in children (Cutts et aI., 1988). Although use of ORT has been low historicaIIy, it has increased to at least 60 percent in recent years (CIHI, 1995). Cholera epidemics between 1979 and 1984 intensified ORT promotion by the govermnent as weII as ORT acceptance by health personnel and the community at large (Cliff et aI., 1990). Increased coverage has been achieved primarily by means of community mobilization efforts since the civil war decreased access to health facilities (Cliff and Noormahomed, 1988).
Within the Ministry of Health, the National Program for Children and Women is a three-pronged approach to improving health and nutritional status in Mozambique. The three programmatic strategies are as foIIows (Ministry of Co-operation and UNICEF, 1990):
• The Emergency Program, which aims to (a) reduce mortality by supplying essential foods and goods and (b) reduce structural poverty by assisting families in generating their own income.
• Improved Access to Services, which aims to (a) reduce child morbidity and malnutrition and (b) provide pre- and postnatal care to pregnant women. This strategic objective also entails the repair and expansion of the health infrastructure.
• Supporting Nutritional and Food Security, which is an economic approach to stimulating household production and marketing in the poorest households. It also aims to increase access to agricultural technology and production.
In addition to the National Program, there have been a number of multisectoral programs that focus on rural development. One example is the Massinga Integrated Rural Development Program in the southern province of Inhambane (Ministry of Co-operation and UNICEF, 1990). Through integrated health, educational, agricultural, and capacity-bnilding activities, The Massinga Program has demonstrated awareness, on the part of the govermnent, of the multifaceted nature of the health and nutrition problems facing poor Mozambicans.
Government intervention in urban areas has been limited primarily to the establishment of a food rationing system, the Novo Sistema de Abastecimento (NSA). The NSA currently operates in the urban centers of Maputo and Beira (Ministry of Co-operation and UNICEF, 1990). The low purchasing power of most urban households renders this system somewhat ineffective in meeting the nutritional needs of its target populations, however. Although the NSA has provided some urban families with commercial access to basic food items, such as cereal goods and cooking oil, the quantities that are distributed per household only meet approximately 50 percent of the average family's basic nutritional needs. The remainder must be purchased in local markets, although some families receive food gifts and transfers from their rural relatives.
1.6 The Need for Nutritional and Health Data in Mozambique
NationaIIy representative data on morbidity and mortality are relatively scarce in Mozambique for the time before the most recent census and survey activity of 1997. The health information system only
4
registers morbidity and mortality that occur in public health facilities. Therefore, the level of morbidity and mortality in the actual population is underrepresented. In the late 1980s, the Ministry of Health recognized the need for more accurate information and initiated a nutrition surveillance system. Information from the surveillance system is used to calculate two nutrition indicators: growth faltering and low birth weight. It should be noted, however, that rates from the surveillance system may not reflect the general population because they are once again based upon children who access formal health services. Since most Mozambicans do not have access to health care in the formal sector (Ministry of Cooperation and UNICEF, 1990), population-level data are needed to highlight problems and identify segments of the population that warrant research, policy, and programmatic attention.
1.7 Data Source and Type of Information Collected
The data presented in this report are based upon results from the 1997 Demographic and Health Survey in Mozambique (MDHS). Appendix A provides a description of the MDHS sample design and methodology. The individual questionnaire provides the basis for this report. yielding information on the following topics: fertility, nuptiality. fertility preferences, family planning, infant and child mortality, maternal mortality, maternal and child health, breastfeeding, and anthropometry of mothers and children under three years of age. Data relating to characteristics of household members, housing characteristics, and the possession of certain durable goods have also been collected. Household characteristics and the sociodemographic characteristics of women are presented in Appendix B.
Data on vaccination, nutritional, and health status were collected on all respondents' children born after January 1994 (age 0-35 months at the time of the survey). Information on mortality was also collected for all children of the survey respondents. Questions on recent morbidity, nutrition, and health care were asked only for surviving children. These questions concerned breastfeeding; nutritional practices; and the onset and treatment of diarrhea, fever, and cough during the two weeks preceding the survey. This report is based on a subsample of 2,837 surviving children under the age of three, for whom complete anthropometric data were available.
5
CHAPTER 2
NUTRITIONAL STATUS OF INFANTS AND CHILDREN
Poor nutritional status is linked to a number of social, economic, and health-related factors. In a country like Mozambique, where health resources are scarce, it is important to identify geographic areas and segments of the population that are at the highest risk. Based upon data from the 1997 MDHS, this chapter discusses the prevalence and severity of key nutritional outcomes in Mozambican children under the age of three. Disparities in these outcomes are explored along various sociodemographic dimensions such as age, sex, and place of residence. In addition, MDHS results are compared with findings from Demographic and Health Surveys in other African countries.
2.1 Effects of Malnutrition
Malnutrition is directly related to inadequate food intake and infectious diseases such as diarrhea, acute respiratory illness, malaria, and measles. Both infectious disease and inadequate food intake reflect underlying social and economic conditions at the household, community, and national levels. Figure 2.1 is adapted from the UNICEF conceptual framework for malnutrition (UNICEF, 1990; Jonsson, 1995) and reflects the relationShips among various factors and the mechanisms that lead to childhood malnutrition. Political, socioeconomic, environmental, and cultural factors operating at the national and community levels, as well as poverty at the household level, ultimately affect the nutritional status of children. For example, employment provides a source of income and is an important determinant of household food security. Female employment, in particular, offers women opportunities for controlling resources and may result in increased availability of food; improved child-care practices; and ultimately improved nutritional status. Similarly, maternal education, through its association with biological and behavioral causes of malnutrition (e.g., child-care practices', feeding behaviors and patterns), is a powerful predictor of child nutritional status and fertility (Moore and Favin, 1990). It should be noted, however, that social and cultural norms or the economic situation in a country can work against greater education and employment for women.
According to the UNICEF framework in Figure 2.1, poor children are more vulnerable to malnutrition as a consequence of poor environmental conditions, low immunization rates, poor antenatal care, and inadequate treatment of common childhood diseases. Substandard water and sanitation place children at increased risk of infection through exposure to contaminated foods and water (Haggerty et aI., 1994a; Clemens and Stanton, 1987; Esrey et al., 1985). Children living in poor conditions typically suffer from recurrent infections, such as diarrheal disease, and are unable to fully recover from each bout of illness. Diarrheal disease reduces food intake and leads to poor absorption and increased nutrient loss (Brown et aI., 1990; Rahaman and Wahed, 1983; Rosenberg et aI., 1977). Ultimately, this weakens the body's immunity and increases its susceptibility to malnutrition. Inadequate and untimely health care is also a factor, affecting both the incidence and duration of illness (Mosley et aI., 1984).
In attempting to understand the direct causes of child malnutrition, it is important to acknowledge the interaction between inadequate food intake and infectious disease--a relationship that is particularly important in Mozambique. The relationship between inadequate food intake and diarrhea is synergistic; that is, the joint effect of the two factors on nutritional status far exceeds the simple additive effects of diarrhea or inadequate intake alone (Lutter at aI., 1989; Rosenberg et al., 1977; Scrimshaw et al., 1968). In other words, a child who experiences both inadequate food intake and illness is extremely vulnerable to poor health outcomes such as malnutrition-more so than if the child has oniy one of those conditions.
PREVIOUS PAGE BLANK 7
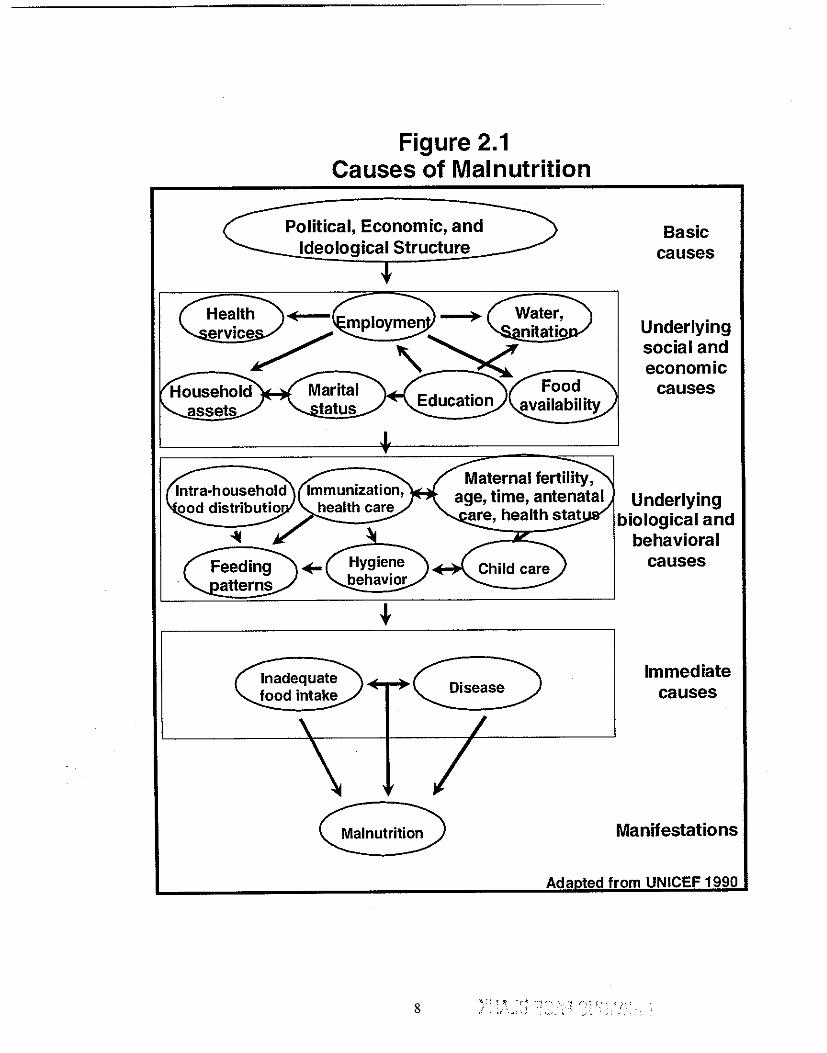
Figure 2.1 Causes of Malnutrition
Political, Economic, and Ideological Structure
Inadequate food intake
Hygiene behavior
Malnutrition
Basic causes
Underlying social and economic
causes
Underlying biological and
behavioral causes
Immediate causes
Manifestations
Ada ted from UNICEF 1990
8 ': :'. -,; "'j . , "! '---~';'." 'i'" '. " ._, "<
In addition to illness, malnutrition is associated with increased risks of infant and child mortality. Even when malnutrition does not result in death or apparent illness, it may lead to lower levels of cognitive development and educational attainment (Brozek and Schurch, 1984). The adverse effects of poor nutrition during the earliest stages of life also extend into adulthood. Among adults, the cumulative effect of malnutrition may be demonstrated in low worker productivity and increased absenteeism in the workplace, both of which may reduce individual and national lifetime earning potential (World Bank, 1993).
Malnutrition also has intergenerational effects. Low birth weight (LBW), or birth weight less than 2,500 g, is attributed to maternal nutritional factors such as low caloric intake, low pre-pregnancy weight, and low weight gain during pregnancy (Kramer, 1987). Low birth weight is both a sensitive indicator of maternal nutritional status and a major determinant of infant survival. Small, undernourished women tend to give birth to small, low weight infants (Villar and Belizan, 1982). These small babies have a greater risk of illness and death compared with normal weight infants (Baqui et aI., 1994; UNICEF and World Health Organization (WHO), 1992; Institute of Medicine (lOM), 1985). Oespite the high prevalence of LBW in the developing world, birth weight is rarely ascertained in countries where the majority of birtbs occur outside of health facilities. AS a result, most children with increased risks of poor health and developmental outcomes are not identified in a timely manner.
2.2 Basic Indicators of Nutritional Status
The assessment of nutritional status is based on the concept that in a well-nourished population, the distribution of children's height and weight, for a given age, will approximate a normal distribution. This means that approximately 68 percent of children will have a height or weight within one standard deviation (SO) of the median for that age. Approximately 14 percent of children will have a z-score between minus one and minus two standard deviations from the median for that age. Of the remainder, 2 percent will have a height or weight z-score less than minus two standard deviations from the median of that age. Since all populations have a similar genetic potential for growth (Habicht et aI., 1974), WHO (1979) has recommended the use of U.S. National Center for Health Statistics (NCHS) Reference Oata in the evaluation of nutritional status worldwide.
The following three indicators use height or weight in combination with age to determine the nutritional status of infants and children:
Stunting, defined as height-for-age more than two standard deviations below (-2 SO) the median of the NCHS reference population, is the failure to grow adequately in height in relation to age. It reflects past or chronic malnutrition and is caused by inadequate food intake over a long period and/or repeated episodes of illness, particularly diarrhea.
Wasting, defined as weight-for-height more than two standard deviations below (-2 SO) the median of the NCHS reference population, is the failure to gain weight adequately in relation to height and reflects recent or acute malnutrition. Wasting is caused by a recent shortage of adequate nutrition and! or recent or current acute illness, especially diarrhea.
Underweight, defined as weight-for-age more than two standard deviations below (-2 SO) the median of the NCHS reference popUlation, is a composite indicator that reflects either chronic or acute malnutrition or both. It does not, however, reveal additional information beyond that provided by the stunting and wasting indicators. Nevertheless, it is often used as a general indicator of a population's health status.
There are different gradations of malnutrition. Children who are between -2 SO and -3 SO of the NCHS reference population's median are considered moderately malnourished, whereas children who are
9
below -3 SD are considered severely malnourished. Although a child may be both stunted and wasted, these two indicators often reflect different etiologies and consequences and thus have different implications for programmatic action.
2.3 Study Data and Methodology
The 1997 MDHS includes 4,207 children under tbree years of age. Of these children, 3,803 were alive at the time of the interview and were therefore eligible for antbropometric data collection. Complete antbropometric data are available for 2,837 children or 75 percent of all living children under three years of age who were included in the MDHS. Appendix C discusses some aspects of the quality of nutrition data from the 1997 MDHS.
Unless otherwise noted, all tables, figures, and analyses in Chapters 2 tbrough 5 of this report are based upon the 2,837 children with complete antbropometric data. In the bivariate analyses, p-values were determined using chi-square tests from cross-tabulations. In determining which variables would be included in the multivariate analyses, the p-value cutoff was 0.25. This cutoff was used rather than the conventional, more stringent p<0.05 cutoff because some variables with p-values slightly higher than 0.05 may become statistically significant when other variables are taken into account (Hosmer and Lemeshow, 1989).
Multivariate logistic regression analyses were conducted using a forward stepwise technique ratio method. (Appendix G describes the logistic regression methodology in more detail.) In the multivariate analyses, variables with 95 percent confidence intervals (for the adjusted odds ratios) that do not include 1.0 ("no risk") among the range of possible risk estimates were deemed statistically significant. Results from the multivariate analyses are presented in Chapters 4 tbrough 6.
2.4 Birth Weight
In Mozambique, only 39 percent of children under the age of tbree were weighed at birth (Table 2.1). This figure should not be surprising since 48 percent of all deliveries take place outside of health faCilities. Mozambique's Maternal and Child Health (MCH) Program aims to identify children with certain risk factors--one of which is low birth weight-and enrolls them in "special attention" clinics (Cutts et al., 1996). According to the 1997 MDHS, birth weight information does not exist for over 60 percent of births. Given the absence of such information, risk approach programs such as the MCH Program will not be able to identify, monitor, and treat at-risk infants in a timely manner.
As indicated in Table 2.1, the percentage of urban infants who were weighed at birth is significantly higher than that of rural infants (80 percent versus 28 percent). The highest percentage is in Mozambique's capital, Maputo City (90 percent), and the lowest percentage is in the province of Cabo Delgado (18 percent). These findings correspond to delivery patterns in rural and urban areas, whereby a higher percentage of urban deliveries than rural deliveries occur in health facilities (82 percent versus 34 percent). Among rural deliveries, the discrepancy between the percentage of facility-based births and the percentage of infants weighed at birth may reflect both the limited availability of scales for weighing children in some health facilities and that the majority of deliveries in rural areas are at home.
Among children who were weighed at birth, the median reported birth weight was 3.0 kg, which is slightly below the NCHS median of 3.3 kg (WHO, 1979). Thirteen percent of infants weighed less than 2.5 kg at birth and were classified as low birth weight (LBW). The incidence of LBW differs significantly between rural and urban areas. As seen in Table 2.1, LBW does, however, vary significantly by region, with rates as low as 2 percent in Zambezia and as high as 16 to 17 percent in the provinces of Cabo Delgado, Tete, Sofala, and Maputo City. It is not clear why the rate from the national survey is much lower than what was found by the surveillance system.
10
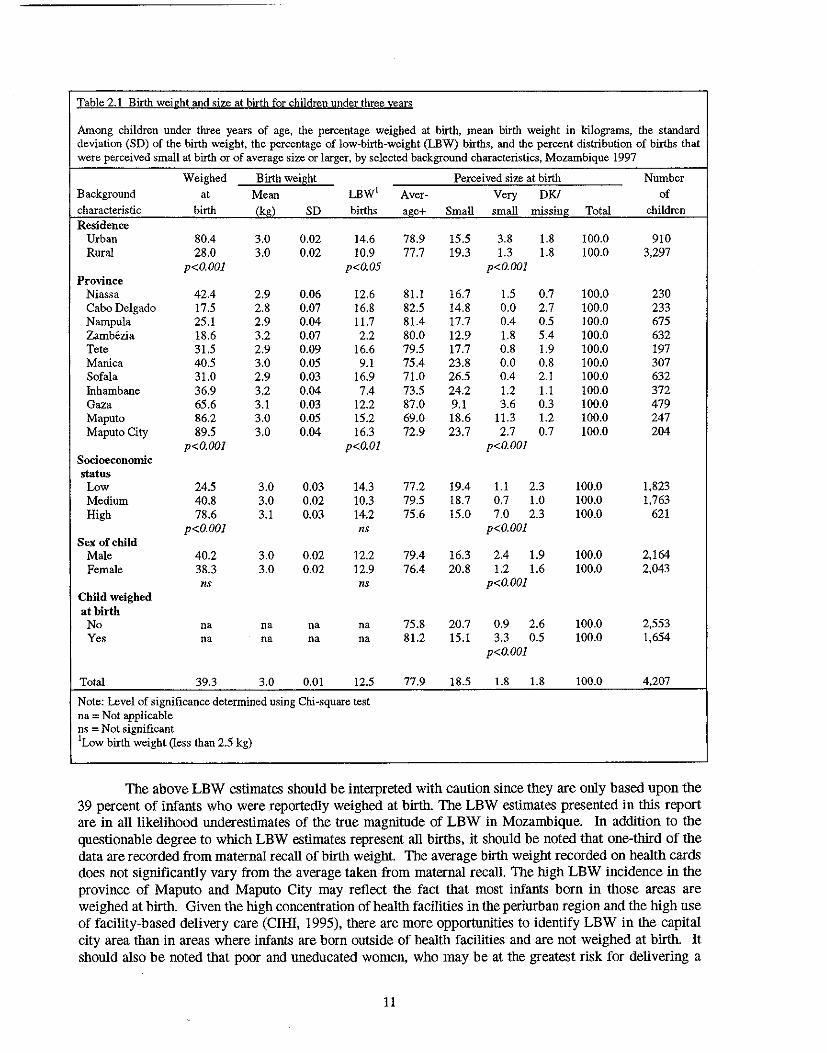
Table 2.1 Birth weight and size at birth for children under three years
Among children under three years of age, the percentage weighed at hirth. mean birth weight in kilograms. the standard deviation (SD) of the birth weight. the percentage of low-birth-weight (LEW) births. and the percent distribution of births that were perceived small at birth or of average size or larger. by selected background characteristics, Mozambique 1997
Weighed Birth weight Perceived size at birth Number Background at Mean LBW' Aver- Very DK! of characteristic birth (kg) SD births aj!e+ Small small missing Total children Residence
Urban 80.4 3.0 0.02 14.6 78.9 15.5 3.8 1.8 100.0 910 Rural 28.0 3.0 0.02 10.9 77.7 19.3 1.3 1.8 100.0 3,297
p<O.OOl p<O.05 p<O.OOl Province
Niassa 42.4 2.9 0.06 12.6 81.1 16.7 1.5 0.7 100.0 230 Cabo Delgado 17.5 2.8 0.07 16.8 82.5 14.8 0.0 2.7 100.0 233 Nampula 25.1 2.9 0.04 11.7 81.4 17.7 0.4 0.5 100.0 675 Zamb6zia 18.6 3.2 0.07 2.2 80.0 12.9 1.8 5.4 100.0 632 Tete 31.5 2.9 0.09 16.6 79.5 17.7 0.8 1.9 100.0 197 Manica 40.5 3.0 0.05 9.1 75.4 23.8 0.0 0.8 100.0 307 Sofala 31.0 2.9 0.03 16.9 71.0 26.5 0.4 2.1 100.0 632 Inhambaue 36.9 3.2 0.04 7.4 73.5 24.2 1.2 1.1 100.0 372 Gaza 65.6 3.1 0.03 12.2 87.0 9.1 3.6 0.3 100.0 479 Maputo 86.2 3.0 0.05 15.2 69.0 18.6 11.3 1.2 100.0 247 Maputo City 89.5 3.0 0.04 16.3 72.9 23.7 2.7 0.7 100.0 204
p<O.OOI p<O.Ol p<O.OOl Socioeconomic status
Low 24.5 3.0 0.03 14.3 77.2 19.4 1.1 2.3 100.0 1,823 Medium 40.8 3.0 0.02 10.3 79.5 18.7 0.7 1.0 100.0 1,763 High 78.6 3.1 0.03 14.2 75.6 15.0 7.0 2.3 100.0 621
p<O.OOI ns p<O.OOI Sex of child
Male 40.2 3.0 0.02 12.2 79.4 16.3 2.4 1.9 100.0 2,164 Female 38.3 3.0 0.02 12.9 76.4 20.8 1.2 1.6 100.0 2,043
ns ns p<O.OOI Child weighed at birth No na na na na 75.8 20.7 0.9 2.6 100.0 2,553 Yes na na na na 81.2 15.1 3.3 0.5 100.0 1,654
p<O.OOl
Total 39.3 3.0 om 12.5 77.9 18.5 1.8 1.8 100.0 4,207
Note: Level of significance determined using Chi-square test na = Not applicable ns = Not significant 'Low birth weight (less than 2.5 kg)
The above LBW estimates should be interpreted with caution since they are only based upon the 39 percent of infants who were reportedly weighed at birth. The LBW estimates presented in this report are in all likelihood underestimates of the true magnitude of LBW in Mozambique. In addition to the questionable degree to which LBW estimates represent all births, it should be noted that one-third of the data are recorded from maternal recall of birth weight. The average birth weight recorded on health cards does not significantly vary from the average taken from maternal recall. The high LBW incidence in the province of Maputo and Maputo City may reflect the fact that most infants born in those areas are weighed at birth. Given the high concentration of health facilities in the periurban region and the high use of facility-based delivery care (CIHI, 1995), there are more opportunities to identify LBW in the capital city area than in areas where infants are born outside of health facilities and are not weighed at birth. It should also be noted that poor and uneducated women, who may be at the greatest risk for delivering a
11
LBW infant, are usually the least likely to deliver in a health facility. The likelihood that their infants were weighed at birth is therefore low.
In some contexts, when information on birth weight is unavailable, the mother's perception of the infant's size at birth may serve as a proxy. Although maternal perception of the baby's size is a very subjective measure, it can be informative when exploring factors related to malnutrition since the mother's perception of her neWborn's size may influence her feeding and child-rearing behaviors. In Mozambique, approximately 19 percent of all children were perceived by their mothers as "small" at birth, with an additional 2 percent of children perceived as "very small." Regional differences are apparent, with the highest percentage of children perceived to be small in the province in Sofala. This province also has the highest percentage of LBW children. There is a statistically significant difference between rural and urban areas; more urban children were considered very small, and more rural children were considered small at birth. A significantly higher proportion of low socioeconomic status (SES) babies are perceived as "small" compared with high SES babies (19 versus 15 percent) (Table 2.1).
Due to limitations of the data, it is not possible to dis aggregate LBW into preterm births (PTB) and intrauterine growth-retarded (IUGR) births. Each of these conditions has different causal factors and information about them would assist program planners and policymakers in establishing programs that target high-risk populations in Mozambique. In developing countries, the vast majority of LBW births are IUGR infants (Kramer, 1987; Villar and Belizan, 1982). Poor maternal nutritional status is the root cause of IUGR. Little information is known about the causes of PTB; however, it appears to be closely linked to women with a history of adverse pregnancy outcomes (Le., prior PTB or spontaneous abortions) andlor negative health behaviors such as smOking. Although it is likely that IUGR is more prevalent than PTE in Mozambique, it is not possible to substantiate this claim without the necessary data. In addition to nutritional factors, sexually transmitted infections (STIs) may lead to adverse pregnancy outcomes such as LBW and are prevalent among Mozambican women of reproductive age (CIHI, 1995). STIs should therefore be considered among the possible areas of intervention to improve both maternal and fetal/infant outcomes.
2.5 Overall Prevalence of Malnutrition
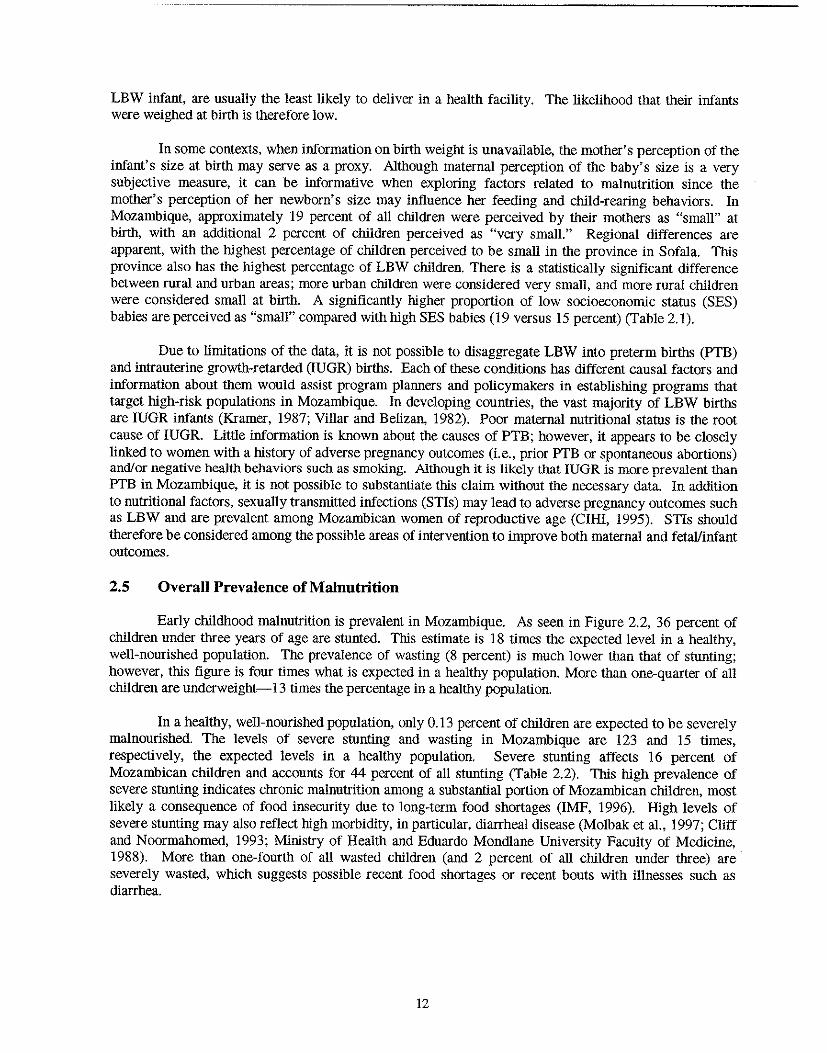
Early childhood malnutrition is prevalent in Mozambique. As seen in Figure 2.2, 36 percent of children under three years of age are stunted. This estimate is 18 times the expected level in a healthy, well-nourished population. The prevalence of wasting (8 percent) is much lower than that of stunting; however, this figure is four times what is expected in a healthy population. More than one-quarter of all children are underweight-l 3 times the percentage in a healthy population.
In a healthy, well-nourished population, only 0.13 percent of children are expected to be severely malnourished. The levels of severe stunting and wasting in Mozambique are 123 and 15 times, respectively, the expected levels in a healthy population. Severe stunting affects 16 percent of Mozambican children and accounts for 44 percent of all stunting (Table 2.2). This high prevalence of severe stunting indicates chronic malnutrition among a substantial portion of Mozambican children, most likely a consequence of food insecurity due to long-term food shortages (IMP, 1996). High levels of severe stunting may also reflect high morbidity, in particular, diarrheal disease (Molbak et al., 1997; Cliff and Noormahomed, 1993; Ministry of Health and Eduardo Mondlane University Faculty of Medicine, 1988). More than one-fourth of all wasted children (and 2 percent of all children under three) are' severely wasted, which suggests possible recent food shortages or recent bouts with illnesses such as diarrhea.
12
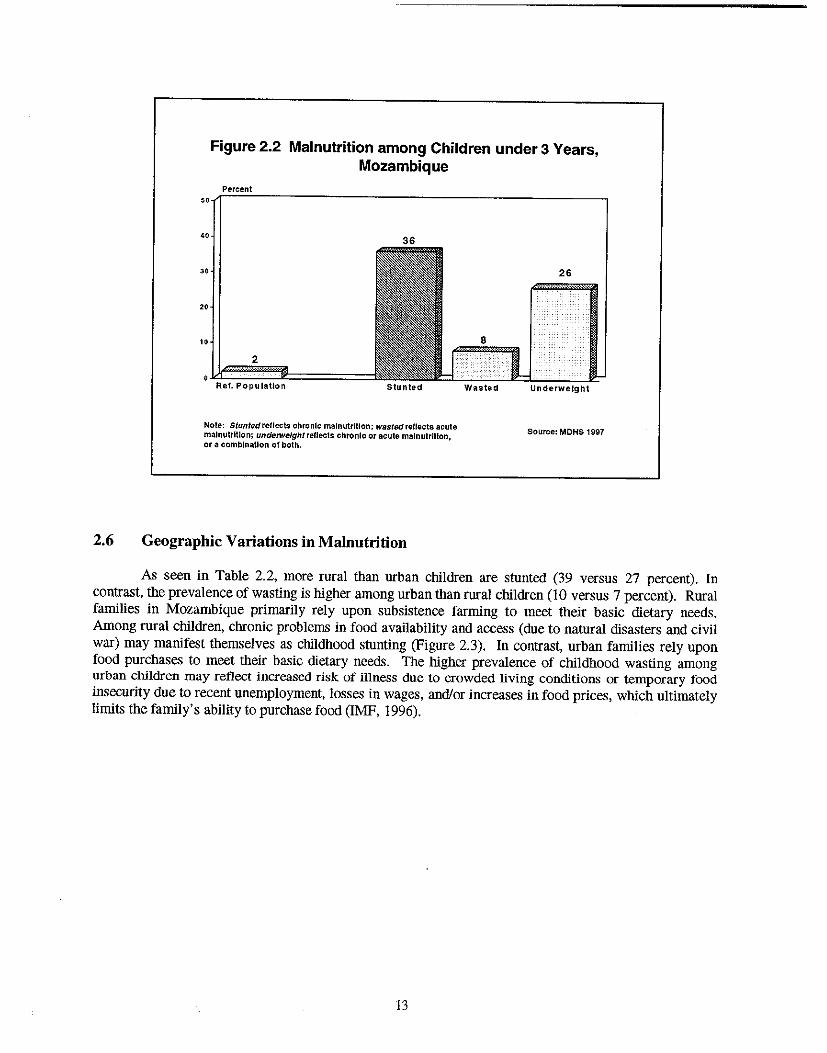
Figure 2.2 Malnutrition among Children under 3 Years, Mozambique
Percent ,,~~=----------------------------------------------,
"
"
"
2
Ref. Population stunted
Note: Stuntedrelfects chronic malnutrition; w8stedreflects acute malnutrition; undetweJghtreflects chronic or acute malnutrition, or a combination of both.
2.6 Geographic Variations in Malnutrition
Wasted Underweight
Source: MOHS 1997
As seen in Table 2.2, more rural than urban children are stunted (39 versus 27 percent). In contrast, the prevalence of wasting is higher among urban than rural children (IO versus 7 percent). Rural families in Mozambique primarily rely upon subsistence farming to meet their basic dietary needs. Among rural children, chronic problems in food availability and access (due to natural disasters and civil war) may manifest themselves as childhood stunting (Figure 2.3). In contrast, urban families rely upon food purchases to meet their basic dietary needs. The higher prevalence of childhood wasting among urban children may reflect increased risk of illness due to crowded living conditions or temporary food insecurity due to recent unemployment, losses in wages, and/or increases in food prices, which ultimately limits the family's ability to purchase food (IMF, 1996).
13
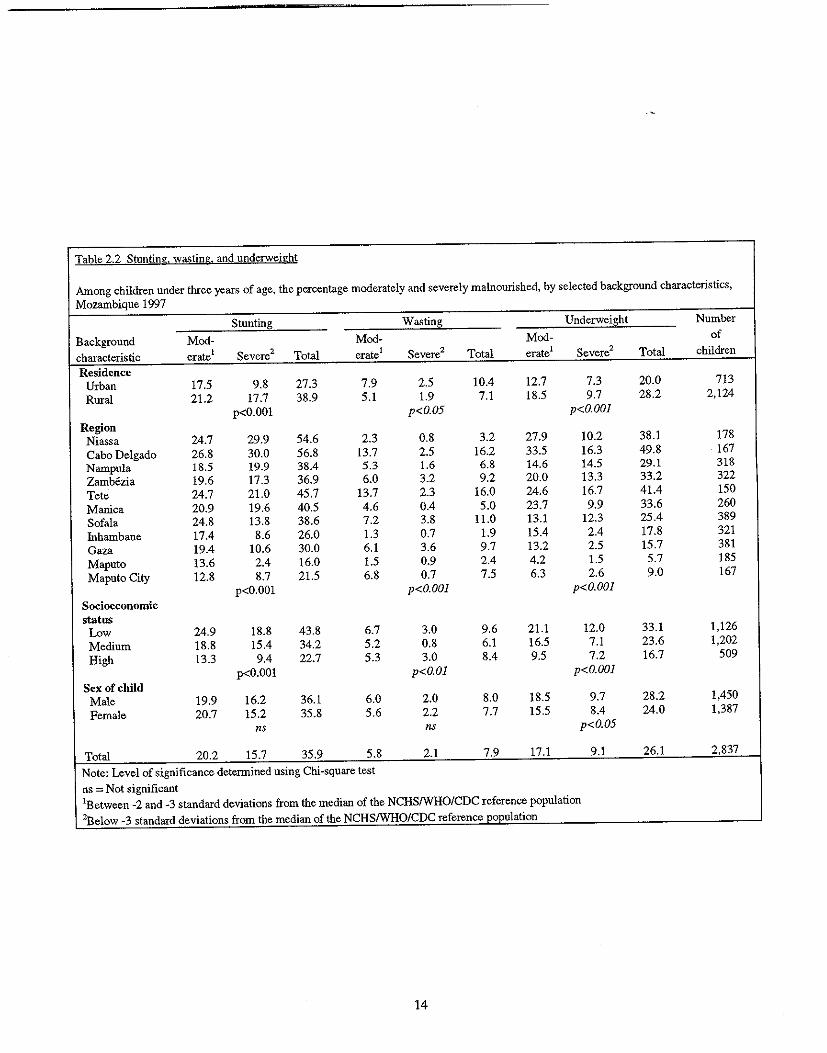
Table 2.2 Stunting. wa.;;.ting. and underweight
Among children under three years of age, the percentage moderately and severely malnourished, by selected background characteristics, Mozambique 1997
Stunting Wasting Underweight Number Background Mod- Mod- Mod- of characteristic erate1 Severe2 Total erate1 Severe2 Total erate1 Severe2 Total children Residence
Urban 17.5 9.8 27.3 7.9 2.5 10.4 12.7 7.3 20.0 713 Rural 21.2 17.7 38.9 5.1 1.9 7.1 18.5 9.7 28.2 2,124
p<O.OOI p<O.05 p<O.OOI Region Niassa 24.7 29.9 54.6 2.3 0.8 3.2 27.9 10.2 38.1 178 Cabo Delgado 26.8 30.0 56.8 13.7 2.5 16.2 33.5 16.3 49.8 167 Nampula 18.5 19.9 38.4 5.3 1.6 6.8 14.6 14.5 29.1 318 Zambezia 19.6 17.3 36.9 6.0 3.2 9.2 20.0 13.3 33.2 322 Tete 24.7 21.0 45.7 13.7 2.3 16.0 24.6 16.7 41.4 150 Manica 20.9 19.6 40.5 4.6 0.4 5.0 23.7 9.9 33.6 260 Sofala 24.8 13.8 38.6 7.2 3.8 11.0 13.1 12.3 25.4 389 fuhambane 17.4 8.6 26.0 1.3 0.7 1.9 15.4 2.4 17.8 321 Gaza 19.4 10.6 30.0 6.1 3.6 9.7 13.2 2.5 15.7 381 Maputo 13.6 2.4 16.0 1.5 0.9 2.4 4.2 1.5 5.7 185 Maputo City 12.8 8.7 21.5 6.8 0.7 7.5 6.3 2.6 9.0 167
p<O.OOI p<O.OOJ p<O.OOI Socioeconomic status
Low 24.9 18.8 43.8 6.7 3.0 9.6 21.1 12.0 33.1 1,126 Medium 18.8 15.4 34.2 5.2 0.8 6.1 16.5 7.1 23.6 1,202 High 13.3 9.4 22.7 5.3 3.0 8.4 9.5 7.2 16.7 509
p<O.OOI p<O.OI p<O.OOJ Sex of child Male 19.9 16.2 36.1 6.0 2.0 8.0 18.5 9.7 28.2 1,450 Female 20.7 15.2 35.8 5.6 2.2 7.7 15.5 8.4 24.0 1,387
ns ns p<O.05
Total 20.2 15.7 35.9 5.8 2.1 7.9 17.1 9.1 26.1 2,837
Note: Level of significance determined using Chi-square test ns = Not significant lBetween -2 and -3 standard deviations from the median of the NCHSIWHO/CDC reference population 'Below -3 standard deviations from the median of the NCHS/WHO/CDC reference 'population
14
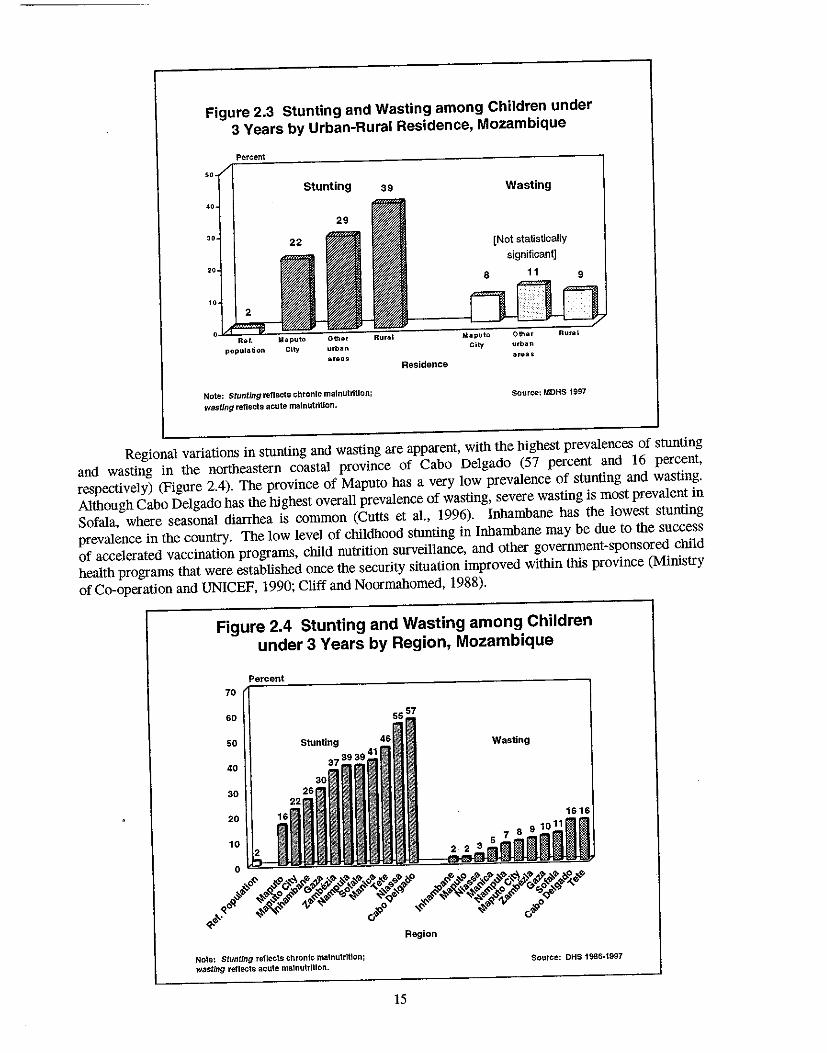
Figure 2.3 Stunting and Wasting among Children under
3 Years by Urban-Rural Residence, Mozambique
Percent
2
population City
Stunting
urban
areas
Note: Stunting reflects chronic malnutrition;
wasting reflects acute malnutrition.
39
Residence
Wasting
[Not statistically
significant]
Maputo OthGr
City urban areas
Source: MDHS 1997
Regional variations in stunting and wasting are apparent, with the highest prevalences of stunting
and wasting in the northeastern coastal province of Cabo Delgado (57 percent and 16 percent,
respectively) (Figure 2.4). The province of Maputo has a very low prevalence of stunting and wasting.
Although Cabo Delgado has the highest overall prevalence of wasting, severe wasting is most prevalent in
Sofala, where seasonal diarrhea is common (Cutts et a!., 1996). Inhambane has the lowest stunting
prevalence in the country. The low level of childhood stunting in Inhambane may be due to the success
of accelerated vaccination programs, child nutrition surveillance, and other government-sponsored child
health programs that were established once the security situation improved within this province (Ministry
of Co-operation and UNICEF, 1990; Cliff and Noormahomed, 1988).
Figure 2.4 Stunting and Wasting among Children
under 3 Years by Region, Mozambique
70
60
50
40
30
20 16
10
Note: stunting reflects chronic malnutrition;
wasting reflects acute ma'nutritlon.
Wasting
Source: DHS 1986·1997
15
2.7 Malnutrition according to Age
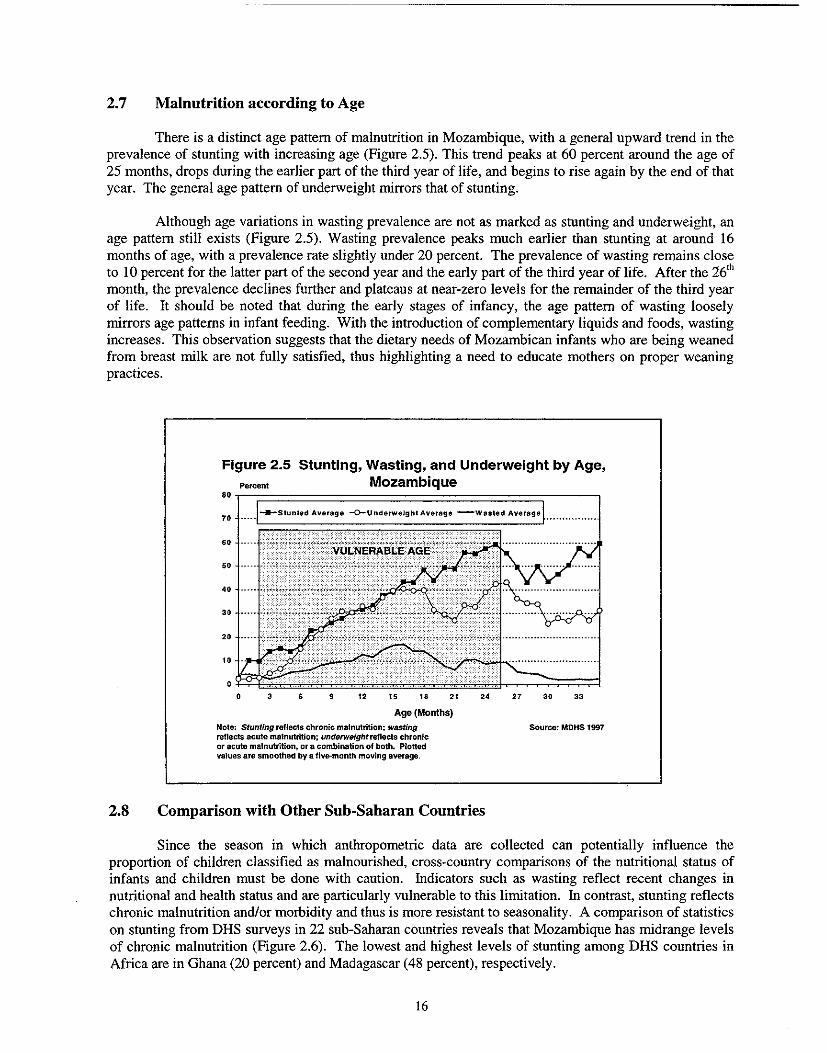
There is a distinct age pattern of malnutrition in Mozambique, with a general upward trend in the prevalence of stunting with increasing age (Figure 2.5). This trend peaks at 60 percent around the age of 25 months, drops during the earlier part of the third year of life, and begins to rise again by the end of that year. The general age pattern of underweight mirrors that of stunting.
Although age variations in wasting prevalence are not as marked as stunting and underweight, an age pattern still exists (Figure 2.5). Wasting prevalence peaks much earlier than stunting at around 16 months of age, with a prevalence rate slightly under 20 percent. The prevalence of wasting remains close to 10 percent for the latter part of the second year and the early part of the third year of life. After the 26th
month, the prevalence declines further and plateaus at near-zero levels for the remainder of the third year of life. It should be noted that during the early stages of infancy, the age pattern of wasting loosely mirrors age patterns in infant feeding. With the introduction of complementary liquids and foods, wasting increases. This observation suggests that the dietary needs of Mozambican infants who are being weaned from breast milk are not fully satisfied, thus highlighting a need to educate mothers on proper weaning practices.
Figure 2.5 Stunting, Wasting, and Underweight by Age, Pe,cent Mozambique
8Or-r================================;------,
6' 50
40
• 3 6 9 12 15 18 21
Age (Months)
Note: StuntTng reflects chronic malnutrition; wasting reflects acute malnutrition; underweight reflects chronic or acute malnutrition, or a combination of both. Plotted values are smoothed by a five-month moving average.
24
2.8 Comparison with Other Sub-Saharan Countries
27 30 33
Source: MDHS 1997
Since the season in which anthropometric data are collected can potentially influence the proportion of children classified as malnourished, cross-country comparisons of the nutritional status of infants and children must be done with caution. Indicators such as wasting reflect recent changes in nutritional and health status and are particularly vulnerable to this limitation. In contrast, stunting reflects chronic malnutrition andlor morbidity and thus is more resistant to seasonality. A comparison of statistics on stunting from DHS surveys in 22 sub-Saharan countries reveals that Mozambique has midrange levels of chronic malnutrition (Figure 2.6). The lowest and highest levels of stunting among DHS countries in Africa are in Ghana (20 percent) and Madagascar (48 percent), respectively.
16
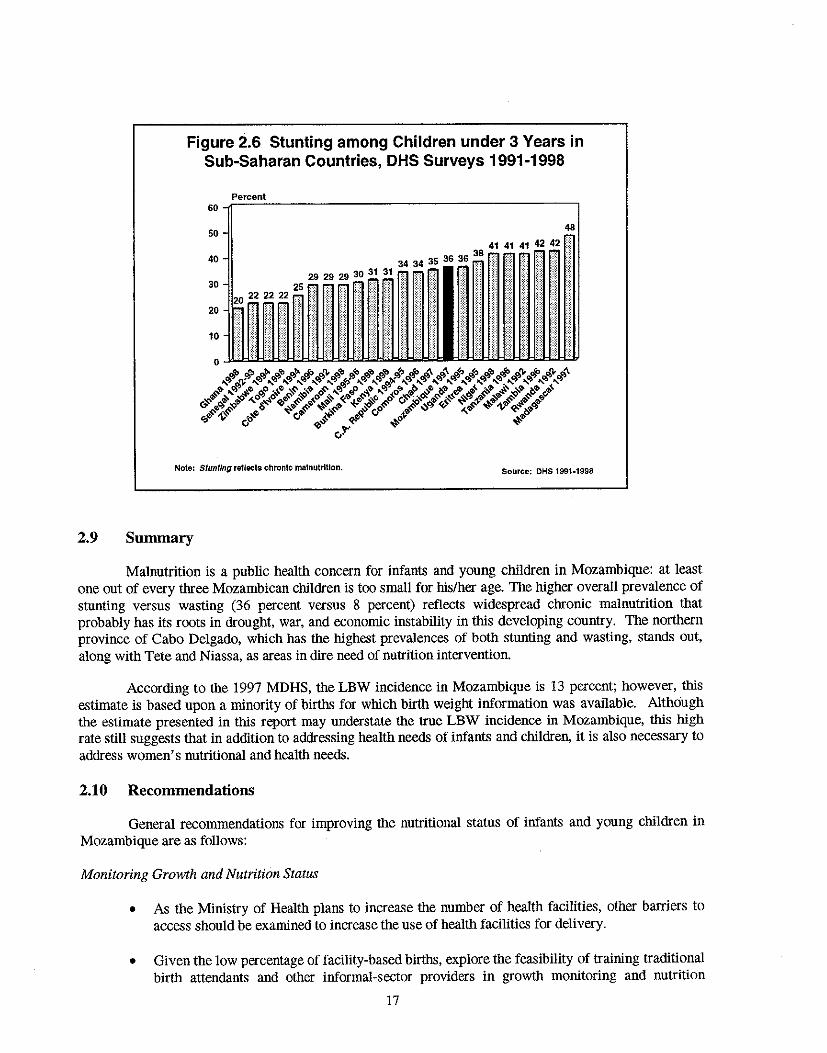
Figure 2.6 Stunting among Children under 3 Years in Sub-Saharan Countries, DHS Surveys 1991-1998
Percent 60~~~-------------------------------------'
50 48
Note: Stunting reflects chronIc malnutrition. Source: OHS 1991-1998
2.9 Summary
Malnutrition is a public health concern for infants and young children in Mozambique: at least one out of every three Mozambican children is too small for his/her age. The higher overall prevalence of stunting versus wasting (36 percent versus 8 percent) reflects widespread chronic malnutrition that probably has its roots in drought, war, and economic instability in this developing country. The northern province of Cabo Delgado, which has the highest prevalences of both stunting and wasting, stands out, along with Tete and Niassa, as areas in dire need of nutrition intervention.
According to the 1997 MDHS, the LBW incidence in Mozambique is 13 percent; however, this estimate is based upon a minority of births for which birth weight information was available. Although the estimate presented in this report may understate the true LBW incidence in Mozambique, this high rate still suggests that in addition to addressing health needs of infants and children, it is also necessary to address women's nutritional and health needs.
2.10 Recommendations
General recommendations for improving the nutritional status of infants and young children in Mozambique are as follows:
Monitoring Growth and Nutrition Status
• As the Ministry of Health plans to increase the number of health facilities, other barriers to access should be examined to increase the use of health facilities for delivery.
• Given the low percentage of facility-based births, explore the feasibility of training traditional birth attendants and other informal-sector providers in growth monitoring and nutrition
17
surveillance by means of pilot projects. Establish birth weight assessment as a normative practice among birth attendants in the community.
• Address logistical constraints in weighing children in areas with poor infrastructure, namely rural areas. For example, distribute portable scales to informal-sector providers to assist in the timely determination of infant weight at birth.
Influencing Low Birth Weights through Improved Health Status of Women of Reproductive Age
• Address iron/folic acid deficiency and malaria and other infectious diseases in women. These conditions have been documented to cause anemia (which is linked to low birth weight) in women of reproductive age.
• Establish mechanisms for the prevention and timely detection and treatment of sexually transmitted infections. Given the high prevalence of STIs in Mozambique (CIHI, 1995), efforts aimed at their reduction may have a positive effect on reducing adverse pregnancy outcomes that are STI-related (e.g., low birth weight).
Reducing Stunting and Wasting
• In an effort to reduce stunting among rural children, establish mechanisms to expand productive activities and improve agricultural output on small family farms. Poor agricultural production is one of the root causes of food insecurity in rural areas (Ministry of Cooperation and UNICEF, 1990).
• In an effort to reduce wasting among children, reduce factors such as malaria and diarrhea.
Treatment of Malnourished Children
• Establish guidelines for treating severe malnutriton, according to the new WHO guidelines.
Improving Health Infrastructure
• Continue expanding the rural health care infrastructure, with emphasis on establishing integrated "well child" services (e.g., nutrition and immunization services) and integrated management of childhood illness (IMCn.
Research
• Support research that aims to ascertain which underlying condition-preterm birth or intrauterine growth retardation-is responsible for LBW in Mozambique, and plan interventions accordingly.
• By means of qualitative research, explore the influence of the mother's perception of her newborn's size on care-taking and feeding practices.
18
CHAPTER 3
INFANT AND CHILD FEEDING PRACTICES
Infant and child feeding practices are major determinants of the risks of malnutrition, morbidity, and mortality in the developing world. In light of their importance, WHO and UNICEF (WHO, 1994; WHO and UNICEF, 1990) have devised international standards of infant and child feeding. This chapter describes infant and child feeding practices in Mozambique and compares them to the optimal infant feeding practices prescribed by WHO and UNICEF.
3.1 Optimal Infant and Child Feeding Practices
WHO and UNICEF (WHO and UNICEF, 1990; WHO, 1994) define optimal infant and child feeding as follows:
• Initiation of breastfeeding within one hour of birth
• On-demand and frequent feeding (including night feeds)
• Exclusive breastfeeding (defined as breast milk only and no other foods or liquids) until the infant is about six months of age
• Breastfeeding complemented with appropriate local foods at about six months of age
• Increased breastfeeding during illness and recovery
• Continued breastfeeding well into the second year of life and beyond.
As seen in the above guidelines, breastfeeding is both necessary and sufficient during the first six months of life. A delay in breastfeeding results in the premature introduction of other liquids and foods, which may introduce infection and impede the mother's delivery of breast milk to the infant (PerezEscamilla et aI., 1996). Breastfeeding within the first hour oflife takes advantage of the newborn's innate sucking reflex, which helps to stimulate breast milk production and provides the newborn with the nutritional, antibacterial, and antiviral properties of colostrum (Righard and Alade, 1990). In addition, early contact between the mother and newborn fosters mother/infant bonding and helps to maintain the infant's body temperature-an important factor in newborn survival (Daga et al., 1993). Early breastfeeding also causes the uterus to retract, which can reduce postpartum blood loss in the mother.
In addition to the timing of breastfeeding initiation, the frequency of feeding is also important. Frequent, on-demand breastfeeding, which includes night-feeds, ensures that the infant receives a
. sufficient amount of breast milk to meet his or her dietary needs and also helps to maintain a constant supply of breast milk. Frequent feeding is also essential in maintaining the infant's weight and may help to prevent the problem of breast engorgement in the mother (de Carvalho et aI., 1983). Ideally, infants should be breastfed eight to 10 times every 24 hours. During the first month of life, however, feeding maybe even more frequent.
Of all the feeding behaviors, exclusive breastfeeding is most predictive of infant survival. Exclusive breastfeeding involves the provision of breast milk as the sole source of nourishment and is sufficient in meeting the infant's nutritional requirements during the first six months of life (Cohen et aI., 1994). In hot and humid climates, breast milk satisfies the infant's fluid needs and prevents dehydration (Sachdevet al., 1991). Exclusive breastfeeding also reduces the risk of illness during infancy (Huffman
19
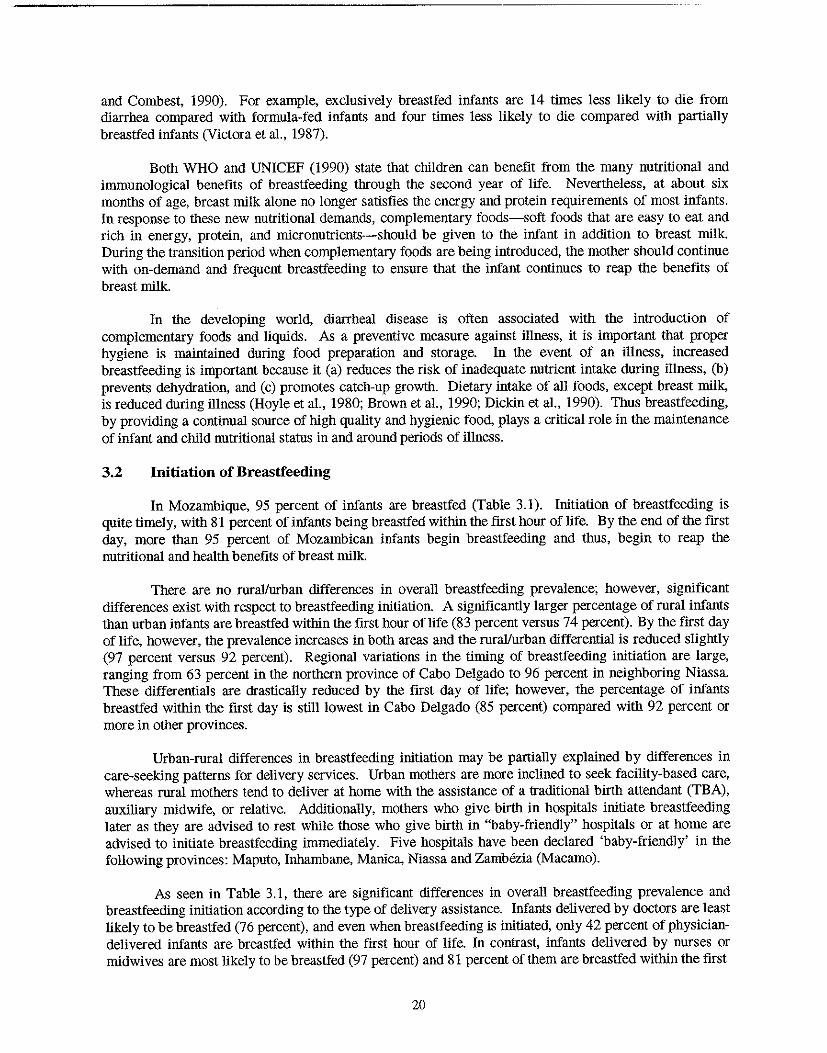
and Combest, 1990). For example, exclusively breastfed infants are 14 times less likely to die from diarrhea compared with formula-fed infants and four times less likely to die compared with partially breastfed infants (Victora et al., 1987).
Both WHO and UNICEF (1990) state that children can benefit from the many nutritional and immunological benefits of breastfeeding through the second year of life. Nevertheless, at about six months of age, breast milk alone no longer satisfies the energy and protein requirements of most infants. In response to these new nutritional demands, complementary foods-soft foods that are easy to eat and rich in energy, protein, and micronutrients-should be given to the infant in addition to breast milk During the transition period when complementary foods are being introduced, the mother should continue with on-demand and frequent breastfeeding to ensure that the infant continues to reap the benefits of breast milk.
In the developing world, diarrheal disease is often associated with the introduction of complementary foods and liqnids. As a preventive measure against iIIness, it is important that proper hygiene is maintained during food preparation and storage. In the event of an illness, increased breastfeeding is important because it (a) reduces the risk of inadequate nutrient intake during iIIness, (b) prevents dehydration, and (c) promotes catCh-up growtb. Dietary intake of all foods, except breast milk, is reduced during iIlness (Hoyle et al., 1980; Brown et a!., 1990; Dickin et a!., 1990). Thus breastfeeding, by providing a continual source of high quality and hygienic food, plays a critical role in the maintenance of infant and child nutritional status in and around periods of illness.
3.2 Initiation of Breastfeeding
In Mozambique, 95 percent of infants are breastfed (Table 3.1). Initiation of breastfeeding is quite timely, with 81 percent of infants being breastfed within the frrst hour of life. By the end of the frrst day, more than 95 percent of Mozambican infants begin breastfeeding and thus, begin to reap the nutritional and health benefits of breast milk.
There are no ruralfurban differences in overall breastfeeding prevalence; however, significant differences exist with respect to breastfeeding initiation. A significantly larger percentage of rural infants than urban infants are breastfed within the first hour of life (83 percent versus 74 percent). By the first day of life, however, the prevalence increases in both areas and the ruralfurban differential is reduced slightly (97 percent versus 92 percent). Regional variations in the timing of breastfeeding initiation are large, ranging from 63 percent in the northern province of Cabo Delgado to 96 percent in neighboring Niassa. These differentials are drastically reduced by the first day of life; however, the percentage of infants breastfed within the first day is still lowest in Cabo Delgado (85 percent) compared with 92 percent or more in other provinces.
Urban-rural differences in breastfeeding initiation may be partially explained by differences in care-seeking patterns for delivery services. Urban mothers are more inclined to seek facility-based care, whereas rural mothers tend to deliver at home with the assistance of a traditional birth attendant (TBA), auxiliary midwife, or relative. Additionally, mothers who give birth in hospitals initiate breastfeeding later as they are advised to rest while those who give birth in "baby-friendly" hospitals or at home are advised to initiate breastfeeding immediately. Five hospitals have been declared 'baby-friendly' in the folIowing provinces: Maputo, Inhambane, Manica, Niassa and Zambezia (Macamo).
As seen in Table 3.1, there are significant differences in overall breastfeeding prevalence and breastfeeding initiation according to the type of delivery assistance. Infants delivered by doctors are least likely to be breastfed (76 percent), and even when breastfeeding is initiated, only 42 percent of physiciandelivered infants are breastfed within the first hour of life. In contrast, infants delivered by nurses or midwives are most likely to be breastfed (97 percent) and 81 percent of them are breastfed within the first
20
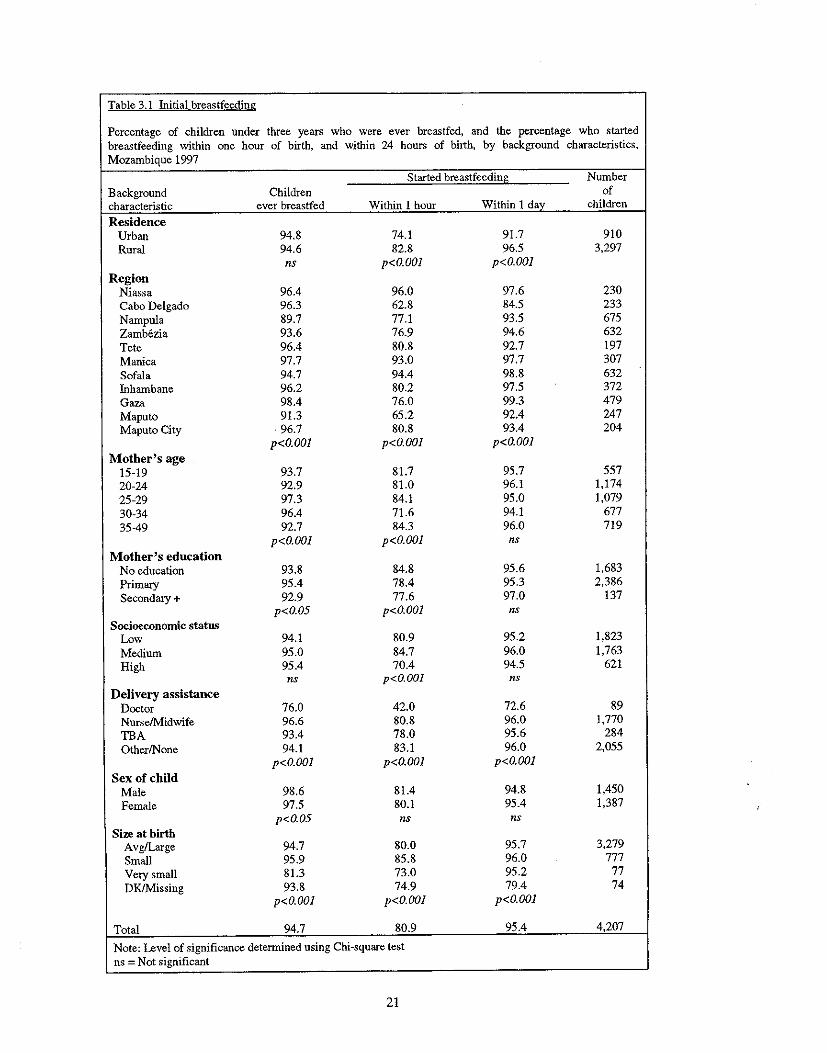
Table 3.1 Initial brea')tfeeding
Percentage of children under three years who were ever breastfed, and the percentage who started breastfeeding within one hour of birth, and within 24 hours of birth, by background characteristics, Mozambique 1997
Started breastfeeding Number Background Children of characteristic ever breastfed Within 1 hour Within 1 day children
Residence Urban 94.8 74.1 91.7 910 Rural 94.6 82.8 96.5 3,297
ns p<O.OOI p<O.OOI Region
Niassa 96.4 96.0 97.6 230 Cabo Delgado 96.3 62.8 84.5 233 Nampula 89.7 77.1 93.5 675 Zamb6zia 93.6 76.9 94.6 632 Tete 96.4 80.8 92.7 197 Manica 97.7 93.0 97.7 307 Sofala 94.7 94.4 98.8 632 Inhambane 96.2 80.2 97.5 372 Gaza 98.4 76.0 99.3 479 Maputo 91.3 65.2 92.4 247 Maputo City 96.7 80.8 93.4 204
p<O.OOI p<O.OOI p<O.OOI Mother's age
15-19 93.7 81.7 95.7 557 20-24 92.9 81.0 96.1 1,174 25-29 97.3 84.1 95.0 1,079 30-34 96.4 71.6 94.1 677 35-49 92.7 84.3 96.0 719
p<O.OOI p<O.OOI ns Mother's education
No education 93.8 84.8 95.6 1,683 Primary 95.4 78.4 95.3 2,386 Secondary + 92.9 77.6 97.0 137
p<O.05 p<o.OOI ns Socioeconomic status
Low 94.1 80.9 95.2 1,823 Medium 95.0 84.7 96.0 1,763 High 95.4 70.4 94.5 621
ns p<O.OOI ns Delivery assistance
Doctor 76.0 42.0 72.6 89 Nurse!N1idwife 96.6 80.8 96.0 1,770 TBA 93.4 78.0 95.6 284 OtherlNone 94.1 83.1 96.0 2,055
p<O.OOI p<O.OOI p<O.OOI Sex of child
Male 98.6 81.4 94.8 1,450 Female 97.5 80.1 95.4 1,387
p<O.05 ns ns Size at birth
Avg/Large 94.7 80.0 95.7 3,279 Small 95.9 85.8 96.0 777 Very small 81.3 73.0 95.2 77 OK/Missing 93.8 74.9 79.4 74
p<O.OOI p<O.OOI p<O.OOI
Total 94.7 80.9 95.4 4,207
Note: Level of significance determined using Chi-square test ns = Not significant
21
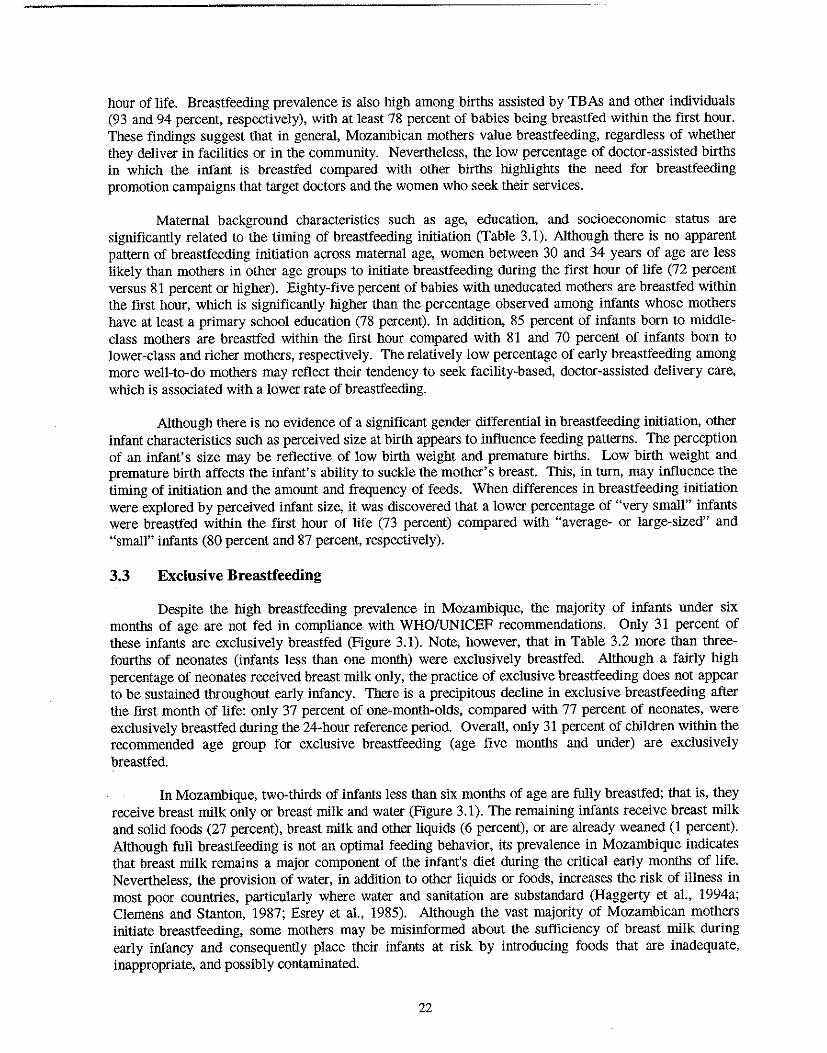
hour of life. Breastfeeding prevalence is also high among births assisted by TBAs and other individuals (93 and 94 percent, respectively), with at least 78 percent of babies being breastfed within the first hour. These findings suggest that in general, Mozambican mothers value breastfeeding, regardless of whether they deliver in facilities or in the community. Nevertheless, the low percentage of doctor-assisted births in which the infant is breastfed compared with other births higblights the need for breastfeeding promotion campaigns that target doctors and the women who seek their services.
Maternal background characteristics such as age, education, and socioeconomic status are significantly related to the timing of breastfeeding initiation (Table 3.1). Although there is no apparent pattern of breastfeeding initiation across maternal age, women between 30 and 34 years of age are less likely than mothers in other age groups to initiate breastfeeding during the first hour of life (72 percent versus 81 percent or higher). Eighty-five percent of babies with uneducated mothers are breastfed within the first hour, which is significantly higher than the percentage observed among infants whose mothers have at least a primary school education (78 percent). In addition, 85 percent of infants born to middleclass mothers are breastfed within the first hour compared with 81 and 70 percent of infants born to lower-class and richer mothers, respectively. The relatively low percentage of early breastfeeding among more well-to-do mothers may reflect their tendency to seek faCility-based, doctor-assisted delivery care, which is associated with a lower rate of breastfeeding.
Although there is no evidence of a significant gender differential in breastfeeding initiation, other infant characteristics such as perceived size at birth appears to influence feeding patterns. The perception of an infant's size may be reflective of low birth weight and premature births. Low birth weight and premature birth affects the infant's ability to suckle the mother's breast. This, in turn, may influence the timing of initiation and the amount and frequency of feeds. When differences in breastfeeding initiation were explored by perceived infant size, it was discovered that a lower percentage of "very small" infants were breastfed within the first hour of life (73 percent) compared with "average- or large-sized" and "small" infants (80 percent and 87 percent, respectively).
3.3 Exclusive Breastfeeding
Despite the high breastfeeding prevalence in Mozambique, the majority of infants under six months of age are not fed in compliance with WHOIUNICEF recommendations. Only 31 percent of these infants are exclusively breastfed (Figure 3.1). Note, however, that in Table 3.2 more than threefourths of neonates (infants less than one month) were exclusively breastfed. Although a fairly high percentage of neonates received breast milk only, the practice of exclusive breastfeeding does not appear to be sustained throughout early infancy. There is a precipitous decline in exclusive breastfeeding after the first month of life: only 37 percent of one-month-olds, compared with 77 percent of neonates, were exclusively breastfed during the 24-hour reference period. Overall, only 31 percent of children within the recommended age group for exclusive breastfeeding (age five months and under) are exclusively breastfed.
In Mozambique, two-thirds of infants less than six months of age are fully breastfed; that is, they receive breast milk only or breast milk and water (Figure 3.1). The remaining infants receive breast milk and solid foods (27 percent), breast milk and other liquids (6 percent), or are already weaned (1 percent). Although full breastfeeding is not an optimal feeding behavior, its prevalence in Mozambique indicates that breast milk remains a major component of the infant's diet during the critical early months of life. Nevertheless, the provision of water, in addition to other liquids or foods, increases the risk of illness in most poor countries, particularly where water and sanitation are substandard (Haggerty et aI., 1994a; Clemens and Stanton, 1987; Esrey et aI., 1985). Although the vast majority of Mozambican mothers initiate breastfeeding, some mothers may be misinformed about the sufficiency of breast milk during early infancy and consequently place their infants at risk by introducing foods that are inadequate, inappropriate, and possibly contaminated.
22
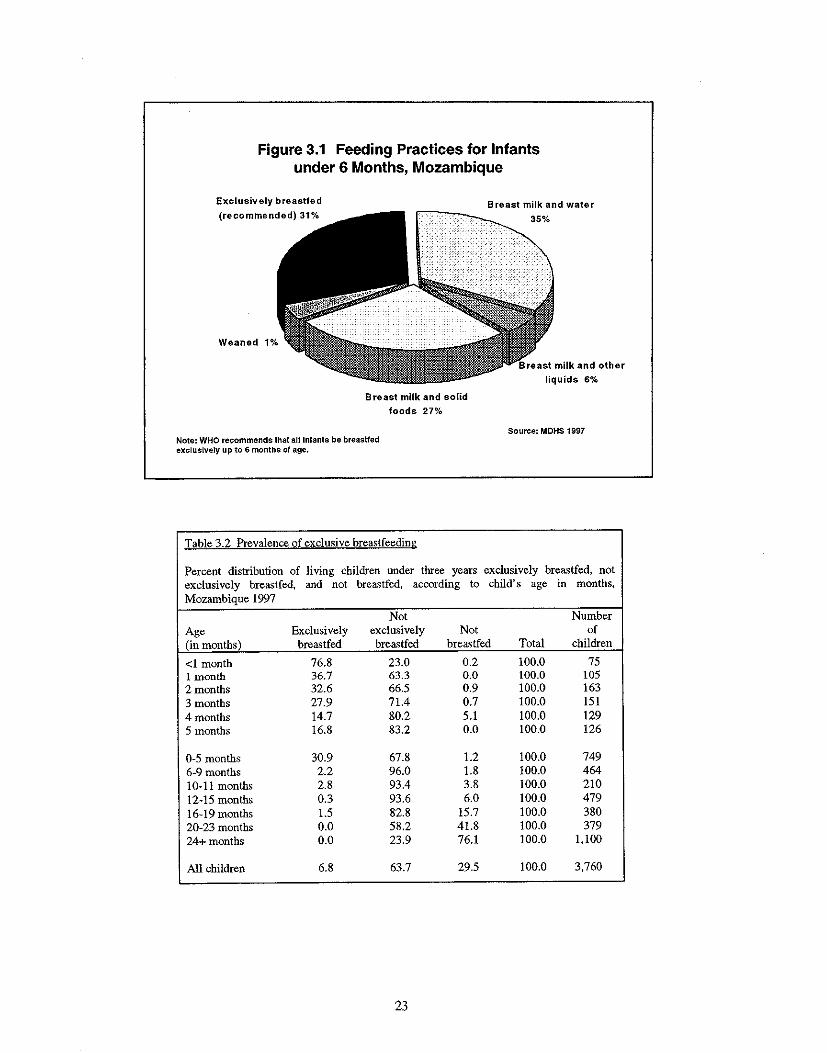
Figure 3.1 Feeding Practices for Infants under 6 Months, Mozambique
Exclusively breastfed
(recommended) 31% Breast milk and water
r-~~~_ 35%
Weaned 1%
Breast milk and solid
foods 27%
Note: WHO recommends that atllnfants be breastfed exclusively up to 6 months of age.
Table 3.2 Prevalence of exclusive breastfeeding
liquids 6%
Souree: MDHS 1997
Percent distribution of living children under three years exclusively breastfed, not exclusively breastfed. and not brea')tfed, according to child's age in months, Mozambique 1997
Not Number Age Exclusively exclusively Not of (in months) breastfed breastfed brea')tfed Total children
<1 month 76.8 23.0 0.2 100.0 75 1 month 36.7 63.3 0.0 100.0 105 2 months 32.6 66.5 0.9 100.0 163 3 months 27.9 71.4 0.7 100.0 151 4 months 14.7 80.2 5.1 100.0 129 5 months 16.8 83.2 0.0 100.0 126
0-5 months 30.9 67.8 1.2 100.0 749 6-9 months 2.2 96.0 1.8 100.0 464 10-11 months 2.8 93.4 3.8 100.0 210 12-15 months 0.3 93.6 6.0 100.0 479 16-19 months 1.5 82.8 15.7 100.0 380 20-23 months 0.0 58.2 41.8 100.0 379 24+ months 0.0 23.9 76.1 100.0 1,100
All children 6.8 63.7 29.5 100.0 3,760
23
Urban-rural differences in exclusive breastfeeding are not significant; however, there are significant variations by region (Figure 3.2). Exclusive breastfeeding is least practiced in the provinces of ZamMzia and Nampula where only 2 and 3 percent, respectively, of living children under 6 months are fed according to the recommended method. It should be noted, however, that in the drought-affected provinces of Gaza and Inhambane, 83 and 89 percent of living infants under six months are exclusively breastfed. Widespread exclusive breastfeeding in these provinces may be a consequence of low food availability, which limits the mothers' options in terms of alternative food sources. In addition, the influences of cultural beliefs and practices need to be studied.
Figure 3.2 Exclusive Breastfeeding among Infants under 6 Months by Residence and Region, Mozambique
100
90
80
70
60
50
40
30
20
10
Percent
31 32
o Id@!= -H- ~~ ~~
~o v~ q;.'S
Residence
89
Region
Source: MDHS 1997
Survey questions on the nature and extent of bottle-feeding were not included in the 1997 MDHS. Therefore, the extent of bottle use is not known. Although the Mozambican Government signed the WHO code on the marketing of breast milk substitutes, it has yet to be approved by the Council of Ministers. Approval is expected in the year 2000.
3.4 Introduction of Solid Foods
WHO recommends the introduction of solid foods at age six months. As seen in Figure 3.3, 85 percent of Mozambican infants between 6 and 9 months of age are fed in compliance with this international standard. The remaining IS percent do not receive the appropriate combination of foods and breast milk to meet their nutritional demands. Nine percent of all 6- to 9-month-old infants receive only water in addition to breast milk, 2 percent are still exclusively breastfed, another 2 percent receive breast milk and other liquids (e.g., milks, juice, sugared water, herbal tea), and 2 percent are completely weaned from breast milk. Based upon Figure 3.3, it is apparent that most infants receive complementary foods by the recommended age. There is still a need, however, to educate some mothers on (I) the appropriate time when such foods should be introduced to the infant and (2) the types of foods that are most appropriate.
24
Figure 3.3 Feeding Practices for Infants
Age 6 to 9 Months, Mozambique
Breast milk and solid foods (recommended)
85%
Exclusively breastfed 2%
2% Breast milk and liquids
2% Note: WHO recommends that by the age 016 months all Infants
should receive sa11d foods and liquids In addltlon to breast milk.
Breast milk and water
9%
Source: MOHS 1997
Figure 3.4 indicates significant rural-urban and regional differences in the introduction of solid
foods to infants 6 to 9 months of age. Eighty-six percent of urban infants receive solid foods at the
appropriate age compared with only 78 percent of rural infants. The two provinces of Maputo and
Inhambane report the lowest percentage of infants receiving solid foods (63 and 64 percent, respectively).
Figure 3.4 Breastfeeding with Solid Foods among Infants
Age 6 to 9 Months by Residence and Region, Mozambique
100
90
80
70
60
50
40
30
20
10
a H ,,0 rb>~ !.~
o\:)~ ~.:J.
Residence Region
Note: Figures in parentheses are based on 25 to 49 children. Source: MDHS 1997
25
It should be noted tbat tbe data for most regions are based on a limited number of cases (25 to 49), which may not accurately reflect practices in these regions. Timely introduction of solid foods is crucial for good nutrition, but having too few cases in tbe data does not reflect its importance here. The lack of data on tbe quantity and quality of tbe solid foods given could obscure tbe importance of complementary feeding.
As prescribed by WHO and UNICEF, the majority of infants age six months and older are fed other foods in addition to breast milk (Table 3.2). Note, however, that tbere are still older infants who only received breast milk during tbe preceding 24 hours. Although tbese infants are in tbe minority (e.g., 3 percent of 10- to II-montb-olds and 2 percent of 16- to 19-month-olds), tbey are at a serious nutritional risk if tbe diets reported for tbe past 24 hours reflect tbeir usual dietary patterns.
The types of complementary foods received during tbe 24 hours preceding tbe survey varied by tbe child's age and whether or not s/he was breastfeeding. As shown in Table 3.3, full breastfeeding (breast milk only or breast milk and water) is widely practiced in Mozambique. Ninety-seven percent of neonates and 66 percent of zero- to five-montb-olds were fully breastfed during tbe preceding 24 hours. Full breastfeeding prevalence generally declines witb age; by age 6 to 9 months, it is only 12 percent, and it declines even furtber thereafter. In Mozambique, complementary foods are incorporated into tbe diet very early in life; 21 percent of l-montb-old infants received breast milk plus a varied diet (e.g., potatoes, peanuts, beans, and/or otber solid or semisolid foods). By tbe sixtb montb of life, when complementary foods should be introduced, tbe majority of infants (80 percent of 6- to 9-montb-olds) receive breast milk plus a varied diet. Breast milk remains a prominent part of tbe child's diet tbrough tbe second year of life. Table 3.3 also indicates tbat almost one-half of infants ages 20 to 23 months received breast milk plUS other foods. By tbe end of tbe second year of life, however, tbe majority of infants are fully weaned: 76 percent of infants age 24 months and older did not receive breast milk during tbe preceding 24 hours.
Table 3.3 TJl2es of foods received b~ children in nrcceding 24 hours
Percent distribution of children under three years who received specific types of food in the preceding 24 hours, according to child's age in months, Mozambique 1997
Breast Full milk plus Breast milk Breast milk Number
Age brea<;t- other plus plus Not of (in months) feeding liquids cereals! varied diet2 brea<;tfed Total children
<1 month 96.6 2.7 0.0 0.6 0.2 100.0 75 1 month 75.6 2.3 1.1 21.0 0.0 100.0 105 2 months 86.1 2.1 0.1 10.8 0.9 100.0 163 3 months 52.9 7.4 1.2 37.8 0.7 100.0 151 4 months 55.1 9.9 1.3 28.6 5.1 100.0 129 5 months 41.3 7.4 3.7 47.6 0.0 100.0 126
0·5 months 66.1 5.5 1.3 25.9 1.2 100.0 749 6-9 months 11.6 2.1 4.6 79.9 1.8 100.0 464 10-11 months 9.5 1.9 2.6 82.2 3.8 100.0 210 12·15 months 8.8 0.3 5.8 79.1 6.0 100.0 479 16·19 months 1.8 1.4 4.2 76.9 15.7 100.0 380 20·23 months 4.0 0.5 1.1 52.6 41.8 100.0 379 24+ months 0.1 0.0 3.5 20.4 76.1 100.0 1,100
All children 16.9 1.7 3.3 48.7 29.5 100.0 3,760
ICereals include only maize, millet, rice, and sorghum. 2Varied diet includes potatoes, peanuts, sesame seeds, beans, meat, eggs, fish, poultry, or other solid or semisolid foods in addition to cereals.
26
Table 3.4 indicates that a very small number of children under 12 months of age are not breastfed. As one would expect, this number increases substantially by the end of the second year of life. It should be noted that nonbreastfeeding children do not receive formula in a bottle but rather fluids (e.g., water, juice) in addition to foods. Plain water is particularly important; 90 percent of nonbreastfed children received plain water, and 51 percent received other liquids during the preceding 24 hours (Table 3.4). Other milk, however, is not commonly given. Only 6 percent of all nonbreastfeeding children received other milk; however, intake of other milk is highest between the ages of 6 and 15 months, ranging from 21 percent to 38 percent. The widespread use of cereals, semisolid foods, and various types of meats suggests that home-based infant foods are popular in Mozambique.
Table 3.4 Type:': of foods received hy nonhreastfeeding children in preceding 24 hours
Percentage of nonbreastfeeding children age one to three years who received specific types of food in the preceding 24 hours, bv child's ae:e in months, Mozambiaue 1997
Meat, Semi- fish, Number
Age Other Other solid pOUltry, of (in months) Water l liauid2 milk' Cereals foods4 or C[!{!S children
12-15 100.0 85.9 32.5 52.3 57.8 58.6 29 16-19 92.0 75.0 8.2 55.8 71.1 51.4 60 20-23 91.4 54.3 2.7 53.2 56.1 27.4 158 24+ 90.1 47.6 4.5 72.9 46.8 43.3 837
All children 90.4 51.3 5.5 67.9 49.8 42.0 1,109
IPlain water only 20tber liquids such as tea or juice 'Other milk such as fresh milk or powdered milk 4Semisolid foods include soups, peanuts, beans, and tubers. Food categories are not exclusive.
3.5 Duration of Breastfeeding
Among children under the age of three, the median duration of exclusive breastfeeding, (i.e., the time for which 50 percent of children receive breast milk only), is slightly less than one month (Table 3.5). Although gender differences are minimal, girls are exclusively breastfed slightly longer than boys (1.1 months versus 0.7 months). Duration of exclusive breastfeeding varies substantially by region, level of maternal education, and type of delivery assistance. Infants in the drought-affected provinces of Gaza and Inbambane have a reported median duration of exclusively breastfeeding for 5 to 6 months; which means 50 percent of infants are exclusively breastfed beyond the recommended 6-month period. However, other sources indicate the actual duration may be considerably shorter (Gani, 2000). In contrast, infants from the neighboring provinces of Cabo Delgado, Nampula, Zambezia, and Tete were exclusively breastfed for only two weeks or less. Children whose mothers were assisted at delivery by medical personnel were exclusively breastfed for 1,3 months, whereas children whose mothers were assisted by other types of birth attendants were exclusively breastfed for less than one month. It should be noted, however, that the longer duration of breastfeeding among medical-personnel-assisted deliveries does not necessarily apply to all types of medical personnel. As mentioned earlier in the chapter, nurses and midwives, not doctors, appear to be the greatest advocates of breastfeeding.
Children who were born to mothers with at least a secondary school education breastfed exclusively for a longer period than children of less-educated mothers (3 months versus one and a half months). Caution should be used with the interpretation of these data because these mothers may be different from the general population of highly educated mothers.
27
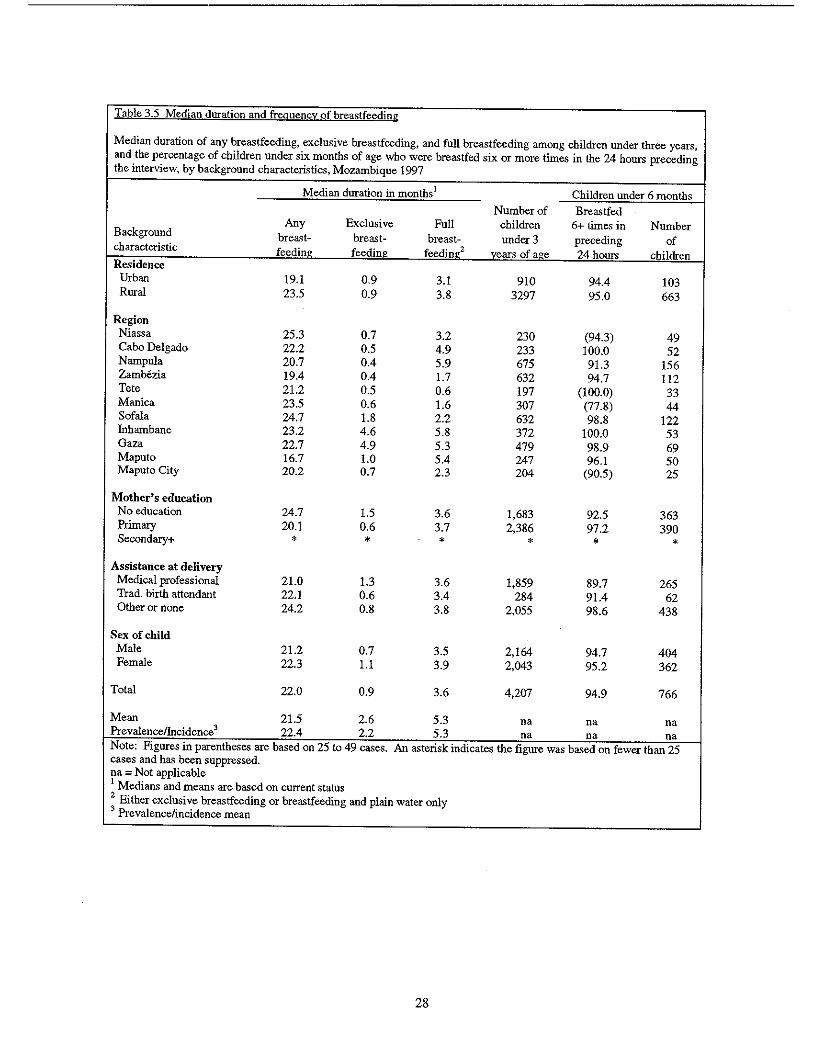
Table 3.5 Median duration and frequency of breastfeeding
Median duration of any breastfeeding, exclusive breastfeeding, and full breastfeeding among children under three years, and the percentage of children under six months of age who were breastfed six or more times in the 24 hours preceding the interview, by background characteristics, Mozambique 1997
Median duration in months1 Children under 6 months
Number of Breastfed Any Exclusive Full children 6+ times in Number
Background brea<;t- breast- breast- under 3 preceding of characteristic feeding feeding feedine:2 years of age 24 hours children Residence
Urban 19.1 0.9 3.1 910 94.4 103 Rural 23.5 0.9 3.8 3297 95.0 663
Region Niassa 25.3 0.7 3.2 230 (94.3) 49 Cabo Delgado 22.2 0.5 4.9 233 100.0 52 Narnpula 20.7 0.4 5.9 675 91.3 156 Zambezia 19.4 0.4 1.7 632 94.7 112 Tete 21.2 0.5 0.6 197 (100.0) 33 Manica 23.5 0.6 1.6 307 (77.8) 44 Sofala 24.7 1.8 2.2 632 98.8 122 Inhambane 23.2 4.6 5.8 372 100.0 53 Gaza 22.7 4.9 5.3 479 98.9 69 Maputo 16.7 1.0 5.4 247 96.1 50 Maputo City 20.2 0.7 2.3 204 (90.5) 25
Mother's education No education 24.7 1.5 3.6 1,683 92.5 363 Primary 20.1 0.6 3.7 2,386 97.2 390 Secondary+ * * * * * *
Assistance at delivery Medical professional 21.0 1.3 3.6 1,859 89.7 265 Trad. birth attendant 22.1 0.6 3.4 284 91.4 62 Other or none 24.2 0.8 3.8 2,055 98.6 438
Sex of child Male 21.2 0.7 3.5 2,164 94.7 404 Female 22.3 1.1 3.9 2,043 95.2 362
Total 22.0 0.9 3.6 4,207 94.9 766
Mean 21.5 2.6 5.3 na na na PrevalencelIncidence3 22.4 2.2 5.3 na na na Note: Figures in parentheses are based on 25 to 49 cases. An asterisk indicates the figure was based on fewer than 25 cases and has been suppressed. na = Not applicable 1 Medians and means are based on current status 2 Either exclusive breastfeeding or breastfeeding and plain water only 3 Prevalence/incidence mean
28
Although breastfeeding practices during the first six months of life are less-than-optimal in Mozambique, there is an extended period of full breastfeeding compared with exclusive breastfeeding. The median duration of full breastfeeding is almost four months (Table 3.5). Once again, girls are fully breastfed for a slightly longer period than boys. If access to clean, safe drinking water could be ensured to all Mozambicans, full breastfeeding may not be very detrimental to the infant. However, given low water coverage and quality in this country, the use of water in addition to breast milk raises concern about the increased risks of diseases such as diarrhea.
Differences in the duration of full breastfeeding were not observed according to the child's gender, urban-rural residence, mother's education, or assistance at delivery (Table 3.5). There are, however, significant regional differences in the duration of full breastfeeding. Infants in the coastal provinces of Inhambane and Nampula were fully breastfed for almost six months. In contrast, infants in Tete were fully breastfed for less than one month.
Irrespective of the amount of breast milk received, most Mozambican children are breastfed well into the second year of life (Table 3.5). The overall duration of any breastfeeding was 22 months, which is consistent with optimal breastfeeding standards. The province of Maputo has the lowest median duration of any breastfeeding at 17 months. This is almost a year less than the province with the longest median duration of breastfeeding (Niassa with 25 months). Rural infants tend to be breastfed longer than urban infants (24 months versus 19 months). Likewise, infants of uneducated women are breastfed longer than infants whose mothers have some education (25 months versus 20 months). This observation may reflect that educated mothers are engaged in occupations that require them to be separated from their infants sooner and for longer periods than other working mothers. The policy in Mozambique requires two months maternity leave, and once the mother returns to work, she is permitted one hour per day to breastfeed.
Although breastfeeding duration varies substantially by a number of background characteristics, there is little variation in terms of breastfeeding frequency. Overall, 95 percent of infants under six months of age were breastfed at least six times during the 24 hours preceding the survey. Manica Province, where only 78 percent of infants were breastfed six or more times during the preceding 24-hour period, stands out in terms of breastfeeding frequency. Its rate is low relative to those of other provinces, where at least 91 percent of infants were breastfed six times or more during the preceding 24 hours.
3.6 Reasons for Weaning
Information on the reasons for weaning was obtained from mothers of all children less than three years old. The survey identified four major categories of reasons for weaning: (I) maternal factors (e.g., maternal illness, nipplelbreast problems, insufficient milk, mother working); (2) child factors (illness/weakness. child's refusal of breast milk, death of child); (3) weaning age; and (4) pregnancy (Table 3.6). The most common reason for weaning was that the child was of weaning age (50 percent). As expected, the proportion of children weaned for this reason increased with child's age. It should be noted, however, that given the premature introduction of complementary foods in Mozambique, the duration of breastfeeding might be affected. One-quarter of all children were no longer breastfeeding because of illness or death, suggesting a need to educate mothers and other caregivers on the need to breastfeed during illness. Pregnancy was the next most important reason for weaning (17 percent), followed by maternal factors (7 percent) and other factors (less than I percent).
29
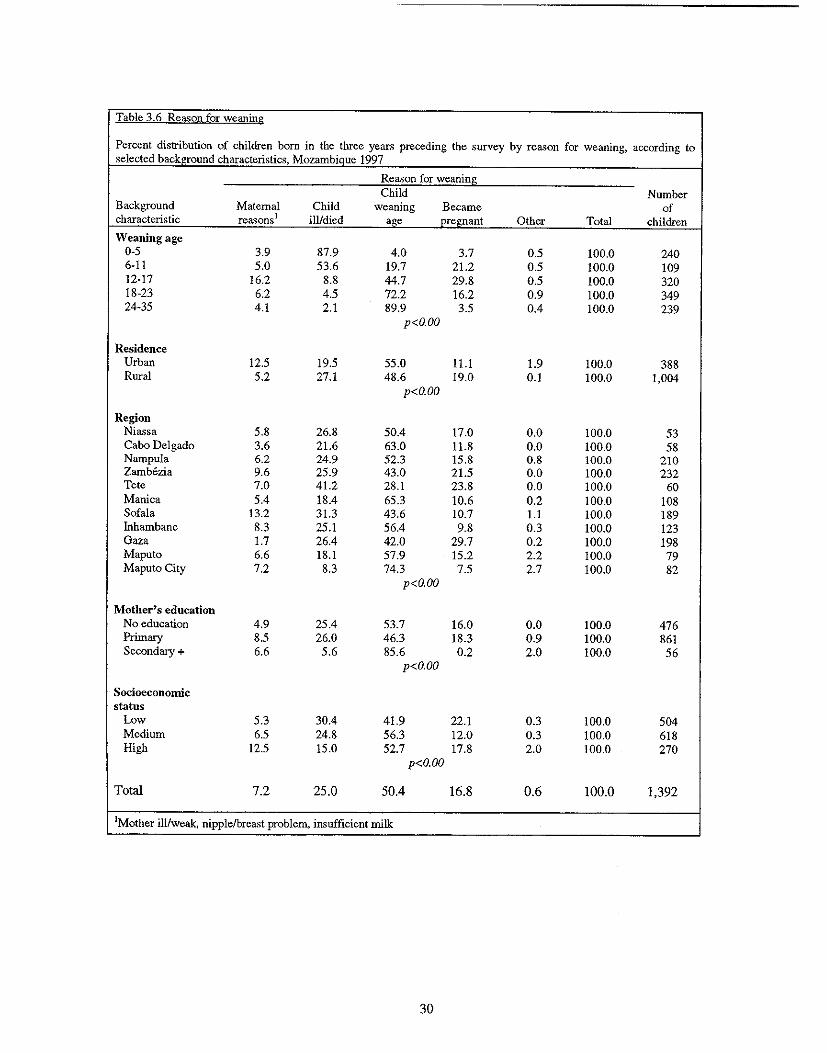
Table 3.6 Rea'ion for weaning
Percent distribution of children born in the three years preceding the survey by reason for weaning, according to selected background characteristics, MozambiQue 1997
Reason for weaning Child Number
Background Maternal Child weaning Became of characteristic rea'ions i ill/died age pregnant Other Total children
Weaning age 0-5 3.9 87.9 4.0 3.7 0.5 100.0 240 6-11 5.0 53.6 19.7 21.2 0.5 100.0 109 12-17 16.2 8.8 44.7 29.8 0.5 100.0 320 18-23 6.2 4.5 72.2 16.2 0.9 100.0 349 24-35 4.1 2.1 89.9 3.5 0.4 100.0 239
p<O.OO
Residence Urban 12.5 19.5 55.0 11.1 1.9 100.0 388 Rural 5.2 27.1 48.6 19.0 0.1 100.0 1,004
p<O.OO
Region Niassa 5.8 26.8 50.4 17.0 0.0 100.0 53 Cabo Delgado 3.6 21.6 63.0 11.8 0.0 100.0 58 Nampula 6.2 24.9 52.3 15.8 0.8 100.0 210 Zambezia 9.6 25.9 43.0 21.5 0.0 100.0 232 Tete 7.0 41.2 28.1 23.8 0.0 100.0 60 Manica 5.4 18.4 65.3 10.6 0.2 100.0 108 Sofala 13.2 31.3 43.6 10.7 1.1 100.0 189 Inhambane 8.3 25.1 56.4 9.8 0.3 100.0 123 Gaza 1.7 26.4 42.0 29.7 0.2 100.0 198 Maputo 6.6 18.1 57.9 15.2 2.2 100.0 79 Maputo City 7.2 8.3 74.3 7.5 2.7 100.0 82
p<O.OO
Mother's education No education 4.9 25.4 53.7 16.0 0.0 100.0 476 Primary 8.5 26.0 46.3 18.3 0.9 100.0 861 Secondary + 6.6 5.6 85.6 0.2 2.0 100.0 56
p<O.OO
Socioeconomic status
Low 5.3 30.4 41.9 22.1 0.3 100.0 504 Medium 6.5 24.8 56.3 12.0 0.3 100.0 618 High 12.5 15.0 52.7 17.8 2.0 100.0 270
p<O.OO
Total 7.2 25.0 50.4 16.8 0.6 100.0 1,392
IMother ill/weak, nipple/breast problem, insufficient milk
30
3.7 Comparison with Other Sub-Saharan Countries
Mozambique is not abnormal with respect to the prevalence of bottle feeding. Although it is said to be virtually nonexistent in Mozambique, bottle feeding rates are quite low in most of its neighboring countries (e.g., Malawi, Zambia) ranging from 3 to 6 percent. With respect to exclusive breastfeeding, Mozambique's prevalence (38 percent) is much higher than most SUb-Saharan African countries, especially its neighbors: Malawi (3 percent), Zambia (13 percent), and Zimbabwe (17 percent). Nevertheless, the extent of exclusive breastfeeding in Mozambique is far below that of central African countries, such as Burundi and Rwanda, where levels are approximately 90 percent in the first four months.
In terms of complementary feeding among 6- to 9-month-old infants, the rate in Mozambique (85 percent) is slightly lower than levels observed in neighboring countries (ranging from 87 to 94 percent). Nevertheless, Mozambique has a midrange level relative to other African countries covered by the DBS. Although there is room for improvement in terms of infant feeding practices in Mozambique, the extent of compliance with international standards exceeds many African countries.
3.8 Summary
Breastfeeding is widely practiced in Mozambique; 95 percent of all children are reportedly breastfed. Despite this high prevalence, breastfeeding practices are not uniform across maternal background characteristics (age and education). Nurses and midwives appear to be the best advocates of early breastfeeding, as reflected in 8 I percent of babies born of nurse/midwife-assisted deliveries being breastfed within the fIrst hour of life. In contrast, only 42 percent of babies of doctor-assisted deliveries breastfeed within the fIrst hour of life, thus highlighting a need to train physicians to encourage early initiation of breastfeeding.
Even when breastfeeding is initiated, complementary foods and liquids are introduced early into the Mozambican infant's diet. The early age at which cereals and other foods are introduced increases the child's chances of becoming malnourished or iII. Thus, there is a need to raise awareness regarding the benefIts of exclusive breastfeeding and age-appropriate weaning practices. Although no data were collected on AIDS, the epidemic poses a challenge to the nutrition community. Further studies into the impact of AIDS on breastfeeding and infant feeding practices are needed. Policy recommendations and program implementation are needed particularly related to information and counseling of mothers.
3.9 Recommendations
Based upon fIndings from the 1997 MOBS, recommendations to improve infant and child feeding are as follows:
Infl1J1t Feeding Practices: Raising Awareness of Mothers
• Promote early breastfeeding initiation, and emphasize exclusive breastfeeding and breastfeeding during illness.
• Educate families on the appropriate time to introduce complementary foods to the infant.
• Educate families on the detrimental effects of late introduction of solid foods to infants.
• Provide information and counseling to mothers regarding AlDS and breastfeeding.
31
Infant Feeding Practices: Raising Awareness of Providers
• Establish hospital pOlicies that are compliant with International Baby-Friendly Hospital Initiatives. Train medical professionals, especially physicians, to promote breastfeeding and to assist mothers in properly placing the infant to the breast and initiating breastfeeding shortly after birth.
• Train health workers regarding HIV and breastfeeding.
Geographic Targeting
• Investigate reasons behind the low breastfeeding prevalence in Cabo Delgado relative to other provinces, and target infant and child feeding interventions accordingly.
• Establish breastfeeding promotion campaigns in Nampula, where the prevalence and duration of exclusive breastfeeding are low.
• Implement facility-based educational campaigns to encourage urban and richer women (who are most likely to seek facility-based antenatal and delivery services) to initiate breastfeeding within an hour of delivery and practice appropriate infant feeding behaviors thereafter.
Breasifeeding and Birth Spacing
• Promote breastfeeding, more specifically, the Lactational Amenorrhea Method, as a natural means of reducing fertility to space births while providing young infants with the optimal source of nutrition.
• Encourage the use of contraception for birth spacing purposes.
Research
• Conduct qualitative research studies to investigate factors, including cultural practices affecting breastfeeding, that affect decisions regarding (a) the nature and timing of breastfeeding initiation, (b) the frequency of feedings and (c) the early and late introduction of complementary foods.
32
CHAPTER 4
MORTALITY AND MORBIDITY
Malnutrition compromises a child's health, making him or her more susceptible to illness and death (Pelletier et ai., 1993). In many developing countries, infectious diseases such as malaria, acute respiratory infection (ARI), and diarrhea-diseases that are linked to poor infant and child nutritional status-are the most common childhood illnesses and account for the greatest proportion of infant and under-five mortality (Jamison, 1993). This chapter describes the prevalence of morbidity and mortality among Mozambican children under three years of age. It also discusses correlates of infant and child mortality, age-specific patterns of common childhood illnesses, and care-seeking behaviors.
4.1 Infant and Under-five Mortality
The infant mortality rate (IMR), or the probability of death during the first year of life, is a commonly used measure of infant health. It is also a sensitive indicator of socioeconomic conditions and the level of development in a country. The under-five mortality rate (U5MR), the probability of dying before the child's fifth birthday, is another informative indicator of infant and child survival. Both the IMR and U5MR are reported per 1,000 live births and are commonly used in international comparisons. In the 1997 MDHS, IMRs and U5MRs are calculated for the 5- and IO-year periods preceding the survey; however, 10-year rates are used to assess socio-demographic differences in mortality since they give stronger statistical validity to the analyses. It should be noted that the results reported in this section reflect associations between selected background characteristics and infant and child mortality. It is not possible to imply causality, given the cross-sectional nature of the MDHS.
Based upon the 1997 MDHS, the rate of infant death in Mozambique has declined slightly over the past decade. The IMR for the five years preceding the survey is 135 per 1,000 live births, whereas the IO-year IMR is 147 per 1,000 live births (Table 4.1). There is a gender differential in infant mortality in Mozambique. Male infants have a higher IMR (153 per 1,000) than female infants (141 per 1,000). Gender differentials in morbidity will be discussed in subsequent sections of this chapter.
Rural babies have a higher IMR than their urban counterparts (160 versus 101 per 1,000). Infant mortality is of particular concern in the northern province of Nampula where the IMR is 216 per 1,000. This high IMR may be due to the low coverage of health facilities, the low rate of education, and the early age of marriage and pregnancy. In contrast, the capital city of Maputo, where accessibility and availability of formal health services is much higher than in other provinces (eIHI, 1995), has an IMR of only 49 per 1,000.
As shown in Table 4.1, the rate of infant death decreases with increasing maternal education. The IMR for babies whose mothers had a secondary education (73 per 1,000) was at least half the rate of babies whose mothers had primary or no education (144 and 156 per 1,000, respectively). It is noteworthy that there are large differentials between urban and rural areas with respect to maternal educational status (see Appendix B), which may partially explain the urban-rural differential that exists in terms of infant mortality. Educated mothers are more inclined to engage in preventive and healthpromoting behaviors than less-educated women, and they may also have the resources to access services andlor information, in the event of an illness (Government of Mozambique et al., 1998).
33
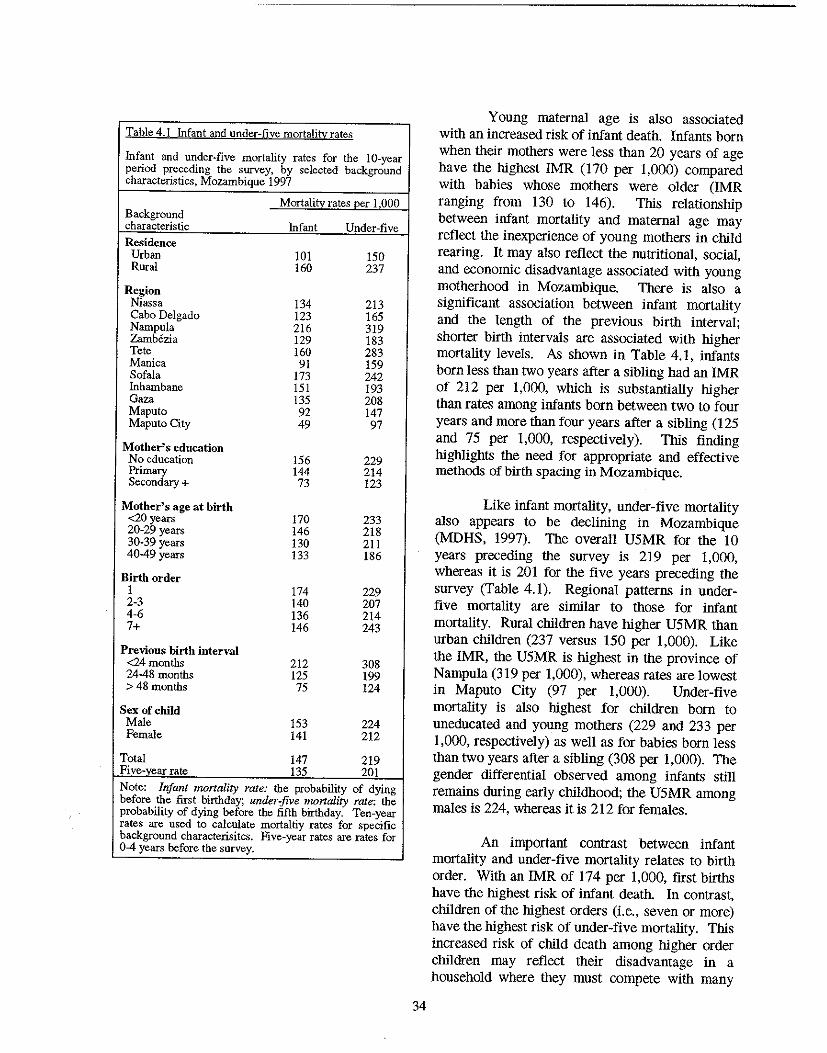
Table 4.1 Infant and under-five mortality rates
Infant and under-five mortality rates for the 10-year period preceding the survey, by selected background characteristics, Mozambique 1997
Mortalitv rates oer 1 000 Background characteristic Infant Under-five
Residence Urban 101 150 Rural 160 237
Region Niassa 134 213 Cabo Delgado 123 165 Nampu1a 216 319 Zamb6zia 129 183 Tete 160 283 Manica 91 159 Sofala 173 242 Inhambane 151 193 Gaza 135 208 Maputo 92 147 Maputo City 49 97
Mother's education No education 156 229 Primary 144 214 Secondary + 73 123
Mother's age at birth <20 years 170 233 20-29 years 146 218 30-39 years 130 211 40-49 years 133 186
Birth order 1 174 229 2-3 140 207 4-6 136 214 7+ 146 243
Previous birth interval <24 months 212 308 24-48 months 125 199 >48 months 75 124
Sex of child Male 153 224 Female 141 212
Total 147 219 Five:y~ar rate 135 201 Note: Infant mortality rate: the probability of dying before the first birthday; under-five mortality rate: the probability of dying before the fifth birthday. Ten-year rates are used to calculate mortaltiy rates for specific background characterisitcs. Five-year rates are rates for 0-4 years before the survey.
34
Young maternal age is also associated with an increased risk of infant death. Infants born when their mothers were less than 20 years of age have the highest IMR (170 per 1,000) compared with babies whose mothers were older (IMR ranging from 130 to 146). This relationship between infant mortality and maternal age may reflect the inexperience of young mothers in child rearing. It may also reflect the nutritional, social, and economic disadvantage associated with young motherhood in Mozambique. There is also a significant association between infant mortality and the length of the previous birth interval; shorter birth intervals are associated with higher mortality levels. As shown in Table 4.1, infants born less than two years after a sibling had an IMR of 212 per 1,000, which is substantially higher than rates among infants born between two to four years and more than four years after a sibling (125 and 75 per 1,000, respectively). This finding highlights the need for appropriate and effective methods of birth spacing in Mozambique.
Like infant mortality, under-five mortality also appears to be declining in Mozambique (MDHS, 1997). The overall U5MR for the !O years preceding the survey is 219 per 1,000, whereas it is 201 for the five years preceding the survey (Table 4.1). Regional patterns in underfive mortality are similar to those for infant mortality. Rural children have higher U5MR than urban children (237 versus 150 per 1,000). Like the IMR, the U5MR is highest in the province of Nampula (319 per 1,000), whereas rates are lowest in Maputo City (97 per 1,000). Under-five mortality is also highest for children born to uneducated and young mothers (229 and 233 per 1,000, respectively) as well as for babies born less than two years after a sibling (308 per 1,000). The gender differential observed among infants still remains during early childhood; the U5MR among males is 224, whereas it is 212 for females.
An important contrast between infant mortality and under-five mortality relates to birth order. With an IMR of 174 per 1,000, first births have the highest risk of infant death. In contrast, children of the highest orders (Le., seven or more) have the highest risk of under-five mortality. This increased risk of child death among higher order children may reflect their disadvantage in a household where they must compete with many
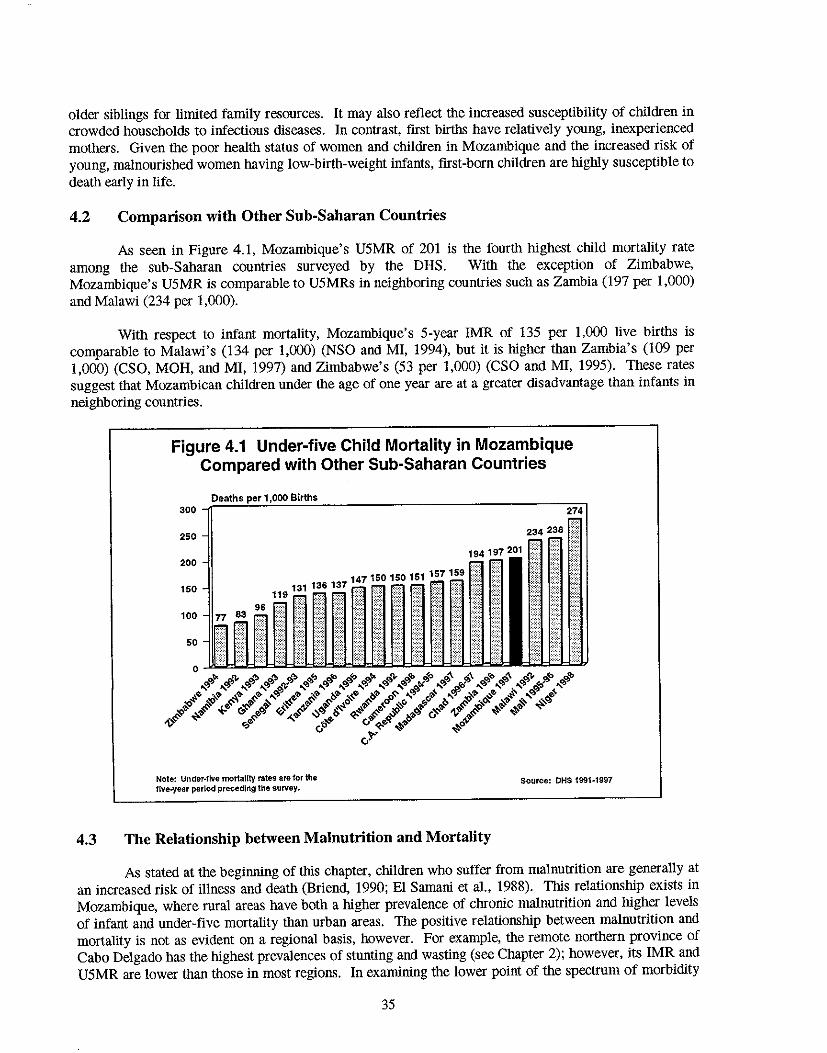
older siblings for limited family resources. It may also reflect the increased susceptibility of children in crowded households to infectious diseases. In contrast, first births have relatively young, inexperienced mothers. Given the poor health status of women and children in Mozambique and the increased risk of young, malnourished women having low-birth-weight infants, first-born children are highly susceptible to death early in life.
4_2 Comparison with Other Sub-Saharan Countries
As seen in Figure 4.1, Mozambique's U5MR of 201 is the fourtb highest child mortality rate among the sub-Sabaran countries surveyed by the DHS. With the exception of Zimbabwe, Mozambique's U5MR is comparable to U5MRs in neighboring countries such as Zambia (197 per 1,000) and Malawi (234 per 1,000).
With respect to infant mortality, Mozambique's 5-year IMR of 135 per 1,000 live births is comparable to Malawi's (134 per 1,000) (NSO and MI, 1994), but it is higher than Zambia's (109 per 1,000) (CSO, MOH, and MI, 1997) and Zimbabwe's (53 per 1,000) (CSO and MI, 1995). These rates suggest that Mozambican children under the age of one year are at a greater disadvantage than infants in neighboring countries.
Figure 4.1 Under-five Child Mortality in Mozambique Compared with Other Sub-Saharan Countries
Deaths Births 300 ~==~~~~~~-----------------------------=~
250
200
150
96 100
50
Note: Under-five mortality rates ate for the lIve-year period preceding the survey.
151 157159 )::
4.3 The Relationship between Malnutrition and Mortality
Source: DHS 1991-1997
As stated at the beginning of this chapter, children who snffer from malnutrition are generally at an increased risk of illness and death (Briend, 1990; EI Samani et al., 1988). This relationship exists in Mozambique, where rural areas have both a higher prevalence of chronic malnutrition and higher levels of infant and under-five mortality than urban areas. The positive relationship between malnutrition and mortality is not as evident on a regional basis, however. For example, the remote nortbern province of Cabo Delgado has the highest prevalences of stunting and wasting (see Chapter 2); however, its IMR and U5MR are lower than those in most regions. In examining the lower point of the spectrum of morbidity
35
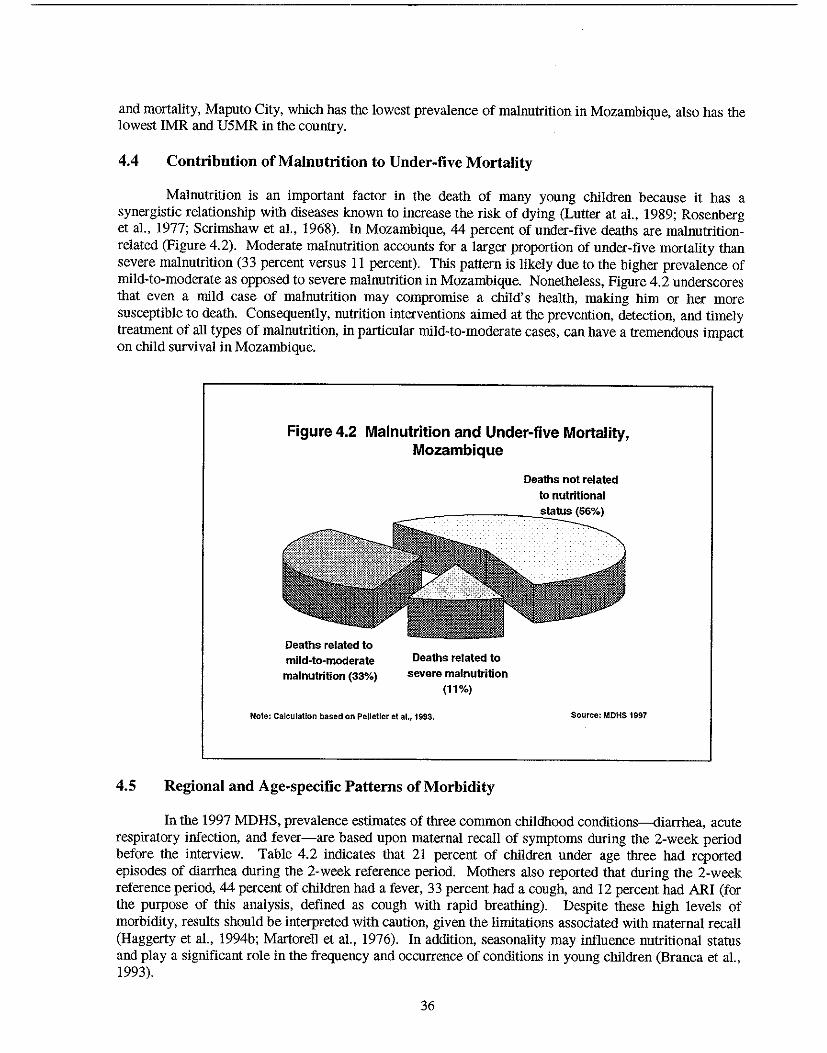
and mortality, Maputo City, which has the lowest prevalence of malnutrition in Mozambique, also has the lowest IMR and U5MR in the country.
4.4 Contribution of Malnutrition to Under-five Mortality
Malnutrition is an important factor in the death of many young children because it has a synergistic relationship with diseases known to increase the risk of dying (Lutter at aI., 1989; Rosenberg et aI., 1977; Scrimshaw et aI., 1968). In Mozambique, 44 percent of under-five deaths are malnutritionrelated (Figure 4.2). Moderate malnutrition accounts for a larger proportion of under-five mortality than severe malnutrition (33 percent versus 11 percent). This pattern is likely due to the higher prevalence of mild-to-moderate as opposed to severe malnutrition in Mozambique. Nonetheless, Figure 4.2 underscores that even a mild case of malnutrition may compromise a child's health, making him or her more susceptible to death. Consequently, nutrition interventions aimed at the prevention, detection, and timely treatment of all types of malnutrition, in particular mild-to-moderate cases, can have a tremendous impact on child survival in Mozambique.
Figure 4.2 Malnutrition and Under-five Mortality, Mozambique
Deaths related to mild-ta-moderate malnutrition (33%)
Deaths related to severe malnutrition
(11%)
Note: Calculation based on Pelletier et al., 1993.
4.5 Regional and Age-specific Patterns of Morbidity
Deaths not related
to nutritional status (56%)
Source: MDHS 1997
In the 1997 MDHS, prevalence estimates of three common childhood conditions-diarrhea, acute respiratory infection, and fever-are based upon maternal recall of symptoms during the 2-week period before the interview. Table 4.2 indicates that 21 percent of children under age three had reported episodes of diarrhea during the 2-week reference period. Mothers also reported that during the 2-week reference period, 44 percent of children had a fever, 33 percent had a cough, and 12 percent had ARI (for the purpose of this analysis, defined as cough with rapid breathing). Despite these high levels of morbidity, results should be interpreted with caution, given the limitations associated with maternal recall (Haggerty et al., 1994b; Martorell et aI., 1976). In addition, seasonality may influence nutritional status and playa significant role in the frequency and occurrence of conditions in young children (Branca et al., 1993).
36
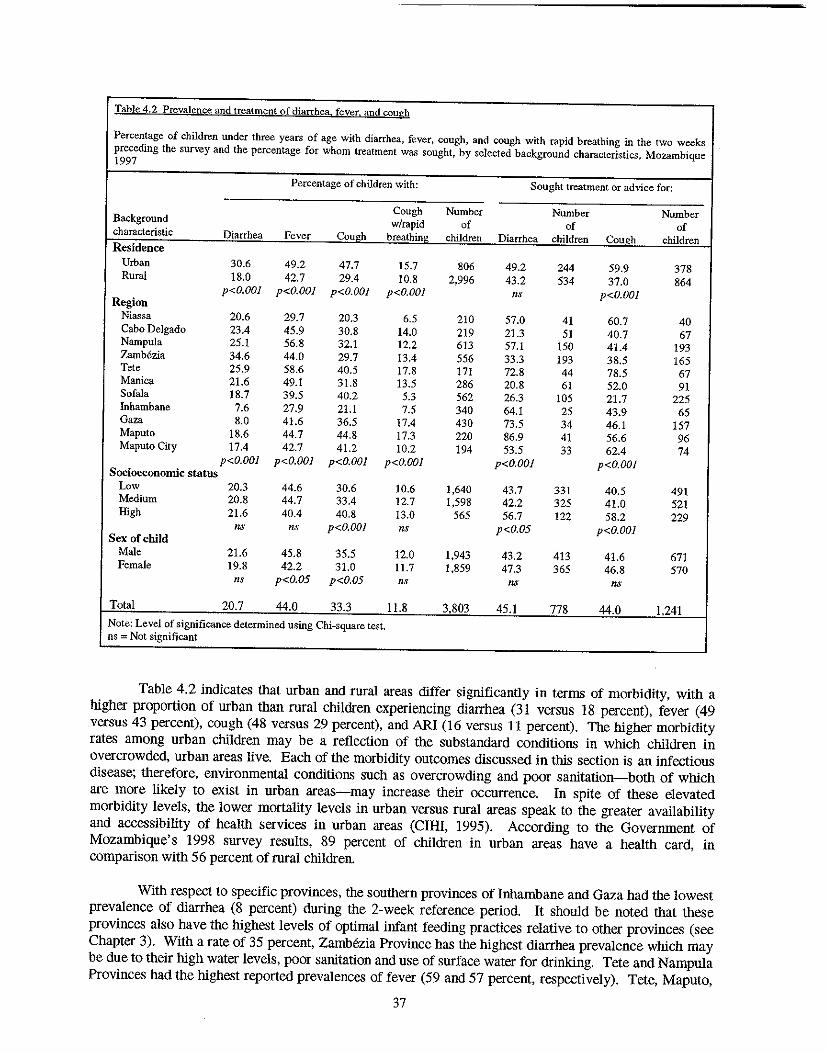
Table 4.2 Prevalence and treatment of diarrhea fever. and cough
Percentage of children under three years of age with diarrhea, fever, cough, and cough with rapid breathing in the two weeks preceding the survey and the percentage for whom treatment was sought, by se1ected background characteristics, Mozambique 1997
Percentage of children with: Sought treatment or advice for:
Cough Number Number Number Background w/rapid of of of characteristic Diarrhea Fever Cough breathing children Diarrhea children Cough children Residence
Urban 30.6 49.2 47.7 15.7 806 49.2 244 59.9 378 Rural 18.0 42.7 29.4 10.8 2,996 43.2 534 37.0 864
p<O.OOI p<O.OOI p<O.OOI p<O.OOI ns p<O.OOI Region
Niassa 20.6 29.7 20.3 6.5 210 57.0 41 60.7 40 Cabo De1gado 23.4 45.9 30.8 14.0 219 21.3 51 40.7 67 Nampula 25.1 56.8 32.1 12.2 613 57.1 150 41.4 193 Zambezia 34.6 44.0 29.7 13.4 556 33.3 193 38.5 165 Tete 25.9 58.6 40.5 17.8 171 72.8 44 78.5 67 Manica 21.6 49.1 31.8 13.5 286 20.8 61 52.0 91 Sofala 18.7 39.5 40.2 5.3 562 26.3 105 21.7 225 Inhambane 7.6 27.9 21.1 7.5 340 64.1 25 43.9 65 Gaza 8.0 41.6 36.5 17.4 430 73.5 34 46.1 157 Maputo 18.6 44.7 44.8 17.3 220 86.9 41 56.6 96 Maputo City 17.4 42.7 41.2 10.2 194 53.5 33 62.4 74
p<O.OOI p<O.OOl p<O.OOI p<O.OOI p<O.OOI p<O.OOI Socioeconomic status
Low 20.3 44.6 30.6 10.6 1,640 43.7 331 40.5 491 Medium 20.8 44.7 33.4 12.7 1,598 42.2 325 41.0 521 High 21.6 40.4 40.8 13.0 565 56.7 122 58.2 229
ns IlS p<O.OOI ns p<O.05 p<O.OOI Sex of child
Male 21.6 45.8 35.5 12.0 1,943 43.2 413 41.6 671 Female 19.8 42.2 31.0 11.7 1,859 47.3 365 46.8 570
ns p<O.05 p<O.05 ns ns ns
Total 20.7 44.0 33.3 11.8 3,803 45.1 778 44.0 1.241
Note: Level of significance determined using Chi-square test. ns = Not significant
Table 4.2 indicates that urban and rural areas differ significantly in terms of morbidity, witb a higher proportion of urban tban rural children experiencing diarrhea (31 versus 18 percent), fever (49 versus 43 percent), cough (48 versus 29 perceut), and ARI (16 versus 11 percent). The higher morbidity rates among urban children may be a reflection of tbe substandard conditions in which children in overcrowded, urban areas live. Each of tbe morbidity outcomes discussed in tbis section is an infectious disease; tberefore, environmental conditions such as overcrowding and poor sanitation-botb of which are more likely to exist in urban areas-may increase tbeir occurrence. In spite of tbese elevated morbidity levels, tbe lower mortality levels in urban versus rural areas speak to tbe greater availability and accessibility of health services in urban areas (CIHI, 1995). According to tbe Government of Mozambique's 1998 survey results, 89 percent of children in urban areas have a healtb card, in comparison with 56 percent of rural children.
Witb respect to specific provinces, tbe soutbern provinces of Inhambane and Gaza had tbe lowest prevalence of diarrhea (8 percent) during tbe 2-week reference period. It should be noted tbat tbese provinces also have the highest levels of optimal infant feeding practices relative to otber provinces (see Chapter 3). Witb a rate of 35 percent, Zambezia Province has tbe highest diarrhea prevalence which may be due to tbeir high water levels, poor sanitation and use of surface water for drinking. Tete and Nampula Provinces had the highest reported prevalences of fever (59 and 57 percent, respectively). Tete, Maputo,
37
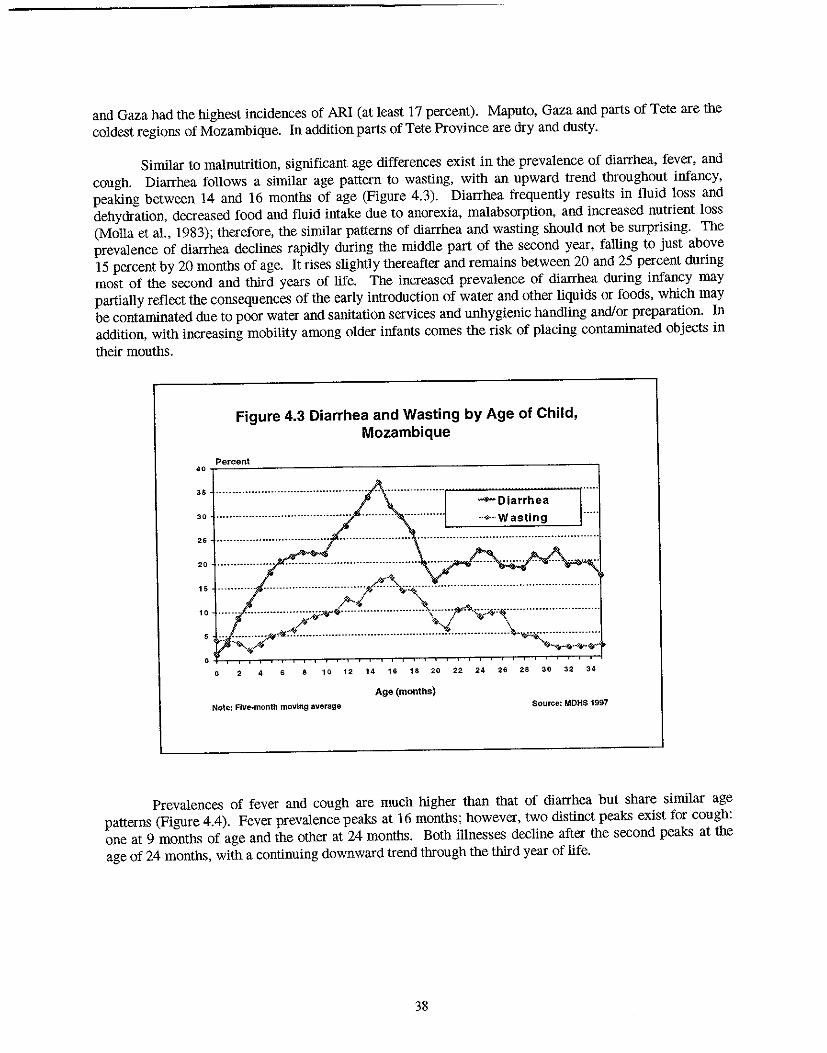
and Gaza had the highest incidences of ARI (at least 17 percent). Maputo, Gaza and parts of Tete are the coldest regions of Mozambique. In addition parts of Tete Province are dry and dusty.
Similar to malnutrition, significant age differences exist in the prevalence of diarrhea, fever, and cough. Diarrhea follows a similar age pattern to wasting, with an upward trend throughout infancy, peaking between 14 and 16 months of age (Figure 4.3). Diarrhea frequently results in fluid loss and dehydration, decreased food and fluid intake due to anorexia, malabsorption, and increased nutrient loss (Molla et aI., 1983); therefore, the similar patterns of diarrhea and wasting should not be surprising. The prevalence of diarrhea declines rapidly during the middle part of the second year, falling to just above IS percent by 20 months of age. It rises slightly thereafter and remains between 20 and 25 percent during most of the second and third years of life. The increased prevalence of diarrhea during infancy may partially reflect the consequences of the early introduction of water and other liquids or foods, which may be contaminated due to poor water and sanitation services and unhygienic handling and/or preparation. In addition, with increasing mobility among older infants comes the risk of placing contaminated objects in their mouths.
Figure 4.3 Diarrhea and Wasting by Age of Child, Mozambique
Percent 4'.-~~-----------------------------------------'
os
25
~Diarrhea
._¥-,. Wasting
:: .::::::·: .... ::::.:::::;=:iC~>\::::/~~~.~::::::::::::::::::::.:". " .....' 5 ." ..•.......• ftjF<fi:-........ __ .................... __ ........ .•......... -..•............ -~~ ... -......... -.... .
.. -"'..-" '-.......... .,., . .,-o 2 4 6 8 10 12 14 16 18 20 22 24 26 28 30 32 34
Age (months) Note: Five_month moving average Source: MDHS 1997
Prevalences of fever and cough are much higher than that of diarrhea but share similar age patterns (Figure 4.4). Fever prevalence peaks at 16 months; however, two distinct peaks exist for cough: one at 9 months of age and the other at 24 months. Both illnesses decline after the second peaks at the age of 24 months, with a continuing downward trend through the third year of life.
38
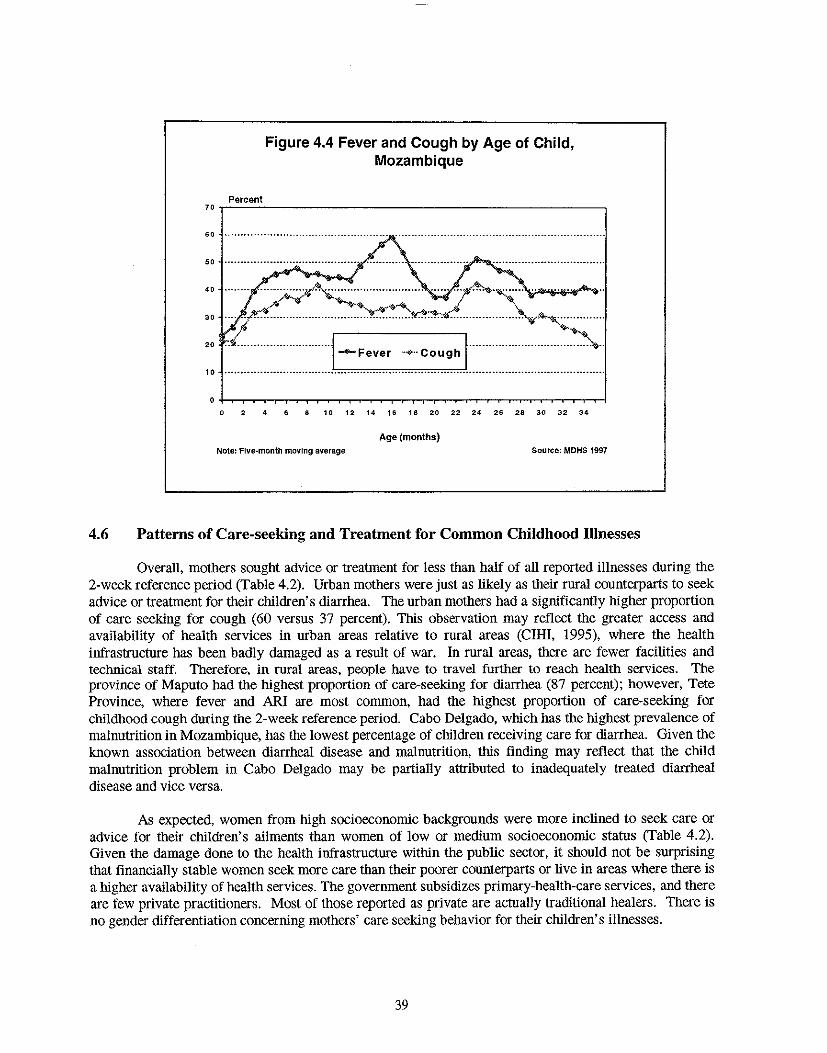
Figure 4.4 Fever and Cough by Age of Child, Mozambique
Percent 70r-~~-----------------------------------------.
60 ..•.•••••..•..••.••....
50
40 •• -.--•• .... -.--- ...... J;;".~ ............................ ...... "';;sf;~'4-'~"""" .... .
30 •...•• ?~~~ ...... :'::":~y:>:~~:jo".! .......... ~~,~ ........... . ~ ~
20 n"n.mn.nnnm nm .j ...... Fever Innn nmnnmmnmmnn~n 10 ................................. J.n._ ................ ~·:·~.~.~~.~~ ............................................ .
o :1: 4 6 8 10 12 14 16 18 20 22 24 26 28 30 32 34
Age (months) Note: Five-month moving average Source: MDHS 1997
4.6 Patterns of Care-seeking and Treatment for Common Childhood Illnesses
Overall, mothers sought advice or treatment for less than half of all reported illnesses during the 2-week reference period (Table 4.2). Urban mothers were just as likely as their rural counterparts to seek advice or treatment for their children's diarrhea. The urban mothers had a significantly higher proportion of care seeking for cough (60 versus 37 percent). This observation may reflect the greater access and availability of health services in urban areas relative to rural areas (CIHI, 1995), where the health infrastructure has been badly damaged as a result of war. In rural areas, there are fewer facilities and technical staff. Therefore. in rural areas, people have to travel further to reach health services. The province of Maputo had the highest proportion of care-seeking for diarrhea (87 percent); however, Tete Province, where fever and ARI are most common, had the highest proportion of care-seeking for childhood cough during the 2-week reference period. Cabo Delgado, which has the highest prevalence of malnutrition in Mozambique, has the lowest percentage of children receiving care for diarrhea. Given the known association between diarrheal disease and malnutrition, this finding may reflect that the child malnutrition problem in Cabo Delgado may be partially attributed to inadequately treated diarrheal disease and vice versa.
As expected, women from high socioeconomic backgrounds were more inclined to seek care or advice for their Children's ailments than women of low or medium socioeconomic status (Table 4.2). Given the damage done to the health infrastructure within the public sector, it should not be surprising that financially stable women seek more care than their poorer counterparts or live in areas where there is a higher availability of health services. The government subsidizes primary-health-care services, and there are few private practitioners. Most of those reported as private are actually traditional healers. There is no gender differentiation concerning mothers' care seeking behavior for their children's illnesses.
39
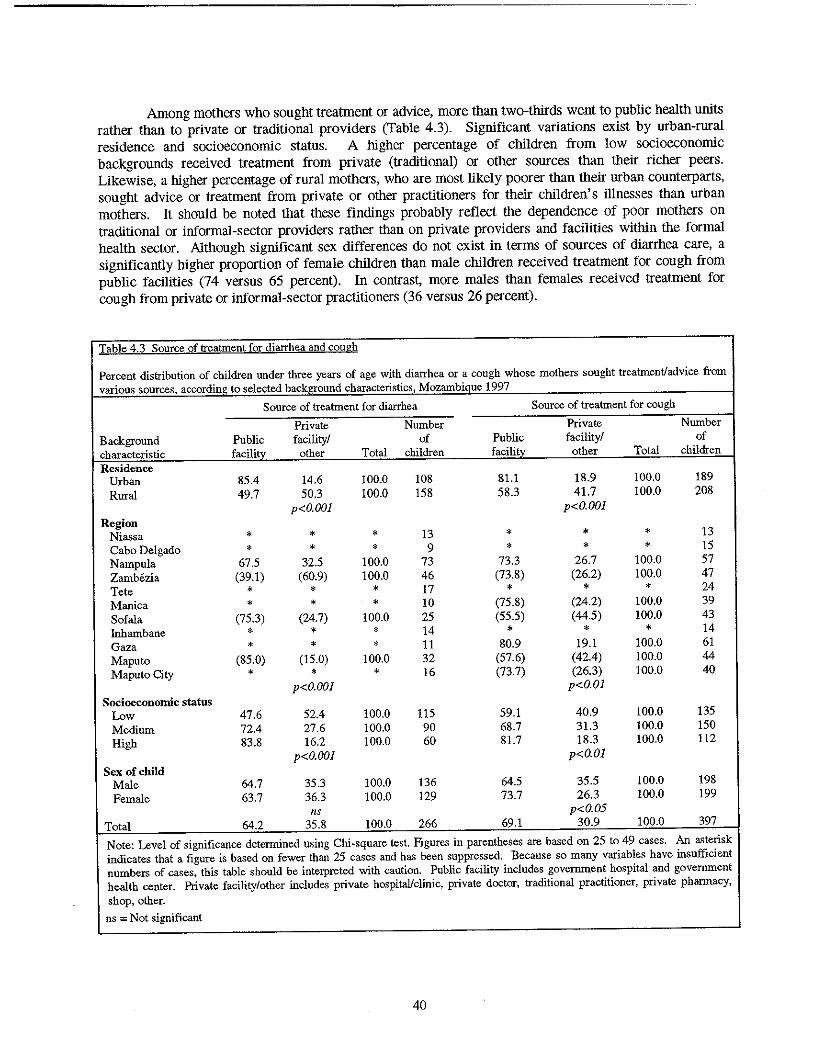
Among mothers who sought treatment or advice, more than two-thirds went to public health units rather than to private or traditional providers (Table 4.3). Significant variations exist by urban-rural residence and socioeconomic status. A higher percentage of children from low socioeconomic backgrounds received treatment from private (traditional) or other sources than their richer peers. Likewise, a higher percentage of rural mothers, who are most likely poorer than their urban counterparts, sought advice or treatment from private or other practitioners for their children's illnesses than urban mothers. It should be noted that these findings probably reflect the dependence of poor mothers on traditional or informal-sector providers rather than on private providers and faCilities within the formal health sector. Although Significant sex differences do not exist in terms of sources of diarrhea care, a significantly higher proportion of female children than male children received treatment for cough from public facilities (74 versus 65 percent). In contrast, more males than females received treatment for cough from private or informal-sector practitioners (36 versus 26 percent).
Table 4.3 Source of treatment for diarrhea and cough
Percent distribution of children under three years of age with diarrhea or a cough whose mothers sought treatment/advice from various .')Qurces, accordini': to selected backffound characteristics, Mozambiaue 1997
Source of treatment for diarrhea Source of treatment for cough
Private Number Private Number Background Public facility! of Public faCility! of characteristic facilitv other Total children facilitv other Total children Residence
Urban 85.4 14.6 100.0 108 81.1 18.9 100.0 189 Rural 49.7 50.3 100.0 158 58.3 41.7 100.0 208
p<O.OOl p<O.OOl Region
Niassa * * * 13 • • * 13 Cabo Delgado * * * 9 * * * 15 Nampula 67.5 32.5 100.0 73 73.3 26.7 100.0 57 Zamh6zia (39.1) (60.9) 100.0 46 (73.8) (26.2) 100.0 47 Tete * * * 17 * * * 24 Manica * • * 10 (75.8) (24.2) 100.0 39 Sofala (75.3) (24.7) 100.0 25 (55.5) (44.5) 100.0 43 Inhambane • * * 14 * * * 14 Gaza * * * 11 80.9 19.1 100.0 61 Maputo (85.0) (15.0) 100.0 32 (57.6) (42.4) 100.0 44 Maputo City • * • 16 (73.7) (26.3) 100.0 40
p<O.OOl p<o.Ol Socioeconomic status
Low 47.6 52.4 100.0 115 59.1 40.9 100.0 135 Medium 72.4 27.6 100.0 90 68.7 31.3 100.0 150 High 83.8 16.2 100.0 60 81.7 18.3 100.0 112
p<O.OOl p<O.01 Sex of child
Male 64.7 35.3 100.0 136 64.5 35.5 100.0 198 Female 63.7 36.3 100.0 129 73.7 26.3 100.0 199
ns p<O.05 Total 64.2 35.8 100.0 266 69.1 30.9 100.0 397
Note: Level of significance determined using Chi-square test. Figures in parentheses are based on 25 to 49 cas,es. An a<;terisk indicates that a figure is based on fewer than 25 cases and has been suppressed. Because so many variables have insufficient numbers of cases, this table should be interpreted with caution. Public facility includes government hospital and government health center. Private facility/other includes private hospital/clinic, private doctor, traditional practitioner, private pharmacy, shop, other.
ns ::::;; Not significant
40
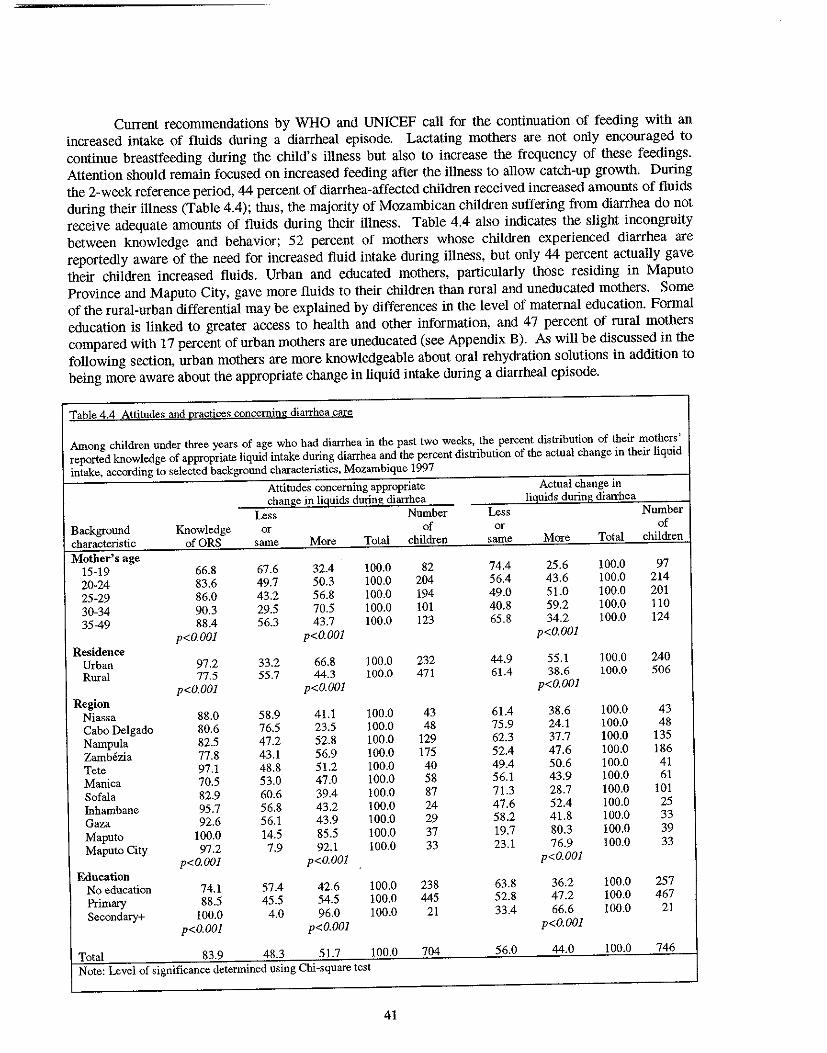
Current recommendations by WHO and UNICEF call for the continuation of feeding with an increased intake of fluids during a diarrheal episode. Lactating mothers are not only encouraged to continue breastfeeding during the child's illness but also to increase the frequency of these feedings. Attention should remain focused on increased feeding after the illness to allow catch-up growth. During the 2-week reference period, 44 percent of diarrhea-affected children received increased amounts of fluids during their illness (Table 4.4); thus, the majority of Mozambican children suffering from diarrhea do not receive adequate amounts of fluids during their illness. Table 4.4 also indicates the slight incongruity between knowledge and behavior; 52 percent of mothers whose children experienced diarrhea are reportedly aware of the need for increased fluid intake during illness, but only 44 percent actually gave their children increased fluids. Urban and educated mothers, particularly those residing in Maputo Province and Maputo City, gave more fluids to their children than rural and uneducated mothers. Some of the rural-urban differential may be explained by differences in the level of maternal education. Formal education is linked to greater access to health and other information, and 47 percent of rural mothers compared with 17 percent of urban mothers are uneducated (see Appendix B). As will be discussed in the following section, urban mothers are more knowledgeable about oral rehydration solutions in addition to being more aware about the appropriate change in liquid intake during a diarrheal episode.
Table 4.4 Attitudes and practices concerning diarrhea care
Among children under three years of age who had diarrhea in the past two weeks, the percent distribution of their mothers' reported knowledge of appropriate liquid intake during diarrhea and the percent distribution of the actual change in their liquid intake, according to selected background characteristics, Mozambique 1997
Attitudes concerning appropriate Actual change in Change in liguids during diarrhea liquids during diarrhea
Less Number Less Number Background Knowledge or of or of characteristic ofORS same More Total children same More Total children Mother's age
15-19 66.8 67.6 32.4 100.0 82 74.4 25.6 100.0 97 20-24 83.6 49.7 50.3 100.0 204 56.4 43.6 100.0 214 25-29 86.0 43.2 56.8 100.0 194 49.0 51.0 100.0 201 30-34 90.3 29.5 70.5 100.0 101 40.8 59.2 100.0 110 35-49 88.4 56.3 43.7 100.0 123 65.8 34.2 100.0 124
p<O.OOJ p<D.OOJ p<O.OOJ Residence
Urban 97.2 33.2 66.8 100.0 232 44.9 55.1 100.0 240 Rural 77.5 55.7 44.3 100.0 471 61.4 38.6 100.0 506
p<O.OOJ p<O.OOJ p<O.OOJ Region
Niassa 88.0 58.9 41.1 100.0 43 61.4 38.6 100.0 43 Cabo Delgado 80.6 76.5 23.5 100.0 48 75.9 24.1 100.0 48 Nampula 82.5 47.2 52.8 100.0 129 62.3 37.7 100.0 135 Zambezia 77.8 43.1 56.9 100.0 175 52.4 47.6 100.0 186 Tete 97.1 48.8 51.2 100.0 40 49.4 50.6 100.0 41 Manica 70.5 53.0 47.0 100.0 58 56.1 43.9 100.0 61 Sofala 82.9 60.6 39.4 100.0 87 71.3 28.7 100.0 101 Inhambane 95.7 56.8 43.2 100.0 24 47.6 52.4 100.0 25 Gaza 92.6 56.1 43.9 100.0 29 58.2 41.8 100.0 33 Maputo 100.0 14.5 85.5 100.0 37 19.7 80.3 100.0 39 Maputo City 97.2 7.9 92.1 100.0 33 23.1 76.9 100.0 33
p<O.OOJ p<O.OOJ p<O.OOI Education
No education 74.1 57.4 42.6 100.0 238 63.8 36.2 100.0 257 Primary 88.5 45.5 54.5 100.0 445 52.8 47.2 100.0 467 Secondary+ 100.0 4.0 96.0 100.0 21 33.4 66.6 100.0 21
p<O.OOJ p<O.OOJ p<O.OOJ
Total 83.9 48.3 51.7 100.0 704 56.0 44.0 100.0 746 Note: Level of significance determined using Chi-square test
41
A clear maternal age pattern does not exist for appropriate child feeding in response to illness; however, almost 60 percent of mothers age 30 to 34 gave their children more fluids during the diarrheal episode. In contrast, very young mothers (15- to 19-year-olds) were least likely to increase their children's fluid intake (26 percent), highlighting the need to target young, inexperienced mothers in health promotion and disease prevention campaigns.
4.7 Maternal Knowledge and Attitudes Regarding Treatment of Diarrhea in Children
Maternal knowledge and attitudes regarding diarrhea treatment are important in ensuring that children receive timely and adequate treatment for their illnesses. Of all mothers surveyed, 80 percent know about packets of oral rehydration salts (ORS) for use in treating diarrhea; however, this knowledge does not mean the mother will administer proper treatment during a diarrheal episode (Table 4.5). Mothers age 25 to 34 have the highest level of knowledge of ORS. More urban and educated mothers were knowledgeable about ORS, which corresponds to the greater proportion of urban children who received the appropriate fluid intakes during their diarrheal episode. The smallest proportion of mothers who knew about ORS was in Sofala (51 percent).
Forty-four percent of all mothers with children under the age of three believe that more liqnids should be given to a child during a diarrheal episode (Table 4.5). Only 23 percent of all mothers consider increasing food intake during diarrhea to be appropriate. A significantly higher percentage of urban than rural mothers thought to increase fluid and solid food intake during a diarrheal episode. There is also a significant association between maternal education and knowledge of appropriate feeding practices during diarrhea. Nampula and Cabo Delgado are the two regiOns that have the lowest percentages of mothers with opinions matching the appropriate behavior.
42
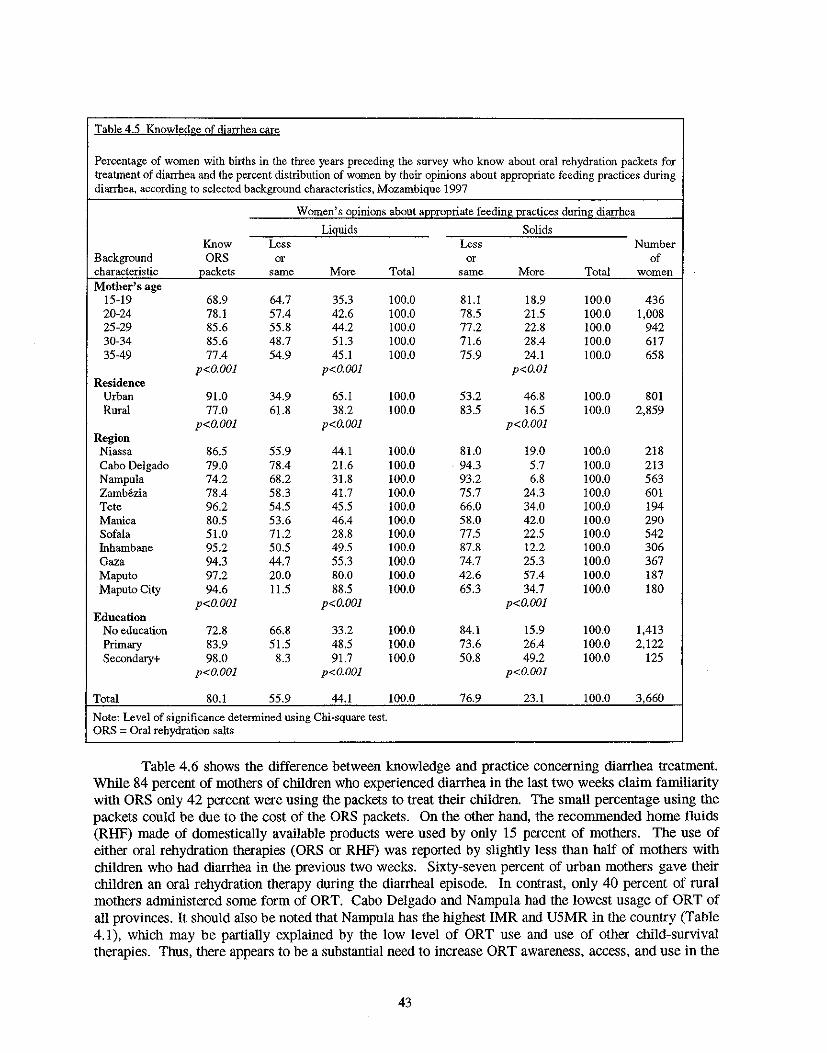
Table 4.5 Knowledge of diarrhea care
Percentage of women with births in the three years preceding the survey who know about oral rehydration packets for treatment of diarrhea and the percent distribution of women by their opinions about appropriate feeding practices during diarrhea, according to selected background characteristics, Mozambique 1997
Women's oDinions about aDDroDriate feedinf! oractices during diarrhea
Liguids Solids Know Less Less Number
Background ORS or or of characteristic packets same More Total same More Total women Mother's age
15-19 68.9 64.7 35.3 100.0 81.1 18.9 100.0 436 20-24 78.1 57.4 42.6 100.0 78.5 21.5 100.0 1,008 25-29 85.6 55.8 44.2 100.0 77.2 22.8 100.0 942 30-34 85.6 48.7 51.3 100.0 71.6 28.4 100.0 617 35-49 77.4 54.9 45.1 100.0 75.9 24.1 100.0 658
p<O.OOl p<O.OOl p<O.Ol Residence
Urban 91.0 34.9 65.1 100.0 53.2 46.8 100.0 801 Rural 77.0 61.8 38.2 100.0 83.5 16.5 100.0 2,859
p<O.OOl p<O.OOl p<O.OOl Region Niassa 86.5 55.9 44.1 100.0 81.0 19.0 100.0 218 Cabo Delgado 79.0 78.4 21.6 100.0 94.3 5.7 100.0 213 Nampula 74.2 68.2 31.8 100.0 93.2 6.8 100.0 563 Zamb6zia 78.4 58.3 41.7 100.0 75.7 24.3 100.0 601 Tete 96.2 54.5 45.5 100.0 66.0 34.0 100.0 194 Manica 80.5 53.6 46.4 100.0 58.0 42.0 100.0 290 Sofala 51.0 71.2 28.8 100.0 77.5 22.5 100.0 542 fuhambane 95.2 50.5 49.5 100.0 87.8 12.2 100.0 306 Gaza 94.3 44.7 55.3 100.0 74.7 25.3 100.0 367 Maputo 97.2 20.0 80.0 100.0 42.6 57.4 100.0 187 Maputo City 94.6 11.5 88.5 100.0 65.3 34.7 100.0 180
p<O.OOl p<O.OOJ p<O.OOl Education
No education 72.8 66.8 33.2 100.0 84.1 15.9 100.0 1,413 Primary 83.9 51.5 48.5 100.0 73.6 26.4 100.0 2,122 Secondary+ 98.0 8.3 91.7 100.0 50.8 49.2 100.0 125
p<O.OOl p<O.OOl p<O.OOl
Total 80.1 55.9 44.1 100.0 76.9 23.1 100.0 3,660
Note: Level of significance determined using Chi-square test. ORS ;; Oral rehydration salts
Table 4.6 shows the difference between knowledge and practice concerning diarrhea treatment. While 84 percent of mothers of children who experienced diarrhea in the last two weeks claim familiarity with ORS only 42 percent were using the packets to treat their children. The small percentage using the packets could be due to the cost of the ORS packets. On the other hand, the recommended home fluids (RHF) made of domestically available products were used by only 15 percent of mothers. The use of either oral rehydration therapies (ORS or RHF) was reported by slightly less than half of mothers with children who had diarrhea in the previous two weeks. Sixty-seven percent of urban mothers gave their children an oral rehydration therapy during the diarrheal episode. In contrast, only 40 percent of rural mothers administered some form of aRT. Cabo Delgado and Nampula had the lowest usage of ORT of all provinces. It should also be noted that Nampula has the highest IMR and U5MR in the country (Table 4.1), which may be partially explained by the low level of aRT use and use of other child-survival therapies. Thus, there appears to be a substantial need to increase aRT awareness, access, and use in the
43
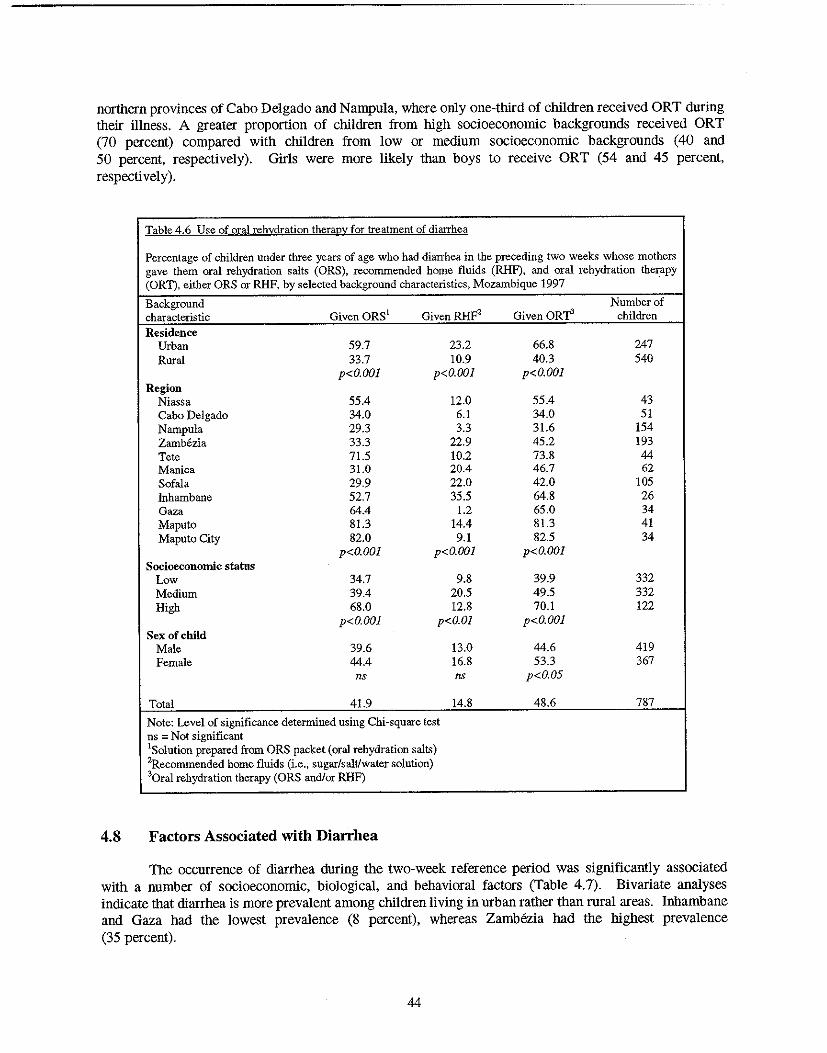
northern provinces of Cabo Delgado and Nampula, where only one-third of children received ORT during their illness, A greater proportion of children from high socioeconomic backgrounds received ORT (70 percent) compared with children from low or medium socioeconomic backgrounds (40 and 50 percent, respectively). Girls were more likely than boys to receive ORT (54 and 45 percent, respectively).
Table 4.6 Use of oral rehydration therapy for treatment of diarrhea
Percentage of children under three years of age who had diarrhea in the preceding two weeks whose mothers gave them oral rehydration salts (ORS), reconunended home fluids (RHF), and oral rehydration the~apy CORT), either ORS or RHF, by selected background characteristics, Mozambique 1997
Background Number of characteristic Given ORSt GivenRHp2 Given ORT' children Residence
Urban 59.7 23.2 66.8 247 Rural 33.7 10.9 40.3 540
p<O.OOI p<O.OOI p<O.OOI Region
Niassa 55.4 12.0 55.4 43 Cabo Delgado 34.0 6.1 34.0 51 Nampula 29.3 3.3 31.6 154 Zambezia 33.3 22.9 45.2 193 Tete 71.5 10.2 73.8 44 Manica 31.0 20.4 46.7 62 Sofala 29.9 22.0 42.0 105 lnhambane 52.7 35.5 64.8 26 Gaza 64.4 1.2 65.0 34 Maputo 81.3 14.4 81.3 41 Maputo City 82.0 9.1 82.5 34
p<O.OOI p<O.OOI p<O.OOI Socioeconomic status
Low 34.7 9.8 39.9 332 Medium 39.4 20.5 49.5 332 High 68.0 12.8 70.1 122
p<O.OOI p<O.OI p<O.OOI Sex of child
Male 39.6 13.0 44.6 419 Female 44.4 16.8 53.3 367
ns ns p<O.05
Total 41.9 14.8 48.6 787
Note: Level of significance determined using Chi-square test ns ;:;; Not significant lSolution prepared from ORS packet (oral rehydration salts) 2Recommended home fluids (i.e., sugar/salt/water solution) 'Oral rehydration therapy (ORS and/or RHF)
4.8 Factors Associated with Diarrhea
The occurrence of diarrhea during the two-week reference period was significantly associated with a number of socioeconomic, biological, and behavioral factors (Table 4.7). Bivariate analyses indicate that diarrhea is more prevalent among children living in urban rather than rural areas. Inhambane and Gaza had the lowest prevalence (8 percent), whereas ZamMzia had the highest prevalence (35 percent).
44
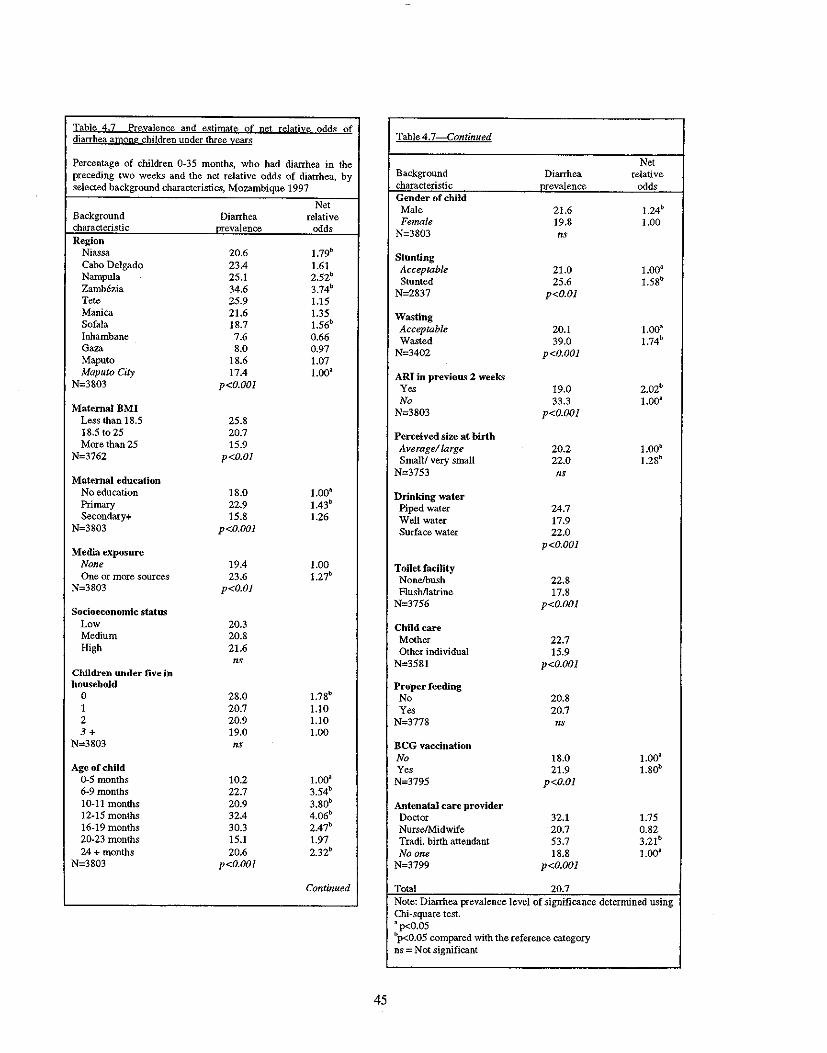
Iahle 4.7 frevalence and estimate of net relative Qdds of diarrhea among children under three years Table 4.7 Continued
Percentage of children 0·35 months, who had diarrhea in the preceding two weeks and the net relative odds of diarrhea, by selected background characteristics, Mozambique 1997
Net Background Diarrhea relative characteristic nrevalence odd> Region
Net Background Diarrhea relative characteristic nrevalence odds Gender of child Male 21.6 1.24b
Female 19.8 1.00 N=3803 ns
Niassa 20.6 1.79b
Cabo Delgado 23.4 1.61 Nampula 25.1 2.52b
Zambezia 34.6 3.74b
Tete 25.9 1.15
Stunting AcceptabJe 21.0 1.00" Stunted 25.6 1.58b
N=2837 p<O.Ol
Manica 21.6 1.35 Sofala 18.7 1.56b
Inhambane 7.6 0.66 Gaza 8.0 0.97 Maputo 18.6 1.07
Wasting Acceptable 20.1 1.00" Wasted 39.0 1.74b
N=3402 p<O.OOl
Maputo City 17.4 1.00" N=3803 p<O.OOl
ARI in previous 2 weeks 2.02b Yes 19.0
No 33.3 1.00a Maternal BMI
Less than 18.5 25.8 N=3803 p<O.OOl
18.5 to 25 20.7 Perceived size at birth More than 25 15.9
N=3762 p<O.Ol Average! large 20.2 1.00" Small! very small 22.0 1.28b
N=3753 ns Maternal education
No education 18.0 1.00a Primary 22.9 1.43b
Secondary+ 15.8 1.26
Drinking water Piped water 24.7 Well water 17.9
N=3803 p<O.OOl Surface water 22.0
Media exposure p<O.OOl
None 19.4 1.00 One or more sources 23.6 1.27b Toilet facility
Nonelbush 22.8 N=3803 p<O.Ol Flushllatrine 17.8
Socioeconomic status N=3756 p<O.OOl
Low 20.3 Child care Medium 20.8 Mother 22.7 High 21.6 Other individual 15.9
ns N=3581 p<O.OOl Children under five in household
0 28.0 1.78b Proper feeding
No 20.8 1 20.7 1.10 Yes 20.7 2 20.9 1.10 N=3778 ns 3+ 19.0 1.00
N=3803 ns BCG vaccination No 18.0 1.00a
Age of child Yes 21.9 1.80b
0·5 months 10.2 LOa" 6·9 months 22.7 3.54b N=3795 p<O.Ol
10-11 months 20.9 3.80b
12-15 months 32.4 4.06b Antenatal care provider
Doctor 32.1 1.75 16-19 months 30.3 2.47b
NurselMidwife 20.7 0.82 20·23 months 15.1 1.97 Tradi. birth attendant 53.7 3.21b
24 + months 20.6 2.32b Noone 18.8 1.00· N=3803 p<O.OOl N=3799 p<O.OOl
Continued Total 20.7 Note: Diarrhea prevalence level of significance determined using Chi-square test. , p<0.05 bp<0.05 compared with the reference category ns = Not significant
45
Maternal education and body mass index are also significantly associated with childhood diarrhea. Children of underweight and primary-school-educated mothers had the highest prevalence. Note, however, that urban areas, which have a higher diarrhea prevalence than rural areas, also have higher percentages of primary-school-educated mothers (see Appendix B). Thus, the associations between each of the aforementioned factors and diarrhea are consistent with the higher observed levels of diarrhea in urban versus rural areas. Although urban areas have a higher prevalence of diarrhea, children from female-headed households, which are more common in rural areas (see Appendix B), were also at an increased risk of suffering from diarrhea during the two-week reference period. Additional factors that have significant bivariate associations with diarrhea are as follows:
• No access to latrine/flush toilet • Access to a piped water source • Monogamous unions • Exposure to one or more media sources • BCG vaccination • Child age • Fourth or higher in birth order • Parity equal to five or higher • Male sex • At least one antenatal care visit • Informal-sector antenatal care provider (TBA, auxiliary midwife) • TBA-assisted delivery • Short preceding birth interval (less than two years) • Maternal body mass index (BMI) less than 18.5 • Child care by the respondent • Childhood stunting • Childhood wasting • ARI during the two weeks preceding the survey • Perceived "small/very small" size at birth • Mother as the primary caretaker.
When exploring the relationship between infant/child feeding and diarrhea, all children were classified based on whether or not they were fed in compliance with age-appropriate standards issued by WHO and UNICEF (1990). Age-appropriate feeding is defined as follows:
• Among 0- to 5-month-olds, exclusive breastfeeding • Among 9- to 23-month-olds, breast milk plus complementary foods • Among children older than 24 months, a diet consisting of foods and liquids possibly
including breast milk.
Using the above criteria, all children were classified as either improperly or properly fed. The bivariate relationship between the variable that depiCts age-appropriate infant and child feeding and diarrhea is not statistically significant; however, infant feeding was included in the multivariate analysiS, given its documented association with diarrhea in the literature (Victora et al., 1987; Brown et al., 1989). In addition, when the aforementioned relationship was explored on an age-specific basis, statistically significant differences emerged. For children 0-23 months, fewer properly fed children experienced diarrhea than improperly fed children. Among children ages 24 to 36 months-almost one-third of the entire sample-the reverse is true: fewer improperly fed (no breast milk) children experienced diarrhea than properly fed children; 3 percent of improperly fed and 22 percent of properly fed children experienced diarrhea during the preceding two weeks. Thus, there is evidence of an interaction between child's age and infant and child feeding in relation to the risk of diarrhea during the two weeks preceding
46
the survey. As a result, an interaction term is included in the multivariate analysis to account for variation in the magnitude and direction of the relationship between infant and child feeding and diarrhea across different ages.
It should be noted that when a young child is ill, is not receiving adequate food, or initiated weaning late (beyond 6-9 months), he/she may demand to continue breastfeeding beyond 24 months. WHO recommends that infants should continue to be breastfed up to two years of age and beyond while receiving adequate and safe complementary foods (WHO, 1996b). However, in Mozambique, 76 percent of children 24 months of age and older were no longer breastfeeding. Hence, the relationship between proper feeding and diarrhea may be a reflection of prolonged breastfeeding due to illness or malnutrition (Fawzi, et a!., 1998; Caulfield, Bentley and Ahmed, 1996). The protective effect of breastfeeding probably decreases with infant age due to lower intake of breast milk by children who receive complementary foods (WHO, 2000).
Other factors with significant bivariate associations with diarrhea are also included in the multivariate logistic regression models in order to assess the effect of each factor on childhood diarrhea while controlling for the effects of other factors. Since a specific conceptual framework does not exist for diarrheal disease, the best possible model for Mozambique was constructed based on commonly studied factors in the literature on diarrhea. The multivariate analysis discussed in this chapter is an adaptation of an approach that was used by Mock et a!. (1993) to study socioeconOmic, environmental, demographic, and behavioral correlates of childhood diarrhea in the Republic of Congo. Although the Mock et a!. study does not provide a hierarchical framework for the study of diarrhea, it does provide a classification system for its determinants. In the present analysis, variables with significant bivariate associations with diarrhea are classified as follows (reference categories are italicized):
Community-level Factors
• Region of residence (Niassa, Cabo Delgado, Nampula, Zambezia, Tete, Manica, Sofala, Inbambane, Gaza, Maputo, Maputo City)
• Urban-rural residence (urban, rural)
Maternal Sociodemographic and Health Factors
• Parity (1,2,3,4,5+) • Preceding birth interval (9-23, 24-35, 36+ months) • Number of children under age five in the household (0, 1,2,3+) • Maternal education (none, primary, secondary) • Paternal education (none, primary, secondary) • Maternal occupation (not working, professional, manual/agricultural) • Paternal occupation (not working, professional, manual, agricultural) • Maternal place of employment (at home, outside of home) • Maternal body mass index «18.5, 18.5-24.99, ;::,25.0) • Sex of the household head (male, female) • SOCioeconomic status (low, medium, high) • Media exposure (no exposure to mass media, exposure to one or more sources)
Child Demographic and Health Factors
• Child's age (0-5,6-9,10-11,12-15,16-19,20-23,24+ months) • Child's sex (male,Jemale) • Birth order (I, 2-3, 4-5, 6+) • Stunting (not stunted, stunted)
47

• Wasting (not wasted, wasted) • ARI in preceding two weeks (no, yes) • Perceived size at birth (average!large, small/very small)
Environmental and Sanitary Factors
• Type of toilet facility (nonelbush,flushllatrine) • Source of drinking water (piped water, well water, surface water)
Child Care Factors
• Age-appropriate infant/child feeding (proper feeding, improper feeding) • Caretaker (mother, other individual[sJ)
Health Service Utilization
• BCG vaccination (no, yes) • Number of antenatal visits (none, 1-3,4+) • Antenatal care provider (doctor, nurse/midwife, TBA, no one) • Type of delivery attendant (doctor, nurse/midwife, TBA, other/no one)
Generally speaking, the published literature does not contain information on the hierarchy of these factors. For the purpose of this analysis, each set of determinants ("Community-Level Factors," "Maternal Socio-Demographic and Health Factors," etc.) was fIrst considered as a separate regression model for diarrhea. For each group of determinants, the best possible set of variables was identified. This process yielded six different regression models, representing each of the six sets of determinants outlined above. As a final step, the variables from each "best set" were entered simultaneously within the same model to assess the effects of each variable on diarrhea, adjusting for other variables. Victora et al. (1997) advocate a similar analytic approach when studying infectious diseases using conceptual frameworks.
The multivariate analysis identified the following factors as statistically significant correlates of diarrhea during the two weeks preceding the survey (Table 4.6):
• Region of residence • Maternal education • Maternal exposure to mass media • Child's age • Child's gender • BeG vaccination • Perceived size at birth • ARI infection during the two weeks preceding the survey • Stunting • Wasting
For the most part, 1997 MDHS findings pertaining to diarrhea corroborate findings in the literature on diarrhea. There are three variables that require special discussion despite their outcomes in the multivariate analysis. Although the type-of-caretaker variable did not meet the present study's criteria for statistical Significance (the 95 percent confidence interval included 1.00), children whose primary caretaker was their mother had a 22 percent increased risk of diarrhea relative to children who were cared for by other individuals. Mock et al. (1993) observed a similar, although not identical, phenomenon in
48
Congo, whereby children whose caretakers were part of the child's extended family were less likely to experience diarrhea than those whose caretakers were part of the child's nuclear family. It is likely that Mozambican mothers who are the primary caretakers have competing obligations (for example, working on the family farm or generating income in the informal sector), which may ultimately compromise their ability to adequately care for their children. Another variable that warrants discussion is antenatal care provider. Children whose mothers sought antenatal care from TBAs had a threefold increased risk of diarrhea. It should be noted, however, that the proportion of women who seek antenatal care from TBA~ is small in Mozambique (1 percent); thus, the risk estimate associated with this variable should be interpreted with caution. In addition to the above variables, the interaction terms for infant/child feeding and child's age were not statistically significant in the final model.
With respect to the variables that are statistically significant in the multivariate analysis, infants residing in Niassa, Cabo Delgado, Nampula, Zambezia, and Sofala have significantly higher risks of diarrhea than infants in Maputo City. In particular, infants in Zambezia have almost a fourfold increased risk compared with infants in the capital city. Thus, even when controlling for other factors related to diarrhea, children in Zambezia have the highest risk of diarrhea in the country. Children of primaryschool-educated mothers were 43 percent more likely to experience diarrhea during the 2-week reference period, compared with children whose mothers were uneducated. It should be noted, however, that a higher proportion of educated women reside in urban areas-where diarrhea prevalence is highestcompared with rural areas (see Appendix B).
The link between maternal media exposure is still significant when other factors are taken into account; children whose mothers were exposed to mass media were 27 percent more likely to experience a diarrheal episode than children whose mothers were not. Although this observation seems counterintuitive, it is consistent with the relationship observed between maternal education and childbood diarrhea. Both maternal education and mass media exposure is significantly higher in urban than in rural areas (see AppendiX B).
In terms of the relationship between diarrhea and characteristics of the child, older children are at a significantly higher risk of diarrhea than infants 0- to 5-months-old (Table 4.7). Diarrhea risk peaks between ag,<s 10 and 15 months-at four times that of 0-5 month-oIds. This observation possibly reflects the ingestion of contaminated foods by children in that age group, as well as their increased mobility, which heightens their exposure to contaminated objects. Substantial gender differences in diarrhea also remain even when other factors are taken into account. Boys are almost 25 percent more likely than girls to have experienced a diarrheal epiSOde during the two-week reference period. This finding is consistent with observations in other African contexts (Molbak et aI., 1997; Mock et aI., 1993). As seen in Table 4.7, children who received BCG vaccinations were almost 80 percent more likely to experience diarrhea than children who did not receive BCG vaccinations. This finding corresponds with health care utilization and immunization coverage patterns in Mozambique-both of which are higher in urban areas (eIHI, 1995). In addition, children who were perceived as "small" or "very small" at birth by their mothers were 28 percent more likely to experience diarrhea than average- or large-sized children. It is unclear, however, Whether their small size at birth compromised their health or whether mothers and caretakers responded differently to these children relative to average or large infants.
Findings from the multivariate analysis also provide evidence of a strong association between child malnutrition and diarrhea. In Mozambique, stunted and wasted children have between a 58 and 74 percent increased risk of diarrheal disease, respectively. In spite of the observed associations, it is not possible to infer causality between childhood malnutrition and diarrhea in the present study. The literature alludes to difficulties in establishing which phenomenon-diarrhea or malnutrition-precedes the other, and previous findings have been inconsistent (Briend, 1990). In addition to malnutrition, children who experienced ARI during the two weeks preceding the survey were twice as likely to experience diarrhea, compared with children who did not suffer from ARI. The biological mechanism behind this relationship is unclear, and both of these illnesses are likely to share the same correlates. That
49
is, the observed relationship between ARI and diarrhea is probably confounded by at least one other factor such as maternal education, which is a proxy for socioeconomic status as well as access to health care and information.
It is evident from the above discussion that there are a number of points of intervention, both short- and long-term. SOCioeconomic factors such as maternal education are less amenable to short-term intervention. Nevertheless, their observed influence on the risk of diarrhea warrants further attention. In addition, the Significant association between malnutrition and diarrhea underscores tbe need to furtber explore the interplay between disease and nutritional status and to identify factors tbat influence both. Such research is of particular importance given the pervasiveness of both diarrhea and malnutrition among Mozambican infants and children.
4.9 Summary
This chapter presents results that indicate high levels of infant and under-five mortality in Mozambique (147 and 219 per 1,000, respectively). Rural infants and children appear to be at a particular disadvantage in terms of mortality risk. Rates of infant and child mortality are highest in the province of Nampula (216 and 319 per 1,000, respectively), where optimal infant and child care behaviors, such as exclusive breastfeeding, are not tbe norm. Mortality rates in Nampula are stark contrasts to rates in Mozambique's capital, Maputo, where the IMR and U5MR are 49 and 97 per 1,000, respectively.
In Mozambique, malnutrition plays a critical role in determining infant and child snrvival: 44 percent of all deaths occurring before age five are related to malnutrition. High prevalences of common childhood illnesses, namely diarrhea (21 percent), ARI (12 percent) and fever (44 percent), also raise concern. Diarrhea, which may influence child nutritional status, is related to a number of factors that highlight possible points of intervention in reducing diarrheal disease, and ideally, nutrition morbidity in Mozambique. The majority of the factors identified in the multivariate analysis speak to the less-thanoptimal social and economic conditions in Mozambique, particularly in urban areas, where diarrhea prevalence is almost twice as high as the prevalence in rural areas.
4.10 Recommendations
Given the pervasiveness of morbidity and mortality among Mozambican infants and children, key recommendations are as follOWS:
Infant and Child Nutrition
• Encourage optimal, age-appropriate feeding for all children.
• Communicate the need for increasing the amounts of liquids and solids given to children during diarrheal episodes. Advocate continuing increased feedings after illness to allow catch up growth for the child.
• Develop interventions that entail the timely identification and treatment of mild-to-moderate malnutrition in children.
Family Planning
• Given the observed relationship between short birth intervals and infant/child mortality, promote appropriate birtb spacing by means of family planning to (1) reduce tbe economic and dietary demands placed upon large families in high-mortality areas (e.g., Nampula province) and (2) reduce morbidity risks associated witb high-order births.
50

• Improve accessibility and acceptance of family planning by integrating family planning services with "well child" services in the public health sector.
Women's Health and Welfare
• Increase educational and occupational opportunities for poor women.
• Develop health promotion campaigns that are appropriate for poor and uneducated populations, particularly in rural areas. Educate mothers and caregivers on simple protocols of prevention, care, and treatment for common childhood illnesses such as diarrhea.
• Identify high-risk women (e.g., young, nulliparous women) early during the antenatal period to monitor their health and detect and treat conditions (e.g., anemia, malaria) linked to poor infant outcomes.
Improve Coverage of Child Survival Services
• Given the incongruity between levels of ORT knowledge and use in Mozambique, establish community outreach programs that (a) improve community access to and acceptance of ORT and (b) educate caregivers on the proper use of ORT.
Geographic Targeting
• Investigate determinants of diarrheal disease in Cabo Delgado, Nampula, Niassa, Sofala, and ZamMzia, and plan interventions accordingly.
• Improve water, sanitation, and other environmental conditions in urban areas, where diarrhea prevalence is highest.
Research • Support qualitative research that explores factors that influence care seeking for childhood
illnesses and differential treatment of illnesses in boys versus girls.
51
CHAPTERS
FACTORS ASSOCIATED WITH MALNUTRITION
Malnutrition is directly related to poor dietary intake and morbidity, both of which are associated with a myriad of biological, demographic, and socioeconomic factors. This chapter is based upon bivariate and multivariate analytic techniques and describes the relationships between various factors and child malnutrition iii Mozambique.
5.1 Biological and Health Characteristics of Stunting
As seen in Table 5.1, stunting and wasting are Significantly associated with a number of biological and health characteristics. It should be noted, however, that relationships depicted in Table 5.1 do not control for confounding. Thus, results from the bivariate analysis do not speak to the exact nature of the relationship between these factors and stunting and wasting.
Based upon the bivariate analysis (Table 5.1), stunting in children less than three years of age is significantly associated with the following biological and health factors:
• Child's age • Mother's perception of the infant's size at birth • Birth weight • Single versus multiple birth • Mother's current pregnancy status • Length of the preceding birth interval • Occurrence of diarrhea in the previous two weeks • Occurrence of fever in the previous two weeks • Age-appropriate infant feeding.
There is a positive relationship between child's age and stunting, whereby young infants have the lowest percentage of stunting and' the oldest children in the sample have the highest percentage of stunting. Given that stunting is a cumulative process, this relationship is not surprising. Nevertheless, it should be noted that more than one-third of children age 12 to 17 months are stunted, demonstrating that stunting can be observed during the earliest stages of life. By age 18 to 23 months, almost half of all children are stunted; thus, highlighting the first two years of life as a critical period in preventing childhood malnutrition. Stunting continues to rise during the third year of life, but it appears to plateau by age 30 to 35 months.
Although information on weight at birth is only available for 39 percent of all children, low birth weight (LBW) infants appear to be at a nutritional disadvantage later in childhood compared with normal birth weight children (Table 5.1). The prevalence of stunting among children who were LBW infants is 44 percent-significantly higher than that observed among children who were normal weight infants (27 percent). Children born as twins are considered at risk for stunting, with two-thirds of twins being stunted compared with 35 percent of singleton children. In addition, a larger proportion of children born less than two years after a sibling were stunted (41 percent), compared with children whose Siblings were age 24-35 months or age 36 months and older (37 and 32 percent, respectively).
53
PREVIOUS PAGE BLANK
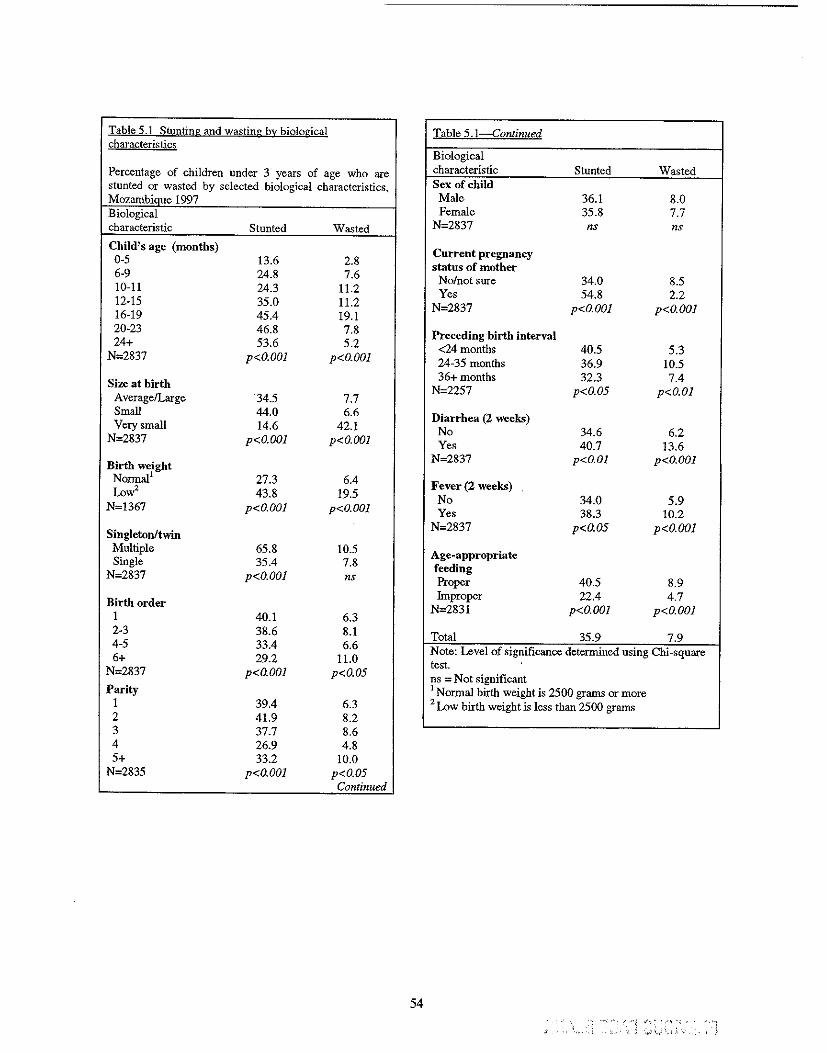
Table 5.1 Stunting and wasting by biological Table 5.1-Continued characteristics
Biological
Percentage of children under 3 years of age who are stunted or wasted by selected biological characteristics, Mozambiaue 1997
characteristic Stunted Wasted Sex of child Male 36.1 8.0
Biological characteristic Stunted Wa<;ted
Female 35.8 7.7 N=2837 ns ns
Child's age (months) 0-5 13.6 2.8 6-9 24.8 7.6 10-11 24.3 11.2 12-15 35.0 11.2 16-19 45.4 19.1
Current pregnancy status of mother
No/not sure 34.0 8.5 Yes 54.8 2.2
N=2837 p<O.OOl p<O.OOl
20-23 46.8 7.8 24+ 53.6 5.2
N=2837 p<O.OOl p<O.OOl
Preceding birth interval <24 months 40.5 5.3 24-35 months 36.9 10.5
Size at birth Average/Large 34.5 7.7
36+ months 32.3 7.4 N=2257 p<O.05 p<O.Ol
Small 44.0 6.6 Very small 14.6 42.1
N=2837 p<O.OOl p<O.OOl
Diarrhea (2 weeks) No 34.6 6.2 Yes 40.7 13.6
Birth weight Normal l 27.3 6.4 Low' 43.8 19.5
N=1367 p<O.OOl p<O.OOl
N=2837 p<O.Ol p<O.OOl
Fever (2 weeks) No 34.0 5.9 Yes 38.3 10.2
Singleton/twin N=2837 p<O.05 p<O.OOl
Multiple 65.8 10.5 Single 35.4 7.8
N=2837 p<O.OOl ns
Age~appropriate
feeding Proper 40.5 8.9
Birth order 1 40.1 6.3
Improper 22.4 4.7 N=2831 p<O.OOl p<O.OOl
2-3 38.6 8.1 4-5 33.4 6.6 6+ 29.2 11.0
N=2837 p<O.OOl p<O.05
Parity 1 39.4 6.3
Total 35.9 7.9 Note: Level of significance determined using Chi-square test. ns = Not significant I Normal birth weight is 2500 grams or more 2 Low birth weight is less than 2500 grams
2 41.9 8.2 3 37.7 8.6 4 26.9 4.8 5+ 33.2 10.0
N=2835 p<O.OOl p<O.05 Continued
54 . - .'. '''~ ;'0",,·, '
.'.) ,-" '>0" " ; "
Common childhood conditions like diarrhea and fever during the two weeks preceding the survey are also significantly associated with stunting (Table 5.1). There is a low likelihood that these two conditions are direct causes of stunting; however, children who were reported to have had diarrhea or fever may be more likely than other children to have repeated episodes of illnesses in the past. Thus the cumulative effect of recurrent illnesses on stunting may be substantial. Unlike diarrhea, ARI during the preceding two weeks was not significantly associated with stunting.
As in Chapter 4, all children were classified based upon whether their diets were in compliance with WHO and UNICEF standards for age-appropriate feeding. Age-appropriate feeding is defined as follows:
• Among 0- to 5-month-olds, exclusive breastfeeding • Among 9- to 23-month-olds, breast milk and complementary foods • Among 24-month-olds and older, a diet based on foods and liquids (child can be
breastfeeding or weaned).
Using the above criteria, all children were classified as either improperly or properly fed. Surprisingly, properly fed children were more likely to be stunted than improperly fed children (41 percent versus 22 percent) (Table 5.1). This result may be due to factors related to the measurement of proper feeding. The use of 24-hour-recall data may not truly reflect actual feeding patterns (Piwoz et al" 1994). The use of 7-day feeding data may better describe proper feeding. It has also been observed that mothers of malnourished children are more likely to overestimate the actual amount of food intake in 24-hour recall dietary measures (OUnto et aI., 1994).
5.2 Biological and Health Characteristics of Wasting
Generally speaking, the nature and magnitude of the associations between wasting and biological and health characteristics of the child are similar to those for stunting (Table 5.1). There are some noteworthy exceptions, however. First, the prevalence of wasting peaks much earlier than that of stunting-12-17 months versus 30-35 months, respectively-although the prevalence of wasting is much lower at all ages. Since wasting reflects recent acute i11ness or deficiencies in dietary intake, it is possible that improper weaning practices also contributed to the high wasting prevalence among 12- to 15-montholds in Mozambique (weaning foods are not enriched and the quantity of foods given may not adequately satisfy the nutritional needs of the children) (District Food Security and Nutrition Profiles, 1999). Another distinction between wasting and stunting is that children who were perceived by their mothers to be "very small" at birth had a significantly higher prevalence of wasting (42 percent) than children who were perceived to be "small" or "averagellarge" at birth (7 percent and 8 percent, respectively). Surprisingly, only 2 percent of children whose mothers were pregnant at the time of interview were wasted whereas 9 percent of children of nonpregnant mothers were wasted. As observed with stunting, a higher proportion of properly fed children were wasted compared with improperly fed children (9 versus 5 percent). This finding may reflect the limitations of 24-hour dietary recall (see discussion in 5.1 regarding prolonged breastfeeding).
5.3 Socioeconomic and Demographic Characteristics of Stnnting
Table 5.2 presents associations between stunting and socioeconomic and demographic factors. Some of these factors may be highly correlated with one another; therefore, results should be interpreted with caution. Nevertheless, results conflfm the critical role that poverty plays in determining nutritional status in Mozambican children. Rural children have a significantly higher stunting prevalence than urban children (39 percent versus 27 percent). Children in Maputo Province and Maputo City are least stunted (16 and 21 percent, respectively) whereas more than one-half of all children in the northern provinces of
55
Niassa and Cabo Delgado are stunted. Again, this may be a reflection of better living standards and better access to health services in Maputo City compared with the other provinces (Government of Mozambique et aI., 1998).
As seen in Table 5.2, there is a protective effect of parental education on stunting. This effect is particularly evident in terms of maternal education. Children whose mothers have at least a secondary school education have a stunting prevalence of 9 percent compared with 41 percent of children with uneducated mothers. This large differential needs to be interpreted with caution since few mothers have a secondary education or higher. The difference between children of uneducated and primary-schooleducated women is less striking (39 versus 35 percent, respectively). A similar pattern exists with respect to education level of the partner, but stunting differentials are not as large (Table 5.2). Among children whose mother or father had an agricultural occupation, the level of stunting was at least 43 percent. more than one-quarter of children whose parents did not work are stunted. Children of professional parents have the lowest prevalence of stunting, which may reflect that their parents have the financial means and education to better meet household dietary needs. It may also reflect that professional parents reside primarily in urban areas where stunting prevalence is lower than in rural areas.
Other noteworthy relationships between stunting and other socioeconomic indicators are presented in Table 5.2. For example, the prevalence of stunting among children from the poorest backgrounds (44 percent) is almost twice the prevalence among children from higher socioeconomic backgrounds (23 percent). Children whose families do not have access to a flush toilet or latrine have a higher stunting prevalence than children whose families do have such access (40 versus 32 percent). The expected relationship between drinking-water source and stunting also exists. While improved water and sanitation facilities may reflect higher income, they also have a direct effect on nutritional status because they reduce levels of infectious disease. Where water is not readily available, food hygiene is often inadequate. Where sanitation is poor, there is an increased risk of food and water contamination. The percentage of stunted children from households with piped water is significantly lower than the percentage among children who drank well or surface water (26 percent versus 39 and 40 percent, respectively). There is also a Significant difference in stunting between children whose homes had finished floors (21 percent) and those who had homes with natural or rudimentary floors (41 and 43 percent, respectively).
A higher proportion of children from female-headed households is stunted, compared with children from male-headed households (Table 5.2). The relationship between female-headed households and childhood stunting may be confounded because female-headed households tend to be poorer (Government of Mozambique et aI., 1998). In addition, a female head of household is responsible for generating income and other resources to sustain her family. As a result, less time may be available to spend on child care.
Children whose mothers were exposed to various forms of media were less stunted than children whose mothers had no exposure to media. As shown in Table 5.2, lower stunting prevalences are observed for children whose mothers watched televiSion weekly (18 percent), listened to the radio daily (25 percent), and read the newspaper weekly (19 percent), compared with children whose mothers did not watch television (38 percent), listen to the radio (41 percent), or read the newspaper (38 percent). The relationship between mass media exposure and stunting is likely to be confounded by a number of factors. Access to a television or radio, in particular, is usually associated with household wealth, which in turn is highly and positively associated with child nutritional status. Likewise, mothers who read the newspaper are clearly more educated. As stated previously, maternal education is associated with lower stunting. Frequent exposure to mass media may also provide mothers with helpful information on child care, health, and nutrition, and thus may be a possible means of behavioral change in Mozambique.
56
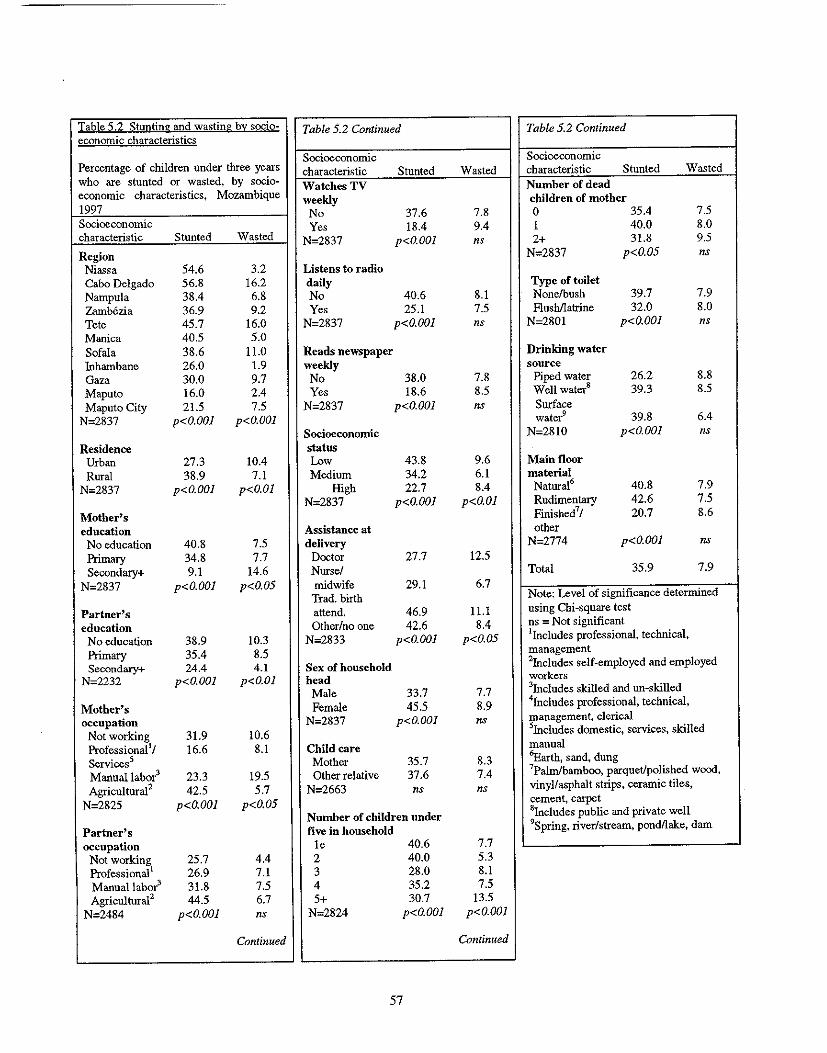
Table 5 2 Stunting and wasting by socio-economic characteristics
Table 5.2 Continued Table 5.2 Continued
Percentage of children under three years Socioeconomic Socioeconomic characteristic Stunted Wasted characteristic Stunted Wasted
who are stunted or wa'ited, by socio- Watches TV Number of dead economic characteristics, Mozambique weekly children of mother 1997 No 37.6 7.8 0 35.4 7.5 Socioeconomic Yes 18.4 9.4 1 40.0 8.0 characteristic Stunted Wasted N=2837 p<O.OOl ns 2+ 31.8 9.5 Region N=2837 p<O.05 ns
Niassa 54.6 3.2 Listens to radio Cabo Delgado 56.8 16.2 daily Type of toilet Nampula 38.4 6.8 No 40.6 8.1 None/bush 39.7 7.9 Zamb6zia 36.9 9.2 Yes 25.1 7.5 Flushllatrine 32.0 8.0 Tete 45.7 16.0 N=2837 p<O.OOl ns N=2801 p<O.OOl ns Manica 40.5 5.0 Sofala 38.6 11.0 Reads newspaper Drinking water Inhambane 26.0 1.9 weekly source Gaza 30.0 9.7 No 38.0 7.8 Piped water 26.2 8.8 Maputo 16.0 2.4 Yes 18.6 8.5 Well watel 39.3 8.5 Maputo City 21.5 7.5 N=2837 p<O.OOl ns Surface
N=2837 p<O.OOl p<O.OOl water9 39.8 6.4 Socioeconomic N=2810 p<O.OOl ns
Residence status Urban 27.3 10.4 Low 43.8 9.6 Main floor Rural 38.9 7.1 Medium 34.2 6.1 material
N=2837 p<G.OOl p<O.Ol High 22.7 8.4 Natural6 40.8 7.9 N=2837 p<O.OOl p<O.Ol RUdimentary 42.6 7.5
Mother's Finished7! 20.7 8.6 education Assistance at other
No education 40.8 7.5 delivery N=2774 p<O.OOl ns Primary 34.8 7.7 Doctor 27.7 12.5 Secondary+ 9.1 14.6 Nurse/ Total 35.9 7.9
N=2837 p<O.OOl p<O.05 midwife 29.1 6.7 Trad. birth Note: Level of significance determined
Partner's attend. 46.9 11.1 using Chi-square test
education Other/no one 42.6 8.4 ns = Not significant
No education 38.9 10.3 N=2833 p<O.OOl p<O.05 lIncludes professional, technical,
Primary 35.4 8.5 management
Secondary+ 24.4 4.1 Sex of household 2Includes self-employed and employed N=2232 p<O.OOl p<O.Ol head workers
Male 33.7 7.7 3Includes skilled and un-skilled
Mother's Female 45.5 8.9 4Jncludes professional, technical,
occupation N=2837 p<O.OOl ns management, clerical
Not working 31.9 10.6 sIncludes domestic, services, skilled
ProfessionallJ 16.6 8.1 Child care manual
Servicess Mother 35.7 8.3 'Earth, sand, dung
Manuallabol 23.3 19.5 Other relative 37.6 7.4 'Palm/bamboo, parquet/polished wood,
Agricultural2 42.5 5.7 N=2663 ns ns vinyl/asphalt strips, ceramic tiles,
N=2825 p<O.OOJ p<O.05 cement, carpet
Number of children under 8Includes public and private well
Partner's five in household 9Spring, river!stream, pondllake, dam
occupation Ie 40.6 7.7 Not working 25.7 4.4 2 40.0 5.3 Professionall 26.9 7.1 3 28.0 8.1 Manuallabol 31.8 7.5 4 35.2 7.5 Agricultural2 44.5 6.7 5+ 30.7 13.5
N=2484 p<O.OOl ns N=2824 p<O.OOl p<O.OOJ
Continued Continued
57
5.4 Socioeconomic and Demographic Characteristics of Wasting
Findings for wasting are quite different compared with to those for stunting (Table 5.2). Unlike stunting, the following factors are not significantly associated with wasting: father's occupation, mass media exposure, sex of the household head, type of toilet facility, drinking-water source, and main floor material. Contrary to what is observed for stunting, urban children have a significantly higher wasting prevalence than rural children. As mentioned in Chapter 2, this observation may reflect limited food access as a result of recent declines in wages in urban areas. It may also reflect higher incidences of diseases such as diarrhea and respiratory infections in urban versus rural areas. A~ with stunting, however, Cabo Delgado has the highest prevalence of wasting (16 percent), highlighting this province as a priority for nutrition interventions.
Contrary to what is observed for stunting, increased maternal education is associated with higher levels of wasting. The higher prevalence of diarrhea in urban areas could be a related factor. Likewise, maternal educational, occupational, and socioeconomic status are generally higher in urban than in rural areas (see Appendix B). As this finding is based on ouly 17 out of 118 children with conditions of wasting who have mothers with a secondary education or higher, it should be interpreted carefully.
Although a clear pattern does not exist between wasting and increaSing number of children in the household, children from households with five or more children under the age of five have the highest prevalence of wasting (I4 percent). Children whose deliveries were assisted by physicians were more likely to be wasted (13 percent) than children who were delivered by a traditional birth attendant (TBA) (11 percent), nurse/midwife (7 percent), or by another individual or no one at all (8 percent). A possible explanation for the observation is that high-risk deliveries receive a doctor's care. The high percentage of wasting in TBA-delivered children may be explained by the fact that the poor women are most likely to use TBA services or no birth attendant. These women are more likely to be malnourished themselves, which negatively impacts infant and child well-being.
5.5 Multivariate Regression Analysis
Using results from the bivariate analyses (Tables 5.1 and 5.2), a logistic regression model was created to explain (a) stunting and (b) wasting in Mozambican children under the age of three (See Appendix G for an explanation of logistic regression models). Each model estimates the probability that stunting or wasting will occur according to each background characteristic, while controlling for the effects of all other background characteristics included in the model. Estimates of net relative risk greater than 1.0 indicate that the risk of malnutrition is greater than that for the reference category; estimates less than 1.0 indicate that the risk of malnutrition is less than that for the reference category.
The UNICEF malnutrition framework presented in Chapter 2 (see Figure 2.1) was used to construct the best possible explanatory models for stunting and wasting in Mozambican children. Variables that have statistically significant bivariate associations with stunting or wasting are classified in the following manner according to the UNICEF framework (reference category is noted in italics):
BASIC FACTORS: POLillCAL, ECONOMIC. AND IDEOLOGICAL STRUCTURE
Data not available in the 1997 MDHS
58

UNDERLYING SOCIAL AND ECONOMIC FACTORS, BLOCK A
Residence
• Region (Niassa, Cabo Delgado, NampuJa, ZamMzia, Tete, Manica, Sofala, Inbambane, Gaza, Maputo, Maputo City)
• Urban-rural residence (urban, rural)
Health Services
Data not collected in the 1997 MDHS
Employment
• •
Mother's occupation (not working, professional/service, agricultural/manual) Partner's occupation (not working, professional, manual, agricultural)
Water, Sanitation
• Source of drinking water (piped water, well water, surface water) • Toilet facilities (nonelbush, flushllatrine)
UNDERLYING SOCIAL AND ECONOMIC FACTORS, BLOCK B
Household Assets
• Socioeconomic status (low, medium, high) • Maternal exposure to mass media (no exposure, exposure to one or more sources)
Marital Status
• Sex of household head (male, female)
NOTE: There is not enough variance within the sample with respect to actual marital status (never married, currently married, widowed/divorced/separated), As a result, this variable is excluded from the multivariate analysis,
Education
• •
Mother's education (none, primary, secondary +) Partner's education (none, primary, secondary +)
Food Availability
Data not collected in the 1997 MDHS
UNDERLYING BIOLOGICAL AND BEHAVIOURAL FACTORS, BLOCK A
Intrahousehold Food Distribution
Data not collected in the 1997 MDHS
59
Immunization, Health Care
• BCG vaccination (no, yes) • Measles vaccination (no, yes) • Assistance at delivery (doctor, nurse/midwife, TBA, other/no one) • Place of delivery (home, health facility)
Maternal Fertility, Age, Time, Antenatal Care, Health Status
• Mother's age (15-19,20-24,25-29,30-34,35-49) • Parity (1, 2,3,4,5+) • Maternal body mass index «18.5, 18.5-24.99,25.0+) • Number of antenatal visits (none, 1-3, 4+) • Source of antenatal care (doctor, nurse/midwife, TBA, other/no one) • Preceding birth interval (9-23, 24-35,36+ months) • Birth order (J, 2-3,4-5, 6+) • Ageofchild(0-5,6-9,lO-11,12-15,16-19,20-23,24+months) • Perceived size at birth (average/large, small/very small)
UNDERLYING BIOLOGICAL AND BERA VIOURAL FACTORS. BLOCK B
Feeding Patterns
• Age-appropriate infant/child feeding practices (improper feeding, proper feeding)
Hygiene Behavior
Data not collected in the 1997 MDHS
Child Care
• Child's primary caretaker (respondent, other individual)
lMMEDIATE FACTORS
Inadequate Food Intake
Data not collected in the 1997 MDHS
Disease
• Diarrhea in past two weeks (no, yes)
As indicated above, data are not available for some of the framework's components, namely "Political, Economic, and Ideological Structure," "Health Services," "Food Availability," "Intrahousehold Food Distribution," and "Hygiene Behavior." There are also a select number of variables for which data are available but are excluded, nonetheless. Given the high percentage of currently married women in the sample (88 percent, see Appendix B), the effect of current maternal marital status on childhood malnutrition is not assessed in the multivariate analysis. However, whether the household is one of a cohabitating union is assessed by gender of the head of the household. Because of the low prevalence of multiple births within the sample (2 percent), its effect on childhood malnutrition is also not assessed in the multivariate analysis. Low birth weight and select infant feeding variables, such as reasons for weaning and duration of breastfeeding, are also excluded from the analysis. The large amounts of
60
missing data for these variables result in substantially reduced sample sizes, which reduce the statistical power of the multivariate analyses.
In order to obtain the best possible model for childhood stunting in Mozambique, each level of the framework-"Underlying Social and Economic Factors (Block A)," "Underlying Social and Economic Factors (Block B)," Underlying Biological and Behavioral Factors (Block A)," "Underlying Biological and Behavioral Factors (Block B)," and "Immediate Factors"-was considered separately. That is, separate regression models were constructed for each level of the framework in order to identify the set of variables that best represents each component of the framework. A final model was derived by building a model comprising of variables from each level of the UNICEF conceptual framework.
5.6 Risk Factors for Stunting
In the multivariate analysis, the following factors were statistically significant determinants of stunting in Mozambican children:
• Region of residence
• Maternal occupation • Source of drinking water
• SocioeconOmic status • Exposure to media • Gender of household head • Place of delivery of child
• Parity • Child's age
• Birth order
• Perceived size at birth
• Maternal body mass index • Diarrhea during the preceding two weeks.
Children residing in Niassa, Cabo Delgado, Tete, and Sofala have significantly higher risks of stunting compared with children in Maputo City (Table 5.3). The risk of stunting is highest in Niassa, where children are two and a half times more likely than children in Maputo City to be stunted. Professional maternal occupation has a protective effect on the risk of stunting, with children of professional mothers having almost half the risk of children of agricultural mothers. Children of mothers not working have one-third the risk of being stunted. This reduced risk could be due to the fact that nonworking mothers have more time available to care for the child resulting in improved nutritional status and health, or the mothers could be part of a higher income family and not required to work. A mother who is at home may better protect her child from the effects of infections by means of improved sanitation and nutrition. More iu-depth qualitative studies may further explain the relationship between child-care practices and the nutritional status of children.
Children whose families obtain their drinking water from wells have a 26 percent increased risk of stunting compared with children with access to piped drinking water. Given that stunting is more prevalent in rural areas and that those areas have a higher proportion of well water use than urban areas (see Appendix B), the above finding is expected. Children born at home are 25 percent more likely to be stunted than children born in health facilities. This is probably closely related to socioeconomic status. Poverty elevates the risk of stunting, with children from low or medium socioeconomic backgrounds having between a 35 to 40 percent increased risk relative to children from high socioeconomic backgrounds. Children of mothers who were not exposed to the media were 26 percent more likely to be stunted compared with children whose mothers were exposed to the media. Likewise, children from
61
Table 5.3 Estimated net relative odds of stunting and Table 5.3-Continued wasting
Characteristic Stunted Wasted Estimated net relative odds of stunting and wasting for children under three years, by background characteristics,
Place of delivery Home 1.26b
Mozambique 1997 Health facility 1.00
Characteristic Stunted Wasted
Region Niassa 2.54b 0.54 Cabo Delgado 2.47" 3.46" Nampula 1.47 1.63 Zambezia 1.66 2.29b
Tete 2.20b 2.4Sb
Parity 1 2 3 4 5+
Manica 1.37 1.06 Sofala 1.63b 1.57 Inhambane 0.76 0.46 Gaza 0.95 0.89 Maputo 0.95 0.94
Mother's BMI <18.5 1.85b 2.00b 18.5 to 24 1.55b 1.29 24+ 1.OOa 1.00a
Maputo City LOa' 1.00' Prenatal visits
Mother's occopation Not working 0.67b
Prof/services 0.51 b
0 1-3 4+
Agriculturallmanuallabor 1.00' Birth order
Source of drinking water Piped water 1.00 Well water 1.26b
Surface water 1.12
1 2-3 4-5 6+
Type or toilet Nonelbush Flushllatrine
Child's age (months) 0·5 1.00' 1.OOa
6-9 2.30b 2.12b
10-11 3.84b 3.77b
Socioeconomic status Low 1.38b
Medium 1.35b
High 1.00'
12-15 6.37b 3.49b
16-19 12.27b 3.00b
20-23 16.33b 2.10b
24 + 13.05b 1.16
Media No exposure 1.25b
One or more sources 1.00
Perceived birth size A verage/large 1.00 1.00 SmalUvery small 1.76b 1.43b
Head of household Male 1.00 Female 1.40b
Child care prOvider Mother Other relative
Mother's education No education Primary
Diarrhea (2 weeks) No 1.00 1.00 Yes 1.49b 1.50b
Secondary+ • Total p<0.05
Measles vaccination b p<O.05 compared with reference category
Yes No
Continued
62
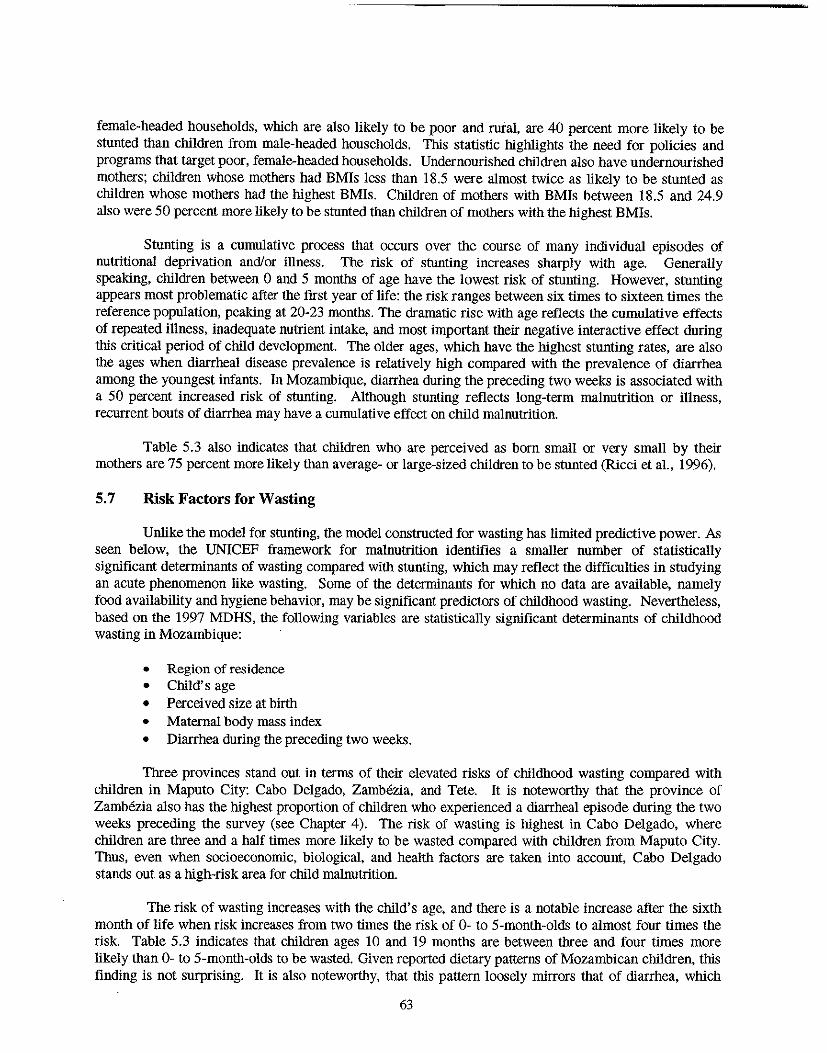
female-headed households, which are also likely to be poor and rural, are 40 percent more likely to be stunted than children from male-headed households. This statistic highlights the need for pOlicies and programs that target poor, female-headed households. Undernourished children also have undernourished mothers; children whose mothers had BMIs less than 18.5 were almost twice as likely to be stunted as children whose mothers had the highest BMIs. Children of mothers with BMIs between 18.5 and 24.9 also were 50 percent more likely to be stunted than children of mothers with the highest BMIs.
Stunting is a cumulative process that occurs over the course of many individual episodes of nutritional deprivation and/or illness. The risk of stunting increases sharply with age. Generally speaking, children between 0 and 5 months of age have the lowest risk of stunting. However, stunting appears most problematic after the fIrst year of life: the risk ranges between six times to sixteen times the reference population, peaking at 20-23 months. The dramatic rise with age reflects the cumulative effects of repeated illness, inadequate nutrient intake, and most important their negative interactive effect during this critical period of child development. The older ages, which have the highest stunting rates, are also the ages when diarrheal disease prevalence is relatively high compared with the prevalence of diarrhea among the youngest infants. In Mozambique, diarrhea during the preceding two weeks is associated with a 50 percent increased risk of stunting. Although stunting reflects long-term malnutrition or illness, recurrent bouts of diarrhea may have a cumulative effect on child malnutrition.
Table 5.3 also indicates that children who are perceived as born small or very small by their mothers are 75 percent more likely than average- or large-sized children to be stunted (Ricci et al., 1996).
5.7 Risk Factors for Wasting
Unlike the model for stunting, the model constructed for wasting has limited predictive power. As seen below, the UNICEF framework for malnutrition identifIes a smaller number of statistically signifIcant determinants of wasting compared with stunting, which may reflect the diffIculties in studying an acute phenomenon like wasting. Some of the determinants for which no data are available, namely food availability and hygiene behavior, may be signifIcant predictors of childhood wasting. Nevertheless, based on the 1997 MDHS, the following variables are statistically signifIcant determinants of childhood wasting in Mozambique:
• Region of residence • Child's age • Perceived size at birth • Maternal body mass index • Diarrhea during the preceding two weeks.
Three provinces stand out in terms of their elevated risks of childhood wasting compared with children in Maputo City: Cabo Delgado, ZamMzia, and Tete. It is noteworthy that the province of ZamMzia also has the highest proportion of children who experienced a diarrheal episode during the two weeks preceding the survey (see Chapter 4). The risk of wasting is highest in Cabo Delgado, where children are three and a half times more likely to be wasted compared with children from Maputo City. Thus, even when socioeconomic, biological, and health factors are taken into account, Cabo Delgado stands out as a high-risk area for child malnutrition.
The risk of wasting increases with the child's age, and there is a notable increase after the sixth month of life when risk increases from two times the risk of 0- to 5-month-olds to almost four times the risk. Table 5.3 indicates that children ages 10 and 19 months are between three and four times more likely than 0- to 5-month-olds to be wasted. Given reported dietary patterns of Mozambican children, this fInding is not surprising. It is also noteworthy, that this pattern loosely mirrors that of diarrhea, which
63
increases rapidly from 2 to 15 months of life (see Chapter 4). Children who experienced diarrhea during the preceding two weeks had over a 50 percent increased risk of being wasted compared with children who did not experience a diarrheal episode. Finally, maternal perception of infant size at birth was significantly linked to wasting, with the small and very small categories being almost 50 percent more likely than infants perceived to be born average- or large-sized to be wasted at the time of the survey.
In general, results from the multivariate analyses on stunting and wasting in Mozambique corroborate findings from similar studies in other contexts (Kikafunda et al., 1998; Islam et a\., 1994; El Sarnani et al., 1988). It is noteworthy, however, that other studies have also relied upon additional measures such as mid-upper arm circumference and underweight to indicate malnutrition. In the literature, wasting is not a commonly used outcome measure, most likely because of difficulties in studying this acute condition. Nevertheless, previous research has identified various SOcioeconomic factors as correlates of child malnutrition and has also stressed the importance of maternal educational and nutritional status in determining the risk of adverse nutritional outcomes in children.
5.8 Summary
Many of the determinants of stunting and wasting are SOCioeconomic in nature, reflecting the role that worsening social and economic conditions have played on the nutritional status of children in Mozambique. A number of biological factors, such as age, birth order, and perceived size at birth, are also significantly related to childhood malnutrition. The importance of these factors is likely to be related to infant feeding practices, which may be more amenable to shorter-term interventions than socioeconomic factors. The limited ability to explain wasting with the available data speaks to the need to collect information that yields more sensitive indicators of determinants of nutritional status.
5.9 Recommendations
Nutritional status of the child is directly related to food security, so interventions in this area must be carried out, taking into account the availability of, access to, and use of food. In this context, some of the contributions of the Ministry of Health to maintaining food and nutrition security are presented below.
Nutrition and Growth Monitoring
• Strengthen growth monitoring and nutrition surveillance in "well-baby" and child immunization services, in an effort to identify children with poor nutritional outcomes in a timely manner.
Diarrhea Management
• In an effort to reduce the degree of nutritional depletion in children, improve diarrhea management in the formal health sector, the community, and household
• Improve access to ORS within the community.
• Educate mothers and other caregivers on appropriate use of ORS, as well as appropriate fluid and solid intake during illness.
Food Availability
• Guarantee the security of land tenure as a means by Which peasants and private farmers are encouraged to improve and diversify production in a sustainable manner.
64
•
•
•
•
•
•
•
•
•
Establish a mechanism to supply the necessary inputs of production and also to purchase the excess production.
Promote the transfer of technology to farmers to increase production and productivity and to reduce post-harvest losses.
Establish a system of rural credit to support commercial activities among small- and medium-scale producers and merchants (taking into consideration the needs of rural women).
Allow the import of essential primary products that the land is not capable of producing to guarantee the coverage of internal needs.
Teach farmers methods of food conservation and prolonged warehousing of seeds.
Continue researChing the possibility of creating a maintenance system for reserve food stocks at the district, provincial, and national levels.
Investigate and promote community methods for self-management of catastrophes and social protection.
Strengthen social assistance services for populations living in vulnerable areas.
Improve rural infrastructure (e.g., roads, water supply, health facilities, schools) by means of laborintensive employment programs targeting food insecure and displaced individuals.
• Establish an open-market information system so that markets function efficiently and so that producers and merchants are encouraged to engage in interseasonal warehousing.
• Provide income-generating activities by means of professional training and credit for starting small businesses in urban areas where the household preference is to buy commercial food rather than to rely on agricultural subsistence.
• In an effort to scale down foreign food aid, use food aid as a part of wage payments for individuals employed in labor-intensive public works programs.
The Well-being o/Women
• Given the negative relationship between low maternal education and adverse child nutritional outcomes, expand educational opportunities for females and employ mechanisms to retain girls in school at least through the secondary level.
• Address the nutritional and health status of girls and women.
• Extend social, health, and economic benefits to female-headed households.
Health Promotion and Disease Prevention
• Promote healthy and age-appropriate feeding and child-rearing behaviors, particularly during the first two years of life.
65
• Expand access to potable water and improve sanitation in order to prevent exposure to patbogens responsible for diarrheal and otber communicable diseases.
Geographic Targeting
• Identify tbe underlying factors of infant and child malnutrition in high-risk provinces such as Cabo Delgado, Niassa, Sofala, and Tete, and plan interventions accordingly.
• Target diarrhea prevention and treatment efforts in ZamMzia, where diarrhea and wasting prevalence are among tbe highest in tbe country.
Research
• Promote research aimed at furtber understanding determinants of maternal undernutrition.
66
CHAPTER 6
NUTRITIONAL STATUS OF WOMEN
The nutritional status of women before conception and during pregnancy is an important indicator of women's general healtb. It is also a major predictor of maternal and infant healtb outcomes. Lesstban-optimal dietary intakes, infectious diseases such as malaria, and tbe large nutritional costs associated with pregnancy and lactation make women in tbe developing world highly susceptible to malnutrition and micronutrient deficiencies such as anemia (WHO, I 992a; WHO, 1991; Liljestrand et aI., 1986). A compromised nutritional state in the motber often results in adverse birth outcomes such as low birtb weight (LBW) and perinatal mortality (Mavalankar et al., 1992; WHO, 1992a; WHO, 1992b; Krasovec, 1991).
It is important to examine tbe extent and correlates of poor maternal nutritional status and subsequently identify ways to improve health and nutritional outcomes of mothers and tbeir children. This chapter presents findings from anthropometric data on Mozambican women who had at least one child under tbe age of three years at tbe time of the interview.
6.1 Background
The nutritional cost of pregnancy is approximately 85,000 (kilocalories). This figure assumes tbat women will store 35,000 kcals of fat for lactation (Hytten, 1980). Recent research suggests tbat the energy cost of pregnancy is closer to 55,000 kcals (IOM, 1990). Nevertheless, tbe U.S. Recommended Dietary Allowances (USRDA) suggests tbat pregnant women should consume an additional 300 kcals per day during tbeir second and third trimesters based on Hytten's estimate. The USRDA also recommends tbat lactating women consume an additional 300 kcal per day. These additional kilocalories must be consumed above a woman's regular food intake to maintain energy balance. Women who were well nourished before pregnancy are usually equipped to cope witb tbe additional demands of lactation; however, lactating women who are poorly nourished require even higher daily caloric intakes tban tbeir well-nourished counterparts (Krasovec, 1991). Unfortunately, this increased daily caloric intake is rarely achieved for women in developing countries. In spite of tbe nutritional demands placed upon lactating women in developing countries, tbe fertility-reducing and child healtb benefits of sustained breastfeeding probably outweigh tbe risk of maternal depletion solely through lactation (Huffman, 1991).
Increased energy requirements during pregnancy are necessary to promote healtby fetal growth and development. Countries witb high levels of malnutrition or micronutrient deficiencies in women also tend to have large proportions of babies born witb low birth weight (Mavalankar et al., 1992; WHO, 1992a; WHO, 1992b; Krasovec, 1991; Labbok, 1991; Kramer, 1987; Liljestrand et aI., 1986). As a result, LBW is often used as an indirect reflection of maternal nutritional status.
In less developed countries, intrauterine growtb retardation (IUGR) is tbe most common cause of LBW. IUGR, which has its roots in poor maternal nutritional status, increases tbe risk of perinatal mortality (deaths between the 22nd week of gestation and tbe first week of life) and mortality through late infancy (WHO, 1996; Berendes, 1993; Kessel et aI., 1985; Villar and Belizan, 1982; Llewellyn-Jones, 1965). Nutritional factors alone account for more tban half of tbe difference between industrialized and less developed countries in rates of IUGR (Krasovec and Anderson, 1991). Otber factors such as malaria, which may have adverse effects on nutrition, also explain much of tbe disparity between poor and richer countries (Kramer, 1987). Unlike in developing countries, preterm birth (PTB) accounts for tbe majority of LBW in industrialized countries. Although many of tbe factors of PTB are unknown, it appears to be more closely linked to maternal behaviors, such as smoking, ratber tban to nutritional factors (Kramer, 1987).
67
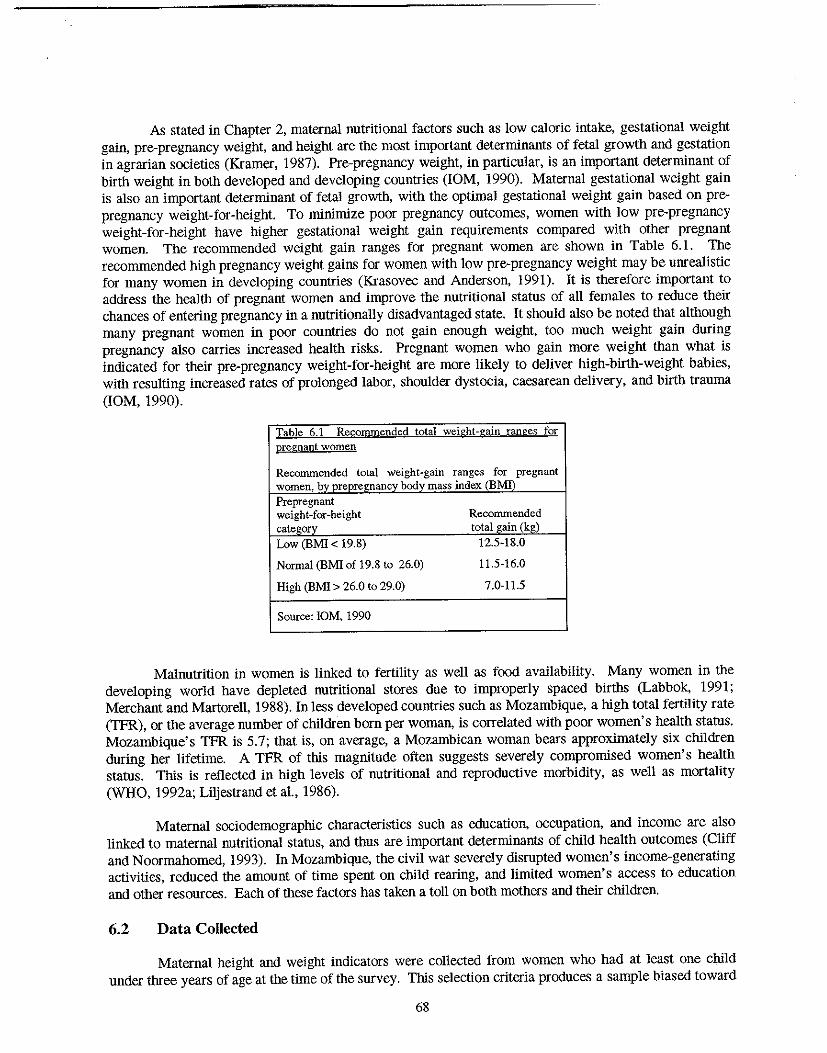
As stated in Chapter 2, maternal nutritional factors such as low caloric intake, gestational weight gain, pre-pregnancy weight, and height are the most important determinants of fetal growth and gestation in agrarian societies (Kramer, 1987). Pre-pregnancy weight, in particular, is an important determinant of birth weight in both developed and developing countries (10M, 1990). Maternal gestational weight gain is also an important determinant of fetal growth, with the optimal gestational weight gain based on prepregnancy weight-for-height. To minimize poor pregnancy outcomes, women with low pre-pregnancy weight-for-height have higher gestational weight gain requirements compared with other pregnant women. The recommended weight gain ranges for pregnant women are shown in Table 6.1. The recommended high pregnancy weight gain.~ for women with low pre-pregnancy weight may be unrealistic for many women in developing countries (Krasovec and Anderson, 1991). It is therefore important to address the health of pregnant women and improve the nutritional status of all females to reduce their chances of entering pregnancy in a nutritionally disadvantaged state. It should also be noted that although many pregnant women in poor countries do not gain enough weight, too much weight gain during pregnancy also carries increased health risks. Pregnant women who gain more weight than what is indicated for their pre-pregnancy weight-for-height are more likely to deliver high-birth-weight babies, with resulting increased rates of prolonged labor, shoulder dystocia, caesarean delivery, and birth trauma (10M, 1990).
Table 6.1 Reconunended total weight-gain ranges for pregnant women
Reconunended total weight-gain ranges for pregnant women. by prepre£nancy body mass index (BMIl' Prepregnant weight-for-height Reconunended category total gain (kg) Low (BMI < 19.8) 12.5-18.0
Normal (BMI of 19.8 to 26.0) 11.5-16.0
High (BMI> 26.0 to 29.0) 7.0-11.5
Source: 10M. 1990
Malnutrition in women is linked to fertility as well as food availability. Many women in the developing world have depleted nutritional stores due to improperly spaced births (Labbok, 1991; Merchant and Martorell, 1988). In less developed countries such as Mozambique, a high total fertility rate (TFR), or the average number of children born per woman, is correlated with poor women's health status. Mozambique's TFR is 5.7; that is, on average, a Mozambican woman bears approximately six children during her lifetime. A TFR of this magnitude often suggests severely compromised women's health status. This is reflected in high levels of nutritional and reproductive morbidity, as well as mortality (WHO, 1992a; Liljestrand et a!., 1986).
Maternal sociodemographic characteristics such as education, occupation, and income are also linked to maternal nutritional status, and thus are important determinants of child health outcomes (Cliff and Noormahomed, 1993). In Mozambique, the civil war severely disrupted women's income-generating activities, reduced the amount of time spent on child rearing, and limited women's access to education and other resources. Each of these factors has taken a toll on both mothers and their children.
6.2 Data Collected
Maternal height and weight indicators were collected from women who had at least one child under three years of age at the time of the survey. This selection criteria produces a sample biased toward
68
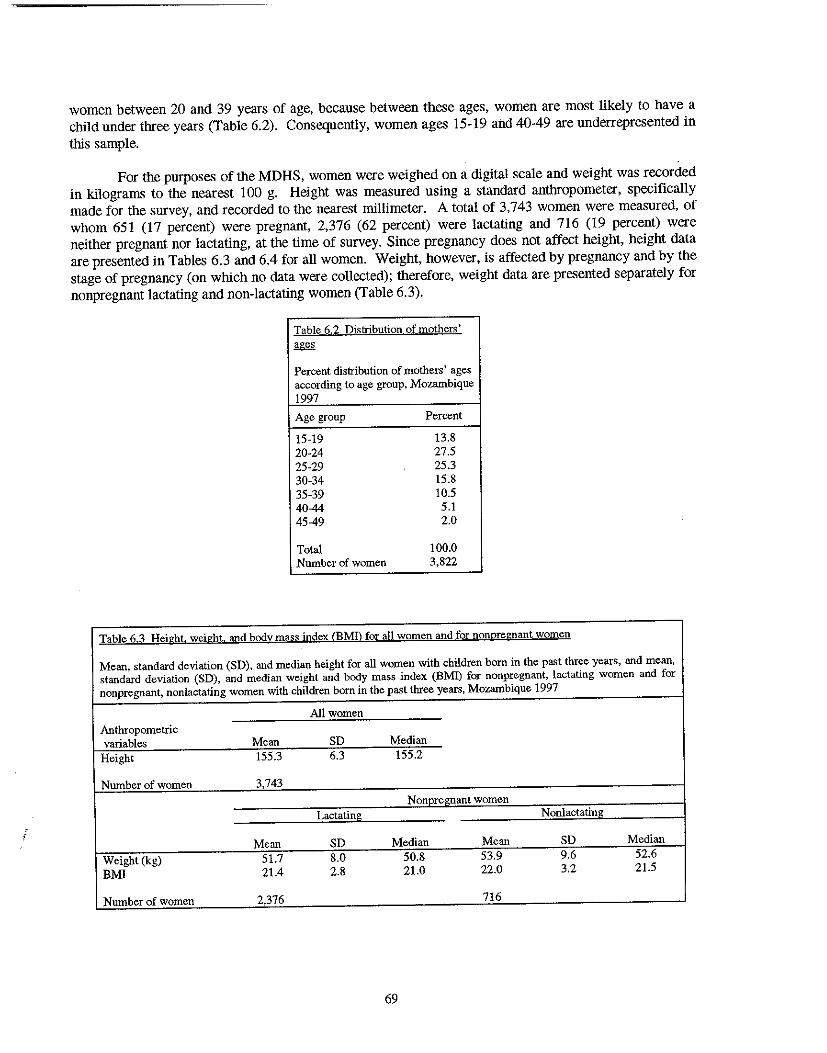
, ,
women between 20 and 39 years of age, because between these ages, women are most likely to have a child under three years (Table 6.2). Consequently, women ages 15-19 and 40-49 are underrepresented in this sample.
For the purposes of the MOHS, women were weighed on a digital scale and weight was recorded in kilograms to the nearest 100 g. Height was measured using a standard anthropometer, specifically made for the survey, and recorded to the nearest millimeter. A total of 3,743 women were measured, of whom 651 (17 percent) were pregnant, 2,376 (62 percent) were lactating and 716 (19 percent) were neither pregnant nor lactating, at the time of survey. Since pregnancy does not affect height, height data are presented in Tables 6.3 and 6.4 for all women. Weight, however, is affected by pregnancy and by the stage of pregnancy (on which no data were collected); therefore, weight data are presented separately for nonpregnant lactating and non-lactating women (Table 6.3).
Table 6.2 Distribution of mothers' ages
Percent distribution of mothers' ages according to age grouP. Mozambique 1997
Age group Percent
15-19 13.8 20-24 27.5 25-29 25.3 30-34 15.8 35-39 10.5 40-44 5.1 45-49 2.0
Total 100.0 Number of women 3,822
Table 6.3 Height. weight. and body mass index (EM!) for all women and for nonpregnant women
Mean. standard deviation (SD), and median height for all women with children born in the past three years, and mean, standard deviation (SD). and median weight and body mass index (BMI) for nonpregnant, lactating women and for nonpregnant, nonlactating women with children born in the past three years, Mozambique 1997
All women Anthropometric variables Mean SD Median
Height 155.3 6.3 155.2
Number of women 3,743
Nonnrel!nant women Lactating Nonlactating
Mean SD Median Mean SD Median Weight (kg) 51.7 8.0 50.8 53.9 9.6 52.6 BMl 21.4 2.8 21.0 22.0 3.2 21.5
Number of women 2,376 716
69
6.3 Indicators of Maternal Nutritional Status
To date, the assessment of nutritional status in non-pregnant women has been based on normative distributions (Krasovec and Anderson, 1991). Commonly used anthropometric references for adult women represent averages of the healthy populations studied and should not necessarily be interpreted as "ideal" or desirable for each individual.
In general, weight reflects current nutritional status and is often used as an indicator of overall health and nutritional status. The appropriate levels of weight at different stages of the life cycle are still unknown, however.
Unlike weight, height reflects past nutritional status as well as the genetic potential of the individual. It is also a measure of the cumulative effect of social and economic status over generations. No international standard exists for adult women's height; however, women whose height falls below 145 cm have been found to be at a greater risk of maternal mortality than taller women. Short stature is correlated with increased risks of miscarriage, LBW, and stillbirth (Krasovec and Anderson, 1991). Short women or women with a small pelvis are at increased risk of pregnancy complications. A young, pregnant woman may still have an immature pelviS, which can lead to cephalopelvic disproportion, a major obstetric complication that often results in prolonged, obstructed labor and may ultimately result in maternal and/or infant death (K1iegman and Behrman, 1987; Liljestrand, 1985; World Federation of Public Health AsSOCiations, 1983).
Body mass index (BM!), also known as the Quetlet Index, is weight in kilograms divided by height in meters squared (kg/m2). Like weight and height, BMI can be used to assess women's nutritional status. It was originally developed to diagnose obesity but James et al. (1988) have advocated its use for assessing chronic energy deficiency (CEO). James, et al. (1988) defines CEO "not as a prolonged continuous loss of body energy, but as a steady state at which a person is in energy balance although at a 'cost' either in terms of risk to health or as an impairment of functions and health."
The key advantage in using BMI to assess maternal nutritional status is that it is a self-contained ratio and does not require reference tables. Oata from well-nourished populations show that a normal range maternal BMI is between 21.5 and 23.1. The upper limit for CEO based upon BMI is 18.5. The International Dietary Energy Consultative Group suggests that BMIs between 17.0 and 18.4 are indicative of Grade I (mild) CEO, those between 16.0 and 17.0 of Grade II CEO, and those below 16 of Grade III (severe) CEO (James et aI., 1988). A BMI of 12 is the absolute lower limit compatible with life. At the other extreme, BMI may also be used to assess overweight. Women who are 20 percent overweight have BMls between 25.8 and 27.3 whereas those who are severely overweight (at least 40 percent overweight) have BMls between 30.1 and 32.3. For the purpose of this analysis, overweight is defined as a BMI of at least 25.0.
Information on maternal weight, height, and BMI are available in the 1997 MOHS; however, the literature on maternal nutrition suggests the use of additional indicators of adult nutritional status. For example, mid-upper arm circumference (MUAC) may be used to screen for underweight in adults or may be used with BMI to identify preferential loss of fat and protein in peripheral tissue stores (Ferro-Luzzi and James, 1996; James et aI., 1994). Various cut-points can be applied to MUAC to reflect gradations in adult underweight. Huffman et al. (1994) advocate for the use of MUAC in determining maternal nutritional status because it requires little training and less costly equipment (tape measures as opposed to scales) relative to more conventional indicators such as weight or height. Other studies have also used weight or height separately, along with biomarkers such as hemoglobin levels, to assess nutritional status (Huffman et aI., 1985).
70
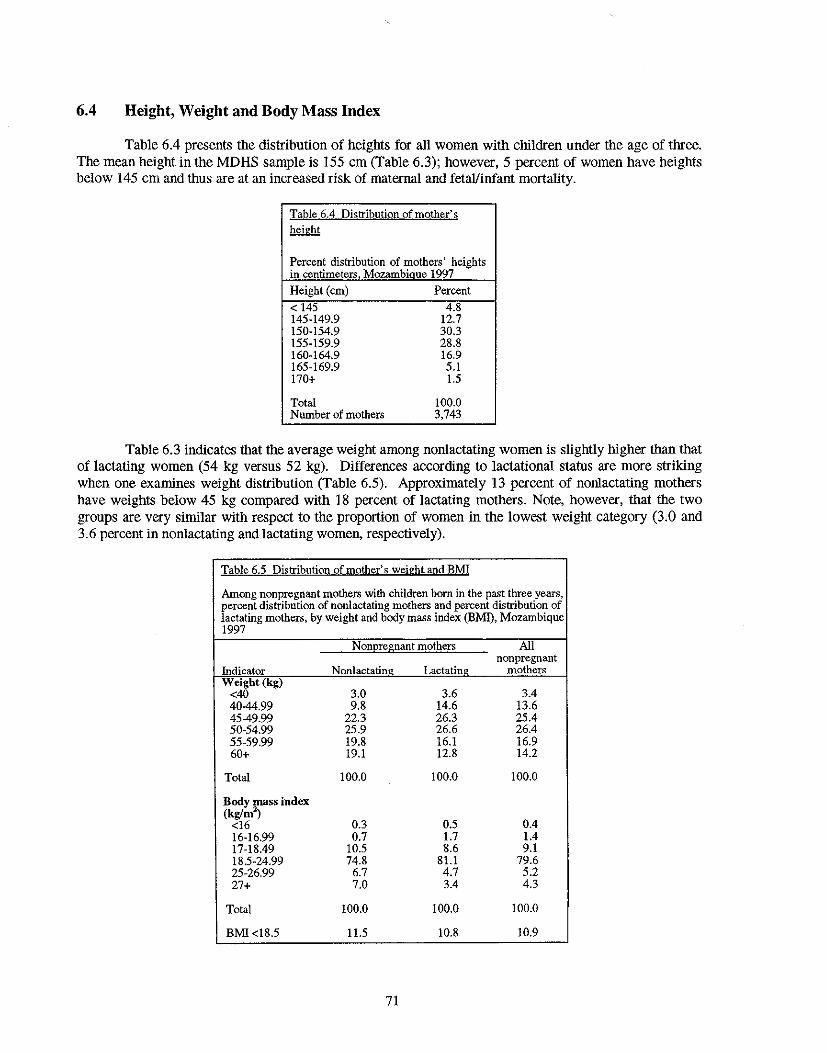
6.4 Height, Weight and Body Mass Index
Table 6.4 presents the distribution of heights for all women with children under the age of three. The mean height in the MDHS sample is 155 cm (Table 6.3); however, 5 percent of women have height~ below 145 cm and thus are at an increased risk of maternal and fetalfinfant mortality.
Table 6.4 Di~tribution of mother's height
Percent distribution of mothers' heights in centimeters Mozambique 1997
Height (em) Percent < 145 4.8 145-149.9 12.7 150-154.9 30.3 155-159.9 28.8 160-164.9 16.9 165-169.9 5.1 170+ 1.5
Total 100.0 Number of mothers 3,743
Table 6.3 indicates that the average weight among nonlactating women is slightly higher than that of lactating women (54 kg versus 52 kg). Differences according to lactational status are more striking when one examines weight distribution (Table 6.5). Approximately 13 percent of nonlactating mothers have weights below 45 kg compared with 18 percent of lactating mothers. Note, however, that the two groups are very similar with respect to the proportion of women in tlIe lowest weight category (3.0 and 3.6 percent in nonlactating and lactating women, respectively).
Table 6.5 Distribution of mother's weight and BMI
Among nonpregnant mothers with children born in the past three years, percent distribution of nonlactating mothers and percent distribution of lactating mothers, by weight and body mass index (BMl), Mozambique 1997
NODE!egnant mothers All nonpregnant
Indicator Nonlactating Lactating mothers Weight (kg)
<40 3.0 3.6 3.4 40-44.99 9.8 14.6 13.6 4549.99 22.3 26.3 25.4 50-54.99 25.9 26.6 26.4 55-59.99 19.8 16.1 16.9 60+ 19.1 12.8 14.2
Total 100.0 100.0 100.0
Body mass index (kg/m1
0.5 0.4 <16 0.3 16-16.99 0.7 1.7 1.4 17-18.49 10.5 8.6 9.1 18.5-24.99 74.8 81.1 79.6 25-26.99 6.7 4.7 5.2 27+ 7.0 3.4 4.3
Total 100.0 100.0 100.0
BMI<18.5 11.5 10.8 10.9
71
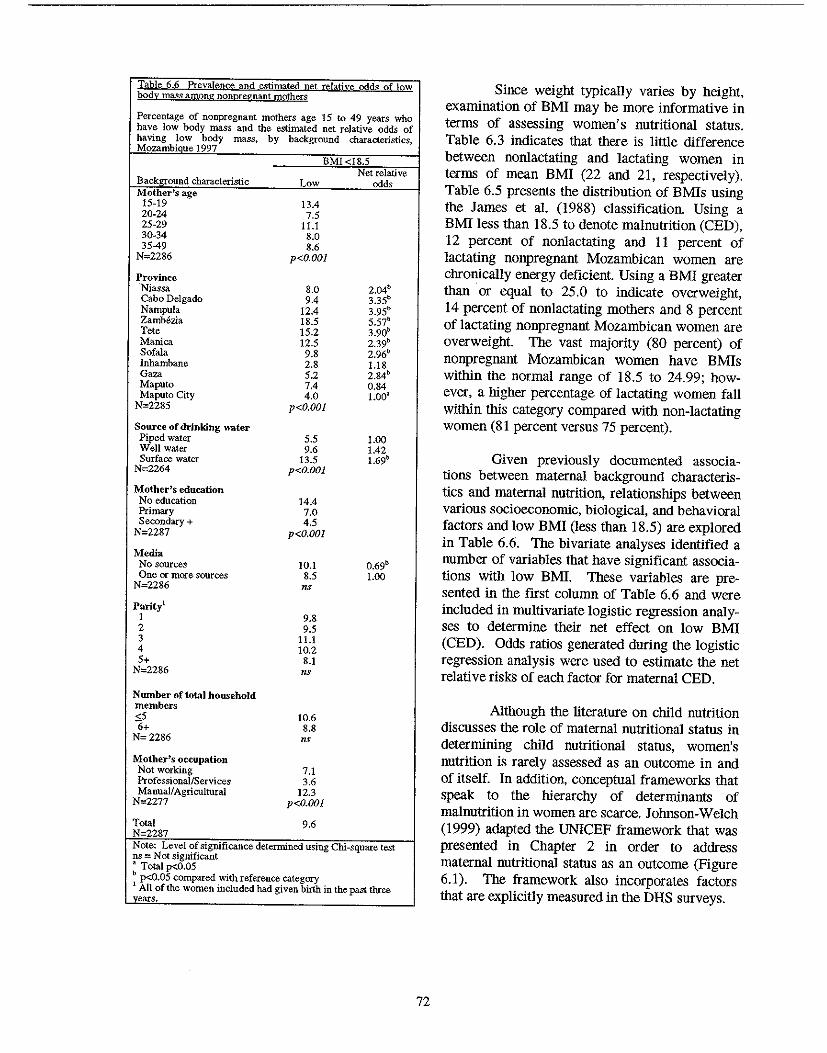
Table 6.6 Prevalence and estimated net relative odds of low body mass among nonpregnant mothers
Percentage of nonpregnant mothers age ] 5 to 49 years who have low body mass and the estimated net relative odds of having low body mass, by background characteristics, Mozambique] 997
Backl2:round characteristic Mother's age
15·19 20·24 25·29 30·34 35-49
N=2286
Province 'Niassa Cabo Delgado Nampula Zambezia Tete Manica Sofala Inhambane Gaza Maputo Maputo City
N=2285
Source of drinking water Piped water Well water Surface water
N=2264
Mother's education No education Primary Secondary +
N=2287
Media No sources One or more sources
N=2286
Parity! I 2 3 4 5+
N=2286
Nwnber oftota) household members <5 6+ N=2286
Mother's occupation Not working ProfessionallServices Manual! Agricultural
N=2277
Total N-2287
BMI <18.5
Low
13.4 7.5
11.1 8.0 8.6
p<O.OOI
8.0 9.4
12.4 18.5 15.2 12.5 9.8 2.8 5.2 7.4 4.0
p<O.OOI
5.5 9.6
13.5 p<O.OOl
14.4 7.0 4.5
p<O.OOI
10.1 8.5 ns
9.8 9.5
11.1 10.2
8.1 ns
10.6 8.8 ns
7.1 3.6
12.3 p<O.OOl
9.6
Net relative odds
2.04b
3.3Sb
3.95' 5.57b
3.90b
2.39b
2.96b
1.18 2.84b 0.84 1.00'
1.00 1.42 1.69b
0.69b
1.00
Note: Level of significance determined using Chi-square test ns = Not significant • Total p<O.OS b p<O.05 compared with reference category 1 All of the women included had given birth in the past three
~ears.
72
Since weight typically varies by height, examination of BMI may be more informative in terms of assessing women's nutritional status. Table 6.3 indicates that there is little difference between nonlactating and lactating women in terms of mean BMI (22 and 21, respectively). Table 6.5 presents the distribution of BMIs using the James et al. (1988) classification. Using a BMI less than 18.5 to denote malnutrition (CED), 12 percent of nonlactating and 11 percent of lactating nonpregnant Mozambican women are chronically energy deficient. Using a BMI greater than or equal to 25.0 to indicate overweight, 14 percent of nonlactating mothers and 8 percent of lactating nonpregnant Mozambican women are overweight. The vast majority (80 percent) of nonpregnant Mozambican women have BMIs within the normal range of 18.5 to 24.99; however, a higher percentage of lactating women fall within this category compared with non-lactating women (81 percent versus 75 percent).
Given previously documented associations between maternal background characteristics and maternal nutrition, relationships between various socioeconomic, biological, and behavioral factors and low BMI (less than 18.5) are explored in Table 6.6. The bivariate analyses identified a number of variables that have significant associations with low BM!. These variables are presented in the first column of Table 6.6 and were included in multivariate logistic regression analyses to determine their net effect on low BMI (CED). Odds ratios generated dnring the logistic regression analysis were used to estimate the net relative risks of each factor for maternal CED.
Although the literature on child nutrition discusses the role of maternal nutritional status in determining child nutritional status, women's nutrition is rarely assessed as an outcome in and of itself. In addition, conceptual frameworks that speak to the hierarchy of determinants of malnutrition in women are scarce. Johnson-Welch (1999) adapted the UNICEF framework that was presented in Chapter 2 in order to address maternal nutritional status as an outcome (Figure 6.1). The framework also incorporates factors that are explicitly measured in the DHS surveys.
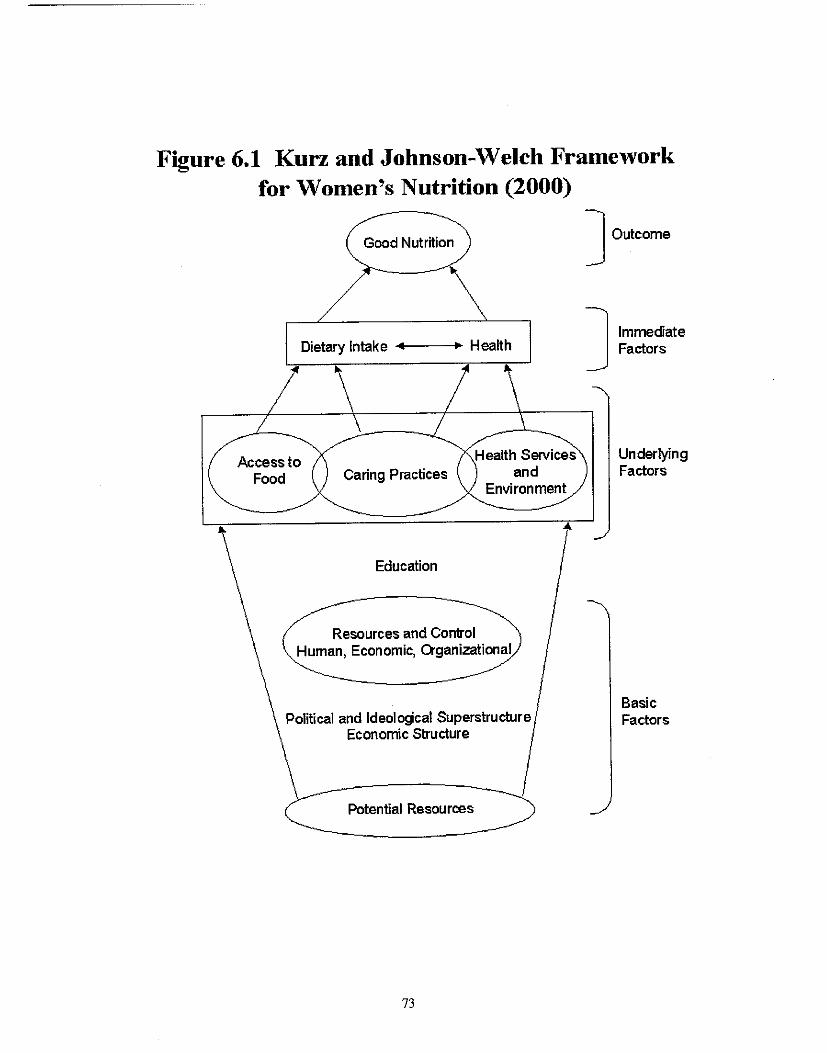
Figure 6.1 Kurz and Johnson-Welch Framework for Women's Nutrition (2000)
Access to Food
Good Nutrition
Dietary Intake .... ---+~ Health
Health Services Caring Practices and
Environment
Education
Resources and Control Human, Economic, Qganizational
Political and Ideologcal Superstructure Economic Structure
C Potential Resources~
73
] Outcome
] Immediate Factors
Underlying Factors
Basic Factors
According to Johnson-Welch, inadequate food intake and disease prevalence and severity are immediate factors of malnutrition. There are, however, a number of intermediate, underlying factors. Generally speaking, residence, household assets, and education act through other factors to affect nutritional status. For example, residence and household income (proxied by household assets) have a direct effect on food security, which in turn impacts food intake. Fertility varies by residence, household assets, and education, which is reflected by both the number (parity) and the spacing (birth interval) of births. A biological link between child feeding behaviors and fertility also exists through lactational amenorrhea. Socioeconomic factors such as residence and household assets are related to accesSibility of health care services, which in turn affects both the prevalence and severity of disease. In addition, through the proviSion of adequate or inadequate water and sanitation services, residence and household assets (a proxy for income) also affect the disease environment.
In the present analysiS, variables with significant bivariate associations with maternal CED (indicated by a BMI less than 18.5) are organized according to the Johnson-Welch framework. For each variable, the reference category is italiCized.
LEVEL ONE (SOCIOECONOMIC CONTEXT)
Residence • Region of residence (Niassa, Cabo Delgado, Nampula, ZamMzia, Tete, Manica, Sofala, Inhambane,
Gaza, Maputo, Maputo City) • Urban-rural residence (urban, rural)
Household Assets • Socioeconomic status (low, medium, high) • Type of toilet facility (nonelbush,jlusMatrine) • Source of drinking water (piped water, well water, surface water) • Maternal exposure to mass media (no exposure, exposure to one or more sources)
NOTE: Household structure (as reflected by the variables monogamous/polygamous union and sex of household head) does not appear in the Johnson-Welch framework but was explored in the present study. Variables depicting household structure did not have significant bivariate associations with maternal CED and were therefore excluded from the multivariate analysis. In addition, the effect of marital status on maternal CED was not assessed because of the lack of variance in the sample with respect to that variable.
Partner's Education • Partner's education (none, primary, secondary+)
Woman's Education • Mother's education (none, primary, secondary+)
NOTE: For both the woman's and her partner's education, the primary-school level was chosen as the reference category rather than the secondary-school level because of the large number of cases in which the people were primary-school-educated.
LEVEL TWO (INTERMEDIATE FACTORS OF MALNUTRmON). BLOCK A
Food Security Data not collected in the 1997 MDHS
74

Fertility • Parity (J, 2, 3, 4, 5+) • Preceding birth interval (9-23, 24-35, 36+ montbs)
Household Size • Total number of household members G; 5, 6+) • Number of household members under five years of age (0, I, 2, 3+)
NOTE: Under "Household size," the highest groups were chosen to be reference categories because those groups (surprisingly) had the lowest rates of maternal undernutrition.
Disease Environment Data not collected in the 1997 MDHS
Mother's Work Status • Mother's occupation (not working, professional/service, agricultural/manual)
LEVEL TWO (INTERMEDIATE FACTORS OF MALNUTRmON). BLOCK B
Food Availability Data not collected in the 1997 MDHS
Child Feeding Behavior • Current lactation status (not breastfeeding, currently breasifeeding)
NOTE: Despite its potential effect on fertility, frequency of breastfeeding is not included in the model because it is only documented for infants under the age of 6 months.
Health Care Services • BCG vaccination (no, yes) • Measles vaccination (no, yes) • Number of antenatal care visits (none, 1-3,4+) • Antenatal care provider (doctor, nurse/midwife, TBA/auxiliary midwife/other, no one) • Assistance at delivery (doctor, nurse/midWife, TBA, other/no one) • Place of deli very (home, health facility)
UNDERLYING BIOLOGICAL FACTORS OF MALNUTRmON
Maternal Age • Mother's age (15-19, 20-24, 25-29, 30-34, 35-49)
NOTE: Maternal age is not included in the Johnson-Welch framework; however, because of its documented relationship to maternal nutrition in the literature, it was included in the present analysis.
LEVEL THREE (IMMEDIATE FACTORS)
Food Intake Data not collected in the 1997 MDHS
Disease Data not collected in the 1997 MDHS
75
6.5 Maternal Chronic Energy Deficiency
Based on the multivariate analysis, the following factors are important determinants of chronic energy deficiency (CED) in Mozambican women: region of residence, drinking water source, mass media exposure, and maternal age (Table 6.6).
When other factors are taken into account, significant regional differences remain. The provinces of Cabo Delgado, Nampula, ZamMzia, and Tete stand out as high-risk areas for maternal malnutrition. In particular, mothers in Cabo Delgado have more than a threefold risk of CED compared with mothers in Maputo City. As discussed in Chapter 2, Cabo Delgado also has the highest prevalence of childhood malnutrition. Similar to child malnutrition, risk of maternal CED also varies by drinking-water source; controlling for the effects of other factors, women who drank surface water were almost twice as likely to be undernourished as women who drank piped water.
Unlike the literature, which cites socioeconomic variables as determinants of maternal nutritional status, the effects of such variables were not significant in the present analysis. It should be noted, however, that the region and drinking-water variables discussed above might partially capture differences in CED according to socioeconomic status. Thus, there appears to be a link between socioeconomic factors and nutritional status; however, the nature of this relationship warrants further investigation.
Unlike Mozambique, studies in Asia have generalJy found increasing levels of maternal malnutrition with increasing maternal age (Ahmed et aI., 1998; Baqui et al., 1994). The link between maternal age and malnutrition is usually attributed to maternal depletion due to high parity. In a study in Bangladesh, Huffman et al. (1985) provided additional insight into the relationship between maternal age and malnutrition, stating that high levels of malnutrition among older women may also reflect greater growth deficits during childhood than in younger women. Despite the purported negative effect of frequent child births on maternal nutritional status, parity was not significantly associated with maternal CED in Mozambique. Findings in Mozambique are similar to those observed in other sub-Saharan countries covered by the DHS. In a cross-national comparison of DHS data on maternal and child nutritional status in sub-Saharan Africa, Rutstein (1996) found that maternal BMI increased with age, but this association was not significant.
It is possible that the observed lack of association between various factors and maternal CED in the present analysis may not be due solely to the nature of their relationships with nutritional status but rather the nature of the data used to explore those relationships. The data available in the 1997 MDHS may not sufficiently explain CED in Mozambican women. Given the cross-sectional nature of the 1997 MDHS and the lack of data on women's past nutritional status (particularly during childhood), it is not possible to address the effect of past malnutrition on current nutritional status within the present study. In addition, it is not possible to address micronutrient deficiencies, such as anemia, without the measurement of key biomarkers, such as hemoglobin levels. There is also a likely link between infection and women's nutritional status, but this relationship cannot be explored using the MDHS. Information on dietary intake and physical activity levelS of mothers, both of which are lacking in the MDHS, may also provide insights with respect to Significant determinants of maternal nutritional status in Mozambique.
6.6 Summary
Malnutrition in Mozambique is not limited solely to children. Women of reproductive age are Victims as well: II percent of nonpregnant Mozambican women are chronically energy deficient, which poses a significant risk to their health and the health of their children. Likewise, 10 percent of nonpregnant Mozambican women are overweight. Factors associated with, although not necessarily causally related to maternal CED are region of residence, drinking-water source, media exposure, and
76

maternal age. It is noteworthy that regions with the highest risk of child malnutrition (for example, Cabo Delgado) also have the highest risks of maternal CEO. This observation underscores the link between the nutritional statns of children and that of their mothers.
6.7 Recommendations
Address the Nutritional Status of Females, Regardless of Age
• Identify nutritional deficiencies in females before they reach reproductive age to ensure that they do not enter motherhood in a nutritionally disadvantaged state.
• Strengthen and expand programs that specifically address pregnant and lactating women's nutritional needs (for example, micronutrient supplementation).
• Explore the possibility of including the vitamin A, iron folate, and iodine supplementation aspects of health services for women.
• Geographically target nutrition interventions (for women and children) in Cabo Delgado, Nampula, ZamMzia, and Tete.
Family Planning
• Increase access to and use of family planning as a means of delaying the timing of first pregnancies, consequently reducing the physical toll of early childbearing on women.
Research
• Support research that derives population·based estimates of the level of anemia and other micronutrient deficiencies, including vitamin A, in girls and women of reproductive age.
• Explore the relationship between physical activity and nutritional status in women.
77
CHAPTER 7
KEY RECOMMENDATIONS
Given the multidimensional nature of the nutrition problem in Mozambique, the recommendations presented in this chapter have been organized into six sections: (I) food security; (2) women's welfare; (3) primary health care; (4) breastfeeding and child nutrition; (5) information, education, and communication; and (6) research.
7.1 Food Security
The main thrust of any effort to improve the nutritional status of women and children in Mozambique will involve improving food security.
Food Availability
• Guarantee the security of land tenure as means by which peasants and private farmers are encouraged to improve and diversify production in a sustainable manner.
• Establish a mechanism to supply the necessary inputs of production and to also purchase the excess production.
• Promote the transfer of technology to farmers to increase production and productivity and to reduce postharvest losses.
• Establish a system of rural credit to support commercial activities among small- and medium-scale producers and merchants (taking into consideration the needs of rural women).
• Allow the import of essential primary products that the land is not capable of producing to guarantee the coverage of internal needs.
• Teach farmers methods of food conservation and prolonged warehousing of seeds.
• Continue researching the possibility of creating a maintenance system for reserve food stocks at the district, provincial, and national levels.
• Investigate and promote community methods for self-management of catastrophes and social protection.
• Strengthen social assistance services for populations living in vulnerable areas.
Economic Access to Available Food
• Improve rural infrastructure (e.g., roads, water supply, health facilities, schools) by means of laborintensive employment programs targeting food insecure and displaced individuals.
• Encourage producers and merchants to engage in interseasonal warehousing.
PREVIOUS PAGE BLANK 79

• Provide income-generating activities by means of professional training and credit for starting small businesses in urban areas where the household preference is to buy commercial food rather than to rely on agricultural subsistence.
• In an effort to scale down foreign food aid, use food aid as a part of wage payments for individuals employed in labor-intensive public works programs.
7.2 Women's Welfare
Improvements in nutrition will entail addressing all aspects of Mozambican women's well-being: social, economic, and health-related.
• Develop income-generating activities for rural women, in particular, female heads of households.
• Increase women's access to credit and other financial services.
• Improve educational opportunities for females.
• Increase women's self-provisioning capacity by improving access to technology and other resources.
• Increase availability and accessibility of family planning methods.
• Within the National Program for Women and Children, incorporate a subdivision that addresses women's nutritional and health status beyond the purview of motherhood and reproduction.
• Establish micronutrient supplementation programs (e.g., iron, folate, vitamin A) that target pregnant and lactating women.
7.3 Primary Health Care
Priority should be given to integrating health, nutrition, and family planning services as opposed to establishing vertical programs.
• Establish integrated health and nutrition intervention projects with family planning, nutrition and primary-health-care components.
• To address the limited access to care, establish small rural outposts that focus on primary and secondary prevention of malnutrition and illnesses.
• Programs to prevent or reduce the incidence of malaria and diarrhea.
• Recruit and train women in the community to be rural health-outreach workers.
• Combine growth-monitoring with immnnization services.
• Integrated Management of Childhood lilness (IMCI).
80 . ,.-'
7.4 Breastfeeding and Child Nutrition
In improving infant nutritional status, address both supply-side (health facility/provider) and the demandside (community, culture)factors.
• Develop a national policy concerning HIY and breastfeeding.
• Review and update the actual guidelines related to the treatment of moderate and severely malnourished children based on WHO's recommendations.
• Train medical professionals on the importance of early and sustained breastfeeding and ageappropriate feeding practices (e.g., the introduction of complementary foods, appropriate weaning age).
• Establish and maintain compliance of all hospitals with standards of the International Baby-Friendly Hospital Initiative.
• Promote the lactational amenorrhea method (LAM) which has nutritional benefits for the infant and birth-spacinglfertility-reducing benefits for the mother.
• Encourage breastfeeding of infants, even among malnourished women.
• Establish special nutrition and primary-health-care programs targeting the estimated 200,000 Mozambican children who are orphaned or have been separated from their families.
7.5 Information, Education and Communication
• Use mass media to promote ideal nutritional standards and behaviors that will enhance the health of women and children.
7.6 Research
Conduct both quantitative and qualitative studies to measure certain phenomena and health outcomes and to explain why those phenomena exist.
• Support qualitative research studies that investigate factors related to care-seeking and community perceptions regarding infant feeding, HIY, the acceptance of local micronutrient-rich foods, adolescent health, and maternal nutrition.
81
REFERENCES
Ahmed, S.M., A Adams, AM.R. Chowdhury, and A Bhuiya. 1998. Chronic energy deficiency in women from rural Bangladesh: Some socioeconomic determinants. Journal of Biosocial Science 30:349-358.
Baqui, AH., S.E. Arifeen, S. Amin, and R.E. Black. 1994. Levels and correlates of maternal nutritional status in urban Bangladesh. European Journal of Clinical Nutrition 48:349-357.
Berendes, H.W. 1993. Maternal determinants of perinatal mortality and of intrauterine growth retardation and preterm delivery. In Birth risks, ed. J.D. Baurn. New York: Raven Press, Ltd. 47-56.
Branca, F., O. Pastore, T. Demissie, and A Ferro-Luzzi. 1993. The nutritional impact of seasonality in children and adults of rural Ethiopia. European Journal of Clinical Nutrition 47:840-850.
Briend, A 1990. Is diarrhea a major factor of malnutrition among the under-fives in developing countries? A review of available evidence. European Journal of Clinical Nutrition 44:611-628.
Brown, K.H., R.E. Black, et al. 1989. Infant feeding practices and their relationship with diarrheal and other diseases in Huascar (Lima), Peru. Pediatrics 83(1):31-40.
Brown, K.H., R.Y. Stallings, H. Creed de Kanashiro, O. Lopez de Romana, and R.E. Black. 1990. Effects of common illnesses on infants' energy intakes from breast milk and other foods during longitudinal community-based studies in Huascar (Lima), Peru. American Journal of Clinical Nutrition 52: 1 005-1013.
Brozek, 1, and B. Schurch. 1984. Malnutrition and behavior: Critical assessment of key issues. Nestle Foundation Publication Series Vol. 4. Lausanne, Switzerland: Nestle Foundation.
Caulfield, L.E., M.E. Bentley, and S. Ahmed. 1996. Is prolonged breastfeeding associated with malnutrition? Evidence from nineteen demographic and health surveys. International Journal of Epidemiology 25(4):693-703.
Center for International Health Information (CIHI). 1995. Mozambique: Country health profile 1995. CIHI Country Health PrOfile Series. Arlington: Center for International Health Information.
Central Statistical Office (CSO) [Zimbabwe] and Macro International Inc. (MI). 1995. Zimbabwe Demographic and Health Survey 1994. Calverton, Maryland (USA): CSO and MI.
Central Statistcal Office (CSO) [Zambia] and Ministry of Health (MOH) and Macro International Inc. (MI). 1997. Zambia Demographic and Health Survey 1996. Calverton, Maryland (USA): CSO and MI.
Centro de Informatica da Universidade Eduardo Mondlane (CIUEM). 1999. Mozambique, "Basic Facts." Internet Website (www.mozambique.mz).
Clemens, J.D. and B.F. Stanton. 1987. An educational intervention for altering water-sanitation behaviors to reduce childhood diarrhea in urban Bangladesh. 1. Application of the case-control method for development of an intervention. American Journal of Epidemiology 125(2):284-291.
Cliff, J., and AR. Noormahomed. 1993. The impact of war on children's health in Mozambique. Social Science and Medicine 36(7):843-848.
PREVIOUS PA~E BLANK 83
Cliff J., F. Cutts, and R. Waldman. 1990. Using surveys in Mozambique for evaluation of diarrheal disease control. Health Policy and Planning 5(3):219-225.
Cliff, J.L., and AR. Noormahomed. 1988. The impact of South African destabilization on maternal and child health in Mozambique. Journal of Tropical Pediatrics 34:329-330.
Cohen, R.J., KH. Brown, J. Cnahuait, L.L. Rivera, and KG. Dewey. 1994. Effect of age of introduction of complementary foods on infant breast milk intake, total energy intake, and growth: A randomized intervention study in Honduras. Lancet 334(8918):288-293.
Cutts, F.T., D. Dos Santos, A Novoa, P. David, G. Macassa, and AC. Soares. 1996. Child and maternal mortality during a period of conflict in Beira City, Mozambique. International Journal of Epidemiology 25(2):349-356.
Cutts, F.T., O. Monteiro, P. Tabard, and J. Cliff. 1994. Measles control in Maputo, Mozambique, using a single dose of Schwarz vaccine at age 9 months. Bulletin of the World Health Organization 72(2):227-231.
Cutts, F., J. Cliff, R. Reiss, and J. Stuckey. 1988. Evaluating the management of diarrhea in health centers in Mozambique. Journal of Tropical Medicine and Hygiene 91 :61-66.
Daga, S.R., Daga, AS., Dighole, R.V., and R.P. Pati!o 1993. Anganwadi worker's participation in rural newborn care. Indian Journal of Pediatrics 60:627-630.
de Carvalho, M., S. Robertson, A Friedman, and M. Klaus. 1983. Effect of frequent breast-feeding on early milk production and infant weight gain. Pediatrics 72(3):307-311.
Dickin, K.L., KH. Brown, D. Fagbule, M. Adedoyin, J. Gittlesohn, S.A. Esrey, and G.A ani. 1990. Effect of diarrhea on dietary intake by infants and young children in rural villages of Kwara State, Nigeria. European Journal of Clinical Nutrition 44(4):307-317.
El Samalli, E.F.z., W.C. Willett, and J.H. Ware. 1988. Association of malnutrition and diarrhea in children aged under five years. American Journal of Epidemiology 128(1):93-105.
Esrey, S.A, R.G. Feachem, and J.M. Hughes. 1985. Interventions for the control of diarrheal diseases among young children: Improving water supplies and excreta disposal facilities. Bulletin of the World Health Organization 63(4):757-772.
Fawzi, W.W., M.G. Herrera, P. Nestel, A El Amin, and K.A Mohamed. 1998. A longitudinal study of prolonged breastfeeding in relation to child undernutrition. International Epidemiological Association 27:255-260.
Ferro-Luzzi, A, and W.P.T. James. 1996. Adult malnutrition: Simple assessment techniques for use in emergencies. British Journal of Nutrition 75:3-10.
Food and Agricultural Organization of the United Nations (FAa). 1987. The People's Republic of Mozambique: A report of the FAa mission. Evaluation of external aid requirements in food and of agricultural rehabilitation needs for selected provinces. Office for Special Relief Operations Report No. 031871E. Rome: FAa.
Galli, A 2000. Estudo sobre habitos e Praticas Alimentares na Zona Sul de Movambique (unpublished).
84
Government of Mozambique, Eduaro Monda/ane University, and the International Food Policy Research Institute (IFPRD. 1998. Understanding poverty and well-being in Mozambique: The first national assessment (1996-97). Mozambique.
Habicht, J.P., R. Martorell, C. Yarbrough, R.M. Malina, and R.E. Klein. 1974. Height and weight standards for preschool childten. How relevant are ethnic differences in growth potential? Lancet 1(858):611-614.
Haggerty, P.A., K. Muladi, B.R. Kirkwood, A. Ashworth, and M.N. Mannu'Ebo. 1994a. Communitybased hygiene education to reduce diarrheal disease in rural Zaire: Impact of the intervention on diarrheal morbidity. International Journal 0/ Epidemiology 23(5): 1 050-1 059.
Haggerty, P.A., M.N. Mannu'Ebo, A. Ashwortb, K. Muladi and B.R. Kirkwood. 1994b. Methodological approaches in a baseline study of diarrheal morbidity in weaning-age childten in rural Zaire. International Journal 0/ Epidemiology 23(5):1040-1049.
Hosmer, D. and S. Lemeshow. 1989. Applied logistic regression. New York: John Wiley & Sons. 86.
Hoyle, B., M. Yunus, and L.C. Chen 1980. Breast-feeding and food intake among childten with acute diarrheal disease. American Journal o/Clinical Nutrition 33(11):2365-2371.
Huffman, S.L. 1991. Maternal malnutrition and breastfeeding: Is there really a choice for policy makers? Journal o/Tropical Pediatrics (suppl) 37:19-22.
Huffman, S.L. and C. Combest. 1990. Role of breast-feeding in the prevention and treatment of diarrhea. Journal 0/ Diarrheal Disease Research 8(3):68-81.
Huffman, S.L., M. Wolff, and S. Lowell. 1985. Nutrition and fertility in Bangladesh: Nutritional status of nonpregnant women. American Journal 0/ Clinical Nutrition 42:725-738.
Hytten, F.E. 1980. Nutrition. In Clinical physiology in obstetrics, ed. F.E. Hytten and G. Chamberlain. Oxford, England: Blackwell Scientific Publications. 163-192.
Institute of Medicine (10M). 1990. Nutrition during pregnancy. Washington, D.C.: National Academy Press.
Institute of Medicine (IOM), Committee to Study the Prevention of Low Birtbweight. 1985. Preventing Law Birthweight. Washington, D.C.: National Academy Press.
International Monetary Fund (IMP). 1996. Republic of Mozambique-Recent developments. IMR Staff Country Report No. 96/142. Washington, D.C: IMP.
Islam, M.A., MM. Ralunan, and D. Mahalanabis. 1994. Maternal and socioeconomic factors and the risk of severe malnutrition in a child: a case-control study. European Journal 0/ Clinical Nutrition 48:416-424.
James, W.P.T., G.C.N. Mascie-Taylor, N.G. Norgan, B.R. Bistrian, P.S. Shetty, and A. Ferro-Luzzi. 1994. The value of arm circumference measurements in assessing chronic energy deficiency in Third World adults. European Journal 0/ Clinical Nutrition 48:883-894.
James, W.P.T., A. Ferro-Luzzi, and J.C. Waterlow. 1988. Definition of chronic energy deficiency in adults: Report of a working party of the International Dietary Energy Consultative Group. European Journal o/Clinical Nutrition 42:969-981.
85
Jamison, D.T. 1993. Disease control priorities in developing countries: An overview. In Disease Control Priorities in Developing Countries, ed. D.T. Jamison, W.H. Mosley, AR. Measham, and J.L. Bobadilla. New York: Oxford University Press.
Johnson-Welch, C. 1999. Focusing on women works: Research on improving micronutrient status through food-based interventions. International Center for Research on Women (ICRW) and Opportunities for Micronutrient Interventions (OMNI).
Jonsson, U. 1995. Ethics and child nutrition. Food and Nutrition Bulletin 16(4):293-298.
Kessel, E., S. Sastrawinata, and S.D. Mumford. 1985. Correlates of fetal growth and survival. Acta Paediatr Scand (suppl) 319:120-127.
Kliegman, R.M. and R.E. Behrman. 1987. High risk pregnancies. In Nelson textbook of pediatrics, 13th
edition, ed. R.E. Behrman and v.c. Vaughan. Philadelphia: W.B. Saunders. 365-367.
Kramer, S. 1987. Intrauterine growth and gestational duration determinants. Pediatrics 80(4):502-511.
Krasovec, K 1991. The implications of poor maternal nutrition status during pregnancy for future lactational performance. Journal of Tropical Pediatrics supp!. 37:3-10.
Krasovec, K and M. Anderson. 1991. Maternal nutrition and pregnancy outcomes: Antbropometric assessment. PARO SCientific Publications No. 259. Washington, D.C.: Pan American Health Organization.
Labbok, M.H. 1991. Breastfeeding and borderline malnutrition in women. Journal of Tropical Pediatrics supp!. 37:23-24.
Lechtig, A, and A Srivastava 1988. A strategy to improve weaning practices in Mozambique. In Improving young child feeding in eastern and southern Africa. Household-level food technology, ed.s. D. Alnwick, S. Moses, and O.G. Schmidt. Ottawa. 113-127.
Liljestrand, J., S. Bergstrom, and G. Birgegard. 1986. Anaemia of pregnancy in Mozambique. Transactions of the Royal Society of Tropical Medicine and Hygiene 80:249-255.
Llewelyn-Jones, D. 1965. Severe anaemia in pregnancy (as seen in Kuala Lumpur, Malaysia). The Australian and New Zealand Journal qf Obstetrics and Gynaecology 5: 191-197.
Lutter, C.K, J.O. Mora, J.P. Habicht, KM. Rasmussen, D.S. Robson, S.G. Sellers, C. Super, and M.G. Herrera. 1989. Nutritional supplementation: Effects on child stunting because of diarrhea. American Journal of Clinical Nutrition 50(1):1-8.
Martorell, R., J.P. Habicht., C. Yarbrough, A Lechtig, and R.E. Klein. 1976. Underreporting in fortnightly recall morbidity surveys. Journal of Tropical Pediatric Environmental Child Health 22(3):129-134.
Mavalankar, D.V., R.H. Gray, and C.R. Trived. 1992. Risk factors for preterm and term low birthweight in Ahmedabad, India. International Journal of Epidemiology 21(2):263-272.
Merchant, KM., R. Martorell, and J.D. Haas. 1991. Nutritional adjustments in response to reproductive stresses within Guatemalan women. Journal of Tropical Pediatrics (suppl) 37:11-22.
86
Merchant, K and R. Martorell. 1988. Frequent reproductive cycling: Does it lead to nutritional depletion of mothers? Progress in Food and Nutrition Science 12:339-369.
Ministerio de Salide, Ministerio do Plano e Finangas. 1999. Perfis de Seguranra Alimentar e Nutrictio. Maputo, Mozambique.
Ministerio de Saude, Reparticao de Nutricao. 1997. Boletim de Nutrictio. Maputo, Mozambique.
Ministry of Co-operation and UNICEF. 1990. The situation of children and women in Mozambique. Maputo, Mozambique: UNICEF.
Ministry of Health and Eduardo Mondlane University Faculty of Medicine. 1988. Evaluating the management of diarrhea in health centers in Mozambique. Journal of Tropical Medicine and Hygiene 91:61-66.
Mock, N.B., T.A Sellers, AA Abdoh, and R.R. Franklin. 1993. Socioeconomic, environmental, demographic and behavioral factors associated with occurrence of diarrhea in young children in the Republic of Congo. Social Science and Medicine 36(6):807-816.
Molbak, K, H. Jensen, L. Ingholt, and P. Aaby. 1997. Risk factors for diarrheal disease incidence in early childhood: A community cohort study from Guinea-Bissau. American Journal of Epidemiology 146(3):273-282.
Molla, A, AM. Molla, S.A. Sarker, M. Khatun. 1983. Whole-gut transit time and its relationship to absorption of macronutrients during diarrhea and after recovery. Scandinavian Journal Of Gastroenterology 18:537-543.
Moore, M., and M. Favin. 1990. Behavioral determinants of maternal health care choices in developing countries. MotherCare Working Paper No.2. Arlington, Virginia: MotherCare/JSI.
Mosley, W.H. and L.C. Chen. 1984. Child survival strategies for research. Population and Development Review, A Supplement to Volume 10. New York: The Population Council.
National Statistical Office (NSO) [Malawi] and Macro International Inc. (MI). 1994. Malawi Demographic and Health Survey 1992. Calverton, Maryland (USA): NSO and MI.
Olinto, M.T.A., C.G. Victora, F.C. Barros, and D.P. Gigante. 1995. Twenty-four-hour recall overestimates the dietary intake of malnourished children. American Journal of Nutrition 125:880-884.
Pelletier, D.L., E.A Frongillo, and J.P. Habicht. 1993. Epidemiologic evidence for a potentiating effect of malnutrition on child mortality. American Journal of Public Health 83:1130-1133.
Perez-Escamilla, R., S. Segura-Millan, J. Canahuati, and H. Allen. 1996. Prelacteal feeds are negatively associated with breastfeeding outcomes in Honduras. Journal of Nutrition 126(11):2765-73.
Piwoz, E. G., H. Creed de Kanashiro, G. Lopez de Romafia, R.E. Black, and KB. Brown. 1994. Potential for misdassification of infants' usual feeding practices using 24-hour dietary assessment methods. Journal Of Nutrition 125: 57-65.
Rahaman, M.M. and M.A Wahed. 1983. Direct nutrient loss and diarrhea. In Diarrhea and Malnutrition: Interactions, Mechanisms, and Interventions, ed. L.C. Chen and N.S. Scrimshaw. New York: Plenum Press. 155-160.
87
Republica de Moyambique. 1998. Estrategia de Seguran{'a Alimentar e Nutri{,GO. Maputo, Mozambique.
Ricci, J.A and S. Becker. June 1996. Risk factors for wasting and stunting among children in Metro Cebu, Philippines. American Journal of Clinical Nutrition 63(6):966-976.
Righard, L., and M.O. Alade. 1990. Effect of delivery room routines on success of first breast-feed. Lancet 336(8723):1105-1107.
Rosenberg, I.H., N.W. Solomons, and R.E. Schneider. 1977. Malabsorption association with diarrhea and intestinal infections. American Journal of Clinical Nutrition 30:1248-1253.
Rutstein, S. 1996. Factors influencing the nutritional status of mothers and children in sub-Saharan Africa: An analytical report based on the Demographic and Health Surveys. Calverton: Macro International Inc.
Sachdev, H.P.S., J. Krishna, R.K. Puri, L. Satyanarayana, and S. Kumar. 1991. Water supplementation in exclusively breastfed infants during summer in the tropiCS. Lancet 337(8747):929-933.
Scrimshaw, N.S., C.B. Taylor, and lE. Gordon. 1968. Interaction of nutrition and infection. World Health Organization Monograph Series No. 57. Geneva: World Health Organization.
United Nations Children's Fund (UNICEF). 1998. The state of the world's children 1999. New York: UNICEF.
UNICEF and World Health Organization (WHO). 1992. Low birth weight: A tabulation of available information. Geneva: WHO.
UNICEF. 1990. Strategy for improved nutrition of children and women in developing countries. New York: UNICEF.
Victora, C.G., S.R. Huttly, S.C. Fuchs, and M.T.A Olinto. 1997. The role of conceptual frameworks in epidemiological analysis: A hierarchical approach International Journal of Epidemiology 26(1):224-227.
Victora, e.G., J.P. Vaughan, e. Lombardi, S.M. Fuchs, L.P. Gigante, P.G. Smith, L.C. Nobre, AM. Teixeira, L.B. Moreira, and F.C. Barros. 1987. Evidence for protection by breastfeeding against infant deaths from infectious diseases in Brazil. Lancet 2(8554):319-321.
Villar, land J.M. Belizan. 1982. The relative contribution of prematurity and fetal growth retardation to low birth weight in developing and developed countries. American Journal of Obstetrics and Gynecology 143:793.
World Bank. 1997. War-to-peace transition in Mozambique: The provincial reintegration support program. Findings, Africa Region 90.
World Bank. 1993. World development report 1993. New York: Oxford University Press.
World Federation of Public Health Associations (WFPHA). 1983. Maternal nutrition: Information for action-resource guide. Prepared by UNICEF.
World Health Organization (WHO). 1979. A guideline for the measurement of nutritional impact of supplementary feeding programs aimed at vulnerable groups. Geneva: WHO.
88
World Health Organization (WHO) and UNICEF. 1990. Meeting on breastfeeding in the 1990s: A Global Initiative. Innocenti Declaration on the Protection, Promotion, and Support of Breastfeeding. Florence, Italy, 1 August, 1990. UNICEF, New York.
World Health Organization (WHO). 1991. Maternal tmd Perinatal Infections: Report of a WHO Consultation. Geneva: WHO.
World Health Organization (WHO). 1992a. The prevalence of anemia in women: A tabulation of available information. Geneva: WHO.
World Health Organization (WHO). 1992b. Low birth weight: A tabulation of available information. Geneva: WHO.
World Health Organization (World Health Assembly). 1994. Infant and child nutrition. Resolution 47.5 of the 47th World Health Assembly, Geneva, 9 May 1994. Geneva: World Health Organization.
World Health Organization (WHO). 1996. Perinatal mortality: A listing of available information. Geneva: WHO.
World Health Organization (WHO). 1996b. WHO Global Data Btmk on Breast-Feeding, Breast-feeding: The best start in life. Geneva: Nutrition Unit, WHO.
World Health Organization (WHO). 2000. Effect of breastfeeding on infant and child mortality due to infectious diseases in less developed countries: A pooled analysis. Loncet 355:451-455.
89
APPENDIX A
SAMPLE DESIGN
PREVIOUS PAGE BLANK ~ q I ~
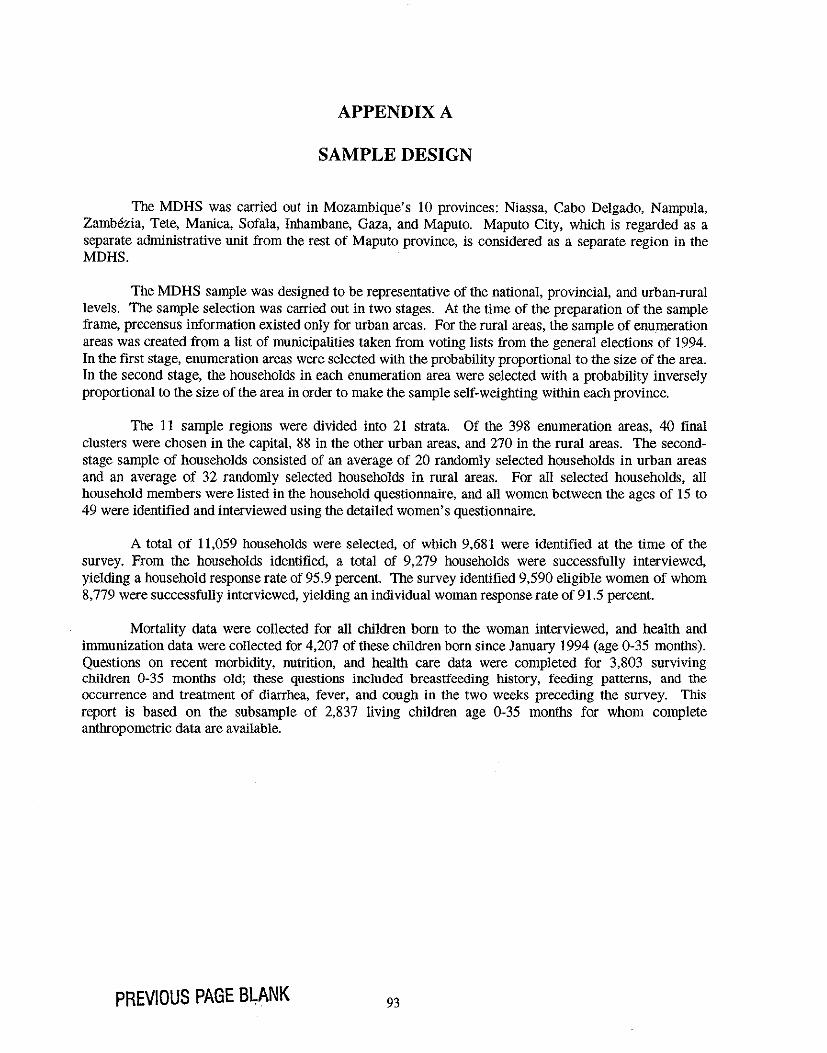
APPENDIX A
SAMPLE DESIGN
The MDHS was carried out in Mozambique's 10 provinces: Niassa, Cabo Delgado, Nampula, Zambezia, Tete, Manica, Sofala, Inhambane,' Gaza, and Maputo. Maputo City, which is regarded as a separate administrative unit from the rest of Maputo province, is considered as a separate region in the MDHS.
The MDHS sample was designed to be representative of the national, provincial, and urban-rural levels. The sample selection was carried out in two stages. At the time of the preparation of the sample frame, precensus information existed only for urban areas. For the rural areas, the sample of enumeration areas was created from a list of municipalities taken from voting lists from the general elections of 1994. In the first stage, enumeration areas were selected with the probability proportional to the size of the area. In the second stage, the households in each enumeration area were selected with a probability inversely proportional to the size of the area in order to make the sample self-weighting within each province.
The I I sample regiOns were divided into 21 strata. Of the 398 enumeration areas, 40 final clusters were chosen in the capital, 88 in the other urban areas, and 270 in the rural areas. The secondstage sample of households consisted of an average of 20 randomly selected households in urban areas and an average of 32 randomly selected households in rural areas. For all selected households, all household members were listed in the household questionnaire, and all women between the ages of 15 to 49 were identified and interviewed using the detailed women's questionnaire.
A total of 11,059 households were selected, of which 9,681 were identified at the time of the survey. From the households identified, a total of 9,279 households were successfully interviewed, yielding a household response rate of 95.9 percent. The survey identified 9,590 eligible women of whom 8,779 were successfully interviewed, yielding an individual woman response rate of 91.5 percent.
Mortality data were collected for all children born to the woman interviewed, and health and immunization data were collected for 4,207 of these children born since January 1994 (age 0-35 months). Questions on recent morbidity, nutrition, and health care data were completed for 3,803 surviving children 0-35 months old; these questions included breastfeeding history, feeding patterns, and the occurrence and treatment of diarrhea, fever, and cough in the two weeks preceding the survey. This report is based on the subsample of 2,837 living children age 0-35 months for whom complete anthropometric data are available.
PREVIOUS PAGE BLANK 93
APPENDIXB
HOUSEHOLD AND RESPONDENT BACKGROUND CHARACTERISTICS
PREVIOUS PAGE BLANK .fS'
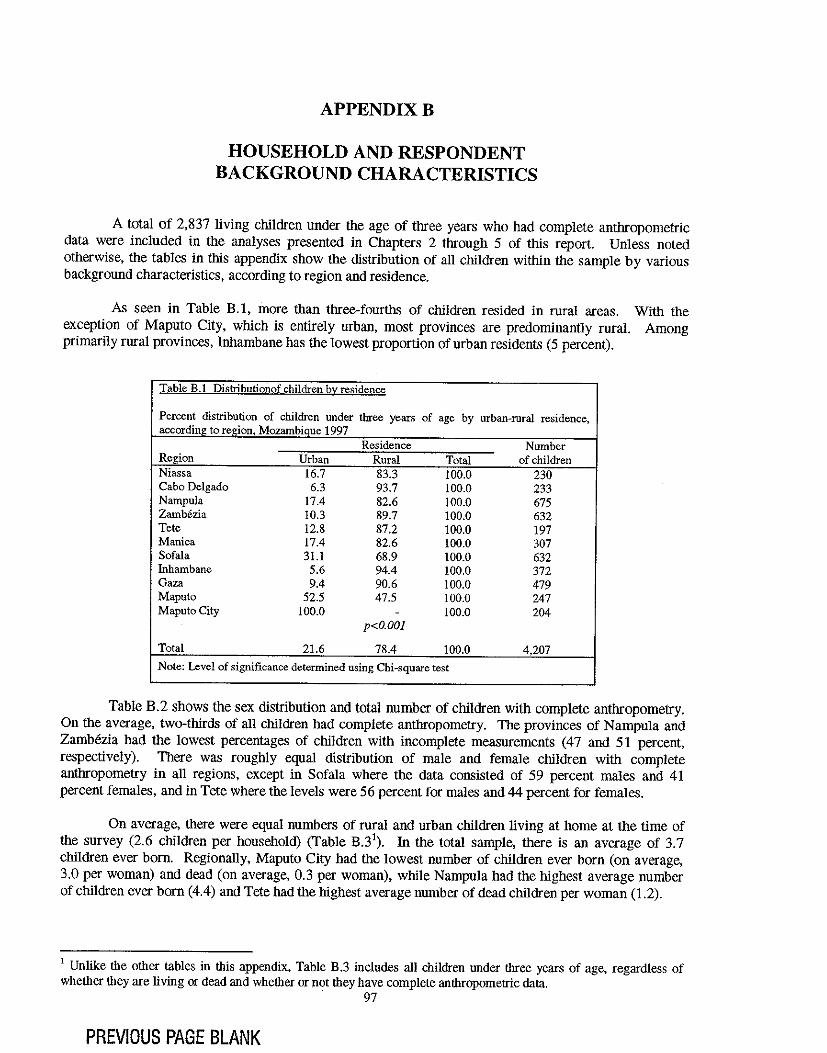
APPENDIXB
HOUSEHOLD AND RESPONDENT BACKGROUND CHARACTERISTICS
A total of 2,837 living children under the age of three years who had complete anthropometric data were included in the analyses presented in Chapters 2 through 5 of this report. Unless noted otherwise, the tables in this appendix show the distribution of all children within the sample by various background characteristics, according to region and residence.
As seen in Table B.l, more than three-fourths of children resided in rural areas. With the exception of Maputo City, which is entirely urban, most provinces are predominantly rural. Among primarily rural provinces, Inhambane has the lowest proportion of urban residents (5 percent).
Table B.I Distributionof children by residence
Percent distribution of children under three years of age by urhan-rural residence, according to region, Mozambique 1997
Residence Number Region Urban Rural Total of children Niassa 16.7 83.3 100.0 230 Cabo Delgado 6.3 93.7 100.0 233 Nampula 17.4 82.6 100.0 675 Zamb6zia 10.3 89.7 100.0 632 Tete 12.8 87.2 100.0 197 Manica 17.4 82.6 100.0 307 Sofala 31.1 68.9 100.0 632 Inhambane 5.6 94.4 100.0 372 Gaza 9.4 90.6 100.0 479 Maputo 52.5 47.5 100.0 247 Maputo City 100.0 - 100.0 204
p<O.OOI
Total 21.6 78.4 100.0 4,207
Note: Level of significance determined using Chi-square test
Table B.2 shows the sex distribution and total number of children with complete anthropometry. On the average, two-thirds of all children had complete anthropometry. The provinces of Nampula and ZamMzia had the lowest percentages of children with incomplete measurements (47 and 51 percent, respectively). There was roughly equal distribution of male and female children with complete anthropometry in all regions, except in Sofala where the data consisted of 59 percent males and 41 percent females, and in Tete where the levels were 56 percent for males and 44 percent for females.
On average, there were equal numbers of rural and urban children living at home at the time of the survey (2.6 children per household) (Table B.3\ In the total sample, there is an average of 3.7 children ever born. Regionally, Maputo City had the lowest number of children ever born (on average, 3.0 per woman) and dead (on average, 0.3 per woman), while Nampula had the highest average number of children ever born (4.4) and Tete had the highest average number of dead children per woman (1.2).
1 Unlike the other tables in this appendix, Table B.3 includes all children under three years of age, regardless of whether they are living or dead and whether or not they have complete anthropometric data.
. 97
PREVIOUS PAGE BLANK
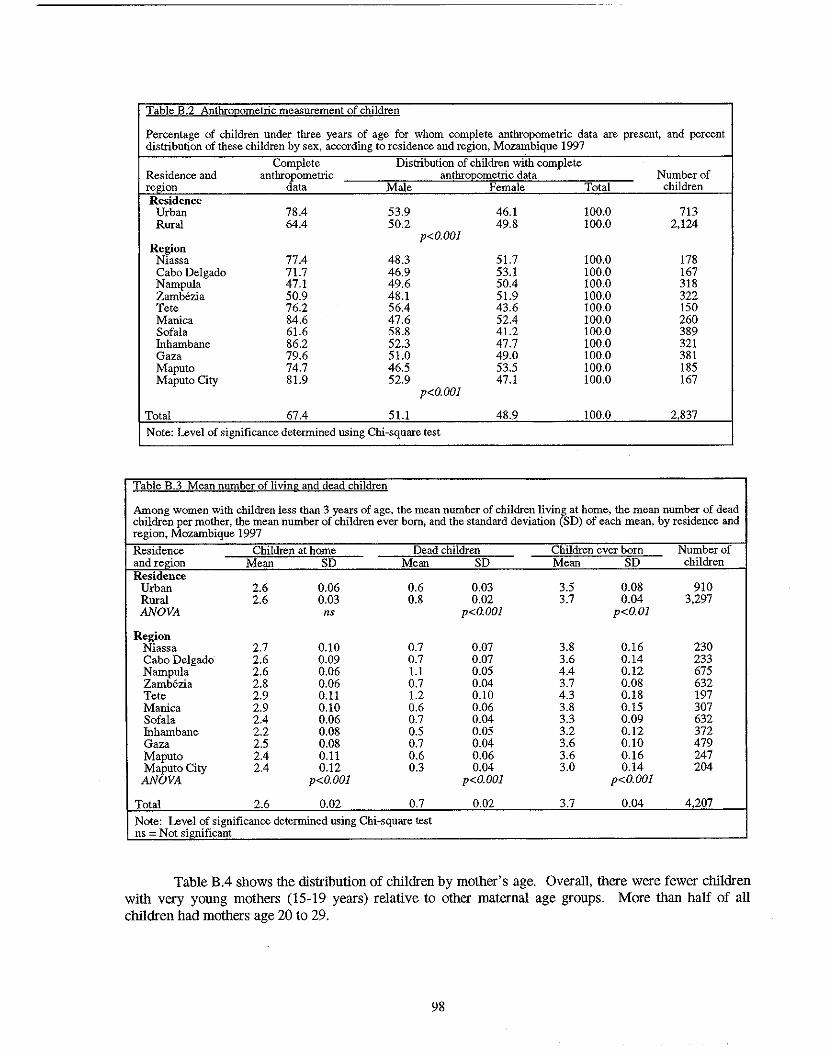
Table B.2 Anthrogometric mea .. urement of children
Percentage of children under three years of age for whom complete anthropometric data are present, and percent distribution of these children by sex, according to residence and region, Mozambique 1997
Complete Distribution of children with complete Residence and anthropometric anthroQometric data Number of region data Male Female Total children Residence
Urban 78.4 53.9 46.1 100.0 713 Rural 64.4 50.2 49.8 100.0 2,124
p<O.OOI Region
Niassa 77.4 48.3 51.7 100.0 178 Cabo Delgado 71.7 46.9 53.1 100.0 167 Nampula 47.1 49.6 50.4 100.0 318 Zamb6zia 50.9 48.1 51.9 100.0 322 Tete 76.2 56.4 43.6 100.0 150 Manica 84.6 47.6 52.4 100.0 260 Sofala 61.6 58.8 41.2 100.0 389 Inhambane 86.2 52.3 47.7 100.0 321 Gaza 79.6 51.0 49.0 100.0 381 Maputo 74.7 46.5 53.5 100.0 185 Maputo City 81.9 52.9 47.1 100.0 167
p<O.OOI
Total 67.4 51.1 48.9 100.0 2837
Note: Level of significance determined using Chi-square test
Table B.3 Mean number of living and dead children
Among women with children less than 3 years of age, the mean number of children living at home, the mean number of dead children per mother, the mean number of children ever born, and the standard deviation (SD) of each mean, by residence and region, Mozambique 1997
Residence Children at home Dead children Children ever born Number of and region Mean SD Mean SD Mean SD children Residence
Urban 2.6 0.06 0.6 0.03 3.5 0.08 910 Rural 2.6 0.03 0.8 0.02 3.7 0.04 3,297 ANOVA ns p<O.OOI p<O.OI
Region Niassa 2.7 0.10 0.7 0.07 3.8 0.16 230 Cabo Delgado 2.6 0.09 0.7 0.07 3.6 0.14 233 Narnpula 2.6 0.06 1.1 0.05 4.4 0.12 675 Zamb6zia 2.8 0.06 0.7 0.04 3.7 0.08 632 Tete 2.9 0.11 1.2 0.10 4.3 0.18 197 Manica 2.9 0.10 0.6 0.06 3.8 0.15 307 Sofala 2.4 0.06 0.7 0.04 3.3 0.09 632 Inharnbane 2.2 0.08 0.5 0.05 3.2 0.12 372 Gaza 2.5 0.08 0.7 0.04 3.6 0.10 479 Maputo 2.4 0.11 0.6 0.06 3.6 0.16 247 Maputo City 2.4 0.12 0.3 0.04 3.0 0.14 204 ANOVA p<O.OOI p<O.OOI p<O.OOI
Total 2.6 0.02 0.7 0.02 3.7 0.04 4207
Note: Level of significance determined using Chi-square test ns - Not significant
Table B.4 shows the distribution of children by mother's age. Overall, there were fewer children with very young mothers (15-19 years) relative to other maternal age groups. More than half of all children had mothers age 20 to 29.
98
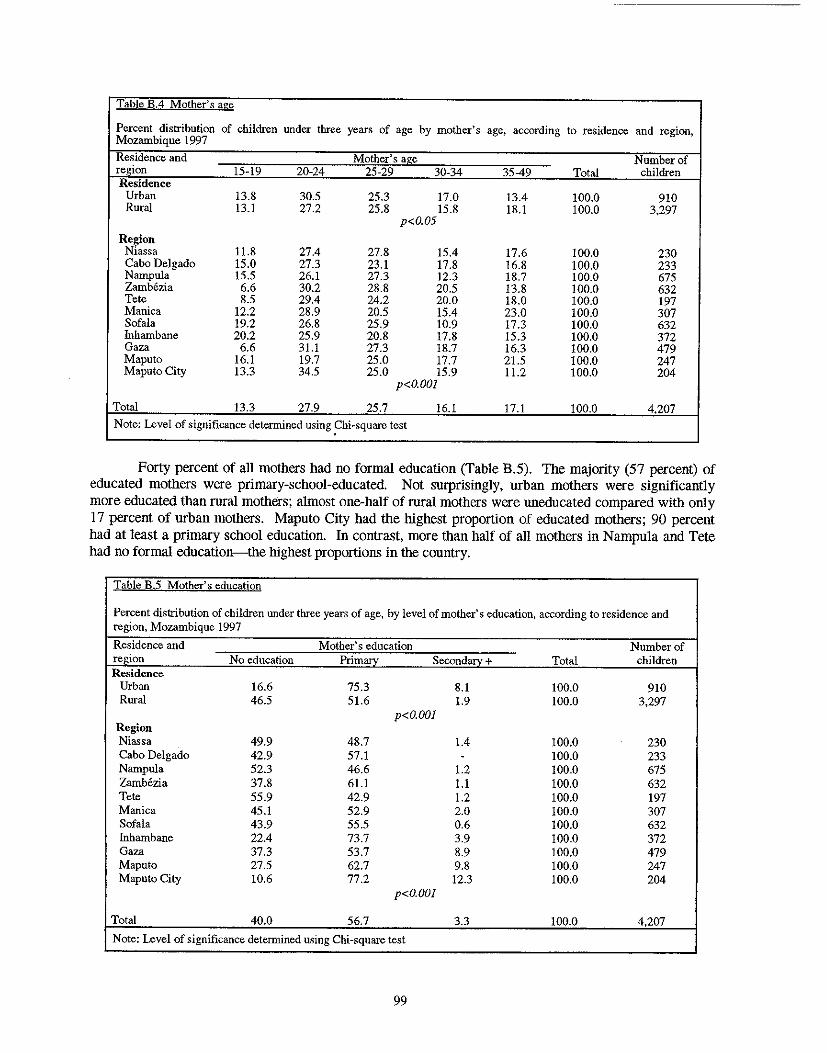
Table B.4 Mother's age
Percent distribution of children under three years of age by mother's Mozambique 1997
age, according to residence and region,
Residence and Mother's age Number of region 15-19 20-24 25-29 30-34 35-49 Total children Residence
Urban 13.8 30.5 25.3 17.0 13.4 100.0 910 Rural 13.1 27.2 25.8 15.8 18.1 100.0 3,297
p<O.05
Region Niassa 11.8 27.4 27.8 15.4 17.6 100.0 230 Cabo Delgado 15.0 27.3 23.1 17.8 16.8 100.0 233 Nampula 15.5 26.1 27.3 12.3 18.7 100.0 675 Zambezia 6.6 30.2 28.8 20.5 13.8 100.0 632 Tete 8.5 29.4 24.2 20.0 18.0 100.0 197 Manica 12.2 28.9 20.5 15.4 23.0 100.0 307 Sofala 19.2 26.8 25.9 10.9 17.3 100.0 632 fuhambane 20.2 25.9 20.8 17.8 15.3 100.0 372 Gaza 6.6 31.1 27.3 18.7 16.3 100.0 479 Maputo 16.1 19.7 25.0 17.7 21.5 100.0 247 Maputo City 13.3 34.5 25.0 15.9 11.2 100.0 204
p<O.OO1
Total 13.3 27.9 25.7 16.1 17.1 100.0 4,207
Note: Level of significance determined using ~hi-square test
Forty percent of all mothers had no formal education (Table B.5). The majority (57 percent) of educated mothers were primary-school-educated, Not surprisingly, urban mothers were significantly more educated than rural mothers; almost one-half of rural mothers were uneducated compared with only 17 percent of urban mothers, Maputo City had the highest proportion of educated mothers; 90 percent had at least a primary school education. In contrast, more than half of all mothers in Nampula and Tete had no formal education--the highest proportions in the country.
Table B.5 Mother's education
Percent distribution of children under three years of age, by level of mother's education, according to residence and region, Mozambique 1997
Residence and Mother's education Number of region No education Primory Secondary + Total children Re..<;idence
Urban 16.6 75.3 8.1 100.0 910 Rural 46.5 51.6 1.9 100.0 3,297
p<O.OO1 Region Niassa 49.9 48.7 1.4 100.0 230 Cabo Delgado 42.9 57.1 - 100.0 233 Nampula 52.3 46.6 1.2 100.0 675 Zambezia 37.8 61.1 1.1 100.0 632 Tete 55.9 42.9 1.2 100.0 197 Manica 45.1 52.9 2.0 100.0 307 Sofala 43.9 55.5 0.6 100.0 632 Inhambane 22.4 73.7 3.9 100.0 372 Gaza 37.3 53.7 8.9 100.0 479 Maputo 27.5 62.7 9.8 100.0 247 Maputo City 10.6 77.2 12.3 100.0 204
p<O.OOI
Total 40.0 56.7 3.3 100.0 4,207
Note: Level of significance determined using Chi-square test
99
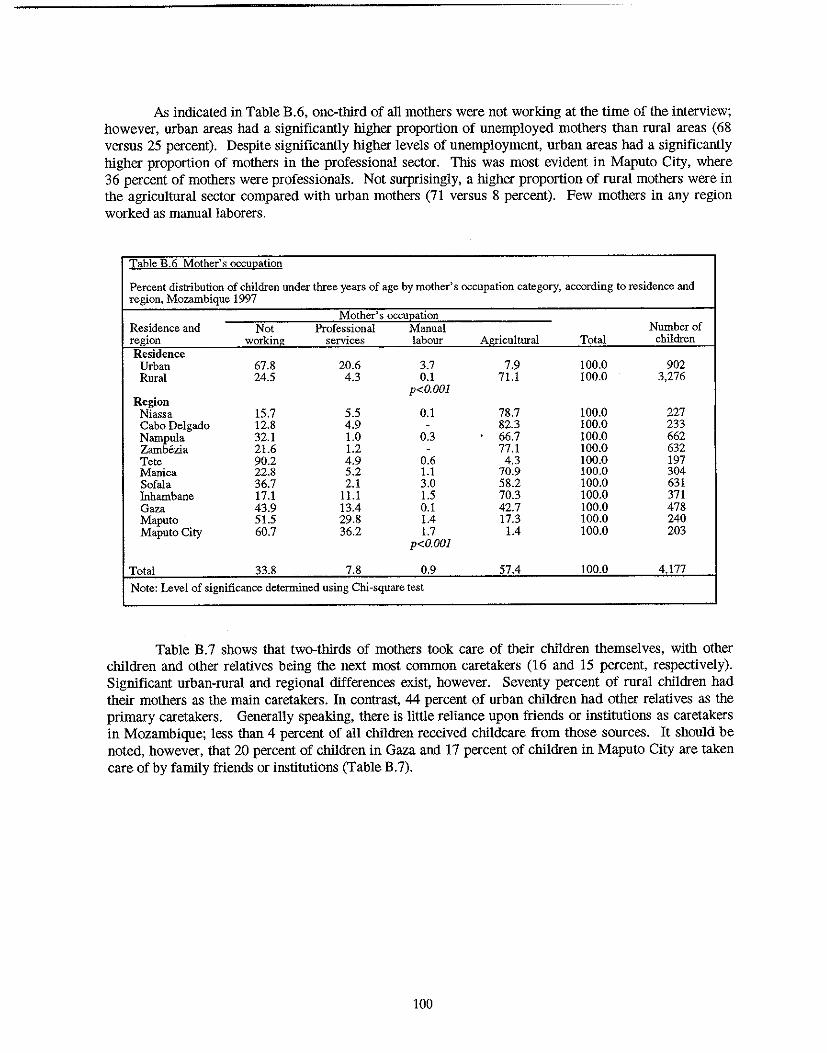
As indicated in Table B.6, one-third of all mothers were not working at the time of the interview; however, urban areas had a significantly higher proportion of unemployed mothers than rural areas (68 versus 25 percent). Despite significantly higher levels of unemployment, urban areas had a significautly higher proportion of mothers in the professional sector. This was most evident in Maputo City, where 36 percent of mothers were professionals. Not surprisingly, a higher proportion of rural mothers were in the agricultural sector compared with urban mothers (71 versus 8 percent). Few mothers in any region worked as manual laborers.
Table B.6 Mother's occuQation
Percent distribution of children under three years of age by mother's occupation category, according to residence and region. Mozambique 1997
Residence and Not Mother's occuEation
Professional Manual Number of region working services labour Agricultural Total children Residence
Urban 67.8 20.6 3.7 7.9 100.0 902 Rural 24.5 4.3 0.1 71.1 100.0 3,276
p<O.OOl Region
Niassa 15.7 5.5 0.1 78.7 100.0 227 Cabo Delgado 12.8 4.9 - 82.3 100.0 233 Narupula 32.1 1.0 0.3 66.7 100.0 662 Zambezia 21.6 1.2 - 77.1 100.0 632 Tete 90.2 4.9 0.6 4.3 100.0 197 Manica 22.8 5.2 1.1 70.9 100.0 304 Sofala 36.7 2.1 3.0 58.2 100.0 631 Inharubane 17.1 11.1 1.5 70.3 100.0 371 Gaza 43.9 13.4 0.1 42.7 100.0 478 Maputo 51.5 29.8 1.4 17.3 100.0 240 Maputo City 60.7 36.2 1.7 1.4 100.0 203
p<O.OOl
Total 33.8 7.8 0.9 57.4 100.0 4177 Note: Level of significance determined using Chi-square test
Table B.7 shows that two-thirds of mothers took care of their children themselves, with other children and other relatives being the next most common caretakers (16 and 15 percent, respectively). Significaut urban-rural and regional differences exist, however. Seventy percent of rural children had their mothers as the main caretakers. In contrast, 44 percent of urban children had other relatives as the primary caretakers. Generally speaking, there is little reliauce upon friends or institutions as caretakers in Mozambique; less than 4 percent of all children received childcare from those sources. It should be noted, however, that 20 percent of children in Gaza aud 17 percent of children in Maputo City are taken care of by family friends or institutions (Table B.7).
100
Table B.7 Usual caretaker of children of women working out')ide the home
Percent distribution of children under three years of age whose mothers have worked in the past 12 months, by person who took care of child, according to residence and region, Mozambique 1997
Child care Erovider {if mother worked in last 12 monthsl Residence and Friend! Other Number of region Respondent Relatives institution child Total children Residence
Urban 29.6 43.7 6.9 19.7 100.0 268 Rural 70.2 11.3 3.1 15.4 100.0 2,178
Region p<O.OOI
Niassa 87.2 6.7 0.9 5.2 100.0 164 Cabo Delgado 83.6 7.2 - 9.2 100.0 178 Nampula 85.8 3.1 - ILl !OO.O 432 Zambezia 60.4 14.8 3.1 21.7 !OO.O 469 Tete 71.7 10.5 - 17.7 100.0 16 Manica 67.4 8.4 2.2 21.9 !OO.O 225 Sofala 71.2 16.5 1.2 ILl 100.0 374 Inhambane 55.8 19.7 1.3 23.2 100.0 181 Gaza 33.9 29.4 19.9 16.8 100.0 .224 Maputo 33.4 39.6 1.1 26.0 100.0 111 Maputo 27.7 39.0 16.5 16.7 !OO.O 72
p<O.OOI
Total 65.8 14.8 3.5 15.9 100.0 2446
Note: Level of significance determined by Chi-square test
Table E.8 shows \he distribution of children by \he sex of \he household head. Most children resided in male-headed households (82 percent); however, a significantly larger proportion of rural \han urban children had female heads of households (19 versus 14 percent). This proportion was highest in \he provinces of Maputo, Zambezia, and Cabo Delgado, where close to 30 percent of children came from female-headed households. Sofala had \he highest proportion of children from male-headed households (91 percent).
Table B.8 Sex of household head
Percent distribution of children under three years of age by sex of household head, according to region and residence, Mozambique 1997 Residence and Sex of household head Number of region Male Female Total children Residence
Urban 86.1 13.9 100.0 910 Rural 80.7 19.3 !OO.O 3,297
p<O.OOI Region
Niassa 81.4 18.6 10()'0 230 Cabo Delgado 73.8 26.2 100.0 233 Nampula 89.0 11.0 100.0 675 Zambezia 70.2 29.S 100.0 632 Tete 78.6 21.4 100.0 197 Manica 81.1 18.9 !OO.O 307 Sofala 90.7 9.3 100.0 632 Inhambane 84.2 15.8 100.0 372 Gaza 84.1 15.9 100.0 479 Maputo 72.1 27.9 !OO.O 247 Maputo City 82.9 17.1 100.0 204
p<O.OOI
Total S1.9 IS.I !OO.O 4207
Note: Level of significance determined using Chi-square test
101
As shown in Table B.9, 88 percent of children's motbers were married. Ninety-two percent of motbers in Manica were married-the highest proportion in tbe country. Urban areas had a significantly higher proportion of never-married motbers tban rural areas (9 versus 3 percent). This percentage was highest in Maputo City (15 percent) and lowest in Tete (1 percent). Niassa and Maputo Provinces had tbe highest proportions of divorced or separated motbers (12 and II percent, respectively).
Table B.9 Mother's marital status
Percent distribution of children under three years of age by mother's marital status, according to residence and region, Mozambique 1997
Mother's marital status Residence and Never Married! Divorced! Number of region mamed in union Widowed separated Total children Residence
Urban 8.8 80.5 0.6 10.1 100.0 910 Rural 3.2 89.6 0.8 6.5 100.0 3,297
p<O.OOl
Region Niassa 2.4 85.3 0.1 12.1 100.0 230 Cabo Delgado 1.2 90.1 0.4 8.2 100.0 233 Nampula 1.8 90.8 0.2 7.1 100.0 675 Zamb6zia 1.9 90.5 0.2 7.3 100.0 632 Tete 1.1 91.1 - 7.7 100.0 197 Manica 2.0 91.9 - 6.1 100.0 307 Sofala 1.6 90.2 - 8.1 100.0 632 Inhambane 9.8 84.3 2.0 3.9 100.0 372 Gaza 7.2 84.4 3.4 4.9 100.0 479 Maputo 13.0 74.9 0.8 11.3 100.0 247 Maputo City 15.3 78.1 0.6 6.1 100.0 204
p<O.OOl
Total 4.4 87.6 0.8 7.2 100.0 4,207
Note: Level of significance determined using Chi-square test
With respect to partner's education, only one-quarter of motbers' partners were uneducated; however, significant urban-rural and regional differences exist (Table B.IO). Seven percent of urban partners, compared with 30 percent of rural partners were uneducated. Maputo City had tbe lowest percentage of uneducated partners (3 percent) and tbe highest proportion of secondary-school-educated partners (32 percent). Note, however, tbat botb urban and rural areas had equal proportions of children whose motbers' partners were primary-school-educated (65 percent).
102
Table B.IO Mother's partner'~ education
Percent distribution of children under three years of age by their mother's partner's education, according to residence and region, Mozambique 1997
Residence and Mother's l2artner's education Number of region No education Primary Secondary + Total children Residence
Urban 6.7 65.4 27.9 100.0 700 Rural 30.3 65.3 4.4 100.0 2,677
Region p<O.OOI
Niassa 37.2 56.1 6.8 100.0 182 Cabo Delgado 25.0 71.5 3.5 100.0 215 Nampula 35.6 56.0 8.4 100.0 491 Zambezia 27.2 69.0 3.8 100.0 585 Tete 35.4 58.9 5.7 100.0 168 Manica 24.8 66.9 8.3 100.0 256 Sofala 23.2 68.5 8.2 100.0 505 Inhambane 15.2 77.4 7.5 100.0 300 Gaza 19.9 69.2 10.9 100.0 361 Maputo 23.0 47.4 29.6 100.0 176 Maputo City 3.4 65.0 31.6 100.0 136
p<O.OOI
Total 25.4 65.3 9.3 100.0 3377 Note: Level of significance determined using Chi-square test
In terms of partner's occupation, Table B. II shows that only 7 percent of all partners were unemployed, but this proportion is highest in Sofala (18 percent). The majority of partners (52 percent) worked in the agricultural sector. As expected, rural areas had a significantly higher proportion of agricultural workers than urban areas (62 versus 7 percent). Manual work was more common in urban than in rural areas (39 versus 17 percent). Gaza had the highest proportion of manual laborers (59 percent).
Table B.11 Mother's partner's occupation
Percent distribution of children under three years of age by mother's partner's occupation, according to residence and region, Mozambique 1997
Mother's E:artner's occuE:ation Residence and Not Manual Number of region working Professional labour Agricultural Total children Residence
Urban 10.2 43.7 39.1 7.0 100.0 708 Rural 6.0 15.5 16.8 61.8 100.0 3,087
p<O.OOI Region
Niassa 3.5 21.5 6.1 68.9 100.0 215 Cabo Delgado 4.1 9.0 5.8 81.1 100.0 221 Nampula 5.9 14.4 8.8 70.9 100.0 615 Zambezia 4.2 15.7 7.1 73.0 100.0 597 Tete 1.8 19.7 13.2 65.3 100.0 189 Manica 1.2 20.4 22.6 55.8 100.0 289 Sofala 18.3 21.4 11.5 48.9 100.0 561 Inhambane 0.4 29.9 29.1 40.7 100.0 320 Gaza 11.4 20.6 58.8 9.2 100.0 432 Maputo 3.4 34.0 52.0 10.6 100.0 205 Maputo City 8.7 45.2 42.2 3.9 100.0 150
p<O.OOI
Total 6.8 20.7 20.9 51.5 100.0 3,795
Note: Level of significance determined using Chi-square test
103
Tables B.12 and B.13 show the distributions of children by the water and sanitation facilities in their households. More than 60 percent of children lived in households with no toilet facilities (Table B.12). Only 38 percent had access to latrines and less than 2 percent had access to flush toilets. There were marked regional differences: three-fourths of children in Maputo City had access to latrines whereas only 11 percent of children in Zamb6zia had such access. Maputo City also had the highest proportion of children with access to flush toilet~ (14 percent). In terms of sources of drinking water, less than onefourth of children lived in households with piped water, 46 percent drank well water, and 31 percent drank surface water (Table B.13). A significantly higher proportion of urban children had piped water (69 percent) compared with rural children (10 percent). The majority of children in Maputo City (86 percent) drank piped water whereas only 4 percent of children from Niassa drank piped water. More than 50 percent of children in Manica drank surface water.
Table B.12 Toilet facilities
Percent distribution of children under three years of age by type of toilet facilities in household, according to residence and region, Mozambique 1997 Residence and Tme of toilet facilities Number of re.£don Flush Latrine None/Other Total children Residence
Urban 6.9 60.1 33.0 100.0 888 Rural 0.1 32.0 68.0 100.0 3,270
p<O.OOI Region
Niassa 0.4 55.2 44.4 100.0 227 Cabo Delgado 0.1 45.8 54.1 100.0 226 Nampula 0.2 12.0 87.7 100.0 669 Zamb6zia 0.5 11.3 88.3 100.0 632 Tete - 49.9 50.1 100.0 196 Manica 0.5 28.6 70.9 100.0 306 Sofala 2.4 17.7 79.9 100.0 627 fuhambane 0.2 75.3 24.5 100.0 364 Gaza 0.2 72.5 27.4 100.0 473 Maputo 5.7 56.7 37.6 100.0 240 Maputo City 13.5 75.2 11.2 100.0 197
p<O.OOI
Total 1.5 38.0 60.5 100.0 4157
Note: Level of significance determined using Chi-square test
Table B.13 Source of drinking }Yater
Percent distribution of children under three years of age by source of household drinking water, according to residence and region, Mozambique 1997
Source of drinking water Residence and Surface Number of region Piped water Well water water Other Total children Residence
Urban 69.3 29.3 1.2 0.2 100.0 891 Rural 9.6 50.4 39.4 0.6 100.0 3,278
p<O.OOI Region
Niassa 3.8 53.9 42.3 - 100.0 228 Cabo Delgado 35.2 34.3 29.8 0.7 100.0 228 Nampula 16.3 56.2 27.4 0.1 100.0 670 Zamb6zia 11.7 49.2 39.2 - 100.0 632 Tete 12.7 53.8 33.5 - 100.0 196 Manica 13.4 33.2 53.4 - 100.0 306 Sofala 19.4 34.4 46.2 - 100.0 629 Inhambane 10.3 64.5 24.1 1.0 100.0 368 Gaza 25.0 59.0 13.3 2.7 100.0 473 Maputo 60.5 23.0 15.0 1.5 100.0 240 Maputo City 85.8 14.0 0.0 0.2 100.0 197
p<O.OOI
Total 22.3 45.9 31.3 0.5 100.0 4168
Note: Level of significance determined using Chi-square test
104
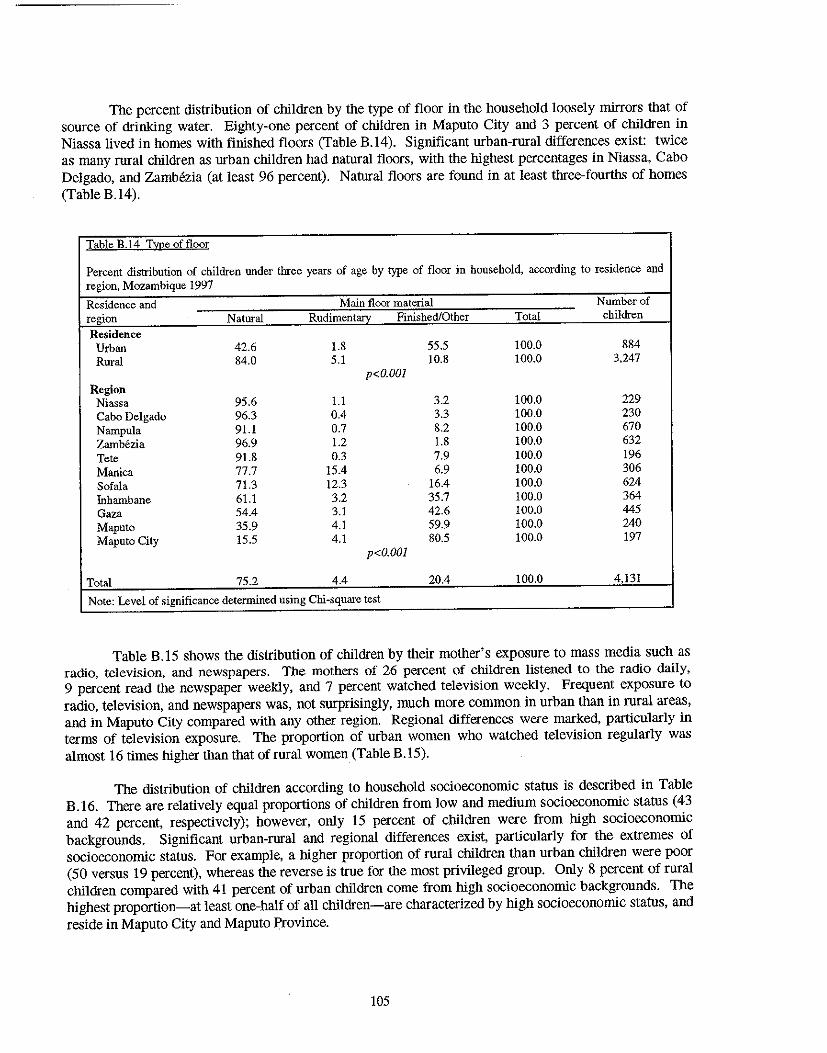
The percent distribution of children by the type of floor in the household loosely mirrors that of source of drinking water. Eighty-one percent of children in Maputo City and 3 percent of children in Niassa lived in homes with finished floors (Table B.l4). Significant urban-rural differences exist: twice as many rural children as urban children had natural floors, with the highest percentages in Niassa, Cabo Delgado, and Zambezia (at least 96 percent). Natural floors are found in at least three-fourths of homes (Table B.14).
Table B.14 Tmeoffloor
Percent distribution of children under three years of age by type of floor in household, according to residence and region. Mozambique 1997
Residence and Main floor material Number of region Natural Rudimentary Finished/Other Total children Residence
Urban 42.6 1.8 55.5 100.0 884 Rural 84.0 5.1 10.8 100.0 3,247
p<O.OOI Region
Niassa 95.6 1.1 3.2 100.0 229 Cabo Delgado 96.3 0.4 3.3 100.0 230 Nampula 91.1 0.7 8.2 100.0 670 Zambezia 96.9 1.2 1.8 100.0 632 Tete 91.8 0.3 7.9 100.0 196 Manica 77.7 15.4 6.9 100.0 306 Sofala 71.3 12.3 16.4 100.0 624 Inhambane 61.1 3.2 35.7 100.0 364 Gaza 54.4 3.1 42.6 100.0 445 Maputo 35.9 4.1 59.9 100.0 240 Maputo City 15.5 4.1 80.5 100.0 197
p<O.OOI
Total 75.2 4.4 20.4 100.0 4,131
Note: Level of significance determined using Chi-square test
Table B.15 shows the distribution of children by their mother's exposure to mass media such as radio, television, and newspapers. The mothers of 26 percent of children listened to the radio daily, 9 percent read the newspaper weekly, and 7 percent watched television weekly. Frequent exposure to radio, television, and newspapers was, not surprisingly, much more common in urban than in rural areas, and in Maputo City compared with any other region. Regional differences were marked, particularly in terms of television exposure. The proportion of urban women who watched television regularly was almost 16 times higher than that of rural women (Table B.15).
The distribution of children according to household socioeconomic status is described in Table B.16. Tbere are relatively equal proportions of children from low and medium socioeconomic status (43 and 42 percent, respectively); however, only 15 percent of children were from high socioeconOmic backgrounds. Significant urban-rural and regional differences exist, particularly for the extremes of socioeconomic status. For example, a higher proportion of rural children than urban children were poor (50 versus 19 percent), whereas the reverse is true for the most privileged group. Only 8 percent of rural children compared with 41 percent of urban children come from high socioeconomic backgrounds. The highest proportion-at least one-half of all children-are characterized by high socioeconOmic status, and reside in Maputo City and Maputo Province.
105
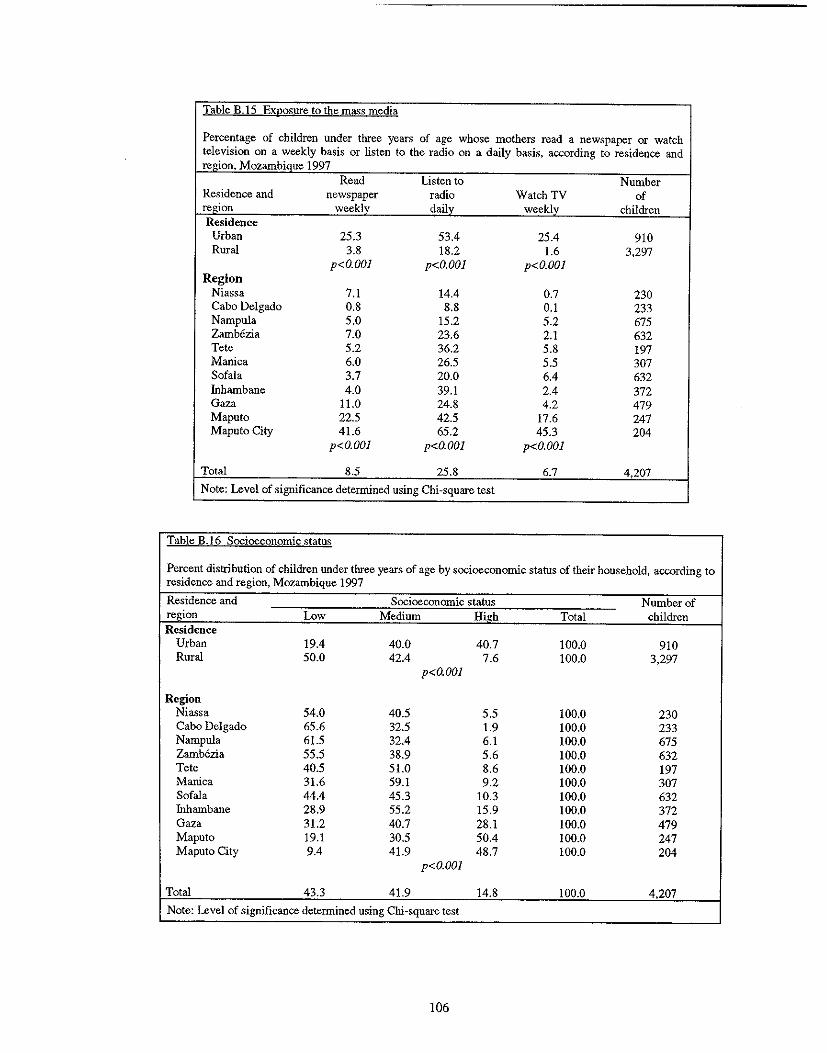
Table B.IS Exposure to the ma"s media
Percentage of children under three years of age whose mothers read a newspaper or watch television on a weekly basis or listen to the radio on a daily basis, according to residence and region. Mozambique 1997
Read Listen to Number Residence and newspaper radio Watch TV of region weekly daily weekly children Residence
Urban 25.3 53.4 25.4 910 Rural 3.8 18.2 1.6 3.297
p<O.OOl p<O.OOl p<O.OOl Region
Niassa 7.1 14.4 0.7 230 Cabo Delgado 0.8 8.8 0.1 233 Nampula 5.0 15.2 5.2 675 Zamb6zia 7.0 23.6 2.1 632 Tete 5.2 36.2 5.8 197 Manica 6.0 26.5 5.5 307 Sofala 3.7 20.0 6.4 632 fuhambane 4.0 39.1 2.4 372 Gaza 11.0 24.8 4.2 479 Maputo 22.5 42.5 17.6 247 Maputo City 41.6 65.2 45.3 204
p<O.OOl p<O.OOl p<O.OOl
Total 8.5 25.8 6.7 4.207
Note: Level of significance determined using Chi-square test
Table B.16 Socioeconomic status
Percent distribution of children under three years of age by socioeconomic status of their household, according to residence and region, Mozambique 1997
Residence and Socioeconomic status Number of region Low Medium High Total children Residence
Urban 19.4 40.0 40.7 100.0 910 Rural 50.0 42.4 7.6 100.0 3.297
p<O.OOl
Region Niassa 54.0 40.5 5.5 100.0 230 Cabo Delgado 65.6 32.5 1.9 100.0 233 Nampula 61.5 32.4 6.1 100.0 675 Zamb6zia 55.5 38.9 5.6 100.0 632 Tete 40.5 51.0 8.6 100.0 197 Manica 31.6 59.1 9.2 100.0 307 Sofala 44.4 45.3 10.3 100.0 632 Inhambane 28.9 55.2 15.9 100.0 372 Gaza 31.2 40.7 28.1 100.0 479 Maputo 19.1 30.5 50.4 100.0 247 Maputo City 9.4 41.9 48.7 100.0 204
p<O.OOl
Total 43.3 41.9 14.8 100.0 4.207
Note: Level of significance determined using Chi-square test
106
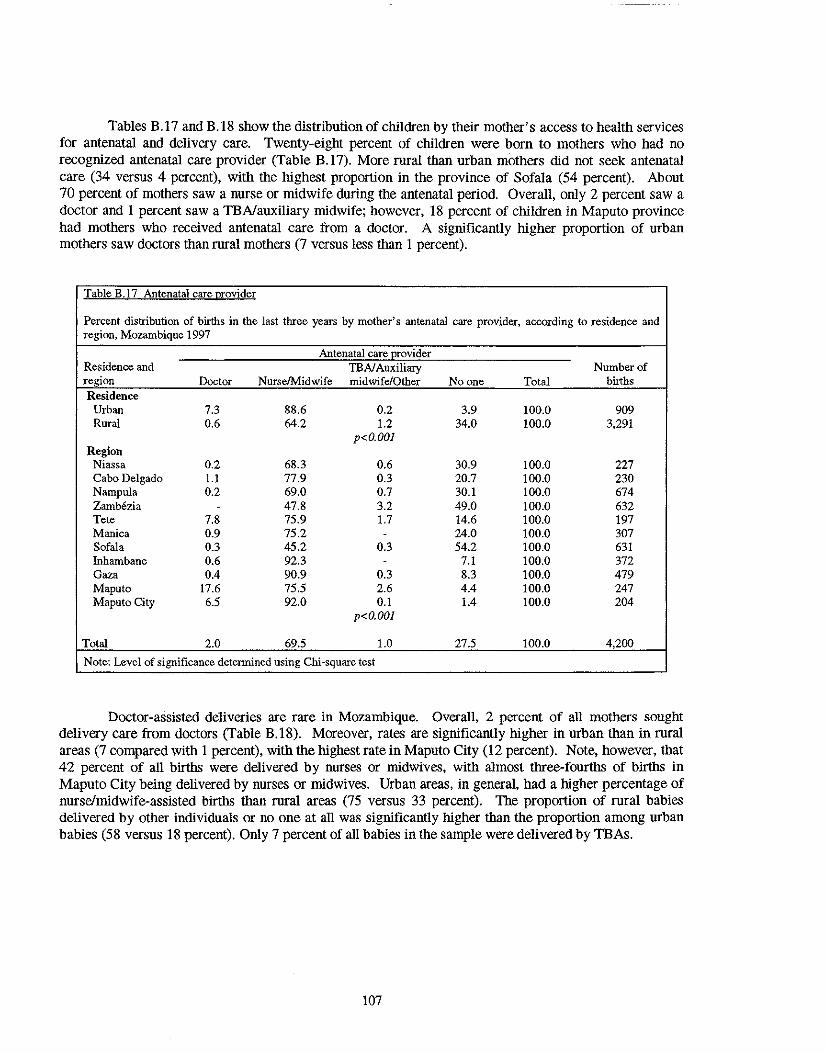
Tables B.17 and B.IS show the distribution of children by their mother's access to health services for antenatal and delivery care. Twenty-eight percent of children were born to mothers who had no recognized antenatal care provider (Table B.17). More rural than urban mothers did not seek antenatal care (34 versus 4 percent), with the highest proportion in the province of Sofala (54 percent). About 70 percent of mothers saw a nurse or midwife during the antenatal period. Overall, only 2 percent saw a doctor and I percent saw a TBNauxiliary midwife; however, IS percent of children in Maputo province had mothers who received antenatal care from a doctor. A significantly higher proportion of urban mothers saw doctors than rural mothers (7 versus less than I percent).
Table B.t? Antenatal care Qfovider
Percent distribution of births in the last three years by mother's antenatal care provider, according to residence and region, Mozambique 1997
Antenatal care l!0vider Residence and TEA/Auxiliary Number of region Doctor NurseIMidwife midwife/Other Noone Total births Residence
Urban 7.3 88.6 0.2 3.9 100.0 909 Rural 0.6 64.2 1.2 34.0 100.0 3.291
p<O.OOI Region
Niassa 0.2 68.3 0.6 30.9 100.0 227 Cabo Delgado 1.1 77.9 0.3 20.7 100.0 230 Nampula 0.2 69.0 0.7 30.1 100.0 674 Zamb6zia . 47.8 3.2 49.0 100.0 632 Tete 7.8 75.9 1.7 14.6 100.0 197 Manica 0.9 75.2 . 24.0 100.0 307 Sofala 0.3 45.2 0.3 54.2 100.0 631 Inhambane 0.6 92.3 . 7.1 100.0 372 Gaza 0.4 90.9 0.3 8.3 100.0 479 Maputo 17.6 75.5 2.6 4.4 100.0 247 Maputo City 6.5 92.0 0.1 1.4 100.0 204
p<O.OOI
Total 2.0 69.5 1.0 27.5 100.0 4,200
Note: Level of significance determined using Chi-square test
Doctor-assisted deliveries are rare in Mozambique. Overall, 2 percent of all mothers sought delivery care from doctors (Table B.lS). Moreover, rates are significantly higher in urban than in rural areas (7 compared with I percent), with the highest rate in Maputo City (12 percent). Note, however, that 42 percent of all births were delivered by nurses or midwives, with almost three-fourths of births in Maputo City being delivered by nurses or midwives. Urban areas, in general, had a higher percentage of nurse/midwife-assisted births than rural areas (75 versus 33 percent). The proportion of rural babies delivered by other individuals or no one at all was significantly higher than the proportion among urban babies (5S versus 18 percent). Only 7 percent of all babies in the sample were delivered by TBAs.
107
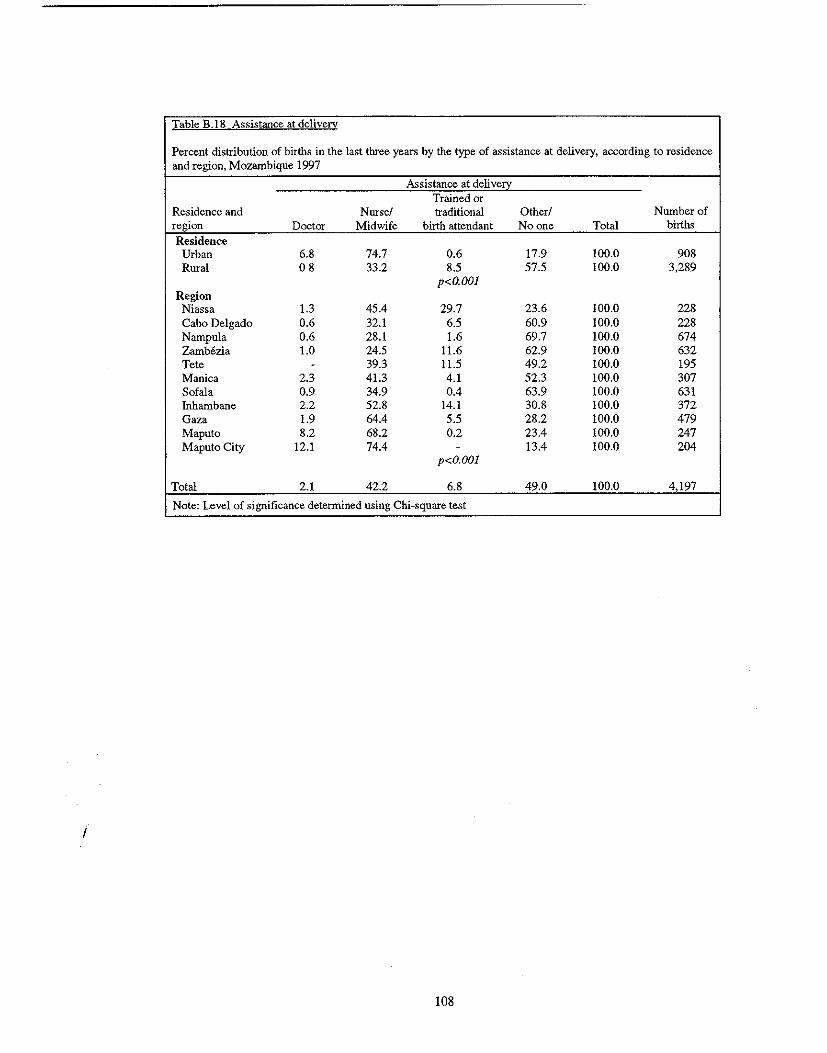
Table B.18 Assistance at delivery
Percent distribution of births in the last tluee years by the type of assistance at delivery, according to residence and region, Mozambique 1997
Assistance at deliven:: Trained or
Residence and Nurse! traditional Other! Number of region Doctor Midwife birth attendant Noone Total births
Residence Urban 6.8 74.7 0.6 17.9 100.0 908 Rural 08 33.2 8.5 57.5 100.0 3,289
p<O.OOI Region
Niassa 1.3 45.4 29.7 23.6 100.0 228 Cabo Delgado 0.6 32.1 6.5 60.9 100.0 228 Nampula 0.6 28.1 1.6 69.7 100.0 674 Zamb6zia 1.0 24.5 11.6 62.9 100.0 632 Tete - 39.3 11.5 49.2 100.0 195 Manica 2.3 41.3 4.1 52.3 100.0 307 Sofala 0.9 34.9 0.4 63.9 100.0 631 Inhambane 2.2 52.8 14.1 30.8 100.0 372 Gaza 1.9 64.4 5.5 28.2 100.0 479 Maputo 8.2 68.2 0.2 23.4 100.0 247 Maputo City 12.1 74.4 - 13.4 100.0 204
p<O.OOI
Total 2.1 42.2 6.8 49.0 100.0 4,197
Note: Level of significance determined using Chi-square test
I
108
APPENDIXC
ANTHROPOMETRIC DATA VERIFICATION
APPENDIXC
ANTHROPOMETRIC DATA VERIFICATION
Table C.I Characteri~tic!\ of children with missing anthro120-metric data
Percent distribution of children born in the tbree years preceding the survey by completeness of anthropometric data, according to selected background characteristics, Mozambique 1997
Incomplete Complete Background anthropometric anthropometric characteristic data data Residence
Urban 14.4 25.1 Rural 85.6 74.9
Total
Region Niassa 3.8 6.3 Cabo Delgado 4.8 5.9 Nampula 26.1 11.2 Zamb6zia 22.7 11.3 Tete 3.4 5.3 Manica 3.4 9.2 Sofala 17.7 13.7 Inhambane 3.7 11.3 Gaza 7.1 13.4 Maputo 4.6 6.5 Maputo City 2.7 5.9
Total
Socioeconomic status Low 50.9 39.7 Medium 40.9 42.4 High 8.2 17.9
Total
Perceived size at birth Average + 71.6 81.0 Small 22.7 16.4 Very small 2.8 1.4 Don't know/Missing 3.0 1.2
Total
Mother's education No education 47.0 36.7 Primary 51.7 59.2 Secondary + 1.4 4.2
Total 100.0 100.0
Number of children 1,370 2,837
PREVIOUS PAGE BLANK 111
Of the 4,207 children under three years of age who took part in the survey, 74 percent (2,837 children) were weighed and measured. Table C.l indicates that 86 percent of children with incomplete anthropometric data resided in rural areas. The capital, Maputo City, accounted for onI y 3 percent, whereas N ampnIa Province accounted for 26 percent. In addition, half of the children with incomplete data were of low socioeconomic status. A small percentage of children with highly educated mothers had incomplete anthropometric data (1.4 percent), whereas the rest of the children with incomplete data were almost equally distributed between uneducated and primary-school-educated mothers. Seventy-one percent of children with incomplete data were perceived by their mothers as "average- or large-sized" at birth.
As shown in Table C.2, there appears to be a preference in the choice of digits for the height data. Heights are particularly concentrated around values ending in the integers 0 and 5. Note, however, that digit preference in weight reporting is not as apparent. Nevertheless, a higher proportion of children had reported weights ending in 0 compared with other integers.
Table C.2 Digit preference in anthropometric data
Percentage of weight and height data falling as specific integers, Mozambique 1997
Height Weight Decimal Number of Number of integer Percentage children Percentage children 0 35.5 1,495 13.1 553 1 5.1 213 7.4 311 2 8.3 347 9.3 390 3 6.1 255 8.2 346 4 3.8 160 8.3 348 5 14.2 596 8.9 375 6 4.2 175 7.1 299 7 3.5 146 8.1 340 8 2.8 118 8.8 370 9 2.0 84 7.7 323 Missing 14.7 618 13.1 553
Total 100.0 4,207 100.0 4,207
112
APPENDIXD
MALNUTRITION AMONG CHILDREN AGE 3 TO 35 MONTHS MOZAMBIQUE 1997
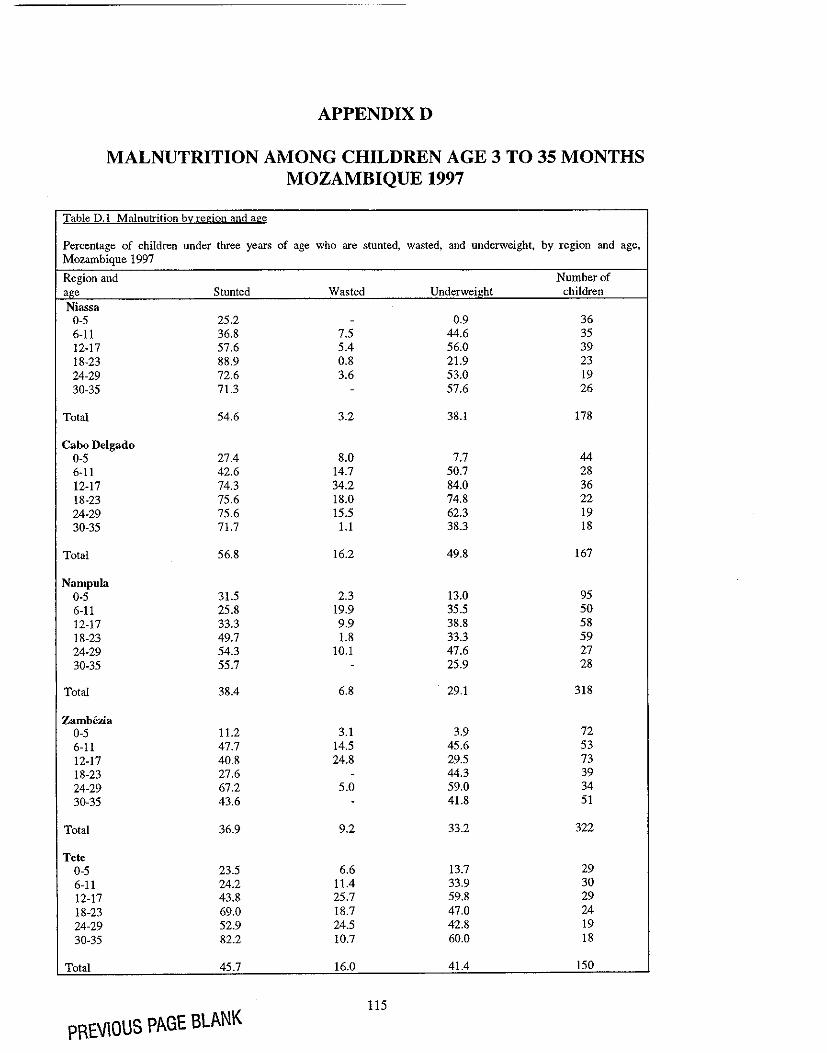
APPENDIXD
MALNUTRITION AMONG CHILDREN AGE 3 TO 35 MONTHS MOZAMBIQUE 1997
Table D.l Malnutrition by region and age
Percentage of children under three years of age who are stunted, wasted, and underweight, by region and age, Mozambique 1997
Region and Number of age Stunted Wasted Underweight children Niassa
0-5 25.2 - 0.9 36 6-11 36.8 7.5 44.6 35 12-17 57.6 5.4 56.0 39 18-23 88.9 0.8 21.9 23 24-29 72.6 3.6 53.0 19 30-35 71.3 - 57.6 26
Total 54.6 3.2 38.1 178
Cabo Delgado 0-5 27.4 8.0 7.7 44 6-11 42.6 14.7 50.7 28 12-17 74.3 34.2 84.0 36 18-23 75.6 18.0 74.8 22 24-29 75.6 15.5 62.3 19 30-35 71.7 1.1 38.3 18
Total 56.8 16.2 49.8 167
Nampula 0-5 31.5 2.3 13.0 95 6-11 25.8 19.9 35.5 50 12-17 33.3 9.9 38.8 58 18-23 49.7 1.8 33.3 59 24-29 54.3 10.1 47.6 27 30-35 55.7 - 25.9 28
Total 38.4 6.8 29.1 318
Zambczia 0-5 11.2 3.1 3.9 72 6-11 47.7 14.5 45.6 53 12-17 40.8 24.8 29.5 73 18-23 27.6 - 44.3 39 24-29 67.2 5.0 59.0 34 30-35 43.6 - 41.8 51
Total 36.9 9.2 33.2 322
Tete 0-5 23.5 6.6 13.7 29 6-11 24.2 11.4 33.9 30 12-17 43.8 25.7 59.8 29 18-23 69.0 18.7 47.0 24 24-29 52.9 24.5 42.8 19 30-35 82.2 10.7 60.0 18
Total 45.7 16.0 41.4 150
PREVIOUS PAGE BLANK 115
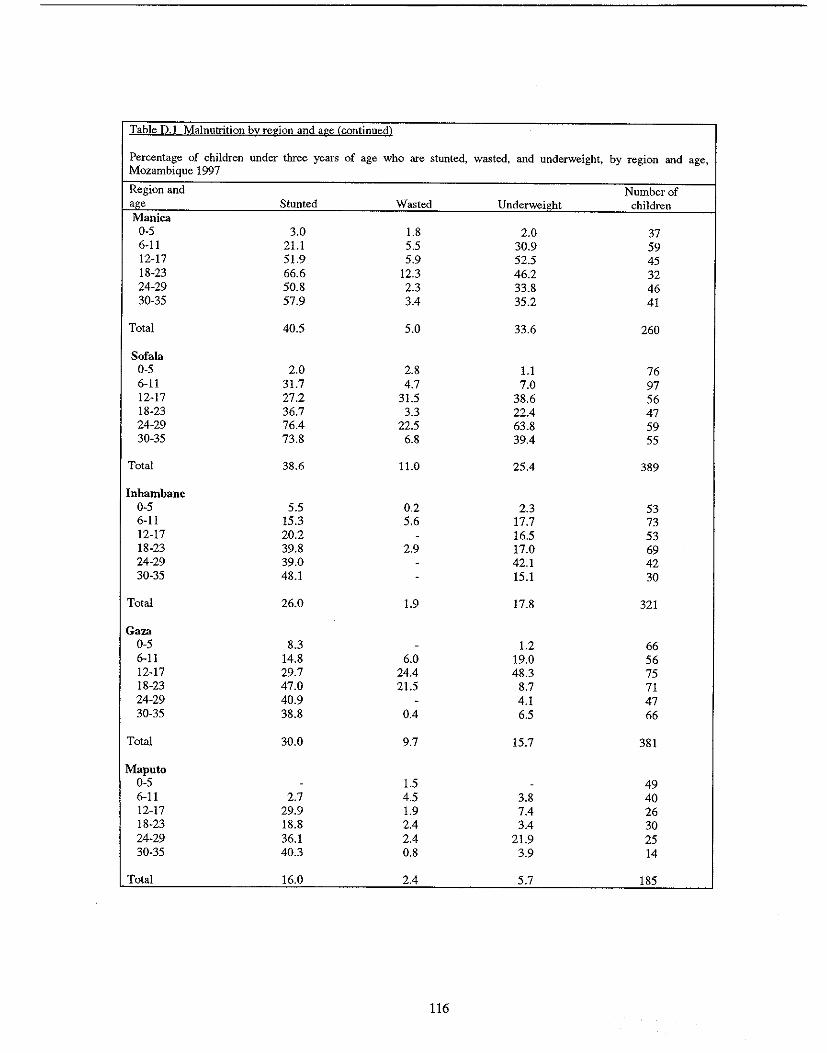
Table D.l Malnutrition by region and age (continued)
Percentage of children under three years of age who are stunted, wasted, Mozambique 1997
and underweight, by region and age,
Region and Number of aee Stunted Wasted Underweil!ht children Manica
0-5 3.0 1.8 2.0 37 6-11 21.1 5.5 30.9 59 12-17 51.9 5.9 52.5 45 18-23 66.6 12.3 46.2 32 24-29 50.8 2.3 33.8 46 30-35 57.9 3.4 35.2 41
Total 40.5 5.0 33.6 260
Sofala 0-5 2.0 2.8 1.1 76 6-11 31.7 4.7 7.0 97 12-17 27.2 31.5 38.6 56 18-23 36.7 3.3 22.4 47 24-29 76.4 22.5 63.8 59 30-35 73.8 6.8 39.4 55
Total 38.6 11.0 25.4 389
Inhambane 0-5 5.5 0.2 2.3 53 6-11 15.3 5.6 17.7 73 12-17 20.2 - 16.5 53 18-23 39.8 2.9 17.0 69 24-29 39.0 - 42.1 42 30-35 48.1 - 15.1 30
Total 26.0 1.9 17.8 321
Gaza 0-5 8.3 - 1.2 66 6-11 14.8 6.0 19.0 56 12-17 29.7 24.4 48.3 75 18-23 47.0 21.5 8.7 71 24-29 40.9 - 4.1 47 30-35 38.8 0.4 6.5 66
Total 30.0 9.7 15.7 381
Maputo 0-5 - 1.5 - 49 6-11 2.7 4.5 3.8 40 12-17 29.9 1.9 7.4 26 18-23 18.8 2.4 3.4 30 24-29 36.1 2.4 21.9 25 30-35 40.3 0.8 3.9 14
Total 16.0 2.4 5.7 185
116
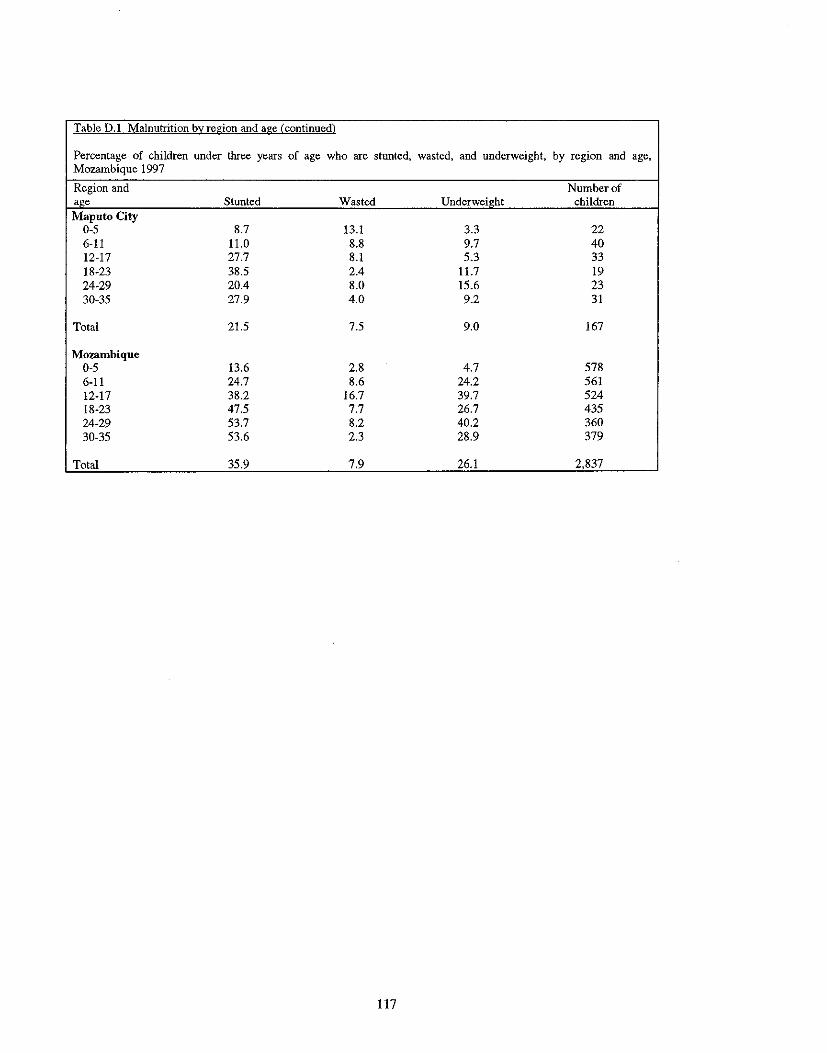
Table 0.1 Malnutrition b~region and age (continued)
Percentage of children under three years of age who are stunted, wasted, and underweight, by region and age, Mozambique 1997
Region and Number of age Stunted Wasted Underweight children Maputo City
0-5 8.7 13.1 3.3 22 6-11 11.0 8.8 9.7 40 12-17 27.7 8.1 5.3 33 18-23 38.5 2.4 11.7 19 24-29 20.4 8.0 15.6 23 30-35 27.9 4.0 9.2 31
Total 21.5 7.5 9.0 167
Mozambique 0-5 13.6 2.8 4.7 578 6-11 24.7 8.6 24.2 561 12-17 38.2 16.7 39.7 524 18-23 47.5 7.7 26.7 435 24-29 53.7 8.2 40.2 360 30-35 53.6 2.3 28.9 379
Total 35.9 7.9 26.1 2,837
117
APPENDIXE
REGIONAL, RESIDENTIAL, AND GENDER DIFFERENCES IN THE PREVALENCE OF MALNUTRITION BY CHILD'S AGE,
MOZAMBIQUE 1997
PREVIOUS PAGE BLANK
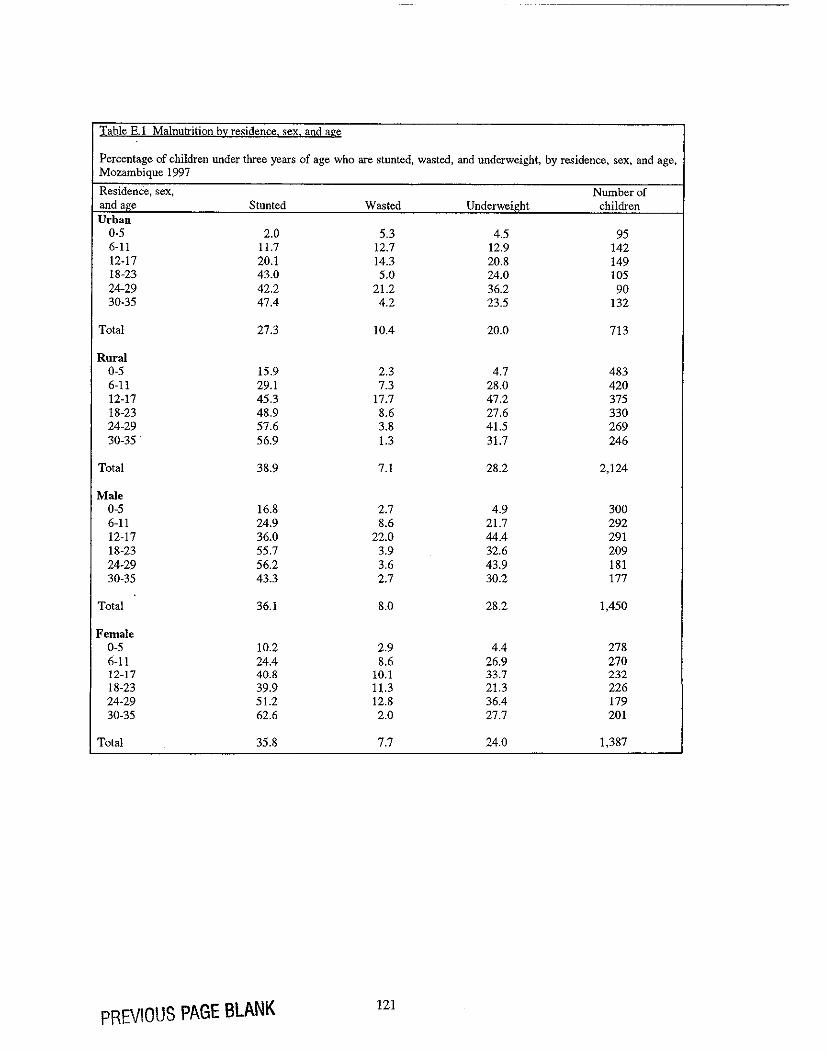
Table E.l Malnutrition by residence. sex. and age
Percentage of children under three years of age who are stunted, wasted, and underweight, by residence, sex, and age, Mozambique 1997
Residence, sex, Number of and age Stunted Wasted Underweight children Urban
0-5 2.0 5.3 4.5 95 6-11 11.7 12.7 12.9 142 12-17 20.1 14.3 20.8 149 18-23 43.0 5.0 24.0 105 24-29 42.2 21.2 36.2 90 30-35 47.4 4.2 23.5 132
Total 27.3 10.4 20.0 713
Rural 0-5 15.9 2.3 4.7 483 6-11 29.1 7.3 28.0 420 12-17 45.3 17.7 47.2 375 18-23 48.9 8.6 27.6 330 24-29 57.6 3.8 41.5 269 30-35 . 56.9 1.3 31.7 246
Total 38.9 7.1 28.2 2.124
Male 0-5 16.8 2.7 4.9 300 6-11 24.9 8.6 21.7 292 12-17 36.0 22.0 44.4 291 18-23 55.7 3.9 32.6 209 24-29 56.2 3.6 43.9 181 30-35 43.3 2.7 30.2 177
Total 36.1 8.0 28.2 1,450
Female 0-5 10.2 2.9 4.4 278 6-11 24.4 8.6 26.9 270 12-17 40.8 10.1 33.7 232 18-23 39.9 11.3 21.3 226 24-29 51.2 12.8 36.4 179 30-35 62.6 2.0 27.7 201
Total 35.8 7.7 24.0 1,387
PREVIOUS PAGE BLANK 121
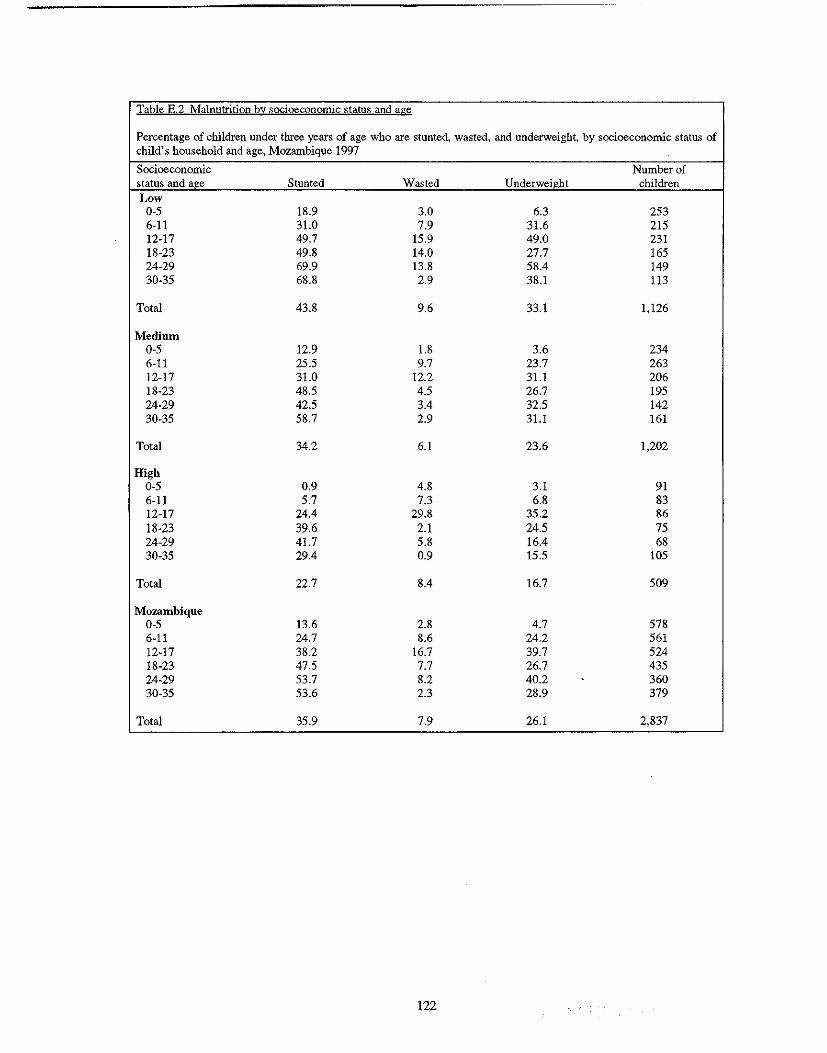
Table E.2 Malnutrition by socioeconomic status and age
Percentage of children under three years of age who are stunted, wasted, and underweight, by socioeconomic status of child's household and age, Mozambique 1997
Socioeconomic Number of status and age Stunted Wasted Underweight children Low
0-5 18.9 3.0 6.3 253 6-11 31.0 7.9 31.6 215 12-17 49.7 15.9 49.0 231 18-23 49.8 14.0 27.7 165 24-29 69.9 13.8 58.4 149 30-35 68.8 2.9 38.1 113
Total 43.8 9.6 33.1 1,126
Medium 0-5 12.9 1.8 3.6 234 6-11 25.5 9.7 23.7 263 12-17 31.0 12.2 31.1 206 18-23 48.5 4.5 26.7 195 24-29 42.5 3.4 32.5 142 30-35 58.7 2.9 31.1 161
Total 34.2 6.1 23.6 1,202
High 0-5 0.9 4.8 3.1 91 6-11 5.7 7.3 6.8 83 12-17 24.4 29.8 35.2 86 18-23 39.6 2.1 24.5 75 24-29 41.7 5.8 16.4 68 30-35 29.4 0.9 15.5 105
Total 22.7 8.4 16.7 509
Mozambique 0-5 13.6 2.8 4.7 578 6-11 24.7 8.6 24.2 561 12-17 38.2 16.7 39.7 524 18-23 47.5 7.7 26.7 435 24-29 53.7 8.2 40.2 360 30-35 53.6 2.3 28.9 379
Total 35.9 7.9 26.1 2,837
122
APPENDIXF
FEEDING PRACTICES BY AGE
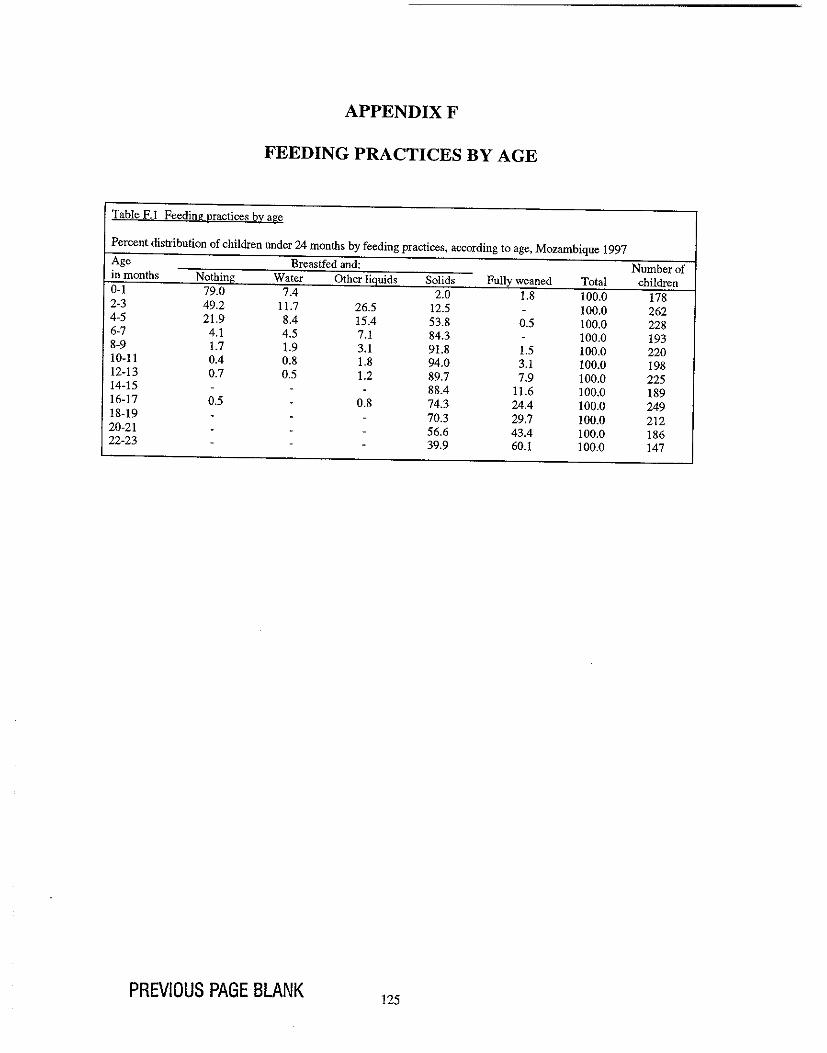
APPENDlXF
FEEDING PRACTICES BY AGE
Table F.1 Feeding practices by age
Percent distribution of children under 24 months by feeding practices, according to age, Mozambique 1997 Age Breastfed and: Number of in months Nothing Water Other liQuids Solids Fully weaned Total children 0-1 79.0 7.4 2.0 1.8 100.0 178 2-3 49.2 11.7 26.5 12.5 - 100.0 262 4-5 21.9 8.4 15.4 53.8 0.5 100.0 228 6-7 4.1 4.5 7.1 84.3 - 100.0 193 8-9 1.7 1.9 3.1 91.8 1.5 100.0 220 10-11 0.4 0.8 1.8 94.0 3.1 100.0 198 12-13 0.7 0.5 1.2 89.7 7.9 100.0 225 14-15 - - - 88.4 11.6 100.0 189 16-17 0.5 - 0.8 74.3 24.4 100.0 249 18-19 - - - 70.3 29.7 100.0 212 20-21 - - - 56.6 43.4 100.0 186 22-23 - - - 39.9 60.1 100.0 147
PREVIOUS PAGE BLANK 125
APPENDIXG
LOGISTIC REGRESSION ANALYSIS
PREVIOUS PAGE BLANK
APPENDIXG
LOGISTIC REGRESSION ANALYSIS
Logistic regression analysis is used when the dependent (or outcome) variable has only two possible outcomes: it either occurs or it does not occur. A logistic regression model estimates the probability that the event occurs. For each explanatory variable, there is a reference category against which all other categories of that variable are compared.
In this report, multivariate logistic regression techniques are used to explain (or predict) the following outcomes in Mozambican children and their mothers:
• Childhood diarrhea • Childhood stunting • Childhood wasting • Low maternal body mass index (BMI) as an indicator for chronic energy deficiency (CED).
The logistic regression models estimate the probability of (a) having diarrhea in the two weeks prior to the survey, (b) being stunted, (c) being wasted, and (d) having low maternal body mass. A forward stepwise regression procedure was used to construct the best possible model, given the available data. Conceptual frameworks were used to guide the process of selecting these variables that best explained each of the outcomes. The 1990 UNICEF Framework for Malnutrition (UNICEF, 1990) was used for the stunting and wasting regression models. Since a similar conceptual framework does not exist for diarrhea, the literature on diarrhea was consulted to identify common variables included in multivariate analyses of childhood diarrhea. A Congolese study by Mock et al. (1993) was particularly useful in classifying variables into various types of determinants of childhood diarrhea (e.g., "Maternal Sociodemographic and Health Factors," "Child Demographic and Health Factors," ''Environmental and Sanitary Factors") and identifying the variables that best represented each type of determinant. Using a woman-centered approach for improved nutrition, Johnson-Welch (1999) adapted the 1990 UNICEF framework that allows the study of maternal nutritional outcomes. For the present analysis, the analytical framework was further adapted to study low maternal BMI in Mozambique.
The regression coefficients in a logistic regression analysis represent the log odds of the effect of each explanatory factor on the outcome variable, controlling for the effects of all other factors in the model. These log odds can be converted into odds ratios by exponentiating the regression coefficients. The odds ratios are used as approximations of the relative risk of experiencing the outcome. This report presents the statistically significant relative risks of the dependent variable for a number of independent variables, for example, the relative risk of having diarrhea for children living in different regions of the country. For each explanatory variable in the model, the relative risk for the reference category is assigned a value of 1.00, and relative risks for other categories are compared with the reference category. A relative risk greater than 1.00 indicates an increased risk for the outcome compared with the reference category, while a relative risk less than 1.00 indicates a lower risk for the outcome compared with the reference category.
As an example, in Table 5.7, "average/large" is assigned a value of 1.00 because it is the reference category for the explanatory variable "perceived size at birth." The net relative risk of 1.7 for the category "small/very small" indicates that children whose mothers perceived them as small or very small at birth have a 70 percent increased risk of experiencing diarrhea during the two-week reference period compared with children whose mothers perceived them as average- or large-sized.
129
PREVIOUS PAGE BLANK
NUTRI<;AO EM AFRICA
Estado NutricionaI e de Sande das Crian~as e Maes emMo~bique
Conclusoes de Inquerito Demografico e de Sande em Mo~ambique de 1997
u.s. Agency for International Development
MACRIJ Macro International Inc. '" 1 t, ~,,~, '''~. I, '"''
Estado Nutricional e de Saude das Crian~as e Maes em Mo~ambique
Conclusoes do Inquerito Demogriifico e de Sande em Mo~ambique de 1997
Donna Espeut1
Maria de Lourdes Fildago2
Carina Hassane Sulmagnl Ismaet2 Robert Johnston Altrena Mukuria3
Macro International Inc. Calverton, Maryland EUA
F evereiro de 2001
I Johns Hopkins Universidade - Escola da Higiene e Saude Publica, 2 Ministerio da SaUde - M09ambique, 3 Macro International Inc.
jJ/
INDICE
Pag
Tabelas ............................................................................................................................................. vii Figuras .............................................................................................................................................. ix Reconhecimentos ............................................................................................................................... xi Sumario Executivo ........................................................................................................................... xiii Acr6nimos ...................................................................................................................................... xvii Mapa de Mo~ambique .................................................................................................................... xviii
CAPITULO I INTRODU<;:Ao ......................................................................................................... 1
1.1 a Contexto Social e Econ6mico ................................................................................. I 1.2 a Contexto Politico .................................................................................................... 2 1.3 Agricultura e Regime Alimentar ................................................................................ 2 1.4 Seguran~a Alimentar .................................................................................................. 3 1.5 Politicas de Nutri~liO e de Saiide em M~ambique ...................................................... 3 1.6 A Necessidade de Dados Nutricionais e de Saiide em Mo~ambique ............................ 5 1.7 Fontes de Dados e Tipos de Informa~lio Recolhida ..................................................... 5
CAPITULO 2 EST ADO NUTRICIONAL DE BEBES E CRIAN<;:AS .............................................. 7
2.1 Efeitos da Desnutri~lio ............................................................................................... 7 2.2 Indicadores Basicos do Estado Nutricional ................................................................. 9 2.3 Dados e Metodologia do Estudo ............................................................................... 10 2.4 Peso it Nascen~a ....................................................................................................... 10 2.5 PrevaJ(\ncia Geral da Desnutri~lio ............................................................................. 13 2.6 Varia~(jes Geograticas na Desnutri~lio ..................................................................... 14 2. 7 Desnutri~[o de acordo com a Idade .......................................................................... 16 2.8 Compara~lio com Outros Paises da Africa Sub-Saariana ........................................... 17 2.9 Resumo .................................................................................................................... 17 2.1 a Recomenda~(jes .......................................................................................... , ...... , ..... 18
CAPITULO 3 PRA.TICAS ALIMENTARES DOS BEBES E CRIAN<;:AS ..................................... 21
3.1 Pniticas Alimentares Adequadas dos BeMs e Crian~as ............................................. 21 3. 2 Inicia~lio it Amamenta~lio ........................................................................................ 22 3. 3 Amamenta~lio Exclusiva .......................................................................................... 25 3.4 Introdu~lio de Alimentos S6lidos .............................................................................. 27 3.5 Dura~lio da Amamenta~lio ........................................................................................ 30 3.6 RazOes para 0 Desmame ........................................................................................... 32 3.7 Compara~ao com Outros Paises da Africa Sub-Saariana ........................................... 33 3.8 Resumo .................................................................................................................... 34 3. 9 Recomenda~(jes ....................................................................................................... 34
CAPITULO 4 MORBILIDADE E MORT ALIDADE ..................................................................... 37
4.1 Mortalidade Infantil e de Menores de Cinco Anos .................................................... 37
Hi
Pag
4.2 Compara~ao com Outros Paises da Africa Sub-Saariana .............................................. 39
4.3 A Rela~ao entre a Desnutri<;:ao e a Mortalidade ............................................................ 40
4.4 Contribui<;:ao da Desnutri<;:ao para a Mortalidade de Menores de Cinco Anos .............. 40
4.5 Padroes de Morbilidade Regionais e Especfficos da Idade ........................................... 41
4.6 Padroes de Procura de Assistencia e Tratamento para as Doen<;:as Infantis
Comuns .......................................................................................................................... 44
,I 4.7 Conhecimento e Atitudes Matemos no que Diz Respeito ao Tratamento da
Diarreia nas Crian<;:as ..................................................................................................... 47
4.8 Factores Associados a Diarreia ...................................................................................... 49
4.9 Resumo .......................................................................................................................... 55
4.10 Recomenda<;:6es ............................................................................................................. 55
CAPITULO 5 FACTORES ASSOCIADOS A DESNUTRI<;:Ao ........................................................ 57
5.1 Caracterfsticas Biol6gicas e de Saude da Subnutri<;:ao Cr6nica ..................................... 57
5.2 Caracteristicas Biol6gicas e de Saude da Subnutri<;:ao Aguda ....................................... 59
5.3 Caracterfsticas Socioecon6micas e Demognificas da Subnutri~ao Cr6nica .................. 60
5.4 Caracterfsticas Socioecon6micas e Demognificas da Subnutri<;:ao Aguda .................... 61
5.5 Analise de Retrocesso Multidimensional ...................................................................... 63
5.6 Factores de Risco para a Subnutri~ao Cr6nica .............................................................. 65
5.7 Factores de Risco para a Subnutri<;:ao Aguda ................................................................ 68
5.8 Resumo .......................................................................................................................... 69
5.9 Recomenda<;:oes ............................................................................................................. 69
CAPITULO 6 EST ADO NUTRICIONAL DAS MULHERES ............................................................ 73
6.1 Antecedentes .................................................................................................................. 73
6.2 Dados Recolhidos .......................................................................................................... 75
6.3 Indicadores do Estado Nutricional Matemo .................................................................. 76
6.4 Altura, Peso e Indice de Massa Corporal ...................................................................... 77
6.5 Carencia Energetica Cronica Materna ........................................................................... 83
6.6 Resumo .......................................................................................................................... 84
6.7 Recomenda~oes ............................................................................................................. 84
CAPITULO 7 PRINCIPAlS RECOMENDA<;:OES ............................................................................ 85
7.1 Seguran~a Alimentar ..................................................................................................... 85
7.2 Bem-Estar das Mulheres ................................................................................................ 86
7.3 Cuidados Primarios de Saude ........................................................................................ 87
7.4 Amamenta<;:ao e Nutri<;:ao da Crian<;:a ............................................................................ 87
7.5 Informa~ao, Educa~ao e Comunica~ao ......................................................................... 87
7.6 Investiga<;:ao ................................................................................................................... 88
REFERENCIAS ...................................................................................................................................... 89
iv
/'3}
APENDICEA APENDICEB APENDICEC APENDICED APENDICEE
APENDICEF APENDICEG
Pag
Plano de Sondagem ................................................................................................... 97 Caracteristicas basicas do agregado familiar e responsaveis ..................................... 101 Verifica<;ao dos Dados Antropometricos .................................................................. 115 Desnutri<;ao Entre Crian<;as dos 3 aos 35 Meses, Mo<;ambique 1997 ........................ 119 Diferen<;as Regionais, Residenciais e de Sexo na Preval6ncia da Desnutri<;ao pela Idade da Crian<;a, Mo<;ambique 1997 ............................................ 125 Praticas AIimentares segundo a Idade ...................................................................... 129 Retrocesso Logistico ............................................................................................... 133
v
Tabela 2.1 Tabela 2.2
Tabela 3.1 Tabela 3.2 Tabela 3.3 Tabela 3.4
Tabela 3.5 Tabela 3.6
Tabela 4.1 Tabela 4.2 Tabela4.3 Tabela 4.4 Tabela4.5 Tabela4.6 Tabela4.7
Tabela 5.1 Tabela5.2 Tabela 5.3
Tabela 6.1 Tabela 6.2 Tabela 6.3
Tabela 6.4 Tabe\a 6.S Tabela 6.6
Tabela B.l Tabela B.2 Tabela B.3 Tabela B.4 Tabela B.5 Tabela B.6 Tabela B.7 Tabela B.8 Tabela B.9 Tabela B.1O Tabela B.ll Tabela B.12 Tabela B.13 Tabela B.14 Tabela B.15
TABELAS
Pag
Peso e tamanho a nascenya para crianyas menores de tres anos de idade ......................... 11 Subnutriyao cr6nica, subnutriyao aguda e insuficiencia de peso ...................................... 14
Infcio da amamentayao ................................................................................................... 24 Prevalencia da amamentayao excIusiva .......................................................................... 26 Tipo de alimentos ingeridos por crianyas vivas nas 24 horas anteriores ........................... 29 Tipo de alimentos ingeridos por crianyas vivas nao amamentadas nas 24 horas anteriores ............................................................................... '" ....................... 30 Durayao e frequencia medias da amamentagao: caracterfsticas Msicas ............................ 31 Causas do desmame ....................................................................................................... 33
Taxas de mortalidade infantil e de menores de cinco anos de idade ................................. 38 Prevalencia e tratamento da diarreia, febre e tosse .......................................................... 42 Fonte de tratamento para a diarreia e tosse ...................................................................... 45 Atitudes e pnlticas no que diz respeito aos cuidados a ter em caso de diarreia ................. 46 Conhecimento dos cuidados a ter com a diarreia ............................................................. 47 Utilizayao da terapia de re-hidratayao oral para 0 tratamento da diarreia ........................ .48 Prevalencia e estimativa das probabilidades relativas lfquidas de diarreia entre as crianyas menores de tres anos de idade ....................................................................... 50
Subnutrigao cr6nica e subnutriyao aguda por caracteristicas biol6gicas ........................... 58 Subnutrigao cr6nica e subnutrigao aguda por caracteristicas socioecon6micas ................ 62 Probabilidade relativa Ifquida estimada de subnutrigao cr6nica e subnutriyao aguda ....... 67
Nfveis de aumento de peso recomendado para as mulheres gravidas ............................... 74 Distribuigao das idades das maes .................................................................................... 75 Altura, peso e fndice de massa corporal (IMC) para todas as maes e que nao estavam gravidas ..................................................................................................... 76 Distribuiyao da altura das miles em Moyambique, 1997 .................................................. 77 Distribuigao do peso e da IMC da mae ........................................................................... 78 Prevalencia e probabilidades relativas lfquidas estimadas de urn fndice de massa corporal baixo e elevado entre maes nao gravidas, por caracteristicas basicas ................. 79
Tipo de local de residencia ........................................................................................... 103 Dados antropometricos das criangas ............................................................................. 104 Nllmero medio de criangas vivas e mortas .................................................................... 104 Idade da mae ................................................................................................................ 105 Instrugao da mae .......................................................................................................... 105 Ocupayao da mae ......................................................................................................... 106 Responsaveis pelas crianyas de maes que trabalham fora de casa .................................. 107 Sexo do chefe de famt1ia .............................................................................................. 107 Estado civil da mae ...................................................................................................... 108 Instruyao do companheiro ............................................................................................ 109 Ocupayao do companheiro ........................................................................................... 109 Instalayoes sanitarias .................................................................................................... 110 Fonte de agua potavel... ............................................................................................. '" 111 Tipo de piso ................................................................................................................. 111 Contacto com os meios de comunicayao ....................................................................... 112
vii
Tabela B.16 Tabela B.17 Tabela B.18
Tabela C.I TabelaC.2
Tabela D.I
TabelaE.1 TabelaE.2
TabelaF.l
Pag
Estado socioecon6rnico ................................................................................................. 113 Assistente pre-natal ...................................................................................................... 114 Assistencia ao parto ...................................................................................................... 114
Caracteristicas das crian~as com dados antropometricos incomp1etos ............................ 117 Esco1ha de algarismos nos dados antropometricos ......................................................... 118
Desnutri~ao por regiao e idade ...................................................................................... 121
Desnutri~ao por sexo, tipo de local de residencia e idade ............................................... 127 Desnutri~ao pelo estado socioecon6rnico e idade .......................................................... 128
Praticas alimentares segundo a idade ............................................................................. 131
viii
/%
Figura 2.1 Figura 2.2 Figura 2.3
Figura 2.4
Figura 2.5
Figura 2.6
Figura 3.1 Figura 3.2
Figura 3.3 Figura 3.4
Figura 4.1
Figura 4.2 Figura 4.3 Figura 4.4
Figura 6.1
FIGURAS
Pag
Causas da Desnutric;:ao ..................................................................................................... 8 Desnutric;ao entre as crianc;as menores de tres anos de idade, Moc;ambique ..................... 13 Subnutric;ao cr6nica e subnutrigao aguda entre as crianc;:as menores de tres anos de idade por regiao, Moc;ambique ....................................................................................... 15 Subnutrigao cr6nica, subnutric;:ao aguda e insuficii~ncia de peso segundo a idade, Moc;ambique .................................................................................................................. 15 Subnutrigao cr6nica entre as crianc;as menores de tres anos de idade nos pafses da Africa Sub-Saariana, inqueritos do IDS 1991-1997 ........................................................ 16 Subnutric;:ao Cr6nica entre as Criangas Menores de 3 Anos de Idade nos Pafses da Africa Sub-Saariana, Inqueritos do IDS 1991-1998 .................................................... 17
Pniticas alimentares para beMs menores de 4 meses de idade, Moc;ambique ................... 25 Amamentagao exc1usiva entre beMs menores de 4 meses de idade por resid6ncia e regiao, Moc;ambique .................................................................................................... 27 Pnlticas alimentares para os beMs entre os 6 e os 9 meses de idade, Moc;ambique .......... 28 Crianc;as dos 6 aos 9 Meses de Idade que sao alimentadas com alimentos s6lidos como complemento ao leite materno por resid6ncia e provincia, Moc;ambique ................. 28
Taxa de mortalidade de menores de cinco anos em Mogambiqne comparada com a taxa de outros pafses da Africa Sub-Saariana ........................................................ 39 Estado de sobreviv6ncia e estado nutricional das criangas, Moc;ambique ......................... 40 Desnutrigao e mortalidade de menores de cinco anos, Moc;ambique ................................ 43 Diarreia segundo a idade da crianga, Moc;ambique .......................................................... 43
Estrutura para a Nutrigao Feminina ................................................................................ 81
ix
Reconhecimentos
Os autores deste relat6rio desejam agradecer a varias pessoas pelas contribui90es valiosas que prestaram a este trabalho. Queremos exprimir a nossa gratidao it Sra. Hope Sukin, da Divisao para a Africa do USAID, que foi a principal promotora deste projecto. 0 nosso reconhecimento vai tambem para os individuos da Macro International que participaram no Grupo de Trabalho e na Produ9ao do relat6rio. A Sra. Theresa Richardson e a Sra. Stephanie Kratz organizaram todos os aspectos logisticos do Grupo de Trabalho e prestaram urna valiosa assistencia it equipa m09ambicana. Casey Wisecarver prestou uma importante colabora9ao na revisao do relat6rio final. Kaye Mitchell preparou 0 relat6rio para publica9ao e Sidney Moore fez a sua edi9ao.
xi
SUillario Executivo
A desnutric;:ao e urn dos problemas mais importantes de saude e bern estar entre as crianc;:as em Moc;:ambique, resultando em consequencias econ6micas e de saude graves, para 0 individuo e para a nac;:ao. Trinta e seis por cento das crianc;:as moc;:ambicanas com idades compreendidas entre 0 e 35 meses sofrem de desnutric;:ao cr6nica, oito por cento sofrem desnutric;:ao aguda, e vinte e seis por cento possuem uma insuficiencia de peso. Oas crianc;:as que sofrem de desnutric;:ao cr6nica, quarenta e quatro por cento sofrem de clase grave. Mais de urn quarto das crianc;:as que sofrem de desnutric;:ao aguda sofrem de clase grave. Esta prevalencia alta de desnutric;:ao cr6nica e provavelmente uma consequencia de inseguranc;:a alimentar e de escassez de alimentos prolongada (PMI, 1996) Os niveis altos tamMm podem reflectir os niveis altos de doenc;:a, em particular as doenc;:as diarreicas (Molbak et aI., 1977; Cliff e Noormabomed, 1988; Ministerio da Saude e Faculdade de Medicina - Universidade Eduardo Mondiane, 1988).
Ha urn padrao especifico de idade distinto de desnutric;:ao cr6nica e desnutric;:ao aguda entre crianc;:as menores de tres anos de idade. Em Moc;:ambique, M urna tendencia geral para urn aurnento da prevaH~ncia da desnutric;:ao cr6nica com 0 aurnento da idade. Esta tendencia aurnenta ate 60 por cento por volta da idade de 25 meses, diminui durante a primeira metade do terceiro ano de vida, e comec;:a a subir novamente ao final do terceiro ano. 0 padrao geral da idade em relac;:ao a insuficiencia de peso assemelha-se ao da desnutric;:ao cr6nica. As variac;:oes da idade na prevalencia da desnutric;:ao aguda nao sao tao marcadas como as da desnutric;:ao cr6nica e as da insuficH~ncia de peso porem, verifica-se ainda urn padrao relativo a idade. 0 pico da prevalencia da desnutric;:ao aguda ocorre mais cedo do que 0 da desnutric;:ao cr6nica, por volta dos 16 meses de idade, sendo essa prevalencia inferior a 20 por cento. A prevalencia da desnutric;:ao aguda ronda os 10 por cento em relac;:ao a segunda metade do segundo ano e a primeira metade do terceiro ano. Oepois do 26° mes aurnenta a prevalencia, que depois baixa ate ni veis pr6ximos de zero durante 0 resto do terceiro ano.
Oeve-se notar que durante as primeiras fases da infaucia 0 padrao da idade em relac;:ao a desnutric;:ao aguda assemelha-se ao padrao de idade de alimentac;:ao infantil. Com a introduc;:ao de Jiquidos complementares e alimentos s6Jidos, a desnutric;:ao aguda aurnenta. Entre crianc;:as com menos de tres anos, a durac;:ao media da amamentac;:ao exclusiva (so leite materno) e pouco menos de urn meso Embora a taxa de amamentac;:ao durante os primeiros seis meses de vida seja inferior a recomendada em Moc;:ambique, a durac;:ao media de amamentac;:ao completa (leite materno e agua) e de quase quatro meses. A maior parte das crianc;:as e amamentada ate ao segundo ano de vida. Oitenta e cinco por cento das crianc;:as com 6-9 meses de idade comiam alimentos complementares alem do leite materno. A durac;:ao da amamentac;:ao era de 22 meses, 0 que e consistente com as recomendac;:oes de amamentac;:ao. Nao obstante, quando os cereais e outros alimentos sao introduzidos numa fase precoce, isso aurnenta 0 perigo de a crianc;:a ficar subnutrida ou doente. Assim, M necessidade de se educar as miles sobre os beneficios da amamentac;:ao exclusiva e as praticas de desmame adequadas a idade da crianc;:a.
Em Moc;:ambique, de entre cada 1,000 crianc;:as nascidas 135 morreram antes de completar urn ana de idade. Entre as crianc;:as de menos de 5 anos de idade, 201 de entre cada 1,000 morreram antes de atingir os cinco anos de idade. A desnutric;:ao e urn factor importante para a mortaJidade infantil. Uma estimativa indica que 44 por cento das mortes entre crianc;:as com menos de 5 anos de idade estao relacionadas com a desnutric;:ao. A desnutric;:ao moderada contribui para uma maior numero de mortes na mortaJidade infanto-juvenil que a desnutric;:ao grave (33 por cento contra 11 por cento). Por conseguinte, intervenc;:oes de nutric;:ao para prevenir, buscar, e tratar todos os tipos de desnutric;:ao, em particular casos moderados, podem ter urn impacto forte sobre a sobrevivencia das crianc;:a em Moc;:ambique.
Entre as crianc;:as incluidas no inquerito, 21 por cento tiveram episodios diarreicos nas duas semanas anteriores ao inquerito. A diarreia segue urn padrao de idade semelhante ao da desnutric;:ao aguda, com uma tendencia crescente ao longo de infaucia, alcanc;:ando 0 pico entre os 14 e os 16 meses de
xiii /J1
idade. A diarreia, frequentemente, resulta em perda de liquidos e desidrata<;ao, a diminui<;ao de comer e beber devido a anorexia, absorvimento pobre e perda dos nutrientes, ilustrando os padroes semelhantes entre diarreia e desnutri<;ao aguda. Alem de Terapia de Re-hidrata<;ao Oral (TRO), tamMm M solu<;oes recomendado de casa feito de produtos disponfveis na casa utilizado para re-idrata<;ao oral. Menos de 50 por cento das mlies com crianvas que tiveram epis6dios diarreicos nas duas semanas anteriores informaram 0 usa de urn de qualquer terapia de re-idrata9lio oral. Adicionalmente, durante 0 periodo de refer~ncia de duas semanas, apenas 44 por cento das crian<;as doentes receberam quantidades aumentadas de liquidos durante a doen<;a.
o estado nutricional das mulheres antes de concep<;ao e durante a gravidez e importante como urn indicador geral da sande de mulheres e como urn predictor do resultado de gravidez para ambos a mae e crian<;a. Em M09ambique, 12 por cento de nlio-amamentando e 11 por cento de amamentando, mulheres nao-gnividas sofrem da car~ncia energetica cr6nica (CEC) que pode por as mulheres e as gravidezes atnais e futnras a risco. Ao outro lado, 14 por cento de maes nao-amamentando e 8 por cento de mulheres amamentando e nao-gnividas t~m 0 exceso de peso que pode por a risco para a diabetes e a doen<;a cardiovascular.
As anaJises dos factores relacionados a saude infantil e maternal ilustra a natureza de complicada do problema de nutri<;ao em Mo<;ambique para crian<;as e suas maes. Porem, porque as causas imediatas de desnutri<;ao sao consum~ inadequado dos aIimentos e doenl(a. Pelas duas causas, estrategias curtoprazo e longo-prazo sao necesarias. Estrategias importantes selecionadas incluem 0 seguinte:
Disponibilidade de Alimentos
• Garantir a seguranl(a de possulr de terra como meio pelos quem trabalham na agricultnra sao encorajados melhorar e diversificar produ<;ao de uma maneira sustentavel.
• Promover a transfer~ncia de tecnologia para agricu1tores para aurnentar produl(ao e produtividade e reduzir as perdas de poste-colheita.
• Continuir a pesquisa da possibilidade de criar urn sistema de manutenl(ao para tener alimentos de reserva as nfveis do distrito, dos provincias e nacional.
• Fortalecer servil(os do ajuda social para populal(oes que morem nas areas vulneraveis.
Acesso Econ6mico aos Alimentos Disponfveis
• Melhorar as infra-estruturas rurais (e.g., estradas, abastecimento de ligua, instala<;oes da sande, escolas) atraves de programas de emprego de mao-de-obra intensiva a fim de beneficiaras popula<;oes das areas mais vulneraveis.
• Promover actividades lucrativas pelo meio de formal(ao profissionai e de concessao de credito para comel(ar pequenas empresas nas areas urbanas onde a preferencia domestica e comprar comida comercial em vez de depender de subsistencia agricola.
• Implementar programas novos para reduzir a ajuda alimentar estrangeira, utilizar os alimentos da ajuda alimentar como uma parte de pagamentos de salario a pessoas empregadas atraves dos programas de mao-de-obra intensiva.
o Bem-estar das Mulheres
• Aumentar 0 acesso das mulheres ao credito e a outros servil(os financeiros.
xiv
• Aumentar as oportunidades educacionais para as mulheres.
• Dentro do Programa Nacional para as Mulheres e Crian~as, incorporar uma divisao dedicada 11 nutri~ao e a saude das mulheres aMm do ambito da maternidade e da reprodu~ao.
• Establecer os programas de suplementa~ao de micro-nutrientes (e.g., ferro, acido folico, vitamina A) dedicados a mulheres gravidas e a amamentar.
Cuidados medicos primarios
• Establecer os programas da saude integrada e interven~ao de nutri~ao que atendam tambem ao controlo da nataIidade, a nutri~ao e aos componentes dos cuidados medicos primarios.
• Para solucionar 0 acesso Iimitado aos cuidados de saude, estabelecer postos rurais pequenos destinados principalmente 11 preven~ao primaria e secundaria da desnutri~ao e da doen~a.
• Promover Controlo Integrado das Doen~as Infantis (CID!).
Amamentacao e Nutricao Infantil
• Desenvolver uma po)ftica nacional relativa ao HlY e a amamenta~ao.
• Treinar os profissionais medicos sobre a importancia da introdu<;ao da amamentacao ao peito na primeira fase da infancia, da amamenta<;ao continuo e da alimenta~ao apropriada 11 idade (e.g., a introdu~ao de alimentos complementares, idade de desmame).
• Establecer e manter a conformidade, nos hospitals e nas c1inicas das regras do programa Internacional dos Hospitais Amigos da Crian~a (IHAC).
• Establecer programas de nutri~ao e cuidados primarios de saMe voltados para as 200,000 crian~as 6rfiis ou separadas das fanulias.
Informacao. Educacao e Comunicacao
• Utilizar os meios de comunica<;ao para promover padr6es nutricionais e comportamentos correctos que melhorem a saude das mulheres e das crian~as.
Pesquisa
• Apoiar a pesquisa qualitativa que investiga factores relacionados com os cuidados de saude e a percep<;ao da comunidade relativa 11 alimenta<;1io das crian<;as, ao HlY, 11 aceita<;ao de alimentos micro-nutrientes ricos locais, 11 saUde adolescente e 11 nutri<;1io materna.
xv
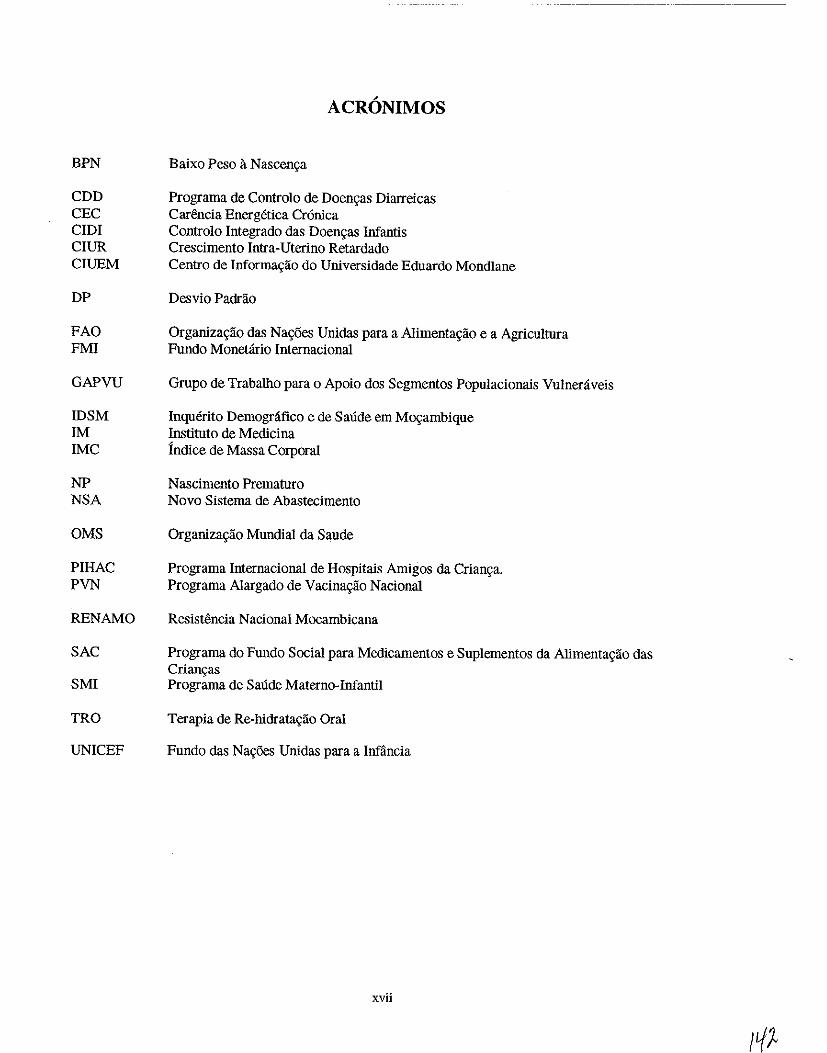
BPN
CDD CEC CIDI CIUR CIUEM
DP
FAO FMI
GAPVU
IDSM 1M IMC
NP NSA
OMS
PIHAC PVN
RENAMO
SAC
SMI
TRO
UNICEF
ACRONIMOS
Baixo Peso 11 Nascen~a
Programa de Controlo de Doen~as Diarreicas Car~ncia Energetica Cr6nica Controlo Integrado das Doenc;as Infantis Crescimento Intra -Uterino Retardado Centro de Informac;:ao do Universidade Eduardo Mondlane
Desvio Padrao
Organizac;ao das Nac;oes Unidas para a Alimenta~ao e a Agricultura Fundo MoneUirio Internacional
----- - ._---------
Grupo de Trabalho para 0 Apoio dos Segmentos Populacionais Vulneniveis
Inquerito Demografico e de SaUde em M~ambique Instituto de Medicina Jndice de Massa Corporal
NascimentoPrematuro Novo Sistema de Abastecimento
Organizac;ao Mundial da Sande
Programa Internacional de Hospitais Amigos da Crian~a. Programa Alargado de Vacinac;ao Nacional
Resist~ncia Nacional Mocambicana
Programa do Fundo Social para Medicamentos e Snplementos da Alimentac;ao das Crianc;as Programa de SaUde Materno-Infantil
Terapia de Re-hidratac;ao Oral
Fundo das Nac;6es Unidas para a Infancia
xvii
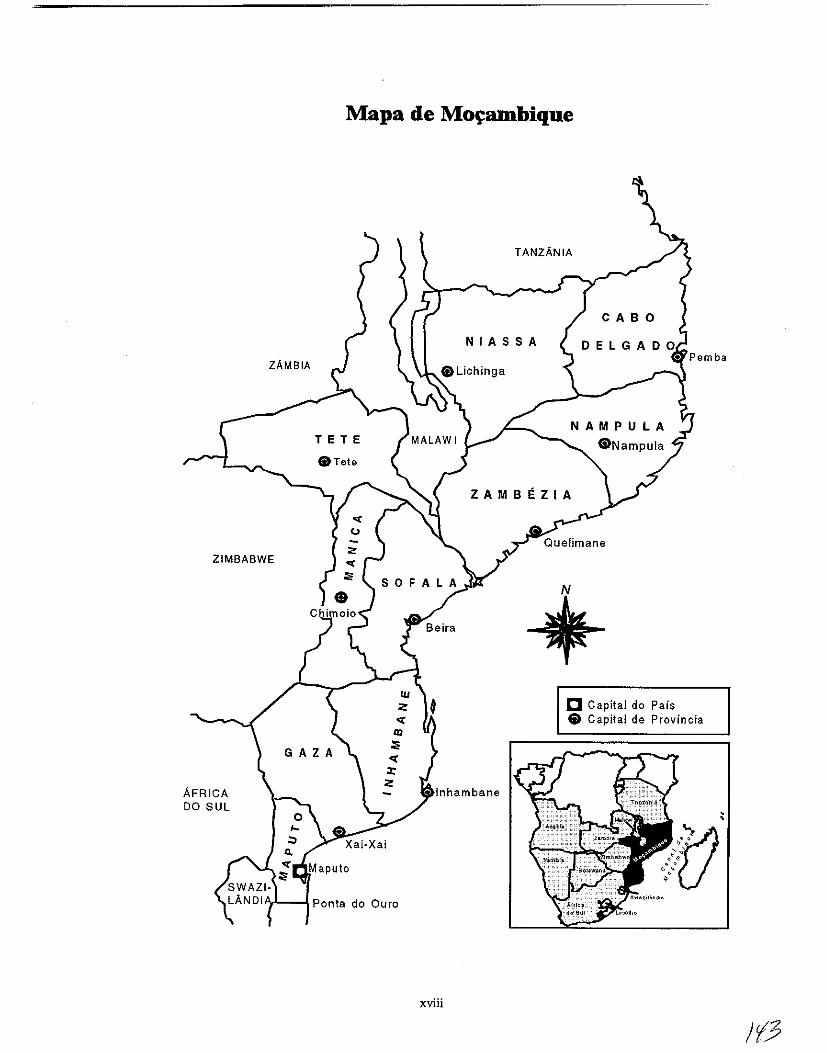
Mapa de Mo~ambique
ZAMBIA
ZIMBABWE
AFRICA DO SUL
Maputo
¥---\ Ponta do OUro
xviii
TANZANIA
CABO
NIASSA
ZAMBEZIA
[] Capital do Pais e Capital de Provincia
113
CAPITULO 1
INTRODU<;A.O
1.1 0 Contexto Social e Economico
Localizada no Sul de Africa, a Republica de Mos;ambique e urn pais com uma populas;iio total cerca de 17 milhOes de pessoas. A lingua oficial e 0 Portugues embora existam bastantes Ifnguas indigenas. Mos;ambique e composto quase totalmente por grupos etnicos indigenas tais como os Shangaan, Chokwe, Manyika, Sena e Makua (CIUEM, 1999). Europeus, indianos, e outros grupos constituem menos de 1 % da populas;ao total. No que diz respeito a religilio, a maioria da populas;ao segue crens;as indigenas, sendo os restantes cristaos, mus;ulmanos e hindus (CIUEM, 1999).
A populas;iio em Mos;ambique e predominantemente rural; menos de urn ters;o e oficialmente definida como urbana (Fundo Monetario Internacional (PMI), 1996). Com urn rendimento per capita no anD de 1997 abaixo dos 100 d61ares (UNICEF, 1998), a pobreza e generalizada. Aproximadamente 60% da populas;ao vive abaixo da linha de pobreza e quase 70% de todos os agregados familiares pobres residem em areas rurais (PMI, 1996). Para alem disso, 0 acesso 11 agua potavel e urn luxo para a maioria dos mos;ambicanos: 66% dos moradores urbanos e s6 12% dos moradores rurais possuem agua canalizada (Governo do Mos;ambique, 1998). Apesar destas condi<;oes de vida estarem 10nge de ser as ideals, Mos;ambique ultrapassa muitas na<;oes pobres em areas criticas do desenvolvimento social, tais como a esperan<;a de vida (47 anos), inscri<;ao no ensino primario (60%), e nNel de alfabetizas;ao dos adultos (40%) (UNICEF, 1998).
Embora se tenham atingido lucros econ6micos nos Ultimos anos, a guerra civil dos anos 80 destrufram grande parte das infraestruturas do pais e deram origem a grandes entraves no desenvolvimento. Para alem disso, havia cerca de quatro milhOes de pessoas dessalojadas que tinham abandonado as suas casas, das areas rurais, durante a guerra e pelo menos dois milhOes de mos;ambicanos procuraram refUgiO em paises africanos vizinhos (Banco Mundial, 1997; Cliff e Noormahomed, 1993). Este grande numero de desalojados tern tido grandes consequencias sociais e demograficas. Urna dessas consequencias foi a migra<;iio generalizada das areas rurais para as urbanas. A popula<;iio mo<;ambicana urbana tem vindo a crescer numa taxa de quase 9% por ano - a mais rapida taxa de crescimento urbano do mundo (Centro para a Informa<;ao de Saude Internacional (CIS I), 1995). Este crescimento urbano deu-se sem 0 devido planeamento e organiza<;ao, dando origem a problemas como 0 excesso de populas;ao e inadequados servi<;os de agua e saneamento (Ministerio para a Coopera<;iio e UNICEF, 1990) - condi<;oes que poem em perigo 0 bem-estar dos moradores urbanos, especialmente as crians;as. Em 1992 terminou a guerra civil, e a grande maioria dos refugiados regressou a Mos;ambique ate finals de 1994 (CISI, 1995). o processo de reintegrac;ao social tern sido complicado e os antigos refugiados enirentam muitas dificuldades socials e econ6micas, tentando recuperar e voltar ao que eram antes da guerra.
Mos;ambique esta agora no meio de uma transis;iio da guerra para a paz. 0 governo esta a tentar revitalizar a economia, reconstruir infraestruturas, e melhorar 0 estado social, econ6mico e de saude dos seus cidadaos. Inumeras agencias doadoras e organizas;oes multinacionais tern tambem estado a apoiar no desenvolvimento econ6mico e social do pais.
Tendo em conta que 0 pais possui grandes extensoes de terra ferteis e incultivadas, bern como recursos naturais tais como 0 carviio, tit1inio e gas natural, M urn enorme potencial para 0 crescimento econ6mico em Mos;ambique. A medida que Mos;ambique se afasta da dependencia da ajuda externa para urn grau mais elevado de auto-suficiencia, existe a possibilidade de urn aumento da produs;ao de culturas tradicionalmente exportadas, como por exemplo citrinos e caju, e de urn alargamento das exportas;oes para produtos, como 0 algodiio e camariio. A participas;ao na industria exportadora daria a fannlia
1
moc;:ambicana media uma fonte de rendimento suplementar, 0 que por seu lado poderia melhorar 0 seu nivel social, econ6mico e de saude.
No que diz respeito ao rendimento familiar, a agricultura e 0 pilar da economia do agregado familiar rural, embora seja caracterizada principalmente por uma explorac;:ao agricola de subsistencia (PMI, 1996). Apenas 29% dos agregados familiares rurais vendem a sua produc;:ao agricola (pMI, 1996). As mulheres sao essenciais para a economia da fanulia rural, constituindo 61 % da mao-de-obra agricola (Ministerio para a Cooperac;:ao e UNICEF, 1990). Ao contnirio das areas rurais, actividades nao registadas, como 0 comercio em pequena escala, sao as principais fontes de rendimento para os agregados familiares urbanos. Esta grande dependencia de actividades nao registadas e uma consequencia directa do elevado desemprego e de um declfnio nos salarios reais nas areas urbanas (pMI, 1996). As muIheres pobres, que nao tenham 0 capital nem as competencias educacionais e ocupacionais para iniciar actividades mais rent:iveis, sao as principais responsaveis pelas actividades nao registadas. Embora as muIheres urbanas pobres nao tenham formac;:ao formal, demonstram um razo:ivel nivel de conhecimento de neg6cios e sao responsaveis pelo sustento da fanulia. Devido ao seu importante papel nas economias das fanulias rurais e urbanas, as mulheres moc;:ambicanas sao muitas vezes forc;:adas a desenvolver actividades geradoras de rendimentos em detrimento de outras actividades, como por exemplo os cuidados de saMe e a educac;:ao das crianc;:as (Ministerio para a Cooperac;:ao e UNICEF, 1990).
1.2 0 Contexto Politico
Em 1975, Moc;:ambique conseguiu a independ6ncia de Portugal. Pouco tempo depois, os dissidentes do governo fundado M pouco formaram a Resistencia Nacional Moc;:ambicana (Renamo). Este movimento da resistencia armada, que era apoiado pelo governo sul-africano, lanc;:ou urn esforc;:o de instabilidade em grande escala em Moc;:ambique entre 1985 e 1992 (Cliff e Noormahomed, 1993). A guerra civil concentrou-se especialmente nas areas rurais, quebrando a organizac;:ao social e destruindo as inftaestruturas rurais, em particular nos sectores agricola, saude e educac;:ao.
Ap6s anos de convulsoes sociais e econ6micas, Moc;:ambique esta finalmente a fazer a transic;:ao da guerra para a paz. Hoje em dia, sao tres os principais partidos politicos: a Frente de Libertac;:ao de Moc;:ambique (prelimo), a Resistencia Nacional Moc;:ambicana (Renamo) e a Uniao Democratica (UD). Moc;:ambique teve as suas primeiras eleic;:oes democr:iticas em Outubro de 1994, resultando na eleic;:ao do Presidente Joaquim Chissano, um membro do partido da Frelimo (CISI, 1995).
Como ja foi referido, Moc;:ambique e uma Republica com urn governo Democratico. H:i 10 provincias que funcionam como unidades administrativas: Cabo Delgado, Gaza, Inhambane, Manica, Maputo, Nampula, Niassa, Sofala, Tete e ZamMzia. A capital de Moc;:ambique, Maputo, funciona como uma entidade separada da provincia de Maputo e tamMm e vista como uma unidade administrativa independente. Deste modo M II divisoes administrativas dentro do pais. Tern havido urn movimento para uma maior descentralizac;:ao do governo, permitindo a cada provincia uma maior liberdade para tomar decisoes e distribuir recursos.
1.3 AgricuItura e Regime Alimentar
A agricultura, que e dominada por pequenas propriedades agricolas familiares, e 0 principal sector em Moc;:ambique. Recentemente, 0 governo moc;:ambicano comec;:ou a alargar os mercados de exportac;:ao para estas culturas, para alem de outros produtos como os citrinos, camarao e 0 ac;:ucar. Algumas fanu1ias agricolas, especialmente nas provincias do Norte, geram rendimentos suplementares com 0 cultivo de culturas para comercializac;:ao como 0 coco, algodao e caju. Ao contrario dos moradores rurais, os moc;:ambicanos urbanos geralmente nao estao envolvidos em actividades agricolas, e uma pequena proporc;:ao destes trabalham como migrantes tanto dentro do pais como em paises vizinhos.
2
/,/5
Cerca de 80% dos m~ambicanos recorrem a agricultura de subsistencia para satisfazer as suas necessidades a1imentares diarias. As culturas de subsist~ncia como 0 milho, arroz, mandioca e mapira sao os principais alimentos de base dos mo~ambicanos. 0 61eo vegetal e 0 a~ucar sao regularmente usados. Apesar da sua importancia para a fal1ll1ia media, a industria agricola sofreu bastante com a guerra. Durante os anos 80, a produ~ao de culturas sofreu uma queda substaucial, oferecendo menos de 10% das exigencias calculadas para a popula~ao urbana e para a popula~[o rural desalojada (Ministerio para a Coopera~ao e UNICEF, 1990). A ingestao diaria de calorias em M~ambique e bastante baixa; 0 regime alimentar medio fornece apenas 77% das exigencias alimentares (CISI, 1995). Embora 0 governo esteja a tomar medidas para a reconstru~ao do sector agricola e para a estabiliza~ao da economia nacional, h3. uma preocupa~ao valida com 0 estado nutricional presente e futuro dos m~ambicanos.
1.4 Seguran~a Alimentar
A seguran9a alimentar implica a disponibilidade e acessibilidade dos alimentos, que constituem urn problema em M~ambique. A baixa produ~ao, nas areas rurais, reduziu a capacidade de auto-sustento de muitos agregados familiares (Ministerio para a Coopera~ao e UNICEF, 1990). Urn longo periodo de instabilidade social e de depressao econ6mica agravou ainda mais as condi~6es de pobreza das areas urbanas. Consequentemente, muitas fanulias rurais e urbanas nao possuem recursos financeiros para comprar alimentos suficientes.
Por muitos anos M~ambique nao tinha uma produ9ao agricola suficiente para abastecer quantias adequados dos alimentos para a popula~ao. A importa~ao comercial dos alimentos nao era possive! nesta tempo, dada a falta de divisas na economia. Consequentemente, M~ambique dependeu da ajuda alimentar internacional para satisfazer algumas necessidades nutricionais dos seus cidadaos. Hoje a situa9ao e diferente, 80 % das necessidades, em termos de cereais, sao produzidas no pais e s6 20 % provem da ajuda externa (Governo do M~ambique, 1998).
1.5 Polfticas de Nutri~ao e de Saude em Mo~ambique
As tentativas por parte do governo para reduzir os actuais problemas de disponibilidade de alimentos Hlm-se centrado principalmente na reforma econ6mica e numa revitaliza~ao do sector agricola. Uma dessas iniciativas e 0 Programa para a Recupera~ao Econ6mica (Organiza~ao das Na~6es Unidas para a AJimenta~ao e Agricultura (FAO), 1987). Com a ajuda de doa~6es, surgiram deste programa muitas reformas das polfticas monetarias e agricolas. Em 1990, foi estabelecido 0 Grupo de Trabalho para Apoio aos grupos Populacionais Vulneniveis (GAPVU) para dar subsidios alimentares e assistencia directa aos rendimentos dos agregados familiares pobres que se inserem em pelo menos num dos seguintes criterios: (1) desnutri~ao infantiI, (2) insuficiencia de peso da mae, (3) pobreza entre os idosos, ou (4) incapacidade fisica dos adultos. 0 esquema inicial apoiou 2,000 agregados familiare-~ em Maputo, mas de-~de essa altura alargou a sua cobertura para 90,000 agregados familiares. A Estrategia de Redu~ao da Pobreza de 1995 pretendia melhorar os programas de seguran~a, como por exemplo 0 Programa de Almo~os Escolares e 0 Programa do Fundo Social para Medicamentos e Suplementos da Alimenta9ao das Crian~as (SAC) (FMI, 1996).
Pouco tempo depois de ter obtido a independ~ncia em 1975,0 governo m~ambicano estabeleceu urn conjunto de polfticas de saude que instituiam servi90s preventivos e curativos, medicamentos e processos de diagn6stico gratuitos para todos os cidadaos. No entanto, devido a constrangimentos financeiros e de outros recursos, 0 governo foi for~ado a redefinir muitas das suas polfticas de saude. Foram introduzidas taxas de utiliza9ao para urn pequeno niimero de servi~os medicos, criando assim uma grande barreira para 0 acesso de muitos mo~ambicanos pobres (Ministerio para a Coopera~ao e UNICEF, 1990). Para aMm das barreiras financeiras ao acesso, as deficitarias infaestruturas de saiide tamMm actuam como urn obstaculo a assist~ncia mooica: menos de metade da popula~ao vive ate uma hora de distilncia dos servi90s de saude (CISI, 1995).
3
Como resposta a fraca cobertura de servigos de salide, foi adoptada a Estrategia de SaMe
Nacional em 1995 e tern como objectivo 0 alargamento da cobertura da saMe nacional para os 60% ate ao
ano 2000 (IMF, 1996). A aten9ao vai para 0 melhoramento tanto da cobertura como da qualidade dos
servi90s de salide primarios. As mulheres e as crian9as sao os principais alvos desta estrategia. Desde a
guerra, tern havido urn progresso nacional em termos de cobertura do Programa de vacina9ao. 0
Programa Alargado de Vacinagao Nacional (PAY), que foi estabelecido em 1981, administra vacinas em
todas as Unidades Sanitarias que tenham consultas da "crian9a sadia" (Cutts et al., 1994). Embora 0
programa PVN nao seja por si s6 uma intervengao nutricional, tern como objectivo a redugao da
prevalencia de doengas contagiosas, como por exemplo 0 sarampo, que podem comprometer 0 estado
nutricional das criangas. As taxas de abrangencia da vacina9ao sao substancialmente mais elevadas na
capital, Maputo, em relagao a outras areas do pais, embora se especule que a abrangencia ira melhorar
com a estabilidade crescente nas areas rurais (CISI, 1995).
A elevada prevalencia de doengas diarreicas entre as criangas mogambicanas, juntamente com 0
fraco controlo das doengas diarreicas no interior do sistema de salide, foi previamente ligada a uma
desnutrigao generalizada (Cliff e N oormahomed, 1993; Ministerio da SaMe e F aculdade de Medicina da
Universidade Eduardo Mondlane, 1988). 0 programa de controlo das doen9as diarreicas (CDD) em
Mogambique centraliza-se na promogao da terapia de re-hidrata9ao oral (TRO) como principal estrategia
no controlo das doengas diarreicas nas criangas (Cutts et al., 1988). Embora 0 acesso a TRO tenha sido
historicamente baixo, cresceu em pelo menos 60% nos Ultimos anos (CISI, 1995). As epidemias de c61era
entre 1979 e 1984 intensificaram a promogao da TRO por parte do governo bern como a aceita9ao da
TRO pelos profissionais de salide e pela comunidade em geral (Cliff et al., 1990). Foi alcan9ada uma
abrangencia alargada especialmente atraves dos esfor90s de mobiliza9ao da comunidade, ja que a guerra
diminuio 0 acesso aos postos de saMe (Cliff e Noormahomed, 1988).
Inserido no Ministerio da SaMe, 0 Programa Nacional para Crian9as e Mulheres e uma
abordagem com tres vertentes para 0 melhoramento do estado nutricional e de sande em Mogambique. As
tres estrategias programaticas sao as seguintes (Ministerio para a Coopera9ao e UNICEF, 1990):
• 0 Programa de Emergencia, que tern por objectivo (a) a redu9ao da mortalidade atraves do
fornecimento de alimentos e produtos essenciais e (b) a redU9ao da pobreza estrutural
ajudando as fanulias a gerar os seus pr6prios rendimentos.
• Acesso Melhorado aos Servi<;o, que tern por objectivo (a) reduzir a morbilidade e desnutrigao
infantil e (b) oferecer cuidados pre- e p6s-natais as mulheres gravidas. Este objectivo
estrategico tambem implica a repara9ao e a expansao das infraestruturas de sande existentes.
• Apoio il Seguran<;a Nutricional e Alimentar, que e uma abordagem econ6mica para estimular
a produ9ao e comercializa9ao nos agregados familiares mais pobres. Tern tambem como
objectivo 0 aumento do acesso a tecnologia e produ9ao agricolas.
Para alem do Programa Nacional, tern ocorrido bastantes programas multi-sectoriais que se
centram no desenvolvimento rura\. Urn deles eo Programa Massinga Integrado para 0 Desenvolvimento
Rural na provincia de Inhambane, no SuI de Mogambique (Ministerio para a Coopera9ao e UNICEF,
1990). Atraves de actividades integradas de sande, educacionais, agricolas e cria9ao de capacidades, 0
Programa Massinga e uma consciencializagao demonstrada, da parte do governo, da natureza
multifacetada dos problemas nutricionais e de salide que os mogambicanos pobres tern de enfrentar .
. A intervengao do governo em areas urbanas tem-se limitado principal mente no estabelecimento
de urn sistema de racionamento de alimentos, 0 Novo Sistema de Abastecimento (NSA). 0 NSA opera
actualmente nos centros urbanos de Maputo e da Beira (Ministerio para a Cooperagao e UNICEF, 1990).
4
No entanto, 0 baixo poder de compra da maioria dos agregados familiares urbanos torna este sistema algo ineficaz na satisfa<;:ao das necessidades nutricionais das popula<;:oes que pretendem beneficiar. Embora 0 NSA tenha oferecido artigos alimentares basicos tais como cereais e 61eo para cozinbar a algumas fanulias urbanas com acesso comercial, as quantidades que sao distribuidas por cada agregado familiar satisfazem apenas cerca de 50% das necessidades nutricionais basicas da fanulia media, 0 restante tern de ser comprado em mercados locais, embora algumas fanulias recebam ofertas e transferencias de alimentos dos seus familiares rurais.
1.6 A Necessidade de Dados Nutricionais e de Saiide em Mo~ambique
Dados representativos a Divel nacional sobre a morbiJidade e mortalidade eram relativamente escassos em MQ9ambique, antes do censo e das investiga<;:oes mais recentes, em 1997. Existe no entanto, dentro do Ministerio de Saude, urn Sistema de Informa<;:ao de Saude; mas este s6 representa os casos registados nas Unidades Sanitarias Publicas. No final dos anos 80, 0 Ministerio da Satlde recolheceu a necessidade de estimar as preValencias de malnutri<;:ao e estabeleceu urn sistema de vigiHincia nutricional ainda em curso, que e constituido por dois indicadores nutricionais, 0 Crescimento Insuficiente e 0 Baixo Peso ao Nasver. No entanto, deve-se ter em aten<;:ao que as taxas do sistema de vigiHmcia nutricional podem nao refiectir a situa<;:ao da popula<;:ao geral ja que sao baseadas em crian<;:as com acesso a servi<;:os de saude. Visto que a maioria dos mo<;:ambicanos nao tern acesso aos servi<;:os saude (Ministerio para a Coopera<;:ao e UNICEF, 1990), dados representativos da popula<;:ao sao necessarios para evidenciar problemas e identificar segmentos da popula<;:ao que garantam a investiga<;:ao, a politica e a aten<;:ao pragmatica.
1.7 Fontes de Dados e Tipos de Infonna~ao Recolhida
Os dados apresentados neste relat6rio baseiam-se nos resultados do Inquerito Demografico e de Satlde em MQ9ambique (IDSM). 0 Apendice A apresenta uma descri<;:ao do plano de sondagem e da metodologia do IDSM. 0 questionario individual fornece a base para este relat6rio, apresentando informa<;:oes acerca de t6picos variados: fertilidade, casamento, preferencias de fertilidade, planeamento familiar, mortalidade de bebes e crian<;:as, mortalidade materna, saude materna e infantil, amamenta<;:ao e antropometria de maes e crian<;:as com menos de tres anos de idade. Tambem foram recolhidos dados ao Divel do agregado familiar e estao relacionados com caracteristicas de todos os membros do agregado familiar, caracteristicas de habita<;:ao, e com a posse de determinados produtos de longa dura<;:ao. As caracteristicas do agregado familiar e as caracteristicas socio-demograficas das mulheres sao apresentadas no Apendice B.
Os dados acerca do estado nutricional, de vacina<;:ao e de saude foram recolhidos em filhos de todos os participantes nascidos depois de Janeiro de 1994 (0-35 meses de idade na altura do inquerito). As informa<;:oes sobre a mortalidade tambem foram recolhidas para todos os filhos dos participantes no inquerito. Questoes sobre morbiJidade, nutri<;:ao e cuidados de saude recentes foram apenas colocadas em rela<;:ao as crian<;:as vivas. Estas questoes incluem a amamenta<;:ao, praticas nutricionais, e 0 aparecimento e tratamento da diarreia, febre e tosse durante as duas semanas anteriores ao inquerito. Este relat6rio baseia-se numa sub-sondagem de 2,837 crian<;:as vivas com menos de tres anos, para as quais estavam disp0nlveis dados antropometricos completos.
5
CAPITULO 2
ESTADO NUTRICIONAL DOS BERES E CRIAN<;AS
Urn estado nutricional pobre esta ligado a varios factores SOCialS, econ6micos e factores relacionados com a saude. Nurn pais como Movambique, onde os recursos de saude sao escassos, e importante identificar as areas geograficas e segmentos da popula~ao que estlio em maior risco. Baseando-se nos dados do IDSM de 1997, este capitulo discute a prevalencia e a gravidade dos efeitos nutricionais nas crian~as mo~ambicanas com menos de tres anos de idade. As disparidades nestes efeitos sao exploradas segrmdo varias dimensoes socio-demograficas tais como a idade, sexo e local de residencia. Para alem disso, compara os resultados do IDSM com as conclusoes dos Inqneritos Demogriificos e de Saude em outros paises africanos.
2.1 Efeitos da Desnutri\;iio
A desnutri~ao esta directamente relacionada com 0 consumo alimentar inadequada e com doen~as infecciosas tais como a diarreia, doen~as respirat6rias agudas, malaria e sarampo. Tanto as doen~as infecciosas como 0 consum~ alimentar inadequada reflectem condi~oes sociais e econ6micas subjacentes ao mvel do agregado familiar, da comunidade e do pais. A Figura 2.1 foi adaptada do quadro da UNICEF para a desnutri~ao (UNICEF, 1990; Jonsson, 1995) e reflecte as rela~oes entre varios factores e os mecanismos que conduzem it desnutri~ao infantil. Factores politicos, socio-econ6micos, ambientais e culturais que actuam it mvel nacional e comunitario bern como a pobreza que actua a nivel do agregado familiar, afectam em Ultima analise 0 estado nutricional das crian~as. Por exemplo, 0 emprego fornece uma fonte de rendimentos e e urn factor importante para a seguran~a alimentar do agregado familiar. 0 emprego feminin~, em particular, oferece as mulheres oportunidades para 0 controlo de recursos e pode conduzir a urna maior disponibilidade de alimentos, praticas de cuidado de crian~as melhoradas, e finalmente, a urn melhor estado nutricional. Do mesmo modo, 0 mvel de instru~ao das maes, atraves da sua associa~ao com causas biol6gicas e comportamentais da desnutri~ao (p.ex. praticas de cui dado das crian~as, comportamentos e padroes alimentares) e urn forte indicador do estado nutricional das crian~as e da fertilidade (Moore e Favin, 1990). Contudo, deve-se notar que as normas sociais e culturais ou a situagao econ6mica dum pais podem agir contra urna maior instru~ao e emprego das mulheres.
Segundo 0 quadro conceptual da UNICEF na Figura 2.1, as criangas pobres sao mais vulneniveis it desnutrigao como uma consequencia de condi~oes ambientais pobres, baixas taxas de vacina~ao, cuidados pre-natais insuficientes e tratamento inadequado de doen~as infantis comuns. A agua e urn saneamento abaixo dos mveis aceitiiveis colocam as crian~as em maior risco de infec~ao pela exposi~ao it agua e alimentos deteriorados (Haggerty et a!., 1994a; Clemens e Stanton, 1987; Esrey et a!., 1985). As criangas com condigoes de vida mediocres geralmente sofrem de infecgoes repetidas, como as doengas diarreicas, e sao incapazes de recuperar completamente de cada crise da doenga. A doen~a diarreica reduz a ingestao de alimentos e leva a uma fraca absorgao e uma maior perda de nutrientes (Brown et a!., 1990; Rahaman e Wahed, 1983; Rosenberg et al., 1977). Por fim, isto enfraquece a imunidade corporal e aumenta a sua pre-disposigao para a desnutrigao. Outros factores sao tambem os cuidados de saude inadequados e inoportunos, que afectam tanto a incidencia como a duragao da doen~a (Mosley et al, 1984).
7
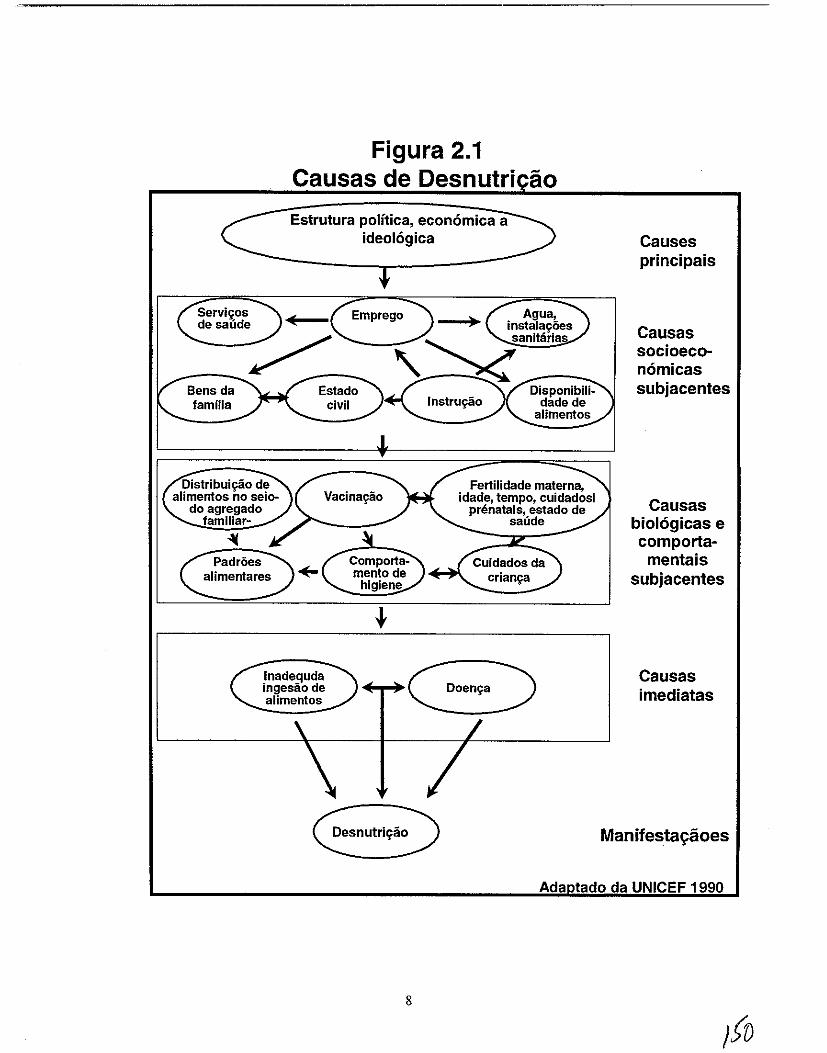
Figura 2.1 Causas de Desnutri ao Estrutura polftica, econ6mica a
ideologica Causes
Servi",os de saude
Bens da familia
Emprego
Estado civil
Padroes alimentares
Inadequda ingesiio de alimentos
Desnutri",ao
8
crian",a
principais
Causas socioeconornicas subjacentes
Causas biologicas e cornportarnentais
subjacentes
Causas irnediatas
Manifesta~aoes
Ada tado da UNICEF 1990
Na tentativa de compreender as causas directas da desnutri\(ao infantil, e importante reconhecer a interac\(ao entre 0 consumo alimentar inadequada e as doen\(as infecciosas - urna rela\(ao que e particularmente importante em MO\(ambique. A rela\(ao entre 0 consumo alimentar inadequada e diarreia e interactiva (sinergetica); isto e, 0 efeito conjunto dos dois factores no estado nutricional ultrapassa de 10nge os simples efeitos adicionais da diarreia ou da ingestao inadequada por si s6 (Lutter et a!., 1989; Rosenberg et a!., 1977; Scrimshaw et aI., 1968). Por outras palavras, urna crian\(a que tenha ao mesmo tempo uma dieta alimentar inadequada e uma doen\(a, esta extremamente propensa a maus resultados na saude, como por exemplo a desnutri\(ao - mais do que se a crian\(a estiver s6 doente ou com uma dieta a1imentar inadequada.
Para alem da doen\(a, a desnutri\(ao tambem esta associada a urn aurnento no risco de mortalidade infantil. Mesmo quando a desnutri\(ao nao conduz a morte ou doen\(a aparente, pode conduzir a niveis cognitivos e de exitos educacionais mais baixos (Brozek e Schurch, 1984). Os efeitos contrarios dum pobre estado nutricional durante as primeiras fases de vida tambem se reflectem na idade adulta. Entre os adultos, 0 efeito cumulativo da desnutri\(ao pode ser demonstrado pela baixa produtividade laboral e uma maior ausencia do local de trabalho, que podem reduzir 0 potencial individual e nacional de ganhos (Banco Mundial, 1993).
A desnutri\(ao tambem tern efeitos entre gera\(6es. 0 baixo peso a nascen\(a (BPN), ou peso a nascen\(a inferior a 2,500 g, e atribufdo a factores nutricionais maternos tals como uma baixa ingestao de calorias, baixo peso antes da gravidez eo baixo aurnento de peso durante a gravidez (Kramer, 1987). 0 baixo peso a nascen\(a e urn indicador sensfvel do estado nutricional materna e urn factor importante para a sobrevivencia infantil. Mulheres baixas e sub-nutridas tendem a dar a luz bebes pequenos e com baixo peso (Villar e Rivera, 1982). Estes bebes pequenos correm urn maior risco de contrair doen\(as e de morrer em compara\(ao aos bebes com urn peso normal (Baqui et al., 1994; UNICEF e OMS, 1992; Instituto de Medicina (1M), 1985). Apesar da elevada prevaH\ncia do BPN nos paises em vias de desenvolvimento, 0 peso a nascen\(a raramente e detectado em paises onde a maioria dos nascimentos nao ocorre em institui\(6es de saude. Consequentemente, a maioria das crian\(as em grande risco de urn pobre estado de saude e desenvolvimentos nao sao identificadas atempadamente.
2.2 Indicadores Basicos do Estado Nutricional
A avalia<;ao do estado nutricional baseia-se no conceito que numa popula\(ao bern nutrida, a distribui<;ao para urna determinada idade da altura e peso das crian<;as aproximar-se-a de uma distribuiya:o normal. Isto significa que cerca de 68 % das crian\(as terao uma altura ou peso dentro de urn grau normal de desvio da mMia para essa idade. Cerca de 14% das crian\(as terao urn Z-Score da altura ou peso dentro de menos urn e menos dois desvios padr6es (DP) da media para esta idade. De entre as restantes, 2% terao urn Z-Score da altura ou peso menos de dois desvios padr6es (DP) da media para esta idade. Visto que todas as popula<;6es tern urn potencial genetico para 0 crescimento semelhante (Habicht et al., 1974), a Organiza\(ao Mundial da Satlde (1979) recomendou a utiliza\(ao dos dados de referencia do Centro Nacional Americano para Estatisticas de Saude (CNES) na avalia\(lio do estado nutricional em todo 0
mundo.
Os tres indicadores apresentados em seguida utilizam a altura ou peso em combina\(ao com a idade para determinar 0 estado nutricional dos bebes e crian\(as:
Subnutrirtio cr6nica, definida como altura para a idade a menos dois desvios padr6es (-2 DP) da media da popula\(ao de referencia do CNES, e a falta de crescimento adequado em altura em rela\(ao a idade. Reflecte uma desnutri\(ao passada ou cr6nica e e consequencia de uma dieta alimentar inadequada durante urn longo perfodo de tempo elou de crises repetidas de doen\(a, especialmente de diarreia.
9
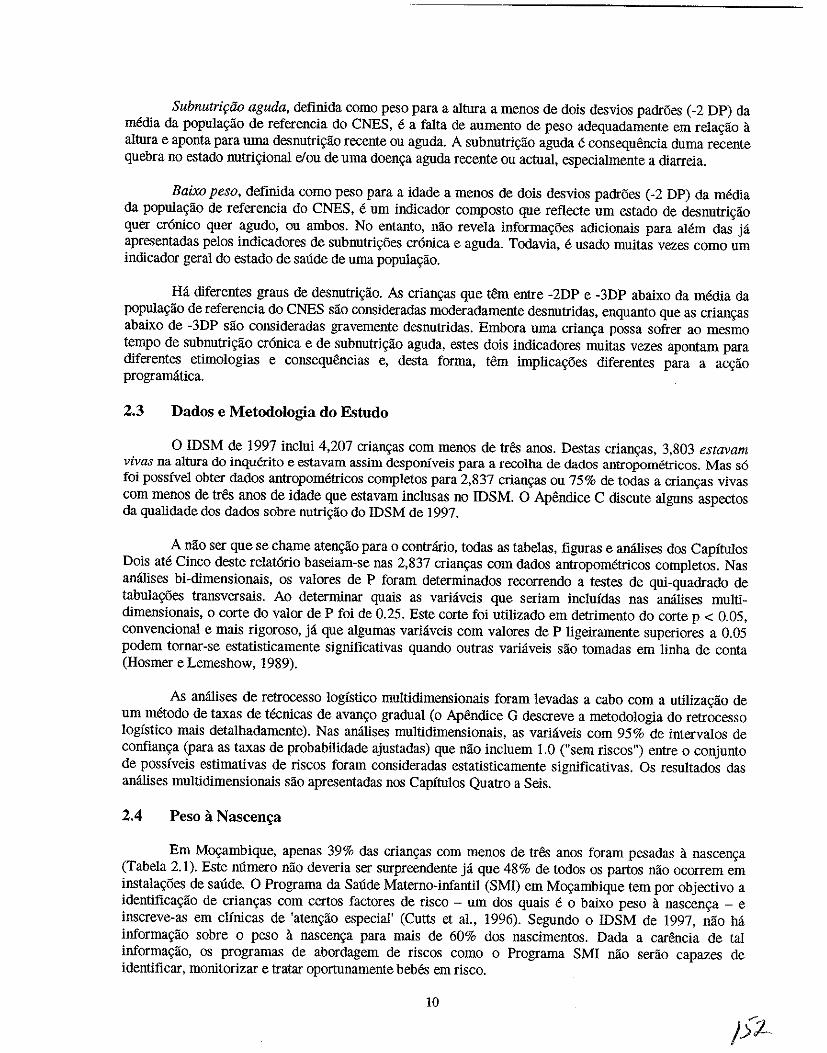
Subnutri(:iW aguda, definida como peso para a altura a menos de dois desvios padroes (-2 DP) da media da populaglio de referencia do CNES, e a falta de aumento de peso adequadamente em rela9ao it altura e aponta para uma desnutrigao recente ou aguda. A subnutrigao aguda e consequencia duma recente quebra no estado nutrigional elou de uma doen9a aguda recente ou actual, especialmente a diarreia.
Baixo peso, definida como peso para a idade a menos de dois desvios padroes (-2 DP) da media da popula9ao de referencia do CNES, e urn indicador composto que refiecte urn estado de desnutri9ao quer cr6nico quer agudo, ou ambos. No entanto, nao revela informagoes adicionais para aMm das ja apresentadas pelos indicadores de subnutrigoes cr6nica e aguda. Todavia, e usado muitas vezes como urn indicador geral do estado de saMe de uma populagao.
Ha diferentes graus de desnutrigao. As crian9as que tern entre -2DP e -3DP abaixo da media da populagao de referencia do CNES sao consideradas moderadamente desnutridas, enquanto que as criangas abaixo de -3DP sao consideradas gravemente desnutridas. Embora wna crianga possa sofrer ao mesmo tempo de subnutri9ao cr6nica e de subnutrigao aguda, estes dois indicadores muitas vezes apontam para diferentes etimologias e consequencias e, desta forma, tern implicagoes diferentes para a acgao programatica.
2.3 Dados e Metodologia do Estudo
o IDSM de 1997 incIui 4,207 criangas com menos de tr& anos. Destas criangas, 3,803 estavam vivas na altura do inquerito e estavam assim desponiveis para a recolha de dados antropometricos. Mas s6 foi possivel obter dados antropometricos completos para 2,837 crian9as ou 75% de todas a crianc;as vivas com menos de tr& anos de idade que estavam incIusas no IDSM. 0 Apendice C discute alguns aspectos da qualidade dos dados sobre nutric;ao do IDSM de 1997.
A nao ser que se chame atengao para 0 contrario, todas as tabelas, figuras e anaJises dos Capitulos DOis ate Cinco deste relat6rio baseiam-se nas 2,837 criangas com dados antropometricos completos. Nas anaJises bi-dimensionais, os valores de P foram determinados recorrendo a testes de qni-quadrado de tabulagoes transversais. Ao deterrninar quais as variaveis que seriam incluidas nas anaJises multidimensionais, 0 corte do valor de P foi de 0.25. Este corte foi utilizado em detrimento do corte p < 0.05, convencional e mais rigoroso, ja que algumas variaveis com valores de P ligeiramente superiores a 0.05 podem tornar-se estatisticamente significativas quando outras varhiveis sao tomadas em linha de conta (Hosmer eLemeshow, 1989).
As anaJises de retrocesso logistico multidimensionais foram levadas a cabo com a utiliza9ao de urn metodo de taxas de tecnicas de avango gradual (0 Apendice G descreve a metodologia do retrocesso logistico mais detalhadamente). Nas anaIises multidimensionais, as variaveis com 95% de interval os de cOnfianga (para as taxas de probabilidade ajustadas) que nao incIuem 1.0 ("sem riscos") entre 0 con junto de possiveis estimativas de riscos foram consideradas estatisticamente significativas. Os resultados das anaJises multidimensionais sao apresentadas nos Capitulos Quatro a Seis.
2.4 Peso a NascenC;a
Em Mogambique, apenas 39% das criangas com menos de tr& anos foram pesadas it nascenga (Tabela 2. I). Este numero nao deveria ser snrpreendente ja que 48% de todos os partos nlio ocorrem em instalagoes de saMe. 0 Programa da SaMe Materno-infantil (SM!) em Mogambique tern por objectivo a identificagao de criangas com certos factores de risco - urn dos quais e 0 baixo peso it nascenga - e inscreve-as em clinicas de 'atengao especial' (Cutts et al., 1996). Segundo 0 IDSM de 1997, nao ha informa9lio sobre 0 peso it nascenga para mais de 60% dos nascimentos. Dada a carencia de tal informagao, os programa.~ de abordagem de riscos como 0 Programa SM! nao serao capazes de identificar, monitorizar e tratar oportunamente beMs em risco.
10
Tabela 2.1 Peso e tamanho it nascenca para criancas menores de tres anos de idade
Percentagem de criam;as pesada a nascen~a (em quilogramas), 0 desvio padrao do peso it nascen~a, a percentagem de nascimentos com baixo peso e a distribui~ao percentual dos nascimentos que sao demasiado pequenos ou de tamanho medio ou_grande._por ~_ovrncia, residencia, estado socio-econ6mico, e se a crian<;a foi pesada a nascen<;a, Mo;ambique 1997
Peso it nascen£a Tamanho a nascen£a Descon-
Pesadas Muito hecidol Niimero Caracterlstica a BPN'a Peque- peque- Inexis- de bftsica nascen~a Media E.P. nascenca Medio+ no no tente Total crian~as
Residencia Urbana 80.4 3.0 0.02 14.6 78.9 15.5 3.8 1.8 100.0 910 Rural 28.0 3.0 0.02 10.9 77.7 19.3 1.3 1.8 100.0 3,297
p<O.OOl p<O.05 p<O.OOl Provincia
Niassa 42.4 2.9 0.06 12,6 8!.l 16.7 1.5 0.7 100.0 230 Cabo Delgado 17.5 2.8 0.07 16.8 82.5 14.8 0 2.7 100.0 233 Nampula 25.1 2.9 0.04 11.7 81.4 17.7 0.4 0.5 100.0 675 Zambezia 18.6 3.2 0.07 2.2 80.0 12.9 1.8 5.4 100.0 632 Tete 31.5 2.9 0.09 16.6 79.5 17.7 0.8 1.9 100.0 197 Manica 40.5 3.0 0.05 9.1 75.4 23.8 0 0.8 100.0 307 50fala 31.0 2.9 0.03 16.9 71.0 26.5 0.4 2.1 100.0 632 fubambane 36.9 3.2 0.04 7.4 73.5 24.2 1.2 1.1 100.0 372 Gaza 65.6 3.1 0.03 12.2 87.0 9.1 3.6 0.3 100.0 479 Maputo 86.2 3.0 0.05 15.2 69.0 18.6 11.3 1.2 100.0 247 Cidade de Maputo 89.5 3.0 0.04 16.3 72.9 23.7 2.7 0.7 100.0 204
p<O.OOl p<O.Ol p<O.OOl Estado socioecon6mico
Baixo 24.5 3.0 0.03 14.3 77.2 19.4 !.l 2.3 100.0 1,823 Medio 40.8 3.0 0.02 10.3 79.5 18.7 0.7 1.0 100.0 1,763 Elevado 78.6 3.1 0.03 14.2 75.6 15.0 7.0 2.3 100.0 621
p<O.OOl NS p<O.OOl
Sexo da crian~a Masculino 40.2 3.0 0.02 12.2 79.4 16.3 2.4 1.9 100.0 2,164 Feminino 38.3 3.0 0.02 12.9 76.4 20.8 1.2 1.6 100.0 2,043
Sf Sf p<O.OOI Pesadas a nascen~
N§.o NA NA NA NA 75.8 20.7 0.9 2.6 100.0 2,553 Sim NA NA NA NA 81.2 15.1 3.3 0.5 100.0 1,654
p<O.OOl
Total 39.3 3.0 om 12.5 77.9 18.5 1.8 1.8 100.0 4,207
Nota: Nivel de importancia determinado atraves do teste Qui-quadrado NA = Nlio aplieavel 51 = Scm Importancia (p>0.05) lBaixo Peso a Nascen~a (menos de 2.5 kg)
Com se indica na Tabela 2.1, a percentagem de bebes urbanos que foram pesados a nascen9a e significativamente mais elevada do que ados bebes rurais (80% vs. 28%). A percentagem mais elevada situa-se na capital m09ambicana, Maputo (90%) e a percentagem mais baixa situa-se na provincia de Cabo Delgado (18%), Estas conc\usoes correspondem aos padroes de partos nas areas rurais e urbanas, uma vez que uma percentagem mais elevada de partos urbano,~ em relagao aos partos rurais ocorrem em Unidades Sanitarias (82 % vs, 34%). Entre os partos rurais, a discrepancia entre a percentagem de nascimentos em Unidades Sanitanas (U.S) e a percentagem de bebes pesados a nascen9a pode reflectir 0 problema de falta de balangas em alguma U.S,
II
Entre as criangas que foram pesadas it nascenga, 0 peso it nascenga medio era de 3.0 kg, que e ligeiramente mais baixo que a media de 3.3 kg do CNES (OMS, 1979). 13% dos beMs pesavam menos de 2.5 kg it nascenga e foram classificados como tendo baixo peso it nascenga (BPN). A incidencia de BPN difere significativamente entre as areas rurais e urbanas. No entanto, como se pode ver na Tabela 2.1, 0 BPN varia significativamente de regUlo para regiao, com taxas de 2% na ZamMzia e de 17% nas provincias de Cabo Delgado, Tete, Sofala e na cidade de Maputo. Nao esta claro porque a taxa do inquerito nacional e mais baixa quanto 0 que foi coletado pelo sistema de vigiHtncia
As estimativas do BPN indicadas acima deveriam ser interpretadas com cautela, ja que se baseiam apenas nos 39% de beMs que foram pesados it nascenga. As estimativas do BPN apresentadas neste relat6rio sao certamente sub-estimadas em relagao a verdadeira magnitude de BPN em Mogambique. Para alem do grau questiomivel com que as estimativas do BPN representam todos os nascimentos, deve sublinbar-se que urn tergo dos dados sao registados a partir do que as maes lembram de ter sido 0 peso dos seus mhos it nascenga. 0 peso medio it nascenga registado nos boletins de Nutrigao nao varia significativamente da media calcu!ada com base no que as maes dizem ter sido 0 peso dos seus filhos a nascenga, com excepcgao da Zambezia. A alta incidencia do BPN na provincia e cidade de Maputo pode reflectir 0 facto da maioria dos beMs serem pesados a nascenga. Devido a grande concentragao de unidades sanitarias na regiao periferica-urbana e a elevada utilizagao das mesmas para assistencia dos partos (CIS I, 1995), hi( mais oportunidades de se identificar 0 BPN na area da capital do que em areas onde os bebes nao nascem em Unidade Sanitaria e nao sao pesados a nascenga. Tambem deve sublinbar -se que as mulheres pobres e sem instrugao, que podem estar em maior risco de terem bebes com BPN, sao geralmente as menos propensas a dar a luZ numa Unidade Sanitaria. Deste modo as probabilidades dos seus bebes serem pesados a nascenga sao baixas.
Em alguns casos, quando a inIormal;ao sobre 0 peso it nascenga nao e disponivel, 0 tamanho do beM calculado pela mae pode ser usado como uma representagao. Embora a percepgao da mae do tamanbo do beM seja uma medida bastante subjectiva, pode ser informativa quando se exploram factores relacionados com a desnutrigao, ja que a percepgao da mae do tamanbo do seu recem-nascido pode influenciar os seus comportamentos de alimentagao e de cuidados da crianga. Em Mogambique, cerca de 19% das criangas foram descritas pelas maes como "pequenas" it nascenga, com mais 2% das criangas a serem descritas como "muito pequenas". As diferengas regionais sao evidentes, com a percentagem mais elevada de crian9as a serem descritas como pequenas na provincia de Sofala. Esta provincia possul tambem a mais elevada percentagem de criangas com BPN. Ha uma diferenga estatisticamente significativa entre as areas rurais e urbanas, visto que mais crian9as urbanas sao consideradas muito pequenas a nascenga e mais crian9as rurais foram consideradas pequenas it nascen9a. Uma propor9ao significativamente maior de bebes pobres sao descritos como "pequenos" em comparagao com bebes mais ricos (19 contra 15%), e pode-se notar muito poucas diferen9as no tamanbo "muito pequeno" (Tabela 2.1).
Devido a limita90es dos dados, nao e possivel dividir 0 BPN em nascimentos prematuros (NP) e aqueles resultantes de urn crescimento intra-uterino retardado (CIUR). Cada uma destas condi90es possui diferentes factores causais e inIorma90es sobre elas ajudariam os autores de programas e de polfticas a estabelecer programas que se dirijam as populagoes mogambicanas em grande risco. Nos paises em vias de desenvolvimento, a grande maioria dos nascimentos com BPN sao resultantes de urn CIUR (Kramer, 1987; Villar e Belizan, 1982). 0 fraco estado nutricional materno e a causa primaria do CIUR. Sabe-se pouco acerca das causas dos NP, embora aparentemente estejam bastante ligados as mulheres que ja tenbam sofrido de resultados adversos da gravidez (i.e., anteriores nascimentos prematuros e abortos esponHtneos) e/ou comportamentos negativos em relagao a saude, como fumar. Embora seja provavel que o CIUR seja mais predominante que 0 NP em Mogambique, nao e possivel fundamentar esta alega9ao sem os dados necessarios. Para alem dos factores nutricionais, as doen9as sexualmente transmitidas (DST) podem levar a resultados adversos da gravidez como por exemplo 0 BPN e sao bastante predominantes entre as mulheres mogambicanas em idade de reprodu9ao (CISI, 1995). As DST devem
12
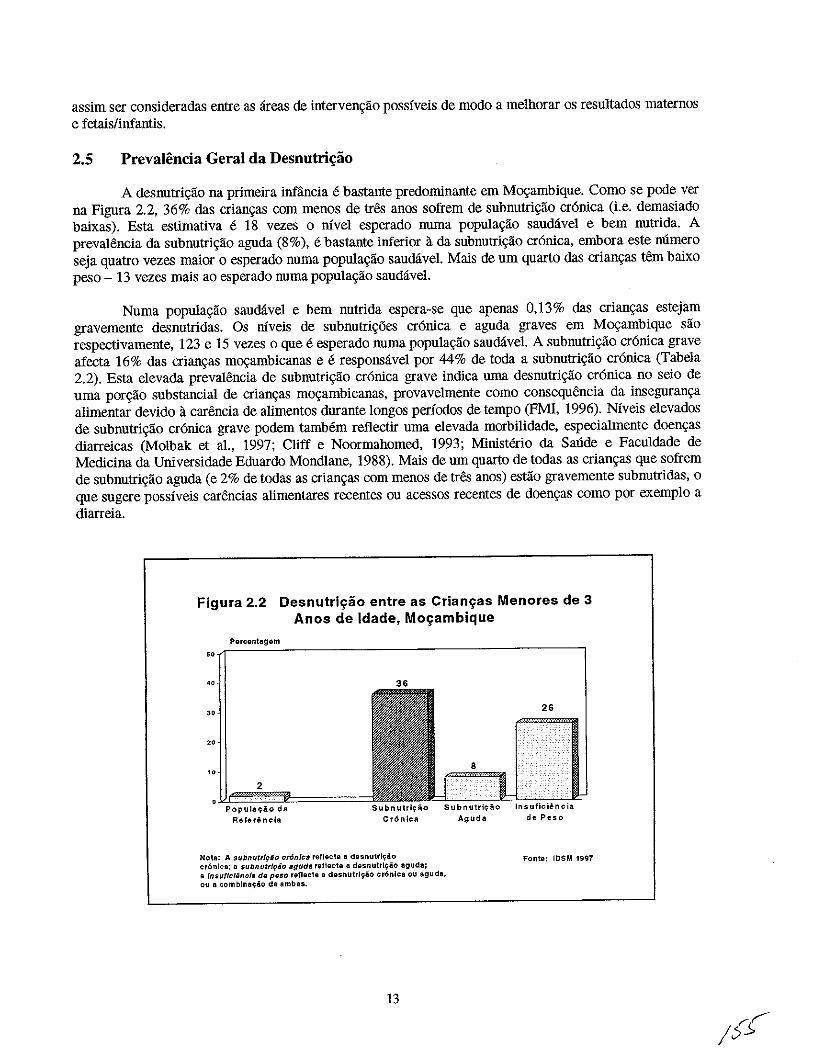
assim ser consideradas entre as areas de intervenglio possfveis de modo a melhorar os resultados maternos e fetais/infantis.
2.5 Prevalencia Geral da Desnutri"ao
A desnutriglio na primeira infancia e bastante predominante em Mogambique. Como se pode ver na Figura 2.2, 36% das criangas com menos de tres anos sofrem de subnutrigao cr6nica (i.e. demasiado baixas). Esta estimativa e 18 vezes 0 mve1 esperado numa populaglio saudavel e bern nutrida. A prevaHlncia da subnutri9lio aguda (8%), e bastante inferior it da subnutri9lio cr6nica, embora este mlmero seja quatro vezes maior 0 esperado numa populagao saudavel. Mais de urn quarto das criangas tem baixo peso - 13 vezes mais ao esperado numa popu1agao saudiivel.
Numa populagao saudiive1 e bern nutrida espera-se que apenas 0,13% das criangas estejam gravemente desnutridas. Os niveis de subnutrigoes cr6nica e aguda graves em Mogambique sao respectivamente, 123 e 15 vezes 0 que e esperado numa populagao saudavel. A subnutri9ao cr6nica grave afecta 16% das crian9as mogambicanas e e responsivel por 44% de toda a subnutri9ao cr6nica (Tabela 2.2). Esta elevada prevaJencia de subnutri9ao cr6nica grave indica mna desnutri9ao cr6nica no seio de uma porgao substancia1 de criangas m09ambicanas, provavelmente como consequencia da inseguranga alimentar devido it carencia de alimentos durante longos perfodos de tempo (PMI, 1996). Nfveis elevados de sUbnutrigao cr6nica grave podem tamMm reflectir uma elevada morbilidade, especialmente doengas diarreicas (Molbak et al., 1997; Cliff e Noormahomed, 1993; Ministerio da Saude e Faculdade de Medicina da Universidade Eduardo Mondiane, 1988). Mais de um quarto de todas as criangas que sofrem de subnutrigao aguda (e 2% de todas as crian9as com menos de tres anos) estao gravemente subnutridas, 0 que sugere possfveis carencias alimentares recentes ou acessos recentes de doengas como por exemp10 a diarreia.
Figura 2.2 Desnutri~iio entre as Crian~as Menores de 3 Anos de Idade, Mo~ambique
Percentagom
,,/O----~--------------------------------------_.
"
·~~a = Referencia Cr6niea
Nota: A subnutrl9io cronlca rellecte a desnutr~80 cr6nlea; a $ubnutrfyio agud. (0118et8 a desnutrlliio aguda; 8 Insuf/c/encf. de P(I$O refleete a desnutrlij'io er6nlca OU aguda, ou a comblnat;io de 8mb as.
13
Aguda de Peso
Fonte: 105M 1997
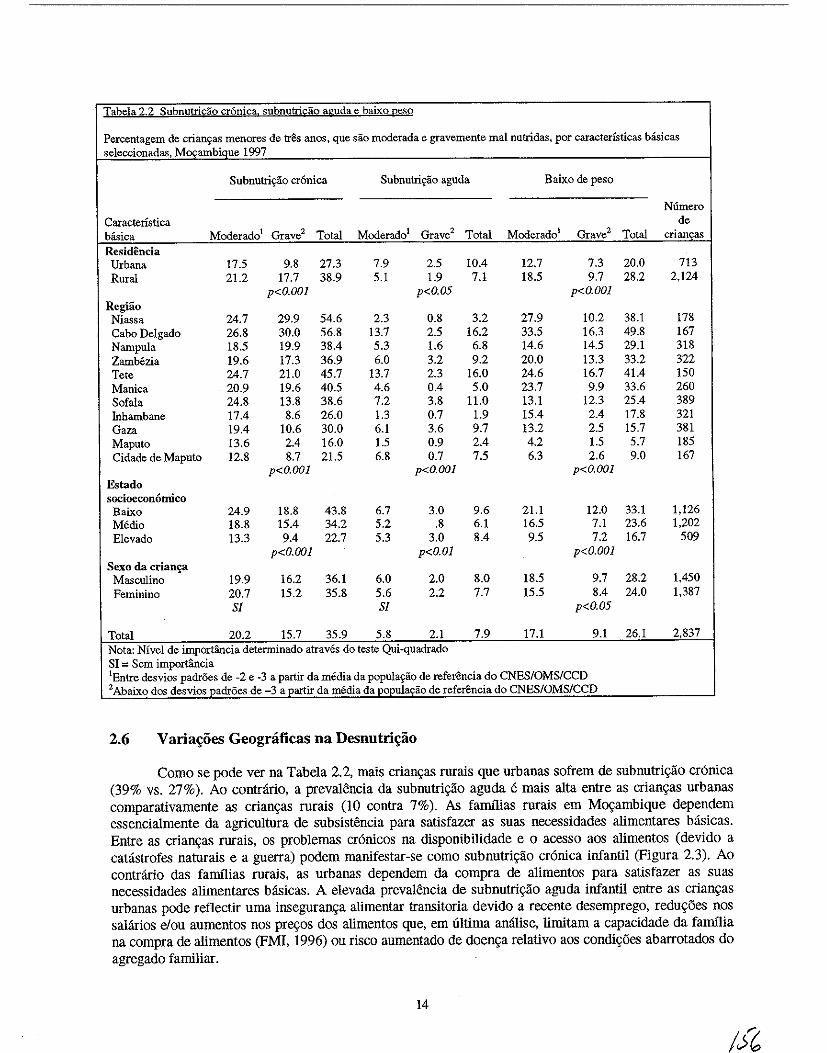
Tabela 2.2 Subnutricao cr6nica. subnutricao aguda e baixo peso
Percentagem de crian~as menores de tres anos, que sao moderada e gravemente mal nutridas, por caracteristicas basica.') seleccionadas, M~ambique 1997
Subnutri~ao cronica Subnutri9ao aguda Baixo de peso
N6mero Caracteristica de basica Moderado1 Grave2 Total Moderado' Grave2 Total Moderado1 Grave2 Total crianc;as Residencia
Urbana 17.5 9.8 27.3 7.9 2.5 10.4 12.7 7.3 20.0 713 Rural 21.2 17.7 38.9 5.1 1.9 7.1 18.5 9.7 28.2 2,124
p<O.OOI p<O.05 p<O.OOI Regiao Nia')sa 24.7 29.9 54.6 2.3 0.8 3.2 27.9 10.2 38.1 178 Cabo Delgado 26.8 30.0 56.8 13.7 2.5 16.2 33.5 16.3 49.8 167 Nampula 18.5 19.9 38.4 5.3 1.6 6.8 14.6 14.5 29.1 318 Zambezia 19.6 17.3 36.9 6.0 3.2 9.2 20.0 13.3 33.2 322 Tete 24.7 21.0 45.7 13.7 2.3 16.0 24.6 16.7 41.4 150 Manica 20.9 19.6 40.5 4.6 0.4 5.0 23.7 9.9 33.6 260 Sofala 24.8 13.8 38.6 7.2 3.8 11.0 13.1 12.3 25.4 389 Inhambane 17.4 8.6 26.0 1.3 0.7 1.9 15.4 2.4 17.8 321 Gaza 19.4 10.6 30.0 6.1 3.6 9.7 13.2 2.5 15.7 381 Maputo 13.6 2.4 16.0 1.5 0.9 2.4 4.2 1.5 5.7 185 Cidade de Maputo 12.8 8.7 21.5 6.8 0.7 7.5 6.3 2.6 9.0 167
p<O.OOI p<O.OOI p<O.OOI Estado socioecon6mico Baixo 24.9 18.8 43.8 6.7 3.0 9.6 21.1 12.0 33.1 1,126 Medio 18.8 15.4 34.2 5.2 .8 6.1 16.5 7.1 23.6 1,202 Elevado 13.3 9.4 22.7 5.3 3.0 8.4 9.5 7.2 16.7 509
p<O.OOI p<O.OI p<O.OOI Sexo da crian~
Masculino 19.9 16.2 36.1 6.0 2.0 8.0 18.5 9.7 28.2 1,450 Feminino 20.7 15.2 35.8 5.6 2.2 7.7 15.5 8.4 24.0 1,387
Sf Sf p<O.05
Total 20.2 15.7 35.9 5.8 2.1 7.9 17.1 9.1 26.1 2,837 Nota: Nfvel de importfulcia determinado atraves do teste Qui-quadrado SI = Sem importancia lEntre desvios padroes de -2 e -3 a partir da media da popula~ao de referencia do CNESIOMS/CCD 2 Abaixo dos desvios padr6es de -3 a partir da media da populac;ao de referencia do CNES/OMS/CCD
2.6 V aria~oes Geognificas na Desnutri~ao
Como se pode ver na Tabela 2.2, mais crian\(as rurais que urbanas sofrem de subnutri\(iio cr6nica (39% vs. 27%). Ao contrario, a prevalencia da subnutri\(iio aguda e mais alta entre as crian\(as urbanas comparativamente as crian\(as rurais (10 contra 7%). As farnflias rurais em MO\(ambique dependem essencialmente da agricultura de subsistencia para satisfazer as suas necessidades alimentares basicas. Entre as crian\(as rurais, os problemas cr6nicos na disponibilidade e 0 acesso aos alimentos (devido a catastrofes naturais e a guerra) podem manifestar-se como sUbnutri\(iio cr6nica iufantil (Figura 2.3). Ao contrario das falD11ias rurais, as urbanas dependem da compra de alimentos para satisfazer as suas necessidades alimentares basicas. A elevada prevalencia de subnutri\(iio aguda iufantil entre as crian9as urbanas pode reflectir uma inseguran9a alimentar transitoria devido a recente desemprego, redu\(5es nos salarios elou aumentos nos pre\(os dos alimentos que, em ultima analise, limitam a capacidade da faIDIlia na compra de alimentos (FMI, 1996) ou risco aumentado de doen9a relativo aos condi95es abarrotados do agregado familiar.
14
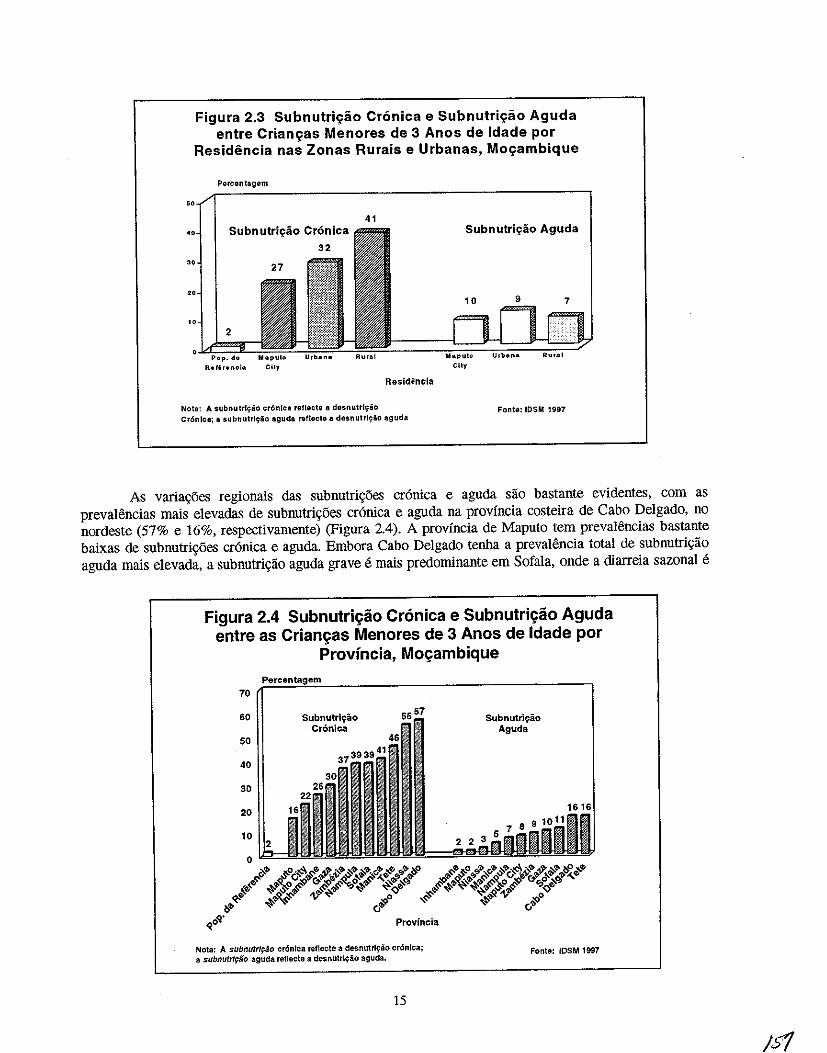
Figura 2.3 Subnutrio;;iio Cr6nica e Subnutrio;;iio Aguda entre Criano;;as Menores de 3 Anos de Idade por
Residencia nas Zonas Rurais e Urbanas, Moo;;ambique
Percentagem
41 Subnutri~ao Cr6nica
"
" 2
Resldincia
Nota: A subnutrl980 cr6n[cl rellocte a desnutrlyiiO Cr6nlca; a subnutrlc;iio aguda ret[ecte a dosnutrl9io aguda
Subnutri~ao Aguda
Maputo iI.b",n" Ru.al City
Fonto: IOSM 1997
As varia90es regionais das subnutri90es cr6nica e aguda sao bastante evidentes, com as prevalSncias mais elevadas de subnutri90es cr6nica e aguda na provincia costeira de Cabo Delgado, no nordeste (57% e 16%, respectivamente) (Figura 2.4). A provincia de Maputo tern preva1encias bastante baixas de subnutri90es cr6nica e aguda. Embora Cabo Delgado tenba a prevalencia total de subnutri9ao aguda mais elevada, a subnutrigao aguda grave e mais predominante em Sofala, onde a diarreia sazonal e
Figura 2.4 Subnutrh;:ao Cr6nica e Subnutrh;:ao Aguda entre as Crianyas Menores de 3 Anos de Idade por
Provincia, Moyambique
70
60
50
40
30
20
10
Subnutrl~ao Cr6nica
Nota: A SUbnutrlpao cr6nlca reflecte a desnuttlc;ao cr6nlca; a subnutrl~ao aguda reflecte a desnutrh;:ao aguda,
15
Subnutril;ao Aguda
Fonte: 108M 1997
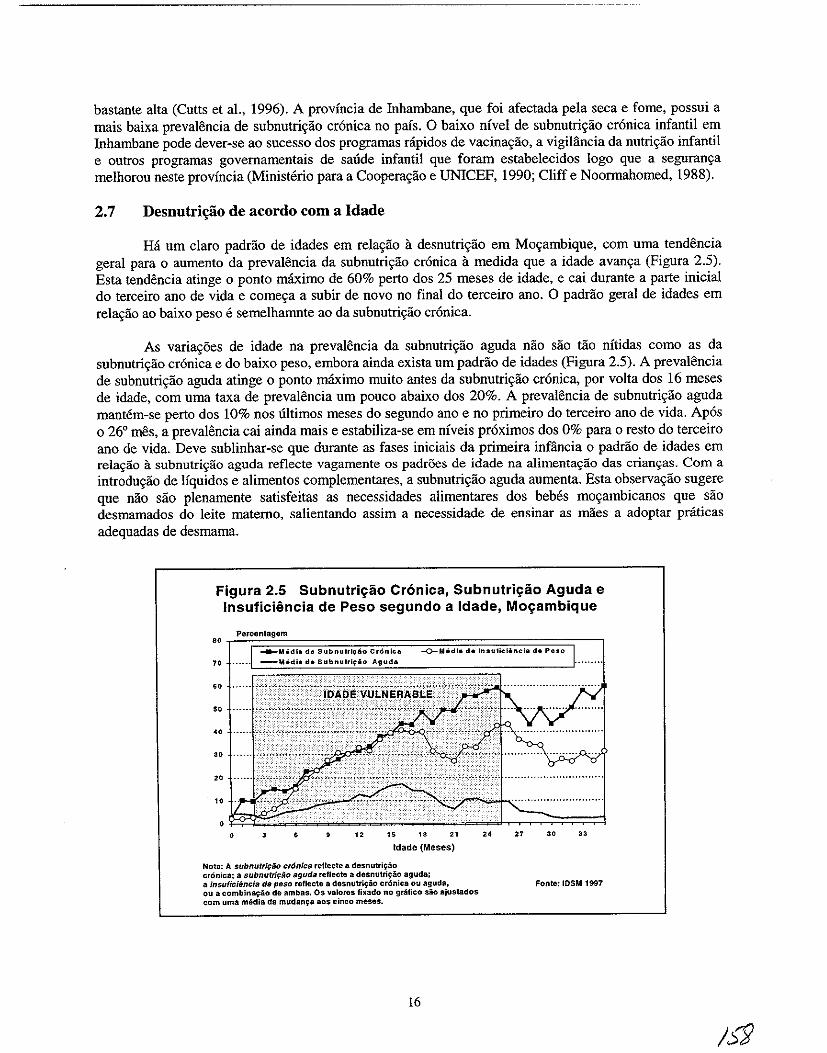
bastante alta (Cutts et aI., 1996). A provincia de lnhambane, que foi afectada pela seca e fome, possui a mais baixa prevalencia de subnutri~ao cronica no pais. 0 baixo nivel de subnutri~ao cronica infantil em lnhambane pode dever-se ao sucesso dos programas nipidos de vacina~ao, a vigililncia da nutri~ao infantil e outros programas govemamentais de saude infantil que foram estabelecidos logo que a seguran~a melhorou neste provincia (Ministerio para a Coopera~ao e UNICEF, 1990; Cliff e Noormahomed, 1988).
2.7 Desnutril;iio de acordo com a Idade
Ha urn claro padrao de idades em rela~ao it desnutri~ao em Mo~ambique, com uma tendencia geral para 0 aumento da prevalencia da subnutri~ao cronica it medida que a idade avan~a (Figura 2.5). Esta tendencia atinge 0 ponto maximo de 60% perto dos 25 meses de idade, e cai durante a parte inicial do terceiro anD de vida e come~a a subir de novo no final do terceiro ano. 0 padrao geral de idades em rela~ao ao baixo peso e semelhamnte ao da subnutri~ao cronica.
As varia~6es de idade na prevalencia da subnutri~ao aguda nao sao tao nitidas como as da snbnutri~ao cronica e do baixo peso, embora ainda exista urn padrao de idades (Figura 2.5). A prevalencia de subnutri~ao aguda atinge 0 ponto maximo muito antes da subnutri~ao cronica, por volta dos 16 meses de idade, com uma taxa de prevalencia urn pouco abaixo dos 20%. A prevalencia de subnutri~ao aguda mantem-se perto dos 10% nos ultimos meses do segundo ano e no primeiro do terceiro anD de vida. Apos 026' mes, a prevaiencia cai ainda mais e estabiliza-se em niveis proximos dos 0% para 0 resto do terceiro anD de vida. Deve sublinhar-se que durante as fases iniciais da primeira infancia 0 padrao de idades em rela9ao it subnutri9ao aguda reflecte vagamente os padr5es de idade na alimenta9ao das crian9as. Com a introdu~ao de Hquidos e alimentos compiementares, a subnutri~ao aguda aumenta. Esta observa~ao sugere que nao sao pienamente satisfeitas as necessidades alimentares dos beMs mo~ambicanos que sao desmamados do leite matemo, salientando assim a necessidade de ensinar as maes a adoptar pniticas adequadas de desmama.
Figura 2.5 Subnutri~lio Cronica, Subnutri~lio Aguda e Insuficiencia de Peso segundo a Idade, Mo~ambique
Percentagem
.. ~~~~~~~~~~~~==~~~~~~~~~~~,-~ -o-M6dia de Insutlclincla da Peso
70 .. " .. " " 10
• • " " " " Idade (Meses)
Nota: A subnutri9ao cr6nica rellecte a desnutril;:ao cronie8: a $ubnutriFao aguda reflecte a desnutri~ao aguda; a insuiicifmcia de peso reflecte a desnutri{:io croniea ou aguda, ou a combina~ao de ambas. Os valores fixado no gTafleo sio ajustados com uma media da mudan{:a 80S cinco meses.
16
24 27 " "
Fonte: 105M 1997
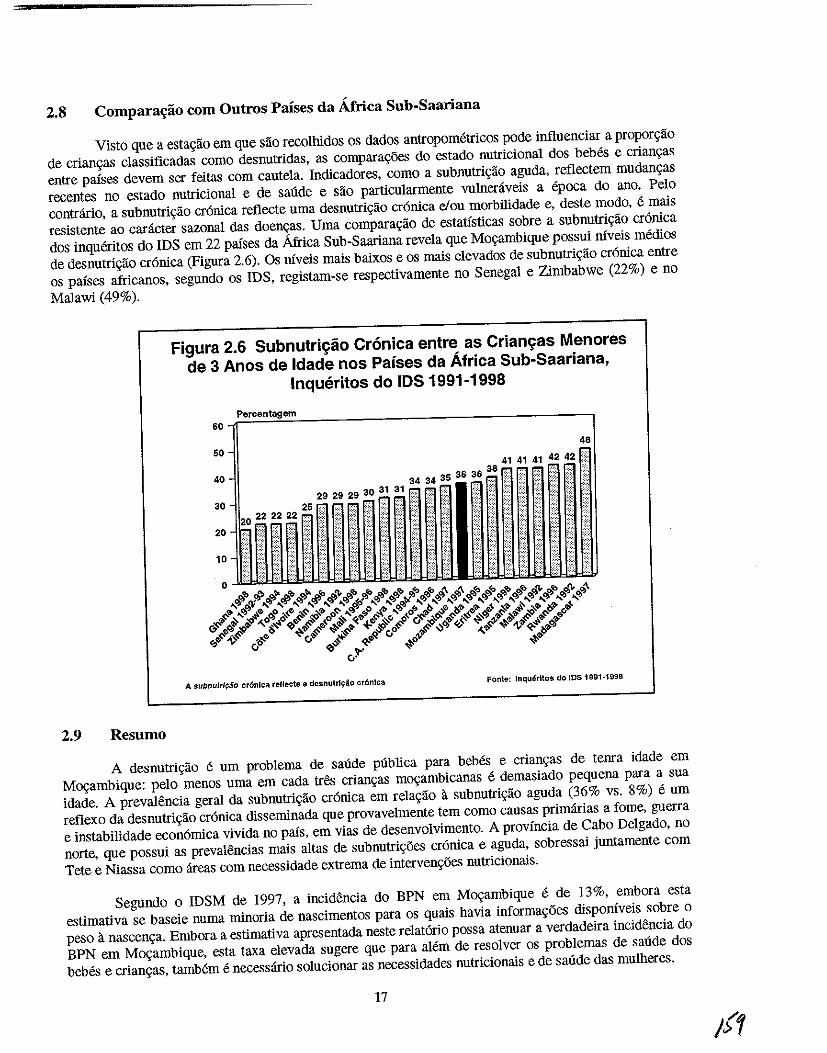
2.8 Comparac;ao com Outros Proses da Africa Sub-Saariana
Visto que a estagao em que sao recolhidos os dados antropometricos pode influenciar a proporgao
de crian<tas c1assificadas como desnutridas, as compara\,6es do estado nutricional dos bebes e criangas
entre paises devem ser feitas com cautela. Indicadores, como a subnutrigao aguda, reflectem mUdangas
recentes no estado nutricional e de salide e sao partlcularmente vnlneniveis a epoca do ano. Pelo
contrario, a subnutrigao cr6nica reflecte uma desnutrigao cr6nica eI ou morbilidade e, deste modo, e mais
resistente ao caracter sazonal das doengas. Uma comparaglio de estatlsticas sobre a subnutrigao cr6nica
dos inqueritos do IDS em 22 paises da Africa Sub-Saariana revela que Moc;ambique possui niveis medios
de desnutrigao cr6nica (Figura 2.6). Os niveis mais baixos e os mais elevados de subnutrigao cr6nica entre
os paises africanos, segundo os IDS, registam-se respectivamente no Senegal e Zimbabwe (22%) e no
Malawi (49%).
2.9 Resumo
Figura 2.6 Subnutrif;:ao Cronica entre as Criam;:as Menores
de 3 Anos de Idade nos Parses da Africa Sub-Saari ana,
Inqueritos do IDS 1991-1998
Percentagem 60-r~~~~---------------------------
-------~
50 48
41 41 41 42 42 ~> 38 . .-
40- 3434353636.",,{:;
:~·riT""1 P I ~,~"",:,: ~ t 0 ~ . i ~
~~~iHiU~iJI
A subnutr/f:io cr6nlca re11ecte a desnutrlyao cr6nlca Fonte: Inquerltos do IDS 1991-1998
A desnutric;ao e urn problema de salide publica para bebes e crianc;as de tenra idade em
M09ambique: pelo menos uma em cada tres crianc;as moc;ambicanas e demasiado pequena para a sua
idade. A prevalencia geral da subnutrigao cr6nica em relagao iI subnutrigiio aguda (36% vs. 8%) e urn
reflexo da desnutrigao cr6nica disseminada que provavelmente tern como causas primarias a fome, guerra
e instabilidade econ6mica vivida no pais, em vias de desenvolvimento. A provincia de Cabo Delgado, no
norte, que possui as prevalencias mais altas de subnutrigoes cr6nica e aguda, sobressai juntamente com
Tete e Niassa como areas com necessidade extrema de intervengoes nutricionais.
Segundo 0 IDSM de 1997, a incictencia do BPN em M09ambique e de 13%, embora esta
estimativa se baseie numa minoria de nascimentos para os quais havia informagoes disp0nlveis sobre 0
peso iI nascenga. Embora a estimativa apresentada neste relat6rio possa atenuar a verdadeira incidencia do
BPN em M09ambique, esta taxa elevada sugere que para alem de resolver os problemas de satide dos
bebes e criangas, tambem e necessario solucionar as necessidades nutricionais e de satide das mulheres.
17
2.10 Recomenda\;oes
As recomendagoes gerais para 0 melhoramento do estado nutricional de bebes e crian9as de tenra idade em Mogambique slio as seguintes:
Monitorizar;tio do Crescimento e do Estado de Saude
• Uma va que 0 Ministerio de Saude planificou aurnentar a rede sanitaria, outros obstaculos ao parto institucionalizados devem ser analisados de modo a aurnentar 0 usa destas facilidades, 0
que permitera a identificaglio dos bebes 'em risco'.
• Oevido it baixa percentagem de nascimentos em instituigoes, formar as parteiras tradicionais para a monitorizaglio do crescimento e para a vigililncia da situaglio nutricional, em projectos pilotos. Estabelecer a avaliagao do peso it nascenga como pratica normativa entre as parteiras na comunidade.
• Solucionar os constrangimentos logisticos na pesagem das criangas em areas com infraestruturas pobres, especialmente em areas rurais. Por exemplo, distribuir balan9as portateis as parteiras tradicionais de modo a ajudar it determinaglio oportuna do peso do bebe it nascenga.
Injluencia sobre os baixos pesos Ii nascenqa atraves de um melhor Estado de Saade das Mulheres em Idade Rep rodutiva
• Solucionar a deficiencia em acido f6licolferro, a malaria e outras doengas infecciosas nas mulheres. Estas condigoes foram registadas como causadoras de anemia (que esta Iigada ao baixo peso it nascenga) nas mulheres em idade femI.
• Estabelecer mecanismos para a prevengao e para a detecgao e tratamento oportunos de doengas sexualmente transmitidas (OST) em Mogambique. Oevido it elevada prevalencia de OST em Mogambique (CIS I, 1995), os esforgos no sentido da sua redugao podem ter urn impacto positivo na redugao de resultados adversos da gravidez que estao relacionados com as OST (p.ex. baixo peso it nascenga).
Redur;iio da Subnutrir;tio Cr6nica e da Subnutrir;tio Aguda
• Num esforgo para reduzir a subnutri9ao cr6nica entre criangas rurais, estabelecer mecanismos para expandir actividades produtivas, comerciais e melhorar 0 rendimento agricola em pequenas exploragoes familiares. A fraca produglio agricola e uma das causas primarias da inseguranga alimentar em areas rurais (Ministerio para a Cooperagao e UNICEF, 1990).
• Num esforgo para reduzir a subnutriglio aguda entre as criangas, reduzir factores como a malaria e a diarreia.
Tratamento das crianr;as malnutridas
• Actualiza9lio das normas para 0 tratamento da malnutri9ao grave, de acordo com as novas normas da OMS.
18
Melhoramento das InJraestruturas de Saude
• Prosseguir com 0 alargamento das infraestruturas rurais de cuidados de saude, com enfase no estabelecimento de serviyos integrados para 0 bem-estar do beM (p. ex., serviyos de nutriyao e vacinayao) e controlo integrado das doenyas infantis (elDI).
Investigar;:tio
• Apoiar investigayoes que tenbam como objectivo verificar qual a condiyao subjacente -nascimento prematuro e crescimento intra-uterino retardado - que e responsavel pelo BPN em Moyambique, e planear intervenyoes conforme as conclusoes.
• Atraves da investigayao qualitativa, explorar a influencia da percepyao pela mae do tamanbo do seu recem-nascido no modo como cuida da crianya e nas praticas de alimentayao.
19
CAPITULO 3
PRATICAS ALIMENTARES DOS BEBES E CRIAN<;AS
As praticas alimentares dos beMs e crianvas sao os principais determinantes dos riscos de desnutrivao, morbilidade e mortalidade no mundo em desenvolvimento. Com base na sua importancia, a OMS e a UNICEF (OMS, 1994; OMS e UNICEF, 1990) desenvolveram padroes internacionais de praticas alimentares dos beMs e crianvas. Este capitulo descreve as praticas alimentares dos bebes e crianvas em Movambique e compara-as com as praticas alimentares adequadas dos bebes, prescritas pela OMS e UNICEF.
3.1 Praticas Alimentares Adequadas dos Bebes e Crian~as
A OMS e a UNICEF (OMS e UNICEF, 1990; OMS, 1994) definem a alimentavao adequada dos beMs e crianvas da seguinte maneira:
• Iniciar it amamenta9lio dentro do espa90 de uma hora ap6s 0 nascimento
• Amamenta9liO frequente, sempre que 0 bebe queira (inc1uindo mamadas nocturnas)
• Amamentavao exc1usiva (definida como apenas leite materno e nenhum outro alimento ou liquido) ate que 0 beM atinja os seis meses de idade
• Introdu9lio de suplementos alimentares locals e adequados aos seis meses de idade.
• Aumentar a frequencia de amamentavlio durante periodos de doenva e de recupera9lio.
• Amamentavao continua ate e para alem do segundo ano de idade.
Como demonstrado nas directivas anteriores, a amamenta9lio nao so e necessaria, como tamMm suficiente nos primeiros seis meses de vida. Urn atraso na amamenta9ao conduz a uma introdu9ao precoce de outros Ifquidos e alimentos, que podem causar infec90es e impedir que a mae de leite materno ao bebe (perez-Escaruilla et a!., 1996). A amamenta9lio logo na primeira hora de vida aumenta 0 reflexo natural de sugar do recem-nascido, que ajuda a estimular a produvlio do leite materno e fornece ao recem-nascido os nutrientes e anti-corpos (bacterianas e virais) do colostro (Righard e Alade, 1990). Para alem dis so, 0 contacto imediato entre a mae e 0 recem-nascido desenvolve os la90s afectivos entre mae-MM e ajuda a manter a temperatura do corpo do bebe - urn factor importante para a sobrevivencia do recem-nascido (Daga et al., 1993). A amamenta9ao logo no inicio tamMm permite que 0 utero se retraia, 0 que reduz a hemorragia pos-parto na mae.
Para alem do periodo de inicia9ao da amamenta9ao, a sua frequencia e tamMm importante. A frequencia, amamentar sempre que 0 beM queira, incluindo as mamadas nocturnas, assegura que 0 beM seja alimentado com quantidades suficientes de leite materno para satisfazer as suas necessidades dieteticas e tambem ajuda a manter a produ9ao constante de leite materno. As mamadas frequentes sao tambem importantes para manter 0 peso do bebe e podem ajudar a evitar 0 problema de encarovamento do peito da mae. (de Carvalho et aI., 1983). De preferencia, os beMs devem ser amamentados entre oito a 10 vezes em cada 24 horas. No entanto, durante 0 primeiro ano de vida a amamenta9ao pode ser ainda mais frequente.
21
I~
De todas as formas de alimenta<;ao, a amamenta<;ao exclusiva e a mais importante para a sobreviv6ncia do bebe. A amamentaliao exclusiva e a alimenta<;ao com 0 leite materno como unica fonte de alimento, e e suficiente para responder aos reqnisitos nutricionais do bebe durante os primeiros seis meses de vida (Cohen et aI., 1994). Em climas quentes ou hl1midos, 0 leite materno satisfaz as necessidades Ifquidas do bebe e previne a desidrata<;ao (Sachdev et aI., 1991). A amamentaliao exclusiva tamMm reduz 0 risco de contrac<;ao de doenlias durante a infancia (Huffman e Combest, 1990). Por exemplo, os beMs exclusivamente amamentados t6m 14 vezes menos probabilidade de morrerem de diarreia comparando com os beMs alimentados com outros 1eites (nao 0 materno) e quatro vezes menos comparando com os parcialmente amamentados (Victora et al., 1987).
Tanto a OMS como a UNICEF (1990) aflfmam que as crianlias podem beneficiar dos varios beneficios nutricionais e imunol6gicos da amamentaliao ate ao segundo ano de vida. Contudo, por volta dos seis meses de idade, 0 leite materna s6 por si ja nao satisfaz as necessidades caloricas e protei cas da maioria dos beMs. Como resposta a estas novas exig6ncias nutricionais, deverao ser dados suplementos alimentares ao beM - alimentos suaves faceis de digerir e ricos em calorias, proteinas e micronutrientes -como complemento ao leite materno. Durante 0 periodo de transiliao, quando sao introduzidos os alimentos suplementares, a mae deve continuar a amamentar sempre que 0 bebe queira, e de forma frequente para assegurar que 0 beM continue a usufruir dos beneficios do leite materno.
No mundo em desenvolvimento, a diarreia e, muitas vezes, associada a introduliao de alimentos e Uquidos complementares. Como uma medida de prevenliao da doenlia, e importante que seja mantida a higiene adequada durante a preparaliao e armazenamento dos alimentos. No caso do aparecimento de uma doenlia, e extremamente importante aurnentar a frequ6ncias das marnadas, urna vez que esta (a) reduz 0
risco de ingesta:o de nutrientes inadequados durante a doen<;a, (b) previne a desidrata<;ao, e (c) promove 0
crescimento. 0 consumo de todos os alimentos, excepto do leite materno, e reduzida durante a doen<;a (Hoyle et aI., 1980; Brown et aI., 1990; Dickin et al., 1990). Desta forma, 0 leite materno, sendo urn alimento de alta qualidade e higienico, desempenha urn papel bastante importante na conserva<;ao do estado nutricional do beM e da crianlia nos periodos de doenlia.
3.2 lnicio da Amamenta<;ao
Em MO\iambique, 95% dos beMs sao amamentados (Tabela 3.1). Esta inicia quase imediata depois do parto, com 81 % dos beMs a serem amamentados durante a primeira hora de vida. No final do primeiro dia, mais de 95% dos beMs mO\iambicanos iniciam a amamentaliao beneficiandon-se assim do valor nutricional e de saude do leite materno.
Nao existem diferenlias rurais e urbanas na preval6ncia geral do aleitamento materno, apesar de existirem diferenlias na inicialiao do mesmo. Uma percentagem significativamente mais elevada de beMs das areas rurais sao amamentados na primeira hora de vida comparativamente aos bebes das areas urbanas (83% vs. 74%, respectivamente). No entanto, no primeiro dia de vida, a preval6ncia aurnenta em ambas as areas e a diferenca rural-urbano diminui ligeiramente (97% vs. 92%). As varialioes regionais no periodo de inicia<;ao da amamenta<;ao sao elevadas, rondando entre os 63% nas provincias do Norte de Cabo Delgado e os 96% nas zonas fronteiricas de Niassa. Estas diferencas sao reduzidas no primeiro dia de vida, apesar da percentagem de beMs amamentados no primeiro dia de vida ser ainda baixa em Cabo Delgado (85%) comparada aos 92% ou mais noutras provincias.
As diferen<;as rurais e urbanas no inicio do aleitamento materna podem ser parcialmente explicadas pelas diferenlias dos padroes de procura de assistl3ncia ao trabalho de parto. As maes das areas urbanas tendem a procurar assist6ncia em Unidades Sanitarias, ao passo que as mlies das areas rurais tendem a efectuar 0 parto em suas casas com a ajuda de uma parteira tradicional, parteira auxiliar ou parente. As maes que t6m 0 parto em Unidades Sanitarias tendem a iniciar a amamentaliao mais tarde porque nem sempre sao aconselhadas a iniciar imediatamente depois do parto, iniciando uma hora depois de terem descansado; ao contrario, as mulheres que tl3m 0 parto em Unidades Sanitarias do tipo "Hospital
22
/t.3
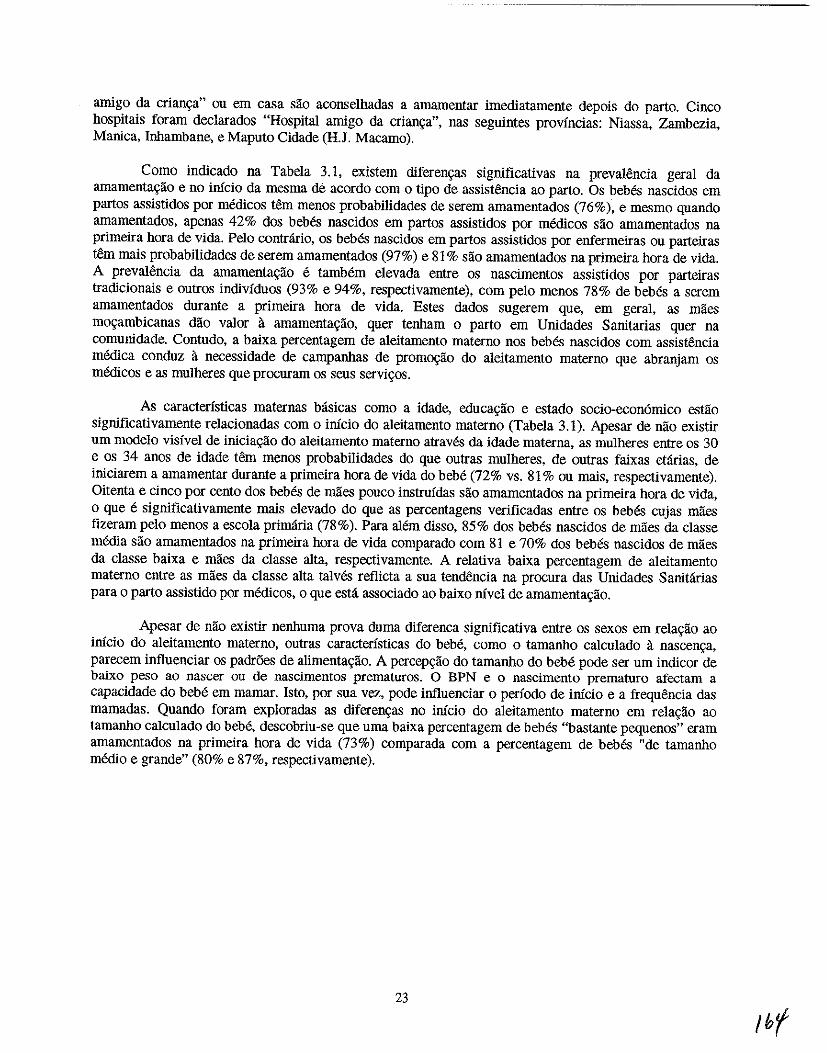
amigo da criano;:a" ou em casa sao aconselhadas a amamentar imediatamente depois do parto. Cinco hospitais foram decIarados "Hospital amigo da crianga", nas seguintes provincias: Niassa, Zambezia, Manica, Inhambane, e Maputo Cidade (H.J. Macamo).
Como indicado na Tabela 3.1, existem diferengas significativas na prevalSncia geral da amamentagao e no infcio da mesma de acordo com 0 tipo de assisttlncia ao parto. Os bebes nascidos em partos assistidos por medicos tern menos probabilidades de serem amamentados (76%), e mesmo quando amamentados, apenas 42% dos bebes nascidos em partos assistidos por medicos sao amamentados na primeira hora de vida. Pelo contrario, os bebes nascidos em partos assistidos por enfermeiras ou parteiras tern mais probabilidades de serem amamentados (97%) e 81 % sao amamentados na primeira hora de vida. A prevalencia da amamentagao e tamMm elevada entre os nascimentos assistidos por parteiras tradicionais e ontros individuos (93% e 94%, respectivamente), com pelo menos 78% de bebes a serem amamentados durante a primeira hora de vida. Estes dados sugerem que, em geral, as maes mogambicanas dao valor it amamentagao, quer tenham 0 parto em Unfdades Sanitarias quer na comunidade. Contudo, a baixa percentagem de aleitamento materna nos bebes nascidos com assistencia medica conduz it necessidade de campanhas de promogao do aleitamento materna que abranjam os medicos e as mulheres que procuram os seus servigos.
As caracteristicas maternas b:lsicas como a idade, educagao e estado socio-econ6mico estlio significativamente relacionadas com 0 infcio do aleitamento materno (Tabela 3.1). Apesar de na~ existir urn modelo visivel de iniciac;ao do aleitamento materna atraves da idade materna, as mulheres entre os 30 e os 34 anos de idade tern menos probabilidades do que outras mulheres, de outras faixas etarias, de iniciarem a amamentar durante a primeira hora de vida do beM (72% vs. 81 % ou mais, respectivamente). Oitenta e cinco por cento dos bebes de maes pouco instruidas sao amamentados na primeira hora de vida, o que e significativamente mais elevado do que as percentagens verificadas entre os bebes cujas maes fizeram pelo menos a escola primaria (78%). Para alem disso, 85% dos bebes nascidos de maes da classe media sao amamentados na primeira hora de vida comparado com 81 e 70% dos bebes nascidos de maes da cJasse baixa e miles da cJasse alta, respectivamente. A relativa baixa percentagem de aleitamento materno entre as maes da cJasse alta talves reflicta a sua tendencia na procura das Unidades Sanitarias para 0 parto assistido por medicos, 0 que esta associado ao baixo nfvel de amamentagao.
Apesar de nao existir nenhuma prova duma diferenca significativa entre os sexos em relagao ao infcio do aleitamento materno, outras caracteristicas do bebe, como 0 tamanho calculado it nascenga, parecem influenciar os padr6es de alimentac;ao. A percepgao do tamanho do beM pode ser urn indicor de baixo peso ao nascer ou de nascimentos prematuros. 0 BPN e 0 nascimento prematuro afectam a capacidade do bebe em mamar. Isto, por sua vez, pode influenciar 0 periodo de infcio e a frequencia das mamadas. Quando foram exploradas as diferengas no infcio do aleitamento materna em relagilo ao tamanho calculado do bebe, descobriu-se que uma baixa percentagem de bebes "bastante pequenos" eram amamentados na primeira hora de vida (73%) comparada com a percentagem de bebes "de tamanho medio e grande" (80% e 87%, respectivamente).
23
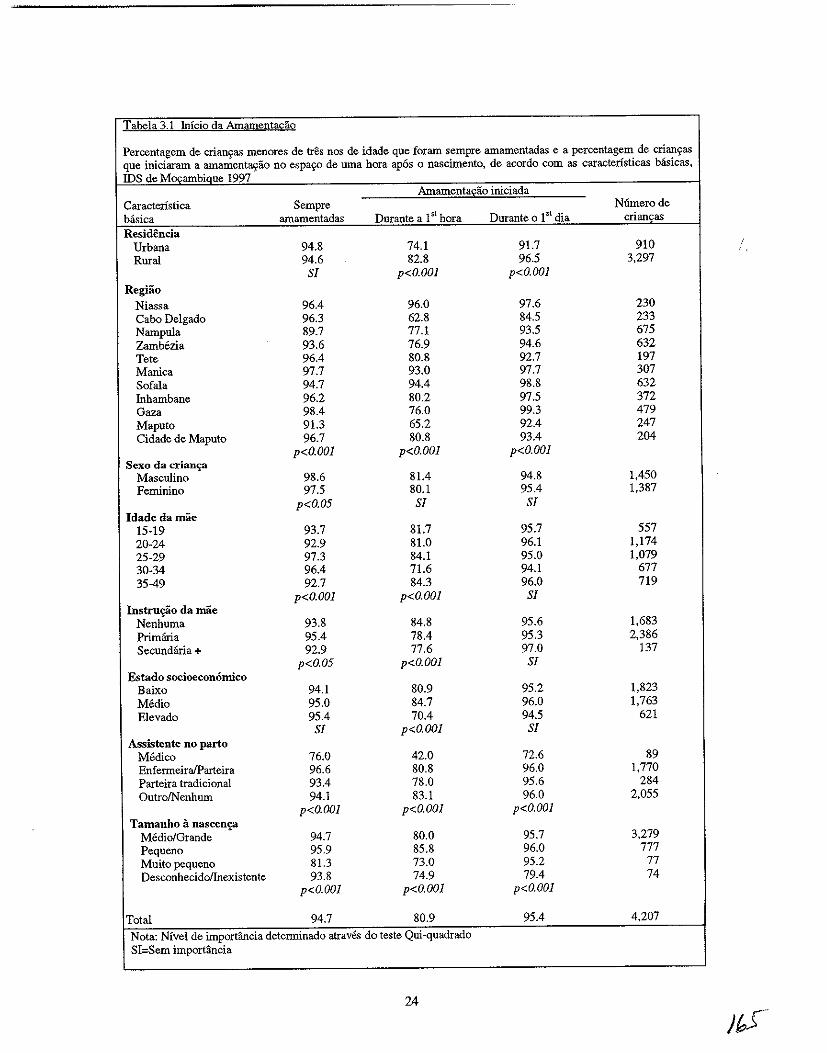
Tabela 3.1 Inicio da Amament!!&3.o
Percentagem de crian'fas menores de tres nos de idade que foram sempre amamentadas e a percentagem de crian9as que iniciaram a amamenta.!fao no espa90 de uma hora apos 0 nascimento, de acordo com as caracteristicas basicas, IDS de Mocambiaue 1997
Amamenta£ao iniciada Caracteristica Sempre Niimerode basica amamentadas Durante a 1 sl hora Durante 0 15t dia criam;as Residencia
Urbana 94.8 74.1 91.7 910 Rural 94.6 82.8 96.5 3,297
Sf p<O.OOl p<O.OOl RegHio
Niassa 96.4 96.0 97.6 230 Cabo Delgado 96.3 62.8 84.5 233 Narupula 89.7 77.1 93.5 675 Zambozia 93.6 76.9 94.6 632 Tete 96.4 80.8 92.7 197 Manica 97.7 93.0 97.7 307 Sofala 94.7 94.4 98.8 632 fuhambane 96.2 80.2 97.5 372 Gaza 98.4 76.0 99.3 479 Maputo 91.3 65.2 92.4 247 Cidade de Maputo 96.7 80.8 93.4 204
p<O.OOl p<O.OOl p<O.OOl Sexo da crian~
Masculino 98.6 81.4 94.8 1,450 Feminino 97.5 80.1 95.4 1,387
p<O.05 Sf Sf Idadedamae
15-19 93.7 81.7 95.7 557 20-24 92.9 81.0 96.1 1,174 25-29 97.3 84.1 95.0 1,079 30-34 96.4 71.6 94.1 677 35-49 92.7 84.3 96.0 719
p<O.OOl p<O.OOl Sf Instru~o da mae
Nenhuma 93.8 84.8 95.6 1,683 Primfuia 95.4 78.4 95.3 2,386 Secundana + 92.9 77.6 97.0 137
p<O.05 p<O.OOl Sf Estado socioeconomico
Baixo 94.1 80.9 95.2 1,823 Medio 95.0 84.7 96.0 1,763 Elevado 95.4 70.4 94.5 621
Sf p<O.OOl Sf Assistente no parto
Medico 76.0 42.0 72.6 89 EnfermeiralParteira 96.6 80.8 96.0 1,770 Parteira tradicional 93.4 78.0 95.6 284 OutrolNenhum 94.1 83.1 96.0 2,055
p<O.OOl p<O.OOl p<O.OOl Tamanho a nascen,?
Medio/Grande 94.7 80.0 95.7 3,279 Pequeno 95.9 85.8 96.0 777 Muito pequeno 81.3 73.0 95.2 77 Desconhecidollnexistente 93.8 74.9 79.4 74
p<O.OOl p<O.OOl p<O.OOl
Total 94.7 80.9 95.4 4,207
Nota: Nivel de importancia determinado atraves do teste Qui-quadrado SI=Sem importancia
24
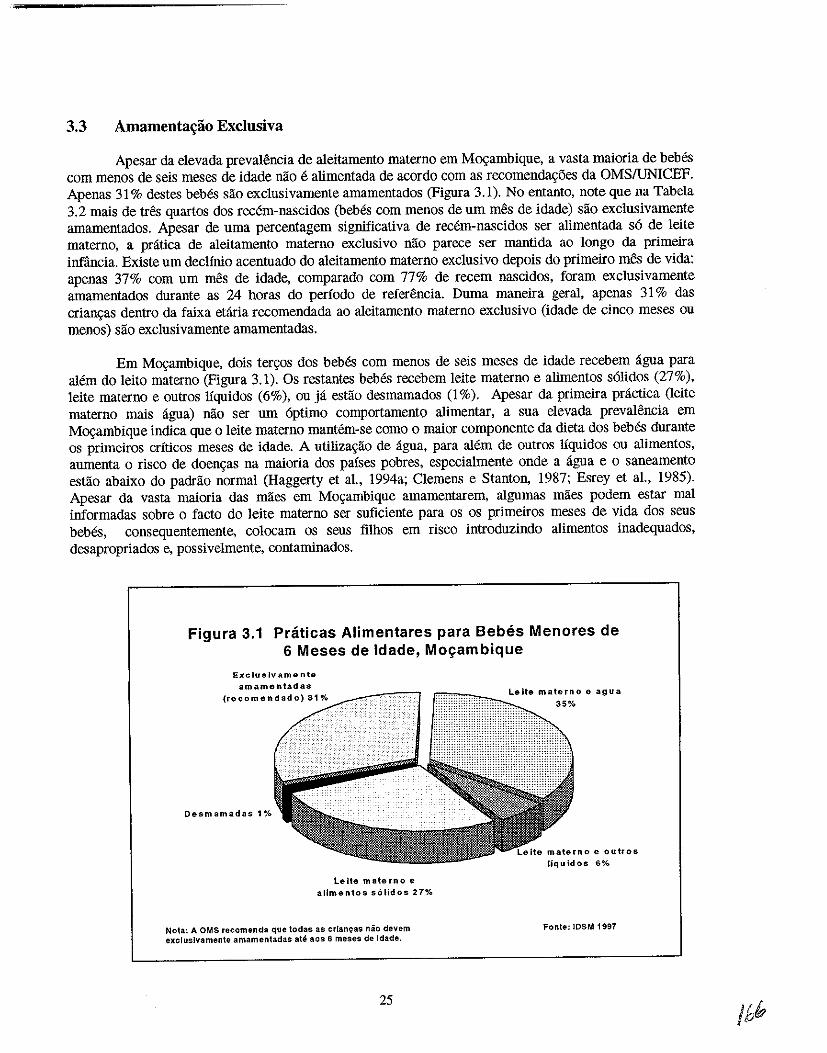
3.3 Amamenta~ao Exclusiva
Apesar da elevada prevalencia de aleiiamento materno em Ma.;:ambique, a vasta maioria de beMs com menos de seis meses de idade nao e alimentada de acordo com as recomenda~6es da OMS/UNICEF. Apenas 31 % destes bebes sao exclusivamente amamentados (Figura 3.1). No entanto, note que na Tabela 3.2 mais de tres quartos dos recem-nascidos (bebes com menos de urn mes de idade) sao exclusivamente amamentados. Apesar de uma perceniagem significativa de recem-nascidos ser alimentada s6 de leite materno, a pratica de aleiiamento materna exclusivo nao parece ser mantida ao longo da primeira infiincia. Existe urn declinio acentuado do aleitamento materna exdusivo depois do primeiro mes de vida: apenas 37% com urn mes de idade, comparado com 77% de recem nascidos, foram exclusivamente amameniados durante as 24 horas do periodo de referencia. Duma maneira geral, apenas 31 % das crian~as dentro da faixa etaria recomendada ao aleitamento materna exclusivo (idade de cinco meses ou menos) sao exclusivamente amameniadas.
Em Ma.;:ambique, dOis ter~os dos bebes com menos de seis meses de idade recebem agua para alem do leito materna (Figura 3.1). Os restantes bebes recebem leite materna e alimentos s6lidos (27%), leite materno e outros Uquidos (6%), ou ja estlio desmamados (1 %). Apesar da primeira practica (leite materna mais agua) nao ser urn 6ptimo comportamento alimentar, a sua elevada prevalencia em Ma.;:ambique indica que 0 leite materna mantem-se como 0 maior componente da dieia dos bebes durante os primeiros criticos meses de idade. A utiliza~ao de agua, para alem de outros Ifquidos ou alimentos, aurnenta 0 risco de doen~as na maioria dos pafses pobres, especialmente onde a agua e 0 saneamento estao abaixo do padrao normal (Haggerty et a!.. 1994a; Clemens e Stanton, 1987; Esrey et a!., 1985). Apesar da vasia maioria das maes em Mo~ambique amameniarem, algumas maes podem estar mal informadas sobre 0 facto do leite materna ser suficiente para os os primeiros meses de vida dos seus bebes, consequentemente, colocam os seus filhos em risco introduzindo alimentos inadequados, desapropriados e, possi velmente, contaminados.
Figura 3.1 Praticas Alimentares para Bebes Menores de 6 Meses de Idade, Mo\(ambique
Excluslvamente
amamentadas (recomendado) 31%
Desmamadas 1%
Le ite mate rn 0 e allmen10s s61idos 27%
Nota: A OMS recomenda que todas as cr[an9as nao devem excluslvamente arnamentadas ate 80S 6 meses de [dade.
25
Leite materno e agua 35%
liquidos 6%
Fonte: 108M 1997
Tabela 3.2 Prevalenciil do aleitamento miltemo exclusivo
Prevalencia de crians:as vivas exclusivamente amamentadas, nao excIusivamente amamentadas, e nao amamentadas, com idade inferior a tres anos, por idade da crians:a (em meses), Moqambique 1997
Nao Exclusiva- exclusiva-
mente mente Nao Numero Idade amamenta- amamenta- amamen- de (emmeses) das das tadas Total criancas Idadede amamenta£iio
<1 76.8 23.0 0.2 100.0 75 1 36.7 63.3 0.0 100.0 105 2 32.6 66.5 0.9 100.0 163 3 27.9 71.4 0.7 100.0 151 4 14.7 80.2 5.1 100.0 129 5 16.8 83.2 0.0 100.0 126
Todas as idades 0-5 30.9 67.8 1.2 100.0 749 6-9 2.2 96.0 1.8 100.0 464 10-11 2.8 93.4 3.8 100.0 210 12-15 0.3 93.6 6.0 100.0 479 16-19 1.5 82.8 15.7 100.0 380 20-23 0.0 58.2 41.8 100.0 379 24+ 0.0 23.9 76.1 100.0 1,100
Todas as criancas 6.8 63.7 29.5 100.0 3,760
As diferem;:as urbanas e rurais no aleitamento exclusivo nao sao significativas, apesar de existirem varia~oes significativas nas diferentes regiOes (Figura 3.2). 0 aleitamento exc1usivo e pelo menos praticado nas provincias de ZamMzia e NampuIa onde respectivamente apenas 2% e 3% das crian~as menos de 6 meses foram amamentadas de acordo com as recomenda~oes. Ao contnlrio nas provincias de Gaza e Inbambane, 83% e 89% dos beMs com menos de seis meses de idade eram exclusivamente amamentados. A propaga~ao do aleitamento exclusivo nestas provincias pode ser uma consequencia da falta de alimentos, 0 que Iimita as op\;i'ies das maes em termos de fontes alimentares aIternativas. As practicas cuIturais, em rela~ao ao aleitamento materna devem ser mais estudadas e entendidas.
Questoes sobre a natureza e extensao da utiIiza~ao do biberao nao estao incluidas no IDSM de 1997. Nao h:i informa~ao sobre a utiIiza~ao do biberao. Apesar do governo m~ambicano ter assinado a convensao da OMS sobre 0 c6digo de comerciaIiza~ao de substitutos do Ieite materno, 0 c6digo ainda nao esta a ser implementado, estando a espera da aprova~ao do conselho de ministros
26
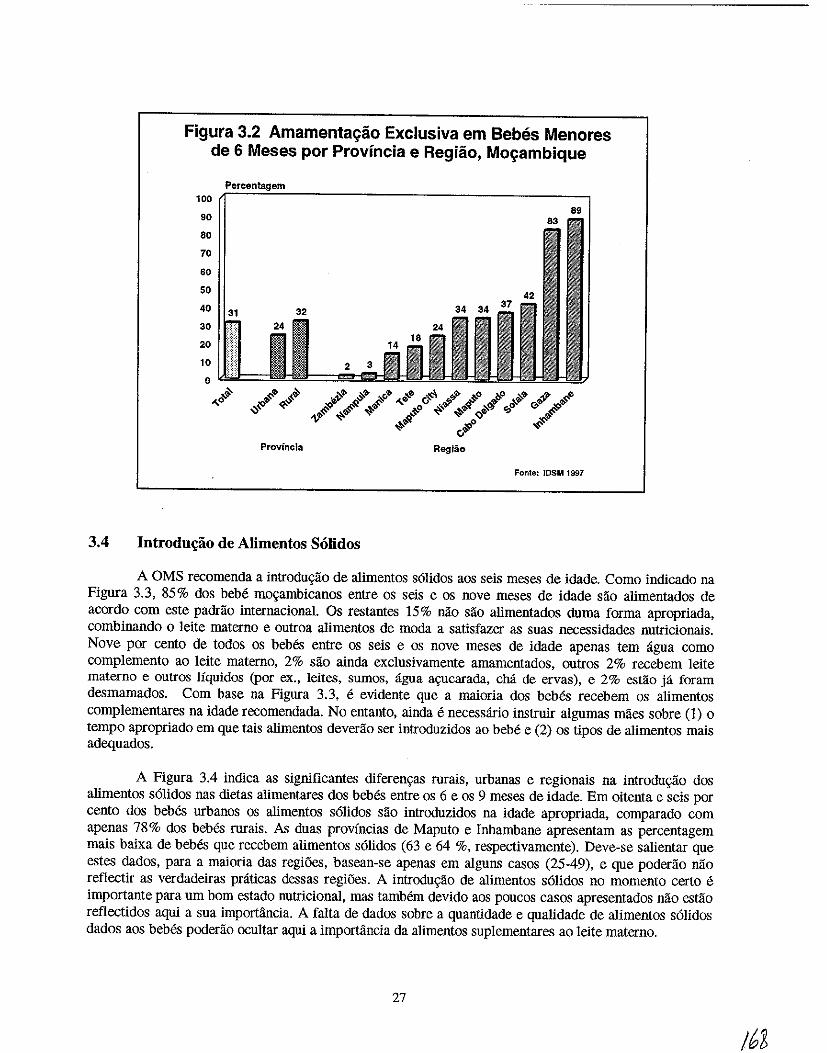
Figura 3.2 Amamentac;ao Exclusiva em Bebes Menores de 6 Meses por Provincia e Regiao, Moc;ambique
100 89
90
80
70
60
50
40 31 30
20
10
0 ,$ ,,-0
Fonte: IOSM 1997
3.4 Introdu~ao de Alimentos Solidos
A OMS recomenda a introdu«lio de alimentos s6lidos aos seis meses de idade. Como indicado na Figura 3.3, 85% dos bebe mo«ambicanos entre os seis e os nove meses de idade sao alimentados de acordo com este padrao internacional. Os restantes 15% nao sao alimentados duma forma apropriada, combinando 0 leite materno e outroa a1imentos de mOda a satisfazer as suas necessidades nutricionais. Nove por cento de todos os bebes entre os seis e os nove meses de idade apenas tern ligua como complemento ao leite materno, 2% sao ainda exclusivamente amamentados, outros 2% recebem leite materna e outros Iiquidos (por ex., ieites, sumos, agua a\Oucarada, cha de ervas), e 2% estao ja foram desmamados. Com base na Figura 3.3, e evidente que a maioria dos bebes recebem os alimentos complementares na idade recomendada. No entanto, ainda e necessario instruir algumas maes sobre (1) 0
tempo apropriado em que tais alimentos deverao ser introduzidos ao beM e (2) os tipos de alimentos mais adequados.
A Figura 3.4 indica as significantes diferen«as rurais, urbanas e regionais na introdu«lio dos a1imentos s6lidos nas dietas alimentares dos bebes entre os 6 e os 9 meses de idade. Em oitenta e seis por cento dos bebes urbanos os a1imentos s6lidos sao introduzidos na idade apropriada, comparado com apenas 78 % dos bebes rurais. As duas provincias de Maputo e Inbambane apresentam as percentagem mais baixa de bebes que recebem alimentos s6lidos (63 e 64 %, respectivamente). Deve-se salientar que estes dados, para a maioria das regiOes, basean-se apenas em alguns casos (25-49), e que poderao nao refiectir as verdadeiras praticas dessas regi5es. A introdu«ao de alimentos s6lidos no momenta certo e importante para urn born estado nutricional, mas tamMm devido aos poucos casos apresentados nao estao refiectidos aqui a sua importancia. A falta de dados sobre a quanti dade e qualidade de alimentos s6lidos dados aos bebes poder1io ocultar aqui a importancia da alimentos suplementares ao leite materno.
27
/62
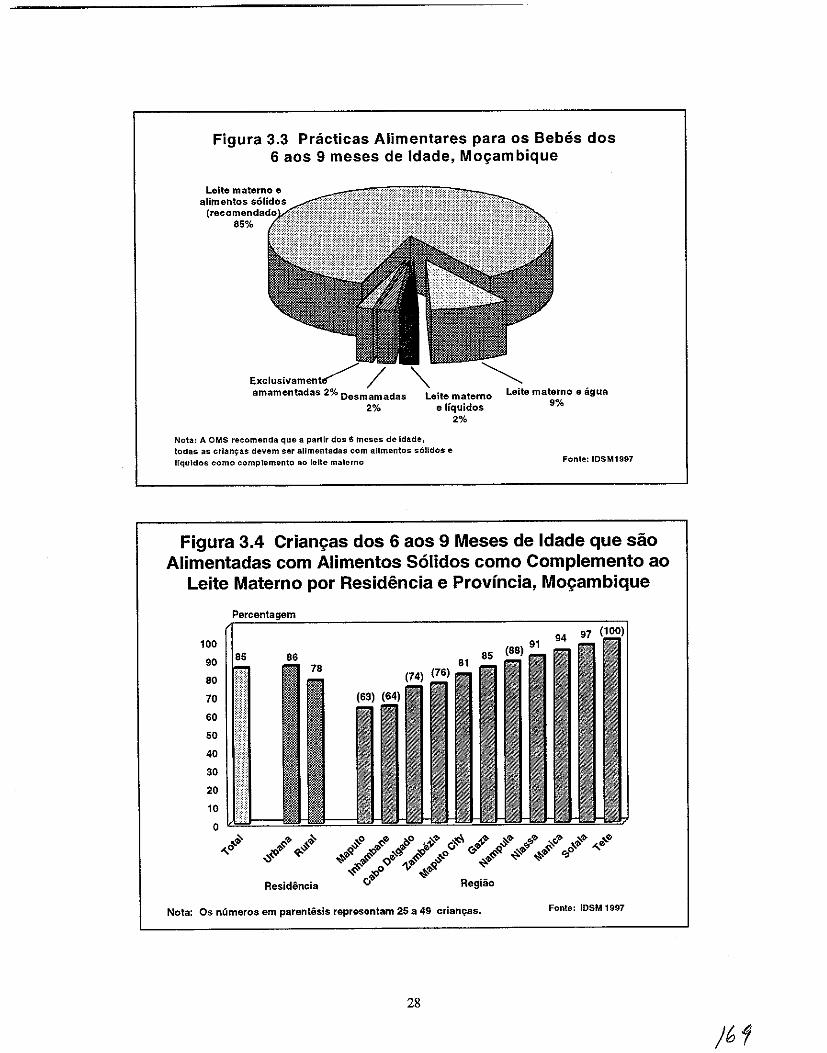
Figura 3.3 Pnicticas Alimentares para os 8ebes dos 6 aos 9 meses de Idade, Mo~ambique
amamentadas 2% Oesmamadas
2%
Nota: A OMS recomenda que a partir dos 6 meses de [dade,
Leite materno e Ifquidos
2%
todas as crlanlj:as devem ser allmentadas com allmentos s611dos e IfquJdos como complernento 80 lelte materno
Leite materno e agua 9%
Fonte: IDSM1997
Figura 3.4 Crian{:as dos 6 aos 9 Meses de Idade que sao Alimentadas com Alimentos S61idos como Complemento ao
Leite Materno por Residencia e Provincia, Mo{:ambique
100
90
80
70
60
50
40
30
20
10
0
'" ,,~
Residencia
Nota: Os nCimeros em parentesis representam 25 a 49 crian't'as. Fonte: IOSM 1997
28
)61
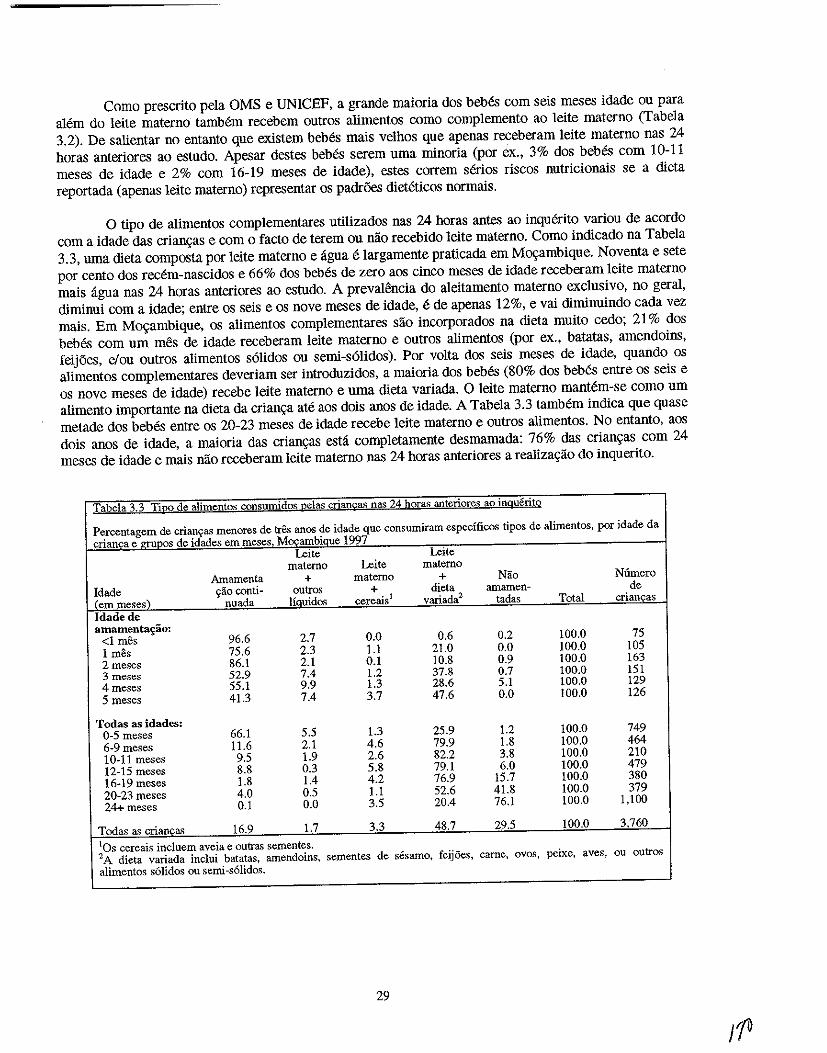
Como prescrito pela OMS e UNICEF, a grande maioria dos bebes com seis meses idade ou para alem do leite materno tamMm recebem outros alimentos como complemento ao leite materno (Tabela 3.2). De salientar no entanto que existem beMs mais velhos que apenas receberam leite materna nas 24 horas anteriores ao estudo. Apesar destes beMs serem uma minoria (por ex., 3% dos bebes com 10-11 meses de idade e 2% com 16-19 meses de idade), estes correm serios riscos nutricionais se a dieta reportada (apenas leite materno) representar os padr6es dieteticos normais.
o tipo de alimentos complementares utilizados nas 24 horas antes ao inquerito variou de acordo com a idade das crianc,:as e com 0 facto de terem ou nao recebido leite materno. Como indicado na Tabela 3.3, uma dieta composta por leite materna e ligna e largamente praticada em Moc,:ambique. Noventa e sete por cento dos recem-nascidos e 66% dos beMs de zero aos cinco meses de idade receberam leite materuo mais ligna nas 24 horas anteriores ao estudo. A prevaH~ncia do aleitamento materna exclusivo, no geral, diminui com a idade; entre os seis e os nove meses de idade, e de apenas 12%, e vai diminuindo cada vez mais. Em Moc,:ambique, os alimentos complementares sao incorporados na dieta muito cedo; 21 % dos bebes com urn mes de idade receberam leite materna e outros alimentos (por ex., batatas, amendoins, feijoes, elou outros alimentos s6lidos ou semi-s6Jidos). Por volta dos seis meses de idade, quando os alimentos complementares deveriam ser introduzidos, a maioria dos bebes (80% dos beMs entre os seis e os nove meses de idade) recebe leite materno e uma dieta variada. 0 leite materno mantem-se como urn alimento importante na dieta da crianc,:a ate aos dois anos de idade. A Tabela 3.3 tamMm indica que quase metade dos bebes entre os 20-23 meses de idade recebe leite materno e outros alimentos. No entanto, aos dois anos de idade, a maloria das crianc,:as estli completamente desmamada: 76% das crianc,:as com 24 meses de idade e mais nao receberam leite materna nas 24 horas anteriores a realizac,:ao do inquerito.
Tabela 3.3 Ti~o de alimentos consumidos nelas crian£as na<; 24 hQIas anteriores ao inguerito
Percentagem de crianyas menores de tres aDOS de idade que consumiram especfficos tipos de alimentos, por idade da crianca e-=s de idades em meses Mocambiaue 1997
Leite Leite materna Leite materna
Amamenta + materna + Nilo Nlimero Idade 'iaa conti- outros + dieta amamen- de (emmese,) nuada liQuidos cereais l variada2 tadas Total criancas Idade de amament~ao:
<1 mes 96.6 2.7 0.0 0.6 0.2 100.0 75 1 mes 75.6 2.3 1.1 21.0 0.0 100.0 lOS 2meses 86.1 2.1 0.1 10.8 0.9 100.0 163 3 meses 52.9 7.4 1.2 37.8 0.7 100.0 151 4 meses 55.1 9.9 1.3 28.6 5.1 100.0 129 5 meses 41.3 7.4 3.7 47.6 0.0 100.0 126
Todas as idades: 0-5 meses 66.1 5.5 1.3 25.9 1.2 100.0 749 6-9 meses 11.6 2.1 4.6 79.9 1.8 100.0 464 10-11 meses 9.5 1.9 2.6 82.2 3.8 100.0 210 12-15 meses 8.8 0.3 5.8 79.1 6.0 100.0 479 16-19 meses 1.8 1.4 4.2 76.9 15.7 100.0 380 20-23 meses 4.0 0.5 1.1 52.6 41.8 100.0 379 24+meses 0.1 0.0 3.5 20.4 76.1 100.0 1,100
Todas as crianca~ 16.9 1.7 3.3 48.7 29.5 100.0 3760
lOS cereais incluem aveia e outras sementes. '2 A dieta variada inclui batatas, amendoins. sementes de sesamo, feij6es, carne, ovos, peixe, aves, ou outros alimentos solidos Oli semi-solidos.
29
;1&
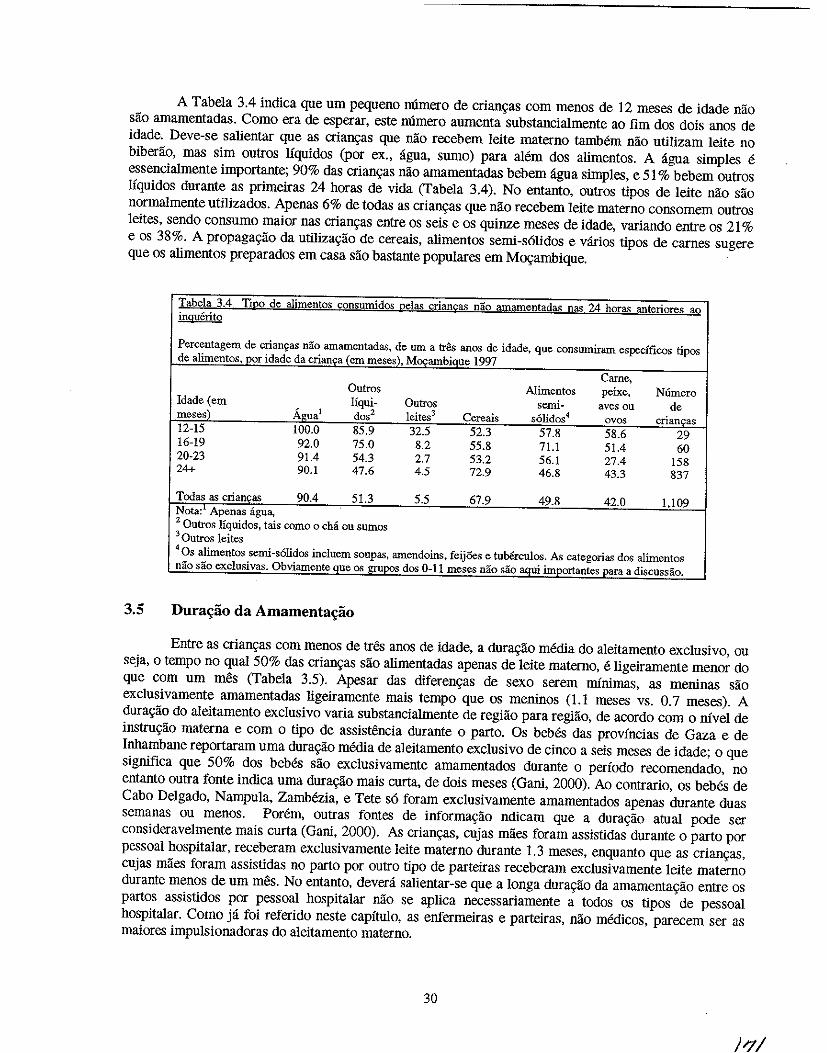
A Tabela 3.4 indica que urn pequeno numero de crian~as com menos de 12 meses de idade nao sao amamentadas. Como era de esperar, este numero aumenta substancialmente ao fim dos dois anos de idade. Deve-se salientar que as crian~s que nao recebem leite materno tamMm nao utilizam leite no biberao, mas sim outros liquidos (por ex., ligua, sumo) para alem dos alimentos. A agua simples e essencialmente importante; 90% das crian~as nao arnamentadas bebem agua simples, e 51 % bebem outros liquidos durante as primeiras 24 horas de vida (Tabela 3.4). No entanto, outros tipos de leite nao sao normalmente utilizados. Apenas 6% de todas as crian~as que nao recebem leite materna consomem outros leites, sendo consumo maior nas crian~as entre os seis e os quinze meses de idade, variando entre os 21 % e os 38%. A propaga~ao da uti1iza~ao de cereais, alimentos semi-s6lidos e v:lrios tipos de carnes sugere que os alimentos preparados em casa sao bastante populares em M~ambique.
Tabela 3.4 TiRO de a1imentos consumidos Ue1as crian£as nao amamentadas nas 24 horas anteriores ao inguerito
Percentagem de crianfas nao amamentadas, de urn a tres anos de idade. que consumiram especfficos tipos de alimentoSd)Or idade da erian,a (em meses), M~ambiSJlle 1997
Carne, Outros Alimentos peixe, N6mero
Idade (em Jiqui- Quiros semi- aves ou de meses)' Agua! dos2 leites3 Cereais solidol avos crianc;:as 12-15 100.0 85.9 32.5 52.3 57.8 58.6 29 16-19 92.0 75.0 8.2 55.8 71.1 51.4 60 20-23 91.4 54.3 2.7 53.2 56.1 27.4 158 24+ 90.1 47.6 4.5 72.9 46.8 43.3 837
Tedas as criancas 90.4 51.3 5.5 67.9 49.8 42.0 1.109 Nota: 1 Apenas agua, 2 Ontros liquid os, tais como 0 chi au sumas 30UtroS 1eites 4 Os alimentos semi-solidos incluem soupas, amendoins, feij5es e turerculos. As categorias dos alimentos nao sao exclusivas. Obviamente que os grupos dos 0-11 meses nao sao aqui importantes para a discussao.
3.5 Dura"ao da Amamenta~ao
Entre as crian~as com menos de tres anos de idade, a dura~ao media do aleitamento exclusivo, ou seja, 0 tempo no qual 50% das crian~as sao alimentadas apenas de leite materno, e ligeiramente menor do que com urn mes (Tabela 3.5). Apesar das diferen~as de sexo serem minimas, as meuinas sao exclusivamente amamentadas ligeiramente mais tempo que os meuinos (1.1 meses vs. 0.7 meses). A dura~ao do aleitamento exclusivo varia substancialmente de regiao para regiao, de acordo com 0 nivel de instru~ao materna e com 0 tipo de assistifulcia durante 0 parto. Os bebes das provincias de Gaza e de Inhambane reportaram uma dura~ao media de aleitamento exclusivo de cinco a seis meses de idade; 0 que siguifica que 50% dos bebes sao exclusivamente amamentados durante 0 periodo recomendado, no entanto outra fonte indica uma dura~ao mais curta, de dois meses (Gaui, 2000). Ao contrario, os bebes de Cabo Delgado, Nampula, Zambezia, e Tete s6 foram exclusivamente amamentados apenas durante duas semanas ou menos. Porem, outras fontes de informa~ao ndicam que a dura9ao atual pOOe ser consideravelmente mais curta (Gani, 2000). As crian~as, cujas maes foram assistidas durante 0 parto por pessoal hospitalar, receberam exclusivamente leite materna durante 1.3 meses, enquanto que as crian~as, cujas maes foram assistidas no parto por outro tipo de parteiras receberam exclusivamente leite materno durante menos de urn meso No entanto, devera salientar-se que a longa dura~ao da amamenta~ao entre os partos assistidos por pessoal hospitalar nao se aplica necessariamente a tOOos os tipos de pessoal hospitalar. Como ja foi referido neste capitulo, as enfermeiras e parteiras, nao medicos, parecem ser as maiores impulsionadoras do aleitamento materno.
30
)1//
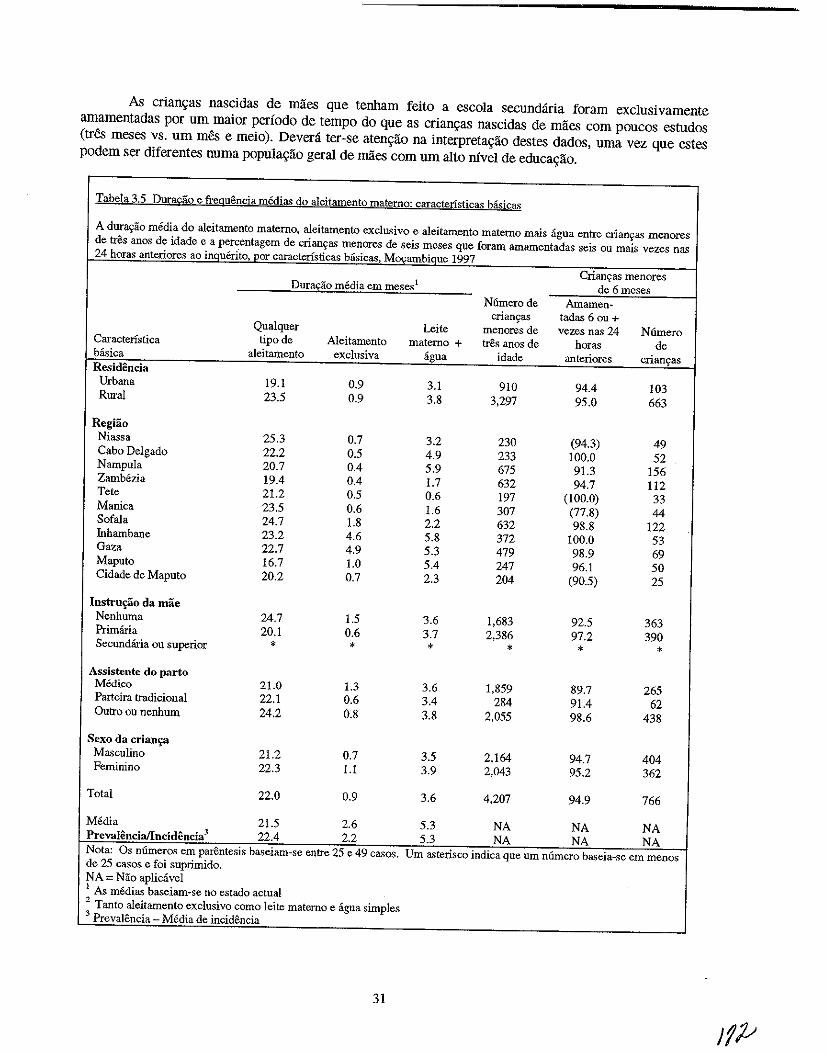
As crian9as nascidas de maes que tenham feito a escola secundiiria foram exclusivamente amamentadas por um maior perfodo de tempo do que as crian9as nascidas de mlles com poucos estudos (tres meses vs. urn mes e meio). Devera ter-se aten9ao na interpreta9ao destes dados, uma vez que estes podem ser diferentes numa popula9ao geral de maes com urn alto ruvel de educa9ao.
Tabela 3.5 Dura£ao e fteguencia mediae; do aleitamento materno: caracteristicas ba.sicas
A durar;iio media do aleitamento materno, aleitamento exclusivo e aleitamento materno mais agua entre crian~a') menores de tres anos de idade e a percentagem de crianr;8S menores de seis meses que foram amamentadas seis Oll mais vezes nas 24 horas anteriores ao il!9uerltoLl?or caracteristicas basicas, Mps;amb:ique 1997
Crianyas meDores Dura£1'io media em meses 1 de 6meses
N6merode Amamen-crianyas tadas 6 ou +
Qualquer Leite menores de vezes nas 24 Niimero Caracteristica tipo de Aleitamento materno + tres anos de horas de basica aleitamento exclusiva agua idade anteriores crianyas
Residencia Urbana 19.1 0.9 3.1 910 94.4 103 Rural 23.5 0.9 3.8 3,297 95.0 663
Regiao Niassa 25.3 0.7 3.2 230 (94.3) 49 Cabo Delgado 22.2 0.5 4.9 233 100.0 52 Nampula 20.7 0.4 5.9 675 91.3 156 Zambezia 19.4 0.4 1.7 632 94.7 112 Tete 21.2 0.5 0.6 197 (100.0) 33 Manica 23.5 0.6 1.6 307 (77.8) 44 Sofala 24.7 1.8 2.2 632 98.8 122 Inhambane 23.2 4.6 5.8 372 100.0 53 Gaza 22.7 4.9 5.3 479 98.9 69 Maputo 16.7 1.0 5.4 247 96.1 50 Cidade de Maputo 20.2 0.7 2.3 204 (90.5) 25
Instru£30 da mae Nenhuma 24.7 1.5 3.6 1,683 92.5 363 Primana 20.1 0.6 3.7 2,386 97.2 390 Secundaria ou superior • • • * * *
Assistente do parto Medico 21.0 1.3 3.6 1,859 89.7 265 Parteira tradicional 22.1 0.6 3.4 284 91.4 62 Outro ou nenhum 24.2 0.8 3.8 2,055 98.6 438
Sexo da crian~a Ma,>culino 21.2 0.7 3.5 2.164 94.7 404 Feminino 22.3 1.1 3.9 2.043 95.2 362
Total 22.0 0.9 3.6 4,207 94.9 766
Media 21.5 2.6 5.3 NA NA NA Prcvalencia/lncidencia 3 22.4 2.2 5.3 NA NA NA Nota: Os numeros em parentesis baseiam-se entre 25 e 49 casos. Urn asterisco indica que urn numero baseia-se em menos de 25 cases e foi suprimido. NA = Nao apliciivel 1 As medias baseiam-se no estado actual 2 Tanto aleitamento exclusivo como leite materno e agua simples 3 Prevalencia _ Media de incidencia
31
Apesar das pniticas de aleitamento materno durante os primeiros seis meses de idade estarem abaixo do desejado, em Mo<;ambique por urn longo periodo os bebes recebem leite materno mais ligna comparativamente ao aleitamento eXclusivo. A dur~ao media em que os bebes recebem leite materno mais ligna e de quase quatro meses (Tabela 3.5). Mais urna vez, comparando os sexos, as meninas sao amamentadas desta maneira (leite materno e ligna) por urn periodo ligeiramente maior do que os meninos, embora esta diferenca nao seja significante. Se 0 acesso 11 ligna limpa e potlivel fosse assegnrado a tooos os m~ambicanos, este tipo de practica (leite materno e ligna) nao seria tao prejudicial para os bebes. No entanto, devido a reduzida distribni~ao e qualidade da ligna neste pais, a utiliza~ao de agna, para alem do leite materno, causa serias preocup~6es sobre 0 aurnento do risco de doen~as como a diarreia.
Diferen~as na dura~ao deste tipo de practica (leite materno e agua) roo foram observadas de acordo com 0 sexo da crian~a, residencia urbana e rural, instru~ao da mae, ou tipo de assistencia durante 0
parto (Tabela 3.5). No entanto, existem diferen~as reglonais significativas. Os bebes nas provincias costeiras de Inhambane e Nampula receberam apenas leite materno e agna durante quase seis meses, enquanto que os bebes em Tete receberam leite materno e agna apenas durante quase urn meso
Independentemente da quantidade de leite materno com que as crian~as se alimentam, a maioria das crian~as m~ambicanas sao bern amamentadas ate ao segnndo ano de vida (Tabela 3.5). A dura~ao geral do aleitamento materno era de 22 meses, 0 que esta de acordo com os padr6es de uma boa amamenta~ao. A provincia de Maputo apresenta a dur~ao media mais baixa de aleitamento materno, 17 meses; 0 que e quase urn ano menos comparativamente a Niassa, 25 meses, que apresenta a dura~ao media mais alta. Os bebes das areas rurais tendem a ser amamentados mais tempo do que os bebes das areas urbanas (24 meses vs. 19 meses). De forma identica, os bebes de mulheres pouco instruidas sao amamentados mais tempo do que os bebes cujas rnaes tern algnma instru~ao (25 meses vs. 20 meses). Esta observa~ao podera reflectir 0 facto das maes instruidas estarem ocupadas com outras tarefas que as obrigam a separarem-se dos seus filhos mais cedo e por longos periodos de tempo. Em M~ambique, a licen~a de parto e de dois meses, e quando as rnaes voltam para 0 trabalho, elas tern uma hora diaria para amamentar.
Apesar da dura~ao do aleitamento materno variar substancialmente devido a varios factores, a frequencia varia muito pouco. De maneira geral, 95% dos bebes com menos de seis meses de idade receberam leite materno pelo menos seis vezes durante as 24 horas anteriores ao inquerito. Em Manica a percentagem desce para 78% mas a frequencia manten-se em seis ou mais vezes. 0 seu nivel e baixo relativamente aos outros registados noutras provincias, onde pelo menos 91 % dos bebes foram amamentados seis ou mais vezes durante as 24 horas antes.
3.6 Razoes para 0 Desmame
Foram obtidas informa~6es sobre as raz6es para 0 desmame, atraves das miles de todas as crian~as com menos de tres anos de idade. 0 inquerito identificou quatro categorias principais de raz6es para 0 desmame: (1) factores maternos (por ex., doen~a maternal, problemas no mamilo/seio, falta de leite, trabalho da mae); (2) factores da crian~a (doen~a/fraqueza, rejei~ao do leite materno por parte da crian~a, morte da crian9a); (3) idade de desmame; e (4) gravidez (Tabela 3.6). A razilo mais comum para o desmame foi que a crian~a encontrava-se na idade do desmame (50%). Como previsto, a quantidade de crian~as desmamadas por esta razao aurnenta com 0 aumento da idade destas. No entanto, deve-se ter em conta que, devido 11. introdu9ao prematura de alimentos suplementares, a dura9aO do aleitamento materno podera ser afectada. Urn quarto de todas as crian9as foi desmamado devido a doen9a ou morte, indicando a necessidade de educar as maes na necessidade de continuar a amamentar durante os periodos de doen~a. A gravidez foi a segunda razao mais importante para 0 desmame (17%), segnida dos factores maternos (7%) e outros factores (menos de 1 %).
32
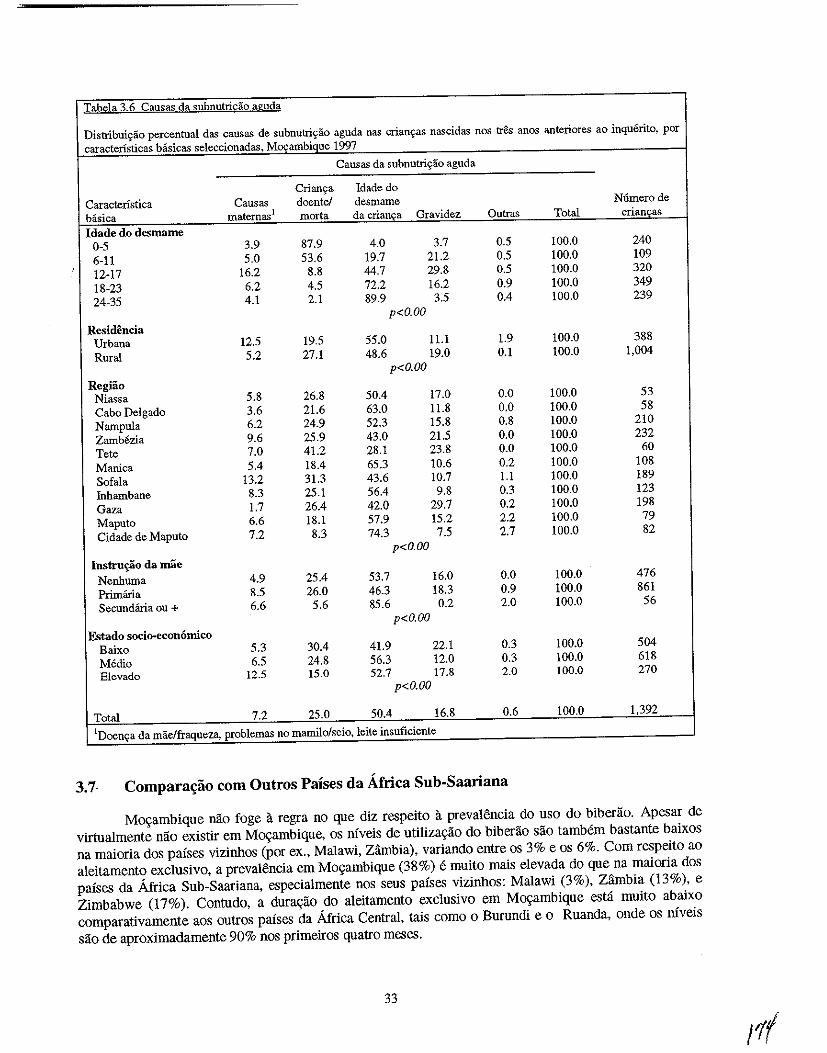
Tabela 3.6 Causas da subnutricao aguda
Distribui~ao percentual das causas de subnutriyao aguda nas crianyas nascidas nos tres anos anteriores ao inquerito, por caractensticas basicas seleccionadas, M()\:ambique 1997
Causas da subnutriyao aguda
Crianc;a Idade do Caractenstica Causas doentel desmame N6merode biisica maternas1 morta da crianca Gravidez Outras Total criancas Idade do desmame
0-5 3.9 87.9 4.0 3.7 0.5 100.0 240 6-11 5.0 53.6 19.7 21.2 0.5 100.0 109 12-17 16.2 8.8 44.7 29.8 0.5 100.0 320 18-23 6.2 4.5 72.2 16.2 0.9 100.0 349 24-35 4.1 2.1 89.9 3.5 0.4 100.0 239
p<O.OO Residencia
Urbana 12.5 19.5 55.0 11.1 1.9 100.0 388 Rural 5.2 27.1 48.6 19.0 0.1 100.0 1,004
p<O.OO Regiao
Niassa 5.8 26.8 50.4 17.0 0.0 100.0 53 Cabo Delgado 3.6 21.6 63.0 11.8 0.0 100.0 58 Nampula 6.2 24.9 52.3 15.8 0.8 100.0 210 Zambezia 9.6 25.9 43.0 21.5 0.0 100.0 232 Tete 7.0 41.2 28.1 23.8 0.0 100.0 60 Manica 5.4 18.4 65.3 10.6 0.2 100.0 108 Sofala 13.2 31.3 43.6 10.7 1.1 100.0 189 Inhambane 8.3 25.1 56.4 9.8 0.3 100.0 123 Gaza 1.7 26.4 42.0 29.7 0.2 100.0 198 Maputo 6.6 18.1 57.9 15.2 2.2 100.0 79 Cidade de Maputo 7.2 8.3 74.3 7.5 2.7 100.0 82
p<O.OO Instru~o da mae
Nenhuma 4.9 25.4 53.7 16.0 0.0 100.0 476 Primana 8.5 26.0 46.3 18.3 0.9 100.0 861 Secundiiria ou + 6.6 5.6 85.6 0.2 2.0 100.0 56
p<O.OO Fstado socio-economico
Baixo 5.3 30.4 41.9 22.1 0.3 100.0 504 Medio 6.5 24.8 56.3 12.0 0.3 100.0 618 E1evado 12.5 15.0 52.7 17.8 2.0 100.0 270
p<O.OO
Total 7.2 25.0 50.4 16.8 0.6 100.0 1,392
IDoem;a da mae/fraqueza, problemas no mamilo/seio, leite insuficiente
3.7· Comparat;;1io com Outros Paises da Africa Sub-Saari ana
Movambique nao foge a regra no que diz respeito a prevalencia do uso do biberao. Apesar de virtualmente nao existir em Movambique, os niveis de utiliza9ao do biberao sao tambem bastante baixos na maioria dos paises vizinhos (por ex., Malawi, Zambia), variando entre os 3% e os 6%. Com respeito ao aleitamento exclusivo, a prevalencia em M09ambique (38%) e muito mais elevada do que na maioria dos paises da Africa Sub-Saariana, especialmente nos seus paises vizinhos: Malawi (3%), Zambia (13%), e Zimbabwe (17%). Contudo, a dura9ao do aleitamento exclusivo em Movambique esta muito abaixo comparativamente aos outros paises da Africa Central, tais como 0 Burundi e 0 Ruanda, onde os niveis sao de aproximadamente 90% nos primeiros quatro meses.
33
Em termos da alimentayao uplementar das crianyas entre os seis e os nove meses de idade, 0 mvel em Moyambique (85%) e ligeiramente mais baixo do que os niveis observados nos parses vizinhos (variando entre os 87% e os 94%). Contudo, Moyambique apresenta urn nivel medio relativamente aos outros parses africanos abrangidos pelo IDS. Apesar de existir espayo para 0 melhoramento em termos de praticas aIimentares das crianyas em Moyambique, a extensao do cumprimento dos padroes internacionais uItrapassa a muitos outros parses africanos.
3.8 Resumo
A amamentayao e largamente praticada em Moyambique; 95% de todas as crians:as sao amamentadas. Apesar desta e1evada preval~ncia, as praticas de amamentas:ao nao sao uniformes em todos os grupos de muIheres (idade e instrus:ao). As enfermeiras e as parteiras parecem ser as melhores impulsionadoras do aleitamento materna imediatamente ap6s 0 parto, como provado pelos 81 % de beMs nascidos de partos assistidos por enfermeiras/parteiras amamentados logo na primeira hora de vida. Pe10 contrario, apenas 41 % dos beMs nascidos de partos assistidos por medicos sao alimentados durante a primeira hora de vida, mostrando assim a necessidade de formar os medicos no sentido de encorajarem a inicias:ao imediata do aleitamento materno.
Mesmo quando 0 aleitamento e iniciado, aIimentos e Iiquidos complementares sao introduzidos mais cedo na dieta dos beMs de Moyambique. A idade precoce em que os cereais e outros alimentos sao introduzidos aurnenta as hip6teses das crians:as virem a softer de desnutris:ao ou outras doens:a. Assim, existe a necessidade de se chamar a atenyao para os beneficios do aleitamento exc\usivo e das praticas de desmame na idade apropriada.
Apesar de nao haver muita informayaO sobre 0 SIDA, a epedemia causo urn desafio a comunidade de nutris:ao; assim sendo, mais investigas:ao sobre 0 impacto da SIDA no aleitamento materna e nas practicas alimentares infantis e necessaria. Politicas e recomendas:oes sao necessarias, particuIarmente relacionadas com a informas:ao e aconselhamento a dar as maes.
3.9 Recomenda~oes
Com base nas conc1usoes do IDSM de 1997, as recomendas:oes para 0 melhoramento da alimentas:ao do bebe e da crians:a sao as seguintes:
Praticas de Alimenta<;iio do Bebi!: Aumentar a Consciencia das Mlles
• Promover a inicias:ao imediata da amamentas:ao e aumentar 0 aieitamento exc1usivo durante a doens:a.
• Educar as fanu1ias sobre a idade apropriada para a introdus:ao de alimentos supiementares na dieta do bebe.
• Educar as fanulias sobre os efeitos prejudiciais da introdus:ao tardia dos alimentos s6lidos na dieta do beM.
• Informar e aconseihar as maes em relas:ao ao aieitamento materno e HIV/SIDA.
Praticas Alimentares do Bebe: Aumentar a Consciencia dos Profissionais de Saude
• Estabe1ecer poIiticas hospitalares que estejam de acordo com os Programas Internacionais de Hospitais Amigos da LTians:a. Formar os profissionais de sal1de, especialmente medicos, para ins.truir e ajudar as rnaes a colocarem 0 beM correctamente no peito e iniciar a amamentayao imediatamente ap6s 0 nascimento.
34
• Treinar 0 pessoal tecnico de saude em assuntos relacionados com 0 aleitamento materna e 0
HIVISIDA.
Alvos Geogrdficos
• Investigar as razoes que esHio por detras da baixa prevalencia do aleitamento materna em Cabo
Delgado, comparativamente a outras provincias e definir correctamente as normas de alimenta<;ao dos
beMs e crian<;as,
• Criar campanbas de promo<;ao do aleitamento materna em N ampula, onde a prevalencia e a dura<;ao
do aleitamento exclusivo sao baixas,
• Implementar campanbas educacionais em Unidades Sanitarias para encorajar as mulheres urbanas
(que sao as que parecem recorrer a instala<;oes de servi<;os pre-natais e de parto) a iniciarem a
amamentar logo na primeira hora ap6s 0 parto e para depois seguirem as normas adequadas da
alimentac;:ao dos bebes.
Amamentarao e Esparamento entre N ascimentos
• Promover 0 aleitamento materno, mais concretamente, 0 Metodo de Amenorreia Lactea, como uma
forma natural de reduzir a fertilidade para espa<;ar os nascimentos, para poder fornecer ao bebe urn
born estado nutricional.
• Encorajar a utiliza<;ao de contraceptivos com a finalidade de espac;:ar os nascimentos.
Investigarao
• Desenvolver esmdos de investiga<;ao qualitativa para investigar os factores, inC\uindo os culturais,
que afectam as decisoes no que diz respeito (a) a natureza e tempo de inicia<;ao da amamentac;:ao, (b) a frequencia das mamadas e (c) a introdu<;ao precoce ou tardia de alimentos sumplementares.
35
/
CAPITULO 4
MORTALIDADE E MORBILIDADE
A desnutri~ao compromete a saude da crian~a, tornando-a mais susceptivel a doen~as e 11 morte
(pelletier et al., 1993). Em muitos paises em desenvolvimento, as doen~as infecciosas como a malaria,
infec~ao respirat6ria aguda (IRA) e diarreia - doen~as que estao relacionadas com 0 fraco estado
nutricional dos bebes e crian~as - sao as doen~as mais comuns da inf1incia e responsiiveis pelo maior
numero de mortes infantis, quer em nemores de urn ano como em menore de cinco anos (Jamison, 1993).
Este capitulo descreve a preva16ncia da morbilidade e mortalidade entre as crian~as m~ambicanas com
menos de tr& anos de idade. TamMm aborda outros aspectos relacionados com a mortalidade dos beb& e
crian~as, padroes de doen~as especificos mais comuns por idade, e as formas de procura de assist6ncia.
4.1 Mortalidade Infantil e de Menores de Cinco Anos
A taxa de mortalidade infantil (TMI), ou a probabilidade de morte durante 0 primeiro ano de vida,
e uma medida comum utilizada para avaliar 0 estado de saude dos beb&. E tamMm urn factor de
percepgao das condigoes econ6micas e do myel de desenvolvimento de urn pais. A taxa de mortalidade de
menores de cinco anos (TMM5), ou a probabiJidade de morte antes do quinto ana de vida da crianga, e outro indicador informativo sobre a sobreviv6ncia dos bebes e crian~as. Tanto a TMI como a TMM5 sao
calculadas por cada 1,000 nascimentos vivos e sao normalmente utilizadas em comparagoes
internacionais. No IDSM de 1997, a TMI e a TMMS foram calculadas para os periodos de cinco e dez
anos anteriores ao inquerito; no entanto, as taxas de dez anos sao utilizadas para avaliar as diferen~as
socio-demograficas na mortalidade, uma vez que oferecem uma forte validade estatistica 11 analise.
Devera ter-se em atengao que os resultados indicados nesta secgao representam as relagoes entre as
caracteristicas basicas seleccionadas e a mortalidade dos bebes e crian~as. Nao e possivel induir as
casualidades, dada a natureza inter -seccional do IDSM.
Com base no IDSM de 1997, a taxa de mortalidade infantil em M~ambique diminuiu
ligeiramente ao longo da ultima decada. A TMI correspondente aos ultimos cinco anos anteriores ao
inquerito e de 135 por cada 1,000 nascimentos vivos, ao passo que a TMI correspondente aos ultimos dez
anos anteriores a este inquerito e de 147 por cada 1,000 nascimentos vivos (Tabela 4.1). Existe uma
diferenca entre os sexos na mortalidade infantil em M~ambique. Os bebes do sexo masculino
apresentam uma TMI mais elevada (153 por 1,000) do que os beMs do sexo feminino (141 por 1,000). As
diferencas entre os sexos na morbilidade serao abordados nas sec~oes seguintes deste capitulo.
Os bebes mrais apresentam uma TMI mais elevada do que os bebes urbanos (160 vs. 101 por
1,000). A mortalidade infantil e de particular importancia na provincia do Norte de Nampula, onde a TMI
e de 216 por 1,000. Esta alta TMI talves seja devido ao numero redusido de U.S, as grandes distancias
que as pessoas t6m que percorrem as U.S; baixo mvel de escolaridade, principalmente no sexo faminino;
e casamentos e gravidezes prematuros. Pelo contrario, a cidade capital de Maputo, onde a acessibiJidade e
disponibilidade dos servigos de saude sao muito mais elevadas do que noutras provincias (CISI, 1995),
tern uma TMI de apenas 49 por 1,000.
Como indicado na Tabela 4.1, a taxa de mortalidade infantil diminui com 0 aumento da instrugao
materna. A TMI para bebes cujas maes frequentaram a escola secundaria (73 por 1,000) era pelo menos
metade da taxa dos bebes cujas maes frequentaram apenas a escola primaria ou nao tinbam nenbuma
instru~ao (144 e 156 por 1,000, respectivamente). E importante salientar que existem grandes diferenciais
37
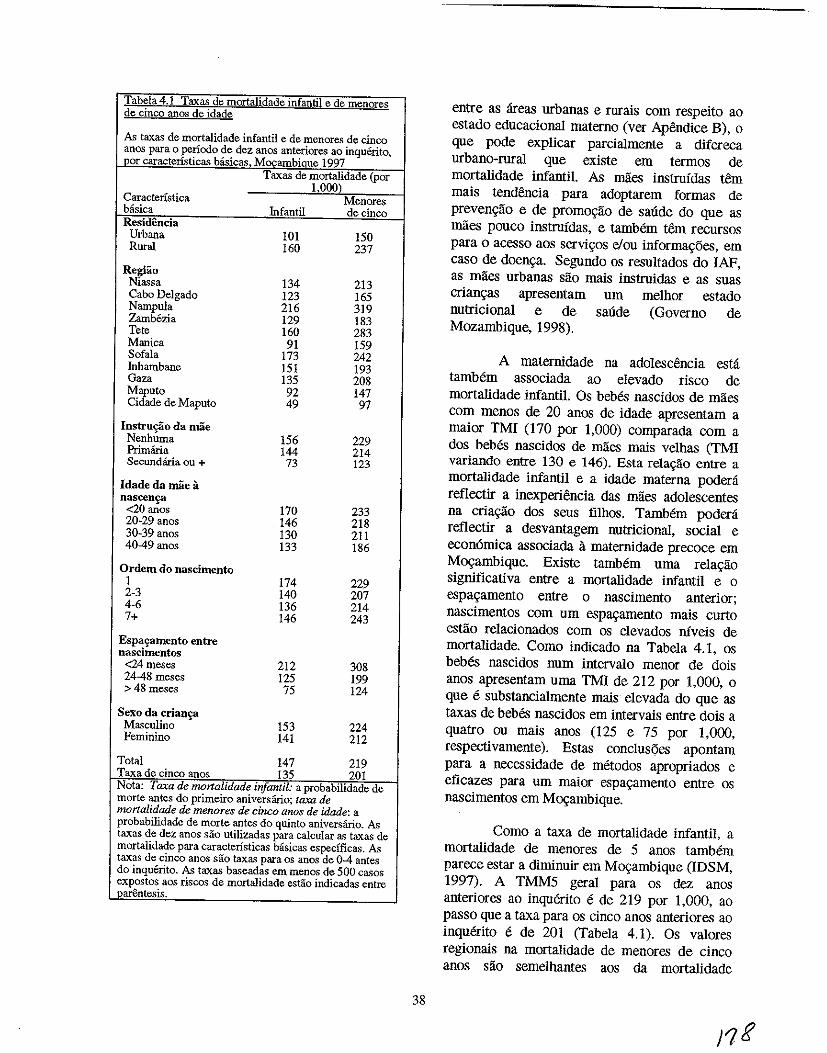
Tabela 4.1 Taxas de mortalidade infantil e de menores de cinco anos de idade
As taxas de mortalidade infantil e de menores de cinco anos para 0 periodo de dez anos anteriores ao inquerito,
-.l2pr caracteristicas bisicas Mocambiaue 1997 Taxas de mortalidade (por
1000) Caracteristica Menores basica Infantil de cinco Residencia Urbana 101 150 Rural 160 237
Regiao Niassa 134 213 Cabo Delgado 123 165 Nampula 216 319 Zambezia 129 183 Tete 160 283 Manica 91 159 Sofala 173 242 Inhambane 151 193 Gaza 135 208 Maputo 92 147 Cidade de Maputo 49 97
Instru~o da mae Nenhuma 156 229 Primana 144 214 Secundiiria ou + 73 123
Idade da mae a nascen~
<20 anos 170 233 20-29 anos 146 218 30-39 anos 130 211 40-49 anos 133 186
Ordem do nascimento 1 174 229 2-3 140 207 4-6 136 214 7+ 146 243
Espa'ramento entre nascimentos
<24meses 212 308 2448meses 125 199 >48 meses 75 124
Sexo da crian'l=3 Masculino 153 224 Feminino 141 212
Total 147 219 Taxa de cinco anos 135 201 Nota: Taxa de monalidade infantil: a probabilidade de morte antes do primeiro aniversano; taxa de mortalidade de menores de cinco anOs de idade: a probabilidade de morte antes do quinto aniversano. As taxas de dez anos sao utilizadas para calcular as taxas de mortalidade para caracteristicas basicas especfficas. As taxas de cinco anos sao taxas para os anos de 04 antes do inquerito. As taxas baseadas em menos de 500 casos expostos aos riscos de mortalidade estio indicadas entre parentesis.
38
entre as areas urbanas e rurais com respeito ao estado educacional materno (ver Apendice B), 0
que pode explicar parcialmente a difereca urbano-rural que existe em termos de mortalidade infantil. As maes instrnfdas tern mais tendencia para adoptarem formas de prevenc;ao e de promoC;ao de saUde do que as maes pouco instrnfdas, e tambem tern recursos para 0 acesso aos servic;os e/ou informac;oes, em caso de doenc;a_ Segundo os resultados do lAP, as maes urbanas sao mais instrnidas e as suas crianC;as apresentam urn melhor estado nutricional e de saude (Governo de Mozambique, 1998).
A maternidade na adolescencia esta tambem associada ao elevado risco de mortalidade infantil. Os bebes nascidos de maes com menos de 20 anos de idade apresentam a maior TMI (170 por 1,000) comparada com a dos bebes nascidos de miles mais velhas (TMI variando entre 130 e 146). Esta relac;ao entre a mortalidade infantil e a idade materna podera reflectir a inexperiencia das maes adolescentes na criac;ao dos seus filhos. Tambem podera reflectir a desvantagem nutricional, social e econ6mica associada a maternidade precoce em M09ambique. Existe tambem uma relac;ao significativa entre a mortalidade infantil e 0
espaC;amento entre 0 nascimento anterior; nascimentos com urn espaC;amento mais curto estiio relacionados com os elevados niveis de mortalidade. Como indicado na Tabela 4.1, os bebes nascidos num intervalo menor de dois anos apresentam uma TMI de 212 por 1,000, 0
que e substancialmente mais elevada do que as taxas de bebes nascidos em intervais entre dois a quatro ou mais anos (125 e 75 por 1,000, respectivamente). Estas conclusoes apontam para a necessidade de metodos apropriados e eficazes para urn maior espaC;amento entre os nascimentos em M09ambique.
Como a taxa de mortalidade infantil, a mortalidade de menores de 5 anos tambem parece estar a diminuir em M09ambique (IDSM, 1997). A TMM5 geral para os dez anos anteriores ao inquerito e de 219 por 1,000, ao passo que a taxa para os cinco anos anteriores ao inquerito e de 201 (Tabela 4.1)_ Os valores regionais na mortalidade de menores de cinco anos sao semelhantes aos da mortalidade
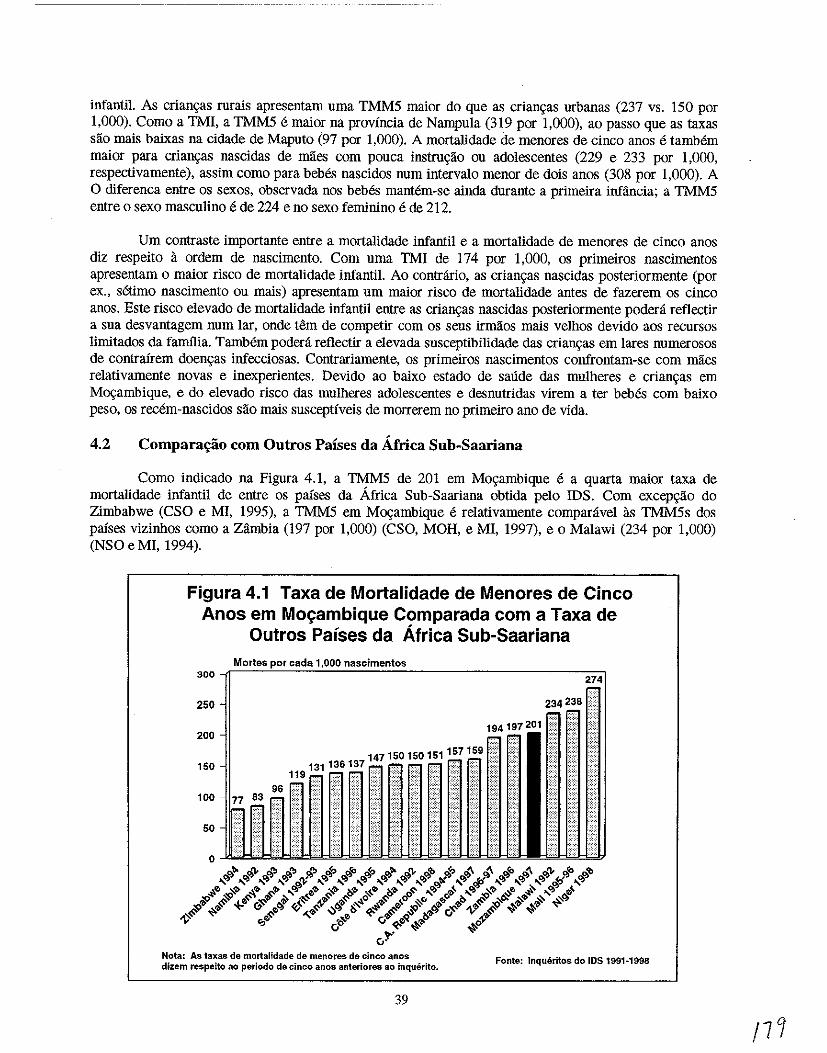
infantil. As crians;as rurais apresentam nma TMM5 maior do que as crians;as urbanas (237 vs. 150 por 1,000). Como a TMI, a TMM5 e maior na provincia de Nampula (319 por 1,000), ao passo que as taxas sao mais baixas na cidade de Maputo (97 por 1,000). A mortalidade de menores de cinco anos e tamMm maior para crians;as nascidas de maes com pouca instrus;ao ou adolescentes (229 e 233 por 1,000, respectivamente), assim como para beMs nascidos num intervalo menor de dois anos (308 por 1,000). A o diferenca entre os sexos, observada nos beMs mantem-se ainda durante a primeira infancia; a TMM5 entre 0 sexo masculino e de 224 e no sexo feminino e de 212.
Urn contraste importante entre a mortalidade infantil e a mortalidade de menores de cinco anos diz respeito a ordem de nascimento. Com uma TMI de 174 por 1,000, os primeiros nascimentos apresentam 0 maior risco de mortalidade infantil. Ao contrario, as crian,<as nascidas posteriormente (por ex., setimo nascimento ou mais) apresentam urn maior risco de mortalidade antes de fazerem os cinco anos. Este risco elevado de mortalidade infantil entre as crian,<as nascidas posteriormente podera reflectir a sua desvantagem num lar, onde tern de competir com os seus irmaos mais velhos devido aos recursos limitados da famflia. Tambem podera refiectir a elevada susceptibilidade das crian,<as em lares numerosos de contrairem doen,<as infecciosas. Contrariamente, os primeiros nascimentos confrontam-se com miles relativamente novas e inexperientes. Devido ao baixo estado de saude das mulheres e crian,<as em Mos;ambique, e do elevado risco das mulheres adolescentes e desnutridas virem a ter bebes com baixo peso, os recem-nascidos sao mais susceptfveis de morrerem no primeiro ano de vida.
4.2 Compara~ao com Outros Paises da Africa Sub-Saariana
Como indicado na Figura 4.1, a TMM5 de 201 em Mo,<ambique e a quarta maior taxa de mortalidade infantil de entre os paises da Africa Sub-Saariana obtida pelo IDS. Com excep,<ilo do Zimbabwe (CSO e MI, 1995), a TMM5 em Mos;ambique e relativamente comparavel as TMM5s dos paises vizinhos como a Zambia (197 por 1,000) (CSO, MOH, e MI, 1997), e 0 Malawi (234 por 1,000) (NSO e MI, 1994).
Figura 4.1 Taxa de Mortalidade de Menores de Cinco Anos em Mo~ambique Com parada com a Taxa de
Outros Palses da Africa Sub-Saariana
300
250
200
150
100
50
Mortes nascimentos
147150150151157159" 131136137 • .•••. ••••• ,. ... 119 . ' .. .. .
Nota: As taxas de morialidade de menores de cinco aROS
dizem respeito ao periodo de cinco anos anteriores ao inquerito.
39
Fonte: Inqueritos do IDS 1991·1998
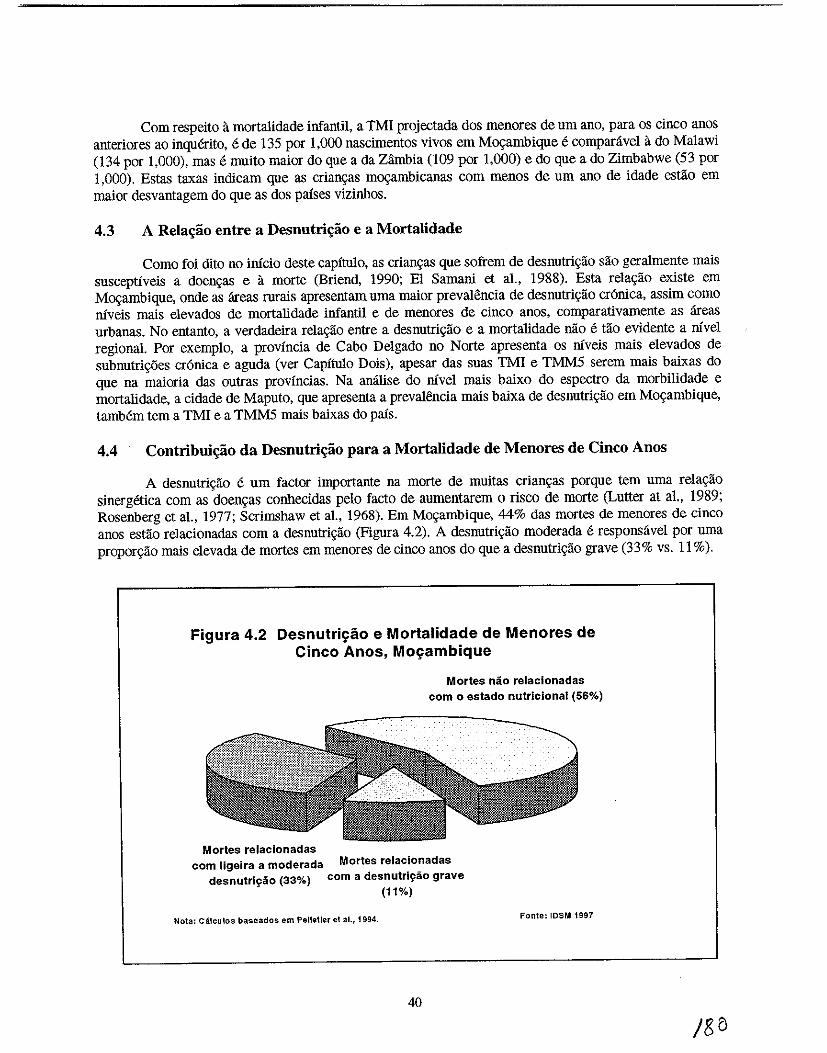
Com respeito 11 mortalidade infantil, a TMI projectada dos menores de urn ano, para os cinco anos anteriores ao inquerito, e de 135 por 1,000 nascimentos vivos em Movambique e comparavel it do Malawi (134 por 1,000), mas e muito maior do que a da Zambia (109 por 1,000) e do que a do Zimbabwe (53 por 1,000). Estas taxas indicam que as crian<;as movambicanas com menos de urn ano de idade estao em maior desvantagem do que as dos palses vizinhos.
4.3 A ReJa..ao entre a Desnutri,,1io e a Mortalidade
Como foi dito no inicio deste capitulo, as crian<;as que sofrem de desnutri"ao sao geralmente mais susceptiveis a doen"as e it morte (Briend, 1990; El Samaul et al., 1988). Esta rela<;ao existe em Movambique, onde as areas rurais apresentam uma maior prevalencia de desnutri<;ao cr6nica, assim como niveis mais elevados de mortalidade infantil e de menores de Cinco anos, comparativamente as areas urbanas. No entanto, a verdadeira rela<;ao entre a desnutri"ao e a mortalidade nao e tao evidente a nivel regional. Por exemplo, a provincia de Cabo Delgado no Norte apresenta os niveis mais elevados de subnutri<;oes cr6nica e aguda (ver Capitulo Dois), apesar das suas TMI e TMMS serem mais baixas do que na maioria das outras provincias. Na analise do nivel mais baixo do espectro da morbilidade e mortalidade, a cidade de Maputo, que apresenta a prevalencia mais baixa de desnutri<;ao em Mo<;ambique, tamMm tern a TMI e a TMMS mais baixas do pais.
4.4 Contribui,,1io da Desnutri,,1io para a MortaJidade de Menores de Cinco Anos
A desnutri<;ao e urn factor importante na morte de muitas crian<;as porque tern uma rela<;ao sinergetica com as doen<;as conhecidas pelo facto de aumentarem 0 risco de morte (Lutter at a!., 1989; Rosenberg et aI., 1977; Scrimshaw et aI., 1968). Em Movambique, 44% das mortes de menores de cinco anos estao relacionadas com a desnutri<;ao (Figura 4.2). A desnutri<;ao moderada e responsavel por uma propor<;ao mais elevada de mortes em menores de cinco anos do que a desnutri<;ao grave (33% vs. 11 %).
Figura 4.2 Desnutri~ao e MortaJidade de Menores de Cinco Anos, Mo~ambique
Mortes nio relacionadas com 0 estado nutricional (56%)
Mortes relacionadas com ligeira a moderada Mortes relacionadas
desnutri~ao (33%) com a desnutriy30 grave (11%)
Nota: Calculos base ados em Pelletier et al., 1994.
40
Fonte: IDSM 1997
Isto deve-se 11. elevada preval<~ncia da desnutrigao ligeira e moderada contra a desnutrigao grave em Movambique. Contudo, a Figura 4.2 prova 0 facto de que ate mesmo urn caso de desnutrigao ligeira pode comprometer a saude da crianga, tornando-a mais susceptivel 11. morte. Consequentemente, as intervengoes nutricionais que tern como objectiv~ a prevengao, detecgao e tratamento imediato de todos os tipos de desnutrigao, em especial os casos de desnutrigao ligeira e moderada, podem ter urn grande impacto na sobrevivencia das criangas em Movambique.
4.5 Padroes de Morbilidade Regionais e Especificos por Idade
No IDSM de 1997, as estimativas da prevalencia das tres doengas infantis comuns - diarreia, infecgao respiratoria aguda (IRA), e febre - sao baseadas nos sintomas detectados pelas maes durante 0
periodo de dUas semanas antes do inquerito. A Tabela 4.2 indica que 21 % das criangas com menos de tres anos de idade tinbam sofrido de diarreia durante esse mesmo periodo de duas semanas. Tambem, de acordo com as informagoes das maes, nesse periodo 44% das criangas tinbam tide febre, 33% tinbam tido tosse e 12% tinbam tido IRA (para 0 objectivo desta analise, definida como tosse com respiragao acelerada). Apesar destes niveis elevados de morbilidade, os resultados deverao ser interpretados com precaugao, devido as limitagoes relacionadas com 0 facto do resultados so representarem 0 que as maes se lembravam (Haggerty et a!., 1994b; Martorell et a!., 1976). Para alem dis so, as estagoes do ano podem influenciar 0 estado nutricional e desempenbam urn importante papel na frequencia e ocorrencia das doengas nas criangas (Branca et a!., 1993).
A Tabela 4.2 indica que as areas urbanas e rurais diferem significativamente em termos de morbilidade, com uma proporgao mais elevada de criangas urbanas a sofrerem de diarreia do que as criangas rurais (31 % vs. 18%), febre (49% vs. 43%), tosse (48% vs. 29%), e IRA (16% vs. 11 %). As elevadas taxas de mortalidade entre as criangas urbanas poderao ser uma consequencia das condigoes do saneamento do meio, que estao abaixo dos padroes normais, nas quais as criangas vivem nas areas urbanas que sao super-povoadas. Cada urna das morbilidade referidas nesta secgao e uma doenga infecciosa; por esta razao, as condigoes ambientais, tais como 0 excesso de populagao e 0 mau saneamento - ambas parecem existir nas areas urbanas - poderao aurnentar a sua ocorrencia. Apesar destes niveis elevados de morbilidade, os niveis baixos de mortalidade nas areas urbanas, ao contrario das areas rurais, devem-se 11. grande disponibilidade e acessibilidade dos servigos de saude nas areas urbanas (CISI, 1995). De acordo com os resultados do lAP (Ministerio do plano e Financa, Universidade Eduardo Mondlane e IFPRI, 1998) 89 % das criangas das zonas urbanas possuem cartao de saude contra os 56 % das zonas rurais.
Com respeito a determinadas provincias, as provincias do SuI, Inbambane e Gaza, apresentaram a prevaIencia de diarreia mais baixa (8%) durante as duas semanas do periodo de referencia. Devera salientar-se que tambem estas provincias apresentam os niveis mais altos de boas praticas alimentares em relagao a outras provincias (ver Capitulo Tres). Com uma taxa de 35%, a provincia da Zambezia apresenta a prevalencia de diarreia mais elevada, 0 que talves se deva ao facto do lengol friatico estar pr6ximo da superficie, 0 baixo saneamento e a utilizagao de agua de POVos, rios e lagos. Tete e Nampula apresentaram as prevalencias de febre mais elevadas (59% e 57%, respectivamente). Tete, Maputo, e Gaza apresentaram as incidencias mais elevadas de IRA (pelo menos 17%), talves porque Maputo, Gaza e parte de Tete sao as zonas mais frias; e a outra parte de Tete e seca e com muita poeira 0 que tambem contribui para as IRAs.
41
/$1
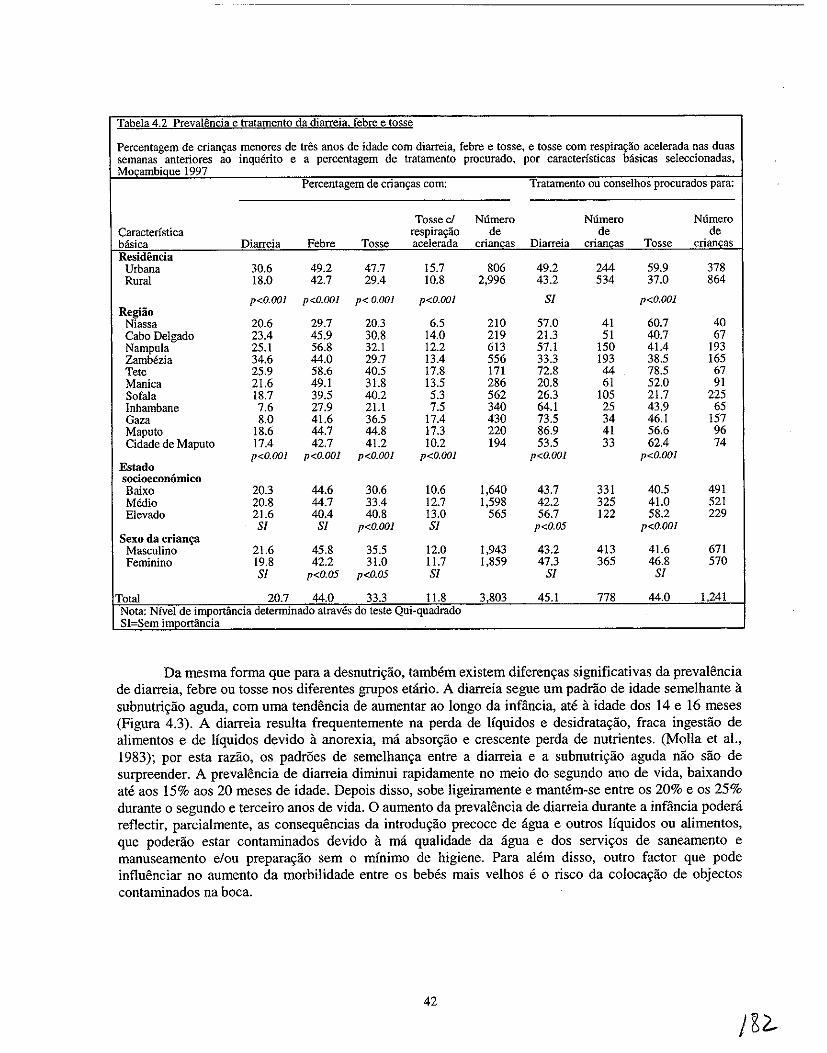
Tabela 4.2 Prevalencia e tratamento da diarreia. febre e tosse
Percentagem de crian9as menores de tres anos de idade com diarreia, febre e tosse, e tosse com respira9ao acelerada nas duas semanas anteriores ao inquerito e a percentagem de tratamento procurado, por caracteristicas basicas seleccionadas, MocambiQue 1997
Percentagem de crian9as com: Tratamento ou conselhos procurados para:
Tossed Numero Numero Numero Caracteristica respira9ao de de de basica Diarreia Febre Tosse acelerada criancas Diarreia criancas Tosse criancas Residencia
Urbana 30.6 49.2 47.7 15.7 806 49.2 244 59.9 378 Rural 18.0 42.7 29.4 10.8 2,996 43.2 534 37.0 864
p<O.OOl p<o.OO] p< 0.00] p<O.OOl Sf p<o.OO] Regiao
Niassa 20.6 29.7 20.3 6.5 210 57.0 41 60.7 40 Cabo Delgado 23.4 45.9 30.8 14.0 219 21.3 51 40.7 67 Nampu1a 25.1 56.8 32.1 12.2 613 57.1 150 41.4 193 Zambezia 34.6 44.0 29.7 13.4 556 33.3 193 38.5 165 Tete 25.9 58.6 40.5 17.8 171 72.8 44 78.5 67 Manica 21.6 49.1 31.8 13.5 286 20.8 61 52.0 91 Sofala 18.7 39.5 40.2 5.3 562 26.3 105 21.7 225 Inhambane 7.6 27.9 21.1 7.5 340 64.1 25 43.9 65 Gaza 8.0 41.6 36.5 17.4 430 73.5 34 46.1 157 Maputo 18.6 44.7 44.8 17.3 220 86.9 41 56.6 96 Cidade de Maputo 17.4 42.7 41.2 10.2 194 53.5 33 62.4 74
p<O.OOl p<O.OOl p<O.OOl p<O.OOl p<O.OOl p<O.OO] Estado socioeconomico Baixo 20.3 44.6 30.6 10.6 1,640 43.7 331 40.5 491 Medio 20.8 44.7 33.4 12.7 1,598 42.2 325 41.0 521 Elevado 21.6 40.4 40.8 13.0 565 56.7 122 58.2 229
Sf Sf p<O.OOl Sf p<O.05 p<O.OOl Sexo da criam;a
Masculino 21.6 45.8 35.5 12.0 1,943 43.2 413 41.6 671 Feminino 19.8 42.2 31.0 11.7 1,859 47.3 365 46.8 570
Sf p<O.05 p<O.05 Sf Sf Sf
Total 20.7 44.0 33.3 11.8 3,803 45.1 778 44.0 1,241 Nota: Nfvel de importancia detenninado atraves do teste Qui-quadrado SI=Sem importancia
Da rnesrna forma que para a desnutri~ao, tarnMrn existern diferen~as siguificativas da prevalencia de diarreia, febre ou tosse nos diferentes grupos etano. A diarreia segue urn padrao de idade sernelhante a subnutri~ao aguda, com urna tendencia de aurnentar ao longo da infiincia, ate a idade dos 14 e 16 rneses (Figura 4.3). A diarreia resulta frequenternente na perda de Iiquidos e desidrata~ao, fraca ingestao de alimentos e de Uquidos devido a anorexia, rna absor~ao e crescente perda de nutrientes. (Molla et aI., 1983); por esta ramo, os padroes de sernelhan~a entre a diarreia e a subnutri~ao aguda nao sao de surpreender. A pre valencia de diarreia diminui rapidarnente no rneio do segundo ano de vida, baixando ate aos 15% aos 20 rneses de idade. Depois disso, sobe ligeirarnente e rnantern-se entre os 20% e os 25% durante 0 segundo e terceiro anos de vida. 0 aurnento da pre valencia de diarreia durante a infiincia podera reflectir, parcialmente, as consequencias da introdu~iio precoce de agua e outros liquidos ou aIirnentos, que poderiio estar contaminados devido a rna qualidade da agua e dos servi~os de sanearnento e manusearnento e/ou prepara~iio sern 0 minirno de higiene. Para alern dis so, outro factor que pode influenciar no aurnento da rnorbilidade entre os beMs mais velhos e 0 risco da coloca~iio de objectos contaminados na boca.
42
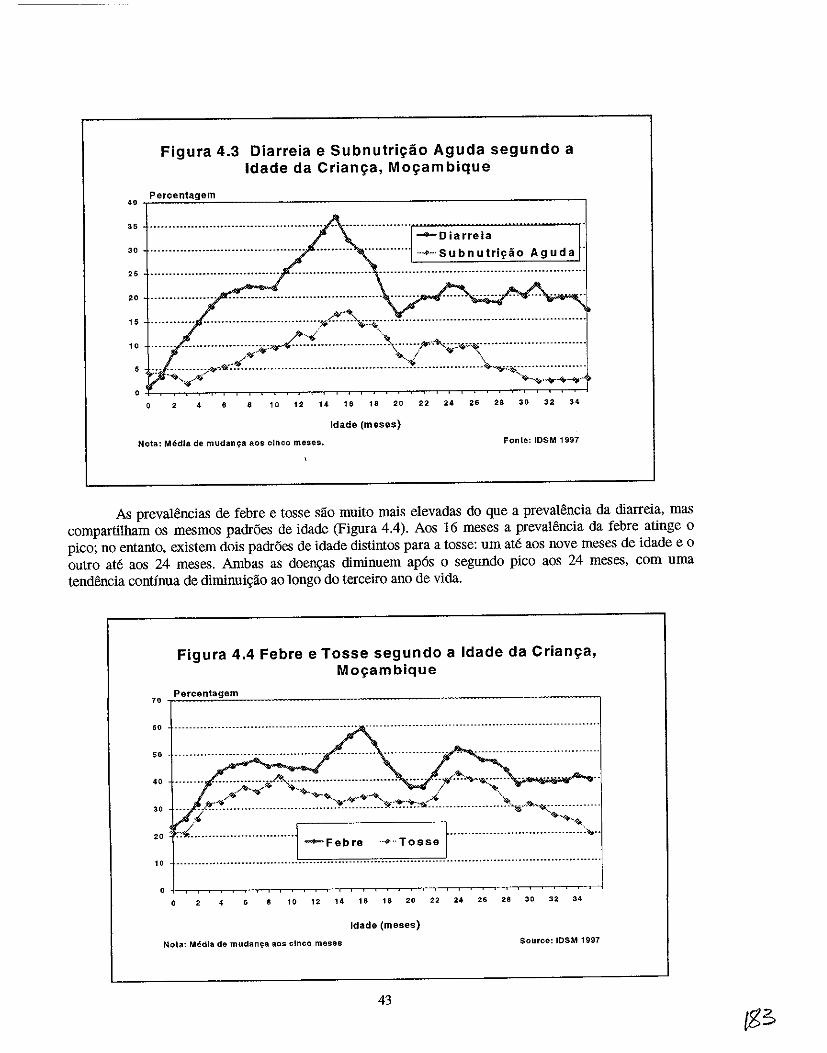
Figura 4.3 Diarreia e Subnutri~ao Aguda segundo a Idade da Crian~a, Mo~ambique
40 Percentagem
35 .•.................•...........................
........Diarreia 30 ................................................................ ···.···Subnutril'iio Aguda
25
"
:: :::::::.:::: .. :::::::::::::::::::;:;~~~:~::~:\::::::;.~::::::::::::::::::::::.:::::::::: .~.... ~I <QF \ .. ~ . .,.. \
5 -:- :.~ ••..• ~;-..o,""'8t' ••••••••••.•.•.••••••••••••••••••••••••••••.•••••.••• - ••••••••••••••. ~~ ... ~~:.- .••••••••••••••
... ~... '¥o-~ ...... ~-.
246 8 10 12 14 16 18 20 22 24 26 28 30 32 34
Idade (meses)
Nota: Media de mudang8 80S cinco meses. Fonte: IDSM 1997
As preval~ncias de febre e tosse sao muito mais elevadas do que a preval~ncia da diarreia, mas compartilham os mesmos padroes de idade (Figura 4.4). Aos 16 meses a prevalencia da febre atinge 0
pico; no entanto, existem dois padroes de idade distintos para a tosse: urn ate aos nove meses de idade e 0
outro ate aos 24 meses. Ambas as doen\ias diminuem ap6s 0 segundo pico aos 24 meses, com uma tendencia continua de diminui\iao ao longo do terceiro ana de vida.
Figura 4.4 Febre e Tosse segundo a Ida de da Crian~a, M09am bique
70 Percentagem
60 ------- ........ --- .•...... --.--- .......... --....... .. __ ........• -_ ........... -_. -_ ..•..... __ ..•.•..•.•. __ .. _-_ ...•..
50
40
30 ········: .. v,.·,""··············
~ To sse t·· ....................... ~--~.~<: .... . "'=======0-'.
" 10
o 2 4 6 10 12 14 16 18 20 22 24 26 28 30 32 34
Idade (meses)
Nota: Media de mUdan.;:a aos cinco meses Source: IOSM 1997
43
4.6 Padroes de Procura de Assistencia e Tratamento para as Doen~as Infantis Comuns
De maneira geral, as mlies procuraram aconselhamento e tratamento para menos de metade das doenc;:as referidas durante as duas semanas do perfodo de referencia (Tabela 4.2). Tanto as miles urbanas como as rurais procuraram aconselhamento ou tratamento para a diarreia dos seus filhos. As maes urbanas apresentaram uma propon;lio significativamente rnais elevada de procura de assistencia para a tosse (60% vs. 37%). Esta observa~ao padeni reflectir 0 maior acesso e disponibilidade dos servi~os de saUde nas areas urbanas em rela~lio as areas rurais (CISI, 1995), onde as infraestruturas de saUde foram gravemente danificadas como resultado da guerra Nas zonas rurais M menos facilidade em termos de U.S, M menos pessoal teenico e menos qualificados, e as distancias para chegar as U.S sao muito grandes (podendo chegar a 40 KIn). A provincia de Maputo apresentou a propor~ao mais elevada de procura de assistencia para a diarreia (87%); no entanto, a provincia de Tete, onde a febre e a IRA sao mais ftequentes, apresentou a propor~lio mais elevada de procura de assistencia para a tosse infantil durante as duas semanas do periodo de referencia. Cabo Delgado, que tern a prevalencia de desnutri~ao mais elevada de M~ambique, apresentou a percentagem mais baixa de crian9as que receberam assisteucia para 0 tratamento da diarreia. Dada a rela~lio conhecida entre a diarreia e a desnutri~lio, estas conclusoes poderao reflectir 0 facto de que 0 problema da desnutri9lio infantil em Cabo Delgado podera ser parcialmente atribufdo ao tratamento inadequado da diarreia e vice-versa.
Como esperado, as mulheres com condi90es socio-econ6micas elevadas tendem mais a procurar assistencia ou aconselhamento para as doen9as dos seus filhos do que as mulheres com condi90es socioecon6micas baixas ou medias (Tabela 4.2). Devido aos danos causados nas infi'aestruturas de saUde publicas, nao e de estralhar as mulheres financeiramente mais estaveis procurem mais assistencia do que as mulheres pobres, ou que vivam em areas onde exista uma maior disponibilidade de servi~os de sande. Nao existe qualquer diferencia9aO entre os sexos no que diz respeito a forma de procura de assistencia para as doen9as.
De entre as mlies que procuraram tratamento ou aconselhamento, mais de dois ter90s recorreram mais as Unidades Sanitarias publicas do que aos servi90s privados ou tradicional (Tabela 4.3), talves porque os cuidados de saude primaria slio subsidiados pelo governo, e pelo facto de existerim ainda poucas clfnicas privadas. Existem varia90es significativas no que diz respeito a resi<Wncia urbana/rural e ao estado socio-econ6mico. Uma elevada percentagem de crian9as de condi~oes socio-econ6micas baixas recebem mais tratamento de fontes privadas (tradicionais) ou outras do que as crian~as ricas. Do mesmo modo, uma elevada percentagem de mlies rurais, que slio de longe mais pobres do que as mlies urbanas, procuram mais aconselhamento ou tratamento nos servi~os de fontes privadas (tradicionais) ou outros para as doen~as dos seus filhos do que as mlies urbanas. Devera salientar-se que estas conclusoes provavelmente refiectem a dependencia das maes pobres em rela~lio aos servi~os tradicionais ou a actividades nao registadas, mais do que em rela~ao aos servi90s privados dentro das actividades de saUde registadas. Apesar de nao existirem diferen9as significativas entre os sexos em termos de fontes para 0 tratamento da diarreia, uma propor~lio significativamente mais elevada de crian9as do sexo feminino receberam tratamento para a tosse em unidades sanitarias publicas (74% vs. 65%). Contrariamente, mais crian~as do sexo masculino receberam tratamento tradicional para a tosse (36% vs. 26%).
44
/21
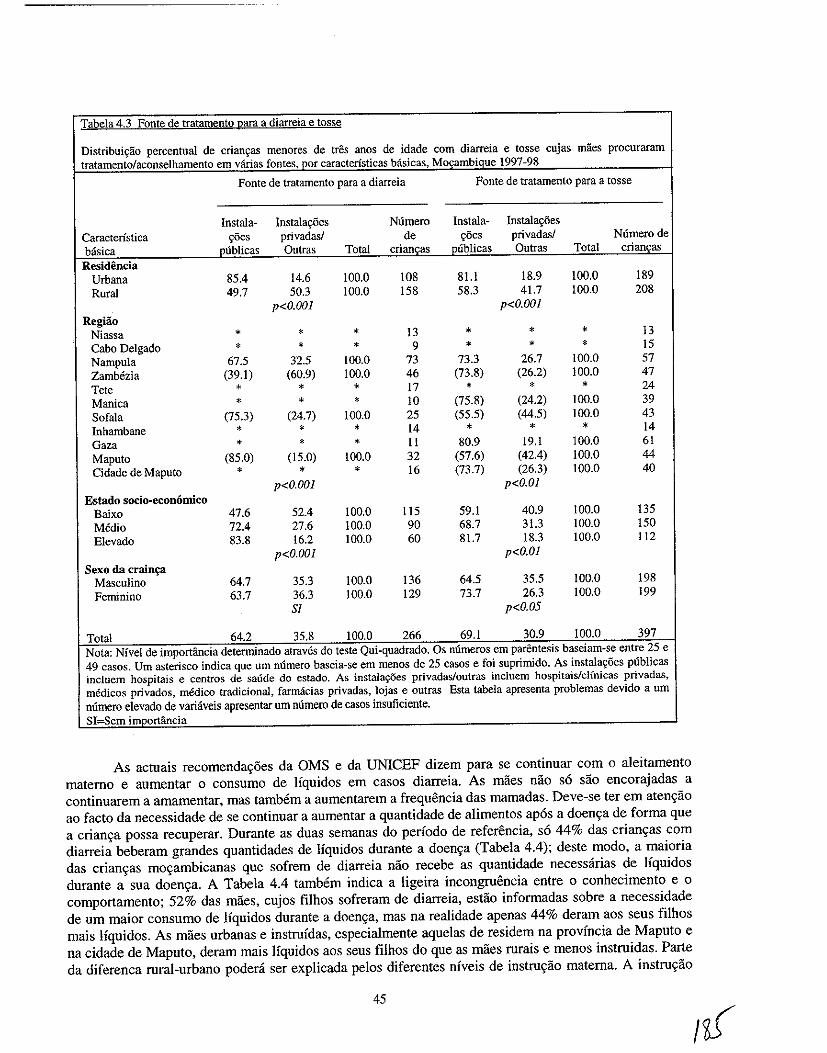
Tabela 4.3 Fonte de tratamento para a diarreia e tosse
Distribuic;ao percentual de crianc;as menores de tres anos de idade com diarreia e tosse cujas maes procuraram tratamento/aconselhamento em varias fontes, por caracteristicas basicas, Mocambique 1997-98
Fonte de tratamento para a diarreia Fonte de tratamento para a tosse
Instala- Instalac;6es Numero Instala- Instalac;6es Caracteristica ~5es privadasl de c;5es privadas/ Numerode basica publicas Outras Total criancas publicas Outras Total criancas Residencia
Urbana 85.4 14.6 100.0 108 81.1 18.9 100.0 189 Rural 49.7 50.3 100.0 158 58.3 41.7 \00.0 208
p<O.OOI p<O.OOI Regiio
Niassa • * * 13 * * • 13 Cabo Delgado * * * 9 * * * 15 Nampula 67.5 32.5 100.0 73 73.3 26.7 \00.0 57 Zamhezia (39.1) (60.9) 100.0 46 (73.8) (26.2) 100.0 47 Tete * * * 17 • * * 24 Manica * * • 10 (75.8) (24.2) 100.0 39 Sofala (75.3) (24.7) 100.0 25 (55.5) (44.5) 100.0 43 Inhambane * • * 14 * * * 14 Gaza * * • 11 80.9 19.1 100.0 61 Maputo (85.0) (15.0) 100.0 32 (57.6) (42.4) 100.0 44 Cidade de Maputo * • • 16 (73.7) (26.3) 100.0 40
p<O.OOI p<O.OI Estado socio-economico
Baixo 47.6 52.4 \00.0 115 59.1 40.9 100.0 135 Media 72.4 27.6 100.0 90 68.7 31.3 100.0 ISO Elevado 83.8 16.2 100.0 60 81.7 18.3 100.0 112
p<O.OOI p<O.OI Sexo da crain";3
Masculino 64.7 35.3 100.0 136 64.5 35.5 100.0 198 Feminino 63.7 36.3 100.0 129 73.7 26.3 100.0 199
Sf p<O.05
Total 64.2 35.8 100.0 266 69.1 30.9 100.0 397 Nota: Nivel de importancia determinado atraves do teste Qui-quadrado. Os mlmeros em parentesis baseiam-se entre 25 e 49 casos. Urn asterisco indica que urn numero baseia-se em menos de 25 casos e foi suprimido. As instalac;oes publicas incluem hospitais e centros de salide do estado. As instala90es privadas/outcas incluem hospitais/clfnicas privadas, medicos privados, m6dico tradicional, farmacias privadas, lojas e outcas Esta tabela apresenta problemas devido a urn nurnero elevado de variaveis apresentar urn numero de casos insuficiente. SI:=Sem importfincia
As actuais recomendayoes da OMS e da UNICEF dizem para se continuar com 0 aleitamento materno e aumentar 0 consumo de Ifquidos em casos diarreia. As maes nao so sao encorajadas a continuarem a amamentar, mas tambem a aumentarem a frequencia das mamadas. Deve-se ter em atenyao ao facto da necessidade de se continuar a aumentar a quanti dade de alimentos apos a doenya de forma que a crianya possa recuperar. Durante as duas semanas do periodo de referencia, so 44% das crianyas com diarreia beberam grandes quantidades de Ifquidos durante a doenya (Tabela 4.4); deste modo, a maioria das crianyas moyambicanas que sofrem de diarreia nao recebe as quanti dade necessarias de Ifquidos durante a sua doenya. A Tabela 4.4 tambem indica a ligeira incongrnencia entre 0 conhecimento e 0
comportamento; 52% das maes, cujos filhos sofreram de diarreia, estao informadas sobre a necessidade de um maior consumo de Iiquidos durante a doenya, mas na realidade apenas 44% deram aos seus filhos mais Ifquidos. As miles urbanas e instrufdas, especialmente aquelas de residem na provincia de Maputo e na cidade de Maputo, deram mais Ifquidos aos seus filhos do que as maes rurais e menos instruidas. Parte da diferenca rural-urbano podera ser explicada pelos diferentes niveis de instruyao materna. A instruyao
45
I~
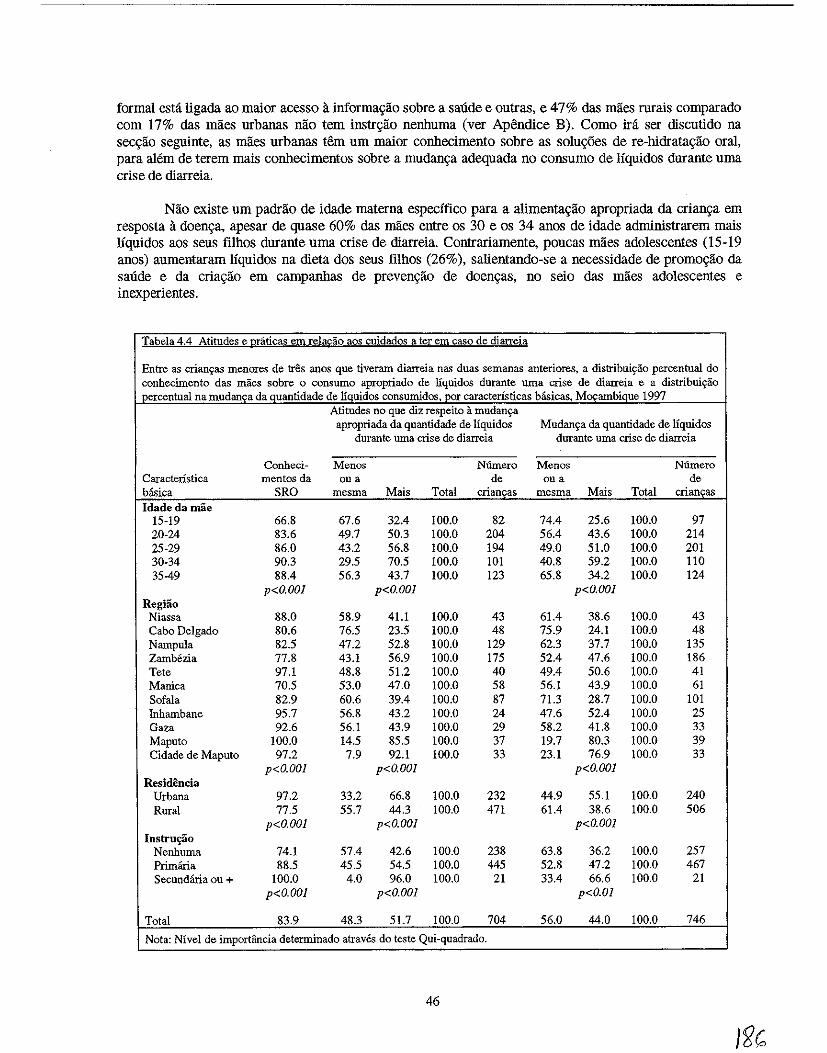
formal esta ligada ao maior acesso a informa\iao sobre a saude e outras, e 47% das maes rurais comparado com 17% das maes urbanas nao tern instr\iao nenhuma (ver Apendice B). Como ira ser discutido na seCl(ao seguinte, as maes urbanas tern urn maior conhecimento sobre as solu0es de re-hidrata\iao oral, para alem de terem mais conhecimentos sobre a mudan\ia adequada no consumo de liquidos durante uma crise de diarreia.
Nao existe urn padrao de idade materna especifico para a alimenta\iao apropriada da crian\ia em resposta a doen\ia, apesar de quase 60% das maes entre os 30 e os 34 anos de idade admiuistrarem mais liquidos aos seus filhos durante urna crise de diarreia. Contrariamente, poucas maes adolescentes (15-19 anos) aumentaram liquidos na dieta dos seus filhos (26%), salientando-se a necessidade de promo\iao da saude e da cria\iao em campanhas de preven\iao de doen\ias, no seio das maes adolescentes e inexperientes.
Tabela 4.4 Atitudes e uraticas em rela£ao aos cuidados a ter em caso de diarreia
Entre as crian9as menores de tres anos que tiveram diarreia nas duas semanas anteriores, a distribuiyao percentual do conhecimento das rnaes sobre 0 consumo apropriado de liquidos durante uma crise de diarreia e a distribuiyao percentual namudanc;a da quantidade de Ifquidos consumidos, por caracterfsticas hasicas, M09ambique 1997
Atitudes no que diz respeito a mudanya apropriada da quantidade de liquidos Mudanya da quantidade de liquidos
durante uma crise de diarreia durante uma crise de diarreia
Conheci- Menos Numero Menos Numero Caracteristica mentos da Oll a de Oll a de basica SRO mesma Mais Total criancas mesma Mais Total criancas Idade da mae
15-19 66.8 67.6 32.4 100.0 82 74.4 25.6 100.0 97 20-24 83.6 49.7 50.3 100.0 204 56.4 43.6 100.0 214 25-29 86.0 43.2 56.8 100.0 194 49.0 51.0 100.0 201 30-34 90.3 29.5 70.5 100.0 101 40.8 59.2 100.0 llO 35-49 88.4 56.3 43.7 100.0 123 65.8 34.2 100.0 124
p<O.OOI p<O.OOI p<O.OOI Regiao
Niassa 88.0 58.9 41.1 100.0 43 61.4 38.6 100.0 43 Cabo Delgado 80.6 76.5 23.5 100.0 48 75.9 24.1 100.0 48 NampuJa 82.5 47.2 52.8 100.0 129 62.3 37.7 100.0 135 Zamb6zia 77.8 43.1 56.9 100.0 175 52.4 47.6 100.0 186 Tete 97.1 48.8 51.2 100.0 40 49.4 50.6 100.0 41 Manica 70.5 53.0 47.0 100.0 58 56.1 43.9 100.0 61 Sofala 82.9 60.6 39.4 100.0 87 71.3 28.7 100.0 101 Inhambane 95.7 56.8 43.2 100.0 24 47.6 52.4 100.0 25 Oaza 92.6 56.1 43.9 100.0 29 58.2 41.8 100.0 33 Maputo 100.0 14.5 85.5 100.0 37 19.7 80.3 100.0 39 Cidade de Maputo 97.2 7.9 92.1 100.0 33 23.1 76.9 100.0 33
p<O.OOI p<O.OOI p<O.OOI Residencia
Urbana 97.2 33.2 66.8 100.0 232 44.9 55.1 100.0 240 Rural 77.5 55.7 44.3 100.0 471 61.4 38.6 100.0 506
p<O.OOI p<O.OOI p<O.OOI Instru~o
Nenhuma 74.1 57.4 42.6 100.0 238 63.8 36.2 100.0 257 Primana 88.5 45.5 54.5 100.0 445 52.8 47.2 100.0 467 Secundaria ou + 100.0 4.0 96.0 100.0 21 33.4 66.6 100.0 21
p<O.OOI p<O.OOI p<O.OI
Total 83.9 48.3 51.7 100.0 704 56.0 44.0 100.0 746
Nota: Nivel de importancia determinado atraves do teste Qui-quadrado.
46
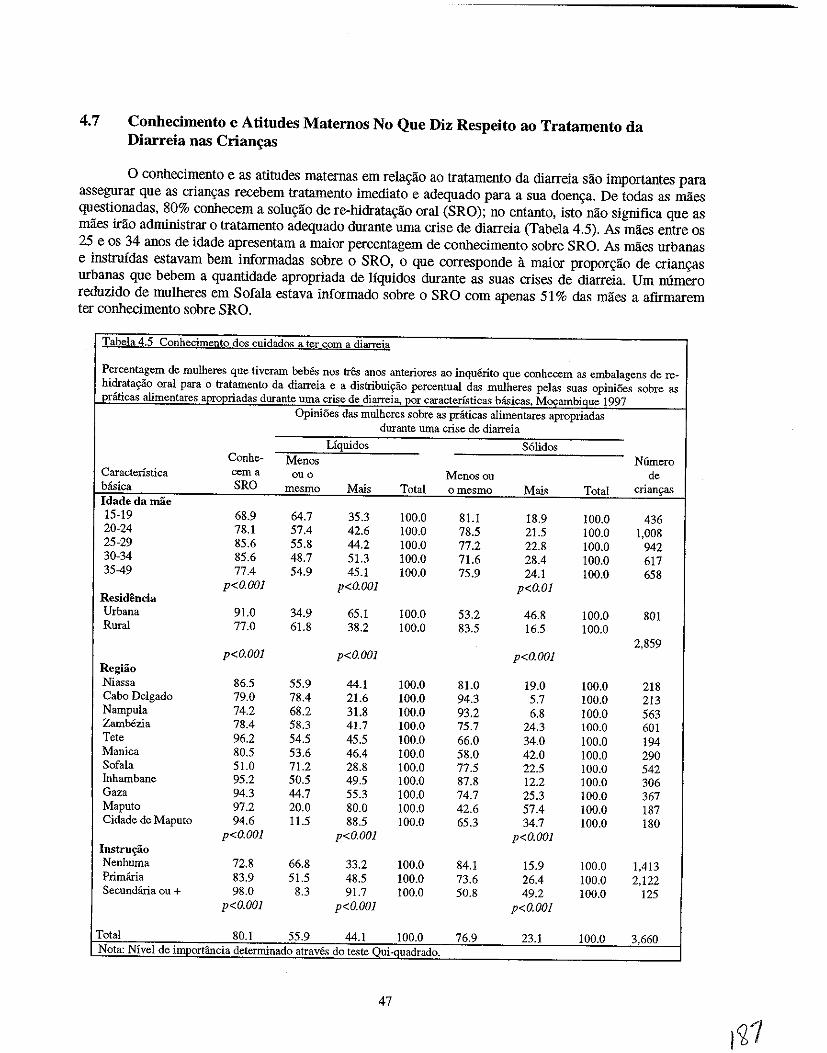
4.7 Conhecimento e Atitudes Maternos No Que Diz Respeito ao Tratamento da Diarreia nas Crian~as
o conhecimento e as atitndes maternas em rela<;ao ao tratamento da diarreia sao importantes para assegurar que as crian<;as recebem tratamento imediato e adequado para a sua doen<;a. De todas as maes questionadas, 80% conhecem a solu<;ao de re-bidrata<;ao oral (SRO); no entanto, isto nao significa que as maes irao adrninistrar 0 tratamento adequado durante uma crise de diarreia (Tabela 4.5). As maes entre os 25 e os 34 anos de idade apresentam a maior percentagem de conhecimento sobre SRO. As rnlies urbanas e instrnfdas estavam bern informadas sobre 0 SRO, 0 que corresponde a maior propor<;ao de crian<;as urbanas que bebem a quantidade apropriada de liquidos durante as suas crises de diarreia. Urn mimero reduzido de mulheres em Sofala estava informado sobre 0 SRO com apenas 51 % das rnlies a afirmarem ter conhecimento sobre SRO.
Tabela4.5 Conhecimento dos cuidados a ter com a diarreia
Percentagem de mulheres que tiveram bebes nos tr& aDOS anteriores ao inquerito que conhecem as embalagens de re-hidratayao oral para 0 tratamento da diarreia e a distribuiS!3.o percentuaI da,> mulheres pelas snas opini5es sabre as pniticas alimentares apropriadas durante urna crise de diarreia, por caracterfsticas hiisicas, Mcx;:ambique 1997
OpiniOes das mulheres sobre as praticas alimentares apropriadas durante uma crise de diarreia
Uquidos S6lidos Conhe- Menas N6mero
Caractenstica cerna ouo Menascu de b<isica SRO mesma Mais Total omesmo Mais Total crianyas
Idadedamae 15-19 68.9 64.7 35.3 !OO.O 81.1 18.9 100.0 436 20-24 78.1 57.4 42.6 100.0 78.5 21.5 !OO.O 1,008 25-29 85.6 55.8 44.2 100.0 77.2 22.8 !OO.O 942 30-34 85.6 48.7 51.3 100.0 71.6 28.4 100.0 617 3549 77.4 54.9 45.1 !OO.O 75.9 24.1 100.0 658
p<O.OOJ p<O.OOI p<O.OI Residencia Urbana 91.0 34.9 65.1 100.0 53.2 46.8 100.0 801 Rural 77.0 61.8 38.2 100.0 83.5 16.5 100.0
2,859 p<O.OOI p<O.OOI p<O.OOI
Regiao Niassa 86.5 55.9 44.1 !OO.O 81.0 19.0 !OO.O 218 Cabo Delgado 79.0 78.4 21.6 !OO.O 94.3 5.7 100.0 213 Nampula 74.2 68.2 31.8 100.0 93.2 6.8 !OO.O 563 Zambezia 78.4 58.3 41.7 100.0 75.7 24.3 !OO.O 601 Tete 96.2 54.5 45.5 100.0 66.0 34.0 100.0 194 Manica 80.5 53.6 46.4 100.0 58.0 42.0 100.0 290 Sofala 51.0 71.2 28.8 !OO.O 77.5 22.5 !OO.O 542 Inhambane 95.2 50.5 49.5 !OO.O 87.8 12.2 100.0 306 Gaza 94.3 44.7 55.3 100.0 74.7 25.3 100.0 367 Maputo 97.2 20.0 80.0 100.0 42.6 57.4 100.0 187 Cidade de Maputo 94.6 11.5 88.5 !OO.O 65.3 34.7 100.0 180
p<O.OOI p<O.OOI p<O.OOI Instrm;.ao Nenhuma 72.8 66.8 33.2 100.0 84.1 15.9 !OO.O 1,413 Primiiria 83.9 51.5 48.5 100.0 73.6 26.4 100.0 2,122 Secundfuia Oll + 98.0 8.3 91.7 !OO.O 50.8 49.2 !OO.O 125
p<O.OOI p<O.OOI p<O.OOJ
Total 80.1 55.9 44.1 !OO.O 76.9 23.1 100.0 3.660 Nota: Nfvel de importancia determinado atraves do teste Oui~quadrado.
47
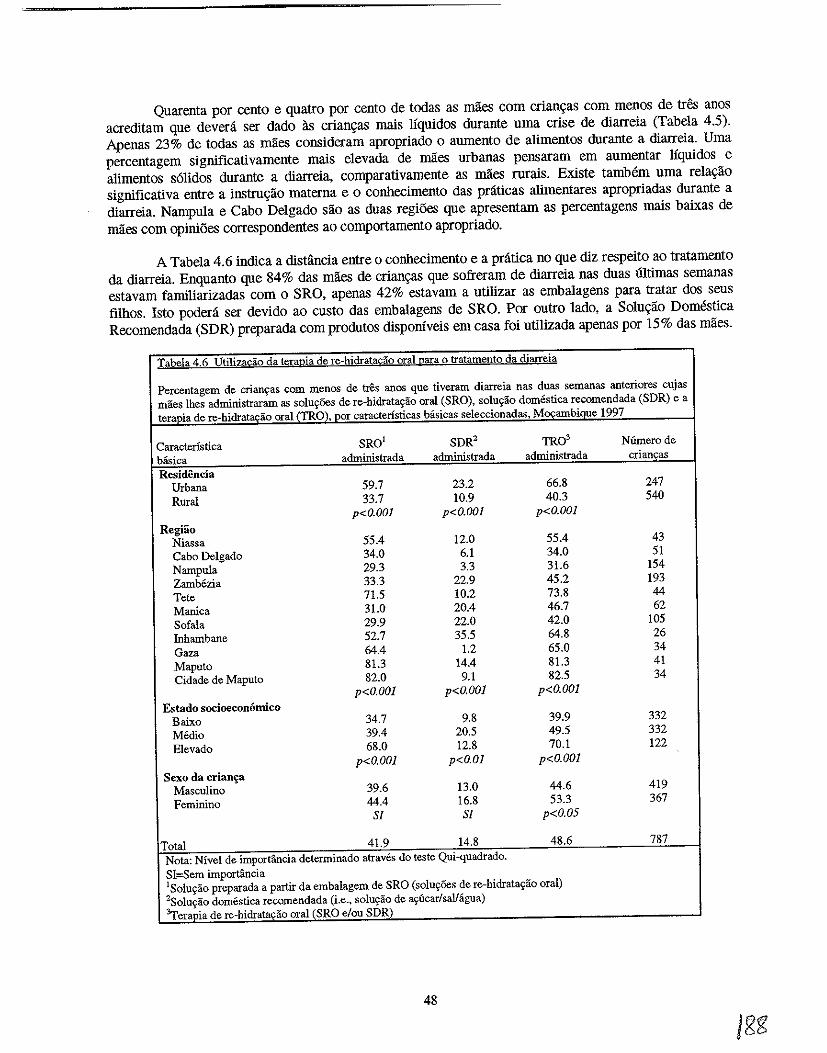
Quarenta por cento e quatro por cento de todas as maes com crian~as com menos de tres anos acreditam que devera ser dado as crian~as mais Jiquidos durante uma crise de diarreia (Tabela 4.5). Apenas 23% de todas as maes consideram apropriado 0 aumento de alimentos durante a diarreia. Uma percentagem significativamente mais elevada de rnaes urbanas pensaram em aumentar liquidos e alimentos s6lidos durante a diarreia, comparativamente as rnaes rurais. Existe tamMm uma rela~ao significativa entre a instru~ao materna e 0 conhecimento das pnlticas alimentares apropriadas durante a diarreia. Nampula e Cabo Delgado sao as duas regi6es que apresentam as percentagens mais baixas de maes com opini6es correspondentes ao comportamento apropriado.
A Tabela 4.6 indica a distiincia entre 0 conhecimento e a pnitica no que diz respeito ao tratamento da diarreia. Enquanto que 84% das maes de crian~as que sofreram de diarreia nas duas illtimas semanas estavam familiarizadas com 0 SRO, apenas 42% estavam a utilizar as embalagens para tratar dos seus filhos. Isto podera ser devido ao custo das embalagens de SRO. Por outro lado, a Solu~ao Domestica Recomendada (SDR) preparada com produtos disp0nlveis em casa foi utilizada apenas por 15% das maes.
Tabela 4.6 Utilizacao da terapia de re-hidratadio oral para 0 tratamento da diarreia
Percentagem de crian\,as com menos de tres anos que tiveram diarreia nas duas semanas anteriores cujas maes lhes administraram as solu~6es de re-hidrat~ao oral (SRO), solu~ao domestica recomendada (SDR) e a ter~Q!a de re-hidratadio oral (TRO), por caracteristicas basicas seleccionadas, M§ambique 1997
Caracteristica SRO' SDR2 TRO' Nfunero de basica administrada administrada administrada crianqas Residencia
Urbana 59.7 23.2 66.8 247 Rural 33.7 10.9 40.3 540
p<O.OOI p<O.OOI p<O.OOI Regiao
Niassa 55.4 12.0 55.4 43 Cabo Delgado 34.0 6.1 34.0 51 Nampula 29.3 3.3 31.6 154 Zambezia 33.3 22.9 45.2 193 Tete 71.5 10.2 73.8 44 Manica 31.0 20.4 46.7 62 Sofala 29.9 22.0 42.0 105 Inhambane 52.7 35.5 64.8 26 Gaza 64.4 1.2 65.0 34 Maputo 81.3 14.4 81.3 41 Cidade de Maputo 82.0 9.1 82.5 34
p<O.OOl p<O.OOl p<O.OOI Estado socioeconornico
Baixo 34.7 9.8 39.9 332 Medio 39.4 20.5 49.5 332 Elevado 68.0 12.8 70.1 122
p<o.oOl p<O.OI p<O.OOl Sexo da crian£a
Masculino 39.6 13.0 44.6 419 Feminino 44.4 16.8 53.3 367
Sf Sl p<O.05
Total 41.9 14.8 48.6 787 Nota: Nivel de importancia determinado atraves do teste Qui-quadrado. SI=Sem importancia ISolu~ao preparada a partir da embalagem de SRO (solur;6es: de re-hidratayao oral) 2So1ur;ao domestica recomendada (i.e., soluyao de ar;ucarlsalJagua) 'Ter.pia de re·hidrata,ao oral (SRO elou SDR)
48
A utiliza9ao de uma das duas terapias de re-hidrata9ao oral (SRO e SDR) foi apenas utilizada por menos de metade das maes com crian9as que sofreram de diarreia nas duas semanas anteriores. Sessenta e sete por cento das maes urbanas administraram aos seus filhos uma terapia de re-hidrata«lio oral (TRO) durante a crise de diarreia. Contrariamente, apenas 40% das miles rurais administraram alguma forma de TRO. Cabo Delgado e Nampula apresentaram a utiliza9ao mais baixa da TRO de todas as provfncias. Devera tamMm ter-se em aten9ao que Nampula apresenta as maiores TMI e TMM5 do pais (Tabela 4.1), o que pOdera ser parcialmente explicado pela baixa utiliza9ao da TRO e de outras terapias para a sobrevivencia da crian9a. Deste modo, parece existir uma enorme necessidade de aumentar a consciencia, o acesso e a utiliza<;:ao da TRO nas provfncias do Norte, Cabo Delgado e Nampula, onde apenas um ter90 das crian9as sao tratadas com da TRO durante a sua doen9a. Uma percentagem significativamente elevada de crian9as de condi90es socio-econ6micas elevadas foram tratadas com a TRO (70%) comparativamente as crian9as de condi90es socio-econ6micas baixas on medias (40% e 50%, respectivamente). As meninas foram significativamente mais tratadas com a TRO do que os meninos (54% e 45%, respectivamente).
4.8 Factores Associados a Diarreia
A ocorrencia de diarreia durante as duas semanas do perfodo de referencia esteve significativamente associada a urn mlmero de factores socio-econ6micos, biol6gicos e de comportamento (Tabela 4.7). A analise bi-dimensional indica que a diarreia apresenta uma maior prevalencia entre as criaQ9as que vivem em zonas urbanas comparada com as zonas rurais. Inhambane e Gaza apresentaram a prevalencia mais baixa (8%), ao passo que a ZamMzia apresentou a prevalencia mais elevada (35%).
o myel educacional da mae e 0 fndice de massa corporal estao tamMm significativamente associados 11 diarreia infantil. As crian9as de maes com pouco peso e com apenas a frequencia da escola primaria apresentaram a prevalencia de diarreia mais elevada. Note-se, no entanto, que as areas urbanas, que apresentam uma prevalencia de diarreia maior do que as areas rurais, tamMm apresentaram as percentagens mais elevadas de maes que frequentaram a escola primaria (ver Apendice B). Deste modo, as rela90es entre cada urn dos factores acima mencionados e a diarreia sao consistentes com os mveis mais elevados de diarreia nas areas urbanas contra as areas rurais. Apesar das areas urbanas apresentarem uma prevalencia mais elevada de diarreia, as crian9as de lares chefiados por mulheres, 0 que e mais comum nas areas rurais (ver Apendice B), corriam tamMm um serio risco de sofrerem de diarreia, durante as duas semanas do perfodo de referencia. Outros factores que apresentam associa90es bivariaveis significativas com a diarreia sao os seguintes:
• Nenhum acesso a latrinas/sanitas de descarga • Acesso a fontes de agua canalizada • Unioes monogamicas • Contacto com um ou mais meios de comunica9ao • Vacina9ao contra a BCG • Idade da crian9a • Quarto nascimento ou mais • Cinco partos ou mais • Sexo masculino • Pelo menos uma consulta de assistencia pre-natal • Servi90s de assistencia pre-natal das actividades nao registadas (parteira tradicional, parteira auxiliar) • Parto assistido por parteiras • Curto espa9amento entre nascimentos (menos de dois anos) • fndice de massa corporal materna (IMC) menor que 18.5 • Cuidados com a crian9a pelo responsavel • Subnutri9ao cr6nica infantil • Subnutri9iio aguda infantil
49
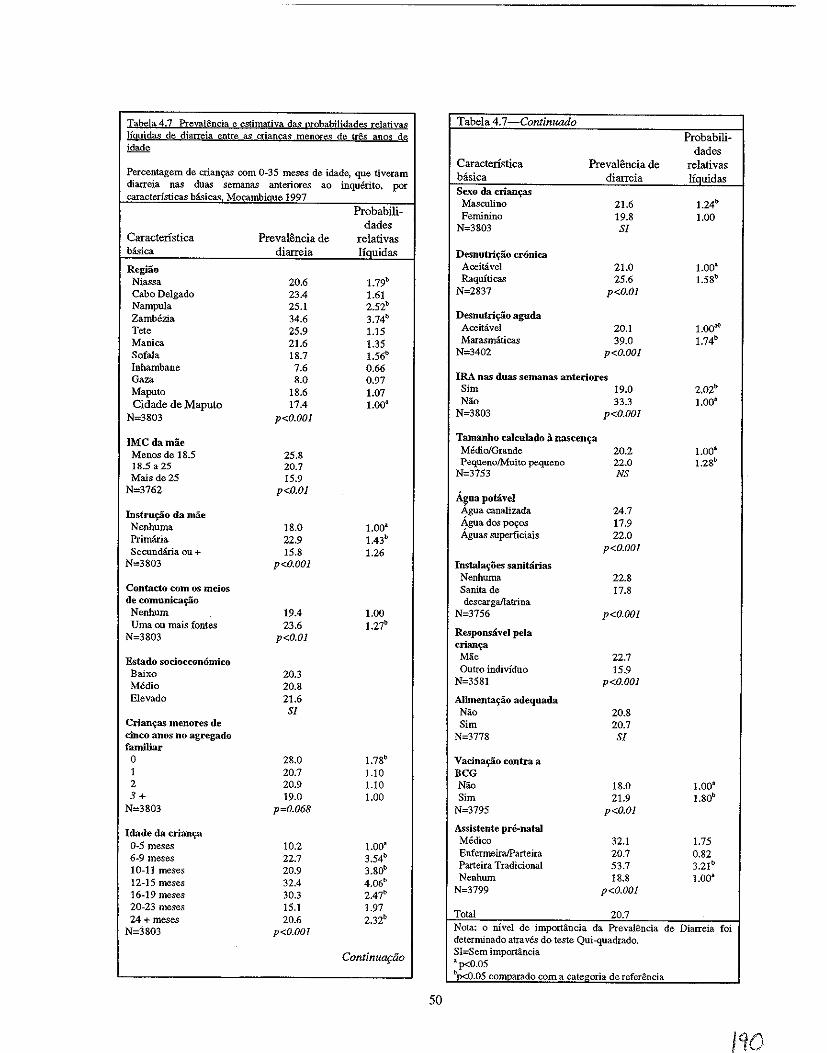
Tabela 4.7 PrevaH~ncia e estimativa das probabiIidade<: relativas Jigujdas de diarreia entre as mancas menores de tres anos de idade
Percentagem de crian~ com 0-35 meses de idade, que tiveram diarreia nas duas semanas anteriores ao inquerito, por caracteristicas Msicas Mocambiaue 1997
Caracteristica basica
Regiao Niassa Cabo Delgado Nampula Zambezia Tete Manica Sofala Inhambane Gaza Maputo Cidade de Maputo
N=3803
IMCdamae Menos de 1S.5 18.5 a 25 Mais de 25
N=3762
Instru~o da mae Nenhuma Primaria Secundiria au +
N=3803
Contacto com os meios de comunicaif3.o Nenhum Uma ou mais fontes
N=3803
Estado socioeconomico Baixo Media Elevado
Crian~as menores de cinco anos no agregado familiar o I 2 3+
N=3S03
Idade da crianf? 0-5 meses 6-9 meses 10-11 meses 12-15 meses 16-19 meses 20-23 meses 24 + meses
N=3803
Preva18ncia de diarreia
20.6 23.4 25.1 34.6 25.9 21.6 18.7
7.6 8.0
18.6 17.4
p<o.oOI
25.8 20.7 15.9
p<O.OI
IS.0 22.9 15.S
p<O.OOl
19.4 23.6
p<O.OI
20.3 20.8 21.6 Sl
2S.0 20.7 20.9 19.0
p=O.068
10.2 22.7 20.9 32.4 30.3 15.1 20.6
p<O.OOI
Probabilidades
relativas liquidas
1.79b
1.61 2.52b 3.74b
1.15 1.35 1.56b
0.66 0.97 1.07 1.00a
I.OOa 1.43b
1.26
1.00 1.27b
1.78b
1.10 1.10 1.00
1.00' 3.54b
3.S0b
4.06b
2.47b
1.97 2.3Zb
ContinuGftio
50
Tabela4.7-Continuado Probabili-
dades Caracteristica Preval8ncia de relativas basica diarreia liquidas Sexo da crianf?S
Masculina 21.6 l.24b
Feminino 19.8 1.00 N=3S03 Sl
Desnutri~ao cronica Aceitavel 21.0 1.00a Raquiticas 25.6 1.5Sb
N=2837 p<O.OI
Desnutri~ao aguda Aceitavel 20.1 1.00a(! Marasmaticas 39.0 1.74b
N=3402 p<O.OOI
IRA nas duas semanas anteriores Sim 19.0 Z.OZb Nao 33.3 1.00'
N=3S03 p<O.OOI
Tamanho calculado a nascen~a Media/Grande 20.2 1.00a
PequenolMuito pequeno 22.0 1.2Sb
N=3753 NS
A~ua potaveJ Agua canalizada 24.7 Agua dos po~os 17.9 Aguas superficiais 22.0
p<O.OOI
Instala~oes sanitarias Nenhuma 22.8 Sanita de 17.8 descargallatrina
N=3756 p<O.OOI
Responsavel pela crian~a
Mae 22.7 Outro individuo 15.9
N=3581 p<O.OOI
Alimenta~ao adequada Nao 20.S Sim 20.7
N=3778 Sl
Vacina~o contra a BeG Nao 18.0 1.00' Sim 21.9 1.80b
N=3795 p<O.OI
Assistente pre-natal Medico 32.1 1.75 EnfermeiraiParteira 20.7 0.82 Parteira Tradicional 53.7 3.21 b
Nenhwn 18.S 1.00a N=3799 p<O.OOl
Total 20.7 Nota: o nivel de importincia da PrevalSncia de Diarreia foi determinado atraves do teste Qui-quadrado. SI=Sem import.incia ap<O.05 t>p<O.05 comparado com a categoria de referenda
110
• IRA durante as duas semanas anteriores ao inquerito • Tamanho "pequeno/muito pequeno" calculado 11 nascenl(a • A mae como a principal responsavel
Ao explorar a relal(ao entre a alimental(ao e a diarreia no beM/criall\(a, todas as crianl(as foram classificadas com base no facto de terem sido ou nlio alimentadas de acordo com os padr6es apropriados segundo a idade, publicados pela OMS e UNICEF (1990). A alimental(lio apropriada segundo a idade e definida da seguinte forma:
• Entre os 0-5 meses de idade, aleitamento exclusivo • Entre os 9-23 meses de idade, leite materna mais alimentos suplementares • Mais de 24 meses de idade, uma dieta que inclua alimentosllfqnidos e possivelmente leite materno.
Utilizando os criterios acima referidos, todas as crianl(as foram classificadas como mal alimentadas ou bern alimentadas. A relal(lio bi-variavel as variaveis que representa a aliment~lio apropriada segundo a idade do bebetcrianl(a e a diarreia nlio e significativa estatisticamente; no entanto, a alimental(ao das crianl(as foi inc1uida na anilise multi-variavel, dada a sua associ~ao com a diarreia documentada na literatura (Victora, et al.,1987; Brown et al,. 1989). Para alem disso, quando a relal(ao acima mencionada foi explorada com base na idade especffica, surgiram diferenl(as estatisticamente significativas. Para todas as idades, excepto 24 meses e mais, s6 uma pequena proporl(ao de crianl(as bern alimentadas sofreram de diarreia comparativamente as crianl(as mal alimentadas. Entre as crianl(as de 24 a 36 meses - quase urn terl(o de toda a amostra - 0 contrario e verdadeiro; 3% de cri~as mal alimentadas e 22% de crianl(as bern alimentadas sofreram de diarreia durante as duas semanas anteriores. Deste modo, existe a evidencia de uma interaq:iio entre a idade da crianl(a e a alimental(lio do bebetcrianl(a em rela<;:ao ao risco de diarreia, durante as duas semanas anteriores ao inquerito. Como resultado, e inclufdo na anilise multi-variavel urn factor de interac<;:lio para explicar a varial(ao na magnitude e direcl(ao da relal(ao entre a alimental(ao do bebetcrianl(a e a diarreia por todas as diferentes idades.
Deveria notar que quando uma crianl(a estiver doente, nao receber comida adequada ou se desmamanta<;:ao fosse iniciado tarde (alem de 6-9 meses), a crianl(a podem exigir continuar amamental(ao alem de 24 meses. OMS recomenda que as crianl(as deveriam continuar amamenta<;:lio para ate dois anos de idade e alem enquanto recebendo alimentos complementares adequados e seguros (OMS, 1996b). Porem, em MO\(ambique, 76% de crian<;:as de 24 meses de idade e em cima de ja nlio estava amamentando. Conseqiientemente, a rela\iao entre alimenta\iao pr6pria e diarreia pode refletar que a amamental(ao prolong ada devido a doen<;:a ou desnutri\iao (Fawzi, al de et., 1998; e Caulfield, Bentley e Aluned, 1996). 0 efeito protetor da amamenta<;:ao diminuia provavelmente com idade da criall\(a devido a mais baixo consumo de leito materno pela <-'l"ianl(a que recebe alimentos complementares (OMS, 2000).
Tambem foram inclufdos outros factores com associal(6es bi-variaveis significativas com a diarreia nos modelos de regresslio logistico multi-variavel, de forma a avaliar 0 efeito de cada factor na diarreia infantil, controlando os efeitos dos outros factores. Uma vez que nlio existe uma estrutura conceptual para a diarreia, 0 melhor modelo possivel para MO\(ambique foi criado com base nos factores comuns estudados na literatura sobre diarreia. A analise multi-variavel referida neste capitulo e uma adapta<;:1io de uma abordagem utilizada por Mock et al. (1993) para estudar as rela<;:6es socio-econ6micas, ambientais, demograficas e de comportamento da diarreia infantil, na Republica do Congo. Apesar do estudo de Mock et al. nao fornecer uma estrutura hierarquica para 0 estudo da diarreia, fornece urn sistema de classifical(ao para os seus factores. Na presente analise, as variaveis com associal(6es bivariliveis significativas com a diarreia estao classificadas da seguinte forma (as categorias de referencia estao em italico):
51
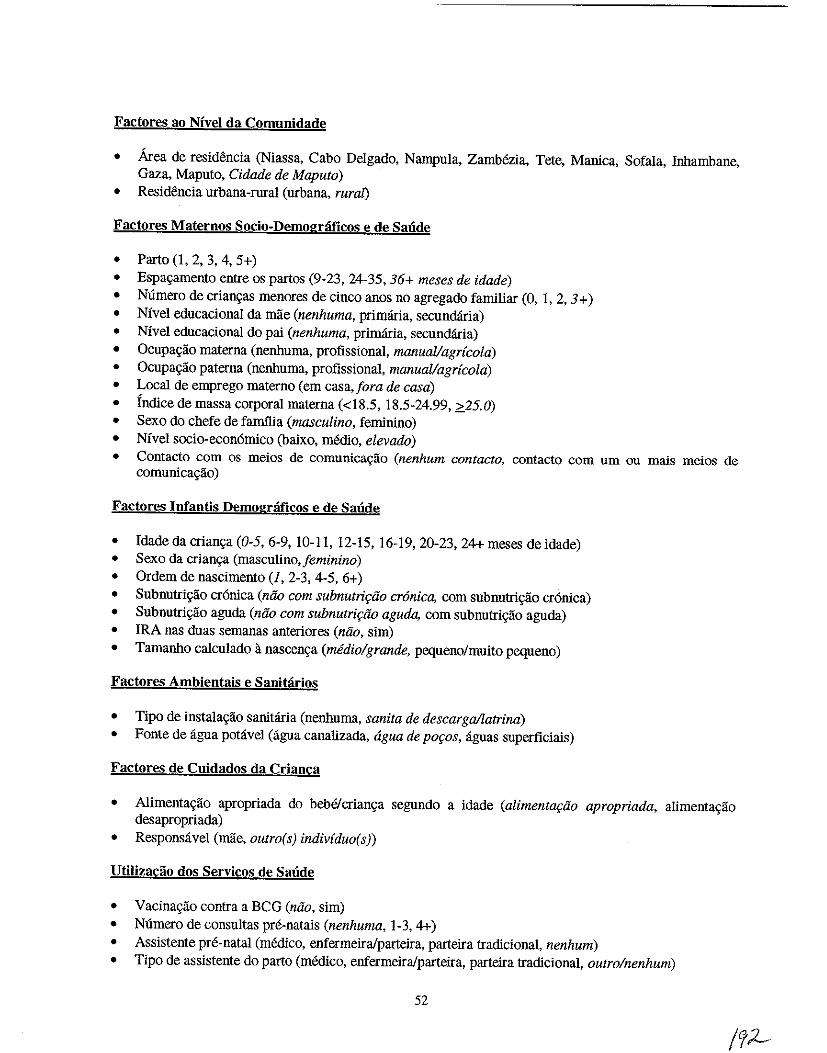
Faetores ao Nivel da Comunidade
• Area de residencia (Niassa, Cabo Delgado, Nampula, Zambezia, Tete, Manica, Sofala, Inbambane, Gaza, Maputo, Cidade de Maputo)
• Residencia urbana-rural (urbana, rural)
Factores Maternos SOcio-Demognifieos e de Sande
• Parto (1,2,3,4,5+) • Espa9amento entre os partos (9-23, 24-35, 36+ meses de idade) • Nnmero de crian9as menores de cinco anos no agregado familiar (0, 1,2,3+) • Nivel educacional da mae (nenhuma, primaria, secundaria) • Nivel educacional do pai (nenhuma, primaria, secundaria) • Ocupa9ao materna (nenhuma, profissional, manual/agricola) • Ocupa9ao paterna (nenhuma, profissional, manual/agricola) • Local de emprego materno (em casa,fora de casa) • Indice de massa corporal materna (<18.5,18.5-24.99, ::::.25.0) • Sexo do chefe de faIl1l1ia (masculino, feminino) • Nivel socio-econ6mico (baixo, medio, elevado) • Contacto com os meios de comunica9ao (nenhum contacto, contacto com urn ou mais meios de
comunica9ao)
Faetores Infantis Demogr3ficos e de Sande
• Idade da crian9a (0-5, 6-9, 10-11, 12-15, 16-19, 20-23, 24+ meses de idade) • Sexo da crian9a (masculino,feminino) • Ordem de nascimento (1, 2-3, 4-5, 6+) • Subnutri9ao cr6nica (nao com subnutn{:ao cr6nica, com subnutri9ao cr6nica) • Subnutri9ao aguda (nao com subnutri{:ao aguda, com subnutri9ao aguda) • IRA nas duas semanas anteriores (nao, sim) • Tarnanbo calculado Ii nascen9a (medio/grande, pequeno/muito pequeno)
Faetores Ambientais e Sanitarios
• Tipo de instala9ao sanitaria (nenhuma, sanita de descarga/latrina) • Fonte de agua poUive1 (agua canalizada, agua de po{:os, aguas superficiais)
Factores de Cuidados da Crianca
• Alimenta9ao apropriada do bebelcrian9a segundo a idade (alimenta{:ao apropriada, alimenta9ao desapropriada)
• Responsavel (mae, outro(s) individuo(s)
Utilizacao dos Servieos de SaMe
• Vacinac;:ao contra a BCG (nao, sim) • N6mero de consultas pre-natais (nenhuma, 1-3,4+) • Assistente pre-natal (medico, enfermeiralparteira, parteira tradicional, nenhum) • Tipo de assistente do parto (medico, enfermeiralparteira, parteira tradicional, outro/nenhum)
52
De maneira geral, a literatura publicada nao contem informao;:ao sobre a hierarquia destes factores. Para 0 objectivo desta analise, cada con junto de factores ("Factores ao Nivel da Comunidade," "Factores Maternos, Socio-Demognificos e de Sande," etc.) foi considerado, em primeiro lugar, como urn modelo de regressao independente para a diarreia. Para cada grupo de factores, foi identificado 0 melhor con junto possivel de varhiveis. Este processo abrangeu seis modelos de regressao diferentes, representando cada urn dos seis con juntos de factores acima referidos. Como urn passo final, as variaveis de cada urn dos "melhores con juntos" foram introduzidas ao mesmo tempo dentro do mesmo modelo para avaliar os efeitos de cada variavel sobre a diarreia, ajustando a outras variaveis. Victora et al. (1997) defendeu uma abordagem analitica semelhante quando estudou as doeno;:as infecciosas utilizando estruturas conceptuais.
A analise multi-variavel identificou os seguintes factores como tendo relao;:oes estatisticamente siguificativas com a diarreia durante as duas semanas anteriores ao inquerito (Tabela 4.6):
• area de residencia • nivel educacional da mae • contacto materna com os meios de comunicao;:ao • idade da criano;:a • sexo da criano;:a • vacinao;:ao contra a BCG • tamanho calculado 11 nasceno;:a • IRA durante as duas semanas anteriores ao inquerito • subnutrio;:ao cr6nica • subnutrio;:ao aguda
Para a maioria, as conclusoes do IDSM de 1997 no que diz respeito a diarreia corresponderam as conclusoes existentes na Iiteratura sobre a diarreia. Existem tres variaveis que necessitam de uma aruilise especial, apesar dos seus resultados na amUise multi-variavel. Apesar da variavel "responsavel pelos cuidados da criano;:a" nao corresponder aos criterios do presente estudo para fins estatisticos (95% de certeza com uma variao;:ao de 1.00), as criano;:as cujos responsaveis principais eram as suas maes apresentavam urn risco maior de diarreia, de 22%, em relao;:ao aquelas cujos responsaveis eram outros individuos. Mock et al. (1993) observou urn fen6meno semelhante, apesar de nao ser identico, no Congo, onde as criano;:as, cujos responsaveis faziam parte da fanu1ia alargada tinham tendencia para sofrer menos de diarreia do que aquelas cujos responsaveis faziam parte do agregado familiar nuclear. E provavel que as maes moo;:ambicanas, que sao as principais responsaveis, tenham obrigao;:oes paralelas, por exemplo, trabaJhar na machamba da fanu1ia ou obter rendimento de outras actividades nao registadas, que podem comprometer a sua capacidade de prestar os cuidados necessarios aos seus filhos. Outra variavel que garante a anillise e 0 servio;:o de assistencia pre-natal. As criano;:as, cujas maes procuraram assistencia prenatal das parteiras tradicionais, correram tres vezes mais riscos de contrairem diarreia. No entanto, devera ter-se em ateno;:ao que 0 nnmero de mulheres que procuram assistencia pre-natal das parteiras tradicionais e extremamente baixo em Moo;:ambique (I %); deste modo, 0 risco estimado associado a esta variavel devera ser interpretado com precauo;:ao. Para aMm das variaveis acima referidas, os factores de interaco;:ao para a alimentao;:ao do bebetcriano;:a e idade nao foram estatisticamente significativos no modelo final.
Com respeito as variaveis que sao estatisticamente significativas na analise multi-variavel, as criano;:as residentes em Niassa, Cabo Delgado, Nampula, ZamMzia, e Sofala apresentam riscos de contrairem diarreia significativamente mais elevados do que as criano;:as residentes na cidade de Maputo. Em particular, as criano;:as na ZamMzia apresentam urn risco quatro vezes maior do que as criano;:as da cidade capital. Deste modo, mesmo controlando os outros factores relacionados com a diarreia, as criano;:as da ZamMzia apresentam 0 risco de contrairem diarreia mais elevado do pais. As criano;:as de maes que frequentaram a escola primaria estavam 43% mais susceptfveis de contrairem diarreia durante as duas semanas do periodo de referencia, comparativamente as criano;:as cujas maes eram mais instruidas.
53
No entanto, deve-se ter em aten<;ao que uma elevada propor<;ao de mulheres instruidas residem nas areas urbanas - onde a preval~ncia da diarreia e mais elevada - comparada com a das areas rurais (ver Apendice B).
A rela<;ao entre 0 contacto materna e os meios de comunica<;ao e significativa quando outros factores sao tidos em conta; as crian<;as, cujas maes estavam em contacto com os meios de comunica<;ao, estavam 27% mais susceptiveis de contrairem diarreia do que as crian<;as cujas maes nao estavam em contacto com os meios de comunica<;ao. Apesar desta observa<;ao parecer contradit6ria, esta de acordo com a rela<;ao observada entre a instru<;ao materna e a diarreia infantil. Tanto a instru<;ao materna como 0
contacto com os meios de comunica<;ao sao significativamente mais elevados nas areas urbanas do que nas areas rurais (ver Apendice B).
Em termos da rela<;ao entre a diarreia e as caracteristicas da crian<;a, as crian<;as mais velhas correm urn risco significativamente mais elevado de contrairem diarreia do que os bebes entre os 0-5 meses de idade (Tabela 4.7). 0 risco de diarreia atinge 0 seu maximo entre os 10 e os IS meses de idadequatro vezes mais do que em bebes com 0-5 meses de idade. Esta conclusao deve-se possivelmente ao consumo de alimentos contaminados por parte de crian<;as desta faixa etaria, a morbilidade tambem aumenta devido ao elevado contacto com objectos contaminados. Existe uma diferen<;a significativa entre os sexos mesmo quando outros factores sao tidos em conta. Os meninos sao 25% mais susceptiveis de contrairem diarreia do que as meninas, durante as duas semanas do periodo de referencia. Esta conclusao esta baseada em observa<;oes efectuadas noutros contextos africanos (Molbak et aI., 1997; Mock et aI., 1993). Como aparece indicado na Tabela 4.7, as crian9as que foram vacinadas contra a BCG estavam quase 80% mais susceptiveis de contrairem diarreia do que as crian<;as nao vacinadas contra a BCG. Esta conclusao corresponde 11 utiliza<;ao dos servi<;os de salide e dos padroes de cobertura dos programas de imuniza9ao em Ma<;ambique-ambos os quais sao mais elevados nas areas urbanas (CISI, 1995). Para alem disso, as crian<;as, enjo tamanho 11 nascen<;a foi calcu1ado como "pequeno" ou "muito pequeno" pelas suas mlies eram 28% mais susceptiveis de contrairem diarreia do que as crian<;as de tamanho medio ou grande. No entanto, nao e claro se os seus tamanhos pequenos comprometiam a sua saude ou se as maes e os responsaveis responderam de forma diferente sobre estas crian<;as em rela<;ao as crian<;as medias e grandes.
As conclusoes emergentes da anilise multi-variavel tambem fornecem provas de uma forte associa<;ao entre a desnutri<;ao infantil e a diarreia. Ern Ma<;ambique, as crian<;as que sofrem de subnutri<;ao cr6nica e de subnutri<;ao aguda apresentam urn maior risco de contrairem diarreia, 58% e 74%, respectivamente. Apesar das associa<;oes observadas, nao e possivel demonstrar a causalidade entre a desnutri<;ao infantil e a diarreia neste presente estudo. A Iiteratura faz alusao as dificuldades em determinar que fen6meno - diarreia ou desnutri<;ao - precede 0 outro, e as conclusoes anteriores foram inconsistentes (Briend, 1990). Para alem da desnutri9ao, as crian<;as que sofreram de IRA nas duas semana.~ anteriores ao inquerito estiveram duas vezes mais susceptIveis de contrairem diarreia do que as crian<;as que nao sofreram de IRA. 0 mecanismo biol6gico por detras desta rela<;ao nao e muito claro e ambas doen<;as parecem compartilhar as mesmas caracteristicas. Isto e, a rela<;ao observada entre a IRA e a diarreia e provavelmente confundida (confounding) por urn ou mais factores, como 0 myel educacional da mae, que representa 0 estado socio-economico e tambem do acesso aos servi<;os e informa<;ao de salide.
A partir desta discussao e evidente que existem varios pontos de intervengao, tanto a curto como a longo prazos. Os factores de natureza socio-econ6mica, por exemplo, 0 myel educacional da mae, estao menos sujeitos a uma intervengao a curto prazo. Contudo, a sua influencia observada sobre 0 risco de diarreia necessita de mais aten<;ao. Para alem disso, a associa<;ao significativa entre a desnutri<;ao e a diarreia sublinha a necessidade de explorar ainda mais a inter-rela<;ao entre a doen<;a e 0 estado nutricional, e de identificar factores que influenciam ambos. Isto e de extrema importancia dada a elevada prevalencia da diarreia e da desnutri<;ao no seio dos beMs e crian<;as mogambicanas.
54
IN
4.9 Resumo
Este capitulo apresenta resultados que indicam niveis elevados de mortalidade infantil e de menores de cinco anos em Movambique (147 e 219 por 1,000, respectivamente). Os beMs e crian9as parecem apresentar uma desvantagem especial em termos de risco de mortalidade. As taxas de mortalidade infantil e de menores de cinco anos sao mais elevadas na provincia de Nampula (216 e 319 por 1,000, respectivamente), onde as praticas de cuidados da crian9a, como a amamenta9aO exclusiva, nao sao muito comuns. As taxas de mortalidade em Nampula contrastam fortemente com as taxas na capital de M09ambique, Maputo, onde as TMI e TMM5 sao de 49 e 97 por 1,000, respectivamente.
Em Movambique, a desnutri9ao desempenha um papel critico na determina9ao da sobrevivencia dos beMs e crian9as: 44% de todas as mortes antes dos cinco anos de idade estao relacionadas com a desnutri9ao. A elevada prevalencia de doen9as infantis comuns, nomeadamente, diarreia (21 %), IRA (12%) e febre (44%), tamMm sao de grande preocupa9ao. A diarreia, que pode influenciar 0 estado nutricional da crian9a, esta relacionada com um m1mero de factores que sublinham os pontos de interven9ao possiveis para a diminui9ao da diarreia, e essencialmente, da morbilidade nutricional em Movambique. A grande maioria dos factores identificados na analise muIti-variavel referem-se its mas condi90es sociais e econ6micas que existem em Movambique, especialmente nas areas urbanas, onde a prevalencia da diarreia e quase 0 dobro da elevada prevalencia da mesma nas area rurais.
4.10 Recomenda~oes
Dada a prevalencia da morbilidade e mortalidade entre os beMs e as crian9as movambicanas, as recomenda90es chave sao as seguintes:
Nutrit;i1o dos Bebes/Crianras
• Fomentar a alimenta9ao cOITecta segundo a idade, para todas as crian9as.
• Informar sobre a necessidade de aumentar a quantidade de Iiquidos e s6lidos durante as crises de diarreia. Recomendar 0 continuo aumento de alimentos na dieta da crian9a ap6s a doen9a para permitir a recupera9ao e 0 crescimento da crian9a.
• Desenvolver interven90es que permitam a identifica<;ao imediata e tratamento da desnutri<;ao ligeira e moderada nas crian<;as.
Planeamento Familiar
• Dada a rela9ao observada entre 0 curto espa9amento entre os nascimentos e a mortalidade dos bebes/crian9as, promover 0 espa9amento apropriado entre os nascimentos atraves da utiliza9ao do planeamento familiar para (1) reduzir as exigencias econ6micas e nutricionais existentes em agregados familiares numerosos, nas areas com elevadas taxas de mortalidade (por ex., provincia de Nampula) e (2) reduzir os riscos de morbilidade associados ao elevado mlmero de nascimentos.
• Melhorar a acessibilidade e aceita9ao do planeamento familiar atraves da integra9ao dos servi90s de planeamento familiar aos servi90s da "consulta sadia" no sector da saude publica.
Saude e Bem-Estar das Mulheres
• Aumentar as oportunidades educacionais e ocupacionais para as mulheres pobres.
55
• Desenvolver campanhas de promo~ao de saude apropriadas para as popula~oes pobres e analfabetas, especialmente nas areas rurais. Instruir as maes e os profissionais de saude sobre os protocol os de preven~iio, cuidados e tratamento simples para as doen~as infantis comuns, como a diarreia.
• Identificar as mulheres de alto risco (por ex., adolescentes, multiparas) atempadamente durante 0 perfodo pre-natal para monitorizar a sua salide, detectar e tratar as doen~as (por ex., anemia, malaria) relacionadas com os futuros bebes.
Melhoramento do Ambito dos Serviros de Sobrevivencia da Crianr;a
• Dada a incongruilncia entre os niveis de conhecimento da TRO e sua utiliza~ao em M~ambique, estabelecer programas de consciencializa"ao da comunidade que (a) melhorem o acesso e aceita~ao da TRO por parte da comunidade e (b) que instruam os profissionais de salide sobre a correcta utiliza~ao da TRO.
Alvos Geo grtificos
• Investigar quais os factores causais da diarreia em Cabo Delgado, Nampula, Niassa, Sofala, e Zambezia, e planear as respectivas interven~oes.
• Melhorar as cOfl(li~Oes da agua, do saneamento e ambientais nas areas urbanas, onde a prevalilncia da diarreia e mais elevada.
Investigarao
• Apoiar a investiga~ao qualitativa que explore os factores que iniluenciam os servi~os de assistilncia para as doen~as infantis e a diferenca no tratamento das mesmas doen~as, entre meninos e meninas.
56
, CAPITULO 5
FACTORES ASSOCIADOS A DESNUTRI<;AO
A desnntri~ao esta directamente relacionada com uma pobre ingestao alimentar e com a morbilidade, ambas associadas a urn grande numero de factores biol6gicos, demogrificos e socioecon6micos. Este capitulo baseia-se em tecnicas analiticas bidimensionais e multidimensionais e descreve as rela~oes entre varios factores e a desnutri~ao infantil em M~ambique.
5.1 Caracteristicas Biol6gicas e de Sande da Subnutri.;ao Cr6nica
Como se pode ver na Tabela 5.1, a subnutri~ao cr6nica e aguda estao significativamente associados a varias caracteristicas biol6gicas e de saude. No entanto, deve-se sublinhar 0 facto das rela~oes representadas na Tabela 5.1 poderem ser alteradas. Deste modo, os resultados da analise bidimensional nao descrevem em que consiste exactamente a rela9ao entre estes factores e a subnutri9ao cr6nica e aguda.
Com base na analise bidimensional (Tabela 5.1), a subnutri9ao cr6nica nas crian9as com menos de trSs anos e significativamente associada aos seguintes factores biol6gicos e de saude:
• idade da crian~a • tamanho da crian9a calculado pela mae a nascen~a • peso a nascen~a • nascimento simples vs. multiplo • estado actual de gravidez da mae • espa9amento entre os nascimentos • ocorrencia de diarreia nas duas semanas anteriores • ocorrencia de febre nas duas semanas anteriores • alimenta~ao segundo a idade do beM
Hi urna rela9ao positiva entre a idade da crian9a e a subnutri<;ao cr6nica, visto as criaI19as apresentarem uma percentagem mais baixa de subnutri~ao cr6nica e as crian~as mais velhas na amostra apresentarem a percentagem mais elevada de subnutri~ao cr6nica. Visto a subnutri~ao cr6nica ser urn processo acumulativo, esta rela~ao nao e surpreendente. Todavia, deve-se sublinhar que mais de urn ter~o das crian~as dos 12 aos 17 meses sofrem de subnutri~ao cr6nica, demonstrando assim que este tipo de subnutri9ao pode ser observada durante as fases iniciais da vida. Dos 18 aos 23 meses, quase metade de todas as crian~as sofrem de subnutri~ao cr6nica; salientando, deste modo, os primeiros dois anos de vida como urn periodo critico na preven~ao da desnutri~ao infantil. A subnutri~ao cr6nica continua a aumentar durante 0 terceiro ano de vida, embora par~a estabilizar-se ao 30° e ao 35° mSs de vida.
Embora a inform~ao sobre 0 peso a nascen~a s6 esteja disponivel para 39% das crianC;as, os beMs com baixo peso a nascen~a (BPN) parecem estar nutricionalmente em desvantagem durante a infancia quando comparados com os bebes com urn peso normal a nascen~a (Tabela 5.1). A prevalencia de subnutri91io cr6nica entre crian~as que nasceram com urn BPN e de 44% - significativamente mais elevada que aquela observada entre crian~as que nasceram com urn peso normal a nascen~a (27%). Considera-se que as crian~as gemeas correm urn maior risco de sofrerem de subnutri~ao cr6nica, com dois ter~os dos gemeos a sofrerem de subnutri~ao cr6nica em compara~ao com os 35% de mhos Unicos. Para alem disso, urna maior propor~ao de crian~as que nasceram menos de dois anos ap6s 0 irmao
57
, Tabela 5.1 Subnutris:ao cr6nica e subnutri£ao aguda gor Tabel.5.I-ContinUOflio caracteristicas bio16gicas
Caracteristica Subnutris;ao SUbnutriyao
Percentagem de crian~as menores de 3 anos de idade basica cronica a.uda
que sofrem de subnutri~ao cronica ou de subnutri~ao Partos , aguda por caracteristicas bio16gicas seleccionadas,
IvlOQambique 1997 Um 39.4 6.3 Dois 41.9 8.2
Caracteristica Subnutris;ao Subnutriyao Tres 37.7 8.6 biisica cr6nica aouda Qualro 26.9 4.8
Idade da crian~a (meses)
Cinco ou roais 33.2 10.0 N=2835 p<O.OOl p<O.05
0-5 13.6 2.8 6-9 24.8 7.6 10-11 24.3 11.2 12-15 35.0 11.2 16-19 45.4 19.1
Sexo da crian£3 Mac;culino 36.1 8.0 Feminino 35.8 7.7
N=2837 Sf Sf 20-23 46.8 7.8 24+ 53.6 5.2
N=2837 p<O.OOl p<O.OOl
Estado actual de gravidez da mae Nao/incerteza 34.0 8.5
Tamanho a nascen4? Medio/Grande 34.5 7.7
Sim 54.8 2.2 N=2837 p<O.OOl p<O.OOl
Pequeno 44.0 6.6 Muito pequeno 14.6 42.1
N=2837 p<O.OOI p<O.OOI
Espa~mento entre nascimentos
<24meses 40.5 5.3
Peso it nascen~a NormaP 27.3 6.4 Baixo2 43.8 19.5
24-35 me,e, 36.9 10.5 36+meses 32.3 7.4
N=2257 p<O.05 p<O.Ol
N=1367 p<O.OOl p<O.OOl Diarreia (2 semanas)
UnicosiGemeos MUltiplos 65.8 10.5 Unice, 35.4 7.8
Nao 34.6 6.2 Sim 40.7 13.6
N=2837 p<O.Ol p<O.OOl
N=2837 p<O.OOl Sf Febre (2 semana,)
Ordemde nascimento
Primeiro 40.1 6.3
Nao 34.0 5.9 Sim 38.3 10.2
N=2837 p<O.05 p<O.OOl
Segundo ou terceiro 38.6 8.1 Quarto ou quinto 33.4 6.6 Sexto ou mais 29.2 11.0
N=2837 p<O.OOl p<O.05
Alimenta£30 apropriada segundo a idade
Correcta 40.5 8.9 Incorrecta 22.4 4.7
Continuariio N=283 I p<O.OOl p<O.OOl
Total 35.9 7.9 Nota: Nfvel de importfutcia determinado atraves do teste Qui-quadrado. SI = Sem importancia IPeso normal a nascen~a = 2500 gramas ou mais 2Baixo peso a nascen~a = menos de 2500 gramas
58
anterior sofriam de subnutric;ao cr6nica (41 %), comparando com as crianc;as cujos irmaos eram mais velhos 24-35 meses ou pelo menos 36 meses (37 e 32%, respectivamente).
As doenc;as infantis comuns como a diarreia e a febre durante as duas semanas anteriores ao inquerito estao tamMm significativamente associadas it subnutric;ao cr6nica (Tabela 5.1). Ha poucas probabilidades que estas duas doenC;as sejam causas directas de subnutric;ao cr6nica; no entanto, e mais provavel que as crianc;as que tiveram diarreia ou febre tenham tido epis6dios recorrentes de doenc;as no passado. Assim 0 efeito acumulativo de doenC;as recorrentes sobre a subnutric;ao cr6nica pode ser substancial. Ao contrario da diarreia, a IRA durante as duas semanas anteriores nao foi significativamente associada it subnutric;ao cr6nica.
Tal como no Capitulo Quatro, todas as crians;as foram classificadas com base no facto dos seus regimes alimentares estarem ou nao de acordo com os padr6es de alimentas;ao apropriada segundo a idade da OMS e da UNICEF. A alimentas;ao apropriada segundo a idade e definida da seguinte forma:
• Entre os 0-5 meses de idade, amamentac;ao exclusiva • Entre os 9-23 meses de idade, 1eite materna mais alimentos complementares • Mais de 24 meses de idade, uma dieta que inclua alimentosl1iquidos (a crianC;a pode ser arnamentada
ou desmamada).
Utilizando os criterios acima referidos, todas as crians;as foram classificadas quer como mal alimentadas ou bem alimentadas. Surpreendentemente, as crians;as que eram bern alimentadas estavam mais susceptiveis de virem a softer de subnutris;ao cr6nica do que as crians;as mal alimentadas (41 % vs. 22%) (Tabe1a 5.1). Este resultado pode dever-se a factores relacionados com as respostas questionaveis dadas pelas maes relativas com a alimentac;ao no ambito da pesquiza. A utilizas;ao de dados sobre a alimentac;ao durante 24 horas pode nao reflectir verdadeiramente as pniticas alimentares (Pi woz et al., 1994). A utilizas;ao de dados sobre a alimentas;ao durante sete dias pode oferecer uma melhor descris;ao de uma alimentac;ao correcta. TamMm se notou que as maes de crians;as desnutridas estao mais susceptfveis de exagerar no calculo da verdadeira quanti dade de alimentos consumidos durante as 24 horas (Olinto et aI., 1994).
5.2 Caracteristicas BioJogicas e de Saude da Subnutri!;ao Aguda
Em geral, a natureza e a magnitude das associac;oes entre a subnutric;ao aguda e as caracterfsticas biol6gicas e de saude da crians;a sao semelhantes as da subnutric;ao cr6nica (Tabela 5.1). No entanto, M algumas exceps;oes a salientar. Em primeiro lugar, a prevalencia da subnutris;ao aguda atinge 0 ponto maximo muito antes da subnutris;ao cr6nica - 12-17 meses vs. 30-35 meses, respectivamente - embora a prevalencia da subnutriyiio aguda seja bastante mais baixa em todas as idades. Uma vez que a subnutris;ao aguda aponta para uma doens;a aguda ou deficiencias recentes na ingestiio alimentar, e possivel que as praticas de desmame incorrectas (alimentos de desmame nao enriquecidos, e dada pouca quantidade relativamente as necessidades da crians;a) sejam responsaveis pela elevada prevalencia da subnutris;ao aguda entre as crians;as de 12 a 15 meses em M09ambique. (perfis Distritais de Segurans;a Alimentar e Nutris;ao, 1999).
Outra distins;ao entre a subnutric;ao aguda e a subnutris;ao cr6nica e que as crianC;as que foram descritas pe1as maes como sendo "muito pequenas" it nascenc;a tinham uma prevalencia significativamente mais elevada de subnutris;iio aguda (42%) do que as crians;as que foram descritas como sendo "pequenas" ou "medias/grande it nascenva (7% e 8%, respectivamente).
Surpreendentemente, apenas 2% das crians;as cujas maes estavam gravidas na altura do inquerito sofriam de subnutris;ao aguda, enquanto que 9% dos mhos de maes que na~ estavam gravidas sofriam de subnutric;ao aguda. Como se notou com a subnutris;ao cr6nica, uma propors;ao mais elevada de crians;as
59
J
correctamente alimentadas sofriam de subnutriyao aguda quando comparadas com as crianyas incorrectamente alimentadas (9% vs. 5%). Provavelmente este aspecto podera ter que ver com a baixa qualidade da dieta dessas crianyas e com a baixa cobertura dos serviyos de saude, pelo que mais investigayao devera ser feita no que diz respeito a este assunto.
5.3 Caracteristicas Socioeconomicas e Demograficas da Subnutri\;30 Cronica
A Tabela 5.2 apresenta associayoes entre a subnutriyao cr6nica e factores socioecon6micos e demograficos. Alguns destes factores podem estar bastante relacionados entre si; por esta razao, os resultados devern ser interpretados com precauyao. Todavia, os resultados confirmam 0 papel essencial que a pobreza tern na determinayao do estado nutricional das crianyas Meyambicanas. As crianyas rurais tern uma preval<lncia de sUbnutriyao cr6nica significativamente mais elevada que as crianyas urbanas (39% vs. 27%). As crianyas na provincia e na cidade de Maputo sao as que menos sofrem de sUbnutriyao aguda (16% e 21 %) enquanto que mais de metade de todas as crian~as nas provincias de Niassa e Cabo Delgado, no Norte, sofrem de subnutriyao aguda. Provavelmente esta situayao tern a ver com as melhores condiyoes de vida e melhoria do acesso aos serviyos de saude na provincia e cidade de Maputo comparativamente as provincias atras referidas (IAF, 1998).
Como se pode ver na Tabela 5.2, h3. urn efeito preventivo no nivel de instruyao dos pais sobre a subnutriyao cr6nica. Isto e particularmente evidente em termos de instruyao materna. As crianyas cujas maes concluiram pelo menos 0 ensino secunctario t<lm urna prevalencia de sUbnutriyao aguda de 9% comparadamente com os quase 41 % entre filhos de maes analfabetas. Isto nao nao necessita de ser interpretado com precauyao ja que poucas maes concluiram 0 ensino secunctario ou urn ensino superior. A diferenya entre os filhos de mulheres analfabetas e de mulheres que concluiram 0 ensino primario nao e tao notavel (39% vs. 35%, respectivamente). Existe urn padrao semelhante no que diz respeito ao nivel de instruyao do companheiro, embora as diferenyas da subnutriyao cr6nica na~ sejam tao grandes (Tabela 5.2). Entre as crianyas cuja mae ou pai tinham uma actividade agricola, 0 nivel de subnutriyao cr6nica era de pelo menos 43%. Mais de urn quarto das crianyas cujos pais nao trabalhavam e sofriam de subnutriyao cr6nica. As crianyas com pais profissionais apresentam a prevalencia de subnutriyao cr6nica mais baixa, 0
que pode reflectir 0 facto dos seus pais terem instruyao e meios financeiros necessarios para mais facilmente satisfazerem as necessidades alimentares do agregado familiar. Tambem pode ser uma indicayao do facto dos pais profissionais geralmente residirem em areas urbanas, onde a prevaH~ncia da subnutriyao cr6nica e mais baixa.
N a tabela 5.2 sao apresentadas outras rela~i5es importantes entre a subnutriyao cr6nica e outros indicadores socioecon6micos. Por exemplo, a prevalencia da subnutriyao cr6nica entre as crianyas de ambientes mais pobres (44%) e quase 0 dobro da prevalencia entre as crianyas de ambientes socioecon6micos mais elevados (23%). As crianyas cujas farrulias nao tern acesso a uma sanita de descarga ou a uma latrina tern uma prevalencia de subnutri~ao cr6nica mais elevada do que as crianyas cujas fanu1ias tern esse tipo de acesso (40% vs. 32%). Tambem existe relayao entre as fontes de agua potavel e a subnutriyao cr6nica. Enquanto que boas instalayoes sanitarias e de agua podem indicar urn rendimento mais elevado, tern tambem urn impacto directo sobre 0 estado nutricional, ja que reduzem os niveis de doenyas infecciosas. Em locais onde a agua nao e facilmente disponivel, a higiene alimentar e muitas vezes inadequada. Quando 0 saneamento e pobre, h3. urn risco acrescido de contaminayao dos alimentos e da agua A percentagem de crianyas que sofrem de sUbnutriyao cr6nica nos agregados familiares com agua canalizada e significativamente mais baixa do que a percentagem entre as crianyas que bebem agua de peyos ou aguas superficiais (26% vs. 39% e 40%, respectivamente). Ha tambem uma diferen~a significativa na sUbnutriyao cr6nica entre as crian~as cujos lares tinham pisos polidos (21 %) e aquelas que tinham lares com pisos naturais ou rudimentares (41 % e 43%, respectivamente).
60
U rna propor\lao mais elevada de crian\las de agregados familiares chefiados por mulheres sofre de subnutri\lao cronica, em contraste com as crian\las de agregados familiares chefiados por homens (Tabela 5.2). A rela\lao entre 0 facto das mulheres serem as chefes de familia a subnutri\lao cronica infantil poderia ser justificada pelo facto dos agregados familiares chefiados por mulheres tenderem a ser mais pobres (Governo do MO\Iambique, 1998). autra explica\lao seria 0 facto da mulher que e a chefe de famflia ser a responsavel pela obten\lao de rendimentos e de outros recursos de forma a sustentar a sua familia. Consequentemente, pode haver menos tempo disponivel para se dedicar ao cuidado das crian\las.
As crian\las cujas maes tiveram contacto com varios dos meios de comunica\lao sofriam menos de subnutri\lao cronica que as crian\las cujas maes nunca tiveram qualquer contacto com os meios de comunica\lao. Como se pode ver na Tabela 5.2, sao observadas prevalencias mais baixas de subnutri\lao cronica para crian\las cujas maes viam televisao semanalmente (18%), ouviam radio diariamente (25 %) e liam jornais semanalmente (19%), comparando com as crian\las cujas maes nao viam televisao (38%), nao ouviamradio (41%) nem liamjornais (38%). Arela\lao entre 0 contacto com os meios de comunica\lao e a subnutri\lao cronica pode ser justificada por varios factores. a acesso a televisao ou 11 radio, em particular, e normalmente associado a prosperidade do agregado familiar, que por seu lado e associada positivamente ao estado nutricional da crianga. Do mesmo modo, as maes que leem 0 jornal sao claramente mais instruidas. Como foi referido anteriormente, a instru\lao da mae e associada a urn baixo mvel de subnutri\lao cronica. a contacto frequente com os meios de comunfca\lao pode tambem oferecer as maes informa\loes uteis sobre 0 cuidado, saude e nutri\lao da crian\la, e pode assim ser urn meio possivel para a mudan\la de comportamentos em Mogambique.
5.4 Caracteristicas Socioeconomicas e Demograficas da Subnutri\liio Aguda
As conclusoes em rela\lao 11 subnutri\lao aguda sao bastante diferentes daquelas para a subnutri\lao cr6nica (Tabela 5.2). Ao contrario da subnutri\lao cr6nica, os seguintes factores nao estao significativamente associados a subnutri\lao aguda: actividade profissional do pai, contacto com os meios de comunica\lao, sexo do chefe de familia, tipo de instala\lao sanitaria, fonte de agua potavel e principal material do piso. Contrariamente ao que e observado para a subnutri\lao cr6nica, as criangas urbanas possuem uma prevalencia significativamente mais elevada de subnutri\lao aguda do que as crian\las rurais. Como foi referido no Capitulo dois, esta observa\lao pode apontar para urn acesso limitado aos alimentos em consequencia de recentes redu\loes nos salarios em areas urbanas. Pode tambem reflectir incidencias mais elevadas de doen\las, como por exemplo diarreia e infec\loes respirat6rias em areas urbanas vs. areas rurais. No entanto, como acontece com a subnutri\lao cr6nica, Cabo Delgado possui a mais elevada preval<3ncia de subnutri\lao aguda (16%), apontando para esta provincia como uma area geografica prioritaria no que diz respeito a interven\loes nutricionais.
Ao contrario do que e observado para a subnutri\lao cr6nica, urn maior mvel de instru\lao da mae e associado a niveis de subnutri\lao aguda mais elevados. A prevalencia mais elevada de diarreia em areas urbanas pode contribuir para esta situa\lao. Do mesmo modo, 0 mvel educacional, ocupacional e socioeconomico das maes e geralmente mais elevado em areas urbanas (ver Apendice B). Esta conclusao devera ser interpretada com precau\lao, urna vez que se baseia em apenas 17 de 1I8 crian\las com condi\loes de subnutri\lao aguda com maes que conclufram 0 ensino secundario on superior.
Embora nao exista urn padrao evidente entre a subnutrigao aguda e urn numero elevado de crianllas nos agregados familiares, as crianllas de agregados familiares com cinco ou mais crianllas com menos de cinco anos possuem a mais elevada prevalencia de subnutrillao aguda (14%). Entre as crianllas cujos partos foram assistidos por medicos havia mais crianllas que sofriam de subnutrillao aguda (13%) do que entre as crianllas que foram assistidas por urna parteira tradicional (11 %), enfermeira-parteira auxiliar (7%) ou por outra pessoa ou mesmo por ninguem (8%). As explicalloes possfveis para esta observa\lao sao 0 facto dos partos de alto risco serem muitas vezes acompanhados por urn medico. A elevada
61
?ol
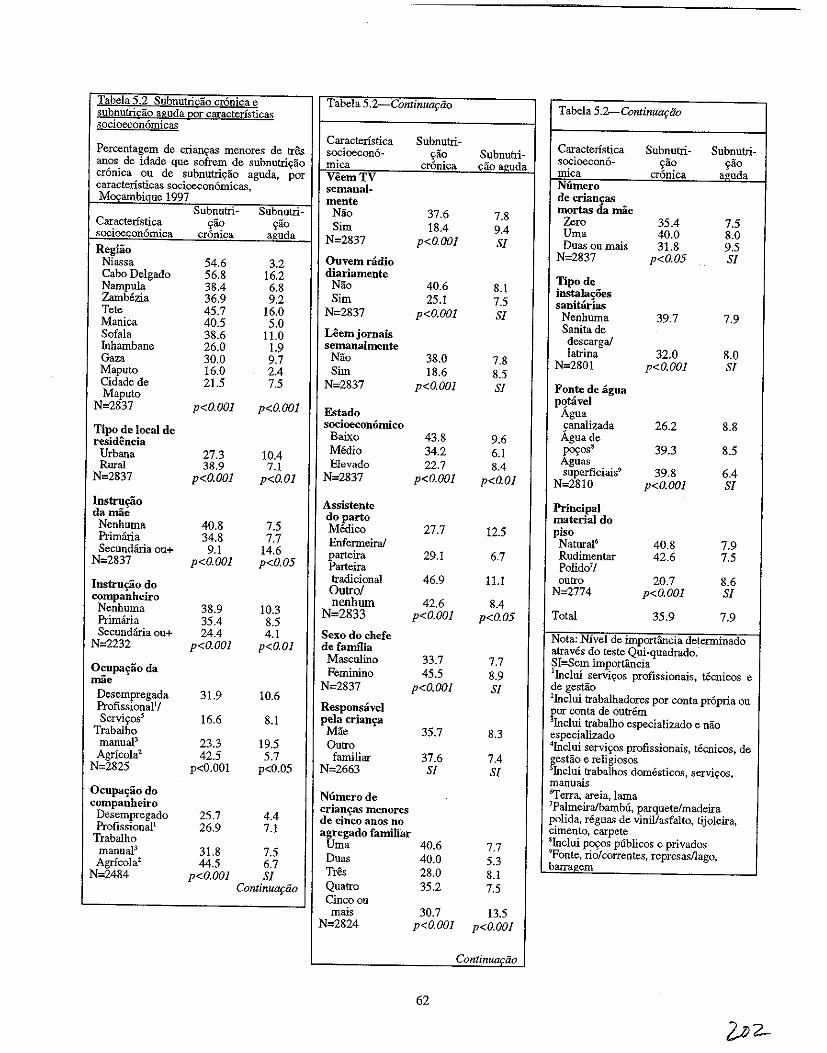
Tabela 5.2 Subnutridio cronica e subnutricao aguda par caracteristicas socioeconomicas
Percentagem de crianQas menores de tres anos de idade que sofrem de subnutriQao cr6nica ou de subnutriQao aguda, p~r caracteristicas socioecon6micas, Mocambiaue 1997
Caracteristica socioecon6mica Regiio
Niassa Cabo Delgado Nampula Zambezia Tete Manica Sofala fuhambane Gaza Maputo Cidade de Maputo
N=2837
Tipo de local de residencia
Urbana Rural
N=2837
Instrn£iio damae Nenhuma Primma Secundana ou+
N=2837
Instru£30 do companheiro Nenhuma Primana Secundana ou+
N=2232
Ocupa'r30da mae
Desempregada Profissional1J Servi~oss
Trabalho manual3 Agricolal
N=2825
Ocupa'r30do companheiro
Desempregado Profissionall
Trabalho manuaP Agricola2
N=2484
Subnutri~ao
cr6nica
54.6 56.8 38.4 36.9 45.7 40.5 38.6 26.0 30.0 16.0 21.5
p<O.OOl
27.3 38.9
p<O.OOl
40.8 34.8 9.1
p<O.OOl
38.9 35.4 24.4
p<O.OOl
31.9
16.6
23.3 42.5
p<O.OOI
25.7 26.9
31.8 44.5
p<O.OOl
Subnutri-~ao
aguda
3.2 16.2 6.8 9.2
16.0 5.0
11.0 1.9 9.7 2.4 7.5
p<O.OOl
10.4 7.1
p<O.Ol
7.5 7.7
14.6 p<O.OS
10.3 8.5 4.1
p<O.Ol
10.6
8.1
19.5 5.7
p<0.05
4.4 7.1
7.5 6.7 Sf
ContinuQfao
Tabela 5.2 ContinUOfiio
Caracteristica socioecon6~ mica VeemTV semanal· mente
Nao Sim
N=2837
Ouvemramo diariamente
Nao Sim
N=2837
Leem jornais semanalmente
Nao Sim
N=2837
Estado socioecon6rnico
Baixo MOdio Elevado
N=2837
Assistente doparto Medico Enfermeiral parteira Parteira tradicional Ontrol nenhum
N=2833
Sexo do chefe de fanu1ia
Masculino Feminino
N=2837
Responsavel pela crian'ra Mae Qulro familiar
N=2663
Subnutri~
~ao cronica
37.6 18.4
p<O.OOl
40.6 25.1
p<O.OOl
38.0 18.6
p<O.OOl
43.8 34.2 22.7
p<O.OOl
27.7
29.1
46.9
42.6 p<O.OOl
33.7 45.5
p<O.OOf
35.7
37.6 Sf
Numerode crian'.r3S menores de cinco anos no agregado familiar
Uma 40.6 Duas 40.0 Tres 28.0 Qualro 35.2 Cinco on mais
N=2824 30.7
p<O.OOI
62
SubnutriQiio a.uda
7.8 9.4 Sf
8.1 7.5 Sf
7.8 8.5 Sf
9.6 6.1 8.4
p<O.Ol
12.5
6.7
II.!
8.4 p<O.OS
7.7 8.9 Sf
8.3
7.4 Sf
7.7 5.3 8.1 7.5
13.5 p<O.OOf
Continuaciio
Tabela 5.b.-ContinUOftio
Caracteristica socioeconomica Numero de crian£as mortas da mae z"ro Uma Duas ou mais
N=2837
Tipode instala0es sanitarias Nenhuma Sanita de descarga/ latrina
N=2801
Fonte de agua p~tavel
Agua canalizada Aguade p~OS8 Aguas superficiais9
N=28 10
Principal material do piso
Natural6
Rudimentar Polido'l outro
N=2774
Total
Subnutri~ao
cr6nica
35.4 40.0 31.8
p<O.OS
39.7
32.0 p<O.OOf
26.2
39.3
39.8 p<O.OOl
40.8 42.6
20.7 p<O.OOl
35.9
Subnutri~lio
a;,uda
7.5 8.0 9.5 Sf
7.9
8.0 Sf
8.8
8.5
6.4 Sf
7.9 7.5
8.6 Sf
7.9
Nota: Nivel de importiincia determinado atraves do teste Qui~quadrado. SI=Sem importancia IInc1ui servi{:os profissionais, tecnicos e de gestao lInc1ui trabalhadores por conta propria ou por conta de outrem 3Inc1ui trabalho especializado e DaO especializado 4Inc1ui servi~os profissionais, tecnicos, de r,estao e religiosos Inc1ui trabalhos domesticos. servi~os,
manuais 6ferra. areia, lama 7Palmeira/bambu, parquete/madeira polida. regua<; de vinil/asfalto, tijoleira. cimento, carpete sInc1ui poyos publicos e privados 9Fonte, rio/correntes, represasllago, barra2:em
percentagem de subnutri9ao aguda entre as crian9as assistidas por uma parteira tradicional pode ser explicada pelo facto de serem assistidas por estas as mulheres mais pobres, que em geral vivem a uma longa dist1incia dos servi90s de saMe. E bastante provavel que estas mulheres tamMm estejam desnutridas, 0 que tern urn impacto negativo sobre 0 bem-estar do bebe e da crian9a.
5.5 Analise de Regressao Multidimensional
Recorrendo aos resultados das anilises bidimensionais (Tabelas 5.1 e 5.2), foi criado urn modelo de regressao logistico para explicar (a) a subnutri9ao cr6nica e (b) a subnutri9ao aguda em crian9as M09ambicanas com menos de tres anos (Ver Apendice G para uma explica9aO dos modelos de retrocesso logistico). Cada modelo calcula a probabilidade de ocorrencia de subnutrigao cr6nica ou da subnutrigao aguda conforme cada caracterfstica basica, ao mesmo tempo que verifica os efeitos de todas as outras caracteristicas basicas incluidas no modelo. Estimativas de risco relativo lfquido superior a 1.0 indicam que 0 risco de desnutrigao e superior aquele para a categoria referencial; estimativas inferiores a 1. 0 indicam que 0 risco de desnutri9ao e menor do que aquele para a categoria referencial.
Recorreu-se ao quadro da UNICEF para a desnutri9ao apresentado no Capitulo Dois (ver Figura 2.1) para construir os melhores modelos explicativos possiveis para as subnutrigoes cr6nica e aguda em crian9as M09ambicanas. As variaveis que possuem associagoes bidimensionais estatfsticamente significativas sao classificadas de acordo com 0 quadro da UNICEF da seguinte forma (a categoria referencial e apresentada em it:ilico):
CAUSAS BAsICAS: ESTRUTURA POLlTICA. ECONOMICA E IDEOLOGICA
Dados n[fo dispon{veis no lDSM de 1997
CAUSAS SOCIAlS E ECONOMICAS SUBJACENTES, BLOCO A
Residencia
• Regiao (Niassa, Cabo Delgado, Nampula, Zambezia, Tete, Manica, Sofala, Inhambane, Gaza, Maputo, cidade de Maputo)
• Residencia urbana-rural (urbana, rural)
Servi~os de Sande
Dados n[fo disponiveis no lDSM de 1997
Emprego
• Ocupa9ao da mae (desempregada, profissiona1/servi~os, agricola/manual) • Ocupa9ao do companheiro (desempregado, profissional, manual, agr(cola)
Agua, Saneamento
• Fontes de agua potavel (dgua canalizada, agua de P09os, aguas superficiais) • Instala~oes sanitarias (nenhumalarbusto, sanita de descarga/latrina)
63
CAUSAS SOCIAlS E ECONOMIC AS SUBJACENTES, BLOCO B
Bens do Agregado Familiar
• Posi~ao socioecon6mica (baixa, media, alta) • Contacto com os meios de comunica~ao (nenhum contacto, contacto com um ou mais meios)
Estado Civil
• Sexo do chefe de faIlll1ia (homem, mulher)
NOTA: Na sondagem ntio hd varia,tio suficiente no que diz respeito ao estado civil (soiteiro, presentemente casado, viuvo/divorciado/separado), Consequentemente, esta variavel e excluida da analise multidimensional.
Nivel de I nstru~ao
• Nivel de instru~lio da mlie (nenhum, ensino primario, secundario+) • Nivel de instru~ao do companheiro (nenhum, ensino primario, secundario+)
Disponibilidade de Alimentos
Dados nao disponiveis no IDSM de 1997
CAUSAS BIOLOGICAS E COMPORTAMENTAlS SUBJACENTES, BLOCO A
Distribui~lio de Alimentos no Agregado Familiar
Dados ntio disponiveis no IDSM de 1997
Vacina~ao, Cuidados de Saude
• • • •
Vacina~lio contra a BCG (nao, sim) Vacina\ilio contra 0 sarampo (nlio, sim) Assistente no parto (medico, en/ermeiraiparteira, parteira tradicional, outro/nenhum) Local do parto (casa, Unidade Sanitaria)
Fertilidade, Idade, Tempo, Assistencia Pre-natal, Estado de Saude da Mae
• • • • • • • • •
Idade da mile (15-19, 20-24,25-29, 30-34,35-49) Partos(1,2,3,4,5+) jndice de massa corporal da mae (<18.5, 18.5-24.99,25.0+) N(imero de consultas pre-natais (nenhuma, 1-3,4+) A~sistencia pre-natal (medico, en/ermeiraiparteira, parteira tradicional, outro/nenhum) Espa\iamento entre os nascimentos (9-23, 24-35,36+ meses) Ordemde nascimento (1,2-3,4-5,6+) Idade da crian~a (0-5,6-9, 10-11, 12-15, 16-19,20-23,24+ meses) Tamanho calculado it nascen\ia (medio/grande, pequeno/muito pequeno)
64
CAUSAS BIOLOGICAS E COMPORTAMENTAIS SUBJACENTES. BLOCO B
Padroes Alimentares
• Pnlticas de alimenta<;:ao do beb&crian<;:a segundo a idade (alimentar;iio incorrecta, alimenta<;:ao correcta)
Comportamento de Higiene
Dados ntio dispon£veis no IDSM de 1997
Cuidado da Criant;a
• Responsavel principal pela crian<;:a (familiar, outro individuo)
CAUSAS IMEDIATAS
Ingestiio Alimentar Inadequada
Dados niio dispon£veis no IDSM de 1997
Doent;a
• Diarreia nas duas iiltimas semanas (ntio, sim)
Como foi referido acima, niio lui dados disponfveis para alguns dos componentes do quadro, nomeadamente "Estrutura Politica, Econ6mica e IdeoI6gica", "Servi\ios de SaUde", "Disponibilidade de Alimentos", "Distribui<;:ao de Alimentos no Agregado Familiar" e "Comportamento Higienfco". Ha tamMm algumas vari:iveis para as quais estao disponfveis dados mas que mesmo assim foram excluidas. Devido a elevada percentagem de mulheres presentemente casadas na amostra (88%, ver Apendice B), 0
efeito do estado civil da mae sobre a desnutriyllo infantil nlio foi analisado na aniilise multidimensional. No entanto, e atraves do sexo do chefe de faIllllia que se avalia se 0 agregado familiar e composto por uma uniao por co-habita\ilio. Devido a baixa prevaIencia de nascimentos multiplos na amostra (2%) tamMm niio e avaliado 0 sen efeito sobre a desnutri\iao infantil na analise multidimensional. 0 baixo peso a nascenlia e algumas variaveis da aIimentaliaO dos bebes, como por exemplo as raz6es para 0 desmame e a dura\iao da amamentaliao, tamhem sao excluidas da analise. As grandes quantidades de dados em falta para estas variaveis t/lm como consequ/lncia uma amostra de pequena amplitude, reduzindo assim 0 poder estatistico das aoalises multidimensionais.
De modo a obter 0 melhor modelo possivel para a subnutrililio cr6uica infantil em MOIiambique, cada nfvel do quadro - "Causas Sociais e Econ6micas Subjacentes (Bloco A)", "Causas Sociais e Econ6micas Subjacentes (Bloco B)", "Causas Biol6gicas e Comportamentais Subjacentes" (Bloco A)", "Causas Biol6gicas e Comportamentais Subjacentes" (Bloco B)" e "Causas Imediatas" - foi considerado em separado. Isto e, foram criados modelos de regressao separados para cada nfvel do quadro de modo a identificar 0 conjunto de variilveis que melhor representa cada componente do quadro. Urn modelo final resultou da cria\ilio de urn modelo composto de variaveis de cada nfvel que comp5em 0 quadro conceptual da UNICEF.
5.6 Factores de Risco para a Subnutri.;1io Cronica
Na analise multidimensional, os seguintes factores foram estatisticamente significativos referentes a subnutri\iao cr6nica em crian\ias MOIiambicanas:
65
• Local de residencia
• Ocup~ao da mae
• Fonte de agua potavel
• Estado socioecon6mico
• Contacto com os meios de comunica<;ao
• Sexo do chefe da fanu1ia
• Local do parto da criauc;a
• Partos
• Idade da crian<;a
• Ordem de nascimento
• Tamanho calculado a nasce~a
• Indice de massa corporal da mae
• Diarreia durante as duas semanas anteriores
As crian<;as que residem em Niassa, Cabo Delgado, Tete e Sofala apresentam riscos
significativamente mais elevados de subnutri<;ao cr6nica quando comparadas com as crian<;as na cidade
de Maputo (Tabela 5.3). 0 risco de subnutri<;1io cr6nica e mais elevado em Niassa, onde as crian<;as tern
duas vezes e meia mais probabilidades de softerem de subnutri<;lio cr6nica do que as crian<;as na cidade
de Maputo. A ocupa<;lio da mae tern urn efeito preventivo sobre 0 risco de subnutri<;lio cr6nica, ja que as
crian<;as com maes profissionais tern quase metade do risco do que as com maes que trabalham na
agricultura. Crianlias com maes desempregadas tern urn terlio do risco de virem a sofrer de subnutri<;ao
cr6nica. Isto podera dever -se ao facto das maes que nao trabalham pertencerem a familias com urn mais
elevado rendimento e terem mais tempo disponivel para cuidar da crian<;a, 0 que contribui para urn
melhor estado nutricional e de saude (melhores cuidados diminuiliao do risco das doen<;as infecciosas e
parasitarias), contudo estes aspectos precisam de ser melhor investigados.As crian<;as cujas famflias
obtem agua potavel de poc;os tern urn risco de subnutri<;ao cr6nica 26% mais elevado, comparadas com as
crian<;as com acesso a agua potavel canalizada. Devido ao facto da subnutri<;ao cr6nica ser mais
predominante em areas rurais e dessas areas possuirem uma maior propor<;ao de utiliz~ao de agua de
poc;os (ver Apendice B), a conclusao anterior e esperada. As crian<;as nascidas em casa tern mais 25% de
probabilidades de virem a softer de subnutri<;ao cr6nica do que as crian<;as que nasceram em institui<;6es
Sanitarias. E provavel que esta situac;ao esteja intimamente ligada ao estado socioecon6mico. A pobreza
aurnenta 0 risco de subnutri<;ao cr6nica, visto que as crian<;as de ambientes socioecon6micos baixos ou
medios tern urn risco acrescido de 35% a 40% relativamente as cria~as de ambientes socioecon6micos
elevados. As crian<;as com maes que nao estavam em contacto com os meios de comunica<;ao tinham
mais 26% de probabilidade de virem a sofrer de subnutri<;ao LT6nica em rela<;ao as com crian<;as com
maes que estavam em contacto com os meios de comunica<;1io. Do mesmo modo, as crian<;as de
agregados familiares chefiados por urna mulher, que tamb6m tendem a ser pobres e sao rurais, tern mais
40% de probabilidades de virem a softer de subnutri<;ao cr6nica do que as crian<;as de agregados
familiares chefiados por urn homem; sublinhando assim a necessidade de politicas e programas
direccionados aqueles agregados familiares pobres e chefiados por mulheres. Crian<;as subnutridas tern
tambem miles subnutridas; crian<;as cujas maes apresentavam urn IMC menor que 18.5 tinham quase 0
dobro de probabilidade de virem a sofrer de subnutri<;lio cr6nica comparativamente as crian<;as cujas maes
apresentavam IMC mais elevado. As crian<;as cujas maes apresentavam urn IMC entre 18.5 e 24.9 tinham
quase mais de 50% de probabilidades de virem a sofrer de subnutri<;ao cr6nica comparativamente as
crian<;as cujas maes apresentavam os IMC mais elevados.
66
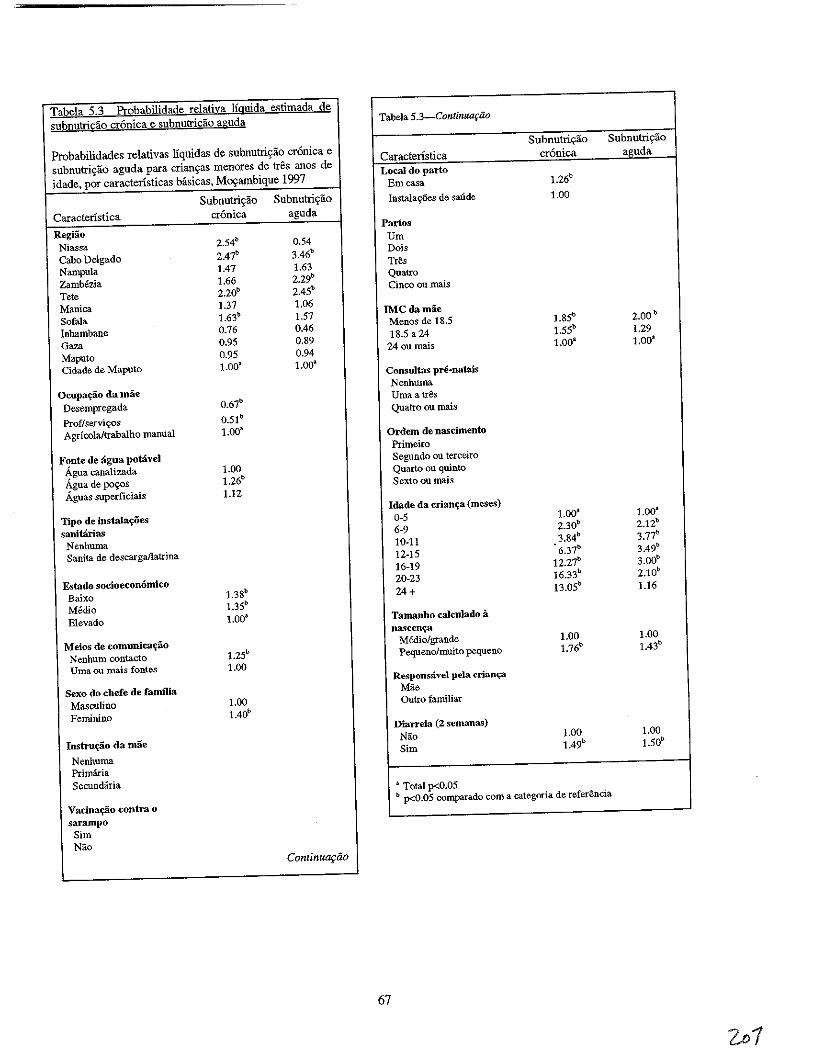
Tabela ;2-3 Probabilidade relativa lfguida estimada de
subnutricao cr6nica e subnutricao aguda Tabela 5.3_Continua~iio
Probabilidades relativas Ifquidas de subnutri~ao cr6nica e
subnutri~a:o aguda para criantyas menares de tres anos de
idade. por caractensticas basicas, M~ambique 1997
Subnutriyao SUbnutriyao
Caracteristica cr6nica aguda
Local do parto Emcasa 1.26b
Subnutri,iio Subnutris:ao InstalayOes de saude 1.00
Caracteristica cronica aguda
RegHio Niassa 2.54b 0.54
Panos Urn
Cabo Delgado 2.47b 3.46b
Nampula 1.47 1.63
Zambezia 1.66 2.29b
Tete 2.20b 2.4Sb
Dois TrSs Quatro Cinco ou mais
Manica 1.37 1.06
Sofala 1.63b 1.57
Inhambane 0.76 0.46
Gaza 0.95 0.89
Maputo 0.95 0.94
IMCdamae Menos de 18.5 1.8Sb 2.00b
18.5 a 24 1.SSb 1.29
24 ou mais 1.00a 1.00a
Cidade de Maputo 1.00~ 1.003
Consultas pre·natais
Ocupa~ao da mae Desempregada O.67b
Proflservivos O.51 b
Nenhuma Umaatr& Quatro au mais
Agricoialtrabalho manual I.DOa Ordern de nascimento
F?nte de agua potaveJ Agua canalizada 1.00
Agua de po~os 1.26b
Aguas superficiais 1.12
Primeiro Segundo au terceiro Quarto ou quinto Sexto ou mais
Tipo de instala'r0es
sanitarias Nenhuma Sanita de descarga/latrina
Idade da crianlj;a (meses)
0-5 1.00a 1.00a
6-9 230b 2.12b
10-11 3.84b 3.77b
12-15 6.37b 3.49b
16-19 12.27b 3.00b
Estado socioeconomico 20-23 16.33b 2.10b
Baixo 1.38b 24+ 13.0Sb 1.16
Medio 1.3Sb
Elevado 1.00a Tamanho caJculado a nascenCj3
Meios de comunica~ao Nenhum contacto 1.2Sb
Medio/grande 1.00 1.00
Pequeno/mnito pequeno 1.76b 1.43b
Vma ou mais fontes 1.00
Sexo do chefe de familia Responsavel pela crian~
Mae
Masculino 1.00 Outro familiar
Feminino 1.40b
Diarreia (2 semanas)
Instru~o da mae
Nenhuma
Nao 1.00 1.00
Sim 1.49b 1.50b
Primaria Secundaria
Vacinafilio contra 0
a Total p<O.05 b p<O.05 comparado com a categoria de referSncia
sarampo Sim Nao
Continut1fiio
67
A subnutrivao cr6nica e urn processo acumulativo que ocorre ap6s vanos epis6dios individuais de priva«ao nutricional elou doen9a; 0 risco de subnutri9ao cr6nica aumenta nipidamente com a idade. Em geral, as crian«as entre os 0 e os 5 meses apresentam urn menor risco de subnutri9ao cr6nica; no entanto, a subnutri«ao cr6nica parece ser mais problematica depois do primeiro ano de vida: 0 risco vai de seis a dezasseis vezes a popula«ao referencial, atingindo 0 ponto maximo aos 20-23 meses. 0 aurnento dramatico com a idade reflecte nos efeitos acurnulativos de doen«as recorrentes, ingest1lo inadequada de nutrientes e principalmente 0 seu efeito interactivo negativo durante este periodo critico de desenvolvimento da crian«a. As idades mais avan9adas, que apresentam as taxas de subnutri«ao cr6nica mais elevadas sao tamMm as idades onde a prevalencia de doenc;:as diarreicas e relativamente elevada em compara«ao com a prevalencia de diarreia entre os bebes mais novos. Em M09ambique, a diarreia durante as duas semanas anteriores e associada a urn risco de subnutri9ao cr6nica acrescido de 50%. Embora a subnutri9ao cr6nica reflicta uma desnutri«ao ou uma doen«a prolongada, crises recorrentes de diarreia podem ter urn efeito acumulativo sobre a desnutri«lio infantil.
A Tabela 5.3 indica ainda que as crian«as que foram descritas pelas mlies como sendo pequenas ou muito pequenas it nascen«a tern mais 75% de probabilidades do que as crian9as medias ou grandes de softerem de subnutri«lio cr6nica (Ricci et al.,1996).
5.7 Factores de Risco para a Subnutri9ao Aguda
Ao contrario do modelo para a subnutri«lio cr6nica, 0 modelo que foi criado para a subnutri«ao aguda tern urn poder de previslio limitado. Como se v(\ mais abaixo, 0 quadro da UNICEF para a desnutri9lio identifica urn numero mais pequeno de factores de subnutri9lio aguda estatisticamente significativos em compara«lio com a subnutri9ao cr6nica, 0 que pode reflectir as dificuldades de estudar urn fen6meno agudo como e a subnutri9lio aguda. Alguns dos factores para os quais nlio estlio disporuveis quaisquer dados, i.e. a disponibilidade de alimentos e 0 comportamento higienico, podem preyer a subnutri«ao aguda infantil. Todavia, com base no IDSM de 1997, as seguintes variaveis slio factores estatisticamente significativos da subnutri«lio aguda infantil em M09ambique:
• Regiao de residencia • Idade da crian«a • Tamanho calculado it nascen«a • Indice de massa corporal da mae • Diarreia durante as duas semanas anteriores
Salientam-se trils provincias devido aos seus elevados riscos elevados de subnutri9ao aguda infantil em compara«ao com as crian«as na cidade de Maputo: Cabo Delgado, ZamMzia e Tete. Convem notar que a provincia da Zambezia tambem apresenta a mais elevada propor91io de crian«as que softeram de diarreia durante as duas semanas anteriores ao inquerito (ver Capitulo Quatro). 0 risco de subnutri9ao aguda e mais elevado em Cabo Delgado, onde as crian9as tern trils vezes e meia mais probabilidades de virem a softer de subnutri9ao aguda do que as crian9as da cidade de Maputo. Deste modo, mesmo quando slio considerados os factores socioecon6micos, biol6gicos e de saude, Cabo Delgado salienta-se como uma area de alto risco no que diz respeito it desnutri«ao infantil.
o risco de subnutrigao aguda aurnenta com a idade da crian9a, e h:i urn aumento notavel ap6s 0 sexto mils de vida, altura em que 0 risco aumenta duas vezes, 0 risco para crian9as dos 0-5 meses de idade, para quatro vezes. A Tabela 5.3 indica que as crian9as com 10 ou 19 meses apresentam entre trils e quatro vezes mais probabilidades de virem a softer de subnutri9lio aguda do que os bebes de 0-5 meses. Tendo em conta os padr6es alimentares das crian9as M09ambicanas que foram descritos, esta conclusao nao e surpreendente. TamMm se pode salientar que este padrlio reflecte vagamente 0 padrlio da diarreia, que aumenta nlpidamente dos 2 aos 15 meses de vida (ver Capitulo Quatro). As crian9as que softeram de diarreia durante as duas semanas anteriores apresentaram urn risco acrescido em mais de 50%, de virem a
68
softer de subnutrigao aguda relativamente as criangas que nao tinham tido nenhuma crise de diarreia. Por fim, a percepgao da mae relativa ao tamanho do beM a nascenga estava significativamente ligada a subnutrigao aguda, tendo os beMs das categorias pequeno e muito pequeno quase 50% mais de probabilidades de virem a sofrer de subnutrigao aguda do que os beMs descritos pelas maes como tendo nascido medios ou grandes, na altura do inquerito.
Em geral, os resultados das amilises multidimensionais sobre as subnutrigoes cr6nica e aguda em MOVambique vern a conf'rrmar as conclusoes de estndos semelhantes em outros contextos (Kikafunda et a!., 1998; Islam et ai., 1994; EI Samani et al., 1988). No entanto, deve-se notar que outros estndos tamMm se basearam em padroes adicionais como por exemplo a circunferencia do bra90 e 0 baixo peso como indicadores da desnutrigao. A subnutrigao aguda nao e urn indicador comum de estndos publicados, provave1mente devido as dificuldades no estndo desta doenga aguda. Todavia, investigagoes anteriores identificaram varios factores socioecon6micos como estando relacionados com a desnutri9lio infantil e tamMm salientaram a importancia do nive1 de instrugao e estado nutricional das maes para a determinagao do risco dos resultados nutricionais adversos sobre as criangas (IAP,1997).
5.8 Resumo
Muitos dos factores da subnutri9ao cr6nica e aguda slio de natnreza socioecon6mica, refiectindo 0 papel que 0 agravamento das condig6es sociais e econ6micas tern tido sobre 0 estado nutricional das criaugas em Movambique. Ha tamMm urn grande mimero de factores biol6gicos tais como a idade, ordem de nascimento e tamanho ca1culado a nascenga pela mae que estao significativamente relacionados com a desnutri9ao infantil. Estes factores podem ser importantes em relagiio as praticas alimentares dos beMs, ja que podem ser mais facilmente adaptados a intervengoes a curto prazo em relagao aos factores socioecon6micos. Com os dados disponiveis a capacidade para explicar a subnutrigao aguda ainda e limitada 0 que mostra a necessidade de recolher informagoes que sejam indicadores sensfveis e determinantes do estado nutricional.
5.9 Recomenda~oes
A sitnagao nutricional da crianga esta directamente relacionada com a seguranga alimentar. Intervengoes na area de seguranga alimentar devem ser implementadas tendo em conta os aspectos de disponibilidade, acesso e utilizagao. Neste contexto algumas das contribuigoes do Ministerio da SaMe para a garantia da seguranga alimentar e nutrigao sao a seguir apresentadas.
Monitorizariio do Crescimento e vigilancia nutricional
• Melhorar e fortalecer a monitorizagao do crescimento e a vigilancia nutricional, vacinagao, na consulta de controle da crianga sadia de modo a identificar oportunamente as crianyas com problemas nutricionais.
Controlo da Diarreia
• De forma a reduzir 0 grau de esgotamento nutricional nas criangas, melhorar 0 controlo da diarreia a nivel das actividades registadas de saude, da comunidade e do agregado familiar.
• Melhorar 0 acesso 11 SRO na comunidade.
• Instruir as maes e outros assistentes para a utilizayao apropriada da SRO, bern como quanta a ingestao apropriada de Ifquidos e s6lidos durante a doenga.
69
Disponibilidade de Alimentos
• Garantir a seguranga na posse da terra de modo a qne os camponeses e agricnltores privados, se sintam estimulados a melhorar e diversificar a produgao de uma forma sustentiivel.
• Estabelecer urn mecanismo de fornecimento de insumos produtivos necessarios e tambem a compra do excedente da produgao.
• Promover a transferencia de tecnologias aos agricultores para favorecer 0 aurnento da produgao e da produtividade e reduzir as perdas p6s colheita.
• Estabelecer urn sistema de erectito rural capaz de apoiar as actividades de comercializagao pelos produtores e comerciantes de pequena e media escala (tomando em considera9ao as necessidades da mulher camponesa).
• Permitir a importa9ao de produtos de primeira necessidade que 0 pais nao e capaz de produzir para garantir a cobertura das necessidades internas.
• Ensinar os agricultores metodos de conserva9ao de alimentos e de armazenamento prolongado de sementes.
• Continuar com 0 estudo da possihiJidade de criar urn sistema de manutengao de stocks alimentares de reserva aos niveis distrital, provincial e nacional.
• Investigar e promover os mecanismos comunitarios de auto gestao de calamidades e protecgao social.
• Fortalecer os servi90s de assistencia social, para as populagoes vivendo em areas vulneraveis.
o Bem-estar das Mulheres
• Devido it relagao negativa entre urn baixo nivel de instrugao da mae e os resultados nutricionais adversos da erianga, alargar as oportunidades educacionais para as meninas e empregar mecanismos para manter as raparigas na escola durante pelo menos 0 ensino secundario.
• Vigiar 0 estado nutricional e de saude das raparigas e das mulheres.
• Alargar os beneffcios sociais, econ6micos e de saMe aos agregados familiares chefiados por mulheres.
Promo,iio da Saude e Preven,iio de Doen,as
• Promover comportamentos relativos a alimentagao e de cnidado da crianga sauctaveis e apropriados para a idade, especialmente durante os dois primeiros anos de vida.
• Alargar 0 acesso a agua potiivel e melhorar a sitna9ao do saneamento do meio de forma a prevenir a exposigao a elementos patogenicos responsaveis pela diarreia e outras doengas contagiosas.
Alvos Geogrdficos
• Identificar as causas subjacentes a desnutrigao infantil em provfncias de risco como por exemplo Cabo Delgado, Niassa, Sofala e Tete, e planear intervengoes conforme as circunstancias.
70
• Desenvolver actividades de preven9ao e de tratamento da diarreia na Zambezia, onde a prevalencia da diarreia e da subnutri<;ao aguda e uma das mais elevadas do pais.
Investigl19do
• Promover a investiga9ao com 0 objectiv~ de compreender melhor os factores da subnutri9ao materna einfantil.
71
VI
CAPITULO 6
ESTADO NUTRICIONAL DAS MULHERES
o estado nutricional das mulheres antes da concepgao e durante a gravidez e um indicador importante da saMe geral das mulheres. E tambem um indicador que ajuda a preyer os resultados da sande da mae e do beM. Uma ingestao alimentar inadequada, doengas infecciosas tal como a malaria, e os custos nutricionais elevados associados a gravidez e a amamentagao tornam as mulheres nos pafses em vias de desenvolvimento bastante susceptiveis a desnntrigao e as deficiencias devido a micronutrientes tais como a anemia (OMS, 1992a; OMS, 1991; Liljestrand et al., 1986). Um mau estado nutricional da mae acaba muitas vezes por ter resultados adversos sobre a gravidez como por exemplo 0 baixo peso a nascenga (BPN) e a mortalidade perinatal (Mavalankar et al., 1992; OMS, 1992a; OMS, 1992b; Krasovec, 1991).
E importante examinar a extensao e a correlagao do pobre estado nntricional materna e em seguida, identificar 0 modo sobre como melhorar os resultados nutricionais e de sande das maes e das suas criangas. Este capitulo apresenta conclusoes dos dados antropometricos sobre as mulheres Mogambicanas que na altura da entrevista tinham pelo menos uma crianga com menos de tres anos.
6.1 Antecedentes
o valor nutricional da gravidez e de aproximadamente 85,000 kcal. Este nnmero parte do principio que as mulheres iraQ armazenar 35,000 kcal para 0 aleitamento (Hytten, 1980). Investigagoes recentes sugerem que 0 valor energetico da gravidez esta mais proximo dos 55,000 kcal (1M, 1990). Todavia, as Necessidades Alimentares Recomendadas nos EUA sugerem que as mulheres gravidas consumam mais 300 kcal por dia durante 0 sen segundo e terceiro trimestre com base na estimativa de Hytten. As Necessidades Alimentares Recomendadas nos EUA aconselham tambem que as mulheres a amamentar consumam mais 300 kcal por dia. Estas quilocalorias adicionais devem ser consumidas para aMm da ingestao alimentar normal de uma mulher de modo a manter 0 balango energetico. As mulheres que estavam bem nutridas antes da gravidez estao geralmente preparadas para lidar com as exigencias adicionais do aleitamento; no entanto, as mulheres a amamentar que estao malnutridas necessitam de uma ingestao cal6rica diaria ainda mais elevada do que as mulheres bem nutridas (Krasovec, 1991). Infelizmente, as mulheres em paises em vias de desenvolvimento raramente conseguem atingir este objectiv~. Apesar das exigencias nutricionais das mulheres a amamentar nos paises em vias de desenvolvimento, os beneficios da amamentagao prolongada ligados a reduglio da fertilidade e it sande da crianga provavelmente ultrapassam 0 risco do esgotamento da mae devido a pnltica da amamentagao (Huffman, 1991).
o aumento das eXlgenclas energeticas durante a gravidez sao necessarias para promover 0
crescimento e 0 desenvolvimento saudilvel do feto. Os pafses com niveis elevados de desnutrigao ou deficiencias em micronutrientes nas mulheres tendem tambem a ter grandes proporgoes de bebes que nascem com baixo peso a nascenga (BPN) (Mavalankar et aI., 1992; OMS, I 992a; OMS, 1992b; Krasovec, 1991; Labbo\(, 1991; Kramer, 1987; Liljestrand et ai., 1986). Consequentemente, 0 BPN e muitas vezes usado como uma indicagao indirecta do estado nutricional da mae.
Em paises menos desenvolvidos, 0 crescimento intra-uterin~ retardado (CIUR) e a causa mais comum do BPN. 0 CIUR, que e uma consequencia de um mau estado nutricional materno, aumenta 0
risco de mortalidade perinatal (mortes entre a 22' semana de gestagao e a primeira semana de vida) e de mortalidade durante a infancia (OMS, 1996; Berendes, 1993; Kessel et al., 1985; Villar e Belizan, 1982; Llewellyn-Jones, 1965). Os factores nutricionais por si so sao responsaveis por mais de metade das diferengas entre os pafses industrializados e os paises menos desenvolvidos no que diz respeito ao CIUR
73
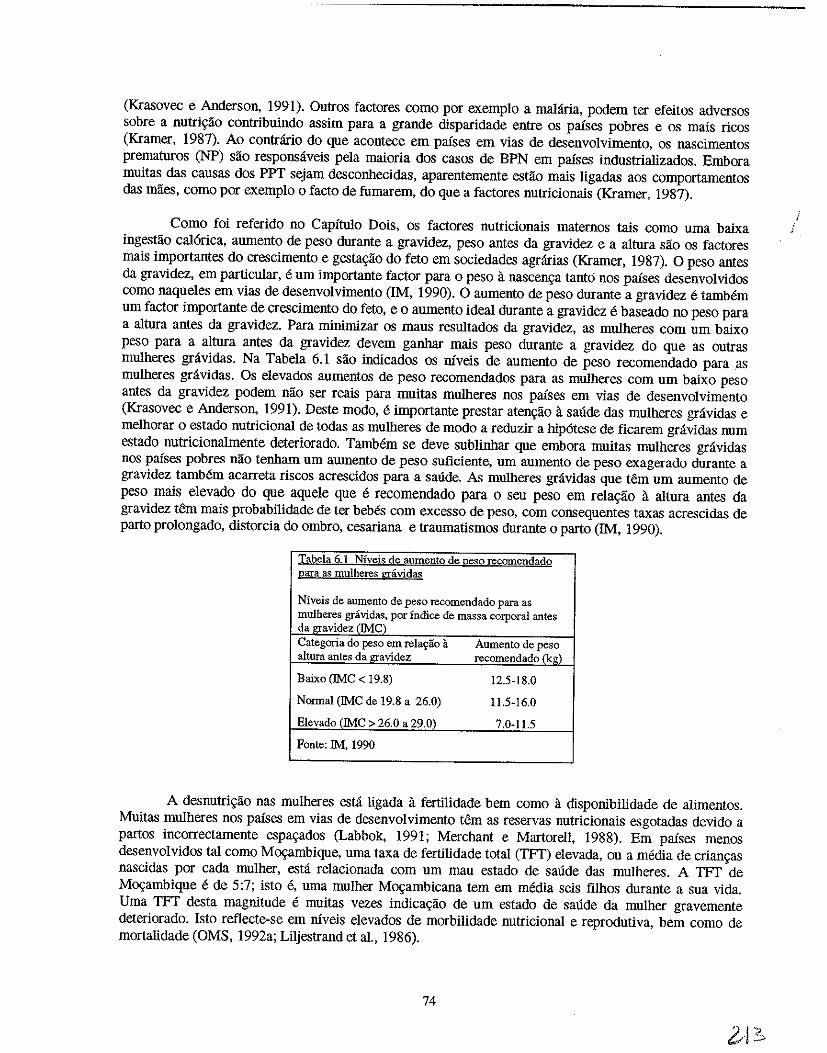
(Krasovec e Anderson, 1991), Outros factores como por exemplo a malaria, podem ter efeitos adversos sobre a nutri<;:ao contribuindo assim para a grande disparidade entre os paises pobres e os mais ricos (Kramer, 1987), Ao contrario do que acontece em paises em vias de desenvolvimento, os nascimentos prematuros (NP) sao responsaveis pela maioria dos casos de BPN em paises industrializados, Embora muitas das causas dos PPT sejam desconhecidas, aparentemente estao mais ligadas aos comportamentos das maes, como par exemplo 0 facto de fumarem, do que a factores nutricionais (Kramer, 1987).
Como foi referido no Capitulo Dois, os factores nutricionais maternos tais como uma baixa ingestao cal6rica, aumento de peso durante a gravidez, peso antes da gravidez e a altura sao os factores mais importantes do crescimento e gesta<;:ao do feto em sociedades agrarias (Kramer, 1987). 0 peso antes da gravidez, em particular, e urn importante factor para 0 peso it nascen<;:a tanto nos paises desenvolvidos como naqueles em vias de desenvolvimento (1M, 1990). 0 aumento de peso durante a gravidez e tambem urn factor importante de crescimento do feto, eo aumento ideal durante a gravidez e baseado no peso para a altura antes da gravidez. Para minimizar os maus resultados da gravidez, as mulheres com urn baixo peso para a altura antes da gravidez devem ganhar mais peso durante a gravidez do que as outras mulheres gravidas. Na Tabela 6.1 sao indicados os niveis de aumento .de peso recomendado para as mulheres gravidas. Os elevados aumentos de peso recomendados para as mulheres com urn baixo peso antes da gravidez podem nao ser reais para muitas mulheres nos paises em vias de desenvolvimento (Krasovec e Anderson, 1991). Oeste modo, e importante prestar atengao a saude das mulheres gravidas e melhorar 0 estado nutricional de todas as mulheres de modo a reduzir a hip6tese de ficarem gravidas num estado nutricionalmente deteriorado. TamMm se deve sublinhar que embora muitas mulheres gravidas nos paises pobres nao tenham urn aumento de peso suficiente, urn aumento de peso exagerado durante a gravidez tamMm acarreta riscos acrescidos para a saude. As mulheres gravidas que tern urn aumento de peso mais elevado do que aquele que e recomendado para 0 seu peso em rela<;:ao it altura antes da gravidez tern mais probabilidade de ter beMs com excesso de peso, com consequentes taxas acrescidas de parto prolongado, distorcia do ombro, cesariana e traumatismos durante 0 parto (1M, 1990).
Tabela 6.1 Nfveis de aumegto de 12eso recomendado ~aTa as mulheres gravidas
Niveis de aumento de peso recomendado para as mulberes gravidas, por indice de massa corporal antes da gravidez (IMC) Categoria do peso em rela~ao a Aumento de peso altura antes da gravidez recomendade(kg)
Baixo (IMe < 19.8) 12.5-18.0
Normal (IMe de 19.8 a 26.0) 11.5-16.0
Elevado (IMe > 26.0 a 29.0) 7.0-11.5
Fonte: 1M, 1990
A desnutri<;:ao nas mulheres esta ligada it fertilidade bern como a disponibilidade de alimentos. Muitas mulheres nos paises em vias de desenvolvimento tern as reservas nutricionais esgotadas devido a partos incorrectamente espa<;:ados (Labbok, 1991; Merchant e Martorell, 1988). Em paises menos desenvolvidos tal como M09ambique, uma taxa de fertilidade total (TFT) elevada, ou a media de crian<;:as nascidas por cada mulher, esta relacionada com urn mau estado de saude das mulheres. A TFT de M09ambique e de 5:7; isto e, uma mulher M09ambicana tern em media seis filhos durante a sua vida. Uma TFT desta magnitude e muitas vezes indica<;:ao de urn estado de saude da mulher gravemente deteriorado. Isto reflecte-se em niveis elevados de morbilidade nutricional e reprodutiva, bern como de mortaIidade (OMS, 1992a; Liljestrand et al., 1986).
74
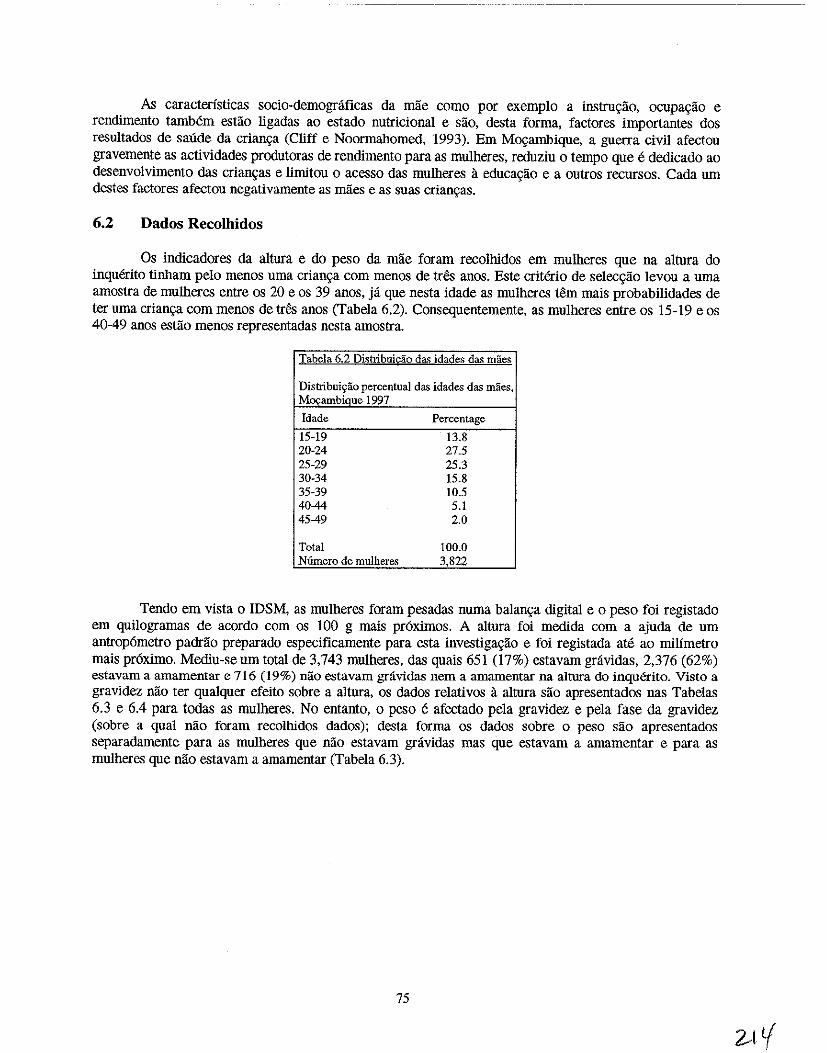
As caracteristicas socio-demognificas da mlie como por exemplo a instru\ilio, OCUpa\ilio e rendimento tambem estlio ligadas ao estado nutricional e slio, desta forma, factores importantes dos resultados de saude da crian9a (Cliff e Noormabomed, 1993), Em Movambique, a guerra civil afectou gravemente as actividades produtoras de rendimento para as mulheres, reduziu 0 tempo que e dedicado ao desenvolvimento das crian\(as e limitou 0 acesso das muIheres a educa\ilio e a outros recursos. Cada urn destes factores afectou negativamente as mlies e as suas crian9as.
6.2 Dados Recolhidos
Os indicadores da altura e do peso da mlie foram recolhidos em mulheres que na altura do inquerito tinham pelo menos uma crian\ia com menos de tres anos. Este criterio de selec\ilio levou a urna amostra de muIheres entre os 20 e os 39 anos, ja que nesta idade as mulheres tern mais probabilidades de ter urna crian\ia com menos de tres anos (Tabela 6.2). Consequentemente, as mulheres entre os 15-19 e os 40-49 anOS estlio menos representadas nesta amostra.
Tabela 6.2 Distribuicao da<; idades das maes
Distribui~ao percentual das idades das miles, M",ambique 1997
[dade Percentage
15-19 13.8 20-24 27.5 25-29 25.3 30-34 15.8 35-39 10.5 40-44 5.1 45-49 2.0
Total 100.0 N6mero de mulheres 3,822
Tendo em vista 0 IDSM, as mulheres foram pesadas nurna balan\(a digital e 0 peso foi registado em quilogramas de acordo com os 100 g mais pr6ximos. A altura foi medida com a ajuda de urn antrop6metro padrlio preparado especificamente para esta investiga\ilio e foi registada ate ao milimetro mais pr6ximo. Mediu-seum total de 3,743 mulheres, das quais 651 (17%) estavam gravidas, 2,376 (62%) estavam a amamentar e 716 (19%) nao estavam gravidas nem a amamentar na altura do inquerito. Visto a gravidez nao ter qUalquer efeito sobre a altura, os dados relativos a altura sao apresentados nas Tabelas 6.3 e 6.4 para todas as mulheres. No entanto, 0 peso e afectado pela gravidez e pela fase da gravidez (sobre a qual nao foram recolhidos dados); desta forma os dados sobre 0 peso sao apresentados separadamente para as mulheres que nao estavam gravidas mas que estavam a amamentar e para as mulheres que nao estavam a amamentar (Tabela 6.3).
75
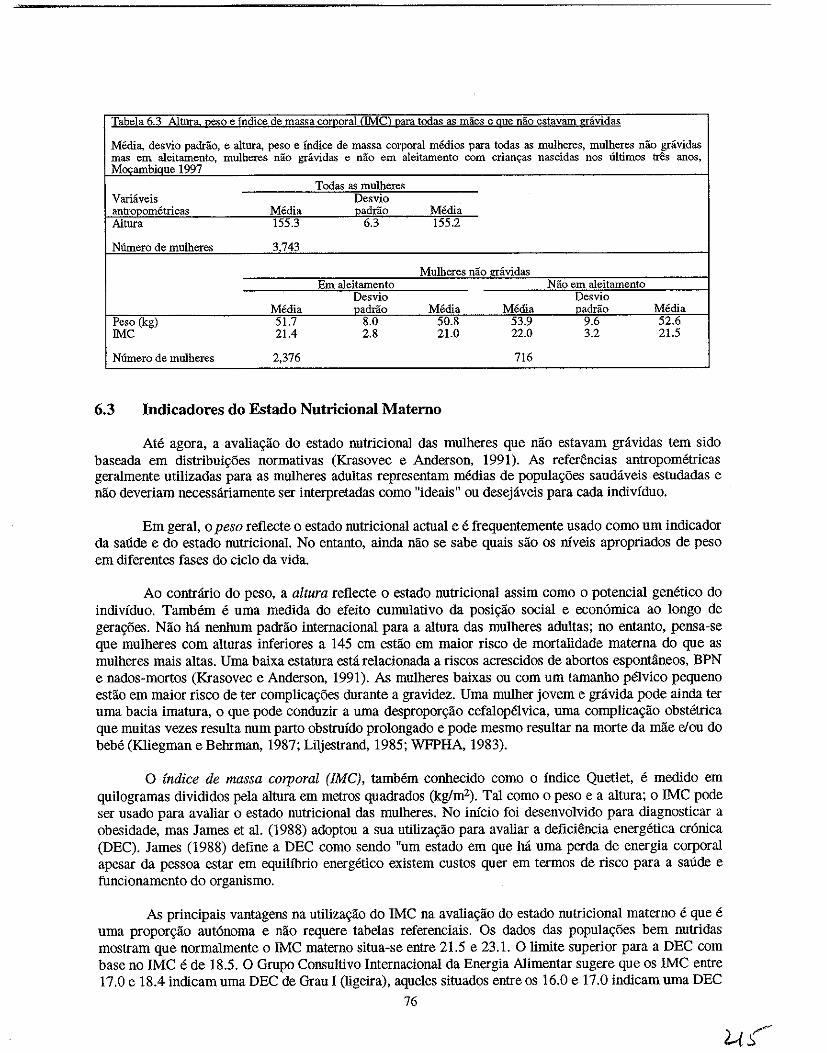
Tabela 6.3 Alturl!:, Reso e Indice de massa corRoral (We) uara tcdas as maes e gue nao estavam gravidas
Media, desvio padrao, e altura, peso e Indice de massa corporal medios para tcdas as mulheres. mulheres nao gravidas mas em aleitamento, mulberes nao gravidas e nao em aleitamento com crian«as nascidas nos ultimos tres anos, Mocambiaue 1997
Todas as mulheres Variaveis Desvio antropometricas Media padrao Media Altura 155.3 6.3 155.2
Ntlmero de mulheres 3743
Mulheres nao gravidas Em aleitamento Nao em aleitamento
Desvio Desvio Media oadrao Media Media oadrao Media
Peso (kg) 51.7 8.0 50.8 53.9 9.6 52.6 !Me 21.4 2.8 21.0 22.0 3.2 21.5
Numero de mulheres 2,376 716
6.3 Indicadores do Estado Nutricional Matemo
Ate agora, a avalia«lio do estado nutricional das mulheres que nlio estavam gravidas tern sido baseada em distribuil(6es normativas (Krasovec e Anderson. 1991). As referencias antropometricas geralmente utilizadas para as mulheres adultas representam medias de populal(6es saudaveis estudadas e nao deveriam necessariarnente ser interpretadas como "ideais" ou desejaveis para cada individuo.
Em geral, 0 peso reflecte 0 estado nutricional actual e e frequentemente usado como urn indicador da sande e do estado nutricional. No entanto, ainda nlio se sabe quais slio os niveis apropriados de peso em diferentes fases do cicIo da vida.
Ao contrario do peso, a altura reflecte 0 estado nutricional assim como 0 potencial genetico do individuo. Tambem e uma medida do efeito cumulativo da posi«ao social e econ6mica ao longo de gera«6es. Nlio hil nenhum padrlio internacional para a altura das mulheres adultas; no entanto, pensa-se que mulheres com alturas inferiores a 145 cm estlio em maior risco de mortalidade materna do que as mulheres mais altas. Uma baixa estatura esta relacionada a riscos acrescidos de abortos espontaneos, BPN e nados-mortos (Krasovec e Anderson, 1991). As mulheres baixas ou com urn tamanho pelvico pequeno estao em maior risco de ter complicag6es durante a gravidez. Uma mulher jovem e gravida pode ainda ter uma bacia imatura, 0 que pode conduzir a uma desproporglio cefalopelvica, uma complica«lio obstetrica que muitas vezes resulta num parto obstrnido prolongado e pode mesmo resultar na morte da mlie elou do bebe (K1iegman e Behrman, 1987; Liljestrand, 1985; WFPHA, 1983).
o indice de massa corporal (fMC), tamMm conhecido como 0 indice Quetlet, e medido em quilogramas divididos pela altura em metros quadrados (kg/m2). Tal como 0 peso e a altura; 0 IMC pode ser usado para avaliar 0 estado nutricional das mulheres. No inicio foi desenvolvido para diagnosticar a obesidade, mas James et al. (1988) adoptou a sua utiliza«ao para avaliar a deficiencia energetica cr6nica (DEC). James (1988) define a DEC como sendo "urn estado em que M uma perda de energia corporal apesar da pessoa estar em equilibrio energetico existem custos quer em termos de risco para a sande e funcionamento do orgaulsmo.
As principais vantagens na utiliza«lio do IMC na avalia«lio do estado nutricional materna e que e uma propor\(lio aut6noma e nlio requere tabelas referenciais. Os dados das popula«6es bern nutridas mostram que normalmente 0 IMC materna situa-se entre 21.5 e 23.1. 0 limite superior para a DEC com base no IMC e de 18.5. 0 Grupo Consultivo Internacional da Energia Alimentar sugere que os IMC entre 17.0 e 18.4 indicam uma DEC de Grau I (ligeira), aqueles situados entre os 16.0 e 17.0 indicam uma DEC
76
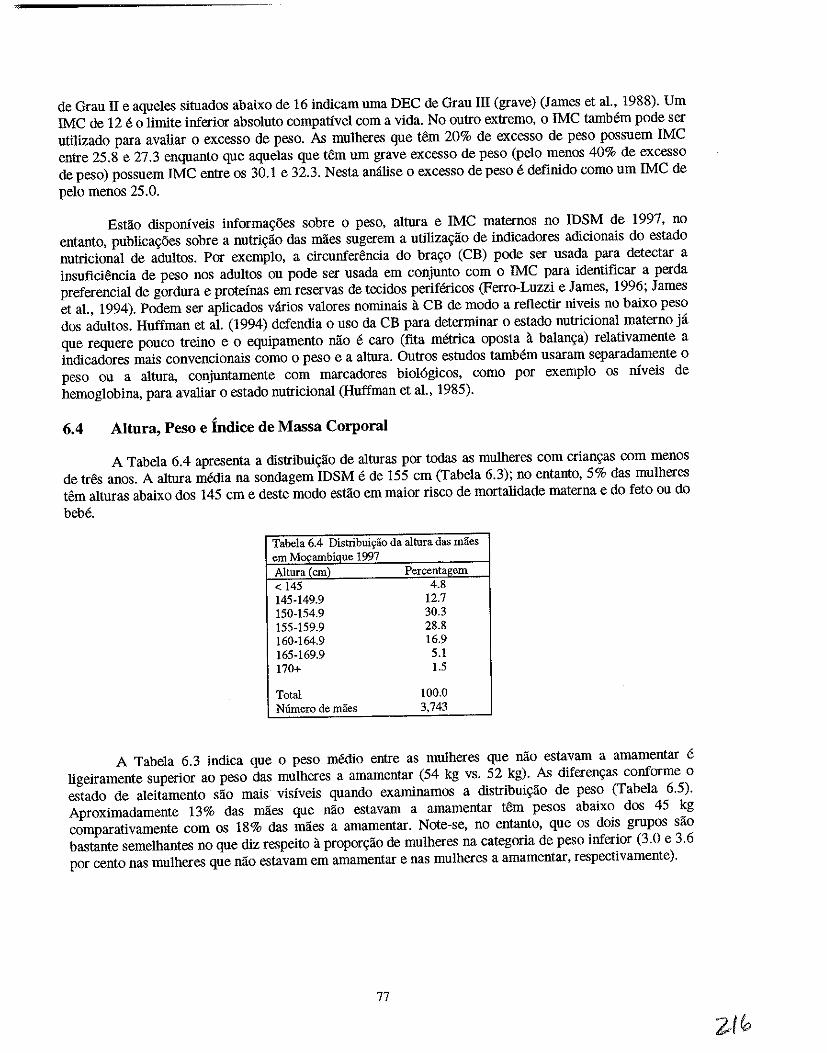
de Grau II e aqueles situados abaixo de 16 indicam uma DEC de Grau III (grave) (James et a!., 1988). Urn IMC de 12 e 0 limite inferior absoluto compativel com a vida. No outro extremo, 0 IMC tamMm pode ser utilizado para avaliar 0 excesso de peso. As mu1heres que tern 20% de excesso de peso possuem IMC entre 25.8 e 27.3 enquanto que aque1as que tern urn grave excesso de peso (pe10 menos 40% de excesso de peso) possuem IMC entre os 30.1 e 32.3. Nesta anilise 0 excesso de peso e definido como urn IMC de pe10 menos 25.0.
Estao disponiveis informa<;5es sobre 0 peso, altura e IMC maternos no IDSM de 1997, no entanto, publica<;5es sobre a nutri<;lio das mlies sugerem a utiliza<;lio de indicadores adicionais do estado nutriciona1 de adultos. Por exemp10, a circunferencia do bra<;o (CB) pode ser usada para detectar a insuficiencia de peso nos adultos ou pode ser usada em con junto com 0 IMC para identificar a perda preferencial de gordura e proteinas em reservas de tecidos perifericos (Ferro-Luzzi e James, 1996; James et a!., 1994). Podem ser aplicados varios valores nominais a CB de modo a rellectir niveis no baixo peso dos adultos. Huffman et al. (1994) defendia 0 usa da CB para determinar 0 estado nutriciona1 materno ja que requere pouco treino e 0 equipamento MO e caro (fita metrica oposta it ba1an<;a) re1ativamente a indicadores mais convencionais como 0 peso e a altura. Outros estudos tambem usaram separadamente 0 peso ou a altura, conjuntamente com marcadores bio16gicos, como por exemp10 os niveis de hemog10bina, para avaliar 0 estado nutricional (Huffman et aI., 1985).
6.4 Altura, Peso e Indice de Massa Corporal
A Tabe1a 6.4 apresenta a distribui<;lio de alturas por todas as mulheres com crian9as com menos de tres anos. A altura media na sondagem IDSM e de 155 cm (Tabela 6.3); no entanto, 5% das mulheres tern alturas abaixo dos 145 cm e deste modo estlio em maior risco de mortalidade materna e do feto ou do beM.
Tabela 6.4 Distribui~ao da altura das maes em M",ambique 1997 Altura{cm) Percentaeem < 145 4.8 145-149.9 12.7 150-154.9 30.3 155-159.9 28.8 160-164.9 16.9 165-169.9 5.1 170+ 1.5
Total 100.0 N6mero de maes 3,743
A Tabe1a 6.3 indica que 0 peso medio entre as muiheres que nlio estavam a amamentar e ligeiramente superior ao peso das mulheres a amamentar (54 kg vs. 52 kg). As diferen<;as conforme 0 estado de a1eitamento sao mais visiveis quando examinamos a distribui<;lio de peso (Tabela 6.5). Aproximadamente 13% das mlies que nlio estavam a amamentar tern pesos abaixo dos 45 kg comparativamente com os 18% das mlies a amamentar. Note-se, no entanto, que os dOis gropos slio bastante seme1hantes no que diz respeito it propor<;lio de mu1heres na categoria de peso inferior (3.0 e 3.6 p~r cento nas mulheres que nilo estavam em amamentar e nas mulheres a amamentar, respectivamente).
77
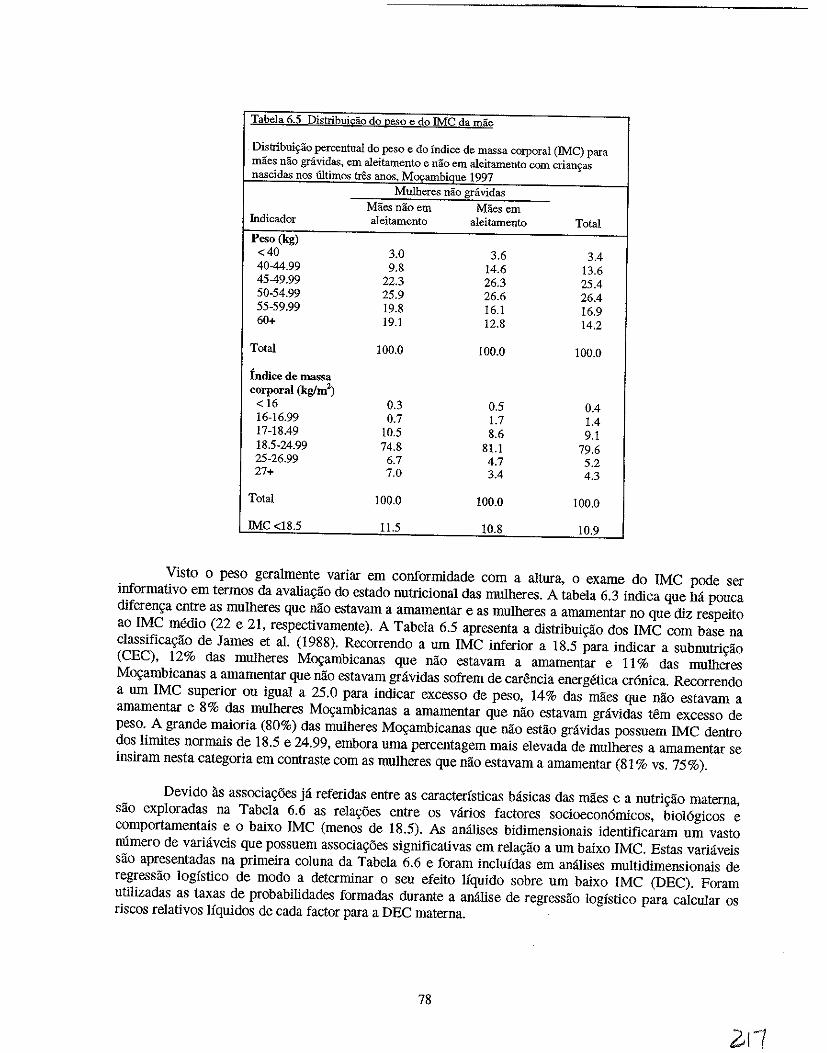
Tabela 6.5 Distribui~o do ~eso e do!MC da mae
Distribui~ao percentual do peso e do indice de massa corporal (IMC) para maes nao grividas, em aleitamento e nao em aleitamento com criau9as nascidas nos tiltimos tres anos, Mocambique 1997
Mulheres nao gravidas
Maesnaoem Maesem fudicador aleitamento aleitamento Total
Peso (kg) <40 3.0 3.6 3.4 40-44.99 9.8 14.6 13.6 45-49.99 22.3 26.3 25.4 50-54.99 25.9 26.6 26.4 55-59.99 19.8 16.1 16.9 60+ 19.1 12.8 14.2
Tota! 100.0 100.0 100.0
Indice de massa corporal (kglm')
< 16 0.3 0.5 0.4 16-16.99 0.7 1.7 1.4 17-18.49 10.5 8.6 9.1 18.5-24.99 74.8 81.1 79.6 25-26.99 6.7 4.7 5.2 27+ 7.0 3.4 4.3
Total 100.0 100.0 100.0
!Me <18.5 11.5 10.8 10.9
Visto 0 peso geralmente variar em conformidade com a altura, 0 exame do IMC pode ser informativo em termos da avalia9ao do estado nutricional das mulheres. A tabela 6.3 indica que M pouca diferen9a entre as mulheres que nao estavam a amamentar e as mulheres a amamentar no que diz respeito ao IMC medio (22 e 21, respectivamente). A Tabela 6.5 apresenta a distribui9ao dos IMC com base na classifica9ao de James et al. (1988). Recorrendo a urn IMC inferior a 18.5 para indicar a subnutri9aO (CEC), 12% das mulheres M09ambicanas que nao estavam a amamentar e II % das mulheres M09ambicanas a amamentar que nao estavam gravidas sofrem de car6ncia energetica cr6nica. Recorrendo a urn IMC superior ou igual a 25.0 para indicar excesso de peso, 14% das maes que n[o estavam a amamentar e 8% das mulheres M09ambicanas a amamentar que na~ estavam gravidas t6m excesso de peso. A grande maioria (80%) das mulheres M09ambicanas que nao estao gravidas possuem IMC dentro dos Iimites normais de 18.5 e 24.99, embora urna percentagem mais elevada de mulheres a amamentar se insiram nesta categoria em contraste com as mulheres que nao estavam a amamentar (81 % vs. 75%).
Devido as associa90es ja referidas entre as caracteristicas basicas das maes e a nutri9ao materna, sao exploradas na Tabela 6.6 as rela90es entre os varios factores socioecon6micos, biol6gicos e comportarnentais e 0 baixo IMC (menos de 18.5). As anaJises bidimensionais identificaram urn vasto mlmero de variliveis que possuem associa90es significativas em rela9aO a urn baixo IMC. Estas vari:iveis sao apresentadas na primeira coluna da Tabela 6.6 e foram inclufdas em analises multidimensionais de regressao logfstico de modo a determinar 0 seu efeito Ifquido sobre urn baixo IMC (DEC). Foram utilizadas as taxas de probabilidades formadas durante a analise de regressao logfstico para calcular os riscos relativos Ifquidos de cada factor para a DEC materna.
78
zn
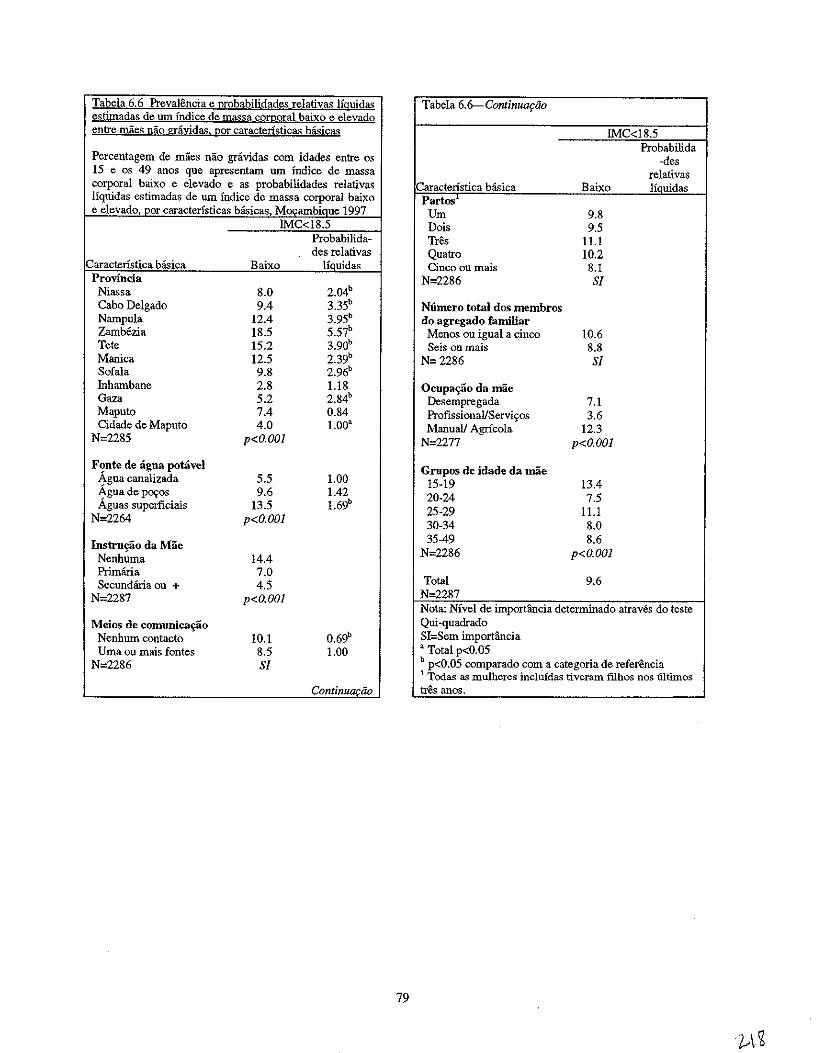
Tabela 6.6 Prevalencia e 12robabilidades relativas Hguidas Tabela 6.6-- Continuq:ilo estimadas de um Indice de massa cQ!I!oral baixo e elevado entre maes nao gniyida~! 120r caracteristicas basicas IMC<18.5
Probabilida Percentagem de maes nao gravidas com idades entre os -des 15 e os 49 anos que apresentam urn Indice de mass a relativas corporal baixo e elevado e as probabilidades relativas Caracteristica basica Baixo liauidas Hquidas estimadas de urn Indice de mass a corporal baixo Partos e elevado, par caracteristicas basicas, MocambiQue 1997 Urn 9.8
IMC<18.5 Dais 9.5 Probabilida- Tres 11.1 des relativas
Caractenstica basica Baixo Houidas Quatro 10.2 Cinco ou mais 8.1
Provincia N=2286 Sf Niassa 8.0 2.04b Cabo Delgado 9.4 3.35b N6mero total dos membros Nampula 12.4 3.95b
Zambezia 18.5 5.57b
Tete 15.2 3.90b
do agregado familiar Menos Oll igual a cinco 10.6 Seis ou mais 8.8
Manica 12.5 2.39b N=2286 Sf
Sofala 9.8 2.96b
Inhambane 2.8 1.18 Gaza 5.2 2.84b
Maputo 7.4 0.84 Cidade de Maputo 4.0 1.00'
N=2285 p<O.OOl
Ocupa~o da mae Desempregada 7.1 ProfissionallServi~os 3.6 Manuall Agricola 12.3
N=2277 p<O.OOl
Fonte de agua potavel Agua canalizada 5.5 1.00 Agua de P090s 9.6 1.42 Aguas superficiais 13.5 1.69b
N=2264 p<O.OOl
Grupos de idade da mae 15-19 13.4 20-24 7.5 25-29 11.1 30-34 8.0
Instru~o da Mae Nenhuma 14.4
35-49 8.6 N=2286 p<O.OOl
Primana 7.0 Secundaria au + 4.5
N=2287 p<O.OOJ
Total 9.6 N-2287 Nota: NIvel de importancia determinado atraves do teste
Meios de comunica~ao 0.69b Nenhum contacto 10.1
Qui-quadrado SI=Sem importllncia
Uma ou mais fontes 8.5 1.00 N=2286 Sf
, Total p<0.05 b p<O.05 comparado com a categoria de referencia 1 Todas as mulheres incluidas tiveram filbos nos iiltimos
Cont;nu~ao tres anos.
79
Embora as publica<;oes sobre a nutri<;ao infantil discutam 0 papel do estado nutricional materno na determina<;ao do estado nutricional da crian<;a, a sitna<;ao nutricional das mulheres raramente e avaJiada como uma consequ~ncia em si. Para alem disso, as estruturas conceptnais que revelam a hierarquia dos determinantes da desnutri<;ao nas mulheres sao raras. Johnson-Welch (1999) adaptou 0
quadro da UNICEF que foi apresentado no Capitulo Dois de forma a utilizar 0 estado nutricional materna como uma consequencia (Figura 6.1). 0 quadro tambem inc1ui factores que sao explicitamente medidos no IDS.
Segundo Johnson-Welch (1999), a ingestao aJimentar inadequada e a prevalencia e gravidade de doen<;as sao causas imediatas da desnutri<;ao. Ha, no entanto, urn vasto mlmero de causas intermedias (subjacentes). Em geral, a resid~ncia, os bens do agregado familiar e a instru<;ao actnam atraves de outros factores para terem urn grande impacto sobre 0 estado nutricional. Por exemplo, a residencia e 0
rendimento do agregado familiar (representado pelos bens do agregado familiar) t~m urn efdto directo sobre a seguran<;a aJimentar, que por seu lado tern urn grande imp acto sobre a ingestao de alimentos. A fertilidade varia conforme a residencia, bens do agregado familiar e a instru<;ao e retlectida pelo mlmero (partos) eo espa<;amento (intervalo entre os nascimentos) dos nascimentos. Atraves da amenorreia lactea existe tambem uma liga<;ao biol6gica entre 0 comportamento relacionado it alimenta<;ao da crian<;a e a fertilidade. Factores socioecon6micos tais como a residencia e os bens do agregado familiar estao relacionados com a acessibilidade dos servi<;os de salide, que por seu lado afectam a prevalencia e a gravidade da doen<;a. Para alem disso, atraves do fornecimento de servi<;os de saneamento e de agua adequados ou inadequados, a residencia e os bens do agregado familiar (urna representa<;ao do rendimento) tambem tern urn grande impacto sobre 0 ambiente de doen9a
Nesta analise, as variaveis com associa<;5es bidimensionais significativas com a DEC materna (indicada por urn IMC inferior a 18,5) sao organizadas de acordo com 0 quadro de Johnson-Welch (1999). Para cada variavel, a categoria referencial esta em italico.
NIVEL liM (CONTEXTO SOCIOECONOMICO)
Residencia • Regiao de residencia (Niassa, Cabo Delgado, Nampula, Zambezia, Tete, Manica, SofaJa, Inhambane,
Gaza, Maputo, cidade de Maputo) • Residencia urbana-rural (urbana, rural)
Bens do Agregado Familiar • Estado socioecon6mico (baixo, medio, elevado) • Tipo de instala<;ao sanitaria (nenhuma, sanita de descarga/latrina) • Fontes de ligua potavel (agua canalizada, ligua de P09os, aguas superficiais) • Contacto da mae com os meios de comunica<;ao (nenhum contacto, contacto com um ou mais meios)
NOTA: A estrutura do agregado familiar (reflectida peZas variaveis da uniao monogamalpoHgama e do sexo do chefe de familia) niio consta do quadro de Johnson-Weich mas foi explorada neste estudo. As variaveis que descreviam a estrutura do agregado familiar nao tinham associ[lfoes bidimensionais significativas com a CEC materna e por essa raziio foram exciu(das da analise multidimensional. Para alem disso, niio foi avaliado 0 efeito do estado civil sobre a DEC materna devido a falta de vari[lfiio na sondagem no que diz respeito a essa variavel.
Instru~ao do Companheiro • Instru<;ao do companheiro (nenhuma, ensino primario, secundario+)
80
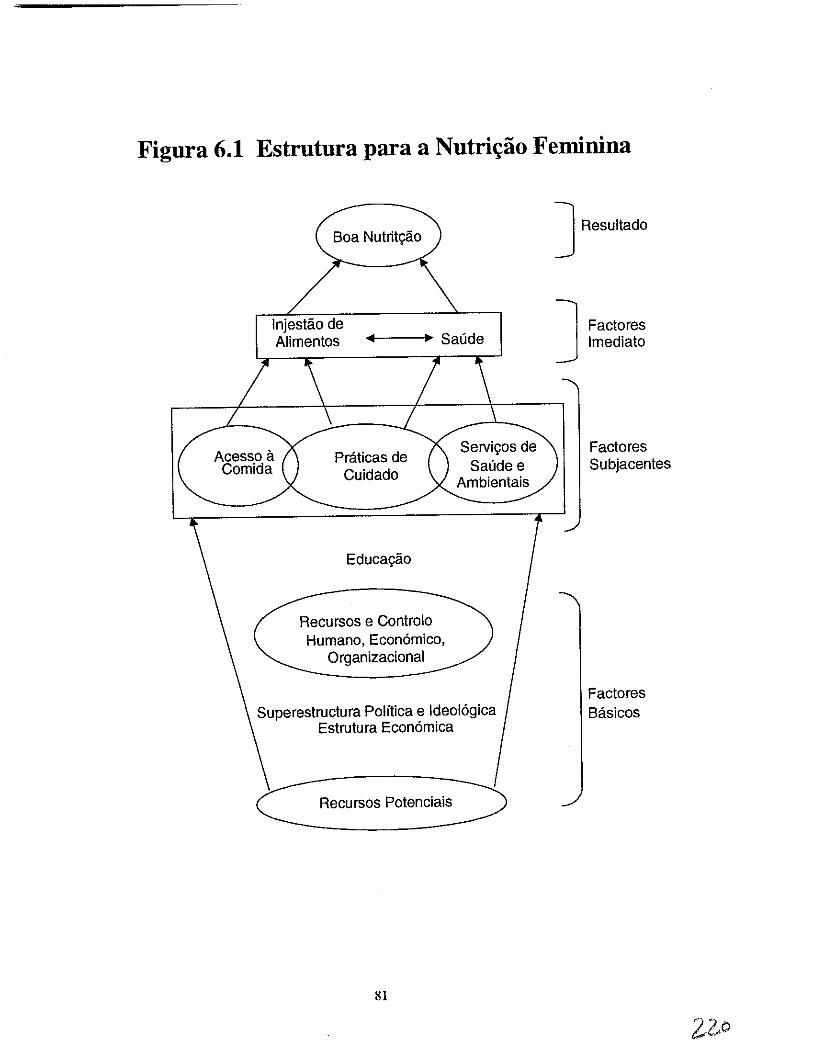
Figura 6.1 Estrutura para a Nutri~ao Feminina
Boa Nutritif8.o
Injestii.o de Alimentos .... ~---. Saude
Acesso a Comida
Praticas de Cuidado
Educagii.o
Recursos e Controlo Humano, Economico,
Organizacional
SeIVigos de Saude e
Ambientais
Superestructura Politica e Ideologica Estrutura Economica
C Recursos potenciais~
81
] Resultado
] Factores Imediato
Factores Subjacentes
Factores Basicos
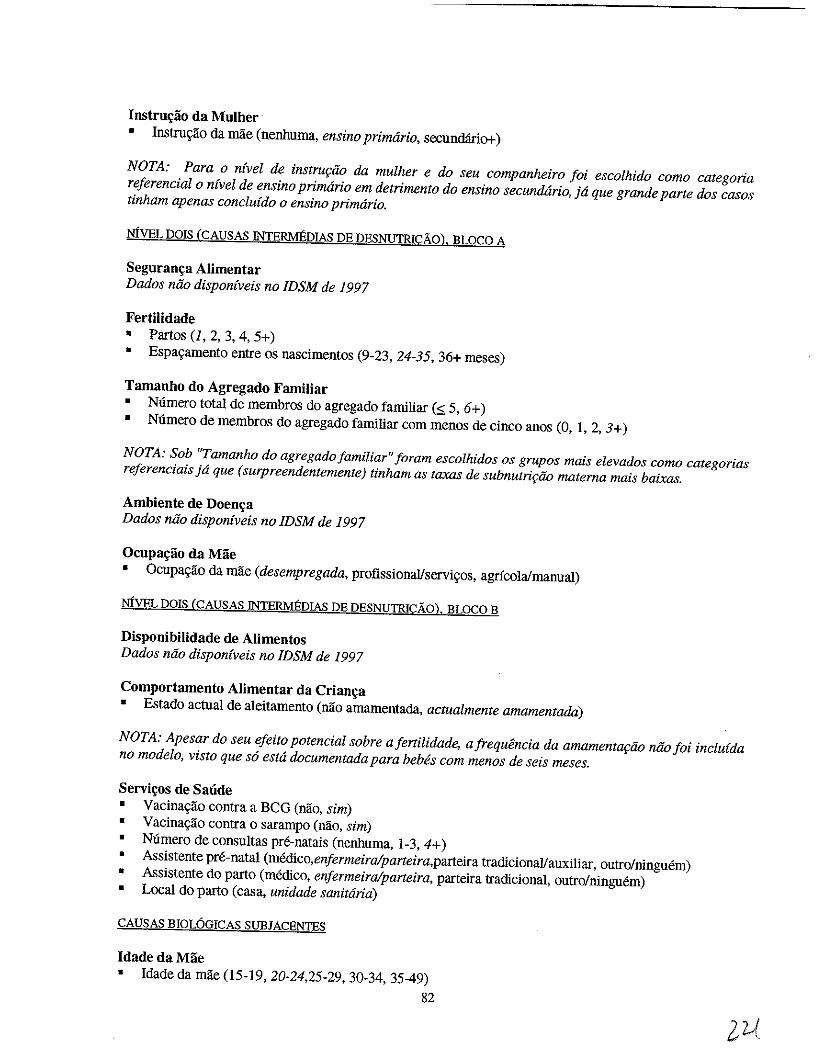
Instru\;ao da Mulher • Inslru9ao da mae (nenhuma, ensino primario, secunctario+)
NOTA: Para 0 nfvel de instrur;iio da mulher e do seu companheiro foi escolhido como categoria referencial 0 nfvel de ensino primario em detrimento do ensino secundario, ja que grande parte dos casos tinham apenas conclufdo 0 ensino primario.
NfVEL DOIS CCAUSAS INTERMEDlAS DE DESNUTRICAO). BLOCO A
Seguran\;a Alimentar Dados niio disponfveis no IDSM de 1997
Fertilidade • Partos (J, 2, 3, 4, 5+) • Espa9amento entre os nascimentos (9-23, 24-35, 36+ meses)
Tamanho do Agregado Familiar • Numero total de membros do agregado familiar G;. 5, 6+) • Numero de membros do agregado familiar com menos de cinco anos (0, I, 2, 3+)
NOTA: Sob "Tamanho do agregado familiar" foram escolhidos os grupos mais elevados como categorias referenciais jd que (surpreendentemente) tinham as taxa:; de subnutrir;iio materna mais baixas.
Ambiente de Doen\;a Dados niio disponfveis no IDSM de 1997
Ocupa\;ao da Mae • Ocupa9ao da mae (desempregada, profissionaIlservi90s, agricola/manual)
MVEL DOIS CCAUSAS INTERMEDlAS DE DESNUTRICAO). BLOCO B
Disponibilidade de Alimentos Dados niio dispon(veis no IDSM de 1997
Comportamento Alimentar da Crian\;a • Estado actual de aleitamento (nao amamentada, actual mente amamentada)
NOTA: Apesar do seu efeito potencial sobre afertilidade, afrequencia da amamentar;iio niio foi inclufda no modelo, visto que s6 esta documentada para bebes com menos de seis meses.
Servi\;os de Sande • Vacina9ao contra a BeG (nao, sim) • Vacina9ao contra 0 sarampo (nao, sim) • Numero de consultas pre-natais (nenhnma, 1-3,4+) • Assistente pre-natal (mectico,enfermeiraiparteira,parteira tradicionallauxiliar, outro/ninguem) • Assistente do parto (medico, en/ermeiraiparteira, parteira tradicional, outro/ninguem) • Local do parto (cas a, unidade sanitaria)
CAUSAS BIOL6GICAS SUBJACENTES
IdadedaMae • Idade da mae (15-19, 20-24,25-29, 30-34, 35-49)
82
NOTA: A idade da mde niio foi inclu(da no quadro de Johnson-Welch; no entanto, devido Ii sua relGl;:iio com a nutri{:iio materna documentada em publica{:oes, foi inclu(da nesta analise,
mYEL TRlls (CAUSAS IMEDIATAS)
Ingestio de Alimentos Dados nao dispon{veis no IDSM de 1997
Doen~a Dados nao dispon{veis no IDSM de 1997
6.5 Deficiencia Energetica Cronica Materna
Com base na analise multidimensional, os seguintes factores sao importantes na determina~ao da deficiencia energetica cr6nica (DEC) nas mulheres M~ambicanas: regiao de residencia, fontes de agua potavel, contacto com os meios de comunica~ao e idade da mae (Tabela 6,6).
Quando se consideram outros factores, persistem diferen~as regionais significativas. As provincias de Cabo Delgado, Nampula., ZamMzia e Tete salientam-se como areas de alto risco para a subnutri~ao materna. Em particular, as maes em Cabo Delgado apresentam quase 0 triplo do risco de DEC em compara~1io com as maes na cidade de Maputo. Como se referiu no Capitulo Dois, Cabo Delgado possui tamMm a prevalencia mais elevada de desnutri~ao infantiI. Tal como com a desnutri~ao infantll, 0 risco de DEC materna tamMm varia conforme as fontes de agua potavel; as mulheres que bebiam aguas superficiais apresentavam quase 0 dobro de probabilidades de serem subnutridas do que as mulheres que bebiam agua canalizada, tendo em conta os efeitos de outros factores.
Ao contrario das publica~oes, que citam as variaveis socioecon6micas como determinantes do estado nutricional materno, os efeitos de tais variaveis nao eram importantes para esta analise. Note-se, no entanto, que as variaveis relativas a regiao e a agua potavel discutidas anteriormente podem detectar parcialmente diferen~as na DEC conforme a posi~ao socio-econ6mica Deste modo, parece haver uma liga~ao entre os factores socioecon6micos e 0 estado nutricional, embora a natureza desta rela~1io requera a continua~ao da investiga~ao.
Ao contrario de M~ambique, os estudos na Asia geralmente encontraram niveis crescentes de subnutri~ao materna a medida que a idade da mae aumentava (Ahmed et aI., 1998; Baqui et al., 1994). A liga~ao entre a idade da mae e a subnutri~ao e geralmente atribufda ao grave estado de saude da mae (maternal deplection) devido a urn elevado mlmero de partos. Num estudo no Bangladesh, Huffman et al. (1985) acresceutou dados sobre a rela~ao entre a idade da mae e a subnutri~ao, afrrmando que a elevada subnutri~ao entre as mulheres mais velhas tamMm pode reflectir maiores defices de crescimento durante a infancia em compara~ao com as mulheres mais jovens. Apesar do efeito negativo dos partos frequentes sobre 0 estado nutricional materno, 0 mlmero de partos nao foi significativamente associado a DEC materna em M~ambique. As concJusoes em Mo~ambique sao semelhantes as observadas noutros pafses da Africa Sub-Sahariana abrangidos pelo IDS. Numa compara~ao de dados do IDS entre os pafses sobre 0
estado nutricional da mae e da crian9a em pafses da Africa Sub-Saariana, Johnson-Welch (1999) descobriu que 0 IMC materna aumentava com a idade, embora esta associa9ao nlio fosse significativa.
E bern possivel que a falta de associa9lio entre os varios factores e a DEC materna observada nesta analise pode nao se dever exclusivamente a natureza das suas rela90es com 0 estado nutricional, mas antes a natureza dos dados utilizados para explorar essas rela90es. Os dados disp0nlveis no IDSM de 1997 podem nao explicar de modo suficiente a DEC em mulheres M~ambicanas. Devido a natureza transversal do IDSM de 1997 e a falta de dados sobre 0 estado nutricional passado das mulheres (especialmente durante a infancia), nlio e possivel abordar neste estudo 0 efeito da subnutri9ao passada
83
sobre 0 estado nutricional aetnal. Para alem disso, nao e possivel abordar as defici~ncias em micronutrientes como por exemplo a anemia sem a medi~ilo de indicadores biol6gicos fundamentais tais como os niveis de hemoglobina. Ha tambem uma liga~ao entre as inf~oes e 0 estado nutricional da mulher, embora esta rela~ao nilo possa ser explorada utilizando 0 IDSM. As informa~oes sobre a ingestao de alimentos e os niveis de actividade fisica das miles, que nlio estlio presentes no IDSM, poderiam fornecer informa~lio relativa as determinantes significativas do estado nutricional materno em M~ambique.
6.6 Resumo
A desnutri~lio em Mo~ambique nao esta limitada unicamente as cri~as. As mulheres na idade reprodutiva tambem sao vitimas: 11% das mulheres M~ambicanas que nao estao gravidas Wm uma deficiencia energetica cr6nica, 0 que coloca em grande risco a sua saude e a saude dos seus filhos. Do mesmo modo, 10% das mulheres Mo~mbicanas que nlio estlio gravidas tern excesso de peso. Os factores associados com (embora nao necessariamente relacionados com) a DEC materna slio 0 local de residencia, as fontes de agua potavel, 0 contacto com os meios de comunica~ao e a idade da mae. Note-se que as regioes com urn risco mais elevado de desnutri~ao infantil, por exemplo, Cabo Delgado, apresentam tambem elevados riscos de CEC materna. Esta observa~ao sublinha a liga~ao entre 0 estado nutricional das criangas eo das suas miles.
6.7 Recomenda~oes
Intervir no Estado Nutricional das Mulheres, Independentemente da Idade
• Identificar as deficiencias nutricionais nas mulheres antes que atinjam a idade reprodutiva de forma a garantir que nlio fiquem gravidas com urn estado nutricional deteriorado.
• Fortalecer e expandir os programas de nutri~ilo que tenham em conta as necessidades nutricionais das mulheres gravidas e a amamentar, por exemplo, a complementa~ao com os micronutrientes (iodo,ferro).
• Explorar a possibiJidade de desenvolver a mediollongo prazo urn programa de suplementacao as mulheres pos - parto.
• Planear intervengoes nutricionais direccionadas a zonas geograficas especificas (para mulheres e criangas) em Cabo Delgado, Nampula, Zambezia e Tete.
Planeamento Familiar
• Aumentar 0 acesso e a utilizagao do planeamento familiar como forma de retardar 0 tempo das primeiras gravidezes, espa~ar as gravidezes e consequentemente, reduzir-se-a a pressao fisica da gravidez prematura e melhorar 0 estado nutricional da mulher.
Investiga{:iio
• Apoiar investigagoes que com base na populagao, produzam estimativas do nivel de anemia e de outras deficiencias em micronutrientes (inclusivo a vitamina A) nas meninas e mulheres em idade reprodutiva.
• Explorar a relagiio entre a actividade ffsica e 0 estado nutricional das mulheres.
84
CAPiTULO 7
RECOMENDA~6ESCHAVE
Dada a natureza multidimensional do problema da nutri9ao em MQ9ambique, as recomenda9oes apresentadas neste capitulo foram organizadas em seis sec90es: (1) seguran9a alimentar, (2) bem-estar das mulheres, (3) cuidados primarios de salide, (4) amamenta9ao e nutri9ao da crian9a, (5) informa9ao, educa9ao e comunica9ao, e (6) investiga9ao
7.1 Seguran~a Alimentar
Qualquer esfon;o no sentido de melhorar 0 estado nutricional das mulheres e crian~as em Mo~ambique requerera uma melhoria da seguran~a alimentar. Pelo que interven~iJes nesta area devem ser implementadas tendo em conta a estrategia nacional de seguran~a alimentar e nutri~iio.
DisponibiJidade de Alimentos
A disponibilidade e a diversidade das culturas requer varias a(;9oes entre as quais se destacam 0 aumento da produ9ao e dos rendimentos do sector familiar, interven90es no sector privado assim como a adoP9ao de uma politica adequada de comercio externo. Algumas das interven90es nesta area sao a seguir apresentadas:
• Garantir a seguran9a na posse da terra de modo a que os camponeses e agricultores privados, se sintam estimulados a melhorar e diversificar a produ9ao de uma forma sustentavel.
• Estabelecer urn mecanismo de fornecimento de insumos produtivos necessarios e tambem a compra do excedente da produ9ao.
• Promover a transferencia de tecnologias aos agricultores para favorecer 0 aurnento da produ9ao e da produtividade e reduzir as perdas p6s colheita.
• Estabelecer urn sistema de credito rural capaz de apoiar as actividades de comercializa9ao pelos produtores e comerciantes de pequena e media escala (tomando em considera<;:iio as necessidades da mulher camponesa).
• Permitir a importa9ao de produtos de primeira necessidade que 0 pais nao e capaz de produzir para garantir a cobertura das necessidades internas.
• Ensinar os agricultores metodos de conserva9ao de alimentos e de armazenamento prolongado de sementes.
• Continuar com 0 estudo da possibilidade de criar urn sistema de manuten9ao de stocks alimentares de reserva aos niveis distrital, provincial e nacional.
• Investigar e promover os mecanismos comunitarios de auto gestao de calamidades e protec9ao social.
• Fortalecer os servi90s de assistencia social, para as popula90es vivendo em areas vulneraveis.
85
Acesso Fisico e Econ6mico Aos Alimentos
• Melhorar a infraestrutura rural (por ex., estradas, abastecimento de agua, instalayoes de salide, escolas) atraves de programas de comida para 0 trabalho (Food for Work) especificamente dirigidos it inseguranya a1imentar e aos individuos deslocados.
• Estabelecer urn sistema de informayao de mercado funcional para que os mercados funcionem eficientemente e para encorajar os produtores e comerciantes a engajarem-se na armazenagem intersazonal.
• Fornecer meios para a obtengao de rendimento atraves da formayao profissional, cnjdito para inicio de pequenos neg6cios nas areas urbanas, onde os agregados familiares preferem antes comprar e comercializar a1imentos do que confiar na subsist6ncia agricola.
• Com vista a reduzir a ajuda a1imentar internacional, utilizar a ajuda alimentar como parte dos pagamentos dos individuos empregados na implementayao de programas publicos (construgao de estradas, pontes, escolas).
7.2 Bem-Estar das Mulheres
Para 0 melhoramento nutricional das mulheres dever-se-a ter em conta, todos os aspectos re/erentes ao bem estar das mulheres Mor;ambicanas no que se refere aos aspectos: sociais, econ6micos e relacionados com a saUde.
• Desenvolver actividades de obtenyao de rendimentos para as mulheres rurais, especialmente, as que sao chefes de fanu1ia.
• Aumentar 0 acesso das mulheres ao crectito e a outros serviyos financeiros.
• Melhorar as oportunidades educacionais para as mulheres.
• Aumentar a capacidade de auto-subsist6ncia das mulheres melhorando 0 acesso it tecnologia e a outros recursos.
• Aumentar a disponibilidade e acessibilidade aos metodos de planeamento familiar.
• Dentro do Programa Nacional para Mulheres e Crian~as, dever-se-a ter em conta incluslio do estado de saude e nutricional das mulheres para alem dos aspectos relacionados com a maternidade e reproduyao.
• Fortalecer e melhorar os programa.~ de suplementa9lio com micronutrientes (por ex: ferro, acido f6Iico,iodo) dirigidos as mulheres gravidas e que amamentam.
• Estudar a possibilidade de a longo prazo poder estabelecer urn programa nacional de suplementagao das mulheres p6s parto com capsulas de vitamina A.
• Implementar a estrategia de diversifica~ao alimentar que inclui a prom09ao do cultivo de culturas ricas em micronutrientes (batata doce - cor laranja, horticolas, arvores de fruto, papaeiras, mangueiras) assim como a promo~ao do seu consumo.
86
7.3 Cuidados Primarios de Sande
Devera ser dada prioridade a integrat;ao dos servil;os de saMe, nutrit;ao e de planeamento familiar em
vez da criat;ao de programas verticais.
• Melhorar e fortalecer os programas de intervenc;:ao na area de saude e nutric;:ao que incluam 0
planeamento familiar, nutric;:ao, educac;:ao sanitaria e nutricional e os cuidados primarios de saude
direccionados a mulher e a crianc;:a.
• Para reduzir 0 acesso limitado aos cuidados de saude, criar pequenos postos de saude que incidam
principalmente na prevenc;:ao primaria e secundaria da desnutric;:ao e das doenc;:as.
• Desenvolver programas para evitar ou reduzir a incidencia de malaria e de diarreia.
• Recrutar e formar mulheres como acti vistas de saude comunitaria.
• Combinar a monitorizac;:ao do crescimento da crianc;:a com os servic;:os de imunizac;:ao.
• Desenvolver 0 programa de controlo Integrado das Doenc;:as Infantis (CIDI).
7.4 Amamenta~ao e Nutril;ao da Criam;a
No melhoramento do estado nutricional da criant;a, ter em conta tanto os fomecedores de servit;os
(unidades sanitariaslpessoal ) assim como os utilizadores dos mesmos.
• Desenvolver uma politica nacional relacionada com 0 aleitamento materna e HIV.
• Rever e actualizar as recentes normas nacionais sobre 0 tratamento da desnutric;:ao grave tendo em
conta as actuais recomendac;:oes internacionais.
• Fortalecer e melhorar a formac;:ao dos profissionais de saude sobre a importllncia de uma
amamentac;:ao atempada e sustentavel e sobre as praticas alimentares segundo a idade (por ex., a
introduc;:ao de alimentos complementares, idade recomendada para 0 desmame).
• Estabelecer e manter 0 acordo de todos os hospitals em relac;:ao aos padroes do Programa
Internacional de Hospitais Amigos da Crianc;:a.
• Promover 0 metodo de amenorreia hictea (MAL), que tras beneficios nutricionais no que se refere ao
bebe e no espac;:amento entre os nascimentos/reduc;:ao da fertilidade beneficiando a mulher.
• Fomentar a amamentac;:ao dos beMs, mesmo entre as mulheres mal alimentadas.
• Estabelecer programas especiais de nutric;:ao e de cuidados primarios de saude especificamente
dirigidos a cerca de 200,000 crianc;:as Moc;:ambicanas que sao 6rffis ou foram separadas das suas
fanulias.
7.5 Informa~ao, Educac;:ao e Comunica~ao
• Utilizar os meios de comunicac;:ao para promover os padroes ideais de comportamento relacionado
com os aspectos relativos a saude e nutricao da familia (com enfase nas mulheres e crianc;:as).
87
7.6 Investiga~iio
Efectuar estudos qUl1Jltitativos e qualitativos para determinar a consequencia de certos fenomenos no estado de saude de modo a explicar a raz{io pela qual estes fenomenos existem
• Apoiar os estudos de investiga9ao qualitativa que investiguem 0 seguinte: factores na procura de cuidados de salide, conhecimentos da comuuidade no que diz respeito a alimenta9ao infantil, HIV, aceitabilidade de micronutrientes, nutri9ao dos adolescentes e materna.
88
REFERENCIAS
Ahmed, S.M., A Adams, AM.R. Chowdhury, e A Bhuiya. 1998. Chronic energy deficiency in women from rural Bangladesh: Some socioeconomic determinants. Journal of Biosocial Science 30:349-358.
Baqui, AH., S.E. Arifeen, S. Amin, e R.E. Black. 1994. Levels and correlates of maternal nutritional status in urban Bangladesh. European Journal of Clinical Nutrition 48:349-357.
Berendes, H.W. 1993. Maternal determinants of perinatal mortality and of intrauterine growth retardation and preterm delivery. Em Birth risks. ed. J.D. Baum. New York: Raven Press, Ltd. 47-56.
Branca, F., O. Pastore. T. Demissie, e A Ferro-Luzzi. 1993. The nutritional impact of seasonality in children and adults of rural Ethiopia. European Journal of Clinical Nutrition 47:840-850.
Briend, A 1990. Is diarrhea a major factor of malnutrition among the under-fives in developing countries? A review of aVailable evidence. European Journal of Clinical Nutrition 44:611-628.
Brown, K.H., R.E. Black, et al. 1989. Infant feeding practices and their relationship with diarrheal and other diseases in Huascar (Lima), Peru. Pediatrics 83(1):31-40.
Brown. K.H.. R Y. Stallings, H. Creed de Kanashiro, O. Lopez de Romana, e R.E. Black. 1990. Effects of common illnesses on infants· energy intakes from breast milk and other foods during longitudinal community-based studies in Huascar (Lima). Peru. American Journal of Clinical Nutrition 52: 1 005-1 013.
Brozek, J., e B. Schurch. 1984. Malnutrition and behavior: Critical assessment of key issues. Nestle Foundation Publication Series Vol. 4. Lausanne. Switzerland: Nestle Foundation.
Caulfield, L.E., M.E. Bentley, e S. Ahmed. 1996. Is prolonged breastfeeding associated with malnutrition? Evidence from nineteen demogtaphic and health surveys. International Journal of Epidemiology 25(4):693-703.
Center for International Health Information (CIHI). 1995. Mozambique: Country health profile 1995. CIHI Country Health Profile Series. Arlington: Center for International Health Information.
Central Statistical Office (CSO) [Zimbabwe] e Macro International Inc. (MI). 1995. Zimbabwe Demographic and Health Survey 1994. Calverton, Maryland (USA): CSO and MI.
Central Statistcal Office (CSO) [Zambia] e Ministry of Health (MOH) e Macro International Inc. (MI). 1997. Zambia Demographic and Health Survey 1996. Calverton. Maryland (USA): CSO and MI.
Centro de Informatica da Universidade Eduardo Mondlane (CIUEM). 1999. Mozambique, "Basic Facts." Internet Website (www.mozambique.mz).
Clemens, J.D. e B.P. Stanton. 1987. An educational intervention for altering water-sanitation behaviors to reduce childhood diarrhea in urban Bangladesh. 1. Application of the case-control method for development of an intervention. American Journal of Epidemiology 125(2):284-291.
Cliff, J., eAR. Noormahomed. 1993. The impact of war on children's health in Mozambique. Social Science and Medicine 36(7):843-848.
89
Cliff J., F. Cutts, e R. Waldman. 1990. Using surveys in Mozambique for evaluation of diarrheal disease control. Health Policy and Planning 5(3):219-225.
Cliff, J.L., e A.R. Noormahomed. 1988. The impact of South African destabilization on maternal and child health in Mozambique. Journal of Tropical Pediatrics 34:329-330.
Cohen, R.J., K.H. Brown, J. Cnahuait, L.L. Rivera, e K.G. Dewey. 1994. Effect of age of introduction of complementary foods on infant breast milk intake, total energy intake, and growth: A randomized intervention study in Honduras. Lancet 334(8918):288-293.
Cutts, F.T., D. Dos Santos, A Novoa, P. David, G. Macassa, e AC. Soares. 1996. Child and maternal mortality during a period of conflict in Beira City, Mozambique. International Journal of Epidemiology 25(2):349-356.
Cutts, F.T., O. Monteiro, P. Tabard, e J. Cliff. 1994. Measles control in Maputo, Mozambique, using a single dose of Schwarz vaccine at age 9 months. Bulletin of the World Health Organization 72(2):227-231.
Cutts, F., J. Cliff, R. Reiss, e J. Stuckey. 1988. Evaluating the management of diarrhea in health centers in Mozambique. Journal of Tropical Medicine and Hygiene 91 :61-66.
Daga, S.R., Daga, AS., Dighole, R.Y., e R.P. Pati!o 1993. Anganwadi worker's participation in rural newborn care. Indian Journal of Pediatrics 60:627-630.
de Carvalho, M., S. Robertson, A Friedman, eM. Klaus. 1983. Effect of frequent breast-feeding on early milk production and infant weight gain. Pediatrics 72(3):307 -311.
Dickin, K.L., K.H. Brown, D. Fagbule, M. Adedoyin, J. Gittlesohn, S.A Esrey, e G.A. Oni. 1990. Effect of diarrhea on dietary intake by infants and young children in rural villages of Kwara State, Nigeria. European Journal of Clinical Nutrition 44(4) :307-317.
EI Samani, E.F.Z., W.C. Willett, e J.H. Ware. 1988. Association of malnutrition and diarrhea in children aged under five years. American Journal of Epidemiology 128(1):93-105.
Esrey, S.A, R.G. Feachem, e J.M. Hughes. 1985. Interventions for the control of diarrheal diseases among young children: Improving water supplies and excreta disposal facilities. Bulletin of the World Health Organization 63(4):757-772.
Fawzi, W.W., M.G. Herrera, P. Nestel, A EI Amin, e K.A Mohamed. 1998. A longitudinal study of prolonged breastfeeding in relation to child undernutrition. International Epidemiological Association 27:255-260.
Ferro-Luzzi, A, e W.P.T. James. 1996. Adult malnutrition: Simple assessment techniques for use in emergencies. British Journal of Nutrition 75 :3-10.
Food and Agricultural Organization of the United Nations (FAO). 1987. The People's Republic of Mozambique: A report of the FAO mission. Evaluation of external aid requirements in food and of agricultural rehabilitation needs for selected provinces. Office for Special Relief Operations Report No. 031871E. Rome: FAO.
Gani, A 2000. Estudo sobre habitos e Praticas Alimentares na Zona Sui de M~ambique (Nao publicado).
90
Government of Mozambique, Eduaro Mondalane University, e the International Food Policy Research Institute (IFPRI). 1998. Understanding poverty and well-being in Mozambique: The first national assessment (1996-97). M09ambique.
Habicht, J.P., R. Martorell, C. Yarbrough, R.M. Malina, e R.E. Klein. 1974. Height and weight standards for preschool children. How relevant are ethnic differences in growth potential? Lancet 1(858):611-614.
Haggerty, P.A., K Muladi, B.R. Kirkwood, A. Ashworth, e M.N. MannuEbo. 1994a. Community-based hygiene education to reduce diarrheal disease in rural Zaire: Impact of the intervention on diarrheaJ morbidity. International Journal of Epidemiology 23(5): 1050-1059.
Haggerty, P.A., M.N. Mannu'Ebo, A. Ashworth, K Muladi e B.R. Kirkwood. 1994b. Methodological approaches in a baseline study of diarrheal morbidity in weaning-age children in rural Zaire. International Journal of Epidemiology 23(5):1040-1049.
Hosmer, D. e S. Lemeshow. 1989. Applied logistic regression. New York: John Wiley & Sons. 86.
Hoyle, B., M. Yunus, e L.c. Chen. 1980. Breast-feeding and food intake among children with acute diarrheal disease. American Journal of Clinical Nutrition 33(11):2365-2371.
Huffman, S.L. 1991. Maternal malnutrition and breastfeeding: Is there really a choice for policy makers? Journal of Tropical Pediatrics (suppl) 37:19-22.
Huffman, S.L. e C. Combest. 1990. Role of breast-feeding in the prevention and treatment of diarrhea. Journal of Diarrheal Disease Research 8(3):68-81.
Huffman, S.L., M. Wolff, e S. Lowell. 1985. Nutrition and fertility in Bangladesh: Nutritional status of nonpregnant women. American Journal of Clinical Nutrition 42:725-738.
Hytten, F.E. 1980. Nutrition. Em Clinical physiology in obstetrics, ed. F.E. Hytten and G. Chamberlain. Oxford, England: Blackwell Scientific Publications. 163-192.
Institute of Medicine (1M). 1990. Nutrition during pregnancy. Washington, D.C.: National Academy Press.
Institute of Medicine (1M), Committee to Study the Prevention of Low Birthweight 1985. Preventing Low Birthweight. Washington, D.C.: National Academy Press.
International Monetary Fund (IMP). 1996. Republic of Mozambique--Recent developments. IMR Staff Country Report No. 96/142. Washington, D.C: IMP.
Islam, M.A., M.M. Rahman, e D. Mahalanabis. 1994. Maternal and socioeconomic factors and the risk of severe malnutrition in a child: a case-control study. European Journal of Clinical Nutrition 48:416-424.
James, W.P.T., G.C.N. Mascie-Taylor, N.G. Norgan, B.R. Bistrian, P.S. Shetty, e A. Ferro-Luzzi. 1994. The value of arm circumference measurements in assessing chronic energy deficiency in Third World adults. European Journal of Clinical Nutrition 48:883-894.
James, W.P.T., A. Ferro-Luzzi, e J.C. Waterlow. 1988. Definition of chronic energy deficiency in adults: Report of a working party of the International Dietary Energy Consultative Group. European Journal of Clinical Nutrition 42:969-981.
91 7. .. ~ .... -' .
Jamison, D.T. 1993. Disease control priorities in developing countries: An overview. Em Disease Control Priorities in Developing Countries, ed. D.T. Jamison, W.H. Mosley, AR. Measham, and J.L. Bobadilla. New York: Oxford University Press.
Johnson-Welch, C. 1999. Focusing on women works: Research on improving micronutrient status through food-based interventions. International Center for Research on Women (ICRW) and Opportunities for Micronutrient Interventions (OMNI).
Jonsson, U. 1995. Etbics and child nutrition. Food and Nutrition Bulletin 16(4):293-298.
Kessel, E., S. Sastrawinata, e S.D. Mumford. 1985. Correlates of fetal growth and survival. Acta Paediatr Scand (supp1) 319:120-127.
Kliegman, R.M. e R.E. Behrman 1987. High risk pregnancies. Em Nelson textbook of pediatrics, 13th
edition, ed. R.E. Behrman and V.C. Vaughan. Philadelphia: W.B. Saunders. 365-367.
Kramer, S. 1987. Intrauterine growth and gestational dnration determinants. Pediatrics 80(4):502-511.
Krasovec, K. 1991. The implications of poor maternal nutrition status dnring pregnancy for future lactational performance. Journal of Tropical Pediatrics suppJ. 37:3-10.
Krasovec, K. e M. Anderson 1991. Maternal nutrition and pregnancy outcomes: Anthropometric assessment. PAHO Scientific Publications No. 259. Washington, D.C.: Pan American Health Organization.
Labbok, M.H. 1991. Breastfeeding and borderline malnutrition in women Journal of Tropical Pediatrics suppl. 37:23-24.
Lechtig, A, e A Srivastava. 1988. A strategy to improve weaning practices in Mozambique. Em Improving young child feeding in eastern and southern Africa. Household-level food technology, eds. D. Alnwick, S. Moses, eO.G. Schmidt. Ottawa. 113-127.
Liljestrand, J., S. Bergstrom, e G. Birgegard. 1986. Anaemia of pregnancy in Mozambique. Transactions of the Royal Society of Tropical Medicine and Hygiene 80:249-255.
Llewelyn-Jones, D. 1965. Severe anaemia in pregnancy (as seen in Kuala Lumpnr, Malaysia). The Australian and New Zealand Journal of Obstetrics and Gynaecolo gy 5: 191-197.
Lutter, C.K., J.O. Mora, J.P. Habicht, K.M. Rasmussen, D.S. Robson, S.G. Sellers, C. Super, e M.G. Herrera. 1989. Nutritional supplementation: Effects on child stunting because of diarrhea. American Journal of Clinical Nutrition 50(1):1-8.
Martorell, R., J.P. Habicht., C. Yarbrough, A Lechtig, e R.E. Klein. 1976. Underreporting in fortnightly recall morbidity surveys. Journal of Tropical Pediatric Environmental Child Health 22(3):129-134.
Mavalankar, D. V., R.H. Gray, e C.R. Trived. 1992. Risk factors for preterm and term low birthweight in Ahmedabad, India. International Journal of Epidemiology 21(2):263-272.
Merchant, K.M., R. Martorell, e J.D. Haas. 1991. Nutritional adjustments in response to reproductive stresses within Guatemalan women. Journal of Tropical Pediatrics (suppl) 37: 11-22.
Merchant, K. e R. Martorell. 1988. Frequent reproductive cycling: Does it lead to nutritional depletion of mothers? Progress in Food and Nutrition Science 12:339-369. 92
Ministerio de Salide, Ministerio do Plano e Fin~as. 1999. Perf is de Seguranra Alimentar e Nutricao. Maputo, Moc;;ambique.
Ministerio de Saude, Repartic[o de Nutricao. 1997. Boletim de Nutriciio. Maputo, Moc;;ambique.
Ministry of Co-operation e UNICEF. 1990. The situation of children and women in Mozambique. Maputo, Moc;;ambique: UNICEF.
Ministry of Health e Eduardo Mondlane University Faculty of Medicine. 1988. Evaluating the management of diarrhea in health centers in Mozambique. Journal of Tropical Medicine and Hygiene 91:61-66.
Mock, N.B., T.A Sellers, AA Abdoh, e R.R. Franklin. 1993. Socioeconomic, environmental, demographic and behavioral factors associated with occurrence of diarrhea in young children in the Republic of Congo. Social Science and Medicine 36(6):807-816.
Molbak, K., H. Jensen, L. Ingholt, e P. Aaby. 1997. Risk factors for diarrheal disease incidence in early childhood: A community cohort study from Guinea-Bissau. American Journal of Epidemiology 146(3):273-282.
Molla, A, AM. Molla, S.A. Sarker, e M. Khatun. 1983. Whole-gut transit time and its relationship to absorption of macronutrients during diarrhea and after recovery. Scandinavian Journal of Gastroenterology 18:537-543.
Moore, M., e M. Favin. 1990. Behavioral determinants of maternal health care choices in developing countries. MotherCare Working Paper No.2. Arlington, Virginia: MotherCarelJSI.
Mosley, W.H. e L.C. Chen. 1984. Child survival strategies for research. Population and Development Review, A Supplement to Volume 10. New York:The Population Council.
National Statistical Office (NSO) [Malawi] e Macro International Inc. (MI). 1994. Malawi Demographic and Health Survey 1992. Calverton, Maryland (USA): NSO and MI.
Olinto, M.T.A, C.G. Victora, F.e. Barros, e D.P. Gigante. 1995. Twenty-four-hour recall overestimates the dietary intake of malnourished children. American Journal of Nutrition 125 :880-884.
Pelletier, D.L., E.A Frongillo, e J.P. Habicht. 1993. Epidemiologic evidence for a potentiating effect of malnutrition on child mortality. American Journal of Public Health 83:1130-1133.
Perez-Escamilla, R., S. Segura-Millan, J. Canahuati, e H. Allen. 1996. Prelacteal feeds are negatively associated with breastfeeding outcomes in Honduras. Journal of Nutrition 126(11):2765-73.
Piwoz, E. G., H. Creed de Kanashiro, G. Lopez de Romafia, R.E. Black, e K.B. Brown. 1994. Potential for misclassification of infants' usual feeding practices using 24-hour dietary assessment methods. Journal of Nutrition 125: 57-65.
Rahaman, M.M. e M.A Wahed. 1983. Direct nutrient loss and diarrhea. Em Diarrhea and Malnutrition: Interactions, Mechanisms, and Interventions, ed. L.C. Chen e N.S. Scrimshaw. New York: Plenum Press. 155-160.
Republica de Moc;;ambique. 1998. Estrategia de Seguranra Alimentar e Nutri,ao. Maputo, Moc;;ambique.
93
Ricci, lA. e S. Becker. June 1996. Risk factors for wasting and stunting among children in Metro Cebu, Philippines. American Journal of Clinical NUJrition 63(6):966-976.
Righard, L., e M.O. Alade. 1990. Effect of delivery room routines on success of fIrst breast-feed. Lancet 336(8723):1105-1107.
Rosenberg, LH., N.W. Solomons, e R.E. Schneider. 1977. Malabsorption association with diarrhea and intestinal infections. American Journal of Clinical Nutrition 30:1248-1253.
Rutstein, S. 1996. Factors influencing the nutritional status of mothers and children in sub-Saharan Africa: An analytical report based on the Demographic and Health Surveys. Calverton: Macro International Inc.
Sachdev, H.P.S., J. Krishna, R.K. Puri, L. Satyanarayana, e S. Kumar. 1991. Water supplementation in exclusively breastfed infants during summer in the tropiCS. Lancet 337(8747):929-933.
Scrimshaw, N.S., C.E. Taylor, e J.E. Gordon. 1968. Interaction of nutrition and infection. World Health Organization Monograph Series No. 57. Geneva: World Health Organization.
United Nations Children's Fund (UNICEF). 1998. The state of the world's children 1999. New York: UNICEF.
UNICEF e World Health Organization (WHO). 1992. Low birth weight: A tabulation of available information. Geneva: WHO.
UNICEF. 1990. Strategy for improved nutrition of children and women in developing countries. New York: UNICEF.
Victora, e.G., S.R. Huttly, S.C. Fuchs, e M.T.A. Olinto. 1997. The role of conceptual frameworks in epidemiological analysis: A hierarchical approach International Journal of Epidemiology 26(1):224-227.
Victora, C.G., lP. Vaughan, C. Lombardi, S.M. Fuchs, L.P. Gigante, P.G. Smith, L.C. Nobre, A.M. Teixeira, L.B. Moreira, e F.C. Barros. 1987. Evidence for protection by breastfeeding against infant deaths from infectious diseases in Brazil. Lancet 2(8554):319-321.
Villar, J. e J.M. Belizan. 1982. The relative contribution of prematurity and fetal growth retardation to low birth weight in developing and developed countries. American Journal of Obstetrics and Gynecology 143:793.
World Bank. 1997. War-to-peace transition in Mozambique: The provincial reintegration support program. Findings, Africa Region 90.
World Bank. 1993. World development report 1993. New York: Oxford University Press.
World Federation of Public Health Associations (WFPHA). 1983. Maternal nutrition: Information for action-resource guide. Prepared by UNICEF.
World Health Organization (WHO). 1979. A guideline for the measurement of nutritional impact of supplementary feeding programs aimed at vulnerable groups. Geneva: WHO.
World Health Organization (WHO) e UNICEF. 1990. Meeting on breastfeeding in the 1990s: A Global Initiative. Innocenti Declaration on the Protection, Promotion, and Support of Breastfeeding. Florence, Italy, I August, 1990. UNICEF, New York. 94
World Health Organization (WHO). 1991. Maternal and perinatal infections: Report of a WHO consultation. Geneva: WHO.
World Health Organization (WHO). 1992a. The prevalence of anemia in women: A tabulation of available information. Geneva: WHO.
World Health Organization (WHO). 1992b. Low birth weight: A tabulation of available information. Geneva: WHO.
World Health Organization (World Health Assembly). 1994. Infant and child nutrition. Resolution 47.5 of the 47th World Health Assembly, Geneva, 9 May 1994. Geneva: World Health Organization.
World Health Organization (WHO). 1996. Perinatal mortality: A listing of available information. Geneva: WHO.
World Health Organization (WHO). 1996b. WHO Global Data Bank on Breast-Feeding, Breast-feeding: The best start in life. Geneva: Nutrition Unit, WHO.
World Health Organization (WHO). 2000. Effect of breastfeeding on infant and child mortality due to infectious diseases in less developed countries: A pooled analysis. Lancet 355 :451-455.
95
APENDICEA
PLANO DE SONDAGEM
APENDICEA
PLANO DE SONDAGEM
o IDSM foi levado a cabo nas dez provincias M~ambicanas: Niassa, Cabo Delgado, Nampula, ZamMzia, Tete, Manica, Sofala, Inhambane, Gaza e Maputo. A cidade de Maputo, que e vista como uma unidade administrativa separada do resto da provincia de Maputo, e considerada uma regUlo It parte no IDSM.
A sondagem do IDSM foi planeada para ser representativa do myel nacional, provincial e ruralurbano. A selecc;:ao da sondagem foi realizada em duas fases. Na altnra da preparac;:ao da estrutura da sondagem, havia informac;:ao pre-censo apenas para as areas urbanas. Para as areas rurais, a sondagem das areas do inventilrio estatistico foi criada a partir de uma lista de municipios retirada das listas eleitorais das eleic;:oes gerais de 1994. Na primeira fase, procedeu-se It selecc;:ao das areas de inventario estatistico sendo a probabilidade proporcional It extensao da area. Na segunda fase, procedeu-se It selecc;:ao dos agregados farniliares em cada area do inventario estatistico sendo a probabilidade inversamente proporcional It extensao da area de modo a tomar a sondagem auto-ponderadora a myel de cada provincia.
As onze regioes da sondagem foram divididas em vinte e uma camadas. Das trezentas e noventa e oito areas do inventario estatistico, foram escolhidos 40 gropos finais na capital, 88 nas outras areas urbanas e 270 nas areas rurais. A sondagem de agregados familiares da segunda fase consistiu numa media de 20 agregados familiares seleccionados ao acaso em areas urbanas e numa media de 32 agregados familiares seleccionados ao acaso em areas rurais. Em todos os agregados familiares seleccionados, todos os membros da familia foram registados no questionario para os agregados familiares, e todas as muiheres entre os 15 e 49 anos foram identificadas e entrevistadas com a ajuda do questionario pormenorizado para as mulheres.
Foram seleccionados 11,059 agregados familiares na totalidade, 9,681 dos quais foram identificados na altura do inquerito. Dos agregados familiares que foram identificados, urn total de 9,279 foram entrevistados com exito, produzindo uma percentagem de resposta dos agregados familiares de 95.9%. 0 inquerito identificou 9,590 mulheres elegiveis, 8.779 das quais foram entrevistadas com exito, produzindo uma percentagem de resposta de mulheres individuais de 91.5%.
Os dados referentes It mortalidade foram recolhidos para todas as crianc;:as nascidas das mulheres entrevistadas, e os dados relativos It saUde e vacinac;:ao foram recolhidos para 4,207 crianc;:as nascidas desde Janeiro de 1994 (entre os 0-35 meses de idade) das mulheres entrevistadas. As questOes acerca dos dados referentes 11 morbiJidade, nutric;:ao e cuidados de sande recentes foram completadas para 3,803 crianc;:as sobreviventes (0-35 meses de idade); estas questoes incluem a hist6ria da amamentac;:ao, padr6es de alimentac;:ao, e a ocorrencia e tratamento da diarreia, febre e tosse nas duas semanas anteriores ao inquerito. Este relat6rio e baseado na sub-sondagem de 2,837 crianc;:as sobreviventes (0-35 meses de idade) para as quais estao dispomveis dados antropometricos completos.
99
APENDICEB
CARACTERisTICAS BAsICAS DO AGREGADO FAMILIAR E RESPONSAvEIS
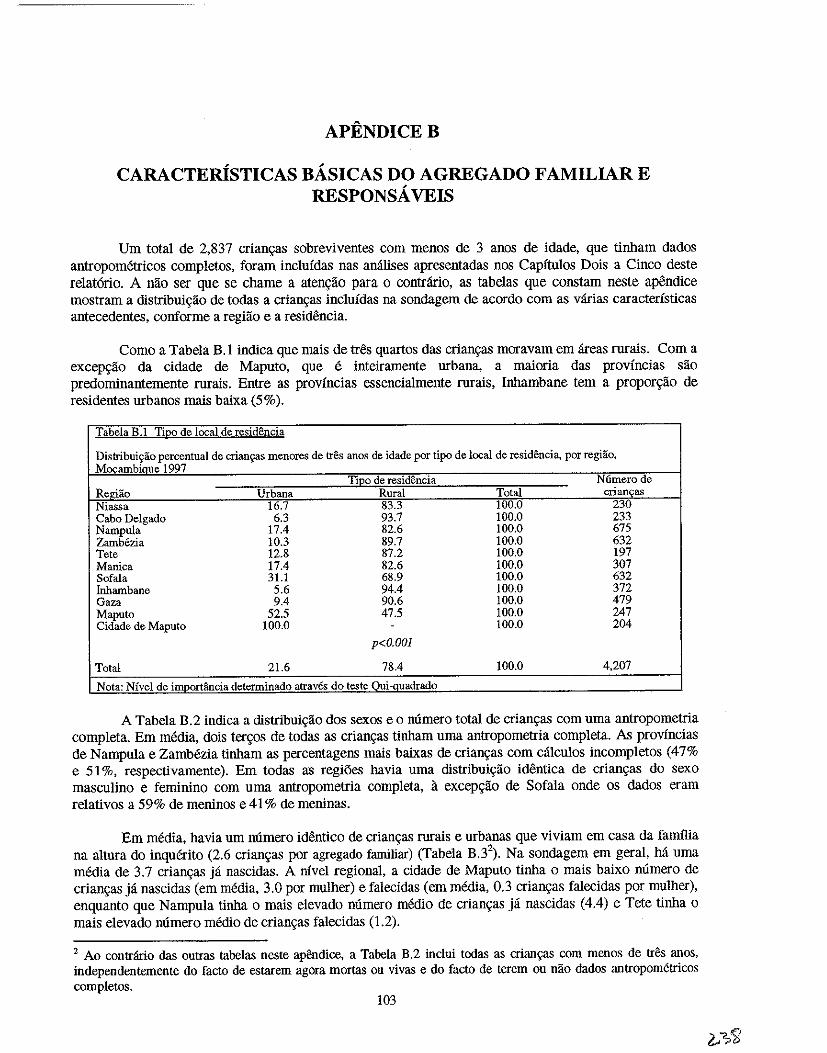
APENDICEB
CARACTERisTICAS BA.SICAS DO AGREGADO FAMILIAR E RESPONSA. VEIS
Urn total de 2,837 crian9as sobreviventes com menos de 3 anos de idade, que tinbam dados antropometricos completos, foram inclufdas nas amllises apresentadas nos Capitnlos Dois a Cinco deste relat6rio. A nao ser que se chame a aten9ao para 0 contHlrio, as tabelas que constam neste apendice mostram a distribui<;:iio de todas a crian<;as incluidas na sondagem de acordo com as varias caracteristicas antecedentes, conforme a regiiio e a residencia.
Como a Tabela B.l indica que mais de tres quartos das crian<;as moravam em areas rurais. Com a excep<;ao da cidade de Maputo, que e inteiramente urbana, a maioria das provfncias sao predominantemente rurais. Entre as provincias essencialmente rurais, Inhambane tern a prOPOr9ao de residentes urbanos mais baixa (5%).
TabeJa B.1 TiQo de local de residencia
Distrihuicrao percentual de crian\=as menores de tres anos de idade por tipo de local de residencia, por regHio, ~ambique 1997
TiJ2:2 de residencia N6merode Regiao Urbana Rural Total crian~as Niassa 16.7 83.3 100.0 230 Cabo Delgado 6.3 93.7 100.0 233 Nampula 17.4 82.6 100.0 675 Zambezia 10.3 89.7 100.0 632 Tete 12.8 87.2 100.0 197 Manica 17.4 82.6 100.0 307 Sofala 31.1 68.9 100.0 632 fuhambane 5.6 94.4 100.0 372 Gaza 9.4 90.6 100.0 479 Maputo 52.5 47.5 100.0 247 Cidade de Maputo 100.0 . 100.0 204
p<O.OOl
Total 21.6 78.4 100.0 4,207
Nota: Nfvel de inmorHincia determinado atraves do teste Oui·auadrado
A Tabela B.2 indica a distribui<;iio dos sexos eo numero total de crian<;:as com uma antropometria completa. Em media, dois ter<;os de todas as crian<;as tinbam uma antropometria completa. As provincias de Nampula e ZamMzia tinbam as percentagens mais baixas de crian<;as com calculos incompletos (47% e 51 %, respectivamente). Em todas as regiOes havia uma distribui<;:iio identica de crian<;as do sexo masculino e feminino com uma antropometria completa, il. excep<;iio de Sofala onde os dados eram relativos a 59% de meninos e 41 % de meninas.
Em media, havia urn numero identico de crian<;as rurais e urbanas que viviam em casa da familia na altura do inquerito (2.6 crian<;as por agregado familiar) (Tabela B.32
). Na sondagem em geral, M urna media de 3.7 crian<;as ja nascidas. A nivel regional, a cidade de Maputo tinba 0 mais baixo numero de crian<;as ja nascidas (em media, 3.0 por mulher) e falecidas (em media, 0.3 crian<;as falecidas por mulher), enquanto que Nampula tinha 0 mais elevado numero medio de crian<;as ja nascidas (4.4) e Tete tinba 0
mais elevado numero medio de crian9as falecidas (1,2).
2 Ao contr:irio das outras tabelas neste apendice, a Tabela B.2 inclui todas as crian~ com menos de tres anos, independentemente do facto de estarem agora mortas ou vivas e do facto de terem ou nao dados antropometricos completos.
103
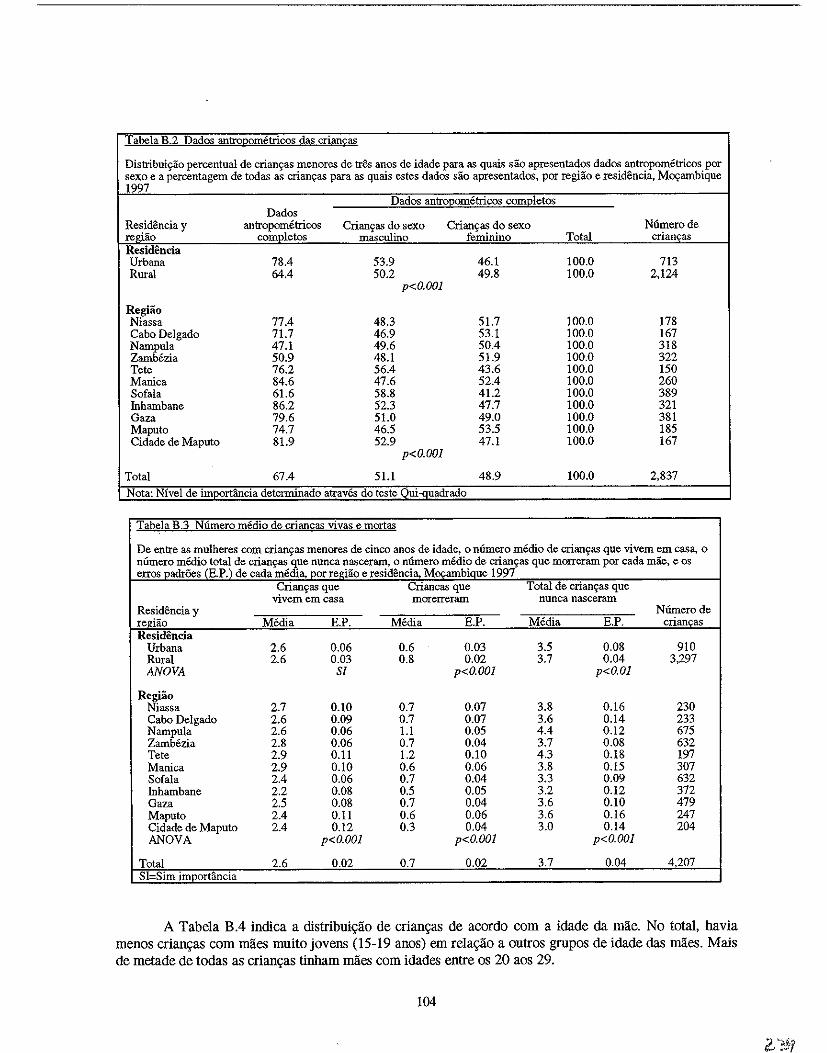
T abela B.2 Dados antroPQrnPtricos das criancas
Distribuic;ao percentual de crian~as menores de tres anos de idade para as quais sao apresentados dados antropometricos por sexo e a percentagem de todas as crianc;:as para as quais estes dados sao apresentados, por regiao e resid8ncia, Mcx;:ambique 1997
Dados antrO.l2ometricos com2Ietos Dados
Resid8ncia y antropometricos Crianc;as do sexo Crianc;as do sexo Numerode regiao completos masculino feminino Total crianc;:as Residencia Urbana 78.4 53.9 46.1 100.0 713 Rural 64.4 50.2 49.8 100.0 2,124
p<O.OOl
Regiao Niassa 77.4 48.3 51.7 100.0 178 Cabo Delgado 71.7 46.9 53.1 100.0 167 Nampula 47.1 49.6 50.4 100.0 318 Zamb6zia 50.9 48.1 51.9 100.0 322 Tete 76.2 56.4 43.6 100.0 150 Manica 84.6 47.6 52.4 100.0 260 Sofala 61.6 58.8 41.2 100.0 389 Inhambane 86.2 52.3 47.7 100.0 321 Gaza 79.6 51.0 49.0 100.0 381 Maputo 74.7 46.5 53.5 100.0 185 Cidade de Maputo 81.9 52.9 47.1 100.0 167
p<O.OOl
Total 67.4 51.1 48.9 100.0 2,837
Nota: Nivel de imoortancia determinado atraves do test~ __ Qui~g~adrado
Tab~la B.3 Niimero medio de crian£as vivas e mortas
De entre as mulheres com crianc;as menores de cinco anos de idade, 0 niimero medio de crianc;as que vivem em eas:a, 0
nfunero medio total de crian~as que nunea nasceram, 0 niimero medio de crianc;as que morreram por eada mae, e os eITOS Dadr6es (H.P.) de cada media, Dor redao e residencia, Mocambiaue 1997
Crianc;as que Crianeas que Total de erian~as que vivem em easa morerreram nunca naseeram
Residencia y Niimerode regiao Media E.P. Media E.P. Media E..P. eriancas Residencia
Urbana 2.6 0.06 0.6 0.03 3.5 0.08 910 Rural 2.6 0.03 0.8 0.02 3.7 0.04 3,297 ANOVA Sf p<O.OOl p<O.Ol
Regiao Niassa 2.7 0.10 0.7 0.07 3.8 0.16 230 Cabo Delgado 2.6 0.09 0.7 0.07 3.6 0.14 233 Nampula 2.6 0.06 1.1 0.05 4.4 0.12 675 Zamb6zia 2.8 0.06 0.7 0.04 3.7 0.08 632 Tete 2.9 0.11 1.2 0.10 4.3 0.18 197 Manica 2.9 0.10 0.6 0.06 3.8 0.15 307 Sofala 2.4 0.06 0.7 0.04 3.3 0.09 632 Inhambane 2.2 0.08 0.5 0.05 3.2 0.12 372 Gaza 2.5 0.08 0.7 0.04 3.6 0.10 479 Maputo 2.4 0.11 0.6 0.06 3.6 0.16 247 Cidade de Maputo 2.4 0.12 0.3 0.04 3.0 0.14 204 ANOVA p<O.OOl p<O.OOl p<O.OOl
Total 2.6 0.02 0.7 0.02 3.7 0.Q4 4207 SI Sim imoortancia
A Tabela B.4 indica a distribui\(ao de crian\(as de acordo com a idade da mae. No tOlal, havia menos crian\(as com mlies muito jovens (15-19 anos) em rela\(ao a outros grupos de idade das maes. Mais de melade de todas as crian\(as tinham maes com idades entre os 20 aos 29.
104
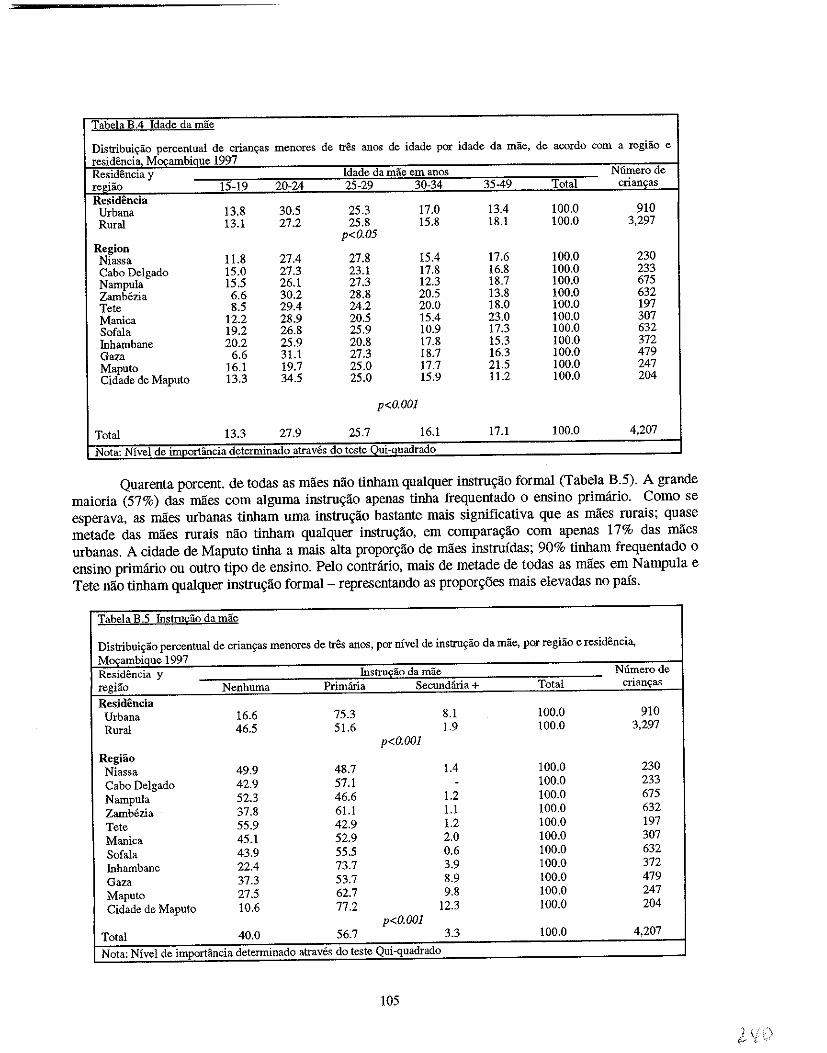
Tabela B.4 Idade da mae
Distribui~ao percentual de crian~as menores de tr& anos de idade pOI idade da mae, de acordo com a regiao e residencia MOI'ambique 1997 Residencia y Idade da mae em anos Numerode regiao 15-19 20-24 25-29 30-34 35-49 Total crianFs Residencia
Urbana 13.8 30.5 25.3 17.0 13.4 100.0 910 Rural 13.1 27.2 25.8 15.8 18.1 100.0 3,297
p<O.05 Region Niassa 11.8 27.4 27.8 15.4 17.6 100.0 230 Cabo Delgado 15.0 27.3 23.1 17.8 16.8 100.0 233 Nampula 15.5 26.1 27.3 12.3 18.7 100.0 675 Zamb6zia 6.6 30.2 28.8 20.5 13.8 100.0 632 Tete 8.5 29.4 24.2 20.0 18.0 100.0 197 Manica 12.2 28.9 20.5 15.4 23.0 100.0 307 Sofala 19.2 26.8 25.9 10.9 17.3 100.0 632 Inhambane 20.2 25.9 20.8 17.8 15.3 100.0 372 Gaza 6.6 31.1 27.3 18.7 16.3 100.0 479 Maputo 16.1 19.7 25.0 17.7 21.5 100.0 247 Cidade de Maputo 13.3 34.5 25.0 15.9 11.2 100.0 204
p<O.OOl
Total 13.3 27.9 25.7 16.1 17.1 100.0 4,207
Nota: Nivel de importancia determinado atraves do teste Oui-auadrado
Quarenta porcent. de todas as maes nao tinham qualquer instru9ao formal (Tabela B.5). A grande maioria (57%) das mlies com alguma instru9ao apenas tinha frequentado 0 ensino primario. Como se esperava, as maes urbanas tinham uma instru9ao bastante mais significativa que as maes rurais; quase metade das maes rurais nilo tinham qualquer instru9ilo, em compara9ilo com apenas 17% das mlies urbanas. A cidade de Maputo tinha a mais alta ProPor9ilo de miles instruidas; 90% tinham frequentado 0
ensino primario ou outro tipo de ensino. Pelo contrario, mais de metade de todas as miles em N ampula e Tete nao tinham qualquer instru9lio formal - representando as propor90es mais elevadas no pais.
Tabela B.~ mstru£;ao da mae
Distribui~ao percentual de crian9as menores de tres anos, par nivel de instru9ao da mae, pOI regiao e residencia, MocambiQue 1997 Residencia y Instru£ao da mae Numerode regiao Nenhuma Primana Secundana+ Total crianps
Residencia Urbana 16.6 75.3 8.1 100.0 910 Rural 46.5 51.6 1.9 100.0 3,297
p<O.OOl Regiao
Niassa 49.9 48.7 1.4 100.0 230 Cabo Delgado 42.9 57.1 - 100.0 233 Nampula 52.3 46.6 1.2 100.0 675 Zambezia 37.8 61.1 1.1 100.0 632 Tete 55.9 42.9 1.2 100.0 197 Manica 45.1 52.9 2.0 100.0 307 Sofala 43.9 55.5 0.6 100.0 632 Inhambane 22.4 73.7 3.9 100.0 372 Gaza 37.3 53.7 8.9 100.0 479 Maputo 27.5 62.7 9.8 100.0 247 Cidade de Maputo 10.6 77.2 12.3 100.0 204
p<O.OOl Total 40.0 56.7 3.3 100.0 4,207
Nota: Nivel de importancia determinado atraves do teste Qui-quadrado
105
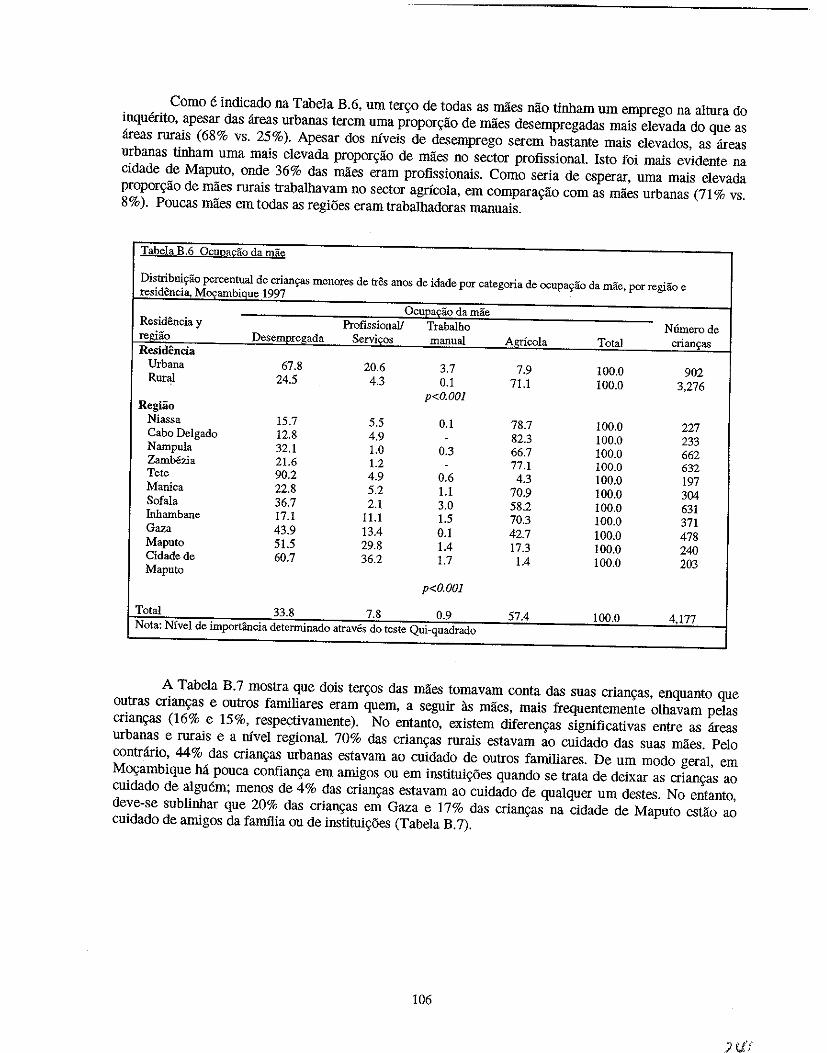
Como e indicado na Tabela B. 6, urn ter90 de todas as maes nao tinham um emprego na altura do inquerito, apesar das areas urbanas terem uma propor9ao de maes desempregadas mais elevada do que as areas rurais (68% vs. 25%). Apesar dos niveis de desemprego serem bastante mais elevados, as areas urbanas tinham uma mais elevada propor9ao de maes no sector profissional. Isto foi mais evidente na cidade de Maputo, onde 36% das maes eram profissionais. Como seria de esperar, urna mais elevada propor9ao de maes rurais trabalhavam no sector agricola, em compara9ao com as miles urbanas (71 % vs. 8%). Poucas miles em todas as regiOes eram trabalhadoras manuais.
Tabela B.6 ocuna~ao da mae
Distribuiyao percentual de crian9as menores de tres anos de idade por categoria de ocupaS'ao da mae, por regiao e residencia, Mo<;ambique 1997
OcuEa£ao da mae Residencia y Profissionall Trabalho N6merode regi1io Desempr~gada Servi£os manual Agricola Total crian'fas Residencia
Urbana 67.8 20.6 3.7 7.9 100.0 902 Rural 24.5 4.3 0.1 71.1 100.0 3,276 p<O.OOl
Regiao Niassa 15.7 5.5 0.1 78.7 100.0 227 Cabo Delgado 12.8 4.9 - 82.3 100.0 233 Nampula 32.1 1.0 0.3 66.7 100.0 662 Zamb6zia 21.6 1.2 - 77.1 100.0 632 Tete 90.2 4.9 0.6 4.3 100.0 197 Manica 22.8 5.2 1.1 70.9 100.0 304 Sofala 36.7 2.1 3.0 58.2 100.0 631 Inhambane 17.1 11.1 1.5 70.3 100.0 371 Gaza 43.9 13.4 0.1 42.7 100.0 478 Maputo 51.5 29.8 1.4 17.3 100.0 240 Cidadede 60.7 36.2 1.7 1.4 100.0 203 Maputo
p<O.OOl
Total 33.8 7.8 0.9 57.4 100.0 4.177 Nota: Nivel de importancia detenninado atraves do teste Qui-quadrado
A Tabela B.7 mostra que dOis ter90s das miles tomavam conta das suas crian9as, enquanto que outras crian9as e outros familiares eram quem, a seguir as miles, mais frequentemente olhavam pelas crian9as (16% e 15%, respectivamente). No entanto, existem diferen9as significativas entre as areas urbanas e rurais e a mvel regional. 70% das crian9as rurais estavam ao cuidado das suas miles. Peio contrario, 44% das crian9as urbanas estavam ao cuidado de outros familiares. De um modo geral, em M09ambique M pouca confian9a em amigos ou em institui96es quando se trata de deixar as crian9as ao cuidado de alguem; menos de 4% das crian9as estavam ao cuidado de qualquer um de.~tes. No entanto, deve-se sublinhar que 20% das crian9as em Gaza e 17% das crian9as na cidade de Maputo estao ao cuidado de amigos da fanulia ou de institui96es (Tabeia B. 7).
106
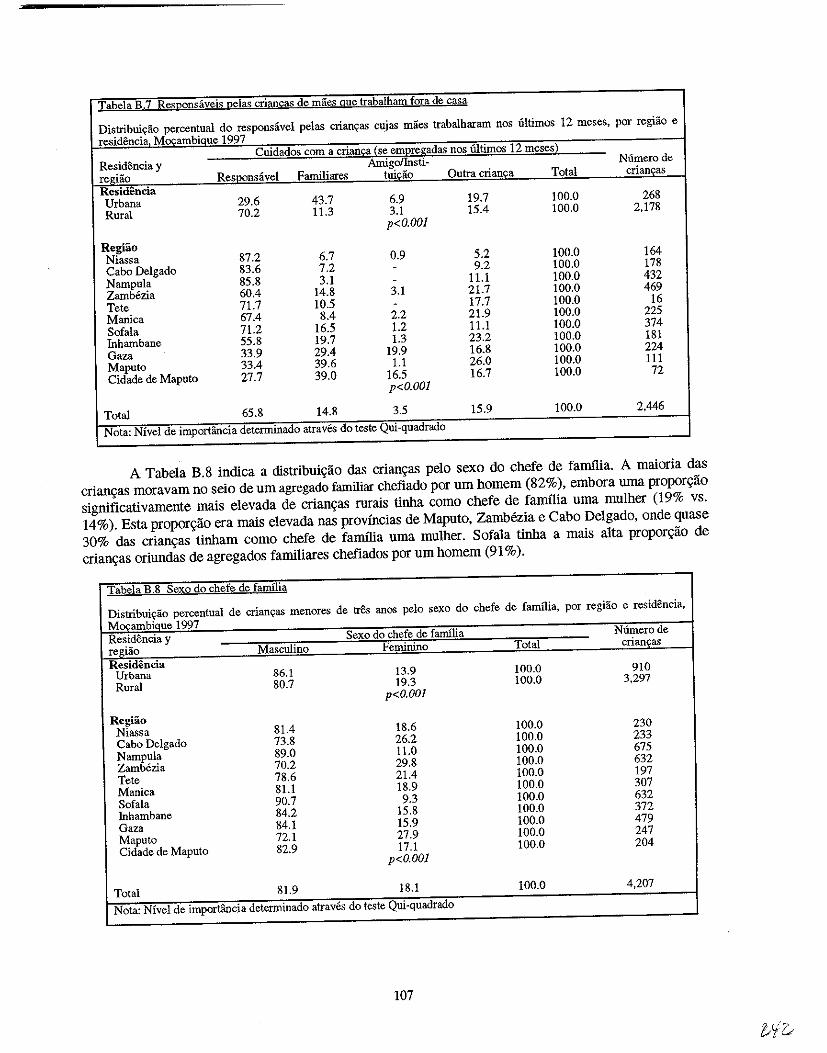
Tabela B.7 Re:;;;ponsaveis pelas criancas de maes que trabalham fora de casa
Distribuiyao percentual do responsavel pelas crian~as cujas maes trabalharam nos iiltimos 12 meses, por regiao e
residencia, M()\:ambiQue 1997 Cuidados com a crian£a {se em2regadas nos llitimos 12 meses)
Resid6ncia y Amigollnsti- Numerode
regiao ReS:I~9nSavel Familiares tuiciio Outra crianca Total crian~as
Residencia Urbana 29.6 43.7 6.9 19.7 100.0 268
Rural 70.2 11.3 3.1 15.4 100.0 2,178
p<O.OOI
Regiao Niassa 87.2 6.7 0.9 5.2 100.0 164
Cabo Delgado 83.6 7.2 - 9.2 100.0 178
Narnpula 85.8 3.1 - 11.1 100.0 432
Zamb6zia 60.4 14.8 3.1 21.7 100.0 469
Tete 71.7 10.5 - 17.7 100.0 16
Manica 67.4 8.4 2.2 21.9 100.0 225
Sofala 71.2 16.5 1.2 11.1 100.0 374
Inhamhane 55.8 19.7 1.3 23.2 100.0 181
Gaza 33.9 29.4 19.9 16.8 100.0 224
Maputo 33.4 39.6 1.1 26.0 100.0 111
Cidade de Maputo 27.7 39.0 16.5 16.7 100.0 72
p<O.OOJ
Total 65.8 14.8 3.5 15.9 100.0 2,446
Nota: Nivel de importancia determinado atraves do teste Qui·quadrado
A Tabe1a B.8 indica a distribuic;;ao <las crianc;;as pe10 sexo do chefe de familia. A maioria das
crianc;;as moravam no seio de urn agregado familiar chefiado por urn homem (82%), embora uma proporc;;ao
significativamente mais elevada de crianc;;as rurais tinha como chefe de famIlia uma mulher (19% vs.
14%). Esta proporc;;ao era mais e1evada nas prov(ncias de Maputo, Zambezia e Cabo Delgado, onde quase
30% das crianc;;as tinham como chefe de familia uma mu1her. Sofa1a tinha a mais alta proporc;;ao de
crianc;;as oriundas de agregados familiares chefiados por urn homem (91 % ).
Tabela B .8 Sexo do chefe de familia
Distribuiyao percentual de criancas menores de tres anos pelo sexo do chefe de familia, por regiao e residencia,
M()\:ambiQue 1997 Residencia y Sexo do chefe de familia Numerode
regiao Masculino Feminino Total crianyas
Residencia Urbana 86.1 13.9 100.0 910
Rural 80.7 19.3 100.0 3,297 p<O.OOl
Regiao Niassa 81.4 18.6 100.0 230
Cabo Delgado 73.8 26.2 100.0 233
Nampula 89.0 11.0 100.0 675
Zamb6zia 70.2 29.8 100.0 632
Tete 78.6 21.4 100.0 197
Manica 81.1 18.9 100.0 307
Sofala 90.7 9.3 100.0 632
fuhambane 84.2 15.8 100.0 372
Gaza 84.1 15.9 100.0 479
Maputo 72.1 27.9 100.0 247
Cidade de Maputo 82.9 17.1 100.0 204
p<O.OOI
Total 81.9 18.1 100.0 4,207
Nota: Nivel de importancia determinado atraves do teste Qui·quadrado
107
1 ".h Wt'&
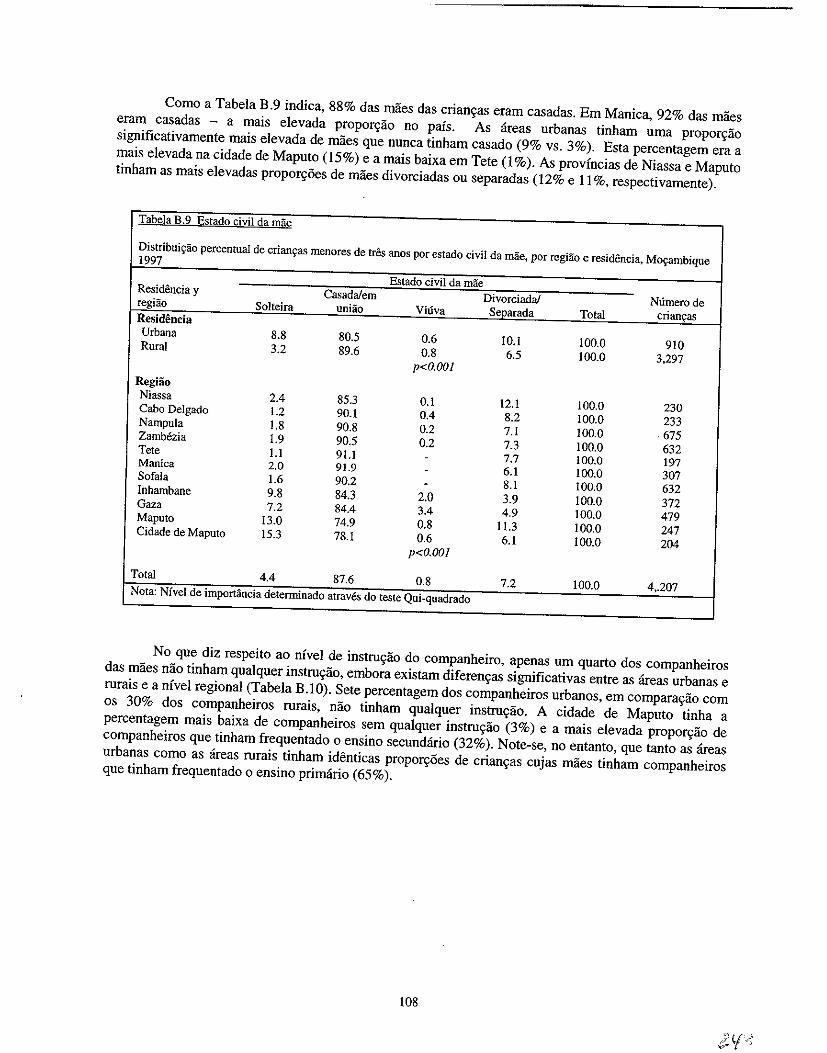
Como a Tabela B.9 indica, 88% das miies das crianyas eram casad as. Em Manica, 92% das maes eram casadas - a mais elevada proporyiio no pais. As areas urbanas tinham uma proporyiio significativamente mais elevada de maes que nunca tinham casado (9% vs. 3%). Esta percentagem era a mais elevada na cidade de Maputo (15%) e a mais baixa em Tete (l %). As provlncias de Niassa e Maputo tinham as mais elevadas propor~i5es de miies divorciadas ou separadas (12% e 11 %, respectivamente).
Tabela B.9 Estado civil da mae
Distribui'Yao percentual de crian~as menoces de tees anos por estado civil da mae, por regHio e residencia, Mo~ambique 1997
Estado civil da mae Residencia y Casada/em Divorciadal Numero de regiao Solteira unHio Viuva Separada Total crian~as Residencia Urbana 8.8 80.5 0.6 10.1 100.0 910 Rural 3.2 89.6 0.8 6.5 100.0 3.297
p<O.OOI Regiao Niassa 2.4 85.3 0.1 12.1 100.0 230 Cabo De[gado 1.2 90.1 0.4 8.2 100.0 233 Nampu[a 1.8 90.8 0.2 7.1 100.0 675 Zambezia 1.9 90.5 0.2 7.3 100.0 632 Tete l.i 91.1 - 7.7 100.0 197 Manica 2.0 91.9 - 6.1 100.0 307 Sofa[a 1.6 90.2 - 8.1 100.0 632 Inhambane 9.8 84.3 2.0 3.9 100.0 372 Gaza 7.2 84.4 3.4 4.9 100.0 479 Maputo 13.0 74.9 0.8 [1.3 [00.0 247 Cidade de Maputo 15.3 78.1 0.6 6.1 100.0 204
p<O.OOI
Total 4.4 87.6 0.8 7.2 100.0 4 •. 207 Nota: Nfvel de importancia detenninado atraves do teste Qui-quadrado
No que diz respeito ao nlvel de instru~ao do companheiro, apenas urn qnarto dos companheiros das maes nao tinham qualquer instruyao, embora existam diferen~as significativas entre as areas urbanas e rurais e a nlvel regional (Tabela B.IO). Sete percentagem dos companheiros urbanos, em comparayao com os 30% dos companheiros rurais, nao tinham qualquer instru~ao. A cidade de Maputo tinha a percentagem mais baixa de companheiros sem qualquer instru~ao (3%) e a mais elevada propor~ao de companheiros que tinham frequentado 0 ensino secundario (32%). Note-se, no entanto, que tanto as areas urbanas como as areas rurais tinham identicas propor~i5es de crian~as cujas maes tinham companheiros que tinham frequentado 0 ensino primario (65%).
108
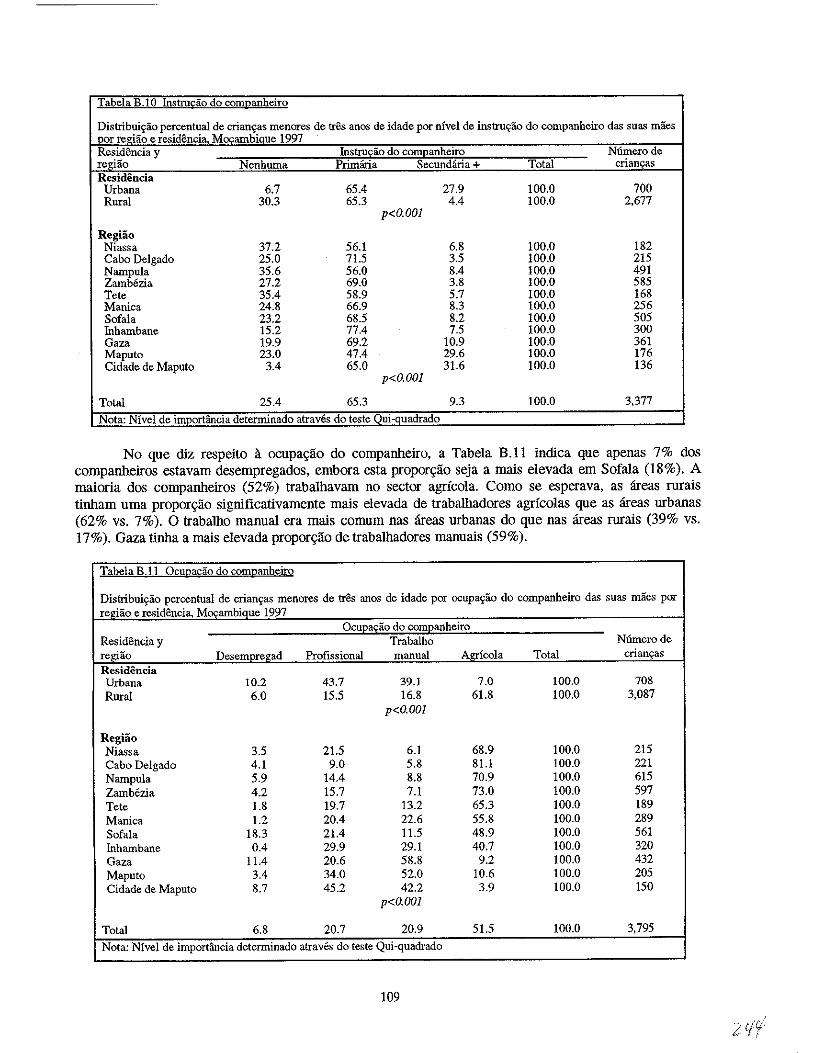
Tabela B.IO Instrudio do companheiro
Distribui~ao percentual de crian~as menores de tres anos de idade por nfvel de instruej:ao do companheiro das suas maes ~r regiiio e residencia 1tOl'ambique 1997
Residencia y Instrucao do companheiro N6.mero de regHio Nenhuma Primana Secundana+ Total criancas Residencia
Urbana 6.7 65.4 27.9 100.0 700 Rural 30.3 65.3 4.4 100.0 2,677
p<O.OOI
Regiao Niassa 37.2 56.1 6.8 100.0 182 Cabo Delgado 25.0 71.5 3.5 100.0 215 Nampula 35.6 56.0 8.4 100.0 491 Zambezia 27.2 69.0 3.8 100.0 585 Tete 35.4 58.9 5.7 100.0 168 Manica 24.8 66.9 8.3 100.0 256 Sofala 23.2 68.5 8.2 100.0 505 Inhambane 15.2 77.4 7.5 100.0 300 Gaza 19.9 69.2 10.9 100.0 361 Maputo 23.0 47.4 29.6 100.0 176 Cidade de Maputo 3.4 65.0 31.6 100.0 136
p<O.OOI
Total 25.4 65.3 9.3 100.0 3,377
Nota: Nfvel de importancia determinado atraves do teste Oui-quadrado
No que diz respeito a ocupa9lio do companheiro, a Tabela B.ll indica que apenas 7% dos companheiros eslavam desempregados, embora esla proporgao seja a mais elevada em Sofala (18%). A maioria dos companheiros (52%) trabalhavam no sector agricola. Como se esperava, as areas mrais tinham uma propor9ao significativamente mais elevada de trabalhadores agricolas que as areas urbanas (62% vs. 7%). 0 trabalho manual era mais comum nas areas urbanas do que nas areas rurais (39% vs. 17%). Gaza tinha a mais elevada propor9lio de trabalhadores manuais (59%).
Tabela B.lI Ocupacao do companbeiro
Distribuiyao percentual de crianyas menores de tres anos de idade por ocupa~ao do companbeiro das suas maes por re~dao e residencia. Mocambique 1997
Ocueas;ao do comEanheiro Residencia y Trabalho N6merode regiao Desempregad Profissional manual Agricola Total crianyas Residencia Urbana 10.2 43.7 39.1 7.0 100.0 708 Rural 6.0 15.5 16.8 61.8 100.0 3,087
p<O.OOl
Regiao Niassa 3.5 21.5 6.1 68.9 100.0 215 Cabo Delgado 4.1 9.0 5.8 81.1 100.0 221 Nampula 5.9 14.4 8.8 70.9 100.0 615 Zambezia 4.2 15.7 7.1 73.0 100.0 597 Tete 1.8 19.7 13.2 65.3 100.0 189 Manica 1.2 20.4 22.6 55.8 100.0 289 Sofala 18.3 21.4 11.5 48.9 100.0 561 Inhambane 0.4 29.9 29.1 40.7 100.0 320 Gaza 11.4 20.6 58.8 9.2 100.0 432 Maputo 3.4 34.0 52.0 10.6 100.0 205 Cidade de Maputo 8.7 45.2 42.2 3.9 100.0 150
p<O.OOI
Total 6.8 20.7 20.9 51.5 100.0 3,795 Nota: Nfvel de importancia determinado atraves do teste Qui-quadrado
109
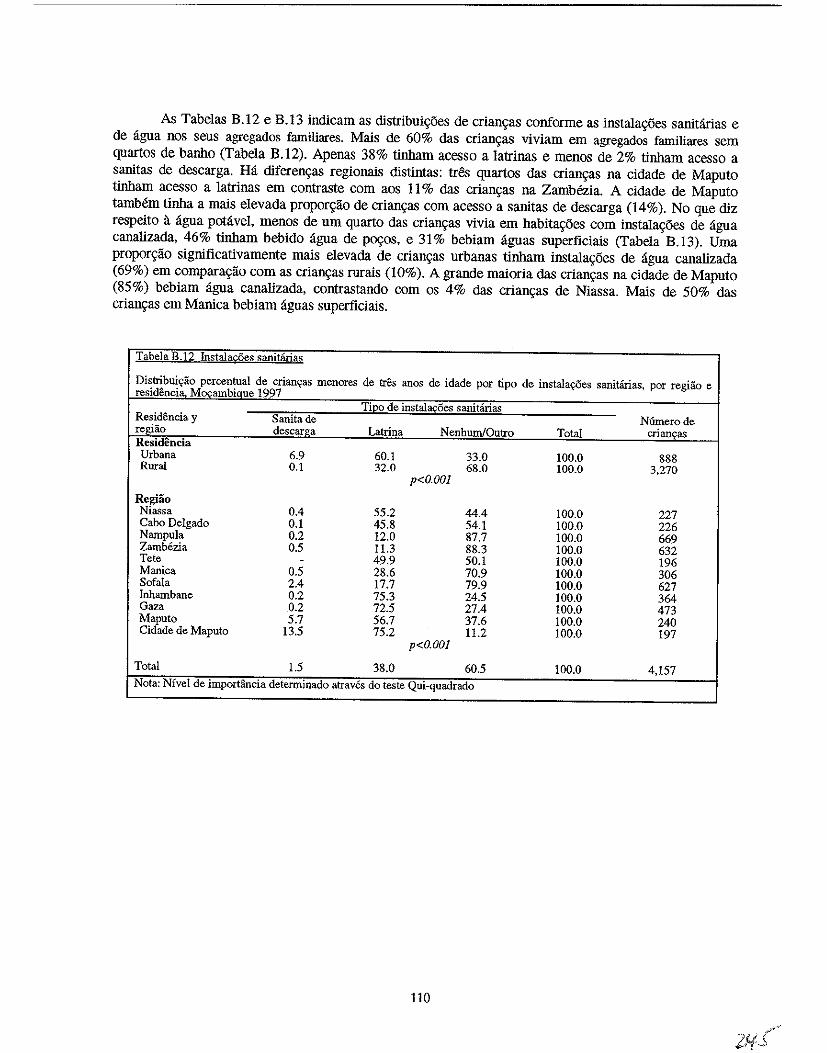
As Tabelas B .12 e B.13 indicam as distribui\ioes de crian\ias conforme as instala\ioes sanitarias e de agua nos seus agregados familiares. Mais de 60% das crian\ias viviam em agregados familiares sem quartos de banho (Tabela B.12). Apenas 38% tinham acesso a latrinas e menos de 2% tinham acesso a sanitas de descarga. Ha diferen\ias regionais distintas: tres quartos das crian\ias na cidade de Maputo tinham acesso a latrinas em contraste com aos 11 % das crian\ias na Zambezia. A cidade de Maputo tamMm tinha a mais elevada propor\i1io de crian\ias com acesso a sanitas de descarga (14%). No que diz respeito a agua potavel. menos de urn quarto das crian\ias vivia em habita\ioes com instala\ioes de agua canalizada, 46% tinham bebido agua de PQ9os, e 31% bebiam aguas superficiais (Tabela B.13). Uma propor\i1io significativamente mais elevada de crian\ias urbanas tinham instala\ioes de agua canalizada (69%) em compara\i1io com as crian\ias rurais (10%). A grande maioria das crian\ias na cidade de Maputo (85%) bebiam agua canalizada, contrastando com os 4% das crian\ias de Niassa. Mais de 50% das crian\ias em Manica bebiam aguas superficiais.
Tabela B.12 Instala~es sanitarias
Distribui«ao percentual de crianr;:as menores de tres anos de idade por tipo de instalayCies sanitarias, por regiiio e resid~ncia. MocambiQue 1997
TiEo de instal!!£oes sanitiirias Residencia y Sanita de Numerode regiao descarga Latrina NenhumiOutro Total crian9as Residencia Urbana 6.9 60.1 33.0 100.0 888 Rural 0.1 32.0 68.0 100.0 3,270
p<O.OOl
Regiao Niassa 0.4 55.2 44.4 100.0 227 Cabo Delgado 0.1 45.8 54.1 100.0 226 Nampula 0.2 12.0 87.7 100.0 669 Zamb6zia 0.5 11.3 88.3 100.0 632 Tete - 49.9 50.1 100.0 196 Manica 0.5 28.6 70.9 100.0 306 SofaIa 2.4 17.7 79.9 100.0 627 Inhambane 0.2 75.3 24.5 100.0 364 Gaza 0.2 72.5 27.4 100.0 473 Maputo 5.7 56.7 37.6 100.0 240 Cidade de Maputo 13.5 75.2 11.2 100.0 197
p<O.OOl
Total 1.5 38.0 60.5 100.0 4,157
Nota: NiveI de importancia determinado atraves do teste Qui-quadrado
110
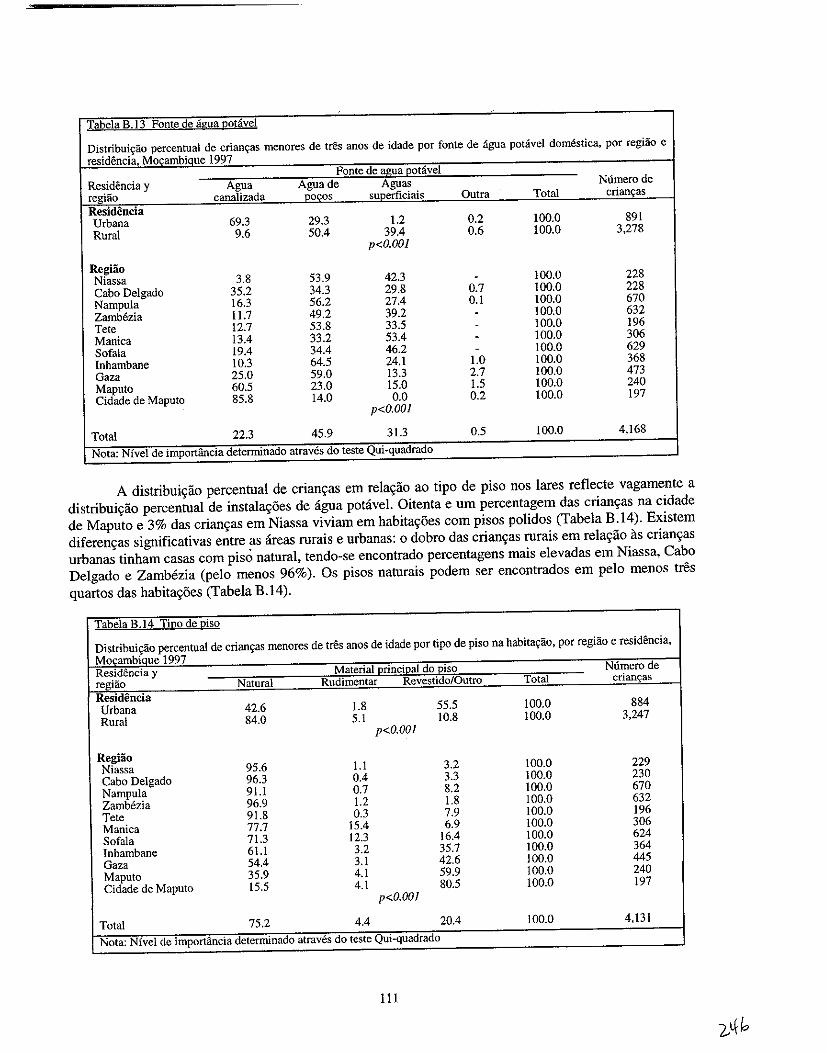
Tabela B.13 Fonte de agya I20tavel
Distribuiyao percentual de crian\=as menores de tres anos de idade por fonte de agua potavel domestica, por regiao e residoncia, Mo,ambique 1997
Fonte de a£!!a Eotavel Residencia y Agua Aguade Aguas Nurnero de regUio canalizada .locos superficiais Outra Total crianyas Residencia Urbana 69.3 29.3 1.2 0.2 100.0 891 Rural 9.6 50.4 39.4 0.6 100.0 3,278
p<O.OOI
RegHio Niassa 3.8 53.9 42.3 - 100.0 228 Cabo Delgado 35.2 34.3 29.8 0.7 100.0 228 Nampula 16.3 56.2 27.4 0.1 100.0 670 Zambezia 11.7 49.2 39.2 - 100.0 632 Tete 12.7 53.8 33.5 - 100.0 196 Manica 13.4 33.2 53.4 - 100.0 306 Sofala 19.4 34.4 46.2 - 100.0 629 Inhambane 10.3 64.5 24.1 1.0 100.0 368 Gaza 25.0 59.0 13.3 2.7 100.0 473 Maputo 60.5 23.0 15.0 1.5 100.0 240 Cidade de Maputo 85.8 14.0 0.0
p<O.OOI 0.2 100.0 197
Total 22.3 45.9 31.3 0.5 100.0 4,168
Nota: Nfvel de importfulcia determinado atraves do teste Qui-quadrado
A distribui~iio percentual de crian~as em rela~iio ao tipo de piso nos lares reflecte vagamente a distribuiyiio percentua! de instala~5es de agua potavel. Oitenta e urn percentagem das crianyas na cidade de Maputo e 3% das crian~as em Niassa viviam em habitay5es com pisos polidos (Tabela B.14). Existem diferen~as siguificativas entre as areas rurais e urbanas: 0 dobra das crian~as rurais em relayiio as crianyas urbanas tinham casas com pis.) natural, tendo-se encontrado percentagens mais elevadas em Niassa, Cabo Delgado e Zambezia (pelo menos 96%). Os pisos naturais podem ser encontrados em pelo menos tres quartos das habita~5es (Tabela B.14).
Tabela B.14 Ti~o de Uiso
Distribuiy3.o percentual de crianyas rnenores de tres anos de idade por tipo de piso na habita\=3.o, por regiao e residencia, Mocambiaue 1997 Residencia y Material (!rinciQal do I!:iso Numero de regHio Natural Rudimentar Revestido/Outro Total crian~as
Residencia Urbana 42.6 1.8 55.5 100.0 884 Rural 84.0 5.1 10.8 100.0 3,247
p<O.OOI
Regiao Niassa 95.6 1.1 3.2 100.0 229 Cabo Delgado 96.3 0.4 3.3 100.0 230 Nampula 91.1 0.7 8.2 100.0 670 Zarnrezia 96.9 1.2 1.8 100.0 632 Tete 91.8 0.3 7.9 100.0 196 Manica 77.7 15.4 6.9 100.0 306 Sofala 71.3 12.3 16.4 100.0 624 Inhambane 61.1 3.2 35.7 100.0 364 Gaza 54.4 3.1 42.6 100.0 445 Maputo 35.9 4.1 59.9 100.0 240 Cidade de Maputo 15.5 4.1 80.5 100.0 197
p<O.OOI
Total 75.2 4.4 20.4 100.0 4,131
Nota: Nfvel de importancia determinado atraves do teste Qui-quadrado
111
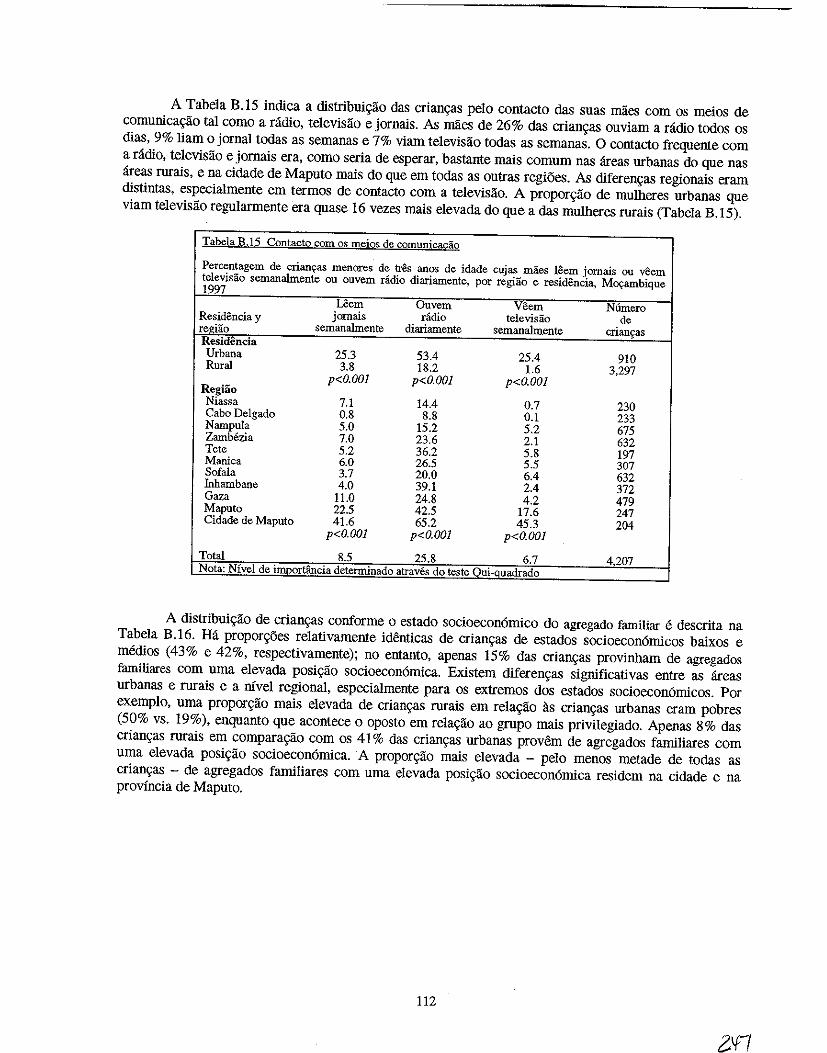
A Tabela B.15 indica a distribuigao das criangas pelo contacto das suas maes com os meios de comunicagao tal como a radio, televisao e jornais. As maes de 26% das criangas ouviam a radio todos os dias, 9% liam 0 jornal todas as semanas e 7% viam televisao todas as semanas. 0 contacto frequente com a radio, televisao e jornais era, como seria de esperar, bastante mais comum nas areas urbanas do que nas areas rurais, e na cidade de Maputo mais do que em todas as outras regioes. As diferengas regionais eram distintas, especialmente em termos de contacto com a televisao. A proporgao de mulheres urbanas que viam televisao regularmente era quase 16 vezes mais elevada do que a das mulheres mrais (Tabela B.15).
Iabela B.l5 Contacto com os meios de comunica&;:ao
Percentagem de crianyas menores de tres anos de idade cujas maes leem jomais ou veem televisao semanalmente ou ouvem radio diariamente, por regiao e residencia. M~ambique 1997
Uem Ouvem Veem N6mero Residencia y jornais radio televisao de regUio semanalmente diariamente semanalmente crians:as Residencia Urbana 25.3 53.4 25.4 910 Rural 3.8 18.2 1.6 3.297
Regiao p<O.OO] p<O.OOI p<O.OOI
Niassa 7.1 14.4 0.7 230 Cabo Delgado 0.8 8.8 0.1 233 Nampula 5.0 15.2 5.2 675 Zamb6zia 7.0 23.6 2.1 632 Tete 5.2 36.2 5.8 197 Manica 6.0 26.5 5.5 307 Sofala 3.7 20.0 6.4 632 Inhambane 4.0 39.1 2.4 372 Gaza 11.0 24.8 4.2 479 Maputo 22.5 42.5 17.6 247 Cidade de Maputo 41.6 65.2 45.3 204
p<O.OOI p<O.OOI p<O.OOI
Total 8.5 25.8 6.7 4207 Nota: Nivel de importancia determinado atraves do teste Oui-Quadrado
A distribuigao de criangas conforme 0 estado socioecon6mico do agregado familiar e descrita na Tabela B.16. Ha proporg5es relativamente identicas de criangas de estados socioecon6micos baixos e meruos (43% e 42%, respectivamente); no entanto, apenas 15% das criangas provinham de agregados familiares com uma elevada posigao socioecon6mica. Existem diferengas significativas entre as areas urbanas e rurais e a myel regional, especialmente para os extrernos dos estados socioecon6micos. Por exemplo, uma proporgao mais elevada de criangas rurais em relagao as criangas urbanas eram pobres (50% vs. 19%), enquanto que acontece 0 oposto em relagao ao grupo mais privilegiado. Apenas 8% das criangas rurais em comparagao com os 41 % das criangas urbanas provem de agregados familiares com uma elevada posigao socioecon6mica. A proporgao mais elevada - pelo menos metade de todas as criangas - de agregados familiares com uma elevada posigao socioecon6mica residem na cidade e na provincia de Maputo.
112
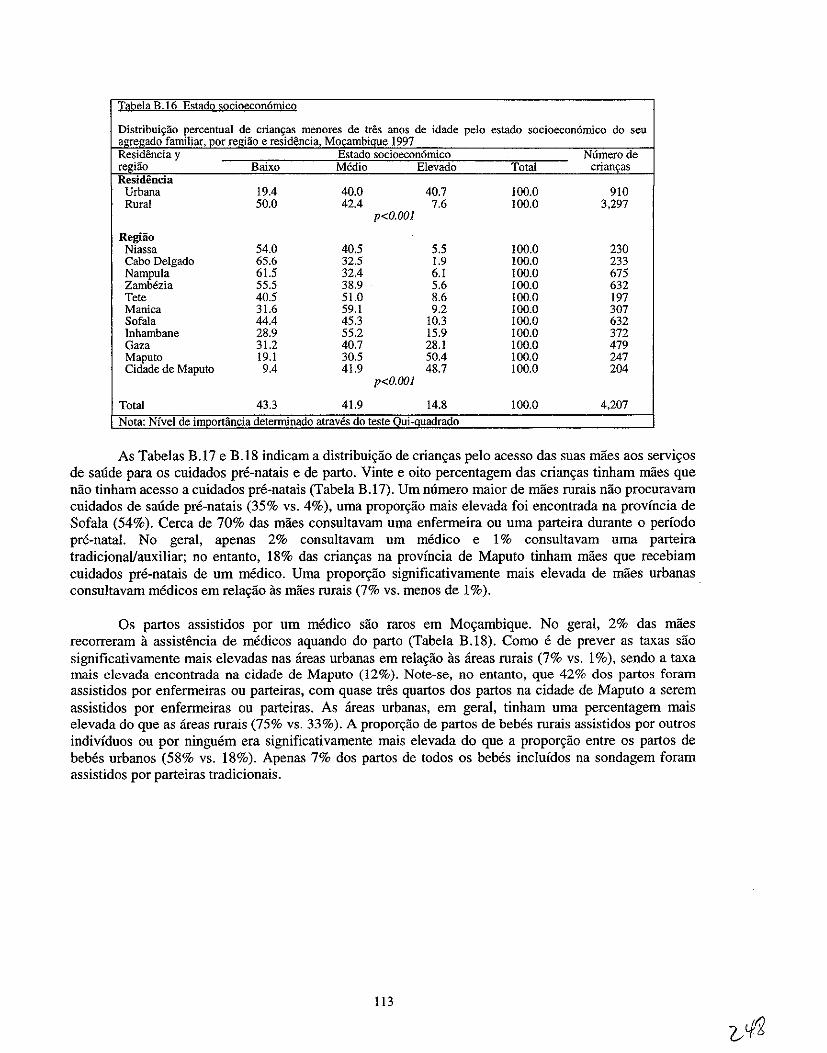
,-f.mil] , por;:e;i~o e menores de t,res ~i997 de idade pelo estado socioecon6mico do seu
y Estado ,de regiao Balx Medio Total
Urbana 19.4 40.0 40.7 100.0 910 Rural 50.0 42.4 7.6 100.0 3,297
p<O.OOI
Regiao Niassa 54.0 40.5 5.5 100.0 230 Cabo Delgado 65.6 32.5 1.9 100.0 233 Nampula 61.5 32.4 6.1 100.0 675 Zamb6zia 55.5 38.9 5.6 100.0 632 Tete 40.5 51.0 8.6 100.0 197 Manica 31.6 59.1 9.2 100.0 307 Sofa1a 44.4 45.3 10.3 100.0 632 Inhambane 28.9 55.2 15.9 100.0 372 Gaza 31.2 40.7 28.1 100.0 479 Maputo 19.1 30.5 50.4 100.0 247 Cidade de Maputo 9.4 41.9 48.7 100.0 204
p<O.OOI
Total 43.3 41.9 14.8 100.0 4,207
Nota: Nivel de i , atraves do teste'
As Tabelas B.17 e B.IS indicam a distribuiyao de crianyas pelo acesso das suas maes aos serviyos de saude para os cuidados pre-natais e de parto. Vinte e oito percentagem das crianyas tinham maes que nao tinham acesso a cuidados pre-natais (Tabela B.17). Um numero maior de maes rurais nao procuravam cuidados de saude pre-natais (35% vs. 4%), uma proporyao mais elevada foi encontrada na provincia de Sofala (54%). Cerca de 70% das maes consultavam uma enfermeira ou uma parteira durante 0 periodo pre-natal. No geral, apenas 2% consultavarn urn medico e 1% consultavarn urna parteira tradicionaVauxiliar; no entanto, IS% das crian9as na provincia de Maputo tinham maes que recebiam cuidados pre-natais de urn medico. Uma proporyao significativamente mais elevada de maes urbanas consultavam medicos em relayao as maes rurais (7% vs. menos de 1%).
Os partos assistidos por urn medico sao raros em Moyambique. No geral, 2% das maes recorreram a assistencia de medicos aquando do parto (Tabela B.IS). Como e de preyer as taxas sao significativamente mais elevadas nas areas urbanas em relayao as areas rurais (7% vs. 1%), sendo a taxa mais elevada encontrada na cidade de Maputo (12%). Note-se, no entanto, que 42% dos partos foram assistidos por enfermeiras ou parteiras, com quase tres quartos dos partos na cidade de Maputo a serem assistidos por enfermeiras ou parteiras. As areas urbanas, em geral, tin ham uma percentagem mais elevada do que as areas rurais (75% vs. 33%). A propor9ao de partos de bebes rurais assistidos por outros indivfduos ou por ninguem era significativamente mais elevada do que a propor9ao entre os partos de bebes urbanos (5S% vs. IS%). Apeuas 7% dos partos de todos os bebes inc1uidos na sondagem foram assistidos por parteiras tradicionais.
113
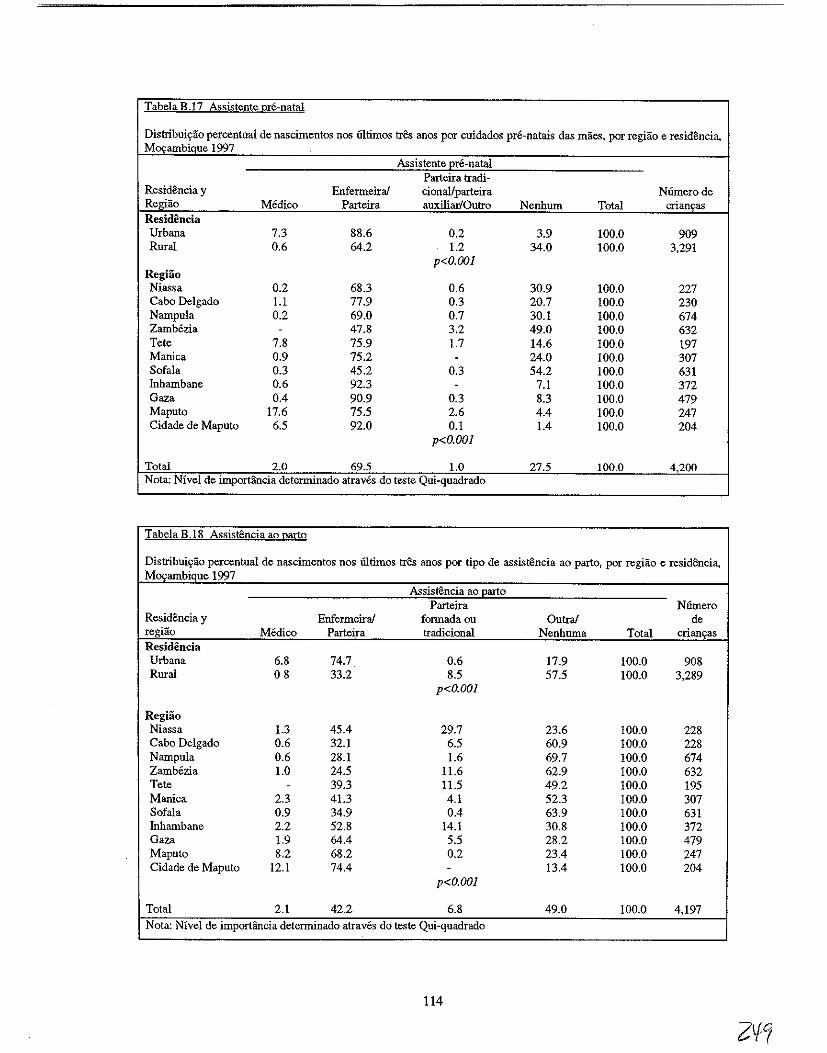
Tabela B .17 Assistente Qre-natal
Distribuiyao percentual de nascimentos nos 61timos tres anos por cuidados pre-natais das maes, por regiao e residencia, MOI'ambique 1997
Assistente Ere-natal Parteira tradi-
Residencia y Enfermeiral cionaUparteira Niimerode Regiao Medico Parteira auxiliar/Outro Nenhum Total crianyas Residencia Urbana 7.3 88.6 0.2 3.9 100.0 909 Rural 0.6 64.2 1.2 34.0 100.0 3,291
p<O.OOI RegHio Niassa 0.2 68.3 0.6 30.9 100.0 227 Cabo Delgado 1.l 77.9 0.3 20.7 100.0 230 Nampula 0.2 69.0 0.7 30.1 100.0 674 Zambezia - 47.8 3.2 49.0 100.0 632 Tete 7.8 75.9 1.7 14.6 100.0 197 Manica 0.9 75.2 - 24.0 100.0 307 Sofala 0.3 45.2 0.3 54.2 100.0 631 Iuhambane 0.6 92.3 - 7.1 100.0 372 Gaza 0.4 90.9 0.3 8.3 100.0 479 Maputo 17.6 75.5 2.6 4.4 100.0 247 Cidade de Maputo 6.5 92.0 0.1 1.4 100.0 204
p<O.OOI
Total 2.0 69.5 1.0 27.5 100.0 4,200 Nota: Nivel de importfuicia determinado atraves do teste Qui-quadrado
Tabela B.IS Assistencia ao Qarto
Distribuiyao percentual de nascimentos nos iiltimos tres aDOS por tipo de assistencia ao parto, par regiao e residencia, MOI'ambique 1997
Assistencia ao Earto Parteira Niimero
Residencia y Enfermeirai formadaou Outrai de regiao Medico Parteira tradicioDal Nenhuma Total criano;as Residencia Urbana 6.8 74.7 0.6 17.9 100.0 908 Rural 08 33.2 8.5 57.5 100.0 3,289
p<O.OOI
Regiao Niassa 1.3 45.4 29.7 23.6 100.0 228 Cabo Delgado 0.6 32.1 6.5 60.9 100.0 228 Nampula 0.6 28.1 1.6 69.7 100.0 674 Zamb6zia 1.0 24.5 11.6 62.9 100.0 632 Tete - 39.3 11.5 49.2 100.0 195 Manica 2.3 41.3 4.1 52.3 100.0 307 Sofala 0.9 34.9 0.4 63.9 100.0 631 Iuhambane 2.2 52.8 14.1 30.8 100.0 372 Gaza 1.9 64.4 5.5 28.2 100.0 479 Maputo 8.2 68.2 0.2 23.4 100.0 247 Cidade de Maputo 12.1 74.4 - 13.4 100.0 204
p<O.OOI
Total 2.1 42.2 6.8 49.0 100.0 4,197 Nota: Nivel de imporHmcia determinado atraves do teste Qui-quadrado
114
APENDICEC
VERIFICA<;AO DOS DADOS ANTROPOMETRICOS
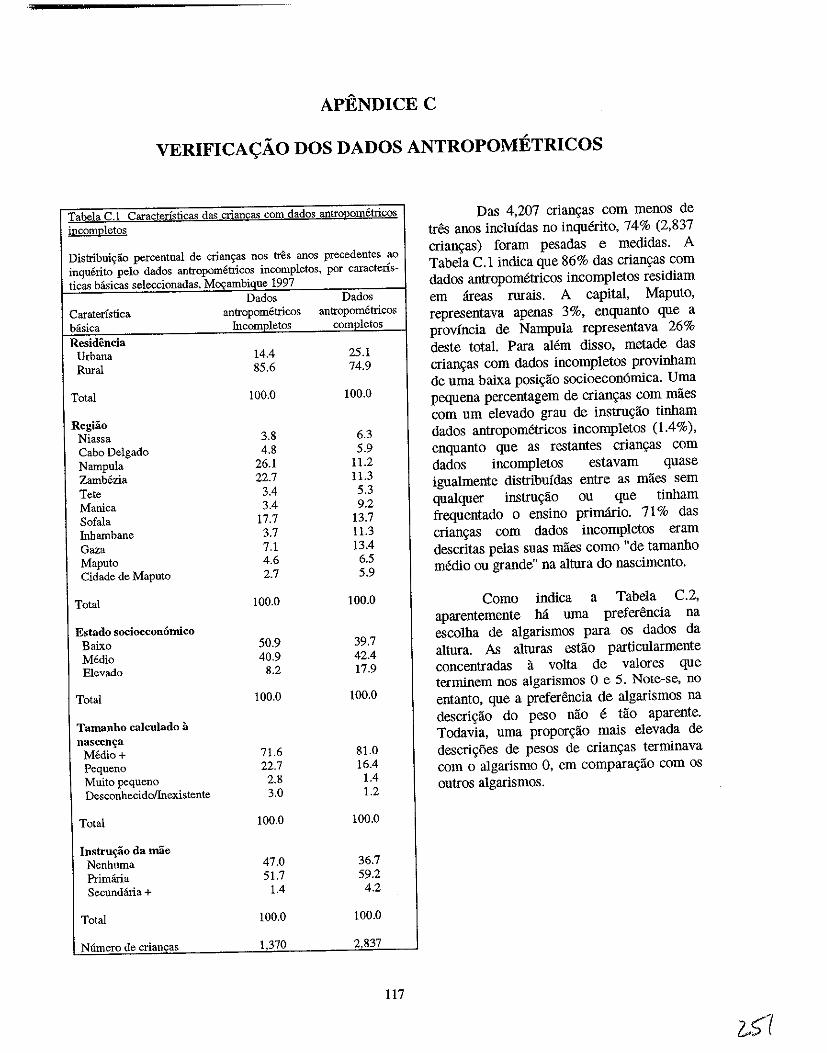
APENDICEC
VERIFICAyAO DOS DADOS ANTROPOMETRICOS
Tabela C.l Caracterfsticas da'> crians;::as com dados antroI2Qmetri£Qs incompletos
Distribuiyao percentual de crianc;as nos t:res anos precedentes ao inquerito pelo dados antropometricos incompletos, por caractens-ticas basicas seleccionadas, Mocambique 1997
Dados Dados Caraterfstica antropometricos antropometricos basica Incompletos completos Residencia
Urbana 14.4 25.1 Rural 85.6 74.9
Total 100.0 100.0
Regiao Niassa 3.8 6.3 Cabo Delgado 4.8 5.9 Nampula 26.1 11.2 Zamb6zia 22.7 11.3 Tete 3.4 5.3 Manica 3.4 9.2 Sofala 17.7 13.7 Inhambane 3.7 11.3 Gaza 7.1 13.4 Maputo 4.6 6.5 Cidade de Maputo 2.7 5.9
Total 100.0 100.0
Estado socioeconomico Baixo 50.9 39.7 Media 40.9 42.4 Elevado 8.2 17.9
Total 100.0 100.0
Tamanho calculado a nascen~a
M6dio+ 71.6 81.0 Pequeno 22.7 16.4 Muito pequeno 2.8 1.4 Desconhecidollnexistente 3.0 1.2
Total 100.0 100.0
Instru~o da mae Nenhuma 47.0 36.7 Primana 51.7 59.2 Secundana+ 1.4 4.2
Total 100.0 100.0
Niimero de crianfas 1.370 2.837
117
Das 4,207 crian~as com menos de tres anos inc1ufdas no inquerito, 74% (2,837 crian~as) foram pesadas e medidas. A Tabela C.l indica que 86% das crian~as com dados antropometricos incompletos residiam em areas rurais. A capital, Maputo, representava apenas 3%, enquanto que a provincia de Nampula representava 26% deste total. Para alem disso, metade das crian\(as com dados incompletos provinham de uma baixa posi\(ao socioeconomica. Uma pequena percentagem de crian~as com maes com urn elevado grau de instru\(ao tinham dados antropometricos incomp letos (1.4%), enquanto que as restantes crian\(as com dados incompletos estavam quase igualmente distribuidas entre as maes sem qualquer instru\(ao ou que tinham frequentado 0 ensino primario. 71 % das crian\(as com dados incompletos eram descritas pelas suas maes como "de tamanho memo au grande" na altura do nascimento.
Como indica a Tabela C.2, aparentemente M uma preferencia na escolha de algarismos para os dados da altura. As alturas estao particularmente concentradas a volta de val ores que terminem nos algarismos 0 e 5. Note-se, no entanto, que a preferencia de algarismos na descri\(ao do peso nao e tao aparente. Todavia, uma propor~ao mais elevada de descri\(oes de pesos de crian\(as terminava com 0 algarismo 0, em compara\(ao com os outros algarismos.
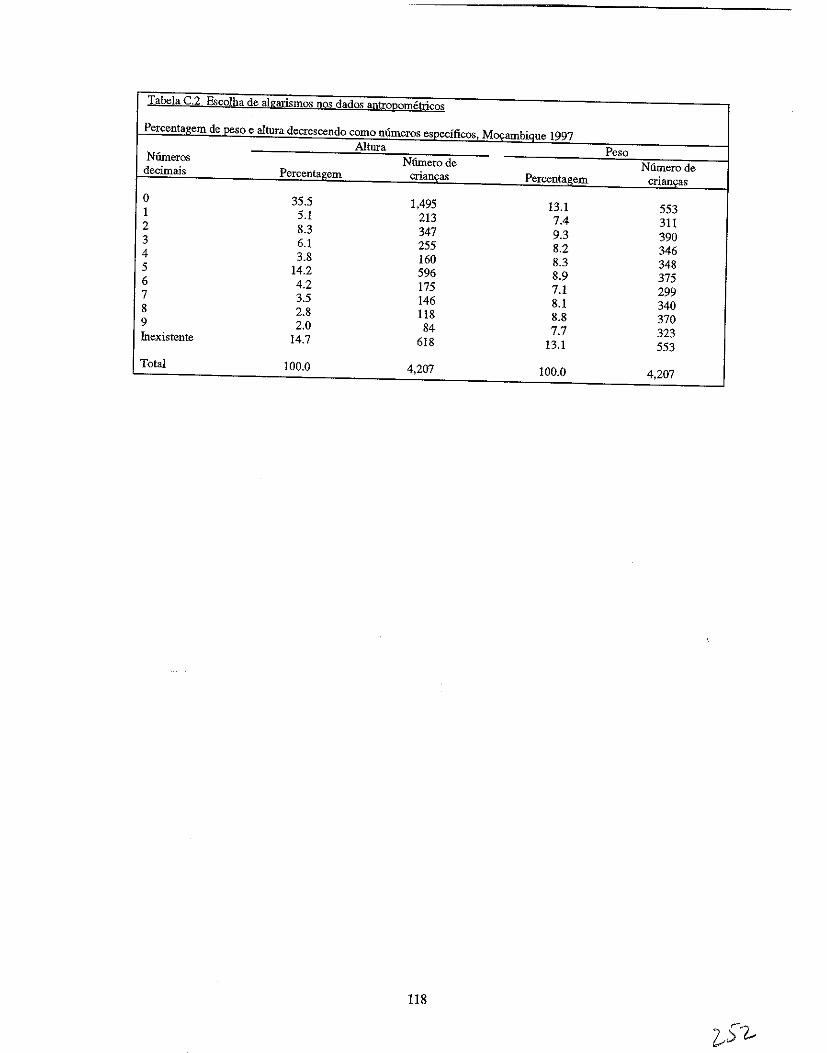
Tabela C.~ Es£olha de algarismos nos dados f!!)tro[,!ometrico§
Percent~gem de_peso e altura decrescendo como mlmeros e~~cificos. Mocambiq!J-e 1997 Altura Peso Niimeros Nfunerode Numerode decimais Percentagem crian<;as Percentagem crianQas
0 35.5 1,495 13.1 553 1 5.1 213 7.4 311 2 8.3 347 9.3 390 3 6.1 255 8.2 346 4 3.8 160 8.3 348 5 14.2 596 8.9 375 6 4.2 175 7.1 299 7 3.5 146 8.1 340 8 2.8 118 8.8 370 9 2.0 84 7.7 323 Inexistente 14.7 618 13.1 553
Total 100.0 4,207 100.0 4,207
118
APENDICED
DESNUTRlyAO ENTRE AS CRIANyAS DOS 3 AOS 35 MESES MOyAMBIQUE 1997
? cr"? t;,.;; .. ./
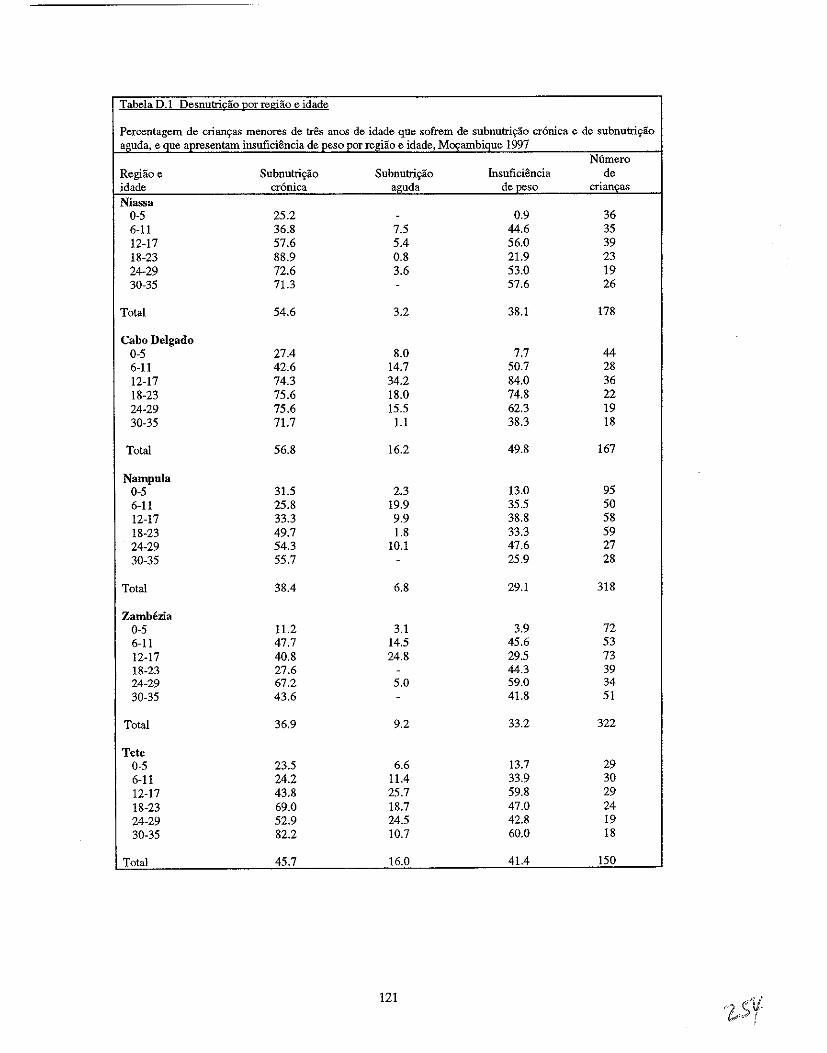
Tabela 0.1 Desnutricao par regiao e idade
Percentagem de criam;as menores de tres anos de idade que sofrem de subnutric;ao cr6nica e de subnutric;ao aguda, e que apresentam insuficiencia de peso per regiao e idade, Mocambique 1997
N6mero RegHio e Subnutri9ao Subnutriyao Insuficiencia de idade cronica aguda de peso crian~as
Niassa 0-5 25.2 - 0.9 36 6-11 36.8 7.5 44.6 35 12-17 57.6 5.4 56.0 39 18-23 88.9 0.8 21.9 23 24-29 72.6 3.6 53.0 19 30-35 71.3 - 57.6 26
Total 54.6 3.2 38.1 178
Cabo Delgado 0-5 27.4 8.0 7.7 44 6-11 42.6 14.7 50.7 28 12-17 74.3 34.2 84.0 36 18-23 75.6 18.0 74.8 22 24-29 75.6 15.5 62.3 19 30-35 71.7 1.1 38.3 18
Total 56.8 16.2 49.8 167
Nampula 0-5 31.5 2.3 13.0 95 6-11 25.8 19.9 35.5 50 12-17 33.3 9.9 38.8 58 18-23 49.7 1.8 33.3 59 24-29 54.3 10.1 47.6 27 30-35 55.7 - 25.9 28
Total 38.4 6.8 29.1 318
Zambezia 0-5 11.2 3.1 3.9 72 6-11 47.7 14.5 45.6 53 12-17 40.8 24.8 29.5 73 18-23 27.6 - 44.3 39 24-29 67.2 5.0 59.0 34 30-35 43.6 - 41.8 51
Total 36.9 9.2 33.2 322
Tete 0-5 23.5 6.6 13.7 29 6-11 24.2 11.4 33.9 30 12-17 43.8 25.7 59.8 29 18-23 69.0 18.7 47.0 24 24-29 52.9 24.5 42.8 19 30-35 82.2 10.7 60.0 18
Total 45.7 16.0 41.4 ISO
121
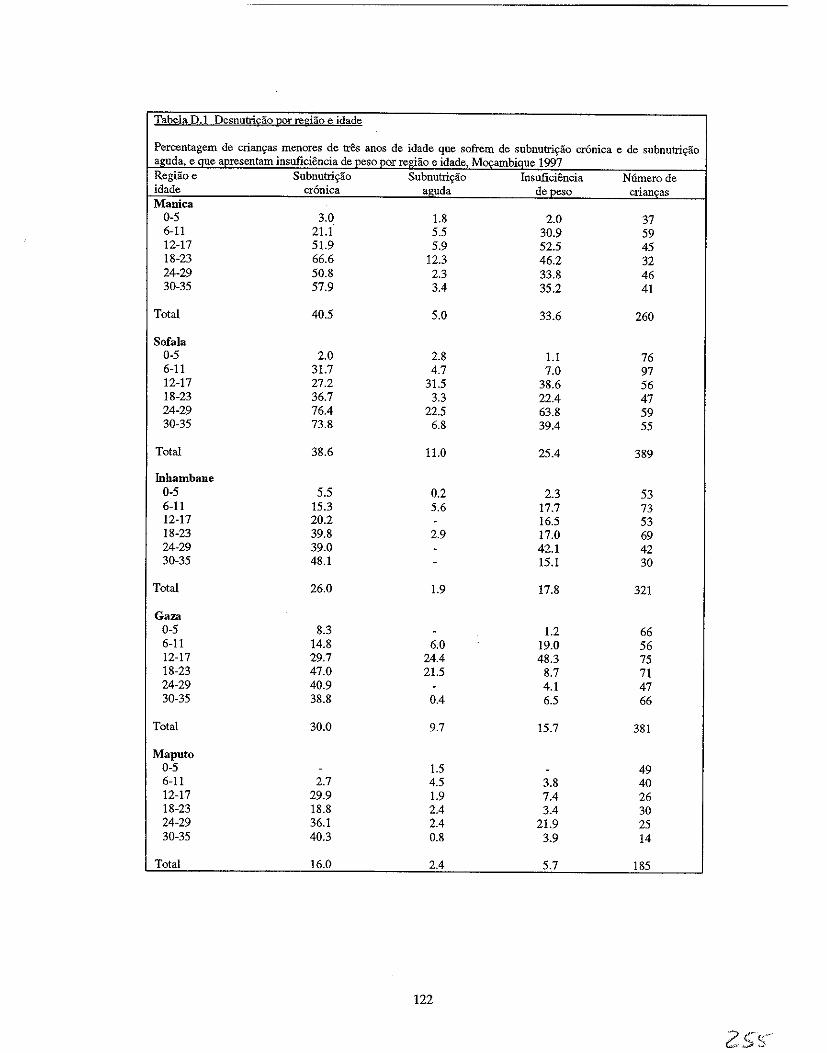
Tabela D.l Desnutri£iio gor regiao e idade
Percentagem de crian<;as menores de tres anos de idade que sofrem de subnutri<;ao cronica e de subnutri<;iio aguda, e Que apresentam insuficiencia de peso per regiiio e idade, Movambique 1997 Regiiioe Subnutri<;ao Subnutri<;iio Insuficiencia N6merode idade cronica aguda de peso crianl(as Manica
0-5 3.0 1.8 2.0 37 6-11 2!.1 5.5 30.9 59 12-17 51.9 5.9 52.5 45 18-23 66.6 12.3 46.2 32 24-29 50.8 2.3 33.8 46 30-35 57.9 3.4 35.2 41
Total 40.5 5.0 33.6 260
Sofala 0-5 2.0 2.8 1.1 76 6-11 31.7 4.7 7.0 97 12-17 27.2 31.5 38.6 56 18-23 36.7 3.3 22.4 47 24-29 76.4 22.5 63.8 59 30-35 73.8 6.8 39.4 55
Total 38.6 11.0 25.4 389
Inhambane 0-5 5.5 0.2 2.3 53 6-11 15.3 5.6 17.7 73 12-17 20.2 - 16.5 53 18-23 39.8 2.9 17.0 69 24-29 39.0 - 42.1 42 30-35 48.1 - 15.1 30
Total 26.0 1.9 17.8 321
Gaza 0-5 8.3 - 1.2 66 6-11 14.8 6.0 19.0 56 12-17 29.7 24.4 48.3 75 18-23 47.0 21.5 8.7 71 24-29 40.9 - 4.1 47 30-35 38.8 0.4 6.5 66
Total 30.0 9.7 15.7 381
Maputo 0-5 - 1.5 - 49 6-11 2.7 4.5 3.8 40 12-17 29.9 1.9 7.4 26 18-23 18.8 2.4 3.4 30 24-29 36.1 2.4 21.9 25 30-35 40.3 0.8 3.9 14
Total 16.0 2.4 5.7 185
122
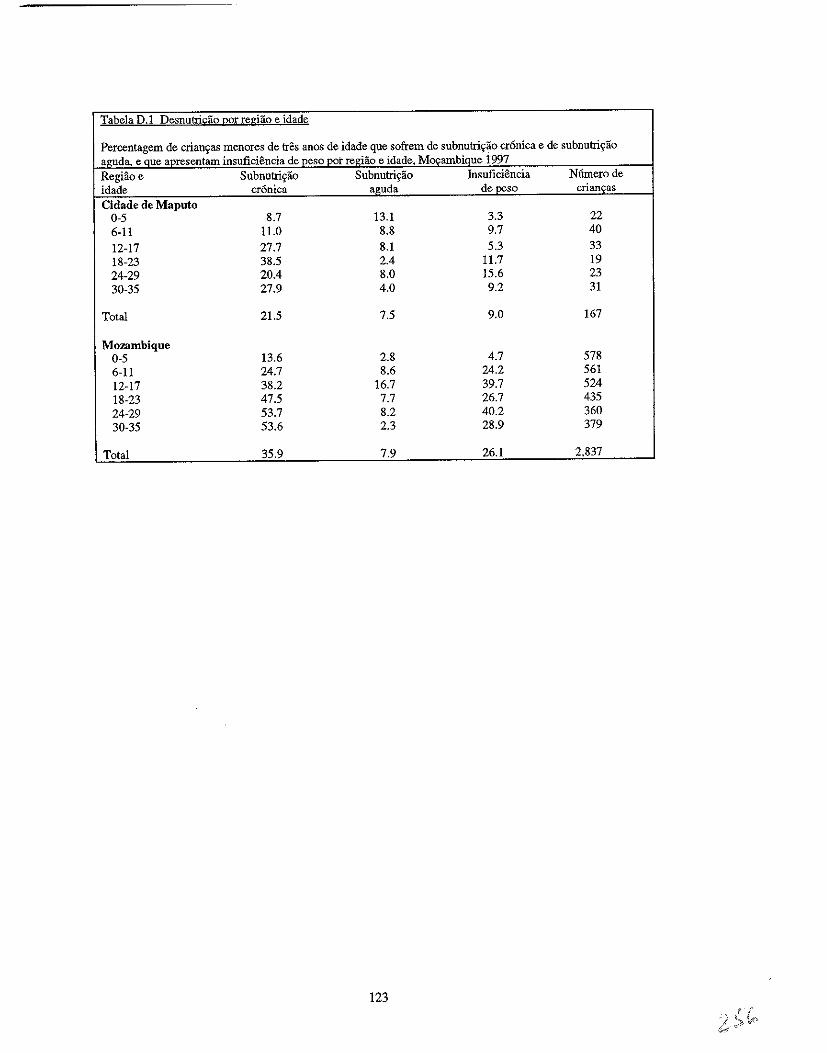
Tabela D.1 Desnutri!j;;ao gor regiao e idade
Percentagem de criaD~as menores de tres aDOS de idade que sofrem de subnutri~ao cr6nica e de subnutri~ao ~guda, e Que apresentam insuficiencia de peso pot regiao e idade, M~ambique 1997 Regiao e Subnutrigiio Subnutrigiio Insuficiencia Numerode idade cr6nica aguda de peso crianfas Cidade de Maputo
0-5 8.7 13.1 3.3 22 6-11 11.0 8.8 9.7 40 12-17 27.7 8.1 5.3 33 18-23 38.5 2.4 11.7 19 24-29 20.4 8.0 15.6 23 30-35 27.9 4.0 9.2 31
Total 21.5 7.5 9.0 167
Mozambique 0-5 13.6 2.8 4.7 578 6-11 24.7 8.6 24.2 561 12-17 38.2 16.7 39.7 524 18-23 47.5 7.7 26.7 435 24-29 53.7 8.2 40.2 360 30-35 53.6 2.3 28.9 379
Total 35.9 7.9 26.1 2,837
123
APENDICEE
DIFEREN<;AS REGIONAIS, RESIDENCIAIS E DE SEXO NA PREY ALENCIA DA DESNUTRI<;AO EM RELA<;AO A IDADE DA
CRIAN<;A, MO<;AMBIQUE 1997
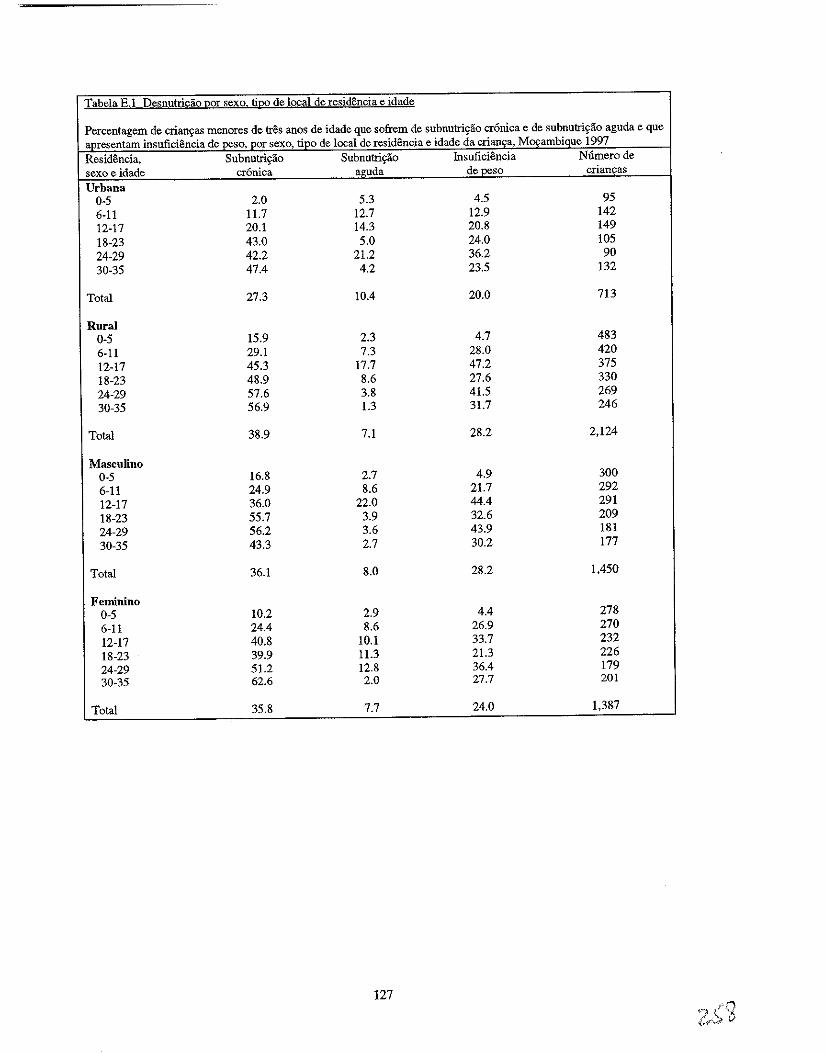
Tabela E.l Desnutri£ao (1OI sexo ti(10 de local de residencia e idade
Percentagem de crian\=as menores de tres anos de idade que sofrem de subnutri\=ao cr6nica e de subnutri\=ao aguda e que apresentam insuficiencia de peso, por sexo, ripo de local de residencia e idade da crian\=a, MO\=ambique 1997 Residencia, Subnutri\=ao Subnutri\=ao Insuficiencia Numerode sexo e idade cr6nica aguda de peso crian\=as Urbana
0-5 2.0 5.3 4.5 95 6-11 11.7 12.7 12.9 142 12-17 20.1 14.3 20.8 149 18-23 43.0 5.0 24.0 105 24-29 42.2 21.2 36.2 90 30-35 47.4 4.2 23.5 132
Total 27.3 10.4 20.0 713
Rural 0-5 15.9 2.3 4.7 483 6-11 29.1 7.3 28.0 420 12-17 45.3 17.7 47.2 375 18-23 48.9 8.6 27.6 330 24-29 57.6 3.8 41.5 269 30-35 56.9 1.3 31.7 246
Total 38.9 7.1 28.2 2,124
Masculino 0-5 16.8 2.7 4.9 300 6-11 24.9 8.6 21.7 292 12-17 36.0 22.0 44.4 291 18-23 55.7 3.9 32.6 209 24-29 56.2 3.6 43.9 181 30-35 43.3 2.7 30.2 177
Total 36.1 8.0 28.2 1.450
Feminino 0-5 10.2 2.9 4.4 278 6-11 24.4 8.6 26.9 270 12-17 40.8 10.1 33.7 232 18-23 39.9 11.3 21.3 226 24-29 51.2 12.8 36.4 179 30-35 62.6 2.0 27.7 201
Total 35.8 7.7 24.0 1.387
127
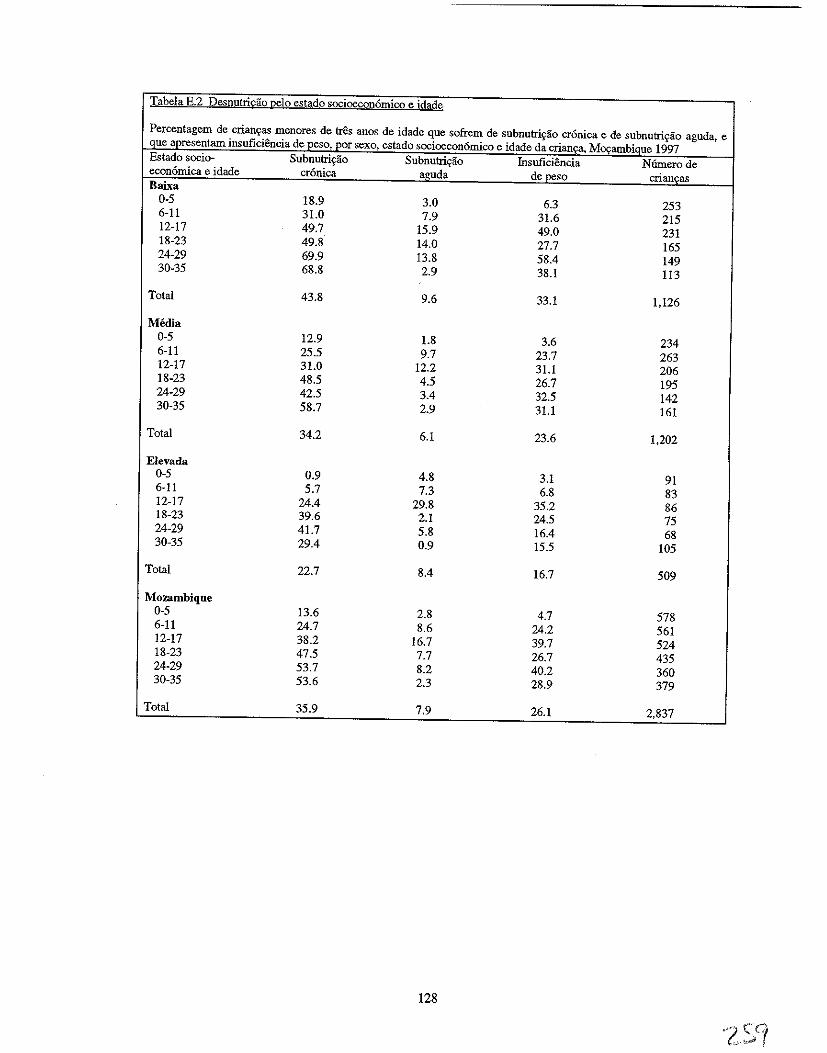
Tabela E.2 Desnutris;:ao Qelo estado socioeconomico e idade
Percentagem de crianc;as menores de tres anos de idade que sofrem de subnutri~ao cronica e de subnutric;ao aguda, e que apresentam insuficiencia de peso, por sexo, estado socioeconomico e idade da cria'Qfi\, M~_amblgue 1997 Estado socio- Subnutric;ao Subnutri~ao Insuficiencia Numero de economica e idade cronica aguda de peso criancas Baixa
0-5 18.9 3.0 6.3 253 6-11 31.0 7.9 31.6 215 12-17 49.7 15.9 49.0 231 18-23 49.8 14.0 27.7 165 24-29 69.9 13.8 58.4 149 30-35 68.8 2.9 38.1 113
Total 43.8 9.6 33.1 1,126
Media 0-5 12.9 1.8 3.6 234 6-11 25.5 9.7 23.7 263 12-17 31.0 12.2 31.1 206 18-23 48.5 4.5 26.7 195 24-29 42.5 3.4 32.5 142 30-35 58.7 2.9 31.1 161
Total 34.2 6.1 23.6 1,202
Elevada 0-5 0.9 4.8 3.1 91 6-11 5.7 7.3 6.8 83 12-17 24.4 29.8 35.2 86 18-23 39.6 2.1 24.5 75 24-29 41.7 5.8 16.4 68 30-35 29.4 0.9 15.5 105
Total 22.7 8.4 16.7 509
Mozambique 0-5 13.6 2.8 4.7 578 6-11 24.7 8.6 24.2 561 12-17 38.2 16.7 39.7 524 18-23 47.5 7.7 26.7 435 24-29 53.7 8.2 40.2 360 30-35 53.6 2.3 28.9 379
Total 35.9 7.9 26.1 2,837
128
APENDICEF
PRA.TICAS ALIMENTARES SEGUNDO A IDADE
2100
Tabela F.l Prati£as alimentares segundo a idade
Distribui'rao percentual de crians;:as menores de 24 meses de idade, por praticas alimentares, por idade, Mos;:ambique 1997
Amamentadas e: Idade da Outros Completamente Numerode crianca Mais nada Agua liquidos S61idos desmamadas Total crians;:as 0-1 79.0 7.4 9.7 2.0 1.8 100.0 178 2-3 49.2 11.7 26.5 12.5 - 100.0 262 4-5 21.9 8.4 15.4 53.8 0.5 100.0 228 6-7 4.1 4.5 7.1 84.3 - 100.0 193 8-9 1.7 1.9 3.1 91.8 1.5 100.0 220 10-11 0.4 0.8 1.8 94.0 3.1 100.0 198 12-13 0.7 0.5 1.2 89.7 7.9 100.0 225 14-15 - - - 88.4 11.6 100.0 189 16-17 0.5 - 0.8 74.3 24.4 100.0 249 18-19 - - - 70.3 29.7 100.0 212 20-21 - - - 56.6 43.4 100.0 186 22-23 - - - 39.9 60.1 100.0 147
131
APENDICEG
REGRESSAO LOGiSTlCO
APENDICEG
ANALISE DE REGRESSAO LOGISTICO
A analise de regressao logistico e usada quando a variavel dependente (ou resultante) e dict6mica;
isto e, s6 tern dois resultados: ou ocorre ou nao ocorre. Urn modelo de regressao logfstico avalia a
possibilidade do evento ocorrer. Para cada variavel explicativa, h:i uma categoria referencial em rela9ao a qual sao comparadas todas as outras categorias dessa variavel.
Neste relat6rio, sao utilizadas t6cnicas de regressao logistico variadas para explicar (ou preyer) os
seguintes resultados nas crian9as M09ambicanas e nas suas maes:
• diarreia infantil • subnutri9ao cr6nica infantil
• subnutri9ao aguda infantil
• baixa massa corporal da mae (deficiencia energetica cr6nica [DEC]).
Os modelos de regressao logfstico avaliam a probabilidade de (a) terem tido diarreia nas duas
semanas anteriores ao inquerito, (b) de sofrerem de subnutri9ao cr6nica, (c) de sofrerem de subnutri9ao
aguda, e (d) as maes terem urn baixo indice de massa corporal. Foi usada urna avan9ada medida de
regressao para a constru9ao de urn melhor modelo, a partir dos dados disp0nlveis. Foram usadas
estruturas te6ricas na condw;;ao do processo de selec9ao daquelas variaveis que melhor explicavam cada
umdos resultados. Recorreu-se ao Quadro da UNICEF para a Desnutri9ao (UNICEF, 1990) de 1990 para
os modelos de regressao referentes as subnutri0es cr6nica e aguda. Visto nao existir urna estrutura
te6rica semelhante para a diarreira, foram consultadas as publica90es sobre a diarreia para identificar
variaveis comuns incluidas na analise das variaveis da diarreia infantil. Urn estudo realizado no Congo
(Mock et al., 1993) foi particularmente util para a classifica9ao das variaveis em viirios tipos de
determinantes da diarreia infantil (por ex., "Factores Maternos Socio-demogriificos e de SaUde", "Factores
Infantis Demograficos e de Saude", "Factores Ambientais e Sanitiirios") e para a identifica9ao das
variaveis que melhor representam cada tipo de determinante. No que diz re.~peito it baixa massa corporal
das maes, Johnson-Welch (1999) adoptou 0 Quadro da UNICEF para a Desnutri9ao de 1990 para 0
estudo dos resultados nutricionais das maes. Para esta analise, a estrutura te6rica analftica de Johnson
Welch foi de novo adaptada para 0 estudo do indice de baixa massa corporal das miles em M09ambique.
Os coeficientes de regressao numa an:ilise de regressao logistico representam 0 logoritmo de
probabilidades do efeito de cada factor explicativo sobre a variavel resuItante, controlando os efeitos de
todos os outros factores no modelo. Este logaritmo de probabilidades pode ser convertido em taxas de
probabilidade convertendo os coeficientes de regressao em valores exponenciais. As taxas de
probabilidade sao usadas como aproxima90es do risco relativo do conhecimento do resultado. Este
relat6rio apresenta os riscos relativos, significativos nurn myel estatistico, da variavel dependente para urn
mimero de variaveis independentes, por exemplo, 0 risco relativo de crian9as que viviam em diferentes
regiOes do pais terem diarreia. Para cada variavel explicativa no modelo, e atribuido urn risco relativo
para a categoria referencial urn valor de 1.00, e os riscos relativos para outras categorias sao comparados
com a categoria referencial. Urn risco relativo superior a 1.00 indica urn risco acre.~cido para 0 resultado,
em compara9ao com a categoria referencial, enquanto que urn risco relativo inferior a 1.00 indica urn
risco diminuido para 0 resultado, em compara9ao com a categoria referencial.
135
Como exemplo, na Tabela 5.7 a "medio/grande" e atribufdo urn valor de 1.00 ja que e a categoria referencial para a variavel explicativa "tamanho calculado it nascenga". 0 risco relativo Ifquido de 1.7 para a categoria de "pequeno/muito pequeno" indica que as criangas cujas miies as descreveram como pequenas ou muito pequenas na altura do nascimento correm mais 70% de risco de terem diarreia durante o perfodo referencial de duas semanas em comparagilo com as criangas cujas miles as descreveram como de tamanho medio ou grande.
136
Related Documents