Safe roads, reliable journeys, informed travellers An executive agency of the Department for Transport Economics of climate change adaptation and risks Final report July 2013

Welcome message from author
This document is posted to help you gain knowledge. Please leave a comment to let me know what you think about it! Share it to your friends and learn new things together.
Transcript
Safe roads, reliable journeys, informed travellers
An executive agency of the Department for Transport
Economics of climate change adaptation and risks
Final reportJuly 2013

Economics of Climate Change Adaptation and Risks Final Report
Atkins Final report ׀ July 2013
Notice
This document and its contents have been prepared and are intended solely for Highways Agency’s information and use in relation to Economics of Climate Change Adaptation and Risks (Transport related Technical Engineering Advice and Research, package order reference 137).
Atkins Ltd assumes no responsibility to any other party in respect of or arising out of or in connection with this document and/or its contents.
Document history
Job number: 5119125 Document ref:
Revision Purpose description Originated Checked Reviewed Authorised Date
Rev 1.0 Draft report HV RF TM HV 15/06/13
Rev 1.1 Final report HV TM AT LT 4/07/2013
Rev 1.1 Final report HV RF TM HV 18/07/13

Economics of Climate Change Adaptation and Risks Final Report
Atkins Final report ׀ July 2013
Table of contents
Chapter Pages
Executive summary 5
1. Introduction – study scope and methodology 9 1.1. Study background 9 1.2. Study objectives 10 1.3. Study scope 10 1.4. Overview of study methodology 12 1.5. Assessing possible changes in climate 13
2. Climate modelling – how will summers change? 15 2.1. Thresholds considered 15 2.2. Summary of climate modelling results 15
3. Identifying the impacts of hotter, drier summers on the network 20 3.1. The impact of hotter, drier summers on pavements 20 3.2. The impact of hotter, drier summers on structures 23 3.3. Hotter, drier summers – wider impacts 26
4. Estimating the cost of hotter, drier summers for the Highways Agency 28 4.1. Maintenance costs 28 4.2. User delay costs 31
5. Estimating the costs and benefits of adaptation to hotter, drier summers 33 5.1. How could the Agency adapt to hotter, drier summers? 33 5.2. Estimated costs and benefits of adaptation action 36
6. Conclusions and recommendations 45 6.1. Cost benefit of adaptation to hotter, drier summers 45 6.2. Need for wider analysis on climate change impacts 45 6.3. Need for improved data on impacts of weather conditions 45
Appendices 47
Appendix A. Economic impacts modelling methodology 48 A.1. Introduction 48 A.2. Geographic data 48 A.3. Costs of climate change without adaptation 52 A.4. Adaptation costs 60 A.5. WebTAG discounted appraisal 61
Appendix B. Climate change modelling methodology 62 B.1. Data 62 B.2. Thresholds 63 B.3. Validation 64
Tables Table 1.1: Climate change variables and their impact on HA assets and customers 9 Table 1.2: Modelling scenarios components 11 Table 2.1: Number of additional days where daily maximum temperatures reach 32°C, 35°C and 40°C, per 30 year period and English administrative region 17 Table 2.2: Number of additional days where daily maximum temperatures reach 32°C and 35°C, per year and English administrative region 18 Table 2.3: Number of additional periods with high maximum temperature, per 30 year period and English administrative region 19 Table 2.4: Number of additional drought events, per 30 year period and English administrative region 19
Economics of Climate Change Adaptation and Risks Final Report
Atkins Final report ׀ July 2013
Table 3.1: Pavement modelling assumptions 22 Table 3.2: Structures modelling assumptions 25 Table 4.1: Maintenance cost of hotter, drier summers, Central Scenario (Present Value, £000s, 60 year period) 28 Table 4.2: Maintenance cost of hotter, drier summers, Worst Case Scenario (Present Value, £000s, 60 year period)
55 29
Table 4.3: Annual maintenance cost (discounted), Central Scenario (Present Value, £000s)55
29 Table 4.4: Annual maintenance cost (discounted), Worst Case Scenario (Present Value, £000s)
55 30
Table 4.5: Annual maintenance cost (undiscounted), Central Scenario (£000s) 30 Table 4.6: Annual maintenance cost (undiscounted), Worst Case Scenario (£000s)
56 30
Table 4.7: User delay costs, Central Scenario (Present Value, £000s, 60 year period) 31 Table 4.8: User delay costs, Worst Case Scenario (Present Value, £000s, 60 year period)
57 32
Table 5.1: Pavement adaptation modelling assumptions 34 Table 5.2: Impact of changes in extreme temperature on HA assets - recommendations 34 Table 5.3: Structures adaptation modelling assumptions 35 Table 5.4: Cost of adaptation and associated standard maintenance savings, Central Scenario (PV, £000s, 60 year period) 37 Table 5.5: Cost of adaptation and associated standard maintenance savings, Worst Case Scenario (PV, £000s, 60 year period) 38 Table 5.6: User delay costs, Central Scenario (Present value, £000s, 60 year period) 39 Table 5.7: Central Scenario cost benefit analysis for adaptation expenditure 40 Table 5.8: Worst Case Scenario cost benefit analysis for adaptation expenditure
66 41
Table 5.9: Benefit Cost Ratios by Region (PVB and PVC in 000s, 2010 prices) 42 Table A–1 Assumed service life by material and wear category (years) 53 Table A–2 Assumed maintenance profile by material and wear category (%age of area subject to surfacing/resurfacing per year) 54 Table A–3 Assumed baseline average service lives for structures considered likely to be susceptible to damage during hotter, drier summers 55 Table A–4: Pavement modelling assumptions 56 Table A–5: Structures modelling assumptions 56 Table A–6 Correspondence between normal speed limit and maintenance speed limit 58 Table A–7 Output rate assumed for resurfacing and patching 58 Table B–18: Locations selected for climate modelling 62
Economics of Climate Change Adaptation and Risks Final Report
Atkins Final report ׀ July 2013 5
Executive summary
The UK Government has identified climate change as one of the most serious threats the world faces1.
Climate change is projected to result in changes in temperatures, rainfall patterns and sea levels, as detailed in the UK Climate Projections (UKCP09)
2. As identified by previous climate change adaptation work
undertaken for the Highways Agency, the Agency’s assets and operations will inevitably be affected, negatively or positively, by these changes in climate and weather.
This study
This study builds on a significant amount of work already undertaken by the Highways Agency to identify climate change risks and potential adaptation measures. It aimed to quantify a sub-set of the risks associated with climate impacts, focusing on hotter, drier summers, and taking account of capital and maintenance costs as well as the cost of delays experienced by network users.
A key finding of the study was that evidence on the likely impacts of hotter, drier summers on the Highways Agency’s assets is limited and insufficient to support the development of clear potential scenarios. Consequently illustrative ‘What If’ scenarios were developed to provide a basis for quantification. Within the scope defined below, this study therefore provides illustrative estimates of the cost of hotter, drier summers for the Highways Agency if no action is taken (cost of non-action) and of the costs and benefits of adaptation actions, as defined in Section 3.
Hotter, drier summers – what should the Highways Agency prepare for?
Climate modelling was undertaken using the UKCP09 Weather Generator3 to assess changes in climate
variables focusing on:
periods with at least two consecutive days reaching 32°C;
periods with at least seven consecutive days reaching 32°C; and
drought threshold combining low precipitations and high temperatures for a prolonged period of time.
As expected, the most significant increases in summer maximum temperatures are modelled to occur in the East of England, London, the South East and the South West. These increases are however relatively modest. When considered on an annual basis, the number of additional days reaching 32°C or above in the worst affected regions is estimated between 10 and 17 under the Worst Case Scenario and in the 2060s.
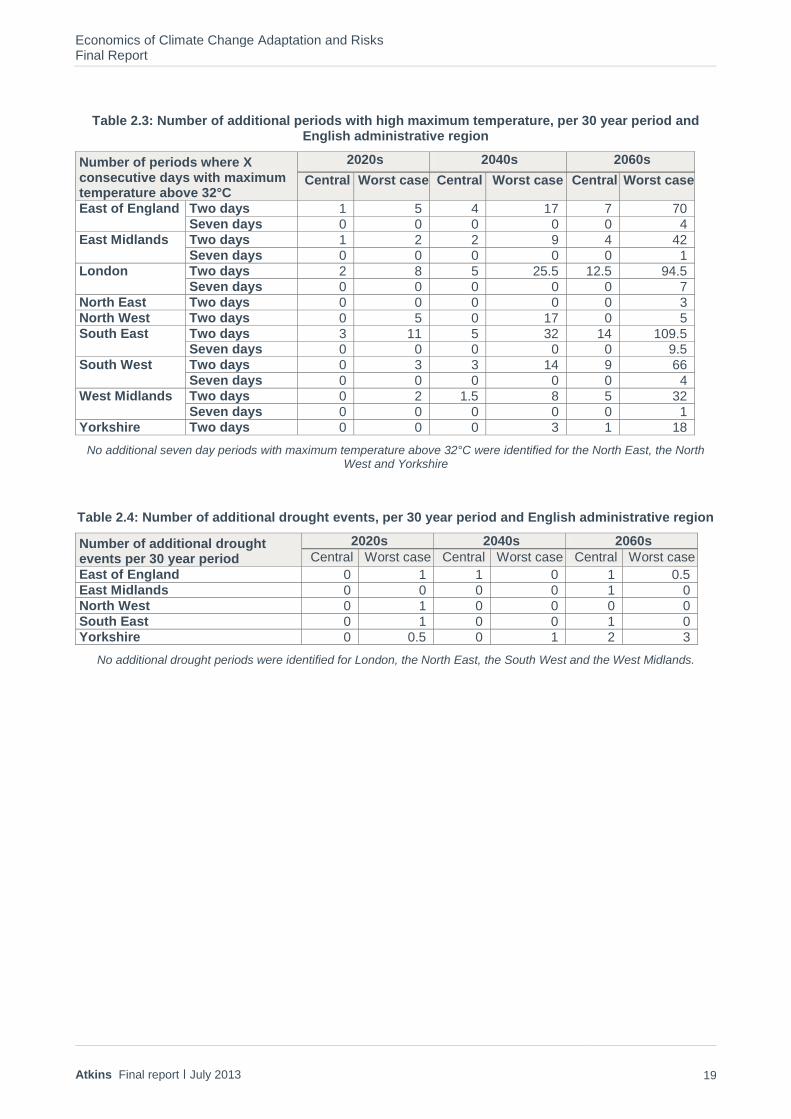
Drought analysis also shows modest numbers of additional drought events per 30 year period. The worst affected region is identified as Yorkshire, with the East of England, the East Midlands, the North West and the South East also identified as potentially affected regions.
Identifying the impacts of hotter, drier summers on the Highways Agency’s assets
Potential impacts were identified through a review of previous Highways Agency work and published evidence and through discussions with experts. This led to the selection of pavements and structures (bridges) as the key assets to be considered for this analysis. Discussions with Highways Agency experts led to the exclusion of geotechnical assets (embankments and cuttings) as they were not identified as being at significant risk.
Quantifying potential impacts on pavements and structures
A review of published evidence and discussions with Highways Agency experts did not produce commonly agreed assumptions on the impact of hotter, drier summers on pavements or structures. Illustrative assumptions were therefore developed by the project team on the basis of “What If” scenarios to test the costs of high level assumptions on the impacts of hotter, drier summers on Highways Agency pavements and structures.
Impacts on pavements were assumed to be relatively modest, limited to surfacing (hot rolled asphalt and thin surfacing as they represent 92% of the network) and were expressed as a reduction in pavement service life, leading to additional maintenance work and subsequent user delays.
1 As recognised in the Climate Change Act 2008 (www.legislation.gov.uk/ukpga/2008/27)
2 http://ukclimateprojections.defra.gov.uk/
3 See http://ukclimateprojections.defra.gov.uk/22540
Economics of Climate Change Adaptation and Risks Final Report
Atkins Final report ׀ July 2013 6
Impacts on structures were also assumed to be relatively modest, limited to a few specific types of bridges and expressed as a reduction in service life (for joints or surfacing material), leading to additional maintenance work and user delays.
Although the focus of this study is on hotter, drier summers, discussions with experts identified the impact of winter weather and severe weather events as potentially much more significant. The service life of pavements is also affected by a number of other factors, including changes in expected traffic volumes. Impacts are also likely to vary depending on the type of roads, with impacts likely to be higher on local authority roads rather than on Highways Agency roads due to differences in pavement design, characteristics, age and maintenance regimes.
Identifying potential wider impacts for the Highways Agency
Wider impacts of hotter, drier summers were identified (but not quantified) and include:
o Potential impacts on assets which have not been considered for this analysis (for example, such as kerbs, road restraint systems, road markings, ICT assets, etc);
o An increase in the risk of large scale wildfires throughout the UK, especially in southern England;
o Potential for high summer temperatures to exacerbate existing air quality issues; o Reductions in summer rainfall could also lead to lower water quality in the vicinity of the
Agency’s network as drainage dilution levels are reduced in receiving watercourses with low water levels;
o Potential issues with Traffic Officers and network users’ welfare; o Additional/different demands are usually placed on the network on hot days (caravans,
horse boxes and animal transport); o Reputational risk for the Highways Agency, as climate change and the way the Agency
prepares to address its impacts can influence users’ trust and satisfaction with the Highways Agency;
o Potential reduction in Agency assets’ net value and related revenue funding for the Highways Agency.
Estimating the cost of hotter, drier summers for the Highways Agency (cost of climate change)
The “What If” scenarios developed for pavements and bridges were used to estimate illustrative costs of hotter and drier summers to the Highways Agency and its users (cost of climate change). Modelling assumptions are based on a reduction in service life for selected pavements and bridges. This in turn is assumed to result in:
o additional maintenance costs in response to the reduction in service life assumed (current maintenance standards are assumed to remain in place); and
o additional user costs, as additional maintenance works take place in response to the reduction in service life caused by hotter, drier summers, this in turn results in user delays on the network, caused by lane closures and associated speed restrictions (all closures have been assumed to take place overnight, with single or two lane closures only).
Illustrative costs of additional maintenance
Regions with the highest costs are those which are likely to experience the strongest increases in summer temperatures, namely the South East, the East of England and the South West. A significant proportion of the Highways Agency’s network is located within these regions. Despite this fact, the total discounted additional maintenance costs are estimated to be modest in the Central Scenario, at just over £9 million (present value). Results for the Worst Case Scenario show much higher additional maintenance costs, estimated at approximately £76 million (present value) in total, reflecting the much greater forecast frequency of potentially damaging weather events in this Scenario.
Illustrative user delay costs
Total user delay costs are estimated to be modest, at approximately £4.3 million (present value) over the 60 year period considered under the Central Scenario (£2.5 million in the South East). Results for the Worst Case Scenario show much higher user costs, estimated at approximately £33.3 million (present value) in total (£18.8 million for the South East), reflecting the much more extensive forecast impacts of climate change and associated required increase in maintenance.
Economics of Climate Change Adaptation and Risks Final Report
Atkins Final report ׀ July 2013 7
The South East of England shows the highest costs under both the Central and Worst Case Scenarios. This is due to several factors including:
o Greater length of network affected in the region; o High traffic flows; and o The fact that the impacts of climate change are forecast to cause the identified climate
thresholds to be reached relatively early in the South East.
Estimating the costs and benefits of adaptation to hotter, drier summers
An illustrative analysis of the cost/benefit of adaptation for hotter, drier summers on the Highways Agency’s network was undertaken for pavements and selected types of bridges for a 60 year appraisal period (starting in 2013). Results show that in the Worst Case Scenario, the benefits of adaptation considerably outweigh the costs. In the Central Scenario however, the costs of the adaptation programme are very similar in scale to the benefits.
The analysis also shows that the timing and geographical focus of adaptation are very important as greater benefits are accrued in later years and regions with greater forecast climate change. It is likely that an alternative, more focussed adaptation programme (targeted on certain regions and certain busy roads, in later years) would lead to a larger net benefit, including under the Central Scenario.
National level analysis shows:
benefits of adaptation estimated to slightly exceed the costs under the Central Scenario, resulting in
a modest positive net present value and benefit/cost ratio (BCR) of slightly greater than 1;
although adaptation costs for the Worst Case Scenario are considerably higher than those for the
Central Case Scenario, the differential in benefits achieved is considerably greater, resulting in more
positive cost/benefit indicators for adaptation measures, between 2.4 and 2.6.
The following key points can be drawn from the results:
Value for money of investment in adaptation measures varies considerably with time and location of implementation. On the basis of the illustrative assumptions made, carefully targeted investment is most likely to bring net benefits in areas where the impacts of climate change are sufficiently large to cause a significant impact on assets, requiring additional maintenance and traffic levels are sufficiently high for maintenance events to cause significant user delay;
Consequently, with some exceptions, BCRs are typically highest in the southern half of the country, reflecting higher levels of traffic (and user delay associated with maintenance) and more frequent incidents of threshold weather events; and
The costs and impacts of surfacing are considerably greater than those associated with structures.
Conclusions and recommendations
The cost benefit analysis shows relatively low returns on investment for adaptation measures to reduce the impact of hotter, drier summers on pavements and structures across England. These results could however improve if:
New evidence becomes available showing that impacts on pavement and structure service life are higher than those assumed in this study (which were illustrative assumptions, based on discussions with experts due to the lack of evidence) or that hotter, drier summers might lead to more marked asset damage requiring more immediate, unplanned maintenance interventions (rather than overnight, planned maintenance as assumed for this study on the basis of expert advice);
New evidence becomes available showing that baseline routine maintenance involves more frequent and larger scale interventions than those assumed in this study (which are again illustrative assumptions, based on discussions with experts due to the lack of evidence);
Adaptation costs are lower than assumed in the modelling. For example, for pavements, the industry could respond by providing new mixes at no additional costs if demand grows for more heat resistant mixes; and
Adaptation measures are focussed geographically on areas where maintenance related to climate change damage is likely to lead to the largest user delays.
Economics of Climate Change Adaptation and Risks Final Report
Atkins Final report ׀ July 2013 8
Regional analysis shows disparities in the impact of hotter, drier summers on pavements and structures between English regions. Adaptation action relating to pavements in the north of England is unlikely to offer good value for money unless considered in later years and under the Worst Case Scenario. Adaptation action presents more positive results in the South of England.
Adaptation action could also present better value for money if undertaken for the busiest parts of the network in the South of England (most at risk of impacts from hotter, drier summers). Further analysis could be undertaken to identify the links on which adaptation action would offer the best returns.
There is emerging evidence that the Earth’s climate might be changing more rapidly than expected and there are warnings that the UN Framework Convention on Climate Change target of limiting global warming to 2°C has become unrealistic. If mitigation targets can’t be met and the climate changes faster than expected, the Scenario presented in this document as “Worst Case” might become a realistic scenario, making the case for adaptation to hotter, drier summers more compelling.
This analysis focused on hotter, drier summers. Although these are likely to have an impact on the Agency’s assets, impacts are likely to be relatively small compared to the impacts of flooding, unpredictable weather events or higher winter temperatures. Experts consulted during the study therefore identified the need for an assessment of climate change impacts which would consider all potential changes and their impacts on the network and its users rather than individual weather events.
As noted in this report, there is limited evidence of the impact of hotter, drier summers on highway assets. As risks from climate change are increasing in the future, it would be useful to improve the monitoring of these impacts now, to be able to better assess future impacts (likely to be of a greater magnitude in later years). This might be possible to achieve through the new integrated asset management information system (IAMIS). For example, temperature information currently recorded in the HA Weather information System (HAWIS) could be correlated with data on failures and maintenance from the HA Pavement Database (HAPMS), the HA Geotechnical Data Management System (HAGDMS) and the Structures Maintenance Information System (SMIS).
Economics of Climate Change Adaptation and Risks Final Report
Atkins Final report ׀ July 2013 9
1. Introduction – study scope and methodology
1.1. Study background
The Highways Agency (the Agency) operates, maintains and improves the strategic road network in England. The network comprises approximately 4,300 miles of motorways and all-purpose trunk roads and is valued at £108 billion
4.
The UK Government has identified climate change as one of the most serious threats the world faces5.
Climate change is projected to result in changes in temperatures, rainfall patterns and sea levels, as detailed in the UK Climate Projections (UKCP09)
6. As identified by previous climate change adaptation work
undertaken for the Agency, the Agency’s assets and operations will inevitably be affected, negatively or positively, by these changes in climate and weather.
The Agency has already undertaken a significant amount of work to identify climate change risks and potential adaptation measures. The Agency published its Climate Change Risk Assessment in August 2011
7,
building on earlier work such as the Agency’s Climate Change Adaptation Strategy and Framework7. This
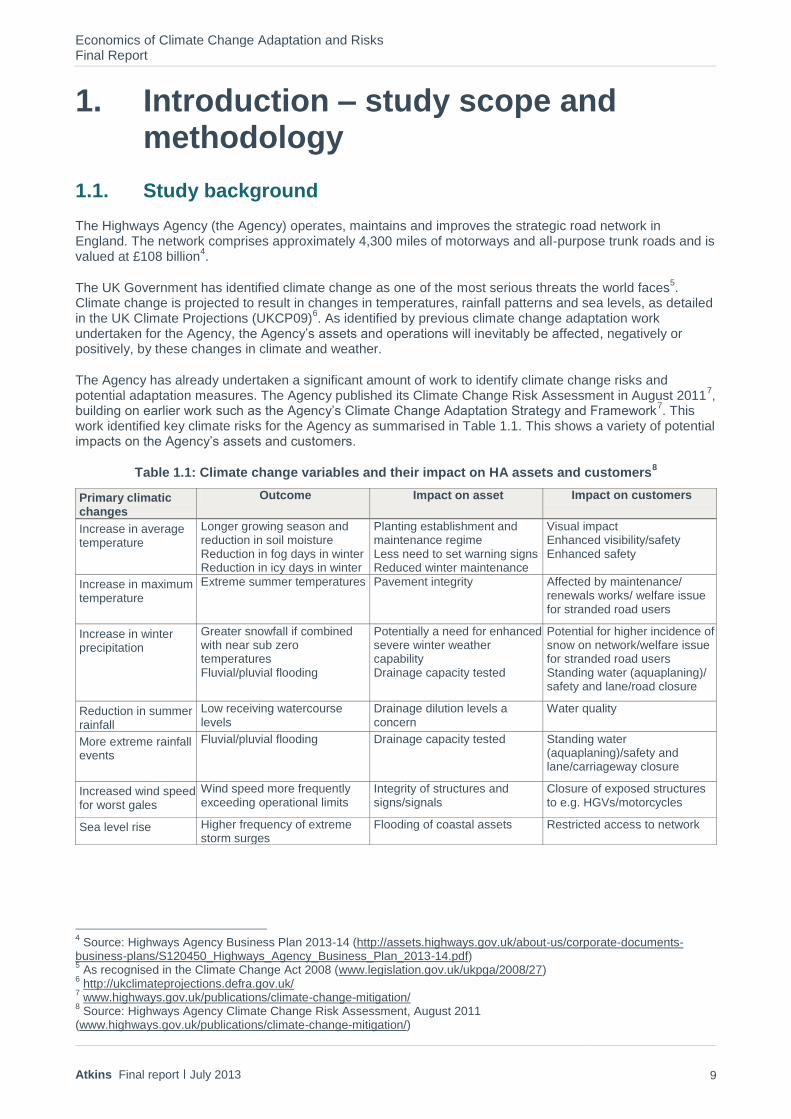
work identified key climate risks for the Agency as summarised in Table 1.1. This shows a variety of potential impacts on the Agency’s assets and customers.
Table 1.1: Climate change variables and their impact on HA assets and customers8
Primary climatic changes
Outcome Impact on asset Impact on customers
Increase in average temperature
Longer growing season and reduction in soil moisture Reduction in fog days in winter Reduction in icy days in winter
Planting establishment and maintenance regime Less need to set warning signs Reduced winter maintenance
Visual impact Enhanced visibility/safety Enhanced safety
Increase in maximum temperature
Extreme summer temperatures Pavement integrity Affected by maintenance/ renewals works/ welfare issue for stranded road users
Increase in winter precipitation
Greater snowfall if combined with near sub zero temperatures Fluvial/pluvial flooding
Potentially a need for enhanced severe winter weather capability Drainage capacity tested
Potential for higher incidence of snow on network/welfare issue for stranded road users Standing water (aquaplaning)/ safety and lane/road closure
Reduction in summer rainfall
Low receiving watercourse levels
Drainage dilution levels a concern
Water quality
More extreme rainfall events
Fluvial/pluvial flooding Drainage capacity tested Standing water (aquaplaning)/safety and lane/carriageway closure
Increased wind speed for worst gales
Wind speed more frequently exceeding operational limits
Integrity of structures and signs/signals
Closure of exposed structures to e.g. HGVs/motorcycles
Sea level rise Higher frequency of extreme storm surges
Flooding of coastal assets Restricted access to network
4 Source: Highways Agency Business Plan 2013-14 (http://assets.highways.gov.uk/about-us/corporate-documents-
business-plans/S120450_Highways_Agency_Business_Plan_2013-14.pdf) 5 As recognised in the Climate Change Act 2008 (www.legislation.gov.uk/ukpga/2008/27)
6 http://ukclimateprojections.defra.gov.uk/
7 www.highways.gov.uk/publications/climate-change-mitigation/
8 Source: Highways Agency Climate Change Risk Assessment, August 2011
(www.highways.gov.uk/publications/climate-change-mitigation/)
Economics of Climate Change Adaptation and Risks Final Report
Atkins Final report ׀ July 2013 10
1.2. Study objectives
The majority of previous work on climate change adaptation considered risks to the Agency’s network and operations in a qualitative manner.
This study aimed to quantify a sub-set of the risks associated with climate impacts, taking account of capital and maintenance costs as well as the cost of delays experienced by network users. However, a key finding of the study was that evidence on likely impacts of climate change on the Agency’s assets is limited and insufficient to support the development of clear potential scenarios. Consequently illustrative ‘What If’ scenarios were developed to provide a basis for providing indicative quantification. Within the scope defined below, this study therefore provides illustrative estimates of the cost of hotter, drier summers for the Agency if no action is taken (cost of non-action) and of the costs and benefits of adaptation actions, as defined in Section 3.
1.3. Study scope
1.3.1. Climatic changes considered
This study focuses on two climate change impacts identified as potentially significant risks in previous Agency work on climate change and described as “hotter, drier summers”:
Increases in (maximum) summer temperatures; and
Lower summer precipitations (and soil moisture).
A number of climate change impacts have been excluded from the study’s scope as follows:
Flood risk - the Agency has already commissioned an assessment of the impacts and costs of flooding events on the network and its users and this work is being progressed in parallel;
Snowfall and freeze-thaw - data from UKCP09 and the UK Met Office seems to show a decrease in snowfall in future years but available data does not provide any indications as to the occurrence of freeze-thaw;
High wind speeds - there is currently insufficient evidence to enable a quantitative analysis of the costs associated with wind impacts; and
Sea level rise – linked to flood risk and anticipated direct impacts on the Agency’s network are relatively low although there could be knock-on effects where local networks are affected.
1.3.2. Agency network and assets considered
The study has considered impacts on the main carriageways of the Agency’s road network which has been assumed to remain in its current form throughout the study period, without the addition of new roads or structures.
9
Recent data on traffic volumes on the network was obtained from the Highways Agency’s journey time database
10 and the Department for Transport (DfT) traffic count database
11. Future traffic forecasts are
based on regional data from the DfT’s 2011 Road Traffic Forecasts from the National Transport Model12
.
Beyond the network’s paved roads, the Agency operates, maintains and manages an extensive asset base including bridges, tunnels, culverts, drainage, embankments, road marking and signs, technology infrastructure (traffic detection equipment, variable message signs, lighting and communication equipment), road restraint systems, walls, screens and environmental barriers.
9 This approach was necessary given the lack of certainty over potential future changes and the reliance of the project on
data from the current road network (in terms of surface types, structures and traffic flows) 10
http://data.gov.uk/dataset/dft-eng-srn-routes-journey-times - data for November 2011 to October 2012, the most recent data available when the study was undertaken 11
www.dft.gov.uk/traffic-counts/download.php 12
Road Traffic Forecasts 2011, DfT, www.gov.uk/government/publications/road-transport-forecasts-2011-results-from-the-department-for-transports-national-transport-model
Economics of Climate Change Adaptation and Risks Final Report
Atkins Final report ׀ July 2013 11
This study did not consider the potential impacts of hotter, drier summers on all asset categories but focused on paved roads and bridges, making use of asset data stored in the Agency’s Pavement Management System (HAPMS) and Structures Maintenance Information System (SMIS).
1.3.3. Costs considered
The analysis of costs associated with hotter, drier summers included:
Capital cost to repair or replace assets where assets have been damaged or their service life reduced;
Additional operational costs (for example if additional cleaning was required or additional traffic officers needed); and
HA road user costs (costs incurred by the travelling public on HA roads) in terms of delays associated with additional maintenance (lane/road closures).
Impacts on non-HA road users, accident costs, vehicle operating costs and reliability were considered to be beyond the scope of this study. In some cases, occasions when additional costs might arise were identified but the costs were not quantified. This includes for example, instances where resurfacing works might need to be delayed to avoid compromising the quality of new pavement surfaces or additional costs to maintain staff welfare in hot weather conditions.
The focus of the study was on additional costs arising from a changing climate rather than a cost/benefit analysis identifying negative and positive impacts of climate change. Potential positive impacts have therefore not been considered here. Some potential positive impacts were identified through discussions with experts including: higher winter temperatures (and lower freeze-thaw occurrences) resulting in reduced use of de-icing products which affect the service life of pavements and structures, positive impact on pavement integrity from higher temperatures, positive impact of reduced moisture on structure corrosion, etc.
1.3.4. Timescales
Climate change is a long term process and this assessment therefore required consideration of long term potential impacts. Combining this requirement with HM Treasury guidance for investment appraisal
13, climate
impacts were considered for a 60 year period, from 2013 to 207214
.
1.3.5. Modelling scenarios
The impacts of hotter, drier summers on the Agency’s network and users were estimated under two future climate scenarios described in Table 1.2
Table 1.2: Modelling scenarios components
Modelling scenarios UKCP probability levels15
Emission scenarios16
Central Scenario UKCP09 “central estimate”, with a 50% probability level
Medium emission scenario
Worst Case Scenario UKCP09 “very unlikely to be greater than”, with a 90% probability level
High emission scenario
13
See WebTAG unit 3.5.4 (www.dft.gov.uk/webtag/documents/expert/pdf/u3_5_4-cost-benefit-analysis-020723.pdf) 14
Using UKCIP data to 2069 and extrapolating this data for the additional three years 15
“For example, if a projected temperature change of +4.5°C is associated with the 90% at a particular location in the 2080s for the UKCP09 medium emission scenario, this should be interpreted as it is projected that there is a 90% likelihood that temperatures at that location will be equal to or less than 4.5°C warmer than temperatures in the 1961–1990 baseline period. Conversely, there is a 10% likelihood that those temperatures will be greater than 4.5°C warmer than the baseline period”. Source: UK Climate Projections (http://ukclimateprojections.defra.gov.uk/23208) 16
Emission scenarios used in UK Climate Projections are based on the IPCC’s Special Report on Emissions Scenarios , with the Medium emission scenario corresponding to IPCC SRES A1B (low population growth, very high GDP growth, very high energy use, low land use changes, medium resource availability and rapid change towards a balanced energy mix) and the High emission scenario to IPCC SRES A1FI (similar to A1B but making intensive use of fossil fuels and energy sources)

Economics of Climate Change Adaptation and Risks Final Report
Atkins Final report ׀ July 2013 12
The impacts and costs associated with hotter, drier summers have been estimated using probability levels for each administrative region in England to account for different level of risk by region (for example, high summer temperature events are more likely to occur in the south of England).
1.4. Overview of study methodology
The study team followed the following key steps to estimate:
the cost of climate change (focusing on hotter, drier summers); o review evidence of impacts of current weather related event (limited data identified); o identify baseline maintenance costs from published/observed data; o undertake climate modelling to assess the likely change in temperature and precipitations; o define impact thresholds for HA assets (focusing on pavements and structures) and identify
assets likely to be adversely impacted (mapping process based on data from HA databases);
o develop and assess “What If” scenario for changes in service life for pavements and bridges under hotter, drier summers and assess additional costs for HA (maintenance) and its users (impact of lane closures);
assess the cost/benefit of adaptation; o develop assumptions on likely adaptation measures, their cost and impacts; o assess the cost benefit of climate change adaptation action by comparing results with the
cost of climate change estimated in previous stage.
Appendix A provides more detail on the methodology used to estimate economic impacts of hotter, drier summers on the Highways Agency’s assets and users.
1.4.1. Identifying potential impacts
Potential impacts from hotter, drier summers on the Agency’s network were identified through:
A review of previous work undertaken by the Agency to identify climate related risks and vulnerabilities;
A review of published evidence on the impact of high temperature and changing soil moisture on transport infrastructure;
Interrogation of relevant Agency databases - Structures Maintenance Information System (SMIS), Highways Agency Pavement Management System (HAPMS) and Highways Agency Weather Information System (HAWIS); and
Discussions with experts, including sessions with the Agency’s Pavement Technical Group and Structures Technical Group as well as representatives from the Traffic Officer Service.
This led to the selection of pavements and structures (bridges) as the key assets to be considered for the economic analysis, with impacts assumed to result in reduced service life for some of these assets and associated closures and delays experienced by users. Possible thresholds for impacts were also identified to define climate variables to be modelled as described in section 0.
It was agreed through discussions with Agency experts that the potential impacts on geotechnical assets (mainly embankments and cuttings) should not be included in this analysis as they were assessed not to be significant.
Economics of Climate Change Adaptation and Risks Final Report
Atkins Final report ׀ July 2013 13
1.5. Assessing possible changes in climate
Climate modelling was undertaken using the UKCP09 Weather Generator17
to assess changes in climate variables as follows:
maximum summer temperatures: number of days above 32°C, 35°C and 40°C;
periods with at least 2 consecutive days reaching 32°C;
periods with at least 7 consecutive days reaching 32°C; and
drought threshold combining low precipitations and high temperatures for a prolonged period of time (precipitations below 350 mm for the last 24 months and mean maximum temperature for the quarter above 22.6°C
18).
The thresholds listed above were selected based on published evidence and discussions with experts which identified the potential for negative impacts on pavements from approximately 30°C.
Changes in climate variables were identified separately for each administrative region.
1.5.1. Cost of climate change and adaptation
Following the identification of potential impacts and assets to be considered at risk, the Agency’s Pavement Management System (HAPMS) and Structures Maintenance Information System (SMIS) were interrogated to enable the project team to map parts of the network considered at risk of being negatively affected by hotter, drier summers, according to the climate modelling results, and to link asset data to traffic data.
User impacts
Climate change impacts on pavements and bridges were assumed to result in reduced service life, in turn resulting in additional maintenance and associated lane closures (no assumptions were developed to model pavement or structure failures and maintenance standards and regimes were assumed to remain as present). The link between asset data and traffic data (historic and forecasts) therefore enabled the team to estimate user delays potentially resulting from hotter, drier summers.
To estimate the scale of user impacts, the following steps were undertaken for each location identified as potentially experiencing additional maintenance due to wear caused by hotter, drier summers, for three forecast years which were selected to represent the three decades of the 2020s, 2040s and 2060s (2025, 2045 and 2065):
Estimate the number of users affected, using current traffic flows on the affected route (as collected for DfT’s reliability statistics) and DfT National Transport Model regional traffic growth forecasts by road type;
Identify the composition of the affected traffic in terms of the balance of freight and personal vehicles (based on the DfT traffic count database
19), journey purpose and vehicle occupancy (using WebTAG
unit 3.5.6 assumptions);
Identify the average value of time per user (in £/hour) accounting for estimated purpose, vehicle occupancy and vehicle type proportions and WebTAG default assumptions (unit 3.5.6); and
Identify the likely additional journey time experienced by private vehicle and freight users based on the Delay Cost Model (DCM)
20 underlying the HA PMS SWEEP.S module (an HA tool used to
assess the business case for maintenance interventions).
The economic user related impacts of each additional maintenance disruption was then identified by assuming that users continue to make the journey despite the event and multiplying the number of users over the affected time period by the average delay experienced per user and the appropriate average value of time. The assumption that the user would continue to make the journey was justified by the fact that the
17
See http://ukclimateprojections.defra.gov.uk/22540 18
Based on Harrison, A.M., Plim, J.F.M., Harrison, M., Jones, L.D. and Culshaw, M.G. 2012. The relationship between shrink-swell occurrence and climate in south-east England, Proceedings of the Geologists’ Association 19
www.dft.gov.uk/traffic-counts/download.php 20
The DCM provides functions, derived originally from the DfT’s QUADRO model, which relate delay experienced per
vehicle to factors including the type of lane closure, length and duration of closure and ratio of flow to capacity once the
associated traffic management is in place.

Economics of Climate Change Adaptation and Risks Final Report
Atkins Final report ׀ July 2013 14
maintenance would be planned and would therefore cause relatively limited disruption (rather than occurring unexpectedly and in weather conditions likely to deter travel, like snow and ice for example).
Additional maintenance costs
Additional maintenance costs associated with forecast climate change impacts were based on:
Averaged maintenance costs provided by the Agency;
Published evidence; and
Expert professional judgement.
Adaptation actions and associated costs
Adaptation actions and associated costs and impacts were identified through:
Discussions with Agency experts at sessions organised with the Agency’s Pavement Technical Group and Structures Technical Group;
Published evidence; and
Expert professional judgement.
1.5.2. Key assumptions and limitations
As relevant evidence in the field is limited, the assessment presented in this report is illustrative, based on the development of modelled “What If” scenarios. Specifying the scenarios has therefore involved the use of a series of assumptions including in relation to:
current service lives and maintenance profiles for pavements and structures;
the impacts of climate change on the service life of assets and associated maintenance profiles;
likely maintenance working patterns in the climate change scenario; and
likely response of traffic to maintenance.
It has been assumed that the impacts of hotter, drier summers on pavements and structures can be dealt with through increased planned maintenance (undertaken overnight), without need for emergency action or daytime lane closures.
Regional level climate forecasts have been used, extracted from the UKCP09 Weather Generator17
for a representative point for the region.
Assessment has been limited to assessing impacts on the main carriageways of the Highways Agency’s network – impacts on slip roads and on users on other parts of the road network have been excluded.
These assumptions and a more detailed description of the methodology adopted are included in Appendix A.
Economics of Climate Change Adaptation and Risks Final Report
Atkins Final report ׀ July 2013 15
2. Climate modelling – how will summers change?
This section presents a summary of results from the climate modelling work undertaken for the study. More information on the climate modelling methodology adopted is included in Appendix B.
2.1. Thresholds considered
The UKCP09 Weather Generator was used to assess the likely change for the six thresholds listed below (in nine locations, under two scenarios
21 and considering three future time slices
22):
Number of summer (three-month period June-July-August) days where the maximum temperature is above 32°C;
Number of summer days where the maximum temperature is above 35°C;
Number of summer days where the maximum temperature is above 40°C;
Number of summer periods with more than two consecutive days where the maximum temperature is above 32°C;
Number of summer periods with more than seven consecutive days where the maximum temperature is above 32°C; and
Number of periods23
where a function of precipitation is below 350 mm for the last 24 months and the mean maximum temperature for the quarter (3 months period) is above 22.6°C
18.
2.2. Summary of climate modelling results
Table 2.1, Table 2.2 and Table 2.3 overleaf present a summary of the climate modelling results24
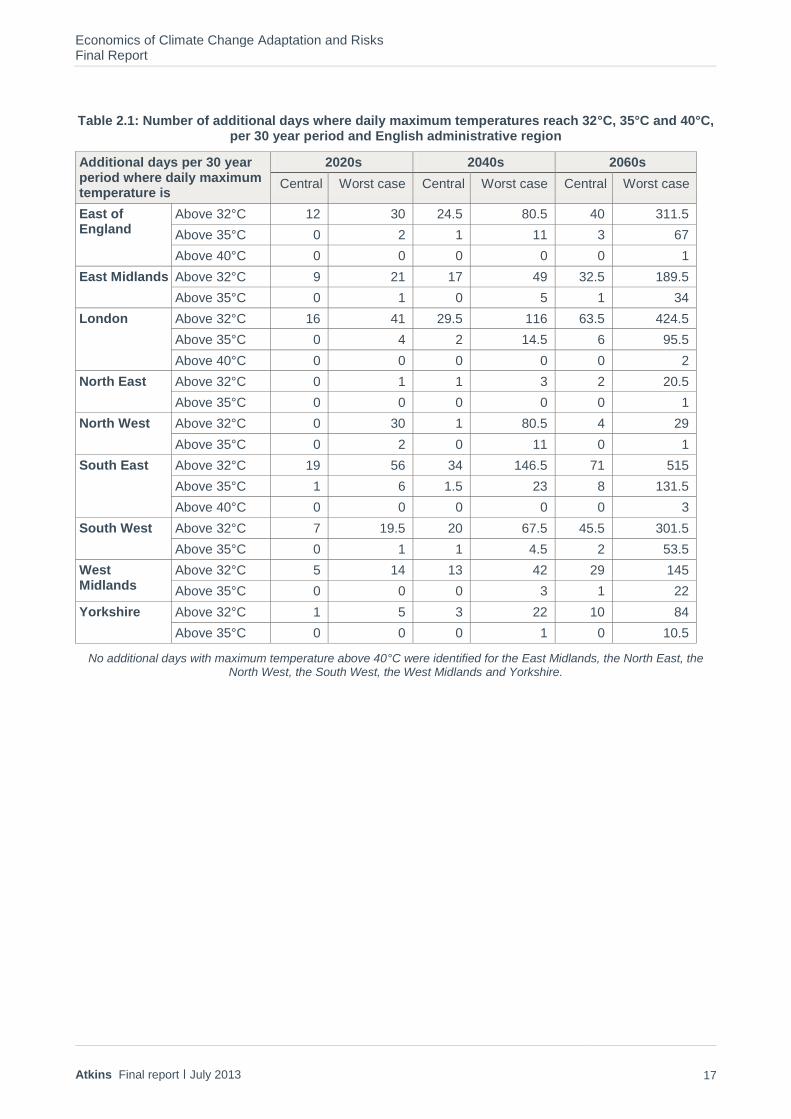
, showing the number of additional days reaching maximum temperatures above 32°C, 35°C and 40°C and periods where consecutive days reach maximum temperatures above 32°C. These figures are to be considered as additional days/periods reaching the selected thresholds when compared to current (baseline) events (although it should be noted that their occurrence is relatively rare at present). Results presented by English administrative region as mapped in Figure 2.1.
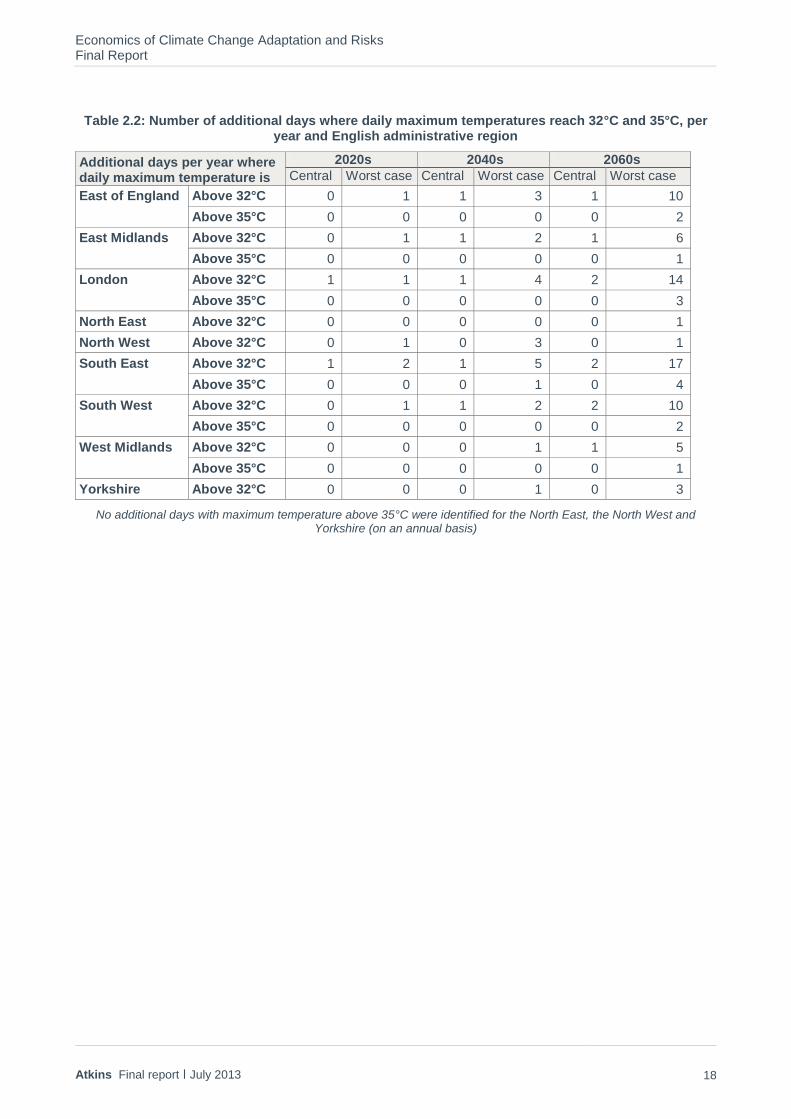
As expected, the most significant increases in summer maximum temperatures are modelled to occur in East of England, London, the South East and the South West. When considered on an annual basis, changes are however limited to a few additional days per year as shown in Table 2.2.
Table 2.4 shows the number of additional drought periods modelled. This analysis also shows relatively low levels of change with only a few additional drought events per 30 year period. The worst affected region is identified as Yorkshire, with East of England, the East Midlands, the North West and the South East also identified as potentially affected regions.
These results were presented to experts, including during the sessions organised with the Agency’s Pavement Technical Group and Structures Technical Group to give an idea of the scale of change to be expected and support discussions on the potential impacts of these changes on the Agency’s assets and users.
21
Central scenario: Medium emissions and 50th percentile and Worst-case scenario: High emissions and 90th percentile 22
2020s (2010 to 2039), 2040s (2030 to 2059) and 2060s (2050 to 2079) 23
Number of quarters (i.e. three month period) 24
As the WG produces 100 output time series, there are 100 results for each threshold and location/scenario/time slice combination. The results were therefore presented as the 50th, 5th and 95th percentiles to give an indication of the range across all the runs. Results presented in this section are for the 50
th percentile.

Economics of Climate Change Adaptation and Risks Final Report
Atkins Final report ׀ July 2013 16
Figure 2.1: Administrative regions in England
Economics of Climate Change Adaptation and Risks Final Report
Atkins Final report ׀ July 2013 17
Table 2.1: Number of additional days where daily maximum temperatures reach 32°C, 35°C and 40°C, per 30 year period and English administrative region
Additional days per 30 year period where daily maximum temperature is
2020s 2040s 2060s
Central Worst case Central Worst case Central Worst case
East of England
Above 32°C 12 30 24.5 80.5 40 311.5
Above 35°C 0 2 1 11 3 67
Above 40°C 0 0 0 0 0 1
East Midlands Above 32°C 9 21 17 49 32.5 189.5
Above 35°C 0 1 0 5 1 34
London Above 32°C 16 41 29.5 116 63.5 424.5
Above 35°C 0 4 2 14.5 6 95.5
Above 40°C 0 0 0 0 0 2
North East Above 32°C 0 1 1 3 2 20.5
Above 35°C 0 0 0 0 0 1
North West Above 32°C 0 30 1 80.5 4 29
Above 35°C 0 2 0 11 0 1
South East Above 32°C 19 56 34 146.5 71 515
Above 35°C 1 6 1.5 23 8 131.5
Above 40°C 0 0 0 0 0 3
South West Above 32°C 7 19.5 20 67.5 45.5 301.5
Above 35°C 0 1 1 4.5 2 53.5
West Midlands
Above 32°C 5 14 13 42 29 145
Above 35°C 0 0 0 3 1 22
Yorkshire Above 32°C 1 5 3 22 10 84
Above 35°C 0 0 0 1 0 10.5
No additional days with maximum temperature above 40°C were identified for the East Midlands, the North East, the North West, the South West, the West Midlands and Yorkshire.
Economics of Climate Change Adaptation and Risks Final Report
Atkins Final report ׀ July 2013 18
Table 2.2: Number of additional days where daily maximum temperatures reach 32°C and 35°C, per year and English administrative region
Additional days per year where daily maximum temperature is
2020s 2040s 2060s
Central Worst case Central Worst case Central Worst case
East of England Above 32°C 0 1 1 3 1 10
Above 35°C 0 0 0 0 0 2
East Midlands Above 32°C 0 1 1 2 1 6
Above 35°C 0 0 0 0 0 1
London Above 32°C 1 1 1 4 2 14
Above 35°C 0 0 0 0 0 3
North East Above 32°C 0 0 0 0 0 1
North West Above 32°C 0 1 0 3 0 1
South East Above 32°C 1 2 1 5 2 17
Above 35°C 0 0 0 1 0 4
South West Above 32°C 0 1 1 2 2 10
Above 35°C 0 0 0 0 0 2
West Midlands Above 32°C 0 0 0 1 1 5
Above 35°C 0 0 0 0 0 1
Yorkshire Above 32°C 0 0 0 1 0 3
No additional days with maximum temperature above 35°C were identified for the North East, the North West and Yorkshire (on an annual basis)
Economics of Climate Change Adaptation and Risks Final Report
Atkins Final report ׀ July 2013 19
Table 2.3: Number of additional periods with high maximum temperature, per 30 year period and English administrative region
Number of periods where X consecutive days with maximum temperature above 32°C
2020s 2040s 2060s
Central Worst case Central Worst case Central Worst case
East of England Two days 1 5 4 17 7 70 Seven days 0 0 0 0 0 4
East Midlands Two days 1 2 2 9 4 42 Seven days 0 0 0 0 0 1
London Two days 2 8 5 25.5 12.5 94.5 Seven days 0 0 0 0 0 7
North East Two days 0 0 0 0 0 3 North West Two days 0 5 0 17 0 5 South East Two days 3 11 5 32 14 109.5
Seven days 0 0 0 0 0 9.5 South West Two days 0 3 3 14 9 66
Seven days 0 0 0 0 0 4 West Midlands Two days 0 2 1.5 8 5 32
Seven days 0 0 0 0 0 1 Yorkshire Two days 0 0 0 3 1 18
No additional seven day periods with maximum temperature above 32°C were identified for the North East, the North West and Yorkshire
Table 2.4: Number of additional drought events, per 30 year period and English administrative region
Number of additional drought events per 30 year period
2020s 2040s 2060s
Central Worst case Central Worst case Central Worst case
East of England 0 1 1 0 1 0.5 East Midlands 0 0 0 0 1 0 North West 0 1 0 0 0 0 South East 0 1 0 0 1 0 Yorkshire 0 0.5 0 1 2 3
No additional drought periods were identified for London, the North East, the South West and the West Midlands.
Economics of Climate Change Adaptation and Risks Final Report
Atkins Final report ׀ July 2013 20
3. Identifying the impacts of hotter, drier summers on the network
This section summarises the key impacts identified for the Agency’s assets and users from hotter, drier summers. Impacts were identified through a review of previous Agency work and published evidence and through discussions with experts. This led to the selection of pavements and structures (bridges) as the key assets to be considered for this analysis. Discussions with Agency experts led to the exclusion of geotechnical assets (embankments and cuttings) as they were not identified as being at risk.
3.1. The impact of hotter, drier summers on pavements
Although the focus of this study is on hotter, drier summers, it is important to note that the impact of winter weather and severe weather events is also significant. The service life of pavements is also affected by a number of other factors, including changes in expected traffic volumes. Impacts are also likely to vary depending on the type of roads, with impacts likely to be higher on local authority roads rather than on Highways Agency roads due to differences in pavement design, characteristics, age and maintenance regimes.
3.1.1. Summary of evidence review
The UK Climate Change Risk Assessment25
notes that:
“the deformation and rutting of road surfaces could increase as road surface temperatures increase due to warmer summers”;
“also road repairs might be postponed or delays could be caused as a result of the required cooling of the road surface after resurfacing before vehicles are allowed to reuse a road”
26.
The assessment undertaken at UK level however indicates that “this impact is likely to be less significant than those due to flood risk and the costs incurred as a result of increased thermal loading are likely to be relatively modest”
27. The Risk Assessment also identifies the potential need to increase the proportion of
repair works carried out at night when temperatures are lower but scheme costs higher.
Evidence from the United States identifies “air temperature over 32°C is a significant threshold for roadways”, with increased risk of thermal cracking above this threshold
28, as road surface temperature may
significantly exceed ambient temperature29
. Publications also pointed to potential issues with concrete strength and the ability of construction and maintenance staff to perform their duties when temperatures are above 32°C
30.
Deformation and rutting
TRL research on the effects of climate change on highway pavements notes: “The relationship between the mean air temperature and the traffic and damage weighted mean temperature are not linear. An increase of 1°C in the mean air temperature may increase the mean traffic weighted temperature by approximately 1.5°C and the traffic and damage weighted mean temperature may increase by approximately 2.0°C.(...) This suggests that the nominal structural life of the pavement (for the example given, in million standard axles) will be reduced by about 17% for an increase in the equivalent pavement temperature of 1°C. (...) A more practical way of interpreting these results is to recognise that pavement life is subject to variability, and
25
www.gov.uk/government/publications/uk-climate-change-risk-assessment-government-report 26
This is a relatively low risk on the Agency’s network as a majority of resurfacing work is currently undertaken at night 27
Source: Climate Change Risk Assessment for the Transport Sector, 2012 28
Source: Weather and climate change implications for surface transportation in the USA, McGuirk, Shuford, Peterson and Pisano (www.wmo.int/pages/publications/bulletin_en/archive/58_2_en/documents/58_2_mcguirk_en.pdf) 29
TRL research shows that asphalt surface temperature can already reach, and may even exceed, 50°C, particularly for south facing gradients in southern England and that the road temperature was generally 35% higher than the air temperature, but was 75% higher on occasions. Source: The behaviour of asphalt in adverse hot weather conditions, TRL 494, 2001 30
Source: CCSP, 2008: Impacts of Climate Change and Variability on Transportation Systems and Infrastructure: Gulf Coast Study, Phase I (www.climatescience.gov/Library/sap/sap4-7/final-report/sap4-7-final-all.pdf)

Economics of Climate Change Adaptation and Risks Final Report
Atkins Final report ׀ July 2013 21
that the nominal design life predicted using LR1132 presents the 85% probability that the pavement will survive that life without requiring structural maintenance. An increase in the equivalent pavement temperature of 1°C will result in a reduction of the probability of a pavement achieving its design life without requiring structural maintenance from 85% to about 81.8% and an increase of 2°C in equivalent pavement temperature will reduce this probability to 78.2%”
31.
Higher summer temperatures may also adversely affect skid resistance. For example, prolonged periods of dry weather, followed by rainfall, will lead to a reduction in skid resistance due to oil and detritus build-up on the carriageway.
The summer of 2003 was a particularly hot summer in the UK and data analysis undertaken for various studies shows a link between the high temperatures reached, lower precipitations and increases in road maintenance costs, for example:
Cambridgeshire County Council spent in excess of £19 million on scheduled highway maintenance schemes with a large number of additional structural maintenance schemes required as a result of the drought conditions (estimated to cost £3.5 million) and an additional £1.1 million spent on emergency repairs of the highway due to cracking and deformation
32;
Analysis of annual rates of rutting observed on trunk road sections located in the East of England against maximum summer temperatures show higher rates of rutting in 2003 compared to other years
33; and
UK regional road subsidence costs (local authority roads only) were estimated at £40.6 million following the summer of 2003, with the highest costs in the South East (£18.7 million) and the East of England (£13.2 million)
34.
Delays to maintenance works
In research on the behaviour of asphalt in hot weather conditions35
, TRL notes that “an asphalt layer will not cool below about 50°C, twice the air temperature in degree Celsius, on a day that is hot, calm and sunny. This temperature can be compared to the safe temperature for trafficking of below 50°C. (...) In general a day must elapse before the heat of a 50mm thick layer is dissipated and three days for a 150mm thick layer”. Recommendations include the “cessation of laying during the hottest part of the day, when the road surface temperature exceeds 45°C”.
31
Source: The effects of climate change on highway pavements, TRL (www.ukroadsliaisongroup.org/en/utilities/document-summary.cfm?docid=6FBEB827-8EB0-4B15-A3B9B389E81796F3) 32
Source: Study on the economic effects of the 2003 heat wave on transport, Alistair Hunt, Metroeconomica & University of Bath 33
Source: Assessment of the impact of climate change on road maintenance, Anyala, Odoki and Baker, 2012 34
Source: Defra Climate Change Impacts and Adaptation: Cross-Regional Research Programme: Project E – Quantify the cost of impacts and adaptation Final Report, Metroeconomica (http://randd.defra.gov.uk/Default.aspx?Menu=Menu&Module=More&Location=None&Completed=0&ProjectID=13231) 35
Source: The behaviour of asphalt in adverse hot weather conditions, TRL 494, 2001 (www.trl.co.uk/online_store/reports_publications/trl_reports/cat_highway_engineering/report_the_behaviour_of_asphalt_in_adverse_hot_weather_conditions.htm)
“I was working on the M25 in 2003 and there were a number of heat related issues during that summer, including softening of the asphalt surface.
The road sensors normally used during the winter were used to record the road surface temperatures during the summer. From memory, they reached a maximum of 55°C. The maximum temperatures were reached between 15.00 and 16.00 each day.
As a result of the high temperatures rutting was very rapid in some areas. I can recall the worst was approaching 3 mm per week. This was in lane 1 (higher number of HGVs) between Junctions 9 and 8 anticlockwise. This is south facing and an uphill grade which is the worst possible situation for the high temperatures”.
Source: Member of staff working on M25 in summer 2003
Economics of Climate Change Adaptation and Risks Final Report
Atkins Final report ׀ July 2013 22
3.1.2. Expert views
Discussions with experts within the project team and with Highways Agency teams, supplemented by previous Agency work on climate change adaptation
36 identified the following issues:
Higher summer temperatures might have an impact on pavement service life but it is difficult to assess as this impact is likely to be relatively small compared to the impact of winter temperatures, severe weather events, freeze-thaw cycles and the use of de-icing products – it was noted that for the assessment of the impacts of climate change to be balanced, the potential changes in winter weather patterns and events and their impact on Agency assets should also be taken into account;
Many factors affect pavement service life and it is difficult to ascertain the impact of individual factors such as hotter summer temperature in isolation;
Although published evidence seems to focus on the impact of higher summer temperatures on surfacing, higher summer temperatures could also have impacts on lower pavement layers, which can be significant for some type of materials;
Increased temperatures are likely to lead to issues with expansion joints and cracking in concrete pavements (linked to joint failures and resulting in pavement failures and the need for emergency repairs) as well as linear features exposed to the atmosphere, such as kerbs. Thermal gradients in concrete pavements can create uneven internal stresses which can then give rise to curling or warping of the slabs.
3.1.3. Assumptions used for modelling work – “What If” scenario
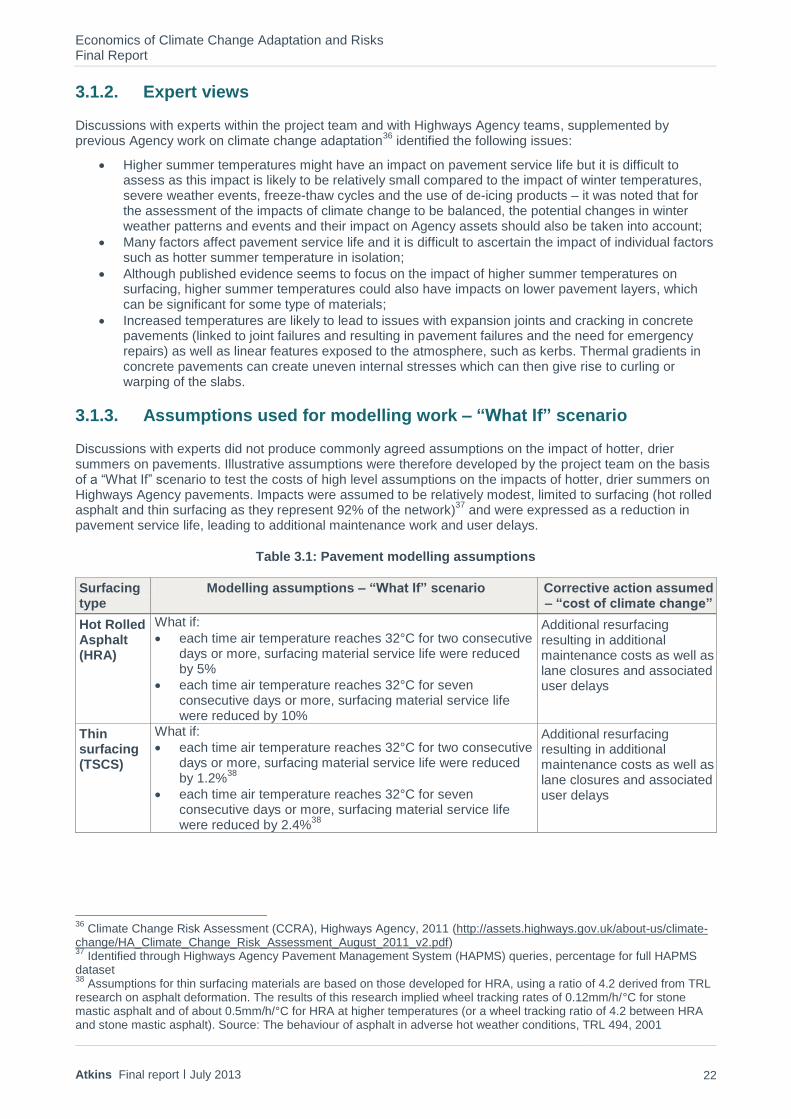
Discussions with experts did not produce commonly agreed assumptions on the impact of hotter, drier summers on pavements. Illustrative assumptions were therefore developed by the project team on the basis of a “What If” scenario to test the costs of high level assumptions on the impacts of hotter, drier summers on Highways Agency pavements. Impacts were assumed to be relatively modest, limited to surfacing (hot rolled asphalt and thin surfacing as they represent 92% of the network)
37 and were expressed as a reduction in
pavement service life, leading to additional maintenance work and user delays.
Table 3.1: Pavement modelling assumptions
Surfacing type
Modelling assumptions – “What If” scenario Corrective action assumed – “cost of climate change”
Hot Rolled Asphalt (HRA)
What if:
each time air temperature reaches 32°C for two consecutive days or more, surfacing material service life were reduced by 5%
each time air temperature reaches 32°C for seven consecutive days or more, surfacing material service life were reduced by 10%
Additional resurfacing resulting in additional maintenance costs as well as lane closures and associated user delays
Thin surfacing (TSCS)
What if:
each time air temperature reaches 32°C for two consecutive days or more, surfacing material service life were reduced by 1.2%
38
each time air temperature reaches 32°C for seven consecutive days or more, surfacing material service life were reduced by 2.4%
38
Additional resurfacing resulting in additional maintenance costs as well as lane closures and associated user delays
36
Climate Change Risk Assessment (CCRA), Highways Agency, 2011 (http://assets.highways.gov.uk/about-us/climate-change/HA_Climate_Change_Risk_Assessment_August_2011_v2.pdf) 37
Identified through Highways Agency Pavement Management System (HAPMS) queries, percentage for full HAPMS dataset 38
Assumptions for thin surfacing materials are based on those developed for HRA, using a ratio of 4.2 derived from TRL research on asphalt deformation. The results of this research implied wheel tracking rates of 0.12mm/h/°C for stone mastic asphalt and of about 0.5mm/h/°C for HRA at higher temperatures (or a wheel tracking ratio of 4.2 between HRA and stone mastic asphalt). Source: The behaviour of asphalt in adverse hot weather conditions, TRL 494, 2001
Economics of Climate Change Adaptation and Risks Final Report
Atkins Final report ׀ July 2013 23
It should be noted that these assumptions were illustrative and developed for modelling purposes only. In
practice, the timing of resurfacing and other repair works would depend on many factors including budget
constraints, staff availability and timing of other works in the same area and actual service life is likely to
vary.
3.2. The impact of hotter, drier summers on structures
As for pavements, it is important to note that many factors affect the service life of structures, including traffic, winter and summer weather or severe weather events and it is difficult to link damage on structures clearly and uniquely to climate change factors
39. Impacts are also likely to vary depending on design,
materials used, age of the structure and location.
3.2.1. Summary of evidence review
Published evidence on the impact of hotter, drier summers on highway structures is limited. Previous work undertaken by the Highways Agency for the Climate Change Risk Assessment identified the following risks for structures in hotter, drier summers:
risk of thermal expansion of superstructures in extreme temperature situations giving rise to increased action effects (bending moments, shear forces, etc);
increased thermal range could give rise to increased earth pressures for integral bridges (dependent upon repeated cycles of displacements rather than one-off extreme displacements);
bearings and expansion joints will need to be able to accommodate movements due to thermal expansion and contraction and increased or more frequent thermal movements may also affect the service life of expansion joints and bearings;
changes in soil humidity and ground water levels could lead to larger ground movement/heave than considered at design stage and affect foundation settlement;
designers will need to set appropriate performance requirements where temperature sensitive components such as epoxies/FRP
40 are used; and
potential constraints on construction activities for activities which should not be undertaken at high temperatures (concrete, use of epoxies).
Research undertaken on behalf of the Highways Agency in 200741
focused on the following aspects of bridge design and management because of their sensitivity to temperature variations:
expansion joints; o noting that there “needs to be sufficient gap for the bridge to expand and contract and the
expansion joint itself must be sufficiently flexible to allow for these changes without failing” and that it should be possible to deal with increases in expansion movement during planned joint replacement;
o recommending that guidance be developed on how to determine whether the joint will be able to accommodate the movement arising from any changes in extreme temperature and that temperature maps in the National Annex to BS EN 1991-1-5 should take account of climate change;
bearings – with recommendations similar to those for expansion joints;
distortion of frame structures – recommending that extreme temperatures resulting from climate change be taken into account when designing the frame; and
enhanced earth pressures for integral bridges – recommending an increase in “the maximum effective bridge temperature used in the design of integral bridges to take account of the potential effects of climate change”.
39
See for example Adaptation to climate change for bridges, PIARC, 2011 (www.piarc.org/en/order-library/11607-en-Adaptation%20to%20climate%20change%20for%20bridges.htm) 40
Fibre Reinforced Polymer. The mechanical properties of FRPs deteriorate with increasing temperatures. The critical temperature is commonly taken to be the glass transition temperature of the polymer matrix which is in the range of 65 to 120°C for matrices used in infrastructure application. Source: ISIS Educational Module 8 Durability of FRP Composites for Construction (www.isiscanada.com/education/Students/ISIS%20EC%20Module%208%20-%20Notes%20(Student).pdf) 41
The impact of changes in extreme temperature and precipitation on the assets and operations of the Highways Agency, PB, WSP, Met Office, 2007

Economics of Climate Change Adaptation and Risks Final Report
Atkins Final report ׀ July 2013 24
3.2.2. Expert views
Experts generally noted that impacts on structures were likely to be more significant if cold weather, freeze-thaw cycles and the frequency of temperature variations were considered. The view was that the impact of hotter, drier summers would generally be limited for structures on the Agency network.
Expansion joints
As noted above, expansion joints could potentially be affected by changes in summer temperatures and changes to materials used or specifications (standards review) might be required to ensure that joints are replaced adequately during planned maintenance. Discussions with Agency experts led to the exclusion of buried joints from the at risk category and led to modelling assumptions focussing on nosing joints as part of the “what if” analysis.
Bearings
Discussions with experts led to the exclusion of bridge bearings from the “what if” analysis as experts identified variations in temperatures as a much greater risk than higher summer temperatures for bearings.
Integral bridges
Experts identified potential issues with integral bridges as changes in temperatures (higher temperatures but mostly increased variations) could potentially result in enhanced earth pressures on integral bridge abutments. The “what if” analysis therefore includes assumptions on impacts on integral bridges linked to the drought threshold developed for the study.
Temperature sensitive components (epoxies/FRP)
Experts noted that FRP does lose stiffness with higher temperatures but felt that this would probably not be an issue in this case. Structures using temperature sensitive components were therefore not included in the “what if” analysis.
Specialist surfacing (Gussasphalt)
Experts identified potential issues with the use of specialist surfacing (Gussasphalt) on lightweight steel bridges where composite action is needed with the surfacing to counter steel fatigue damage of the deck plate and high temperatures may soften the surfacing making it ineffective. Additional UV exposure could also have an impact on paints and Gussasphalt.
Corrosion
Experts identified the risk of increased steel corrosion due to warmer (and potentially wetter) weather. Research shows that “for ambient temperatures above freezing, the corrosion rate will double if the temperature increases by 10°C”
42.
Bridge temperatures for design purposes
Experts discussed the need to review isotherms of shade air temperature used to derive effective bridge temperatures for design purposes to take account of future increases in summer temperatures.
42
Derived from the Arrhenius Equation as presented in Corrosion Control Plan for Bridges, NACE, 2012 (www.nace.org/uploadedFiles/Corrosion_Central/Corrosion_101/White_Papers/CorrosionControlPlanForBridges.pdf)
Economics of Climate Change Adaptation and Risks Final Report
Atkins Final report ׀ July 2013 25
3.2.3. Assumptions used for modelling work – “What If” scenario
Discussions with experts did not lead to commonly agreed assumptions on the impact of hotter, drier summers on structures. Illustrative assumptions were therefore developed by the project team on the basis of a “What If” scenario to test the costs of high level assumptions on the impacts of hotter, drier summers on Highways Agency structures.
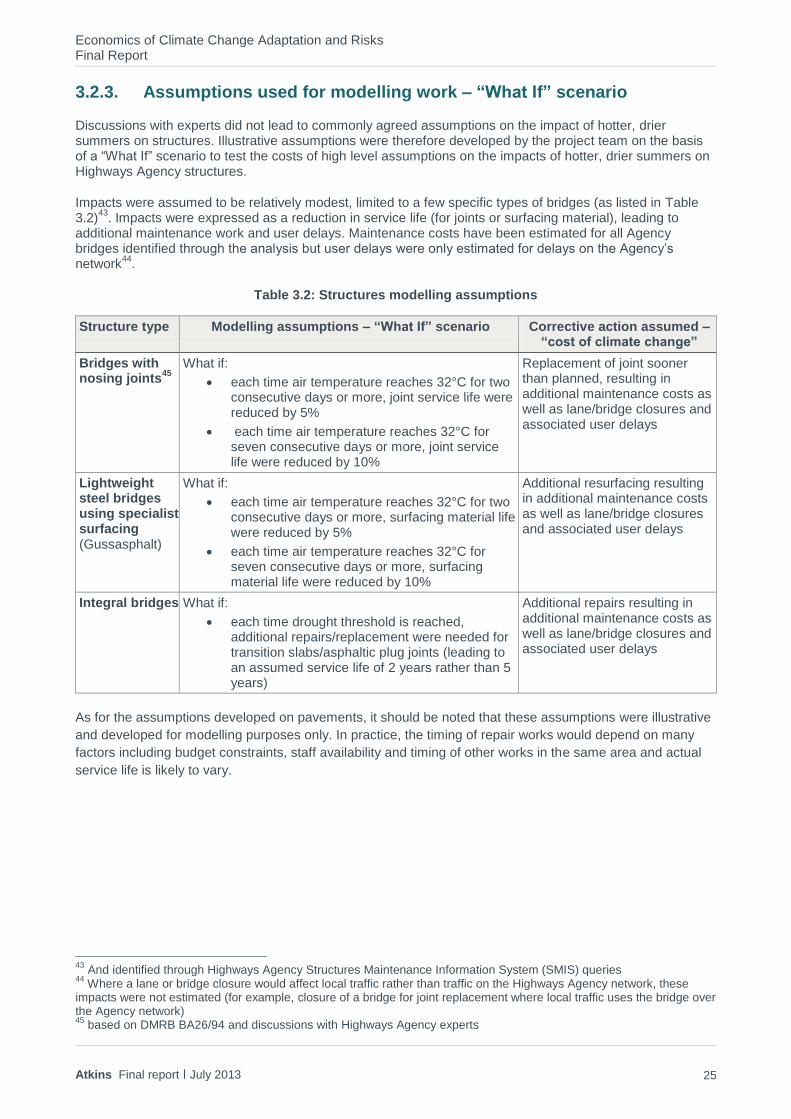
Impacts were assumed to be relatively modest, limited to a few specific types of bridges (as listed in Table 3.2)
43. Impacts were expressed as a reduction in service life (for joints or surfacing material), leading to
additional maintenance work and user delays. Maintenance costs have been estimated for all Agency bridges identified through the analysis but user delays were only estimated for delays on the Agency’s network
44.
Table 3.2: Structures modelling assumptions
Structure type Modelling assumptions – “What If” scenario Corrective action assumed – “cost of climate change”
Bridges with nosing joints
45
What if:
each time air temperature reaches 32°C for two consecutive days or more, joint service life were reduced by 5%
each time air temperature reaches 32°C for seven consecutive days or more, joint service life were reduced by 10%
Replacement of joint sooner than planned, resulting in additional maintenance costs as well as lane/bridge closures and associated user delays
Lightweight steel bridges using specialist surfacing (Gussasphalt)
What if:
each time air temperature reaches 32°C for two consecutive days or more, surfacing material life were reduced by 5%
each time air temperature reaches 32°C for seven consecutive days or more, surfacing material life were reduced by 10%
Additional resurfacing resulting in additional maintenance costs as well as lane/bridge closures and associated user delays
Integral bridges What if:
each time drought threshold is reached, additional repairs/replacement were needed for transition slabs/asphaltic plug joints (leading to an assumed service life of 2 years rather than 5 years)
Additional repairs resulting in additional maintenance costs as well as lane/bridge closures and associated user delays
As for the assumptions developed on pavements, it should be noted that these assumptions were illustrative
and developed for modelling purposes only. In practice, the timing of repair works would depend on many
factors including budget constraints, staff availability and timing of other works in the same area and actual
service life is likely to vary.
43
And identified through Highways Agency Structures Maintenance Information System (SMIS) queries 44
Where a lane or bridge closure would affect local traffic rather than traffic on the Highways Agency network, these impacts were not estimated (for example, closure of a bridge for joint replacement where local traffic uses the bridge over the Agency network) 45
based on DMRB BA26/94 and discussions with Highways Agency experts
Economics of Climate Change Adaptation and Risks Final Report
Atkins Final report ׀ July 2013 26
3.3. Hotter, drier summers – wider impacts
Although the economic analysis presented in the following sections focuses on the analysis of limited “What If” scenarios for pavements and structures; other potential impacts were identified through discussions with experts and evidence review. The cost of these impacts to the Agency and its users has not been estimated.
3.3.1. Additional impacts on Agency assets
Features such as kerbs, road restraint systems, road markings, road signs, traffic signals, lighting, fences, walls, screens and environmental barriers could potentially be affected by higher summer temperatures although no evidence was available for these assets. Changing temperatures could also potentially affect ICT assets. For example, research on the impacts of climate change on the ICT sector notes that “higher temperatures reduce the distance wireless signals can transmit and changes to precipitation and humidity can affect the ability of wireless devices to pick up signals”
46. As noted above,
repairs might need to be postponed due to high temperatures (for technical reasons where materials are heat sensitive or to preserve worker welfare).
The UK Climate Change Risk Assessment47
notes that climate change is projected to increase the risk of large scale wildfires throughout the UK, especially in southern England. The transport sector report notes that “potential implications for transport include increased disruption if services are delayed because of fires, and damage to infrastructure”
48. Data provided by the Highways Agency on current occurrences of verge
fires on the network shows that between 250 and 500 incidents were recorded per annum on the network between 2006 and 2012. It is important to note that these fires can have significant impacts on users as the fire service might require the closure of several lanes or even the full carriageway to intervene safely.
3.3.2. Air quality and environmental impacts
Air quality analysis shows that high summer temperatures often exacerbate existing air quality issues. For example, the Environment Agency notes that “the heat wave in summer 2003 caused the poorest air quality for years. High levels of pollution were measured on 10 consecutive days in August, and ozone pollution reached its highest peak for more than a decade in London. High levels of pollution were again recorded in late July/early August 2004 as temperatures rose to about 30°C”
49.
As air quality is already an issue in some areas served by the Highways Agency network, higher summer temperatures are likely to result in further deterioration of air quality in these areas and mitigation measures might need to be implemented during high temperature periods.
Reductions in summer rainfall could also lead to lower water quality in the vicinity of the Agency’s network as drainage dilution levels are reduced in receiving watercourses with low water levels
50. This
might lead to unacceptable pollution levels from routine runoffs in areas where precipitation levels are very low (and higher impacts from accidental spillages).
Additional assessments of impacts51
might be required in the most at risk areas, especially where HA roads feed into sensitive water bodies (such as Site of Special Scientific Interests, Special Protection Areas, Special Area for Conservations, Water Protection Zones, Ramsar Wetlands and salmonid waters).
46
Source: Adapting the ICT Sector to the Impacts of Climate Change, AEA Technology (www.gov.uk/government/uploads/system/uploads/attachment_data/file/69266/pb13520-infrastructure-adaptation-supplementary.pdf) 47
www.gov.uk/government/publications/uk-climate-change-risk-assessment-government-report 48
Source: CCRA for the Transport Sector Technical Report (www.gov.uk/government/publications/uk-climate-change-risk-assessment-government-report) 49
Source: Environment Agency (hwww.direct.gov.uk/prod_consum_dg/groups/dg_digitalassets/@dg/@en/documents/digitalasset/dg_073021.pdf) 50
DMRB HD 45/09 notes that “with UK summers becoming hotter and drier and winters becoming milder and wetter the seasonality of river volumes may change, particularly in rivers with a high proportion of base flow from groundwater. (...) Change in levels and timing of flows could increase the risk of extreme low river flows if winter recharge were insufficient. However, wetter winters and more frequent extreme winter precipitation may lead to increases in river flows and, therefore, the likelihood of flooding. Future impacts on river flows are also likely to vary between catchments within the UK.” (http://www.dft.gov.uk/ha/standards/dmrb/vol11/section3/hd4509.pdf) 51
As described in DMRB HD 45/09 (potentially with updated requirements for assessments)
Economics of Climate Change Adaptation and Risks Final Report
Atkins Final report ׀ July 2013 27
3.3.3. Operational impacts and user welfare
The impacts of hotter, drier summers on the Agency’s operations were discussed with representatives from the Agency’s Traffic Officer Service. Key points to note include:
Potential issues with Traffic Officers’ welfare (current kit might not be adapted to high summer temperatures) and user welfare (need for water and shade);
There is a risk that more vehicles break down on hot days although this might not necessarily be an issue if they park on the hard shoulder or in emergency refuge areas;
Where traffic queues form (linked to heavy traffic congestion or incidents/accidents), there might be issues with users running out of fuel as they might keep the engine running to provide air conditioning (similar to winter time and the need for heating);
Additional/different demands are usually placed on the network on hot days, with more caravans, horse boxes using the network and potential issues due to people’s lack of experience in towing (and sometimes lower levels of checks and maintenance on these vehicles);
Potential issues with animal welfare for cattle/animal transport caught in queues in hot weather;
The Agency currently undertakes user awareness campaigns for winter conditions and similar campaigns are organised for warm weather and could become more frequent if required.
3.3.4. Reputational risk
Climate change and the way the Agency prepares to address its impacts can influence users’ trust and satisfaction with the Agency. For example, if the Agency was to fail to take adequate steps to adapt to climate change related risks and provide a resilient network, more frequent road closures could adversely affect the Agency’s reputation.
Discussions with Agency staff led to the identification of a range of financial impacts from reputational damage, from a few hundred pounds, for staff time spent reacting to a negative story in the press, to millions of pounds if stakeholder concerns result in a whole programme needing to be reviewed.
3.3.5. Asset valuation
The Agency reports the values of its highway assets on an annual basis to support Whole of Government Accounts (commercial-style accounts covering all public-sector assets). According to the Agency’s Business Plan 2012-13
52, the Agency’s network is valued at approximately £100 billion
53.
This value is calculated as a function of the condition of the asset. Therefore, when climate change affects the condition of pavements and structures, it will also have an impact on their asset value.
The issue of impairment54
is of particular significance when considering climate change impacts. If any part of the asset cannot provide the service that is required due to impairment, its value will have to be adjusted accordingly. Revenue funding allocations to the Agency are linked to the reported asset value and the funding of impairment is an issue currently under consideration for the Agency.
52
http://assets.highways.gov.uk/about-us/corporate-documents-business-plans/S110461_Business_Plan_2012-13_Final.pdf 53
evaluated as the Depreciated Replacement Cost (DRC) of the Agency’s assets 54
Impairment is defined as “a reduction in Net Asset Value due to a sudden or unforeseen decrease in condition and/or performance of an asset, compared to the previously assessed level, which has not been recognised through depreciation” in Highway Infrastructure Asset Valuation Guide, County Surveyors Society/TAG Asset Management Working Group, 2005 (www.ukroadsliaisongroup.org/en/utilities/document-summary.cfm?docid=0B6C87C1-F2BA-4BF3-BBAE3FE735ED3C77)

Economics of Climate Change Adaptation and Risks Final Report
Atkins Final report ׀ July 2013 28
4. Estimating the cost of hotter, drier summers for the Highways Agency
This section presents the results of the modelling work undertaken to use “What If” scenarios to estimate illustrative costs of hotter and drier summers to the Agency and its users (cost of climate change).
4.1. Maintenance costs
Modelling assumptions are based on a reduction in service life for selected pavements (see Table 3.1) and bridges (see Table 3.2). This in turn is assumed to result in additional capital maintenance costs as presented below and overleaf.
Table 4.1 and Table 4.2 summarise the estimated cost of additional maintenance due to hotter, drier summers, based on the “What If” scenarios presented above. Results are presented by administrative regions and for the whole of England for the whole 60 year period considered. Table 4.1 presents results for the Central Scenario developed for climate change modelling (see Table 1.2). Table 4.2 presents results under the Worst Case Scenario (see Table 1.2).
Regions with the highest costs are those which are likely to experience the strongest increases in summer temperatures, namely the South East, the East of England and the South West. A significant proportion of the Agency’s network is located within these regions. Despite this fact, the total discounted additional maintenance costs are estimated to be modest in the Central Scenario, at just over £9 million (present value). Results for the Worst Case Scenario show much higher additional maintenance costs, estimated at approximately £76 million (present value) in total, reflecting the much greater forecast frequency of potentially damaging weather events in this scenario.
Table 4.1: Maintenance cost of hotter, drier summers, Central Scenario (Present Value, £000s, 60 year period)
55
Region Pavements Structures (under) Structures (over) All
East of England 1,481 76 84 1,641
East Midlands 650 13 31 694
London 116 53 34 203
North East 0 0 0 0
North West 0 0 0 0
South East 4,150 180 517 4,846
South West 1,025 33 100 1,157
West Midlands 606 70 48 724
Yorks & Humber 60 25 13 98
Total 8,086 449 827 9,362
55
2010 prices and values, discounted at 3.5% for first 30 years and 3% thereafter
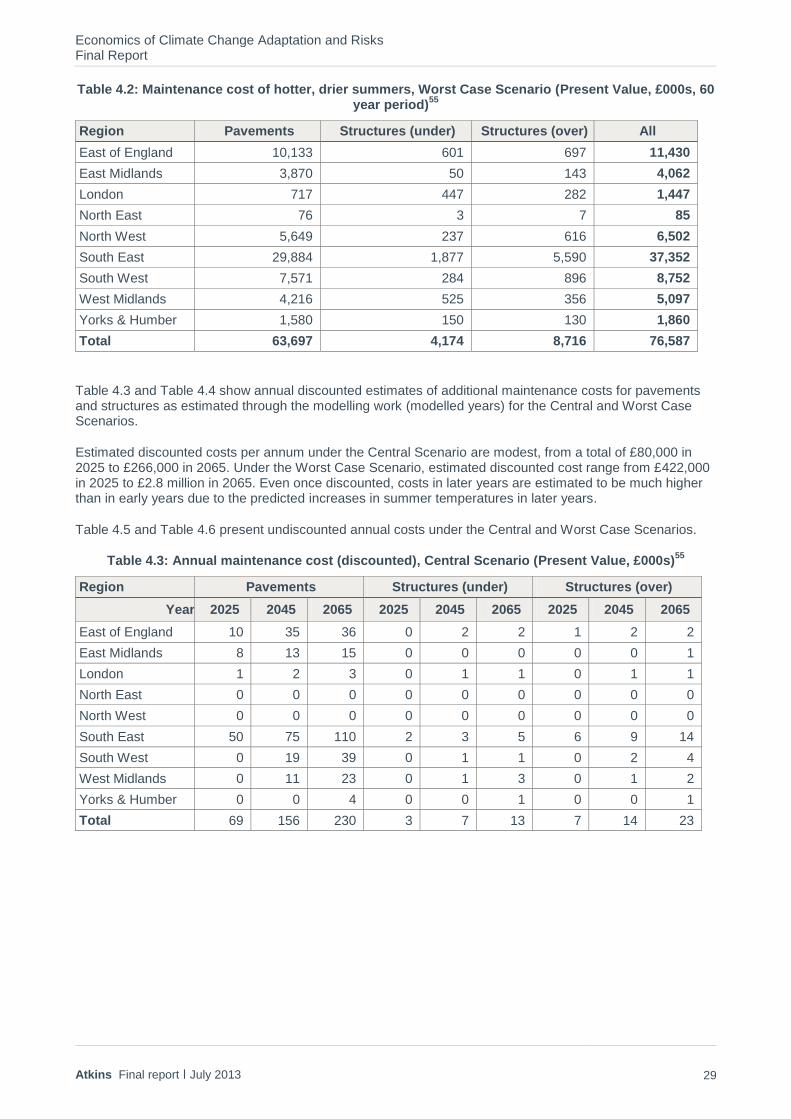
Economics of Climate Change Adaptation and Risks Final Report
Atkins Final report ׀ July 2013 29
Table 4.2: Maintenance cost of hotter, drier summers, Worst Case Scenario (Present Value, £000s, 60 year period)
55
Region Pavements Structures (under) Structures (over) All
East of England 10,133 601 697 11,430
East Midlands 3,870 50 143 4,062
London 717 447 282 1,447
North East 76 3 7 85
North West 5,649 237 616 6,502
South East 29,884 1,877 5,590 37,352
South West 7,571 284 896 8,752
West Midlands 4,216 525 356 5,097
Yorks & Humber 1,580 150 130 1,860
Total 63,697 4,174 8,716 76,587
Table 4.3 and Table 4.4 show annual discounted estimates of additional maintenance costs for pavements and structures as estimated through the modelling work (modelled years) for the Central and Worst Case Scenarios.
Estimated discounted costs per annum under the Central Scenario are modest, from a total of £80,000 in 2025 to £266,000 in 2065. Under the Worst Case Scenario, estimated discounted cost range from £422,000 in 2025 to £2.8 million in 2065. Even once discounted, costs in later years are estimated to be much higher than in early years due to the predicted increases in summer temperatures in later years.
Table 4.5 and Table 4.6 present undiscounted annual costs under the Central and Worst Case Scenarios.
Table 4.3: Annual maintenance cost (discounted), Central Scenario (Present Value, £000s)55
Region Pavements Structures (under) Structures (over)
Year 2025 2045 2065 2025 2045 2065 2025 2045 2065
East of England 10 35 36 0 2 2 1 2 2
East Midlands 8 13 15 0 0 0 0 0 1
London 1 2 3 0 1 1 0 1 1
North East 0 0 0 0 0 0 0 0 0
North West 0 0 0 0 0 0 0 0 0
South East 50 75 110 2 3 5 6 9 14
South West 0 19 39 0 1 1 0 2 4
West Midlands 0 11 23 0 1 3 0 1 2
Yorks & Humber 0 0 4 0 0 1 0 0 1
Total 69 156 230 3 7 13 7 14 23
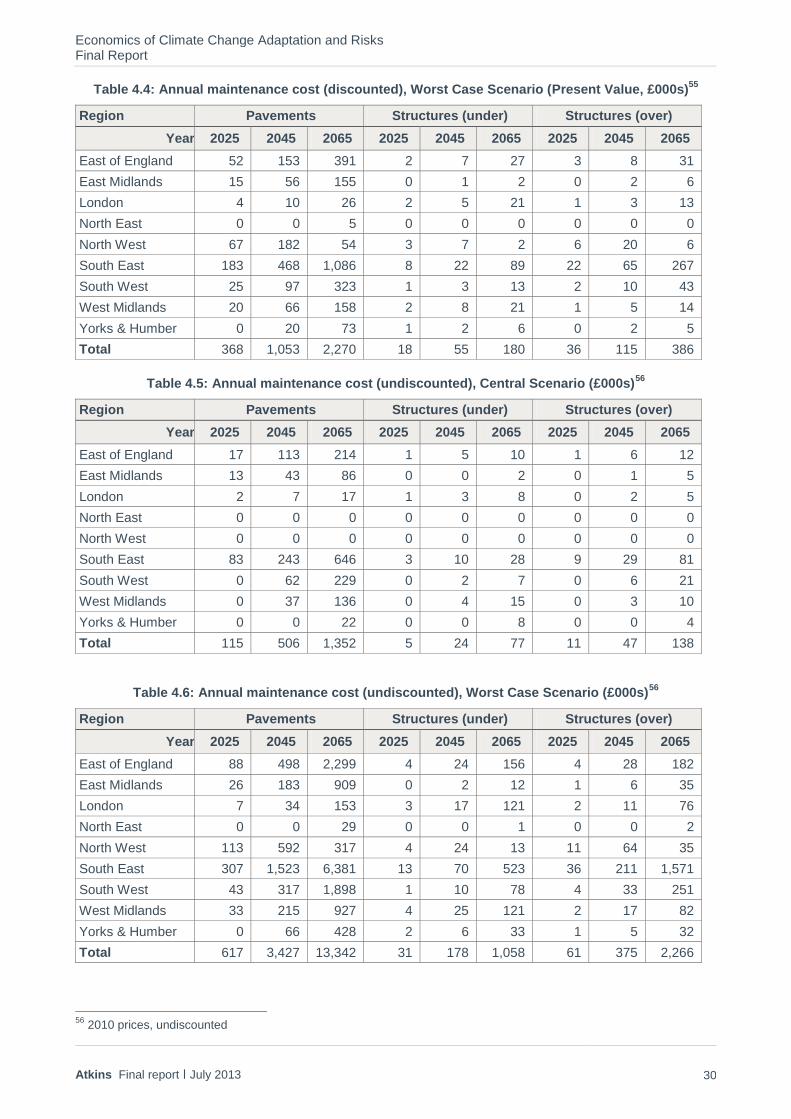
Economics of Climate Change Adaptation and Risks Final Report
Atkins Final report ׀ July 2013 30
Table 4.4: Annual maintenance cost (discounted), Worst Case Scenario (Present Value, £000s)55
Region Pavements Structures (under) Structures (over)
Year 2025 2045 2065 2025 2045 2065 2025 2045 2065
East of England 52 153 391 2 7 27 3 8 31
East Midlands 15 56 155 0 1 2 0 2 6
London 4 10 26 2 5 21 1 3 13
North East 0 0 5 0 0 0 0 0 0
North West 67 182 54 3 7 2 6 20 6
South East 183 468 1,086 8 22 89 22 65 267
South West 25 97 323 1 3 13 2 10 43
West Midlands 20 66 158 2 8 21 1 5 14
Yorks & Humber 0 20 73 1 2 6 0 2 5
Total 368 1,053 2,270 18 55 180 36 115 386
Table 4.5: Annual maintenance cost (undiscounted), Central Scenario (£000s)56
Region Pavements Structures (under) Structures (over)
Year 2025 2045 2065 2025 2045 2065 2025 2045 2065
East of England 17 113 214 1 5 10 1 6 12
East Midlands 13 43 86 0 0 2 0 1 5
London 2 7 17 1 3 8 0 2 5
North East 0 0 0 0 0 0 0 0 0
North West 0 0 0 0 0 0 0 0 0
South East 83 243 646 3 10 28 9 29 81
South West 0 62 229 0 2 7 0 6 21
West Midlands 0 37 136 0 4 15 0 3 10
Yorks & Humber 0 0 22 0 0 8 0 0 4
Total 115 506 1,352 5 24 77 11 47 138
Table 4.6: Annual maintenance cost (undiscounted), Worst Case Scenario (£000s)56
Region Pavements Structures (under) Structures (over)
Year 2025 2045 2065 2025 2045 2065 2025 2045 2065
East of England 88 498 2,299 4 24 156 4 28 182
East Midlands 26 183 909 0 2 12 1 6 35
London 7 34 153 3 17 121 2 11 76
North East 0 0 29 0 0 1 0 0 2
North West 113 592 317 4 24 13 11 64 35
South East 307 1,523 6,381 13 70 523 36 211 1,571
South West 43 317 1,898 1 10 78 4 33 251
West Midlands 33 215 927 4 25 121 2 17 82
Yorks & Humber 0 66 428 2 6 33 1 5 32
Total 617 3,427 13,342 31 178 1,058 61 375 2,266
56
2010 prices, undiscounted
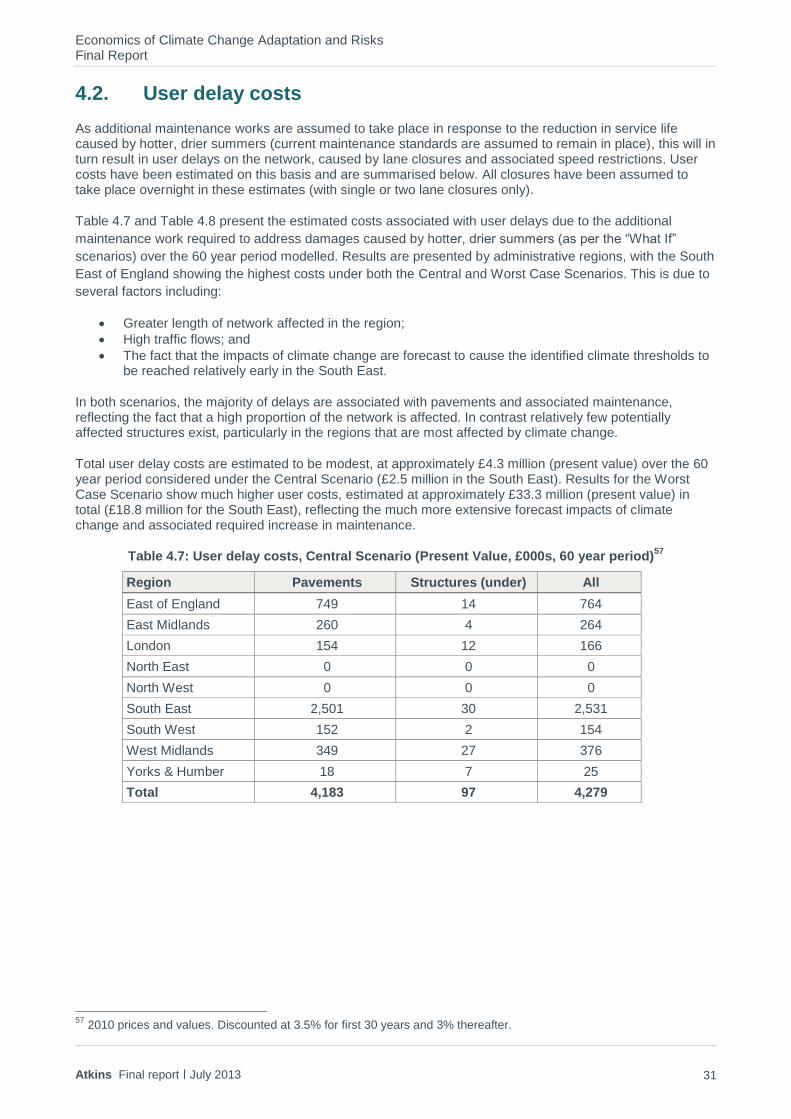
Economics of Climate Change Adaptation and Risks Final Report
Atkins Final report ׀ July 2013 31
4.2. User delay costs
As additional maintenance works are assumed to take place in response to the reduction in service life caused by hotter, drier summers (current maintenance standards are assumed to remain in place), this will in turn result in user delays on the network, caused by lane closures and associated speed restrictions. User costs have been estimated on this basis and are summarised below. All closures have been assumed to take place overnight in these estimates (with single or two lane closures only).
Table 4.7 and Table 4.8 present the estimated costs associated with user delays due to the additional
maintenance work required to address damages caused by hotter, drier summers (as per the “What If”
scenarios) over the 60 year period modelled. Results are presented by administrative regions, with the South
East of England showing the highest costs under both the Central and Worst Case Scenarios. This is due to
several factors including:
Greater length of network affected in the region;
High traffic flows; and
The fact that the impacts of climate change are forecast to cause the identified climate thresholds to be reached relatively early in the South East.
In both scenarios, the majority of delays are associated with pavements and associated maintenance, reflecting the fact that a high proportion of the network is affected. In contrast relatively few potentially affected structures exist, particularly in the regions that are most affected by climate change.
Total user delay costs are estimated to be modest, at approximately £4.3 million (present value) over the 60 year period considered under the Central Scenario (£2.5 million in the South East). Results for the Worst Case Scenario show much higher user costs, estimated at approximately £33.3 million (present value) in total (£18.8 million for the South East), reflecting the much more extensive forecast impacts of climate change and associated required increase in maintenance.
Table 4.7: User delay costs, Central Scenario (Present Value, £000s, 60 year period)57
Region Pavements Structures (under) All
East of England 749 14 764
East Midlands 260 4 264
London 154 12 166
North East 0 0 0
North West 0 0 0
South East 2,501 30 2,531
South West 152 2 154
West Midlands 349 27 376
Yorks & Humber 18 7 25
Total 4,183 97 4,279
57
2010 prices and values. Discounted at 3.5% for first 30 years and 3% thereafter.
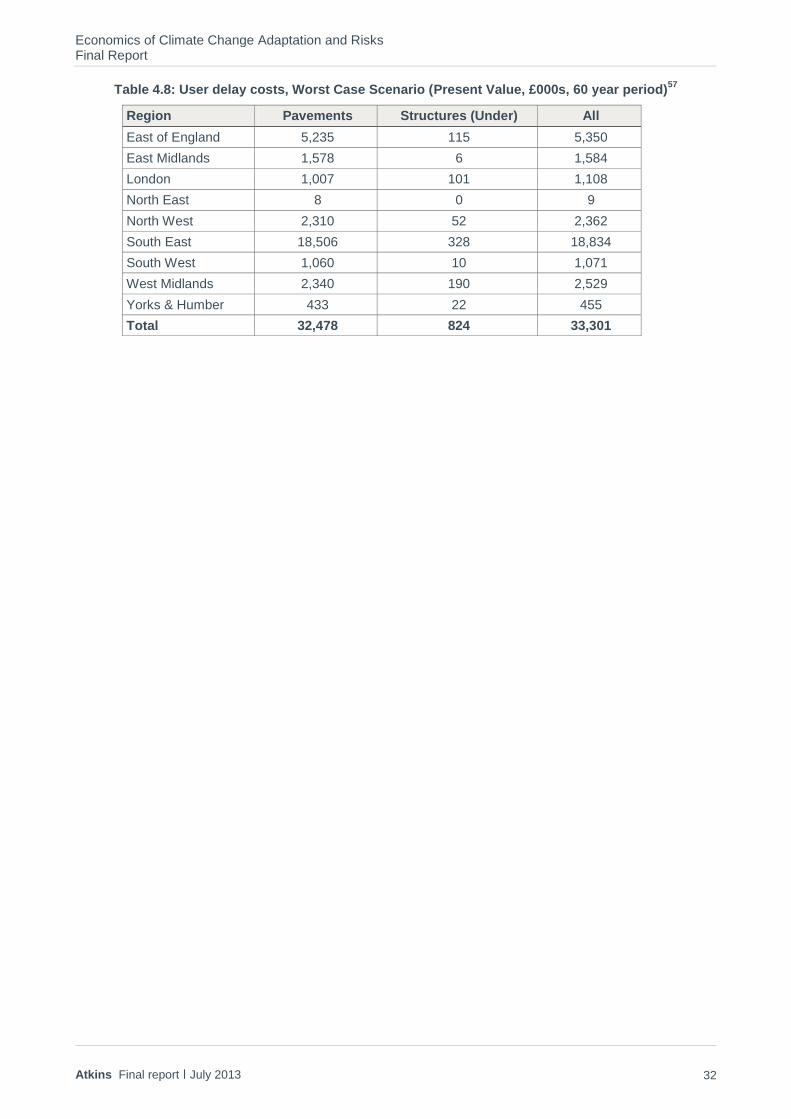
Economics of Climate Change Adaptation and Risks Final Report
Atkins Final report ׀ July 2013 32
Table 4.8: User delay costs, Worst Case Scenario (Present Value, £000s, 60 year period)57
Region Pavements Structures (Under) All
East of England 5,235 115 5,350
East Midlands 1,578 6 1,584
London 1,007 101 1,108
North East 8 0 9
North West 2,310 52 2,362
South East 18,506 328 18,834
South West 1,060 10 1,071
West Midlands 2,340 190 2,529
Yorks & Humber 433 22 455
Total 32,478 824 33,301
Economics of Climate Change Adaptation and Risks Final Report
Atkins Final report ׀ July 2013 33
5. Estimating the costs and benefits of adaptation to hotter, drier summers
This section focuses on the cost and benefits of adaptation to hotter, drier summers and presents the results of the illustrative modelling work, considering additional costs and benefits for network users in “What If” scenarios.
5.1. How could the Agency adapt to hotter, drier summers?
This section briefly considers adaptation actions that the Agency could implement to reduce the risks from hotter, drier summers in the future. As noted in section 3, the evidence on climate change risks and the impact of potential adaptation actions is limited and discussions with industry experts did not identify common assumptions and recommendations.
5.1.1. Pavements
Evidence review
When considering the risk of pavement deformation from hot weather, DMRB notes that “this risk can be mitigated by the selection of appropriate, well-designed and placed materials”
58.
Research on pavement performance in hot weather conditions59
identified the following adaptation measures:
Mixture selection, development and use of heat resistant materials;
Use more rut resistant and/or stripping-resistant resurfacings;
Surface dressing and micro-surfacings, especially with chippings with higher reflectivity;
Sealing of cracked and distressed areas;
At construction/laying stage - delivery temperature, layer thickness, time of day for laying, chipping colour with hot rolled asphalt and parking restrictions; and
Removal of roadside vegetation.
Modelling assumptions
Table 5.1 summarises the assumptions used by the project team to assess the cost and benefits of adaptation of pavements. Due to the lack of evidence on impacts and costs, simple assumptions were developed to account for additional costs linked to the use of heat resistant materials, assumed to result in a return to the original baseline expected service life. In practice, it is possible that the industry would respond by providing new mixes at no additional costs if demand grows for more heat resistant mixes.
58
Source: DMRB HD 30/08 (www.dft.gov.uk/ha/standards/dmrb/vol7/section3/hd3008.pdf), referring users to DMRB HD 37/99 on bituminous surfacing materials and techniques (www.dft.gov.uk/ha/standards/dmrb/vol7/section5/hd3799.pdf) 59
Sources: The behaviour of asphalt in adverse hot weather conditions, TRL 494, 2001 (www.trl.co.uk/online_store/reports_publications/trl_reports/cat_highway_engineering/report_the_behaviour_of_asphalt_in_adverse_hot_weather_conditions.htm) and Impacts and adaptation requirements of road networks, Pr. Tsamboulas, National Technical University of Athens (NTUA)UNECE presentation, 2012 (www.unece.org/fileadmin/DAM/trans/doc/2012/wp5/07_Mr_Tsamboulas.pdf)

Economics of Climate Change Adaptation and Risks Final Report
Atkins Final report ׀ July 2013 34
Table 5.1: Pavement adaptation modelling assumptions
Surfacing type Adaptation action and cost Impact of adaptation action
Thin surfacing (TSCS)
Changes to standards require the use of a more heat resistant mix for thin surfacing
More heat resistant thin surfacing assumed to cost 15% more than standard mix
60
Pavement service life assumed to return to expected duration (reduction in service life assumed in section 3.1.3 is assumed to be reversed)
Hot Rolled Asphalt (HRA)
HRA is assumed to be progressively replaced by thin surfacing on the Agency’s network, using specifications as above.
More heat resistant thin surfacing assumed to cost 15% more than standard mix
60
5.1.2. Structures
Evidence review
Previous work undertaken by the Agency61
identified the need to review evidence from structure inspections and implement changes to standards where required.
For integral bridges, previous research noted the abutments’ sensitivity to thermal expansion and contraction, noting that “more excavation of material and replacement with stronger fill material” might be required, “leading to increased costs and amount of waste”
61.
Recommendations from research undertaken on behalf of the Highways Agency in 200762
are summarised in Table 5.2.
Table 5.2: Impact of changes in extreme temperature on HA assets - recommendations
Element / structure type
Management of existing structures Design of new structures
Expansion joints
Gather data on joint type, size of expansion gap and approximate life expectancy during Principal Inspections
Develop guidelines to enable the ability of joints to accommodate increased thermal movements predicted to occur during their life to be assessed
Use predicted thermal movements commensurate with joint life in joint replacement schemes
Review need for specific investigation of long-life joints as greater confidence is developed in predicted changes in extreme temperatures
Undertake design taking account of temperature ranges commensurate with the anticipated life of the structure or element
Develop new isotherm maps for long-life assets for inclusion in the National Annex to BS EN 1991-1-5, accounting for predicted changes to extreme temperatures
Bearings Gather data on bearing type and expansion range during Principal Inspections
Develop guidelines to enable the ability of bearings to accommodate increased thermal movements predicted to occur during their life to be assessed
Use predicted thermal movements commensurate with bridge life in bearing replacement schemes
Review need for specific investigation of bearings as greater confidence is developed in predicted changes in extreme temperatures
60
Based on cost information quoted in Impacts of Climate Change: A focus on road and rail transport infrastructures, European Commission JRC Scientific and Policy Reports, Nemry & Demirel, 2012 (ftp://ftp.jrc.es/pub/EURdoc/JRC72217.pdf) 61
Highways Agency Climate Change Adaptation Plan, supporting spreadsheets 62
The impact of changes in extreme temperature and precipitation on the assets and operations of the Highways Agency, PB, WSP, Met Office, 2007
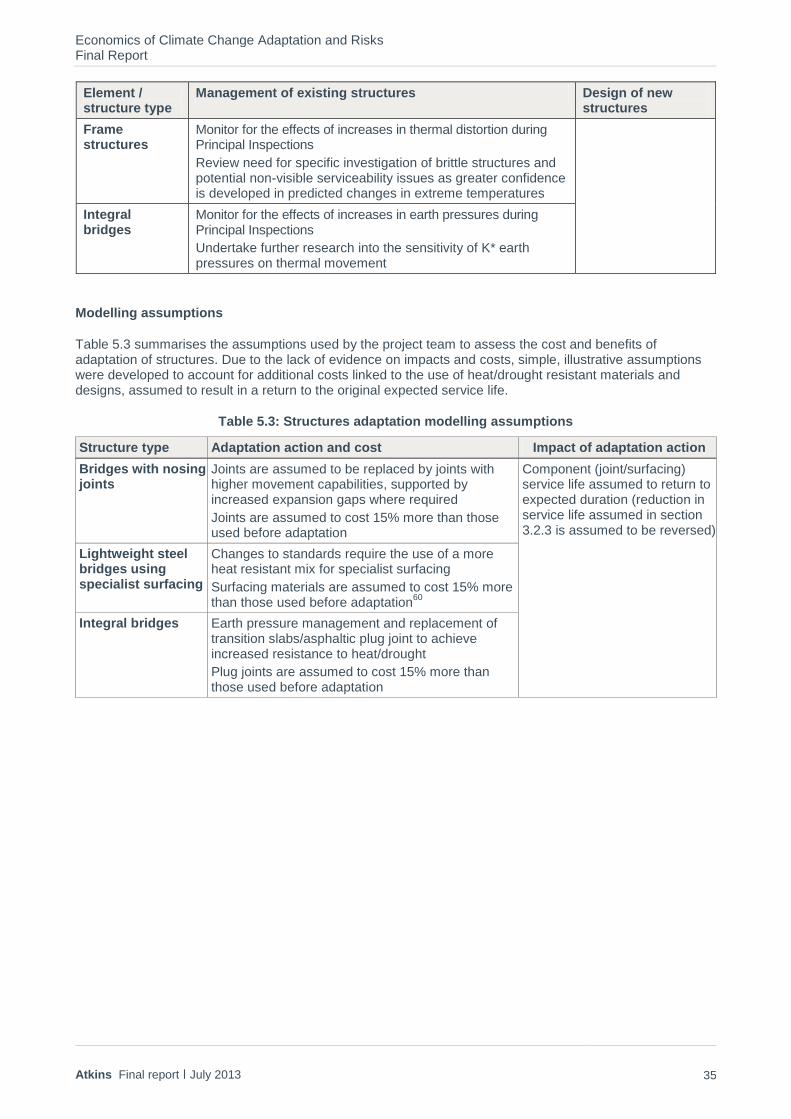
Economics of Climate Change Adaptation and Risks Final Report
Atkins Final report ׀ July 2013 35
Element / structure type
Management of existing structures Design of new structures
Frame structures
Monitor for the effects of increases in thermal distortion during Principal Inspections
Review need for specific investigation of brittle structures and potential non-visible serviceability issues as greater confidence is developed in predicted changes in extreme temperatures
Integral bridges
Monitor for the effects of increases in earth pressures during Principal Inspections
Undertake further research into the sensitivity of K* earth pressures on thermal movement
Modelling assumptions
Table 5.3 summarises the assumptions used by the project team to assess the cost and benefits of adaptation of structures. Due to the lack of evidence on impacts and costs, simple, illustrative assumptions were developed to account for additional costs linked to the use of heat/drought resistant materials and designs, assumed to result in a return to the original expected service life.
Table 5.3: Structures adaptation modelling assumptions
Structure type Adaptation action and cost Impact of adaptation action
Bridges with nosing joints
Joints are assumed to be replaced by joints with higher movement capabilities, supported by increased expansion gaps where required
Joints are assumed to cost 15% more than those used before adaptation
Component (joint/surfacing) service life assumed to return to expected duration (reduction in service life assumed in section 3.2.3 is assumed to be reversed)
Lightweight steel bridges using specialist surfacing
Changes to standards require the use of a more heat resistant mix for specialist surfacing
Surfacing materials are assumed to cost 15% more than those used before adaptation
60
Integral bridges Earth pressure management and replacement of transition slabs/asphaltic plug joint to achieve increased resistance to heat/drought
Plug joints are assumed to cost 15% more than those used before adaptation
Economics of Climate Change Adaptation and Risks Final Report
Atkins Final report ׀ July 2013 36
5.2. Estimated costs and benefits of adaptation action
This section presents estimates of adaptation costs on the basis of assumptions presented above and concludes on the illustrative cost/benefit analysis of adaptation for hotter and drier summers on the Agency network.
5.2.1. Adaptation costs
Table 5.4 summarises the estimated costs of adaptation per administrative region and for England as a
whole. Costs were estimated on the basis of assumptions presented in Table 5.1 and Table 5.3. Costs
considered here do not include staff time to develop new standards or change existing standards as this was
assumed to be likely to take place in any scenario over the period considered (although with a different focus
in the adaptation scenario).
Adaptation measures have been assumed to be implemented in a region for each asset type once the forecast average annual reduction in service life due to climate change for that asset type exceeds 1% during the decade. This means that for the Central Scenario, adaptation related to high temperatures is not forecast to start until the 2050s in the South East, South West and London and is not required at all during the appraisal period in the other regions.
Adaptation (for integral bridges) related to drought conditions is forecast to start earlier (but only applies to a very limited set of assets), starting in the 2030s in the East of England and the 2050s in East Midlands and Yorkshire and Humber and not required at all during the appraisal period in other regions.
In the Worst Case Scenario, the more extreme forecast weather conditions bring the start of adaptation action forward to the 2020s for London and the South East, the 2030s for the East of England, the South West and the North West, the 2040s for the Midlands and the 2050s for Yorkshire and Humber. Adaptation is not forecast to be required at all during the appraisal period in the North East.
The specific drought related conditions leading to anticipated adaptation measures for integral bridges are also forecast to start as early as the 2020s in the South East, the East of England, the North West and Yorkshire and Humber (although the particular combination of conditions does not necessarily occur in every subsequent decade) but do not start at all in the other regions.
In the Central Scenario, the fact that the implementation of adaptation measures is on a limited scale and largely occurs later on in the appraisal period means that discounted costs of adaptation measures are relatively limited, estimated to reach approximately £6.4 million over the 60 year period considered. The large majority of the costs are linked to additional resurfacing costs (£6.3 million, present value). As summarised in Table 5.4, these are offset by savings of over £4.3 million in maintenance costs associated with more frequent maintenance due to climate change that is no longer required once adaptation actions are in place.
The more extreme weather conditions forecast for the Worst Case Scenario lead to more extensive implementation of adaptation measures, earlier in the appraisal period. Consequently the associated costs are significantly higher, estimated to exceed £41 million (present value) over the 60 year appraisal period. As shown in Table 5.5, these costs are however, more than offset by the estimated maintenance savings generated because the adaptation measures mean that the more frequent maintenance required to cope with climate change is no longer required.
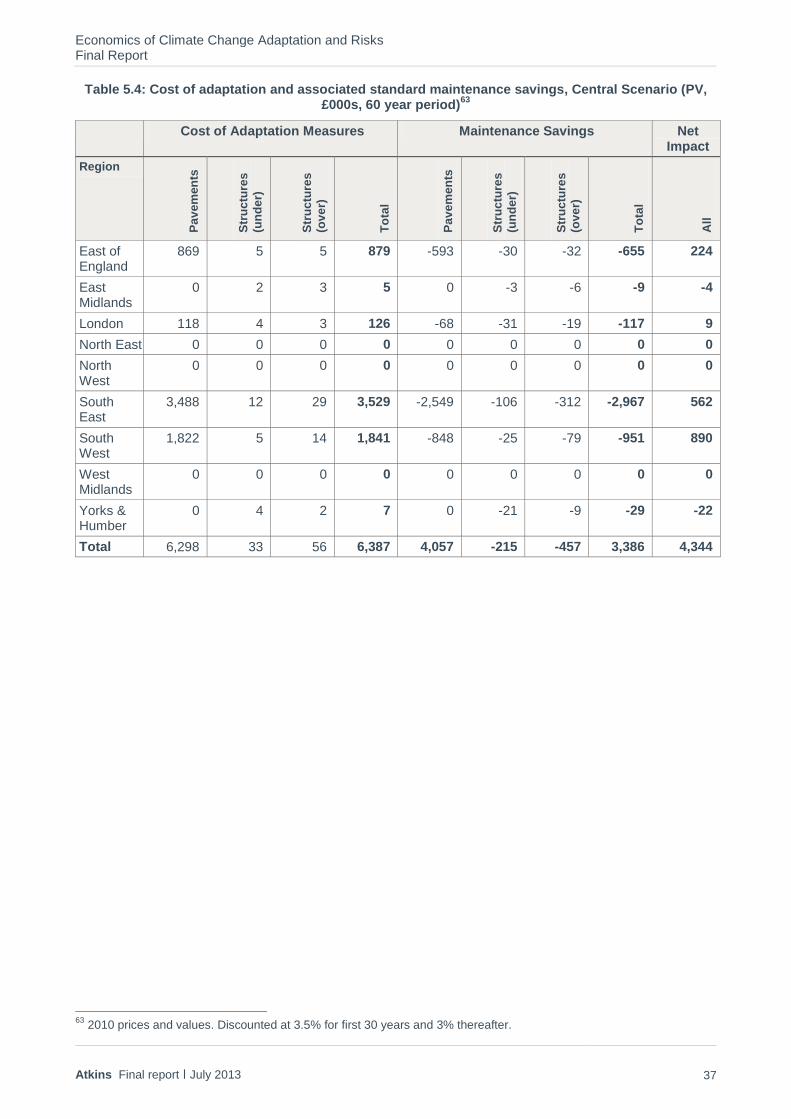
Economics of Climate Change Adaptation and Risks Final Report
Atkins Final report ׀ July 2013 37
Table 5.4: Cost of adaptation and associated standard maintenance savings, Central Scenario (PV, £000s, 60 year period)
63
Cost of Adaptation Measures Maintenance Savings Net Impact
Region
Pa
ve
men
ts
Str
uc
ture
s
(un
de
r)
Str
uc
ture
s
(ov
er)
To
tal
Pa
ve
men
ts
Str
uc
ture
s
(un
de
r)
Str
uc
ture
s
(ov
er)
To
tal
All
East of England
869 5 5 879 -593 -30 -32 -655 224
East Midlands
0 2 3 5 0 -3 -6 -9 -4
London 118 4 3 126 -68 -31 -19 -117 9
North East 0 0 0 0 0 0 0 0 0
North West
0 0 0 0 0 0 0 0 0
South East
3,488 12 29 3,529 -2,549 -106 -312 -2,967 562
South West
1,822 5 14 1,841 -848 -25 -79 -951 890
West Midlands
0 0 0 0 0 0 0 0 0
Yorks & Humber
0 4 2 7 0 -21 -9 -29 -22
Total 6,298 33 56 6,387 4,057 -215 -457 3,386 4,344
63
2010 prices and values. Discounted at 3.5% for first 30 years and 3% thereafter.

Economics of Climate Change Adaptation and Risks Final Report
Atkins Final report ׀ July 2013 38
Table 5.5: Cost of adaptation and associated standard maintenance savings, Worst Case Scenario (PV, £000s, 60 year period)
64
Cost of Adaptation Measures Maintenance Savings Net
Region
Pa
ve
men
ts
Str
uc
ture
s
(un
de
r)
Str
uc
ture
s
(ov
er)
To
tal
Pa
ve
men
ts
Str
uc
ture
s
(un
de
r)
Str
uc
ture
s
(ov
er)
To
tal
All
East of England
6,120 21 25 6,166 -9,940 -580 -674 -11,193 -5,027
East Midlands
2,796 3 8 2,807 -3,528 -42 -126 -3,696 -889
London 528 19 13 560 -717 -447 -282 -1,447 -887
North East 0 0 0 0 0 0 0 0 0
North West
5,505 18 37 5,560 -4,948 -193 -519 -5,660 -100
South East
15,488 49 127 15,664 -29,884 -1,877 -5,590 -37,352 -21,688
South West
5,098 13 36 5,147 -7,462 -274 -875 -8,611 -3,464
West Midlands
3,744 30 21 0 -3,790 -468 -316 -4,573 -4,573
Yorks & Humber
1,885 25 18 1,929 -1,398 -138 -115 -1,652 277
Total 41,165 178 284 41,628 -61,667 -4,019 -8,498 -74,185 -32,557
64
2010 prices and values. Discounted at 3.5% for first 30 years and 3% thereafter.
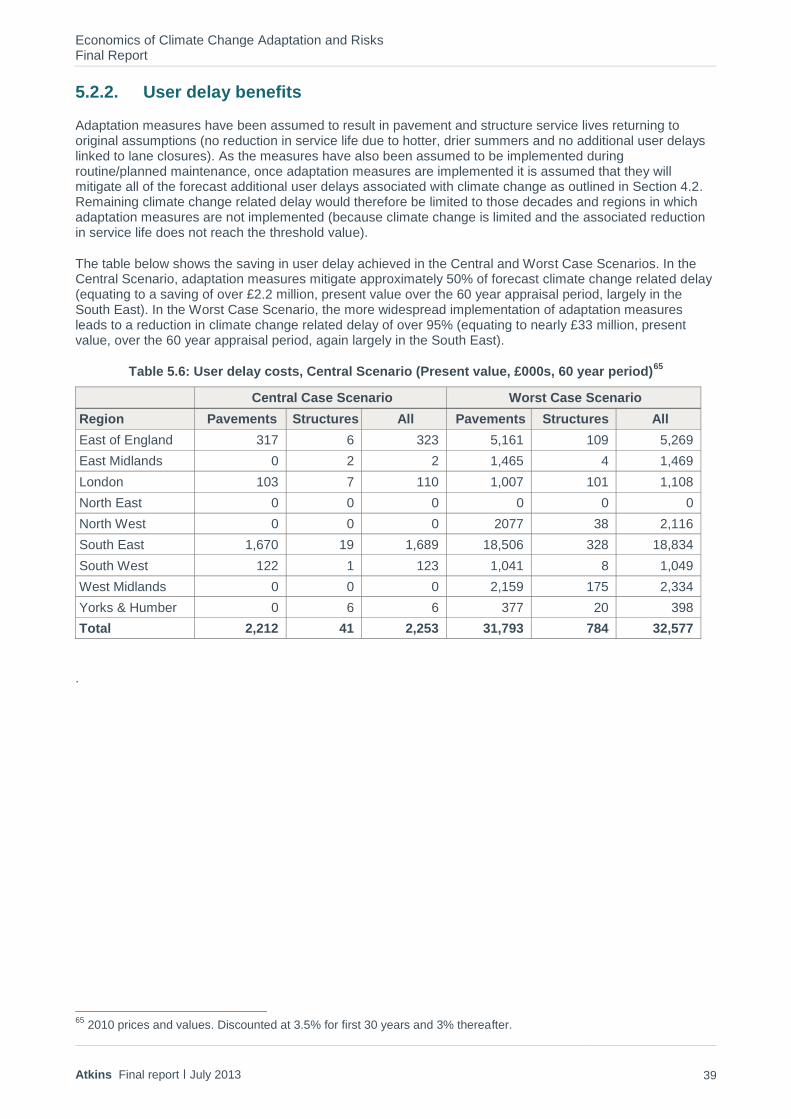
Economics of Climate Change Adaptation and Risks Final Report
Atkins Final report ׀ July 2013 39
5.2.2. User delay benefits
Adaptation measures have been assumed to result in pavement and structure service lives returning to original assumptions (no reduction in service life due to hotter, drier summers and no additional user delays linked to lane closures). As the measures have also been assumed to be implemented during routine/planned maintenance, once adaptation measures are implemented it is assumed that they will mitigate all of the forecast additional user delays associated with climate change as outlined in Section 4.2. Remaining climate change related delay would therefore be limited to those decades and regions in which adaptation measures are not implemented (because climate change is limited and the associated reduction in service life does not reach the threshold value).
The table below shows the saving in user delay achieved in the Central and Worst Case Scenarios. In the Central Scenario, adaptation measures mitigate approximately 50% of forecast climate change related delay (equating to a saving of over £2.2 million, present value over the 60 year appraisal period, largely in the South East). In the Worst Case Scenario, the more widespread implementation of adaptation measures leads to a reduction in climate change related delay of over 95% (equating to nearly £33 million, present value, over the 60 year appraisal period, again largely in the South East).
Table 5.6: User delay costs, Central Scenario (Present value, £000s, 60 year period)65
Central Case Scenario Worst Case Scenario
Region Pavements Structures All Pavements Structures All
East of England 317 6 323 5,161 109 5,269
East Midlands 0 2 2 1,465 4 1,469
London 103 7 110 1,007 101 1,108
North East 0 0 0 0 0 0
North West 0 0 0 2077 38 2,116
South East 1,670 19 1,689 18,506 328 18,834
South West 122 1 123 1,041 8 1,049
West Midlands 0 0 0 2,159 175 2,334
Yorks & Humber 0 6 6 377 20 398
Total 2,212 41 2,253 31,793 784 32,577
.
65
2010 prices and values. Discounted at 3.5% for first 30 years and 3% thereafter.
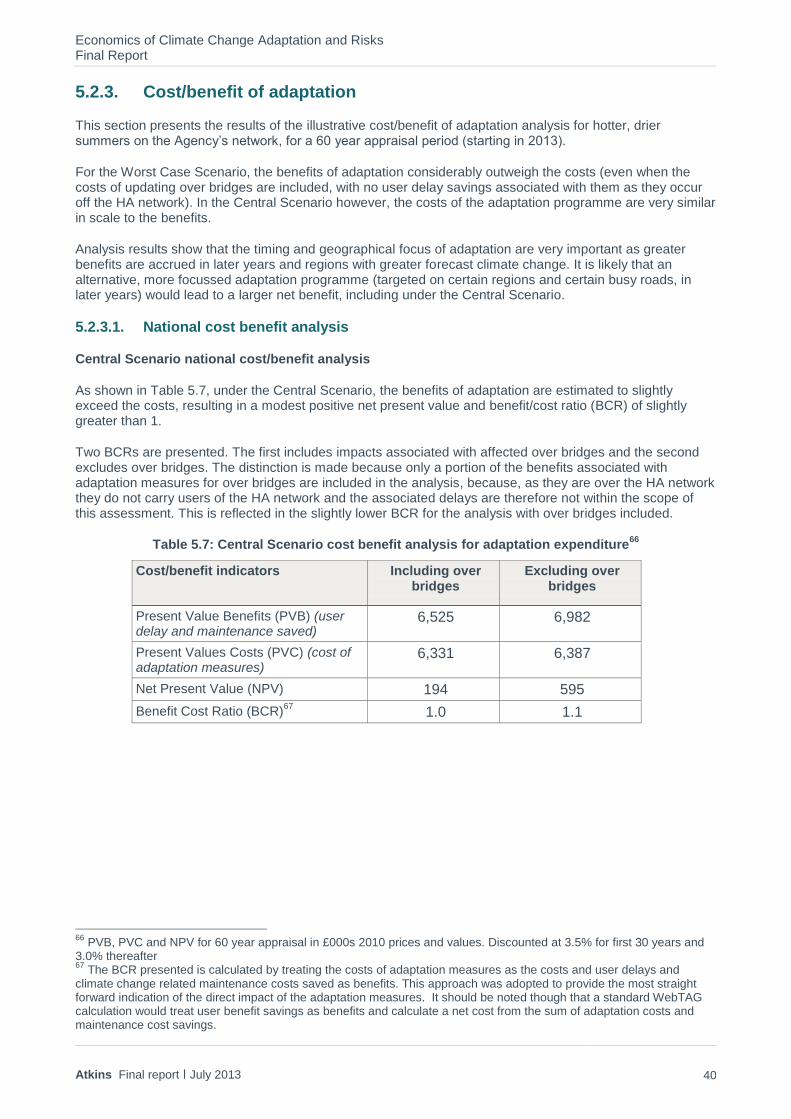
Economics of Climate Change Adaptation and Risks Final Report
Atkins Final report ׀ July 2013 40
5.2.3. Cost/benefit of adaptation
This section presents the results of the illustrative cost/benefit of adaptation analysis for hotter, drier summers on the Agency’s network, for a 60 year appraisal period (starting in 2013).
For the Worst Case Scenario, the benefits of adaptation considerably outweigh the costs (even when the costs of updating over bridges are included, with no user delay savings associated with them as they occur off the HA network). In the Central Scenario however, the costs of the adaptation programme are very similar in scale to the benefits.
Analysis results show that the timing and geographical focus of adaptation are very important as greater benefits are accrued in later years and regions with greater forecast climate change. It is likely that an alternative, more focussed adaptation programme (targeted on certain regions and certain busy roads, in later years) would lead to a larger net benefit, including under the Central Scenario.
5.2.3.1. National cost benefit analysis
Central Scenario national cost/benefit analysis
As shown in Table 5.7, under the Central Scenario, the benefits of adaptation are estimated to slightly exceed the costs, resulting in a modest positive net present value and benefit/cost ratio (BCR) of slightly greater than 1.
Two BCRs are presented. The first includes impacts associated with affected over bridges and the second excludes over bridges. The distinction is made because only a portion of the benefits associated with adaptation measures for over bridges are included in the analysis, because, as they are over the HA network they do not carry users of the HA network and the associated delays are therefore not within the scope of this assessment. This is reflected in the slightly lower BCR for the analysis with over bridges included.
Table 5.7: Central Scenario cost benefit analysis for adaptation expenditure66
Cost/benefit indicators Including over bridges
Excluding over bridges
Present Value Benefits (PVB) (user delay and maintenance saved)
6,525 6,982
Present Values Costs (PVC) (cost of adaptation measures)
6,331 6,387
Net Present Value (NPV) 194 595
Benefit Cost Ratio (BCR)67
1.0 1.1
66
PVB, PVC and NPV for 60 year appraisal in £000s 2010 prices and values. Discounted at 3.5% for first 30 years and 3.0% thereafter 67
The BCR presented is calculated by treating the costs of adaptation measures as the costs and user delays and climate change related maintenance costs saved as benefits. This approach was adopted to provide the most straight forward indication of the direct impact of the adaptation measures. It should be noted though that a standard WebTAG calculation would treat user benefit savings as benefits and calculate a net cost from the sum of adaptation costs and maintenance cost savings.
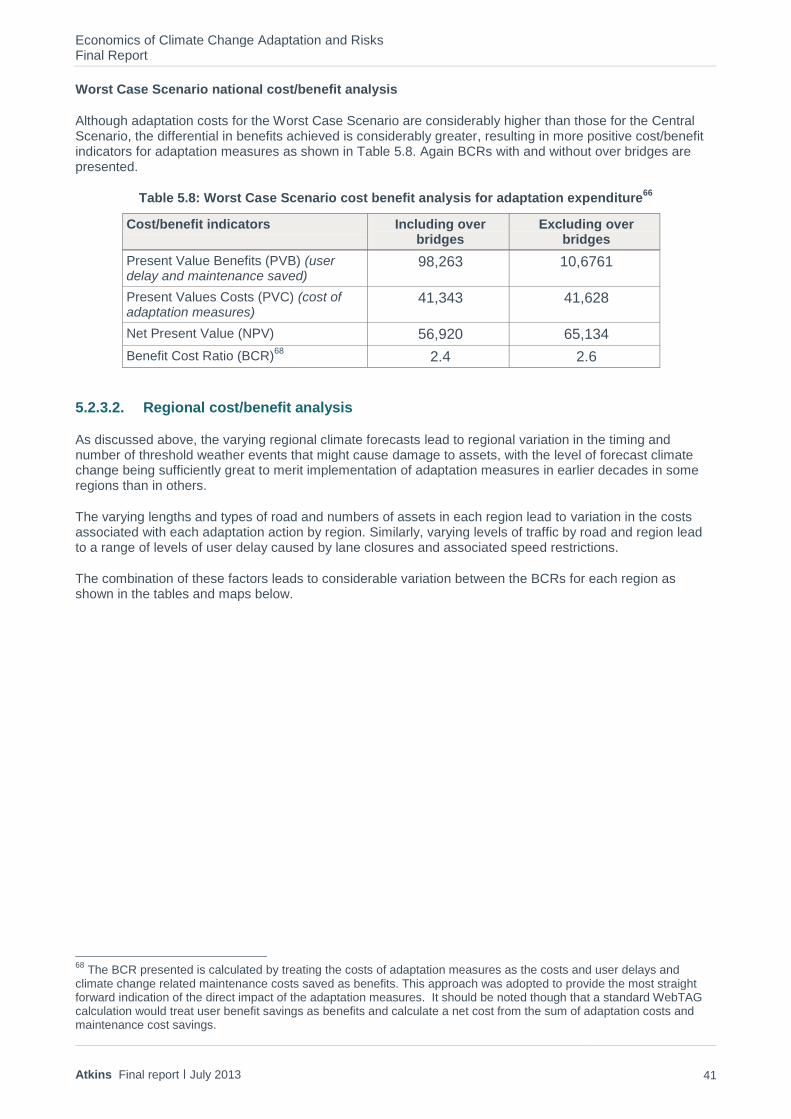
Economics of Climate Change Adaptation and Risks Final Report
Atkins Final report ׀ July 2013 41
Worst Case Scenario national cost/benefit analysis
Although adaptation costs for the Worst Case Scenario are considerably higher than those for the Central Scenario, the differential in benefits achieved is considerably greater, resulting in more positive cost/benefit indicators for adaptation measures as shown in Table 5.8. Again BCRs with and without over bridges are presented.
Table 5.8: Worst Case Scenario cost benefit analysis for adaptation expenditure66
Cost/benefit indicators Including over bridges
Excluding over bridges
Present Value Benefits (PVB) (user delay and maintenance saved)
98,263 10,6761
Present Values Costs (PVC) (cost of adaptation measures)
41,343 41,628
Net Present Value (NPV) 56,920 65,134
Benefit Cost Ratio (BCR)68
2.4 2.6
5.2.3.2. Regional cost/benefit analysis
As discussed above, the varying regional climate forecasts lead to regional variation in the timing and number of threshold weather events that might cause damage to assets, with the level of forecast climate change being sufficiently great to merit implementation of adaptation measures in earlier decades in some regions than in others.
The varying lengths and types of road and numbers of assets in each region lead to variation in the costs associated with each adaptation action by region. Similarly, varying levels of traffic by road and region lead to a range of levels of user delay caused by lane closures and associated speed restrictions.
The combination of these factors leads to considerable variation between the BCRs for each region as shown in the tables and maps below.
68
The BCR presented is calculated by treating the costs of adaptation measures as the costs and user delays and climate change related maintenance costs saved as benefits. This approach was adopted to provide the most straight forward indication of the direct impact of the adaptation measures. It should be noted though that a standard WebTAG calculation would treat user benefit savings as benefits and calculate a net cost from the sum of adaptation costs and maintenance cost savings.

Economics of Climate Change Adaptation and Risks Final Report
Atkins Final report ׀ July 2013 42
The following key points can be drawn from the results:
Value for money of investment in adaptation measures varies considerably with time and location of implementation. On the basis of the illustrative assumptions made, carefully targeted investment is most likely to bring net benefits in areas where the impacts of climate change are sufficiently large to cause a significant impact on assets, requiring additional maintenance and traffic levels are sufficiently high for maintenance events to cause significant user delay;
Consequently, with some exceptions, BCRs are typically highest in the southern half of the country, reflecting higher levels of traffic (and user delay associated with maintenance) and more frequent incidents of threshold weather events;
On the basis of the illustrative assumptions used in the ‘What If’ scenarios, investment in climate resilience of the asphalt plug joints and transition slabs associated with certain integral bridge types seems to potentially provide particularly good value for money, if applied in the relevant region. This is most clearly shown in the value of the BCR for Yorkshire and Humberside in the Central Scenario. The climate forecasts for the region predict that only the drought related weather event is forecast to be sufficiently frequent to trigger adaptation measures during the appraisal period, leading to only measures for integral bridges being assessed, leading to a BCR of over 6. A similar effect leads to a BCR of over 2 for integral bridges in East Midlands. In both cases the number of structures involved and associated costs and benefits of adaptation are very small in scale, compared to impacts in other regions (involving surfacing);
The costs and impacts of surfacing are considerably greater than those associated with structures.
Table 5.9: Benefit Cost Ratios by Region (PVB and PVC in 000s, 2010 prices)
Central Scenario Worst Case Scenario
Region PVB PVC BCR PVB PVC BCR
East of England 874 947 1.1 6,141 15,788 2.6
East Midlands 2 5 2.5 2,799 5,040 1.8
North East - - - - - -
North West - - - 5,524 7,256 1.3
South East 3,500 4,343 1.2 15,537 50,595 3.3
South West 1,828 995 0.5 5,111 8,784 1.7
West Midlands - - - 3,774 6,591 1.7
Yorks & Humber 4.5 27.1 6.0 1,910 1,934 1.0
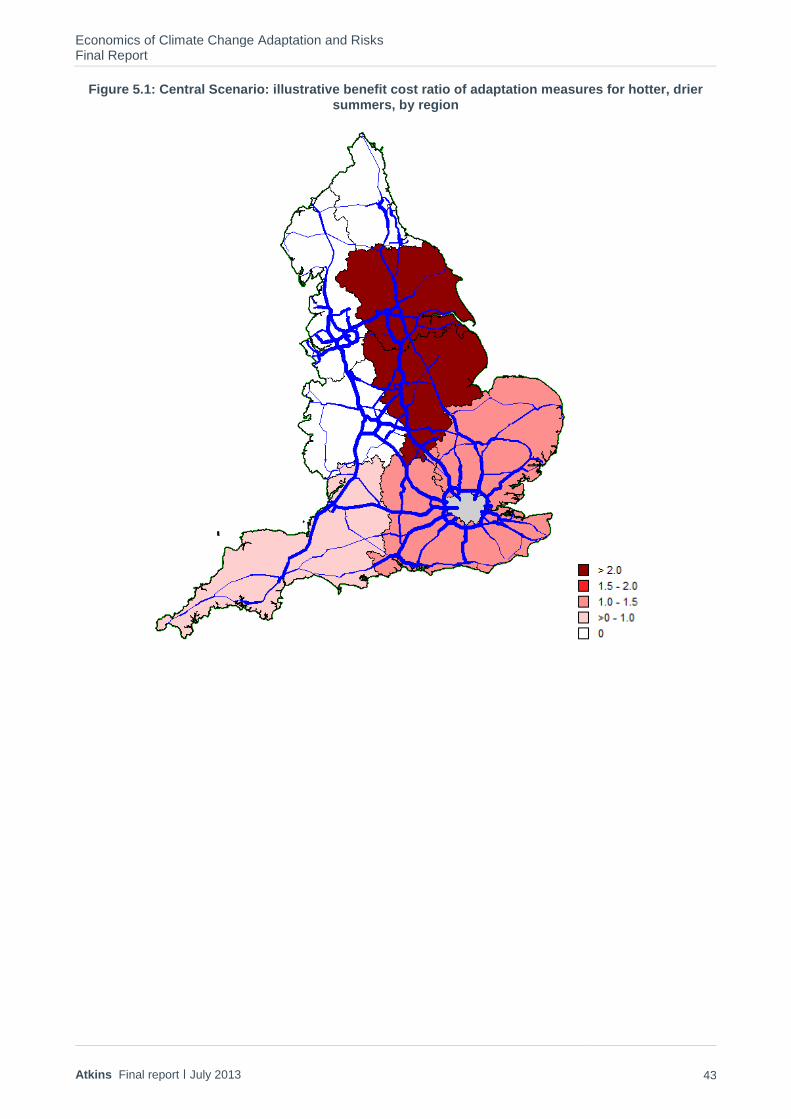
Economics of Climate Change Adaptation and Risks Final Report
Atkins Final report ׀ July 2013 43
Figure 5.1: Central Scenario: illustrative benefit cost ratio of adaptation measures for hotter, drier summers, by region

Economics of Climate Change Adaptation and Risks Final Report
Atkins Final report ׀ July 2013 44
Figure 5.2: Worst Case Scenario: illustrative benefit cost ratio of adaptation measures for hotter, drier summers, by region
Economics of Climate Change Adaptation and Risks Final Report
Atkins Final report ׀ July 2013 45
6. Conclusions and recommendations
6.1. Cost benefit of adaptation to hotter, drier summers
Cost benefit analysis shows relatively low returns on investment for adaptation measures to reduce the impact of hotter, drier summers on pavements and structures across England. These results could however improve if:
New evidence becomes available showing that impacts on pavement and structure service life are higher than those assumed in this study (which were illustrative assumptions, based on discussions with experts due to the lack of evidence) or that hotter, drier summers might lead to more marked asset damage requiring more immediate, unplanned maintenance interventions (rather than overnight, planned maintenance as assumed for this study on the basis of expert advice);
New evidence becomes available showing that baseline routine maintenance involves more frequent and larger scale interventions than those assumed in this study (which are again illustrative assumptions, based on discussions with experts due to the lack of evidence);
Adaptation costs are lower than assumed in the modelling. For example, for pavements, the industry could respond by providing new mixes at no additional costs if demand grows for more heat resistant mixes; and
Adaptation measures are focussed geographically on areas where maintenance related to climate change damage is likely to lead to the largest user delays.
Regional analysis shows disparities in the impact of hotter, drier summers on pavements and structures between English regions. Adaptation action relating to pavements in the north of England is unlikely to offer good value for money unless considered in later years and under the Worst Case Scenario. Adaptation action presents more positive results in the South of England.
Adaptation action could also present better value for money if undertaken for the busiest parts of the network in the South of England (most at risk of impacts from hotter, drier summers). Further analysis could be undertaken to identify the links on which adaptation action would offer the best returns.
There is emerging evidence that the Earth’s climate might be changing more rapidly than expected and there are warnings that the UN Framework Convention on Climate Change target of limiting global warming to 2°C has become unrealistic. If mitigation targets can’t be met and the climate changes faster than expected, the Scenario presented in this document as “Worst Case” might become a realistic scenario, making the case for adaptation to hotter, drier summers more compelling.
6.2. Need for wider analysis on climate change impacts
This analysis focused on hotter, drier summers. Although these are likely to have an impact on the Agency’s assets, impacts are likely to be relatively small compared to the impacts of flooding, unpredictable weather events or higher winter temperatures. Experts consulted during the study therefore identified the need for an assessment of climate change impacts which would consider all potential changes and their impacts on the network and its users rather than individual weather events.
6.3. Need for improved data on impacts of weather conditions
As noted in this report, there is limited evidence of the impact of hotter, drier summers on highway assets. As risks from climate change are increasing in the future, it would be useful to improve the monitoring of these impacts now, to be able to better assess future impacts (likely to be of a greater magnitude in later years). This might be possible to achieve through the new integrated asset management information system (IAMIS). For example, temperature information currently recorded in the HA Weather information System (HAWIS) could be correlated with data on failures and maintenance from the HA Pavement Database (HAPMS), the HA Geotechnical Data Management System (HAGDMS) and the Structures Maintenance Information System (SMIS).
Contractor and agent staff contacted for this study seemed to hold a wealth of information on the impacts of various weather related events but this is not currently recorded or compared with records held in the

Economics of Climate Change Adaptation and Risks Final Report
Atkins Final report ׀ July 2013 46
Agency’s databases. Further evidence on the impact of hotter, drier summers or other weather events could be gathered through targeted staff interviews and data mining from existing databases or IAMIS.
Trial schemes to test new heat resistant materials/mixes could be undertaken, especially in the South of England, to monitor their performance and support the development of heat resistant materials/mixes by the supply chain.

Appendices
Economics of Climate Change Adaptation and Risks Final Report
Atkins Final report ׀ July 2013 48
Appendix A. Economic impacts modelling methodology
A.1. Introduction
This Appendix describes the methodology used to assess the economic impacts of potential adaptation measures to mitigate the impacts of hotter, drier summers identified in illustrative ‘What-If’ scenarios of potential impacts on the Agency’s assets. The modelled scenarios were used to compare:
the costs of potential adaption measures to reduce the impact of hotter, drier summers on assets; and
the costs of climate change if no adaptation measures were undertaken i.e. the costs of increased frequency of maintenance required to cope with the impacts of hotter, drier summers on assets, assuming the continued application of the type of maintenance undertaken in the baseline scenario, without adaptation for climate change and illustrative assumptions on the scale of impact of climate change on assets.
In both cases the costs considered included:
changes in material costs for maintenance (i.e. volume and type of surfacing material required);
changes in labour and works costs associated with maintenance; and
changes in user delay associated with lane closures and speed restrictions required for maintenance.
The appraisal was undertaken in line with recommendations in the DfT’s WebTAG appraisal guidance and costs and benefits were therefore considered over a 60 year period (2013 to 2072) in 2010 prices and discounted to 2010 present values (using discount rates of 3.5% for 30 years from 2013 then 3% thereafter).
Section 2 below provides a summary of the geographic network and traffic data underpinning the main economic calculations. Sections 3 and 4 provide more detail on the assumptions underlying the estimates of the costs of climate change without adaptation and of the costs of adaptation.
A.2. Geographic data
A.2.1. Introduction: Scale of analysis
The calculations of economic impact are largely undertaken and at the regional level, in particular due to the use of representative regional climate forecasts. The results produced should therefore also be viewed at a regional or national level.
However, it is important to reflect the fact that the costs and benefits of climate change and adaptation will vary considerably with detailed geographical location, particularly the extent to which susceptible network assets coincide with damaging weather events caused by climate change and high traffic flows (with the implication of large user delays associated with maintenance).
Calculations have therefore been undertaken at a link by link level for the network to allow a representation of these impacts to be included in the analysis. However, it is important to note that the calculations for each link are not intended to represent a detailed forecast of maintenance and climate impacts on that link. Representations are generalised, intended to be considered on aggregate with other links in the region to give a sense of the likely probability of climate related disruption, allowing for a representation of local factors such as asset location and traffic.

Economics of Climate Change Adaptation and Risks Final Report
Atkins Final report ׀ July 2013 49
A.2.2. Datasets
The economic impact calculations rely on several underlying geographic datasets to identify:
the location and characteristics of assets identified as being likely to be susceptible to damage from hotter, drier summers. The regional location also identifying each asset’s level of forecast exposure to the impacts of climate change (based on regional climate forecasts by scenario); and
the volume of traffic using the affected assets (and consequent implications for user delays caused by additional maintenance).
The data used was largely drawn from three Agency databases with supporting information from DfT traffic datasets, as described further in the sections below.
Data from the different sources was combined using mapping processes established in Mapinfo GIS and Excel. The output was a dataset of over 2450 links summarising the main carriage way links of the Agency’s network, providing information for each link on:
forecast traffic flow by year;
forecast traffic composition;
current traffic speed;
link length;
number of lanes;
link capacity;
speed limit;
road type (A or motorway, dual or single carriageway);
proportion of surface covered by each surfacing type considered likely to be susceptible to damage from hotter, drier summers; identified separately for Lane 1 (which bears the majority of traffic wear from HGVs and so has a shorter service life) and Lanes 2 onwards;
average age of surfacing of each type in each lane type; and
the number of each type of structure identified as being susceptible to damage from climate change present and whether they are over bridges or under bridges (carrying traffic on the Agency’s network).
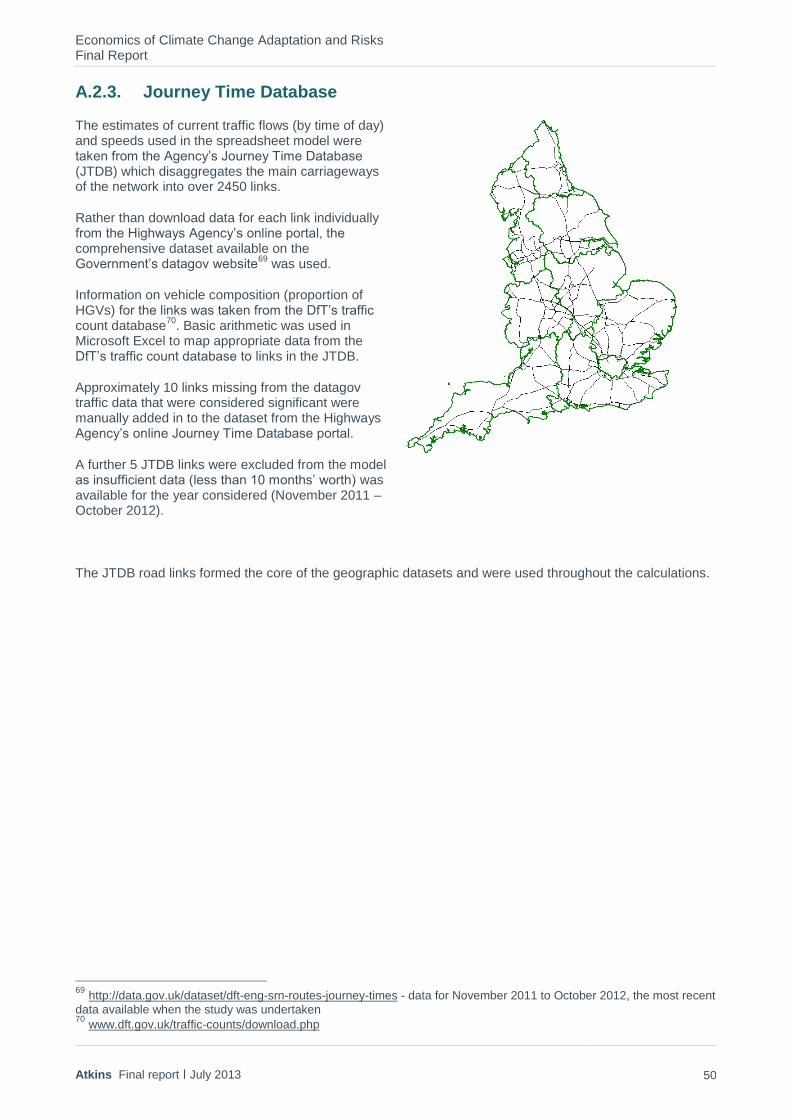
Economics of Climate Change Adaptation and Risks Final Report
Atkins Final report ׀ July 2013 50
A.2.3. Journey Time Database
The estimates of current traffic flows (by time of day) and speeds used in the spreadsheet model were taken from the Agency’s Journey Time Database (JTDB) which disaggregates the main carriageways of the network into over 2450 links.
Rather than download data for each link individually from the Highways Agency’s online portal, the comprehensive dataset available on the Government’s datagov website
69 was used.
Information on vehicle composition (proportion of HGVs) for the links was taken from the DfT’s traffic count database
70. Basic arithmetic was used in
Microsoft Excel to map appropriate data from the DfT’s traffic count database to links in the JTDB.
Approximately 10 links missing from the datagov traffic data that were considered significant were manually added in to the dataset from the Highways Agency’s online Journey Time Database portal.
A further 5 JTDB links were excluded from the model as insufficient data (less than 10 months’ worth) was available for the year considered (November 2011 – October 2012).
The JTDB road links formed the core of the geographic datasets and were used throughout the calculations.
69
http://data.gov.uk/dataset/dft-eng-srn-routes-journey-times - data for November 2011 to October 2012, the most recent
data available when the study was undertaken 70
www.dft.gov.uk/traffic-counts/download.php
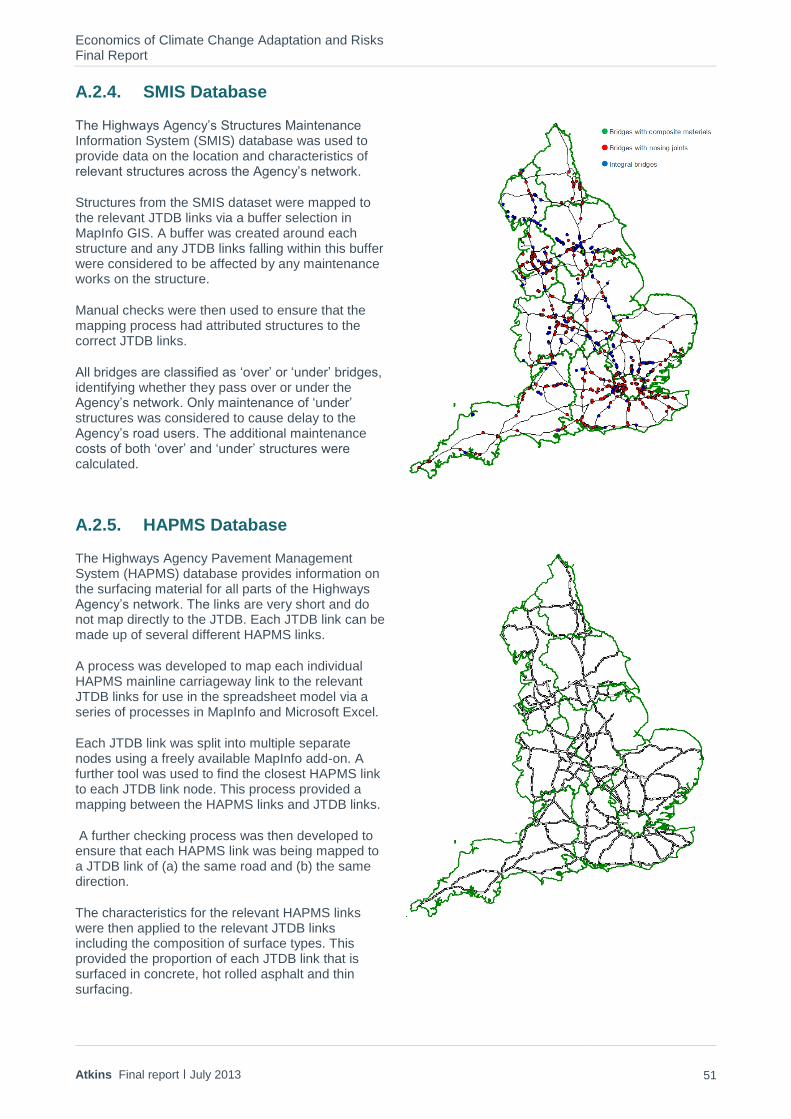
Economics of Climate Change Adaptation and Risks Final Report
Atkins Final report ׀ July 2013 51
A.2.4. SMIS Database
The Highways Agency’s Structures Maintenance Information System (SMIS) database was used to provide data on the location and characteristics of relevant structures across the Agency’s network.
Structures from the SMIS dataset were mapped to the relevant JTDB links via a buffer selection in MapInfo GIS. A buffer was created around each structure and any JTDB links falling within this buffer were considered to be affected by any maintenance works on the structure.
Manual checks were then used to ensure that the mapping process had attributed structures to the correct JTDB links.
All bridges are classified as ‘over’ or ‘under’ bridges, identifying whether they pass over or under the Agency’s network. Only maintenance of ‘under’ structures was considered to cause delay to the Agency’s road users. The additional maintenance costs of both ‘over’ and ‘under’ structures were calculated.
A.2.5. HAPMS Database
The Highways Agency Pavement Management System (HAPMS) database provides information on the surfacing material for all parts of the Highways Agency’s network. The links are very short and do not map directly to the JTDB. Each JTDB link can be made up of several different HAPMS links.
A process was developed to map each individual HAPMS mainline carriageway link to the relevant JTDB links for use in the spreadsheet model via a series of processes in MapInfo and Microsoft Excel.
Each JTDB link was split into multiple separate nodes using a freely available MapInfo add-on. A further tool was used to find the closest HAPMS link to each JTDB link node. This process provided a mapping between the HAPMS links and JTDB links.
A further checking process was then developed to ensure that each HAPMS link was being mapped to a JTDB link of (a) the same road and (b) the same direction.
The characteristics for the relevant HAPMS links were then applied to the relevant JTDB links including the composition of surface types. This provided the proportion of each JTDB link that is surfaced in concrete, hot rolled asphalt and thin surfacing.
Economics of Climate Change Adaptation and Risks Final Report
Atkins Final report ׀ July 2013 52
The proportion of each surfacing type was determined for the left hand lane (lane one) and all other lanes (lanes 2+) separately. The average age of each surfacing type on each link was also identified from HAPMS data and the mapping between the two datasets was also used to determine where a JTDB link was single or dual carriageway, the number of lanes and speed limit for each link
A.2.6. Supporting Data
The data from the JTDB provided information on traffic flows and speeds between November 2011 and October 2012 (the most recent data available at the time of analysis). However, additional supporting information was also needed to provide the full dataset of link based information required for the calculations.
Estimates of traffic levels in future years were derived from current traffic levels by applying growth forecasts for the relevant road type, region and vehicle type from the DfT’s 2011 Road Traffic Forecasts from the National Transport Model
71. These forecasts only extend as far as 2035 so traffic in all subsequent forecast
years was assumed to remain at the same level (consistent with WebTAG guidance).
Some more minor assumptions were also required; including an estimate of the proportion of overnight traffic that is HGVs from the all day proportion provided by the DfT’s traffic count database and DfT’s (relatively old) reported statistics that 25% of HGV traffic occurs overnight and 15% of car traffic occurs overnight
72.
The capacity for each link was calculated on the basis of the number of lanes, road type and DMRB guidance
73
A series of more minor assumptions were also required to fill the small number of gaps in the datasets, including setting the default speed limit to 70mph and default number of lanes to two for missing values.
A.3. Costs of climate change without adaptation
The key inputs into the estimated cost of hotter, drier summers in the absence of adaptation measures were assumptions on:
baseline (without climate change) maintenance profiles for highway surfaces and structures (based on expert advice on current patterns);
the extent to which service lives would vary with climate change (based on “What If” scenario assumptions);
the impact of reduced service lives on maintenance profiles in the with climate change scenario (causing increased frequency of maintenance) and associated costs (in terms of additional material, labour and works costs); and
the impact of increased frequency of maintenance on delays for users of the Highways Agency network (valued in number of hours and in monetary terms).
A.3.1. Baseline maintenance profiles
The service lives and associated maintenance profiles for network assets were assumed to vary with traffic wear and surfacing type for highway surfaces and by type for structures. The following sections provide more details on each set of assumptions.
71
Road Traffic Forecasts 2011, DfT, www.gov.uk/government/publications/road-transport-forecasts-2011-results-from-the-department-for-transports-national-transport-model 72
Table 3.3 of the Transport Statistics Bulletin, Road Traffic Statistics 2001 – the most recent data published for this proportion. 73
DMRB Vol 5, Section 1, Annex D TA 46/97
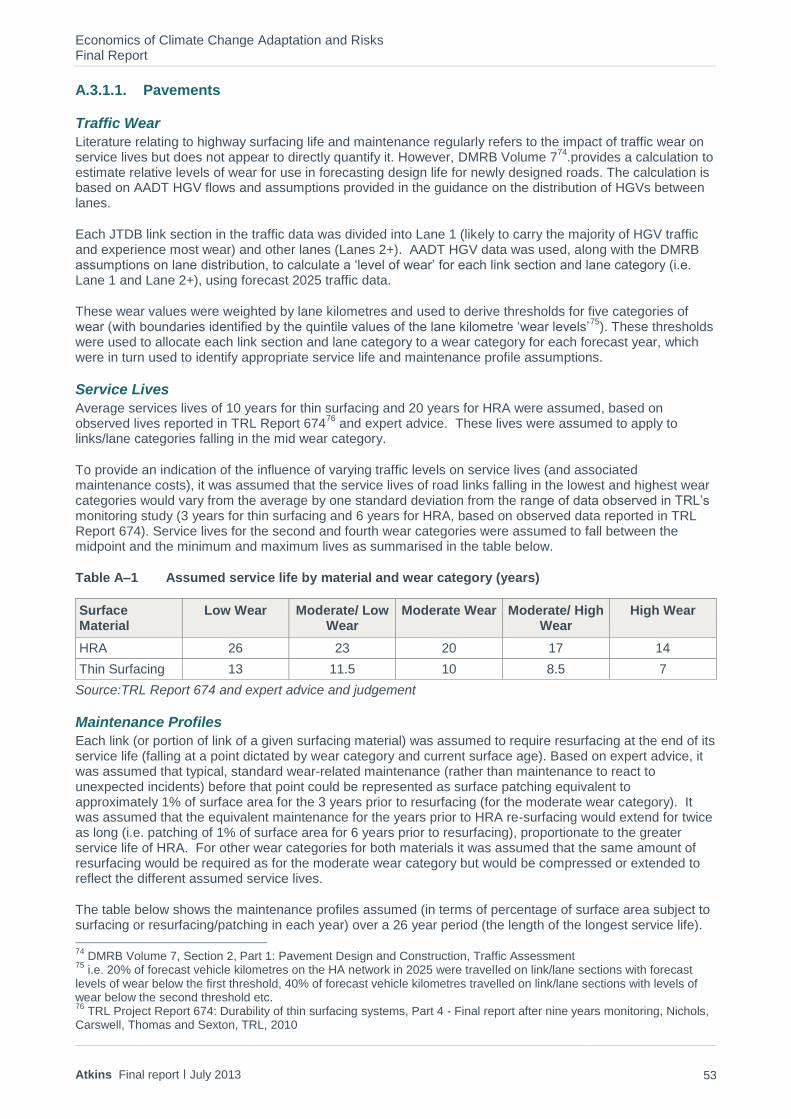
Economics of Climate Change Adaptation and Risks Final Report
Atkins Final report ׀ July 2013 53
A.3.1.1. Pavements
Traffic Wear
Literature relating to highway surfacing life and maintenance regularly refers to the impact of traffic wear on service lives but does not appear to directly quantify it. However, DMRB Volume 7
74.provides a calculation to
estimate relative levels of wear for use in forecasting design life for newly designed roads. The calculation is based on AADT HGV flows and assumptions provided in the guidance on the distribution of HGVs between lanes.
Each JTDB link section in the traffic data was divided into Lane 1 (likely to carry the majority of HGV traffic and experience most wear) and other lanes (Lanes 2+). AADT HGV data was used, along with the DMRB assumptions on lane distribution, to calculate a ‘level of wear’ for each link section and lane category (i.e. Lane 1 and Lane 2+), using forecast 2025 traffic data.
These wear values were weighted by lane kilometres and used to derive thresholds for five categories of wear (with boundaries identified by the quintile values of the lane kilometre ‘wear levels’
75). These thresholds
were used to allocate each link section and lane category to a wear category for each forecast year, which were in turn used to identify appropriate service life and maintenance profile assumptions.
Service Lives
Average services lives of 10 years for thin surfacing and 20 years for HRA were assumed, based on observed lives reported in TRL Report 674
76 and expert advice. These lives were assumed to apply to
links/lane categories falling in the mid wear category.
To provide an indication of the influence of varying traffic levels on service lives (and associated maintenance costs), it was assumed that the service lives of road links falling in the lowest and highest wear categories would vary from the average by one standard deviation from the range of data observed in TRL’s monitoring study (3 years for thin surfacing and 6 years for HRA, based on observed data reported in TRL Report 674). Service lives for the second and fourth wear categories were assumed to fall between the midpoint and the minimum and maximum lives as summarised in the table below.
Table A–1 Assumed service life by material and wear category (years)
Surface Material
Low Wear Moderate/ Low Wear
Moderate Wear Moderate/ High Wear
High Wear
HRA 26 23 20 17 14
Thin Surfacing 13 11.5 10 8.5 7
Source:TRL Report 674 and expert advice and judgement
Maintenance Profiles
Each link (or portion of link of a given surfacing material) was assumed to require resurfacing at the end of its service life (falling at a point dictated by wear category and current surface age). Based on expert advice, it was assumed that typical, standard wear-related maintenance (rather than maintenance to react to unexpected incidents) before that point could be represented as surface patching equivalent to approximately 1% of surface area for the 3 years prior to resurfacing (for the moderate wear category). It was assumed that the equivalent maintenance for the years prior to HRA re-surfacing would extend for twice as long (i.e. patching of 1% of surface area for 6 years prior to resurfacing), proportionate to the greater service life of HRA. For other wear categories for both materials it was assumed that the same amount of resurfacing would be required as for the moderate wear category but would be compressed or extended to reflect the different assumed service lives.
The table below shows the maintenance profiles assumed (in terms of percentage of surface area subject to surfacing or resurfacing/patching in each year) over a 26 year period (the length of the longest service life).
74
DMRB Volume 7, Section 2, Part 1: Pavement Design and Construction, Traffic Assessment 75
i.e. 20% of forecast vehicle kilometres on the HA network in 2025 were travelled on link/lane sections with forecast levels of wear below the first threshold, 40% of forecast vehicle kilometres travelled on link/lane sections with levels of wear below the second threshold etc. 76
TRL Project Report 674: Durability of thin surfacing systems, Part 4 - Final report after nine years monitoring, Nichols, Carswell, Thomas and Sexton, TRL, 2010
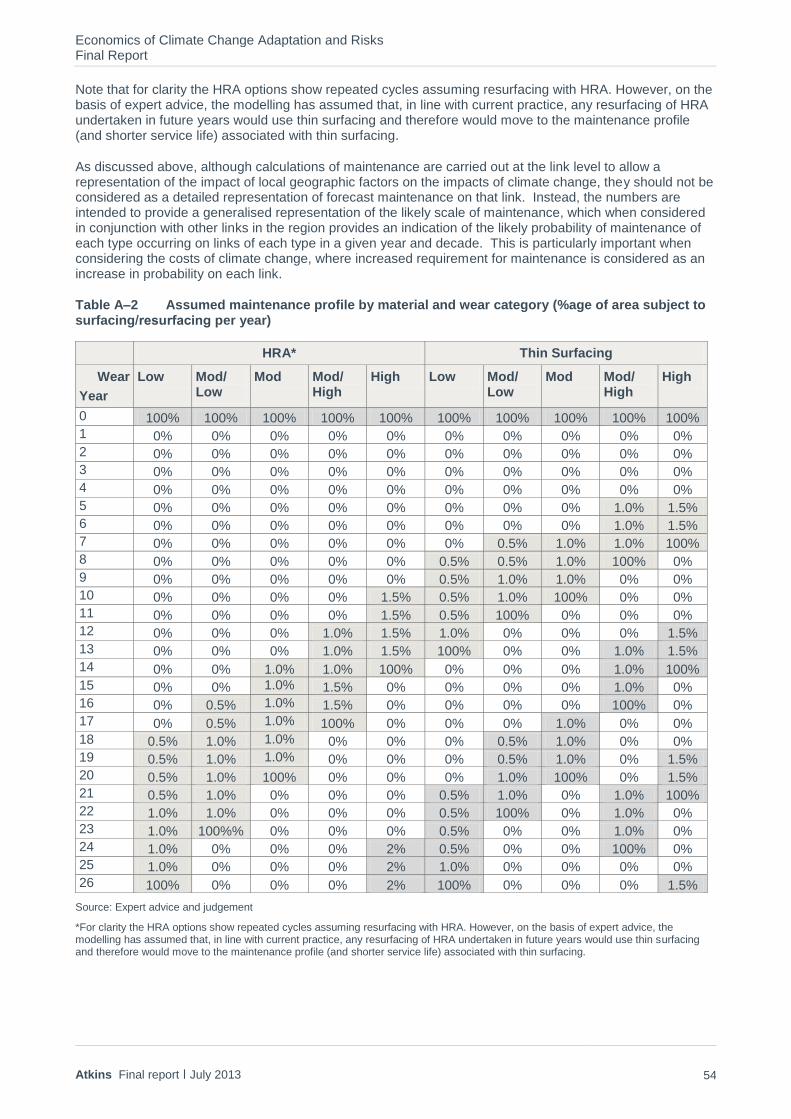
Economics of Climate Change Adaptation and Risks Final Report
Atkins Final report ׀ July 2013 54
Note that for clarity the HRA options show repeated cycles assuming resurfacing with HRA. However, on the basis of expert advice, the modelling has assumed that, in line with current practice, any resurfacing of HRA undertaken in future years would use thin surfacing and therefore would move to the maintenance profile (and shorter service life) associated with thin surfacing.
As discussed above, although calculations of maintenance are carried out at the link level to allow a representation of the impact of local geographic factors on the impacts of climate change, they should not be considered as a detailed representation of forecast maintenance on that link. Instead, the numbers are intended to provide a generalised representation of the likely scale of maintenance, which when considered in conjunction with other links in the region provides an indication of the likely probability of maintenance of each type occurring on links of each type in a given year and decade. This is particularly important when considering the costs of climate change, where increased requirement for maintenance is considered as an increase in probability on each link.
Table A–2 Assumed maintenance profile by material and wear category (%age of area subject to surfacing/resurfacing per year)
HRA* Thin Surfacing
Wear
Year
Low Mod/ Low
Mod Mod/ High
High Low Mod/ Low
Mod Mod/ High
High
0 100% 100% 100% 100% 100% 100% 100% 100% 100% 100%
1 0% 0% 0% 0% 0% 0% 0% 0% 0% 0%
2 0% 0% 0% 0% 0% 0% 0% 0% 0% 0%
3 0% 0% 0% 0% 0% 0% 0% 0% 0% 0%
4 0% 0% 0% 0% 0% 0% 0% 0% 0% 0%
5 0% 0% 0% 0% 0% 0% 0% 0% 1.0% 1.5%
6 0% 0% 0% 0% 0% 0% 0% 0% 1.0% 1.5%
7 0% 0% 0% 0% 0% 0% 0.5% 1.0% 1.0% 100%
8 0% 0% 0% 0% 0% 0.5% 0.5% 1.0% 100% 0%
9 0% 0% 0% 0% 0% 0.5% 1.0% 1.0% 0% 0%
10 0% 0% 0% 0% 1.5% 0.5% 1.0% 100% 0% 0%
11 0% 0% 0% 0% 1.5% 0.5% 100% 0% 0% 0%
12 0% 0% 0% 1.0% 1.5% 1.0% 0% 0% 0% 1.5%
13 0% 0% 0% 1.0% 1.5% 100% 0% 0% 1.0% 1.5%
14 0% 0% 1.0% 1.0% 100% 0% 0% 0% 1.0% 100%
15 0% 0% 1.0% 1.5% 0% 0% 0% 0% 1.0% 0%
16 0% 0.5% 1.0% 1.5% 0% 0% 0% 0% 100% 0%
17 0% 0.5% 1.0% 100% 0% 0% 0% 1.0% 0% 0%
18 0.5% 1.0% 1.0% 0% 0% 0% 0.5% 1.0% 0% 0%
19 0.5% 1.0% 1.0% 0% 0% 0% 0.5% 1.0% 0% 1.5%
20 0.5% 1.0% 100% 0% 0% 0% 1.0% 100% 0% 1.5%
21 0.5% 1.0% 0% 0% 0% 0.5% 1.0% 0% 1.0% 100%
22 1.0% 1.0% 0% 0% 0% 0.5% 100% 0% 1.0% 0%
23 1.0% 100%% 0% 0% 0% 0.5% 0% 0% 1.0% 0%
24 1.0% 0% 0% 0% 2% 0.5% 0% 0% 100% 0%
25 1.0% 0% 0% 0% 2% 1.0% 0% 0% 0% 0%
26 100% 0% 0% 0% 2% 100% 0% 0% 0% 1.5%
Source: Expert advice and judgement
*For clarity the HRA options show repeated cycles assuming resurfacing with HRA. However, on the basis of expert advice, the modelling has assumed that, in line with current practice, any resurfacing of HRA undertaken in future years would use thin surfacing and therefore would move to the maintenance profile (and shorter service life) associated with thin surfacing.
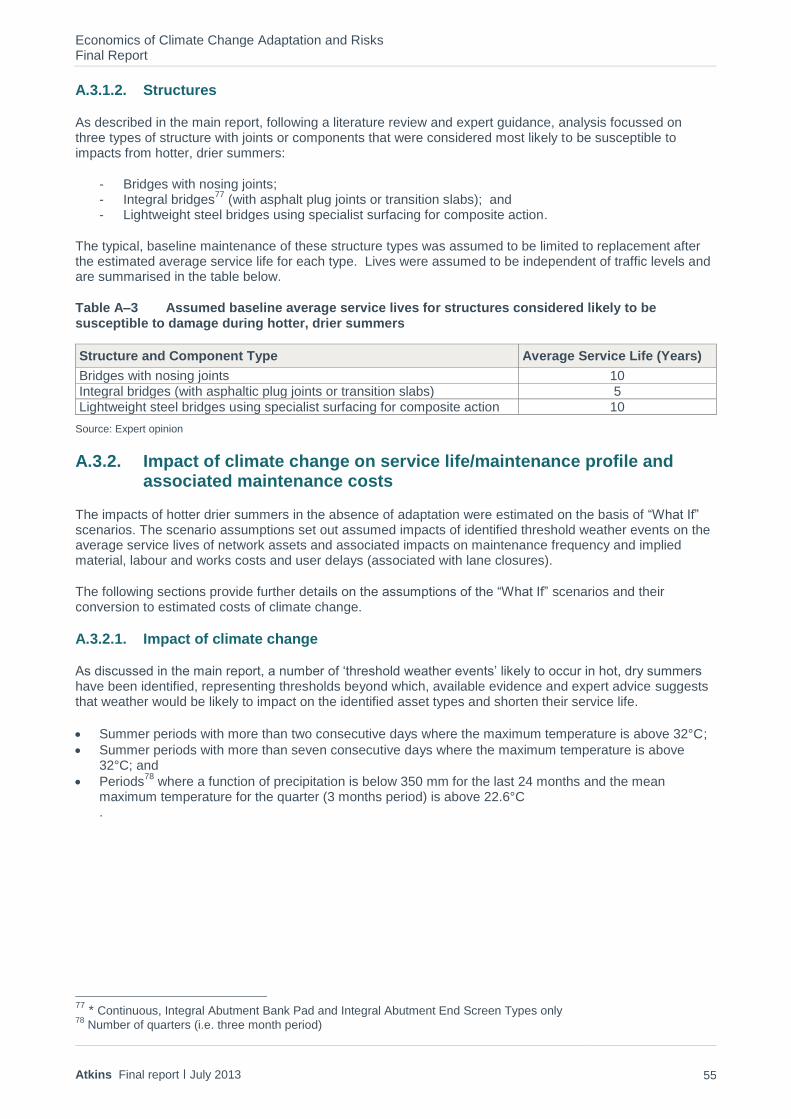
Economics of Climate Change Adaptation and Risks Final Report
Atkins Final report ׀ July 2013 55
A.3.1.2. Structures
As described in the main report, following a literature review and expert guidance, analysis focussed on three types of structure with joints or components that were considered most likely to be susceptible to impacts from hotter, drier summers:
- Bridges with nosing joints; - Integral bridges
77 (with asphalt plug joints or transition slabs); and
- Lightweight steel bridges using specialist surfacing for composite action.
The typical, baseline maintenance of these structure types was assumed to be limited to replacement after the estimated average service life for each type. Lives were assumed to be independent of traffic levels and are summarised in the table below.
Table A–3 Assumed baseline average service lives for structures considered likely to be susceptible to damage during hotter, drier summers
Structure and Component Type Average Service Life (Years)
Bridges with nosing joints 10
Integral bridges (with asphaltic plug joints or transition slabs) 5
Lightweight steel bridges using specialist surfacing for composite action 10
Source: Expert opinion
A.3.2. Impact of climate change on service life/maintenance profile and associated maintenance costs
The impacts of hotter drier summers in the absence of adaptation were estimated on the basis of “What If” scenarios. The scenario assumptions set out assumed impacts of identified threshold weather events on the average service lives of network assets and associated impacts on maintenance frequency and implied material, labour and works costs and user delays (associated with lane closures).
The following sections provide further details on the assumptions of the “What If” scenarios and their conversion to estimated costs of climate change.
A.3.2.1. Impact of climate change
As discussed in the main report, a number of ‘threshold weather events’ likely to occur in hot, dry summers have been identified, representing thresholds beyond which, available evidence and expert advice suggests that weather would be likely to impact on the identified asset types and shorten their service life.
Summer periods with more than two consecutive days where the maximum temperature is above 32°C;
Summer periods with more than seven consecutive days where the maximum temperature is above 32°C; and
Periods78
where a function of precipitation is below 350 mm for the last 24 months and the mean maximum temperature for the quarter (3 months period) is above 22.6°C .
77
* Continuous, Integral Abutment Bank Pad and Integral Abutment End Screen Types only 78
Number of quarters (i.e. three month period)
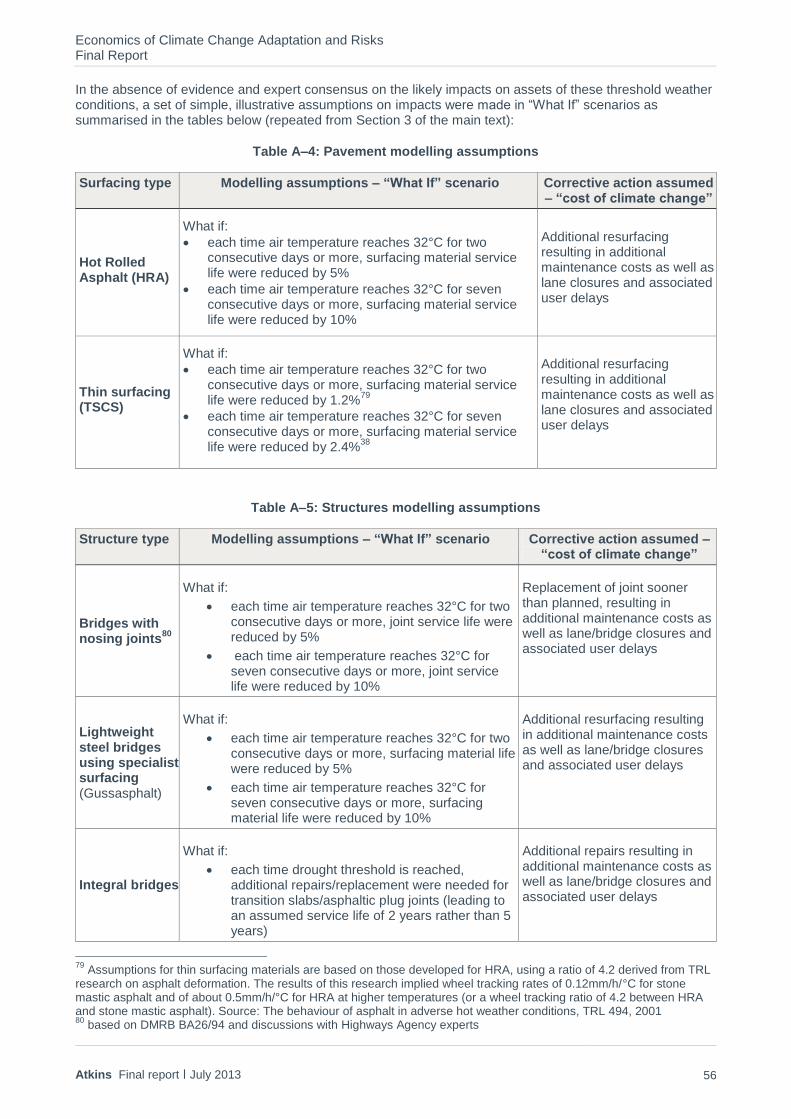
Economics of Climate Change Adaptation and Risks Final Report
Atkins Final report ׀ July 2013 56
In the absence of evidence and expert consensus on the likely impacts on assets of these threshold weather conditions, a set of simple, illustrative assumptions on impacts were made in “What If” scenarios as summarised in the tables below (repeated from Section 3 of the main text):
Table A–4: Pavement modelling assumptions
Surfacing type Modelling assumptions – “What If” scenario Corrective action assumed – “cost of climate change”
Hot Rolled Asphalt (HRA)
What if:
each time air temperature reaches 32°C for two consecutive days or more, surfacing material service life were reduced by 5%
each time air temperature reaches 32°C for seven consecutive days or more, surfacing material service life were reduced by 10%
Additional resurfacing resulting in additional maintenance costs as well as lane closures and associated user delays
Thin surfacing (TSCS)
What if:
each time air temperature reaches 32°C for two consecutive days or more, surfacing material service life were reduced by 1.2%
79
each time air temperature reaches 32°C for seven consecutive days or more, surfacing material service life were reduced by 2.4%
38
Additional resurfacing resulting in additional maintenance costs as well as lane closures and associated user delays
Table A–5: Structures modelling assumptions
Structure type Modelling assumptions – “What If” scenario Corrective action assumed – “cost of climate change”
Bridges with nosing joints
80
What if:
each time air temperature reaches 32°C for two consecutive days or more, joint service life were reduced by 5%
each time air temperature reaches 32°C for seven consecutive days or more, joint service life were reduced by 10%
Replacement of joint sooner than planned, resulting in additional maintenance costs as well as lane/bridge closures and associated user delays
Lightweight steel bridges using specialist surfacing (Gussasphalt)
What if:
each time air temperature reaches 32°C for two consecutive days or more, surfacing material life were reduced by 5%
each time air temperature reaches 32°C for seven consecutive days or more, surfacing material life were reduced by 10%
Additional resurfacing resulting in additional maintenance costs as well as lane/bridge closures and associated user delays
Integral bridges
What if:
each time drought threshold is reached, additional repairs/replacement were needed for transition slabs/asphaltic plug joints (leading to an assumed service life of 2 years rather than 5 years)
Additional repairs resulting in additional maintenance costs as well as lane/bridge closures and associated user delays
79
Assumptions for thin surfacing materials are based on those developed for HRA, using a ratio of 4.2 derived from TRL research on asphalt deformation. The results of this research implied wheel tracking rates of 0.12mm/h/°C for stone mastic asphalt and of about 0.5mm/h/°C for HRA at higher temperatures (or a wheel tracking ratio of 4.2 between HRA and stone mastic asphalt). Source: The behaviour of asphalt in adverse hot weather conditions, TRL 494, 2001 80
based on DMRB BA26/94 and discussions with Highways Agency experts

Economics of Climate Change Adaptation and Risks Final Report
Atkins Final report ׀ July 2013 57
The Weather Generator analysis described in Section 4 of the main report and Appendix B provided estimates of the number of times each of the ‘threshold weather events’ are forecast to occur in three thirty year periods, centring on the 2020s, 2040s and 2060s for each of the two modelled scenarios. For the purposes of the modelling, the thirty year frequencies were converted to an average number of forecast events per annum. These values were assumed to apply to the mid decade in each group (i.e. the 2020s, 2040s and 2060s). Equivalent values for the 2030s, 2050s and 2070s were estimated through interpolation and the assumption that 2070s values matched those for the 2060s. It is recognised that this approach represents a simplified use of the climate forecasts (which are intended to be considered for the full thirty year period). However, the simplification was judged appropriate in the context of the nature of the calculations being undertaken, and provided a mechanism for identifying the potential scale of growth in climate impacts through time.
To calculate the net impact of forecast weather conditions on the assets in each forecast year in each region, the midpoint year was taken to represent conditions in each decade. The cumulative impact of climate change on service life for each asset by that year was then identified by combining (multiplicatively) the impact of the number of each of the threshold weather events in each year over the duration of the last service life of the relevant asset (i.e. section of surfacing or structure), using the estimated service life impacts of each event identified above
81. The combined annual impact on service life was capped at a
maximum of 5% p.a. in the 2020s and 2030s, 10% p.a. in the 2040s then rising by 5% per decade to 25% in the 2070s (although these caps are only needed for the Worst Case Scenario).
The ‘with climate change’ service life for each asset type was assumed to reduce by the cumulative proportion reduction identified, varying according to the region of location (and associated climate forecasts), decade and asset type. Similarly, the maintenance profile of the asset was assumed to be compressed in line with the reduction of service life, leading to an increase in the probability of maintenance of each type in each year, calculated as the inverse of the cumulative reduction in service life.
A.3.2.2. Additional maintenance costs
The reduction in asset service lives estimated to be caused by hotter, drier summers were also forecast to lead to increased maintenance costs, due to the associated increase in the annual probability of maintenance in each year.
Cost impacts were identified (on the basis of expert advice) on the assumption that all additional maintenance would be planned and undertaken overnight with one or two lanes closed (with complete road closures never required).
The direct costs of maintenance for each link were estimated through the following steps for each link:
Identifying the additional area requiring resurfacing in each year as a result of climate change in m2;
Multiplying by the assumed thickness of 40mm (based on the Highways Agency’s IAN 157/1182
and expert advice) to estimate the volume required in m
3;
Multiplying by the average cost (materials, works and labour) of resurfacing per m3 provided by the
Agency83
.(£179 per m3 in 2012prices);
Identifying the number of additional structures requiring replacement in each year as a result of climate change; and
Multiplying by the average cost (materials, works and labour) of replacement per structure provided by the Agency
84 (£13,079 per nosing joint and £5,362 per asphalt plug joint in 2012prices).
81
Calculations ensured that periods of 2 days over 32°C were not double counted in cases where high temperature
conditions extended to generate of a period of 7 days over 32°C 82
IAN 157/11, Thin Surface Course Systems - Installation and Maintenance, Highways Agency 83
The Highways Agency provided data provided by contractors on the volume and costs of resurfacing works and joint
replacements undertaken between April 2011 and June 2013, provided as complete costs including labour, plant, materials and subcontract, allowing an average cost per m3 of surfacing and per joint to be estimated. The average value was assumed to be in 2012 prices. . 84
The Highways Agency provided data provided by contractors on the volume and costs of resurfacing works and joint
replacements undertaken between April 2011 and June 2013, provided as complete costs including labour, plant, materials and subcontract, allowing an average cost per m3 of surfacing and per joint to be estimated. The average value was assumed to be in 2012 prices. .
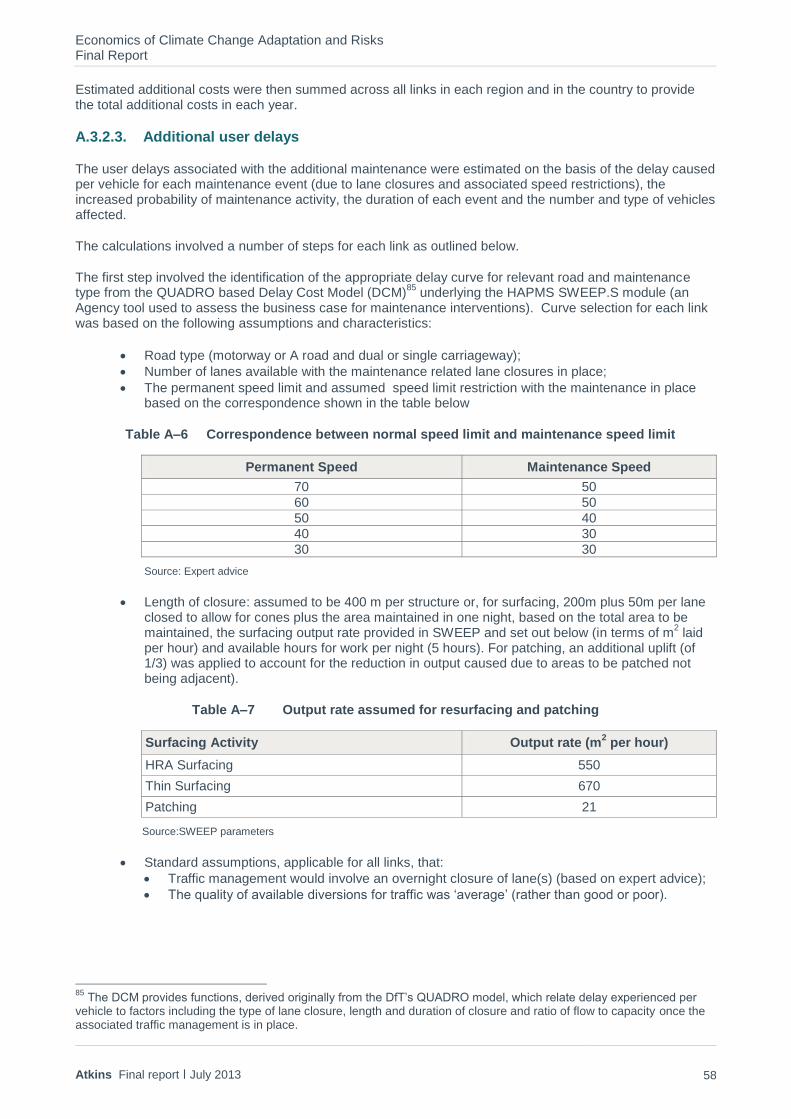
Economics of Climate Change Adaptation and Risks Final Report
Atkins Final report ׀ July 2013 58
Estimated additional costs were then summed across all links in each region and in the country to provide the total additional costs in each year.
A.3.2.3. Additional user delays
The user delays associated with the additional maintenance were estimated on the basis of the delay caused per vehicle for each maintenance event (due to lane closures and associated speed restrictions), the increased probability of maintenance activity, the duration of each event and the number and type of vehicles affected.
The calculations involved a number of steps for each link as outlined below.
The first step involved the identification of the appropriate delay curve for relevant road and maintenance type from the QUADRO based Delay Cost Model (DCM)
85 underlying the HAPMS SWEEP.S module (an
Agency tool used to assess the business case for maintenance interventions). Curve selection for each link was based on the following assumptions and characteristics:
Road type (motorway or A road and dual or single carriageway);
Number of lanes available with the maintenance related lane closures in place;
The permanent speed limit and assumed speed limit restriction with the maintenance in place based on the correspondence shown in the table below
Table A–6 Correspondence between normal speed limit and maintenance speed limit
Permanent Speed Maintenance Speed
70 50
60 50
50 40
40 30
30 30
Source: Expert advice
Length of closure: assumed to be 400 m per structure or, for surfacing, 200m plus 50m per lane closed to allow for cones plus the area maintained in one night, based on the total area to be maintained, the surfacing output rate provided in SWEEP and set out below (in terms of m
2 laid
per hour) and available hours for work per night (5 hours). For patching, an additional uplift (of 1/3) was applied to account for the reduction in output caused due to areas to be patched not being adjacent).
Table A–7 Output rate assumed for resurfacing and patching
Surfacing Activity Output rate (m2 per hour)
HRA Surfacing 550
Thin Surfacing 670
Patching 21
Source:SWEEP parameters
Standard assumptions, applicable for all links, that:
Traffic management would involve an overnight closure of lane(s) (based on expert advice);
The quality of available diversions for traffic was ‘average’ (rather than good or poor).
85
The DCM provides functions, derived originally from the DfT’s QUADRO model, which relate delay experienced per vehicle to factors including the type of lane closure, length and duration of closure and ratio of flow to capacity once the associated traffic management is in place.
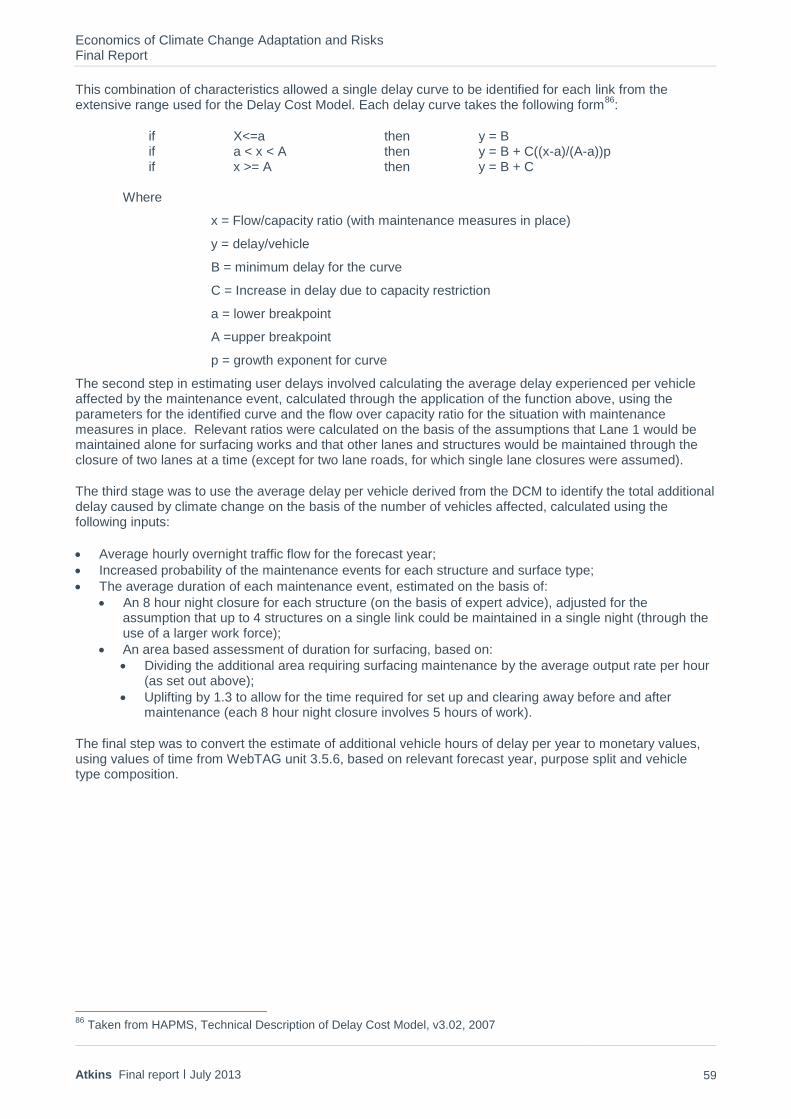
Economics of Climate Change Adaptation and Risks Final Report
Atkins Final report ׀ July 2013 59
This combination of characteristics allowed a single delay curve to be identified for each link from the extensive range used for the Delay Cost Model. Each delay curve takes the following form
86:
if X<=a then y = B if a < x < A then y = B + C((x-a)/(A-a))p if x >= A then y = B + C
Where
x = Flow/capacity ratio (with maintenance measures in place)
y = delay/vehicle
B = minimum delay for the curve
C = Increase in delay due to capacity restriction
a = lower breakpoint
A =upper breakpoint
p = growth exponent for curve
The second step in estimating user delays involved calculating the average delay experienced per vehicle affected by the maintenance event, calculated through the application of the function above, using the parameters for the identified curve and the flow over capacity ratio for the situation with maintenance measures in place. Relevant ratios were calculated on the basis of the assumptions that Lane 1 would be maintained alone for surfacing works and that other lanes and structures would be maintained through the closure of two lanes at a time (except for two lane roads, for which single lane closures were assumed).
The third stage was to use the average delay per vehicle derived from the DCM to identify the total additional delay caused by climate change on the basis of the number of vehicles affected, calculated using the following inputs:
Average hourly overnight traffic flow for the forecast year;
Increased probability of the maintenance events for each structure and surface type;
The average duration of each maintenance event, estimated on the basis of:
An 8 hour night closure for each structure (on the basis of expert advice), adjusted for the assumption that up to 4 structures on a single link could be maintained in a single night (through the use of a larger work force);
An area based assessment of duration for surfacing, based on:
Dividing the additional area requiring surfacing maintenance by the average output rate per hour (as set out above);
Uplifting by 1.3 to allow for the time required for set up and clearing away before and after maintenance (each 8 hour night closure involves 5 hours of work).
The final step was to convert the estimate of additional vehicle hours of delay per year to monetary values, using values of time from WebTAG unit 3.5.6, based on relevant forecast year, purpose split and vehicle type composition.
86
Taken from HAPMS, Technical Description of Delay Cost Model, v3.02, 2007
Economics of Climate Change Adaptation and Risks Final Report
Atkins Final report ׀ July 2013 60
A.4. Adaptation costs The costs of implementing the identified adaptation measure for each asset type for each scenario were calculated on the following basis.
A.4.1.1. Surfaces
For surfacing, the first step in cost quantification was identification of the volume of surfacing material required for maintenance in the baseline (accounting for patching and resurfacing by region in each year of the 60 year appraisal).
Additional material costs associated with the use of higher specification surfacing materials were the identified on the basis of:
data provided by the Highways Agency providing total area and labour, works and material costs for resurfacing jobs between April 2011 and June 2013,combined with an uplift of 20% to account for traffic management and preliminary costs (based on rates in SWEEP.S) - allowing an average cost per m
3 to
be derived
a ratio of material costs as a proportion of total labour, material and works costs based on assumptions available from the SWEEP.S database, which provides costs of laying a m
2 of surfacing of each type
including labour and materials costs (with works costs identified separately). The difference between daytime and night time costs per m
2 was assumed to be solely due to a variation in labour costs and it
was assumed that night time labour costs were approximately double the costs of day time work. Once additional allowances were made for traffic management and preliminaries, this comparison suggested that material costs accounted for approximately 45% of the total costs of surfacing
The additional costs per unit area of more heat resistant surfacing materials were estimated on the basis of evidence from USA on relative costs of surfacing materials
87 which suggested that a 15% uplift on material
costs for standard surfacing would achieve a significant improvement in heat resistance.
Total costs of adaptation measures required for each climate scenario were identified on the assumption that adaptation measures would begin to be applied in each region in decades where the impacts of hotter, drier summers are forecast to reduce the average service life of surfacing by 1% or more per annum
A.4.1.2. Structures
The quantification of adaptation costs for joints/components within structures involved estimation of the number of components replaced in baseline conditions and, as for surfacing, a number of assumptions:
average cost per component in 2012 prices derived from data on maintenance between April 2011 and June 2013 provided by the Agency and 20% uplift to allow for traffic management and preliminaries (in line with the assumption for surfacing in the absence of more detailed information)
additional costs of climate resistant components are the equivalent of 15% of material costs for each component;
material costs equate to 45% of total maintenance costs (preliminaries (in line with the assumption for surfacing in the absence of more detailed information); and.
adaptation measures would begin to be applied in each region in decades where the impacts of hotter, drier summers are forecast to reduce the average service life of the assets by 1% or more per annum.
87
Based on cost information quoted in Impacts of Climate Change: A focus on road and rail transport infrastructures, European Commission JRC Scientific and Policy Reports, Nemry & Demirel, 2012 (ftp://ftp.jrc.es/pub/EURdoc/JRC72217.pdf)
Economics of Climate Change Adaptation and Risks Final Report
Atkins Final report ׀ July 2013 61
A.5. WebTAG discounted appraisal
For each climate scenario, the cost and benefits associated with adaptation measures in each forecast year were converted to provide an estimated present value of impacts over a 60 year appraisal period (2013 to 2072), following WebTAG guidance as set out below.
The user delays avoided by adaptation measures in the three forecast years were extrapolated to provide estimates of the savings in each of the 60 years of the appraisal period by assuming
A steady build up to 2025 impacts from 2014;
A constant annual rate of change between 2025 and 2045 and between 2045 and 2065;88
No further growth in impact beyond 2065.
Costs of adaptation measures and avoided maintenance costs were converted to a 2010 price base (for consistency with the values of time used in WebTAG) using the GDP deflator.
89
Costs and benefits were discounted to a 2010 base year using a discount rate of 3.5% to 2043 and 3% beyond (all in line with WebTAG)
For each scenario, a BCR of adaptation measures for the HA was calculated by dividing the net impact of the adaptation measures (i.e. user delay plus maintenance cost saved) by the direct cost of adaptation measures. This approach was adopted in preference to a more standard WebTAG approach (which would have treated user delay savings as the PVB and net impact of adaptation costs and maintenance savings as the PVC), as it was considered to provide a more straightforward view of the direct relative costs and benefits of adaptation.
The equivalent calculation was also undertaken at a regional level, considering only links in each region.
88
It is recognised that this approach represents a simplified use of the climate forecasts which are intended to be considered for the full thirty year period. However the simplification was judged to be appropriate in the context of the nature of the calculations. 89
HM Treasury GDP Deflator, available May 2013
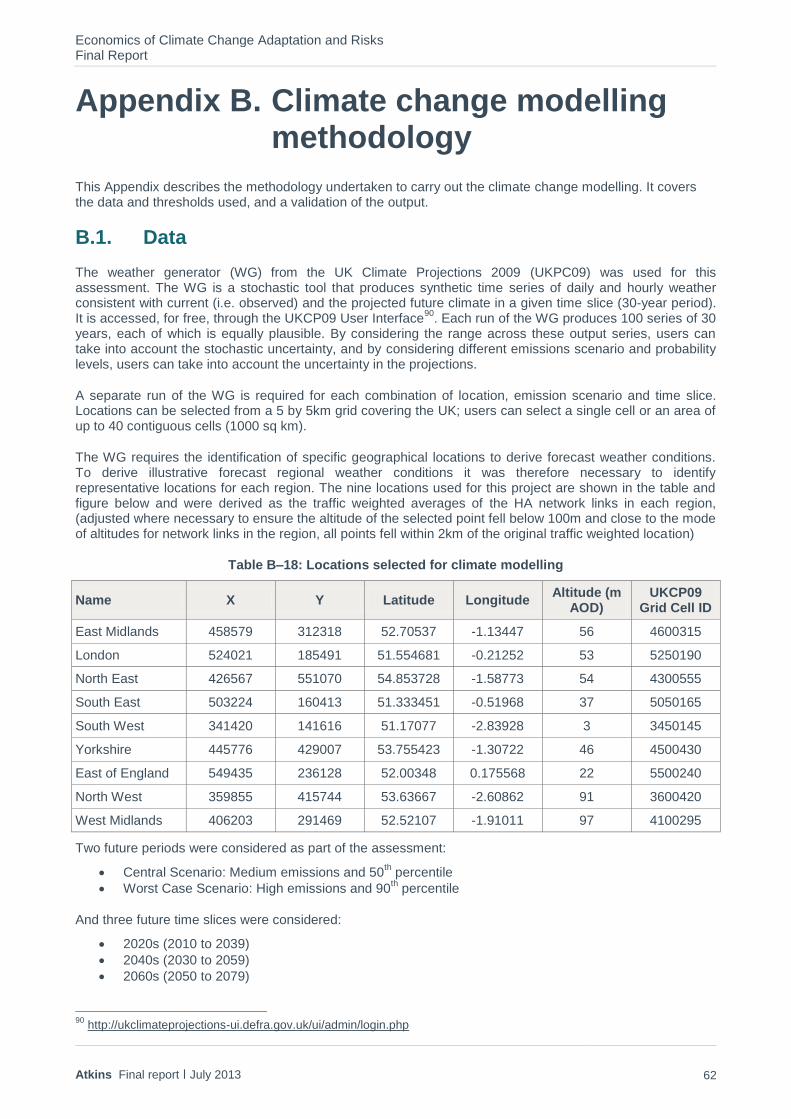
Economics of Climate Change Adaptation and Risks Final Report
Atkins Final report ׀ July 2013 62
Appendix B. Climate change modelling methodology
This Appendix describes the methodology undertaken to carry out the climate change modelling. It covers the data and thresholds used, and a validation of the output.
B.1. Data
The weather generator (WG) from the UK Climate Projections 2009 (UKPC09) was used for this assessment. The WG is a stochastic tool that produces synthetic time series of daily and hourly weather consistent with current (i.e. observed) and the projected future climate in a given time slice (30-year period). It is accessed, for free, through the UKCP09 User Interface
90. Each run of the WG produces 100 series of 30
years, each of which is equally plausible. By considering the range across these output series, users can take into account the stochastic uncertainty, and by considering different emissions scenario and probability levels, users can take into account the uncertainty in the projections.
A separate run of the WG is required for each combination of location, emission scenario and time slice. Locations can be selected from a 5 by 5km grid covering the UK; users can select a single cell or an area of up to 40 contiguous cells (1000 sq km).
The WG requires the identification of specific geographical locations to derive forecast weather conditions. To derive illustrative forecast regional weather conditions it was therefore necessary to identify representative locations for each region. The nine locations used for this project are shown in the table and figure below and were derived as the traffic weighted averages of the HA network links in each region, (adjusted where necessary to ensure the altitude of the selected point fell below 100m and close to the mode of altitudes for network links in the region, all points fell within 2km of the original traffic weighted location)
Table B–18: Locations selected for climate modelling
Name X Y Latitude Longitude Altitude (m
AOD) UKCP09
Grid Cell ID
East Midlands 458579 312318 52.70537 -1.13447 56 4600315
London 524021 185491 51.554681 -0.21252 53 5250190
North East 426567 551070 54.853728 -1.58773 54 4300555
South East 503224 160413 51.333451 -0.51968 37 5050165
South West 341420 141616 51.17077 -2.83928 3 3450145
Yorkshire 445776 429007 53.755423 -1.30722 46 4500430
East of England 549435 236128 52.00348 0.175568 22 5500240
North West 359855 415744 53.63667 -2.60862 91 3600420
West Midlands 406203 291469 52.52107 -1.91011 97 4100295
Two future periods were considered as part of the assessment:
Central Scenario: Medium emissions and 50th percentile
Worst Case Scenario: High emissions and 90th percentile
And three future time slices were considered:
2020s (2010 to 2039)
2040s (2030 to 2059)
2060s (2050 to 2079)
90
http://ukclimateprojections-ui.defra.gov.uk/ui/admin/login.php
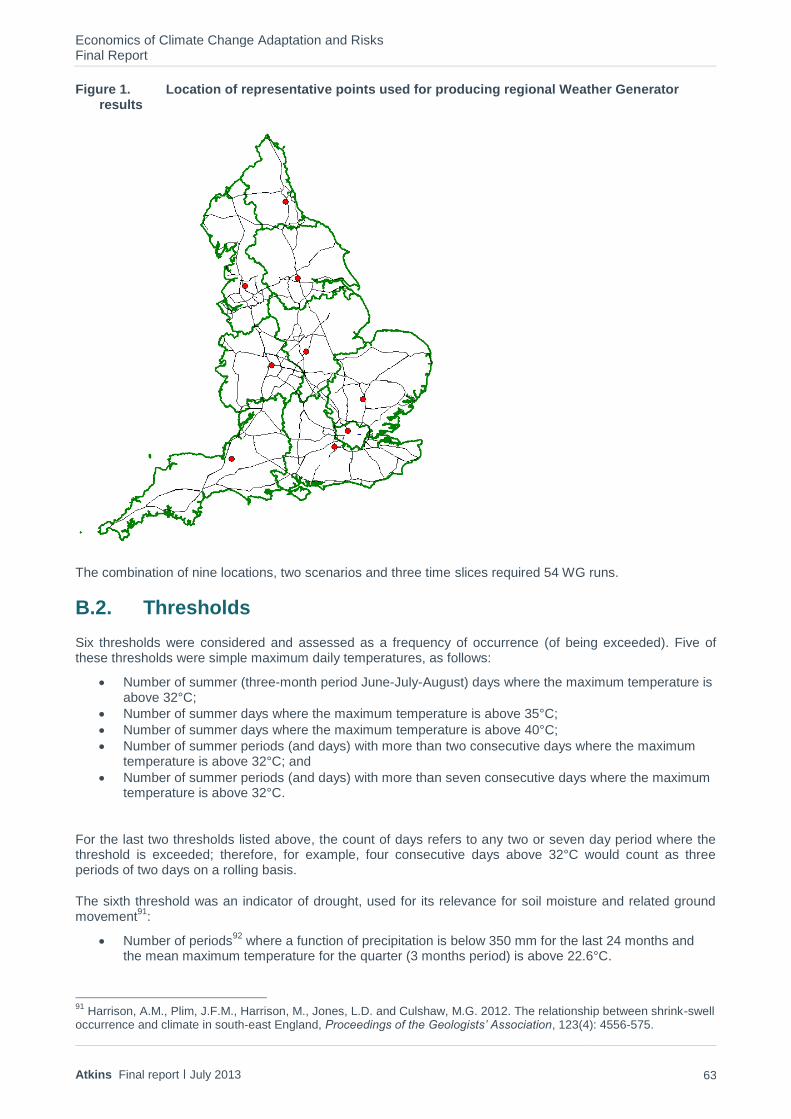
Economics of Climate Change Adaptation and Risks Final Report
Atkins Final report ׀ July 2013 63
Figure 1. Location of representative points used for producing regional Weather Generator results
The combination of nine locations, two scenarios and three time slices required 54 WG runs.
B.2. Thresholds
Six thresholds were considered and assessed as a frequency of occurrence (of being exceeded). Five of these thresholds were simple maximum daily temperatures, as follows:
Number of summer (three-month period June-July-August) days where the maximum temperature is above 32°C;
Number of summer days where the maximum temperature is above 35°C;
Number of summer days where the maximum temperature is above 40°C;
Number of summer periods (and days) with more than two consecutive days where the maximum temperature is above 32°C; and
Number of summer periods (and days) with more than seven consecutive days where the maximum temperature is above 32°C.
For the last two thresholds listed above, the count of days refers to any two or seven day period where the threshold is exceeded; therefore, for example, four consecutive days above 32°C would count as three periods of two days on a rolling basis.
The sixth threshold was an indicator of drought, used for its relevance for soil moisture and related ground movement
91:
Number of periods92
where a function of precipitation is below 350 mm for the last 24 months and the mean maximum temperature for the quarter (3 months period) is above 22.6°C.
91
Harrison, A.M., Plim, J.F.M., Harrison, M., Jones, L.D. and Culshaw, M.G. 2012. The relationship between shrink-swell occurrence and climate in south-east England, Proceedings of the Geologists’ Association, 123(4): 4556-575.
Economics of Climate Change Adaptation and Risks Final Report
Atkins Final report ׀ July 2013 64
This threshold was calculated as follows:
a) Daily rainfall was summed into monthly totals; b) An average monthly total was calculated for each quarter on a seasonal basis (i.e. not rolling, but as
fixed December-January-February (DJF), March-April-May (MAM), June-July-August (JJA) and September-October-November (SON) periods);
c) A 24-month ‘total’ rainfall was calculated on a rolling seasonal basis. This is not a true 24-month total as it is, in effect, only the sum of eight months of rainfall (as each season is a monthly average rather than a total);
d) Mean maximum daily temperature was calculated for each season; e) The frequency of the threshold being exceeded was then calculated as a number of seasons (quarters)
on a rolling seasonal basis.
All the thresholds, whether they are temperature, precipitation or day count, were calculated on a ‘greater than or equal’ basis.
The WG was analysed using the thresholds described. The WG output was downloaded from the UKCP09 User Interface in zipped folders of csv files. The data was then analysed using code written in Python, and then checked with manual calculations in Microsoft Excel. As the WG produces 100 output time series, there are 100 results for each threshold and location/scenario/time slice combination. The results were therefore presented as the 50
th, 5
th and 95
th percentiles to give an indication of the range across all the runs.
B.3. Validation
The WG gives both ‘control’ and ‘scenario’ output, where the ‘control’ refers to time series generated consistent with the baseline period 1961-90 and the ‘scenario’ refers to time series generated consistent with future projections as selected by the user. This feature of the WG means users can directly compare the ‘control’ output with observed baseline data of the same period.
The WG was validated against gridded observed data available from the Met Office for the five temperature thresholds used in the assessment. Daily data are available using the same 5 by 5km grid as UKCP09. These data were not used as the baseline for the WG itself because the data weren’t available at the time the WG was created. Instead, the WG baseline was constructed using daily data from 115 sites across the UK, which was then interpolated to the same 5 by 5km grid
93.
92
Number of quarters (i.e. three month period) 93
Jones, P. D., Kilsby, C. G., Harpham, C., Glenis, V., Burton, A. (2009), UK Climate Projections science report: Projections of future daily climate for the UK from the Weather Generator. University of Newcastle, UK.

Economics of Climate Change Adaptation and Risks Final Report
Atkins Final report ׀ July 2013 65
The four most southerly (and therefore likely warmest) of the nine locations were assessed against the Met Office data. The results are shown in Table B-2.
Table B–2: Validation results
South West South East London East of England
Met Office data
Daily Max Temp > 32 9 17 9 16
Daily Max Temp > 35 0 1 0 1
Daily Max Temp > 40 0 0 0 0
2 Day Max Temp > 32 5 8 4 7
7 Day Max Temp > 32 0 0 0 0
WG Data
Daily Max Temp > 32 0 (0 – 1) 1 (0 – 3) 2 (0 – 3) 2 (0.95 – 4)
Daily Max Temp > 35 0 0 0 0
Daily Max Temp > 40 0 0 0 0
2 Day Max Temp > 32 0 0 0 (0 – 1) 0
7 Day Max Temp > 32 0 0 0 0
WG data shows median count with 5th and 95
th percentiles in brackets, showing range of 100 output runs.
It can be seen that the WG control data under predicts the number of times the thresholds are exceeded when compared to the gridded observed data. This is likely to be a result of the gridded baseline data being interpolated from the 115 daily stations based on mean monthly temperatures, and therefore struggling to replicate the very high temperatures such as the thresholds being used here. For this reason, the results from this assessment (as counts above each threshold) should be considered as change in totals rather than absolute totals. Therefore, the control figures from the WG should be subtracted from the projection figures before being used. (In practice, the control figures for all thresholds at all sites analysed here are almost all zero).

Working on behalf of the Highways Agency
If you need help using this or any other Highways Agency information, please call 0300 123 5000* and we will assist you.
© Crown copyright 2014. You may re-use this information (not including logos) free of charge in any format or medium, under the terms of the Open Government Licence. To view this licence, visit http://www.nationalarchives.gov.uk/doc/open-government-licence/ or write to the Information Policy Team, The National Archives, Kew, London TW9 4DU, or email: [email protected].
This document is also available on our website at www.highways.gov.uk
If you have any enquiries about this publication email [email protected] or call 0300 123 5000*Please quote Highways Agency publications code PR153/13
* Calls to 03 num bers cost no more than a national rate call to an 01 or 02 num ber and must count towards any inclu sive min utes in the same way as 01 and 02 calls. These rules apply to calls from any type of line includ ing mobile, BT, other fixed line or payphone. Calls may be recorded or monitored.
Highways Agency media services. Job number S130633
Related Documents