Aerosol Composition in Los Angeles During the 2010 CalNex Campaign Studied by High Resolution Aerosol Mass Spectrometry CalNex Data Analysis Workshop, May 16 th – 19 th 2011, Sacramento Patrick L. Hayes 1,2 , Amber M. Ortega 1,3 , Michael J. Cubison 1,2 , Weiwei Hu 4 , Darin W. Toohey 3 , James H. Flynn 5 , Barry L. Lefer 5 , Sergio Alvarez 5 , Bernhard Rappenglück 5 , James D. Allan 6 , John S. Holloway 1,7 , Jessica B. Gilman 1,7 , William C. Kuster 7 , Joost A. de Gouw 1,7 , Paola Massoli 8 , Xiaolu Zhang 9 , Rodney J. Weber 9 , Ashley Corrigan 10 , Lynn M. Russell 10 , Jose L. Jimenez 1,2 (1) CIRES, Boulder, USA; (2) Department of Chemistry and Biochemistry, University of Colorado, Boulder, USA; (3) Department of Atmospheric and Oceanic Science, University of Colorado, Boulder, USA; (4) College of Environmental Sciences and Engineering, Peking University, China; (5) Department of Earth and Atmospheric Sciences, University of Houston, USA; (6) National Centre for Atmospheric Science, The University of Manchester, UK ; (7) NOAA, Boulder, USA; (8) Aerodyne Research Inc., Billerica, USA; (9) Georgia Institute of Technology, Atlanta, USA; (10) Scripps Institution of Oceanography, University of California San Diego, La Jolla, USA.

Aerosol Composition in Los Angeles During the 2010 CalNex Campaign Studied by High Resolution Aerosol Mass Spectrometry CalNex Data Analysis Workshop,
Dec 16, 2015
Welcome message from author
This document is posted to help you gain knowledge. Please leave a comment to let me know what you think about it! Share it to your friends and learn new things together.
Transcript

Aerosol Composition in Los Angeles During the 2010 CalNex Campaign Studied by High Resolution Aerosol Mass Spectrometry
CalNex Data Analysis Workshop, May 16th – 19th 2011, Sacramento
Patrick L. Hayes1,2, Amber M. Ortega1,3, Michael J. Cubison1,2, Weiwei Hu4, Darin W. Toohey3, James H. Flynn5, Barry L. Lefer5, Sergio Alvarez5, Bernhard Rappenglück5, James D. Allan6, John S. Holloway1,7, Jessica B.
Gilman1,7, William C. Kuster7, Joost A. de Gouw1,7, Paola Massoli8, Xiaolu Zhang9, Rodney J. Weber9, Ashley Corrigan10, Lynn M. Russell10, Jose L. Jimenez1,2
(1) CIRES, Boulder, USA; (2) Department of Chemistry and Biochemistry, University of Colorado, Boulder, USA; (3) Department of Atmospheric and Oceanic Science, University of Colorado, Boulder, USA; (4) College of Environmental Sciences and Engineering, Peking University, China; (5) Department of Earth and Atmospheric Sciences, University of Houston, USA; (6) National Centre for Atmospheric Science, The University of Manchester, UK; (7) NOAA, Boulder, USA; (8) Aerodyne Research Inc., Billerica, USA; (9) Georgia Institute of Technology, Atlanta, USA; (10) Scripps Institution of Oceanography, University of
California San Diego, La Jolla, USA.

20
15
10
5
0
Mas
s C
once
ntra
tion
(µg/
m3 )
5/21/2010 5/31/2010 6/10/2010Date and Time (PDT)
BC Org NO3
SO4
NH4
Chl
Chemical Composition of PM1 Aerosols for Pasadena
• Build up of organic aerosol concentrations over a period of several days. Residual organic aerosols and precursor species in the Pasadena area appear to undergo multiple days of aging.
0.76
6.8
3.8
2.7
2.2
0.11
Organic
Nitrate
Sulfate
AmmoniumBlack CarbonChloride

Chemical Composition of Non-Refractory PM1 Aerosols for Pasadena
Diurnal Average (6/3 – 6/9):
16
14
12
10
8
6
4
2
0
Mas
s C
once
ntra
tion
(g/
m3 )
24201612840Diurnal Hour (PDT)
x20
Org NO3 SO4 NH4 Chl
• Organic diurnal trend consistent with transport times from source-rich western basin and the expected timescale of secondary production.
• Nitrate diurnal trend influenced by dilution due to rising planetary boundary layer and evaporation of ammonium nitrate.

Positive Matrix Factorization (PMF): Time Series & Mass Spectra
50
5/16/2010 5/21/2010 5/26/2010 5/31/2010 6/5/2010 6/10/2010 6/15/2010
Date and Time (PDT)
100
100
Mas
s C
once
ntr
atio
n (µ
g m
-3)
420
2.5
0.0
(LV-OOA)
(SV-OOA)
(LOA)
(HOA-ND)
(HOA-D)
PMF Background: Ulbrich et al. Atmos. Chem. Phys. 2009, 9, 2891.
Diesel Hydrocarbon-like Organic Aerosol (HOA-D)
Non-Diesel Hydrocarbon-like Organic Aerosol (HOA-ND)
Semi-Volatile OxygenatedOrganic Aerosol (SV-OOA)
Low-Volatility Oxygenated Organic Aerosol (LV-OOA)
Local Organic Aerosol(LOA)

Positive Matrix Factorization (PMF): Time Series & Mass Spectra
50
5/16/2010 5/21/2010 5/26/2010 5/31/2010 6/5/2010 6/10/2010 6/15/2010
Date and Time (PDT)
100
100
Mas
s C
once
ntr
atio
n (µ
g m
-3)
420
2.5
0.0
(LV-OOA)
(SV-OOA)
(LOA)
(HOA-ND)
(HOA-D)
PMF Background: Ulbrich et al. Atmos. Chem. Phys. 2009, 9, 2891.
0.10
0.00
10080604020m/z
0.2
0.0
8040
0x10
-3
0.10
0.00 Fra
ctio
n of
Sig
nal
8040
0x10
-3
OM:OC=2.2, O:C=0.80, H:C=1.2, N:C=0.012
OM:OC=1.4, O:C=0.21, H:C=1.6, N:C=0.004
OM:OC=1.6, O:C=0.38, H:C=1.4, N:C=0.004
OM:OC=1.3, O:C=0.14, H:C=1.6, N:C=0.010
OM:OC=1.6, O:C=0.31, H:C=1.7, N:C=0.052
Cx
CHCHO1
CHO1+
CHNCHO1NCHON1+
CSHOAir
Diesel Hydrocarbon-like Organic Aerosol (HOA-D)
Non-Diesel Hydrocarbon-like Organic Aerosol (HOA-ND)
Semi-Volatile OxygenatedOrganic Aerosol (SV-OOA)
Low-Volatility Oxygenated Organic Aerosol (LV-OOA)
Local Organic Aerosol(LOA)

0.10
0.00
10080604020m/z
0.2
0.0
8040
0x10
-3
0.10
0.00 Fra
ctio
n of
Sig
nal
8040
0x10
-3
OM:OC=2.2, O:C=0.80, H:C=1.2, N:C=0.012
OM:OC=1.4, O:C=0.21, H:C=1.6, N:C=0.004
OM:OC=1.6, O:C=0.38, H:C=1.4, N:C=0.004
OM:OC=1.3, O:C=0.14, H:C=1.6, N:C=0.010
OM:OC=1.6, O:C=0.31, H:C=1.7, N:C=0.052
Cx
CHCHO1
CHO1+
CHNCHO1NCHON1+
CSHOAir
Diesel Hydrocarbon-like Organic Aerosol (HOA-D)
Non-Diesel Hydrocarbon-like Organic Aerosol (HOA-ND)
Semi-Volatile OxygenatedOrganic Aerosol (SV-OOA)
Low-Volatility Oxygenated Organic Aerosol (LV-OOA)
Local Organic Aerosol(LOA)
Positive Matrix Factorization (PMF): Time Series & Mass Spectra
6
4
2
0Mas
s C
once
ntra
tion
(µg
m-3
)
24201612840Diurnal Hour (PDT)
HOA-D HOA-ND LOA SVOOA LVOOA

Ox(O3 + NO2) vs OOA
• Slope of OOA vs. Ox plot is steeper for Pasadena in comparison to Riverside (SOAR-1). • The OOA vs. Ox slope is similar to that found in Mexico City for less aged aerosol (MILAGRO).
20
15
10
5
Tot
al O
OA
Mas
s C
once
ntra
tion
(µg
m-3
)
6/3/2010 6/9/2010
Date and Time (PDT)
100
80
60
40
Ox (ppbv)
Ox OOA
Reference for OOA vs. Ox plots:Herndon et al. Geophys. Res. Lett. 2008, 35, L15804.Wood et al. Atmos. Chem. Phys. 2010, 10, 8947.
20
15
10
5
0
Tot
al O
OA
Mas
s C
once
ntra
tion
(µg
m-3
)
120100806040200
Ox (ppbv)
Linear ODR FitSlope = 0.151
R2 = 0.78
12:00 AM
6:00 AM
12:00 PM
6:00 PM
12:00 AM
Tim
e o
f Da
y (PD
T)

Comparison of HOA Components with Combustion Emission Tracers
1000
800
600BC
(ng
m-3
)
12:00 AM 6:00 AM 12:00 PM 6:00 PM 12:00 AM
Diurnal Hour (PDT)
340
320
300
280
260
CO
(p
pbv,
NO
AA
)0.750.700.650.600.550.500.45T
olue
ne (
ppbv
)
2.5
2.0
1.5
1.0
0.5
0.0
Mas
s C
onc.
(µg
m-3
)0.32
0.30
0.28
0.26
0.24
0.22
Benzene (ppbv)
700
600
500
400
EC
(ng m-3)
340
320
300
280
260
CO
(ppbv, U
niv. Hou.)
Toluene (NOAA) Benzene (NOAA) CO (NOAA) CO (Univ. Hou.) BC (Manchester Aeth) EC (GA Tech.) HOA-D HOA-ND
Gasoline Dominated
Diesel Dominated
More-Diesel Influenced
Less-Diesel Influenced

Taken from: Zhang et al. Geophys. Res. Lett. 2007, 34, L13801
Positive Matrix Factorization (PMF): Time Series & Campaign Averages
33%
34%
17%
12%
5%
LV-OOA
SV-OOA
HOA-D
HOA-NDLOA
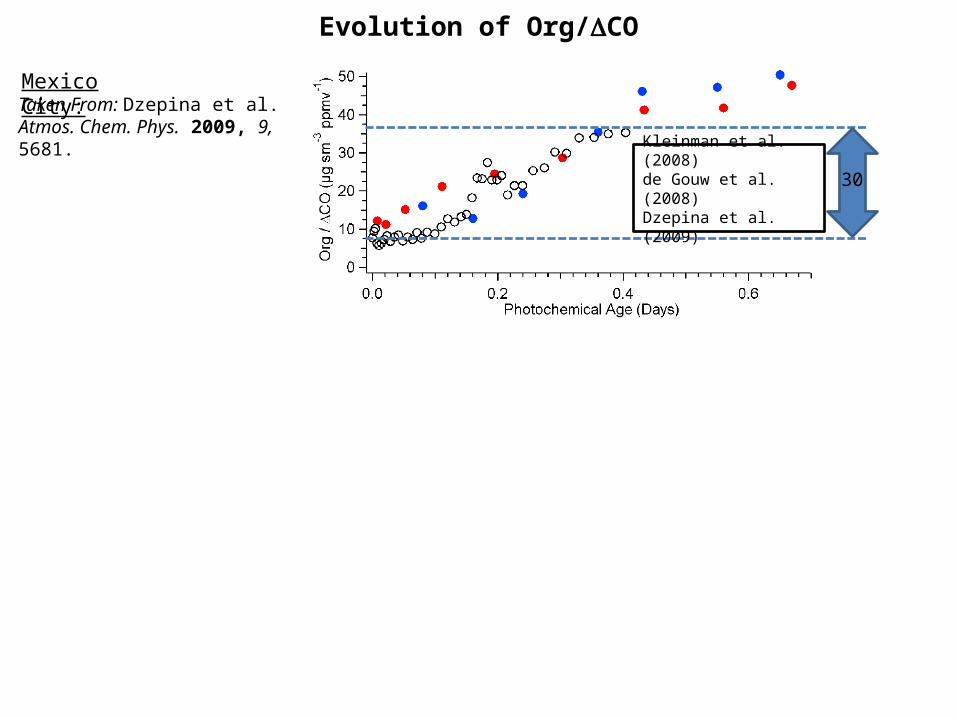
Evolution of Org/DCO
30
Taken From: Dzepina et al. Atmos. Chem. Phys. 2009, 9, 5681.
Mexico City:
Kleinman et al. (2008)de Gouw et al. (2008)Dzepina et al. (2009)

Evolution of Org/DCO
30
Taken From: Dzepina et al. Atmos. Chem. Phys. 2009, 9, 5681.
Mexico City:
Pasadena:For 6/2 -6/6
80
60
40
20
0Org
/C
O (
µg
m-3
ppm
v-1)
00:00 06:00 12:00 18:00 00:00Diurnal Hour (PDT)
Univ. of Hou. CONOAA CO
30
HOA
SOA from previous day?
Kleinman et al. (2008)de Gouw et al. (2008)Dzepina et al. (2009)

Organic Aerosol Elemental Composition from High Resolution AMS data
HR-ToF-AMS Elemental Analysis Background: Aiken et al. Anal. Chem. 2007, 79, 8350.
0.48
0.46
0.44
0.42
0.40
0.38
O:C
20151050Diurnal Hour (PDT)
1.50
1.48
1.46
1.44
1.42
1.40
H:C
1.80
1.78
1.76
1.74
1.72
1.70
1.68
1.66
1.64
OM
:OC
O:C mean H:C mean OM:OC mean

The Van Krevelen Diagram, Pasadena vs. Riverside
Reference for Van Krevelen Diagrams:Heald et al. Geophys. Res. Lett. 2010, 37, L08803.
• A shallower slope significantly less than -1 for Pasadena could be due to a greater tendency for alcohol addition, or C-C bond breaking (fragmentation) reactions during aerosol aging. Alternatively, slope may be due to different mixing of primary and secondary organic aerosol components.
2.0
1.8
1.6
1.4
1.2
1.0
H:C
1.00.80.60.40.20.0
O:C
Avg. CalNex Avg. SOAR
R2 = 0.83
slope = -0.64 Linear ODR Fit (CalNex)
Pasadena, CA (CalNex)Riverside, CA (SOAR)

The Van Krevelen Diagram, Pasadena vs. Riverside
Reference for Van Krevelen Diagrams:Heald et al. Geophys. Res. Lett. 2010, 37, L08803.
• A shallower slope significantly less than -1 for Pasadena could be due to a greater tendency for alcohol addition, or C-C bond breaking (fragmentation) reactions during aerosol aging. Alternatively, slope may be due to different mixing of primary and secondary organic aerosol components.
2.0
1.8
1.6
1.4
1.2
1.0
H:C
1.00.80.60.40.20.0
O:C
HOA-D HOA-ND LOA SV-OOA LV-OOA Avg. CalNex Avg. SOAR
R2 = 0.83
slope = -0.64 Linear ODR Fit (CalNex)
Pasadena, CA (CalNex)Riverside, CA (SOAR)

Thermodenuder + AMS and Volatility Distributions
1.20.80.40.0M
ass
Con
c. (
µg
m-3
)
10
-9 -8 -7 -6 -5 -4 -3 -2 -1 0 1 2 3Log C*
Particle Phase Total
Total OA:
0.300.200.100.00M
ass
Con
c. (
µg
m-3
)
-9 -8 -7 -6 -5 -4 -3 -2 -1 0 1 2 3Log C*
1
100 Particle Phase Total
POA (using C4H9 as surrogate):
Method From: Faulhaber et al. Atmos. Meas. Tech. 2009, 2, 15.
1.0
0.8
0.6
0.4
0.2
0.0
Mas
s F
ract
ion
Rem
aini
ng
(MF
R)
250200150100500TD Temperature (
oC)
C4H9 (Riverside, SOAR) C4H9 (Pasadena, CalNex)
1.0
0.8
0.6
0.4
0.2
0.0
Mas
s F
ract
ion
Rem
aini
ng
(MF
R)
250200150100500TD Temperature (
oC)
OA (Riverside, SOAR) OA (Pasadena, CalNex)

Acknowledgements
Funding:
CalNex Pasadena Ground-Site Team&
CalNex Scientific Community

Back-Up

2.0
1.8
1.6
1.4
1.2
1.0
H:C
1.00.80.60.40.20.0
O:C
Pasadena HOA-D HOA-ND LOA SV-OOA LV-OOA Avg. CalNex Avg. SOAR
Riverside LOA LV-OOA SV-OOA
R2 = 0.83
slope = -0.64 Linear ODR Fit (CalNex)
Pasadena, CA (CalNex)Riverside, CA (SOAR)

HOA-D vs. Black Carbon, ‘HOA-D + HOA-ND’ vs. CO(g)
Slope = 1.25
Slope = 1.41
Mexico City
Slope = 5.71
Slope = 3.33
MeMexico City
6
5
4
3
2
1
0
HO
A-D
Mas
s C
onc.
(µ
g m
-3)
3.02.01.00.0
BC Mass Concentration (µg m-3
)
Linear ODR Fit
Slope = 1.31, R2=0.49
16
12
8
4
0
'HO
A-D
' + 'H
OA
-ND
' Con
c. (
µg
m-3
)
0.60.40.20.0CO (ppmv)
Linear FitSlope=10.2
R2=0.49
8
6
4
2
0
Tot
al L
V-O
OA
Mas
s C
onc.
(µ
g m
-3)
120100806040200
Ox (ppbv)
12:00 AM 12:00 AMTime of Day (PDT)
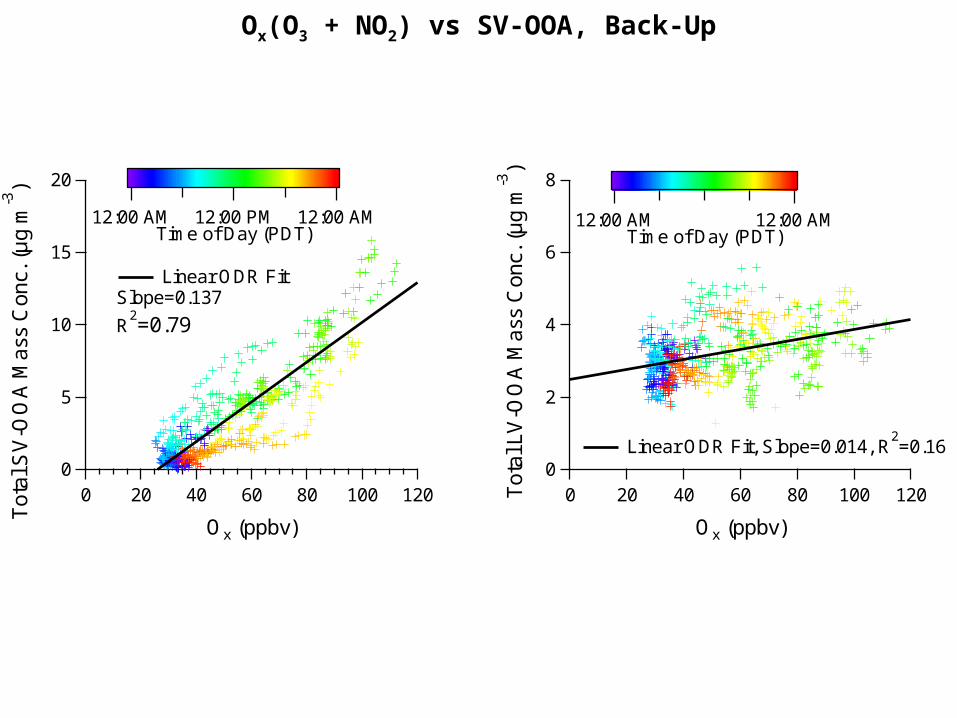
Linear ODR Fit, Slope=0.014, R2=0.16
20
15
10
5
0
Tot
al S
V-O
OA
Mas
s C
onc.
(µ
g m
-3)
120100806040200
Ox (ppbv)
Linear ODR FitSlope=0.137
R2=0.79
12:00 AM 12:00 PM 12:00 AMTime of Day (PDT)
Ox(O3 + NO2) vs SV-OOA, Back-Up

0.30
0.25
0.20
0.15
0.10
0.05
0.00
f 44
0.200.150.100.050.00
f43
Pasadena, CA(CalNex)
Riverside, CA (SOAR)
HOA-DHOA-NDSV-OOALV-OOA Avg. SOAR Avg. CalNex
f44 vs. f43 plot (with PMF Results)

60
50
40
30
20
10
0
Mas
s C
onc.
(µ
g/m
3)
5/21/2010 5/31/2010 6/10/2010
Date and Time (PDT)
SMPS UHSAS AMS + BC
AMS Comparison with SMPS, UHSAS (Part 1)
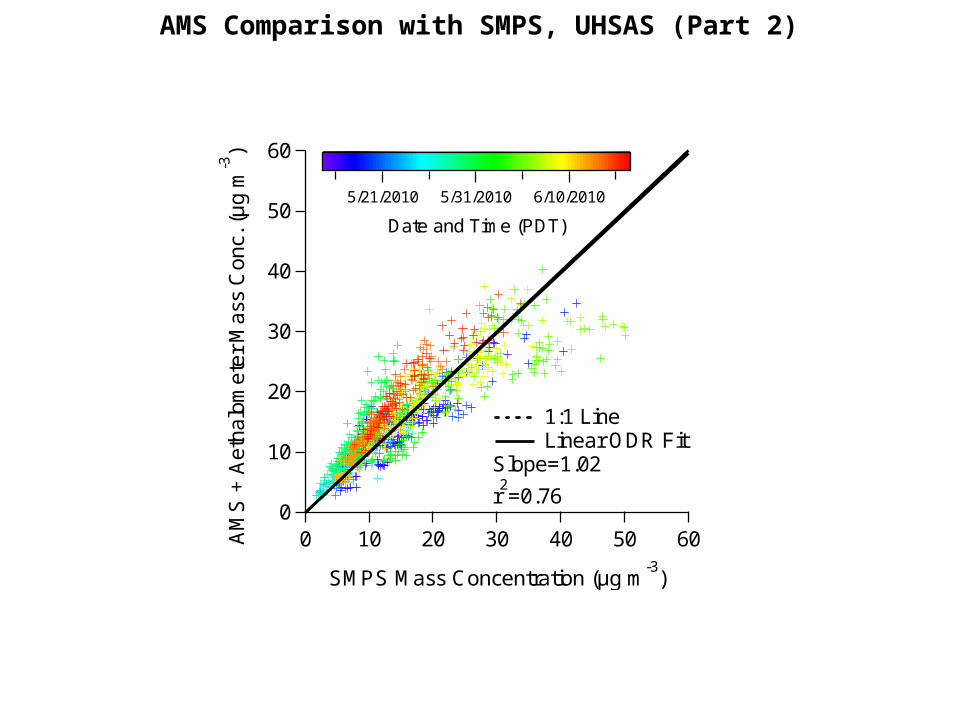
AMS Comparison with SMPS, UHSAS (Part 2)
60
50
40
30
20
10
0
AM
S +
Aet
halo
met
er M
ass
Con
c. (
µg
m-3
)
6050403020100
SMPS Mass Concentration (µg m-3
)
1:1 Line Linear ODR Fit
Slope=1.02
r2=0.76
5/21/2010 5/31/2010 6/10/2010
Date and Time (PDT)

60
50
40
30
20
10
0
AM
S +
Aet
halo
met
er M
ass
Con
c. (
µg
m-3
)
6050403020100
UHSAS Mass Concentration (µg m-3
)
1:1 Line Linear ODR Fit
Slope=0.99
r2=0.73
5/21/2010 5/31/2010 6/10/2010
Date and Time (PDT)
AMS Comparison with SMPS, UHSAS (Part 3)
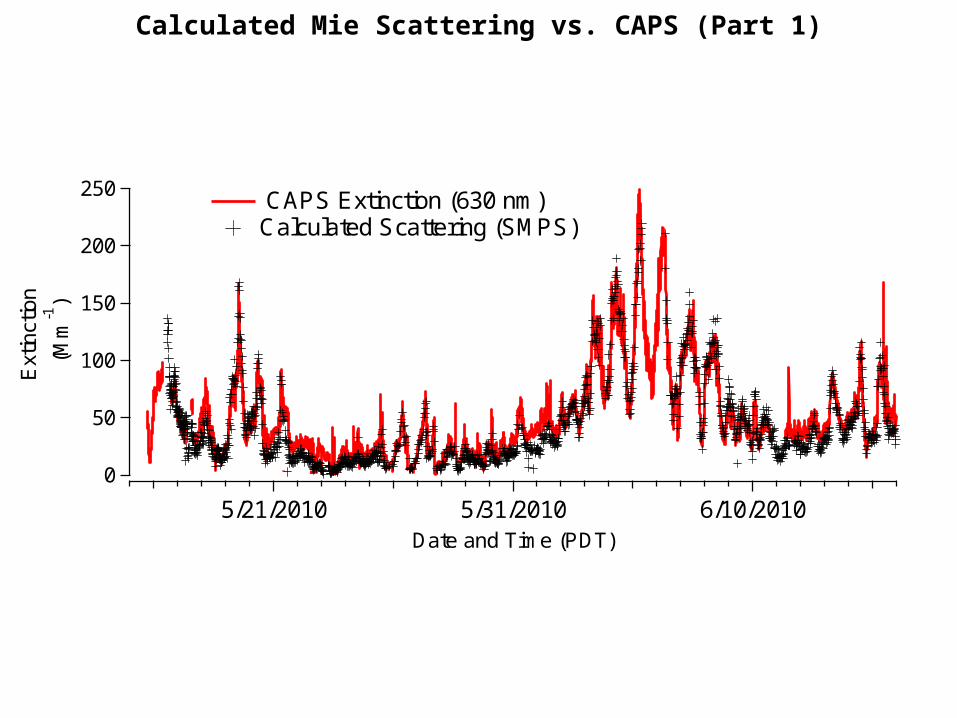
Calculated Mie Scattering vs. CAPS (Part 1)
250
200
150
100
50
0
Ext
inct
ion
(Mm
-1)
5/21/2010 5/31/2010 6/10/2010Date and Time (PDT)
CAPS Extinction (630 nm)Calculated Scattering (SMPS)

250
200
150
100
50
0
Cal
c. M
ie S
catte
ring
[Mm
-1]
250200150100500
CAPS Extinction [Mm-1
]
Linear FitSlope=1.01
r2= 0.88
Calculated Mie Scattering vs. CAPS (Part 2)
30
25
20
15
10
5
0
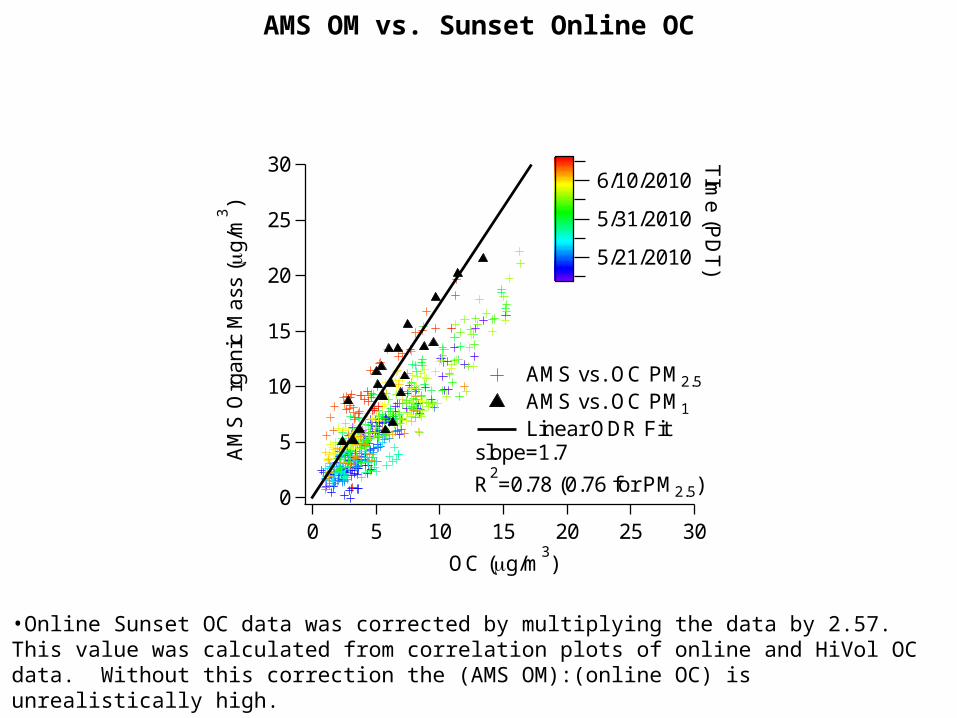
AM
S O
rgan
ic M
ass
(g/
m3)
302520151050
OC (g/m3)
AMS vs. OC PM2.5
AMS vs. OC PM1
Linear ODR Fitslope=1.7
R2=0.78 (0.76 for PM2.5)
5/21/2010
5/31/2010
6/10/2010
TIm
e (PD
T)
AMS OM vs. Sunset Online OC
•Online Sunset OC data was corrected by multiplying the data by 2.57. This value was calculated from correlation plots of online and HiVol OC data. Without this correction the (AMS OM):(online OC) is unrealistically high.
30
25
20
15
10
5
0
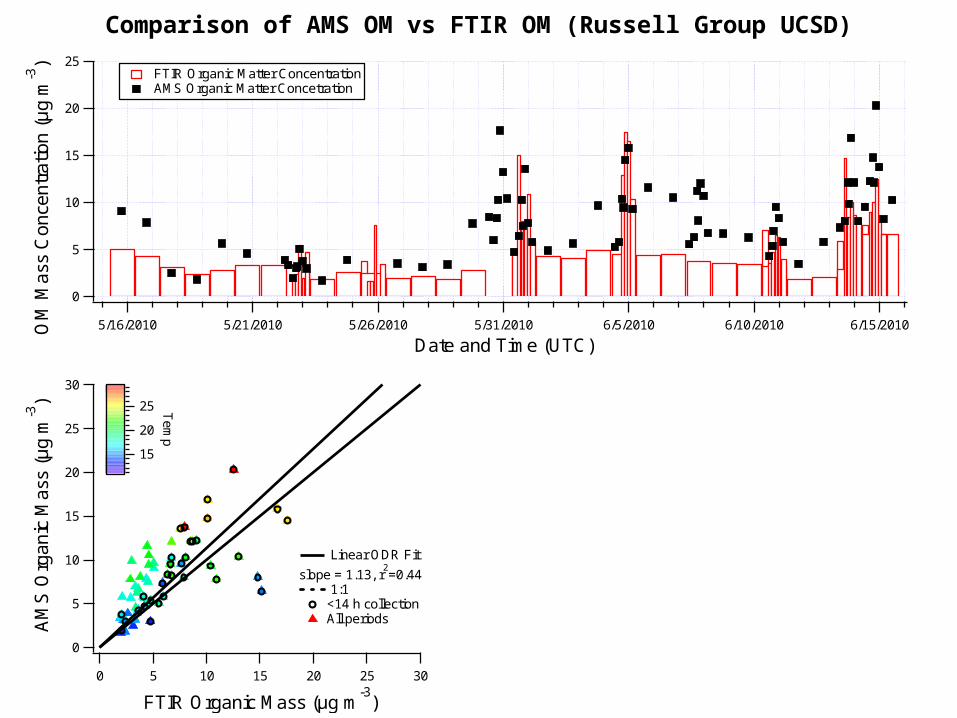
AM
S O
rgan
ic M
ass
(µg
m-3
)
302520151050
FTIR Organic Mass (µg m-3
)
Linear ODR Fit
slope = 1.13, r2=0.44
1:1<14 h collection All periods
25
20
15
Tem
p
25
20
15
10
5
0
OM
Mas
s C
once
ntra
tion
(µg
m-3
)
5/16/2010 5/21/2010 5/26/2010 5/31/2010 6/5/2010 6/10/2010 6/15/2010
Date and Time (UTC)
FTIR Organic Matter Concentration AMS Organic Matter Concetration
Comparison of AMS OM vs FTIR OM (Russell Group UCSD)

30
25
20
15
10
5
0
Ma
ss C
onc
ent
ratio
n (
µg
m-3
)
5/16/2010 5/21/2010 5/26/2010 5/31/2010 6/5/2010 6/10/2010 6/15/2010Date and Time (UTC)
AMS (Univ. CO) TAG-AMS (Aerodyne)
30
25
20
15
10
5
0
TA
G-A
MS
Org
Mas
s C
onc.
(µ
g m
-3)
302520151050
CU AMS Org Mass Conc. (µg m-3
)
Org 1:1 Linear ODR Fit
slope = 1.19
r2 = 0.89
5/21/2010
5/26/2010
5/31/2010
6/5/2010
6/10/2010
6/15/2010
Da
te and T
ime (U
TC
)
Comparison Plots: TAG-AMS OM (Aerodyne) vs. AMS OM (Univ. CO.)

Comparison Weekday vs. Sunday – HOA Components & Tracers
References on Weekday/Weekend Effect in LA-area: Millstein et al. Atmos. Environ. 2008, 42, 632. Marr et al. Atmos. Environ. 2002, 36, 2327.
2.0 2.0
1.5 1.5
1.0 1.0
0.5 0.5
0.0 0.0HO
A-D
(µ
g m
-3)
00:00 12:00
Weekday (PDT)
00:00 12:00 00:00
Sunday (PDT)
360 360
320 320
280 280
240 240CO
(pp
bv)
1000 1000
800 800
600 600
400 400BC
(ng
m-3
)
3.0 3.0
2.0 2.0
1.0 1.0
0.0 0.0
HO
A-N
D (
µg
m-3
)
Solid – MeanDashed – Median
Related Documents