Aerosol characteristics of air masses in northern Europe: Influences of location, transport, sinks, and sources P. Tunved, E. D. Nilsson, H.-C. Hansson, and J. Stro ¨m Department of Applied Environmental Science, Stockholm University, Stockholm, Sweden M. Kulmala and P. Aalto Department of Physics, University of Helsinki, Helsinki, Finland Y. Viisanen Finnish Meteorological Institute, Helsinki, Finland Received 2 June 2004; revised 2 December 2004; accepted 4 January 2005; published 2 April 2005. [1] Synoptic-scale air masses at different stations were classified following a definition based on Berliner Wetterkarte. This air mass classification has been related to 1 year of aerosol number size distributions measurements performed at four different stations extending from Aspvreten in Sweden (58.8°N) to Pallas in northern Finland (68°N). The air mass classification describes both class of air mass, based on the origin of the air mass, and character of air in terms of marine, mixed, and continental air masses. The aerosol size distribution properties were evaluated in relation to the air masses. Emphasis was put on the differences between marine, mixed, and continental character air masses. It is shown that continental air masses exceed marine and mixed character air masses both in number and mass concentration. Different classes of air masses were further associated with different aerosol size distribution properties. It is also shown that although serving as a somewhat good qualifier for the aerosol at individual stations, the air mass classification cannot be used to estimate the aerosol burden over large geographical areas. Instead, a sharp gradient was shown to exist between different stations, although aerosol properties were observed in equal air masses according to the definition by Berliner Wetterkarte. This gradient manifests as a south-northerly decrease in aerosol total number and volume, indicating that the aerosol properties including the aerosol size distribution are less conservative than the thermodynamic properties (e.g., pseudo- potential temperature and humidity profiles) that characterize the different air masses. Further, using a pseudo-Lagrangian approach, the aerosol turnover time was estimated for different sized aerosols in air moving from south to north (i.e., depletion of aerosols in air arriving from the continent). Turnover time of Aitken particles was found to be in the range of 1–2 days, while accumulation mode turnover time was estimated to be in the order of 2–3 days. Citation: Tunved, P., E. D. Nilsson, H.-C. Hansson, J. Stro ¨m, M. Kulmala, P. Aalto, and Y. Viisanen (2005), Aerosol characteristics of air masses in northern Europe: Influences of location, transport, sinks, and sources, J. Geophys. Res., 110, D07201, doi:10.1029/2004JD005085. 1. Introduction [2] The direct and the indirect climate effects of the atmospheric aerosols constitute the largest uncertainty in our present understanding of the anthropogenic climate forcing [Intergovernmental Panel on Climate Change (IPCC), 2001]. The climatic effects are based on the backscatter and absorption of light by the aerosol (direct effect), and the activation of aerosol particles to form cloud drops (indirect effect). More aerosols in the atmosphere may lead to optically denser clouds [Twomey , 1974]. [3] The potential of aerosols to contribute to a negative forcing are dependent on the properties of the particles: size distribution, chemical composition, and degree of internal and external mixing. Direct and the indirect climate effects of the atmospheric aerosols constitute the largest uncertainty in our present understanding of the anthropogenic climate forcing. It is essential to reduce the uncertainty in the aerosol climate forcing to make better prognoses of future climate change. This may be done by improving the representation of aerosol properties in climate models. Since the variability of the continental aerosol is very large, it is useful to associate variations in aerosol concentration and size distri- bution with quantities applicable over large areas. Therefore parameterization of aerosol properties in terms of different JOURNAL OF GEOPHYSICAL RESEARCH, VOL. 110, D07201, doi:10.1029/2004JD005085, 2005 Copyright 2005 by the American Geophysical Union. 0148-0227/05/2004JD005085$09.00 D07201 1 of 13

Welcome message from author
This document is posted to help you gain knowledge. Please leave a comment to let me know what you think about it! Share it to your friends and learn new things together.
Transcript
Aerosol characteristics of air masses in northern Europe: Influences of
location, transport, sinks, and sources
P. Tunved, E. D. Nilsson, H.-C. Hansson, and J. StromDepartment of Applied Environmental Science, Stockholm University, Stockholm, Sweden
M. Kulmala and P. AaltoDepartment of Physics, University of Helsinki, Helsinki, Finland
Y. ViisanenFinnish Meteorological Institute, Helsinki, Finland
Received 2 June 2004; revised 2 December 2004; accepted 4 January 2005; published 2 April 2005.
[1] Synoptic-scale air masses at different stations were classified following a definitionbased on Berliner Wetterkarte. This air mass classification has been related to 1 year ofaerosol number size distributions measurements performed at four different stationsextending from Aspvreten in Sweden (58.8�N) to Pallas in northern Finland (68�N). Theair mass classification describes both class of air mass, based on the origin of the airmass, and character of air in terms of marine, mixed, and continental air masses. Theaerosol size distribution properties were evaluated in relation to the air masses. Emphasiswas put on the differences between marine, mixed, and continental character air masses.It is shown that continental air masses exceed marine and mixed character air massesboth in number and mass concentration. Different classes of air masses were furtherassociated with different aerosol size distribution properties. It is also shown that althoughserving as a somewhat good qualifier for the aerosol at individual stations, the air massclassification cannot be used to estimate the aerosol burden over large geographicalareas. Instead, a sharp gradient was shown to exist between different stations, althoughaerosol properties were observed in equal air masses according to the definition byBerliner Wetterkarte. This gradient manifests as a south-northerly decrease in aerosol totalnumber and volume, indicating that the aerosol properties including the aerosol sizedistribution are less conservative than the thermodynamic properties (e.g., pseudo-potential temperature and humidity profiles) that characterize the different air masses.Further, using a pseudo-Lagrangian approach, the aerosol turnover time was estimatedfor different sized aerosols in air moving from south to north (i.e., depletion ofaerosols in air arriving from the continent). Turnover time of Aitken particles was found tobe in the range of 1–2 days, while accumulation mode turnover time was estimated to bein the order of 2–3 days.
Citation: Tunved, P., E. D. Nilsson, H.-C. Hansson, J. Strom, M. Kulmala, P. Aalto, and Y. Viisanen (2005), Aerosol characteristics
of air masses in northern Europe: Influences of location, transport, sinks, and sources, J. Geophys. Res., 110, D07201,
doi:10.1029/2004JD005085.
1. Introduction
[2] The direct and the indirect climate effects of theatmospheric aerosols constitute the largest uncertainty inour present understanding of the anthropogenic climateforcing [Intergovernmental Panel on Climate Change(IPCC), 2001]. The climatic effects are based on thebackscatter and absorption of light by the aerosol (directeffect), and the activation of aerosol particles to form clouddrops (indirect effect). More aerosols in the atmosphere maylead to optically denser clouds [Twomey, 1974].
[3] The potential of aerosols to contribute to a negativeforcing are dependent on the properties of the particles: sizedistribution, chemical composition, and degree of internaland external mixing. Direct and the indirect climate effectsof the atmospheric aerosols constitute the largest uncertaintyin our present understanding of the anthropogenic climateforcing. It is essential to reduce the uncertainty in the aerosolclimate forcing to make better prognoses of future climatechange. This may be done by improving the representationof aerosol properties in climate models. Since the variabilityof the continental aerosol is very large, it is useful toassociate variations in aerosol concentration and size distri-bution with quantities applicable over large areas. Thereforeparameterization of aerosol properties in terms of different
JOURNAL OF GEOPHYSICAL RESEARCH, VOL. 110, D07201, doi:10.1029/2004JD005085, 2005
Copyright 2005 by the American Geophysical Union.0148-0227/05/2004JD005085$09.00
D07201 1 of 13
air masses may offer an efficient alternative to geographicalconstant aerosol fields commonly used in climate models. Itmay also be applicable for initialization of models with moredetailed aerosol schemes and for validation of model results.
[4] Works by Birmili et al. [2001] did show that theobserved aerosol physical properties (i.e., the size distribu-tion) were resolved differently in different types of airmasses. These investigations were performed near Melpitz(51.19�N, 12.34�E, 86 m a.s.l.), comprising approximatelyone and a half year of size distribution data. When inves-tigating the effect of air mass changes on aerosol properties,the authors found that modal diameters as well as modalnumber concentration were related to air mass origin andcharacter. Especially, air masses of continental characterwere associated with an aerosol biased toward larger sizescompared with maritime air masses. However, one impor-tant question remained unanswered, namely if and to whatextent this relation was applicable to larger geographicalareas. With a set of four stations, we investigate howconservative the aerosol properties are within the same typeof air mass at different geographical location in the Nordiccountries.
2. Methods
2.1. Measurement Technique and Data Analysis
[5] Aerosol dry size distributions from <10 nm up to�500 nm have been measured at four stations in Finlandand Sweden with similar setup of Differential MobilityParticle Sizer (DMPS) using conventional electrical mobil-ity analysis as described by Knutson and Whitby [1975].The aerosol is separated according to electromobility in adifferential mobility analyzer (DMA). The mobility distri-
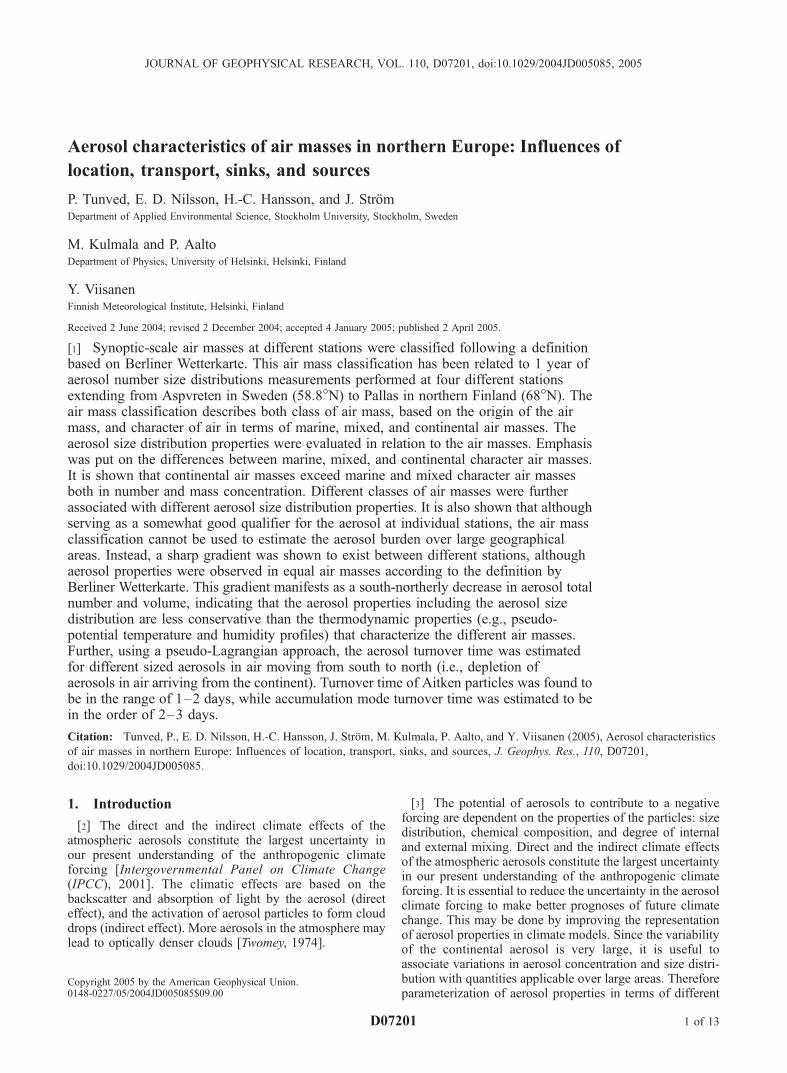
Figure 1. Location of the stations contributing to thisinvestigation.
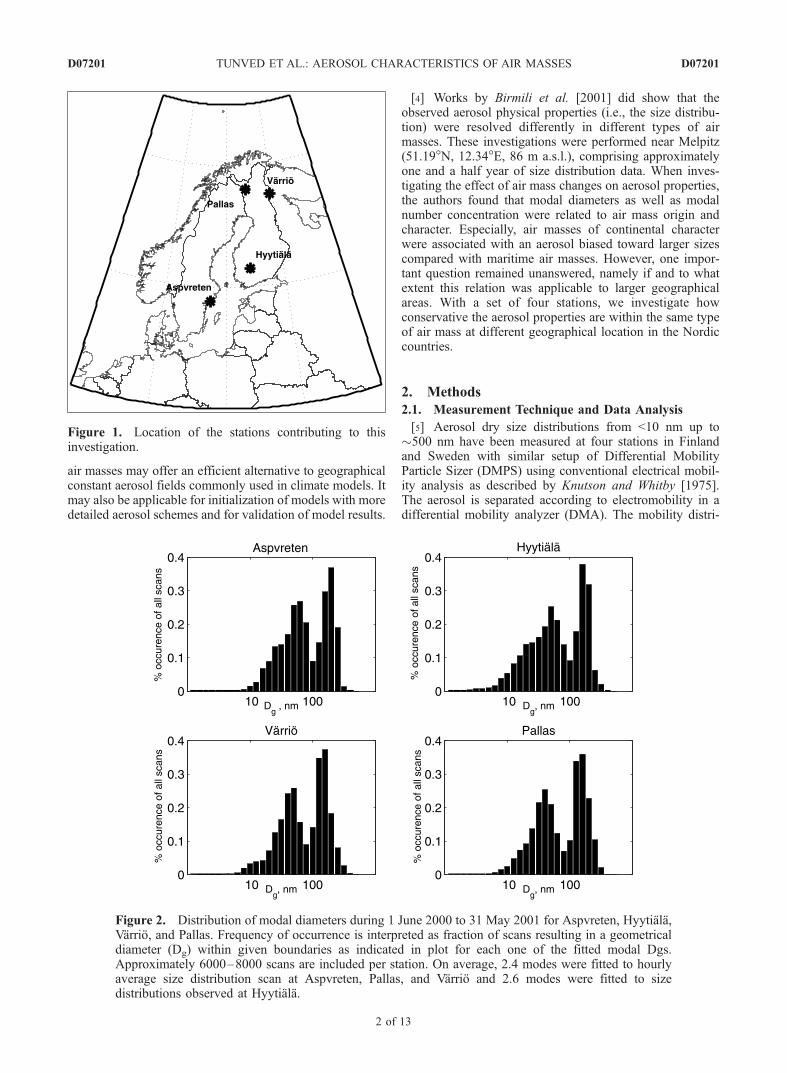
Figure 2. Distribution of modal diameters during 1 June 2000 to 31 May 2001 for Aspvreten, Hyytiala,Varrio, and Pallas. Frequency of occurrence is interpreted as fraction of scans resulting in a geometricaldiameter (Dg) within given boundaries as indicated in plot for each one of the fitted modal Dgs.Approximately 6000–8000 scans are included per station. On average, 2.4 modes were fitted to hourlyaverage size distribution scan at Aspvreten, Pallas, and Varrio and 2.6 modes were fitted to sizedistributions observed at Hyytiala.
D07201 TUNVED ET AL.: AEROSOL CHARACTERISTICS OF AIR MASSES
2 of 13
D07201
bution is inverted to a size distribution assuming a Fuchs-Boltzmann charge distribution from the neutralizer. Afterselection, the aerosol is detected and counted with acondensation particle counter (CPC).[6] The stations involved in this study are Hyytiala
(61.51�N 24.17�E, 180 m a.s.l.) situated in a boreal forestin Finland [e.g., Makela et al., 2000; Nilsson et al., 2001a,2001b; Kulmala et al., 1998, 2001], Varrio (67.46�N29.35�E, 400 m a.s.l.) located in Finnish Lapland [e.g.,Kulmala et al., 2000], and the Matorova station at Pallas(68.00�N 24.14�E, 340 m a.s.l.). Sweden is represented byAspvreten (58.8�N, 17.4�E, 25 m a.s.l.) [Tunved et al.,2003]. A more detailed description of the instrument setupand stations involved in this network is given by Tunved etal. [2003]. The geographical distribution of stations isdepicted in Figure 1. The aerosol size distribution data atHyytiala, Varrio, and Aspvreten cover observations duringthe course of 1 year, ranging from 1 June 2000 to 31 May2001 with some minor gaps due to measurement failure.The Pallas data set include observations from the beginningof August 2000 to late May 2001. Observations of aerosolsize distributions are made on the timescale of minutes at allfour stations. In the analysis, however, the data are treatedas 1-hour averages.
2.2. Lognormal Assumption
[7] With use of relatively simple equations the aerosolsize distribution can be interpreted and described by alimited number of well-defined parameters, i.e., the lognor-mal aerosol size distribution [Whitby, 1978; Hoppel et al.,1994]. With this approach the aerosol is assumed to appearin different modes. The aerosol has been interpreted by amaximum of four modes. All DMPS data collected at thestations have been fitted as 1-hour averages. The data werefitted using initially manually selected modal geometricaldiameters (Dg). These manually selected values are, how-ever, not fixed, but allowed to vary slightly (±10%) in orderto result in the best possible fit. From the approximatelocation of the modal diameters, number concentration andgeometrical standard deviation (GSD) have been evaluatedwith a Matlab1 routine involving the FMINCON function,performing fit constrained by the selected Dgs. During thefitting procedure, the manually selected best guesses ofmodal Dgs are allowed to vary (±10%) in order to resultin the best possible fit.[8] The possible mathematical solutions to the size dis-
tributions equation are basically infinite. This means that asemi-objective method is necessary in order to supply usefulresults. A pure mathematical, non-constrained approach wastested, but found to be not sufficiently good for the purposesof this investigation. One should further bear in mind thatthe parameterization of the aerosol size distribution is basedon assumptions concerning the lifecycle of the aerosol.From this point of view it is necessary to constrain theanalysis following these assumptions.
[9] The data set provided approximately 6000–8000hourly average size distribution scans that were fittedindividually for each station. Figure 2 describes thefrequency distribution of the modal diameters derivedfrom the fitting. As can be seen from Figure 2 theaerosol mainly distributes in two size ranges, namelyAitken (�20–100 nm) and accumulation mode sizerange (�100–500 nm). On average, 2.4 modes werefitted to each distribution. A lower portion of scans areassociated with fitted modes in the nuclei mode sizerange (<20 nm). Further, the location of these modesdiffers when comparing Aspvreten and Hyytiala withPallas and Varrio.[10] Although the aerosol was mainly resolved with one
mode in Aitken size range and one mode in accumulationsize range, some occasions required the fitting of two modesto the accumulation size range in order to capture thefeatures of some special occasions. The data are thusinterpreted in terms of nuclei mode, Aitken mode, andaccumulation mode 1 and 2. The origin of this secondaccumulation mode is uncertain, but could be related toeither cloud processing of the aerosol or direct emissions ofparticles in this size range (e.g., sea spray).
2.3. Air Masses and Trajectories
[11] Berliner Wetterkarte [Institute fur Meteorologie,1997] provides a classification scheme for air masses on adaily basis at 0000 UTC. The classification is based on backtrajectories. Further, each type of air mass is associated withtypical thermodynamical properties. The air mass may becharacterized by class and character. On the basis of thisdefinition the air masses are divided in Arctic (A), sub-Polar(P) and heated sub-Polar (Ps), Subtropical (S), middlelatitude (Sp), and tropical air mass classes (T) (Table 1).[12] Each type of air mass can be regarded as transform-
able into one other, reflecting the influence from sea orcontinents on energy content (heat and water vapor), butalso on trace gases and suspended particulate matter. Thusthe air mass is not only defined from its origin but also fromthe extent of continental/marine influence. In this mannereach air mass may be characterized as continental (c), mixed(x), or marine (m). For example, Arctic air may thus bedefined as marine Arctic, mixed Arctic, and continentalArctic (mA, xA, and cA, respectively). Owing to a lowfrequency of observation over the Nordic countries, sub-tropical air masses (S) and tropical air masses (T) are leftout of the discussion.[13] The preferred path of transformation into different air
masses is exemplified in Table 2. This path may differdepending on season. In this manner, for example, mPs istransformed in a first stage to xSp during summer and to
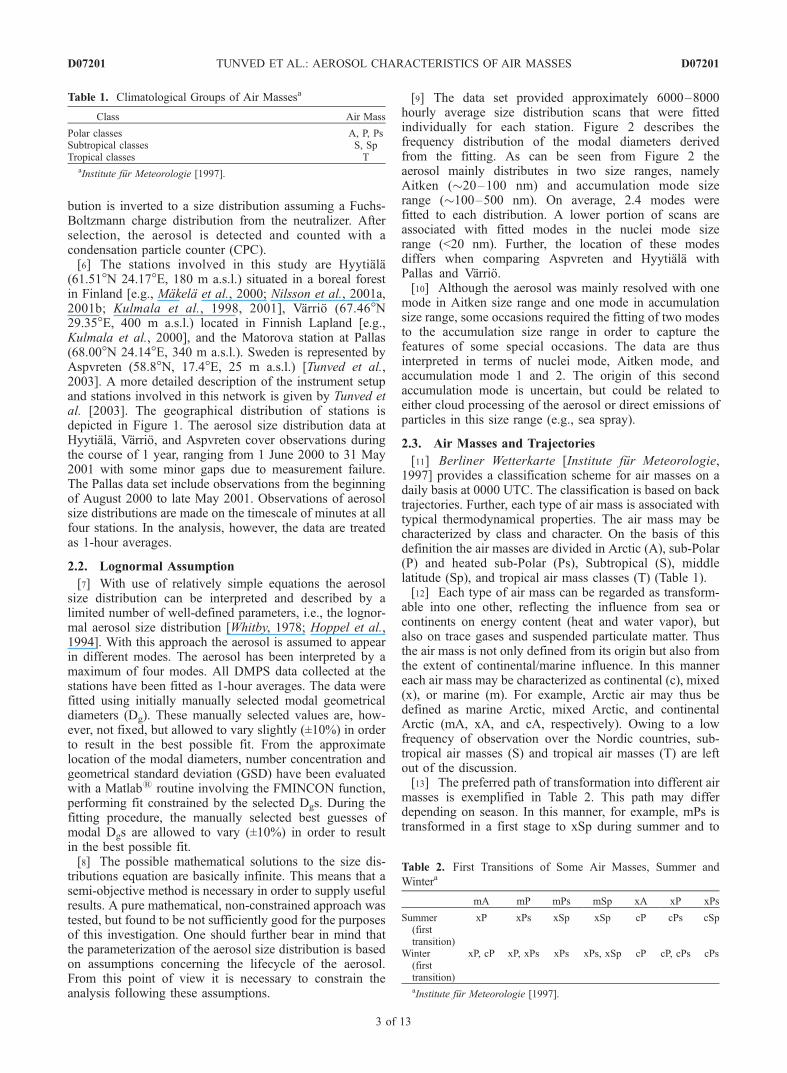
Table 1. Climatological Groups of Air Massesa
Class Air Mass
Polar classes A, P, PsSubtropical classes S, SpTropical classes T
aInstitute fur Meteorologie [1997].
Table 2. First Transitions of Some Air Masses, Summer and
Wintera
mA mP mPs mSp xA xP xPs
Summer(firsttransition)
xP xPs xSp xSp cP cPs cSp
Winter(firsttransition)
xP, cP xP, xPs xPs xPs, xSp cP cP, cPs cPs
aInstitute fur Meteorologie [1997].
D07201 TUNVED ET AL.: AEROSOL CHARACTERISTICS OF AIR MASSES
3 of 13
D07201
xPs during winter. When transformation occurs, the air masswill gradually adopt typical properties concerning temper-ature and water content as well as pollutants.[14] The dominating advection situation for each air mass
was investigated using back trajectories. Trajectories werecalculated with the HYSPLIT4 (HYbrid Single-ParticleLagrangian Integrated Trajectory) model [Draxler andHess, 1997]. For this study, 96-hour back trajectoriesarriving at 500 m a.g.l. were calculated throughout the yearfor each station 4 times a day (UTC 0500, 1100, 1700,
2300). In this way each station contributes with aboutroughly 1400 trajectories each.
3. Results and Discussion
[15] The air masses may be described by means offormation area (class) or influence from underlying sea orland (character). As a first analysis we investigate how thesedifferent properties of the air masses relate to observedaerosol size distribution properties. One transition that is
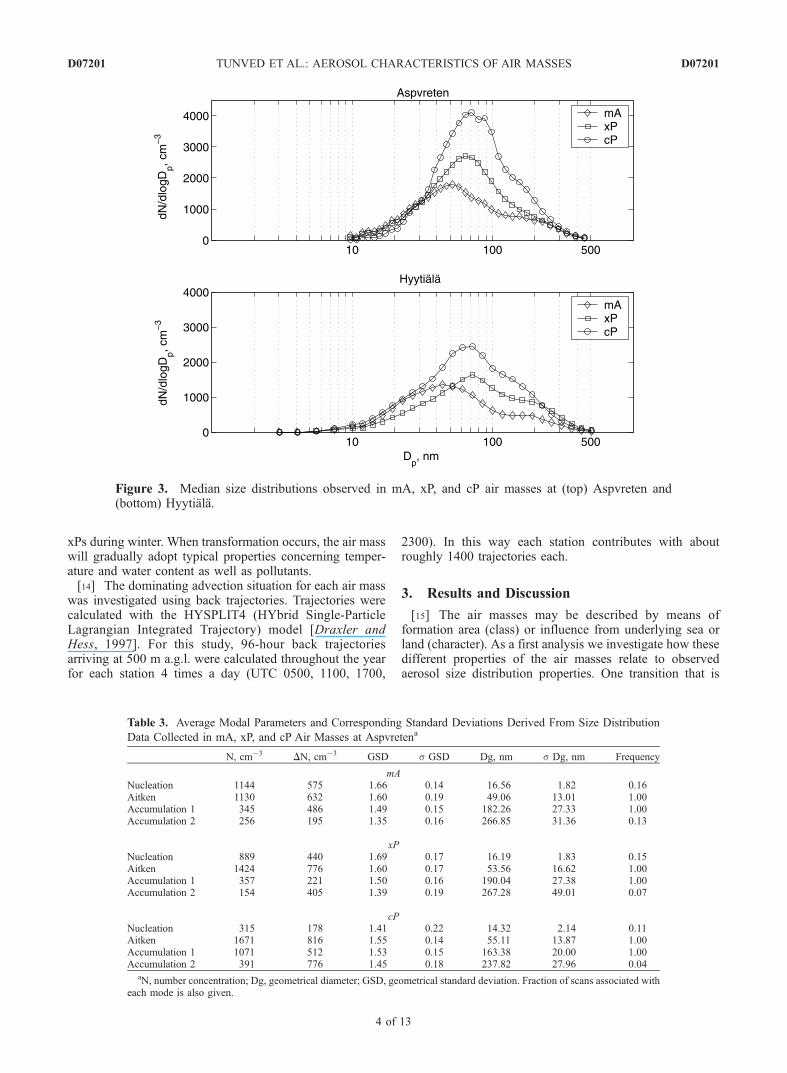
Figure 3. Median size distributions observed in mA, xP, and cP air masses at (top) Aspvreten and(bottom) Hyytiala.
Table 3. Average Modal Parameters and Corresponding Standard Deviations Derived From Size Distribution
Data Collected in mA, xP, and cP Air Masses at Aspvretena
N, cm�3DN, cm�3 GSD s GSD Dg, nm s Dg, nm Frequency
mANucleation 1144 575 1.66 0.14 16.56 1.82 0.16Aitken 1130 632 1.60 0.19 49.06 13.01 1.00Accumulation 1 345 486 1.49 0.15 182.26 27.33 1.00Accumulation 2 256 195 1.35 0.16 266.85 31.36 0.13
xPNucleation 889 440 1.69 0.17 16.19 1.83 0.15Aitken 1424 776 1.60 0.17 53.56 16.62 1.00Accumulation 1 357 221 1.50 0.16 190.04 27.38 1.00Accumulation 2 154 405 1.39 0.19 267.28 49.01 0.07
cPNucleation 315 178 1.41 0.22 14.32 2.14 0.11Aitken 1671 816 1.55 0.14 55.11 13.87 1.00Accumulation 1 1071 512 1.53 0.15 163.38 20.00 1.00Accumulation 2 391 776 1.45 0.18 237.82 27.96 0.04
aN, number concentration; Dg, geometrical diameter; GSD, geometrical standard deviation. Fraction of scans associated witheach mode is also given.
D07201 TUNVED ET AL.: AEROSOL CHARACTERISTICS OF AIR MASSES
4 of 13
D07201
likely to take place is the conversion of marine Arctic air tocontinental Polar air.[16] Maritime Arctic air (mA) forms during summer over
the high Arctic waters and during winter from cA that hasevolved over the ice in the central Arctic, via xA, if enoughopen water is present during the transport of the air mass.When the mA air mass reaches the European continent itstarts to adopt continental properties and is transformed,after a minimum of 24 hours over land, to xP (mixed
Polar) air mass. Transformation to continental air requiresup to 5–7 days more over land. In the end, depending onseason, either a continental sub-Polar or continental heatedsub-Polar air mass is formed (cP and cPs, respectively),mA!xP!cP/cPs.[17] One way to address the influence on the aerosol size
distribution properties during these steps of transformationis to investigate the aerosol size distribution propertiesassociated with corresponding air mass at a single measure-
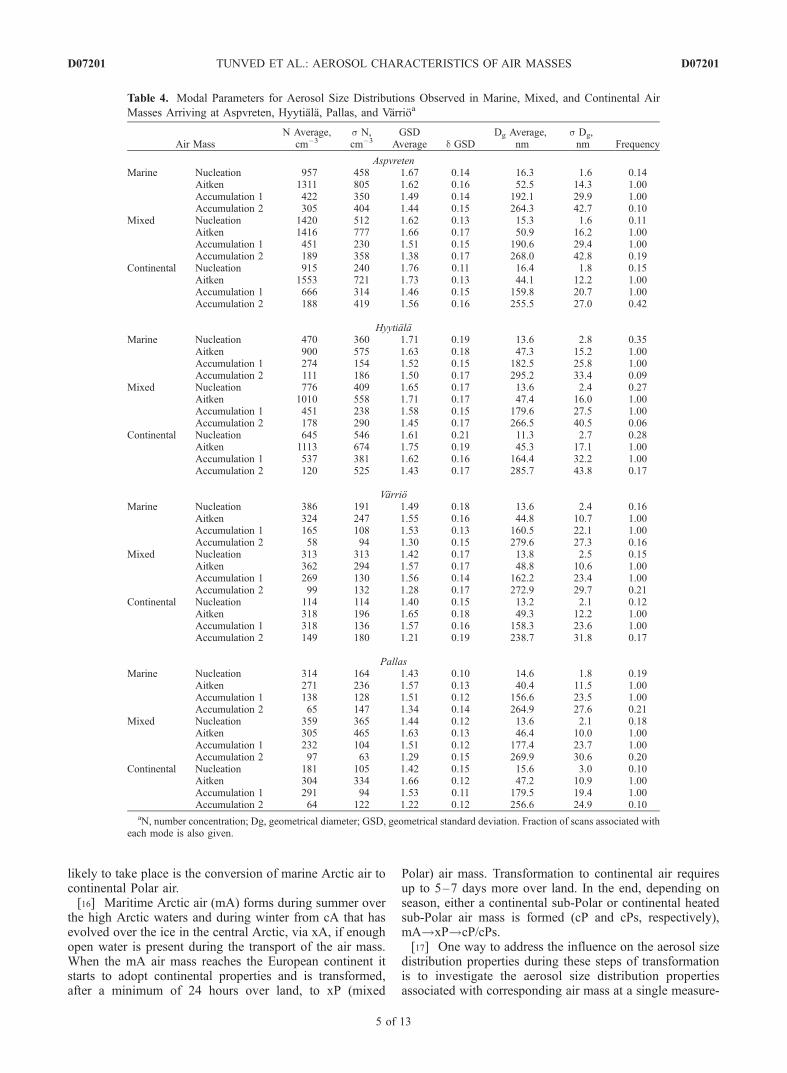
Table 4. Modal Parameters for Aerosol Size Distributions Observed in Marine, Mixed, and Continental Air
Masses Arriving at Aspvreten, Hyytiala, Pallas, and Varrioa
Air MassN Average,
cm�3s N,cm�3
GSDAverage d GSD
Dg Average,nm
s Dg,nm Frequency
AspvretenMarine Nucleation 957 458 1.67 0.14 16.3 1.6 0.14
Aitken 1311 805 1.62 0.16 52.5 14.3 1.00Accumulation 1 422 350 1.49 0.14 192.1 29.9 1.00Accumulation 2 305 404 1.44 0.15 264.3 42.7 0.10
Mixed Nucleation 1420 512 1.62 0.13 15.3 1.6 0.11Aitken 1416 777 1.66 0.17 50.9 16.2 1.00Accumulation 1 451 230 1.51 0.15 190.6 29.4 1.00Accumulation 2 189 358 1.38 0.17 268.0 42.8 0.19
Continental Nucleation 915 240 1.76 0.11 16.4 1.8 0.15Aitken 1553 721 1.73 0.13 44.1 12.2 1.00Accumulation 1 666 314 1.46 0.15 159.8 20.7 1.00Accumulation 2 188 419 1.56 0.16 255.5 27.0 0.42
HyytialaMarine Nucleation 470 360 1.71 0.19 13.6 2.8 0.35
Aitken 900 575 1.63 0.18 47.3 15.2 1.00Accumulation 1 274 154 1.52 0.15 182.5 25.8 1.00Accumulation 2 111 186 1.50 0.17 295.2 33.4 0.09
Mixed Nucleation 776 409 1.65 0.17 13.6 2.4 0.27Aitken 1010 558 1.71 0.17 47.4 16.0 1.00Accumulation 1 451 238 1.58 0.15 179.6 27.5 1.00Accumulation 2 178 290 1.45 0.17 266.5 40.5 0.06
Continental Nucleation 645 546 1.61 0.21 11.3 2.7 0.28Aitken 1113 674 1.75 0.19 45.3 17.1 1.00Accumulation 1 537 381 1.62 0.16 164.4 32.2 1.00Accumulation 2 120 525 1.43 0.17 285.7 43.8 0.17
VarrioMarine Nucleation 386 191 1.49 0.18 13.6 2.4 0.16
Aitken 324 247 1.55 0.16 44.8 10.7 1.00Accumulation 1 165 108 1.53 0.13 160.5 22.1 1.00Accumulation 2 58 94 1.30 0.15 279.6 27.3 0.16
Mixed Nucleation 313 313 1.42 0.17 13.8 2.5 0.15Aitken 362 294 1.57 0.17 48.8 10.6 1.00Accumulation 1 269 130 1.56 0.14 162.2 23.4 1.00Accumulation 2 99 132 1.28 0.17 272.9 29.7 0.21
Continental Nucleation 114 114 1.40 0.15 13.2 2.1 0.12Aitken 318 196 1.65 0.18 49.3 12.2 1.00Accumulation 1 318 136 1.57 0.16 158.3 23.6 1.00Accumulation 2 149 180 1.21 0.19 238.7 31.8 0.17
PallasMarine Nucleation 314 164 1.43 0.10 14.6 1.8 0.19
Aitken 271 236 1.57 0.13 40.4 11.5 1.00Accumulation 1 138 128 1.51 0.12 156.6 23.5 1.00Accumulation 2 65 147 1.34 0.14 264.9 27.6 0.21
Mixed Nucleation 359 365 1.44 0.12 13.6 2.1 0.18Aitken 305 465 1.63 0.13 46.4 10.0 1.00Accumulation 1 232 104 1.51 0.12 177.4 23.7 1.00Accumulation 2 97 63 1.29 0.15 269.9 30.6 0.20
Continental Nucleation 181 105 1.42 0.15 15.6 3.0 0.10Aitken 304 334 1.66 0.12 47.2 10.9 1.00Accumulation 1 291 94 1.53 0.11 179.5 19.4 1.00Accumulation 2 64 122 1.22 0.12 256.6 24.9 0.10
aN, number concentration; Dg, geometrical diameter; GSD, geometrical standard deviation. Fraction of scans associated witheach mode is also given.
D07201 TUNVED ET AL.: AEROSOL CHARACTERISTICS OF AIR MASSES
5 of 13
D07201
ment location. In this context, the aerosol properties asso-ciated with each air mass represent snapshots of the evolu-tion from mA, via xP, to cP/cPs.[18] Figure 3 shows the median aerosol size distribution
measured in these different air masses. Hyytiala andAspvreten were chosen to exemplify the response in aerosolsize distribution properties comparing these inter-transform-able air masses. Table 3 gives fitted size distributionparameters (geometrical diameter (Dg), geometrical stan-dard deviation (GSD), and number concentration (N)).Nucleation mode particles are more often present in mAair masses, and at higher concentrations, compared with xPand cP. The comparison further shows a significant increase(99% confidence interval) in Aitken mode comparing mA,xP, and cP/cPs. The increase is on the order 500 cm�3
comparing mA and cP. No significant difference in accu-mulation mode 1 concentration can be noted comparing mAand xP, while instead a significant increase in accumulationmode number concentration can be noted comparing xP andcP (�700 cm�3). Assuming sources on land to be a majorcontributor to particle mass, it is not surprising to find thelargest difference in accumulation mode number concentra-tion comparing xP and cP, considering the timescale oftransformation from xP to cP versus mA to xP. While thisanalysis gives a description of a commonly encounteredtransition between air masses, the following parts of thepaper focus on the more general aerosol properties of airmasses of different class and character.
3.1. Comparing Continental and Marine CharacterAir Masses
[19] This section investigates the relation between conti-nental influence and aerosol properties observed at differentstations. The data set has been subdivided into mixed,
marine, and continental character of air masses. Further,each station was treated separately. This is motivated, as wewill see, by large differences between different stations eventhough measurements are performed within equivalent airmass. Lognormal parameters were taken representingcorresponding air masses and summarized as average andaverage daily standard deviation in Table 4. For thisinvestigation, only Arctic, sub-Polar, and heated sub-Polarwere used.[20] The general characteristic found when comparing
marine, mixed, and continental character of air masses isan increase in Aitken and accumulation mode numberconcentration as the continental influence increases. AtAspvreten, mixed air contains on average 10% more Aitkenmode integral number density as compared with marine air.Corresponding value for continental air is �20%. Thispattern is similar for Hyytiala. Only small changes areobserved for similar comparisons at Pallas and Varrio.The changes in modal Dgs are comparably small for allstations. The relation between continental influence andaccumulation mode number concentration was also investi-gated. On average, continental air contains far more accu-mulation mode particles as compared with marine.Significant increase can also be observed at Pallas compar-ing continental and marine air masses.[21] The differences between continental, mixed and
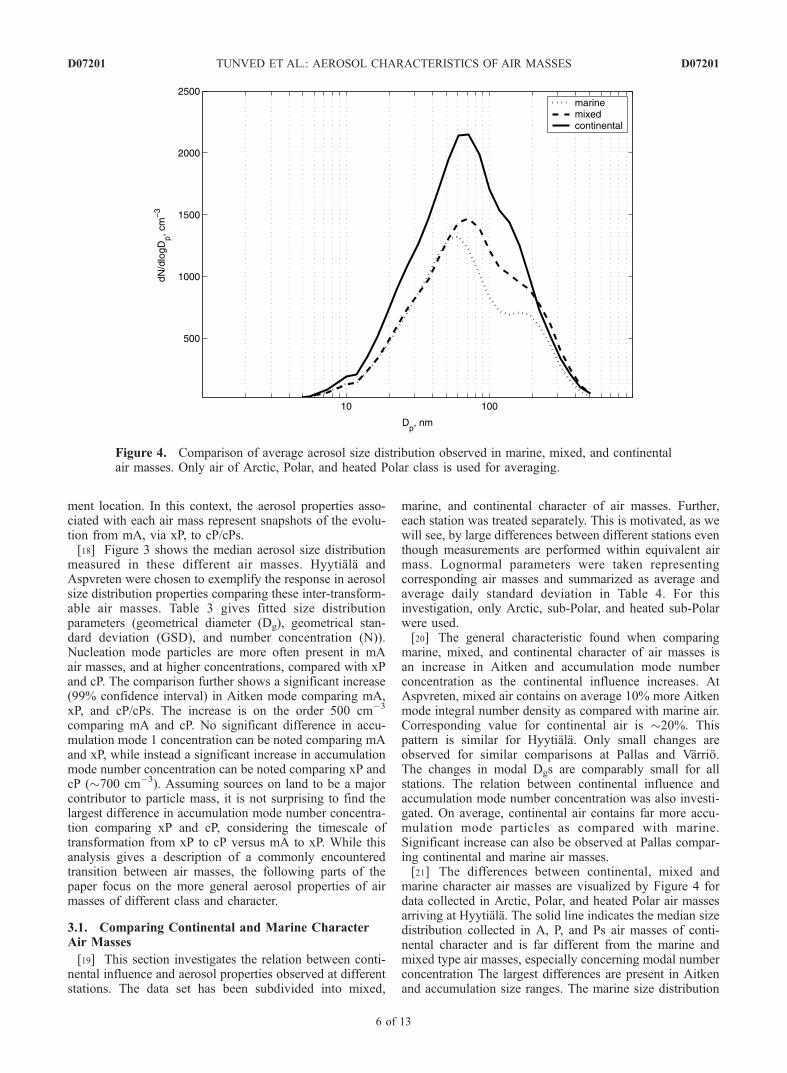
marine character air masses are visualized by Figure 4 fordata collected in Arctic, Polar, and heated Polar air massesarriving at Hyytiala. The solid line indicates the median sizedistribution collected in A, P, and Ps air masses of conti-nental character and is far different from the marine andmixed type air masses, especially concerning modal numberconcentration The largest differences are present in Aitkenand accumulation size ranges. The marine size distribution
Figure 4. Comparison of average aerosol size distribution observed in marine, mixed, and continentalair masses. Only air of Arctic, Polar, and heated Polar class is used for averaging.
D07201 TUNVED ET AL.: AEROSOL CHARACTERISTICS OF AIR MASSES
6 of 13
D07201
even has a pronounced minimum in the 120 nm size rangepossibly related to cloud activation and in-cloud growth ofthe activated aerosol [Hoppel et al., 1994].[22] So far, we can conclude that the continental influence
affects the aerosol size distribution with increasing Aitkenand accumulation mode concentrations in a way that isshown in Table 4. On the other hand, one should, however,bear in mind that the results from an approach as shownabove is not self-evident. It is necessary to be aware of thefact that the result of averaging continental, marine, andmixed character air masses regardless of the air mass originas described above neglects the fact that the character of theair is not necessarily the determining factor. This relationderived from air mass characteristics is not the only criteriashaping the size distribution. Therefore we also have toevaluate the differences resulting from measurements per-formed in air masses of different origin.
3.2. Comparing Different Air Mass Classes
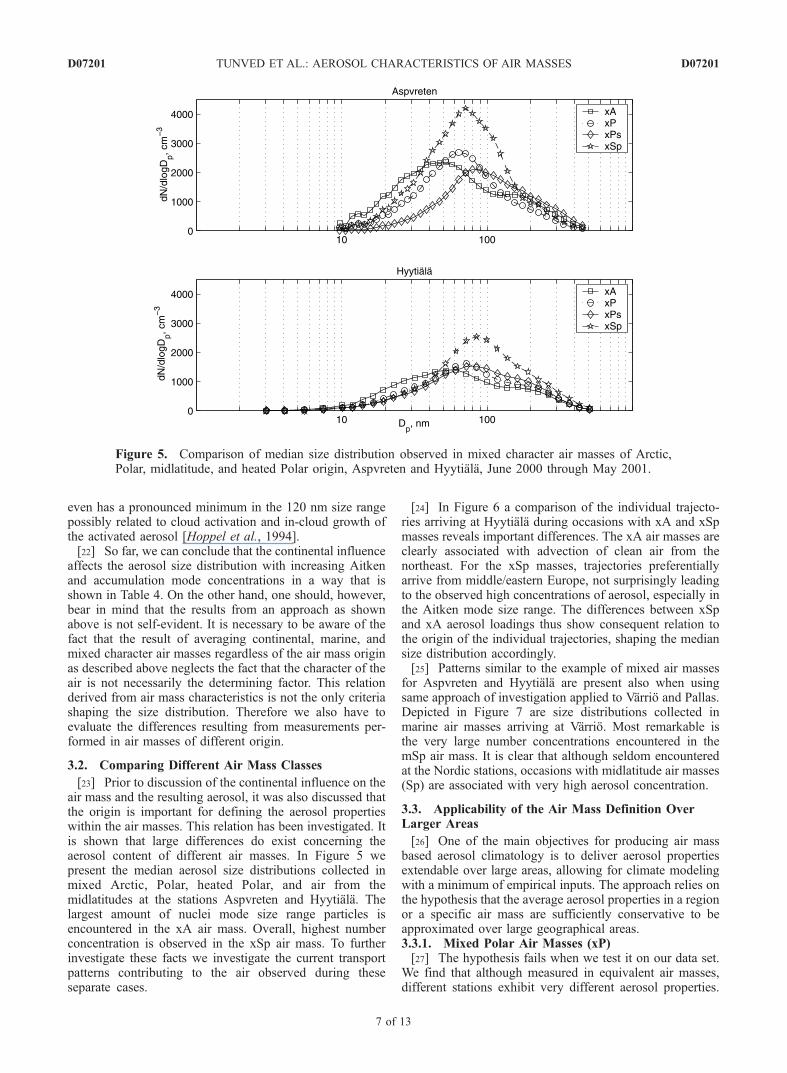
[23] Prior to discussion of the continental influence on theair mass and the resulting aerosol, it was also discussed thatthe origin is important for defining the aerosol propertieswithin the air masses. This relation has been investigated. Itis shown that large differences do exist concerning theaerosol content of different air masses. In Figure 5 wepresent the median aerosol size distributions collected inmixed Arctic, Polar, heated Polar, and air from themidlatitudes at the stations Aspvreten and Hyytiala. Thelargest amount of nuclei mode size range particles isencountered in the xA air mass. Overall, highest numberconcentration is observed in the xSp air mass. To furtherinvestigate these facts we investigate the current transportpatterns contributing to the air observed during theseseparate cases.
[24] In Figure 6 a comparison of the individual trajecto-ries arriving at Hyytiala during occasions with xA and xSpmasses reveals important differences. The xA air masses areclearly associated with advection of clean air from thenortheast. For the xSp masses, trajectories preferentiallyarrive from middle/eastern Europe, not surprisingly leadingto the observed high concentrations of aerosol, especially inthe Aitken mode size range. The differences between xSpand xA aerosol loadings thus show consequent relation tothe origin of the individual trajectories, shaping the mediansize distribution accordingly.[25] Patterns similar to the example of mixed air masses
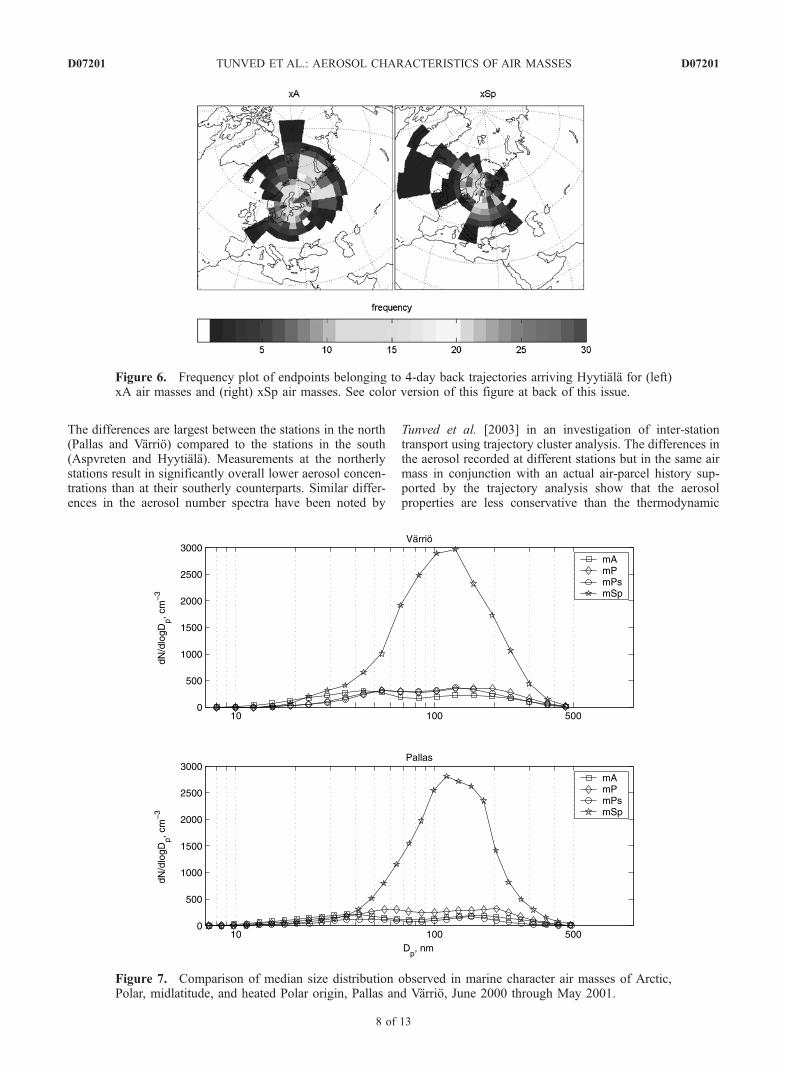
for Aspvreten and Hyytiala are present also when usingsame approach of investigation applied to Varrio and Pallas.Depicted in Figure 7 are size distributions collected inmarine air masses arriving at Varrio. Most remarkable isthe very large number concentrations encountered in themSp air mass. It is clear that although seldom encounteredat the Nordic stations, occasions with midlatitude air masses(Sp) are associated with very high aerosol concentration.
3.3. Applicability of the Air Mass Definition OverLarger Areas
[26] One of the main objectives for producing air massbased aerosol climatology is to deliver aerosol propertiesextendable over large areas, allowing for climate modelingwith a minimum of empirical inputs. The approach relies onthe hypothesis that the average aerosol properties in a regionor a specific air mass are sufficiently conservative to beapproximated over large geographical areas.3.3.1. Mixed Polar Air Masses (xP)[27] The hypothesis fails when we test it on our data set.
We find that although measured in equivalent air masses,different stations exhibit very different aerosol properties.
Figure 5. Comparison of median size distribution observed in mixed character air masses of Arctic,Polar, midlatitude, and heated Polar origin, Aspvreten and Hyytiala, June 2000 through May 2001.
D07201 TUNVED ET AL.: AEROSOL CHARACTERISTICS OF AIR MASSES
7 of 13
D07201
The differences are largest between the stations in the north(Pallas and Varrio) compared to the stations in the south(Aspvreten and Hyytiala). Measurements at the northerlystations result in significantly overall lower aerosol concen-trations than at their southerly counterparts. Similar differ-ences in the aerosol number spectra have been noted by
Tunved et al. [2003] in an investigation of inter-stationtransport using trajectory cluster analysis. The differences inthe aerosol recorded at different stations but in the same airmass in conjunction with an actual air-parcel history sup-ported by the trajectory analysis show that the aerosolproperties are less conservative than the thermodynamic
Figure 7. Comparison of median size distribution observed in marine character air masses of Arctic,Polar, midlatitude, and heated Polar origin, Pallas and Varrio, June 2000 through May 2001.
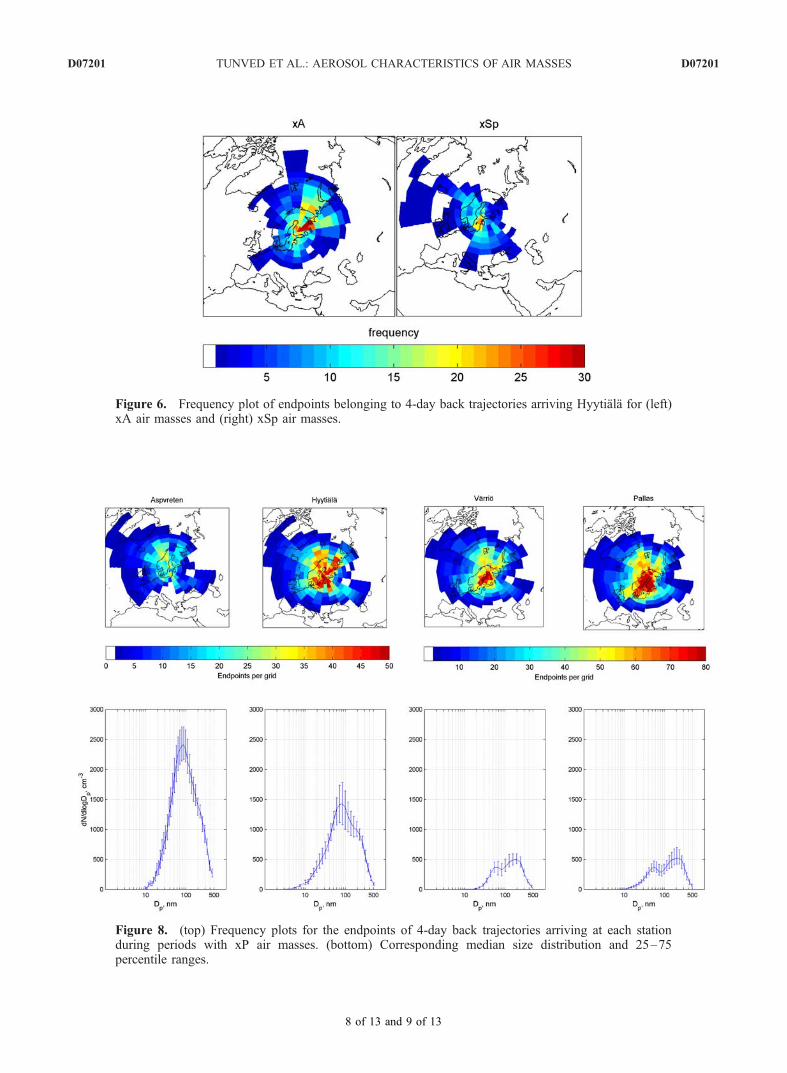
Figure 6. Frequency plot of endpoints belonging to 4-day back trajectories arriving Hyytiala for (left)xA air masses and (right) xSp air masses. See color version of this figure at back of this issue.
D07201 TUNVED ET AL.: AEROSOL CHARACTERISTICS OF AIR MASSES
8 of 13
D07201
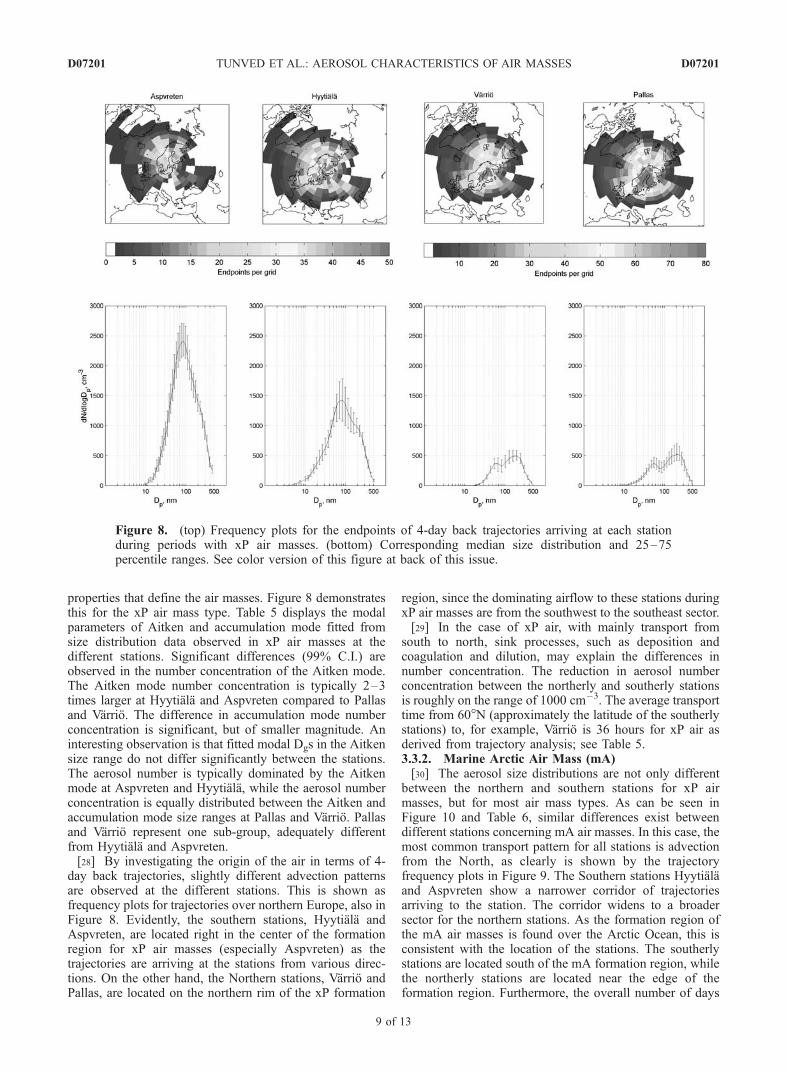
properties that define the air masses. Figure 8 demonstratesthis for the xP air mass type. Table 5 displays the modalparameters of Aitken and accumulation mode fitted fromsize distribution data observed in xP air masses at thedifferent stations. Significant differences (99% C.I.) areobserved in the number concentration of the Aitken mode.The Aitken mode number concentration is typically 2–3times larger at Hyytiala and Aspvreten compared to Pallasand Varrio. The difference in accumulation mode numberconcentration is significant, but of smaller magnitude. Aninteresting observation is that fitted modal Dgs in the Aitkensize range do not differ significantly between the stations.The aerosol number is typically dominated by the Aitkenmode at Aspvreten and Hyytiala, while the aerosol numberconcentration is equally distributed between the Aitken andaccumulation mode size ranges at Pallas and Varrio. Pallasand Varrio represent one sub-group, adequately differentfrom Hyytiala and Aspvreten.[28] By investigating the origin of the air in terms of 4-
day back trajectories, slightly different advection patternsare observed at the different stations. This is shown asfrequency plots for trajectories over northern Europe, also inFigure 8. Evidently, the southern stations, Hyytiala andAspvreten, are located right in the center of the formationregion for xP air masses (especially Aspvreten) as thetrajectories are arriving at the stations from various direc-tions. On the other hand, the Northern stations, Varrio andPallas, are located on the northern rim of the xP formation
region, since the dominating airflow to these stations duringxP air masses are from the southwest to the southeast sector.[29] In the case of xP air, with mainly transport from
south to north, sink processes, such as deposition andcoagulation and dilution, may explain the differences innumber concentration. The reduction in aerosol numberconcentration between the northerly and southerly stationsis roughly on the range of 1000 cm�3. The average transporttime from 60�N (approximately the latitude of the southerlystations) to, for example, Varrio is 36 hours for xP air asderived from trajectory analysis; see Table 5.3.3.2. Marine Arctic Air Mass (mA)[30] The aerosol size distributions are not only different
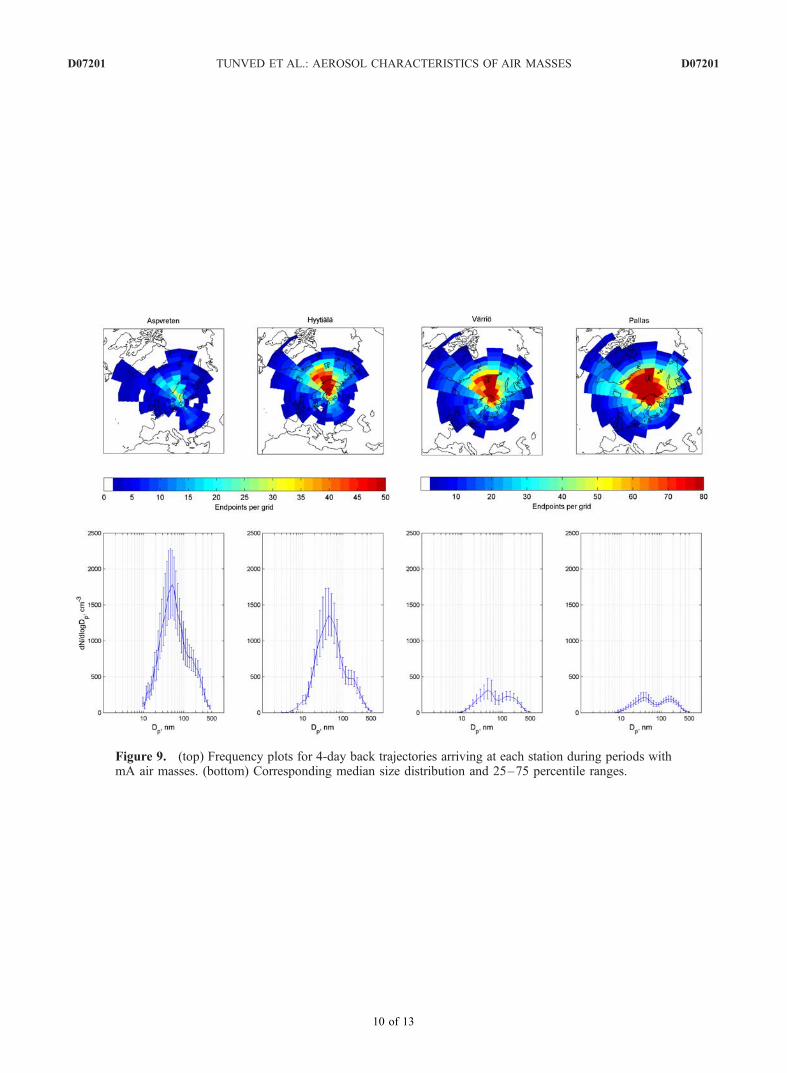
between the northern and southern stations for xP airmasses, but for most air mass types. As can be seen inFigure 10 and Table 6, similar differences exist betweendifferent stations concerning mA air masses. In this case, themost common transport pattern for all stations is advectionfrom the North, as clearly is shown by the trajectoryfrequency plots in Figure 9. The Southern stations Hyytialaand Aspvreten show a narrower corridor of trajectoriesarriving to the station. The corridor widens to a broadersector for the northern stations. As the formation region ofthe mA air masses is found over the Arctic Ocean, this isconsistent with the location of the stations. The southerlystations are located south of the mA formation region, whilethe northerly stations are located near the edge of theformation region. Furthermore, the overall number of days
Figure 8. (top) Frequency plots for the endpoints of 4-day back trajectories arriving at each stationduring periods with xP air masses. (bottom) Corresponding median size distribution and 25–75percentile ranges. See color version of this figure at back of this issue.
D07201 TUNVED ET AL.: AEROSOL CHARACTERISTICS OF AIR MASSES
9 of 13
D07201
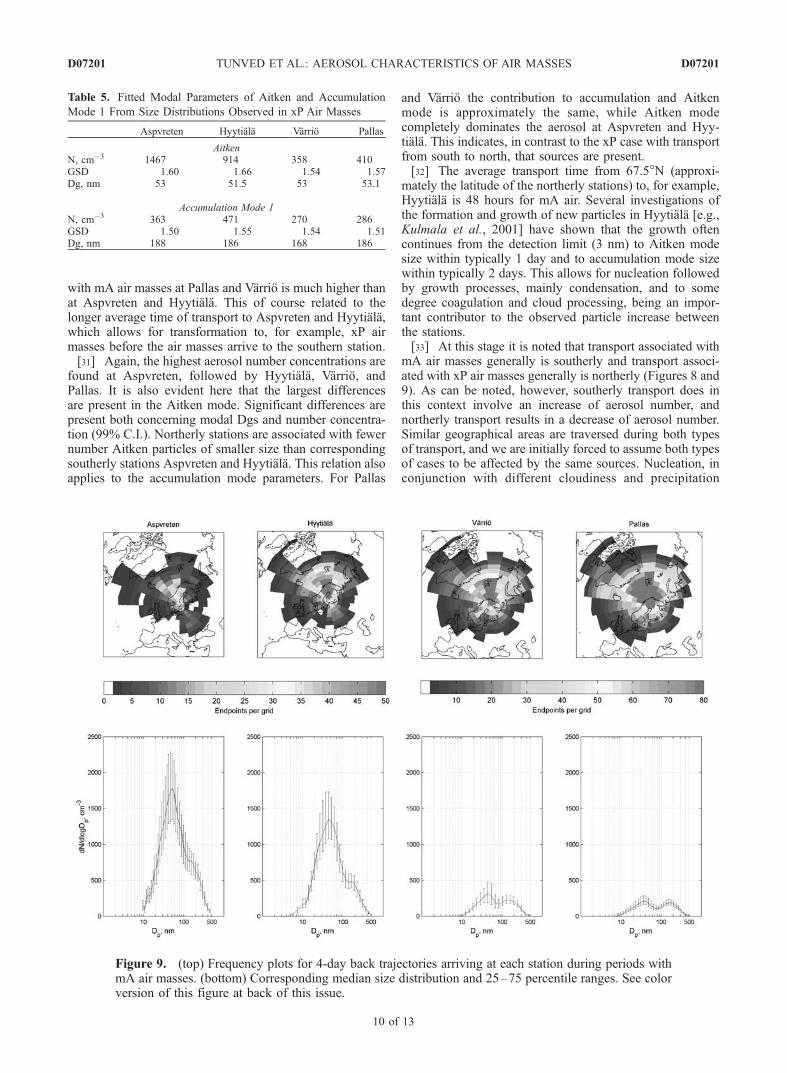
with mA air masses at Pallas and Varrio is much higher thanat Aspvreten and Hyytiala. This of course related to thelonger average time of transport to Aspvreten and Hyytiala,which allows for transformation to, for example, xP airmasses before the air masses arrive to the southern station.[31] Again, the highest aerosol number concentrations are
found at Aspvreten, followed by Hyytiala, Varrio, andPallas. It is also evident here that the largest differencesare present in the Aitken mode. Significant differences arepresent both concerning modal Dgs and number concentra-tion (99% C.I.). Northerly stations are associated with fewernumber Aitken particles of smaller size than correspondingsoutherly stations Aspvreten and Hyytiala. This relation alsoapplies to the accumulation mode parameters. For Pallas
and Varrio the contribution to accumulation and Aitkenmode is approximately the same, while Aitken modecompletely dominates the aerosol at Aspvreten and Hyy-tiala. This indicates, in contrast to the xP case with transportfrom south to north, that sources are present.[32] The average transport time from 67.5�N (approxi-
mately the latitude of the northerly stations) to, for example,Hyytiala is 48 hours for mA air. Several investigations ofthe formation and growth of new particles in Hyytiala [e.g.,Kulmala et al., 2001] have shown that the growth oftencontinues from the detection limit (3 nm) to Aitken modesize within typically 1 day and to accumulation mode sizewithin typically 2 days. This allows for nucleation followedby growth processes, mainly condensation, and to somedegree coagulation and cloud processing, being an impor-tant contributor to the observed particle increase betweenthe stations.[33] At this stage it is noted that transport associated with
mA air masses generally is southerly and transport associ-ated with xP air masses generally is northerly (Figures 8 and9). As can be noted, however, southerly transport does inthis context involve an increase of aerosol number, andnortherly transport results in a decrease of aerosol number.Similar geographical areas are traversed during both typesof transport, and we are initially forced to assume both typesof cases to be affected by the same sources. Nucleation, inconjunction with different cloudiness and precipitation
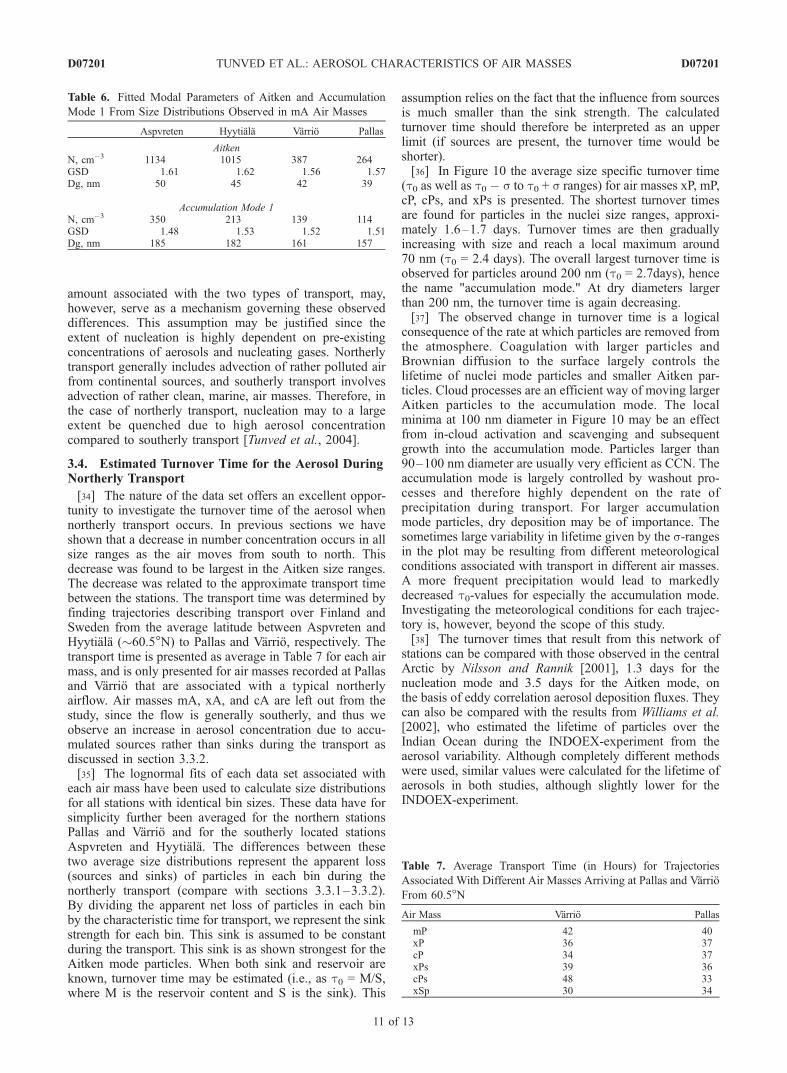
Table 5. Fitted Modal Parameters of Aitken and Accumulation
Mode 1 From Size Distributions Observed in xP Air Masses
Aspvreten Hyytiala Varrio Pallas
AitkenN, cm�3 1467 914 358 410GSD 1.60 1.66 1.54 1.57Dg, nm 53 51.5 53 53.1
Accumulation Mode 1N, cm�3 363 471 270 286GSD 1.50 1.55 1.54 1.51Dg, nm 188 186 168 186
Figure 9. (top) Frequency plots for 4-day back trajectories arriving at each station during periods withmA air masses. (bottom) Corresponding median size distribution and 25–75 percentile ranges. See colorversion of this figure at back of this issue.
D07201 TUNVED ET AL.: AEROSOL CHARACTERISTICS OF AIR MASSES
10 of 13
D07201
amount associated with the two types of transport, may,however, serve as a mechanism governing these observeddifferences. This assumption may be justified since theextent of nucleation is highly dependent on pre-existingconcentrations of aerosols and nucleating gases. Northerlytransport generally includes advection of rather polluted airfrom continental sources, and southerly transport involvesadvection of rather clean, marine, air masses. Therefore, inthe case of northerly transport, nucleation may to a largeextent be quenched due to high aerosol concentrationcompared to southerly transport [Tunved et al., 2004].
3.4. Estimated Turnover Time for the Aerosol DuringNortherly Transport
[34] The nature of the data set offers an excellent oppor-tunity to investigate the turnover time of the aerosol whennortherly transport occurs. In previous sections we haveshown that a decrease in number concentration occurs in allsize ranges as the air moves from south to north. Thisdecrease was found to be largest in the Aitken size ranges.The decrease was related to the approximate transport timebetween the stations. The transport time was determined byfinding trajectories describing transport over Finland andSweden from the average latitude between Aspvreten andHyytiala (�60.5�N) to Pallas and Varrio, respectively. Thetransport time is presented as average in Table 7 for each airmass, and is only presented for air masses recorded at Pallasand Varrio that are associated with a typical northerlyairflow. Air masses mA, xA, and cA are left out from thestudy, since the flow is generally southerly, and thus weobserve an increase in aerosol concentration due to accu-mulated sources rather than sinks during the transport asdiscussed in section 3.3.2.[35] The lognormal fits of each data set associated with
each air mass have been used to calculate size distributionsfor all stations with identical bin sizes. These data have forsimplicity further been averaged for the northern stationsPallas and Varrio and for the southerly located stationsAspvreten and Hyytiala. The differences between thesetwo average size distributions represent the apparent loss(sources and sinks) of particles in each bin during thenortherly transport (compare with sections 3.3.1–3.3.2).By dividing the apparent net loss of particles in each binby the characteristic time for transport, we represent the sinkstrength for each bin. This sink is assumed to be constantduring the transport. This sink is as shown strongest for theAitken mode particles. When both sink and reservoir areknown, turnover time may be estimated (i.e., as t0 = M/S,where M is the reservoir content and S is the sink). This
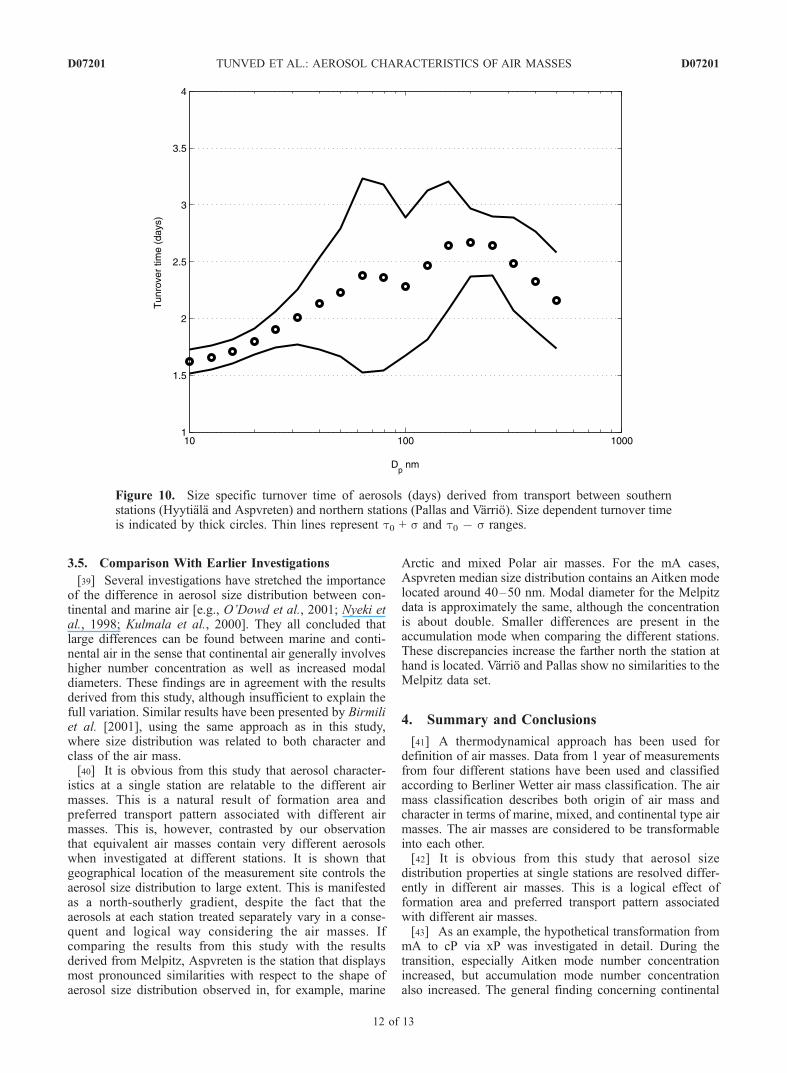
assumption relies on the fact that the influence from sourcesis much smaller than the sink strength. The calculatedturnover time should therefore be interpreted as an upperlimit (if sources are present, the turnover time would beshorter).[36] In Figure 10 the average size specific turnover time
(t0 as well as t0 � s to t0 + s ranges) for air masses xP, mP,cP, cPs, and xPs is presented. The shortest turnover timesare found for particles in the nuclei size ranges, approxi-mately 1.6–1.7 days. Turnover times are then graduallyincreasing with size and reach a local maximum around70 nm (t0 = 2.4 days). The overall largest turnover time isobserved for particles around 200 nm (t0 = 2.7days), hencethe name "accumulation mode." At dry diameters largerthan 200 nm, the turnover time is again decreasing.[37] The observed change in turnover time is a logical
consequence of the rate at which particles are removed fromthe atmosphere. Coagulation with larger particles andBrownian diffusion to the surface largely controls thelifetime of nuclei mode particles and smaller Aitken par-ticles. Cloud processes are an efficient way of moving largerAitken particles to the accumulation mode. The localminima at 100 nm diameter in Figure 10 may be an effectfrom in-cloud activation and scavenging and subsequentgrowth into the accumulation mode. Particles larger than90–100 nm diameter are usually very efficient as CCN. Theaccumulation mode is largely controlled by washout pro-cesses and therefore highly dependent on the rate ofprecipitation during transport. For larger accumulationmode particles, dry deposition may be of importance. Thesometimes large variability in lifetime given by the s-rangesin the plot may be resulting from different meteorologicalconditions associated with transport in different air masses.A more frequent precipitation would lead to markedlydecreased t0-values for especially the accumulation mode.Investigating the meteorological conditions for each trajec-tory is, however, beyond the scope of this study.[38] The turnover times that result from this network of
stations can be compared with those observed in the centralArctic by Nilsson and Rannik [2001], 1.3 days for thenucleation mode and 3.5 days for the Aitken mode, onthe basis of eddy correlation aerosol deposition fluxes. Theycan also be compared with the results from Williams et al.[2002], who estimated the lifetime of particles over theIndian Ocean during the INDOEX-experiment from theaerosol variability. Although completely different methodswere used, similar values were calculated for the lifetime ofaerosols in both studies, although slightly lower for theINDOEX-experiment.
Table 6. Fitted Modal Parameters of Aitken and Accumulation
Mode 1 From Size Distributions Observed in mA Air Masses
Aspvreten Hyytiala Varrio Pallas
AitkenN, cm�3 1134 1015 387 264GSD 1.61 1.62 1.56 1.57Dg, nm 50 45 42 39
Accumulation Mode 1N, cm�3 350 213 139 114GSD 1.48 1.53 1.52 1.51Dg, nm 185 182 161 157
Table 7. Average Transport Time (in Hours) for Trajectories
Associated With Different Air Masses Arriving at Pallas and Varrio
From 60.5�N
Air Mass Varrio Pallas
mP 42 40xP 36 37cP 34 37xPs 39 36cPs 48 33xSp 30 34
D07201 TUNVED ET AL.: AEROSOL CHARACTERISTICS OF AIR MASSES
11 of 13
D07201
3.5. Comparison With Earlier Investigations
[39] Several investigations have stretched the importanceof the difference in aerosol size distribution between con-tinental and marine air [e.g., O’Dowd et al., 2001; Nyeki etal., 1998; Kulmala et al., 2000]. They all concluded thatlarge differences can be found between marine and conti-nental air in the sense that continental air generally involveshigher number concentration as well as increased modaldiameters. These findings are in agreement with the resultsderived from this study, although insufficient to explain thefull variation. Similar results have been presented by Birmiliet al. [2001], using the same approach as in this study,where size distribution was related to both character andclass of the air mass.[40] It is obvious from this study that aerosol character-
istics at a single station are relatable to the different airmasses. This is a natural result of formation area andpreferred transport pattern associated with different airmasses. This is, however, contrasted by our observationthat equivalent air masses contain very different aerosolswhen investigated at different stations. It is shown thatgeographical location of the measurement site controls theaerosol size distribution to large extent. This is manifestedas a north-southerly gradient, despite the fact that theaerosols at each station treated separately vary in a conse-quent and logical way considering the air masses. Ifcomparing the results from this study with the resultsderived from Melpitz, Aspvreten is the station that displaysmost pronounced similarities with respect to the shape ofaerosol size distribution observed in, for example, marine
Arctic and mixed Polar air masses. For the mA cases,Aspvreten median size distribution contains an Aitken modelocated around 40–50 nm. Modal diameter for the Melpitzdata is approximately the same, although the concentrationis about double. Smaller differences are present in theaccumulation mode when comparing the different stations.These discrepancies increase the farther north the station athand is located. Varrio and Pallas show no similarities to theMelpitz data set.
4. Summary and Conclusions
[41] A thermodynamical approach has been used fordefinition of air masses. Data from 1 year of measurementsfrom four different stations have been used and classifiedaccording to Berliner Wetter air mass classification. The airmass classification describes both origin of air mass andcharacter in terms of marine, mixed, and continental type airmasses. The air masses are considered to be transformableinto each other.[42] It is obvious from this study that aerosol size
distribution properties at single stations are resolved differ-ently in different air masses. This is a logical effect offormation area and preferred transport pattern associatedwith different air masses.[43] As an example, the hypothetical transformation from
mA to cP via xP was investigated in detail. During thetransition, especially Aitken mode number concentrationincreased, but accumulation mode number concentrationalso increased. The general finding concerning continental
Figure 10. Size specific turnover time of aerosols (days) derived from transport between southernstations (Hyytiala and Aspvreten) and northern stations (Pallas and Varrio). Size dependent turnover timeis indicated by thick circles. Thin lines represent t0 + s and t0 � s ranges.
D07201 TUNVED ET AL.: AEROSOL CHARACTERISTICS OF AIR MASSES
12 of 13
D07201
influence was that Aitken mode number concentration tendsto increase in the order marine!mixed!continental. How-ever, large differences were also present when comparingdifferent classes of air masses. Overall, largest concentra-tions were encountered in midlatitude air masses (Sp). Fromthis we draw the conclusion that both formation area andtransport pathways are crucial to shape the aerosol sizedistribution associated with different air masses.[44] The most important finding is, however, that the
aerosol properties including the aerosol number distributionare less conservative than the thermodynamic properties(temperature and humidity profiles) that characterize thedifferent air masses. Obviously, both aerosol sink andsource processes are more efficient in transforming theaerosol than the processes acting to transform the air masses(mainly surface heat and moisture exchange, radiation,subsidence, and latent heat release due to cloud formation).This implies that the air mass type will only characterize theaerosol at each station, or at stations with a similar geo-graphical position in the air mass transport patterns. The airmass type is not enough to characterize the aerosol atstations with a different position in the transport patterns.Therefore average air mass aerosol characteristics cannot beused to, for example, initialize the aerosol in a large-scalemodel. It may, however, be used to characterize the aerosolin a local model, such as an urban air-quality dispersionmodel, provided that aerosol data for various air masses areavailable for the location. Comparison of aerosol character-istics and air mass type may, as the present study hasindicated, also be used to learn more about the aerosol sinkand source processes and the life cycle.
[45] Acknowledgments. This work was funded by the ASTA pro-gram (International and National Abatement Strategies for TransboundaryAir Pollution) of the MISTRA research foundation (Swedish Foundationfor Strategic Environmental Research), Nordic Council of Ministers(NMR), and the Swedish Environmental Protection Agency, EnvironmentalMonitoring Programme. The helpful comments by two anonymous refereesare greatly acknowledged.
ReferencesBirmili, W., A. Wiedensohler, J. Heintzenberg, and K. Lehmann (2001),Atmospheric particle number size distribution in central Europe: Statis-tical relations to air masses and meteorology, J. Geophys. Res., 106,32,005–32,018.
Draxler, R. R., and G. D. Hess (1997), Description of the Hysplit_4 mod-elling system, Tech. Memo. ERL ARL-224, 24 pp., Natl. Oceanic andAtmos. Admin., Silver Spring, Md.
Hoppel, W. A., G. M. Frick, J. W. Fitzgerald, and B. J. Wattle (1994), Acloud chamber study of the effect that nonprecipitating water clouds haveon the aerosol size distribution, Aerosol Sci. Technol., 20, 1–30.
Institute fur Meteorologie (1997), Berliner Wetterkarte, Freie Univ., Berlin.Intergovernmental Panel on Climate Change (2001), Climate Change 2000:The Science of Climate Change, edited by J. T. Houghton et al., Cam-bridge Univ. Press, New York.
Knutson, E. O., and K. T. Whitby (1975), Aerosol classification by electricmobility: Apparatus theory and applications, J. Aerosol Sci., 6, 443–451.
Kulmala, M., A. Toivonen, J. M. Makela, and A. Laaksonen (1998), Ana-lysis of the growth of nucleation mode particles observed in Boreal forest,Tellus, Ser. B, 50, 449–462.
Kulmala, M., et al. (2000), Characterization of atmospheric trace gases andaerosol composition at forest sites in southern and northern Finland usingback trajectories, Boreal Environ. Res., 5, 315–336.
Kulmala, M., et al. (2001), Overview of the international project on bio-genic aerosol formation in the boreal forest (BIOFOR), Tellus, Ser. B, 53,324–343.
Makela, J. M., I. K. Koponen, P. Aalto, and M. Kulmala (2000), One-yeardata of submicron size modes of tropospheric background aerosol inSouthern Finland, J. Aerosol Sci., 31, 595–611.
Nilsson, E. D., and U. Rannik (2001), Turbulent aerosol fluxes over theArctic Ocean: 1. Dry deposition over sea and pack ice, J. Geophys. Res.,106, 32,125–32,137.
Nilsson, E. D., U. Rannik, M. Kulmala, G. Buzorius, and C. D. O’Dowd(2001a), Effects of continental boundary layer evolution, convection,turbulence and entrainment, on aerosol formation, Tellus, Ser. B, 53,441–461.
Nilsson, E. D., J. Paatero, and M. Boy (2001b), Effects of air masses andsynoptic weather on aerosol formation in the continental boundary layer,Tellus, Ser. B, 53, 462–478.
Nyeki, S., U. Baltensperger, I. Colbeck, D. T. Jost, E. Weingartner, andH. W. Gaggeler (1998), The Jungfraujoch high-Alpine research station(3454 m) as a background clean continental site for the measurement ofaerosol parameters, J. Geophys. Res., 103, 6097–6107.
O’Dowd, C. D., E. Becker, and M. Kulmala (2001), Mid-latitude North-Atlantic aerosol characteristics in clean and polluted air, Atmos. Res., 58,167–185.
Tunved, P., et al. (2003), One year boundary layer aerosol size distributiondata from five Nordic background stations, Atmos. Chem. Phys., 3,2183–2205.
Tunved, P., H. Korhonen, J. Strom, H. C. Hansson, and M. Kulmala (2004),A pseudo-Lagrangian model study of the size distribution properties overScandinavia: Transport from Aspvreten to Varrio, Atmos. Chem. Phys.Discuss., 4, 7757–7794.
Twomey, S. A. (1974), Pollution and the planetary albedo, Atmos. Environ.,8, 1251–1256.
Whitby, K. T. (1978), The physical characteristics of sulphur aerosols,Atmos. Environ., 12, 135–159.
Williams, J., M. de Reus, R. Krejci, H. Fischer, and J. Strom (2002),Application of the variability-size relationship to atmospheric aerosolstudies: Estimating aerosol lifetimes and ages, Atmos. Chem. Phys., 2,133–145.
�����������������������P. Aalto and M. Kulmala, Department of Physics, University of Helsinki,
POB 9, Helsinki, FIN-00014 Finland.H.-C. Hansson, E. D. Nilsson, J. Strom, and P. Tunved, Department
of Applied Environmental Research, Stockholm University, Stockholm,SE-106 91 Sweden. ([email protected])Y. Viisanen, Finnish Meteorological Institute, POB 503, Helsinki,
FIN-00101 Finland.
D07201 TUNVED ET AL.: AEROSOL CHARACTERISTICS OF AIR MASSES
13 of 13
D07201
8 of 13 and 9 of 13
Figure 6. Frequency plot of endpoints belonging to 4-day back trajectories arriving Hyytiala for (left)xA air masses and (right) xSp air masses.
Figure 8. (top) Frequency plots for the endpoints of 4-day back trajectories arriving at each stationduring periods with xP air masses. (bottom) Corresponding median size distribution and 25–75percentile ranges.
D07201 TUNVED ET AL.: AEROSOL CHARACTERISTICS OF AIR MASSES D07201
10 of 13
Figure 9. (top) Frequency plots for 4-day back trajectories arriving at each station during periods withmA air masses. (bottom) Corresponding median size distribution and 25–75 percentile ranges.
D07201 TUNVED ET AL.: AEROSOL CHARACTERISTICS OF AIR MASSES D07201
Related Documents