Aerohub Business Park Newquay Cornwall AirportAerohub Enterprise Zone @ Newquay Cornwall Airport - Environmental Statement Prepared by Parsons Brinckerhoff December 2012 - 289 - for Cornwall Development Company access to the Business Park. It is therefore expected that the majority of visitors and employees will arrive by car. 15.1.26 A detailed road safety analysis has been undertaken for the surrounding highway network, particularly the A3059. This determined that the majority of accidents are unlikely to have been significantly influenced by the highway layout and are similarly unlikely to be influenced by the proposal. 15.1.27 An assessment of highway capacity has been undertaken on the junctions and roads around the proposed Business Park. The increase in vehicle trips which is expected as a result of the proposed Business Park is predicted to result in some additional delay at junctions in and around Newquay. As the proposal nears completion, the impact on junction capacity will become increasingly pronounced and other junctions will be adversely affected. 15.1.28 In order to assess the effect that the NSR would have upon journey times across Newquay, two forecast models were used to compare average journey times in the 2014 & 2030. The 2030 traffic model shows that all routes would suffer small increases in journey times, however the significance of this effect would be reduced following the completion of the Newquay Strategic Route. 15.1.29 The CEMP and the TP provide a range of measures which should minimise journeys to and from the site during construction and operation. The main aim of the travel plan is to increase the usage of bus travel, above the current 4% of commuters in the Travel to Work Area (Census, 2001). Further mitigation is outlined in the TP. Socio-economic Effects 15.1.30 The proposed Business Park will be of particular benefit to the local economy. It is estimated that once complete, in 2030, the Business Park will lead to the direct creation of 2,730 jobs and an additional 400 jobs outside the Business Park. These jobs will be particularly beneficial to an area that suffers from higher than average unemployment. Assuming the development meets its potential, it will contribute to the creation of a £141 million GVA for the Cornwall economy just from on site activities. 15.1.31 The businesses attracted to the Business Park are also expected to encourage an increase in Cornwall’s performance in skills and education, as new workers arrive, and existing workers and young people train and re-skill to gain access to the new employment opportunities. 15.1.32 No significant adverse socio-economic effects were identified, it was therefore concluded that the proposed Business Park will benefit nearby communities and the economy.

Welcome message from author
This document is posted to help you gain knowledge. Please leave a comment to let me know what you think about it! Share it to your friends and learn new things together.
Transcript

Aerohub Business Park Newquay Cornwall AirportAerohub
Enterprise Zone @ Newquay Cornwall Airport -
Environmental Statement Prepared by Parsons Brinckerhoff December 2012 - 289 - for Cornwall Development Company
access to the Business Park. It is therefore expected that the majority of visitors and employees will arrive by car.
15.1.26 A detailed road safety analysis has been undertaken for the surrounding highway network, particularly the A3059. This determined that the majority of accidents are unlikely to have been significantly influenced by the highway layout and are similarly unlikely to be influenced by the proposal.
15.1.27 An assessment of highway capacity has been undertaken on the junctions and roads around the proposed Business Park. The increase in vehicle trips which is expected as a result of the proposed Business Park is predicted to result in some additional delay at junctions in and around Newquay. As the proposal nears completion, the impact on junction capacity will become increasingly pronounced and other junctions will be adversely affected.
15.1.28 In order to assess the effect that the NSR would have upon journey times across Newquay, two forecast models were used to compare average journey times in the 2014 & 2030. The 2030 traffic model shows that all routes would suffer small increases in journey times, however the significance of this effect would be reduced following the completion of the Newquay Strategic Route.
15.1.29 The CEMP and the TP provide a range of measures which should minimise journeys to and from the site during construction and operation. The main aim of the travel plan is to increase the usage of bus travel, above the current 4% of commuters in the Travel to Work Area (Census, 2001). Further mitigation is outlined in the TP.
Socio-economic Effects
15.1.30 The proposed Business Park will be of particular benefit to the local economy. It is estimated that once complete, in 2030, the Business Park will lead to the direct creation of 2,730 jobs and an additional 400 jobs outside the Business Park. These jobs will be particularly beneficial to an area that suffers from higher than average unemployment. Assuming the development meets its potential, it will contribute to the creation of a £141 million GVA for the Cornwall economy just from on site activities.
15.1.31 The businesses attracted to the Business Park are also expected to encourage an increase in Cornwall’s performance in skills and education, as new workers arrive, and existing workers and young people train and re-skill to gain access to the new employment opportunities.
15.1.32 No significant adverse socio-economic effects were identified, it was therefore concluded that the proposed Business Park will benefit nearby communities and the economy.

Appendix 1.1 – Scoping Response

��� �������������
���� ����������� ��� �������������� ������������������������������������������������������ ����������� ������� ��� ������ ����������� ��������� ��� ������ ��� ���� !�� "��� �� �� ���� �������������� #��������� $�#%� �������� ������� ��&���������� �� ����� #����'� ������ ���� ����� �������� ���� ������� ��������� ��� ��������������� ��� ��������� ����������� ������� ���� ���� ���'����� #�������'��������������������� ��� (�������� �����
��� )�� ���������������� ���� �)*� +�'��������,� ���� ���� ������ ��� �� ��������� $��� �����-��������%� ����� ��� �������������� ������������ ������� ��� ��������� ��� ������������������ #���������� ���� ����� ��������� ���������� ��� '������� �������������� ��� ����������� ������� ���� ����� �������� ��������� ��������� $������ ����������� ��&�� ���������� ����� ��%� ���� ��� ������ ��� ������ ��� ���� ����������������������������������������$*����-��%��
�� � ���� �������������� #��������� ������� �������� ���� ��-����� ��������������������� ���������� ����� ��� ������������ .���� ��'���� ������� ��� '����� ��� ����������������������� #��������/�0�����)�����))�������� ����+�'����������
��1� )�� ��� ��������� ����� ���'�������� ������� ���� ����������� ���� ���� �����������������������&���������'������� ����������������������������������������2�������������,�������������'���������������������� �������������������
��/ ����������� ���������'��-������,�����������������������������������'�,������������������������������������#����'��������������������������
��3� �������������'���������������'����'��������������������'���������������������������'���'��������������������������������#�������������������������������(�������������#��������
��4 ���� �������� ��� ����� ������ ����� ���� ��5������ ���� �������� ���� ��������������������������+�'�������� ��������������+�'�����������������������������������'���
��� ��������������������������������������
��� ������������� ��� �� &��� ������ ��� ���� �������������� )����� *������������ ���������������������������������������������������������&��������������������������������� ��� ���� �����'� ������ ���� ����� ���������� *� ���� ��� ���� ��������������������������������������������*����-����
� � ���� �������������� #��������� $�#%� ������� ������ ��� ���� ������ ���������������������� ����� ����� ���������� ��� ���� �)*� ��������'� ���� 5������������� ���� ������������������������������������������������������������������������������#�����������������������������������

��� ����������������������������������������������
1��� �������,��������������������������������������������������'�������������������������������������������������������������������-�������������������������������������������������������-������������������������������������������������������������������'��������������������������������������'����������
1� ������������������ ������5���� ������� ��������� �����-�����'����������� ���� ����,������������������������������������������������������������������#����������&�� ����� �������� ���� ��������������� ��� ���� (������� ��������� *������"������������������������� ����#�����'�����������������*����������(�������� ��!�
1�1� �������������������������������������������'���������������������������������� ��������� ���� ��������'� ������ ��������2��'�������� ������������ ��'��*�������� *���������� ������� ��� �-�������� )����������� ��������� ���� ����*�������� *���������� ������� ��� ������� ����� ��� ���� ������� ����������� �������������'������������
��� ����������������
/�� ������������������������������+�������������������6
�� �������������������������������� ���� �������� ��������� ��� ���� +����� ��'�� (��� ���������� #������� ����
���������������� ���������������������+�����������7��� ���� �������� ��� �������������� ����� ���������� ����������,� ��������� '�����
�������������7�� 8��� ���� ��������� ����������� ����� ��������� ���� ������� ����������,� ����
������������ ��� ������ ��'���������� ���� ��� �������� ��� ���� ��������������������'�� �������� ��� ���� ������������ �������� ��� �������������'�������������������������������,��������������������������������9��&'������+������
��� ������ ������������������!����"�
3��� �����#�����������������������������������������������������������������������-�� ������� ��� ���� ��'��� ��������&,� ��'��������� ����� ������ �������,����������� ����������� ����,� '���������� ���������� ���� ������ '�������� ������������� '�������� ����� '���������� ����������� ���� ������ ������������'���������*�����������������,������#������������������������&'������������������������'�����������������������������������������������������������������������������������������'������
3� � 0�����������������������������������-����������������������������������������������������:��������������������������������������������������������������;������������������,����������������������������������������������������������������������� ���� ������� ����� ������� ��� �������� ������� ���������� ����������������������������������������
3�1� ���� ����������� ��� ����� ��������� ������� ������������ ����������� ����� ��������������� 0����� )�� ��������� ����� ���������� ��������� +�'������ 0������'�

<�������� ��� $ ���%,� ���� ��������� #��������� 0���� $ ��/%� ���� ���� +���������9����'�� =����� 0���� $ ���%�� +�'���� ������� ����� ��� ���� ��� ���� ��������� �������������� ���� ������ +�'������ #������ #�����'�� $ ��!%7� ���� ��� ���� (��������0������'�0������.�������&�$(00.%�
#�� �����$����������������������
4��� �����#��������������������������������������������������������������������������������'�������������������������,���������������������������������������������>���������'?���������
4� @����� ����� ������',� ���� +����� ������� �������� �� �������������� ��� ���������������������� ��� ������������������������������������� ����������������������� ��������� ��� ���� ������ ����� ����� ����� ���������������� +����� ������� ���� ���� ����5�������������������������������������������� ��������������'���'�������������������������
%�� &����������������&��'�������&�����
A�� ���������������������-����������������������������������������������������������������������������������'���������������������������������������������������� ������� ��� ������������ ����� ���� �������� �������� ��� ���� ��������������+������ ���� ��������� ������� ��������� ���� �����'� ������� ���� ������� �������������������������������������������������������������������������
(�� $������������)��'��&�����
!�� 9����������������������������������������������������������������������������������'6
�� �������������������������������������7��� =�������������������������������������������������������)��������
#������=��������*���������� ��A������������������������������������������������
���� +����������������������������������'�������������������������������������,���'��������������������,��������������������������������������������������
��� ���������������������������������������,����������������������������������������������7
�� ����������������������������������������������������������������������������������������������������������������������������������������������������������������������,������,����������������������������������������������'�����������������������������������������������������������������������������������
���������������'����������������������������������������'������������������������������������������������������
*� &������������� ������$���
B�� �������������������������-��������B��������������������� :����'��������=��������*�������<�����=��������C�����$*<=C%�������#����������������������&������������������*<=C���������'���������'������������������������������

B� ��������������������������������������������-����������������������)��������#������=������������������#����� ��3; ��A��
B�1 +�'����������������������������������������������������������������������������'��������� ������������ ��� ���� (������� ����,����������� ����� ��'���� ��� ������������������������������������
��� ����������+'���,����-������������������
���� ����+��������������������������� ���������������������������� ������������������� ���� ������;��������� ������������ ��� ���� ������)�� ������� ��������� �����������������������������'�����������������
���� ��� .
����� �����#�������� ��������� ����������,���'�������������'����������������� �������������������'�������������������������������������������,�����������'��������������������� ���&��� .����������,� �������������� ������� ��� '����� ��� ���� ������������������������������������������������������������������
��� ���������'����� ����������� ������ ����������������� ����������� ��������������������'������ ���� ��� ��������,� ������������ ������� ���� ���� �-���������,� ������������'�������7
�� 0���������������,�����������9���������������'������7��� ����'�����������7���� 9*0�8���������������������������'�����;��������'�������
���1 �����������������������������&����������������������������������������������������������������������'��������������������������������
���/� ���������������������������������������������������&����������������������'�������������������������������������������'���*�D0������D����������������������� ����� ���� ����������'� ������ ������� ��� ����������� ���� ����� ���� �������������������������������� ����� ���������-����� ���������������� �������&������,����������������������-�����'��������������0����������������������������������������������� ������ ��� ��������� �������� ����� ���� ��&���� ��� ��� ���������� )�� ��������������� ����� ��� ����� ��������� �������� ��������� ���� ��������� ���������������� ����� ���� ����'�� ��� ���� ������ ������ ��� ����� ���� ������������ ���������������������������������
���3� �����#���������������� �������������������&���������������������������� ���������� ����� ��������,� ��� ����� ��� 5������� ���� ������� ��&��� ���� ����������������� ����������� ����� ���� ����� �������� ����� ������ �������� ��� ��� ����� ���������������������������������*����������������������������������������������������������������������������������������������������������������������������������������������������������������������'����������������������'����
���4 �����#����������������������-�������������������������:�����������������&����,��� ��������������� ����� ��� ��� ���������������� ���� �#� ������ ���� ����������������������������������������������������������������&����������
���A� ���� �#� ������� ��������� ������ ������� ��� ���� ��������� ��� ���� ��������������������������������������������������������������������������������������

�������� ������� ����� ���������� ������� ��� �����������,� ��'����'� ���� ���� ����� ��������'������������������������'��������������������������������������
��� +.���� .,�+.��� ��� .,�/����0��1
� �� ���� +����� ������� ������� ��������� ������������ ��� ��������� ���������,�'����������� ���� ������������� ����,� ����� ���&,� �������� ������ ���� �����������'�,�����#�����������������'��#�������$#@�#%�
� � �����#�������� �������'������������� ����������'���������������������������������������-����������������#�������������������������������������'��������������������� ��� �� ������������ ��� ���� ������������� ��� ���� ������������ *�������'�����������������,������������'���'�������������������������������������������������
���� 2��������
�1��� *����������#������������������������������������������#��*�����������������������������������������������&���5��������������������������������������������������'������������������������������ 5������������ ���&���������������������� 8�'������ *'����� ���� ���� =����� 8�'����� *��������� ��� �������� ��� �������������� ��� ���� #���������� ������������������� ����� ��� ��� '����� ��� ��������������� ����������,� ���� ���� ������������� ��� ������������ ���������� �����������������������������������
�1� � ����#������������������������������������'6�
�� C�����������������������'����������������������������'��������������������������7��������
��� �������� �������'� ���� ���� ��&���� ������� ��� ���� ����� ������&� ���� ����������������������������������'�������������7
���� +��������'�7��� #�E�� ���� ������� ��� ���� ��������� ����������� ��� ���� ����,� ��������'� ����
��������������7��� )��������������������������������������������������������������������
���������+�'�������:��7����� *����������������'�������������������������������������
���� 3���������)�4������
�/��� (����� ����������� ���&� ������� ��������� '������� ������ ����� ���� ����������������������������������������������
�/� � ���� +����� ������� �������� �� �������������� ��� ���� ��������'� �������2���������������6;
�� �-�����'���������������'������������������������������������������������������������������������7
��� 0��������� ������ ������� ������'� �����'� ���� ������������� ���� ������������������������������7
���� 0���������������������������������������������������7��� ����������� ������ ��� ������ ����� ������ ����������� �������� ��� ����
����7�� (������������������� ��������������������7

��� *��������������������������������������������������� ���������������������������������������,� ��������'�����������'��;�����
������������7
�/�1 .������������������������+���������������������������������'7
�� �������'���������������������������������������7��� ������������������������'������������������������������������������7���� ���� ������������ ���������� ����� ���� ���� ����������� ������ ���
����������������������7������� ���������������������������������������,�����������������������'��;�����
������
�/�/ "���'��������������� ���� ������������� ���� ����������� ����������� ����� ����� ��� �������������� ��� ���� ����������� ������ ���� '������� ������������ ��� F���������������������G���������������#�������A �������������������0���������*����BA/,��������9#�3 !� (�����������������������������&���������������������������������&���������������������F��������0������������(���������C����������������������������������������#����G�$#���9#3 !�0����������� 6� ��B������������@H�(����� =�'��������,� ��� ��������� *� ������� �����'� ���������� ������� ����� ���������������
���� !'�'���+����� ������������� .
�3�� ���� +����� ������� �������� �� ������������� ���&� ������ ������� ��� �����������'����� ������������ � ����� ����� ��� ��������� ��� ���� ������� �������������������������������������������������&������������&���������������������7
�� *�����������'��������&�����������������7��� 8���������������������������������������7���� 0���������������+�������������������������������������������'���������
����������� ��������� ���� ������� ����'������ ���� ��������'� �����������������������$��F:�������#���������)������'�����G%7
��� �������������� ��� ���� ������� ��� =������ 9������'�,� ��'������ ����� ���;����'������ ��������'����� �����,� ���������� ���� ���������� ������ �����������������������������*���#������8��������������������+������
�#� ����5�� ��'�'�����������'��
�4�� �����#��������'������������������������������������������������������������������������������������������������������'���������� �����������������������
�� *�������������������������'������&;�������������������'������;���������������������������������*'�����������=������������������������������������������������������'���������������������������7
��� *������������������������������&�������������������������������������������������������������'���������������,���������'������������������������'�������������������������������������������������������'�����������������������������������7
���� ���������������������������������� �����������������7��� ����������������������'������������������������,����������������������
�����������������������������������������������'���������������7

�� *����������������������&�����������������������������'����������������������
�%� ����3��� ���������������.
�A�� �����#��������������������������������'����������E���������������'���'������������'���'������������������������'����'��(���'��������������������������������������������������������������'�����'����������������������'����������������������'�����������������������������������������'���
�(� 0��������,2�'����,6'������
�!�� �������������� ������� ��� '�������� ������� ��� ������ ����������� ���� ����������������'�8����������0������8������ ��� ���� ������������ ���� ������������� �������������������� ������������ ���� ��������� ������ ��� �������� ������� ��� ���������������������������)�����#������������������������������#��
�*� 0�����������7��������������������
�B�� �������������� ������� ��� '����� ��� ���� ����������� ��� ������ ���������������������� ����,� ��� ������'� ��� �� ������� ��� ���� �������� � #���� ������������������������������������,������������������������������
���� ���� �����
���� )������-���������������'���������������������������������������������������������������������������������������+���������������������������������������������������'����'���������������������������������������������������������
���� !'�'������������
��� ���� +����� ������� �������� ��� ������ ����������� ��� ��������,� ��������� ����������������������������� ������&���������������������������������������������������������������������5���������������������������������',���������������������� �������� ����� � )�� ������� ����� ��������� ���� ��;������������ �������� ��� ����������������������� ������,� �����-����� ���� �������������������� �������������������� ���������������������� ������������������������������������'�������������'�����
���� 3���2�������'����.
�� ���� (��;���������� #������� ������� ����'� ��'������ ���� ���� ������� ��� ����������� ��� �� ������� ��� ������ ���� '������� ������ ��� ���������� �������������������������������������������������������
���� !��'����
1�� ���� ����������� ����� ����� ��� ���� ���� ������������ �������� ���� ��� ���� ��� �����������
�'����.
�����#����'����������&������������������������������������������������������������������������� +����� ����������'� �� ������'� ���������� ���� ���� ������

�������������8����������������������������������������#����'���������������������������������������������������������������-���������
��������� ��;����������� ������������ ����� ���� #�����'��� ����������� "���'����������� ���� ������������ ��� ������� ���� ���������� ������ ���� �������� ����� ��� ������������������'�������������'���
#������ ���� ������� ��� ����'�� ���� �������� ��� ������������ ����������� ��� ������������� ������ �������� ���������������� $������ �������;9����%� ���� ���� �������� �������������� ��� ���������� �������� ��� ���� �������� ��������'2�����'� ��� ���� ������� �������������
I��������������,
0����"����8�������0������'�����+�'���������
���6���!A //31�����6���������J���������'����&

����3�&8�$&�2$�������!���'�������������������
�������"���9 ���������'4�������:������;$�������<�������"�6�9 ������������� ��.�������"�!�9 =�������2�'���������"���- !���7��!�'���2����:������������"���9 3�0$����� '����� �������"�/�- 3��'����� ���

�������"���9 ���������'4�������:������;$�������<
#������6��������>������������������������������������������������������������������������������������������������������������)*������������������������ �����6=�������������������������������)������C������������������������������)�����
0�������������>���������#��������������������4������'�������������>���������*(9�"���'������0���� ���; ��4���������K�)�������#������=������������������*���������,������������������������,��������� ��A=�*��
0������������>#������������������������������������������������������������������������������������������������������������������������������������������������������������������������������������������BA2��2���*�������3$�%6�������������������������������������������������������������������������'����������������'�������2����������,������'�2�'�������������������,��������'������������������������������������������
/'�0����������'����������'����.
��� �����
�����#�������������������������������������������������������������� �������'�������������������,����������,������������������������������������������������������������������������������������������������������'��������������6=��������������������������������������������������������������������������,���'����������������������'�����������������������������'����������������������������������������������������������������������������������������������������������������������������������������������������������������'����������������'����������������������'������������������������������������������������
)������������������������������������������'�������������������������'�����������������������)*������'�������������������������6;
(��������'�������6�������������������������������������������������� $<=C)*%,�����=��������)�����������������)��������������������������"���'����������*����������$ ������� �� %
��� $��������9���'��
:���������������������������������������������'�������������������������������������������'�����

� *(9���������8�������#���������������������������������������������������������������������������'�����'����������������2����������������������������������������'������
� *<=C�:����'�������=��������
����������������3&�����������������'����������2��������������'�����������������,�����������,���'������������������������������������������6
###)��������������:#����������2�(���&�����:�����:#�0�����+�������������.�����:����:#����E�������������"�����������������
������������������-����������������������������������������������&���������������������
������������������������*�3�(�������0����������������������������������������������������������������������������������������������������������5������������������'�'�������������������������������������������������������*�/�(����������������2��������������������������������������������������������'����������������������������������������������������������������������������������������������������
������������������������������������������������<�����1�*=�����5����������������������*'�����������=�������������������*=��'�����1�����������������������������������*=������F���������������������������������������������������������������������������������������������������������������������������������������������G�������������������������'�<�����1���������������������������������������������������� �����������'�������,� �����1���������������������������'�������������������������(����������������������������F�������������������������������������������������� �������������������������������������������������������������������������������������������������������������������������������������������������� ���������������������������������������������������������������������������������������������������!"
��� )��'��������.�9���'�������
������������������������������6
� ����2��������2����������������������� L�������C������)���������"������������������'�������-��������������������
��������� ����������������������������������������� ����'�������������������������������������&���������������������������
������ ����������������'������������'������������������������������ �������������������-������������������������������������ ����'�������������������������������������������������������������� �-�����������������������������
������������������������������������������������� ��)(�/B�; *'�����������=������������������6���������'������������������������������'�����������
����
���622���������'����������������������2���������'�������2���������-M0������)�N!!��B 4�;1�AA;
/�B�;����;���4�B�1�� B
2.����������������� �����>
$��������������
�� &�����'����
� ��������������� ����������'���5���������������������������������������������5���� ����������'������������������������ �������������������������������'��������������'������������������
�������
�� $��������6���������'�.
� #�����*���� ���&�#����� .�����#�����
�� &����������������&������������������������������ �����������$��������������
� *�������'�"�'����������)����� *�������'�=��������#����������� *�������'�#�'��������������������� "���'��������������� +��������)�����
)��'��&�����
�� &�����'����
� )���������'������-��������C���������� ����������'�����L�������C������)���������$LC)%� ���&�#����� .�����#������ C������+������������������#����������
�� &����������������&�������������������� ��������� �����������)��'��������
� +�������'�C�������������� "���'������ *�������'�"�'����������)����� *�������'�#�'�������������C�������������
�� ���� ����������'���
�� 0����'��������
)�����������=C)*���������-��������'������������������������ ���'������������������ ������������������.��������������������������;�<�����������������'�������

�����������������������������������������������������������������������������������'��������������'��'���'�����������������������������������������������������������������������������������������������������������>���������?,�>�������?,�>�����?�>�������?�������������������'��������������'��'���'�,�������,�����

�������"�6�9 ������������� ��.
�&���!:�&3��0�?@��2�0�$�2&3��2:��0:�:����3�=?@�A�!:03=�$$��&0�:02�$:!�$���)�$:���32�:0��0�;�+�����<�3�=?@�A�!:03=�$$��&0�:02�3�=�0:���!�0$:������2���=��3�3�=?@�A�!:03=�$$�20(��0?������
����&����������������������������������������������!������ �� ������������������������
������������� ��.���������
:��������������������#�*�������(�������� ��!,�����"��������� ��!; �1����������������#��������������������������������"���'������#�����'����������������� ��!�����(����������������*������
����#�*�����#��������������������������������"���'������#�����'��'����������������������������������������������������������������)*���:�����������������������������&����'�����'�:�����+�������,�.�����+��&�����<�����)�������������,�����:�����.�������&����������������������������=�������������������������������������#������������������������������������������������������������������������������������������������������������
=�����0���'���
�����)*��������������������������������������������'��������������,�'���������������������'���������������������
*���������������������������������'�����������������������'�����������;������������'�����������:���������������������������������������������,�������E�����������������'����������������������'���������������������������������������������������'��������������������������������'�����������������������������������'�����������������������������������������'����������������'������������������������������������������
�����)*����������������������������������������������������������������������������������������������������$���������������������,��������������������,����% ���������������� ������������� �������������������������������,�����������'������� �������������������������������������
/����0��1�B�������&�������'�'��
������������'���������������������������������#�*������'������������������������������'����������������������:����������&�����������������������������������������������'�������������������������������������������������������������#@������������������������'��������������������;������������������������������������������������������������������������������:���-�������������<�����)��������������$<)%����������������&���������������'��������������������������;���������'��#@�������'����������������������� ����������:������������*����-�*������������-��������*�������9��������0��&�L���� ����������&�������������������������7�������������������������������)*���������������������'��������������<)�������������������������������������������0����������

:���������������������������������������������-������������'��������������������������������������������������������������������������������'��<������������������������������������������������������������������������������6���622�������������'����&2����������-M�'�N 1A�A
=�����/����7��1���������
�����)*���������������������������:�����.�������&��������������'��������������������������'������������������������������������������������' �����,���������������������������=��&������������'�����������:.�����������������������������6���622���������������;�'�����'����&2��������2������'211��4���-
!���������������
�����)*����������������������������������������������������������������
������������������������������)*�������������������������������������������������������,����������'�����'������,���������'���������������-����������������������)�����������������������������������������������������������#�����'��������������������������������������������������'�����������������'������#����"���'������0����������������������,�����)���'������:�����"���'������#�����'��$):"#%,�����'����������������������)�������������������������'�������������������������������������������������������'����������������������������������������������������E���,���'������������������������,����������������������
:���������������������������������������������'���������������������&��������������������������������"���'������0����$��"0%��������'�����������������������������������������*���"0��������'��������������'���������������������������������$��������'�����#���������:�����"���'������0���%����������������������������,������'������������������������*���"0������������������������������������������)�����������'�������������������������������������8�K�#����&����������'����*����� ��"0��������������������������� ������������������������'��������������'�������������������������������������������#��������������������������������������������������������������������������,�����'���������������������� ������������������� ������������������������"0�
:���������������������"0����������������'�����������'������������������������������'������������������������,�00<4����622�����������������������;�'�����'����&20�.20"8�/��9#<(;�;����
)��������
� ���������������������!��1����=��1� �������������������'��'����������������������&���������������������'�����������'�����������������������,���������'���������������������������������������&���,����;�����������,����������������������'�����������"���������'� /����������'������������������������������������������������������������������*'����������������������������������������������������'������������������������������������������������&���
� ��'�����!����� ��������������������������;��������������������������������'���������&����'�������������'������������������,�����������������������������������#@�����������������������������������������������������������������'�����,������������������������������������������������

� �������6����������.5������������������������������������ ���������������������������������������������������������������������'���������'����������������������������������������������������������������������������������������������������������'����������������������������������������'�������������������������������������������'������������������������������������
� �������������'�����&���������������������������������'������������������������������ �����������'�������������������������������������������*'�����������������������
� ����#���������:�����"���'������0�������622���������������;�'�����'����&2��������2�������21 A B���- ���&���������������������������������������
:���������������������������������������������������������������������������������������

�������"�!�9 =�������2�'��
�������>��&������� ���C'���������� �������������3�7C'�.�!���7����������$��������������:�����;�������<�
����&������������������������� ���������������������������������������:�����������������(���������'����?��*�������:��������)������������*�������:��������������������������������������������������(����������������*�������*���������������������������������������������������������O ��� ��������������������������,��������,������,��������������������������������������������������������(��������0������'�0������.�������&����'������!�������������F������'����������������������������������������������������'������������������������������������������������������,���������'�����������������������������������'��������������������������������������������������,��������������������,����������������,�����������������������������������������������'�����������G�
:�������������������-������ ����'�������������������������������������������������������������������������������������������������)����������������'�������������������������������'������������������������������������������������������������
:���������������������'����������)�����������������'��������������������"���'������$)��"%�����������������������������������'��������������������������������������)*�����������&����������,���������������������������������������������������'�����������������������������������������)�����������������������������������������������������������������������E���������������������������������
(��������0������'�0������.�������&����'������!������������������F*'������D�������D�����������������������������������������������������������������������������������������������������������������������)������������������������������������������������������������������������������������'�������������'���������������������'��������'�������������9#�3!1A��
:���������������������������������������������� ����������������������'���������������������������������������������������������������������#��������7������''�����������������������������'�����������$������������������-��������%��
�����������=�������&�������.�;����������<�������'�����O �����������������������������������������������"*<)�����������*�������:��������������������������������������������������������������������������������������4��*�,����������������6�
� *�������#���;����������������7
� *��������������������������������������������������� ���������������������������������������������,�������'�����������������������'������������'����������'������������������'�����������������7
� *�������+��������:�������7
� *�����������������������������������'������������������������������������������������������������',������������������������������������������������
)����������,�����������������������������������������������������������������������������������������&��������������������$��'������������������������� �������������������������������������%������:����������������������������������������������������������*:),������������������������������������������������-�����������'����������������������������������������������������������������������������������������������

���������������������������������&���������������������������������������:���������������������������������������'����������������������������������������������������@H����������������������������������������������������
#��������������������������������������������������������������������,���������������������������5�����������������������������&�������������������������������=��������������������������������������������������������������������������������������������������������������
I������� ���������� ��� �������� ���� ������ 9������������ +�������������� ���� ����� ������������ ��� ������� ������ ������������� �������� ���� ����&� ���� ��������� ������� ���������(������� ��'����� ���� ��������� ������� �������'� '�������� ���� ��������� ������,� ����������� �������������� ��� ������'� ���������,� ��������'� ������� ��� ������� ���&� ��������'������

�������"���- !���7��!�'���2����:�����
���� �#� ������� �������6� ��� ����� ������� ��� ����������� ����� 9#3!1A�� �� 8��'���������������������������� ��������������������8��'�����+�'����������BBA���������������� ������������ ����� ���� ����� ������� ��� �����'����� ������������ ��� �����'����2�������������� ������� '������� ����,� ��������� ��� ������ ��������� ���� ���������'������������������7��������������������'��������������������&������&��������������������������������������������������������

�������"���9 3�0$����� '�����
��������������������������������-����������������������������'������'������������������������������������������'������'���������� *�������'��,�(*�#�$���+����%�=������������������'������'���5�����������������������
0�������������������������������������������������������������������������������������� ���� ������������ ������� ��� ���� ����� ��� ����� ���������� )�� ���� ����'��� ����������������������������������������(�+=������'����������������������$��������'����������������������������������%���������������������������������,��������,����������������������������������������,�������������������������������(�+=��������������������� �������� ���������� ��� ���� ����� ����'��� ����� ��� ���� ������'� ���������� ��� ����������������'�'�������

�������"�/�9 3��'����� ���
(���������'�������������;�������������������������� ����������������������������������������������������������������������,���������,���������'����������������������������������������'����������,��������������������'����������������������������
����������"���������#�*�+�����$(�������� ��!%�������������������&'�������������������)����''������������������������������������������&����������������&���������'������������������������������������������������������������������
(������������,�����+������������'���'������������������������������������� �����������������������������������������������������)*�������������������������������������������,���'����������������������������������'�����������
:����''���������������������������������������������������������������������������������������������������������������������$��'���������������������5������������������������%��������������������������������������������������������������'��������������$��'��'�������������������������������������������������������%��
����������'�����������������������������������������������������������'�����������������������������'���������
���622�������������'�������'��&2������&2������'����������2������������'2�������'������2����������-�
.������������������������������������������������������:����'��������=��������*�������<�����=��������C�����$*<=C%���������������������������������������������:��������������������������������������������������������������������������������������������������������������������������������
����+������������������������������������������������������'�����������������������������������������������,����������������������������*���5���������������������������������������������������)*���������'������������������&��������������������������������������������������������������&��������������������������'����������������������������������������������������������������������
.����������������������'������������������������������������������������������������������; ��������6��1����4�� ������������6���������������&J���������'�������'��&��

Appendix 2.1 – Local Development Order Site Option Analysis

LDO Options Analysis: Business Park Land Newquay Cornwall Airport
LDO1.0 What is an LDO?
� Order by LPA � Grants planning permission for specified development. � Development outside framework requires planning permission � Location specific � Defines development parameters and specific rules
1.1 Why LDO? Is an LDO the right vehicle to provide planning freedom required? We feel that it is for the following reasons:
� It delivers a comprehensive planning framework – when we have very little in place. � Reduces cost and risk – no planning fees � Reduces burden on LPA and consultees. � Promotion and communication of clear policy � Investor certainty and confidence – planning a real and perceived consent � Rapid response to investors � Easy to promote � EZ policy on planning freedoms
We don’t feel that alternative planning options (which are limited) will give us the freedom and investor attractiveness that we require.
1.3 LDO 2 Development Definition: The LDO will have quantum of development (as described within Screening Opinion (SO)). The current feasibility and market assessments will ascertain the detail of the permitted development.
Need/Supply & Demand
2.0 Evidence Base: We are in the process of concluding two pieces of evidence base: 1. Overview of Market Demand for Business Space (RTP Peter Brett). Valuation
and other professional advice to establish evidence base for development activity to specifically support LDO2.
1. Aerohub EZ @ Newquay Cornwall Airport Market Assessment Report (RDC Aviation) Detailed market assessment to assist in identifying opportunities for both ‘inside’ the fence activity and assess both supply and demand factors from or in the aviation/ aerospace industry.
These have both concluded. They both support the quantum of development land proposed.
2.1 Other uses: To date only employment/business uses (B1, B2 and B8) have been considered as a part of the strategy for the business park land. Other uses such as a Hotel/pub/restaurant in association with the Business Park have been considered but do not form part of the current LDO option 1 and strategy. Other uses such as retail and housing have not been considered to date due to proximity to the airport and overall sustainable development principles. If we include other developments then this clearly will affect the quantum of development and EIA requirements.

LDO Options:
3.1 We have 2 clear options both have clear advantages and disadvantages. I have outlined in the table attached in Appendix 2 a detailed analysis for the pros and cons of each option covering the project drivers and constraints.
3.2 LDO 2 Area of land (see plan)
Option 1: 20 ha (49.4acres) within area of search of c31.6Ha (78 acres) to east and west of SAR as below.
Option 2: The remaining development Land on the south side to the east of the SAR (and including the SAR) without planning. Totalling 35.5 Ha (87.6 acres). 3.3 LDO Drivers:
Our view is there are three main drivers in order of priority: 1. Planning Certainty (and value): The site has little planning status the sooner this
can be derisked albeit on part of the land the better. This also immediately releases value and makes the site saleable. Once the overall principle of development has been established this risk diminishes dramatically
2. Need (supply and demand) in our view the most important as it in turn drives value, planning justification and associated development risk. The quantum of land required for the development proposed for the medium term (10-15 years) term has been independently assessed and should be the principle driver. This must of course be balanced by future proofing and a sensible approach to phasing.
3. Deliverability: There are a number of critical delivery factors to consider in the options analysis such as:
a. Road access from the SAR b. Site conditions such as archaeology and habitat. c. The ability for the planning granted to satisfy the “substantial test” within the
Baker Bros FBT. d. The assessment of the likely level of clawback from the option chosen.
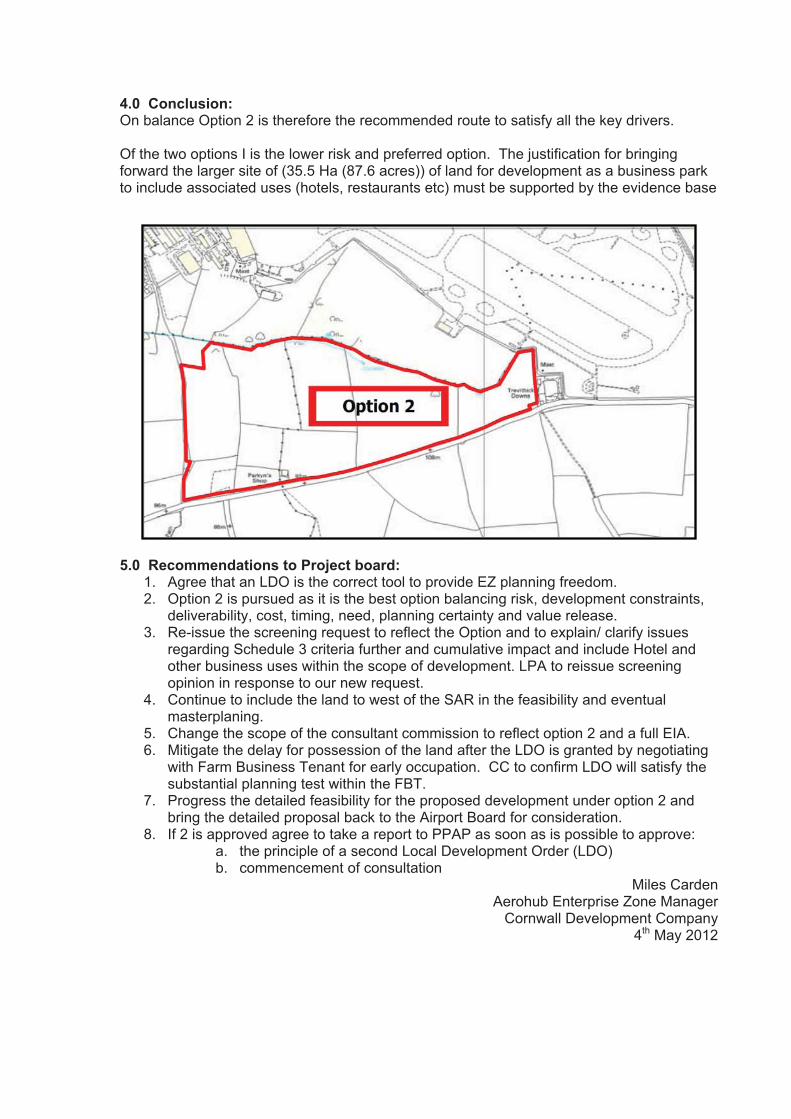
4.0 Conclusion: On balance Option 2 is therefore the recommended route to satisfy all the key drivers.
Of the two options I is the lower risk and preferred option. The justification for bringing forward the larger site of (35.5 Ha (87.6 acres)) of land for development as a business park to include associated uses (hotels, restaurants etc) must be supported by the evidence base
5.0 Recommendations to Project board: 1. Agree that an LDO is the correct tool to provide EZ planning freedom. 2. Option 2 is pursued as it is the best option balancing risk, development constraints,
deliverability, cost, timing, need, planning certainty and value release. 3. Re-issue the screening request to reflect the Option and to explain/ clarify issues
regarding Schedule 3 criteria further and cumulative impact and include Hotel and other business uses within the scope of development. LPA to reissue screening opinion in response to our new request.
4. Continue to include the land to west of the SAR in the feasibility and eventual masterplaning.
5. Change the scope of the consultant commission to reflect option 2 and a full EIA. 6. Mitigate the delay for possession of the land after the LDO is granted by negotiating
with Farm Business Tenant for early occupation. CC to confirm LDO will satisfy the substantial planning test within the FBT.
7. Progress the detailed feasibility for the proposed development under option 2 and bring the detailed proposal back to the Airport Board for consideration.
8. If 2 is approved agree to take a report to PPAP as soon as is possible to approve: a. the principle of a second Local Development Order (LDO) b. commencement of consultation
Miles CardenAerohub Enterprise Zone Manager
Cornwall Development Company 4th May 2012

Annexe 1: Plan of South Side Development Zones:
Summary of Development Land on the south side of NCA: PlanningDev Zone Ha AcresLDO Status Airport Masterplan
StatusWest of SAR 20.5 50.6 No planning NoEast of SAR 35.5 87.6 No planning (SAR
in LDO1) Yes
Business Park
North 6.2 15.5 Within LDO 1 Yes South side Terminal Zone 20.2 50 Within LDO 1 Yes Aerohub Dev Zone #1 13.4 33 Within LDO 1 Yes Total 95.8 236.7 These are all Gross areas.
Comparison of other sites to show scale: 1. Exeter Sky Park 43 Ha (107 acres) 1.4msqft 15-20 years planned development 2. Cardrew Industrial est Redruth 36Ha (90 acres) 3. St Columb Major Business Park 6.8 Ha (17 acres) 4. Indian Queens BP 14 Ha (35 acres) only 50% developed after 18 years 5. Pool/Barncoose Industrial Estate 40 Ha (100 acres)

Ann
exe
2 –
LDO
Opt
ions
Ana
lysi
s LD
O O
ptio
ns
Opt
ion
1: 2
0 ha
(49.
4 ac
res)
Opt
ion
2: (3
5.5
Ha
(87.
6 ac
res)
) LD
O
Sum
mar
y
Proj
ect D
river
s
Con
side
rs th
e be
st 1
5-20
Ha
of la
nd w
ithin
the
defin
ed a
rea
of s
earc
h (E
nviro
nmen
tal
Ass
essm
ent b
ound
ary)
for d
evel
opm
ent b
ased
on
the
proj
ect d
river
s w
ith a
par
ticul
ar
emph
asis
on:
�
Exi
stin
g ac
cess
�
Nee
d/de
man
d �
Cos
t (ca
pita
l and
reve
nue)
�
EZ
– ea
rly im
petu
s D
CLG
�
Fund
ing
– sh
ort t
erm
Enc
ompa
sses
the
entir
e bu
sine
ss P
ark
area
to
the
sout
h si
de a
nd to
the
east
of t
he s
outh
ern
acce
ss ro
ad b
ut N
OT
the
addi
tiona
l are
a of
land
ac
quire
d by
CC
in O
ct 2
011.
Opt
ion
2 w
ill s
ecur
e pl
anni
ng s
tatu
s on
all
CC
ow
ned
land
at t
he
airp
ort.
Intr
oduc
tion
Pro’
sC
on’s
Pro’
sC
on’s
Plan
ning
Cer
tain
ty
Airp
ort M
aste
rpla
n:ap
prov
ed b
y C
C J
une
2009
. Airp
ort M
aste
rpla
ns
have
som
e al
beit
limite
d w
eigh
t for
pla
nnin
g bu
t it i
s th
e pr
edom
inat
e fra
mew
ork
to re
ly u
pon.
All
the
sout
h si
de la
nd h
as th
eref
ore
limite
d “p
lann
ing
stat
us”.
S
ecur
ing
Pla
nnin
g is
th
eref
ore
rela
tivel
y hi
gh
risk.
Sec
ures
pla
nnin
g st
atus
on
the
land
re
lativ
ely
quic
kly
at
rela
tivel
y lo
w c
ost.
Any
pl
anni
ng is
not
cer
tain
an
d th
is w
ould
es
tabl
ish
the
prin
cipl
e of
dev
elop
men
t.
Par
t of s
ite is
out
side
of
the
Mas
terp
lan
busi
ness
par
k zo
ne.
Leav
es re
mai
n la
nd
with
out p
lann
ing
stat
us in
the
shor
t te
rm o
ther
than
th
roug
h th
e M
aste
rpla
n.
Link
s m
ore
cohe
rent
ly w
ith th
e la
nd p
redo
min
atel
y id
entif
ied
thro
ugh
the
Airp
ort
Mas
terp
lan.
Pro
vide
s fu
ll pl
anni
ng to
all
land
to
the
east
of t
he
SA
R.
As
it is
a v
ery
larg
e si
te th
e ne
ed a
naly
sis
need
s to
su
ppor
t thi
s qu
antu
m. L
DO
co
nditi
ons
mig
ht; b
e m
ore
strin
gent
, req
uire
furth
er
envi
ronm
enta
l wor
k as
ph
asin
g pr
ogre
sses
, re
stric
t per
mitt
ed u
ses.
H
ighe
r ris
k of
exp
iry o
r ev
en th
e po
tent
ial v
iew
th
at th
e pr
opos
al s
houl
d no
t be
supp
orte
d by
pl
anni
ng a
s no
t del
iver
able
ba
sed
on e
vide
nce.

Intr
oduc
tion
Pro’
s C
on’s
Pr
o’s
Con
’s
Proj
ect
feas
ibili
ty C
ost
The
two
optio
ns w
ill re
quire
di
ffere
nt le
vels
of w
ork
with
op
tion
2 ha
ving
gre
ater
co
st.
Like
ly o
vera
ll co
st to
ac
hiev
e pl
anni
ng
c£10
0k
Non
e –
Rel
ease
s £1
00k
to b
e re
dire
cted
into
oth
er
activ
ity.
Fund
ed fr
om IB
D &
10
0% E
RD
F Li
kely
cos
t to
be o
ver
£250
k an
d th
is w
ill re
duce
he
adro
om in
pro
ject
by
£250
kPr
ojec
tR
even
ueFu
ndin
g
CD
C is
fund
ing
this
wor
k th
roug
h P
riorit
y 4
SIF
fu
ndin
g po
t Thi
s re
leas
ed
fund
ing
head
room
to
prog
ress
oth
er
wor
kstre
ams.
Use
s E
RD
F fu
ndin
g fro
m a
ltern
ativ
e po
t (P
4) a
nd p
rovi
des
anot
her £
100k
of
proj
ect f
undi
ng
Pro
gram
me
is d
rivin
g a
very
tigh
t sho
rt te
rm d
eliv
ery
prog
ram
me.
none
Add
ition
al w
ork
requ
ired
wou
ld h
ave
been
del
iver
ed
thro
ugh
IBD
and
P4
fund
ing
of c
£100
K m
ight
be
lost
.
Proj
ect C
apita
l Fu
ndin
gTh
e C
onve
rgen
ce E
RD
F pr
ogra
mm
e is
kee
n to
look
at
fund
ing
furth
er A
irpor
t or
Aer
ohub
EZ
proj
ects
with
in
the
curr
ent p
rogr
amm
e th
at
ends
mid
201
3
Allo
ws
the
pote
ntia
l to
acce
ss h
igh
leve
ls o
f E
RD
F fu
ndin
g po
ssib
ly
to 7
5% in
terv
entio
n on
bu
sine
ss P
ark
Tim
etab
le to
get
pr
ojec
t to
a de
liver
able
sta
ge is
ve
ry ti
ght b
y m
id
2013
.
The
proj
ect m
ight
fit
a fu
ture
pro
gram
me
but a
t low
er
inte
rven
tion
rate
s sa
y 40
-50%
Due
to ti
mes
cale
del
ays
this
opt
ion
will
not
allo
w u
s to
acc
ess
the
curr
ent
ER
DF
prog
ram
me.
Thi
s m
ight
affe
ct E
DR
F pr
ogra
mm
e.
EZ Z
one
Stat
usE
nter
pris
e Zo
ne s
tatu
s is
co
nditi
onal
upo
n pu
tting
in
plac
e a
genu
inel
y si
mpl
ified
app
roac
h to
pl
anni
ng. T
his
may
incl
ude
the
use
of L
DO
s, a
s w
ell a
s ot
her w
ays
of s
impl
ifyin
g th
e pl
anni
ng p
roce
ss.
Will
del
iver
sim
plifi
ed
plan
ning
sta
tus
as
requ
ired
for E
Z as
ag
reed
with
and
with
in
agre
ed ti
mes
cale
s w
ith
DC
LG. E
Z st
atus
will
no
t be
jeop
ardi
se
Non
e al
thou
gh. T
his
driv
er is
cle
arly
po
litic
ally
driv
en a
nd
base
d up
on th
e ne
ed
to g
et e
arly
win
s on
a
flags
hip
gove
rnm
ent
grow
th p
olic
y.
Will
del
iver
si
mpl
ified
pla
nnin
g st
atus
as
requ
ired
for E
Z bu
t not
unt
il po
ssib
ly a
s la
te a
s S
umm
er 2
013.
Pos
sibi
lity
of lo
sing
EZ
stat
us o
n B
usin
ess
Par
k.
EZ
rate
s re
lief f
inis
hes
in
04/1
5 so
me
little
cha
nce
of
bene
fitin
g fro
m th
is.
Als
o ris
k of
loos
ing
mom
entu
m a
nd th
eref
ore
EZ
stat
us
Prog
ram
me
It is
ess
entia
l to
acce
lera
te
prog
ress
on
the
busi
ness
pa
rk s
o w
e do
not
lose
po
tent
ial i
nves
tors
. We
curr
ently
can
t offe
r site
s fro
m th
e B
P d
ue to
lack
of
acce
ss a
nd p
lann
ing
Pla
nnin
g st
atus
will
be
rece
ived
Aut
umn
2012
at
late
st. A
llow
s si
tes
to b
e br
ough
t for
war
d fo
r dev
elop
men
t and
in
frast
ruct
ure
to b
e de
liver
ed.
Non
e –
how
ever
the
prog
ram
me
prop
osed
fo
r opt
ion
1 co
uld
be
subj
ect t
o de
lay
resu
lting
in c
lose
r al
ignm
ent w
ith o
ptio
n 2.
Pos
sibi
litie
s of
w
orki
ng w
ith C
C
Pla
nnin
g &
Reg
en
and
DC
LG n
atio
nal
to fa
stra
ck a
nd
acce
lera
te p
roce
ss.
With
a fu
ll EI
A re
quire
men
t an
d th
e in
crea
sed
deta
il th
en p
lann
ing
will
onl
y be
re
ceiv
ed in
Sum
mer
201
3 at
the
earli
est.
This
del
ay
will
hav
e a
sign
ifica
nt
affe
ct o
n E
Z st
atus
and
in
vest
or in
tere
st,
Intr
oduc
tion
Pro’
sC
on’s
Pro’
sC
on’s
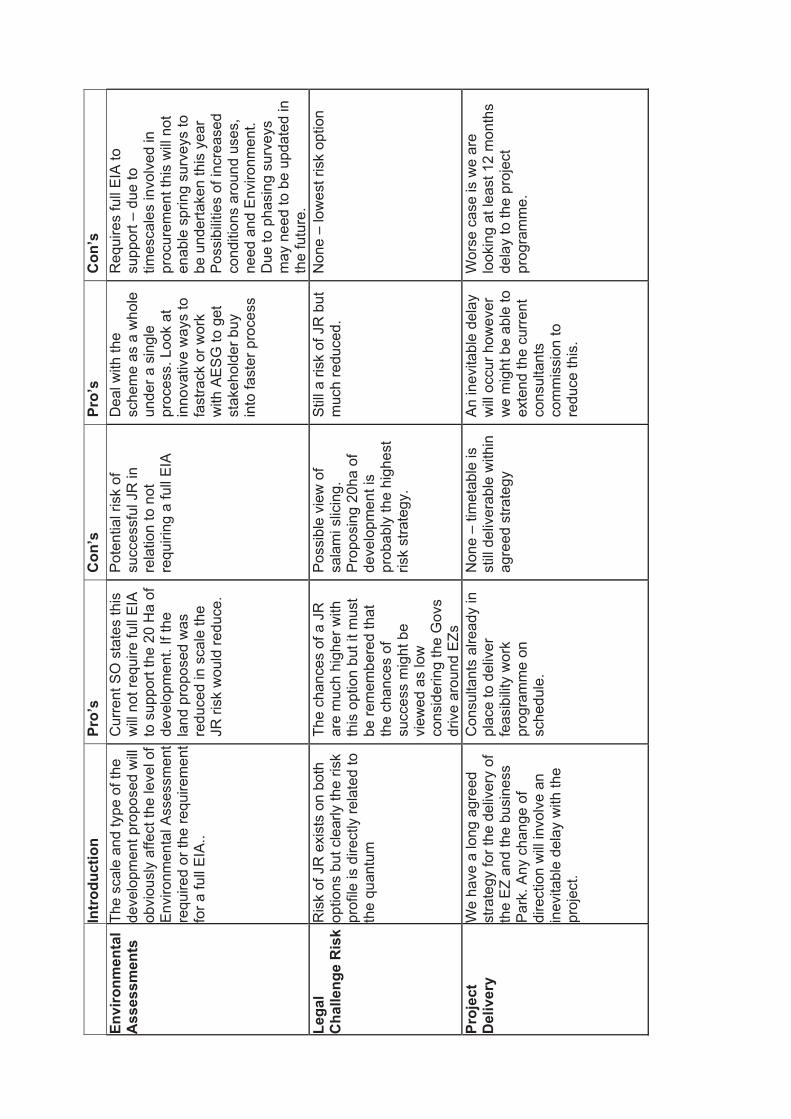
Envi
ronm
enta
lA
sses
smen
tsTh
e sc
ale
and
type
of t
he
deve
lopm
ent p
ropo
sed
will
ob
viou
sly
affe
ct th
e le
vel o
f E
nviro
nmen
tal A
sses
smen
t re
quire
d or
the
requ
irem
ent
for a
full
EIA
..
Cur
rent
SO
sta
tes
this
w
ill n
ot re
quire
full
EIA
to
sup
port
the
20 H
a of
de
velo
pmen
t. If
the
land
pro
pose
d w
as
redu
ced
in s
cale
the
JR ri
sk w
ould
redu
ce.
Pot
entia
l ris
k of
su
cces
sful
JR
in
rela
tion
to n
ot
requ
iring
a fu
ll E
IA
Dea
l with
the
sche
me
as a
who
le
unde
r a s
ingl
e pr
oces
s. L
ook
at
inno
vativ
e w
ays
to
fast
rack
or w
ork
with
AE
SG
to g
et
stak
ehol
der b
uy
into
fast
er p
roce
ss
Req
uire
s fu
ll E
IA to
su
ppor
t – d
ue to
tim
esca
les
invo
lved
in
proc
urem
ent t
his
will
not
en
able
spr
ing
surv
eys
to
be u
nder
take
n th
is y
ear
Pos
sibi
litie
s of
incr
ease
d co
nditi
ons
arou
nd u
ses,
ne
ed a
nd E
nviro
nmen
t. D
ue to
pha
sing
sur
veys
m
ay n
eed
to b
e up
date
d in
th
e fu
ture
. Le
gal
Cha
lleng
e R
isk
Ris
k of
JR
exi
sts
on b
oth
optio
ns b
ut c
lear
ly th
e ris
k pr
ofile
is d
irect
ly re
late
d to
th
e qu
antu
m
The
chan
ces
of a
JR
ar
e m
uch
high
er w
ith
this
opt
ion
but i
t mus
t be
rem
embe
red
that
th
e ch
ance
s of
su
cces
s m
ight
be
view
ed a
s lo
w
cons
ider
ing
the
Gov
s dr
ive
arou
nd E
Zs
Pos
sibl
e vi
ew o
f sa
lam
i slic
ing.
P
ropo
sing
20h
a of
de
velo
pmen
t is
prob
ably
the
high
est
risk
stra
tegy
.
Stil
l a ri
sk o
f JR
but
m
uch
redu
ced.
N
one
– lo
wes
t ris
k op
tion
Proj
ect
Del
iver
y
We
have
a lo
ng a
gree
d st
rate
gy fo
r the
del
iver
y of
th
e E
Z an
d th
e bu
sine
ss
Par
k. A
ny c
hang
e of
di
rect
ion
will
invo
lve
an
inev
itabl
e de
lay
with
the
proj
ect.
Con
sulta
nts
alre
ady
in
plac
e to
del
iver
fe
asib
ility
wor
k pr
ogra
mm
e on
sc
hedu
le.
Non
e –
timet
able
is
still
del
iver
able
with
in
agre
ed s
trate
gy
An
inev
itabl
e de
lay
will
occ
ur h
owev
er
we
mig
ht b
e ab
le to
ex
tend
the
curr
ent
cons
ulta
nts
com
mis
sion
to
redu
ce th
is.
Wor
se c
ase
is w
e ar
e lo
okin
g at
leas
t 12
mon
ths
dela
y to
the
proj
ect
prog
ram
me.

Intr
oduc
tion
Pro’
sC
on’s
Pro’
sC
on’s
Evid
ence
Bas
e –
Nee
d/D
eman
dW
e ar
e in
the
proc
ess
of
seek
ing
an in
depe
nden
t re
view
of t
he d
eman
d fo
r la
nd a
nd p
rem
ises
. Ear
ly
indi
catio
ns a
re th
at th
ere
is
sign
ifica
nt s
uppl
y of
land
on
BP
adj
acen
t to
airp
orts
an
d de
velo
pmen
t will
take
tim
e an
d sh
ould
be
phas
ed. W
e ar
e aw
aitin
g ad
vice
on
quan
tum
and
ph
asin
g.
Will
be
prov
ed b
y th
e de
man
d as
sess
men
t cu
rren
tly b
eing
un
derta
ken
by R
TP.
Like
ly to
pro
ve th
at
dem
and
will
be
stro
ng
but l
imite
d du
e to
re
stric
tions
on
disp
lace
men
t – n
ot
abou
t loc
al n
eed
– ne
w g
row
th
If de
man
d ou
tstri
ps
expe
ctat
ions
we
may
no
t be
able
to
acco
mm
odat
e de
man
d an
d w
e w
ill
lose
inve
stm
ent.
Evi
denc
e of
nee
d fo
r thi
s la
rger
are
a ov
er a
long
er
perio
d is
not
bei
ng
soug
ht b
ut is
like
ly
to b
e ve
ry d
iffic
ult
to p
rove
. Pla
nner
s ar
e lik
ely
to
dem
and
that
it is
ne
w g
row
th
atta
ched
to a
irpor
t no
t loc
al n
eed.
Cou
ld o
ver d
eliv
er la
nd
and
pote
ntia
l for
poo
r pe
rcep
tion
by th
e pu
blic
an
d m
arke
t. W
hils
t LD
O
does
not
pre
vent
oth
er
appr
oval
s on
the
sam
e la
nd th
ere
is p
oten
tial b
y es
tabl
ishi
ng L
DO
app
rova
l to
dra
w li
ne in
the
sand
an
d pr
even
t oth
er u
ses
for
the
site
.
Cov
enan
ts &
C
law
back
Th
ere
are
a nu
mbe
r o
claw
back
con
ditio
ns,
cove
nant
s an
d te
nanc
y co
nditi
ons
acro
ss th
e si
te.
The
two
prin
cipl
e on
es a
re
a 50
/50
claw
back
on
the
wes
t lan
d an
d a
poss
essi
on c
laus
e on
the
east
with
in a
FB
T.
If th
e te
st o
n th
e FB
T is
qua
litat
ive
then
the
maj
ority
of v
alue
cou
ld
be re
leas
ed fr
om th
is
optio
n an
d th
e FB
T te
st w
ill b
e sa
tisfie
d.
This
nee
ds le
gal
advi
ce.
Will
like
ly tr
igge
r the
cl
awba
ck p
rovi
sion
al
beit
quan
tum
will
be
low
er.
Doe
s th
is s
atis
fy th
e “s
ubst
antia
l” te
st in
re
latio
n to
the
dete
rmin
atio
n of
the
FBT
Will
rele
ase
FBT
poss
essi
on c
laus
e co
vena
nt o
n ea
ster
n la
nd a
s it
will
cle
arly
sat
isfy
“s
ubst
antia
l” te
st.
Will
not
trig
ger
claw
back
on
east
la
nd.
We
will
nee
d to
wai
t 1 y
ear
for p
osse
ssio
n of
the
land
af
ter t
he L
DO
is g
rant
ed.
This
will
be
a m
ajor
del
ay
that
cou
ld b
e m
itiga
ted
by
nego
tiatin
g w
ith F
B T
enan
t fo
r ear
ly o
ccup
atio
n.
Dis
plac
emen
tTh
e st
rate
gy fo
r the
bu
sine
ss P
ark
has
alw
ays
been
it is
targ
eted
at n
ew
dem
and
gene
rate
d fro
m
the
airp
ort s
ite o
r tha
t at
tract
ed to
the
airp
orts
’ co
nnec
tivity
. It i
s no
t abo
ut
loca
l dem
and.
This
sm
alle
r site
cou
ld
be a
suf
ficie
nt s
ize
to
acco
mm
odat
e th
e ne
w
dem
and
prop
osed
.
.Non
e.N
one
In o
rder
to g
ener
ate
suffi
cien
t dem
and
for t
he
larg
er a
rea
of la
nd. L
ocal
ne
ed m
ay n
eed
to b
e co
nsid
ered
. Thi
s m
ay
affe
ct p
lann
ing
and
cond
ition
s at
tach
ed to
LD
O.

Intr
oduc
tion
Pro’
sC
on’s
Pro’
sC
on’s
Land
Dis
posa
l It
wou
ld b
e a
clea
r ad
vant
age
if w
e co
uld
look
at
an
early
dis
posa
l of l
and
with
in th
e B
P to
pro
gres
s de
velo
pmen
t.
Del
iver
s la
nds
to th
e m
arke
t in
a ph
ased
ap
proa
ch d
irect
ly to
im
med
iate
nee
d.
Ris
k of
not
del
iver
ing
for t
he m
ost
mar
keta
ble/
deliv
erab
le la
nd
Will
rele
ase
land
ne
xt to
the
exis
ting
Air
Am
bula
nce
build
ing
whi
ch h
as
pote
ntia
l to
have
al
read
y es
tabl
ish
deve
lopm
ent
mom
entu
m.
Will
del
iver
an
expe
ctat
ion
of d
evel
opm
ent o
n la
nd
that
pos
sibl
y ha
s no
re
alis
tic c
hanc
e of
de
velo
pmen
t due
to
dem
and
in th
e sh
ort t
o m
ediu
m te
rm.
Oth
er u
ses
Oth
er u
ses
such
as
a H
otel
/pub
/rest
aura
nt h
ave
been
con
side
red
as a
par
t of
the
busi
ness
par
k pr
opos
al. O
ther
use
s su
ch
as re
tail
and
hous
ing
have
no
t bee
n co
nsid
ered
to
date
.
Thes
e ar
e no
t bei
ng
cons
ider
ed a
t the
m
omen
t as
a pa
rt of
LD
O 2
/EZ
but i
t is
not
too
late
to b
ring
thes
e in
to th
e 20
Ha
of d
ev.
Thes
e us
es m
ay w
ell
alte
r the
SO
and
the
requ
irem
ent f
or a
n E
IA. I
t will
cer
tain
ly
redu
ce th
e qu
antu
m
of d
evel
opm
ent d
own
from
20h
a.
The
scop
e fo
r wid
er
uses
is in
crea
sed
grea
tly w
ith th
e la
rger
dem
and
and
site
sca
le.
It is
impo
ssib
le to
ass
ess
the
alte
rnat
ives
at p
rese
nt
with
out n
eed
asse
ssm
ents
an
d di
rect
ion
from
pol
icy.

Appendix 4.1 – Air Quality
APPENDIX 4 DMRB MODEL VERIFICATION
Dispersion modelling is an inherently uncertain procedure with potential errors in the model output arising from either, or both, systematic or random errors.
Systematic errors occur where a distinct trend is apparent in the model output i.e. a tendency to under or over estimate known values. This type of error may arise where emissions have been underestimated, or particular characteristics of a sample location has not neen represented in the model. Whilst it is rarely possible to identify a specific reason for the systematic error, the errors can be quantified and allowed for by comparing modelled concentrations against monitored concentrations in order to derive a scaling factor. Monitored data itself has an associated uncertainty. Therefore, in the adjustment for systematic errors, it is best to calculate the scaling factor on the basis of data from 3 or more monitoring stations.
Random errors, as the name suggests, do not show a distinct trend and result in a scatter of modelled concentrations about monitored data even after an allowance for systematic error has been made. The degree of uncertainty i.e. random error, in the model results may be estimated by calculating the standard deviation of the verified modelled results.
Nitrogen oxide outputs from the DMRB Model were used to derive nitrogen dioxide concentrations. The updated empirical method (Defra 2009) to convert annual mean NOx to NO2 at roadside locations outside Greater London was used, using 2010 road traffic emission factors.
Table B2 and B 3 shows the details of the verification process and the factors generated to scale the model results to correct for systematic errors.
Since the correction of the modelled results relates to the road-side component of the pollutant only, the scaling factor is calculated by first removing the background contribution to the monitored and modelled NOx concentrations and then comparing the roadside components only.
The raw model result at all diffusion tube locations significantly under estimated the monitored concentrations gathered at monitoring sites in Newquay. Therefore, the calculation of an average scaling factor was attempted for all sampling locations. However comparing modelled and monitored NOx concentrations, there appeared to be two separate characteristic sample locations types. In addition trends a systematic over estimation by DMRB of the modelled NOx concentrations at receptor location 8, Mount Wise Mitchell Avenue.
The analysis of the systematic error in the DMRB modelling output led to the conclusion that two scaling factors are required.
The first bias adjustment factor (6.15) was calculated from the ratio derived from sample locations St Thomas Road, Quintrell Road and Treninnick Hill (Table A4.1) and will be applied to all kerbside receptor locations. The second first bias adjustment factor (2.55) was the direct ratio between roadside monitored NOx and Modelled NOx at sample locations Trevenson Road, Henver Road, Hillgrove Road and Mount Wise Roundabout/ Higher Town Road (Table A4.2). This will apply to receptors which are located at non-kerbside locations.

It has been assumed that the nitrogen dioxide factors apply to all pollutants.
Table A4.1: Verification of Nitrogen Dioxide Model Output for Kerbside Location Receptors
Diffusion tube location
ReceptorNumber
Total NO2
Monitored Period �g/m3
Total NO2Monitored adjusted for
Annual Period �g/m3
BackgroundNOx
�g/m3
Modelled Roadside
NOxContribution
�g/m3
Monitored Roadside
NOxContribution
�g/m3
Ratio of Monitored to
Modelled Roadside
Contributions19 St Thomas
Road R6 27.62 27.62 14.31 3.97 41.86 10.54
58 Quintrell Road
R1 17.07 17.07 9.58 3.05 21.67 7.10
Treninnick Hill R7 44.16 44.16 14.31 14.64 84.69 5.78
Bias factor Derived from Slope 6.15
Figure A4.1: Relationship between Modelled and Monitored NOx at Kerbside Sampling locations
41.86
21.67
84.69
y = 6.1495xR² = 0.8348
0
20
40
60
80
100
120
140
0 5 10 15 20 25
Mon
itor
edN
Ox
(��g/
m3 )
Modelled NOx (�g/m3)
Relationship between Modelled and Monitored NOx at Kerbside Locations

Table A4.2: Verification of Nitrogen Dioxide Model Output for non- Kerbside Location Receptors
Diffusion tube location
ReceptorNumber
Total NO2
Monitored Period �g/m3
Total NO2Monitored adjusted for
Annual Period �g/m3
BackgroundNOx
�g/m3
Modelled Roadside
NOxContribution
�g/m3
Monitored Roadside
NOxContribution
�g/m3
Ratio of Monitored to
Modelled Roadside
Contributions
Trevenson roadR2 29.94 20.35 9.58 19.78 49.99 2.53
Henver RoadR3 22.49 22.49 9.94 11.89 32.93 2.77
Hillgrove RoadR4 18.28 18.28 9.94 9.96 23.96 2.41
Mount Wise Roundabout/High
er Town Rd
R9 27.78 127.78 11.78 17.37 43.67 2.51
Bias factor derived from slope 2.55
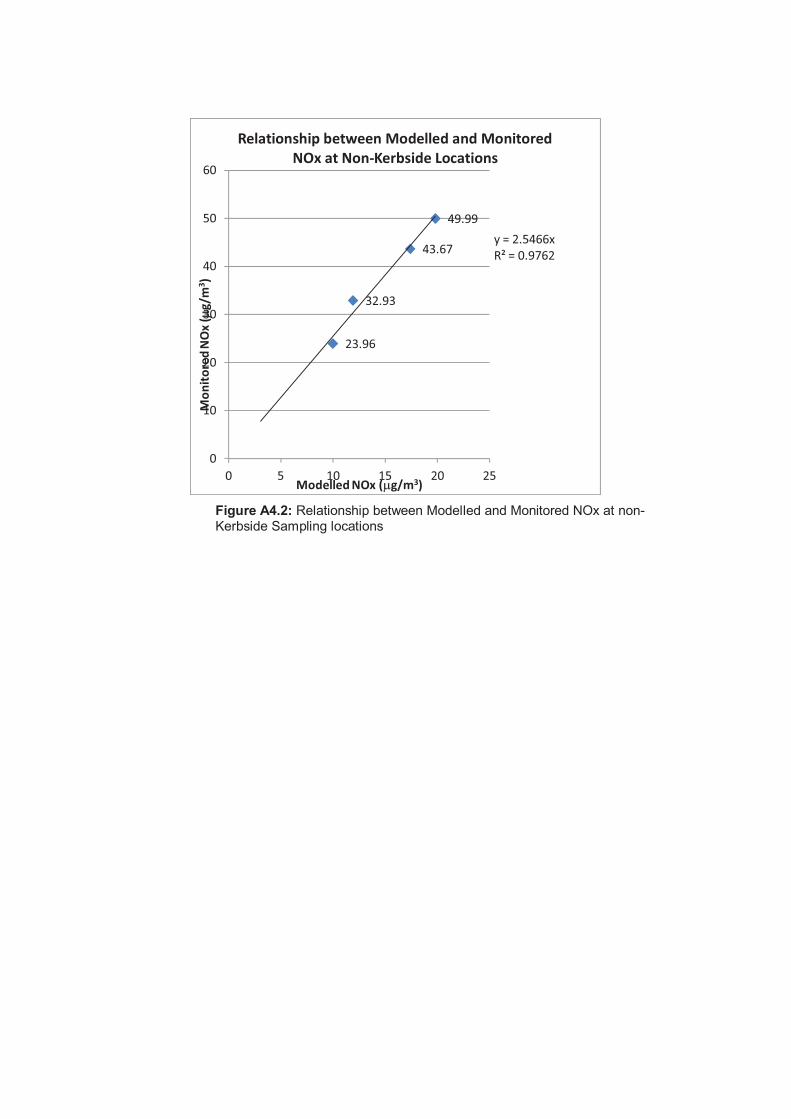
Figure A4.2: Relationship between Modelled and Monitored NOx at non-Kerbside Sampling locations
49.99
32.93
23.96
43.67y = 2.5466xR² = 0.9762
0
10
20
30
40
50
60
0 5 10 15 20 25
Mon
itor
edN
Ox
(��g/
m3 )
Modelled NOx (�g/m3)
Relationship between Modelled and Monitored NOx at Non-Kerbside Locations

Appendix 5.1 – Archaeological and Historical Desk-based Assessment and Geophysical Survey Report

Newquay Airport Business ParkSt Columb Minor and St Columb Major
Cornwall
Heritage Desk-Based Assessment
forParsons Brinkerhoff
on behalf of Cornwall Development Company
CA Project: 3957 CA Report: 12274
September 2012
Newquay Airport Business Park St Columb Minor and St Columb Major
Cornwall
Heritage Desk-Based Assessment
CA Project: 3957 CA Report: 12274
prepared by Rosemary Blackwell, Heritage Consultant
date 28 September 2012
checked by Gail Stoten, Principal Heritage Consultant
date 28 September 2012
approved by Gail Stoten, Principal Heritage Consultant
signed
date 28 September 2012
issue 01
This report is confidential to the client. Cotswold Archaeology accepts no responsibility or liability to any third party to whom this report, or any part of it, is made known. Any such party relies upon this report entirely
at their own risk. No part of this report may be reproduced by any means without permission.
© Cotswold Archaeology Building 11, Kemble Enterprise Park, Kemble, Cirencester, Gloucestershire, GL7 6BQ t. 01285 771022 f. 01285 771033 e. [email protected]

© Cotswold Archaeology
3
Newquay Airport Business Park, Cornwall: Heritage Desk-Based Assessment
CONTENTS
1. INTRODUCTION ................................................................................................. 6
Outline.................................................................................................................. 6
Location and landscape context .......................................................................... 6
Scope................................................................................................................... 6
2. METHODOLOGY................................................................................................. 7
Previous archaeological investigations ................................................................ 9
3. PLANNING POLICY CONTEXT .......................................................................... 9
Planning policy and guidance context.................................................................. 9
National Planning Policy Framework ................................................................... 10
Local planning policy............................................................................................ 12
4. BASELINE SURVEY............................................................................................ 12
Introduction .......................................................................................................... 12
Designated heritage assets ................................................................................. 12
Summary of non-designated or potential heritage assets.................................... 13
Geology, topography and the palaeoenvironment ............................................... 13
Prehistoric (pre- AD 43) and Romano-British (AD 43 – AD410) .......................... 13
Medieval (1066-1539) .......................................................................................... 14
Post-medieval (1540-1800) and Modern (1801-present) ..................................... 15
5. CONCLUSIONS................................................................................................... 18
Known and potential heritage assets ................................................................... 18
6. REFERENCES .................................................................................................... 19
APPENDIX A: GAZETTEER OF RECORDED HERITAGE ASSETS............................... 21
APPENDIX B: LOCAL PLANNING POLICY: EXTRACT FROM THE RESTORMEL
BROUGH COUNCIL PLAN (ADOPTED OCTOBER 2001) .............................................. 22
APPENDIX C: EXTRACT FROM THE HEDGEROWS REGULATIONS 1997................. 23

© Cotswold Archaeology
4
Newquay Airport Business Park, Cornwall: Heritage Desk-Based Assessment
LIST OF ILLUSTRATIONS Fig. 1 Site location plan
Fig. 2 Recorded heritage assets
Fig. 3 Extract from the map of 1836
Fig. 4 Extract from the First Edition Ordnance Survey map of 1888
Fig. 5 Extract from the Second Edition Ordnance Survey map of 1907
Fig. 6 Later 20th-century barn, view to south-west
Fig. 7 Remains of a building first depicted on the Second Edition Ordnance Survey map of
1907, view to north-west

© Cotswold Archaeology
5
Newquay Airport Business Park, Cornwall: Heritage Desk-Based Assessment
SUMMARY
Project Name: Newquay Airport Business Park
Location: St Columb Minor and St Columb Major, Cornwall
NGR: SW 8750 6340
In August 2012 Cotswold Archaeology was commissioned by Parsons Brinkerhoff, on behalf
of Cornwall Development Company, to carry out a Heritage Desk-Based Assessment of land
at the proposed Newquay Airport Business Park, St Columb Minor and St Columb Major,
Cornwall. The objective of the assessment was to identify the nature and extent of the
recorded heritage resource within both the site and its immediate environs.
The site of an 18th-century farmstead, including a smithy, known as Parkyn’s Shop, was
formerly located in the south-western area of the site. Then-extant buildings at Parkyn’s
Shop, and associated below-ground remains, were recorded and subsequently removed
during works associated with Newquay Airport Southern Access Road. It is likely that any
then-surviving below-ground remains of other buildings depicted at Parkyn’s Shop on historic
cartographic sources were also removed at this time.
Extant remains of a building and boundary wall first depicted on the Second Edition
Ordnance Survey map of 1907, in the eastern area of the site, are considered to be of
negligible historic significance.
The field name Brick Moor indicates that clay extraction may have taken place in the
northern area of the site. Any associated below ground remains are likely to be of negligible
historic significance, at most.
Cornish Hedges within the site on the lines of historic Parish/Township boundaries are
considered to have statutory protection under the Hedgerow Regulations 1997. These
Cornish Hedges are heritage assets of historic interest and are considered to be of low
historic significance.
There is potential for currently unrecorded prehistoric or Romano-British remains to survive
below-ground within the site.

© Cotswold Archaeology
6
Newquay Airport Business Park, Cornwall: Heritage Desk-Based Assessment
1. INTRODUCTION
Outline
1.1 In August 2012 Cotswold Archaeology was commissioned by Parsons Brinkerhoff,
on behalf of Cornwall Development Company, to carry out a Heritage Desk-Based
Assessment of land at the proposed Newquay Airport Business Park, St Columb
Minor and St Columb Major, Cornwall. This heritage desk-based assessment has
been undertaken to inform an Environmental Statement.
Location and landscape context
1.2 The proposed development site is approximately 36.3ha in size, and is located to
the south-west of Newquay Airport (formerly RAF St Mawgan), north of the A3059.
The recently-constructed Newquay Airport Southern Access Road to the airport
crosses north/south through the western area of the site, within a cutting. A
construction site compound is located within the south-western area of the site,
west of the access road. To the north of this compound is a large compacted spoil
bank, presumably associated with the construction of Newquay Airport Southern
Access Road.
1.3 The area of the site to the east of the access road comprises agricultural fields, in
use as sheep pasture at the time of the site visit, with the exception of the far
eastern field which was fallow. A wooded belt, which bounds an unnamed stream,
extends into the northern area of the site. Field boundaries within the site are
predominantly Cornish Hedge (a bank with stone facing and topped with
vegetation), and Hedge-Bank, where no stone facing was visible. The eastern part
of the southern boundary is fence and the central and northern parts of the northern
boundary are within a wooded belt.
Scope
1.4 The content of this report has been guided by the Tender Brief produced by
Cornwall Development Company (CDC 2012). The Tender Brief includes a
requirement for a geophysical survey, which is being undertaken in parallel with the
production of this desk-based assessment.

© Cotswold Archaeology
7
Newquay Airport Business Park, Cornwall: Heritage Desk-Based Assessment
1.5 This assessment focuses upon the cultural heritage resource of the site itself,
although the heritage resource of a minimum 500m ‘buffer’ around the site has also
been assessed in detail, referred to as the ‘study area’ (Fig. 2).
1.6 The main objectives of the desk-based assessment are:
� to identify designated heritage assets within the site and study area;
� to gather information on non-designated recorded heritage assets;
� to assess the above baseline information and offer an analysis of the potential
for currently unrecorded heritage assets within the site; and
� to assess the significance of the heritage assets, including elements of setting
that positively contribute to significance.
2. METHODOLOGY
2.1 The methodology is based on the guidance provided in the Institute for
Archaeologists ‘Standards and Guidance for Historic Environment Desk-Based
Assessment’ (IfA 2011).
2.2 This desk-based assessment has considered a 500m study area centred on the site
(Fig. 2). The size of the study area ensured that data sources provide sufficient
information about the proposed allocation site and its surrounding landscape from
which to assess known and potential impacts on the heritage resource.
2.3 Known heritage assets within the study area discussed in the text are reported in
Section 4. A gazetteer of known and potential heritage assets in the study area has
been compiled (Appendix A). All assets are referred to in the text by a unique
reference number 01, etc... The locations of these assets can be seen on Figure 2.
2.4 The baseline survey involved consultation of readily available archaeological and
historical information from documentary and cartographic sources. The major
repositories of information consulted comprised:
English Heritage National Heritage List
� World Heritage Sites
� Scheduled Monuments

© Cotswold Archaeology
8
Newquay Airport Business Park, Cornwall: Heritage Desk-Based Assessment
� Listed buildings
� Registered Parks and Gardens
� Registered Battlefields
Cornwall and Scilly Historic Environment Record (CSSHER)
� Database of known archaeological sites, findspots, historic buildings and
previous archaeological works;
� Published and unpublished documentary sources (including development
control site reports);
� Extensive Urban Survey.
Cornwall Record Office and Cornish Studies Library
� Published documentary sources; and
� Historic maps and photographs.
National Monuments Record (NMR)
� AMIE (Archives and Monuments Information, England) data including known
archaeological sites, findspots and previous archaeological works; and
� Aerial photography collections.
Online sources
� Including the British Geological Survey (BGS) Geology of Britain Viewer and
Local Plan information from the Restormel Borough Council website.
2.5 Site visits were undertaken on 23 April and 27 September 2012 to identify any
visible potential heritage assets not recorded by the baseline sources and to more
fully understand the potential constraints, if any, to the proposed development.

© Cotswold Archaeology
9
Newquay Airport Business Park, Cornwall: Heritage Desk-Based Assessment
Previous archaeological investigations
2.6 Three programmes of archaeological work are recorded within the study area, two
of which extended into part of the site. Recorded archaeological work comprises:
� A programme of works in 2011 associated with Newquay Airport Southern
Access Road, which crosses the site (Fig. 2, 1; AS 2010; CC 2011a). Works
included desk-based assessment, English Heritage Level 3 builing survey of
now-demolished buildings at Parkyn’s shop (Fig. 2, 17), geophysical survey
(Fig. 2, 1a), and a watching brief following topsoil-stripping associated with
road construction (Fig. 2, 1b);
� A programme of works in 2010 associated with a proposed Solar Farm c.
350m west of the site (Fig. 2, 2; CC 2010). Work included desk-based
assessment, geophysical survey and a watching brief on geotechnical pits.
� A Historic Environment Assessment and Characterisation of Newquay
Cornwall Airport, which covered the area of the site (Fig. 2, 3).
2.7 Geophysical Survey covering the western area of the site not covered by Newquay
Airport Southern Access Road was undertaken in April 2012 (Stratascan 2012).
Geophysical Survey covering the remainder of the site is currently being
undertaken. The combined results of the geophysical surveys will be incorporated
into the Environmental Statement.
3. PLANNING POLICY CONTEXT
Planning policy and guidance context
3.1 The assessment has been written within the following legislative, planning policy and
guidance context:
� National Heritage Act 1983 (amended 2002),
� Town and Country Planning Act (1990)
� Planning (Listed Buildings and Conservation Areas) Act (1990)
� The Setting of Heritage Assets: English Heritage Guidance (2011)
� English Heritage Conservation Principles: policies and guidance for the
sustainable management of the historic environment (2008)
� National Planning Policy Framework (2012)

© Cotswold Archaeology
10
Newquay Airport Business Park, Cornwall: Heritage Desk-Based Assessment
National Planning Policy Framework
3.2 The National Planning Policy Framework sets out planning policies relating to
‘conserving and enhancing the historic environment’. It defines the historic
environment as ‘all aspects of the environment resulting from the interaction
between people and places through time, including all surviving physical remains of
past human activity, whether visible, buried or submerged, and landscaped and
planted or managed flora.’ It further classifies a ‘heritage asset’ as ‘a building,
monument, site, place, area or landscape indentified as having a degree of
significance meriting consideration in planning decisions, because of its heritage
interest.
3.3 Heritage assets include designated heritage assets and assets identified by the local
planning authority (including local listing). Policies relate to both the treatment of the
assets themselves and their settings, both of which are a material consideration in
development management decision making.
3.4 The NPPF states that “The purpose of the planning system is to contribute to the
achievement of sustainable development” and that there are “three dimensions to
sustainable development: economic, social and environmental”. The role the
environment will play is described as “contributing to protecting and enhancing our
natural, built and historic environment; and as part of this, helping to improve
biodiversity, use of natural resources prudently, minimise waste and pollution, and
mitigate and adapt to climate change including moving to a low carbon economy”.
3.5 Within the over-arching roles that the planning system will play, a set of 12 “core
land-use planning principles” have been developed to underpin place-shaping and
decision making. The 10th principle is:
� “conserve heritage assets in a manner appropriate to their significance, so
that they can be enjoyed for their contribution to the quality of life of this and
future generations”
3.6 When determining planning applications local planning authorities should take
account of:
� “the desirability of sustaining and enhancing the significance of heritage
assets and putting them to viable uses consistent with their conservation;

© Cotswold Archaeology
11
Newquay Airport Business Park, Cornwall: Heritage Desk-Based Assessment
� the positive contribution that conservation of heritage assets can make to
sustainable communities including their economic vitality; and
� the desirability of new development making a positive contribution to local
character and distinctiveness.”
3.7 Further to this, local planning authorities can request that the applicant should
describe “the significance of any heritage assets affected, including any contribution
made by their setting”. The level of detail required in the assessment should be
“proportionate to the assets’ importance and no more than is sufficient to understand
the potential impact of the proposal on their significance”. “Where a site on which
development is proposed includes or has the potential to include heritage assets
with archaeological interest, local planning authorities should require developers to
submit an appropriate desk-based assessment and, where necessary, a field
evaluation.”
3.8 Local planning authorities should take this assessment into account when
considering the impact of a proposed development, “to avoid or minimise conflict
between the heritage asset’s conservation and any aspect of the proposal”.
3.9 A key policy within the NPPF is that “when considering the impact of a proposed
development on the significance of a designated heritage asset, great weight should
be given to the asset’s conservation. The more important the asset, the greater the
weight should be.”
3.10 “Significance can be harmed or lost through alteration or destruction of the heritage
asset or development within its setting. As heritage assets are irreplaceable, any
harm or loss should require clear and convincing justification. Substantial harm to or
loss of a grade II listed building, park or garden should be exceptional. Substantial
harm to or loss of designated heritage assets of the highest significance, notably
scheduled monuments, protected wreck sites, battlefields, grade I and II* listed
buildings, grade I and II* registered parks and gardens, and World Heritage Sites,
should be wholly exceptional.”
3.11 However, where a proposed development will lead to “less than substantial harm to
the significance of a designated heritage asset”, this harm should be weighed
against the public benefits of the proposal.

© Cotswold Archaeology
12
Newquay Airport Business Park, Cornwall: Heritage Desk-Based Assessment
3.12 With regard to non-designated heritage assets specific policy is provided in that a
balanced judgement will be required having due regard to the scale of any harm or
loss and the significance of the heritage asset affected.
Local planning policy
3.13 Local planning policy is detailed in the Restormel Borough Council Plan (adopted
October 2001) Saved policies. Relevant policies comprise Policy 11, 12, 25 and 26,
reproduced in Appendix B.
4. BASELINE SURVEY
Introduction
4.1 This section provides an overview of the historical and archaeological background of
the study area, in order to provide a better understanding of the context and
significance of the cultural heritage resource that may be affected by development.
This assessment then determines the significance of any affected heritage assets
(Chapter 5 of this report) and assesses the potential for encountering buried
archaeological remains within the proposed development site.
Designated heritage assets
International designations
4.2 No World Heritage Sites or sites included on the Tentative List of Future
Nominations for World Heritage Sites (July 2010) are situated within the site or its
vicinity.
National designations
4.3 There are no Scheduled Monuments, Registered Parks and Gardens or Registered
Battlefields located within the site or the study area.
4.4 A Grade II Listed milestone is located on the south side of the A3059, c. 430m west
of the site (Fig. 2, 4). A second Grade II Listed milestone is located c. 80m east of
the site, also to the south of the A3059 (Fig. 2, 22). Grade II Listed buildings at
Nanswydhen Farm are located c. 500m south of the site (Fig. 2, 5).

© Cotswold Archaeology
13
Newquay Airport Business Park, Cornwall: Heritage Desk-Based Assessment
Regional and local designations
4.5 No Conservation Areas are located within the site or the study area.
Summary of non-designated or potential heritage assets
4.6 A group of now demolished post-medieval buildings, known as Parkyn’s Shop, is
recorded within the south-western area of the site (Fig. 2, 17). Then-extant buildings
were recorded during works associated with Newquay Airport Southern Access
Road, and have since been removed (Fig. 2, 1). It is likely that any then-surviving
below-ground remains of other buildings recorded at Parkyn’s Shop on historic
cartographic sources were also removed during works associated with Newquay
Airport Southern Access Road.
4.7 Cornish Hedge historic Parish/Township boundaries within the site are considered to
have statutory protection under the Hedgerow Regulations 1997.
4.8 There may be potential for currently unrecorded prehistoric or Romano-British
remains to survive below-ground within the site.
Geology, topography and the palaeoenvironment
4.9 The geology of the site is mapped as Dartmouth Group slate, siltstone and
sandstone, overlain by Meadfoot Group interbedded slate and sandstone in the
southern areas. No drift deposits are recorded within the site (BGS 2012).
Prehistoric (pre- AD 43) and Romano-British (AD 43 – AD410)
4.10 Cropmarks potentially representing possible prehistoric or Romano-British
settlement have been identified within and immediately west of the study area.
These comprise two groups of cropmarks c. 500m west of the site (Fig. 2, 6 and 7),
one group c. 550m south-west (Fig. 2, 8), and one at the c. 850m west (Fig. 2, 9).
4.11 Cropmarks c. 500m west of the site potentially represent a small sub-circular
enclosure (Fig. 2, 6), and a larger sub-circular enclosure with an internal hut circle
and possible adjacent hut circle (Fig. 2, 7). However, geophysical survey in this area
did not identify any associated anomalies, nor did it identify any anomalies
suggestive of prehistoric or Roman settlement (Fig. 2, 2; CC 2010). It is probable
therefore that the identified cropmarks do not represent below-ground
archaeological features. The geophysical survey did identify anomalies in other
areas consistent with the below-ground remains of ditches, some of which may be of

© Cotswold Archaeology
14
Newquay Airport Business Park, Cornwall: Heritage Desk-Based Assessment
prehistoric or Romano-British origin as they are not aligned with the extant field
system.
4.12 A group of cropmarks c. 550m to the south-west of the site potentially represent four
small enclosures and a trackway (Fig. 2, 8). A circular cropmark which may
represent a round (a single-ditched enclosed settlement of Iron Age/Romano-British
date) is recorded c. 850m west of the site (Fig. 2, 9). Field names suggesting the
possible presence of a round in the vicinity are recorded at the northern-western
edge of the study area (Fig. 2, 10).
4.13 Geophysical survey within the site, associated with Newquay Airport Southern
Access Road, identified three short linear anomalies which potentially represent the
below-ground remains of ditches of prehistoric or Romano-British origin (Fig. 2, 1a).
No prehistoric or Romano-British features were recorded during the archaeological
watching brief (Fig. 2, 1b; CC2011a).
4.14 A curvilinear banked enclosure is visible on aerial photographs to the north-east of
the site (Fig. 2, 24). The feature is undated, although its origins as a prehistoric or
Romano-British site cannot be ruled out at this stage.
Early medieval (AD 410 – 1066)
4.15 The place name prefix ‘Tre’ has pre-Norman origins and may be indicative of early
medieval settlement. Examples the vicinity include Treissac (Fig. 2, 11) and
Trebarber (Fig. 2, 12), to the south and south-west of the site respectively, and
Trenoon (Fig. 2, 13), to the north. The site was most likely part of the agricultural
hinterland in the early medieval period.
Medieval (1066-1539)
4.16 The main area of the site is located within the historic parishes of St Columb Minor
and St Columb Major, with the boundary between the two running north/south
through the site. The historic boundary between these parishes and St Mawgan
Parish is along the northern edge of the site.
4.17 Medieval settlement in the vicinity is recorded at Nanswhyden, c. 500m south of the
site (Fig. 2, 14). A medieval field system is recorded in the northern part of the study
area (Fig. 2, 15), associated with settlement at Carnanton c. 1km north-east of the
site, since removed by the construction of the airfield. Medieval ridge and furrow is
© Cotswold Archaeology
15
Newquay Airport Business Park, Cornwall: Heritage Desk-Based Assessment
recorded in the vicinity c. 900m south-west of the site (Fig. 2, 16), at Trebarber. Field
boundaries within the site are relatively straight and uniform, indicating that it was
not enclosed until the post-medieval period. The area of the site may have
comprised rough grassland, such as was used for common land, in the medieval
period (CSHER). A watching-brief on the Newquay Airport Southern Access Road,
which crossed the site, identified the below-ground remains of undated ditches and
suggested that they were of medieval origin (CC 2011, 5). These ditches were
aligned with the post-medieval field system (see below), and as such a post-
medieval date is considered more likely.
Post-medieval (1540-1800) and Modern (1801-present)
4.18 The site of a post-medieval smithy, Parkyn’s Shop, is recorded within the south-
western area of the site (Fig. 2, 17). The smithy was part of a small farmstead,
located at the St Columb Minor/St Columb Major parish boundary. Parkyn’s Shop is
also recorded as the home of the 19th-century wrestler Richard Parkyn, known as
‘The Great Parkyn’ (Ellery 2000, 27; Rabey 1979, 55), and a commemorative stone
has been erected within the site, adjacent to the road. Then-extant buildings at
Parkyn’s Shop, and associated below-ground remains of built structures, associated
with Parkyn’s Shop, were recorded during works associated with Newquay Airport
Southern Access Road, and have since been removed (Fig. 2, 1). The development
of the site as recorded on the historic cartographic sources is described below,
followed by a brief summary of the Parkyn’s Shop buildings. A detailed discussion of
Parkyn’s Shop can be found in the Cultural Heritage Assessment for Newquay
Airport Southern Access Road (AS 2010).
Development of the site
4.19 The site is first depicted in detail on a 1836 map of the Townships of Nanswhyden
and Trevithick in the Parish of St Columb Major, and Nantornan in St Columb Minor
(Fig. 3). This depicts the main area of the site situated across agricultural fields, with
open downland at its eastern extent. A trackway bounded the western edge of the
site (Fig. 3, A), and a small group of buildings, labelled Parkyn’s Shop, are shown
within the south-western area of the site (Figs. 2 and 3, 17). Buildings in this area
are depicted to the west and east of the historic St Columb Major/St Columb Minor
Parish boundary (also the boundary between Nantornan and Nanswhyden). The
boundary between Nanswhyden and Trevithick crosses the eastern area of the site
(Fig. 3, D). The northern site boundary is the historic boundary with St Mawgan
Parish. A list of field names accompanying the map records a field called Brick Moor

© Cotswold Archaeology
16
Newquay Airport Business Park, Cornwall: Heritage Desk-Based Assessment
in the northern area of the site (Fig. 3, B), suggesting that there may have been clay
extraction in this area. Land use for this field is recorded as Wet & Furze. The
eastern area of the site extended into Great Down, an area of unenclosed Furze &
Heath (Fig. 3, C).
4.20 The entirety of the site is covered by mid-19th century Tithe Maps for St Columb
Major and St Columb Minor. No major changes are depicted on these sources. The
Tithe Apportionment Register for St Columb Major indicates that the fields in the
central area of the site formed part of agricultural land associated with Parkyn’s
Shop.
4.21 The western area of the site is depicted on a map of 1847 (not illustrated). No major
changes are shown in this area on this source.
4.22 By the time of the First Edition Ordnance Survey map of 1888 (Fig. 3), buildings at
Parkyn’s Shop to the east of the parish boundary had been removed. Two groups of
buildings remained extant: a structure immediately adjacent to the parish boundary,
and a group of buildings to its north-west. This map also indicates that there had
been some loss of field boundaries by this time, and that the field at the eastern
extent of the site had been enclosed from open land (Figs. 3 and 4, C).
4.23 A building is depicted within a small enclosed area in the eastern area of the site at
Trevithick Downs on the Second Edition Ordnance Survey map of 1907 (Fig. 5, E).
This is a narrow linear building. At the time of the site visit two walls were extant in
this area, most likely associated with the former building, and its adjacent boundary
wall. The function of the building is not known, although it may have been subsidiary
to the adjacent building, immediately east of the site, which is extant and comprises
a two-storey stone-built dwelling.
Parkyn’s Shop
4.24 A Level 3 building survey of three standing buildings at Parkyn’s Shop in 2011, in
advance of their demolition, recorded that two of the buildings appeared to be of
18th-century origin (AS 2010). These two buildings correspond with the structures
shown on the First Edition Ordnance Survey map (Fig. 4). These comprised simple
single-roomed structures, of a single phase of construction. The building directly
adjacent to the road was identified as the smithy. The building to its north-west was
identified as a probable dwelling. Now demolished buildings to the east of the parish

© Cotswold Archaeology
17
Newquay Airport Business Park, Cornwall: Heritage Desk-Based Assessment
boundary are recorded in the accompanying Apportionment Register as House and
Garden. It is likely that any below-ground remains then surviving were removed
during the construction of Newquay Airport Southern Access Road.
4.25 One extant building was noted at Parkyn’s Shop during the site visit. This is a recent
concrete, timber and steel barn (Fig. 5, F). It incorporates the remains of a low
boundary wall into its northern elevation (Fig. 6), which most likely originated as a
garden wall to the rear of buildings at Parkyn’s Shop (Figs. 3-5, 17).
Hedgerows
4.26 Cornish Hedges which mark the historic St Columb Minor/St Columb Major parish
boundary (also the historic Nantornan/Nanswhyden Township Boundary) are
considered to have statutory protection under the Hedgerow Regulations 1997
(criteria for archaeology and history, reproduced in Appendix B). Cornish
Hedge/Hedge Banks along the historic Nanswhyden/Trevithick Township Boundary
and along the St Columb Major/St Mawgan Parish boundary are also considered to
have statutory protection (illustrated on Fig. 5).
Historic Landscape Character
4.27 Historic Landscape Characterisation data provided by CSHER defines the main area
of the site as Post-medieval Enclosed Land. This is defined as land enclosed in the
17th/18th and 19th centuries, which may formerly have comprised rough grassland
and Medieval commons (see also Medieval above). The wooded belt within the
northern area of the site is defined as Plantations and Scrubland.
The wider study area
4.28 A Grade II Listed milestone is recorded c. 430m west of the site, south of the A3059
(Fig. 2, 4). A second Grade II Listed milestone is recorded c. 80m to the east of the
site (Fig. 2, 22). Elements of setting which positively contribute to the significance of
these structures comprise the road, which enables their function to be understood.
4.29 Post-medieval settlement in the wider study area includes Grade II Listed buildings
at Nanswydhen (Fig. 2, 5).
4.30 One other post-medieval site, a small quarry, is recorded within the study area (Fig.
2, 18). This was located to the north of the unnamed stream which forms the
northern site boundary.

© Cotswold Archaeology
18
Newquay Airport Business Park, Cornwall: Heritage Desk-Based Assessment
4.31 RAF St Mawgan, located immediately north of the site was constructed in 1942-43
(Fig. 2, 19). It continued to operate as a military airfield through the late 20th century
before becoming a civilian airport in the early 21st century. No airfield features have
been identified within the site. WWII sites recorded in the vicinity include military
camps (Fig. 2, 21) and radar stations (Fig. 2, 20 and 23).
5. CONCLUSIONS
Known and potential heritage assets
5.1 The site of an 18th-century farmstead, including a smithy, known as Parkyn’s Shop,
was formerly located within the south-western area of the site. Extant buildings and
associated below-ground remains of built structures, associated with Parkyn’s Shop,
were recorded during works associated with Newquay Airport Southern Access
Road, and have since been removed (Fig. 2, 1). It is likely that any then-surviving
below-ground remains of other buildings shown on historic cartographic sources
were also removed at this time. A short stretch of boundary wall, associated with a
garden to the rear of the Parkyn’s Shop buildings, is extant within the site, and has
been incorporated into a modern field barn. This boundary wall is considered to be
of negligible historic significance.
5.2 Walls associated with a building/boundary wall recorded on the Second Edition
Ordnance Survey map of 1907 are extant in the eastern area of the site. These walls
are considered to be of negligible historic significance. Any associated below-
ground remains are likely to be of, at most, negligible historic significance.
5.3 The field name Brick Moor indicates potential for former clay extraction within the
northern area of the site. Any below-ground remains are likely to be of negligible historic significance, at best.
5.4 Cornish Hedge/Hedge banks along historic Parish/Township boundaries are
considered to have statutory protection under the Hedgerow Regulations 1997.
These Cornish Hedges are heritage assets historic interest and are considered to be
of low historic significance.
© Cotswold Archaeology
19
Newquay Airport Business Park, Cornwall: Heritage Desk-Based Assessment
5.5 Cropmarks potentially representing the below-ground remains of prehistoric or
Romano-British settlement are recorded in the western part of the study area. There
is potentially for currently unrecorded prehistoric or Romano-British below-ground
remains within the site.
6. REFERENCES
AS (Archaeological Surveys Ltd.) 2010 Newquay Cornwall Southern Access Route:
cultural heritage assessment, typescript report produced for Entec
BGS (British Geological Survey) 2012 Geology of Britain Viewer, 1:50,000
geological mapping, solid and drift, viewed online April 2012
CC (Cornwall Council) 2010 Proposed Kernow Solar Farm, Newquay, Cornwall:
archaeological assessment, typescipt report
CC (Cornwall Council) 2011a Newquay Airport Southern Access Road, Cornwall:
archaeological watching-brief, typescipt report
CC (Cornwall Council) 2011b Newquay Cornwall Airport: historic environment
assessment and characterisation, typescript report
CDC (Cornwall Development Company) 2012 Aerohub Enterprise Zone @
Newquay Cornwall Airport – Business Park: Brief for Environmental Impact
Assessment TEN 212, 20th July 2012, typescript report
Ellery, P. 2000 St Columb Minor: memoirs and parish history, St Columb Minor
Parish Map Project Committee, Newquay
Rabey, I. 1979 The Book of St Columb & St Mawgan, Barracuda Books Ltd,
Buckingham
Stratascan 2012 Geophysical survey report: Newquay Aerohub, typescript report

© Cotswold Archaeology
20
Newquay Airport Business Park, Cornwall: Heritage Desk-Based Assessment
Cartographic sources
1746 Map of Cornwall surveyed by Thomas Martyn
1836 Plan of Nanswhyden and Trevithick in St Columb Major, and Nantoman in St
Columb Minor, CRO CF/1/3005 1839 St Columb Minor Tithe map, CRO digital copy
1840 St Columb Major Tithe map, CRO digital copy
1847 Plan of East Wheal Rose mining district, CRO AS220/24 1888 First Edition Ordnance Survey map, 6” series, sheet 32SW
1888 First Edition Ordnance Survey map, 25” series, sheet 32.14
1907 Second Edition Ordnance Survey map, 6” series, sheet 32SW
CRO Cornwall Record Office
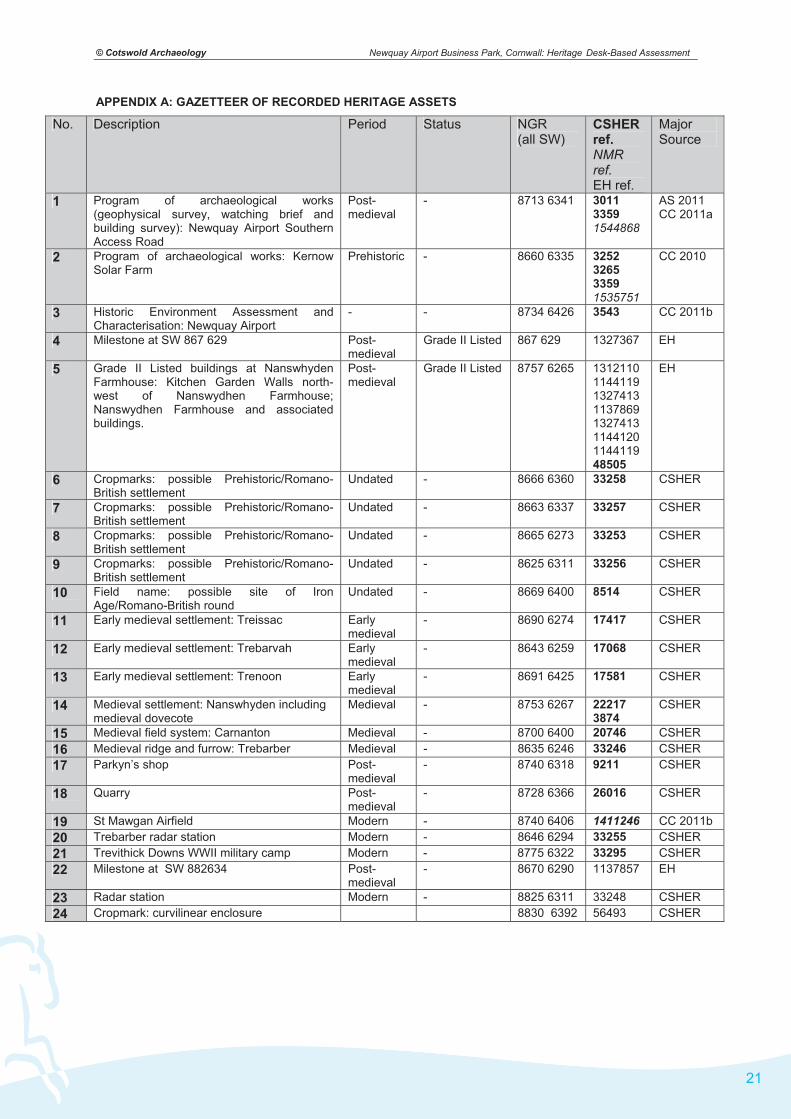
© Cotswold Archaeology
21
Newquay Airport Business Park, Cornwall: Heritage Desk-Based Assessment
APPENDIX A: GAZETTEER OF RECORDED HERITAGE ASSETS
No. Description Period Status NGR (all SW)
CSHER ref.NMRref.EH ref.
MajorSource
1 Program of archaeological works (geophysical survey, watching brief and building survey): Newquay Airport Southern Access Road
Post-medieval
- 8713 6341 3011 3359 1544868
AS 2011 CC 2011a
2 Program of archaeological works: Kernow Solar Farm
Prehistoric - 8660 6335 3252 3265 3359 1535751
CC 2010
3 Historic Environment Assessment and Characterisation: Newquay Airport
- - 8734 6426 3543 CC 2011b
4 Milestone at SW 867 629 Post-medieval
Grade II Listed 867 629 1327367 EH
5 Grade II Listed buildings at Nanswhyden Farmhouse: Kitchen Garden Walls north-west of Nanswydhen Farmhouse; Nanswydhen Farmhouse and associated buildings.
Post-medieval
Grade II Listed 8757 6265 1312110 1144119 1327413 1137869 1327413 1144120 1144119 48505
EH
6 Cropmarks: possible Prehistoric/Romano-British settlement
Undated - 8666 6360 33258 CSHER
7 Cropmarks: possible Prehistoric/Romano-British settlement
Undated - 8663 6337 33257 CSHER
8 Cropmarks: possible Prehistoric/Romano-British settlement
Undated - 8665 6273 33253 CSHER
9 Cropmarks: possible Prehistoric/Romano-British settlement
Undated - 8625 6311 33256 CSHER
10 Field name: possible site of Iron Age/Romano-British round
Undated - 8669 6400 8514 CSHER
11 Early medieval settlement: Treissac Early medieval
- 8690 6274 17417 CSHER
12 Early medieval settlement: Trebarvah Early medieval
- 8643 6259 17068 CSHER
13 Early medieval settlement: Trenoon Early medieval
- 8691 6425 17581 CSHER
14 Medieval settlement: Nanswhyden including medieval dovecote
Medieval - 8753 6267 22217 3874
CSHER
15 Medieval field system: Carnanton Medieval - 8700 6400 20746 CSHER16 Medieval ridge and furrow: Trebarber Medieval - 8635 6246 33246 CSHER17 Parkyn’s shop Post-
medieval - 8740 6318 9211 CSHER
18 Quarry Post-medieval
- 8728 6366 26016 CSHER
19 St Mawgan Airfield Modern - 8740 6406 1411246 CC 2011b 20 Trebarber radar station Modern - 8646 6294 33255 CSHER21 Trevithick Downs WWII military camp Modern - 8775 6322 33295 CSHER22 Milestone at SW 882634 Post-
medieval - 8670 6290 1137857 EH
23 Radar station Modern - 8825 6311 33248 CSHER24 Cropmark: curvilinear enclosure 8830 6392 56493 CSHER

© Cotswold Archaeology
22
Newquay Airport Business Park, Cornwall: Heritage Desk-Based Assessment
APPENDIX B: LOCAL PLANNING POLICY: EXTRACT FROM THE RESTORMEL BROUGH COUNCIL PLAN (ADOPTED OCTOBER 2001)
Policy 11 (Protecting the Borough’s Heritage):The Council will seek to conserve and enhance the landscapes, features and habitats of heritage importance within the Borough.
Policy 12 (1) Proposals for interpretation and educational facilities which support greater awareness and incorporate positive management of landscapes, features and habitats of heritage importance will be permitted. (2) Where appropriate, opportunities will be taken to make conditions and enter into agreements relating to their conservation and proper management.
Policy 25 (Scheduled Ancient Monuments): Development proposals which would damage scheduled ancient monuments or other archaeological remains of national importance or their settings will not be permitted.
Policy 26 (Local Archaeological Sites): Development proposals which adversely affect locally important archaeological sites held on the county sites and monuments record or identified as a result of a prior archaeological investigation will only be permitted where: (1) physical preservation in-situ is not feasible and the importance of the development outweighs the case for preservation of the remains; and (2) satisfactory arrangements are made for the excavation and recording of the remains before or during development.
Policy 27 (Archaeological Assessments): Where there is evidence to suggest that significant remains may exist on the site of a proposed development the extent and importance of which are unknown, an archaeological assessment will be carried out prior to the granting of planning permission.

© Cotswold Archaeology
23
Newquay Airport Business Park, Cornwall: Heritage Desk-Based Assessment
APPENDIX C: EXTRACT FROM THE HEDGEROWS REGULATIONS 1997
Extracted From Statutory Instruments 1997 No. 1160 The Hedgerows Regulations 1997, Schedule 1: Additional criteria for determining ‘Important’ hedgerows;
PART II CRITERIAArchaeology and history
1. The hedgerow marks the boundary, or part of the boundary, of at least one historic parish or township; and for this purpose “historic” means existing before 1850.
2. The hedgerow incorporates an archaeological feature which is- (a) included in the schedule of monuments compiled by the Secretary of State under section 1 (schedule of monuments) of the Ancient Monuments and Scheduled Areas Act 1979(g); or (b) recorded at the relevant date in a sites and Monuments Record.
3. The hedgerow- (a) is situated wholly or partly within an archaeological site included or recorded as mentioned in paragraph 2 or on land adjacent to and associated with such a site; and (b) is associated with any monument or feature on that site.
4. The hedgerow- (a) marks the boundary of a pre-1600 AD estate or manor recorded at the relevant date in a sites and Monuments Record or on a document held at that date at a Record Office; or (b) is visibly related to any building or feature of such an estate or manor.
5. The hedgerow- (a) is recorded in a document held at the relevant date at a Record Office as an integral part of a field system pre-dating the Inclosure acts(a); or (b) is part of, or visibly related to, any building or other feature associated with such a system, and that system- (i) is substantially complete; or
(ii) is of a pattern which is recorded in a document prepared before the relevant date by a local planning authority, within the meaning of the 1990 Act(b), for the purposes of development control within the authority’s area, as a key landscape characteristic

Cornwall
CotswoldArchaeology
PROJECT TITLE
FIGURE TITLE
FIGURE NO.DATEREVISIONSCALE@A4
PROJECT NO.DRAWN BYAPPROVED BY
N
0 1km
Site location plan
Newquay Airport Business ParkCornwall
13-09-2012001:25,000
3957IAPJM 1
Reproduced from the 2003 Ordnance Survey Explorer map with the permission of Ordnance Survey on behalf of The Controller of Her Majesty's Stationery Office Crown copyright Cotswold Archaeological Trust 100002109
c
Cirencester 01285 771022
Milton Keynes 01908 218320
Andover 01264 326549
w www.cotswoldarchaeology.co.uk

8686
86
64 63 62
23
13
1510
1a
18
3
1b
117
6
7
2
19
9
20
8
4
16
12
11
514
21
24
22
Cotswold
Archa
eology
Cir
ence
ster
012
85 7
7102
2
Milt
on
Key
nes
019
08 2
1832
0
An
dov
er 0
1264
326
549
w w
ww
.cot
swol
darc
haeo
logy
.co.
uk
e en
quiri
es@
cots
wol
darc
haeo
logy
.co.
uk
N
PR
OJE
CT
TITL
E
FIG
UR
E T
ITLE
FIG
UR
E N
O.
DAT
ER
EV
ISIO
NS
CA
LE@
A3
PR
OJE
CT
NO
.D
RAW
N B
YA
PP
RO
VE
D B
Y
050
0m
Rec
orde
d he
ritag
e as
sets
New
quay
Airp
ort B
usin
ess
Par
kC
ornw
all
13-0
9-20
1200 1:
10,0
00
3957
IA PJM
2
Rep
rodu
ced
from
the
2003
Ord
nanc
e S
urve
y E
xplo
rer
map
with
the
perm
issi
onof
Ord
nanc
e S
urve
y on
beh
alf o
f The
Con
trol
ler
of H
er M
ajes
ty's
Sta
tione
ry O
ffice
C
row
n co
pyrig
ht C
otsw
old
Arc
haeo
logy
Ltd
100
0021
09
c
site
stud
y ar
ea
early
med
ieva
l
med
ieva
l
post
-med
ieva
l
mod
ern
unda
ted
prev
ious
arc
haeo
logi
cal w
orks
area
of g
eoph
ysic
al s
urve
y
geop
hysi
cal a
nom
aly
(sel
ecte
d)
area
of w
atch
ing
brie
f
Gra
de II
Lis
ted
build
ing
crop
mar
ks
exte
nt o
f airf
ield

CotswoldArchaeology
Cirencester 01285 771022
Milton Keynes 01908 218320
Andover 01264 326549
w www.cotswoldarchaeology.co.uk
PROJECT TITLE
FIGURE TITLE
FIGURE NO.DATEREVISIONSCALE@A4
PROJECT NO.DRAWN BYAPPROVED BY
4
3
3 Extract from the map of 1836
4 Extract from the First Edition Ordnance Survey map of 1888
Historic mapping
Newquay Airport Business ParkCornwall
13-09-2012001:8000 (approx.)
3957IAPJM 3 & 4
NANSWHYDEN
NANTORNANTREVITHICK
17
A
B
D
C
17
A
B
D
C

CotswoldArchaeology
Cirencester 01285 771022
Milton Keynes 01908 218320
Andover 01264 326549
w www.cotswoldarchaeology.co.uk
PROJECT TITLE
FIGURE TITLE
FIGURE NO.DATEREVISIONSCALE@A4
PROJECT NO.DRAWN BYAPPROVED BY
site
Important Hedegrow
later 20th-century building - extant
modern road corridor
5
5 Extract from the Second Edition Ordnance Survey map of 1907
Historic mapping
Newquay Airport Business ParkCornwall
13-09-2012001:8000 (approx.)
3957IAPJM 5
A
F
E

CotswoldArchaeology
Cirencester 01285 771022
Milton Keynes 01908 218320
Andover 01264 326549
w www.cotswoldarchaeology.co.uk
PROJECT TITLE
FIGURE TITLE
FIGURE NO.DATEREVISIONSCALE@A4
PROJECT NO.DRAWN BYAPPROVED BY
7
6
6 Later 20th-century barn, view ot south-west
7 Remains of a building first depicted on the Second Edition Ordnance Survey map of 1907, view to north-west
Photographs
Newquay Airport Business ParkCornwall
28-09-201200N/A
3957LGPJM 6 & 7

Geophysical Survey Report Newquay Aerohub
for
Cotswold Archaeology
October 2012
Job ref. J3180
Richard Smalley BA (Hons) AIFA Bryony P Marsh BA
Document Title: Geophysical Survey Report Newquay Aerohub – Options 1 & 2 Client: Cotswold Archaeology Stratascan Job No: J3090 & J3180 Survey Date: 12th-21st April 2012 9th-12th October Techniques: Detailed magnetic survey (gradiometry)
National Grid Ref: SW 871 634 Field Team: Tim Lewis BA (Hons)
Thomas DeSalle MSc Alex Pilditch Adam Cooper MSc Alexandra Bellisario Steve Hamflett MSc Tom Richardson MSc Joshua Jones
Project Manager: Simon Haddrell B.Eng (Hons) AMBCS PIFA Report written by: Richard Smalley BA (Hons) AIFA Bryony P Marsh BA CAD illustration by: Richard Smalley BA (Hons) AIFA Simon Haddrell B.Eng (Hons) AMBCS PIFA Bryony P Marsh BA Checked by: David Elks MSc AIFA Stratascan Ltd. Vineyard House Upper Hook Road Upton upon Severn WR8 0SA Tel: 01684 592266 Fax: 01684 594142 Email: [email protected] www.stratascan.co.uk

Geophysical Survey Newquay Aerohub Cotswold Archaeology October 2012
© Stratascan Ltd 2012 Page No. 1 Job ref: J30901 & 3180
1 SUMMARY OF RESULTS............................................................................................... 3
2 INTRODUCTION.............................................................................................................. 3
2.1 Background synopsis.................................................................................................. 3
2.2 Site location................................................................................................................ 3
2.3 Description of site ...................................................................................................... 3
2.4 Geology and soils ....................................................................................................... 4
2.5 Site history and archaeological potential ................................................................... 4
2.6 Survey objectives ....................................................................................................... 4
2.7 Survey methods .......................................................................................................... 4
3 METHODOLOGY............................................................................................................. 4
3.1 Date of fieldwork ....................................................................................................... 5
3.2 Grid locations ............................................................................................................. 5
3.3 Survey equipment....................................................................................................... 5
3.4 Sampling interval, depth of scan, resolution and data capture................................... 6
3.4.1 Sampling interval ............................................................................................... 6
3.4.2 Depth of scan and resolution.............................................................................. 6
3.4.3 Data capture........................................................................................................ 6
3.5 Processing, presentation of results and interpretation................................................ 6
3.5.1 Processing........................................................................................................... 6
3.5.2 Presentation of results and interpretation ........................................................... 7
4 RESULTS........................................................................................................................... 7
5 CONCLUSION .................................................................................................................. 9
APPENDIX A – Basic principles of magnetic survey......................................................... 12
APPENDIX B – Glossary of magnetic anomalies ............................................................... 13

Geophysical Survey Newquay Aerohub Cotswold Archaeology October 2012
© Stratascan Ltd 2012 Page No. 2 Job ref: J30901 & 3180
LIST OF FIGURES
Figure 1 1:2000 Site Location and Survey Area Figure 2 1:1000 Colour Plot Showing Extreme Values- West Figure 3 1:1000 Minimally Processed Gradiometer Data- West Figure 4 1:1000 Abstraction and Interpretation of Anomalies- West Figure 5 1:1000 Colour Plot Showing Extreme Values- Central Figure 6 1:1000 Minimally Processed Gradiometer Data- Central Figure 7 1:1000 Abstraction and Interpretation of Anomalies- Central Figure 8 1:1000 Colour Plot Showing Extreme Values- East Figure 9 1:1000 Minimally Processed Gradiometer Data- Central Figure 10 1:1000 Abstraction and Interpretation of Anomalies- Central Figure 11 1:1250 Minimally Processed Gradiometer Data – Whole Site Figure 12 1:2500 Abstraction and Interpretation of Anomalies- Whole Site

Geophysical Survey Newquay Aerohub Cotswold Archaeology October 2012
© Stratascan Ltd 2012 Page No. 3 Job ref: J30901 & 3180
1 SUMMARY OF RESULTS
A geophysical survey has been carried out across approximately 48ha of agricultural land to the south of Newquay Cornwall Airport. The fieldwork was carried out during two phases in April and October 2012. Part of the area surveyed in April 2012, located to the west of the Newquay Cornwall Airport Access Route, lies outside of the proposed development site. The data has identified a number of circular, curvilinear and rectilinear anomalies likely to represent archaeological activity in the south western limits of the survey area, outside of the proposed development site. A number of linear anomalies evident within the data have been interpreted as former field boundaries; the majority of which are located in the northern and eastern regions of the site. Also evident within the gradiometer data were a large number of generally amorphous and relatively weak positive anomalies. These have been interpreted as cut features of a possible archaeological origin. However, the character of these anomalies means that a natural origin cannot be ruled out. Closely spaced linear anomalies are evident across the majority of the site and are indicative of modern agricultural activity such as ploughing. These anomalies may be obscuring weaker responses of possible archaeological interest.
2 INTRODUCTION
2.1 Background synopsis
Stratascan were commissioned to undertake a geophysical survey of an area outlined for
development as the Newquay Aerohub. This survey forms part of an archaeological investigation being undertaken by Cotswold Archaeology.
2.2 Site location
The site is located near Newquay, Cornwall at OS ref. SW 871 634.
2.3 Description of site
The area surveyed in April 2012, comprises of approximately 32ha of agricultural land south of the Newquay Cornwall Airport. At the time of survey the western half of the site was used for arable and the eastern half was pasture. The southern boundary of the site is formed by the A3059 highway and a strip of woodland acts as the northern limits of the survey area. The recently constructed Newquay Cornwall Airport Southern Access Route bisects the site.

Geophysical Survey Newquay Aerohub Cotswold Archaeology October 2012
© Stratascan Ltd 2012 Page No. 4 Job ref: J30901 & 3180
The area surveyed during the October 2012 fieldwork measures approximately 16.8ha, divided across four fields and is located directly to the east of the area surveyed in April. The site is predominantly pasture with some areas of waterlogging present.
2.4 Geology and soils
The underlying geology is mudstone and sandstone (British Geological Survey South Sheet, Fifth Edition Solid, 2007). No drift geology is recorded for the site (British Geological Survey South Sheet, First Edition Quaternary, 1977). The overlying soils are known as Denbigh 2 which are typical brown earths. These consist of well drained fine loamy soils over slate or slate rubble (Soil Survey of England and Wales, Sheet 5 South West England).
2.5 Site history and archaeological potential
Archaeological Surveys conducted a geophysical survey over the area of the Newquay Cornwall Airport Southern Access Route in 2009. Very few features were identified in the survey data and those that were identified were shown to be related to medieval field systems during the consequent watching brief undertaken in 2011 (Shepherd, 2011).
2.6 Survey objectives
The objective of the survey was to detect and precisely locate any potential
archaeological features using non-intrusive survey techniques.
2.7 Survey methods
Detailed magnetic survey (gradiometry) was used as an efficient and effective method
of locating archaeological anomalies. More information regarding this technique is included in the Methodology section below.
3 METHODOLOGY
The survey methodology complies with the brief set out in the Written Scheme of Investigation prepared by Cotswold Archaeology and agreed by the Cornwall County Council Historic Environment Advice Team Leader (Central) (Stoten, 2012).
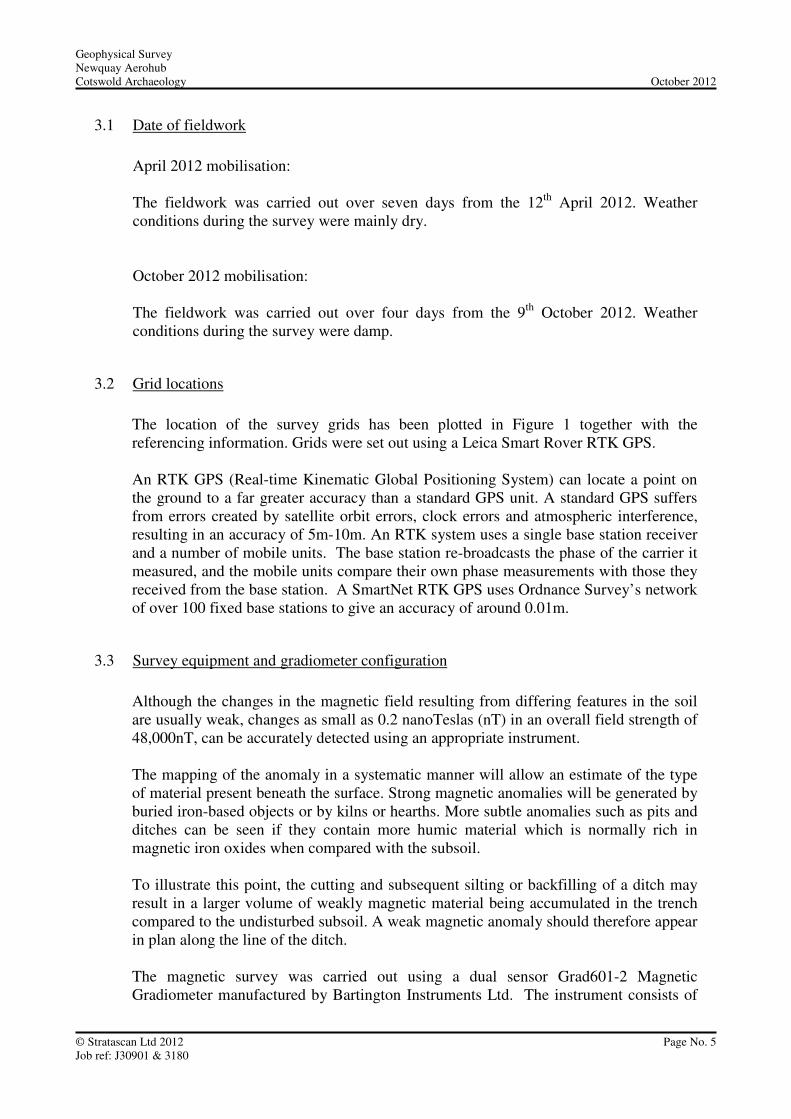
Geophysical Survey Newquay Aerohub Cotswold Archaeology October 2012
© Stratascan Ltd 2012 Page No. 5 Job ref: J30901 & 3180
3.1 Date of fieldwork
April 2012 mobilisation: The fieldwork was carried out over seven days from the 12th April 2012. Weather conditions during the survey were mainly dry.
October 2012 mobilisation: The fieldwork was carried out over four days from the 9th October 2012. Weather conditions during the survey were damp.
3.2 Grid locations
The location of the survey grids has been plotted in Figure 1 together with the referencing information. Grids were set out using a Leica Smart Rover RTK GPS.
An RTK GPS (Real-time Kinematic Global Positioning System) can locate a point on
the ground to a far greater accuracy than a standard GPS unit. A standard GPS suffers from errors created by satellite orbit errors, clock errors and atmospheric interference, resulting in an accuracy of 5m-10m. An RTK system uses a single base station receiver and a number of mobile units. The base station re-broadcasts the phase of the carrier it measured, and the mobile units compare their own phase measurements with those they received from the base station. A SmartNet RTK GPS uses Ordnance Survey’s network of over 100 fixed base stations to give an accuracy of around 0.01m.
3.3 Survey equipment and gradiometer configuration
Although the changes in the magnetic field resulting from differing features in the soil are usually weak, changes as small as 0.2 nanoTeslas (nT) in an overall field strength of 48,000nT, can be accurately detected using an appropriate instrument.
The mapping of the anomaly in a systematic manner will allow an estimate of the type
of material present beneath the surface. Strong magnetic anomalies will be generated by buried iron-based objects or by kilns or hearths. More subtle anomalies such as pits and ditches can be seen if they contain more humic material which is normally rich in magnetic iron oxides when compared with the subsoil.
To illustrate this point, the cutting and subsequent silting or backfilling of a ditch may
result in a larger volume of weakly magnetic material being accumulated in the trench compared to the undisturbed subsoil. A weak magnetic anomaly should therefore appear in plan along the line of the ditch.
The magnetic survey was carried out using a dual sensor Grad601-2 Magnetic
Gradiometer manufactured by Bartington Instruments Ltd. The instrument consists of

Geophysical Survey Newquay Aerohub Cotswold Archaeology October 2012
© Stratascan Ltd 2012 Page No. 6 Job ref: J30901 & 3180
two fluxgates very accurately aligned to nullify the effects of the Earth's magnetic field. Readings relate to the difference in localised magnetic anomalies compared with the general magnetic background. The Grad601-2 consists of two high stability fluxgate gradiometers suspended on a single frame. Each gradiometer has a 1m separation between the sensing elements so enhancing the response to weak anomalies.
3.4 Sampling interval, depth of scan, resolution and data capture
3.4.1 Sampling interval
Readings were taken at 0.25m centres along traverses 1m apart. This equates to 3600
sampling points in a full 30m x 30m grid.
3.4.2 Depth of scan and resolution
The Grad 601-2 has a typical depth of penetration of 0.5m to 1.0m, though strongly magnetic objects may be visible at greater depths. The collection of data at 0.25m centres provides an optimum methodology for the task balancing cost and time with resolution.
3.4.3 Data capture
The readings are logged consecutively into the data logger which in turn is daily down-
loaded into a portable computer whilst on site. At the end of each site survey, data is transferred to the office for processing and presentation.
3.5 Processing, presentation of results and interpretation
3.5.1 Processing
Processing is performed using specialist software. This can emphasise various aspects
contained within the data but which are often not easily seen in the raw data. Basic processing of the magnetic data involves 'flattening' the background levels with respect to adjacent traverses and adjacent grids. Once the basic processing has flattened the background it is then possible to carry out further processing which may include low pass filtering to reduce 'noise' in the data and hence emphasise the archaeological or man-made anomalies.
The following schedule shows the basic processing carried out on all processed
gradiometer data used in this report:
1. Destripe (Removes striping effects caused by zero-point discrepancies between different sensors and walking directions)

Geophysical Survey Newquay Aerohub Cotswold Archaeology October 2012
© Stratascan Ltd 2012 Page No. 7 Job ref: J30901 & 3180
2. Destagger (Removes zigzag effects caused by inconsistent walking
speeds on sloping, uneven or overgrown terrain)
3.5.2 Presentation of results and interpretation
The presentation of the data for each site involves a print-out of the minimally
processed data both as a greyscale plot (Figures 3, 6 and 9) and a colour plot showing extreme magnetic values (Figures 2, 5 and 8). Magnetic anomalies have been identified and plotted onto the 'Abstraction and Interpretation of Anomalies' drawing for the site (Figures 4, 7, 10 and 11).
4 RESULTS
The difference between probable and possible archaeological origin is a confidence rating. Features identified within the data set that form recognisable archaeological patterns or seem to be related to a deliberate historical act have been interpreted as being of a probable archaeological origin. Features of possible archaeological origin tend to be more amorphous anomalies which may have similar magnetic attributes in terms of strength or polarity but are difficult to classify as being archaeological or natural. The following list of numbered anomalies refers to numerical labels on the interpretation plots (Figures 4, 7, 10 and 11).
For ease of reference the two mobilisations will be discussed separately: Fieldwork carried out in April 2012.
Probable Archaeology 1-48 A number of positive linear and area anomalies has been identified to the south west of the proposed development site. These anomalies have been interpreted as cut features, such pits or ditches, of a probable archaeological origin. A particular cluster of circular and sub-circular ditched features (6-12) is worthy of note with two similar outlying features evident also (4 and 17). A number of rectilinear enclosures (23, 32, 33, 34, 35 and 36, 37, 47, 48) have also been identified in this area. Several other linear anomalies can be noted in this area. These features don’t seem to form any discrete enclosures but may still be related to this phase of activity. A large, horseshoe shaped anomaly (24) is evident to the south west of the proposed development site. This feature measures approximately 45m in diameter and its limits seem to respect, and possibly form a continuation of Anomaly 16.

Geophysical Survey Newquay Aerohub Cotswold Archaeology October 2012
© Stratascan Ltd 2012 Page No. 8 Job ref: J30901 & 3180
This concentration of anomalies seems to indicate the presence of archaeological settlement activity likely to be of a prehistoric origin. The complex nature of some of these anomalies with features seemingly cutting each other, may suggest that multiphase activity is present to the south west of the proposed development site. 49-77 Several linear anomalies can be noted across the survey area. These anomalies are characteristic of former field boundaries and have been interpreted as such. Many of these features consist of a negative anomaly surrounded by a positive response and are characteristic of Cornish field boundaries. The majority of anomalies related to former field boundaries are located in the northern and eastern regions of the survey area. Possible Archaeology 78-157 A large number of positive linear and area anomalies has been identified throughout the survey area. These anomalies may be related to cut features, such as ditches and pits of a possible archaeological origin. However the amorphous character and relatively weak magnetic value of many of these anomalies may suggest that they are of a natural origin and related to localised changes in geology or pedology. The weaker linear anomalies may be related to ploughed out field boundaries or animal tracks.
158 A number of magnetic ‘spikes’ (strong focussed values with associated antipolar response) indicate ferrous metal objects. Although most of these are likely to be modern detritus, some may be of archaeological interest. Particular attention may be paid to those found in association with other potentially archaeological anomalies.
Other Anomalies
159 Areas of magnetic disturbance are the result of substantial nearby ferrous metal objects such as fences and underground services. These effects can mask weaker archaeological anomalies, but on this site have not affected a significant proportion of the area. 160 Close centred, parallel linear anomalies, likely to have been caused by ploughing activity, dominate the data collected throughout the survey data. The dense frequency of these features can inhibit data quality and also make the interpretation of other geophysical anomalies difficult.
Fieldwork carried out in October 2012. Probable Archaeology 161-168 Several positive linear anomalies have been identified in the second phase of investigation and are indicative of further cut features such as ditches, of probable archaeological origin.

Geophysical Survey Newquay Aerohub Cotswold Archaeology October 2012
© Stratascan Ltd 2012 Page No. 9 Job ref: J30901 & 3180
169-182 Further linear anomalies indicative of former field boundaries are noted within this survey area, predominantly in the western fields, with one single response noted in the eastern field.
Possible Archaeology
183-217 Numerous positive linear and area anomalies are again identified within this additional data set and are classified as of possible archaeological origin, relating to former cut features. A single negative linear anomaly has been noted (217) which may be associated with a former bank. 218-222 Several magnetic spikes have been identified in the west of the site and are indicative of ferrous material. These are likely to be associated with modern detritus. Other Anomalies 223 – Several areas of magnetic disturbance have again been identified and are associated with interference from modern field boundaries. 224 – As in the April fieldwork, the data collected across this area is dominated by closely spaced linear anomalies, indicative of modern ploughing activity. These responses can be seen across each of the fields and in the eastern field, multiple phases are evident. These anomalies may be acting as obscuring factors for weaker archaeological responses on the site.
5 CONCLUSION
The detailed magnetic gradiometer survey undertaken over 48ha of land near Newquay, Cornwall is dominated by the presence of close centred parallel linear anomalies related to ploughing activity. These plough lines have had an adverse affect on the survey data making the identification of anomalies in some areas quite problematical. Despite this however, a series of circular, curvilinear and rectilinear anomalies have been identified in the south western region of the April 2012 survey area, outside of the proposed development site. These anomalies are likely to be related to archaeological settlement activity and may be of a prehistoric origin. As the survey data progresses eastwards and northwards the number of anomalies attributed to being of a probable archaeological origin peters out; with the exception of former field boundaries which seem to be more common in the eastern limits of the site. The additional survey data collected during the October 2012 fieldwork has identified several linear responses in the east of the proposed development site which are classified as of probable archaeological origin.

Geophysical Survey Newquay Aerohub Cotswold Archaeology October 2012
© Stratascan Ltd 2012 Page No. 10 Job ref: J30901 & 3180
For the most part the survey area contains little in the way of anomalies that can be confidently designated as archaeological with the exception of the settlement activity in the south west, beyond the site, and the former field boundaries.

Geophysical Survey Newquay Aerohub Cotswold Archaeology October 2012
© Stratascan Ltd 2012 Page No. 11 Job ref: J30901 & 3180
6 REFERENCES Maps
British Geological Survey South Sheet, 1977. Geological Survey Ten Mile Map, South Sheet First Edition (Quaternary). Institute of Geological Sciences. British Geological Survey, 2007. Geological Survey Ten Mile Map, South Sheet, Fifth Edition (Solid). British Geological Society.
Soil Survey of England and Wales, 1983. Soils of England and Wales, Sheet 5 South West England. Reports Shepherd, F. (2011) Newquay Airport Southern Access Road, Cornwall: Archaeological Watching Brief. Cornwall Council Report No. 2011R082. Stoten, G. (2012) Newquay Aerohub, Newquay Cornwall: Written Scheme of Investigation for a Geophysical Survey. Cotswold Archaeology Project 3788.
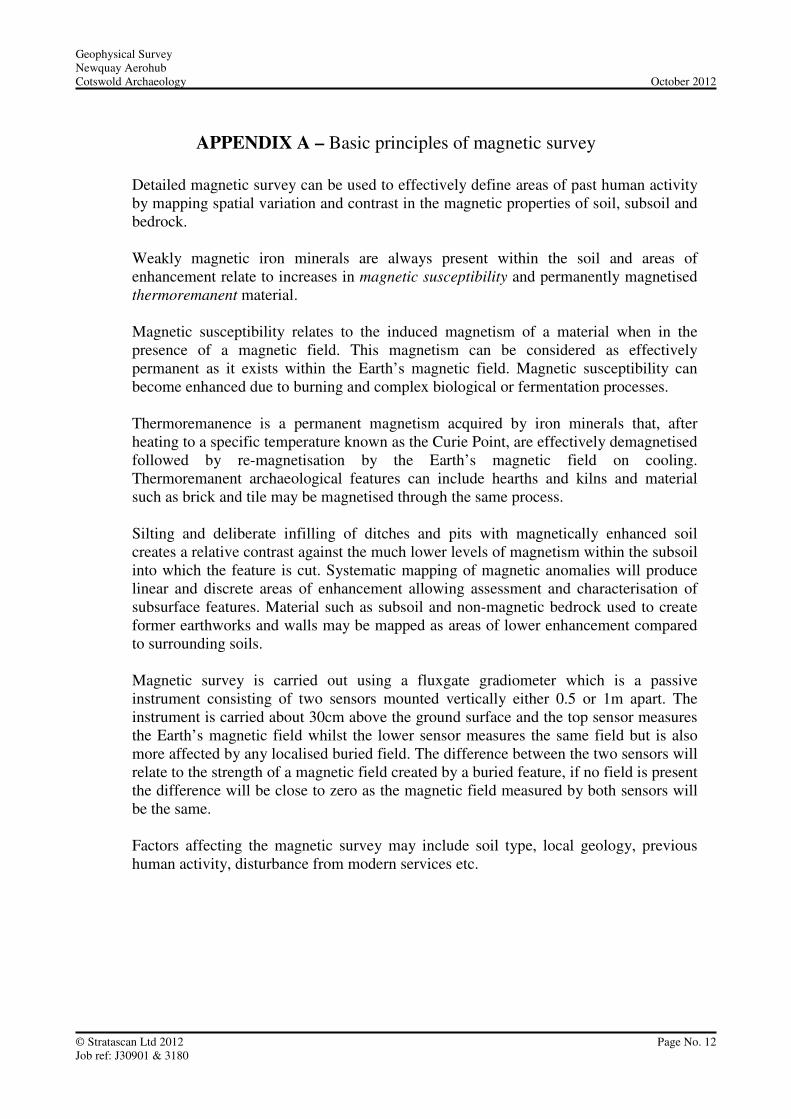
Geophysical Survey Newquay Aerohub Cotswold Archaeology October 2012
© Stratascan Ltd 2012 Page No. 12 Job ref: J30901 & 3180
APPENDIX A – Basic principles of magnetic survey
Detailed magnetic survey can be used to effectively define areas of past human activity by mapping spatial variation and contrast in the magnetic properties of soil, subsoil and bedrock. Weakly magnetic iron minerals are always present within the soil and areas of enhancement relate to increases in magnetic susceptibility and permanently magnetised thermoremanent material. Magnetic susceptibility relates to the induced magnetism of a material when in the presence of a magnetic field. This magnetism can be considered as effectively permanent as it exists within the Earth’s magnetic field. Magnetic susceptibility can become enhanced due to burning and complex biological or fermentation processes. Thermoremanence is a permanent magnetism acquired by iron minerals that, after heating to a specific temperature known as the Curie Point, are effectively demagnetised followed by re-magnetisation by the Earth’s magnetic field on cooling. Thermoremanent archaeological features can include hearths and kilns and material such as brick and tile may be magnetised through the same process. Silting and deliberate infilling of ditches and pits with magnetically enhanced soil creates a relative contrast against the much lower levels of magnetism within the subsoil into which the feature is cut. Systematic mapping of magnetic anomalies will produce linear and discrete areas of enhancement allowing assessment and characterisation of subsurface features. Material such as subsoil and non-magnetic bedrock used to create former earthworks and walls may be mapped as areas of lower enhancement compared to surrounding soils. Magnetic survey is carried out using a fluxgate gradiometer which is a passive instrument consisting of two sensors mounted vertically either 0.5 or 1m apart. The instrument is carried about 30cm above the ground surface and the top sensor measures the Earth’s magnetic field whilst the lower sensor measures the same field but is also more affected by any localised buried field. The difference between the two sensors will relate to the strength of a magnetic field created by a buried feature, if no field is present the difference will be close to zero as the magnetic field measured by both sensors will be the same. Factors affecting the magnetic survey may include soil type, local geology, previous human activity, disturbance from modern services etc.

Geophysical Survey Newquay Aerohub Cotswold Archaeology October 2012
© Stratascan Ltd 2012 Page No. 13 Job ref: J30901 & 3180
APPENDIX B – Glossary of magnetic anomalies Bipolar
A bipolar anomaly is one that is composed of both a positive response and a negative response. It can be made up of any number of positive responses and negative responses. For example a pipeline consisting of alternating positive and negative anomalies is said to be bipolar. See also dipolar which has only one area of each polarity. The interpretation of the anomaly will depend on the magnitude of the magnetic field strength. A weak response may be caused by a clay field drain while a strong response will probably be caused by a metallic service.
Dipolar
This consists of a single positive anomaly with an associated negative response. There should be no separation between the two polarities of response. These responses will be created by a single feature. The interpretation of the anomaly will depend on the magnitude of the magnetic measurements. A very strong anomaly is likely to be caused by a ferrous object.
Positive anomaly with associated negative response See bipolar and dipolar. Positive linear
A linear response which is entirely positive in polarity. These are usually related to in-filled cut features where the fill material is magnetically enhanced compared to the surrounding matrix. They can be caused by ditches of an archaeological origin, but also former field boundaries, ploughing activity and some may even have a natural origin.
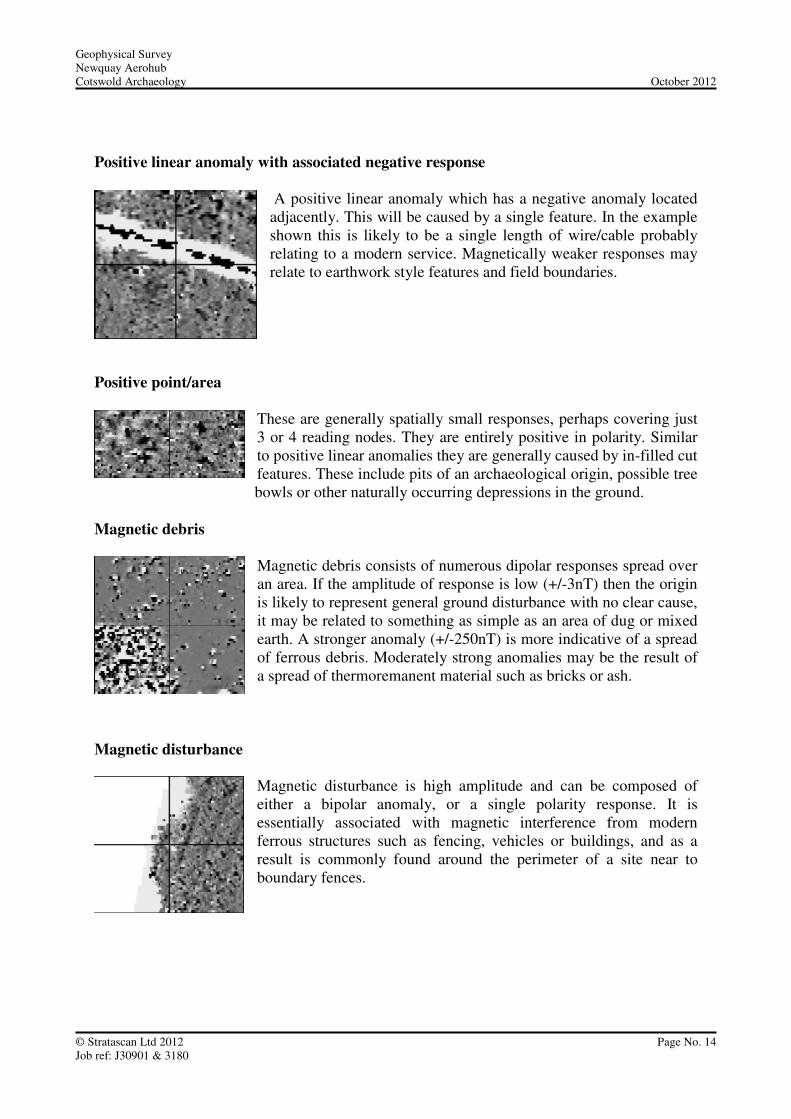
Geophysical Survey Newquay Aerohub Cotswold Archaeology October 2012
© Stratascan Ltd 2012 Page No. 14 Job ref: J30901 & 3180
Positive linear anomaly with associated negative response
A positive linear anomaly which has a negative anomaly located adjacently. This will be caused by a single feature. In the example shown this is likely to be a single length of wire/cable probably relating to a modern service. Magnetically weaker responses may relate to earthwork style features and field boundaries.
Positive point/area
These are generally spatially small responses, perhaps covering just 3 or 4 reading nodes. They are entirely positive in polarity. Similar to positive linear anomalies they are generally caused by in-filled cut features. These include pits of an archaeological origin, possible tree
bowls or other naturally occurring depressions in the ground. Magnetic debris
Magnetic debris consists of numerous dipolar responses spread over an area. If the amplitude of response is low (+/-3nT) then the origin is likely to represent general ground disturbance with no clear cause, it may be related to something as simple as an area of dug or mixed earth. A stronger anomaly (+/-250nT) is more indicative of a spread of ferrous debris. Moderately strong anomalies may be the result of a spread of thermoremanent material such as bricks or ash.
Magnetic disturbance
Magnetic disturbance is high amplitude and can be composed of either a bipolar anomaly, or a single polarity response. It is essentially associated with magnetic interference from modern ferrous structures such as fencing, vehicles or buildings, and as a result is commonly found around the perimeter of a site near to boundary fences.
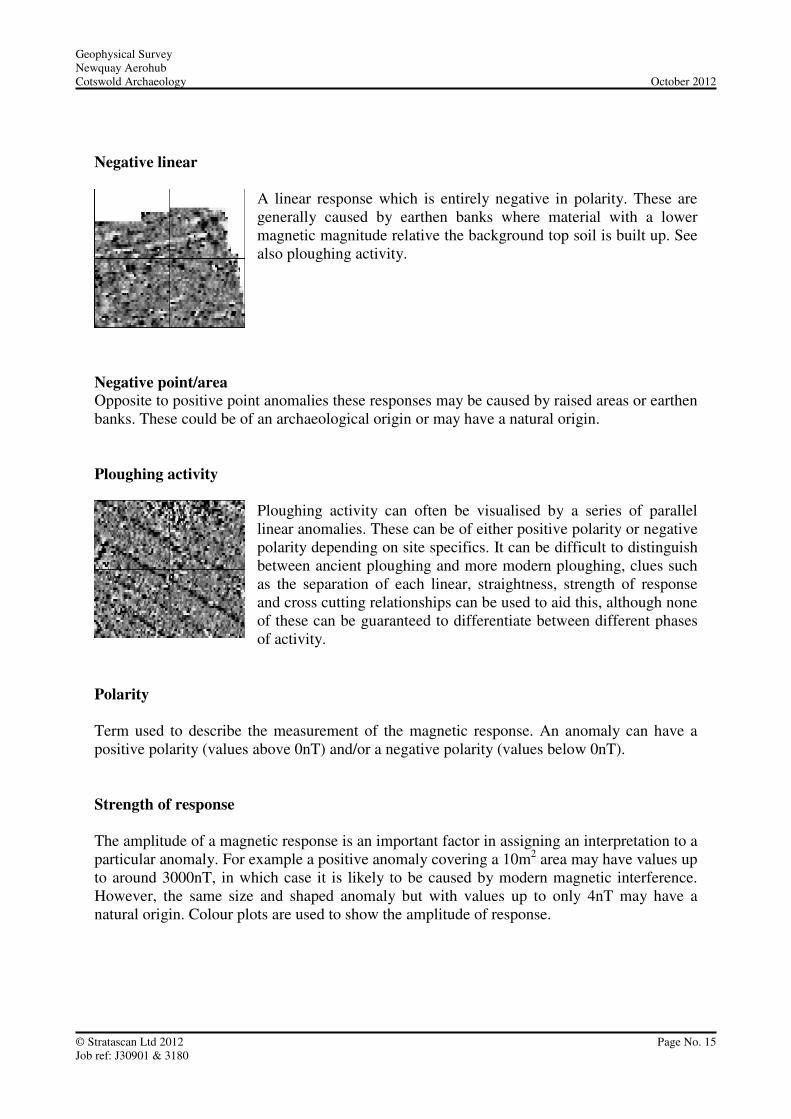
Geophysical Survey Newquay Aerohub Cotswold Archaeology October 2012
© Stratascan Ltd 2012 Page No. 15 Job ref: J30901 & 3180
Negative linear
A linear response which is entirely negative in polarity. These are generally caused by earthen banks where material with a lower magnetic magnitude relative the background top soil is built up. See also ploughing activity.
Negative point/area Opposite to positive point anomalies these responses may be caused by raised areas or earthen banks. These could be of an archaeological origin or may have a natural origin. Ploughing activity
Ploughing activity can often be visualised by a series of parallel linear anomalies. These can be of either positive polarity or negative polarity depending on site specifics. It can be difficult to distinguish between ancient ploughing and more modern ploughing, clues such as the separation of each linear, straightness, strength of response and cross cutting relationships can be used to aid this, although none of these can be guaranteed to differentiate between different phases of activity.
Polarity Term used to describe the measurement of the magnetic response. An anomaly can have a positive polarity (values above 0nT) and/or a negative polarity (values below 0nT). Strength of response The amplitude of a magnetic response is an important factor in assigning an interpretation to a particular anomaly. For example a positive anomaly covering a 10m2 area may have values up to around 3000nT, in which case it is likely to be caused by modern magnetic interference. However, the same size and shaped anomaly but with values up to only 4nT may have a natural origin. Colour plots are used to show the amplitude of response.

Geophysical Survey Newquay Aerohub Cotswold Archaeology October 2012
© Stratascan Ltd 2012 Page No. 16 Job ref: J30901 & 3180
Thermoremanent response A feature which has been subject to heat may result in it acquiring a magnetic field. This can be anything up to approximately +/-100 nT in value. These features include clay fired drains, brick, bonfires, kilns, hearths and even pottery. If the heat application has occurred in situ (e.g. a kiln) then the response is likely to be bipolar compared to if the heated objects have been disturbed and moved relative to each other, in which case they are more likely to take an irregular form and may display a debris style response (e.g. ash). Weak background variations
Weakly magnetic wide scale variations within the data can sometimes be seen within sites. These usually have no specific structure but can often appear curvy and sinuous in form. They are likely to be the result of natural features, such as soil creep, dried up (or seasonal) streams. They can also be caused by changes in the underlying geology or soil type which may contain unpredictable distributions of magnetic minerals, and are usually apparent in several locations across a site.

A
B
C
D
NEWQU
AY C
ORNW
ALL A
IRPO
RT S
OUTH
ERN
ACCESS R
OUTE
STRATASCANTMGEOPHYSICS FOR ARCHAEOLOGY
AND ENGINEERINGVINEYARD HOUSEUPPER HOOK ROADUPTON UPON SEVERN
UKWR8 0SA
T: +44 (0)1684 592266F: +44 (0)1684 594142E: [email protected]
1:3000
Date
Plot
A1
Scale
Drawn by
Checked by
RAJS/BPMFigure No.
Issue No.
01
SubjectProject TitleClient Job No. Survey Date
SW 871 634Site centred on NGR
Survey area
Reproduced from Ordnance Survey's1:25 000 map of 1998 with thepermission of the controller of HerMajesty's Stationary Office.Crown Copyright reserved.Licence No: AL 50125ALicencee:Stratascan Ltd.Vineyard HouseUpper Hook RoadUpton Upon SevernWR8 0SA
OS 100km square = SW
01
SITE LOCATION AND SURVEYAREACOTSWOLD ARCHAEOLOGY
DGE
OCT 2012
J3180 OCT 12
GEOPHYSICAL SURVEY -NEWQUAY AEROHUB
DateIssue No.
- -
AmendmentsDescription
-
-
- -
© Stratascan Ltd - 2012
OS REFERENCING INFORMATION
D
A
B
C
186817.29 , 063567.80
186817.29 , 063027.80
187387.29 , 063567.80
187387.29 , 063327.80
Survey area - Option 1
Survey area - Option 2
90300m 60 180m120 150
KEY
April 2012 survey grids
October 2012 survey grids
Outline of proposed development site
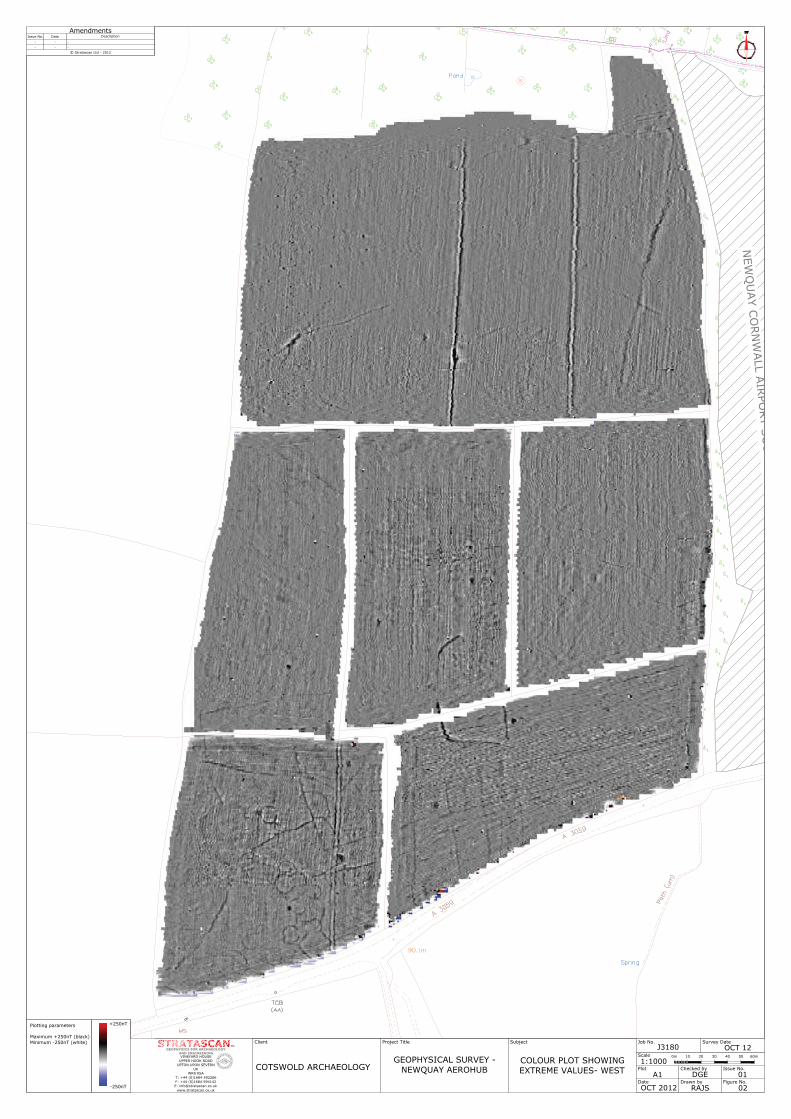
NEWQU
AY C
ORNW
ALL A
IRPO
RT S
OUT
STRATASCANTMGEOPHYSICS FOR ARCHAEOLOGY
AND ENGINEERINGVINEYARD HOUSEUPPER HOOK ROADUPTON UPON SEVERN
UKWR8 0SA
T: +44 (0)1684 592266F: +44 (0)1684 594142E: [email protected]
1:1000
Date
Plot
A1
Scale
Drawn by
Checked by
RAJSFigure No.
Issue No.
02
SubjectProject TitleClient Job No. Survey Date
01
COLOUR PLOT SHOWINGEXTREME VALUES- WESTCOTSWOLD ARCHAEOLOGY
DGE
OCT 2012
J3180 OCT 12
GEOPHYSICAL SURVEY -NEWQUAY AEROHUB
DateIssue No.
- -
AmendmentsDescription
-
-
- -
© Stratascan Ltd - 2012
Plotting parameters
Maximum +250nT (black)Minimum -250nT (white)
+250nT
-250nT
30100m 20 60m40 50
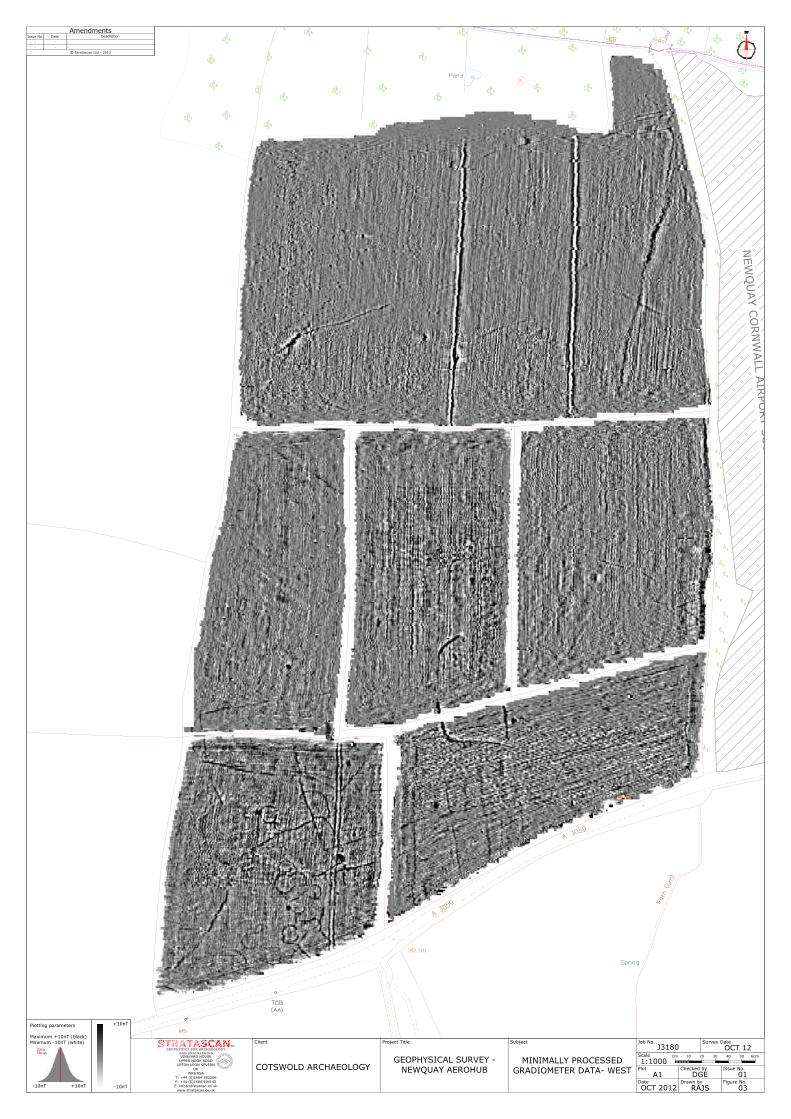
NEWQU
AY C
ORNW
ALL A
IRPO
RT S
OUT
STRATASCANTMGEOPHYSICS FOR ARCHAEOLOGY
AND ENGINEERINGVINEYARD HOUSEUPPER HOOK ROADUPTON UPON SEVERN
UKWR8 0SA
T: +44 (0)1684 592266F: +44 (0)1684 594142E: [email protected]
1:1000
Date
Plot
A1
Scale
Drawn by
Checked by
RAJSFigure No.
Issue No.
03
SubjectProject TitleClient Job No. Survey Date
01
MINIMALLY PROCESSEDGRADIOMETER DATA- WESTCOTSWOLD ARCHAEOLOGY
DGE
OCT 2012
J3180 OCT 12
GEOPHYSICAL SURVEY -NEWQUAY AEROHUB
DateIssue No.
- -
AmendmentsDescription
-
-
- -
© Stratascan Ltd - 2012
Plotting parameters
Maximum +10nT (black)Minimum -10nT (white)
-10nT +10nT
+10nT
-10nT
30100m 20 60m40 50

12
17
10 11
8
67
9
4
3
2
1
5
13
16
18
23
19
2122
2526
27
28
30
20
24
29
50
49
1415
32
33
3534
31
38
39
40
41
42
43
44
45
46
47
3748
36
79
78
80
82
92 91
93
90
89
88
87
86
84
83
85
81
94
98
95
96
100101
99
102
103
105104
106
107
108
109
110
111
112
113
114
115
116
118
117
52
51
54
53
55
56
97
159
159
159 159
NEWQU
AY C
ORNW
ALL A
IRPO
RT S
OUT
160
160
160160
160 160 160
160160
160
160160
160
STRATASCANTMGEOPHYSICS FOR ARCHAEOLOGY
AND ENGINEERINGVINEYARD HOUSEUPPER HOOK ROADUPTON UPON SEVERN
UKWR8 0SA
T: +44 (0)1684 592266F: +44 (0)1684 594142E: [email protected]
1:1000
Date
Plot
A1
Scale
Drawn by
Checked by
RAJSFigure No.
Issue No.
04
SubjectProject TitleClient Job No. Survey Date
01
ABSTRACTION ANDINTERPRETATION OFANOMALIES- WEST
COTSWOLD ARCHAEOLOGYDGE
OCT 2012
J3180 OCT 12
GEOPHYSICAL SURVEY -NEWQUAY AEROHUB
DateIssue No.
- -
AmendmentsDescription
-
-
- -
© Stratascan Ltd - 2012
Closely spaced parallel linear anomalies - probablyrelated to agricultural activity such as ploughing
Magnetic disturbance associated with nearby metalobject such as service or field boundary
Linear anomaly - probably related to pipe, cable orother modern service
Magnetic spike - probable ferrous object
Linear anomaly - possibly related to land drain
Scattered magnetic debris
Area of amorphous magnetic variation - probablenatural (e.g. geological or pedological) origin
OTHER ANOMALIES
POSSIBLE ARCHAEOLOGY
Positive anomaly / weak positive anomaly - probablecut feature of archaeological origin
PROBABLE ARCHAEOLOGY
Negative anomaly / weak negative anomaly - probablebank or earthwork of archaeological origin
Linear anomalies probably related to former fieldboundaries
KEY
Moderate strength discrete anomaly - probablethermoremanent feature
Moderate strength discrete anomaly - possiblethermoremanent feature
Strong magnetic debris - possible disturbed or madeground
Positive anomaly / weak positive anomaly - possible cutfeature of archaeological origin
Negative anomaly / weak negative anomaly - possiblebank or earthwork of archaeological origin
30100m 20 60m40 50

NEWQU
AY C
ORNW
ALL A
IRPO
RT S
OUTH
ERN
ACCESS R
OUTE
STRATASCANTMGEOPHYSICS FOR ARCHAEOLOGY
AND ENGINEERINGVINEYARD HOUSEUPPER HOOK ROADUPTON UPON SEVERN
UKWR8 0SA
T: +44 (0)1684 592266F: +44 (0)1684 594142E: [email protected]
1:1000
Date
Plot
A1
Scale
Drawn by
Checked by
RAJSFigure No.
Issue No.
05
SubjectProject TitleClient Job No. Survey Date
01
COLOUR PLOT SHOWINGEXTREME VALUES- CENTRALCOTSWOLD ARCHAEOLOGY
DGE
OCT 2012
J3180 OCT 12
GEOPHYSICAL SURVEY -NEWQUAY AEROHUB
DateIssue No.
- -
AmendmentsDescription
-
-
- -
© Stratascan Ltd - 2012
Plotting parameters
Maximum +250nT (black)Minimum -250nT (white)
-250nT +250nT
+250nT
-250nT
30100m 20 60m40 50

NEWQU
AY C
ORNW
ALL A
IRPO
RT S
OUTH
ERN
ACCESS R
OUTE
STRATASCANTMGEOPHYSICS FOR ARCHAEOLOGY
AND ENGINEERINGVINEYARD HOUSEUPPER HOOK ROADUPTON UPON SEVERN
UKWR8 0SA
T: +44 (0)1684 592266F: +44 (0)1684 594142E: [email protected]
1:1000
Date
Plot
A1
Scale
Drawn by
Checked by
RAJSFigure No.
Issue No.
06
SubjectProject TitleClient Job No. Survey Date
01
MINIMALLY PROCESSEDGRADIOMETER DATA-
CENTRALCOTSWOLD ARCHAEOLOGY
DGE
OCT 2012
J3180 OCT 12
GEOPHYSICAL SURVEY -NEWQUAY AEROHUB
DateIssue No.
- -
AmendmentsDescription
-
-
- -
© Stratascan Ltd - 2012
Plotting parameters
Maximum +10nT (black)Minimum -10nT (white)
-10nT +10nT
+10nT
-10nT
30100m 20 60m40 50

63
62
61
60
120
59
119
57 58
158
158
158
65
64
66
67
158
138
139
140
141
143
142
150
149148
147
146 145
144
151 152 153
156154
155
157
137
71132
133
131
70
130
134
135
136
69
68
129128
127
126
125
124
122
123
121
7273
74
7576
77
159159
159159
159
159
159
NEWQU
AY C
ORNW
ALL A
IRPO
RT S
OUTH
ERN
ACCESS R
OUTE
160
160
160
160
160
161
162
163
164
165
169
170 171
172
173
174
175
183
184
185
186
187
188
189
190
191
192
193194
195
196
200
198197
199
202201
203
218
219
220
221
222
223
223
STRATASCANTMGEOPHYSICS FOR ARCHAEOLOGY
AND ENGINEERINGVINEYARD HOUSEUPPER HOOK ROADUPTON UPON SEVERN
UKWR8 0SA
T: +44 (0)1684 592266F: +44 (0)1684 594142E: [email protected]
1:1000
Date
Plot
A1
Scale
Drawn by
Checked by
RAJSFigure No.
Issue No.
07
SubjectProject TitleClient Job No. Survey Date
01
ABSTRACTION ANDINTERPRETATION OF
ANOMALIES- CENTRALCOTSWOLD ARCHAEOLOGY
DGE
OCT 2012
J3180 OCT 12
GEOPHYSICAL SURVEY -NEWQUAY AEROHUB
DateIssue No.
- -
AmendmentsDescription
-
-
- -
© Stratascan Ltd - 2012
Closely spaced parallel linear anomalies - probablyrelated to agricultural activity such as ploughing
Magnetic disturbance associated with nearby metalobject such as service or field boundary
Linear anomaly - probably related to pipe, cable orother modern service
Magnetic spike - probable ferrous object
Linear anomaly - possibly related to land drain
Scattered magnetic debris
Area of amorphous magnetic variation - probablenatural (e.g. geological or pedological) origin
OTHER ANOMALIES
POSSIBLE ARCHAEOLOGY
Positive anomaly / weak positive anomaly - probablecut feature of archaeological origin
PROBABLE ARCHAEOLOGY
Negative anomaly / weak negative anomaly - probablebank or earthwork of archaeological origin
Linear anomalies probably related to former fieldboundaries
KEY
Moderate strength discrete anomaly - probablethermoremanent feature
Moderate strength discrete anomaly - possiblethermoremanent feature
Strong magnetic debris - possible disturbed or madeground
Positive anomaly / weak positive anomaly - possible cutfeature of archaeological origin
Negative anomaly / weak negative anomaly - possiblebank or earthwork of archaeological origin
30100m 20 60m40 50

STRATASCANTMGEOPHYSICS FOR ARCHAEOLOGY
AND ENGINEERINGVINEYARD HOUSEUPPER HOOK ROADUPTON UPON SEVERN
UKWR8 0SA
T: +44 (0)1684 592266F: +44 (0)1684 594142E: [email protected]
1:1000
Date
Plot
A1
Scale
Drawn by
Checked by
RAJSFigure No.
Issue No.
08
SubjectProject TitleClient Job No. Survey Date
01
COLOUR PLOT SHOWINGEXTREME VALUES- CENTRALCOTSWOLD ARCHAEOLOGY
DGE
OCT 2012
J3180 OCT 12
GEOPHYSICAL SURVEY -NEWQUAY AEROHUB
DateIssue No.
- -
AmendmentsDescription
-
-
- -
© Stratascan Ltd - 2012
Plotting parameters
Maximum +250nT (black)Minimum -250nT (white)
+250nT
-250nT
30100m 20 60m40 50
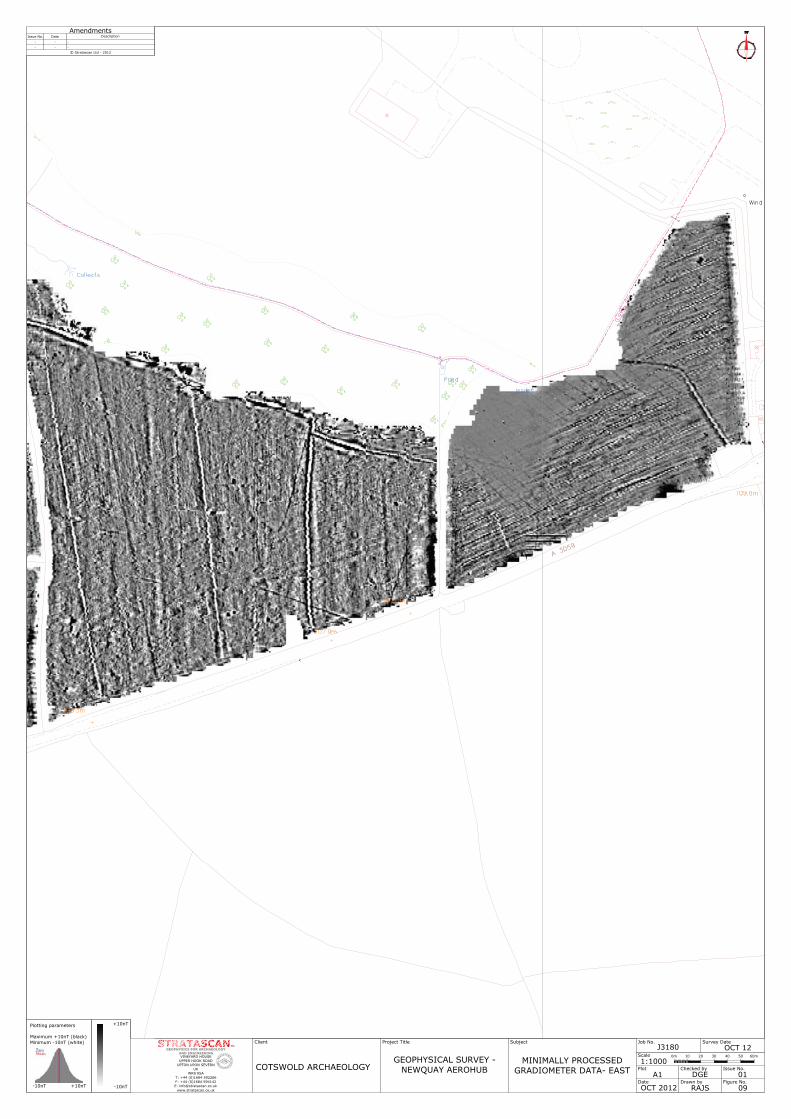
STRATASCANTMGEOPHYSICS FOR ARCHAEOLOGY
AND ENGINEERINGVINEYARD HOUSEUPPER HOOK ROADUPTON UPON SEVERN
UKWR8 0SA
T: +44 (0)1684 592266F: +44 (0)1684 594142E: [email protected]
1:1000
Date
Plot
A1
Scale
Drawn by
Checked by
RAJSFigure No.
Issue No.
09
SubjectProject TitleClient Job No. Survey Date
01
MINIMALLY PROCESSEDGRADIOMETER DATA- EASTCOTSWOLD ARCHAEOLOGY
DGE
OCT 2012
J3180 OCT 12
GEOPHYSICAL SURVEY -NEWQUAY AEROHUB
DateIssue No.
- -
AmendmentsDescription
-
-
- -
© Stratascan Ltd - 2012
Plotting parameters
Maximum +10nT (black)Minimum -10nT (white)
-10nT +10nT
+10nT
-10nT
30100m 20 60m40 50

166
167
168
172
173
174
175
176
177
178
179
180
181
182
203
204
205
206
207
208
209
210 211
212
213
214
217
215
216
223
223
223
223
STRATASCANTMGEOPHYSICS FOR ARCHAEOLOGY
AND ENGINEERINGVINEYARD HOUSEUPPER HOOK ROADUPTON UPON SEVERN
UKWR8 0SA
T: +44 (0)1684 592266F: +44 (0)1684 594142E: [email protected]
1:1000
Date
Plot
A1
Scale
Drawn by
Checked by
RAJSFigure No.
Issue No.
10
SubjectProject TitleClient Job No. Survey Date
01
ABSTRACTION ANDINTERPRETATION OF
ANOMALIES- CENTRALCOTSWOLD ARCHAEOLOGY
DGE
OCT 2012
J3180 OCT 12
GEOPHYSICAL SURVEY -NEWQUAY AEROHUB
DateIssue No.
- -
AmendmentsDescription
-
-
- -
© Stratascan Ltd - 2012
Closely spaced parallel linear anomalies - probablyrelated to agricultural activity such as ploughing
Magnetic disturbance associated with nearby metalobject such as service or field boundary
Linear anomaly - probably related to pipe, cable orother modern service
Magnetic spike - probable ferrous object
Linear anomaly - possibly related to land drain
Scattered magnetic debris
Area of amorphous magnetic variation - probablenatural (e.g. geological or pedological) origin
OTHER ANOMALIES
POSSIBLE ARCHAEOLOGY
Positive anomaly / weak positive anomaly - probablecut feature of archaeological origin
PROBABLE ARCHAEOLOGY
Negative anomaly / weak negative anomaly - probablebank or earthwork of archaeological origin
Linear anomalies probably related to former fieldboundaries
KEY
Moderate strength discrete anomaly - probablethermoremanent feature
Moderate strength discrete anomaly - possiblethermoremanent feature
Strong magnetic debris - possible disturbed or madeground
Positive anomaly / weak positive anomaly - possible cutfeature of archaeological origin
Negative anomaly / weak negative anomaly - possiblebank or earthwork of archaeological origin
30100m 20 60m40 50

NEWQUAY CORNWALL AIRPORT SOUTHERN ACCESS ROUTE
A1
Plot
PLOT O
F M
INIM
ALLY
PRO
CESSED
GRAD
IOM
ETER
DATA
GEOPH
YSIC
AL SURVEY -
NEWQU
AY A
ERO
HU
B
COTSW
OLD
ARCH
AEO
LOGY
Date
Issue
No.
--
Amendments
Description
--
Checked by
BPM
Issue
No.
Figure
No.
11
Drawn by
DG
EDate
OCT 2
012
Scale
1:2
500
Client
Project
Title
Subject
Survey
Date
Job No.
01
J3180
OCT 1
2
--
© Stratascan Ltd
- 2
012
VIN
EYARD
HOUSE
UPT
ON
UPO
N S
EVERN
WR8 0SA SU
MO
GROUP
MEM
BER
THE
SURV
EYA
SSO
CIA
TIO
N
STR
ATA
SC
AN
TM
GEO
PH
YS
ICS
FO
R A
RC
HA
EO
LO
GY
AN
D E
NG
INEER
ING
T:
01684 5
92266
E: info
@stratascan
.co.uk
www
.stratascan.co.uk
-10nT
Plotting param
eters
Maximum
+10nT (black
)Minimum
-10nT (white)
+10nT
-10nT
+10nT
0m
50
150m
100

12
17
10
11
8
679
4
3
2
1
5
13
16
18
23
19
21
22
25
26
27 28
30
20
24
29
504
9
14
15
32
33
35
34
31
38
39
40 41
42
43
44
45
46
47
37
48
36
79
78
80
82
92
91
93
908
9
88
87
86
84
83
85
81
94
98
95
96
100
101
99
102
103
105
104
106
107
108
109
110
111
112
113 114
115
116
118
117
52
51
545
3
55
56
63
62
61
60
120
59
119
57
58
158
158
158
65
64
66
67
158
138
139
140
141
143
142
150
149
1481
47
146
145
144
151
152
153 156
154
155
157
137
71
132
133
131
70
130
134
135
136
69
68
129
128
127
126
125
124
122
123
121 7
273
74
75
76
77
97
159
159 1
59
159
159
1591
59
159
159
159
159
NEWQUAY CORNWALL AIRPORT SOUTHERN ACCESS ROUTE
160
160
160
160
160
160
160
160
160
160
160
160
160
160
160
160
160
160
161
1621
63
164
165
166
167
168
169
170
171
172
173174
175
176
177
178
179
180 181
182
183
184
185
186
187
188
189
190
191
192 193
194
195
196
200
198
197 1
99
202
201
203
204
205
206
207
208
209
210
211
212
213
214
217
215
216
218
219
220
221
222
223
223
223
223
223
A1
Plot
ABSTRACTIO
N A
ND
INTERPR
ETATIO
N O
FAN
OM
ALI
ES -
OVERVIEW
GEOPH
YSIC
AL SURVEY -
NEWQU
AY A
ERO
HU
B
COTSW
OLD
ARCH
AEO
LOGY
Date
Issue
No.
--
Amendments
Description
--
Checked by
BPM
Issue
No.
Figure
No.
12
Drawn by
DG
EDate
OCT 2
012
Scale
1:2
500
Client
Project
Title
Subject
Survey
Date
Job No.
01
J3180
OCT 1
2
--
© Stratascan Ltd
- 2
012
VIN
EYARD
HOUSE
UPT
ON
UPO
N S
EVERN
WR8 0SA SU
MO
GROUP
MEM
BER
THE
SURV
EYA
SSO
CIA
TIO
N
STR
ATA
SC
AN
TM
GEO
PH
YS
ICS
FO
R A
RC
HA
EO
LO
GY
AN
D E
NG
INEER
ING
T:
01684 5
92266
E: info
@stratascan
.co.uk
www
.stratascan.co.uk
Closely
spaced
parallel linear anomalies
- probably
related to agricultural activity
such
as ploughing
Magnetic
disturbance
associated
with nearby metal
object
such
as service or field boundary
Linear anomaly
- probably
related
to pipe,
cable
or
other
modern service
Magnetic
spike
- probable
ferrous object
Linear anomaly
- possibly
related
to land drain
Scattered
magnetic
debris
Area of am
orphous magnetic
variation -
probable
natural (e
.g. geological
or pedological
) origin
OTH
ER A
NO
MALI
ES
POSSIB
LE ARCH
AEO
LOGY
Positive
anomaly
/ weak positive
anomaly
- probable
cut feature
of archaeological
origin
PRO
BABLE
ARCH
AEO
LOGY
Negative anomaly
/ weak negative anomaly
- probable
bank or earthwork
of archaeological
origin
KEY
Moderate strength
discrete anomaly
- probable
thermoremanent feature
Moderate strength
discrete anomaly
- possible
thermoremanent feature
Strong m
agnetic
debris
- possible
disturbed
or made
ground
Positive
anomaly
/ weak positive
anomaly
- possible
cut
feature
of archaeological
origin
Negative anomaly
/ weak negative anomaly
- possible
bank or earthwork
of archaeological
origin
0m
50
150m
100
Linear anomalies probably
related
to form
er field
boundaries
Related Documents