This document is downloaded from DR‑NTU (https://dr.ntu.edu.sg) Nanyang Technological University, Singapore. Aerodynamics of badminton shuttlecock : Characterization of flow around a conical skirt with gaps, behind a hemispherical dome Lin, C. S. H.; Chua, C. K.; Yeo, J. H. 2014 Lin, C., Chua, C., & Yeo, J. (2014). Aerodynamics of badminton shuttlecock: Characterization of flow around a conical skirt with gaps, behind a hemispherical dome. Journal of Wind Engineering and Industrial Aerodynamics, 127, 29‑39. https://hdl.handle.net/10356/79761 https://doi.org/10.1016/j.jweia.2014.02.002 © 2014 Elsevier Ltd. This is the author created version of a work that has been peer reviewed and accepted for publication by Journal of Wind Engineering & Industrial Aerodynamics, Elsevier Ltd. It incorporates referee’s comments but changes resulting from the publishing process, such as copyediting, structural formatting, may not be reflected in this document. The published version is available at: [http://dx.doi.org/10.1016/j.jweia.2014.02.002]. Downloaded on 15 Mar 2022 14:51:55 SGT

Welcome message from author
This document is posted to help you gain knowledge. Please leave a comment to let me know what you think about it! Share it to your friends and learn new things together.
Transcript

This document is downloaded from DR‑NTU (https://dr.ntu.edu.sg)Nanyang Technological University, Singapore.
Aerodynamics of badminton shuttlecock :Characterization of flow around a conical skirtwith gaps, behind a hemispherical dome
Lin, C. S. H.; Chua, C. K.; Yeo, J. H.
2014
Lin, C., Chua, C., & Yeo, J. (2014). Aerodynamics of badminton shuttlecock: Characterizationof flow around a conical skirt with gaps, behind a hemispherical dome. Journal of WindEngineering and Industrial Aerodynamics, 127, 29‑39.
https://hdl.handle.net/10356/79761
https://doi.org/10.1016/j.jweia.2014.02.002
© 2014 Elsevier Ltd. This is the author created version of a work that has been peerreviewed and accepted for publication by Journal of Wind Engineering & IndustrialAerodynamics, Elsevier Ltd. It incorporates referee’s comments but changes resultingfrom the publishing process, such as copyediting, structural formatting, may not bereflected in this document. The published version is available at:[http://dx.doi.org/10.1016/j.jweia.2014.02.002].
Downloaded on 15 Mar 2022 14:51:55 SGT
Elsevier Editorial System(tm) for Journal of Wind Engineering & Industrial Aerodynamics Manuscript Draft Manuscript Number: INDAER-D-13-00295 Title: Aerodynamics of badminton shuttlecock: Characterization of flow around a conical skirt with gaps, behind a hemispherical dome Article Type: Full Length Article Keywords: shuttlecock; blunt body; flow; aerodynamics; pressure profile Corresponding Author: Mr. Calvin Shenghuai Lin, B.Eng Corresponding Author's Institution: Nanyang Technological University First Author: Calvin Shenghuai Lin, B.Eng Order of Authors: Calvin Shenghuai Lin, B.Eng; Chee Kai Chua, Ph.D; Joon Hock Yeo, Ph.D

Comparative analysis of flow around shuttlecocks with and without gaps through CFD.
Presence of gaps increased air bleed and reduced blunt body effect.
In all instances, gaps increased the drag over a gapless shuttlecock.
Velocity plot, wake vector plot, and pressure profile plots were evaluated.
Experimental data on gapless model shows good agreement with numerical data.
Highlights (for review)
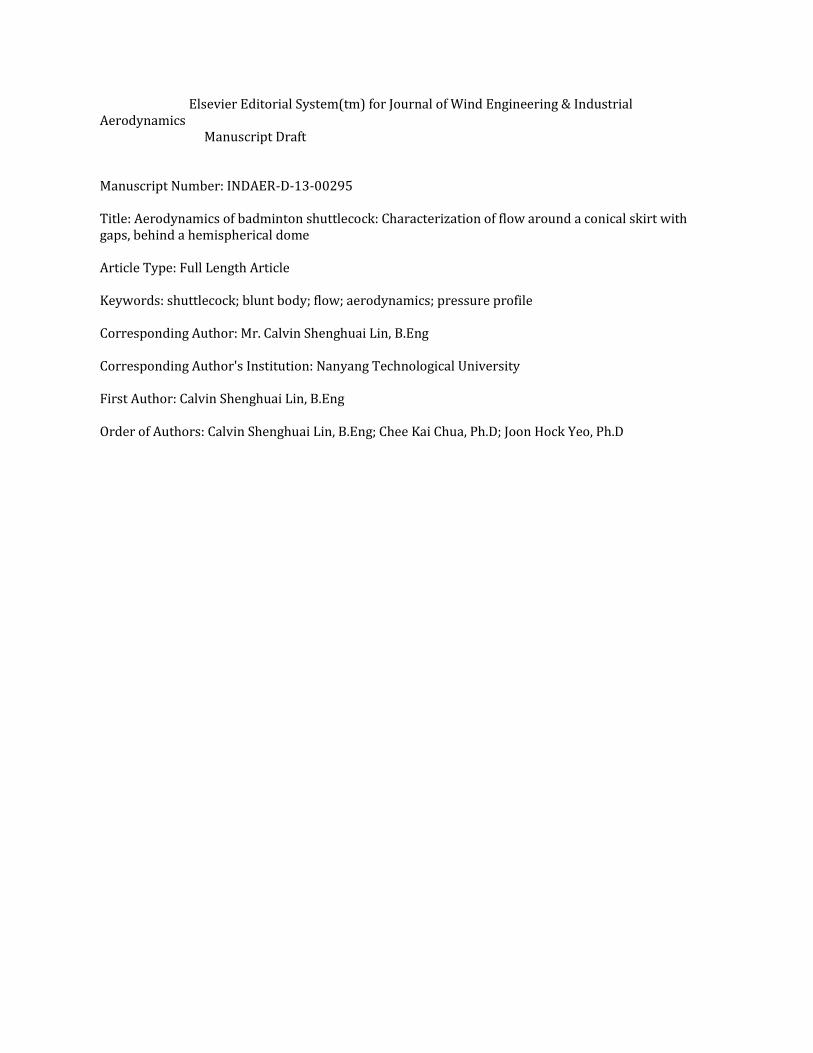
Dear Editor-in-Chief,
Please find enclosed our manuscript, “Aerodynamics of badminton shuttlecock: Characterization
of flow around a conical skirt with gaps, behind a hemispherical dome” by Lin et al., which we
would like to submit for publication as an original research article in Journal of Wind
Engineering and Industrial Aerodynamics.
The flow around a badminton shuttlecock is interesting because aerodynamically, it is the
combination of two blunt bodies- a thin wall conical skirt behind a hemispherical dome.
However, gaps are required along the skirt of the shuttlecock to fulfill the typical drag
characteristics and flight performance associated with a shuttle. This is an unusual case where
drag is desired. It is proposed that these gaps reduce the blunt body effect, and result from the
work supports this. While there have been previous works that observed the differences between
a skirt with and without gaps, none was able to explain the effect of varying the gap sizes.
Building on those publications, we were able to qualify and quantify how changing the gap size
affects the shuttlecock. To our knowledge, there exists no similar publication on this area of
work for a thin wall conical bluff body. Moreover, there has been limited work in the open
literature on flow over such blunt body with gaps. Therefore, we believe that this study will be
highly relevant to future work in synthetic shuttlecocks and may even be applied to other fields
of industrial aerodynamics.
We hope this article will interest the readers of Journal of Wind Engineering and Industrial
Aerodynamics. We look forward to your reply. Thank you for reading.
Please address all correspondence to [email protected]
Yours sincerely,
Calvin Lin
Cover Letter

Aerodynamics of badminton shuttlecock: Characterization of flow around a
conical skirt with gaps, behind a hemispherical dome
C.S.H. Lin a, b, #
C.K. Chua a
J.H. Yeo a
a School of mechanical and aerospace engineering, Nanyang Technological University, 50
Nanyang Ave, Singapore 639798
bInstitute for sports research, Nanyang Technological University, 50 Nanyang Ave, Singapore
639798
#Corresponding author: Lin Shenghuai Calvin
Tel: 065-67904192
E-mail: [email protected]
Postal address: 158 Jalan Teck Whye #13-109, Singapore, Singapore 680158
*ManuscriptClick here to view linked References
The effects of gaps on flow properties were studied for thin walled conical structure behind a
hemispherical dome- badminton shuttlecocks . Computational fluid dynamics was applied to six
different profiles with differing gap sizes. The gaps increased the drag force over a gapless
conical skirt by up to 45.2% using the design dimensions. This is termed the critical gap size.
Below the critical gap size, drag increases with as gap widens. Beyond the critical gap size,
larger gaps resulted in reduced blunt body effect, reduced drag, and increased skirt porosity.
Bleeding caused the formation of air jets that diminished the recirculation typical in wake behind
a blunt body. Analysis of the pressure profiles showed that gaps increased the differential
pressure between the inner and outer surface, thereby producing more drag. The gaps also
resulted in spikes along the pressure profiles. Some of the numerical results were validated
against wind tunnel experiments. The numerical and experimental results showed good
agreement.
Keywords: shuttlecock; blunt body; flow; aerodynamics; pressure profile
1. Introduction
The shuttlecock used in a badminton game has the drag characteristics of a blunt body.
Aerodynamically, the shuttlecock is equivalent to a semi-porous thin wall cone attached behind a
solid hemispherical dome. This property gives the shuttlecock very high deceleration rate, where
shuttlecock velocity in the same game can range from 5.5m/s to over 80m/s. Based on the
guidelines from Badminton World Federation (BWF 1988), a badminton shuttlecock comprises
of a 16 feather skirt attached to a base and weigh between 4.74g to 5.50g. The skirt can be
replaced by synthetic materials but flight characteristics should remain similar. Since flight of a
shuttlecock is highly dependent on the drag properties, the synthetic skirt must retain the same

drag properties. The synthetic skirt must also weigh as light as a feather skirt to retain the flight
performance, especially the trajectory and turnover. The challenge then, is innovating a skirt
design that can reproduce feather performance. Through the decades of badminton sports, there
have been numerous attempts from the industry at the creation of an alternative to the natural
feather shuttlecock. However, none was successful and even till today, feather shuttlecocks
remain the top choice. Despite that, the development of a synthetic shuttlecock remains attractive
for various reasons. These include the possible increase in consistency from batch to batch of
shuttlecock, the decrease in demand of natural waterfowl feathers that can be unpredictable in
supply and quality, improved durability, and lowered production cost. The availability of good
synthetic shuttlecocks will make badminton more affordable and attractive as a recreational sport
because top grade feather shuttles remain a costly consumable in the game.
The first step in development of synthetic shuttles is to understand the fundamental differences
between it and the feather counterpart. Numerous previous works explored the differences
between synthetic and feather shuttlecocks. Cooke (Cooke 1992; Cooke 1996; Cooke 1999;
Cooke 2002) was one pioneer of such works. Her works include trajectory studies to compare the
flight path, wind tunnel studies to evaluate flow field differences between synthetic and feather
shuttles, and the design process changes required for development of synthetic shuttlecocks.
More recently, Alam et al. (Alam, Chowdhury et al. 2009) compared the drag coefficient
between feather and synthetic shuttlecocks in the wind tunnel. The average drag coefficient
observed for the 10 types of shuttlecocks was 0.61 at flow speed over 100km/hr. It was proposed
that the skirt deformation of synthetic shuttles at high speed was the cause in lowered drag. The
work by Chan and Rossmann (Chan and Rossmann 2012) reinforced this idea by observing the
transient deformation under steady state flow in wind tunnel. It was observed that even with spin,
synthetic skirts are unable to maintain the circular geometry at high speed. In contrast, feather
shuttles were able to resist deformation. The feathers shuttlecocks were also observed to have
higher spin rate at the same free stream speed. Differences between feather and synthetic
shuttlecocks have also been observed through flow simulation. Verma et al. (Verma, Desai et al.
2013) applied computational fluid dynamics (CFD) to evaluate the differences between synthetic
and feather shuttlecock. The various planar cuts and plots presented gave insight to local flow
conditions around the badminton shuttlecock skirt. Through CFD, the effect of twist angle of
feathers was studied. It was found that increasing the twist angle beyond 12 degrees lowered the
drag. However, such properties are less relevant for design of synthetic shuttles, because
synthetic skirts are typically molded as one-piece design. Study of the effect of gaps on feather
shuttlecocks by Kitta et al. (Kitta, Hasegawa et al. 2011) may be more applicable in the design of
synthetic skirts. This is because gap designs, which play a critical role in synthetic skirts, are
seldom discussed in open literatures. The work compared the drag coefficient of feather
shuttlecocks with and without gaps. It was observed that presence of gaps significantly increased
drag. Kitta et al. (Kitta, Hasegawa et al. 2011) also observed that spin has no direct effect on
drag. The drag change from spin was induced by the skirt expansion under the centrifugal force
of spin.
However, none of the work explored the effect of gap dimensions. In this paper, research was
carried out to investigate further the effect of gaps. The main objective is to increase the
understanding of how different gap sizes affect the skirt porosity and thus, the degree of
similarity to blunt body aerodynamics. In addition to drag estimation, changes from varying gaps
dimensions were explained through study of the wake, bleeding through the skirt, and pressure
profiles along the skirt. Six simple shuttlecock models were studied in the numerical experiment:
a gapless cone model and five other cone models with varied gap dimension. The baseline result
of the gapless cone model was then compared through physical experiments. This reinforces the
validity of the CFD simulation. While the Reynolds-averaged Navier-Stokes (RANS) simulation
that was carried out may be the averaged values, it improves understanding of conical thin
walled bluff bodies which are much less studied than other solid bluff bodies. Moreover, the
work will serve as a foundation for subsequent shuttlecock development, especially in virtual
prototyping and transient simulation with Unsteady RANS (URANS) and Large Eddy
Simulation (LES).
2.1 Numerical Analysis
The reference bluff body, profile A, consists of a thin wall gapless conical cup (skirt) attached to
a solid hemispherical dome (cork) shown in Figure 1. Dimensions of the cork and skirt were
referenced from Verma et al. (Verma, Desai et al. 2013). To investigate the effect of gaps around
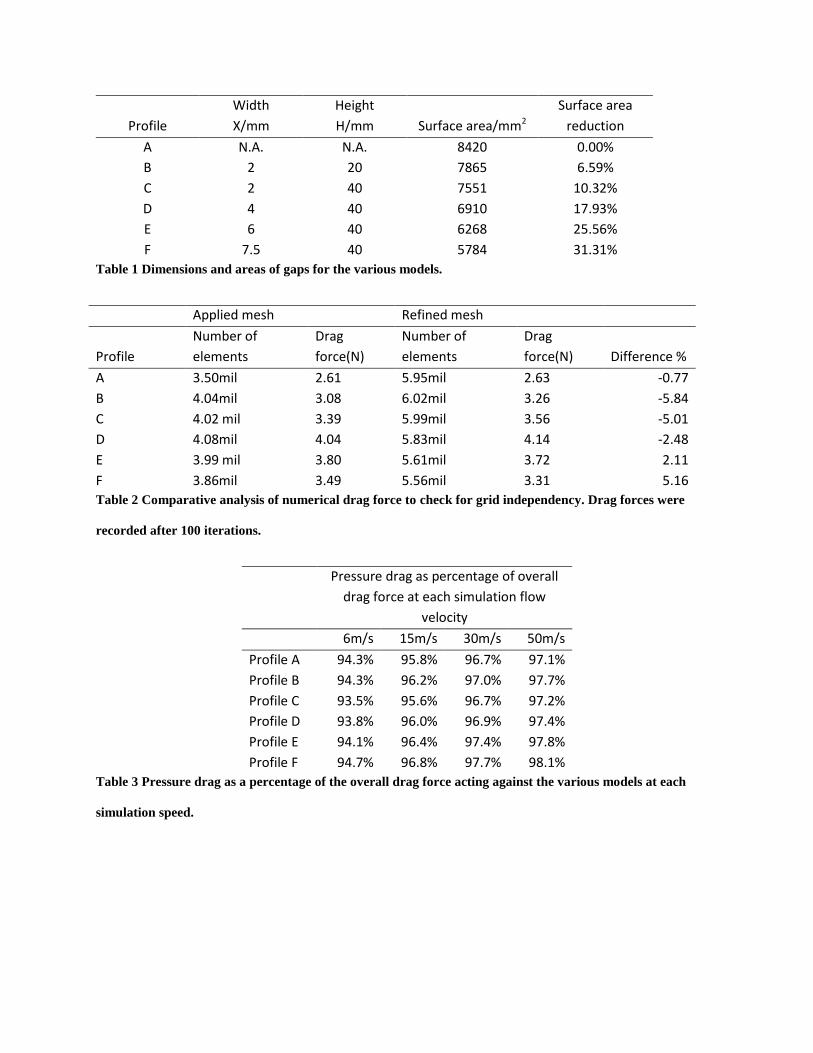
the skirt, 5 models (profile B to F), each with a different gap dimension, were constructed. Each
profile had 15 triangular gaps of X/mm width and H/mm height that extend downward along the
skirt beginning from 35mm behind the cork. External dimensions remain the same as profile A.
The various dimensions of cut, including the surface area reduction by virtue of the gaps, are
given in Table 1.
Numerical analysis was applied to the six simple shuttlecock profiles using ANSYSTM
suite.
Through ANSYSTM
design modeler, the CAD model of each profile was enclosed in a cylinder
of diameter 310mm, as shown in Figure 2. Flow inlet is 135mm upstream from the model, while
outlet is 500mm downstream. In defining the case in CFXTM
, velocity inlet was applied to the
inlet, 0Pa static pressure for the outlet, free-slip wall at the cylindrical wall, and no-slip wall on
the shuttlecock profile. Simulation was conducted using the shear stress transport turbulence
model (SST).
Unstructured mesh in the fluid domain within the cylinder was generated through ICEMTM
. By
comparison of numerical drag forces at 50m/s between the applied mesh and a finer mesh setup,
a mesh of 3.5 to 4 million elements was observed to be sufficient for grid independency.
Presented in Table 2 are the numerical drag forces after 100 iterations for each profile and mesh
setup. Such grid requirement is also similar to what was obtained by Verma et al. (Verma, Desai
et al. 2013). Drag forces obtained through the two meshes had differences of 0.7-5.8% for the six
profiles. At 0.7%, the gapless shuttlecock model A had the smallest difference in drag predicted
by the two meshes. Despite the higher magnitude of 5%, differences in numerical drag between
the applied mesh and refined mesh for profile B, C and F are still of acceptable level.
2.2 Experimental validation of numerical data
The numerical drag forces obtained were validated through wind tunnel analysis of physical
models of the profiles. The hard models were manufactured through ObjectTM
Eden 350V on
FullCure 720 model material and FullCure 705 support material. This validation work was
presented in (Lin, Chua et al. 2013). Due to resource limitation, only profile A, C and E were
fabricated. Profile A was chosen because it presents a baseline value that is comparable against
previous works on a gapless conical skirt, such as (Cooke 1992; Kitta, Hasegawa et al. 2011;
Nakagawa, Hasegawa et al. 2012; Verma, Desai et al. 2013). Profile C and E were chosen
because their drag coefficients are close to that of a speed 76 feather shuttlecock. Moreover,
numerical drag forces of profile C and E fall on an interesting trend in study of the effect of gap
on drag. At gap size of profile C, increasing the gap size increases the resultant drag. However,

drag reduces with further increase in gap size from that of profile E. Thus, physical models of
these two profiles were reproduced to validate the trend.
Numerical pressure on the skirt of the gapless shuttlecock was validated with experimental data.
The pressure profile on the outer wall was validated against the experimental data by Cooke
(Cooke 1992). Since no inner pressure profile of a thin wall gapless conical skirt was found in
the open literature, a fourth physical model consisting of a gapless cone with attachment for
silicon tubing was manufactured to validate the inner pressure profile. This physical model, as
presented in Figure 3, was manufactured through the same rapid prototyping process as the
physical models for drag validation. The only difference is the fittings for pressure measurements
that were integrated into the skirt, and then fabricated as a one-piece design. The fittings are
located at 30mm, 40mm, 50mm, 60mm, 70mm, and 80mm aft of the tip of the cork. Static
pressure measurement was carried out using a MPXV7002DP differential pressure sensor.
All measurements were conducted in a closed loop wind tunnel commissioned by STEM ISI
ImpiantiS.p.A with a test section measuring 780mm (W) x 720mm (H) x 2000mm (L). Drag
forces were recorded through a calibrated load system comprising of a Seeed Studio 500g load
cell (SEN128A3B) and a Vishay P-3500 strain indicator. Drag force measurements were only
conducted at 15m/s, 30m/s, and 50m/s. No experimental drag data was collected for 6m/s
because the load system was not designed for the small load involved (0.05N).
3. Results and discussions
Effect of the gaps was investigated through study on the drag forces, discussion of the wake
behind the blunt body, and analysis of the coefficient of pressure. Flow simulation was
conducted at velocities of 6m/s (Re~0.26x10⁵), 15m/s (Re~0.66x10
5), 30m/s (Re~1.3x10
5), and

50m/s (Re~2.2x10⁵). These velocities were chosen because 6m/s is the terminal velocity of
various feather shuttlecocks tested, 15m/s and 30m/s allow for comparison with many
shuttlecock experimental data in the open literature, while 50m/s is the high Reynolds number
flow that is of interest in recent literatures on badminton shuttlecocks. Having the same diameter
and test conditions, the six profiles investigated have the same Reynolds number at the same
flow condition. Therefore, the results are discussed with respect to free-stream velocity (m/s) for
easier comparison with the local velocities in the velocity plots.
3.1 Drag coefficient
Drag coefficients of the profiles at various airspeeds are shown in Figure 4. The presence of gaps
increases the drag experienced by the shuttlecock model, but little variation is seen within each
shuttlecock profile at different airspeed. The consistent drag coefficient with respect to airspeed
suggests that the shuttlecock models remain in sub-critical flow regime throughout the operating
airspeed that was investigated. This observation agrees with previous work such as that in
(Cooke 1999; Alam, Chowdhury et al. 2010; Kitta, Hasegawa et al. 2011; Chan and Rossmann
2012). In those publications, changes in drag coefficient observed through wind tunnel
experiments were attributed to changes in skirt diameter due to combination of shrinkage by high
speed flow and expansion from centrifugal force of spin.
Comparison between profile A and B shows that introduction of gaps on the skirt resulted in an
average increase of drag coefficient by 18.8%. The largest average increase over a gapless
conical shuttlecock was observed on profile D at 45.2%. Comparing the drag forces on the
various profiles at the same flow rate further demonstrated the effect of gap size on drag. This is
seen in Figure 5 where drag forces of the various profiles at 50m/s flow are tabulated. It was

observed that the gapless conical model has the lowest drag force. As exhibited by the numerical
data of profile B and C, drag on the shuttlecock increased as gap size widened. Drag peaked at
profile D, with approximately 18% surface reduction. Further increase in gap size, as seen in
profile E and F, caused reduction in drag force. This is attributed by the increased bleeding with
larger gap size, thereby reducing the blunt body effect. In this case, profile D may be termed as
the critical gap size.
For a blunt body such as a sphere or flat plate, pressure drag is the dominant component of drag
force (Bertin and Cummings 2009). According to Cooke (Cooke 1999), the drag regime of a
shuttlecock is similar to that of a blunt body, and the numerical data obtained in this study agrees
with that. Contribution of pressure drag summarized in Table 3 shows pressure drag to be the
dominant drag component throughout typical operating speeds of the models. Dominance of
pressure drag over viscous drag increases with increasing airspeed in all profiles. Variation in
gap dimensions has less significant effect. The significance of pressure drag indicates the
importance of understanding the pressure profile along a shuttlecock model. The impact of gaps
on bleeding and pressure coefficient along the six profiles will be further explored in subsequent
sections of this article.
The trend observed in Figure 5 demonstrates that drag first increases with growing gap size and
then subsequently decreases when gaps are larger than the critical gap size. This is an important
aspect in the design of synthetic shuttlecocks because it allows for the balance between the
various design specifications and the resultant drag force. Figure 5 shows that for a desired drag
force, there exists two possible design points, one before and one after the critical gap size. Since
flight trajectory of a shuttlecock is heavily influenced by the drag force (Cooke 2002), these two
design points may represent two designs that have very different physical properties, but similar

flight performance at the same overall weight. For instance, the design curve in Figure 5 shows
that a drag force of 3.7N can be achieved by a skirt profile with gaps that reduce the surface area
by either 12.5% or 27.5%. For application in a synthetic shuttlecock, the skirt design with gaps
of 27.5% surface area reduction will be desired because of inherent difficulty in substitution of
lightweight natural feather with synthetic material. Moreover, the larger gaps may increase
stability by virtue of a more forward center of gravity and changes in inertia of moments.
However, the design curve in Figure 5 is design specific. That is, a new curve is required for
gaps of other order or arrangement.
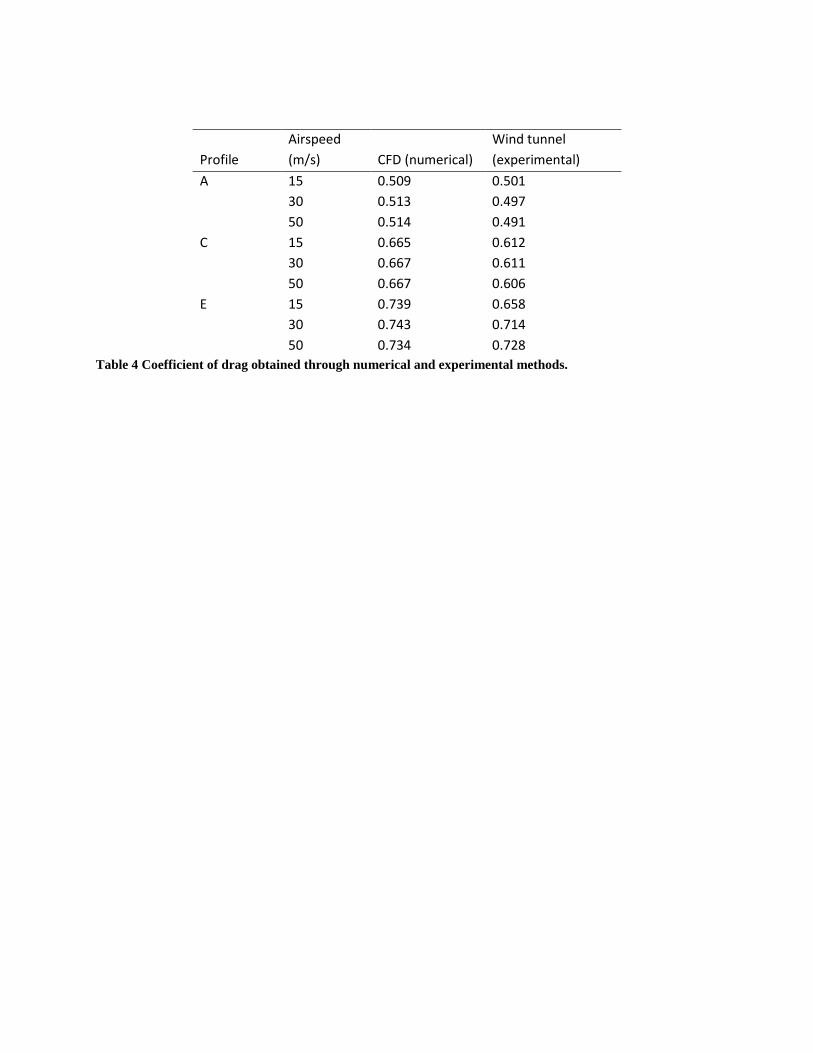
Drag measurement with physical models of profile A, C, and E shows good agreement with drag
predicted through numerical method. The results, as presented in Table 4, suggest that the
simulation results are reliable. Average percentage difference between numerical and
experimental drag coefficient is 3.11% for profile A, 8.50% for profile C, and 5.25% for profile
E.
3.2 Effect of gaps on wake
When the gaps are small or not present, such as in profile A, B and C, recirculation of air is seen
in the immediate wake region of the model, as per Figure 6. This pair of counter rotating vortices
seen in the plane is located directly behind the skirt within an area of the largest diameter of the
skirt. Due to the counter rotation, it was observed that the near field wake around the core region
have a tendency to curl inward. Vector plot of the wake also shows reverse flow near the core
region of the skirt. The above is similar to a typical blunt body, such as a square cylinder as
depicted in (Hu, Zhao et al. 2012) or a blunt body with rounded edges, as studied by Chok et al.

(Chok, Parameswaran et al. 1994). This observed wake pattern is same as the wake observed for
a shuttlecock through physical experiment by Cooke (Cooke 1999).
As gap size increases, intensity of the recirculation and reverse flow decreases. Vector plot of the
wake of profile D, also in Figure 6, exhibits much lower reverse flow velocity as compared to the
other profiles with smaller gap sizes. Beyond the critical gap size, as on profile E and F,
recirculation and flow reversal is no longer observed on the velocity vector plot. Instead of the
medium intensity (16-32m/s) reverse flow observed from profile A, B, and C, or the low
intensity (0-15m/s) reverse flow observed for profile D, high speed air stream is seen in the
immediate wake of profile E and F. It is likely that the high velocity stream forming in and
exiting through the skirt is due to the increased bleeding. As observed from Figure 7, amount of
air bleeding through the shuttlecock skirt increases with gap size, thereby increasing the overall
skirt porosity. It is likely that the increased dominance of gap is reducing the blunt body effect.
When the gaps are small, as seen on profile B and C, small stream of high velocity air is formed
only within the skirt around the gaps. The jet of high velocity air grows in coverage and intensity
as gap size increases, eventually going beyond the skirt and into the wake as seen in the velocity
plot from profile E and F in Figure 7. Indeed, this stream of air was also observed in physical
experiments on flow visualization by Cooke (Cooke 1992; Cooke 1999) and Kitta et al. (Kitta,
Hasegawa et al. 2011). Cooke (Cooke 1999) termed this stream as “air jet”, and on basis of the
work by Calvert (Calvert 1967) proposed that such bleeding increases the drag of a 3-
dimensional bluff body over a gapless conical skirt. Kitta et al. (Kitta, Hasegawa et al. 2011)
presented experimental result of a shuttlecock with gaps and with its gaps covered. It was
concluded that gaps increase drag of a shuttlecock. Moreover, bleeding from the gaps reduced
the flow over the outer surface of the skirt.

3.3 Coefficient of pressure
Surface pressure profile obtained from flow simulation for the gapless profile A was validated
with experimental data. In general, comparative analysis between experimental data and
simulation results show the simulation method to be reliable.
Outer surface pressure coefficient was validated against experimental data adopted from wind
tunnel measurement by Cooke (Cooke 1992), as given in Figure 8. The pressure profile behind
the cork follows closely to that obtained by Cooke (Cooke 1992) in the wind tunnel. Three
observations were identified. Firstly, numerical data shows a small first peak at location of
approximately 25mm, which is the region directly behind the leeward wall of the cork. In
contrast, the experimental data has no peak in pressure immediately behind the cork. This is
possibly due to the difference in lip area of the model that was used by Cooke (Cooke 1992).
Interestingly, this peak and dip between the 25mm to 30mm chord location was also observed in
the numerical data by Verma et al. (Verma, Desai et al. 2013). Secondly, it is noticed that the
second pressure peak (between 30mm to 40mm along the chord) occurred earlier in the
experimental data. This is because the gapless profile used in the numerical method was 85mm
and thus, was 4mm longer than the model used in the experimental study. Lastly, it was noticed
that unlike on the numerical result where pressure dips, experimental data shows that surface
pressure rises towards the end of the skirt profile. This could be due to the difference in
shuttlecock model where the physical model is a solid wood cone, while the numerical model is
a thin wall hollow profile.
Numerical pressure coefficient of the inner surface was validated through experimental data
obtained from the wind tunnel. In comparison with the numerical coefficient of pressure for

inner surface from Verma et al. (Verma, Desai et al. 2013), the result using the SST turbulence
model shows larger negative pressure on the inner side of the gapless shuttlecock. Experimental
result from measurement with physical model agrees with general trend and values that were
observed with the flow simulation in this work. Comparison of the numerical and experimental
results is presented in Figure 9. The increase in negative pressure after the 80mm point was also
captured in experimental data.
3.3.1 Effect of gaps on the coefficient of pressure
Numerical pressure profiles of the six models at fully developed flow of 6m/s and 50m/s are
presented in Figure 10, Figure 11, and Figure 12. These pressure profiles were obtained from
both the inner and outer surface of the models. By comparison, strong positive pressure was
observed along the outer surface of all models. Positive pressure on the outer surface increases
drag force acting against the shuttlecock by resisting forward motion. Strong negative pressure
was observed along the inner surface of the models. This negative pressure on the inner surface
creates suction effect in the direction against the flow, thus increasing drag. As described by
Verma et al. (Verma, Desai et al. 2013) , difference in outer and inner surface pressure creates
the resultant drag.
Comparing the upper pressure distribution of the six different models show that gaps along the
skirt has two significant effects. Firstly, the introduction of gaps resulted in an increase in the
magnitude of the first pressure peak that occurs at the 20mm point on the plots. Although this
pressure peak was already present in the gapless skirt, the introduction of gaps on the skirt with
shuttlecock model B, C, D and E resulted in increased magnitude. The gaps also resulted in this
peak occurring at an earlier point along the chordwise direction of the skirt. Interestingly, the
largest gaps, as seen in shuttlecock profile F, diminished the increase of the first pressure peak.
This is likely contributed by the larger gaps that resulted in more bleeding through the skirt at the
same chordwise position. The second impact of gaps on the outer surface is the increase in mid-
chord pressure with growing gap size. It was observed that with increased gap size, the second
pressure peak that occurs at approximately 43mm on the plot increases in magnitude. Moreover,
pressure between the first and second pressure peak also increased significantly. This is the
effect of gaps because such was not observed on the gapless profile A. Formation of the second
pressure peak also resulted in elevated pressure on the outer surface after the gaps. This
contributed to the increased drag that was observed over a gapless conical shuttlecock. With the
exception of profile B, little variation was seen between the 50m/s plot and 6m/s plot of each
model on the outer surface. Upper coefficient of pressure for profile B was observed to be lower
at flow speed of 6m/s than at 50m/s.
Analysis of the inner pressure profiles showed three significant observations. Firstly, gaps on the
skirt resulted in higher overall negative pressure in all instances. Drag increase with the presence
of gaps was contributed by larger negative pressure on the inside of the shuttlecock model, in
addition to the increased outer pressure. This is critical because drag characteristic of
shuttlecocks is dominated by pressure drag. Secondly, formation of the two pressure dips
(negative spikes) was noticed around the locations where the two positive pressure spikes were
seen on the outer pressure profile. Similar to the outer pressure peaks, intensity of these two
pressure dips increases with gap dimensions. However, unlike the outer surface where the first
pressure peak was not the sole effect of gaps, both pressure drops on the inner pressure profiles
were attributed by the gaps. This is because no spike was observed along the skirt on the inner
side of the gapless profile A. The last observation is the rise in negative pressure towards the end
of the skirt. This was only observed on profile E and F, suggesting this to be an effect of the air
jet that resulted from increased skirt porosity.
3.3.2 Further discussion on pressure profile
The pressure coefficient (50m/s) with respect to the chordwise position on the skirt of model E is
plotted in Figure 13. Three distinct regions labeled 1, 2, and 3 are discussed. Dashed lines
symbolize the cut plane of pressure plots. The first region occurring 28mm behind the tip of the
cork (labeled 1), corresponds to an area of low negative pressure. This dip was observed on all
the profile models, but to varying magnitude depending on the gap size. This phenomenon is
akin to the low pressure region at the leeward back wall of flow around a blunt body, such as that
observed by Stathopoulos and Zhou (Stathopoulos and Zhou 1993) , and Gomes et al. (Gomes,
Moret Rodrigues et al. 2005). In (Gomes, Moret Rodrigues et al. 2005), flow fields around
irregular shapes were studied. On faces in the leeward side, low negative pressure was recorded.
Such was also observed in the region of the skirt directly behind the cork. A pressure plot in the
X-Z plane corresponding to 28.3mm behind the tip of the cork is presented in Figure 14. Despite
the presence of gaps, pressure plot shows that negative pressure around the vicinity of the outer
side of the skirt remains consistent. Going outward in the radial direction, pressure increases
rapidly beyond the diameter of the cork, suggesting the validity of treating the region to the
immediate behind of the cork as similar to the wake behind a body. The lack of positive
differential pressure between the inner and outer surface in this segment suggests that no drag is
produced by this section of the skirt. This dip may not be observed if there is no lip located at the
intersection of skirt and cork.
After the dip, magnitude of inner and outer pressure rises rapidly along the chord length of the
skirt, reaching a peak after 34mm from the tip of cork. This large rise corresponds to region 2 in

Figure 13. This arises from the higher velocity flow, deflected by the cork, being incident onto
the stems of the skirt. This is in contrast to region 1 where the free stream velocity is shielded by
the cork. This is observed through the vector plot of the velocity flow field in Figure 15. The
pressure plot in X-Z plane, given in Figure 16, shows the high pressure region to be concentrated
around the stems between the gaps, while pressure between the gaps is much lower. This means
that air bleed through the gap, increasing the overall skirt porosity of the model, as also observed
in Figure 15.
Surface pressure on the outer surface remains high between region 2 and 3 of the surface
pressure plot. Pressure difference between the inner and outer surface at this section of the skirt
is large, contributing significantly to the pressure drag that is dominant for a blunt body, such as
the shuttlecock model. Towards region 3, pressure increases along the chord of the skirt on the
outer surface, peaking at the edge of the gap on the skirt, as seen in Figure 13. Pressure plot
before (Figure 17) and at the end of the gap locations (Figure 18) showed localized high-pressure
region around the stems. This suggests that blockage effect of the stem continues to be
significant. As seen from the pressure profile, outer pressure peaks at region 3 where the gaps are
discontinued on the skirt. This is likely due to the sudden increase in blockage when the air has
to choose between a path that goes inward into the skirt or outward around the skirt. The effect is
similar to an angled plate in a free stream, almost like a second stagnation point albeit to a
smaller magnitude. Such pressure peak is not observed on a gapless cone because the full
blockage earlier upstream resulted in the formation of a lower velocity layer that follows the
contour of the skirt, similar to a viscous sub-layer along a plate. Beyond region 3, little
difference is observed from a gapless skirt.
4. Conclusion
The numerical approach to evaluate the drag characteristic of shuttlecock models with gaps was
conducted with SST model. This was achieved by comparison of five profiles with gaps and a
reference gapless shuttlecock. To understand further the fundamentals, the wake vector plots,
pressure profiles, and velocity plots were studied. Numerical results of the gapless shuttlecock
were validated against experimental work to substantiate the simulation method. Major findings
include:
1. The gapless skirt has lower drag than the average badminton shuttlecock. The presence of
gaps along the skirt increased drag force significantly, even beyond that of a standard
shuttlecock. The largest drag increase that was observed was 45.2% over a gapless
shuttlecock. For gaps larger than the critical gap size, drag force decreases with
increasing gap size. It is likely that this is due to the increasing skirt porosity that is
reducing the blunt body effect. Pressure drag remains the dominant drag component
regardless of gap sizes.
2. The gapless shuttlecock exhibited a wake similar to a blunt body, where recirculation
vortices and flow reversal are observed. Key features of the wake reduce in intensity with
the introduction of gaps along the skirt. Beyond the critical gap size, formation of air jet
was observed instead of the recirculation effect in the wake of a blunt body. This again is
due to the increased skirt porosity, reinforcing the idea that beyond the critical gap size,
blunt body effect is significantly diminished.
3. Comparative analysis of the pressure profiles shows the fundamental effect of gaps. A
flat line inner pressure was observed for the reference gapless profile A. Introduction of
gaps resulted in spikes at various locations that were discussed. Magnitude of pressure on
inner and outer surface also increased with larger gap size despite the increased bleeding.

It is possible that the gaps prevented the formation of a lower velocity sub-layer that
adheres to the contour of the gapless skirt, as observed on the velocity plot.
References
Alam, F., H. Chowdhury, et al. (2010). "Measurements of aerodynamic properties of badminton
shuttlecocks." Procedia Engineering 2(2): 2487-2492.
Alam, F., H. Chowdhury, et al. (2009). "Aerodynamic properties of badminton shuttlecock."
International journal of mechanical and materials engineering 4(3): 266-272.
Bertin, J. J. and R. M. Cummings (2009). Aerodynamics for engineers. Upper saddle river, NJ,
Pearson Prentice-Hall.
BWF (1988). "Badminton World Federation eqiupment approval scheme (shuttlecock)."
Retrieved from http://www.bwfbadminton.org/file.aspx?id=473031&dl=1
Calvert, J. R. (1967). The seperated flow behind axially symmetric bodies. PhD thesis,
Cambridge University.
Chan, C. M. and J. S. Rossmann (2012). "Badminton shuttlecock aerodynamics: synthesizing
experiment and theory." Sports Engineering 15(2): 61-71.
Chok, C., S. Parameswaran, et al. (1994). "Numerical investigation of the effects of base slant on
the wake pattery and drag of three-dimensional bluff bodies with a rear blunt end."
Journal of wind engineering and industrial aerodynamics 51: 269-285.
Cooke, A. (1999). "Shuttlecock aerodynamics." Sports engineering ( International sports
engineering association) 2: 85-96.
Cooke, A. J. (1992). The aerodynamics and mechanics of shuttlecocks. Doctor of Philosophy,
University of Cambridge.
Cooke, A. J. (1996). Shuttlecock design and development. Sports engineering- Design and
development. S. J. Haake. Balkeman, Rotterdam, Blackwell Science.
Cooke, A. J. (2002). "Computer simulation of shuttlecock trajectories." Sports engineering (
International sports engineering association) 5(2): 93-105.
Gomes, M. G., A. Moret Rodrigues, et al. (2005). "Experimental and numerical study of wind
pressures on irregular-plan shapes." Journal of wind engineering and industrial
aerodynamics 93(10): 741-756.
Hu, L. H., X. Y. Zhao, et al. (2012). "An experimental investigation and characterization on
flame bifurcation and leaning transition behavior of a pool fire in near wake of a square
cylinder." International Journal of Heat and Mass Transfer 55(23-24): 7024-7035.
Kitta, S., H. Hasegawa, et al. (2011). "Aerodynamic properties of a shuttlecock with spin at high
Reynolds number." Procedia Engineering 13: 271-277.
Lin, C. S. H., C. K. Chua, et al. (2013). "Design of high performance badminton shuttlecocks;
virtual and rapid prototyping approach." Journal Virtual and Physical Prototyping 8(2):
165-171.
Nakagawa, K., H. Hasegawa, et al. (2012). "Aerodynamic Properties and Flow Behavior for a
Badminton Shuttlecock with Spin at High Reynolds Numbers." Procedia Engineering 34:
104-109.
Stathopoulos, T. and Y. S. Zhou (1993). "Numerical simulation of wind-induced pressures on
buildings of various geometries." Journal of wind engineering and industrial
aerodynamics 46 & 47: 419-430.
Verma, A., A. Desai, et al. (2013). "Aerodynamics of badminton shuttlecocks." Journal of fluids
and structures.
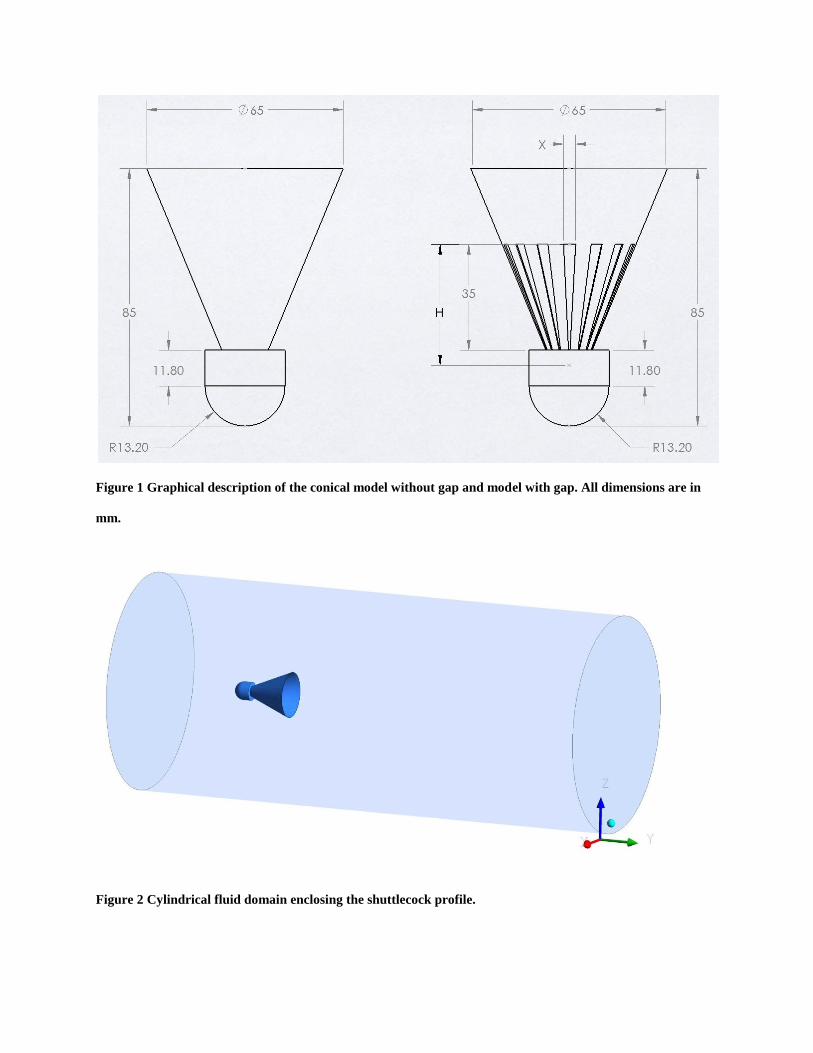
Figure 1 Graphical description of the conical model without gap and model with gap. All dimensions are in
mm.
Figure 2 Cylindrical fluid domain enclosing the shuttlecock profile.
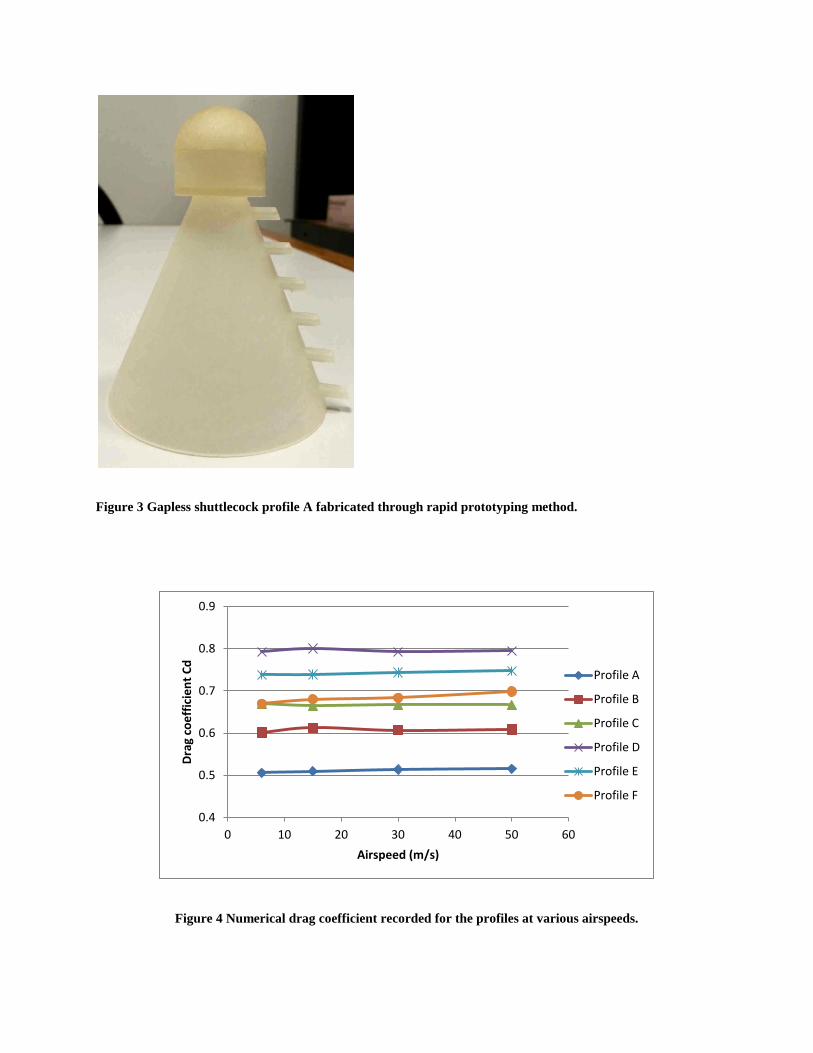
Figure 3 Gapless shuttlecock profile A fabricated through rapid prototyping method.
Figure 4 Numerical drag coefficient recorded for the profiles at various airspeeds.
0.4
0.5
0.6
0.7
0.8
0.9
0 10 20 30 40 50 60
Dra
g co
eff
icie
nt
Cd
Airspeed (m/s)
Profile A
Profile B
Profile C
Profile D
Profile E
Profile F

Figure 5 Effect of gap on the resultant numerical drag force at 50m/s flow speed. A design curve that can
predict the drag characteristic of gaps.
2.50
2.70
2.90
3.10
3.30
3.50
3.70
3.90
4.10
4.30
0 5 10 15 20 25 30 35
Dra
g fo
rce
(N
)
% Surface area reduction

Figure 6 Vector plot of the wake of the various shuttlecock profiles that were studied. Free stream velocity is
50m/s.

Figure 7 Effect of gap size on skirt porosity. Increased bleeding through the skirt is observed as gap size
grows. Shown is the planar view of velocity plot under free stream velocity of 50m/s.
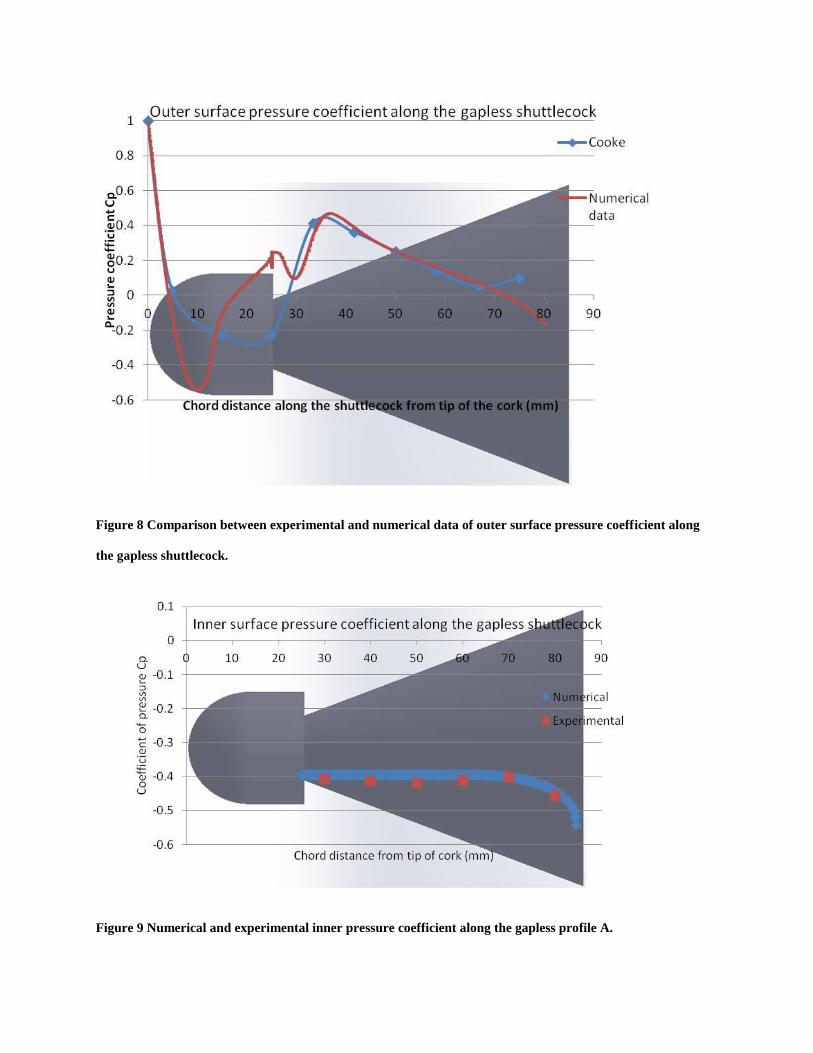
Figure 8 Comparison between experimental and numerical data of outer surface pressure coefficient along
the gapless shuttlecock.
Figure 9 Numerical and experimental inner pressure coefficient along the gapless profile A.

Figure 10 Plot of numerical pressure coefficient for profile A and profile B. The upper line is the outer
surface, while the bottom one is for the inner surface.
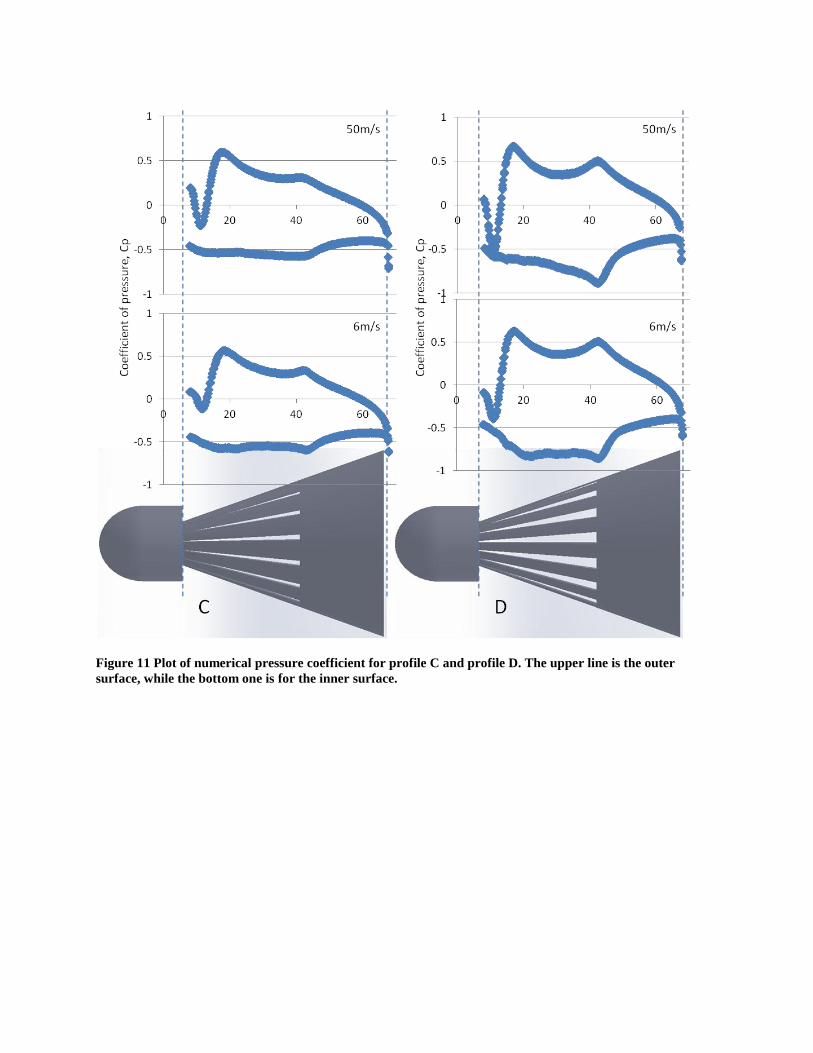
Figure 11 Plot of numerical pressure coefficient for profile C and profile D. The upper line is the outer
surface, while the bottom one is for the inner surface.

Figure 12 Plot of numerical pressure coefficient for profile E and profile F. The upper line is the outer
surface, while the bottom one is for the inner surface.

Figure 13 Skirt pressure profile with respect to the distance behind the cork for model E at 50m/s. The chord
distance scale has been superimposed onto the shuttlecock diagram for visual representation and is
representative of the actual chord location on the skirt.
Figure 14 Pressure plot of flow field around the shuttlecock at 28.3mm behind the tip of the cork,
corresponding to position 1 on the pressure plot. Clip plane was set to 29.2mm.

Figure 15 Velocity vectors showing the deflection of airflow around the cork.
Figure 16 Pressure plot in X-Z plane at 34.3mm behind the tip of the cork, corresponding to position 2 on the
pressure plot. Clip plane was set to 35.1mm.
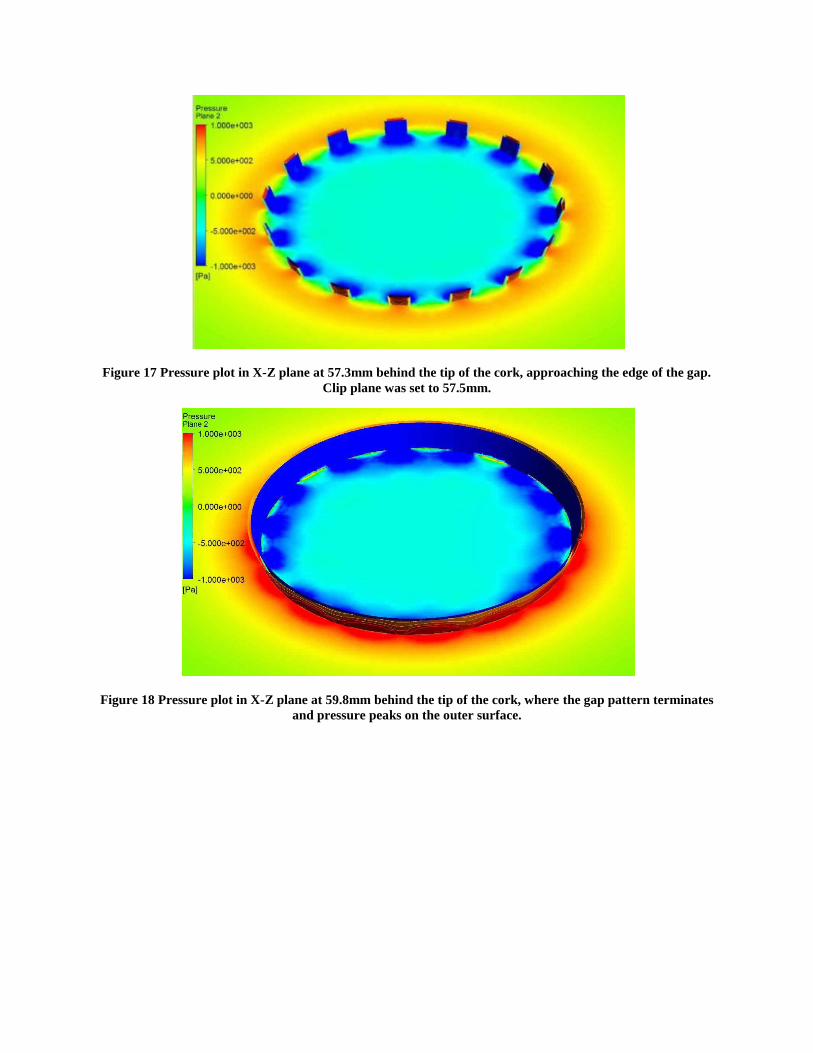
Figure 17 Pressure plot in X-Z plane at 57.3mm behind the tip of the cork, approaching the edge of the gap.
Clip plane was set to 57.5mm.
Figure 18 Pressure plot in X-Z plane at 59.8mm behind the tip of the cork, where the gap pattern terminates
and pressure peaks on the outer surface.
Profile
Width
X/mm
Height
H/mm Surface area/mm2
Surface area
reduction
A N.A. N.A. 8420 0.00%
B 2 20 7865 6.59%
C 2 40 7551 10.32%
D 4 40 6910 17.93%
E 6 40 6268 25.56%
F 7.5 40 5784 31.31%
Table 1 Dimensions and areas of gaps for the various models.
Applied mesh Refined mesh
Profile
Number of
elements
Drag
force(N)
Number of
elements
Drag
force(N) Difference %
A 3.50mil 2.61 5.95mil 2.63 -0.77
B 4.04mil 3.08 6.02mil 3.26 -5.84
C 4.02 mil 3.39 5.99mil 3.56 -5.01
D 4.08mil 4.04 5.83mil 4.14 -2.48
E 3.99 mil 3.80 5.61mil 3.72 2.11
F 3.86mil 3.49 5.56mil 3.31 5.16
Table 2 Comparative analysis of numerical drag force to check for grid independency. Drag forces were
recorded after 100 iterations.
Pressure drag as percentage of overall
drag force at each simulation flow
velocity
6m/s 15m/s 30m/s 50m/s
Profile A 94.3% 95.8% 96.7% 97.1%
Profile B 94.3% 96.2% 97.0% 97.7%
Profile C 93.5% 95.6% 96.7% 97.2%
Profile D 93.8% 96.0% 96.9% 97.4%
Profile E 94.1% 96.4% 97.4% 97.8%
Profile F 94.7% 96.8% 97.7% 98.1%
Table 3 Pressure drag as a percentage of the overall drag force acting against the various models at each
simulation speed.
Profile
Airspeed
(m/s) CFD (numerical)
Wind tunnel
(experimental)
A
15 0.509 0.501
30 0.513 0.497
50 0.514 0.491
C
15 0.665 0.612
30 0.667 0.611
50 0.667 0.606
E
15 0.739 0.658
30 0.743 0.714
50 0.734 0.728
Table 4 Coefficient of drag obtained through numerical and experimental methods.
Related Documents