Engineering Applications of Computational Fluid Mechanics Vol. 6, No. 3, pp. 316–335 (2012) Received: 7 Mar. 2011; Revised: 20 Dec. 2011; Accepted: 6 Feb. 2012 316 AERODYNAMICS CHARACTERISTIC OF AXISYMMETRIC SURFACE PROTUBERANCE IN SUPERSONIC REGIME Adnan Qamar* and Sanjeev Sanghi ** * Mechanical Engineering, King Abdullah University of Science and Technology, KSA E-Mail:[email protected] (Corresponding Author) ** Department of Applied Mechanics, IIT Delhi, New Delhi -110016, India ABSTRACT: The present work deals with the problem of an axi-symmetric surface protuberance mounted on a spherical nosed body of revolution. The numerical computations are carried out for laminar supersonic viscous flow for trapezoidal shape axi-symmetric protuberances. A free stream Mach number ranging from 3 to 8 in steps of 1 at a fixed free stream Reynolds number of 1.8×10 4 has been used in the present study. The steady solutions are obtained using a time marching approach. A newly developed Particle Velocity Upwinding (PVU) scheme has been used for the computation. The spatial flow pattern exhibits a strong bow shock in front of the hemispherical nose, which engulfs the entire base body. Near the protuberance, the fluid particle decelerates due to the adverse pressure created by the protuberance and thus the flow separates in front of the protuberance. This point of separation is found to be a function of Mach number and the protuberance shape. A low-pressure expansion region dominates the base region of the obstacle. The reattachment point for the base separation is also a function of Mach number. As the Mach number is increased the reattachment point shifts toward the protuberances base. A weak recompression shock is also seen in the base, which affects the separated zone behind the protuberance. The important design parameters such as skin friction, heat transfer, drag, and surface pressure coefficients are reported extensively. Keywords: axisymmetric protuberance, particle velocity upwinding, supersonic flow and separated flows 1. INTRODUCTION Flow past a surface protuberance is an important class of problem specifically for high speed- moving vehicle in supersonic/hypersonic regimes. Due to design constraints, it is not always possible to give perfect aerodynamic smooth surfaces on the vehicle. Discontinuities in the aerodynamic shapes often occur in the form of kinks, fins, steps, cable covers, structure joints, spoilers, stiffeners etc. The presence of such discontinuities creates a drastic change in the local flow field surrounding the protuberance. The presence of these structural discontinuities creates a local bow shock formation in front of the structure. In case of bluff protuberances extending from the surface, a complex, three- dimensional flow field develops in the junction region. Owing to the adverse pressure gradient generated by the presence of a bluff body, the approaching boundary layer undergoes local reversal, creating a region of separation at the upstream of the body. The impinging boundary layer may destabilize, resulting in an unsteady spanwise vortex structure (shear instability) which is fed by advected vorticity generated upstream of the protuberance. The body also imposes a cross-stream pressure gradient, which causes boundary layer to divert symmetrically around the protuberance leading to an unsteady horseshoe (Simpson, 2001) vortex generation. The separation, either induced because of the shock wave boundary layer interaction or induced by protuberance itself is accompanied by loss of the lift force, increase in drag, increase in heat transfer rates and pressure fluctuations in the vicinity of the separated region. Thus it results in fluttering and buffeting phenomena. The occurrence of these phenomena imposes considerable limitations on the operating characteristic of high speed-moving vehicles, thus degrading their aerodynamic efficiency. From the structural design viewpoint, such protuberances are generally unavoidable. Therefore prior to the design of the supersonic/hypersonic vehicles the flow features around such structures and their contributions towards overall aerodynamics characteristics must be known in advance. Thus, elucidation of the flow field around such protuberances to minimize the adverse influence on the global and local flow-field is always required. In the past, large numbers of researchers have carried out theoretical, experimental and numerical studies concerning the effect of surface protuberance in the form of simplified

Welcome message from author
This document is posted to help you gain knowledge. Please leave a comment to let me know what you think about it! Share it to your friends and learn new things together.
Transcript
Engineering Applications of Computational Fluid Mechanics Vol. 6, No. 3, pp. 316–335 (2012)
Received: 7 Mar. 2011; Revised: 20 Dec. 2011; Accepted: 6 Feb. 2012
316
AERODYNAMICS CHARACTERISTIC OF AXISYMMETRIC SURFACE PROTUBERANCE IN SUPERSONIC REGIME
Adnan Qamar* and Sanjeev Sanghi **
* Mechanical Engineering, King Abdullah University of Science and Technology, KSA E-Mail:[email protected] (Corresponding Author)
** Department of Applied Mechanics, IIT Delhi, New Delhi -110016, India
ABSTRACT: The present work deals with the problem of an axi-symmetric surface protuberance mounted on a spherical nosed body of revolution. The numerical computations are carried out for laminar supersonic viscous flow for trapezoidal shape axi-symmetric protuberances. A free stream Mach number ranging from 3 to 8 in steps of 1 at a fixed free stream Reynolds number of 1.8×10⁴ has been used in the present study. The steady solutions are obtained using a time marching approach. A newly developed Particle Velocity Upwinding (PVU) scheme has been used for the computation. The spatial flow pattern exhibits a strong bow shock in front of the hemispherical nose, which engulfs the entire base body. Near the protuberance, the fluid particle decelerates due to the adverse pressure created by the protuberance and thus the flow separates in front of the protuberance. This point of separation is found to be a function of Mach number and the protuberance shape. A low-pressure expansion region dominates the base region of the obstacle. The reattachment point for the base separation is also a function of Mach number. As the Mach number is increased the reattachment point shifts toward the protuberances base. A weak recompression shock is also seen in the base, which affects the separated zone behind the protuberance. The important design parameters such as skin friction, heat transfer, drag, and surface pressure coefficients are reported extensively.
Keywords: axisymmetric protuberance, particle velocity upwinding, supersonic flow and separated flows
1. INTRODUCTION
Flow past a surface protuberance is an important class of problem specifically for high speed-moving vehicle in supersonic/hypersonic regimes. Due to design constraints, it is not always possible to give perfect aerodynamic smooth surfaces on the vehicle. Discontinuities in the aerodynamic shapes often occur in the form of kinks, fins, steps, cable covers, structure joints, spoilers, stiffeners etc. The presence of such discontinuities creates a drastic change in the local flow field surrounding the protuberance. The presence of these structural discontinuities creates a local bow shock formation in front of the structure. In case of bluff protuberances extending from the surface, a complex, three-dimensional flow field develops in the junction region. Owing to the adverse pressure gradient generated by the presence of a bluff body, the approaching boundary layer undergoes local reversal, creating a region of separation at the upstream of the body. The impinging boundary layer may destabilize, resulting in an unsteady spanwise vortex structure (shear instability) which is fed by advected vorticity generated upstream of the protuberance. The body also imposes a cross-stream pressure gradient, which
causes boundary layer to divert symmetrically around the protuberance leading to an unsteady horseshoe (Simpson, 2001) vortex generation. The separation, either induced because of the shock wave boundary layer interaction or induced by protuberance itself is accompanied by loss of the lift force, increase in drag, increase in heat transfer rates and pressure fluctuations in the vicinity of the separated region. Thus it results in fluttering and buffeting phenomena. The occurrence of these phenomena imposes considerable limitations on the operating characteristic of high speed-moving vehicles, thus degrading their aerodynamic efficiency. From the structural design viewpoint, such protuberances are generally unavoidable. Therefore prior to the design of the supersonic/hypersonic vehicles the flow features around such structures and their contributions towards overall aerodynamics characteristics must be known in advance. Thus, elucidation of the flow field around such protuberances to minimize the adverse influence on the global and local flow-field is always required. In the past, large numbers of researchers have carried out theoretical, experimental and numerical studies concerning the effect of surface protuberance in the form of simplified
Engineering Applications of Computational Fluid Mechanics Vol. 6, No. 3 (2012)
317
assumptions of geometry, type of flow and for different flow regimes. The most extensive studies carried out were by those of Love (1955), Chapman et al. (1957), Sterrett and Emery (1960), Zukoski (1967), Driftmyer (1974) and Qamar et al. (2006) for forward facing protuberances in supersonic regime. It was summarized from their work that the separation of flow occurs ahead of the protuberance as long as the height is not negligible compared to the thickness of boundary layer. The separation point is not known beforehand and flow adjusts itself to an equilibrium position; but the reattachment point is at the top of the protuberance. The pressure distribution along the surface downstream of the separation is strongly affected by protuberance heights. The size of separated region is largest for laminar and shortest for the turbulent flow, with transition lying between these two flows. The pressure in the separated region is less compared to the pressure upstream of separation and its magnitude is smallest for turbulent, largest for laminar flow and transition lying again between these two flows. Near the protuberance the pressure was found to be constant for all types of flow conditions. Similar findings were reported for forward facing step in hypersonic regime by Grotowsky and Ballmann (2000). Efimtsov et al. (2000), Becker (2005) and Ericsson (1978) carried out studies for aeroacoustics characteristics of the flow over a forward facing step. They identified relevant regions that are responsible for the noise generation. Correlation measurement for wall pressure fluctuation, velocity field and the far field acoustic pressure were carried out. The correlation measurement provided a useful tool in determining the flow induced sound sources in supersonic regime region. Several researchers explicitly focused on the base flow of such protuberance via investigating the backward flow step in supersonic/hypersonic regimes. Experimental investigations of the base pressure, heat transfer and flow visualizations by various methods are presented by Donaldson (1967), Scherberg and Smith (1967), Hama (1968), Roshko and Thomke (1966) and Correa and Warren (1989). Roos and Kegelman (1986) studied excitation of these flows by employing a spoiler like flap located at the base of the step. Strong vortex shedding is evident for subsonic and supersonic flows over the step base and apparently flow features are quite different for supersonic flows. Investigations showed that excitation enhances vortical structures and increases entrainment and
in so-doing exerts substantial control over the reattachment length. Recently developed non-intrusive optical methods such as the Laser Doppler Velocimetry (LDV) (Samimy et al., 1985; Abu-Hijleh and Samimi, 1989), and the planar laser induced fluorescence (PLIF) (Hartfield et al., 1993) have been applied to study the separated flow behind the backward facing step. These techniques enable the direct simultaneous measurement of mean velocity, turbulence intensities, Reynolds stresses, turbulent correlations, density, temperature, pressure and concentration. Detailed calculations of the flow over a backward facing step using solutions of the Navier-Stokes equations were presented by Kronzon (1974), Kuruvila and Anderson (1985), Lombard et al. (1986), Yang et al. (1991), Tucker and Shyy (1993) and Arai et al. (1995). Some studies investigated the full protuberance via examining the flow field at upstream and downstream of the protuberance in high-speed flow regime. McConnell D.G (1961) carried out experimental investigation on an axisymmetric collar mounted protuberance on a cylindrical body in turbulent regime (Re 1.8106) up to Mach number 8.6. The boundary layer thickness Stanton number and the heat transfer coefficient were reported as a function of Mach number. Bloom and Pallone (1959) carried out experimental investigation on an axisymmetric shroud in hypersonic regime placed over the wall of an axially symmetric nozzle. The computations were carried out by varying Reynolds number from 4.4-5.2106 for different heights of shroud with surface temperature below 350 K. The main emphasis of the study was to investigate qualitative trends of the heat transfer rate by varying the cylindrical height and the Reynolds number. Suxun and Chen (2000) performed an experimental investigation of hypersonic flow on a set of rectangular cylinders mounted over a flat surface. All the tests were carried out at Mach number 5 under turbulent conditions. The results indicate that the aspect ratio is an important parameter for the classification of the flow field. Most of the work reported in literature primarily focused on experimental approach for square or the rectangular cross-section protuberance. Axisymmetric surface protuberance has been rarely investigated. Although many close by related axisymmetric configurations such as compression corners (Dolling and Murphy, 1983) or flare body junction (Chen and Hung, 1992) have been investigated, but their results cannot be directly correlated with the axisymmetric surface
Engineering Applications of Computational Fluid Mechanics Vol. 6, No. 3 (2012)
318
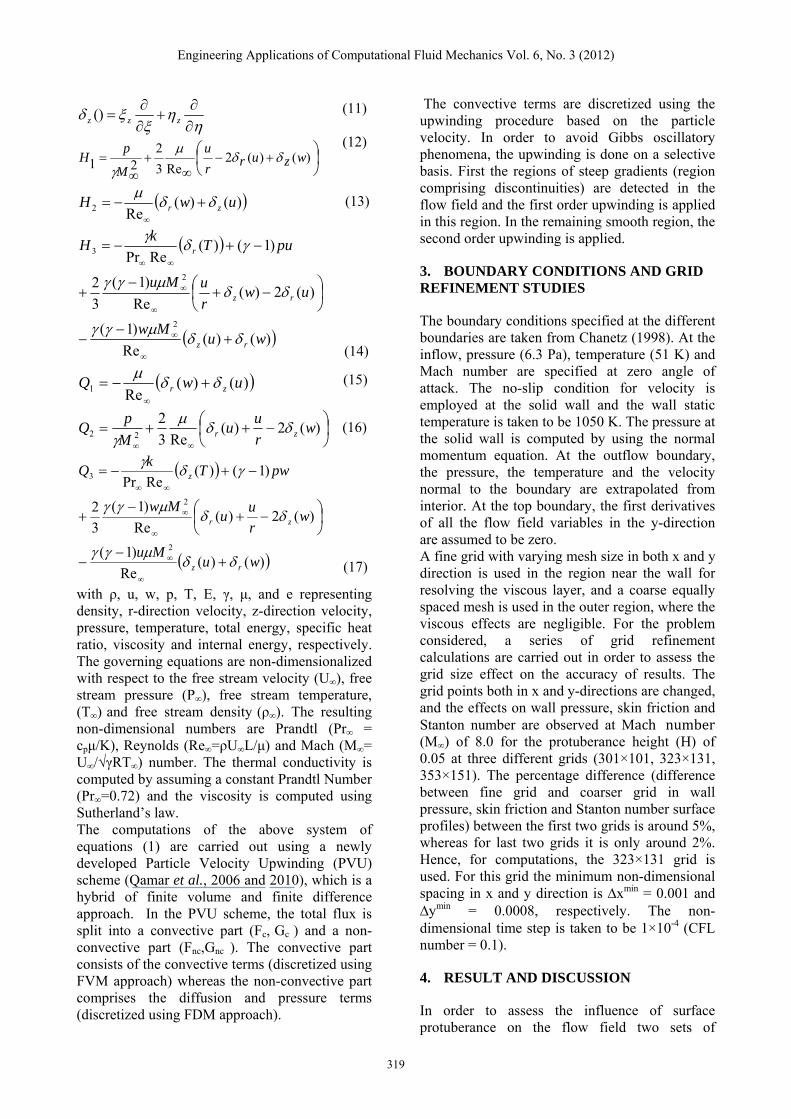
protuberances. The problem of axisymmetric surface protuberance in hand requires turbulent modeling for its real applications, however, as no results are explicitly available in the literature for the axisymmetric protuberance case it is worth to explore this problem in laminar flow regime first. The presented work is the first attempt to understand the fundamental fluid dynamics characteristics around the protuberance from basic applied science point of view. Once the fundamental flow physics is understood further extension of this study to the turbulent regime would be carried out in our future work. Thus, in this present work, a laminar numerical investigation of axisymmetric surface protuberance mounted on a cylindrical nosed body of revolution is carried out. Trapezoidal shaped protuberance is investigated as it has more practical applicability compared to square and rectangular shaped protuberances. Moreover, intuitively from design viewpoint it is expected that the trapezoidal shape protuberance would have more smooth-lined aerodynamic contribution compared to square and rectangular shaped protuberances. Hence, trapezoidal shaped protuberance is studied via examining the effects of protuberance heights and free stream Mach number on the flow structure and consequently on important design parameters which are extensively reported in this study. To estimate the effect of surface protuberance on the global aerodynamics behavior first a base solution is computed without protuberance (Fig. 1a) and later it is compared with the trapezoidal axisymmetric protuberance (Fig. 1b) case under same flow conditions.
2. GOVERNING EQUATIONS AND NUMERICAL PROCEDURE
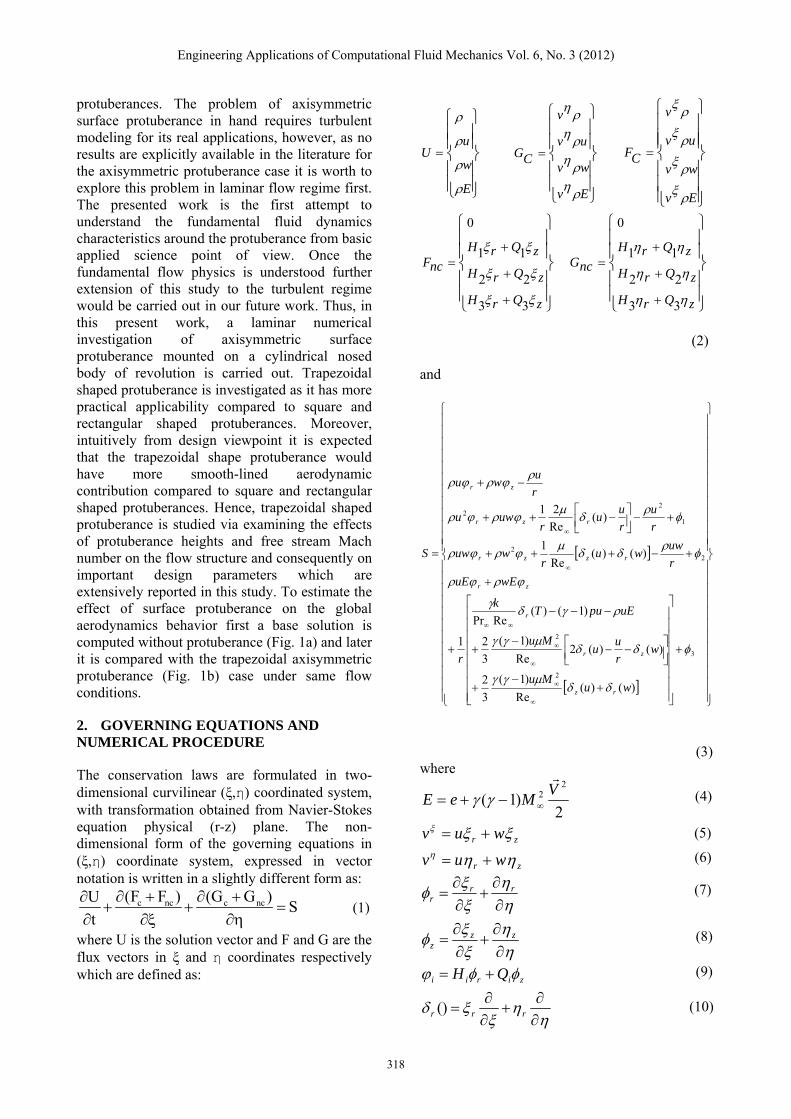
The conservation laws are formulated in two-dimensional curvilinear (ξ,η) coordinated system, with transformation obtained from Navier-Stokes equation physical (r-z) plane. The non-dimensional form of the governing equations in (ξ,η) coordinate system, expressed in vector notation is written in a slightly different form as:
c nc c nc(F F ) (G G )US
t
(1)
where U is the solution vector and F and G are the flux vectors in ξ and η coordinates respectively which are defined as:
E
w
uU
Ev
wv
uv
v
CG
Ev
wv
uv
v
CF
zQrH
zQrH
zQrH
ncF
33
22
11
0
zQrH
zQrH
zQrH
ncG
33
22
11
0
(2) and
3
2
2
22
1
22
)()(Re
)1(
3
2
)()(2Re
)1(
3
2
)1()(RePr
1
)()(Re
1
)(Re
21
wuMu
wr
uu
Mu
uEpuTk
r
wEuE
r
uwwu
rwuw
r
u
r
uu
ruwu
r
uwu
S
rz
zr
r
zr
rzzr
rzr
zr
(3) where
2)1(
22 V
MeE
zr
zr
wuv
wuv
zzz
rrr
rrr
zirii QH
)(
(4)
(5)
(6)
(7)
(8)
(9)
(10)
Engineering Applications of Computational Fluid Mechanics Vol. 6, No. 3 (2012)
319
zzz )(
)()(2
Re3
221 wzur
r
u
M
pH
)()(Re2 uwH zr
)()(Re
)1(
)(2)(Re
)1(
3
2
)1()(RePr
2
2
3
wuMw
uwr
uMu
puTk
H
rz
rz
r
)()(Re1 uwQ zr
)(2)(Re3
222 w
r
uu
M
pQ zr
)()(Re
)1(
)(2)(Re
)1(
3
2
)1()(RePr
2
2
3
wuMu
wr
uu
Mw
pwTk
Q
rz
zr
z
with ρ, u, w, p, T, E, γ, μ, and e representing density, r-direction velocity, z-direction velocity, pressure, temperature, total energy, specific heat ratio, viscosity and internal energy, respectively. The governing equations are non-dimensionalized with respect to the free stream velocity (U∞), free stream pressure (P∞), free stream temperature, (T∞) and free stream density (ρ∞). The resulting non-dimensional numbers are Prandtl (Pr∞ = cpμ/K), Reynolds (Re∞=ρU∞L/μ) and Mach (M∞= U∞/√γRT∞) number. The thermal conductivity is computed by assuming a constant Prandtl Number (Pr∞=0.72) and the viscosity is computed using Sutherland’s law. The computations of the above system of equations (1) are carried out using a newly developed Particle Velocity Upwinding (PVU) scheme (Qamar et al., 2006 and 2010), which is a hybrid of finite volume and finite difference approach. In the PVU scheme, the total flux is split into a convective part (Fc,
Gc ) and a non-
convective part (Fnc,Gnc ). The convective part
consists of the convective terms (discretized using FVM approach) whereas the non-convective part comprises the diffusion and pressure terms (discretized using FDM approach).
The convective terms are discretized using the upwinding procedure based on the particle velocity. In order to avoid Gibbs oscillatory phenomena, the upwinding is done on a selective basis. First the regions of steep gradients (region comprising discontinuities) are detected in the flow field and the first order upwinding is applied in this region. In the remaining smooth region, the second order upwinding is applied.
3. BOUNDARY CONDITIONS AND GRID REFINEMENT STUDIES
The boundary conditions specified at the different boundaries are taken from Chanetz (1998). At the inflow, pressure (6.3 Pa), temperature (51 K) and Mach number are specified at zero angle of attack. The no-slip condition for velocity is employed at the solid wall and the wall static temperature is taken to be 1050 K. The pressure at the solid wall is computed by using the normal momentum equation. At the outflow boundary, the pressure, the temperature and the velocity normal to the boundary are extrapolated from interior. At the top boundary, the first derivatives of all the flow field variables in the y-direction are assumed to be zero. A fine grid with varying mesh size in both x and y direction is used in the region near the wall for resolving the viscous layer, and a coarse equally spaced mesh is used in the outer region, where the viscous effects are negligible. For the problem considered, a series of grid refinement calculations are carried out in order to assess the grid size effect on the accuracy of results. The grid points both in x and y-directions are changed, and the effects on wall pressure, skin friction and Stanton number are observed at Mach number(M∞) of 8.0 for the protuberance height (H) of 0.05 at three different grids (301×101, 323×131, 353×151). The percentage difference (difference between fine grid and coarser grid in wall pressure, skin friction and Stanton number surface profiles) between the first two grids is around 5%, whereas for last two grids it is only around 2%. Hence, for computations, the 323×131 grid is used. For this grid the minimum non-dimensional spacing in x and y direction is ∆xmin = 0.001 and ∆ymin = 0.0008, respectively. The non-dimensional time step is taken to be 1×10⁻⁴ (CFL number = 0.1).
4. RESULT AND DISCUSSION
In order to assess the influence of surface protuberance on the flow field two sets of
(11)
(12)
(13)
(14)
(16)
(17)
(15)
Engineering Applications of Computational Fluid Mechanics Vol. 6, No. 3 (2012)
320
computations are carried out. Initially numerical computations are carried out for the cylindrical body of revolution without protuberance and later computations are carried out by placing an axisymmetric trapezoidal protuberance on the same cylindrical body of revolution. In both cases the freestream Mach number is varied from 3 to 8 in steps of 1 for a fixed free stream Reynolds number of 1.8×10⁴. The characteristic length scale used in this study is the total length of the cylindrical body of revolution. For the case of trapezoidal protuberance, effect of protuberance height is also investigated. Protuberance height (H) is varied from 10 -50 % of the radius of the base body (R). The protuberance width (W) is 10 percent of the characteristic length and is placed at 30 percent of the characteristic length. For all the cases investigated the width and the location of the protuberance are kept the same.
4.1 Flow features without surface protuberance
To study the influence of surface protuberance a base line solution is first computed for the cylindrical body of revolution (Fig.1) placed in a supersonic stream. The radius of the circular base body is 10% of the total characteristic length.
(a) (b)
Fig. 1 Axisymmetric body of revolution: (a) without trapezoidal protuberance and (b) with protuberance.
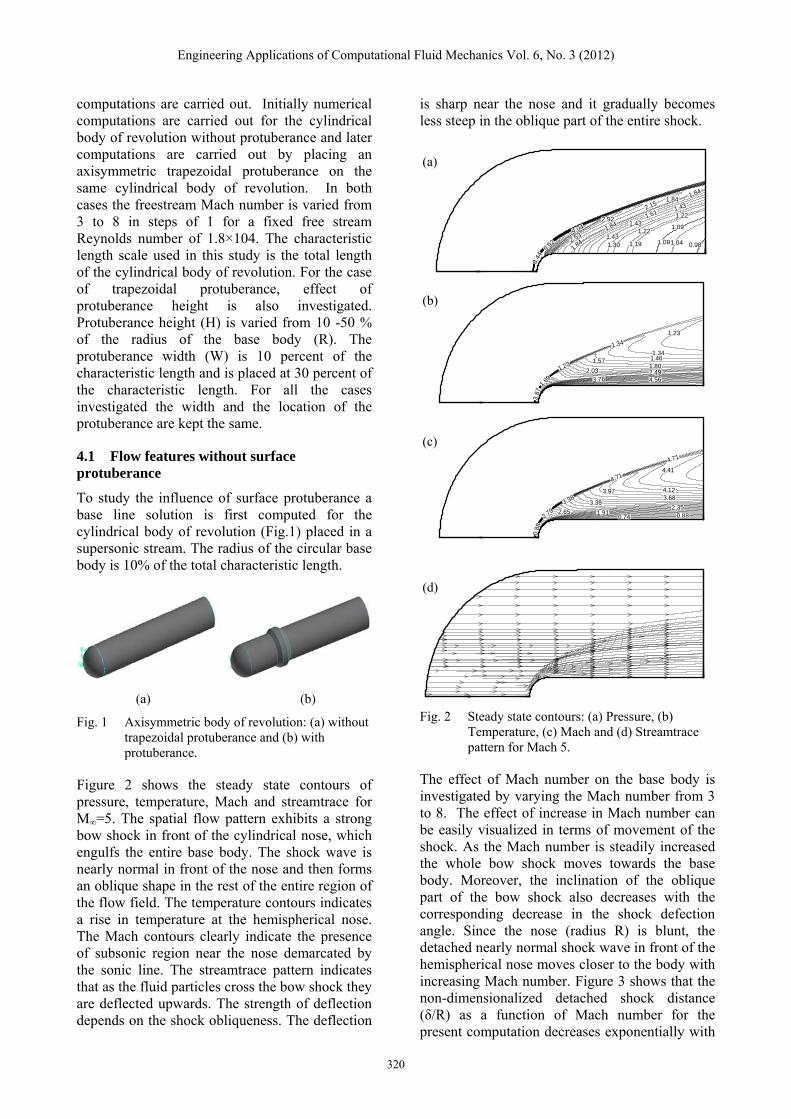
Figure 2 shows the steady state contours of pressure, temperature, Mach and streamtrace for M∞=5. The spatial flow pattern exhibits a strong bow shock in front of the cylindrical nose, which engulfs the entire base body. The shock wave is nearly normal in front of the nose and then forms an oblique shape in the rest of the entire region of the flow field. The temperature contours indicates a rise in temperature at the hemispherical nose. The Mach contours clearly indicate the presence of subsonic region near the nose demarcated by the sonic line. The streamtrace pattern indicates that as the fluid particles cross the bow shock they are deflected upwards. The strength of deflection depends on the shock obliqueness. The deflection
is sharp near the nose and it gradually becomes less steep in the oblique part of the entire shock.
Fig. 2 Steady state contours: (a) Pressure, (b) Temperature, (c) Mach and (d) Streamtrace pattern for Mach 5.
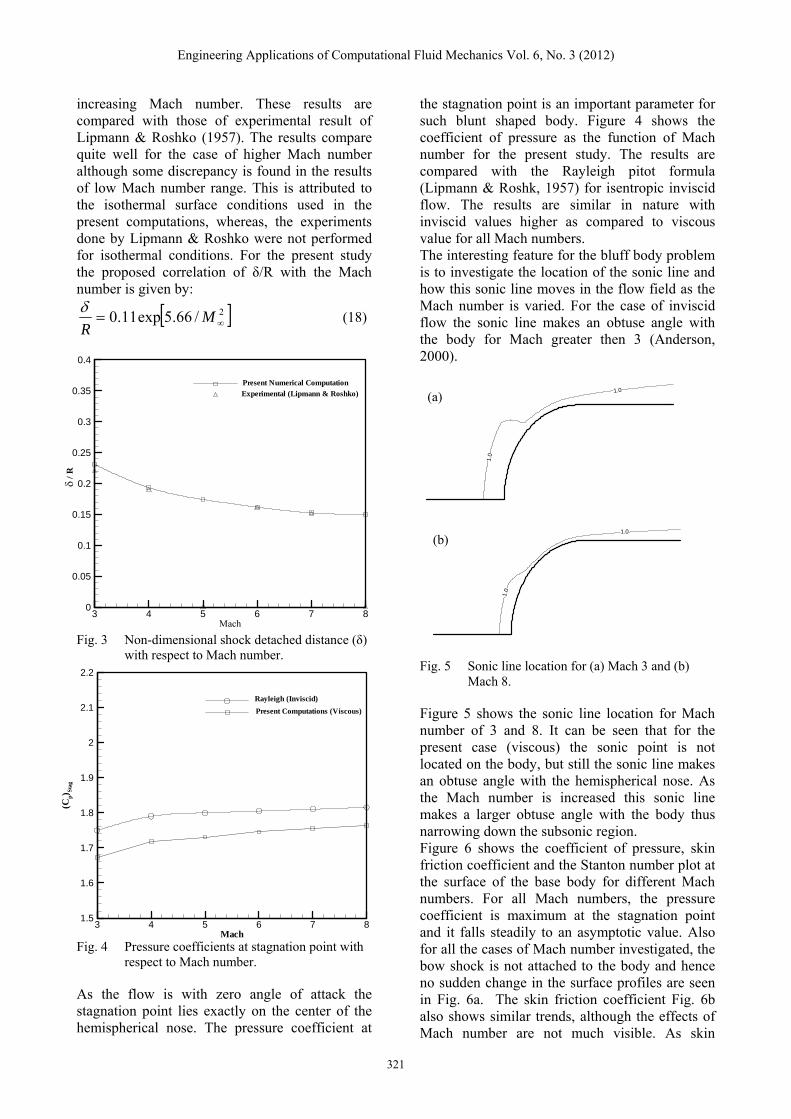
The effect of Mach number on the base body is investigated by varying the Mach number from 3 to 8. The effect of increase in Mach number can be easily visualized in terms of movement of the shock. As the Mach number is steadily increased the whole bow shock moves towards the base body. Moreover, the inclination of the oblique part of the bow shock also decreases with the corresponding decrease in the shock defection angle. Since the nose (radius R) is blunt, the detached nearly normal shock wave in front of the hemispherical nose moves closer to the body with increasing Mach number. Figure 3 shows that the non-dimensionalized detached shock distance (δ/R) as a function of Mach number for the present computation decreases exponentially with
9.92
2.15
1.841.84
1.43
1.22
1.22
1.09
1.432.53
2.92
1.30 1.091.04 0.98
4.04
1.61
1.19
1.43
1.84
1.84
8.44
1.69
1.23
1.34
1.23
1.341.461.802.494.563.76
2.03
1.57
3.87
4.71
4.41
4.123.68
2.350.880.74
1.91
3.38
3.97
4.71
3.38
2.652.79
0.88
(a)
(b)
(c)
(d)
Engineering Applications of Computational Fluid Mechanics Vol. 6, No. 3 (2012)
321
Mach
3 4 5 6 7 80
0.05
0.1
0.15
0.2
0.25
0.3
0.35
0.4
/R
Present Numerical Computation
Experimental (Lipmann & Roshko)
Mach
(Cp)
Sta
g
3 4 5 6 7 81.5
1.6
1.7
1.8
1.9
2
2.1
2.2
Rayleigh (Inviscid)
Present Computations (Viscous)
increasing Mach number. These results are compared with those of experimental result of Lipmann & Roshko (1957). The results compare quite well for the case of higher Mach number although some discrepancy is found in the results of low Mach number range. This is attributed to the isothermal surface conditions used in the present computations, whereas, the experiments done by Lipmann & Roshko were not performed for isothermal conditions. For the present study the proposed correlation of δ/R with the Mach number is given by:
2/66.5exp11.0 MR
(18)
Fig. 3 Non-dimensional shock detached distance (δ) with respect to Mach number.
Fig. 4 Pressure coefficients at stagnation point with respect to Mach number.
As the flow is with zero angle of attack the stagnation point lies exactly on the center of the hemispherical nose. The pressure coefficient at
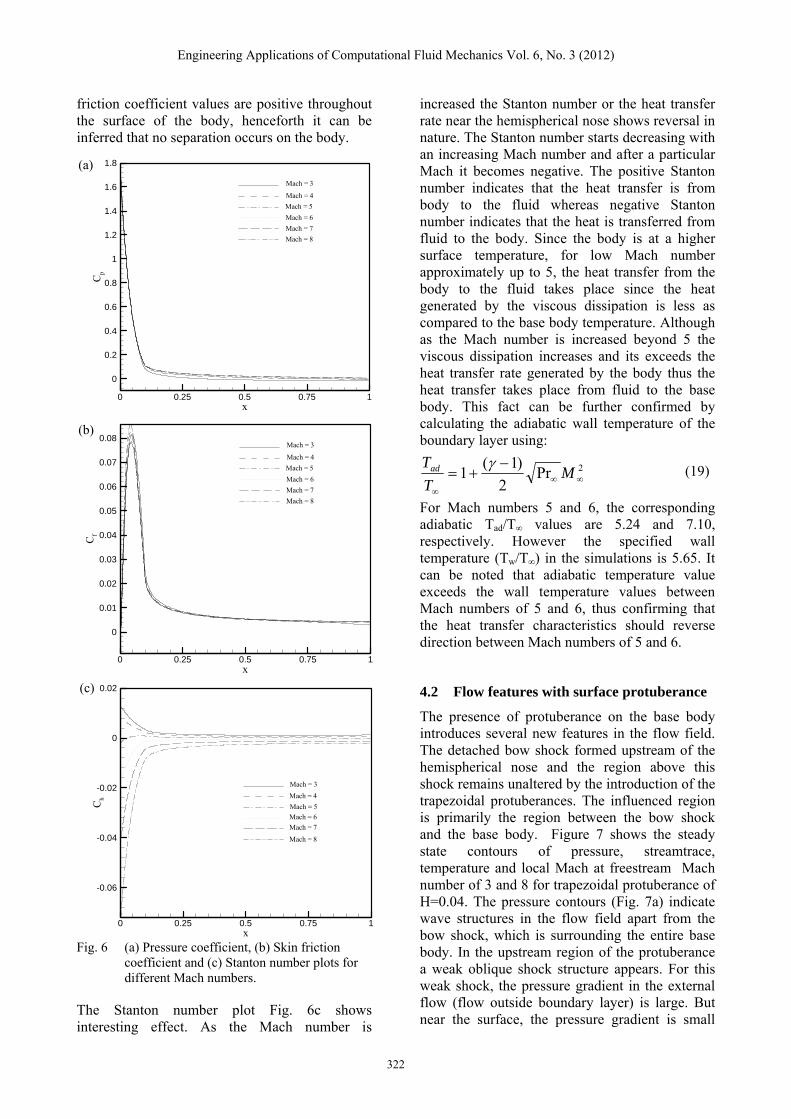
the stagnation point is an important parameter for such blunt shaped body. Figure 4 shows the coefficient of pressure as the function of Mach number for the present study. The results are compared with the Rayleigh pitot formula (Lipmann & Roshk, 1957) for isentropic inviscid flow. The results are similar in nature with inviscid values higher as compared to viscous value for all Mach numbers. The interesting feature for the bluff body problem is to investigate the location of the sonic line and how this sonic line moves in the flow field as the Mach number is varied. For the case of inviscid flow the sonic line makes an obtuse angle with the body for Mach greater then 3 (Anderson, 2000).
Fig. 5 Sonic line location for (a) Mach 3 and (b) Mach 8.
Figure 5 shows the sonic line location for Mach number of 3 and 8. It can be seen that for the present case (viscous) the sonic point is not located on the body, but still the sonic line makes an obtuse angle with the hemispherical nose. As the Mach number is increased this sonic line makes a larger obtuse angle with the body thus narrowing down the subsonic region. Figure 6 shows the coefficient of pressure, skin friction coefficient and the Stanton number plot at the surface of the base body for different Mach numbers. For all Mach numbers, the pressure coefficient is maximum at the stagnation point and it falls steadily to an asymptotic value. Also for all the cases of Mach number investigated, the bow shock is not attached to the body and hence no sudden change in the surface profiles are seen in Fig. 6a. The skin friction coefficient Fig. 6b also shows similar trends, although the effects of Mach number are not much visible. As skin
1.0
1.0
(a)
1.0
1.0
(b)
Engineering Applications of Computational Fluid Mechanics Vol. 6, No. 3 (2012)
322
friction coefficient values are positive throughout the surface of the body, henceforth it can be inferred that no separation occurs on the body.
Fig. 6 (a) Pressure coefficient, (b) Skin friction coefficient and (c) Stanton number plots for different Mach numbers.
The Stanton number plot Fig. 6c shows interesting effect. As the Mach number is
increased the Stanton number or the heat transfer rate near the hemispherical nose shows reversal in nature. The Stanton number starts decreasing with an increasing Mach number and after a particular Mach it becomes negative. The positive Stanton number indicates that the heat transfer is from body to the fluid whereas negative Stanton number indicates that the heat is transferred from fluid to the body. Since the body is at a higher surface temperature, for low Mach number approximately up to 5, the heat transfer from the body to the fluid takes place since the heat generated by the viscous dissipation is less as compared to the base body temperature. Although as the Mach number is increased beyond 5 the viscous dissipation increases and its exceeds the heat transfer rate generated by the body thus the heat transfer takes place from fluid to the base body. This fact can be further confirmed by calculating the adiabatic wall temperature of the boundary layer using: For Mach numbers 5 and 6, the corresponding adiabatic Tad/T∞ values are 5.24 and 7.10, respectively. However the specified wall temperature (Tw/T∞) in the simulations is 5.65. It can be noted that adiabatic temperature value exceeds the wall temperature values between Mach numbers of 5 and 6, thus confirming that the heat transfer characteristics should reverse direction between Mach numbers of 5 and 6.
4.2 Flow features with surface protuberance
The presence of protuberance on the base body introduces several new features in the flow field. The detached bow shock formed upstream of the hemispherical nose and the region above this shock remains unaltered by the introduction of the trapezoidal protuberances. The influenced region is primarily the region between the bow shock and the base body. Figure 7 shows the steady state contours of pressure, streamtrace, temperature and local Mach at freestream Mach number of 3 and 8 for trapezoidal protuberance of H=0.04. The pressure contours (Fig. 7a) indicate wave structures in the flow field apart from the bow shock, which is surrounding the entire base body. In the upstream region of the protuberance a weak oblique shock structure appears. For this weak shock, the pressure gradient in the external flow (flow outside boundary layer) is large. But near the surface, the pressure gradient is small
2Pr2
)1(1
M
T
Tad (19)
x
Cp
0 0.25 0.5 0.75 1
0
0.2
0.4
0.6
0.8
1
1.2
1.4
1.6
1.8
Mach = 3
Mach = 4
Mach = 5
Mach = 6
Mach = 7
Mach = 8
x
Cf
0 0.25 0.5 0.75 1
0
0.01
0.02
0.03
0.04
0.05
0.06
0.07
0.08Mach = 3
Mach = 4
Mach = 5
Mach = 6
Mach = 7
Mach = 8
x
Ch
0 0.25 0.5 0.75 1
-0.06
-0.04
-0.02
0
0.02
Mach = 3
Mach = 4
Mach = 5
Mach = 6
Mach = 7
Mach = 8
(a)
(b)
(c)
Engineering Applications of Computational Fluid Mechanics Vol. 6, No. 3 (2012)
323
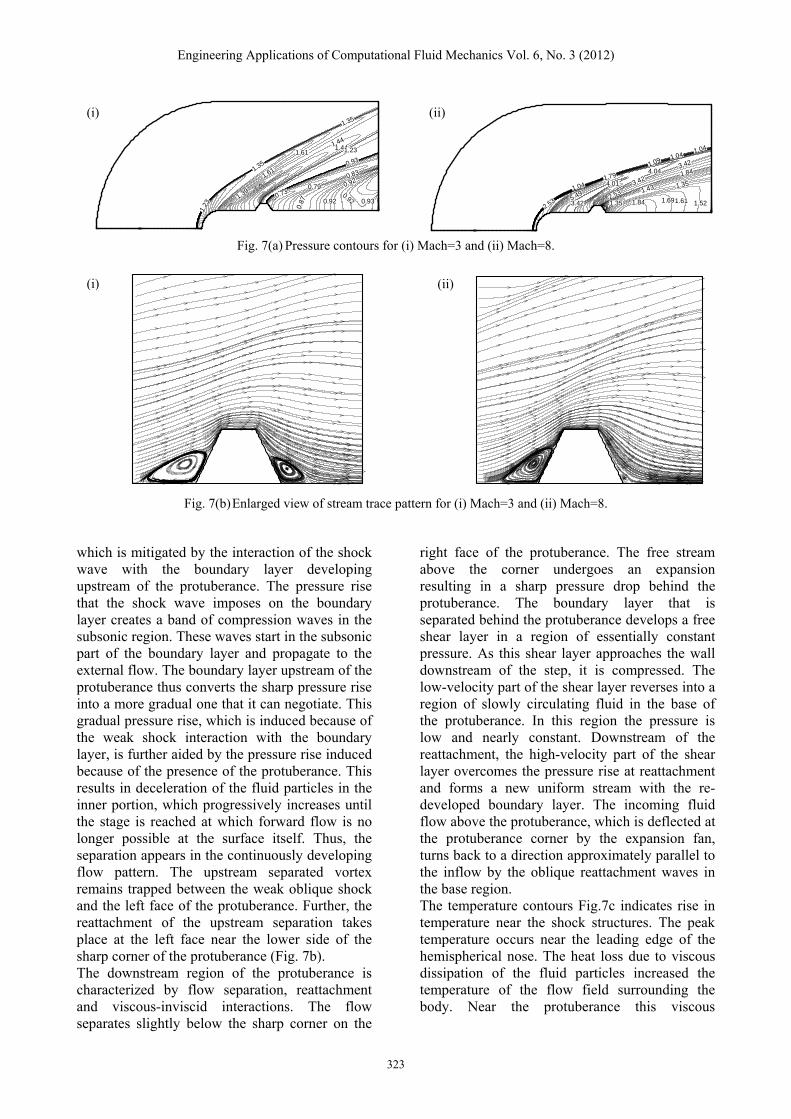
Fig. 7(a) Pressure contours for (i) Mach=3 and (ii) Mach=8.
Fig. 7(b) Enlarged view of stream trace pattern for (i) Mach=3 and (ii) Mach=8.
which is mitigated by the interaction of the shock wave with the boundary layer developing upstream of the protuberance. The pressure rise that the shock wave imposes on the boundary layer creates a band of compression waves in the subsonic region. These waves start in the subsonic part of the boundary layer and propagate to the external flow. The boundary layer upstream of the protuberance thus converts the sharp pressure rise into a more gradual one that it can negotiate. This gradual pressure rise, which is induced because of the weak shock interaction with the boundary layer, is further aided by the pressure rise induced because of the presence of the protuberance. This results in deceleration of the fluid particles in the inner portion, which progressively increases until the stage is reached at which forward flow is no longer possible at the surface itself. Thus, the separation appears in the continuously developing flow pattern. The upstream separated vortex remains trapped between the weak oblique shock and the left face of the protuberance. Further, the reattachment of the upstream separation takes place at the left face near the lower side of the sharp corner of the protuberance (Fig. 7b). The downstream region of the protuberance is characterized by flow separation, reattachment and viscous-inviscid interactions. The flow separates slightly below the sharp corner on the
right face of the protuberance. The free stream above the corner undergoes an expansion resulting in a sharp pressure drop behind the protuberance. The boundary layer that is separated behind the protuberance develops a free shear layer in a region of essentially constant pressure. As this shear layer approaches the wall downstream of the step, it is compressed. The low-velocity part of the shear layer reverses into a region of slowly circulating fluid in the base of the protuberance. In this region the pressure is low and nearly constant. Downstream of the reattachment, the high-velocity part of the shear layer overcomes the pressure rise at reattachment and forms a new uniform stream with the re-developed boundary layer. The incoming fluid flow above the protuberance, which is deflected at the protuberance corner by the expansion fan, turns back to a direction approximately parallel to the inflow by the oblique reattachment waves in the base region. The temperature contours Fig.7c indicates rise in temperature near the shock structures. The peak temperature occurs near the leading edge of the hemispherical nose. The heat loss due to viscous dissipation of the fluid particles increased the temperature of the flow field surrounding the body. Near the protuberance this viscous
(ii) (i)
1.23
1.35
1.35
1.611.441.441.23
0.93
0.79
0.83
0.92
0.731.39
1.61
0.87 0.92
0.92 0.932.53
1.09
1.041.04
3.42
1.43
1.84
1.35
2.535.49
1.79
1.35 1.691.61 1.52
1.04
4.04
1.84
3.42
3.42
4.01
(i) (ii)
Engineering Applications of Computational Fluid Mechanics Vol. 6, No. 3 (2012)
324
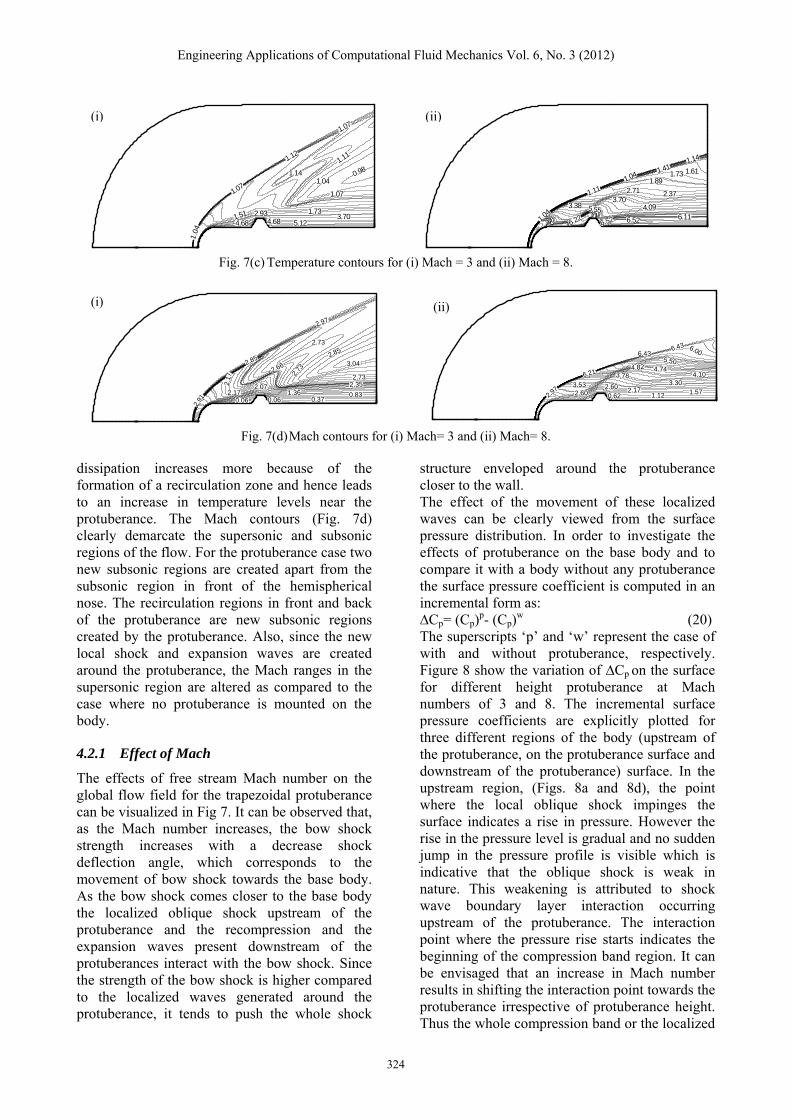
Fig. 7(c) Temperature contours for (i) Mach = 3 and (ii) Mach = 8.
Fig. 7(d) Mach contours for (i) Mach= 3 and (ii) Mach= 8.
dissipation increases more because of the formation of a recirculation zone and hence leads to an increase in temperature levels near the protuberance. The Mach contours (Fig. 7d) clearly demarcate the supersonic and subsonic regions of the flow. For the protuberance case two new subsonic regions are created apart from the subsonic region in front of the hemispherical nose. The recirculation regions in front and back of the protuberance are new subsonic regions created by the protuberance. Also, since the new local shock and expansion waves are created around the protuberance, the Mach ranges in the supersonic region are altered as compared to the case where no protuberance is mounted on the body.
4.2.1 Effect of Mach
The effects of free stream Mach number on the global flow field for the trapezoidal protuberance can be visualized in Fig 7. It can be observed that, as the Mach number increases, the bow shock strength increases with a decrease shock deflection angle, which corresponds to the movement of bow shock towards the base body. As the bow shock comes closer to the base body the localized oblique shock upstream of the protuberance and the recompression and the expansion waves present downstream of the protuberances interact with the bow shock. Since the strength of the bow shock is higher compared to the localized waves generated around the protuberance, it tends to push the whole shock
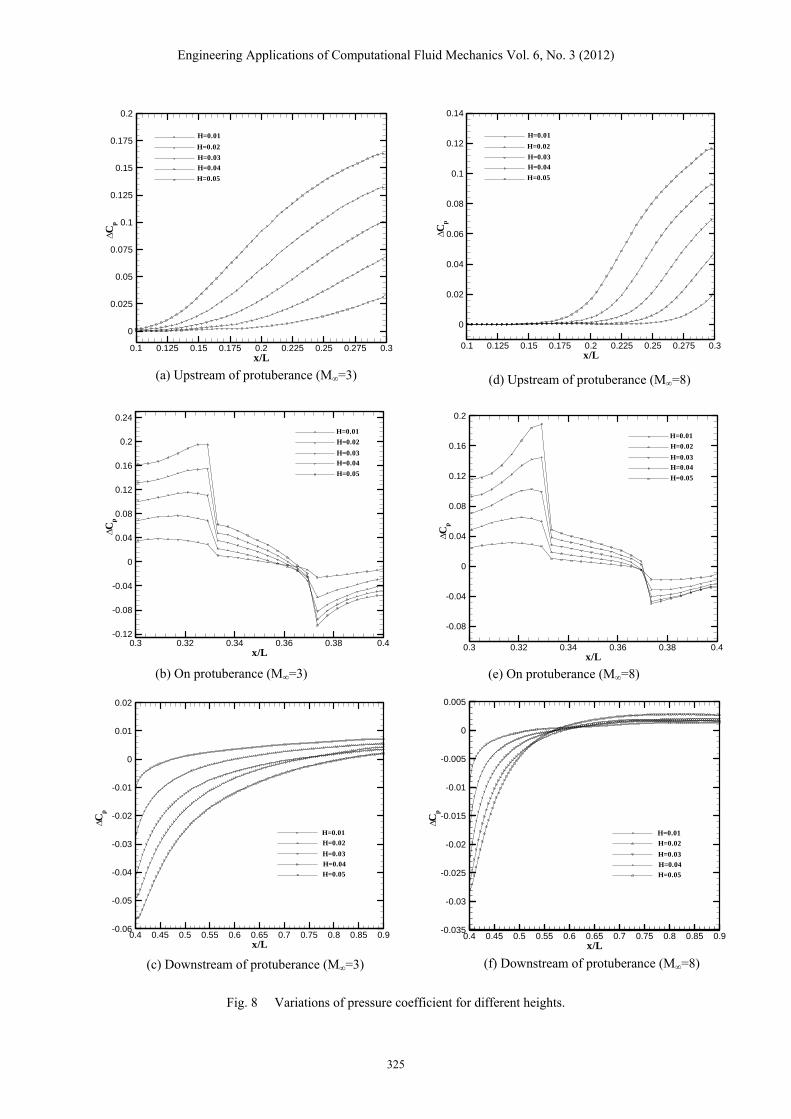
structure enveloped around the protuberance closer to the wall. The effect of the movement of these localized waves can be clearly viewed from the surface pressure distribution. In order to investigate the effects of protuberance on the base body and to compare it with a body without any protuberance the surface pressure coefficient is computed in an incremental form as: ∆Cp= (Cp)
p- (Cp)w (20)
The superscripts ‘p’ and ‘w’ represent the case of with and without protuberance, respectively. Figure 8 show the variation of ∆Cp on the surface for different height protuberance at Mach numbers of 3 and 8. The incremental surface pressure coefficients are explicitly plotted for three different regions of the body (upstream of the protuberance, on the protuberance surface and downstream of the protuberance) surface. In the upstream region, (Figs. 8a and 8d), the point where the local oblique shock impinges the surface indicates a rise in pressure. However the rise in the pressure level is gradual and no sudden jump in the pressure profile is visible which is indicative that the oblique shock is weak in nature. This weakening is attributed to shock wave boundary layer interaction occurring upstream of the protuberance. The interaction point where the pressure rise starts indicates the beginning of the compression band region. It can be envisaged that an increase in Mach number results in shifting the interaction point towards the protuberance irrespective of protuberance height. Thus the whole compression band or the localized
1.07
1.12
1.07
1.11
1.04
1.514.68 5.12
3.701.73
1.07
4.682.93
1.04
1.14 0.98
1.11
1.411.14
1.731.89
3.38
6.22 6.52 6.114.09
2.37
6.52
5.551.0
4
1.04 1.61
2.713.70
(i) (ii)
2.91
2.85
2.97
2.73
3.04
2.732.35
0.370.06
2.07
2.66
2.170.06
1.36 0.83
2.85
2.17
2.73
2.97
6.43
4.74
6.43 6.00
4.103.30
1.120.622.60
3.783.532.60 2.17 1.57
5.50
6.214.82
(i) (ii)
Engineering Applications of Computational Fluid Mechanics Vol. 6, No. 3 (2012)
325
Fig. 8 Variations of pressure coefficient for different heights.
(d) Upstream of protuberance (M∞=8)
x/L
Cp
0.3 0.32 0.34 0.36 0.38 0.4
-0.08
-0.04
0
0.04
0.08
0.12
0.16
0.2
H=0.01
H=0.02
H=0.03
H=0.04
H=0.05
x/L
Cp
0.1 0.125 0.15 0.175 0.2 0.225 0.25 0.275 0.3
0
0.02
0.04
0.06
0.08
0.1
0.12
0.14
H=0.01
H=0.02
H=0.03
H=0.04
H=0.05
x/L
Cp
0.1 0.125 0.15 0.175 0.2 0.225 0.25 0.275 0.3
0
0.025
0.05
0.075
0.1
0.125
0.15
0.175
0.2
H=0.01
H=0.02
H=0.03
H=0.04
H=0.05
x/L
Cp
0.3 0.32 0.34 0.36 0.38 0.4-0.12
-0.08
-0.04
0
0.04
0.08
0.12
0.16
0.2
0.24
H=0.01
H=0.02
H=0.03
H=0.04
H=0.05
x/L
Cp
0.4 0.45 0.5 0.55 0.6 0.65 0.7 0.75 0.8 0.85 0.9-0.06
-0.05
-0.04
-0.03
-0.02
-0.01
0
0.01
0.02
H=0.01
H=0.02
H=0.03
H=0.04
H=0.05
x/L
Cp
0.4 0.45 0.5 0.55 0.6 0.65 0.7 0.75 0.8 0.85 0.9-0.035
-0.03
-0.025
-0.02
-0.015
-0.01
-0.005
0
0.005
H=0.01
H=0.02
H=0.03
H=0.04
H=0.05
(a) Upstream of protuberance (M∞=3)
(b) On protuberance (M∞=3)
(c) Downstream of protuberance (M∞=3)
(e) On protuberance (M∞=8)
(f) Downstream of protuberance (M∞=8)
Engineering Applications of Computational Fluid Mechanics Vol. 6, No. 3 (2012)
326
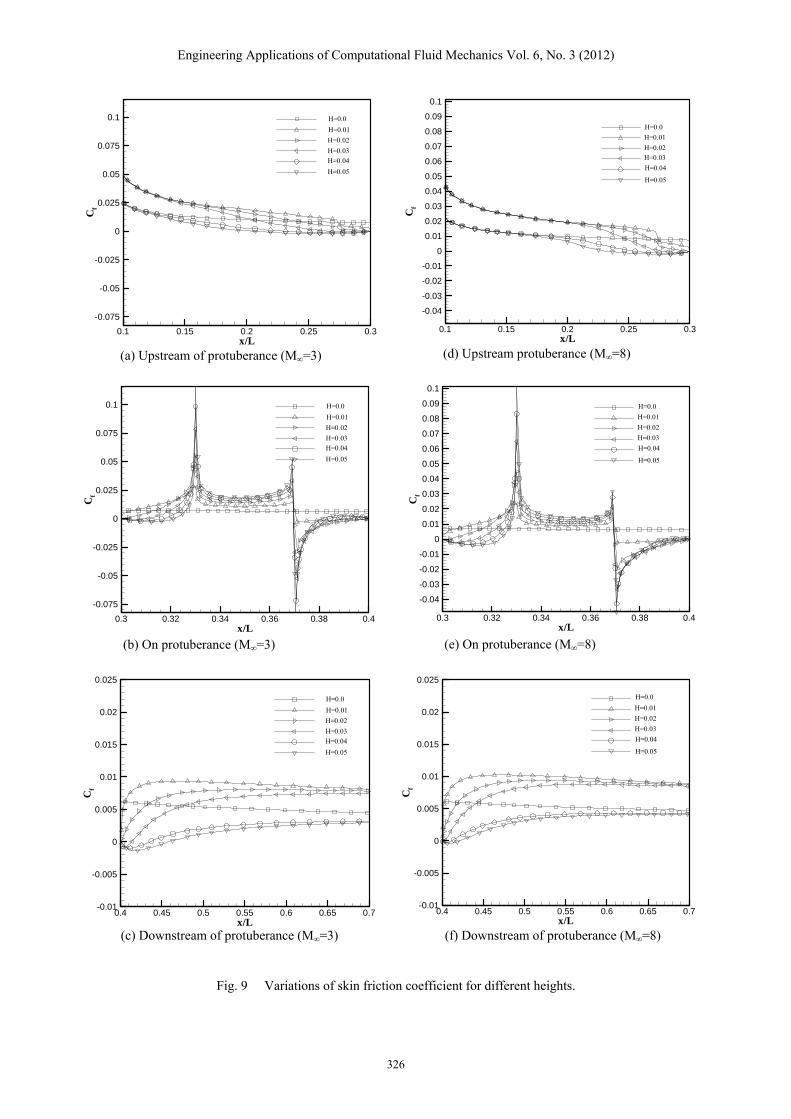
Fig. 9 Variations of skin friction coefficient for different heights.
(a) Upstream of protuberance (M∞=3)
(b) On protuberance (M∞=3)
(c) Downstream of protuberance (M∞=3)
(d) Upstream protuberance (M∞=8)
(e) On protuberance (M∞=8)
(f) Downstream of protuberance (M∞=8) x/L
Cf
0.4 0.45 0.5 0.55 0.6 0.65 0.7-0.01
-0.005
0
0.005
0.01
0.015
0.02
0.025
H=0.01
H=0.02
H=0.03
H=0.04
H=0.05
H=0.0
x/L
Cf
0.3 0.32 0.34 0.36 0.38 0.4
-0.075
-0.05
-0.025
0
0.025
0.05
0.075
0.1H=0.01
H=0.02
H=0.03
H=0.04
H=0.05
H=0.0
x/L
Cf
0.3 0.32 0.34 0.36 0.38 0.4
-0.04
-0.03
-0.02
-0.01
0
0.01
0.02
0.03
0.04
0.05
0.06
0.07
0.08
0.09
0.1
H=0.01
H=0.02
H=0.03
H=0.04
H=0.05
H=0.0
x/L
Cf
0.4 0.45 0.5 0.55 0.6 0.65 0.7-0.01
-0.005
0
0.005
0.01
0.015
0.02
0.025
H=0.01
H=0.02
H=0.03
H=0.04
H=0.05
H=0.0
x/L
Cf
0.1 0.15 0.2 0.25 0.3
-0.075
-0.05
-0.025
0
0.025
0.05
0.075
0.1H=0.01
H=0.02
H=0.03
H=0.04
H=0.05
H=0.0
x/L
Cf
0.1 0.15 0.2 0.25 0.3
-0.04
-0.03
-0.02
-0.01
0
0.01
0.02
0.03
0.04
0.05
0.06
0.07
0.08
0.09
0.1
H=0.01
H=0.02
H=0.03
H=0.04
H=0.05
H=0.0
Engineering Applications of Computational Fluid Mechanics Vol. 6, No. 3 (2012)
327
Uy
0.2 0.4 0.6 0.8
0.15
0.16
0.17
0.18
0.19
0.2
0.21
0.22
0.23
0.24
0.25
Mach=3
Mach=4Mach=5
Mach=6
Mach=7
Mach=8
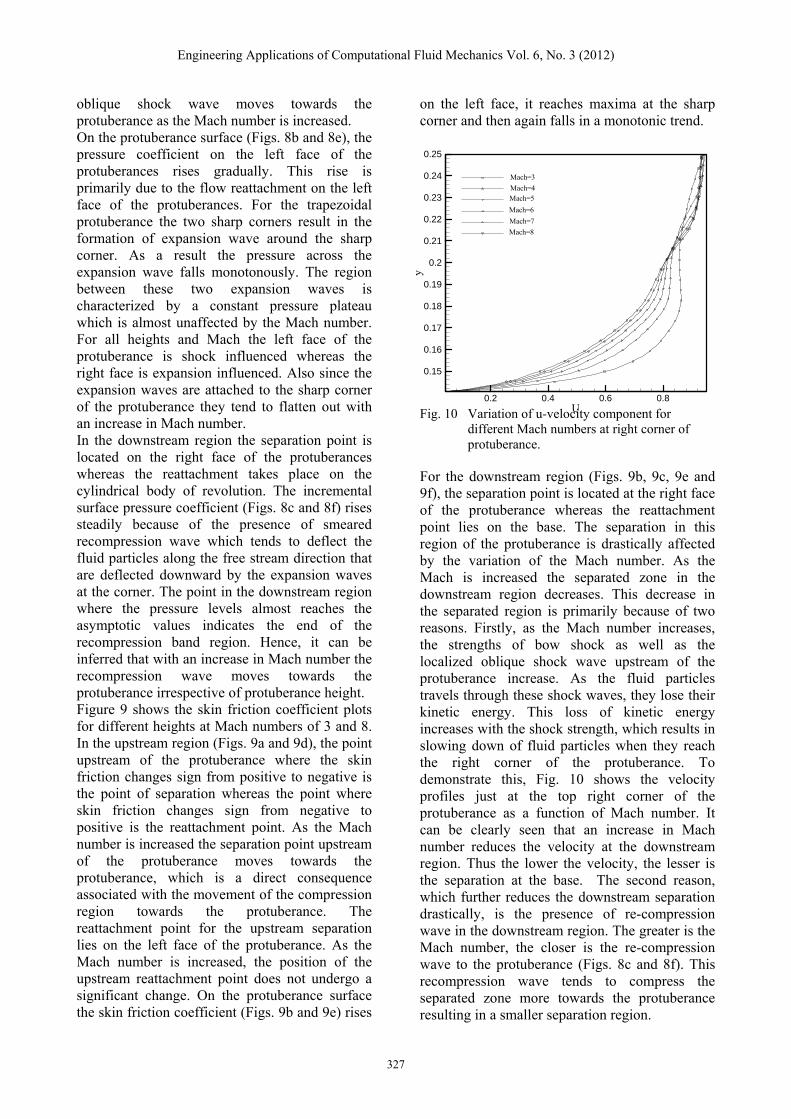
oblique shock wave moves towards the protuberance as the Mach number is increased. On the protuberance surface (Figs. 8b and 8e), the pressure coefficient on the left face of the protuberances rises gradually. This rise is primarily due to the flow reattachment on the left face of the protuberances. For the trapezoidal protuberance the two sharp corners result in the formation of expansion wave around the sharp corner. As a result the pressure across the expansion wave falls monotonously. The region between these two expansion waves is characterized by a constant pressure plateau which is almost unaffected by the Mach number. For all heights and Mach the left face of the protuberance is shock influenced whereas the right face is expansion influenced. Also since the expansion waves are attached to the sharp corner of the protuberance they tend to flatten out with an increase in Mach number. In the downstream region the separation point is located on the right face of the protuberances whereas the reattachment takes place on the cylindrical body of revolution. The incremental surface pressure coefficient (Figs. 8c and 8f) rises steadily because of the presence of smeared recompression wave which tends to deflect the fluid particles along the free stream direction that are deflected downward by the expansion waves at the corner. The point in the downstream region where the pressure levels almost reaches the asymptotic values indicates the end of the recompression band region. Hence, it can be inferred that with an increase in Mach number the recompression wave moves towards the protuberance irrespective of protuberance height. Figure 9 shows the skin friction coefficient plots for different heights at Mach numbers of 3 and 8. In the upstream region (Figs. 9a and 9d), the point upstream of the protuberance where the skin friction changes sign from positive to negative is the point of separation whereas the point where skin friction changes sign from negative to positive is the reattachment point. As the Mach number is increased the separation point upstream of the protuberance moves towards the protuberance, which is a direct consequence associated with the movement of the compression region towards the protuberance. The reattachment point for the upstream separation lies on the left face of the protuberance. As the Mach number is increased, the position of the upstream reattachment point does not undergo a significant change. On the protuberance surface the skin friction coefficient (Figs. 9b and 9e) rises
on the left face, it reaches maxima at the sharp corner and then again falls in a monotonic trend.
Fig. 10 Variation of u-velocity component for different Mach numbers at right corner of protuberance.
For the downstream region (Figs. 9b, 9c, 9e and 9f), the separation point is located at the right face of the protuberance whereas the reattachment point lies on the base. The separation in this region of the protuberance is drastically affected by the variation of the Mach number. As the Mach is increased the separated zone in the downstream region decreases. This decrease in the separated region is primarily because of two reasons. Firstly, as the Mach number increases, the strengths of bow shock as well as the localized oblique shock wave upstream of the protuberance increase. As the fluid particles travels through these shock waves, they lose their kinetic energy. This loss of kinetic energy increases with the shock strength, which results in slowing down of fluid particles when they reach the right corner of the protuberance. To demonstrate this, Fig. 10 shows the velocity profiles just at the top right corner of the protuberance as a function of Mach number. It can be clearly seen that an increase in Mach number reduces the velocity at the downstream region. Thus the lower the velocity, the lesser is the separation at the base. The second reason, which further reduces the downstream separation drastically, is the presence of re-compression wave in the downstream region. The greater is the Mach number, the closer is the re-compression wave to the protuberance (Figs. 8c and 8f). This recompression wave tends to compress the separated zone more towards the protuberance resulting in a smaller separation region.
Engineering Applications of Computational Fluid Mechanics Vol. 6, No. 3 (2012)
328
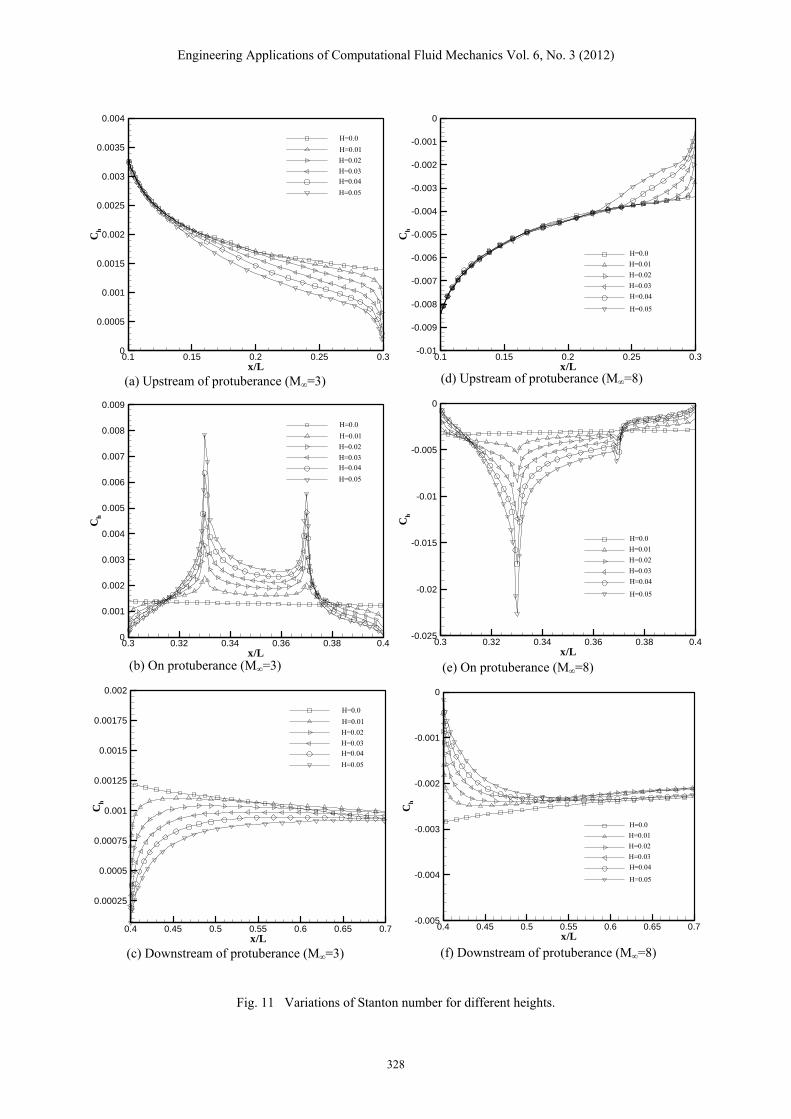
Fig. 11 Variations of Stanton number for different heights.
x/L
Ch
0.1 0.15 0.2 0.25 0.30
0.0005
0.001
0.0015
0.002
0.0025
0.003
0.0035
0.004
H=0.01
H=0.02
H=0.03
H=0.04
H=0.05
H=0.0
x/L
Ch
0.1 0.15 0.2 0.25 0.3-0.01
-0.009
-0.008
-0.007
-0.006
-0.005
-0.004
-0.003
-0.002
-0.001
0
H=0.01
H=0.02
H=0.03
H=0.04
H=0.05
H=0.0
x/L
Ch
0.3 0.32 0.34 0.36 0.38 0.40
0.001
0.002
0.003
0.004
0.005
0.006
0.007
0.008
0.009
H=0.01
H=0.02
H=0.03
H=0.04
H=0.05
H=0.0
x/L
Ch
0.3 0.32 0.34 0.36 0.38 0.4-0.025
-0.02
-0.015
-0.01
-0.005
0
H=0.01
H=0.02
H=0.03
H=0.04
H=0.05
H=0.0
x/L
Ch
0.4 0.45 0.5 0.55 0.6 0.65 0.7
0.00025
0.0005
0.00075
0.001
0.00125
0.0015
0.00175
0.002
H=0.01
H=0.02
H=0.03
H=0.04
H=0.05
H=0.0
x/L
Ch
0.4 0.45 0.5 0.55 0.6 0.65 0.7-0.005
-0.004
-0.003
-0.002
-0.001
0
H=0.01
H=0.02
H=0.03
H=0.04
H=0.05
H=0.0
(a) Upstream of protuberance (M∞=3)
(b) On protuberance (M∞=3)
(c) Downstream of protuberance (M∞=3)
(d) Upstream of protuberance (M∞=8)
(e) On protuberance (M∞=8)
(f) Downstream of protuberance (M∞=8)
Engineering Applications of Computational Fluid Mechanics Vol. 6, No. 3 (2012)
329
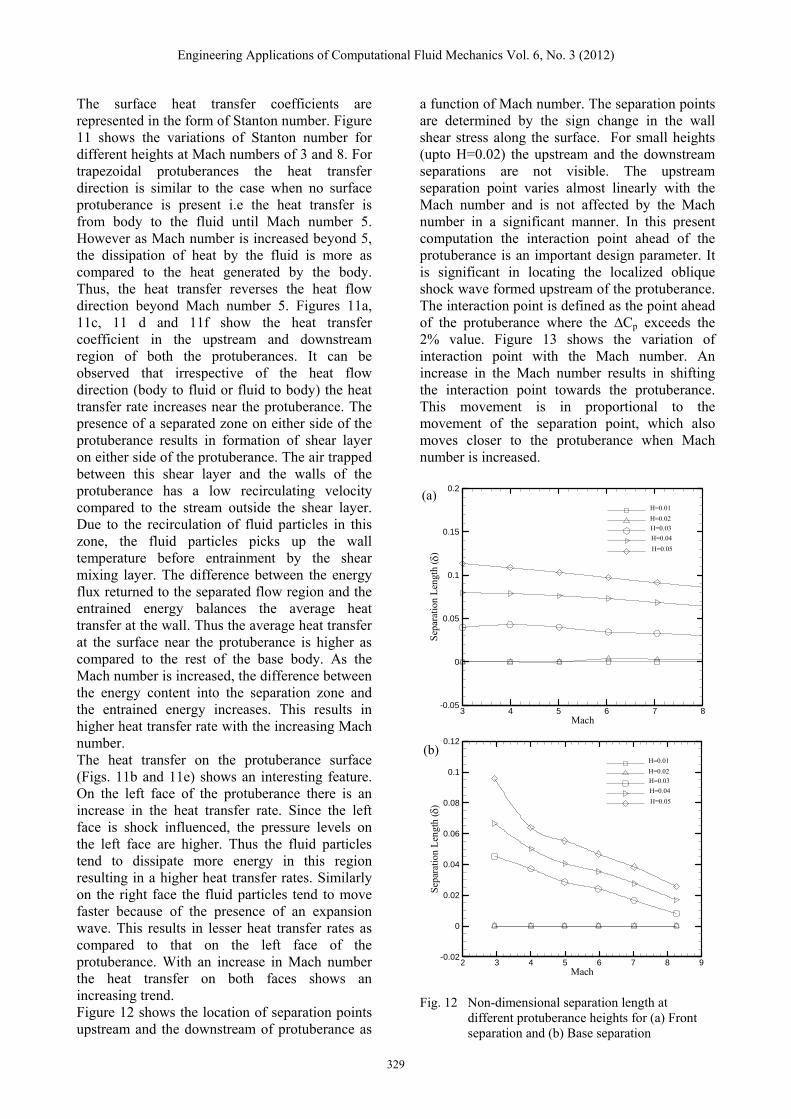
The surface heat transfer coefficients are represented in the form of Stanton number. Figure 11 shows the variations of Stanton number for different heights at Mach numbers of 3 and 8. For trapezoidal protuberances the heat transfer direction is similar to the case when no surface protuberance is present i.e the heat transfer is from body to the fluid until Mach number 5. However as Mach number is increased beyond 5, the dissipation of heat by the fluid is more as compared to the heat generated by the body. Thus, the heat transfer reverses the heat flow direction beyond Mach number 5. Figures 11a, 11c, 11 d and 11f show the heat transfer coefficient in the upstream and downstream region of both the protuberances. It can be observed that irrespective of the heat flow direction (body to fluid or fluid to body) the heat transfer rate increases near the protuberance. The presence of a separated zone on either side of the protuberance results in formation of shear layer on either side of the protuberance. The air trapped between this shear layer and the walls of the protuberance has a low recirculating velocity compared to the stream outside the shear layer. Due to the recirculation of fluid particles in this zone, the fluid particles picks up the wall temperature before entrainment by the shear mixing layer. The difference between the energy flux returned to the separated flow region and the entrained energy balances the average heat transfer at the wall. Thus the average heat transfer at the surface near the protuberance is higher as compared to the rest of the base body. As the Mach number is increased, the difference between the energy content into the separation zone and the entrained energy increases. This results in higher heat transfer rate with the increasing Mach number. The heat transfer on the protuberance surface (Figs. 11b and 11e) shows an interesting feature. On the left face of the protuberance there is an increase in the heat transfer rate. Since the left face is shock influenced, the pressure levels on the left face are higher. Thus the fluid particles tend to dissipate more energy in this region resulting in a higher heat transfer rates. Similarly on the right face the fluid particles tend to move faster because of the presence of an expansion wave. This results in lesser heat transfer rates as compared to that on the left face of the protuberance. With an increase in Mach number the heat transfer on both faces shows an increasing trend. Figure 12 shows the location of separation points upstream and the downstream of protuberance as
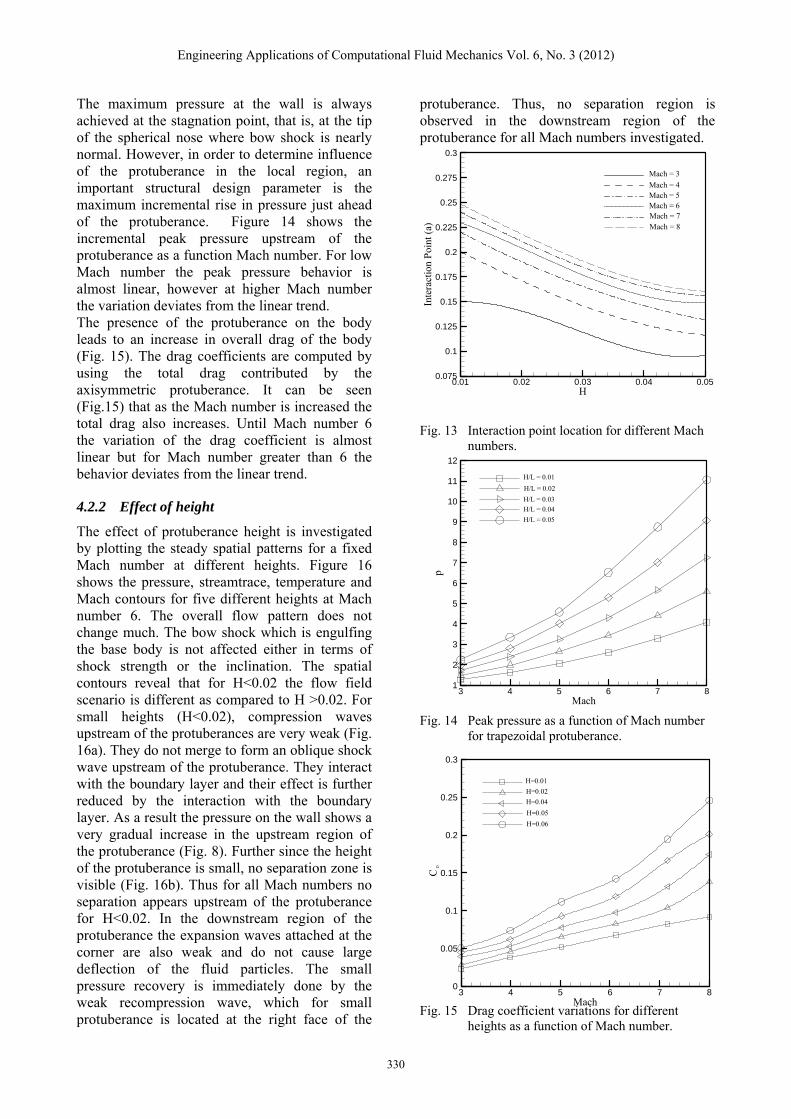
a function of Mach number. The separation points are determined by the sign change in the wall shear stress along the surface. For small heights (upto H=0.02) the upstream and the downstream separations are not visible. The upstream separation point varies almost linearly with the Mach number and is not affected by the Mach number in a significant manner. In this present computation the interaction point ahead of the protuberance is an important design parameter. It is significant in locating the localized oblique shock wave formed upstream of the protuberance. The interaction point is defined as the point ahead of the protuberance where the ∆Cp exceeds the 2% value. Figure 13 shows the variation of interaction point with the Mach number. An increase in the Mach number results in shifting the interaction point towards the protuberance. This movement is in proportional to the movement of the separation point, which also moves closer to the protuberance when Mach number is increased.
Fig. 12 Non-dimensional separation length at different protuberance heights for (a) Front separation and (b) Base separation
Mach
Sep
arat
ion
Len
gth
()
2 3 4 5 6 7 8 9-0.02
0
0.02
0.04
0.06
0.08
0.1
0.12
H=0.01
H=0.02
H=0.03
H=0.04
H=0.05
Mach
Sep
arat
ion
Len
gth
()
3 4 5 6 7 8-0.05
0
0.05
0.1
0.15
0.2
H=0.01
H=0.02
H=0.03
H=0.04
H=0.05
(a)
(b)
Engineering Applications of Computational Fluid Mechanics Vol. 6, No. 3 (2012)
330
H
Inte
ract
ion
Poi
nt(a
)
0.01 0.02 0.03 0.04 0.050.075
0.1
0.125
0.15
0.175
0.2
0.225
0.25
0.275
0.3
Mach = 3
Mach = 4Mach = 5Mach = 6Mach = 7Mach = 8
The maximum pressure at the wall is always achieved at the stagnation point, that is, at the tip of the spherical nose where bow shock is nearly normal. However, in order to determine influence of the protuberance in the local region, an important structural design parameter is the maximum incremental rise in pressure just ahead of the protuberance. Figure 14 shows the incremental peak pressure upstream of the protuberance as a function Mach number. For low Mach number the peak pressure behavior is almost linear, however at higher Mach number the variation deviates from the linear trend. The presence of the protuberance on the body leads to an increase in overall drag of the body (Fig. 15). The drag coefficients are computed by using the total drag contributed by the axisymmetric protuberance. It can be seen (Fig.15) that as the Mach number is increased the total drag also increases. Until Mach number 6 the variation of the drag coefficient is almost linear but for Mach number greater than 6 the behavior deviates from the linear trend.
4.2.2 Effect of height
The effect of protuberance height is investigated by plotting the steady spatial patterns for a fixed Mach number at different heights. Figure 16 shows the pressure, streamtrace, temperature and Mach contours for five different heights at Mach number 6. The overall flow pattern does not change much. The bow shock which is engulfing the base body is not affected either in terms of shock strength or the inclination. The spatial contours reveal that for H<0.02 the flow field scenario is different as compared to H >0.02. For small heights (H<0.02), compression waves upstream of the protuberances are very weak (Fig. 16a). They do not merge to form an oblique shock wave upstream of the protuberance. They interact with the boundary layer and their effect is further reduced by the interaction with the boundary layer. As a result the pressure on the wall shows a very gradual increase in the upstream region of the protuberance (Fig. 8). Further since the height of the protuberance is small, no separation zone is visible (Fig. 16b). Thus for all Mach numbers no separation appears upstream of the protuberance for H<0.02. In the downstream region of the protuberance the expansion waves attached at the corner are also weak and do not cause large deflection of the fluid particles. The small pressure recovery is immediately done by the weak recompression wave, which for small protuberance is located at the right face of the
protuberance. Thus, no separation region is observed in the downstream region of the protuberance for all Mach numbers investigated.
Fig. 13 Interaction point location for different Mach numbers.
Fig. 14 Peak pressure as a function of Mach number for trapezoidal protuberance.
Fig. 15 Drag coefficient variations for different heights as a function of Mach number.
Mach
p
3 4 5 6 7 81
2
3
4
5
6
7
8
9
10
11
12
H/L = 0.01
H/L = 0.02
H/L = 0.03
H/L = 0.04
H/L = 0.05
Mach
C
3 4 5 6 7 80
0.05
0.1
0.15
0.2
0.25
0.3
H=0.01
H=0.02
H=0.04
H=0.05
H=0.06
D
Engineering Applications of Computational Fluid Mechanics Vol. 6, No. 3 (2012)
331
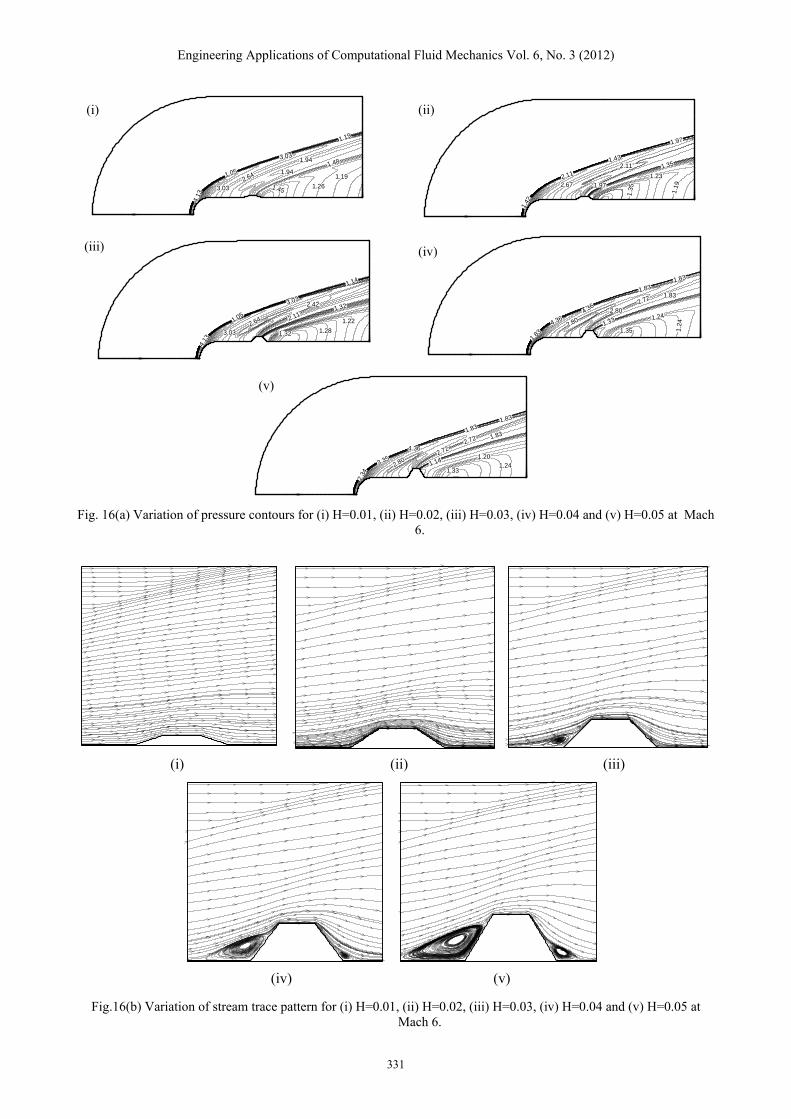
Fig. 16(a) Variation of pressure contours for (i) H=0.01, (ii) H=0.02, (iii) H=0.03, (iv) H=0.04 and (v) H=0.05 at Mach 6.
Fig.16(b) Variation of stream trace pattern for (i) H=0.01, (ii) H=0.02, (iii) H=0.03, (iv) H=0.04 and (v) H=0.05 at Mach 6.
1.05
3.03
1.19
2.64
1.941.48
1.19
1.453.03
1.94
4.13
1.26
2.11
1.43
1.97
2.67
2.11 1.35
1.97
1.35
1.23
1.19
1.42
1.05
3.03
1.14
2.64
2.421.32
1.22
1.323.03
2.11
4.13
1.281.
83
4.36
1.831.83
2.80
2.80
1.83
1.33 1.24
1.2
4
1.35
2.72
4.36
2.34
4.36
1.831.83
2.802.72
1.83
1.141.20
1.241.33
2.72
3.35
(i) (ii)
(iii) (iv)
(v)
(v)
(i) (ii) (iii)
(iv)
Engineering Applications of Computational Fluid Mechanics Vol. 6, No. 3 (2012)
332
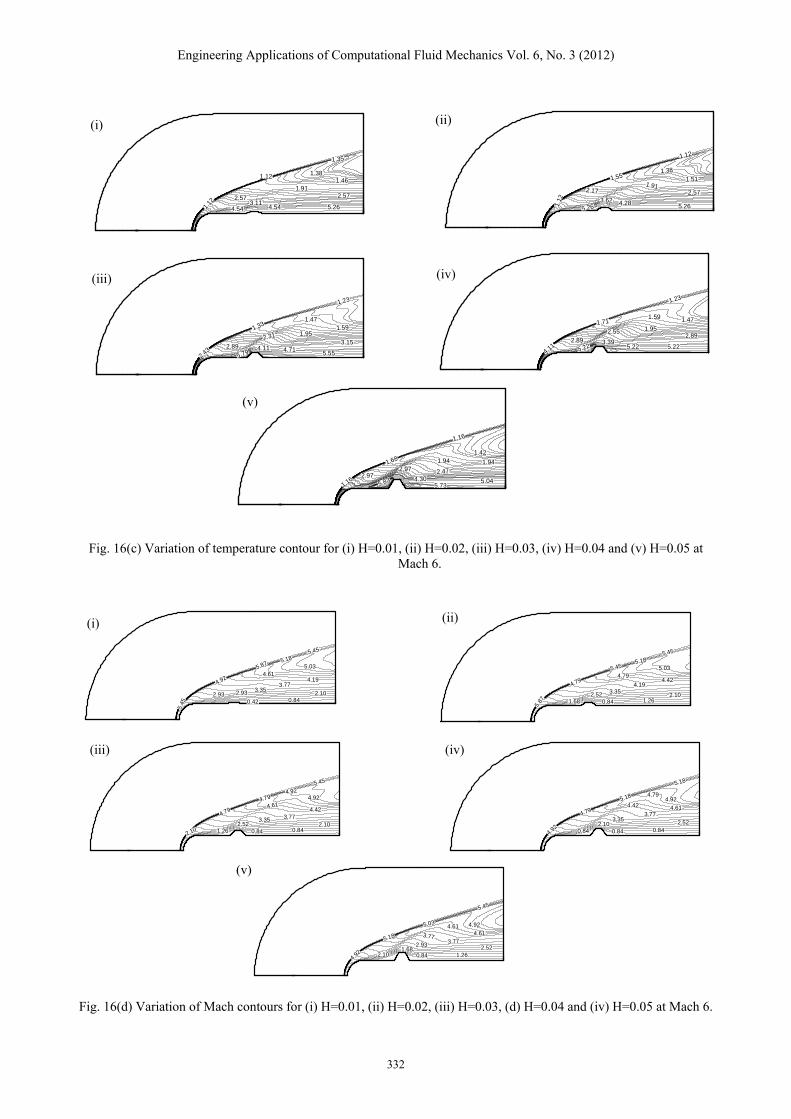
Fig. 16(c) Variation of temperature contour for (i) H=0.01, (ii) H=0.02, (iii) H=0.03, (iv) H=0.04 and (v) H=0.05 at Mach 6.
Fig. 16(d) Variation of Mach contours for (i) H=0.01, (ii) H=0.02, (iii) H=0.03, (d) H=0.04 and (iv) H=0.05 at Mach 6.
1.12
1.12
1.35
1.46
2.57
5.264.543.11
4.54
2.57
1.91
1.38
1.12
1.55
1.12
1.51
2.57
5.264.283.625.26
2.171.91
1.38
2.43
1.33
1.23
1.59
3.15
5.554.71
1.952.31
5.792.89
1.47
4.114.11
1.71
1.23
1.47
2.89
5.225.22
1.952.55
5.222.89
1.59
3.39
1.16
1.68
1.16
1.42
1.94
5.045.73
4.30
1.94
2.472.97
5.832.97
(i) (ii)
(iii) (iv)
(v)
5.45
4.92
5.87
5.45
2.933.35
0.84
4.19
5.034.61
0.42
2.93
5.18
3.77
2.10
5.87
4.79
5.45
5.45
1.68
3.35
1.26
4.42
5.034.79
0.842.52
5.18
4.19
2.10
2.10
4.79
4.79
5.45
1.26
3.35
0.84
4.42
4.92
4.61
0.842.52
4.92
3.772.10
4.92
4.79
5.18
5.18
0.84
3.35
0.84
4.61
4.924.42
0.842.10
4.79
3.772.52
4.92
5.18
5.03
5.45
2.10
2.93
1.26
4.61
4.92
3.77
0.841.68
4.61
3.772.52
(i) (ii)
(iii) (iv)
(v)
Engineering Applications of Computational Fluid Mechanics Vol. 6, No. 3 (2012)
333
For H>0.02 the compression waves upstream of the protuberance and the expansion waves attached at the corner become stronger, resulting in upstream and downstream separation regions for all Mach numbers. It can also be observed that as the height is increased, the upstream separation region is found to be more pronounced as compared to the downstream separation. The temperature field also shows an increase in temperature around the protuberance with an increase in height (Fig. 16c). As the height increases the local rise in the pressure results in slowing down the speed of the fluid particles and hence increasing the heat dissipation rate, which increases the temperature around the protuberance. Also, the extent of the subsonic region is increased with an increase in height. Smaller separated region is due to the retarding fluid velocities near the protuberance in response to an increase in height of the protuberance. The effect of height in the local region of the protuberance can further be analyzed by investigating surface quantities at Mach numbers of 3 and 8. The incremental surface pressure shows (Fig. 8) that as the height of protuberance is increased the pressure ahead of the protuberance also increases. It can also be observed that the interaction point of the compression waves with the boundary layer shifts away from the protuberance as the height is increased. On the protuberance surface (Figs. 8b and 8e) for H<0.02, since no separation is present the pressure is almost constant on the left face, however, for H>0.02 a rise in pressure level is visible due to the reattachment at the left face. In the downstream region (Figs. 8c and 8f), with the increasing height the incremental pressure values achieve an asymptotic value at larger distances away from the protuberance. This indicates that the recompression wave moves away from the protuberance as the height of the protuberance is increased. The skin friction plots (Fig. 9) also indicate the movement of the separation and reattachment points on the surface. As for H<0.02 the skin friction profile is positive throughout the surface. It indicates that no separation zone is present. For H>0.02 the separation point moves towards the spherical nose and the reattachment lies on the left face of the protuberance. Similarly in the downstream side, the separation point still remains at the right face of the protuberance. However, the reattachment point in the downstream region shifts away from the protuberance. The Stanton number plots (Fig. 11) also show an increase in heat transfer characteristics with an increase in height. The
heat transfer is small for small height whereas it increases significantly as the height is increased. For larger heights the heat transfer rate is higher because increased height results in a larger separated zone upstream and downstream of the protuberance. Hence, there is a larger difference between the energy flux returned to the separated flow region and the entrained energy. This results in higher heat transfer rates. No change in the direction of the heat flow (body to fluid or fluid to body) is visible for any height. The heat transfer direction reversal is only dependent on the Mach number. Figure 12 shows the separation point as a function of height for the trapezoidal protuberance. It can be seen that the separation points vary linearly with the height of the protuberance. A similar trend can be seen for the peak pressure and the drag characteristics (Figs. 14 and 15). It can be concluded that the separation length, the interaction points, the peak pressure and the drag coefficient are more significantly affected by the variation in height as compared to the variation in Mach number.
5. CONCLUSIONS
A numerical investigation of the flow past an axisymmetric surface protuberance of trapezoidal cross-section has been carried out. The protuberance is mounted on a cylindrical body of revolution with hemispherical nose. The computations are carried out for the full Navier- Stokes equation for axisymmetric flows in the curvilinear coordinate system using particle velocity upwinding scheme. Effects of inflow Mach number (3-8) and protuberance height (0-50% of the base radius) on the global and local flow fields are investigated. The influence on the aerodynamics design parameters like skin friction, surface pressure distributions, heat transfer characteristics, peak pressure, shock wave boundary interaction points, separation lengths and the drag characteristic by varying these parameters are studied. The results are compared with the case when no surface protuberance is mounted on the cylindrical body of revolution. The major conclusions for each set of parametric study are summarized as follows:
A. Effect of Mach number
1. The spatial global pattern exhibits a strong bow shock formation in front of the spherical nose. The Mach number variation only affects this bow shock in terms of shock strength and
Engineering Applications of Computational Fluid Mechanics Vol. 6, No. 3 (2012)
334
the shock deflection for all the cases investigated.
2. The expansion wave formed at the corners of the protuberances remains attached at the sharp corner and tends to flatten out with an increase in Mach number.
3. The local oblique shock that appears in front of the protuberance moves towards the protuberance as the Mach number is increased.
4. An increase in Mach number results in the reversal of heat transfer. Until Mach number 5 heat transfer is form body to fluid, whereas after Mach number 5 the heat transfer is from fluid to the body.
5. The separation, upstream and downstream of the protuberance, decreases with an increase in Mach number. However, the downstream separation region is drastically affected by an increase in Mach number. At higher Mach number the downstream separation almost vanishes.
6. The drag coefficient variation is almost linear until Mach number 5. Beyond Mach number 5 the variation deviates from the linear trend.
B. Effect of protuberance height
1. The local oblique shock formed because the protuberance moves away from the protuberance as the height is increased.
2. An increase in protuberance height results in an increase in subsonic region formed near the base body.
3. An increase in protuberance height results in increase in heat transfer rate. No signs of heat transfer reversal due to increase in height are observed.
4. For small height H< 0.02 no separation occurs.
5. For H>0.02 the upstream separation increases with an increase in height.
6. The separation and reattachment points, upstream and the downstream of the protuberance, vary linearly as the height is increased.
7. The drag coefficient also varies linearly with the height of the protuberance.
REFERENCES
1. Abu-Hijleh B, Samimi M (1989). An experimental study of a reattaching supersonic shear layer. AIAA-1989-1801.
2. Anderson JD (1995). Computational Fluid Dynamic. McGraw-Hill, New York.
3. Arai T, Sugiyama H, Homareda M, Uno N (1995). Turbulence characteristics of supersonic boundary layer past: a backward facing step. AIAA-1995-6126.
4. Becker S (2005). Experimental and numerical investigation of the flow induced noise from a forward facing step. AIAA-2005-3006.
5. Bloom MH, Pallone A (1959). Shroud tests of pressure and heat transfer over short afterbodies with separated wakes. J. Aero-Space Sciences 26:629
6. Chapman DR, Kuehn DM, Larson HK (1957). Investigation of Separated Flows in Supersonic and Subsonic Streams with Emphasis on the Effect of Transition. NACA TR 1356.
7. Chanetz B, Benay R, Bousquet JM, Bur R, Pot T, Grass F, Moss J (1998). Experimental and numerical study of the laminar separation in hypersonic flow. Aerospace Science and Technology 3:205-218.
8. Chen CL, Hung CM (1992). Numerical study of junction flows. AIAA Journal 30:1800-1807.
9. Correa SM, Warren RE (1989). Supersonic sudden-expansion flow with fluid injection: An experimental and computational study. AIAA-1989-0389.
10. Dolling D, Murphy M (1983). Unsteadiness of the separation shockwave structure in a supersonic compression ramp flow-field. AIAA Journal 12:1628-1634.
11. Donaldson IS (1967). On the separation of a supersonic flow at a sharp corner. AIAA Journal 5:1086-1088.
12. Driftmyer RT (1974). Thick 2D turbulent boundary layer separated by steps and slot jets. AIAA Journal 12:21-27.
13. Efimtsov BM, Rizzi SA, Andersson AO, Andrianov EV (2002). Influence of small steps on wall pressure fluctuation spectra measured on TU-144LL flying laboratory. AIAA-2002-2605.
14. Ericsson LE (1978). Axisymmetric unsteady flow in forward-facing cavities. Journal of Spacecraft and Rockets 15:321-327.
15. Grotowsky IMG, Ballmann J (2000). Numerical investigation of hypersonic step flow. Shock Waves 10:57-72.
16. Hama FR (1968). Experimental studies on the lip shock. AIAA Journal 6:212-219.
17. Hartfield RJ, Hollo SD, McDaniel JC (1993). Planar measurement technique for compressible flows using laser induced iodine fluorescence. AIAA Journal, 31:483- 490.
Engineering Applications of Computational Fluid Mechanics Vol. 6, No. 3 (2012)
335
18. Kronzon Y (1974). Numerical Solution for the Laminar Supersonic Flow over a Two Dimensional Backward Facing Step. Ph.D. Thesis. Technion, Israel Institute of Technology.
19. Kuruvila G, Anderson JD (1985). A study on the effects of numerical dissipation on the calculations of supersonic separated flows. AIAA-1985-0301.
20. Liepmann HW, Roshko A (1957). Elements of Gas Dynamics. John Wiley and Sons, New York.
21. Lombard CK, Luh RC-C, Nagaraj N, Bardina J, Venkatapathy E (1986). Numerical simulation of backward step and jet exhaust flows. AIAA-1986-0432.
22. Love ES (1955). Pressure Rise Associated with Shock Induced Boundary Layer Separation. NACA TN 3601.
23. McConnell DG (1961). Flight Observation of Separated Turbulent Flow Including Heat Transfer up to Mach 8.5. NASA - TN.
24. Qamar A, Hasan N, Sanghi S (2006). A new scheme for the computation of compressible flows. AIAA Journal 44(5):1025–1039.
25. Qamar A, Hasan N, Sanghi S (2010). A new spatial discretization strategy of the convective flux term for the hyperbolic conservation laws. Engineering Applications of Computational Fluid Mechanics 4:593-611.
26. Roos FW, Kegelman JT (1986). Control of coherent structures in reattaching laminar and turbulent shear layers. AIAA Journal 24:1956.
27. Roshko A, Thomke GJ (1966). Observations of turbulent reattachment behind an axisymmetric downstream-facing step in supersonic flow. AIAA Journal 4:975-979.
28. Simpson LR (2001). Junction flows. Annu. Rev. Fluid Mech. 33:415.
29. Samimy M, Petrie HL, Addy AL (1985). A study of compressible turbulent free shear layers using laser doppler velocimetry. AIAA-1985-0177.
30. Scherberg MG, Smith HE (1967). An experimental study of supersonic flow over a rearward facing step. AIAA Journal 5:51- 56.
31. Sterrett JR, Emery JC (1960). Extension of Boundary Layer Separation Criterion to a Mach Number of 6.5 by Utilizing Flat Plates with Forward Facing Step. NASA TN D-618.
32. Suxun Li, Chen Y (2000). Pressure measurement and flow visualization on hypersonic low over rectangular cylinder. 6th Flucome International Symposium on Fluid Control, Measurement and Visualization.
33. Tucker R, Shyy WA (1993). Numerical analysis of supersonic flow over an axisymmetric afterbody. AIAA-1993-2347.
34. Yang AS, Hsieh WH, Kuo KK (1991). Theoretical study of supersonic flow separation over a rearward facing step. AIAA-1991-2161.
35. Zukoski EE (1967). Turbulent boundary layer separation in front of a forward facing step. AIAA Journal l5:1746-1753.
Related Documents