1 Aerodynamics and Debris Transport for the Space Shuttle Launch Vehicle UTIAS I.I. Glass Memorial Lecture May 2012 Stuart Rogers Applied Modeling and Simulation Branch NASA Advanced Supercomputing Division NASA Ames Research Center https://ntrs.nasa.gov/search.jsp?R=20120014272 2020-05-01T02:18:26+00:00Z

Welcome message from author
This document is posted to help you gain knowledge. Please leave a comment to let me know what you think about it! Share it to your friends and learn new things together.
Transcript

1
Aerodynamics and Debris Transport for the Space Shuttle Launch Vehicle
UTIAS I.I. Glass Memorial Lecture May 2012
Stuart Rogers Applied Modeling and Simulation Branch NASA Advanced Supercomputing Division NASA Ames Research Center
https://ntrs.nasa.gov/search.jsp?R=20120014272 2020-05-01T02:18:26+00:00Z
2
Acknowledgements The accomplishments described herein is the work of many talented
people, including: NASA Ames Engineers: Michael Aftosmis Scott Murman William Chan Robert Meakin Edward Tejnil
NASA JSC Engineers: Reynaldo Gomez
Darby Vicker Phil Stuart Jim Greathouse
NAS Supercomputing Facility Ames wind-tunnels and ballistic range

3
NASA Advanced Supercomputer Facility
Provides massive computing power to all of NASA Pleiades: 112,896 cores
7th biggest computer in the world (Nov 2011)
Columbia: 4608 cores Formerly 2nd biggest computer in the world
Over 1.3 Tflops total compute capability

Timeline of NAS, Ames CFD, and Space Shuttle Applications
105 grid points
1980 1985 1990 1995 2000 2005 2010
Cray X-MP 0.2 Gflops
Cray Y-MP 2.5 Gflops
Cray 2 2 Gflops
Cray C90 15 Gflops
SGI Origin 2000 128 Gflops
SGI Altix 2.3 Tflops
ARC3D
INS3D
F3D TLNS3D
Overflow 1.6 Overflow 2.0 Overflow 1.8
Cart3D Overflow 2.1
Overflow 2.2
Chimera
Grid Tools
Pegasus5
NAS
Begins
SGI Origin 3800
1.2 Tflops
Columbia 67 Tflops
Pleiades 608 Tflops
STS107
Cart3D 1.4
106 grid points 107 grid points 108 grid points
5
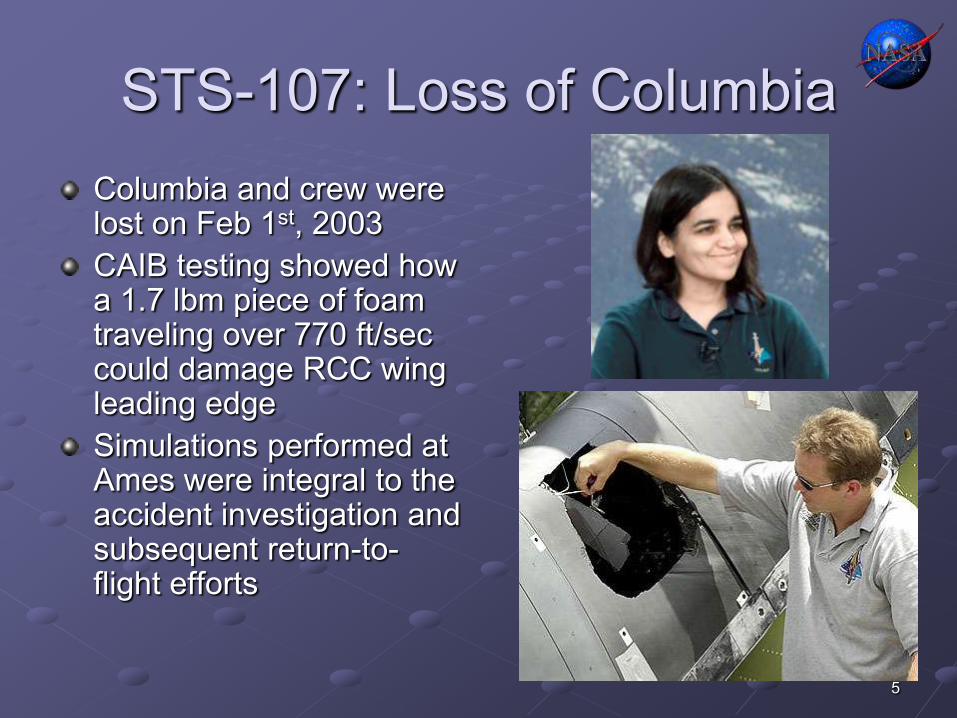
STS-107: Loss of Columbia Columbia and crew were lost on Feb 1st, 2003 CAIB testing showed how a 1.7 lbm piece of foam traveling over 770 ft/sec could damage RCC wing leading edge Simulations performed at Ames were integral to the accident investigation and subsequent return-to-flight efforts

6
Support for STS-107 Accident Investigation
Significant improvements to fidelity of Overflow CFD model of SSLV Steady-state simulations of many points along trajectory of STS-107
calculated by the CFD results were well within the design certification limits, and were a small fraction of the design limits at the debris-release conditions at
Time-accurate 6-DOF simulations of SSLV and bipod-ramp foam debris using Cart3D

7
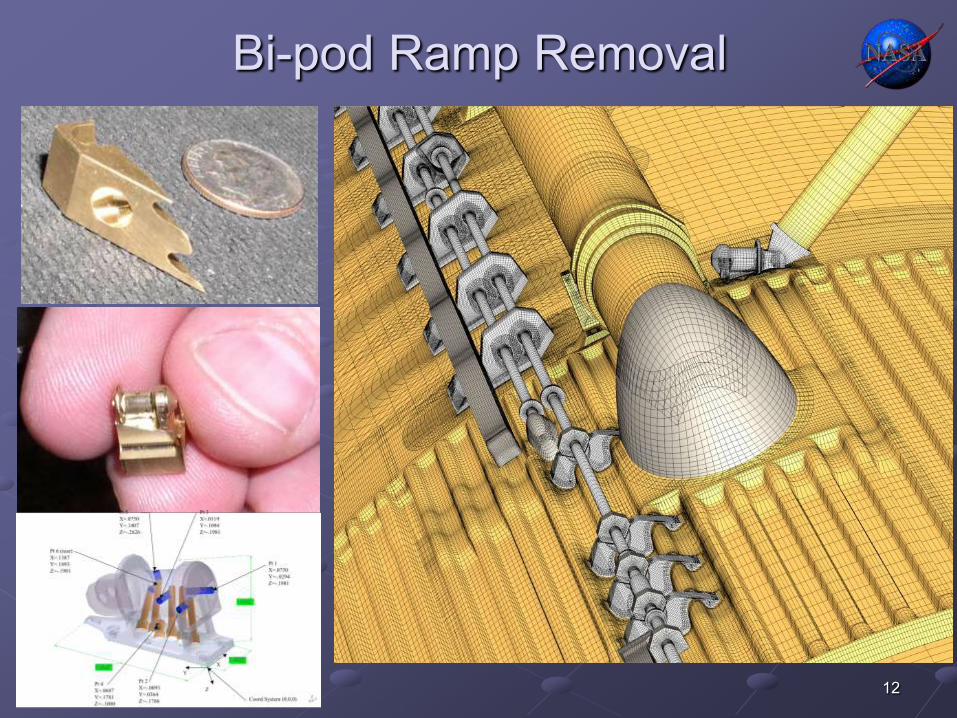
Geometry Details
Old Grid System
New Grids with Bipod Ramp
New Grids without Bipod Ramp
Control Surface and nozzle deflections

8
Cart3D 6-DOF Simulations, Mach=2.46
9
Return To Flight
Overflow solutions of ascent Analyze aero loads on External Tank design changes Provide CFD flow-fields for debris analysis Correlation of 3% Wind-Tunnel tests
Debris Transport Analysis Develop next generation of debris analysis software Develop aerodynamic models for debris

10
CFD Analysis of SSLV Ascent Over 400 Overflow solutions run for Return-to-Flight New grids generated for each ascent condition
2 hours on 32 Itanium-2 CPUs 30 to 50 million grid points each
Average of ~1000 Itanium-2 CPU hrs / solution ~20 hours of wallclock time running on 64 Itanium-2 CPUs Never converges to a steady-state: aft end of ET, attachment hardware, plumes, etc Typically run for ~10,000 iterations
11
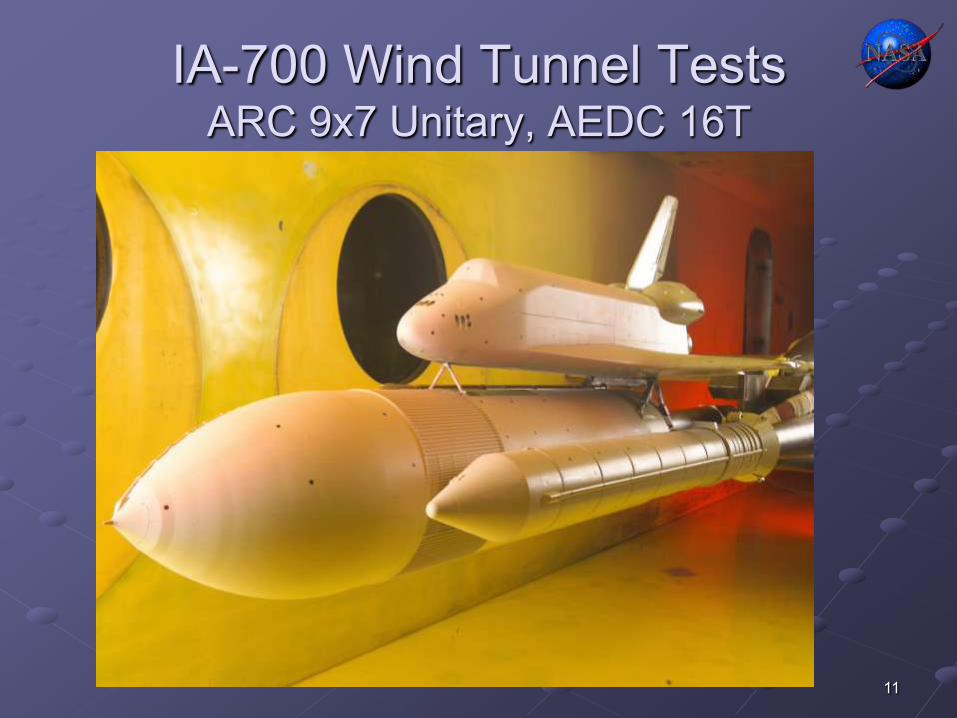
IA-700 Wind Tunnel Tests ARC 9x7 Unitary, AEDC 16T
12
Bi-pod Ramp Removal
13
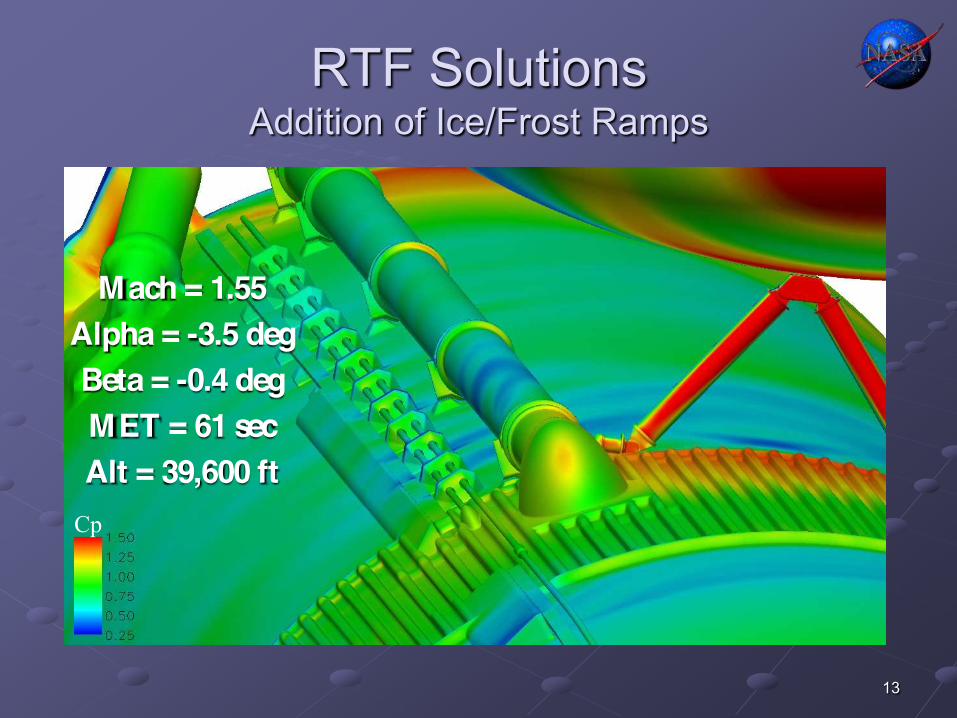
RTF Solutions Addition of Ice/Frost Ramps
Mach = 1.55 Alpha = -3.5 deg Beta = -0.4 deg MET = 61 sec Alt = 39,600 ft
Cp
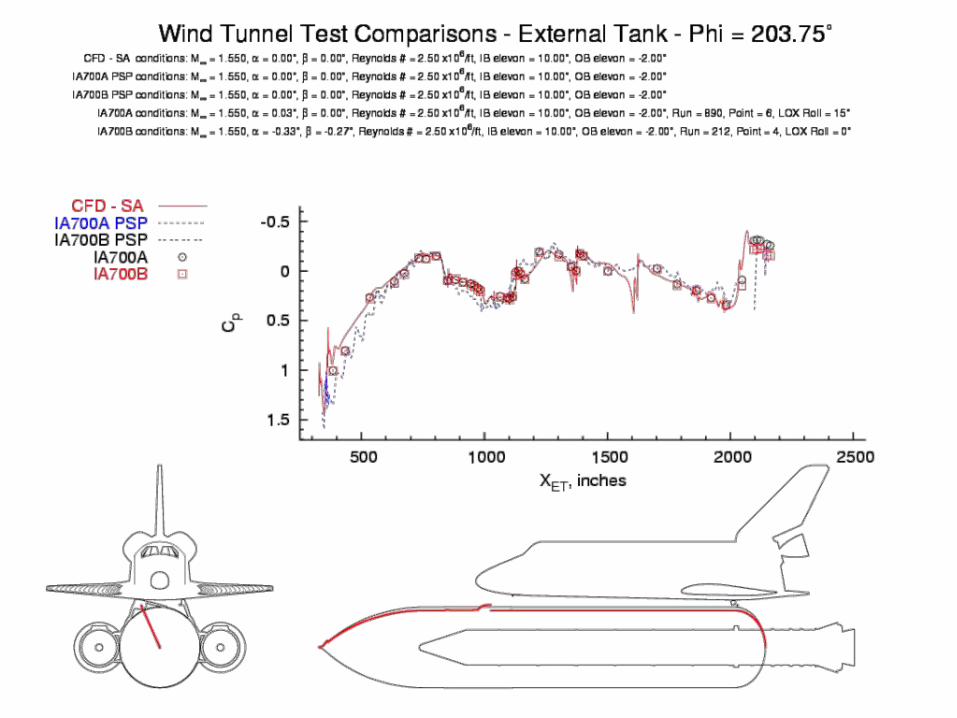
Stagnation pressure is artificially high in the PSP data because of poor camera angles

15
External Tank Redesign Assessments
Bipod Ramp Removal
PAL Ramp Removal
+Z Aerovent Modification
Multiple ice/frost ramp redesigns Ascent & entry windows airloads Discrete airloads data book updates Venting database updates Aerothermal support
LO2 feedline bracket redesigns
RCS Tyvek® covers

16
Space Shuttle Ascent Debris Analysis

Ascent Profile and Debris Velocities
18
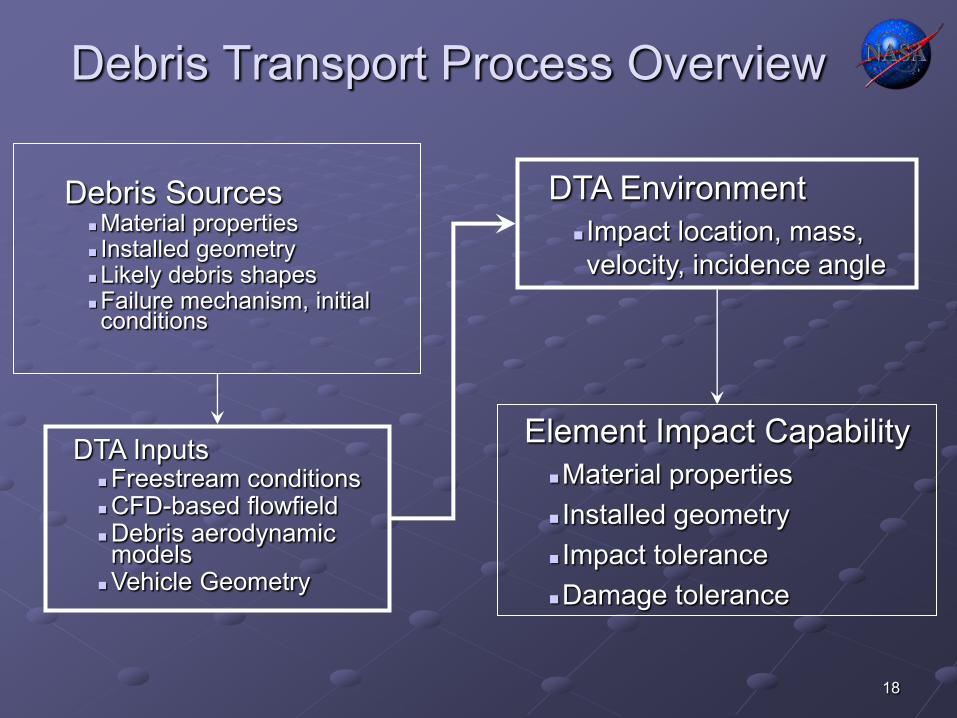
Debris Transport Process Overview
Debris Sources Material properties Installed geometry Likely debris shapes Failure mechanism, initial conditions
DTA Inputs Freestream conditions CFD-based flowfield Debris aerodynamic models Vehicle Geometry
DTA Environment Impact location, mass, velocity, incidence angle
Element Impact Capability Material properties Installed geometry Impact tolerance Damage tolerance
19
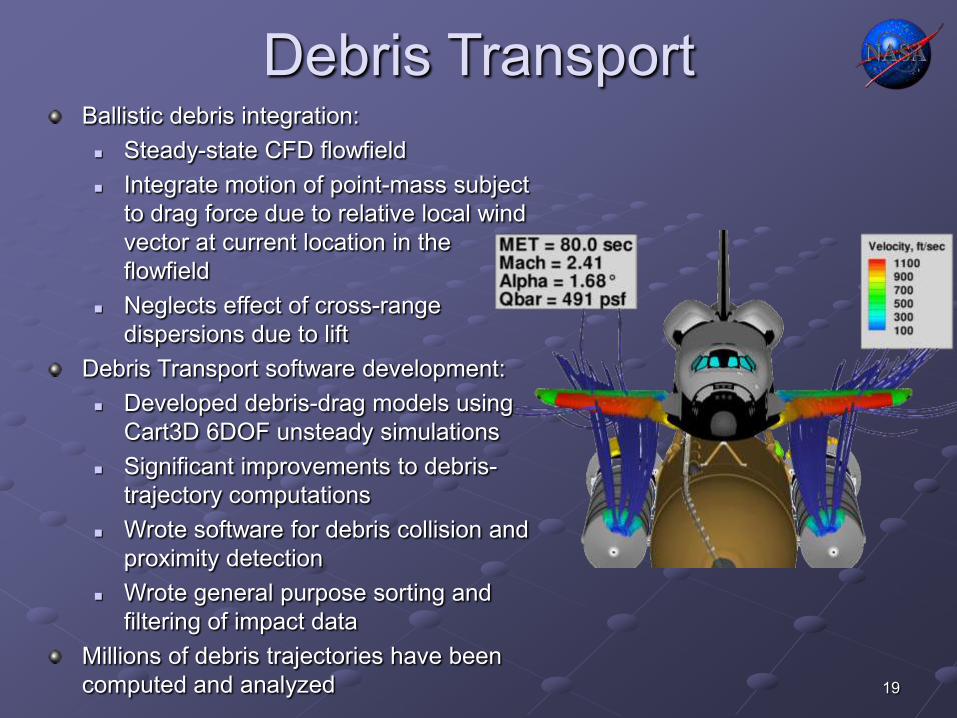
Debris Transport Ballistic debris integration:
Steady-state CFD flowfield Integrate motion of point-mass subject to drag force due to relative local wind vector at current location in the flowfield Neglects effect of cross-range dispersions due to lift
Debris Transport software development: Developed debris-drag models using Cart3D 6DOF unsteady simulations Significant improvements to debris-trajectory computations Wrote software for debris collision and proximity detection Wrote general purpose sorting and filtering of impact data
Millions of debris trajectories have been computed and analyzed
20
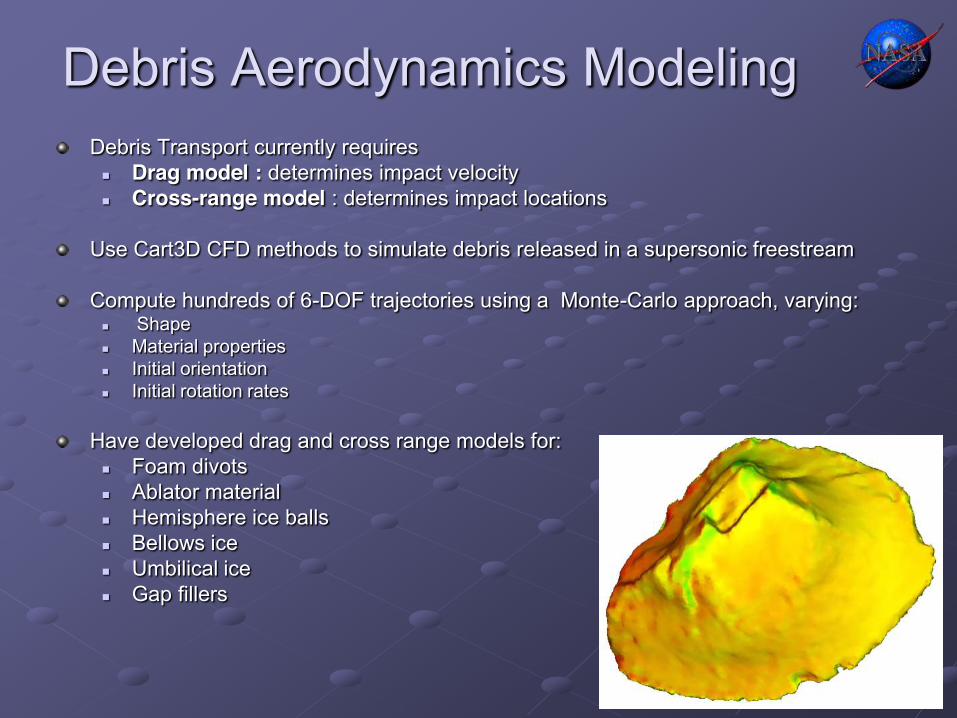
Debris Aerodynamics Modeling Debris Transport currently requires
Drag model : determines impact velocity Cross-range model : determines impact locations
Use Cart3D CFD methods to simulate debris released in a supersonic freestream Compute hundreds of 6-DOF trajectories using a Monte-Carlo approach, varying:
Shape Material properties Initial orientation Initial rotation rates
Have developed drag and cross range models for:
Foam divots Ablator material Hemisphere ice balls Bellows ice Umbilical ice Gap fillers
21
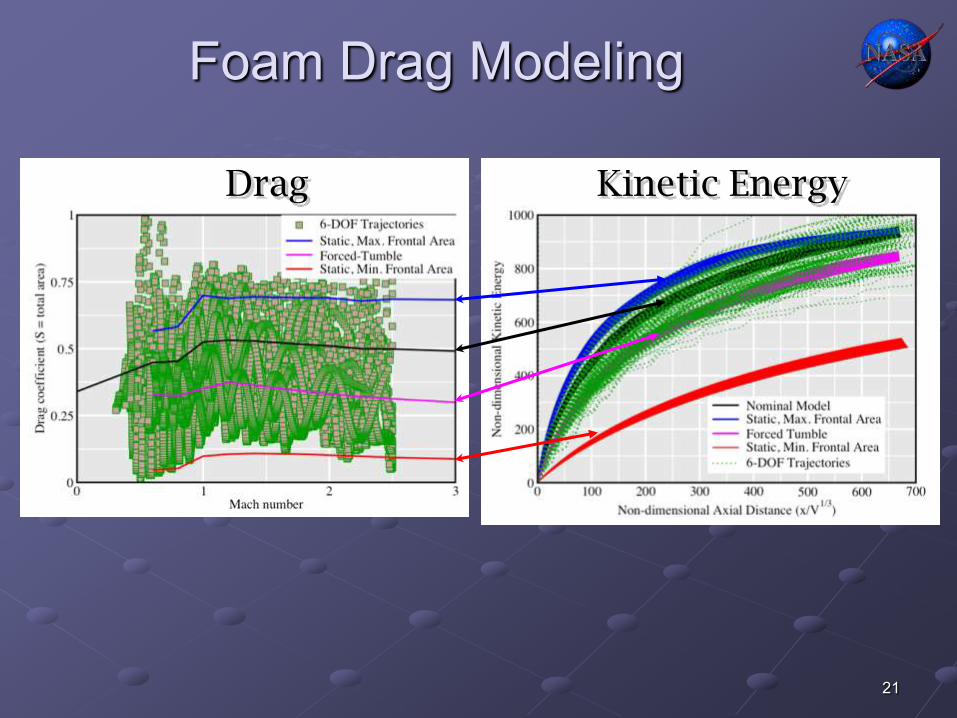
Foam Drag Modeling
Drag Kinetic Energy

22
Foam Cross-Range Model
direction during trajectory (referred to as crossrange). This effect is modeled in a post-processing step. Crossrange cone applied to zero-lift debris trajectories from ballistic code to determine possible impact points.
Drag Model Leads to -
Crossrange Model Provides all possible impact locations
23
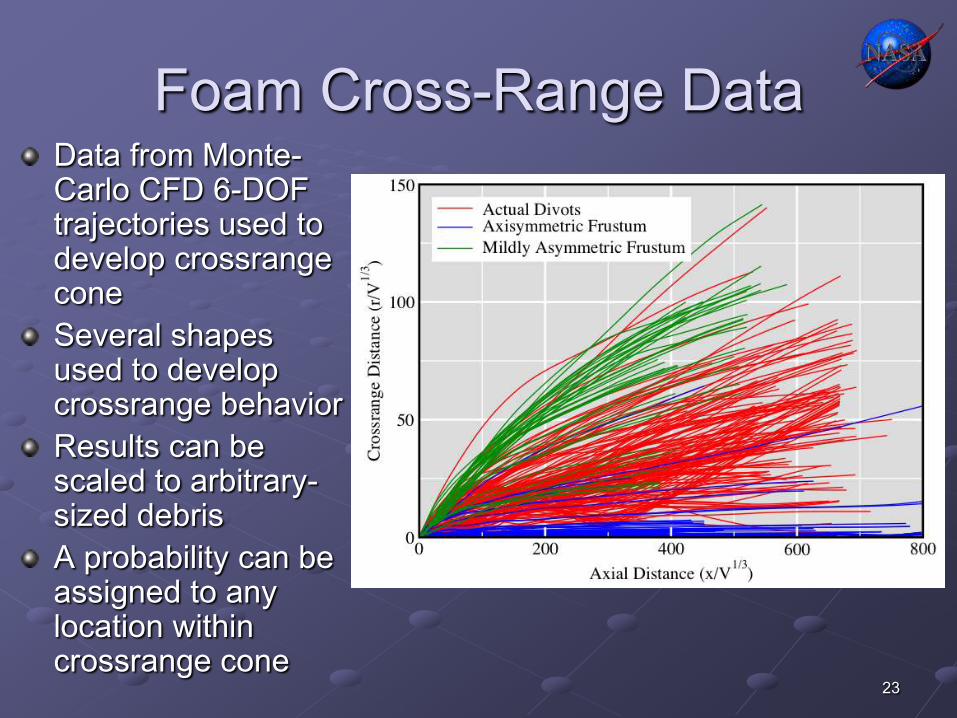
Foam Cross-Range Data Data from Monte-Carlo CFD 6-DOF trajectories used to develop crossrange cone Several shapes used to develop crossrange behavior Results can be scaled to arbitrary-sized debris A probability can be assigned to any location within crossrange cone

24
Validation With Gun Development Facility (GDF) Data
There are two aspects to the validation effort:
Validate the ability of the Cart3D code to simulate a 6-DOF foam trajectory by direct comparison against range data. (validation of CFD method)
Validate the foam drag and cross-range models using the range data. (validation of models)
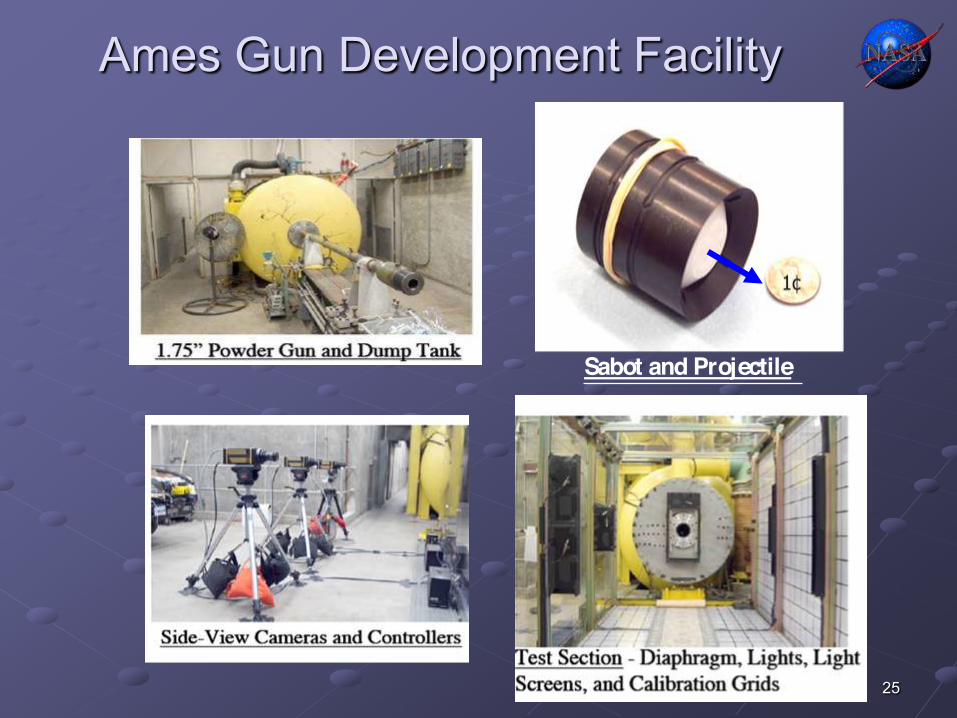
25
Ames Gun Development Facility
Sabot and Projectile

26
6-DOF Method Validation Ames GDF ballistic data Distance vs Time
27
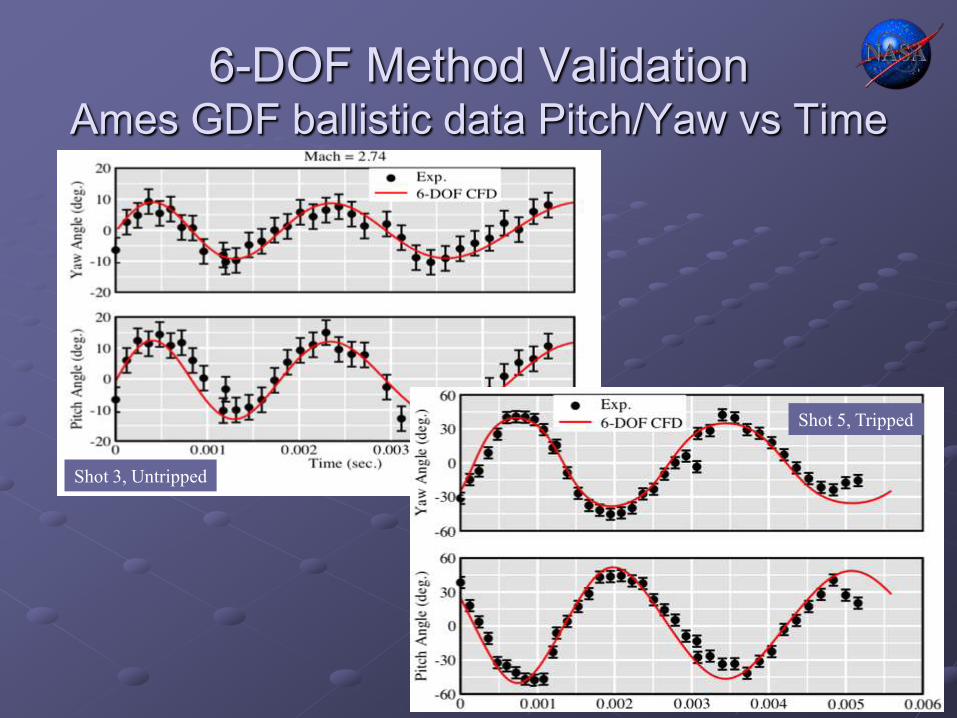
6-DOF Method Validation Ames GDF ballistic data Pitch/Yaw vs Time
Shot 3, Untripped
Shot 5, Tripped

28
Drag Model Validation Low oscillation trajectory - shot 2, Mach = 3.00

29
Drag Model Validation Medium oscillation trajectory - shot 7, Mach = 2.81

30
Drag Model Validation High oscillation trajectory - shot 6, Mach = 2.46

31
Cross-Range Model Validation
Cart3D 6-dof predictions bound ballistic data CFD (all) represents several hundred CFD trajectories generated from offset C.G. and asymmetric models
Even mild asymmetry generates strong crossrange

32
Additional Foam Testing CUBRC supersonic wind-tunnel foam ejection tests DFRC F15 flight ejection tests: 38 divots
31 supersonic divots trimmed in high-drag orientation 5 subsonic divots oscillated or tumbled 2 divots re-contacted and broke apart Deceleration matches nominal foam drag model
f93
f90
f95 f96 f94
f91
f92
5.1 inch divot Mach 3.5 Q 706 psf
7.4 inch divot Mach 3.5 Q 729 psf
33
Updated Launch Commit Criteria
Determine allowable ice-ball size on the External Tank

34
Debris-Transport Analysis Procedure Compute all possible ice-debris trajectories
Release from 7600 locations (blue dots) 35 different masses
Compute impact conditions RCC impact kinetic energy Tile damage depths
Map all impact data back to 1562 different source zones (red-grid cells) In each source zone, determine largest mass which does not exceed component capability
35
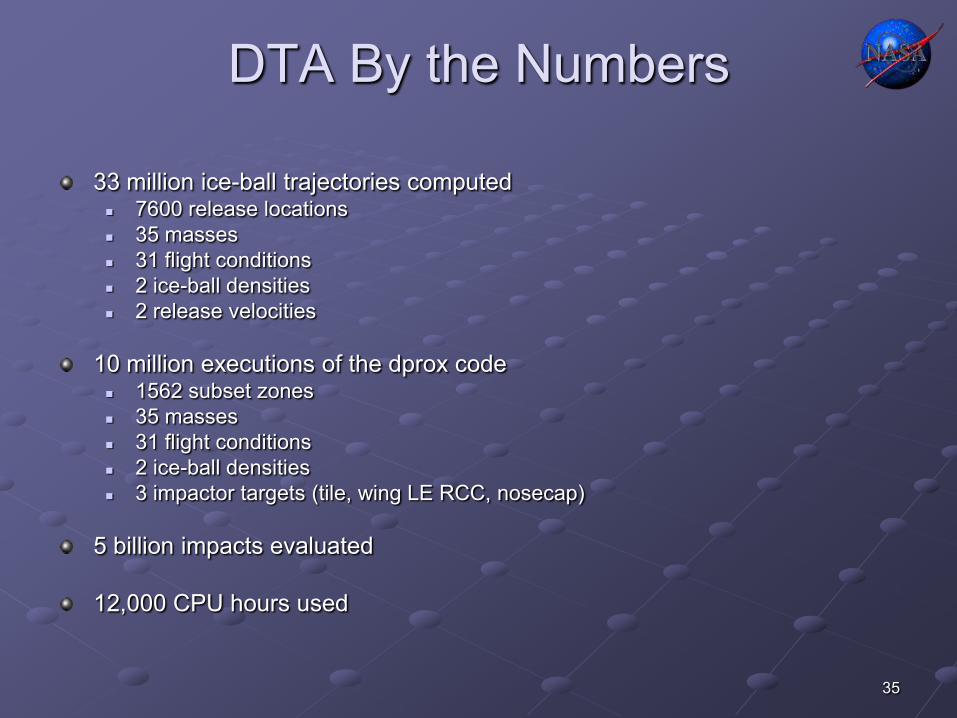
DTA By the Numbers
33 million ice-ball trajectories computed 7600 release locations 35 masses 31 flight conditions 2 ice-ball densities 2 release velocities
10 million executions of the dprox code 1562 subset zones 35 masses 31 flight conditions 2 ice-ball densities 3 impactor targets (tile, wing LE RCC, nosecap)
5 billion impacts evaluated 12,000 CPU hours used

36
Maximum Allowable Ice-Ball Diameters

List of Debris Assessments
ET PAL ramp foam ET Flange foam ET iceballs ET ice/froat ramps ET intertank foam ET feedline bellows ice ET feedline bracket ice SRB Weather-seal SRB phenolic glass SRB Ablator material SRB viton-coated nylon SRB BSM RTV
T0 umbilical ice Orbiter/ET umbilical ice RCS Tyvek covers Tile gap-fillers Orbiter blankets Ceramic inserts SSME Ice Flow-control valves
38
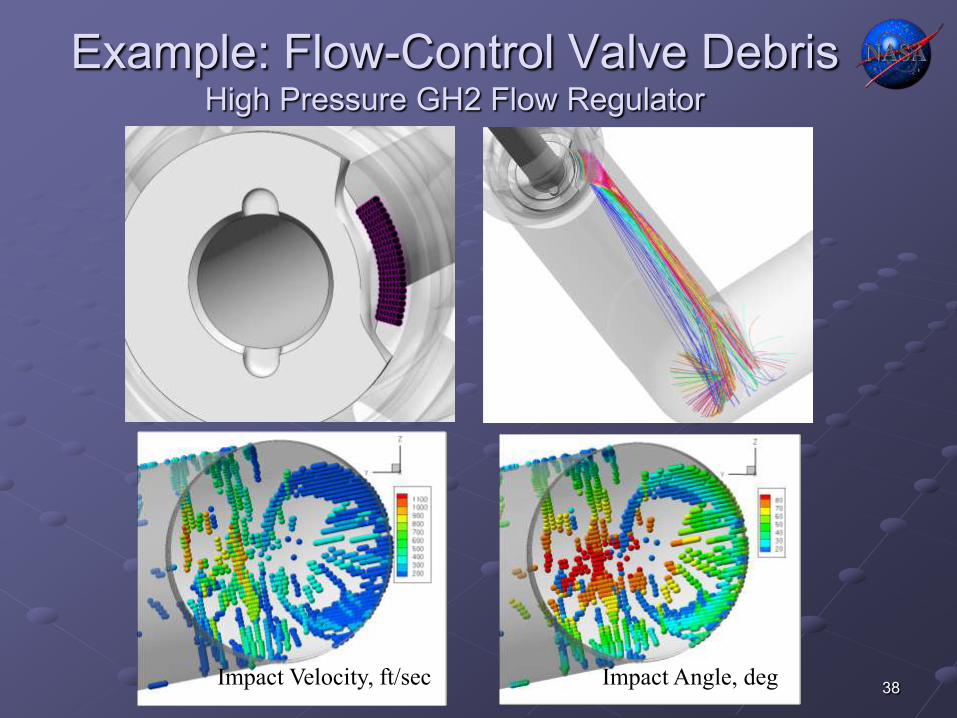
Example: Flow-Control Valve Debris High Pressure GH2 Flow Regulator
Impact Velocity, ft/sec Impact Angle, deg

39
Example: SRB Booster Separation Motor RTV

40
Day of Launch Support Mission Control Center, Johnson Space Center, Houston Debris analysis team spends the hours before the launch making sure the vehicle is ready to fly
Final Inspection Team Dozens of video cameras Looking for ice, cracks in foam, and anything unusual
My job includes being able to simulate potential debris and provide potential impact conditions
Execute debris analysis on NAS computers and produce data in less than an hour

41
Bat Debris

42
Space Bat
43
Concluding Remarks
CFD simulations of SSLV ascent have become a valuable tool for the program
Debris transport simulation has been used to quantify the debris environment during ascent
Helped the program focus on mitigation of the most dangerous debris sources Make certain that the vehicle will only launch in a safe configuration

44
The End
Related Documents