getting hands-on experience with aerodynamic deterioration A PERFORMANCE AUDIT VIEW Flight Operations Support - Customer Services Directorate

Welcome message from author
This document is posted to help you gain knowledge. Please leave a comment to let me know what you think about it! Share it to your friends and learn new things together.
Transcript
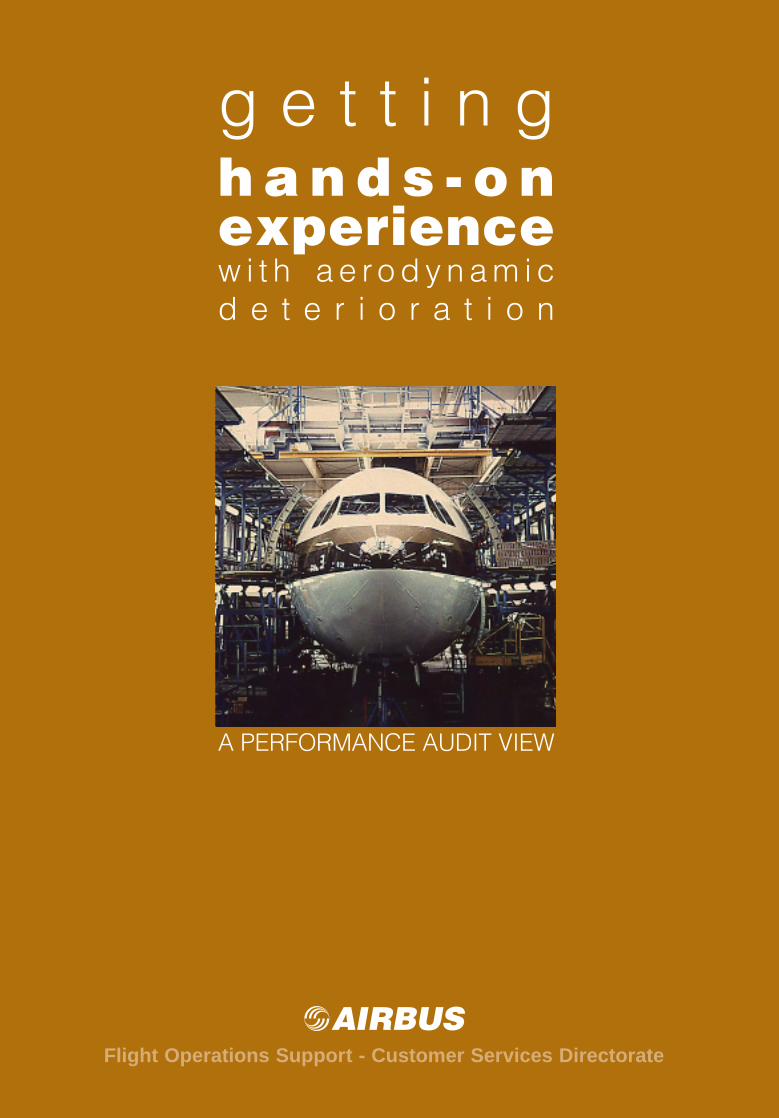
g e t t i n gh a n d s - o nexperiencew i t h a e r o d y n a m i c d e t e r i o r a t i o n
A PERFORMANCE AUDIT VIEW
Flight Operations Support - Customer Services Directorate
get
ting
h
an
ds-
on
ex
pe
rie
nc
ew
ith a
erod
ynam
ic
det
erio
ratio
n
10
/ 2
00
1 -
IS
SU
E 2

STL 945.3399/96 October 2001 Issue 2
Flight Operations Support & Line Assistance
GETTING HANDS-ON EXPERIENCE
W I T H A E R O D Y N A M I C D E T E R I O R A T I O N
A PERFORMANCE AUDIT VIEW


ii
PreambleToday's tough competitive environment forces airlines to reduce their operational
costs in every facet of their business. All ways and means to achieve this goal have to berationally envisaged, safety being of course the prime factor in any airline operation. A widevariety of different aspects have to be taken into consideration in this process, such as airlineeconomics, airline management, flight operations, maintenance management, technicalcondition of aircraft.
The purpose of this document is to examine the influence of the latter with respect toaerodynamic deterioration.
The manufacturer does his utmost from the development onwards by foreseeing allpotential deteriorations and by adopting less sensitive designs. This goes on in service life bycontinuous development and modification programmes, the aim being to keep the aircraft ingood condition as efficiently as possible. Unfortunately, in the life of an aircraft, normal orabnormal degradations are likely to occur. An aircraft is normally expected to have its dragincreased by up to 2 % within five years. Indeed, many aerodynamic elements may sufferextra drag and their cumulative effect can result in a significative fuel consumption increaseand associated fuel bill.
Systematically adopting corrective measures to repair these items inevitably leads toexcessive maintenance costs. Therefore, the effect of aerodynamic deteriorations has to betraded against the estimated maintenance cost to establish whether it is cost-effective tocarry out corrective measures or not. Cost-benefit analyses are thus the only practical way toapproach the topic of aerodynamic deterioration, at least when keeping an eye on bothoperational efficiency and technical realism.
Airbus has carried out numerous performance audits in cooperation with airlineswhich, implicitly, have made a very useful contribution in preparing this brochure. Theinformation contained in this brochure aims to help you adapt your maintenance programs,balancing out financial aspects, such as increased fuel consumption, against maintenancecosts. It should enable operators determine whether corrective actions are financiallypertinent, despite short-term maintenance costs. Considerable longer term expense maythus be avoided at relatively low cost. And strategic maintenance actions rather thandetailed, dispersed and costly repair jobs may be more easily decided upon as well as betterjustified.
Would you please sent your comments and remarks to the following contact point atAIRBUS. These will be taken into account in the following issues to be edited.
Flight Operations Support & Line AssistanceCustomer Services Directorate1, Rond Point Maurice Bellonte, BP 3331707 BLAGNAC Cedex - FRANCETELEX AIRBU 530526ESITA TLSBI7XTELEFAX 33/(0)5 61 93 29 68 or 33/(0)5 61 93 44 65


iv
CONTENTS
1. GENERAL 11.1 Aerodynamic deterioration 1
1.1.1Sensitivity classification 11.1.2Fuel penalty calculation 1
1.2 Airframe maintenance 71.3 Adapted maintenance programme 7
2. LISTED ITEMS 92.1 Misrigging of control surfaces 92.2 Absence of seals on movable sections 122.3 Missing parts 132.4 Mismatched doors 142.5 Missing door seal section 152.6 Surface deterioration 16
2.6.1Skin roughness 162.6.2Skin dents 172.6.3Unfilled butt joint gap 172.6.4Conclusion 18
2.7 Consequences of hasty repairs 182.7.1Overfilled butt joint gap 182.7.2External patches 192.7.3Paint peeling 192.7.4Conclusion 20
2.8 Engine cowling 20
3. A300/A310/A300-600 FAMILY 233.1 Misrigging of control surfaces 273.2 Absence of seals on movable sections 353.3 Missing parts 413.4 Mismatched surfaces 43

v
3.5 Door seal leakage 483.6 Surface deterioration 54
3.6.1Skin roughness 543.6.2Skin dents 583.6.3Unfilled butt joint gaps 61
3.7 Consequences of hasty repairs 633.7.1Overfilled butt joint gaps 633.7.2External patches 663.7.3Paint peeling 69
4. A319/A320/A321 FAMILY 754.1 Misrigging of control surfaces 794.2 Absence of seals on movable sections 884.3 Missing parts 914.4 Mismatched surfaces 934.5 Door seal leakage 974.6 Surface deterioration 100
4.6.1Skin roughness 1004.6.2Skin dents 1014.6.3Unfilled butt joint gaps 103
4.7 Consequences of hasty repairs 1064.7.1Overfilled butt joint gaps 1064.7.2External patches 1084.7.3Paint peeling 110
5. A330/A340 FAMILY 1155.1 Misrigging on control surfaces 1185.2 Absence of seals on movable sections 1215.3 Missing parts 1285.4 Mismatched surfaces 1305.5 Door seal leakage 1365.6 Surface deterioration 139
5.6.1Skin roughness 1395.6.2Skin dents 1415.6.3Unfilled butt joint gaps 143
5.7 Consequences of hasty repairs 1455.7.1Overfilled butt joint gaps 1455.7.2External patches 1475.7.3Paint peeling 149
6. CONCLUSION 153

1. GENERAL


1
1.1 Aerodynamic deterioration
Some of the most severe penalties in terms of fuel consumption are caused byincreased drag resulting from poor airframe condition. Normal aerodynamic deterioration ofan aircraft over a period of time can include the incomplete retraction of moving surfaces,damaged seals on control surfaces, skin roughness and deformation due to bird strikes ordamage caused by ground vehicles, chipped paint, mismatching doors and excessive gaps.All these items are potential money wasters. Each deterioration incurs drag increase, andthis increased drag is accompanied by increased fuel consumption.
1.1.1 Sensitivity classification
The fuel burn penalty caused by drag-inducing items is largely dependent upon thelocation and extent of the problem; different areas of the airframe are more or are lesssensitive to alterations in their optimum aerodynamic smoothness. Bearing this in mind, azonal classification can be established for drag sensitivity over the whole aircraft.«Zone 1 » areas require high aerodynamic smoothness because they are endowed with highlocal flow velocities and very thin boundary layers which are very sensitive to small localdisturbances. «Zone 3» areas are much less sensitive because of lower flow velocities andthicker boundary layers, and disturbances on these parts of the airframe do not produce highaerodynamic resistance to the airflow. Also, the transition from laminar to turbulent boundarylayers having occurred earlier, «Zone 3» is less sensitive to aerodynamic irregularities orexcrescences. Finally, «Zone 2» areas represent an average between these two extremes.
The localisation of Zones 1, 2 and 3 for Airbus Industrie aircraft are shown in the fol-lowing figures (A300, A310, A320, A330, A340) on pages 2-6.
1.1.2 Fuel penalty calculation
It is possible to determine drag increases, generated by particular items with wind-tunnel measurements or analytical techniques. The drag increase is then converted intoterms of increased fuel burn - in US gallons per year per aircraft - but the reader must keep inmind that values given correspond to an aircraft which is in accordance with specificassumptions. These assumptions refer to each type of aircraft of the three Airbus familiesand include annual flight hours based on airline statistics.
The drag increase can also be expressed in US$ per year per aircraft, the fuel pricebeing estimated at US$0.60 per gallon. Since calculation assumptions may vary significantlyamong individual operators, tables giving a corrective factor - to apply to the fuel penalty tobe derived from the operator's annual flight hours - will be given for each type of aircraft.

2
A300
DEGREE OF SMOOTHNESS
ZONE 1 High SensitivityZONE 2 Medium SensitivityZONE 3 Low Sensitivity

3
A310
DEGREE OF SMOOTHNESS
ZONE 1 High SensitivityZONE 2 Medium SensitivityZONE 3 Low Sensitivity

4
A320
DEGREE OF SMOOTHNESS��������������������������������������������������������
ZONE 1 High SensitivityZONE 2 Medium Sensitivity

5
A330
DEGREE OF SMOOTHNESS
ZONE 1 High SensitivityZONE 2 Medium SensitivityZONE 3 Low Sensitivity

6
A340
DEGREE OF SMOOTHNESS
ZONE 1 High SensitivityZONE 2 Medium SensitivityZONE 3 Low Sensitivity

7
1.2 Airframe maintenance
For a specific corrective task, manhours required can significantly vary from one air-line to another, and from one type of repair to another. The calculation method adopted inthis document is simply an estimation partly based on measurements. These tasks shouldhave been carried out assuming a regularly maintained aircraft, operated under normalconditions and with an average daily utilisation, having maintenance/corrective actionscarried out in a hangar with good environmental conditions. All necessary standard andspecial tools, as well as ground support equipment, skilled maintenance personnel andappropriate maintenance documentation should also be available. The values presentedbelow (men and manhours) are based on these assumptions and are intended to reflectoperational reality as closely as possible.
Total maintenance costs, for both on-aircraft and shop tasks, include overhead andburden costs for maintenance planning, engineering orders, safety equipment, facilities andsupervision. An acceptable rate per manhour covering all these aspects is US$50. Servingas a benchmark, this value corresponds to an average cost covering skilled personnel wor-king.
1.3 Adapted maintenance programme
As stated above, the degradations that are likely to occur stem from two mainsources (excluding incidents or handling) : either mechanical wear or corrective actionswhich have not been properly executed. Although ill-considered or superficial repair mayhave negligible effect on performance, some tasks have to be carried out with special care,given their positive impact on fuel consumption.
As mentioned before, despite the efforts of maintenance organisations andmanufacturers, deterioration can occur. It may have significant effects on consumption inspite of having only a slight influence on drag. One way to determine these effects is to usethe Aircraft Performance Monitoring (APM) software. This programme calculates deviationsin Specific Range and, to some extent, helps to determine how much these discrepanciesstem from engine degradation and how much from a lack of aerodynamic cleanliness.Inherently, the program does not really differentiate between apparent and real drag.
For instance, higher drag may be concluded from APM results but could, in fact,reflect lower thrust at N1 (or EPR). Also bleed leaks can affect apparent aerodynamicdeterioration through N1 deviations by biasing the N1/thrust relationship if they are notaccounted for. For these reasons, values given by the APM software have to be consideredwith great care.
Nevertheless, it can trigger an alarm at a predetermined loss of Specific Range if inrelation to the initial aircraft drag condition, and an unscheduled check could be launched todetect the type and location of any drag rise. This unscheduled check could be like a linecheck walkaround associated with an overwing in-flight check observing and photographingcontrol surfaces, preferably by means of a telephoto or zoom lens. The association of bothtypes of check constitutes an «Aerodynamic Inspection». The items to be observed arereviewed and listed in the following tables. This Aerodynamic Inspection, which would takeonly a short time to perform, should be done by skilled personnel as for exampleaerodynamics or performance engineers, able to interpret secondary effects (e.g. leakages)

8
and to determine the corresponding deviations (as well as being able to conduct performanceaudits).
When both the type and extent of the deterioration are known, the following tablescould be used to determine what should be repaired and what may be ignored, for financialreasons. Repair times should be scheduled during nights-time periods, time permitting,otherwise the task has to be included in a scheduled check.
The Aircraft Performance Monitoring software has the advantage of potentiallytriggering an Aerodynamic Inspection just when it seems to be needed, thus avoidingpointless inspection.
If the APM software is not used, the Aerodynamic Inspection could be scheduled, forinstance, at the occasion of a «C check».
Although this approach may confirm discrepancies, not all might be identified. In thiscase direct measurements in the suspected area should be made, such as prescribed in theAircraft Maintenance Manual. This second way is more expensive but it may offer better dragreduction results.
In a third stage, if the drag reduction seems insufficient, the airline may then askAirbus for a Performance Audit.
These three approaches should help any airline to alleviate excessive fuelconsumption.

2. LISTED ITEMS


9
2. LISTED ITEMS
These lists are not exhaustive; they simply correspond to the main airframedeteriorations or misrigged surfaces.
The purpose of the following paragraphs is to give a fuel penalty / maintenance costcomparison and to propose an existing or suggested method in order to ensure that there areno discrepancies.
Values given in this particular section correspond to the smaller fuel penaltiesapplicable to all Airbus Industrie aircraft. They are intended to make the reader moresensitive to fuel penalties / maintenance cost comparison and to sort out a few generalconclusions which pertain to all Airbus Industrie aircraft.
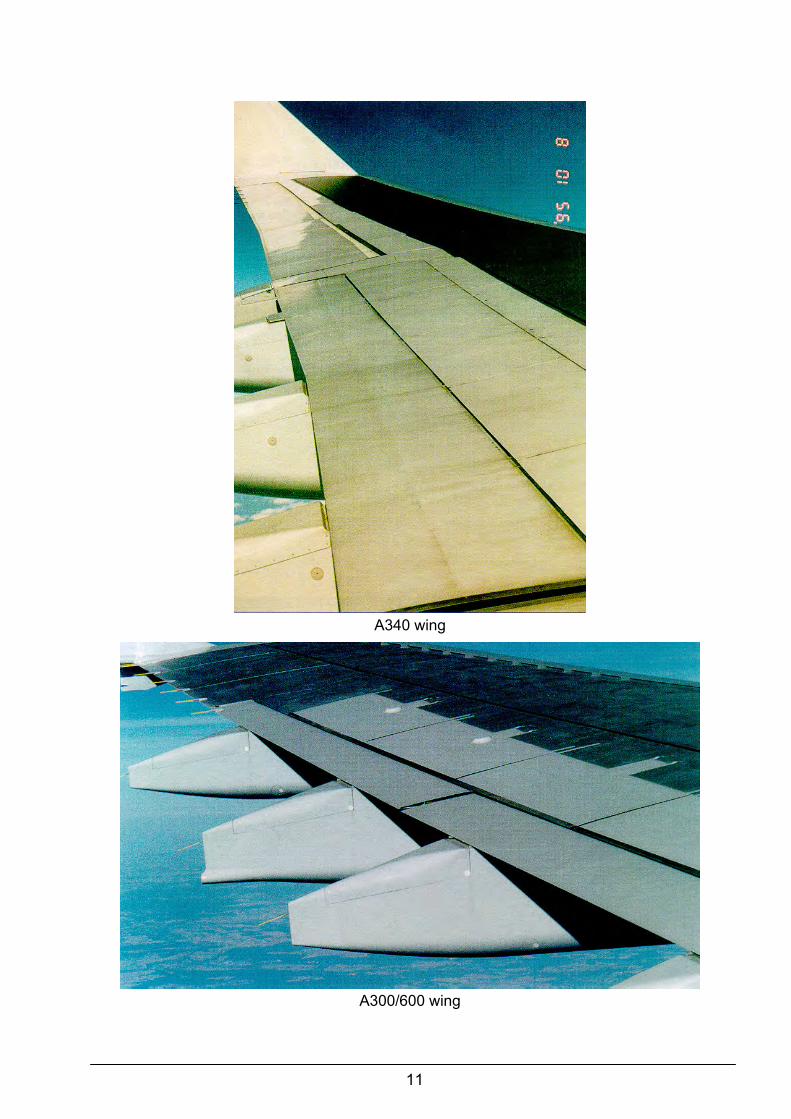
2.1 Misrigging of control surfaces
These items correspond to specific control surfaces misrigging. They incur one of thelargest fuel penalties, while the cost of the corrective actions, by comparison, is negligible.Indeed, one spoiler extended by 15mm over a 1 metre spanwise length leads to more thanUS$ 5,000 penalty per aircraft per year. Similarly, an outboard slat misrigging causes nearlyUS$ 11,000 penalty per aircraft per year. Furthermore, flap misrigging - or especially ruddermisrigging - can lead to a slightly lower, but still considerable, fuel penalty. Another sensitiveitem which is generally forgotten is misalignment at a flap track fairing which may cost nearlyUS$ 1,000 per aircraft per year.
The Aerodynamic Inspection could be done in flight, simply by a visual inspectionfrom the passenger compartment and by photographing control surfaces by means of atelephoto or zoom lens.
For a misrigged control surface, the associated corrective action cost is negligibleand should indeed be undertaken.

10
A300 wing
A310 wing
A320 wing
11
A340 wing
A300/600 wing
12
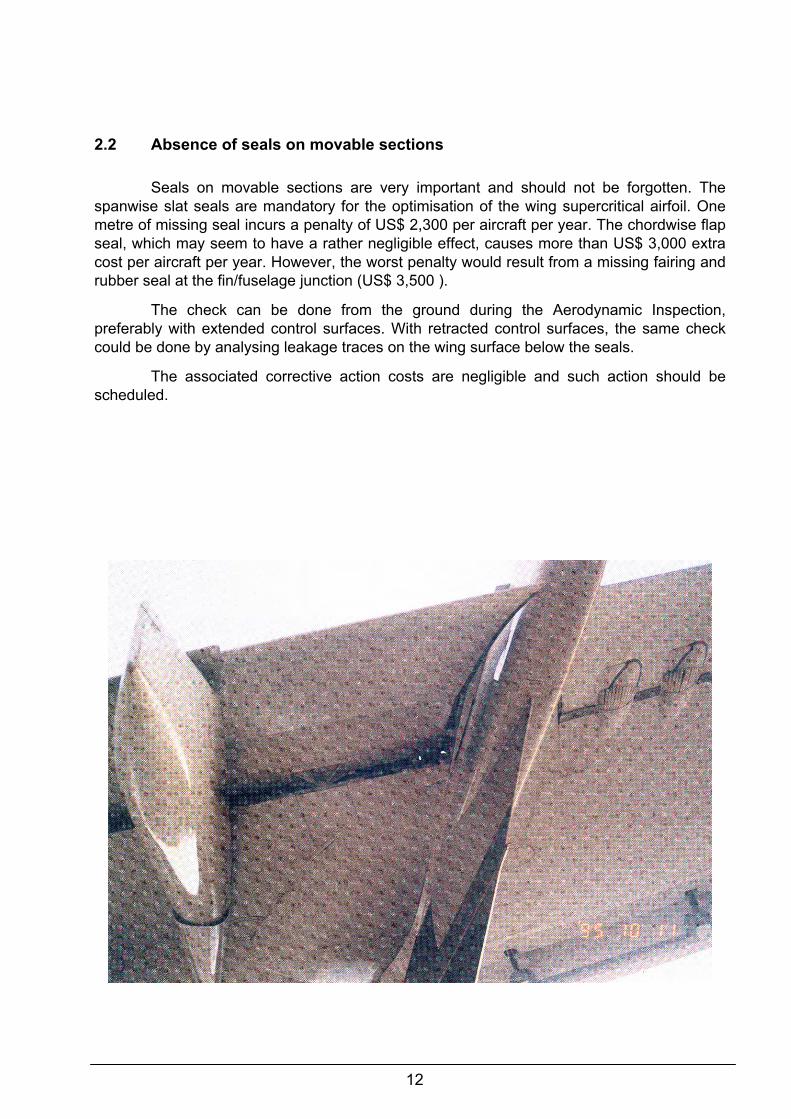
2.2 Absence of seals on movable sections
Seals on movable sections are very important and should not be forgotten. Thespanwise slat seals are mandatory for the optimisation of the wing supercritical airfoil. Onemetre of missing seal incurs a penalty of US$ 2,300 per aircraft per year. The chordwise flapseal, which may seem to have a rather negligible effect, causes more than US$ 3,000 extracost per aircraft per year. However, the worst penalty would result from a missing fairing andrubber seal at the fin/fuselage junction (US$ 3,500 ).
The check can be done from the ground during the Aerodynamic Inspection,preferably with extended control surfaces. With retracted control surfaces, the same checkcould be done by analysing leakage traces on the wing surface below the seals.
The associated corrective action costs are negligible and such action should bescheduled.

13
2.3 Missing parts
Missing parts are given in the Configuration Deviation List showing missing partswhich must be replaced as soon as possible. The tables shown on pages 41, 91 and 128,provides adequate motivation to shorten this delay.
Service door

14
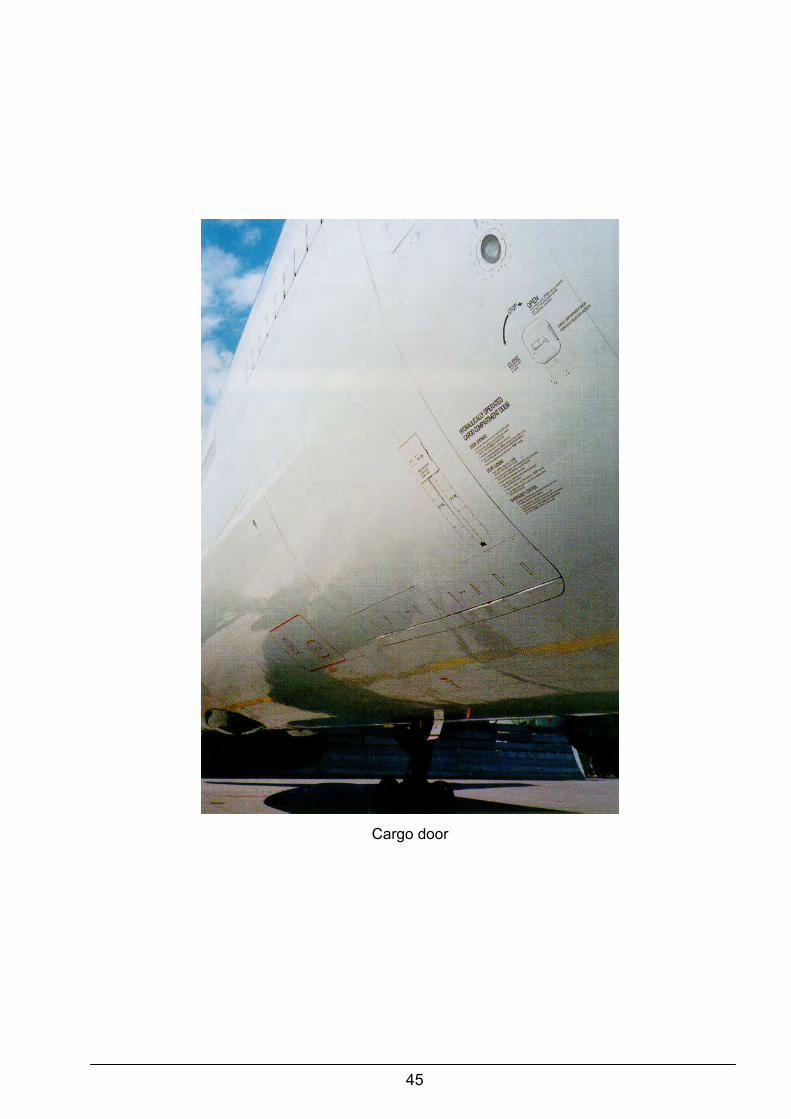
2.4 Mismatched doors
A step on the forward fuselage surface is much more penalising than one on therear. Misalignment of forward doors must be monitored very carefully; a 10mm forward cargodoor step imposes a US$ 2,300 annual penalty, although the associated corrective actioncosts US$ 650.
During the Aerodynamic Inspection, the door can be checked by standing under itand observing the line where it meets the fuselage. Due to pressurisation, the door must beslightly out of flush with the fuselage. In other words, the door must be 2-3 mm inside thefuselage when checked on the ground.
The decision - to repair or not - is not easy, knowing that an estimated rigging costcould be much higher, especially if insufficiently skilled personnel are available. The decisionis a matter of judgement by each operator.
Passenger door

15
2.5 Missing door seal section
A missing door seal section has two effects: it disturbs the external flow and causesa slight leakage which has to be compensated for by an increase in engine compressor airbleed. In addition to the fuel penalty, a stress-provoking low-frequency whistling sound isaudible in the cabin which could possibly annoy passengers.
Preferably, the inspection should be done with the door opened, looking fordamaged sections of the seal. With a closed door, the same verification could be done simplyby analysing dirt traces on the fuselage.
Since this leakage may increase with time, even if corrective actions are quiteexpensive, this work should be implemented to remove the risk of further deterioration whichwould lead to the aircraft being grounded eventually.
Passenger door seal
16
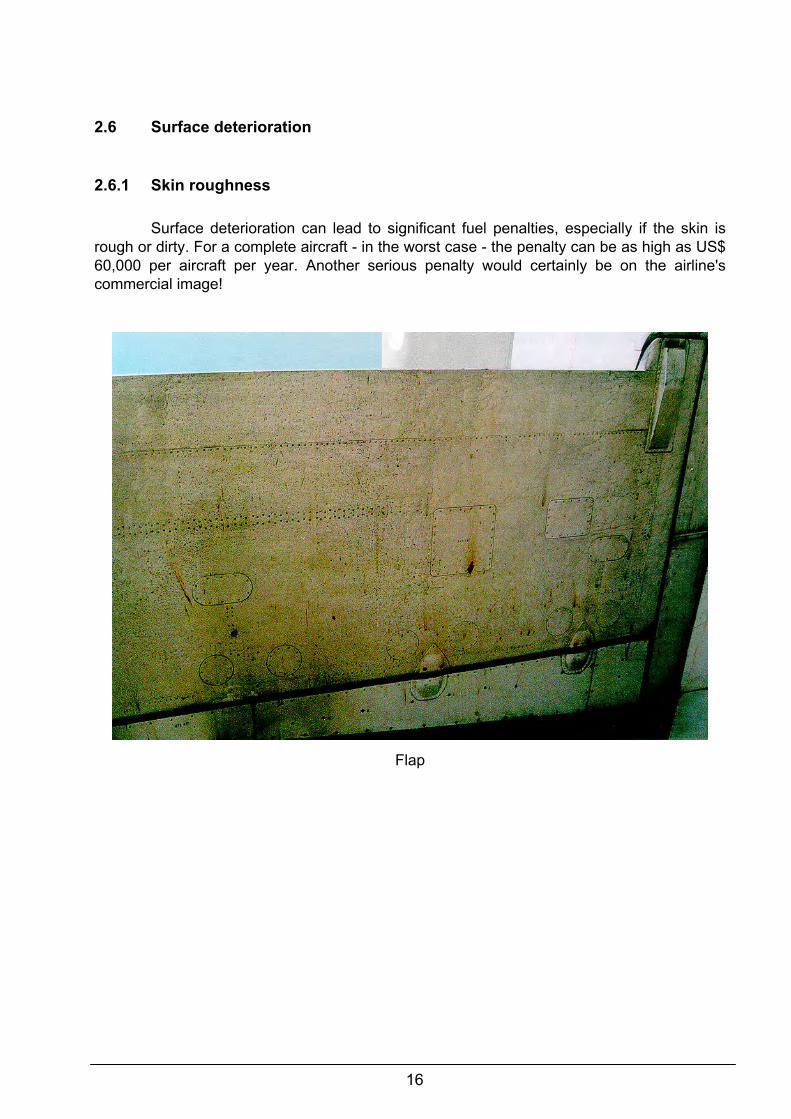
2.6 Surface deterioration
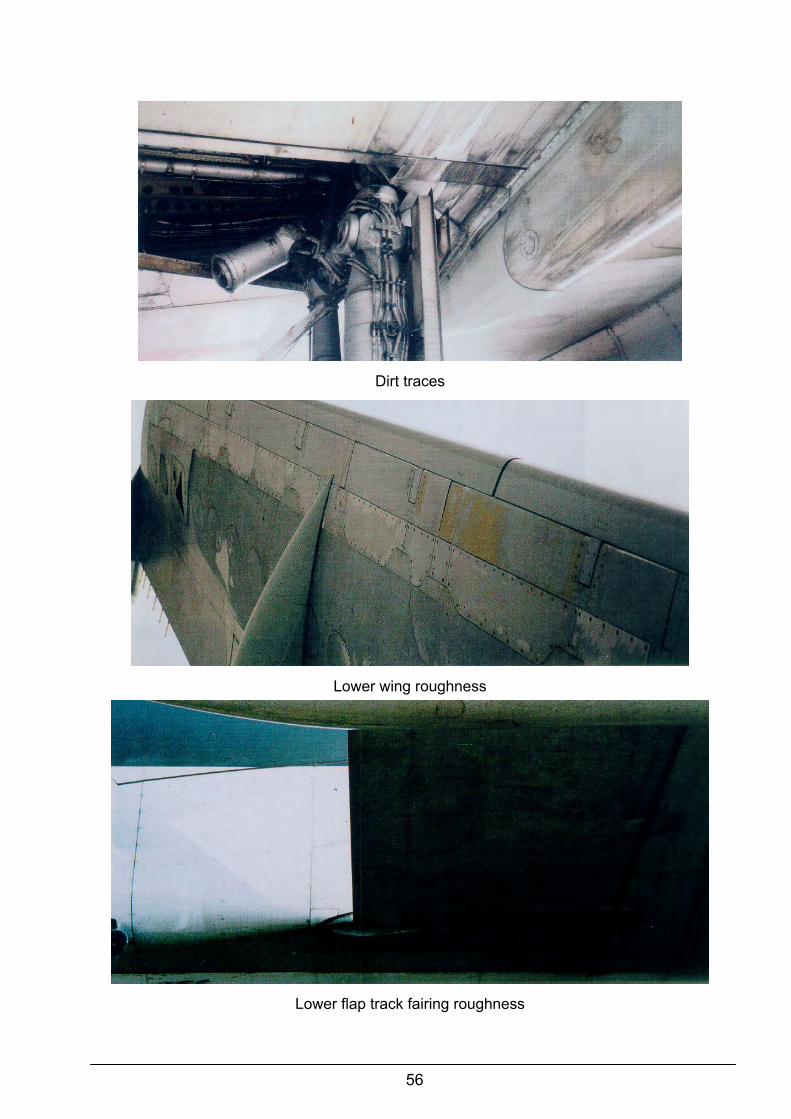
2.6.1 Skin roughness
Surface deterioration can lead to significant fuel penalties, especially if the skin isrough or dirty. For a complete aircraft - in the worst case - the penalty can be as high as US$60,000 per aircraft per year. Another serious penalty would certainly be on the airline'scommercial image!
Flap

17
2.6.2 Skin dents
Simple dents also cause some fuel penalty which are not costly in terms of fuelconsumption (US$ 100 per aircraft per year in the worst case) but are very expensive torepair. If the dent is within the Structural Repair Manual tolerances, no action is necessary forpurely aerodynamic reasons.
With repeated «loaders' assaults», scuff plates are frequently dented and generallypresent a step, generating high fuel penalties, but corrective actions are not particularlytime-consuming.
Dented scuff plate
2.6.3 Unfilled butt joint gap
Unfilled butt joint gaps in aircraft skins are not very expensive in terms of excess fuelconsumption ( US$22 per aircraft per year in the worst case).
Missing seal on the wing / pylon junction

18
2.6.4 Conclusion
Manhours for structural repairs must be determined with great care becausesignificant differences exist, mainly depending upon the exact location of the deterioration.
All these discrepancies can be observed very easily from the ground during theAerodynamic Inspection.
The decision whether or not to rectify a loss of surface smoothness is not easy andis a matter of judgement by each operator.
2.7 Consequences of hasty repairs
Sometimes, in an operational environment, the purpose of a repair is simply to keepthe aircraft in service and to avoid grounding it. Repairs may have been done without takinginto account the consequences of increased fuel consumption.
2.7.1 Overfilled butt joint gap
If a butt joint gap is overfilled, the penalty can be significant on the wing uppersurface ( US$330 ). The tables, corresponding to each aircraft type, show that a repair whichis not properly carried out can lead to a heavier fuel penalty than existed prior to the repair(from US$14 per aircraft per year for an unfilled butt joint gap to US$500 for an overfilled gapon the upperwing in the sensitive «Zone 1»).
Overfilled seal on the wing / belly fairing junction

19
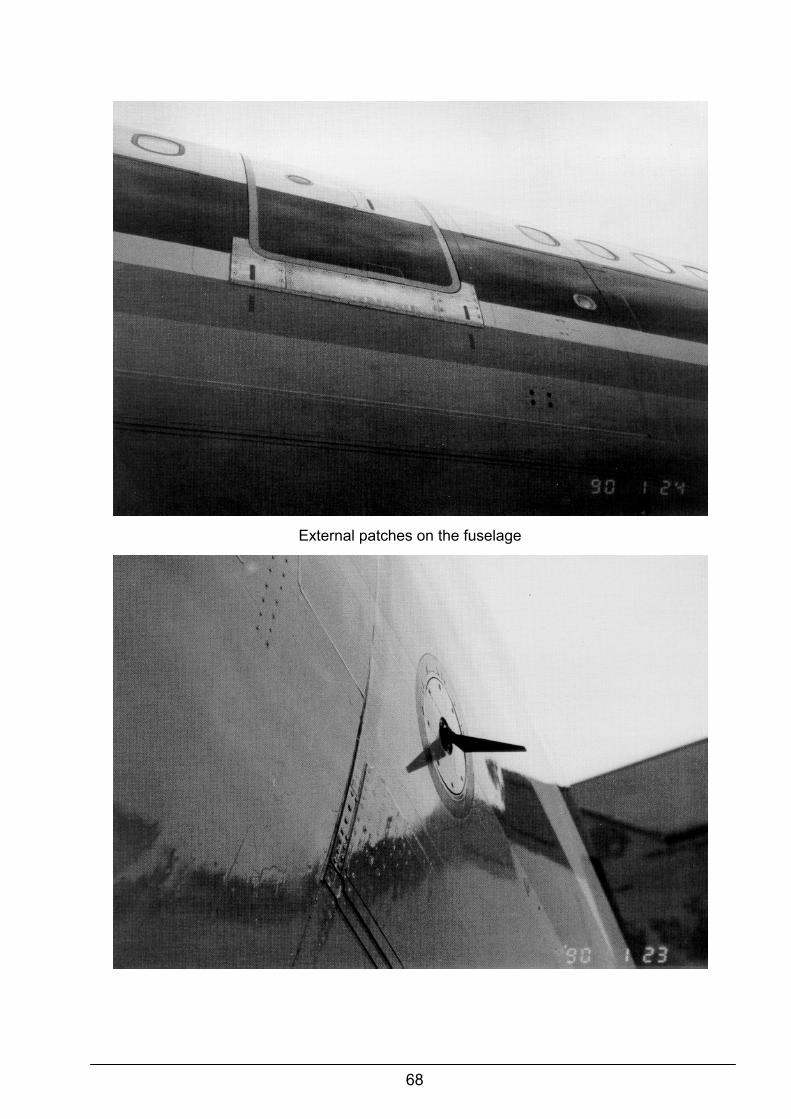
2.7.2 External patches
In the same way, external patches induce more drag, especially on the wing uppersurface ( US$640 ). It is normally difficult to replace an external patch by an internal one, butif access has already been gained during an inspection, installing an internal patch could bepreferable, since it also has less impact on an airline's commercial image.
External patches on the fuselage
2.7.3 Paint peeling
On the other hand, for visually improving the commercial image, some fleets areoften hastily repainted without bothering to properly prepare the surface. Additional paintlayers cause increased aircraft weight and the surface is less smooth due to paint steps.Over a short time, paint may peel, with dramatic drag effects, and severe risk of corrosion.
In order to prevent paint problems, proper preparation has to be carried out beforeany refresher coat is applied.
Manhours for painting have also to be determined with great care because groundtime due to paint drying has much more effect on aircraft operation than the simple manhourcost by itself.
Belly fairing

20
2.7.4 Conclusion
The Aerodynamic Inspection will identify all of these items, but the decision whetherto repair or not will, perhaps, not be an obvious one.
2.8 Engine cowling
The engine cowling, due to its location in a very sensitive zone, has to be observedwith great care during the Aerodynamic Inspection. All surface discrepancies incurconsiderable drag.
Another item, which is less obvious because it is hidden, is reverser air bleed. Theassociated fuel penalty is very large. Nevertheless, it can be observed by leakages on theengine cowling.
No values have been calculated for this penalty.
Reverser door seal

21
Engine step
leakage traces

22
Distance due to leakage
Step on engine cowl

3. A300/A310/A300-600 FAMILY


23
3. A300/A310/A300-600 FAMILY
The three aircraft of this widebody family have very similar airframes. Values givenare best estimates for each aircraft.
As a simple fact, the higher the flight hours, the greater is the effect of aerodynamicdeterioration on fuel consumption. For that reason, assumptions about flight hours per yearare very important and can cause considerable differences, depending on each individualcase. Based on data reported by all Airbus operators, the following flight hours (FH) per yearper aircraft were assumed based on 1995 data.
FH / Year Nominal Consumption USGAL / Year
A300 2200 12450A310 3200 14600
A300/600 2600 13700
Drag penalty values for each item are given in the tables on pages 28 to 69,representing an average for the whole widebody family and have determined considering afictive airplane which in average Burns 13100 US Gallons / Year.
The manhours required for each item are given as a guideline.
The accuracy is high enough to allow a comparison between fuel burn penalties andthe associated maintenance costs.
Corrective factor for drag penalty
If there is a need to determine aircraft fuel penalties with greater accuracy and/or ifthe airline has a different aircraft utilisation, corrective factors to apply to the yearly fuelpenalty (in US gallons or US$) can be introduced in relation to the annual aircraft utilisation.
This corrective factor takes into account the geometrical differences compared to thefictive airplane used to determine the drag penalty values as well as the operationaldifferences (nbr of flying hours per year and associated fuel consumption/hours)
A300 Family
0.5
0.75
1
1.25
1.5
1.75
2
1500 2000 2500 3000 3500 4000Annual Aircraft Utilization (Hrs)
Drag Corrective
FactorA300 A300-600 A310

24
A300

25
A310

26
A300-600

27
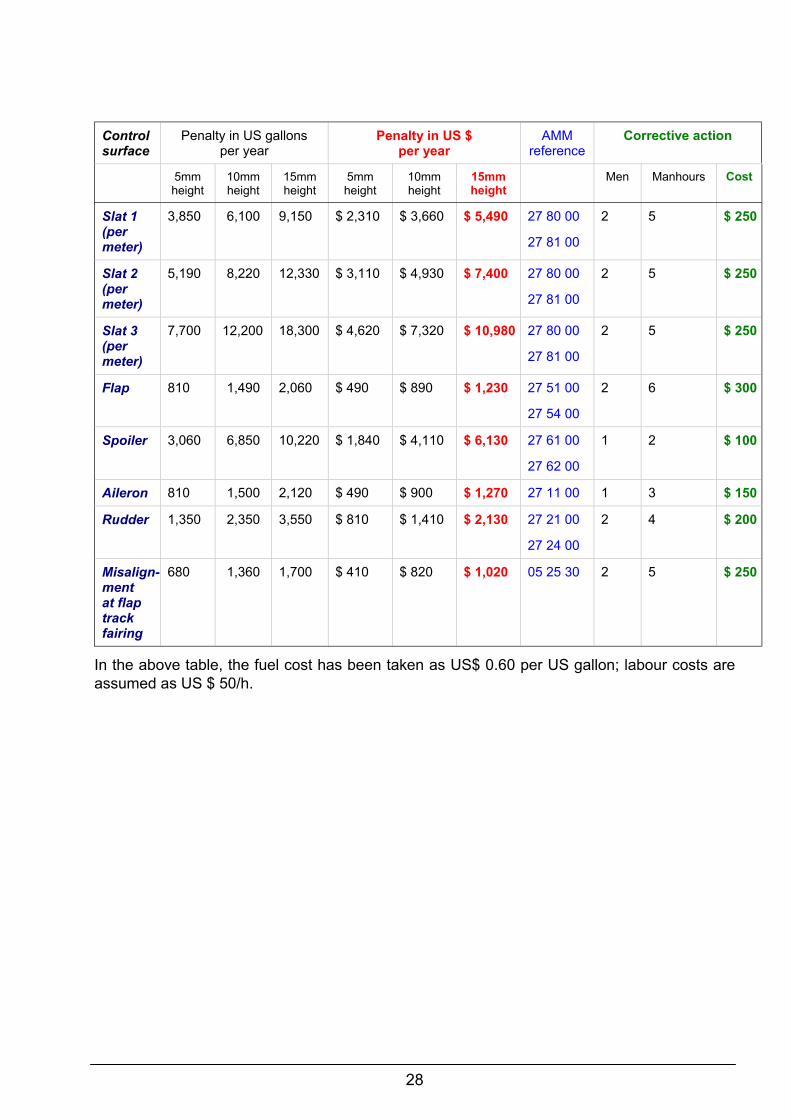
3.1 Misrigging of control surfaces
These items correspond to a specific control surface misrigging. The penalty isexpressed by the difference in height at the control surface trailing edge between themisrigged and the correct position. The penalty corresponds to a one meter length of surfacemisrigging.
28
Controlsurface
Penalty in US gallonsper year
Penalty in US $per year
AMMreference
Corrective action
5mmheight
10mmheight
15mmheight
5mmheight
10mmheight
15mmheight
Men Manhours Cost
Slat 1(permeter)
3,850 6,100 9,150 $ 2,310 $ 3,660 $ 5,490 27 80 00
27 81 00
2 5 $ 250
Slat 2(permeter)
5,190 8,220 12,330 $ 3,110 $ 4,930 $ 7,400 27 80 00
27 81 00
2 5 $ 250
Slat 3(permeter)
7,700 12,200 18,300 $ 4,620 $ 7,320 $ 10,980 27 80 00
27 81 00
2 5 $ 250
Flap 810 1,490 2,060 $ 490 $ 890 $ 1,230 27 51 00
27 54 00
2 6 $ 300
Spoiler 3,060 6,850 10,220 $ 1,840 $ 4,110 $ 6,130 27 61 00
27 62 00
1 2 $ 100
Aileron 810 1,500 2,120 $ 490 $ 900 $ 1,270 27 11 00 1 3 $ 150
Rudder 1,350 2,350 3,550 $ 810 $ 1,410 $ 2,130 27 21 00
27 24 00
2 4 $ 200
Misalign-mentat flaptrackfairing
680 1,360 1,700 $ 410 $ 820 $ 1,020 05 25 30 2 5 $ 250
In the above table, the fuel cost has been taken as US$ 0.60 per US gallon; labour costs areassumed as US $ 50/h.

29
Misrigged slats
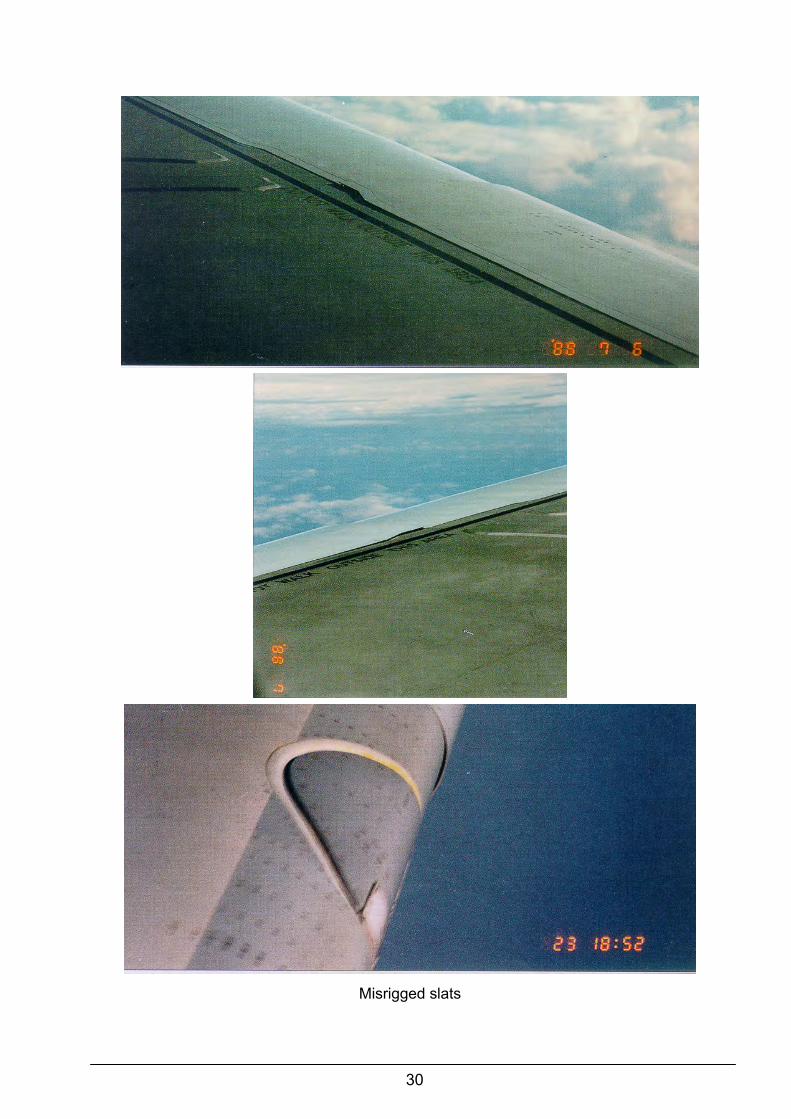
30
Misrigged slats

31
Misrigged slats

32
Misrigged slats

33
Misrigged spoiler
Misrigged spoiler

34
Misrigged flap
Misrigged aileron

35
3.2 Absence of seals on movable sections
Values are given per meter of missing seal.
Controlsurface
Penalty inUS gallons
per year
Penalty inUS $
per year
AMMreference
Corrective action
Slat 1(spanwiseseal)
1,880 $ 1,130 57 42 00 1 2 $ 100
Slat 2(spanwiseseal)
2,800 $ 1,680 57 43 00 1 2 $ 100
Slat 3(spanwiseseal)
4,480 $ 2,690 57 44 00 1 2 $ 100
Flap(chordwiseseal)
5,900 $ 3,540 27 50 00 1 2 $ 100
Wingsurface-to-flap seal
2,150 $ 1,290 27 50 00 1 3 $ 150
Trainingedgemissingfrom onespoiler
1,200 $ 720 27 61 63
27 61 54
1 2 $ 100
Aileron(chordwiseseal)
5,900 $ 3,540 27 11 00 1 2 $ 100
Fairing andrubber sealmissingfromfin/fuselagejunction
7,240 $ 4,350 53 53 00 1 3 $ 150
In the above table, the fuel cost has been taken as US$ 0.60 per US gallon; labour costsare assumed as US $ 50/h.

36
No traces
Absence of spanwise slat seal
Slat seal

37
Chordwise slat seal
Wing under-surface-to-flap seal

38
Chordwise flap seal
Aileron/flap seal
Aileron/flap seal

39
Chordwise aileron/flap seal

40
Spanwise aileron seal

41
3.3 Missing parts
Values are given per meter of missing part.
Corrective actionMissingpart
Penalty inUS gallons
per year
Penalty inUS $
per year
AMMreference
Men Manhours Cost
Accessdoor in thefuselageZone 1 area
10,200 $ 6,120 52 41 00
52 42 00
1 3 $ 150
Accessdoor inthefuselageZone 2area
7,650 $ 4,590 52 41 00
52 42 00
1 3 $ 150
In the above table, the fuel cost has been taken as US$ 0.60 per US gallon; labour costsare assumed as US $ 50/h.

42
Service door

43
3.4 Mismatched surfaces
Values are given for a given step per meter of mismatch.
Mismatchedsurface
Penalty in US gallons peryear
Penalty in US $per year
AMMreference
Corrective action
5mm step 10mm step 5mm step 10mm step Men Manhours Cost
Forwardpassengerdoor
1,710 3,940 $ 1,030 $ 2,360 52 10 11 2 8 $ 400
Midpassengerdoor(A300)
1,280 2,920 $ 770 $ 1,750 52 10 11 2 8 $ 400
Aftpassengerdoor(A300)
480 1,100 $ 286 $ 660 52 10 11 2 8 $ 400
Aftpassengerdoor(A310)
1,420 3,260 $ 850 $ 1,960 52 10 11 2 8 $ 400
Emergencyexit (A300)
620 1,450 $ 370 $ 870 52 22 11 2 7 $ 350
Emergencyexit (A310)
1,570 3,620 $ 940 $ 2,170 52 22 11 2 7 $ 350
Forwardcargo door
1,870 4,270 $ 1,120 $ 2,560 52 31 11 2 13 $ 650
Aft cargodoor
1,230 2,850 $ 740 $ 1,710 52 31 11 2 13 $ 650
Bulk door 700 1,780 $ 420 $ 1070 52 54 00 1 4 $ 200
Mainlandinggear door
1,080 2,710 $ 650 $ 1,630 32 12 11 2 8 $ 400
Noselandinggear door
1,540 3,520 $ 920 $ 2,110 32 22 11 2 6 $ 300
Accessdoor inZone 1 area
610 1,650 $ 370 $ 990 no procedure
Radomemisfit(maximumallowed)
670 $ 400 53 51 00 2 6 $ 300
In the above table, the fuel cost has been taken as US$ 0.60 per US gallon; labour costs areassumed as US $ 50/h.

44
Mismatched passenger doors
45
Cargo door

46
Radome misfit

47
Mismatched access doors

48
3.5 Door seal leakage
Values are given for a 5cm damaged door seal section.
Item Penalty in US gallonsper year
Penalty in US $per year
AMMreference
Corrective action
Sides Top orbottom
Sides Top orbottom
Men Manhours Cost
Forwardpassengerdoor
317 170 $ 190 $ 100 52 10 00 2 8 $ 400
Midpassengerdoor (A300)
260 150 $ 160 $ 90 52 10 00 2 8 $ 400
Aftpassengerdoor
230 120 $ 140 $ 70 52 10 00 2 8 $ 400
Emergencyexit
240 120 $ 140 $ 70 52 20 00 2 7 $ 350
Forwardcargo door
290 150 $ 170 $ 90 52 30 00 2 12 $ 600
Aft cargodoor
220 110 $ 130 $ 70 52 30 00 2 12 $ 600
In the above table, the fuel cost has been taken as US$ 0.60 per US gallon; labour costsare assumed as US $ 50/h.

49
Damaged door

50
Damaged seal

51
Damaged seals and leakage traces

52
Leakage traces due to damaged seal

53
Missing service door seal

54
3.6 Surface deterioration
3.6.1 Skin roughness
Values are given for a 0.3mm skin roughness height over 1m2 area in Zone 1.
Corrective actionAffectedarea
Penalty inUS gallons
per year
Penalty inUS $
per year
Maintenancereference
Men Manhours Cost
Leadingedge slat 4,410 $ 2,640
Wing skin –upper 2,720 $ 1,630
Polishing of 1sq.m. ofsurfaceSRM
51 41 10
1 3 $ 150
Wing skin –lower 1,360 $ 820
Tail 1,020 $ 610
Fuselage 460 $ 280Repainting
the areAMM
51 12 00
1 8 $ 400
In the above table, the fuel cost has been taken as US$ 0.60 per US gallon; labour costsare assumed as US $ 50/h.

55
Roughness surface due to skydrol leakage on the belly fairing
Skin roughness on lower-flap
56
Dirt traces
Lower wing roughness
Lower flap track fairing roughness

57
Lower wing roughness
Leakage traces

58
3.6.2 Skin dents
Values are given for a single dent or blister in specific areas.
Affectedarea
Dentdiameter
Penalty in USgallons per year
Penalty in US $per year
Maint.reference
Corrective action
Surfacearea 5mm 10mm 5mm 10mm Men Manhours Cost
Leadingedge slat 20 m2 36 36 $ 22 $ 22 SRM
57 00 00 2 24 $ 1,200
80 m2 159 173 $ 95 $ 104 2 60 $ 3,000
Wing(Zone 1) 20 m2 22 22 $ 13 $ 13 SRM
57 00 00 2 24 $ 1,200
80 m2 98 107 $ 59 $ 64 2 60 $ 3,000
Tail(Zone 1) 20 m2 7 15 $ 4 $ 9 SRM
55 00 00 2 24 $ 1,200
80 m2 14 29 $ 8 $ 17 2 40 $ 2,000
Fuselage(Zone 2) 20 m2 3 7 $ 2 $ 4 SRM
53 00 00 2 16 $ 800
80 m2 7 13 $ 4 $ 8 2 40 $ 2,000
Scuff plate atforward pax door 150 400 $ 90 $ 240 SRM
53 42 11 1 1 $ 50
Scuff plate atforward cargodoor
140 360 $ 80 $ 220 SRM53 42 11 1 1 $ 50
Scuff plate at aftcargo door 80 220 $ 50 $ 130 SRM
53 42 11 1 1 $ 50
In the above table, the fuel cost has been taken as US$ 0.60 per US gallon; labour costsare assumed as US $ 50/h.
For the fuselage Zone 1 areas, multiply the above values by 1.4For the wing Zone 2 areas, divide the above values by 1.23For the tail Zone 2 areas, divide the above values by 1.3

59
Dented slat
Dented engine cowl plate

60
Dented scuff plates

61
3.6.3 Unfilled butt joint gaps
Values are given for a given step and per meter of sealant of gap 2mm and width5mm.
Penalty in US gallonsper year
Penalty in US $per year
Maint.reference
Corrective actionAffectedarea
Zone 1 Zone 2 Zone 1 Zone 2 Men Manhours Cost
Wing 29 23 $ 17 $ 14 SRM51 40 20
AMM51 20 00
1 2 $ 100
Tail 35 26 $ 21 $ 16 SRM51 40 20
AMM51 20 00
1 2 $ 100
Fuselage 24 15 $ 14 $ 9 SRM51 40 20
AMM51 20 00
1 2 $ 100
In the above table, the fuel cost has been taken as US$ 0.60 per US gallon; labour costsare assumed as US $ 50/h.

62
Damaged seal
Missing seal
Missing seal

63
3.7 Consequences of hasty repairs
3.7.1 Overfilled butt joint gaps
Values are given for a given step and per meter of sealant for overfilled butt joints ofheight 2 mm and width 5mm.
Penalty in US gallonsper year
Penalty in US $per year
Maint.reference
Corrective actionSensitivearea
Zone 1 Zone 2 Zone 1 Zone 2 Men Manhours Cost
Leadingedge slat
69 46 $ 41 $ 28 SRM51 40 20
AMM51 12 00
1 2 $ 100
Wing skin– upper
550 66 $ 330 $ 40 1 2 $ 100
Wing skin– lower
48 43 $ 29 $ 26 1 2 $ 100
Tail 70 50 $ 40 $ 30 1 2 $ 100
Fuselage 38 26 $ 23 $ 16 1 2 $ 100
In the above table, the fuel cost has been taken as US$ 0.60 per US gallon; labour costsare assumed as US $ 50/h.

64
Overfilled belly fairing butt joint gaps

65
Damaged seals

66
3.7.2 External patches
Values are given for a 1 m2 patch of height 3 mm.
Penalty in US gallonsper year without
chamfer
Penalty in US $per year
Maint.reference
Extra time for an internalpatch instead of an external
oneSensitivearea Zone 1 Zone 2 Zone 1 Zone 2 Men Manhours Cost
Wing skin– upper
1,180 700 $ 710 $ 420 SRM57 00 00
2 60 $ 3,000
Wing skin– lower
210 210 $ 130 $ 120 SRM57 00 00
2 60 $ 3,000
Tail 520 340 $ 310 $ 200 SRM55 00 00
2 40 $ 2,000
Fuselage 310 220 $ 190 $ 130 SRM53 00 00
2 40 $ 2,000
In the above table, the fuel cost has been taken as US$ 0.60 per US gallon; labour costsare assumed as US $ 50/h.
With a chamfer (slope 26°), multiply the above values by 0.28, except for wing skin – upper(multiply the above values by 0.82).

67
External patches on the fuselage
68
External patches on the fuselage

69
3.7.3 Paint peeling
Values are given for a high-density paint peeling over a 1 m2 area.
Penalty in US gallonsper year
Penalty in US$per year
Maint.reference
Corrective actionSensitivearea
Zone 1 Zone 2 Zone 1 Zone 2 Men Manhours Cost
Leadingedge slat
2,550 1,570 $ 1,530 $ 940 Repaintingthe area
SRM51 41 10
AMM51 12 00
1 8 $ 400
Wing skin– upper
1,590 980 $ 950 $ 590 1 8 $ 400
Wing skin– lower
640 640 $ 390 $ 390 1 8 $ 400
Tail 540 400 $ 330 $ 240 1 8 $ 400
Fuselage 350 210 $ 210 $ 120 1 8 $ 400
In the above table, the fuel cost has been taken as US$ 0.60 per US gallon; labour costsare assumed as US $ 50/h.

70
Paint peeling

71
Paint peeling

72
Paint peeling

73
Paint peeling


4. A319/A320/A321 FAMILY


75
4. A319/A320/A321 FAMILY
The three aircraft of the narrow-body family have very similar airframes. Valuesgiven are best estimates for each aircraft.
As a simple rule, the higher the flight hours, the greater the effect of aerodynamicdeterioration on fuel consumption. For that reason, assumptions about flight hours per yearare very important and can cause very considerable differences, depending on eachindividual case. Based on data reported by all Airbus operators, 2,700 flight hours per yearper aircraft were assumed for the A320 family.
Drag penalty values for each item are given in the tables from pages 80 to 110, andcorrespond to the A320. These values could be considered valid for the A319 and the A321.
Manhours requested for each item are given as a guideline and should be a goodaverage for the whole narrow-body family (A319/A320/A321).
The accuracy of the given values is high enough to allow a comparison between thefuel burn penalties and associated maintenance costs.
Corrective factor for drag penalty
If there is a need to determine aircraft fuel penalties with greater accuracy and/or ifthe airline has a different aircraft utilisation, corrective factors to apply to the yearly fuelpenalty (in US gallons or US$) can be introduced in relation to the annual aircraft utilisation.This corrective factor introduces as well the geometrical differences.
A320 Family
0.250.5
0.751
1.251.5
1.752
1500 2000 2500 3000 3500 4000Annual Aircraft Utilization (Hrs)
Drag Corrective
FactorA321 A320 A319

76
A319

77
A320

78
A321

79
4.1 Misrigging of control surfaces
These items correspond to a specific control surface misrigging. The penalty isexpressed by the difference in height at the control surface trailing edge between themisrigged and the correct position.
Slat
Flap
Spoiler
Aileron
Rudder

80
Controlsurface
Penalty in US gallonsper year
Penalty in US $per year
AMMreference
Corrective action
5mmheight
10mmheight
15mmheight
5mmheight
10mmheight
15mmheight
Men Manhours Cost
Slat 1 3,420 5,510 8,940 $ 2,050 $ 3,300 $ 5,360 27 84 61 2 5 $ 250
Slat 2, 3 5,100 8,230 13,340 $ 3,060 $ 4,940 $ 8,000 2 5 $ 250
Slat 4, 5 8,160 13,165 21,350 $ 4,900 $ 7,900 $ 12,810 27 84 62 2 5 $ 250
Flap 550 1,110 1,660 $ 330 $ 670 $ 1,000 27 51 00 2 7 $ 350
Spoiler 2,500 5,750 8,660 $ 1,500 $ 3,450 $ 5,200 27 64 00 1 2 $ 100
Aileron 520 1,010 1,530 $ 310 $ 610 $ 920 27 14 00 1 3 $ 150
Rudder 1,360 2,280 2,950 $ 820 $ 1,370 $ 1,770 27 24 00 2 3 $ 150
Misalign-mentat flaptrackfairing
640 1,280 1,600 $ 380 $ 770 $ 960 05 25 30 2 4 $ 200
In the above table, the fuel cost has been taken as US$ 0.60 per US gallon; labour costsare assumed as US $ 50/h.

81
Misrigged slats

82
Misrigged spoilers
Misrigged spoiler and aileron

83
Misrigged spoilers

84
Flap
Aileron / flap

85
Ailerons

86
Flap track fairing

87
Misrigged spoilers

88
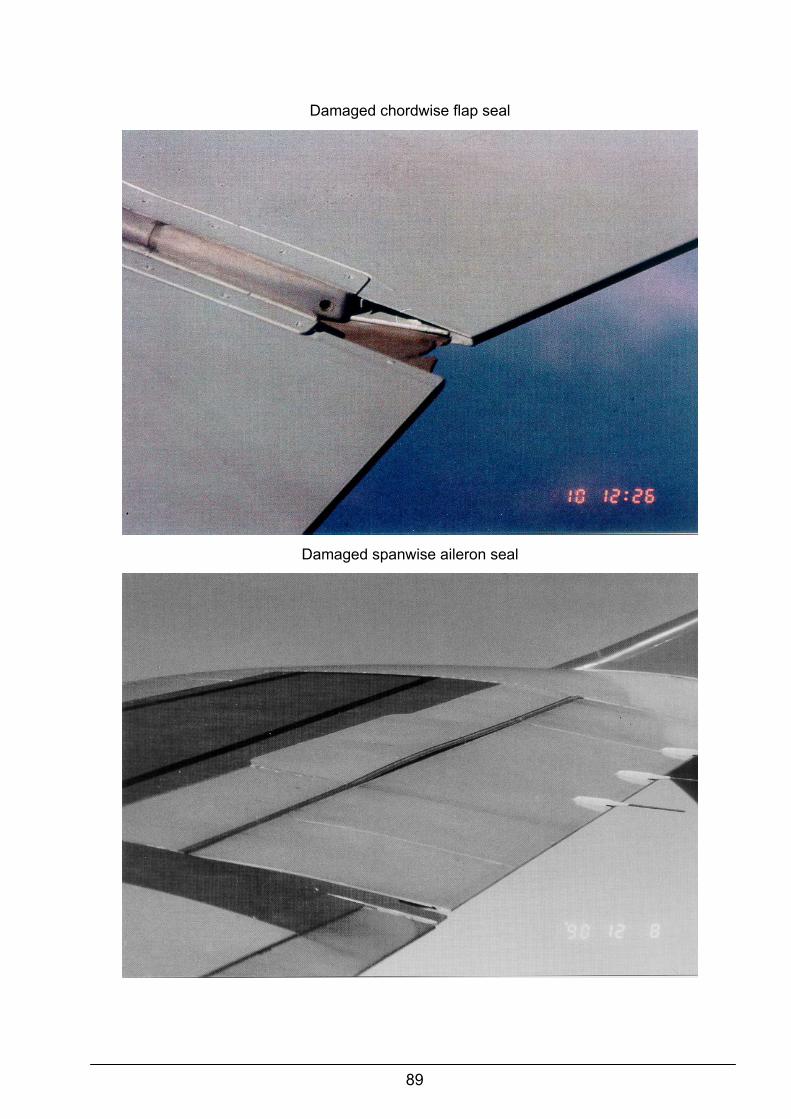
4.2 Absence of seals on movable sections
Values are given per meter of missing seal.
Corrective actionControlsurface
Penalty inUS gallons
per year
Penalty inUS $
per year
AMMreference
Men Manhours Cost
Slat 1(spanwiseseal)
1,630 $ 980 27 84 61 1 2 $ 100
Slat 2, 3(spanwiseseal)
2,428 $ 1,450 27 84 62 1 2 $ 100
Slat 4, 5(spanwiseseal)
3,880 $ 2,330 27 84 62 1 2 $ 100
Flap(chord-wise seal)
5,250 $ 3,150 27 54 6127 54 62
1 2 $ 100
Wingsurface-to-flapseal
2,120 $ 1,270 27 50 00 1 3 $ 150
Aileron(chord-wise seal)
5,250 $ 3,150 57 60 00 1 1 $ 50
Fairing andrubber sealmissingfromfin/fuselagejunction
5,840 $ 3,500 27 21 00 1 2 $ 100
In the above table, the fuel cost has been taken as US$ 0.60 per US gallon; labour costsare assumed as US $ 50/h.
89
Damaged chordwise flap seal
Damaged spanwise aileron seal

90
Aileron and flap seals

91
4.3 Missing parts
Values are given per meter of missing part.
Corrective actionMissingpart
Penalty inUS gallons
per year
Penalty inUS $
per year
AMMreference
Men Menhours Cost
Accessdoor in thefuselageZone 1 area
4,680 $ 2,800 52 42 00 1 3 $ 150
Accessdoor in thefuselageZone 2area
3,500 $ 2,100 52 42 00 1 3 $ 150
In the above table, the fuel cost has been taken as US$ 0.60 per US gallon; labour costsare assumed as US $ 50/h.

92
Exhaust door
Cargo door latch

93
4.4 Mismatched surfaces
Values are given for a given per meter of mismatch.
Mismatchedsurface
Penalty in US gallonsper year
Penalty in US $per year
AMMreference
Corrective action
5mmstep
10mm step 5mm step 10mm step Men Manhours Cost
Forwardpassengerdoor
1,620 3,507 $ 970 $ 2,100 52 11 00 2 7 $ 350
Aftpassengerdoor
1,150 2,450 $ 690 $ 1,470 52 13 00 2 7 $ 350
Emergencyexit
770 1,680 $ 460 $ 1,010 52 21 11 2 6 $ 300
Forwardcargo door
1,950 3,890 $ 1,170 $ 2,330 52 31 11 2 12 $ 600
Aft cargodoor
1,530 3,560 $ 920 $ 2,140 52 31 11 2 12 $ 600
Bulk cargodoor
700 1,420 $ 420 $ 853 52 33 11 2 4 $ 200
Mainlanding geardoor
800 1,860 $ 480 $ 1,110 32 12 11 2 7 $ 350
Noselanding geardoor
1,000 2,360 $ 600 $ 1,420 32 22 11 2 5 $ 250
Accessdoor inZone 1 area
390 1,030 $ 230 $ 620 no specific procedure
Radomemisfit(maximumallowed)
490 $ 300 53 15 11 2 6 $ 250
In the above table, the fuel cost has been taken as US$ 0.60 per US gallon; labour costsare assumed as US $ 50/h.

94
Passenger door
perfectly matched
Mismatched cargo door

95
Mismatched access doors

96
Radome misfit

97
4.5 Door seal leakage
Values are given for a 5cm damaged door seal section.
Item Penalty in US gallonsper year
Penalty in US $per year
AMMreference
Corrective action
Sides Top orbottom
Sides Top orbottom
Men Manhours Cost
Forwardpassengerdoor
340 170 $ 200 $ 100 52 11 18 2 7 $ 350
Aftpassengerdoor
200 100 $ 120 $ 60 52 13 18 2 7 $ 350
Emergencyexit
110 60 $ 70 $ 40 52 22 00 2 6 $ 300
Forwardcargo door
270 140 $ 160 $ 80 52 31 18 2 10 $ 500
Aft cargodoor
220 120 $ 130 $ 70 52 31 18 2 10 $ 500
In the above table, the fuel cost has been taken as US$ 0.60 per US gallon; labour costsare assumed as US $ 50/h.

98
Damaged seal

99
Damaged seal

100
4.6 Surface deterioration
4.6.1 Skin roughness
Values are given for a 0.3mm skin roughness height over 1m2 area in Zone 1.
Affectedarea
Penalty inUS gallons
per year
Penalty inUS $
per year
Maintenancereference
Corrective action
SRM51 10 00
Men Manhours Cost
Leadingedge slat
4,900 $ 2,940 Externalcleaning
AMM51 78 00
1 1 $ 50
Wing skin –upper 2,970 $ 1,780
PolishingAMM
51 21 001 3 $ 150
Wing skin –lower 1,460 $ 880
Tail 940 $ 560
Fuselage 600 $ 360
In the above table, the fuel cost has been taken as US$ 0.60 per US gallon; labour costsare assumed as US $ 50/h.

101
4.6.2 Skin dents
Values are given for a single dent or blister in specific areas.
Affectedarea
Surfacedama-
ged
Penalty in USgallons per year
Penalty in US $per year
Maint.reference
Corrective action
5mm 10mm 5 mm 10 mm SRM 51 73 00AMM 51 73 11 Men Manhours Cost
Leadingedgeslat
20 cm2 35 35 $ 21 $ 21 27 80 00 2 24 $ 1,200
80 cm2 150 170 $ 90 $ 100 2 60 $ 3,000
Wing(Zone 1) 20 cm2 21 21 $ 13 $ 13 57 00 00 2 24 $ 1,200
80 cm2 90 101 $ 54 $ 61 2 60 $ 3,000
Tail(Zone 1) 20 cm2 7 19 $ 4 $ 11 55 00 00 2 24 $ 1,200
80 cm2 15 30 $ 9 $ 18 2 40 $ 2,000
Fuselage(Zone 2) 20 cm2 2 5 $ 1 $ 3 53 00 00 2 16 $ 800
80 cm2 5 9 $ 3 $ 5 2 40 $ 2,000
Scuff plate atforward pax door 110 270 $ 70 $ 160 AMM
53 15 15 1 1 $ 50
Scuff plate atforward cargodoor
100 260 $ 60 $ 160 AMM53 45 15 1 1 $ 50
Scuff plate atbulk door 60 150 $ 40 $ 90 AMM
53 45 15 1 1 $ 50
In the above table, the fuel cost has been taken as US$ 0.60 per US gallon; labour costsare assumed as US $ 50/h.
For the fuselage Zone 1 areas, multiply the above values by 1.4
For the wing Zone 2 areas, divide the above values by 1.23
For the tail Zone 2 areas, divide the above values by 1.3

102
Dented door

103
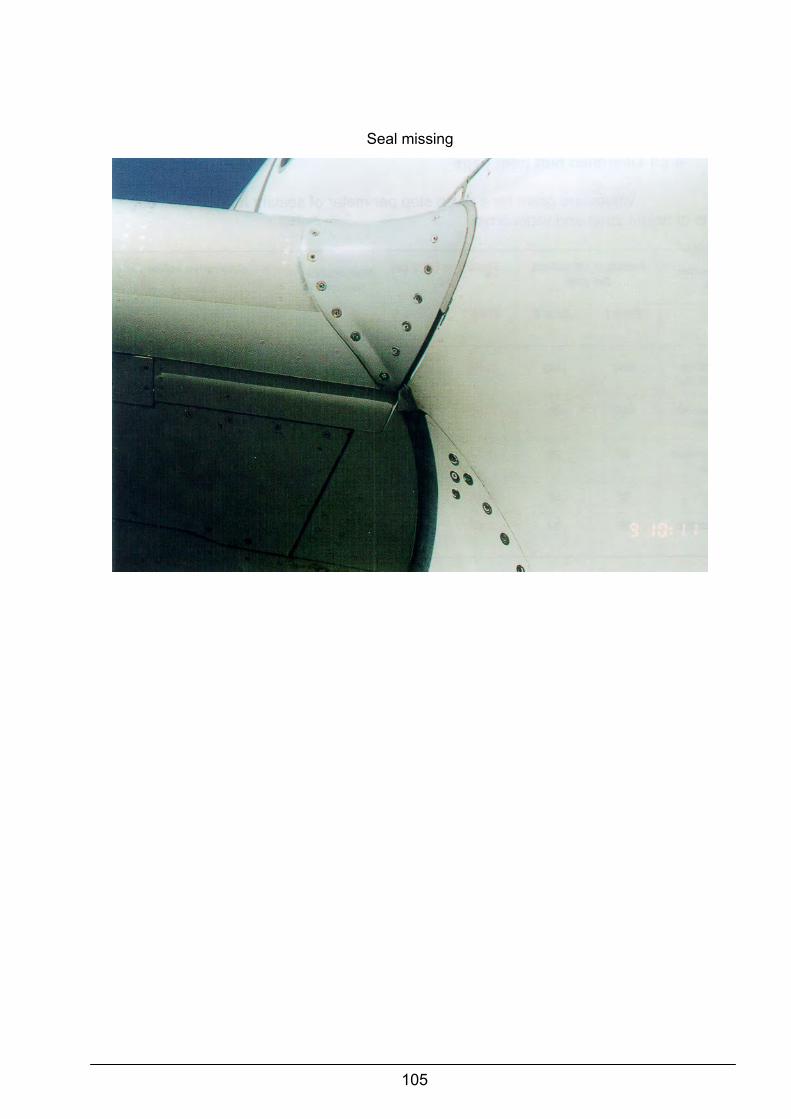
4.6.3 Unfilled butt joint gaps
Values are given for a given step and per meter of sealant of gap 2mm and width5mm.
Penalty in US gallonsper year
Penalty in US $per year
Maint.reference
Corrective actionAffectedarea
Zone 1 Zone 2 Zone 1 Zone 2 Men Manhours Cost
Wing 23 14 $ 14 $ 8 1 2 $ 100
Tail 36 27 $ 22 $ 16 1 2 $ 100
Fuselage 27 21 $ 16 $ 13 SRM51 76 11
1 2 $ 100
In the above table, the fuel cost has been taken as US$ 0.60 per US gallon; labour costsare assumed as US $ 50/h.

104
Seal missing
Seal missing
105
Seal missing

106
4.7 Consequences of hasty repairs
4.7.1 Overfilled butt joint gaps
Values are given for a given step per meter of sealant for overfilled butt joints ofheight 2mm and width 5mm.
Penalty in US gallonsper year
Penalty in US $per year
Maint.reference
Corrective actionSensitivearea
Zone 1 Zone 2 Zone 1 Zone 2 Men Manhours Cost
Leadingedge slat
800 100 $ 480 $ 60 1 2 $ 100
Wingskin -upper
500 60 $ 300 $ 40 1 2 $ 100
Wingskin -lower
30 20 $ 20 $ 10 1 2 $ 100
Tail 70 50 $ 40 $ 30 1 2 $ 100
Fuselage 36 24 $ 22 $ 14 SRM51 76 11
1 2 $ 100
In the above table, the fuel cost has been taken as US$ 0.60 per US gallon; labour costsare assumed as US $ 50/h.

107
Seal misfit
Seal misfit

108
4.7.2 External patches
Values are given for a 1 m2 patch of height 3 mm.
Penalty in US gallonsper year without
chamber
Penalty in US $per year
Maint.reference
Extra time for an Internalpatch instead of an external
oneSensitivearea
Zone 1 Zone 2 Zone 1 Zone 2 Men Manhours Cost
Wingskin -upper
1,070 670 $ 640 $ 400 57 00 00 2 60 $ 3,000
Wingskin -lower
230 220 $ 140 $ 130 57 00 00 2 60 $ 3,000
Tail 540 360 $ 320 $ 220 55 00 00 2 40 $ 2,000
Fuselage 280 200 $ 170 $ 120 53 00 00 2 40 $ 2,000
In the above table, the fuel cost has been taken as US$ 0.60 per US gallon; labour costsare assumed as US $ 50/h.
With a chamfer (slope 26°), multiply the above values by 0.28, except for wing skin – upper(multiply the above values by 0.82).

109
External patches
External patcheson the belly fairing

110
4.7.3 Paint peeling
Values are given for a high-density paint peeling over a 1 m2 area.
Penalty in US gallonsper year
Penalty in US $per year
Maintenancereference
Corrective actionSensitivearea
Zone 1 Zone 2 Zone 1 Zone 2 Men Manhours Cost
Leadingedge slat
2,830 1,740 $ 1,700 $ 1,040 Repair ofpaint
damage
1 8 $ 400
Wingskin -upper
1,770 1,090 $ 1,060 $ 650 AMM51 75 12
SRM51 75 12
1 8 $ 400
Wingskin -lower
710 710 $ 430 $ 430 1 8 $ 400
Tail 540 400 $ 330 $ 240 1 8 $ 400
Fuselage 350 200 $ 210 $ 120 1 8 $ 400
In the above table, the fuel cost has been taken as US$ 0.60 per US gallon; labour costsare assumed as US $ 50/h.

111
Paint peeling on the belly fairing
Paint peeling on the lower wing

112
Paint peeling on the upper-wing
Paint peeling on the slat-leading edge

113
Paint peeling on the bellyfairing
Paint peeling on the bellyfairing


5. A330/A340 FAMILY


115
5. A330/A340 FAMILY
The two aircraft of the long-range family have very similar airframes. Values givenare best estimates for each aircraft.
As a simple rule, the higher the flight hours, the greater the effect of aerodynamicdeterioration on fuel consumption. For that reason, assumptions about flight hours per yearare very important and cause very considerable differences, depending on each individualcase. Based on data reported by all Airbus operators the following flight hours (FH) per yearper aircraft were assumed.
FH / Year Nominal ConsumptionUS GAL / Year
A330 2,900 FH/year 19500
A340 4,700 FH/year 35700
Drag penalty values each item are given in the tables from page 119 to 149,representing an average for the whole long-range family and have been determinedconsidering a fictive airplane (representative of both A330 and A340 models) and which inaverage burns 27600 US Gallons / Year.
The manhours requested for each item is given as a guideline.
The accuracy is high enough to allow a comparison between the fuel burn penaltiesand the associated maintenance costs.
Corrective factor for drag penalty
If there is a need to determine aircraft fuel penalties with greater accuracy and/or ifthe airline has a different aircraft utilisation, corrective factors to apply to the yearly fuelpenalty (in US gallons or US$) can be introduced in relation to the annual aircraft utilisation.This corrective factor takes into account the drag penalties computed for the fictive airplaneindicated above.
A330-A340 Family
0.25
0.5
0.75
1
1.25
1.5
1.75
2
1500 2500 3500 4500 5500 6500
Annual Aircraft Utilisation (Hrs)
Drag Corrective
Factor A340 A330

116
A330

117
A340
118
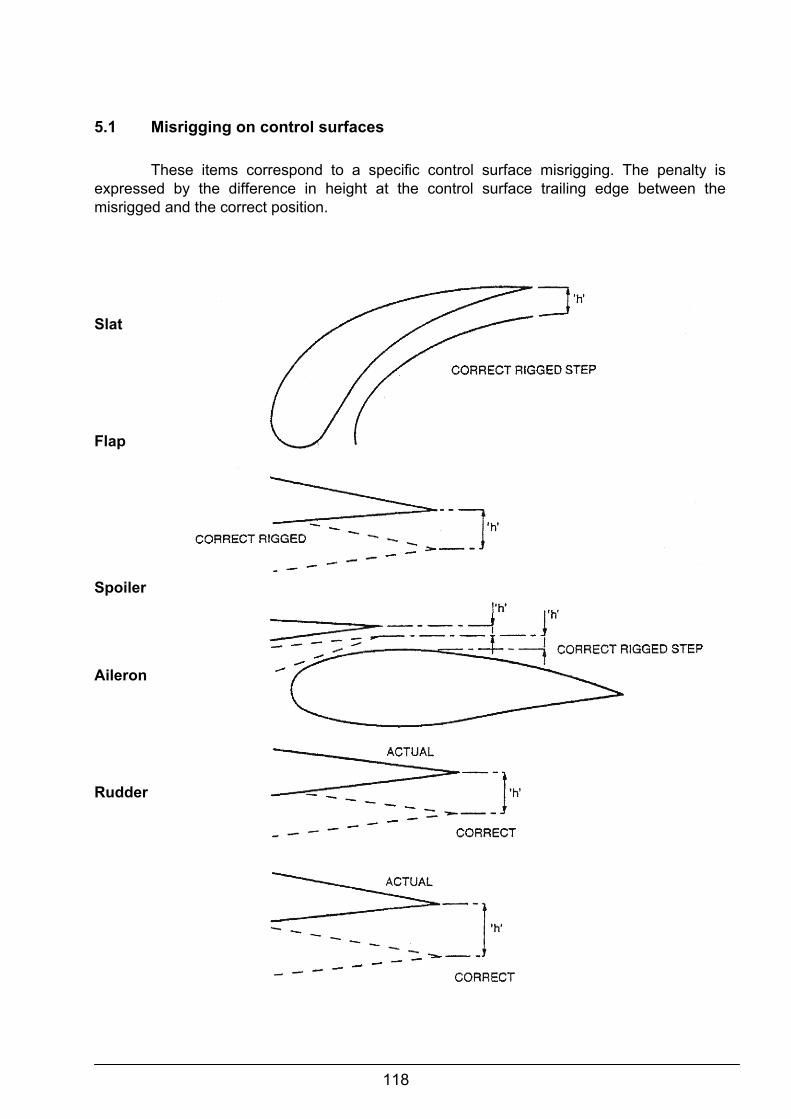
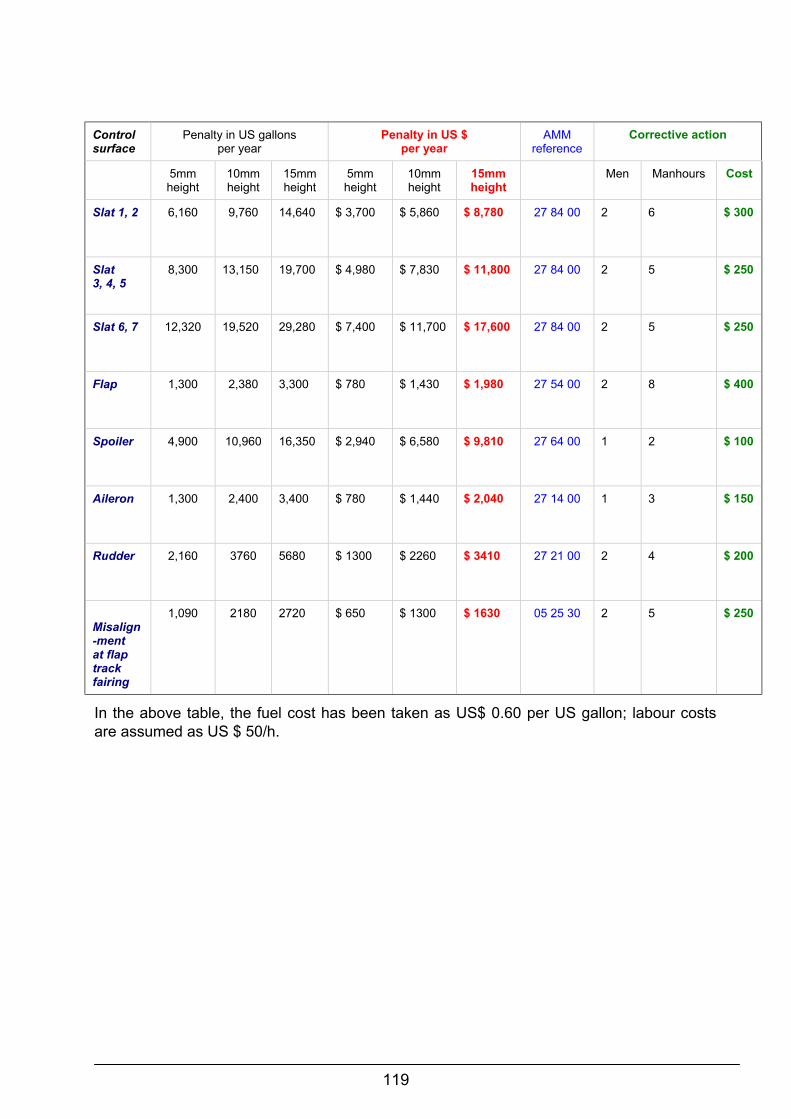
5.1 Misrigging on control surfaces
These items correspond to a specific control surface misrigging. The penalty isexpressed by the difference in height at the control surface trailing edge between themisrigged and the correct position.
Slat
Flap
Spoiler
Aileron
Rudder
119
Controlsurface
Penalty in US gallonsper year
Penalty in US $per year
AMMreference
Corrective action
5mmheight
10mmheight
15mmheight
5mmheight
10mmheight
15mmheight
Men Manhours Cost
Slat 1, 2 6,160 9,760 14,640 $ 3,700 $ 5,860 $ 8,780 27 84 00 2 6 $ 300
Slat3, 4, 5
8,300 13,150 19,700 $ 4,980 $ 7,830 $ 11,800 27 84 00 2 5 $ 250
Slat 6, 7 12,320 19,520 29,280 $ 7,400 $ 11,700 $ 17,600 27 84 00 2 5 $ 250
Flap 1,300 2,380 3,300 $ 780 $ 1,430 $ 1,980 27 54 00 2 8 $ 400
Spoiler 4,900 10,960 16,350 $ 2,940 $ 6,580 $ 9,810 27 64 00 1 2 $ 100
Aileron 1,300 2,400 3,400 $ 780 $ 1,440 $ 2,040 27 14 00 1 3 $ 150
Rudder 2,160 3760 5680 $ 1300 $ 2260 $ 3410 27 21 00 2 4 $ 200
Misalign-mentat flaptrackfairing
1,090 2180 2720 $ 650 $ 1300 $ 1630 05 25 30 2 5 $ 250
In the above table, the fuel cost has been taken as US$ 0.60 per US gallon; labour costsare assumed as US $ 50/h.

120
Misrigged slat
Flap

121
5.2 Absence of seals on movable sections
Values are given per meter of missing seal.
Corrective actionControlsurface
Penalty inUS gallons
per year
Penalty inUS $
per year
AMMreference
Men Manhours Cost
Slat 1, 2(spanwiseseal)
3,010 $ 1,800 27 84 71 1 2 $ 100
Slat 3, 4, 5(spanwiseseal)
4,480 $ 2,690 27 84 71 1 2 $ 100
Slat 6, 7(spanwiseseal)
7,170 $ 4,300 27 84 71 1 2 $ 100
Flap(chord-wise seal)
9,940 $ 5,660 27 54 72 1 2 $ 100
Wingsurface-to-flapseal
3,440 $ 2,070 27 50 00 1 3 $ 150
Trailingedgemissingfrom onespoiler
1,920 $ 1,150 27 64 00 1 2 $ 100
Aileron(chordwiseseal)
9,440 $ 5,660 27 14 0057 61 00
1 2 $ 100
Fairing andrubber sealmissingfromfin/fuselagejunction
1,160 $ 6,950 27 21 41 1 3 $ 150
In the above table, the fuel cost has been taken as US$ 0.60 per US gallon; labour costsare assumed as US $ 50/h.

122
Spanwise slat seal
Missing chordwise slat seal

123
Missing spanwise slat seal
Missing chordwise seal

124
Damaged chordwise slat seal

125
Damaged wing lower-surface-to-flap seals

126
Missing aileron
spanwise seal
Chordwise flap seal

127
Rubber seal on the
fin/fuselage junction

128
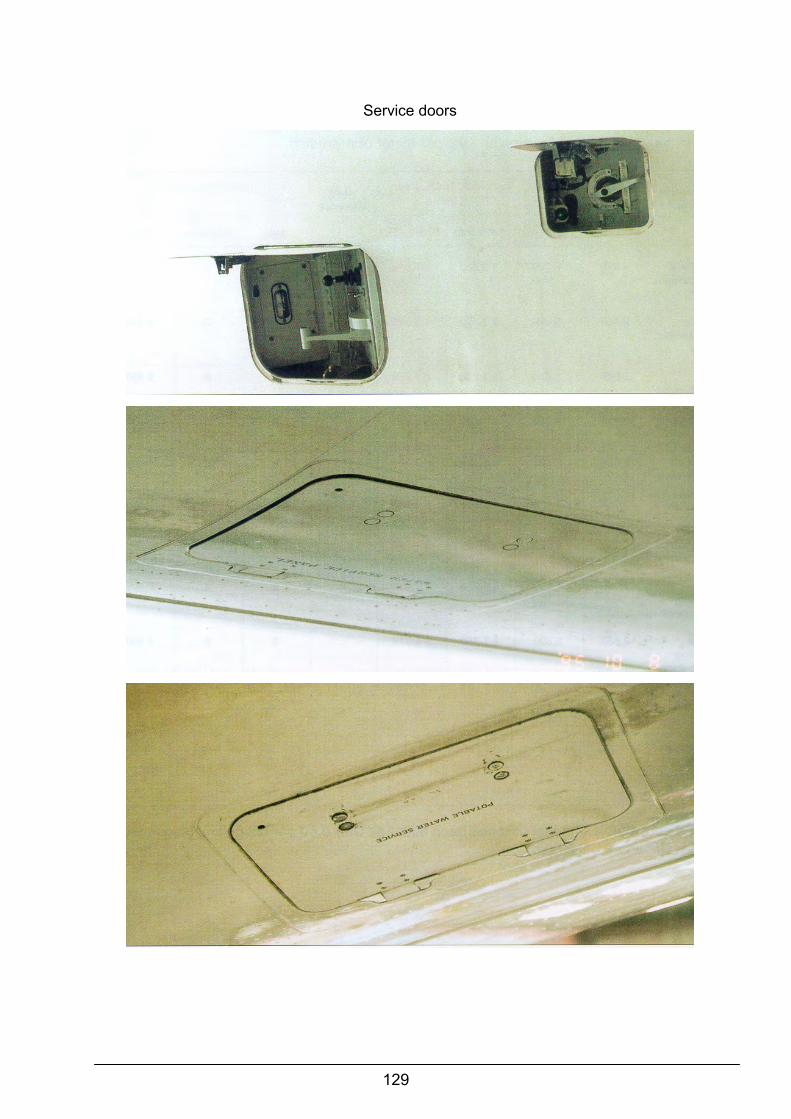
5.3 Missing parts
Values are given per meter of missing part.
Corrective actionMissingpart
Penalty inUS gallons
per year
Penalty inUS $
per year
AMMreference
Men Manhours Cost
Accessdoor in thefuselageZone 1 area
16,320 $ 9,800 52 41 0052 42 00
1 4 $ 200
Accessdoor inthefuselageZone 2area
12,240 $ 7,340 52 41 0052 42 00
1 4 $ 200
In the above table, the fuel cost has been taken as US$ 0.60 per US gallon; labour costsare assumed as US $ 50/h.
129
Service doors

130
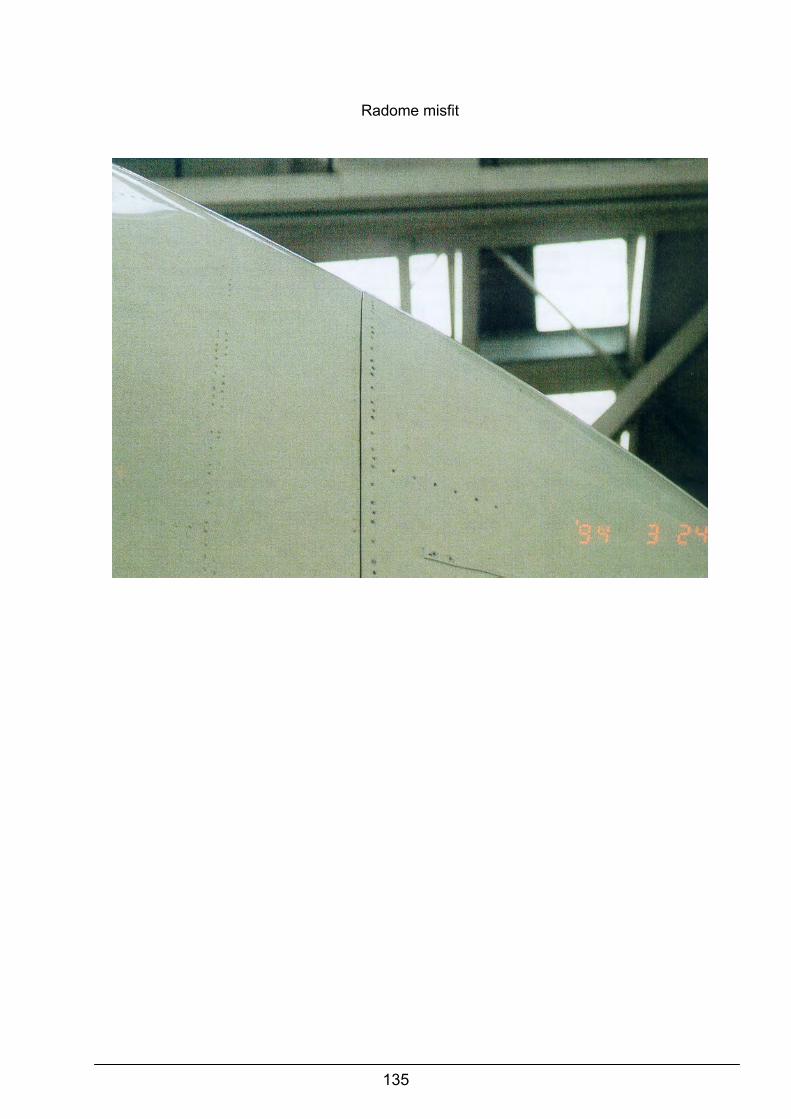
5.4 Mismatched surfaces
Values are given for a given per meter of mismatch.
Mismatchedsurface
Penalty in US gallonsper year
Penalty in US $per year
AMMreference
Corrective action
5mm step 10mm step 5mm step 10mm step Men Manhours Cost
Forwardpassengerdoor
4,470 8,720 $ 2,680 $ 5,330 52 11 00 2 8 $ 400
Midpassengerdoor
2,460 5,160 $ 1,470 $ 3,100 52 12 00 2 8 $ 400
Aftpassengerdoor
2,040 4,690 $ 1,230 $ 2,820 52 13 00 2 8 $ 400
Emergencyexit
2,230 4,860 $ 1,340 $ 2,920 52 22 00 2 8 $ 400
Forwardcargo door
4,526 8,830 $ 2,720 $ 5,300 52 31 00 2 13 $ 650
Aft cargodoor
2,760 5,410 $ 1,660 $ 3,250 52 32 11 2 13 $ 650
Bulk cargodoor
1,210 2,570 $ 730 $ 1,540 52 33 11 1 4 $ 200
Mainlandinggear door
2,050 5,150 $ 1,230 $ 3,090 32 12 11 2 8 $ 400
Noselandinggear door
2,930 6,690 $ 1,760 $ 4,010 32 22 11 2 6 $ 300
Accessdoor inZone 1 area
1,160 3,140 $ 700 $ 1,880 no adjustment procedure
Radomemisfit(maximumallowed)
1,270 $ 760 53 10 00 2 7 $ 350
In the above table, the fuel cost has been taken as US$ 0.60 per US gallon; labour costsare assumed as US $ 50/h.

131
Passenger door
Passenger door

132
Mismatched passengerdoor

133
Nose landing gear door

134
Radome misfit
135
Radome misfit

136
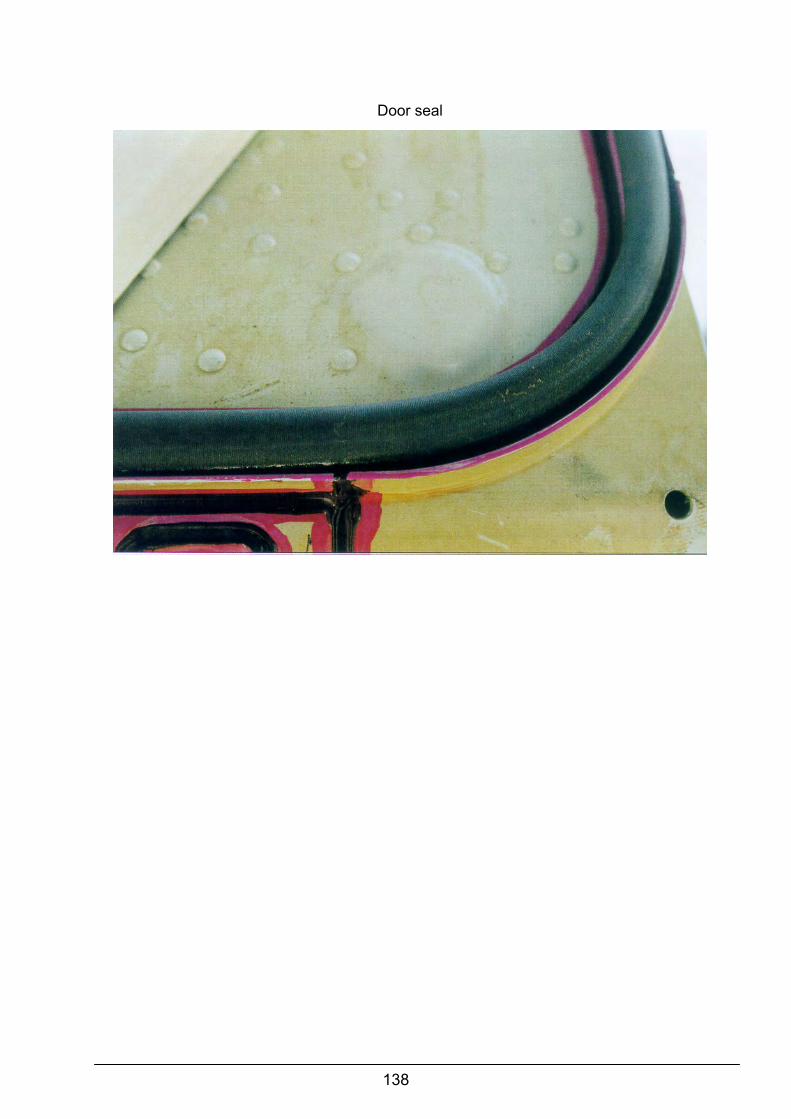
5.5 Door seal leakage
Values are given for a 5cm damaged door seal section.
Item Penalty in US gallonsper year
Penalty in US $per year
AMMreference
Corrective action
Sides Top orbottom
Sides Top orbottom
Men Manhours Cost
Forwardpassengerdoor
500 270 $ 300 $ 160 52 11 18 2 8 $ 400
Midpassengerdoor
420 240 $ 250 $ 140 52 12 18 2 8 $ 400
Aftpassengerdoor
370 190 $ 220 $ 120 52 13 18 2 8 $ 400
Emergencyexit
380 190 $ 230 $ 120 52 22 18 2 8 $ 400
Forwardcargo door
460 240 $ 280 $ 140 52 31 18 2 13 $ 650
Aft cargodoor
350 180 $ 210 $ 110 52 32 18 2 13 $ 650
In the above table, the fuel cost has been taken as US$ 0.60 per US gallon; labour costsare assumed as US $ 50/h.

137
Missing door seal
Missing door seal
138
Door seal

139
5.6 Surface deterioration
5.6.1 Skin roughness
Values are given for a 0.3mm skin roughness height over a 1m2 area in Zone 1.
Affectedarea
Penalty inUS gallons
per year
Penalty inUS $
per year
Maintenancereference
Corrective action
SRM51 10 00
Men Manhours Cost
Leadingedge slat
11,500 $ 6,900 Externalcleaning
AMM12 21 11
AMM51 78 00
1 1 $ 50
Wing skin –upper
7,120 $ 4,270 PolishingAMM
51 21 00
1 3 $ 150
Wing skin –lower
3,560 $ 2,140
Tail 2,460 $ 1,470
Fuselage 1,300 $ 780
In the above table, the fuel cost has been taken as US$ 0.60 per US gallon; labour costsare assumed as US $ 50/h.
For Zone 2, divide the above values by 1.3.

140
Skin roughness

141
5.6.2 Skin dents
Values are given for a single dent or blister in specific areas.
Affectedarea
Surfacedama-
ged
Penalty in USgallons per year
Penalty in US $per year
Maint.reference
Corrective action
5mm 10mm 5 mm 10 mm SRM 51 73 00AMM 51 73 11 Men Manhours Cost
Leadingedgeslat
20 m2 140 140 $ 90 $ 90 27 80 00 2 24 $ 1,200
80 m2 640 690 $ 380 $ 420 2 60 $ 3,000
Wing(Zone 1) 20 m2 90 90 $ 50 $ 50 57 00 00 2 24 $ 1,200
80 m2 390 430 $ 230 $ 260 2 60 $ 3,000
Tail(Zone 1) 20 m2 39 52 $ 23 $ 31 55 00 00 2 24 $ 1,200
80 m2 97 190 $ 58 $ 114 2 40 $ 2,000
Fuselage(Zone 2) 20 m2 11 14 $ 7 $ 8 53 00 00 2 16 $ 800
80 m2 28 28 $ 17 $ 17 2 40 $ 2,000
Scuff plate atforward pax door
170 430 $ 100 $ 260 AMM53 45 15
1 1 $ 50
Scuff plate atforward cargodoor
160 410 $ 100 $ 250 AMM53 45 15
1 1 $ 50
Scuff plate atbulk door
90 230 $ 50 $ 140 AMM53 45 15
1 1 $ 50
In the above table, the fuel cost has been taken as US$ 0.60 per US gallon; labour costsare assumed as US $ 50/h.
For the fuselage Zone 1 areas, multiply the above values by 1.51For the wing Zone 2 areas, divide the above values by 1.23For the tail Zone 2 areas, divide the above values by 1.17

142
Dented skin
Dented scuff plates

143
5.6.3 Unfilled butt joint gaps
Values are given for a given step and per meter of sealant of gap 2mm and width5mm.
Penalty in US gallonsper year
Penalty in US $per year
Maintenancereference
Corrective actionAffectedarea
Zone 1 Zone 2 Zone 1 Zone 2 Men Manhours Cost
Wing 47 37 $ 28 $ 22 1 2 $ 100
Tail 68 51 $ 41 $ 30 1 2 $ 100
Fuselage 29 20 $ 17 $ 12 SRM51 76 11
1 2 $ 100
In the above table, the fuel cost has been taken as US$ 0.60 per US gallon; labour costsare assumed as US $ 50/h.

144
Damaged seal
Missing seal
Missing seal

145
5.7 Consequences of hasty repairs
5.7.1 Overfilled butt joint gaps
Values are given for a given step per meter of sealant for overfilled butt joints ofheight 2mm and width 5mm.
Penalty in US gallonsper year
Penalty in US $per year
Maintenancereference
Corrective actionSensitivearea
Zone 1 Zone 2 Zone 1 Zone 2 Men Manhours Cost
Leadingedge slat
90 60 $ 50 $ 40 1 2 $ 100
Wingskin –upper
760 90 $ 450 $ 50 1 2 $ 100
Wingskin –lower
70 60 $ 40 $ 40 1 2 $ 100
Tail 100 70 $ 60 $ 40 1 2 $ 100
Fuselage 50 40 $ 30 $ 20 SRM51 76 11
1 2 $ 100
In the above table, the fuel cost has been taken as US$ 0.60 per US gallon; labour costsare assumed as US $ 50/h.

146
Overfilled butt joint gap

147
5.7.2 External patches
Values are given for a 1 m2 patch with a 3mm height.
Penalty in US gallonsper year without
chamber
Penalty in US $per year
Maintenancereference
Extra time for an Internalpatch instead of an external
oneSensitivearea
Zone 1 Zone 2 Zone 1 Zone 2 Men Manhours Cost
Wingskin –upper
1,826 1,050 $ 1,100 $ 630 57 00 00 2 60 $ 3,000
Wingskin –lower
320 320 $ 190 $ 190 57 00 00 2 60 $ 3,000
Tail 800 700 $ 480 $ 420 55 00 00 2 40 $ 2,000
Fuselage 410 280 $ 240 $ 170 53 00 00 2 40 $ 2,000
In the above table, the fuel cost has been taken as US$ 0.60 per US gallon; labour costsare assumed as US $ 50/h.
With a chamfer (slope 26°), multiply the above values by 0.27, except for wing skin – upper(multiply above values by 0.82).

148
Internal patch on the slatleading edge
External patch

149
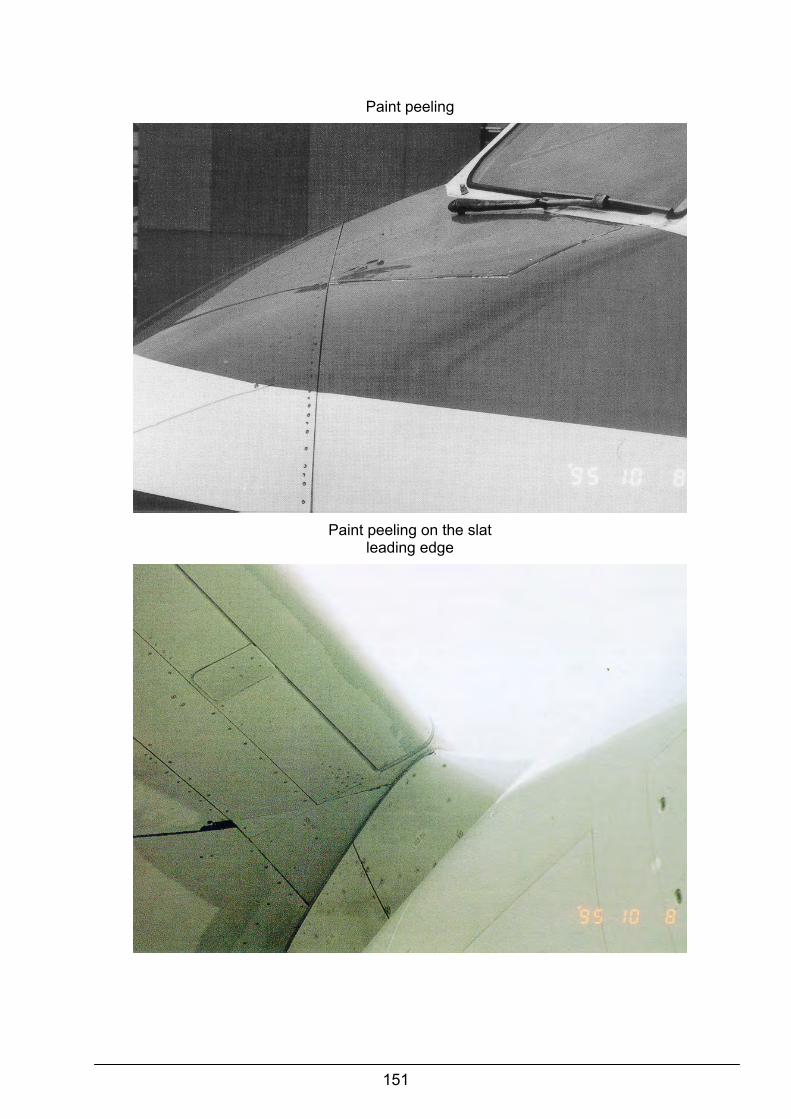
5.7.3 Paint peeling
Values are given for a high-density paint peeling over a 1 m2 area.
Penalty in US gallonsper year
Penalty in US $per year
Maintenancereference
Corrective actionSensitivearea
Zone 1 Zone 2 Zone 1 Zone 2 Men Manhours Cost
Leadingedge slat
6,380 3,930 $ 3,830 $ 2,350 Repair ofpaint
damage
1 8 $ 400
Wingskin –upper
3,970 2,450 $ 2,370 $ 1,470 AMM51 75 12
1 8 $ 400
Wingskin –lower
1,600 1,600 $ 960 $ 960 SRM51 75 12
1 8 $ 400
Tail 1,360 1,010 $ 820 $ 600 1 8 $ 400
Fuselage 850 650 $ 510 $ 390 1 8 $ 400
In the above table, the fuel cost has been taken as US$ 0.60 per US gallon; labour costsare assumed as US $ 50/h.

150
Paint peeling separation
Paint peeling
151
Paint peeling
Paint peeling on the slatleading edge

6. CONCLUSION


153
6. CONCLUSION
The purpose of presenting the foregoing examples is simply to make operators andmaintenance personnel more aware of drag-induced performance degradation on normalday-to-day operation. It has been shown that many, but not all, aerodynamic degradationscan be easily detected and cost-effectively repaired. It ultimately becomes a matter ofjudgement for the airline to decide whether to rectify a fault or to ignore its effect.
Nevertheless, all maintenance and operations personnel should be aware of fuelpenalties which may stem for misrigged control surfaces, defective seals and the lack ofaircraft external cleanliness – especially at or near leading edges and forward sections of theaircraft.
Airbus Industrie is convinced that prevention is better than repair. Continuouslymonitoring aircraft aerodynamic efficiency, together with timely rectification of problems, is,without a doubt, the best approach to minimising unnecessary fuel consumption.
Related Documents