NASA / TM-2002-211432 Aeroacoustic Experiments in the Langley Low-Turbulence Pressure Tunnel Meelan M. Choudhari, David P. Lockard, Michele G. Macaraeg, Bart A. Singer, and Craig L. Streett Langley Research Center, Hampton, Virginia Guy R. Neubert, Robert W. Stoker, and James R. Underbrink Boeing Commercial Aircraft, Seattle, Washington Mert E. Berkman, Mehdi R. Khorrami, and Shelly S. Sadowski High Technology Corporation, Hampton, Virginia February 2002

Welcome message from author
This document is posted to help you gain knowledge. Please leave a comment to let me know what you think about it! Share it to your friends and learn new things together.
Transcript

NASA / TM-2002-211432
Aeroacoustic Experiments in the LangleyLow-Turbulence Pressure Tunnel
Meelan M. Choudhari, David P. Lockard, Michele G. Macaraeg, Bart A. Singer, and
Craig L. Streett
Langley Research Center, Hampton, Virginia
Guy R. Neubert, Robert W. Stoker, and James R. Underbrink
Boeing Commercial Aircraft, Seattle, Washington
Mert E. Berkman, Mehdi R. Khorrami, and Shelly S. Sadowski
High Technology Corporation, Hampton, Virginia
February 2002
The NASA STI Program Office... in Profile
Since its founding, NASA has been dedicated
to the advancement of aeronautics and spacescience. The NASA Scientific and Technical
Information (STI) Program Office plays a key
part in helping NASA maintain this
important role.
The NASA STI Program Office is operated by
Langley Research Center, the lead center forNASA's scientific and technical information.
The NASA STI Program Office providesaccess to the NASA STI Database, the
largest collection of aeronautical and space
science STI in the world. The Program Officeis also NASA's institutional mechanism for
disseminating the results of its research and
development activities. These results arepublished by NASA in the NASA STI Report
Series, which includes the following report
types:
• TECHNICAL PUBLICATION. Reports ofcompleted research or a major significant
phase of research that present the results
of NASA programs and include extensivedata or theoretical analysis. Includes
compilations of significant scientific andtechnical data and information deemed
to be of continuing reference value. NASA
counterpart of peer-reviewed formalprofessional papers, but having less
stringent limitations on manuscriptlength and extent of graphic
presentations.
• TECHNICAL MEMORANDUM.
Scientific and technical findings that are
preliminary or of specialized interest,
e.g., quick release reports, workingpapers, and bibliographies that containminimal annotation. Does not contain
extensive analysis.
• CONTRACTOR REPORT. Scientific and
technical findings by NASA-sponsored
contractors and grantees.
CONFERENCE PUBLICATION.
Collected papers from scientific and
technical conferences, symposia,
seminars, or other meetings sponsored or
co-sponsored by NASA.
SPECIAL PUBLICATION. Scientific,
technical, or historical information from
NASA programs, projects, and missions,
often concerned with subjects having
substantial public interest.
TECHNICAL TRANSLATION. English-
language translations of foreign scientificand technical material pertinent toNASA's mission.
Specialized services that complement the
STI Program Office's diverse offerings includecreating custom thesauri, building customized
databases, organizing and publishing
research results.., even providing videos.
For more information about the NASA STI
Program Office, see the following:
• Access the NASA STI Program Home
Page at http://www.sti.nasa.gov
• Email your question via the Internet to
• Fax your question to the NASA STI
Help Desk at (301) 621-0134
• Telephone the NASA STI Help Desk at(301) 621-0390
Write to:
NASA STI Help Desk
NASA Center for AeroSpace Information7121 Standard Drive
Hanover, MD 21076-1320

NASA / TM-2002-211432
Aeroacoustic Experiments in the LangleyLow-Turbulence Pressure Tunnel
Meelan M. Choudhari, David P. Lockard, Michele G. Macaraeg, Bart A. Singer, and
Craig L. Streett
Langley Research Center, Hampton, Virginia
Guy R. Neubert, Robert W. Stoker, and James R. Underbrink
Boeing Commercial Aircraft, Seattle, Washington
Mert E. Berkman, Mehdi R. Khorrami, and Shelly S. Sadowski
High Technology Corporation, Hampton, Virginia
National Aeronautics and
Space Administration
Langley Research CenterHampton, Virginia 23681-2199
February 2002
Acknowledgments
Many individuals contributed to various aspects of this work. The authors especially would like to thank the crews atthe Langley Low-Turbulence Pressure Tunnel for making this work possible.
The use of trademarks or names of manufacturers in this report is for accurate reporting and does not constitute an I
official endorsement, either expressed or implied, of such products or manufacturers by the National Aeronautics andSpace Administration.
Available from:
NASA Centerfor AeroSpaceInformation (CASI)7121 Standard Drive
Hanover, MD 21076-1320(301)621-0390
National Technical Information Service (NTIS)
5285 Port Royal Road
Springfield, VA 22161-2171(703) 605-6000
Contents
Nomenclature ...................................................................................................................................................... iv
1. Introduction ..................................................................................................................................................... 1
2. Experimental Details ...................................................................................................................................... 1
2.1. Experimental Facility ............................................................................................................................. 1
2.2. Airframe Model ...................................................................................................................................... 2
2.3. Instrumentation ...................................................................................................................................... 3
2.3.1. Pressure-Sensitive Paint ................................................................................................................ 3
2.3.2. Surface Pressure Ports ................................................................................................................... 3
2.3.3. Unsteady Surface Pressure ............................................................................................................ 3
2.3.4. Phased Microphone Array ............................................................................................................. 4
3. Results ............................................................................................................................................................. 8
3.1. Flap Side Edge ....................................................................................................................................... 8
3.1.1. Mean Flow ..................................................................................................................................... 8
3.1.2. Unsteady Surface Pressures ........................................................................................................ 11
3.1.3. Acoustics ...................................................................................................................................... 14
3.1.4. Flap-Side-Edge Modifications .................................................................................................... 17
3.2. Leading-Edge Slat ................................................................................................................................ 28
3.2.1. Mean Flow ................................................................................................................................... 28
3.2.2. Unsteady Surface Pressures ........................................................................................................ 29
3.2.3. Acoustics ...................................................................................................................................... 30
3.2.4. Slat Modifications ....................................................................................................................... 32
4. Concluding Remarks .................................................................................................................................... 37
References .......................................................................................................................................................... 38
111
Nomenclature
c speed of sound
cruise-wing chord
Cp pressure coefficient
f frequency
M Mach number
Re Reynolds number based on
SPL sound pressure level
x streamwise distance along wing
c_ angle of attack of configuration
6f flap deflection
6 s slat deflection downward
iv
Abstract
A phased microphone array was used in the Langley Low-Turbulence
Pressure Tunnel to obtain the radiated acoustic JieldJbom high-lift wing
conJ_gurations that included a slat and a part-span flap. The data
included noise localization maps and acoustic spectra.
1. Introduction
Airframe-generated noise is an important component of the total noise radiated from commercial
aircraft, especially during the approach. Recent studies by Davy and Remy (ref. 1) on a scale model of an
Airbus aircraft indicate that the high-lift devices and landing gear are the main sources of airframe noise
when the aircraft is configured for approach. Earlier tests on a model of a McDonnell Douglas DC-10
aircraft also identified the high-lift system as an important airframe noise source (ref. 2).
Dobrzynski et al. (ref. 3) performed full-scale experimental studies in an open-jet wind tunnel on a
portion of a wing equipped with a high-lift system. They found that both the leading-edge slat and the
side edge of the trailing flap contributed significantly to airframe noise.
An extensive experimental and computational effort to study the various mechanisms associated with
airframe-generated noise continues at NASA Langley Research Center (ref. 4), including tests performed
in the NASA Langley Quiet Flow Facility (QFF) (refs. 5-7). Many aspects of the work are described
elsewhere (refs.8-10); this report documents the experimental conditions and the salient results.
Section 2 discusses the experimental facility, the model geometries, and the instrumentation used.
Section 3 summarizes the results and important conclusions from the various tests.
2. Experimental Details
This report documents three wind tunnel entries. The first entry, in August 1997, focused on noise
emanating from the flap side edge. This wind tunnel entry is logged as Flap-Edge Noise Test 403. The
second entry, in April 1998, explored some noise-reduction technologies for flap-side-edge noise and then
examined slat noise. The respective portions of the tests are logged as Flap-Edge Noise II Test 409 and
Slat Noise Test 410. The third entry, in June 1999, tested some noise-reduction techniques for slat noise
and then studied landing-gear noise. These studies are logged as Acoustics-Flap Noise Test 420 and
Acoustics-Landing Gear Test 421, respectively. Details of the landing-gear test are not discussed here.
2.1. Experimental Facility
The tests involved a series of aeroacoustic experiments performed in the Langley Low-Turbulence
Pressure Tunnel (LTPT). The LTPT is a closed-loop wind tunnel that can operate at pressures up to
10 atm, thereby providing the capability to test at variable Reynolds numbers without changing the Mach
number. This capability, critical to these tests, enabled clear determination of which effects were
Reynolds number related and which could reasonably be expected to exist in flight. A detailed description
of the tunnel is given by McGhee, Beasley, and Foster (ref. 11). Some details pertinent to these tests aresummarized below.
Unfortunately, the wind tunnel is not well suited for aeroacoustic tests. The tunnel walls are all hard
and the test section is not large; its dimensions are 3 ft wide, 7.5 ft high, and 7.5 ft long
(0.98 m x 2.46 m x 2.46 m). The tunnel has a passive boundary layer control system for venting sidewall
boundarylayersthroughporousendplates,butaeroacousticconcernsledtotheuseofsolidendplates.Thetunneltemperaturewascontrolledbytunnelcoolingvanes,butautomaticcontroloftunnelpressurizationwasdisabledto avoidnoiseintroducedbycontrolvanes.Anotheraeroacousticconcernwasthemodelsupportarcsectorthatextendsfromthetunnelfloor to theceilingatthedownstreamendof thetestsection.Thearcsectorisdesignedto supportinstrumentationfor measuringdetailsof themodelwake.Leftuntreated,openingsin thearcsector(suchasscrewholesandrecessesformountingequipment)wereamajorsourceofnoise.Simplytapingtheopeningswasinsufficient;thehighoperationalpressuresoftenburstthetape.Ultimatelyametalplatewasfabricatedto coverseveralmajoropenings,all remainingopeningsinthearcsectorwerecaulkedwithacryliccaulk.
ThetargetReynoldsnumbersbasedonthemodelmeanchordin thecruiseconfigurationwere3.6,7.2,14.4,and19.2x 106.ThetargetMachnumberswere0.125,0.2,and0.3.Notall entrieswererunatallReynoldsandMachnumbers.BecausestrongReynoldsnumbereffectswereobservedonlyforthelowestReynoldsnumber,mostof therunsusedaReynoldsnumber(Re)of 7.2x 10⁶or greater.TheMachnumber(M) of 0.2wasselectedasthebaselineMachnumberfor thesetests;theotherMachnumberswereusedprimarilytodeterminescalinglaws.
2.2. Airframe Model
The two-dimensional (2D) NASA Energy Efficient Transport (EET) wing described by Morgan
(ref. 6) served as the basic model for the tests. In the cruise configuration, the wing has a chord g of
21.65 in. (55 cm); this is the chord with which lengths will be nondimensionalized. In the 1998 and 1999
tests, the same leading-edge slat was used. This slat has been described by Lin and Dominik (ref. 13). No
leading-edge slat was used in the 1997 test. Two flap configurations were used in the tests. In both the
1997 and 1998 tests, a part-span trailing flap was used. The part-span flap had a span of 19 in. (48.26 cm)
and a 6.5 in. (16.5 cm) chord (30 percent of chord). For the 1999 test, a full-span trailing flap was desired.
Unfortunately, a full-span version of the part-span flap previously tested was not available. Rather than
build an entirely new full-span flap, the full-span flap of Lin and Dominik (ref. 13) was used. This flap
was also a 30-percent chord flap, but its contour differed from that used in the previous tests.
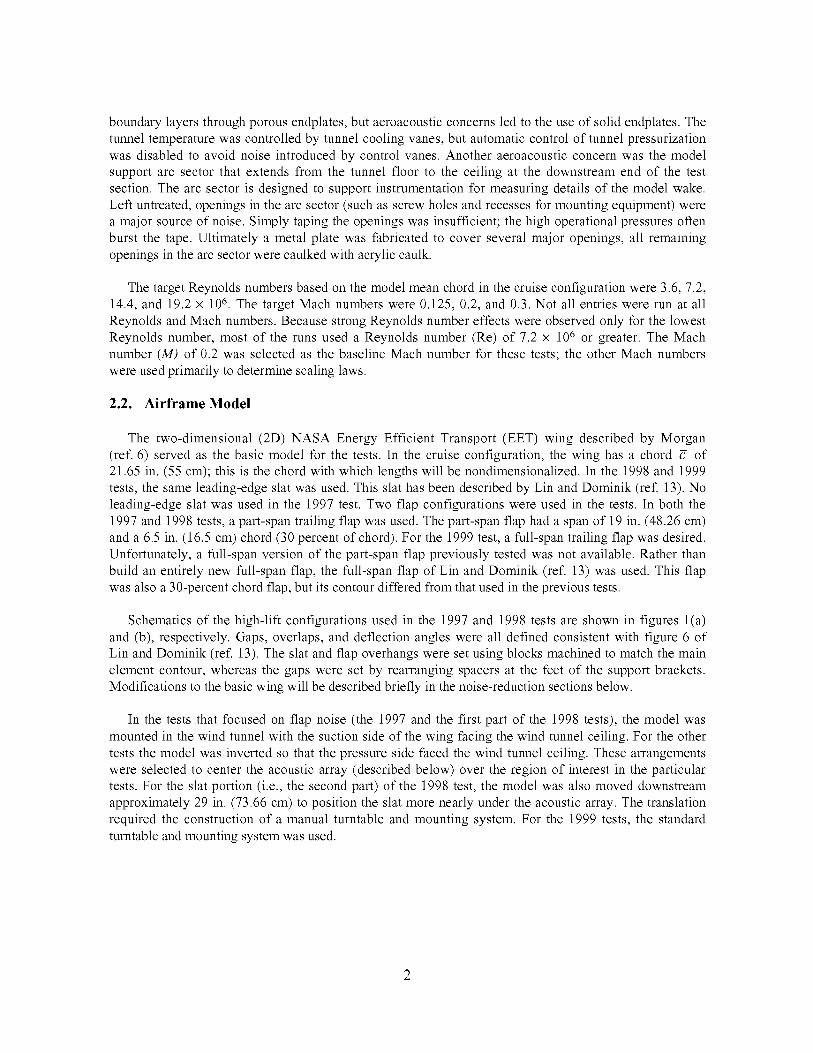
Schematics of the high-lift configurations used in the 1997 and 1998 tests are shown in figures l(a)
and (b), respectively. Gaps, overlaps, and deflection angles were all defined consistent with figure 6 of
Lin and Dominik (ref. 13). The slat and flap overhangs were set using blocks machined to match the main
element contour, whereas the gaps were set by rearranging spacers at the feet of the support brackets.
Modifications to the basic wing will be described briefly in the noise-reduction sections below.
In the tests that focused on flap noise (the 1997 and the first part of the 1998 tests), the model was
mounted in the wind tunnel with the suction side of the wing facing the wind tunnel ceiling. For the other
tests the model was inverted so that the pressure side faced the wind tunnel ceiling. These arrangements
were selected to center the acoustic array (described below) over the region of interest in the particular
tests. For the slat portion (i.e., the second part) of the 1998 test, the model was also moved downstream
approximately 29 in. (73.66 cm) to position the slat more nearly under the acoustic array. The translation
required the construction of a manual turntable and mounting system. For the 1999 tests, the standard
turntable and mounting system was used.
J L-
(a) Configuration for 1997 test and first part of 1998 test.
(b) Configuration for second part of 1998 test.
Figure 1. High-lift wing section. Slotted flap shown with flap deflection 8f 30 °. Slat shown with slat deflection8s 30°.
2.3. Instrumentation
Various types of measurements were taken during these tests. Pressure-sensitive paint was used during
the 1997 entry to determine flap-side-edge vortex paths. This technique was not used during later wind
tunnel entries. Surface pressure measurements were taken for portions of all three entries. Extensive
phased microphone array data were taken during all three entries. Additional aerodynamic data were
taken during aerodynamic portions of the 1997 and 1998 entries and will be reported elsewhere.
2.3.1. Pressure-Sensitive Paint
Pressure-sensitive paint (PSP) was used to help determine vortex trajectories associated with the flap
side edge. The paint changes color in response to the local static pressure. Vortices near a solid surface
leave a low-pressure footprint on the surface. A team from what was then McDonnell Douglas
Corporation applied the paint, took the photographs, processed the data, and plotted the mean pressure
fields on the flap surfaces. Data were obtained from cameras directed to the top of the flap (camera 3) and
the side edge of the flap (camera 4). The processed data on the flap top and side surfaces are in digital
format and can be viewed from a variety of angles. A more detailed analysis of the data is presented in thesection entitled "Mean Flow."
2.3.2. Su_ace Pressure Ports
The models included surface pressure ports for obtaining static pressure at discrete locations on themodels.
2.3.3. Unsteady Su_ace Pressure
Several of the models were outfitted with fluctuating pressure transducers for obtaining unsteady
pressure measurements on the wing elements. Most of the unsteady pressure data acquisition was
performed with a mix of equipment and staff from High Technology Corporation and The Boeing
Company. During the 1997 test, the signals from the unsteady pressure transducers were low-passed
filtered at 40 kHz. During the 1998 test, the unsteady pressure transducer data were reliable to a
frequency of about 70 kHz.
2.3.4. Phased Microphone Array
The microphone array and processing software were supplied by The Boeing Company. Underbrink
and Dougherty (ref. 14) and Dougherty (ref. 15) describe the use of logarithmic spirals in phased
microphone arrays. This spiraled array improves the signal-to-noise ratio available compared to
conventional microphone array configurations. The improved signal-to-noise ratio allows for the
acquisition of acoustic data in hard-wall tunnels. Mosher (ref. 16) and Mosher et al. (ref. 17) address
some additional issues that arise when using arrays in hard-wall wind tunnels.
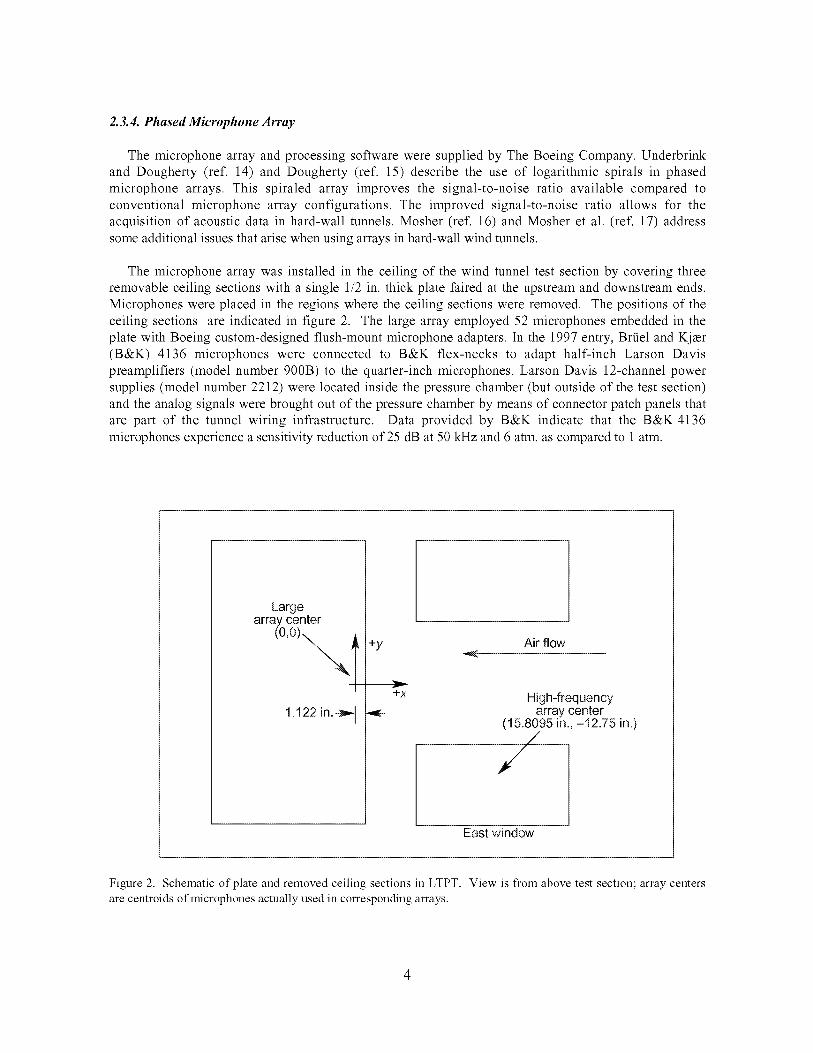
The microphone array was installed in the ceiling of the wind tunnel test section by covering three
removable ceiling sections with a single 1/2 in. thick plate faired at the upstream and downstream ends.
Microphones were placed in the regions where the ceiling sections were removed. The positions of the
ceiling sections are indicated in figure 2. The large array employed 52 microphones embedded in the
plate with Boeing custom-designed flush-mount microphone adapters. In the 1997 entry, Briiel and Kj_er
(B&K) 4136 microphones were connected to B&K flex-necks to adapt half-inch Larson Davis
preamplifiers (model number 900B) to the quarter-inch microphones. Larson Davis 12-channel power
supplies (model number 2212) were located inside the pressure chamber (but outside of the test section)
and the analog signals were brought out of the pressure chamber by means of connector patch panels that
are part of the tunnel wiring infrastructure. Data provided by B&K indicate that the B&K 4136
microphones experience a sensitivity reduction of 25 dB at 50 kHz and 6 atm. as compared to 1 atm.
Largearray center
[
1.122 in.-_
+y _4 Air flow
+x High-frequencyarray center
(15.8095 in.,-12.75 in.)
/East window
Figure 2. Schematic of plate and removed ceiling sections in LTPT. View is from above test section; array centersare centroids of microphones actually used in corresponding arrays.
SubsequenttestsusedB&K 4136WB1437microphones,whichhavea substantialsensitivityimprovementathighfrequenciesunderpressurizedconditions.Themaximumlossin sensitivitywiththenewmicrophoneswasabout15dBatapproximately40kHz.Theuseof thenewmicrophonesimprovedthedynamicrangeofthemeasurements.The1999testhadanadditionalequipmentupgradewiththeuseofB&Kpreamplifiers(modelnumber2670/WH3188)andBoeing-built16-channelpowersupplies.
In all tests,datawereacquiredastime serieswith HewlettPackardHP-3565dataacquisitionhardware.Thesystemconsistedof anHP-35654Acontrolmodule,anHP-35653Asourcemodule,twoHP-35659ASCSI(smallcomputersysteminterface)diskcontrollermodules,andupto 60HP-35652Binputmoduleswith 102.4kHz databandwidth.Theinputmodulescontainedall thenecessarysignalconditioningfor qualitydigitaldataacquisition,includinganalogantialiasingfilters,16bit A/D (analogto digital)converters(dynamicrangeof 75dB).Theconvertershaverangingcapabilitythatenablesdynamicrangeoptimizationwhendigitizingthedata.UsingBoeingcustomdataacquisitionsoftware,digitaldatawerestreamedin realtimetotwoSCSIdiskdrivesof2 Gbeachandsuccessivelyuploadedtothehostcomputer(anHP-9000/385workstation).Onthehostcomputertheywerewrittentobinaryfilesasdigitized(rawinteger)values,alongwithinformationtoconvertthedatatovolts.
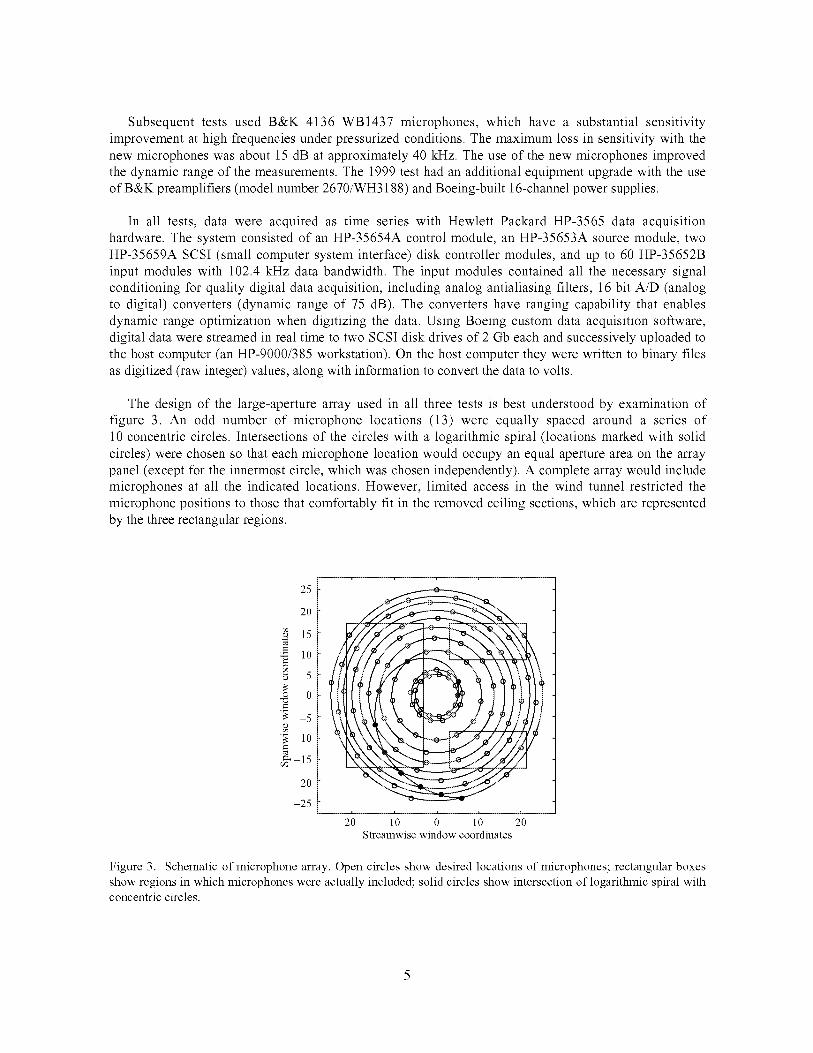
Thedesignof thelarge-aperturearrayusedin all threetestsis bestunderstoodby examinationoffigure 3. An oddnumberof microphonelocations(13)wereequallyspacedarounda seriesof10concentriccircles.Intersectionsof thecircleswitha logarithmicspiral(locationsmarkedwithsolidcircles)werechosensothateachmicrophonelocationwouldoccupyanequalapertureareaonthearraypanel(exceptfortheinnermostcircle,whichwaschosenindependently).A completearraywouldincludemicrophonesat all the indicatedlocations.However,limitedaccessin thewindtunnelrestrictedthemicrophonepositionsto thosethatcomfortablyfit in theremovedceilingsections,whicharerepresentedbythethreerectangularregions.
..=©
8
©
..=
_=&
25 -
20
15
10
5
0
5
10
15
20
25
J
n _ x _ J
20 10 0 10 20Streamwise window coordinates
Figure 3. Schematic of microphone array. Open circles show desired locations of microphones; rectangular boxes
show regions in which microphones were actually included; solid circles show intersection of logarithmic spiral withconcentric circles.

Thearraywasinitiallydesignedto workwellupto afrequencyof40kHz,buttestsindicatedthatthestrongestsidelobeat80kHzwasnotsignificantlystrongerthanthatat40kHz.Formostfrequencies,theworstcasesidelobein aplaneparalleltothearray,atadistanceequaltothedistanceof themodelfromthearray,wasapproximately8 dBdownfromthepeak.However,designinganarrayonapanelwhererelativelylargeregionsarenotinstrumentedyieldedanundesirableoutcome,asdescribedbelow.
In thepast,untilandincludingthiswork,thearraydesignprocessinvolvedtheevaluationof arrayresolutionandsidelobecharacteristicsonaplanarsurfaceneartheregionof interestfor thetest.Worstcasesidelobesweredeterminedatmanyfrequenciesonaplanarsurfaceparalleltothearraysurfaceatthesamedistancefromthearrayasthemodelwouldbeduringthetest.Thisprocessdidnotdetectlargeout-of-planesidelobesthatwerelaterdiscoveredfor thisarray.Fortuitously,theout-of-planesidelobeswereabove-and-aftandbelow-and-forwardof asourceneartheflapedge,andthereforedidnotinterferewithflap-side-edgemeasurements.
In designinganarray,anotherimportantissueshouldbeconsidered.Volumetricbeamformingshowsthatisosurfacesof constantnoiselevelareellipsoidswithmajoraxesorientedonalinefromthesourcetothephasecenterofthearray.Thisorientationmeansthattheworstresolution(abilityto separatecloselyspacedsources)is alongthismajoraxis.In casesinwhichmultiplenoisesourcesneedtobeconsidered,careshouldbetakentoensurethatthesourcesarenotcollinearwiththephasecenterof thearray.Suchcollinearitywouldmakedistinguishingthedifferentnoisesourcesverydifficult. For instance,thissituationcouldariseif a landinggearweremountedonthewingandthearraycenter,thewheelsofthelandinggear,andtheslatgapwereallcollinear.
The1999windtunnelexperimentalsoincludeda60-microphonesmall-aperturearray,locatedin theeastwindowplateofthewindtunnel(seefig. 2).Thisarraywasdesignedtoworkwelluptoafrequencyof 80kHz,andthereforeis sometimesreferredtoasthehigh-frequencyarray.Eachconcentriccircleofthearrayincluded11equallyspacedmicrophones.Theirrelativepositionswerechosenby usingaproceduresimilartothatusedfor thelarge-aperturearray.Thepanel'slayoutofmicrophonesisshowninfigure4. Inthefigure,theasterisksmarkthelocationof microphonesassociatedwiththelarge-aperture
6 i i i i i i i
4
2©
8
o 0
._ 2
_=4
610
0 0 0 00 0
00
0 0 0 0 0 0 _0 0 0 0
0 0 0 0 00
0 0 0 00 0 0
0 00 0 0
0 0 0 0 _ 0 0
0 0 0 0
0 0 0 0 0 _ 0
0 0O 0 0 0 0 0
I I I I I I I I I
8 6 4 2 0 2 4 6 8 10Streamwise window coordinates
Figure 4. Schematic of microphones mounted in east window plate. Circles show locations of microphones for
small-aperture array; asterisks show locations of microphones used in large-aperture array.
array.Wheretheselarge-aperturemicrophonelocationsweretooclosefor mountingpurposesto thedesiredlocationof a microphonefor thesmall-aperturearray,thesmall-aperturemicrophonewasexcluded.Theconfigurationof thearraywaschosenfromanalyticalandempiricaldataregardingtheslatnoisesource.All microphonesin thesmall-aperturearraywereintendedtobewithinthemainlobeof theslatnoisesource,wherethemainlobewasobtainedfromSinger,Lockard,andBrentner(ref.8).
Calibrationswereperformedacrossthefrequencyrangeof interestwithmultiplespeakersources,includingalow-frequencypipespeaker,asupertweeter,andanionophone.Thespeakerswerecarefullypositionedandthepositionsdocumented.Theknowngeometryenableddeterminingtheas-installedchannel-to-channelphaseandamplitudedifferencesbetweenthe end-to-endmeasurementsystemchannels.A spectrumfromareferencemicrophone(acentralmicrophonein thearray)wascapturedforusein calibratingthearraylevel.Pressure-responsedatawereappliedto thereferencemicrophonetoaccountfor microphonesensitivityvariationsunderpressurizedconditions.In the1999test,a sonicdigitizerwasusedfor thefirst timeto determinetestgeometry.Thismethodprovidedmoreaccuratedeterminationof testgeometrythanthepreviousplumbbobandtapemeasuremethods.However,thetightconfinesoftheLTPTtestsectionmadeusingthesonicdigitizerarraydifficult.
Processedacousticarraydataprovided"sourcelocalizationmaps"foreachfrequencyprocessed.Poorspatialresolutionin thedirectionnormalto thearrayunderminedassociatinganoisesourcewitheithertheupperor lowersideof theflapbasedonlyonasinglefigure.Inpractice,viewingmultipleplanesofsuchdatais usefulandoftengiveshintsthatstronglysuggestonesourceovertheother,butpreciselocalizationin thenormaldirectionis notyetpossible.However,theacousticarrayhadgoodspatialresolutioninplanesparallelto thearray,sothelocalizationmapswereusefulforlocalizingconcentrateduncorrelatedsourcesin thecontourplane.Theacousticarraypostprocessingwasnotsuitedforlocalizingspatiallyextendedsources(likeconventionaltrailing-edgenoise)norsourcesthatwerecorrelated.Foruncorrelatedsources,sidelobestypicallyappearedabout8dBbelowthepeakamplitude.Fordistributedsources,thesidelobescouldappearatamplitudesmuchclosertothepeak.
Moredifficultieswereencounteredwhendataat differentfrequencieswereto becompared.Mostoften,spatiallyintegratedspectrawerechosenfor study. Theintegratedspectrawere1/12-octaveinfrequencyandhadbeenintegratedoverthespatialdomain.Gridpointswithnoiseamplitudesmorethan8dB downfromthepeakwerenot includedin theintegration.Theexclusionof thesepointsfromtheintegrationwasintendedtoavoidintegratingthesidelobecontributions.
Althoughthisprocedureis generallybelievedto provideusefulinformation,onoccasionit hasthepotentialto bedeceiving.In particular,ata givenfrequency,considerabaselinecasein whichnoiseemanatesataboutthesameamplitudefromalargeportionof thespatialdomain.All of thegridpointswill be includedin the integratedresultfor thisbaselinecase.If somemodificationto thebaselineconfigurationweretointroduceanewhigh-amplitudesourcethatwashighlylocalizedin thedomainandmorethan8 dBstrongerthanthebackgroundnoisethatpreviouslyexisted,mostof thegridpointsthatpreviouslycontributedtotheintegratedresultswouldbediscountedin thenewintegrationbecausetheiramplitudewouldbemorethan8 dBdownfromthepeak.Dependinguponthedetails,thisphenomenoncouldresultin theloudernoisecaseactuallyintegratingto a lowervaluethanthebaselinecase.Thissituationwasavoidedinmostcasesbyconsideringbothpeakandintegratedresultsduringdatareductionandevaluation.
In spiteof thesedifficulties,theacousticarraysprovidevaluableinformationfor unravelingthephysicsandevaluatingvariousnoise-reductiontechniques.

3. Results
3.1. Flap Side Edge
Noise generated near the side of the flap is related to the unsteady flow associated with the side-edge vortices.
Therefore, considerable effort was expended in understanding the details of the vortices in the vicinity of the flapside. Both computational and experimental efforts focused towards understanding this flow are reported by
Berkman et al. (ref. 9). Section 3.1.1 describes the mean flow. In section 3.1.2, experimentally obtained surfacepressure information is supplemented with knowledge of the flow obtained from numerical simulations.
Section 3.1.3 describes key features of the acoustic field. Finally, section 3.1.4 concludes with a review of theperformance of noise-reduction techniques for the flap side edge.
3.1.1. Mean Flow
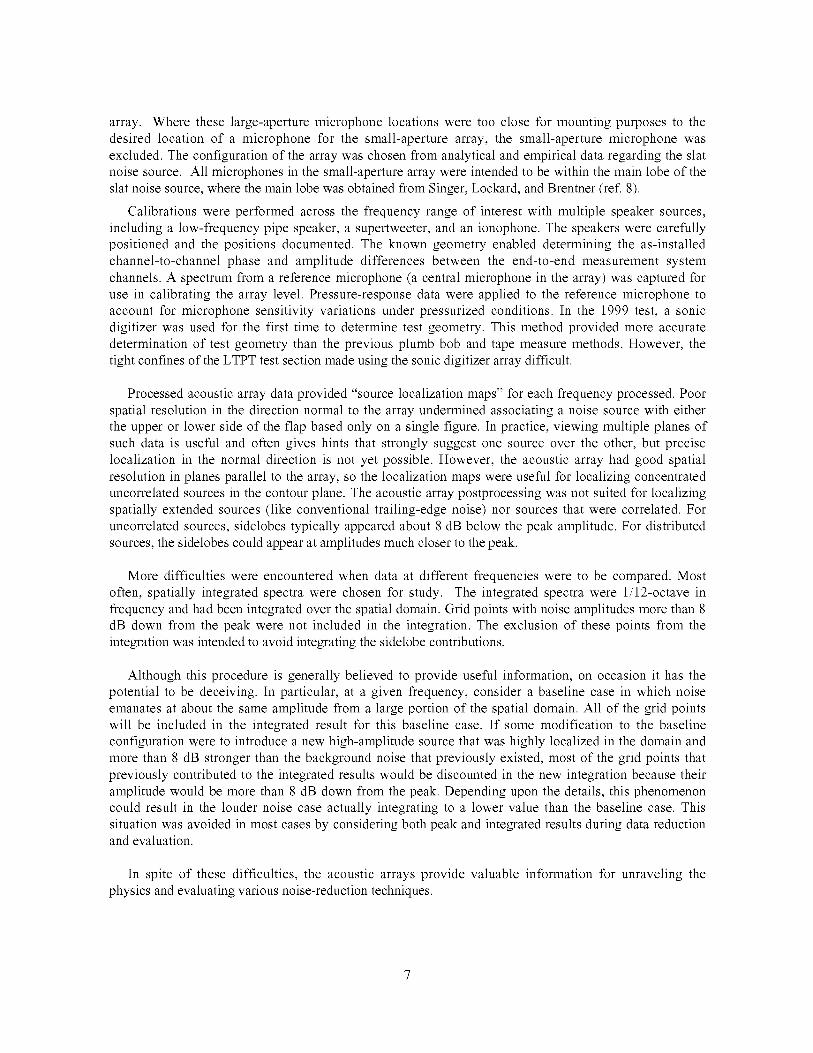
A rendition of the main element and the flap is shown in figure 5. The dashed line is approximately
1.0 in. (2.54 cm) inboard of the flap side edge and indicates the approximate location of the line of
pressure taps used to obtain the pressure distribution over the main element and the flap as illustrated in
figure 6. The second suction peak on the flap is caused by strong suction of the vortex. Pressure
distributions farther from the flap side edge do not show the second peak. The main element used was not
the cruise-configuration main element, but the high-lift configuration without the leading-edge slat.
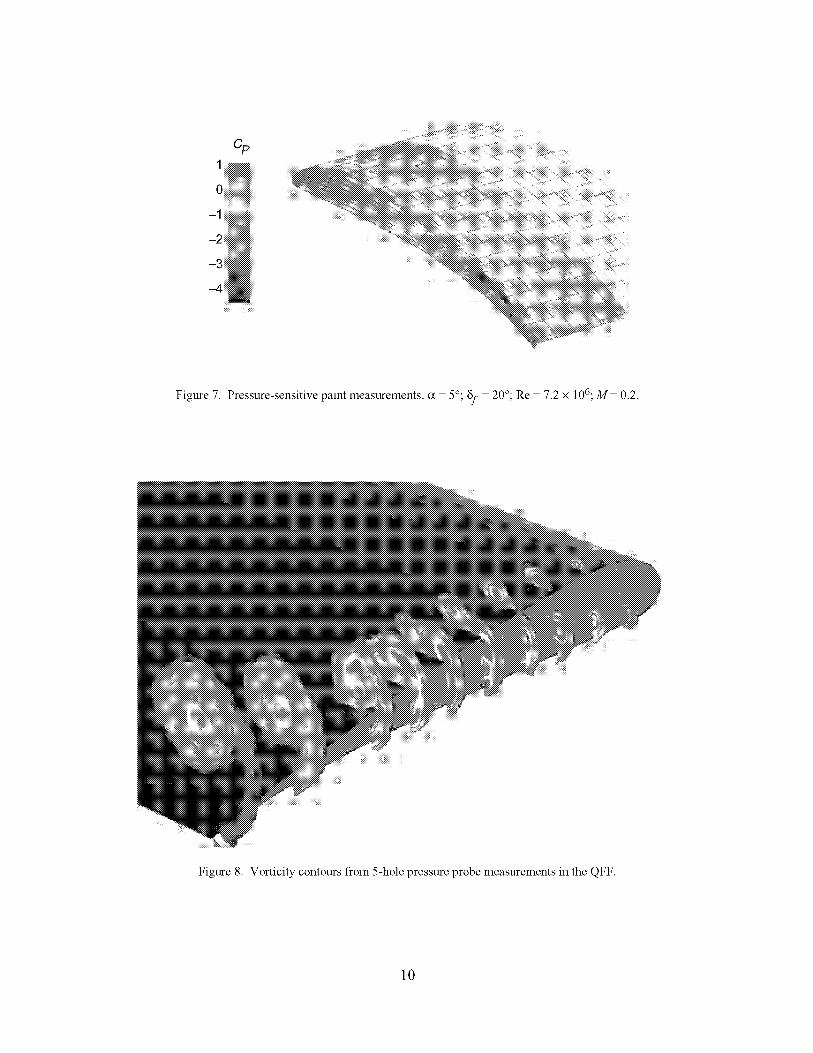
Essentially continuous pressure distributions from the PSP measurements are shown in figure 7. The
pressure distributions confirm that a dual vortex system exists near the flap side edge. In the current tests,
the stronger vortex forms on the flap top surface. This result differs from observations made with a
different configuration that was tested in the NASA Langley Quiet Flow Facility (QFF) and the
Ames 7- by 10-Foot Subsonic Wind Tunnel (refs. 18-20). As shown in figure 8, five-hole probe
measurements from the QFF show that the stronger vortex in those experiments developed on the flap
side edge. The flap side-edge vortex then merged with the flap top surface vortex (ref. 18). However, the
general trajectories of the vortices are similar. In the current experiments, the low-pressure region near
the side edge of the flap top surface in figure 7 reveals that the flap-top vortex moves slightly inboard as it
moves downstream. The weaker vortex forms on the flap side edge close to the bottom comer where the
boundary layer on the flap separates. It grows in strength in the downstream direction and eventually
migrates onto the flap-top surface, where it merges with the flap-top vortex.
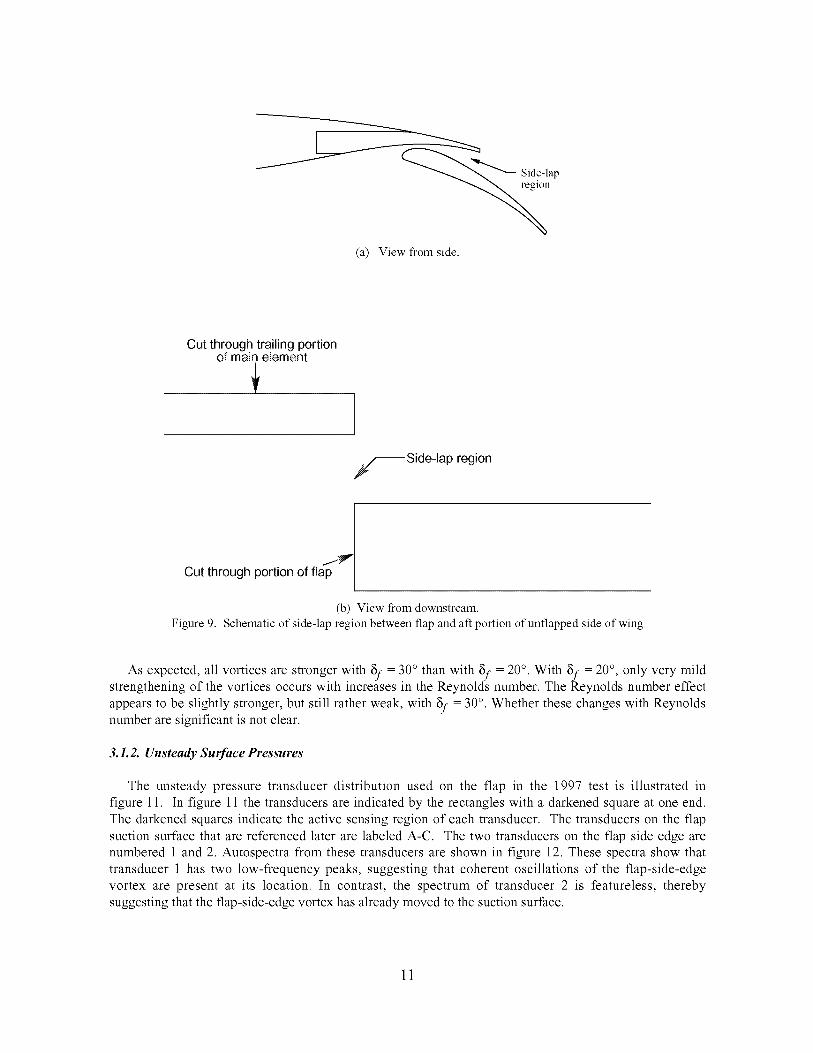
The delayed growth of the flap-side-edge vortex relative to that in the QFF experiments is related to
the extensive side-lap region for this wing. With reference to figures 9a and 9b, the side-lap region is the
space near the flap side edge between the flap and the aft portion of the wing on the portion without a
flap. The side-lap region extends over approximately 40 percent of the flap chord.
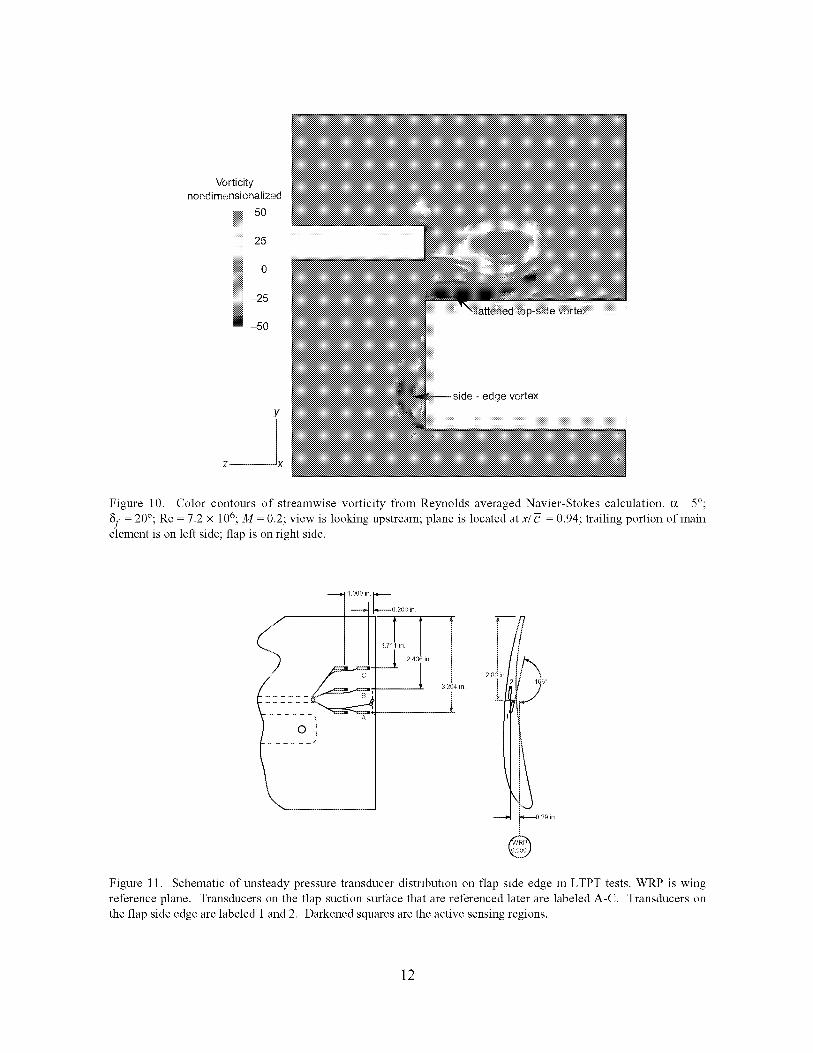
Figure 10, which is taken from figure 6 of Berkman et al. (ref. 9), shows a cross-stream plane of
streamwise vorticity contours from a Reynolds averaged Navier-Stokes calculation of the flow. The view
in the figure is towards the upstream direction. The presence of the side lap produces a high-speed flat jet
of fluid that results in a strong shear layer that separates from the main element. This shear layer quickly
rolls up into a main-element vortex with a sign opposite to that of the flap-side-edge and flap-top vortices.
The presence of the main-element vortex appears to flatten the flap-top vortex and delay the merging of
the flap-side-edge vortex with the flap-top vortex relative to what was observed in the experiments
performed in the QFF. The configuration used in the QFF had a smaller side-lap region.
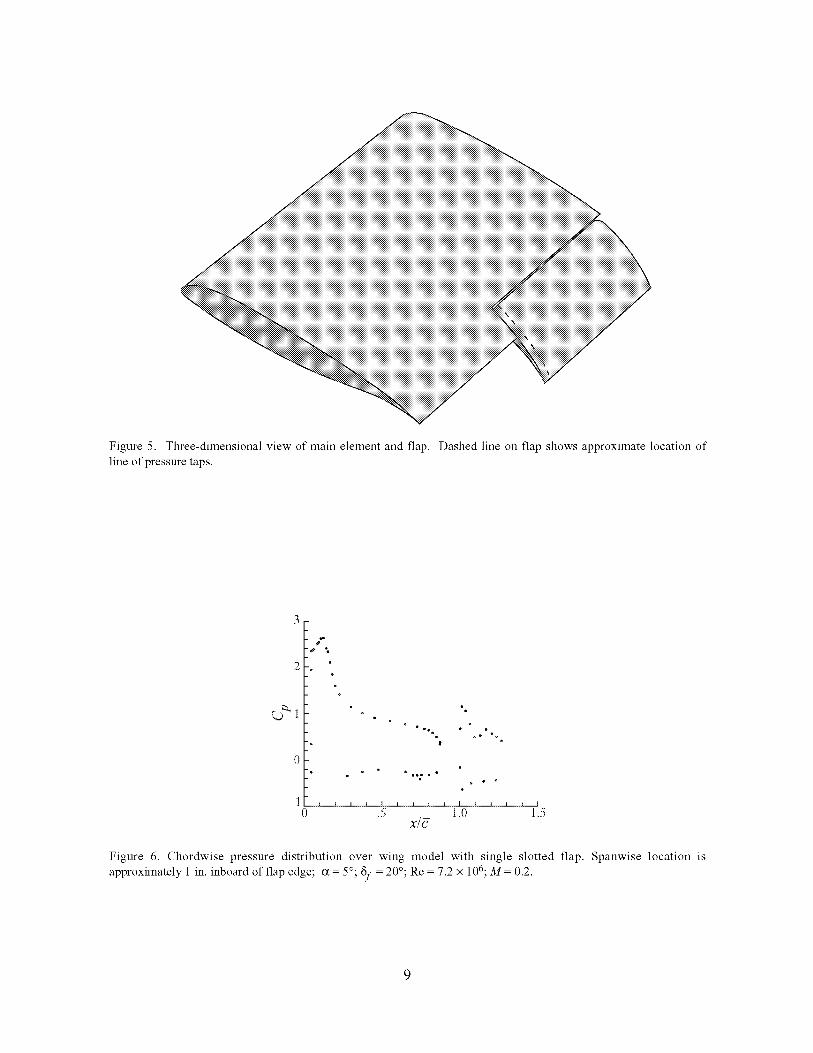
Figure5. Three-dimensionalviewofmainelementandflap.Dashedlineonflapshowsapproximatelocationoflineofpressuxetaps.
s"
2
0
0
Q)_II 6
06 ° O®
O ®
I R I I I I I I I R I I I J
.5 1.0 1.5X/g
Figure 6. Chordwise pressure distribution over wing model with single slotted flap. Spanwise location is
approximately 1 in. inboard of flap edge; c_ 5°; 8f 20°; Re 7.2 x 10⁶; M 0.2.
%
_2iiii_iii,,,iiiii_3iiii_ iiiiii_i_iii--4
Figure 7. Pressure-sensitive paint measurements, c_ 5°; 8f 20°; Re 7.2 x 10⁶; M 0.2.
iii ii ii̧ iii
Figure 8. Vorticity contours from 5-hole pressure probe measurements in the QFF.
10
J
(a) View from side.
Cut through trailing portionof main element
,----_ Side-lap region
/
Cut through portion of flap1"lP" I
(b) View from downstream.Figure 9. Schematic of side-lap region between flap and aft portion of unflapped side of wing
As expected, all vortices are stronger with 8f = 30 ° than with 8f = 20 °. With 8f = 20 °, only very mildstrengthening of the vortices occurs with increases in the Reynolds number. The Reynolds number effect
appears to be slightly stronger, but still rather weak, with 8f = 30 °. Whether these changes with Reynoldsnumber are significant is not clear.
3.1.2. Unsteady Su_ace Pressures
The unsteady pressure transducer distribution used on the flap in the 1997 test is illustrated in
figure 11. In figure 11 the transducers are indicated by the rectangles with a darkened square at one end.
The darkened squares indicate the active sensing region of each transducer. The transducers on the flap
suction surface that are referenced later are labeled A-C. The two transducers on the flap side edge are
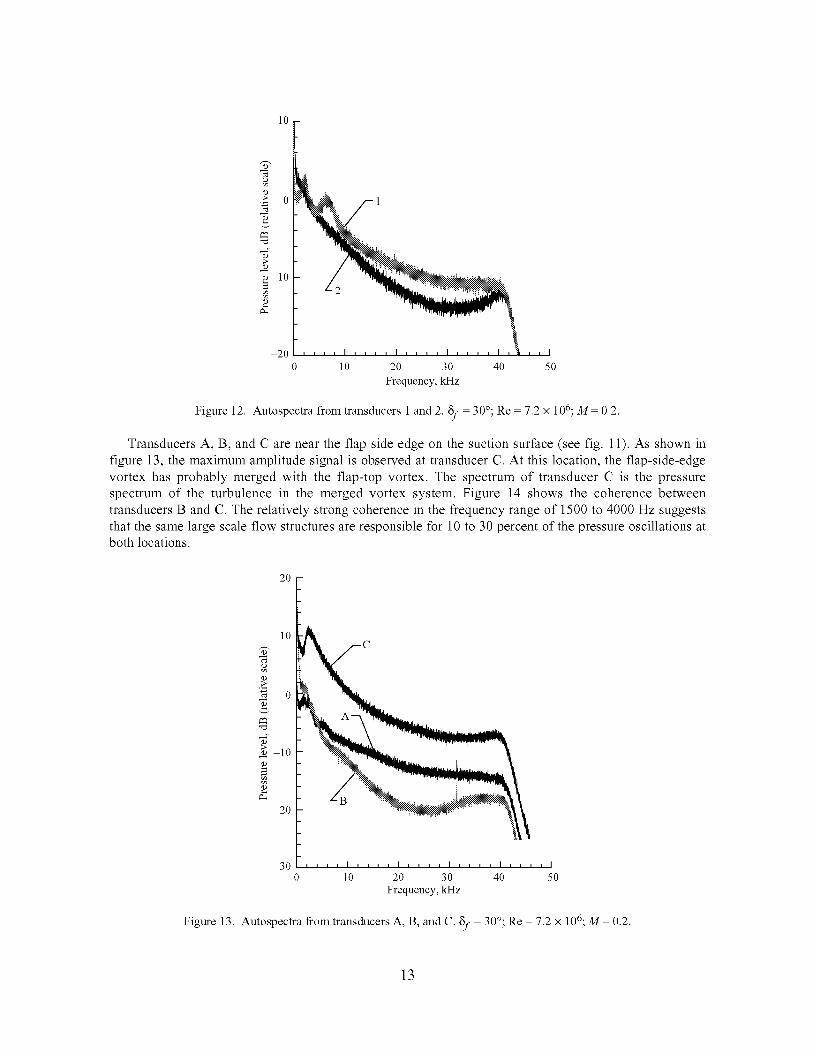
numbered 1 and 2. Autospectra from these transducers are shown in figure 12. These spectra show that
transducer 1 has two low-frequency peaks, suggesting that coherent oscillations of the flap-side-edge
vortex are present at its location. In contrast, the spectrum of transducer 2 is featureless, thereby
suggesting that the flap-side-edge vortex has already moved to the suction surface.
11
Vorticitynondimensionalized
5o25
---25
-50
Y
Z--X
-edge vortex
Figure 10. Color contours of streamwise vorticity from Reynolds averaged Navier-Stokes calculation, c_ 5°;
8f 20°; Re 7.2 x 10⁶; M 0.2; view is looking upstream; plane is located at x/c 0.94; trailing portion of main
element is on left side; flap is on right side.
1 000 in _0 200 in
Figure 11. Schematic of unsteady pressure transducer distribution on flap side edge in LTPT tests. WRP is wing
reference plane. Transducers on the flap suction surface that are referenced later are labeled A-C. Transducers on
the flap side edge are labeled 1 and 2. Darkened squares are the active sensing regions.
12
10
Z"
0
o 10
E
2o
0 10 20 30 40 50
Frequency, kHz
Figure 12. Autospectra from transducers 1 and 2.8f 30°; Re 7.2 x 10⁶; M 0.2.
Transducers A, B, and C are near the flap side edge on the suction surface (see fig. 11). As shown in
figure 13, the maximum amplitude signal is observed at transducer C. At this location, the flap-side-edgevortex has probably merged with the flap-top vortex. The spectrum of transducer C is the pressure
spectrum of the turbulence in the merged vortex system. Figure 14 shows the coherence betweentransducers B and C. The relatively strong coherence in the frequency range of 1500 to 4000 Hz suggests
that the same large scale flow structures are responsible for 10 to 30 percent of the pressure oscillations atboth locations.
2O
10
0
10o
2O
3O0 10 20 30 40 50
Frequency, kHz
Figure 13. Autospectra from transducers A, B, and C. 8f 30°; Re 7.2 x 10⁶; M 0.2.
13
.4
.3
.2
i |
0 2.5 5.0 7.5
Frequency, kHz
Figure 14. Coherence between transducers B and C. 8f 30°; Re 7.2 x 10⁶; M 0.2.
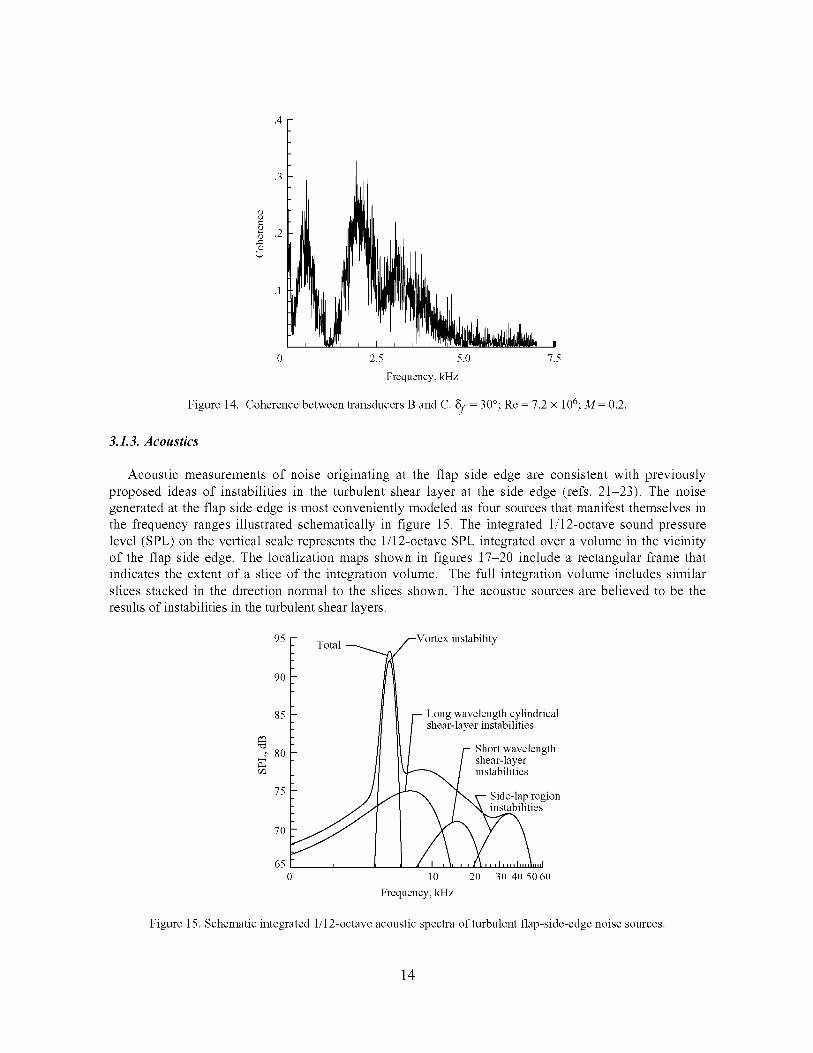
3.1.3. Acoustics
Acoustic measurements of noise originating at the flap side edge are consistent with previously
proposed ideas of instabilities in the turbulent shear layer at the side edge (refs. 21-23). The noise
generated at the flap side edge is most conveniently modeled as four sources that manifest themselves in
the frequency ranges illustrated schematically in figure 15. The integrated 1/12-octave sound pressure
level (SPL) on the vertical scale represents the 1/12-octave SPL integrated over a volume in the vicinity
of the flap side edge. The localization maps shown in figures 17-20 include a rectangular frame that
indicates the extent of a slice of the integration volume. The full integration volume includes similar
slices stacked in the direction normal to the slices shown. The acoustic sources are believed to be the
results of instabilities in the turbulent shear layers.
95-
9o
85
80
75
7o
650
Total -_
i
Vortex instability
-- Long wavelength cylindrical
shear-layer instabilities
U Short wavelength
l / shear-layer_-_ instabilities
/ _ /"x V Side-lap region
_i,,,s I
e
10 20 30 40 50 60
Frequency, kHz
Figure 15. Schematic integrated 1/12-octave acoustic spectra of turbulent flap-side-edge noise sources.
14

An actual spectrum of the SPL integrated over the flap-side-edge region is shown in figure 16. The
cutoff at 60 kHz is the result of a data management tradeoff and does not imply that no noise sources have
frequencies that exceed 60 kHz. The strongest noise source in figure 16 is associated with a strong
tone-like signal at slightly less than 5000 Hz.
Figures 17-20 show localization plots for run 61. The array centroid was approximately 1 m from the
flap suction surface. All localization plots shown here illustrate contours from the local maximum to
approximately 8 dB less than the maximum. Figure 17 shows a source localization plot of the noise at4870 Hz.
95-
9o
85
80
75
7o
65 i10 20 30 40 50 60
Frequency, kHz
Figure 16. Integrated 1/12-octave acoustic spectrum for run 61 of 1998 test. 8f 30°; Re 7.2 x 10⁶; M 0.2.
Figure 17. Localization plot for run 61 of 1998 test. f 4870 Hz; 8f 30°; Re 7.2 x 10⁶; M 0.2; local1/12-octave SPL peak is 92.5 dB.
15
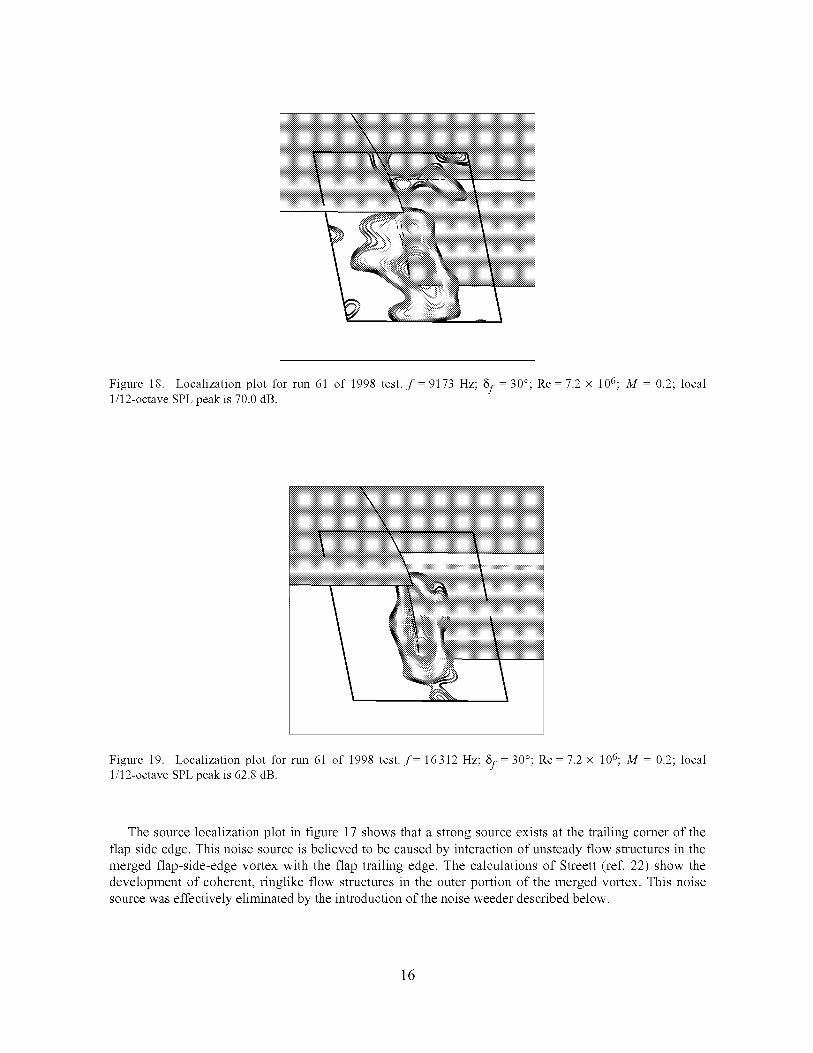
Figure18. Localizationplotfor run61of 1998test.f 9173 Hz; 8f 30°; Re 7.2 x 10⁶; M 0.2; local1/12-octave SPL peak is 70.0 dB.
IFigure 19. Localization plot for run 61 of 1998 test. f 16312 Hz; 8f 30°; Re 7.2 x 10⁶; M 0.2; local1/12-octave SPL peak is 62.8 dB.
The source localization plot in figure 17 shows that a strong source exists at the trailing corner of the
flap side edge. This noise source is believed to be caused by interaction of unsteady flow structures in the
merged flap-side-edge vortex with the flap trailing edge. The calculations of Streett (ref. 22) show the
development of coherent, ringlike flow structures in the outer portion of the merged vortex. This noise
source was effectively eliminated by the introduction of the noise weeder described below.
16
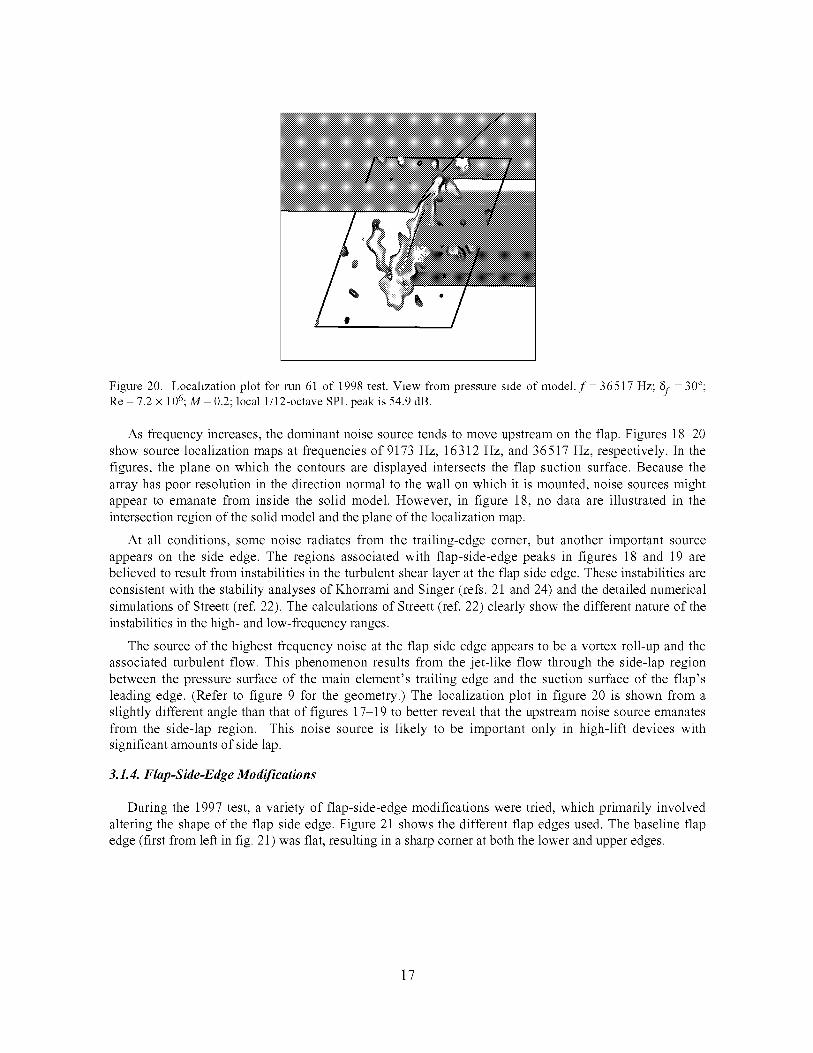
Figure 20. Localization plot for run 61 of 1998 test. View from pressure side ofmodel.f 36517 Hz; 8f 30°;Re 7.2 x 10⁶; M 0.2; local 1/12-octave SPL peak is 54.9 dB.
As frequency increases, the dominant noise source tends to move upstream on the flap. Figures 18-20
show source localization maps at frequencies of 9173 Hz, 16312 Hz, and 36517 Hz, respectively. In the
figures, the plane on which the contours are displayed intersects the flap suction surface. Because the
array has poor resolution in the direction normal to the wall on which it is mounted, noise sources might
appear to emanate from inside the solid model. However, in figure 18, no data are illustrated in the
intersection region of the solid model and the plane of the localization map.
At all conditions, some noise radiates from the trailing-edge corner, but another important source
appears on the side edge. The regions associated with flap-side-edge peaks in figures 18 and 19 are
believed to result from instabilities in the turbulent shear layer at the flap side edge. These instabilities are
consistent with the stability analyses of Khorrami and Singer (refs. 21 and 24) and the detailed numerical
simulations of Streett (ref. 22). The calculations of Streett (ref. 22) clearly show the different nature of the
instabilities in the high- and low-frequency ranges.
The source of the highest frequency noise at the flap side edge appears to be a vortex roll-up and the
associated turbulent flow. This phenomenon results from the jet-like flow through the side-lap region
between the pressure surface of the main element's trailing edge and the suction surface of the flap's
leading edge. (Refer to figure 9 for the geometry.) The localization plot in figure 20 is shown from a
slightly different angle than that of figures 17-19 to better reveal that the upstream noise source emanates
from the side-lap region. This noise source is likely to be important only in high-lift devices with
significant amounts of side lap.
3.1. 4. Flap-Side-Edge Modifications
During the 1997 test, a variety of flap-side-edge modifications were tried, which primarily involved
altering the shape of the flap side edge. Figure 21 shows the different flap edges used. The baseline flap
edge (first from left in fig. 21) was flat, resulting in a sharp comer at both the lower and upper edges.
17
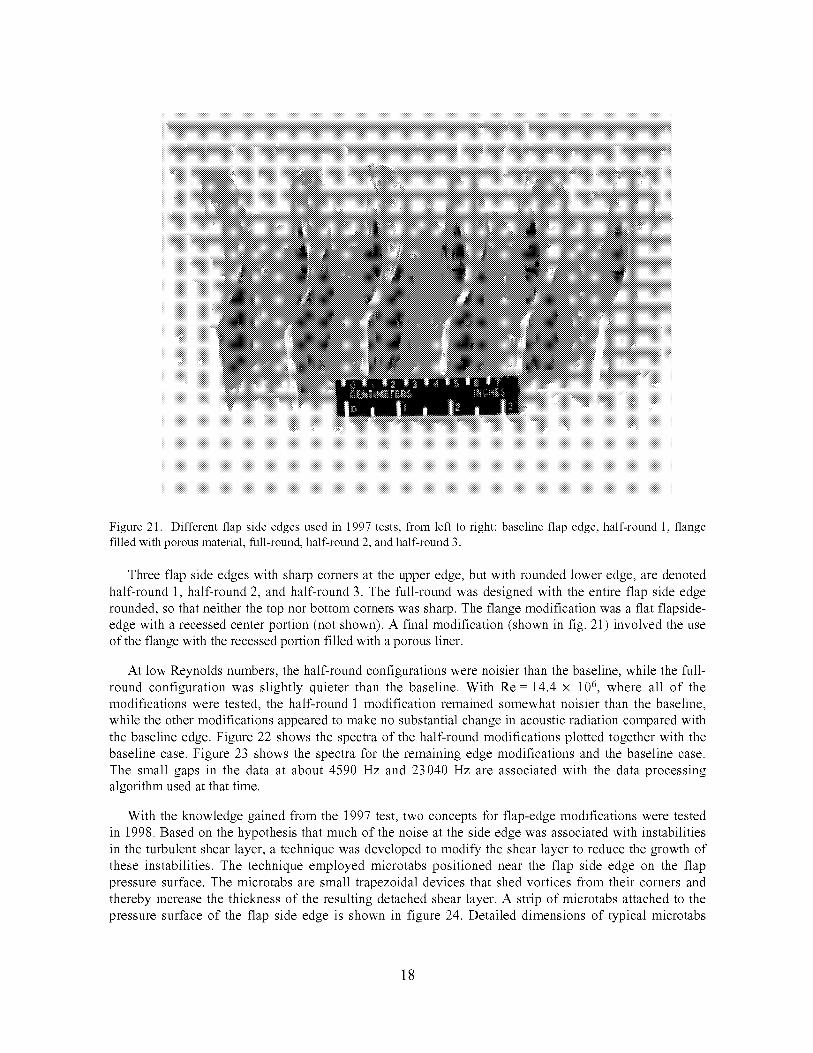
Figure21.Differentflapsideedgesusedin1997tests,fromlefttoright:baselineflapedge,half-round1,flangefilledwithporousmaterial,full-round,half-round2,andhalf-round3.
Threeflapsideedgeswithsharpcornersattheupperedge,butwithroundedloweredge,aredenotedhalf-round1,half-round2, andhalf-round3. Thefull-roundwasdesignedwiththeentireflapsideedgerounded,sothatneitherthetopnorbottomcornerswassharp.Theflangemodificationwasaflatflapside-edgewitharecessedcenterportion(notshown).A finalmodification"shown in fig. 21) involved the use
of the flange with the recessed portion filled with a porous liner.
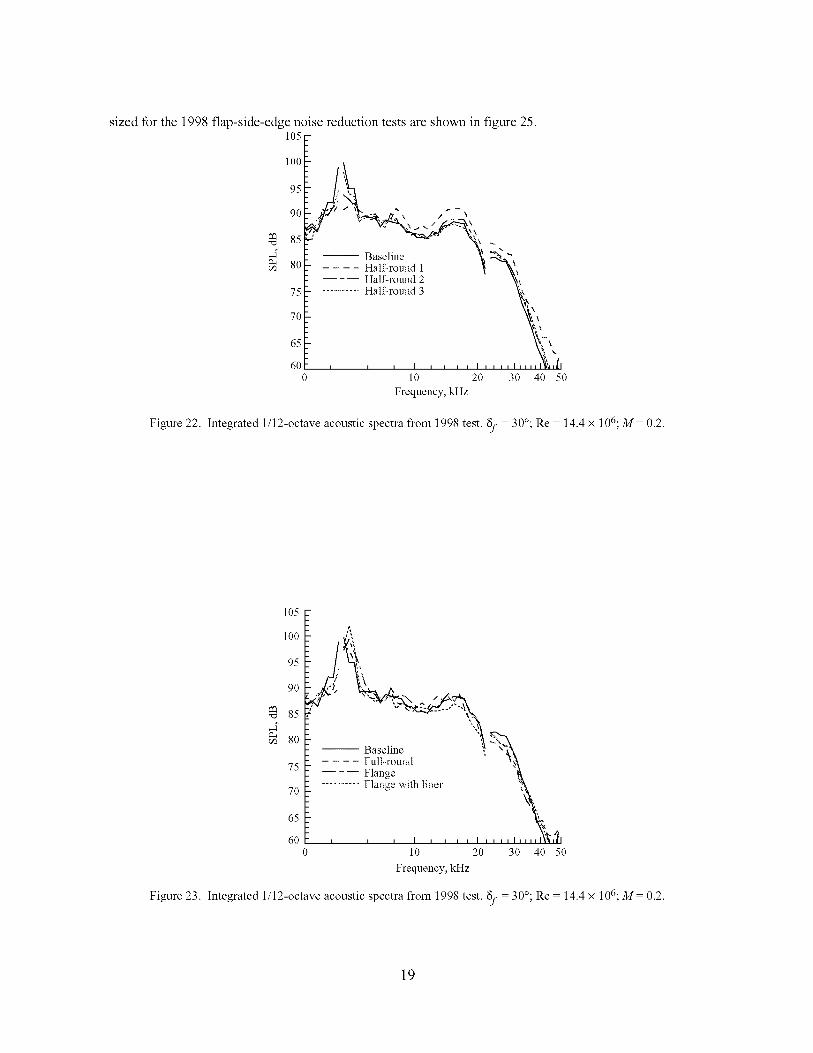
At low Reynolds numbers, the half-round configurations were noisier than the baseline, while the full-
round configuration was slightly quieter than the baseline. With Re = 14.4 x 10⁶, where all of the
modifications were tested, the half-round 1 modification remained somewhat noisier than the baseline,
while the other modifications appeared to make no substantial change in acoustic radiation compared with
the baseline edge. Figure 22 shows the spectra of the half-round modifications plotted together with the
baseline case. Figure 23 shows the spectra for the remaining edge modifications and the baseline case.
The small gaps in the data at about 4590 Hz and 23040 Hz are associated with the data processing
algorithm used at that time.
With the knowledge gained from the 1997 test, two concepts for flap-edge modifications were tested
in 1998. Based on the hypothesis that much of the noise at the side edge was associated with instabilities
in the turbulent shear layer, a technique was developed to modify the shear layer to reduce the growth of
these instabilities. The technique employed microtabs positioned near the flap side edge on the flap
pressure surface. The microtabs are small trapezoidal devices that shed vortices from their corners and
thereby increase the thickness of the resulting detached shear layer. A strip of microtabs attached to the
pressure surface of the flap side edge is shown in figure 24. Detailed dimensions of typical microtabs
18
sizedforthe1998flap-side-edgenoisereductiontestsareshownin figure25.105
100
95
90
85
8O
75
70
65
6O
0
-- Baseline
.... Hall'-rowed 1-- - -- Hall'-rowed 2
.......... Hall'-rowed 3
10 20
Frequency, kHz
30 504O
Figure 22. Integrated 1/12-octave acoustic spectra from 1998 test. 8f 30°; Re 14.4 x 10⁶;M 0.2.
105
100
95
9O
85
80
75
7O
65
60
-- Baseline
.... Full-round
---- Flange.......... Flange with liner
i i i I i i
10 20 30 40 50
Frequency, kHz
Figure 23. Integrated 1/12-octave acoustic spectra from 1998 test. 8f 30°; Re 14.4 x 10⁶;M 0.2.
19

Figure 24. Microbtabs on flap side edge.
W
,._------ a _________ b_
Figure 25. Schematic of typical microtab strip on flap side edge. For the LTPT experiments, a 0.075 in.,b 0.075 in.,c 0.051 in.,d 0.060in.,e 0.012in.,h 0.046in.,L 4in., W 0.10in.,c_ 50 °.
The microtabs used in this application thicken the mixing region and decrease mean shear. The shear
layers are therefore more stable because microtabs produce more mixing as a result of greater entrainment
associated with small vortices generated by the microtabs.
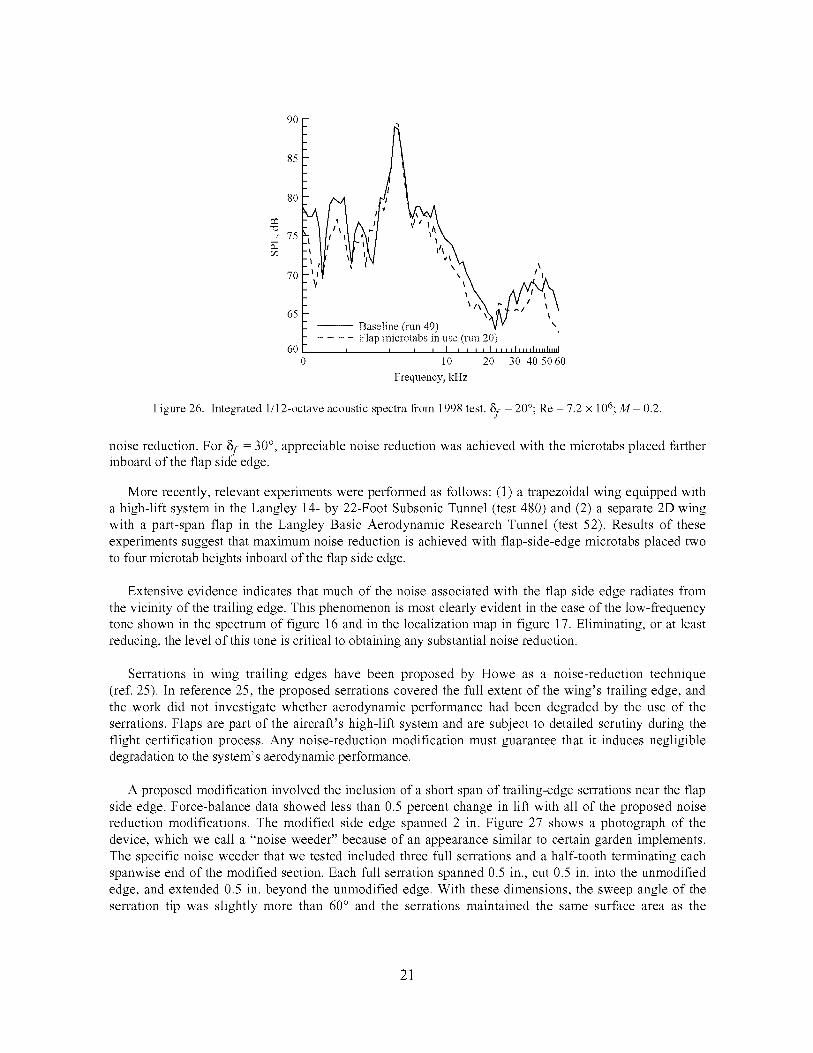
Previous data indicate that a significant portion of the noise associated with the flap side edge radiates
from the trailing-edge corner of the flap. The microtabs were designed to thicken the separated shear
layer. Figure 26 shows results with and without the microtabs for runs with 8j. = 20 °. Noise wassignificantly reduced from approximately 7 kHz to 40 kHz. However, the microtabs apparently increase
the noise between 40 and 50 kHz, probably by adding small-scale fluctuations to the flow. Details
associated with microtab sizing and placement need to be explored more carefully to make this
modification viable. Tests with the same placement of the microtabs and 8j. = 30 ° showed essentially no
20
90
85
8O
75
-- Baseline (run 49) V " \..... Flap microtabs in use (rim 20)
60 i i i i I i i i i I i llllllllhmhml
0 10 20 30 40 50 60
Frequency, kHz
Figure 26. Integrated 1/12-octave acoustic spectra from 1998 test. 8f 20°; Re 7.2 x 10⁶; M 0.2.
noise reduction. For 8j. = 30 °, appreciable noise reduction was achieved with the microtabs placed fartherinboard of the flap side edge.
More recently, relevant experiments were performed as follows: (1) a trapezoidal wing equipped with
a high-lift system in the Langley 14- by 22-Foot Subsonic Tunnel (test 480) and (2) a separate 2D wing
with a part-span flap in the Langley Basic Aerodynamic Research Tunnel (test 52). Results of these
experiments suggest that maximum noise reduction is achieved with flap-side-edge microtabs placed two
to four microtab heights inboard of the flap side edge.
Extensive evidence indicates that much of the noise associated with the flap side edge radiates from
the vicinity of the trailing edge. This phenomenon is most clearly evident in the case of the low-frequency
tone shown in the spectrum of figure 16 and in the localization map in figure 17. Eliminating, or at least
reducing, the level of this tone is critical to obtaining any substantial noise reduction.
Serrations in wing trailing edges have been proposed by Howe as a noise-reduction technique
(ref. 25). In reference 25, the proposed serrations covered the full extent of the wing's trailing edge, and
the work did not investigate whether aerodynamic performance had been degraded by the use of the
serrations. Flaps are part of the aircraft's high-lift system and are subject to detailed scrutiny during the
flight certification process. Any noise-reduction modification must guarantee that it induces negligible
degradation to the system's aerodynamic performance.
A proposed modification involved the inclusion of a short span of trailing-edge serrations near the flap
side edge. Force-balance data showed less than 0.5 percent change in lift with all of the proposed noise
reduction modifications. The modified side edge spanned 2 in. Figure 27 shows a photograph of the
device, which we call a "noise weeder" because of an appearance similar to certain garden implements.
The specific noise weeder that we tested included three full serrations and a half-tooth terminating each
spanwise end of the modified section. Each full serration spanned 0.5 in., cut 0.5 in. into the unmodified
edge, and extended 0.5 in. beyond the unmodified edge. With these dimensions, the sweep angle of the
serration tip was slightly more than 60 ° and the serrations maintained the same surface area as the
21
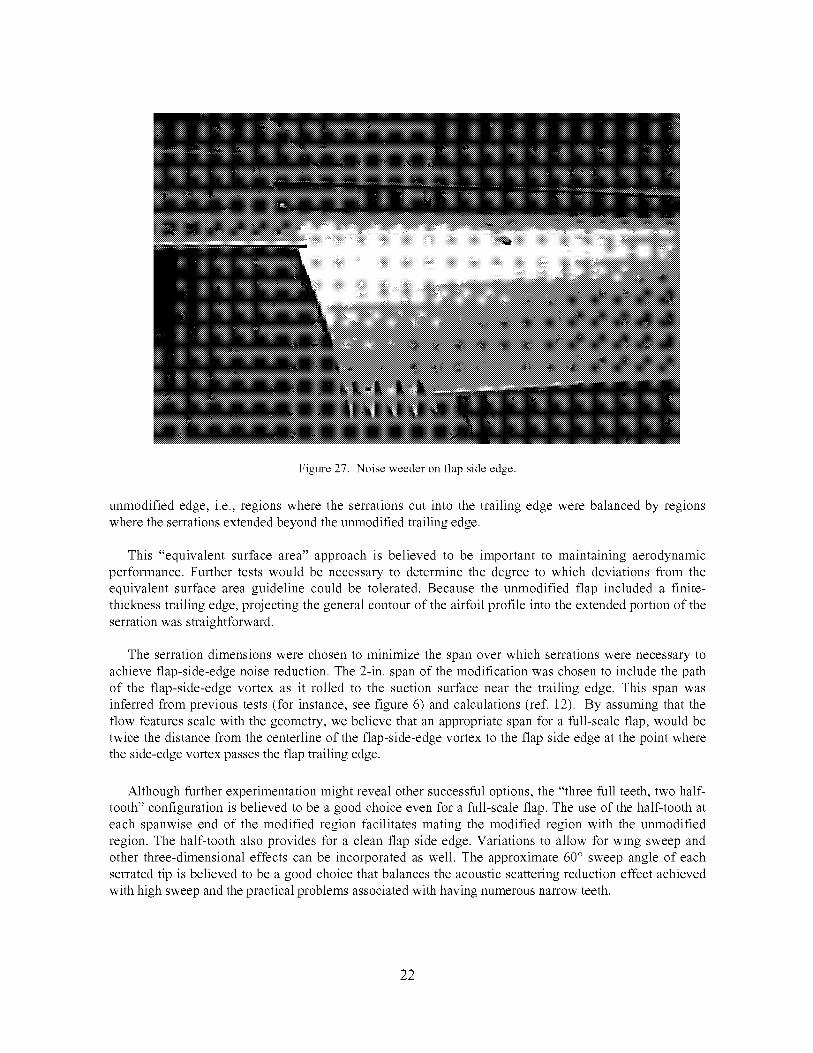
Figure27.Noiseweederonflapsideedge.
unmodifiededge,i.e.,regionswheretheserrationscutintothetrailingedgewerebalancedbyregionswheretheserrationsextendedbeyondtheunmodifiedtrailingedge.
This"equivalentsurfacearea"approachis believedto be importantto maintainingaerodynamicperformance.Furthertestswouldbenecessaryto determinethedegreeto whichdeviationsfromtheequivalentsurfaceareaguidelinecouldbe tolerated.Becausetheunmodifiedflap includeda finite-thicknesstrailingedge,projectingthegeneralcontouroftheairfoilprofileintotheextendedportionof theserrationwasstraightforward.
Theserrationdimensionswerechosento minimizethespanoverwhichserrationswerenecessarytoachieveflap-side-edgenoisereduction.The2-in.spanof themodificationwaschosento includethepathof theflap-side-edgevortexas it rolledto thesuctionsurfacenearthetrailingedge.Thisspanwasinferredfromprevioustests(forinstance,seefigure6) andcalculations(ref.12).By assumingthattheflow featuresscalewiththegeometry,webelievethatanappropriatespanfor afull-scaleflap,wouldbetwicethedistancefromthecenterlineoftheflap-side-edgevortextotheflapsideedgeatthepointwheretheside-edgevortexpassestheflaptrailingedge.
Althoughfurtherexperimentationmightrevealothersuccessfuloptions,the"threefull teeth,twohalf-tooth"configurationisbelievedtobeagoodchoiceevenforafull-scaleflap.Theuseof thehalf-toothateachspanwiseendof themodifiedregionfacilitatesmatingthemodifiedregionwith theunmodifiedregion.Thehalf-toothalsoprovidesfor a cleanflapsideedge.Variationsto allowfor wingsweepandotherthree-dimensionaleffectscanbeincorporatedaswell.Theapproximate60° sweep angle of each
serrated tip is believed to be a good choice that balances the acoustic scattering reduction effect achieved
with high sweep and the practical problems associated with having numerous narrow teeth.
22

Figure 28 compares spectra with and without the noise weeder for the case of 8j. = 20 °. The low-frequency peaks are effectively removed by the noise weeder. A slight increase in noise above about16 kHz is indicated.
9O
85
8O
75
7O
65
60
0
;' ...... 'A/v- Baseline (run 49) V v
,. Noise)_'eeder(,run,37,), ,,, .... , .... ,,,,,,,,,,,
10 20 30 40 50 60
Frequency, kHz
Figure 28. Integrated 1/12-octave acoustic spectra from 1998 test. 8f 20°; Re 7.2 x 10⁶; M 0.2.
Because of time restrictions during the 1998 test, the noise weeder modification alone was not tested
with 8j. = 30 °. Instead, the noise weeder was tested in combination with microtabs. Figure 29 shows theintegrated acoustic spectra for a baseline case and a case with the noise weeder and microtabs. In this
case, microtabs were included on the main element pressure surface in the side-lap region (see fig. 30)
and on the noise weeder pressure surface slightly inboard of the side edge (see fig. 31). The noise weeder
95-
A9O
[/ Baseline (run 61)
85 I I Noise weeder
} / plus microtabs (run 93)
/ \_
,,' ' ,r,/65 I_ .... I .... I .... I .... h,,,h&
10 20 30 40 50 60
Frequency, kHz
80
Figure 29. Integrated 1/12-octave acoustic spectra from 1998 test. 8f 30°; Re 7.2 x 10⁶;M 0.2.
23
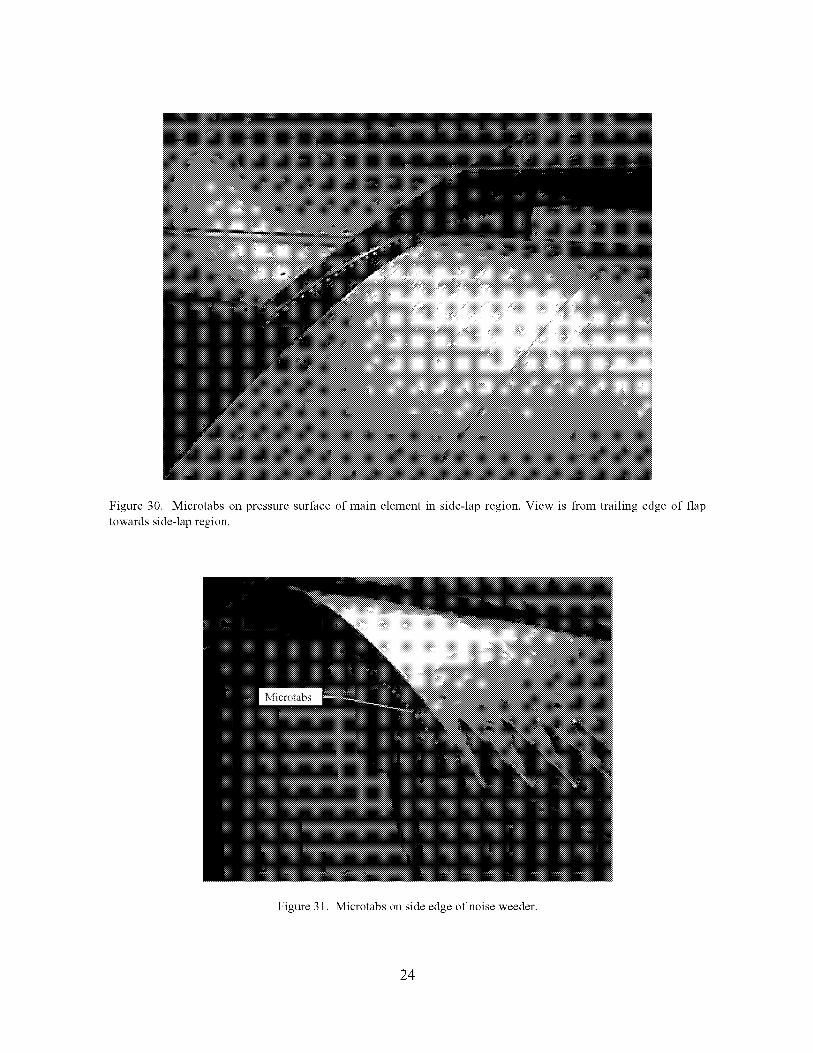
Figure 30. Microtabs on pressure surface of main element in side-lap region. View is from trailing edge of flap
towards side-lap region.
Figure 31. Microtabs on side edge of noise weeder.
24
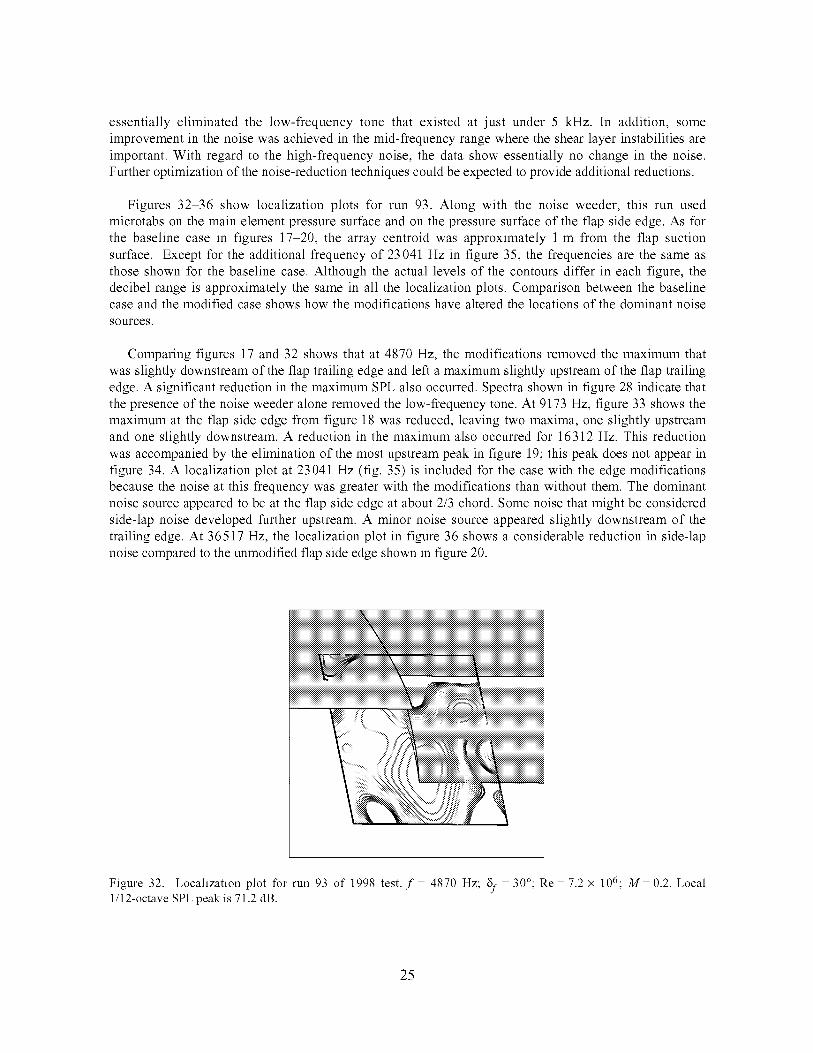
essentially eliminated the low-frequency tone that existed at just under 5 kHz. In addition, some
improvement in the noise was achieved in the mid-frequency range where the shear layer instabilities are
important. With regard to the high-frequency noise, the data show essentially no change in the noise.
Further optimization of the noise-reduction techniques could be expected to provide additional reductions.
Figures 32-36 show localization plots for run 93. Along with the noise weeder, this run used
microtabs on the main element pressure surface and on the pressure surface of the flap side edge. As for
the baseline case in figures 17-20, the array centroid was approximately 1 m from the flap suction
surface. Except for the additional frequency of 23 041 Hz in figure 35, the frequencies are the same as
those shown for the baseline case. Although the actual levels of the contours differ in each figure, the
decibel range is approximately the same in all the localization plots. Comparison between the baselinecase and the modified case shows how the modifications have altered the locations of the dominant noise
sources.
Comparing figures 17 and 32 shows that at 4870 Hz, the modifications removed the maximum that
was slightly downstream of the flap trailing edge and left a maximum slightly upstream of the flap trailing
edge. A significant reduction in the maximum SPL also occurred. Spectra shown in figure 28 indicate that
the presence of the noise weeder alone removed the low-frequency tone. At 9173 Hz, figure 33 shows the
maximum at the flap side edge from figure 18 was reduced, leaving two maxima, one slightly upstream
and one slightly downstream. A reduction in the maximum also occurred for 16312 Hz. This reduction
was accompanied by the elimination of the most upstream peak in figure 19; this peak does not appear in
figure 34. A localization plot at 23041 Hz (fig. 35) is included for the case with the edge modifications
because the noise at this frequency was greater with the modifications than without them. The dominant
noise source appeared to be at the flap side edge at about 2/3 chord. Some noise that might be considered
side-lap noise developed further upstream. A minor noise source appeared slightly downstream of the
trailing edge. At 36517 Hz, the localization plot in figure 36 shows a considerable reduction in side-lap
noise compared to the unmodified flap side edge shown in figure 20.
Figure 32. Localization plot for run 93 of 1998 test. f 4870 Hz; 8f 30°; Re 7.2 x 10⁶; M 0.2. Local1/12-octave SPL peak is 71.2 dB.
25
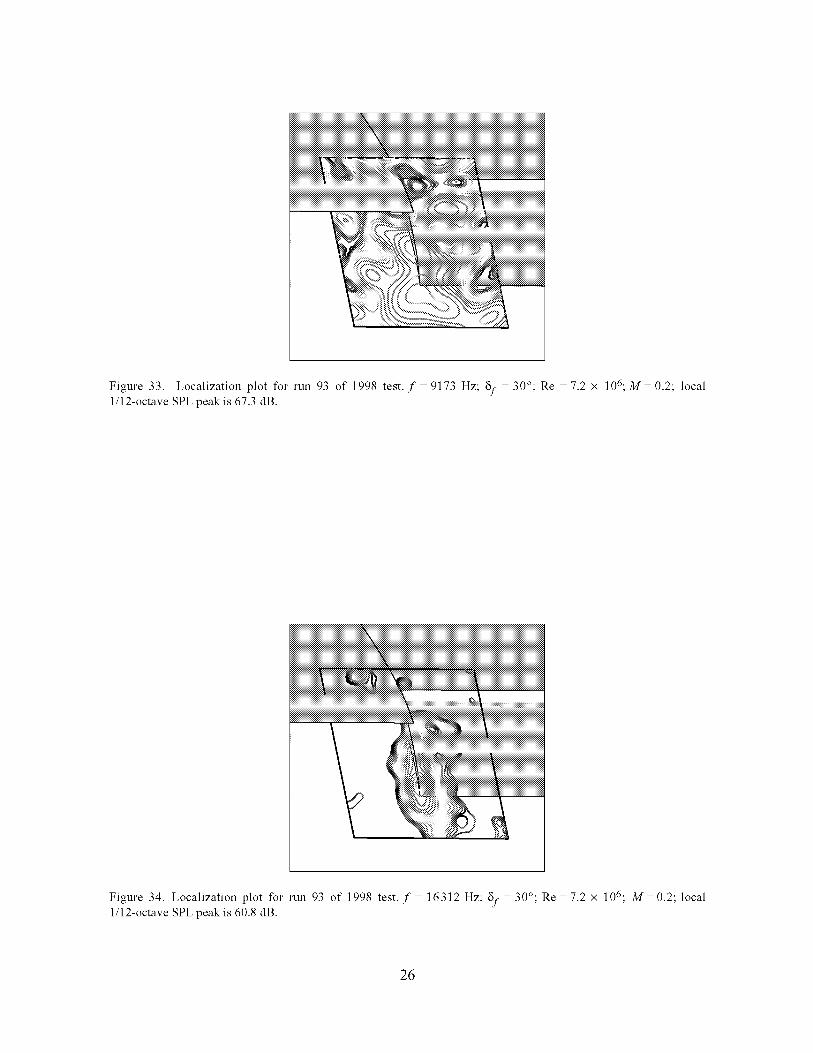
Figure 33. Localization plot for run 93 of 1998 test. f 9173 Hz; 8f 30°; Re 7.2 x 10⁶;M 0.2; local
1/12-octave SPL peak is 67.3 dB.
Figure 34. Localization plot for run 93 of 1998 test. f 16312 Hz; 8f 30°; Re 7.2 x 10⁶; M 0.2; local
1/12-octave SPL peak is 60.8 dB.
26
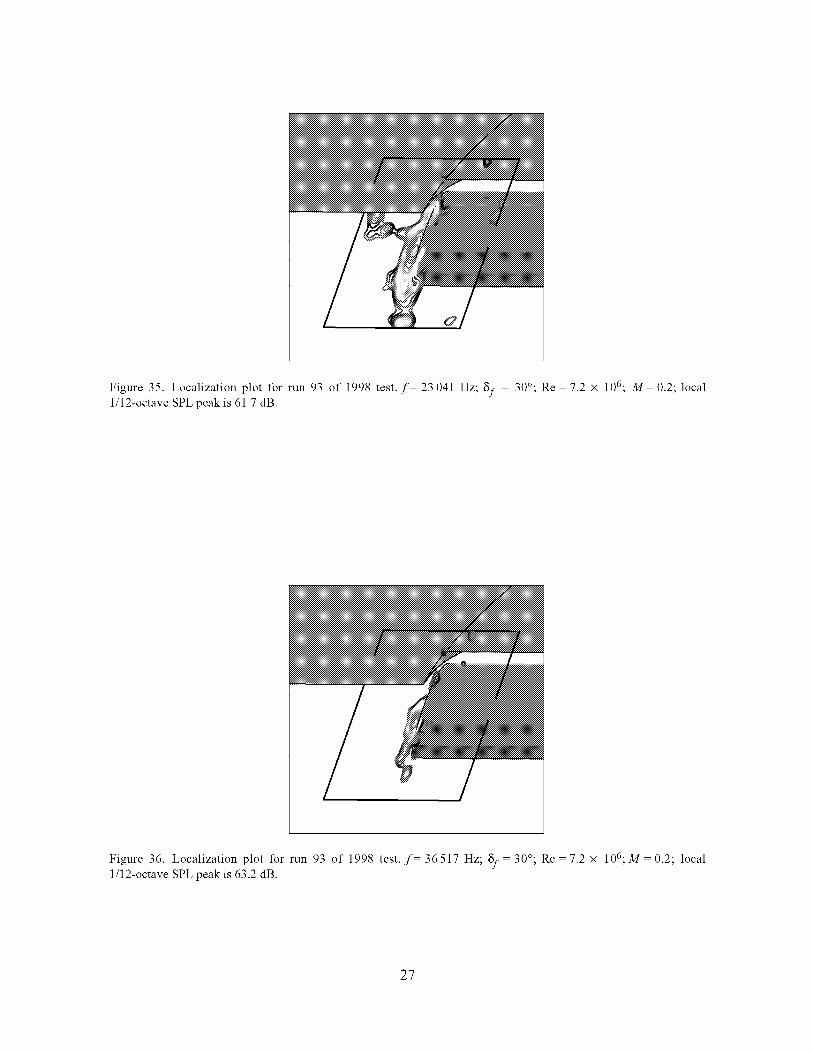
Figure 35. Localization plot for run 93 of 1998 test. f 23 041 Hz; 8f 30°; Re 7.2 x 10⁶; M 0.2; local
1/12-octave SPL peak is 61.7 dB.
Figure 36. Localization plot for run 93 of 1998 test. f 36517 Hz; 8f 30°; Re 7.2 x 10⁶;M 0.2; local
1/12-octave SPL peak is 63.2 dB.
27

These observations suggest that the noise weeder removed the low-frequency tone associated with the
flap-side-edge vortex traversing the flap trailing edge. In addition, the microtabs on the pressure surface
of the main element appeared to have significantly reduced the side-lap noise, and the microtabs on the
flap side edge appeared to have reduced the shear layer noise. The noise weeder might have introduced
some high-frequency noise (the small source downstream of the trailing edge), as was shown in the
8f = 20 ° spectra of figure 28, but the 8f = 30 ° spectra in figure 29 show little change in the highfrequencies.
3.2. Leading-Edge Slat
3.2.1. Mean Flow
A typical static pressure distribution on the slat is shown in figure 37. For this case, the slat was
deflected with 8 s = 30 °. Flow on the pressure side of the slat separated at the slat cusp, but reattached
upstream of the trailing edge. Other experiments on a similar configuration found the reattachment was
unsteady and could produce strong fluctuations in the flow field (ref. 26).
Much of the mean flow information about the slat flow field was derived from computational studies
(refs. 9 and 10). The computations were three-dimensional (3D) and included the part-span flap, but not
the flap nor slat brackets. Figure 38 shows streamlines superimposed on Mach contours in the region
around the slat. The large recirculation region is evident in the figure. A free-shear layer developed on the
edge of the recirculation zone. Fluid was accelerated through the gap at maximum speeds almost 2.5
times the free-stream velocity. Another important observation was that the slat flow field was essentially
2D, in spite of the inclusion of the part-span trailing flap. However, the presence of the slat brackets in the
wind tunnel experiments most certainly introduced at least local 3D effects into the flow.
5
4
3
1
0
1.1
illl
.1x/7:
Figure 37. Pressure coefficient measured on slat centerline, a 10°; 8f 30°; 8s 30 °.
28
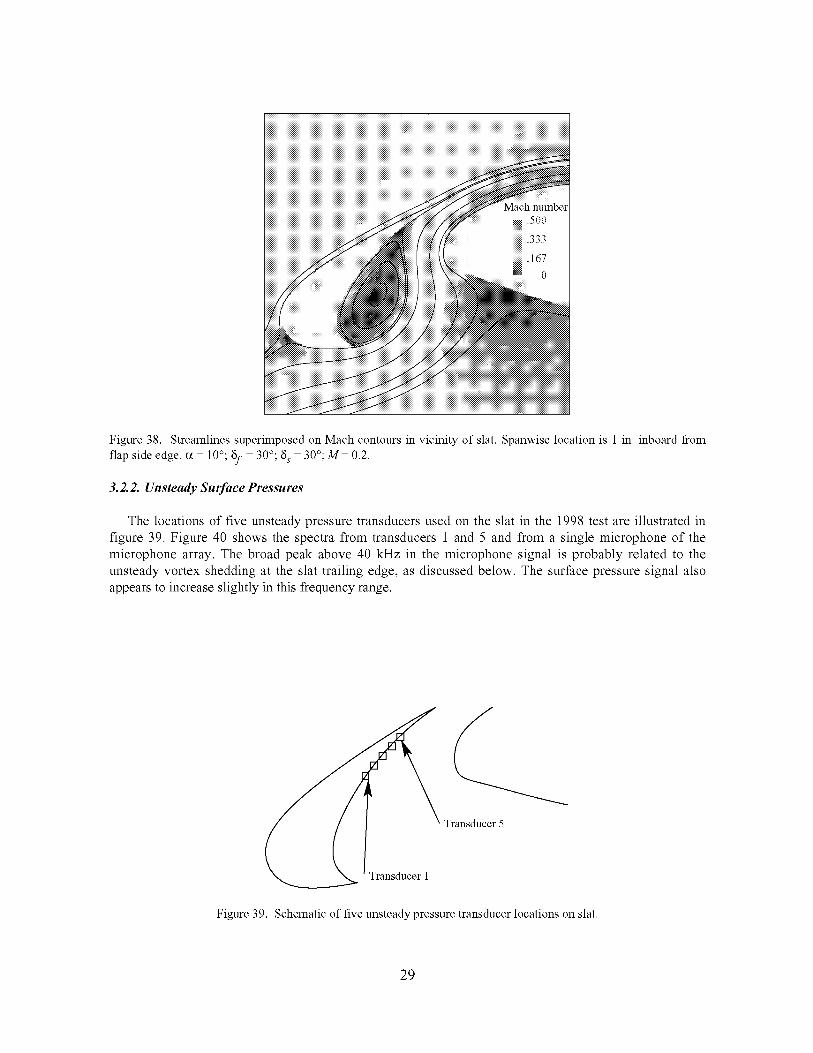
Figure 38. Streamlines superimposed on Mach contours in vicinity of slat. Spanwise location is 1 in. inboard from
flap side edge. cz 10°; 8f 30°;8 s 30°;M 0.2.
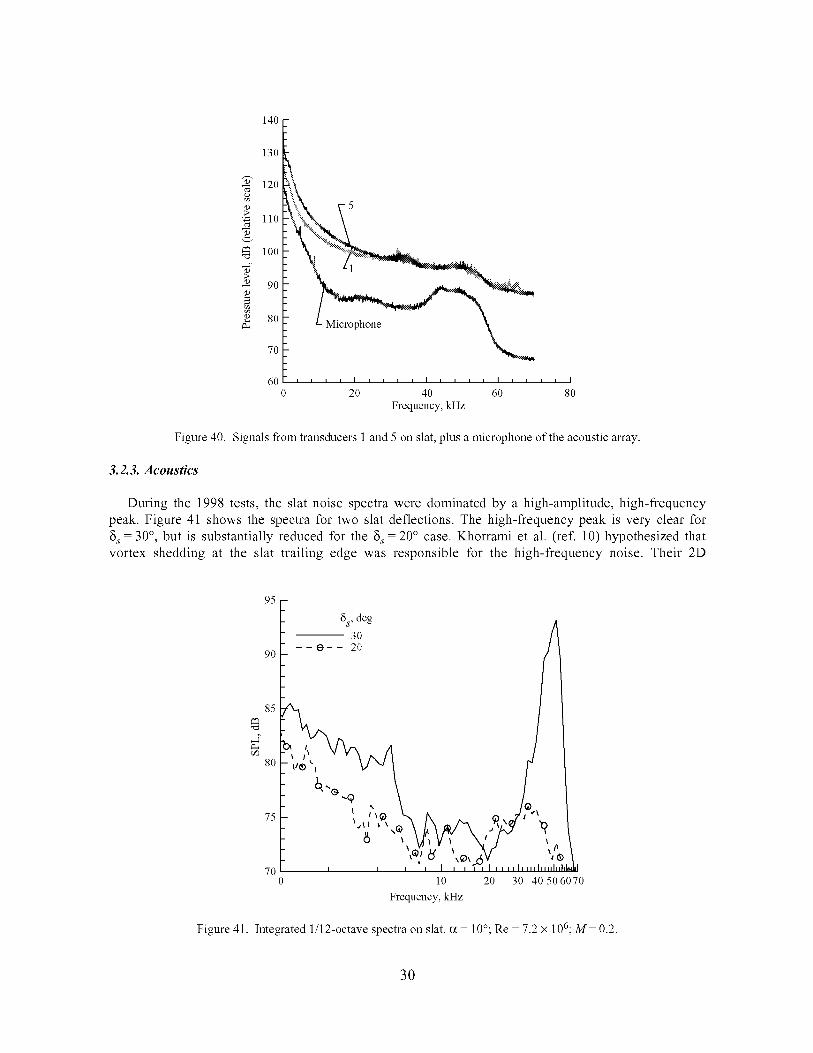
3.2.2. Unsteady Su_ace Pressures
The locations of five unsteady pressure transducers used on the slat in the 1998 test are illustrated in
figure 39. Figure 40 shows the spectra from transducers 1 and 5 and from a single microphone of the
microphone array. The broad peak above 40 kHz in the microphone signal is probably related to the
unsteady vortex shedding at the slat trailing edge, as discussed below. The surface pressure signal also
appears to increase slightly in this frequency range.
J
/Transducer 5
Transducer 1
Figure 39. Schematic of five unsteady pressure transducer locations on slat.
29
140
%-.
o
130
120
110
IO0
9O
8O
7O
600
Microphone
20 40 60 80
Frequency, kHz
Figure 40. Signals from transducers 1 and 5 on slat, plus a microphone of the acoustic array.
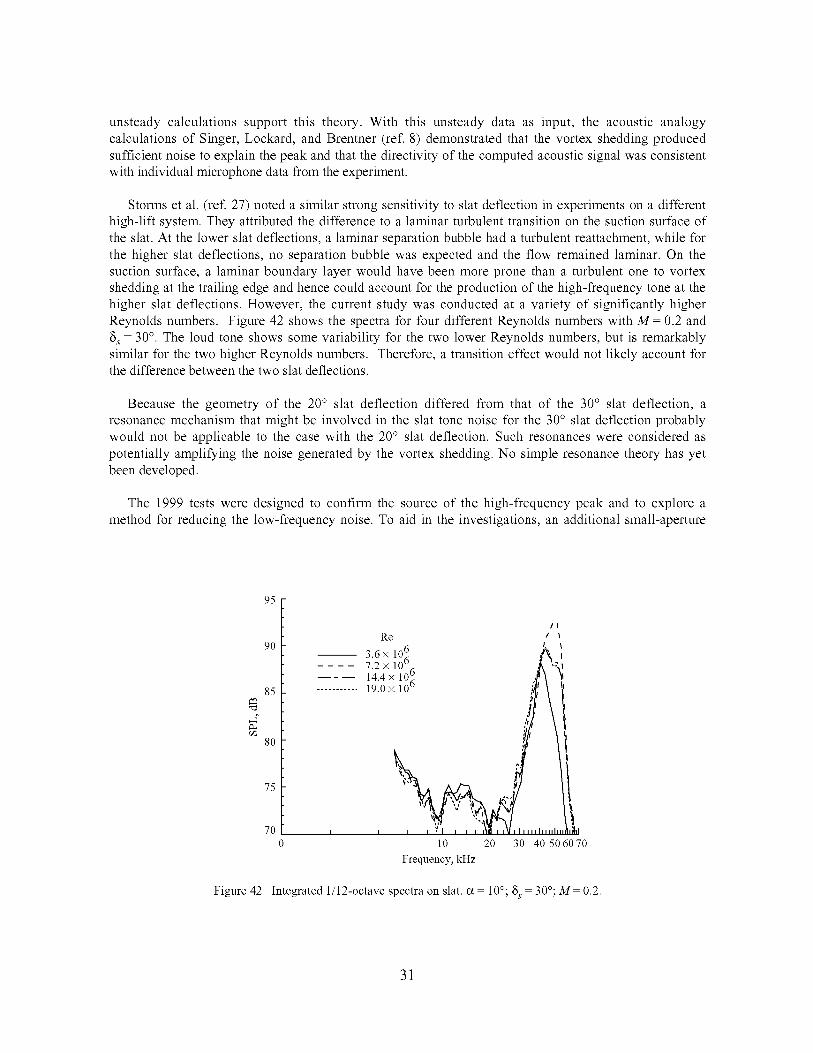
3.2.3. Acoustics
During the 1998 tests, the slat noise spectra were dominated by a high-amplitude, high-frequency
peak. Figure 41 shows the spectra for two slat deflections. The high-frequency peak is very clear for8s = 30°, but is substantially reduced for the 8s = 20° case. Khorrami et al. (ref. 10) hypothesized that
vortex shedding at the slat trailing edge was responsible for the high-frequency noise. Their 2D
- ;_0
m 85
80-
75
7o10 20 30 40 506070
Frequency, kHz
Figure 41. Integrated 1/12-octave spectra on slat. c_ 10°; Re 7.2 x 10⁶;M 0.2.
30
unsteady calculations support this theory. With this unsteady data as input, the acoustic analogy
calculations of Singer, Lockard, and Brentner (ref. 8) demonstrated that the vortex shedding produced
sufficient noise to explain the peak and that the directivity of the computed acoustic signal was consistent
with individual microphone data from the experiment.
Storms et al. (ref. 27) noted a similar strong sensitivity to slat deflection in experiments on a different
high-lift system. They attributed the difference to a laminar turbulent transition on the suction surface of
the slat. At the lower slat deflections, a laminar separation bubble had a turbulent reattachment, while for
the higher slat deflections, no separation bubble was expected and the flow remained laminar. On the
suction surface, a laminar boundary layer would have been more prone than a turbulent one to vortex
shedding at the trailing edge and hence could account for the production of the high-frequency tone at the
higher slat deflections. However, the current study was conducted at a variety of significantly higher
Reynolds numbers. Figure 42 shows the spectra for four different Reynolds numbers with M = 0.2 and
8 s = 30 °. The loud tone shows some variability for the two lower Reynolds numbers, but is remarkably
similar for the two higher Reynolds numbers. Therefore, a transition effect would not likely account forthe difference between the two slat deflections.
Because the geometry of the 20 ° slat deflection differed from that of the 30 ° slat deflection, a
resonance mechanism that might be involved in the slat tone noise for the 30 ° slat deflection probably
would not be applicable to the case with the 20 ° slat deflection. Such resonances were considered as
potentially amplifying the noise generated by the vortex shedding. No simple resonance theory has yet
been developed.
The 1999 tests were designed to confirm the source of the high-frequency peak and to explore a
method for reducing the low-frequency noise. To aid in the investigations, an additional small-aperture
95
9O
85
8O
75
7O
Re /
3.6 × 10⁶ if\ ;7.2 × 10% _ '-"d
14.4x 10 0 _'_ _1'
........... 19°×1°° i_'/ l
i i i i _""1 i i i _\_ i i_/i llllllllllll ._d
10 20 30 40 506070
Frequency, kHz
Figure 42. Integrated 1/12-octave spectra on slat. c_ 10°; 8s 30°;M 0.2.
31
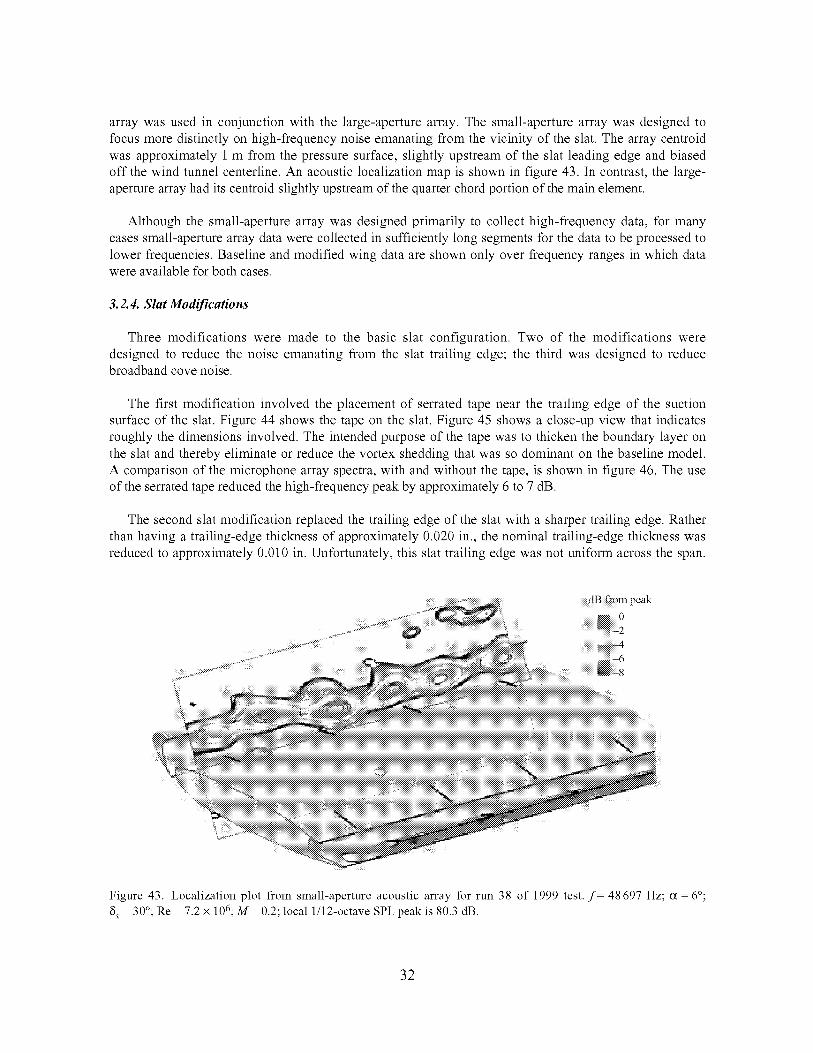
arraywasusedin conjunctionwith thelarge-aperturearray.Thesmall-aperturearraywasdesignedtofocusmoredistinctlyonhigh-frequencynoiseemanatingfromthevicinityof theslat.Thearraycentroidwasapproximately1m fromthepressuresurface,slightlyupstreamof theslatleadingedgeandbiasedoff thewindtunnelcenterline.An acousticlocalizationmapisshownin figure43.In contrast,thelarge-aperturearrayhaditscentroidslightlyupstreamofthequarterchordportionofthemainelement.
Althoughthesmall-aperturearraywasdesignedprimarilyto collecthigh-frequencydata,for manycasessmall-aperturearraydatawerecollectedinsufficientlylongsegmentsforthedatatobeprocessedtolowerfrequencies.Baselineandmodifiedwingdataareshownonlyoverfrequencyrangesinwhichdatawereavailableforbothcases.
3.2.4. Slat Modifications
Three modifications were made to the basic slat configuration. Two of the modifications were
designed to reduce the noise emanating from the slat trailing edge; the third was designed to reducebroadband cove noise.
The first modification involved the placement of serrated tape near the trailing edge of the suction
surface of the slat. Figure 44 shows the tape on the slat. Figure 45 shows a close-up view that indicates
roughly the dimensions involved. The intended purpose of the tape was to thicken the boundary layer on
the slat and thereby eliminate or reduce the vortex shedding that was so dominant on the baseline model.
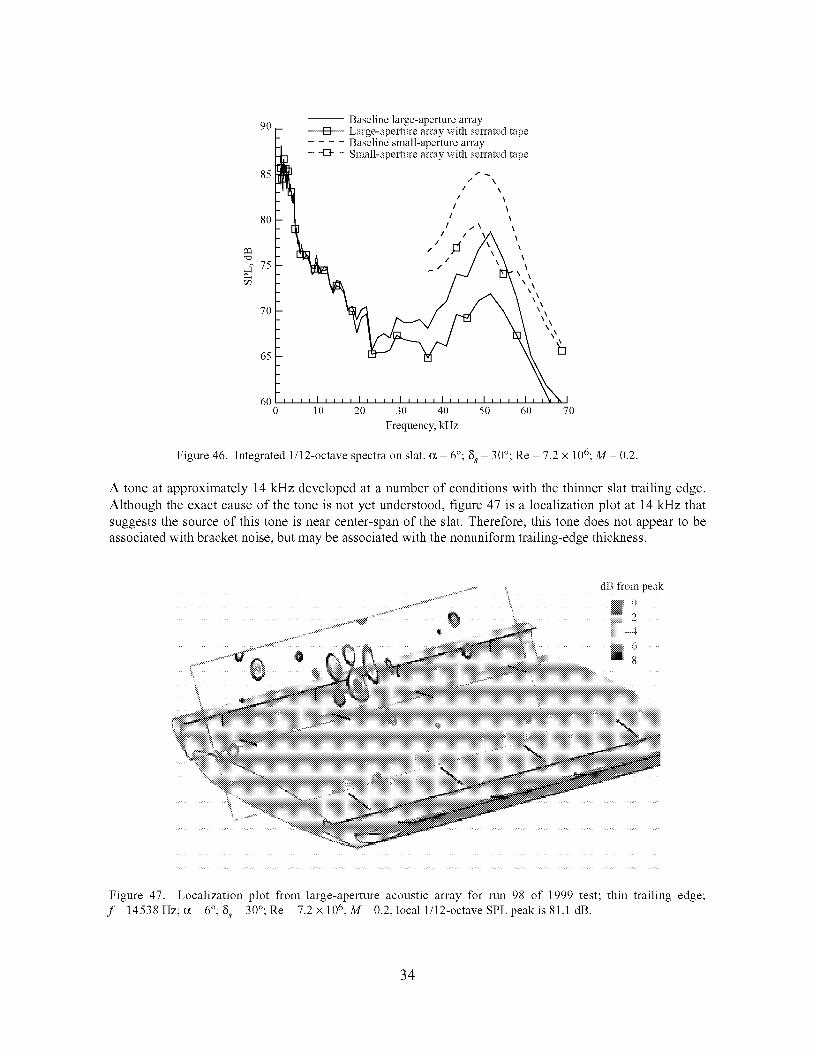
A comparison of the microphone array spectra, with and without the tape, is shown in figure 46. The use
of the serrated tape reduced the high-frequency peak by approximately 6 to 7 dB.
The second slat modification replaced the trailing edge of the slat with a sharper trailing edge. Rather
than having a trailing-edge thickness of approximately 0.020 in., the nominal trailing-edge thickness was
reduced to approximately 0.010 in. Unfortunately, this slat trailing edge was not uniform across the span.
dB from peak
N0:.:.:::::::.---2..::= 4
Figure 43. Localization plot from small-aperture acoustic array for run 38 of 1999 test. f 48697 Hz; c_ 6°;
8s 30°; Re 7.2 x 10⁶; M 0.2; local 1/12-octave SPL peak is 80.3 dB.
32
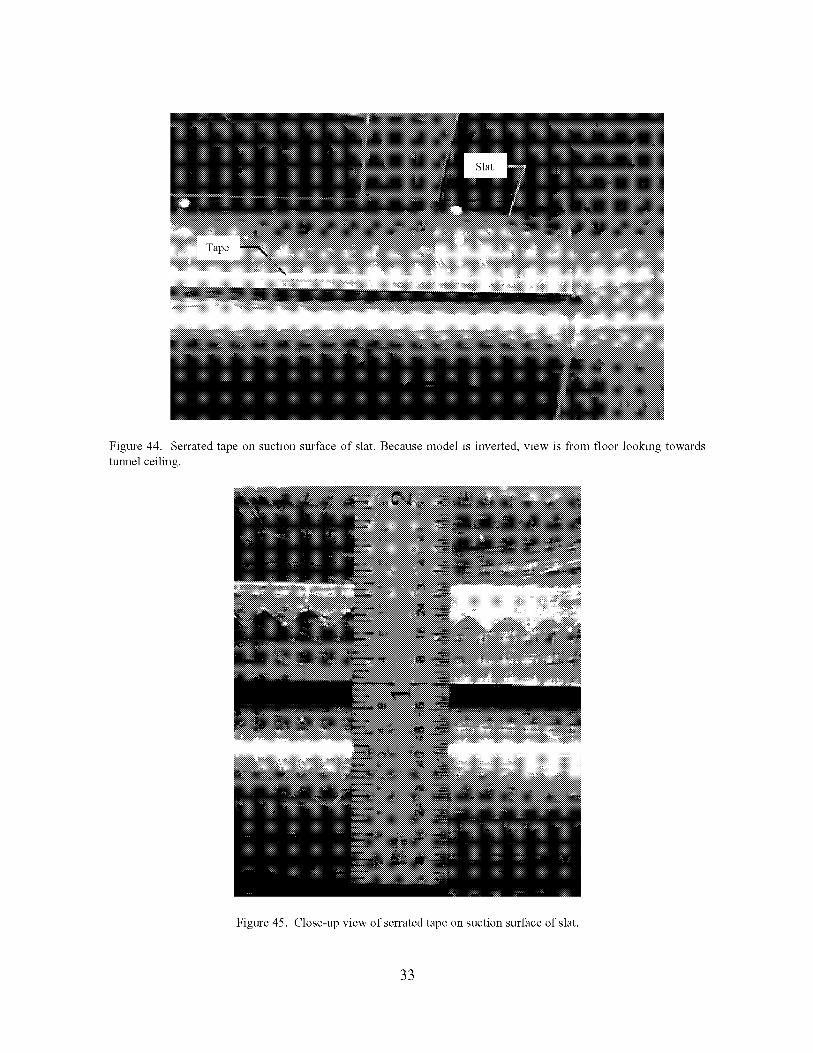
Figure 44. Serrated tape on suction surface of slat. Because model is inverted, view is from floor looking towards
tunnel ceiling.
Figure 45. Close-up view of serrated tape on suction surface of slat.
33
9O
85
8O
75
7O
65
60
-- Baseline large-aperture arrayLarge-aperture array wi/h serrated tape
.... Baseline small-aperture array
- -El- - Small-aperture array with serrated tape
z \
/ \
/
1
I _.\ _
/ ., \',,,
";"S
........57 ....LT10 20 30 40 50 60 70
Frequency, kHz
Figure 46. Integrated 1/12-octave spectra on slat. c_ 6°; 8s 30°; Re 7.2 x 10⁶;M 0.2.
A tone at approximately 14 kHz developed at a number of conditions with the thinner slat trailing edge.
Although the exact cause of the tone is not yet understood, figure 47 is a localization plot at 14 kHz that
suggests the source of this tone is near center-span of the slat. Therefore, this tone does not appear to be
associated with bracket noise, but may be associated with the nonuniform trailing-edge thickness.
Figure 47. Localization plot from large-aperture acoustic array for run 98 of 1999 test; thin trailing edge;
f 14538 Hz; c_ 6°; 8s 30°; Re 7.2 x 10⁶;M 0.2; local 1/12-octave SPLpeakis 81.1 dB.
34
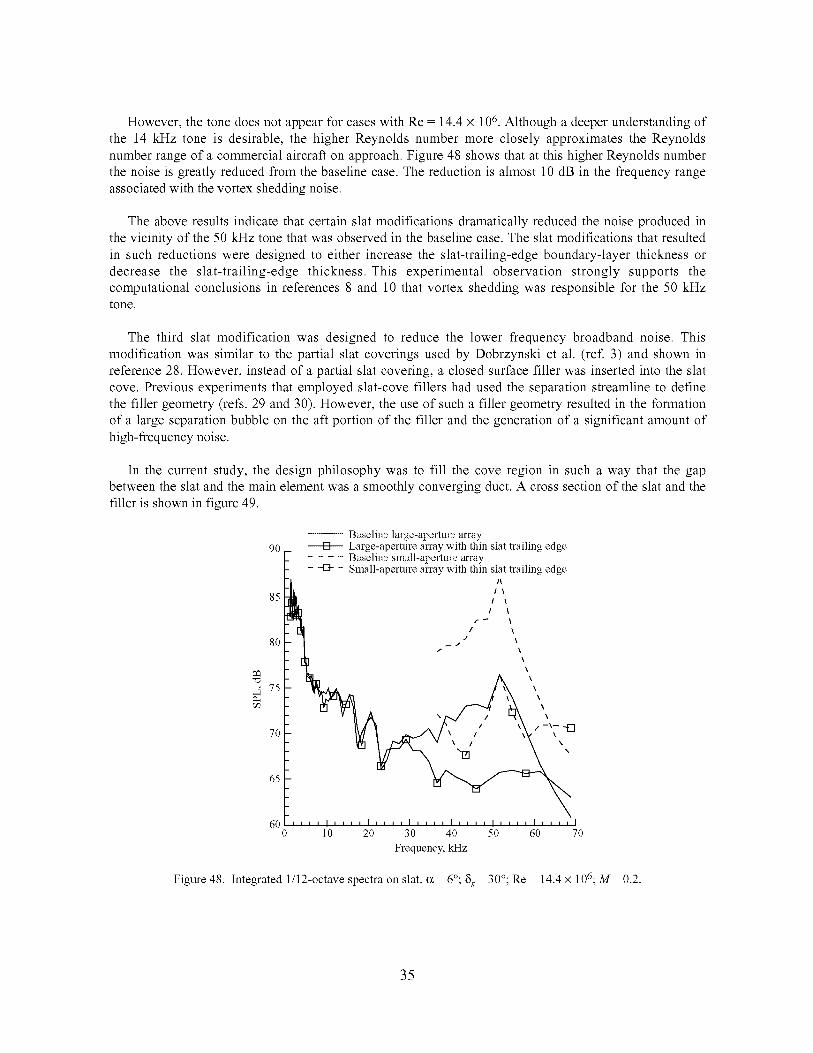
However, the tone does not appear for cases with Re = 14.4 x 10⁶. Although a deeper understanding of
the 14 kHz tone is desirable, the higher Reynolds number more closely approximates the Reynolds
number range of a commercial aircraft on approach. Figure 48 shows that at this higher Reynolds number
the noise is greatly reduced from the baseline case. The reduction is almost 10 dB in the frequency range
associated with the vortex shedding noise.
The above results indicate that certain slat modifications dramatically reduced the noise produced in
the vicinity of the 50 kHz tone that was observed in the baseline case. The slat modifications that resulted
in such reductions were designed to either increase the slat-trailing-edge boundary-layer thickness or
decrease the slat-trailing-edge thickness. This experimental observation strongly supports the
computational conclusions in references 8 and 10 that vortex shedding was responsible for the 50 kHztone.
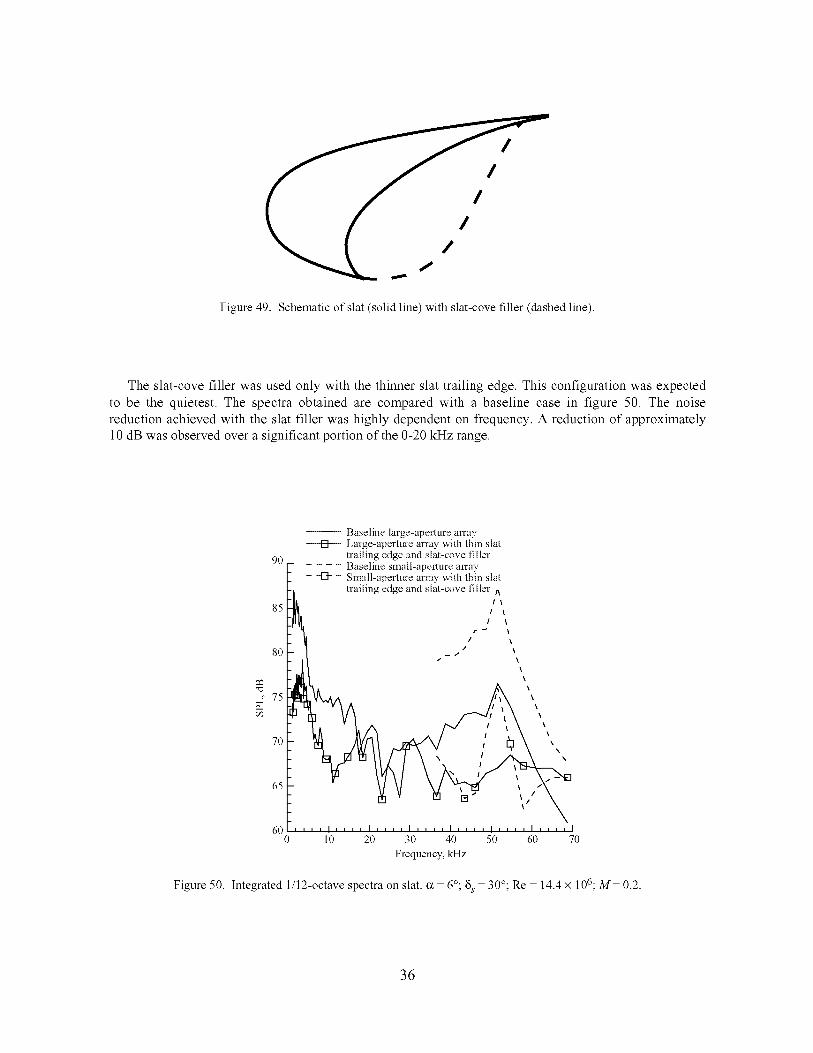
The third slat modification was designed to reduce the lower frequency broadband noise. This
modification was similar to the partial slat coverings used by Dobrzynski et al. (ref. 3) and shown in
reference 28. However, instead of a partial slat covering, a closed surface filler was inserted into the slat
cove. Previous experiments that employed slat-cove fillers had used the separation streamline to define
the filler geometry (refs. 29 and 30). However, the use of such a filler geometry resulted in the formation
of a large separation bubble on the aft portion of the filler and the generation of a significant amount of
high-frequency noise.
In the current study, the design philosophy was to fill the cove region in such a way that the gap
between the slat and the main element was a smoothly converging duct. A cross section of the slat and the
filler is shown in figure 49.
-- Base]ine large-aperture array90 ------Ell Large-aperture array with thin slat lrai]ing edge
_- .... Base]ine small-aperture arrayL - --D- - Sma]l-aperture array with thin slat lrai]ing edge
i1_
85. / _
80 _
_c__75 \\
70 t -- ' //A _ x]_ z, M_ ,'-_'-'t_
6O0 10 20 30 40 50 60 70
Frequency, kHz
Figure 48. Integrated 1/12-octave spectra on slat. a 6°; 8 s 30°; Re 14.4 x 10⁶;M 0.2.
35
I
i I
Figure 49. Schematic of slat (solid line) with slat-cove filler (dashed line).
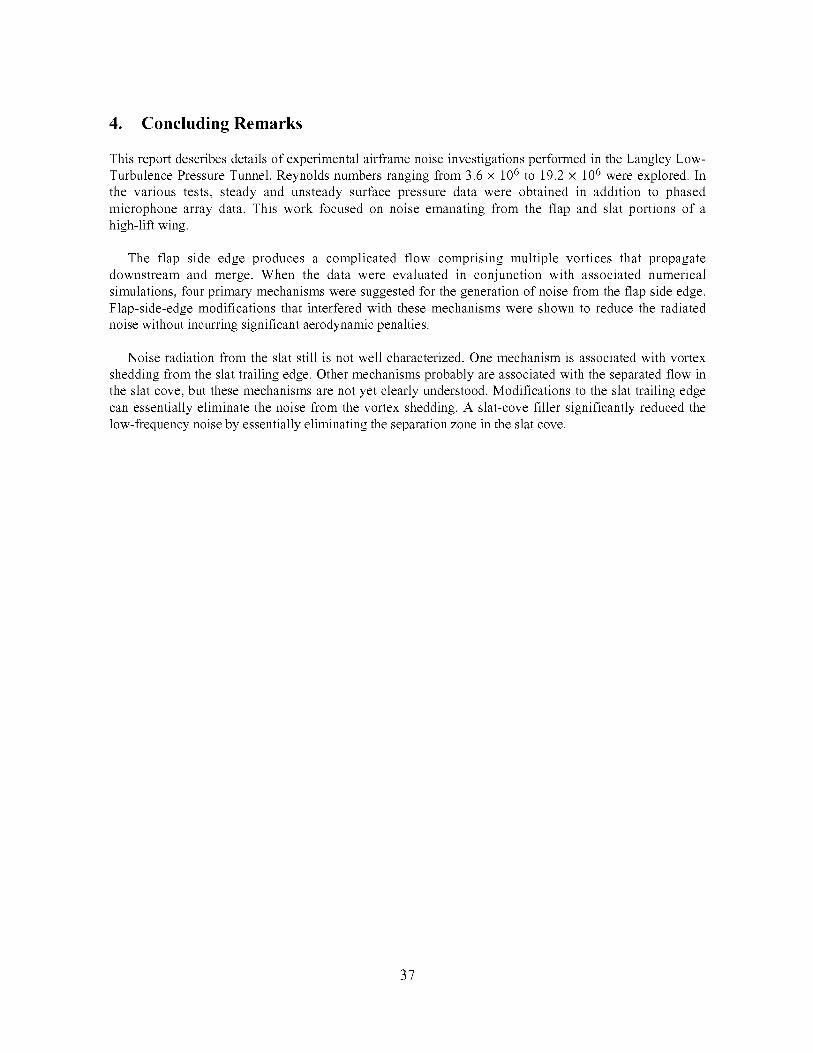
The slat-cove filler was used only with the thinner slat trailing edge. This configuration was expected
to be the quietest. The spectra obtained are compared with a baseline case in figure 50. The noise
reduction achieved with the slat filler was highly dependent on frequency. A reduction of approximately
10 dB was observed over a significant portion of the 0-20 kHz range.
75
c_
-- Baseline large-aperture arrayLarge-aperttu'e array with thin slat
90 _ trailing edge and slat-cove filler- - - Baseline small-apertt_re array
- '[3- - Sma|l-aperture arrav with thin slattrailing edge and slat-cove filler t_
70 _\
65-
60 _ I_1_1_1_1_1_1
0 10 20 30 40 50 60 70
Frequency, kHz
Figure 50. Integrated 1/12-octave spectra on slat. c_ 6°; 8 s 30°; Re 14.4 x 10⁶;M 0.2.
36
4. Concluding Remarks
This report describes details of experimental airframe noise investigations performed in the Langley Low-
Turbulence Pressure Tunnel. Reynolds numbers ranging from 3.6 x 10 6 to 19.2 x 10 6 were explored. In
the various tests, steady and unsteady surface pressure data were obtained in addition to phased
microphone array data. This work focused on noise emanating from the flap and slat portions of a
high-lift wing.
The flap side edge produces a complicated flow comprising multiple vortices that propagate
downstream and merge. When the data were evaluated in conjunction with associated numerical
simulations, four primary mechanisms were suggested for the generation of noise from the flap side edge.
Flap-side-edge modifications that interfered with these mechanisms were shown to reduce the radiated
noise without incurring significant aerodynamic penalties.
Noise radiation from the slat still is not well characterized. One mechanism is associated with vortex
shedding from the slat trailing edge. Other mechanisms probably are associated with the separated flow in
the slat cove, but these mechanisms are not yet clearly understood. Modifications to the slat trailing edge
can essentially eliminate the noise from the vortex shedding. A slat-cove filler significantly reduced the
low-frequency noise by essentially eliminating the separation zone in the slat cove.
37
References
1. Davy, H.; and Remy, R.: Airframe Noise Characteristics on a 1/11 Scale Airbus Model. AIAA-98-2335, 1998.
2. Hayes, J. A.; Horne, W. C.; Soderman, P. T.; and Bent, P. H.: Airframe Noise Characteristics of a 4.7% Scale
DC-10 Model. AIAA-97-1594, 1997.
Dobrzynski, W.; Nagakura, K.; Gehlhar, B.; and Buschbaum, A.: Airframe Noise Studies on Wings With
Deployed High-Lift Devices. AIAA-98-2337, 1998.
Macaraeg, M. G.: Fundamental Investigations of Airframe Noise. AIAA-98-2224, 1998.
Meadows, K. R.; Brooks, T. F.; Gerhold, C. H.; Humphreys, W. M. Jr.; and Hunter, W. W.: Acoustic and
Unsteady Surface Pressure Measurements of a Main Element-Flap Configuration. AIAA-97-1595, 1997.
6. Radeztsky, R. H.; Singer, B. A.; and Khorrami, M. R.: Detailed Measurements of a Flap Side-Edge Flow Field.
AIAA-98-700, 1998.
7. Brooks, T. F.; and Humphreys, W. M. Jr.: Flap Edge Aeroacoustic Measurments and Predictions. AIAA-2000-
1975, 2000.
8. Singer, B. A.; Lockard, D. P.; and Brentner, K. S.: Computational Acoustic Analysis of Slat Trailing-Edge
Flow. AIAA J., vol. 38, no. 9, Sept. 2000, pp. 1558 1564.
9. Berkman, M. E.; Khorrami, M. R.; Choudhari, M.; and Sadowski, S. S.: Investigation of High-Lift Flow Field
of an Energy Efficient Transport Wing. AIAA-99-0926, 1999.
10. Khorrami, M. R.; Berkman, M. E.; Choudhari, M.; Singer, B. A.; Lockard, D. P.; and Brentner, K. S.: Unsteady
Flow Computations of a Slat With a Blunt Trailing Edge. AIAA-99-1805, 1999.
11. McGhee, R. J.; Beasley, W. D.; and Foster, J. M.: Recent Modijications and Calibration of the Langley Low-
Turbulence-Pressure Tunnel. NASA TP-2328, 1984.
12. Morgan, H. L.: Model Geometry Description and Pressure Distribution Data From Tests' of EET High-L_
Research Model Equipped With Full-Span Slat and Part-Span Flaps. NASA TM-80048, 1979.
13. Lin, J. C.; and Dominik, C. J.: Parametric Investigation of High-Lift Airfoil at High Reynolds Numbers. J.
Aircr., vol. 33, no. 4, 1997, pp. 485 491.
14. Underbrink, J. R.; and Dougherty, R. P.: Array Design for Non-Intrusive Measurements of Noise Sources.
Proceedings of NOISECON 96, J. D. Chalupnik, S. E. Marshall, and R. C. Klein, eds., Institute of Noise Control
Engineering, Washington, DC, 1996.
15. Dougherty, R. P.: Spiral-ShapedArrayJorBroadbandImaging. U.S. Patent No. 5,838,284, 1998.
16. Mosher, M.: Phased Arrays for Aeroacoustic Testing_heoretical Development. AIAA-96-1713, 1996.
17. Mosher, M.; Watts, M. E.; Jaeger, S. M.; and Jovic, S.: Calibration of Microphone Arrays for Phased Array
Processing. AIAA-97-1678, 1997.
18. Radeztsky, R. H.; Singer, B.S.; and Khorrami, M. R.: Detailed Measurements of a Flap Side-Edge Flow Field.
AIAA-98-0700, 1998.
3.
4.
5.
38
19. Khorrami, M. R.; Singer, B. A.; and Radeztsky, J.: Reynolds-Averaged Navier-Stokes Computations of
Flap-Side-Edge Flowfield. AIAA J., vol. 37, no. 1, 1999, pp. 14 22.
20. Storms, B. L.; Takahashi, T. T.; and Ross, J. C.: Aerodynamic Influence of a Finite-Span Flap on a Simple
Wing. SAE Paper No. 951977, 1995.
21. Khorrami, M. R.; and Singer, B. A.: Stability Analysis for Noise-Source Modeling of a Part-Span Flap. AIAA-
98-2225, 1998.
22. Streett, C. L.: Numerical Simulation of Fluctuations Leading to Noise in a Flap-Edge Flowfield. AIAA-98-
0628, 1998.
23. Streett, C. L.: Numerical Simulations of a Flap-Edge Flowfield. AIAA-98-2226, 1998.
24. Khorrami, M. R.; and Singer, B.A.: Stability Analysis for Noise-Source Modeling of a Part-Span Flap. AIAA
J., vol. 37, no. 10, 1999, p. 1206.
25. Howe, M. S.: Aerodynamic Noise of a Serrated Trailing Edge. J. Fluids' & Struct., vol. 5, 1991, pp. 33 45.
26. McGinley, C. B.; Anders, J. B.; and Spaid, F. W.: Measurements of Reynolds Stress Profiles on a High-Lift
Airfoil. AIAA-98-2620, 1998.
27. Storms, B.; Hayes, J.; Moriarty, P. J.; and Ross, J.: Aeroacoustic Measurements of Slat Noise on the Three-
Dimensional High-Lift System. AIAA-99-1957, 1999.
28. Heller, H. H.: DLR's Involvement in European Aviation Noise Research on Fixed and Rotary Wing
Aircraft A (Roughly) Five Year Retrospective. 5 th AIAA/CEAS Aeroacoustics Conference Keynote Lecture,
AIAA, Reston, VA, 1999.
29. Moriarty, P.: Unsteady Measurements Near a Leading-Edge Slat. 3 rJ AirJ?ame Noise Workshop, R. Sen, ed.,
NASA AST Program, 1998.
30. Storms, B.; Hayes, J.; and Ross, J.: Aeroacoustic Measurements of Slat Noise on a Three-Dimensional High-
Lift System. 3 rJ AirJ?ame Noise Workshop, R. Sen, ed., NASA AST Program, 1998.
39
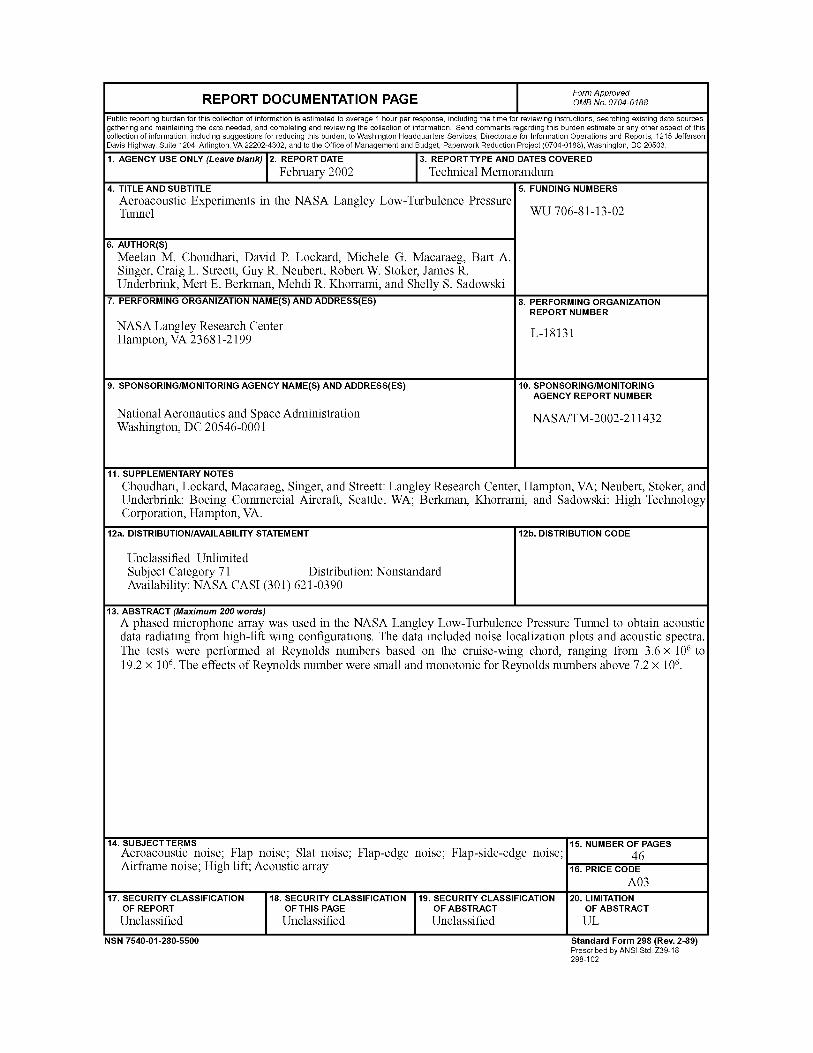
Form ApprovedREPORT DOCUMENTATION PAGE OMSNo.0704-0188
Public reporting burden for this collection of information is estimated to average 1 hour per response, including the time for reviewing instructions, searching existing data sources,gathering and maintaining the data needed, and completing and reviewing the collection of information. Send comments regarding this burden estimate or any other aspect of thiscollection of information, including suggestions for reducing this burden, to Washington Headquarters Services, Directorate for Information Operations and Reports, 1218 JeffersonDavis Highway, Suite 1204, Arlington, VA 22202-4302, and to the Office of Management and Budget, Paperwork Reduction Project (0704-0188), Washington, DC 20803.
1. AGENCY USE ONLY (Leave blank) 2. REPORT DATE 3. REPORTTYPE AND DATES COVERED
February 2002 Technical Memorandum4. TITLE AND SUBTITLE 5. FUNDING NUMBERS
Aeroacoustic Experiments in the NASA Langley Low-Turbulence PressureTunnel WU 706-81-13-02
6. AUTHOR(S)
Meelan M. Choudhari, David R Lockard, Michele G. Macaraeg, Bart A.
Singer, Craig L. Streett, Guy R. Neubert, Robert W. Stoker, James R.
Underbrink, Mert E. Berkman, Mehdi R. Khorrami, and Shelly S. Sadowski
7. PERFORMING ORGANIZATION NAME(S) AND ADDRESS(ES)
NASA Langley Research CenterHampton, VA 23681-2199
9. SPONSORING/MONITORING AGENCY NAME(S) AND ADDRESS(ES)
National Aeronautics and Space AdministrationWashington, DC 20546-0001
8. PERFORMING ORGANIZATION
REPORT NUMBER
L-18131
10. SPONSORING/MONITORING
AGENCY REPORT NUMBER
NASA/TM-2002-211432
11. SUPPLEMENTARY NOTES
Choudhari, Lockard, Macaraeg, Singer, and Streett: Langley Research Center, Hampton, VA; Neubert, Stoker, andUnderbrink: Boeing Commercial Aircraft, Seattle, WA; Berkman, Khorrami, and Sadowski: High TechnologyCorporation, Hampton, VA.
12a. DISTRIBUTION/AVAILABILITY STATEMENT
Unclassifie_UnlimitedSubject Category 71 Distribution: NonstandardAvailability: NASA CASI (301) 621-0390
12b. DISTRIBUTION CODE
13. ABSTRACT (Maximum 200 words)
A phased microphone array was used in the NASA Langley Low-Turbulence Pressure Tunnel to obtain acousticdata radiating from high-lift wing configurations. The data included noise localization plots and acoustic spectra.The tests were performed at Reynolds numbers based on the cruise-wing chord, ranging from 3.6 x 10⁶ to19.2 x 106. The effects of Reynolds number were small and monotonic for Reynolds numbers above 7.2 x 10⁶.
14. SUBJECTTERMS
Aeroacoustic noise; Flap noise; Slat noise; Flap-edge noise; Flap-side-edge noise;Airframe noise; High lift; Acoustic array
17. SECURITY CLASSIFICATION
OF REPORT
Unclassified
NSN 7540-01-280-5500
18. SECURITY CLASSIFICATION
OF THIS PAGE
Unclassified
19. SECURITY CLASSIFICATION
OF ABSTRACT
Unclassified
15. NUMBER OF PAGES
4616. PRICE CODE
A0320. LIMITATION
OF ABSTRACT
UL
Standard Form 298 (Rev. 2-89)Prescribed byANSI Std. Z39-18298-102
Related Documents

![The Effect of Turbulence on the Aerodynamics of Low ... Reynolds number range (less than 100,000, ... (source: Mueller [4]) ... open-jet automotive aeroacoustic test section on the](https://static.cupdf.com/doc/110x72/5ae2568d7f8b9a7b218bd66c/the-effect-of-turbulence-on-the-aerodynamics-of-low-reynolds-number-range-less.jpg)