AEC Integration and Internal Migration: A Dynamic CGE Model Approach Kitti Limskul Faculty of Economics, Saitama University, Japan Nattapong Puttanapong Faculty of Economics, Thammasat University, Thailand Thongchart Bowonthumrongchai Faculty of Economics, Saitama University, Japan Page 1 SYMPOSIUM ON PREFERENTIAL TRADE AGREEMENTS AND INCLUSIVE TRADE 14-15 December 2017 Novotel Bangkok Ploenchit Sukhumvit Bangkok, Thailand

Welcome message from author
This document is posted to help you gain knowledge. Please leave a comment to let me know what you think about it! Share it to your friends and learn new things together.
Transcript
AEC Integration and Internal Migration:
A Dynamic CGE Model Approach
Kitti Limskul Faculty of Economics, Saitama University, Japan
Nattapong Puttanapong Faculty of Economics, Thammasat University, Thailand
Thongchart Bowonthumrongchai Faculty of Economics, Saitama University, Japan
Page 1
SYMPOSIUM ON PREFERENTIAL TRADE
AGREEMENTS AND INCLUSIVE TRADE 14-15 December 2017
Novotel Bangkok Ploenchit Sukhumvit
Bangkok, Thailand
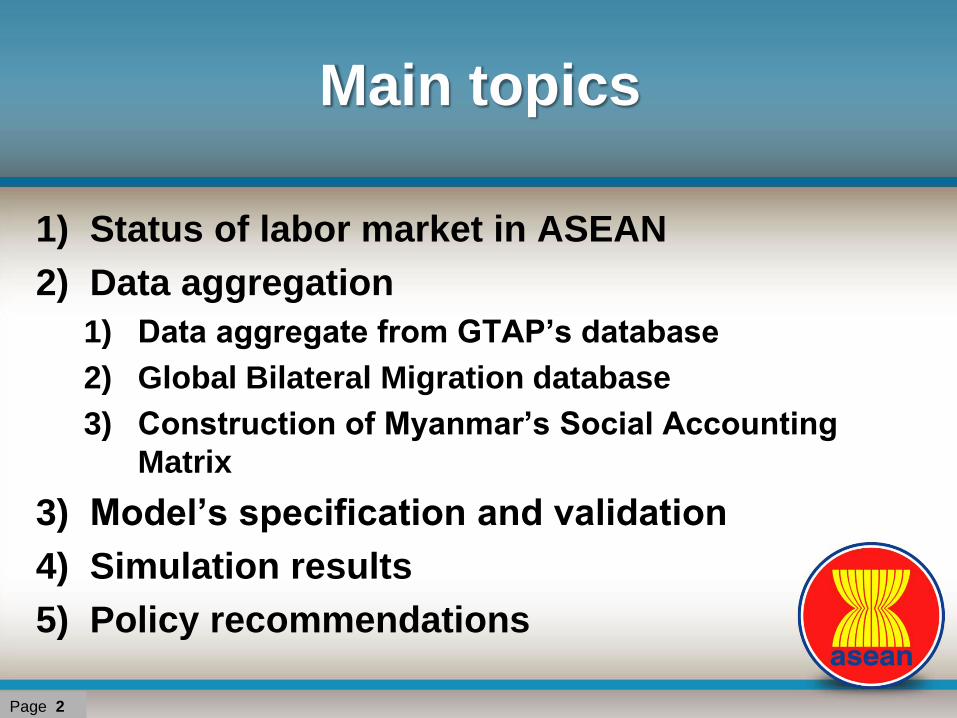
Main topics
1) Status of labor market in ASEAN
2) Data aggregation
1) Data aggregate from GTAP’s database
2) Global Bilateral Migration database
3) Construction of Myanmar’s Social Accounting
Matrix
3) Model’s specification and validation
4) Simulation results
5) Policy recommendations
Page 2

1) Status of labor market in
ASEAN
1) Broad difference of total population among
ASEAN members
2) Different ratios of labor participation
3) Different country’s labor supply
4) Different magnitudes of labor dependency
ratios
Page 3
1) Status of labor market in
ASEAN
1) Broad difference of total population among
ASEAN members
2) Different ratios of labor participation
3) Different country’s labor supply
4) Different magnitudes of labor dependency
ratios
Page 4
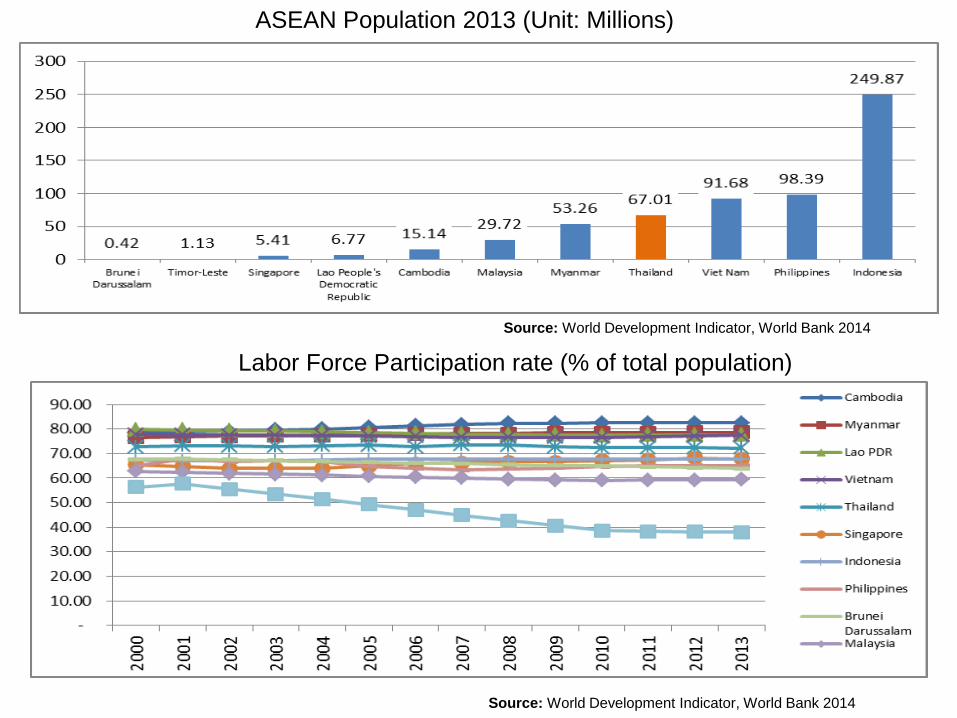
ASEAN Population 2013 (Unit: Millions)
Labor Force Participation rate (% of total population)
Source: World Development Indicator, World Bank 2014
Source: World Development Indicator, World Bank 2014
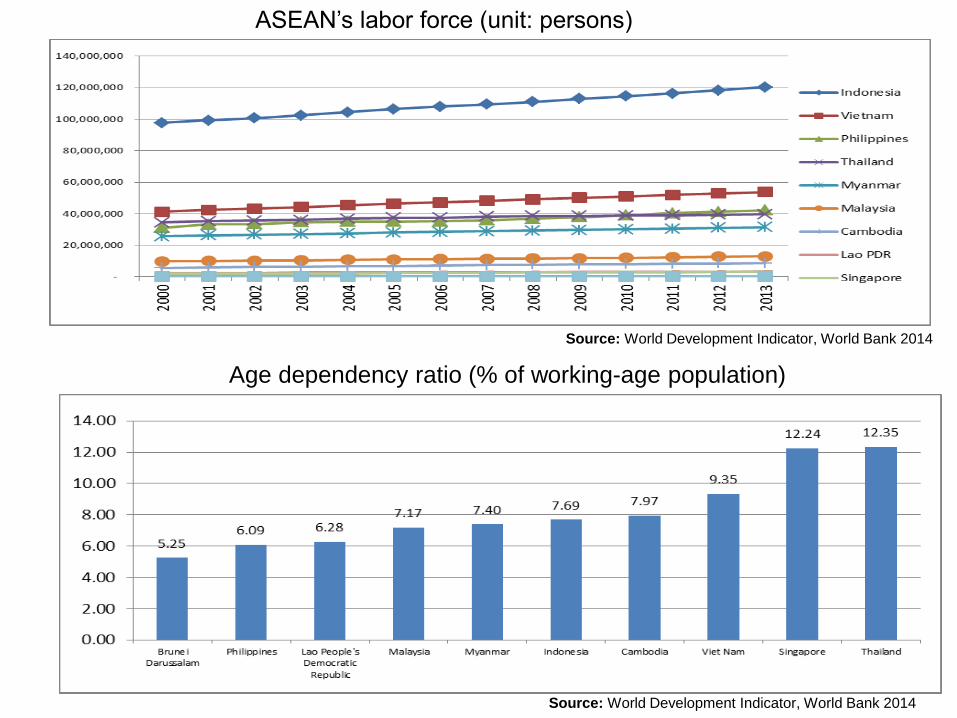
ASEAN’s labor force (unit: persons)
Age dependency ratio (% of working-age population)
Source: World Development Indicator, World Bank 2014
Source: World Development Indicator, World Bank 2014
2) Data aggregation
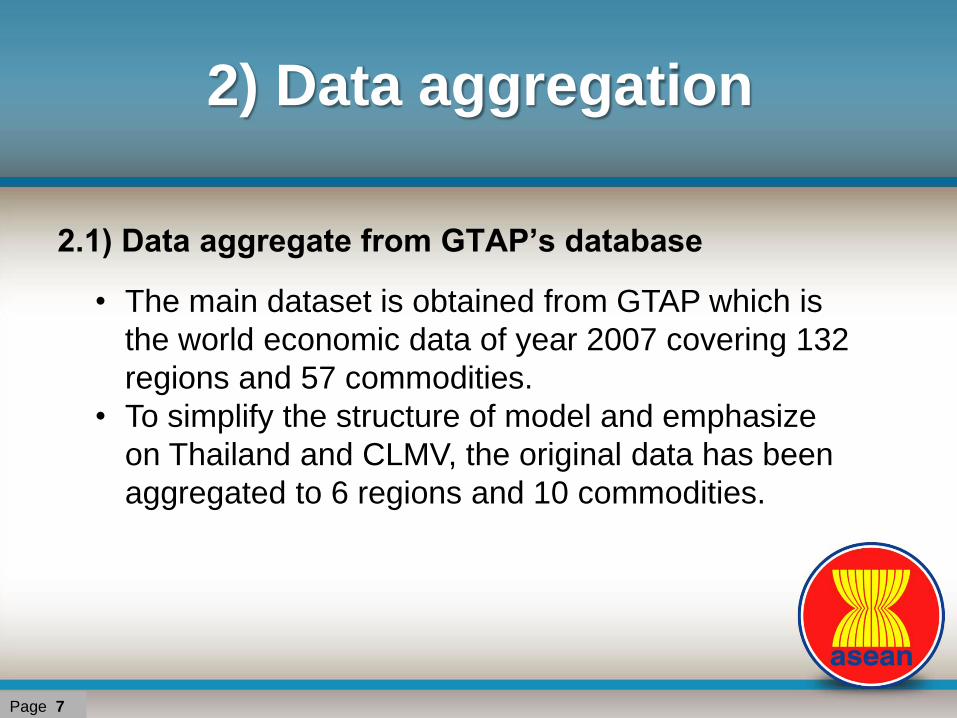
2.1) Data aggregate from GTAP’s database
Page 7
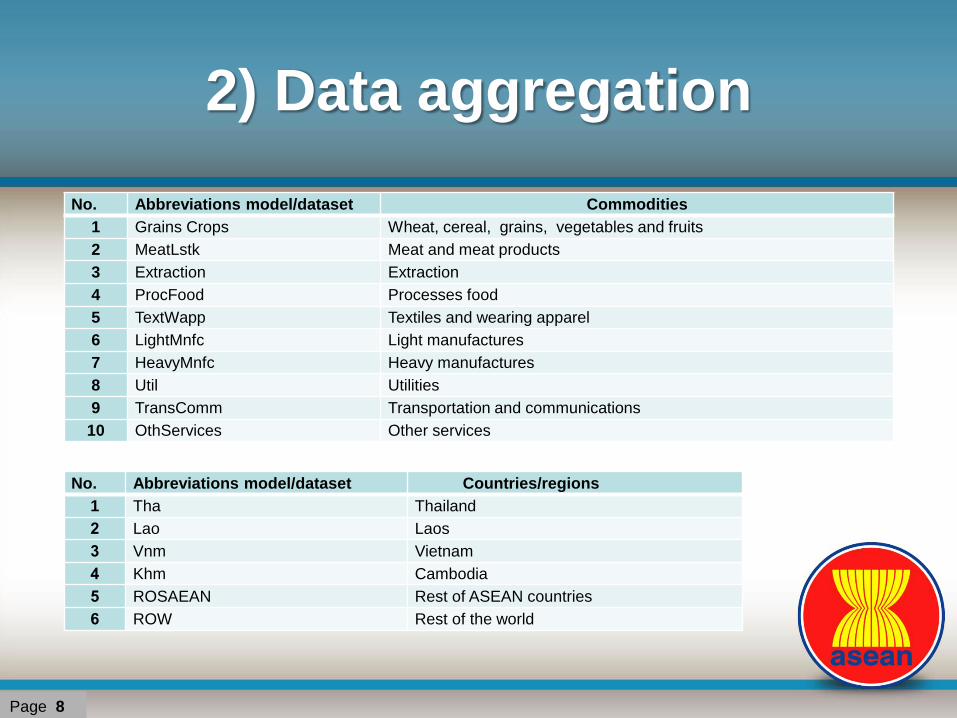
• The main dataset is obtained from GTAP which is
the world economic data of year 2007 covering 132
regions and 57 commodities.
• To simplify the structure of model and emphasize
on Thailand and CLMV, the original data has been
aggregated to 6 regions and 10 commodities.
2) Data aggregation
No. Abbreviations model/dataset Countries/regions
1 Tha Thailand
2 Lao Laos
3 Vnm Vietnam
4 Khm Cambodia
5 ROSAEAN Rest of ASEAN countries
6 ROW Rest of the world
8
No. Abbreviations model/dataset Commodities
1 Grains Crops Wheat, cereal, grains, vegetables and fruits
2 MeatLstk Meat and meat products
3 Extraction Extraction
4 ProcFood Processes food
5 TextWapp Textiles and wearing apparel
6 LightMnfc Light manufactures
7 HeavyMnfc Heavy manufactures
8 Util Utilities
9 TransComm Transportation and communications
10 OthServices Other services
Page 8
2) Data aggregation
2.2) Global Bilateral Migration database
9
• In addition to the domestic economic and international
trade statistics, the migration data has been gathered
and integrated.
• The World Bank’s Global Bilateral Migration is the main
source of labor flows.
• This data is matrix of 231*231 countries.
• This matrix has been constructed every 10 years since
1960. The latest matrix shows that among ASEAN
countries in 2010,
Page 9

2) Data aggregation
Numbers of emigrating workers (unit: persons) % Change
1960 1970 1980 1990 2000 1960 vs.
1970
1970 vs.
1970
1980 vs.
1990
1990 vs.
2000
Brunei Darussalam
20,551
32,892
50,954
73,196 104,127
60% 55% 44% 42%
Indonesia
1,859,454
1,170,217
736,452
463,465 149,741 -37% -37% -37% -68%
Cambodia
381,238
321,297
4,157
38,348 236,597 -16% -99% 822% 517%
Lao PDR
19,627
20,673
21,735
22,849 21,718 5% 5% 5% -5%
Myanmar
286,553
272,571
188,037
133,523 98,007 -5% -31% -29% -27%
Malaysia
56,883
736,297
674,645
951,460 1,503,266 1194% -8% 41% 58%
Philippines
219,663
217,413
121,633
136,170 322,483
-1% -44% 12% 137%
Singapore
519,217
530,840
526,978
726,959 1,351,787
2% -1% 38% 86%
Thailand
484,824
347,382
272,886
287,570 688,997
-28% -21% 5% 140%
Vietnam
3,997
4,414
4,874
7,288 40,599
10% 10% 50% 457%
Page 10
2) Data aggregation
2.3 Construction of Myanmar’s Social Accounting Matrix
• Because the database of GTAP version 8.0 does not
include the separated Social Accounting Matrix (SAM)
of Myanmar, this study has gathered data from various
sources and applied the Epochal approach to estimate
the structural data of Myanmar economy.
• The estimation is also based on the empirical
structure of Myanmar’s economy, which indicates
that agricultural sector is main activity while
service and manufacturing sectors are the
second and the third largest ones, respectively
Page 11
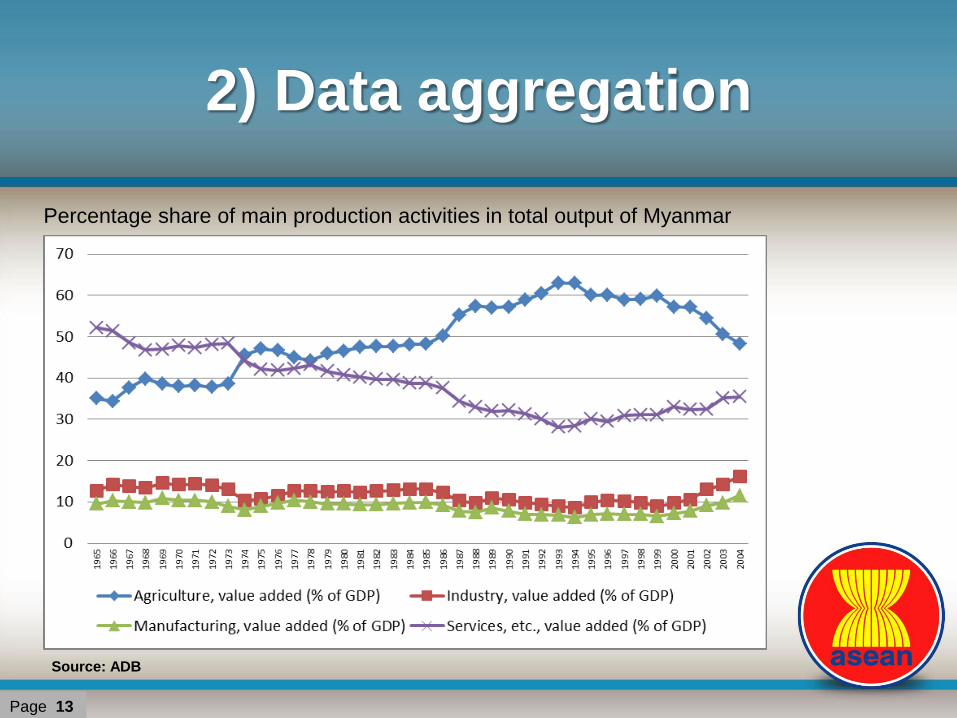
2) Data aggregation
• The evolution has been transforming from agricultural-
based toward the manufacturing and service intensive.
• For the estimated data of Myanmar in 2007 used in this
study, the agriculture was accounted for 43.64% of total
production.
• The service sector, mainly the wholesales and retails, was
21.58% and the industrial sector was 14.95% of the
aggregate output, respectively.
• For the aggregate demand based on ADB’s data, the total
private consumption had the share of 85.11%, while the
investment was the second largest component.
Page 12
2) Data aggregation
13
Page 13
Percentage share of main production activities in total output of Myanmar
Source: ADB
3) Model specification and
validation
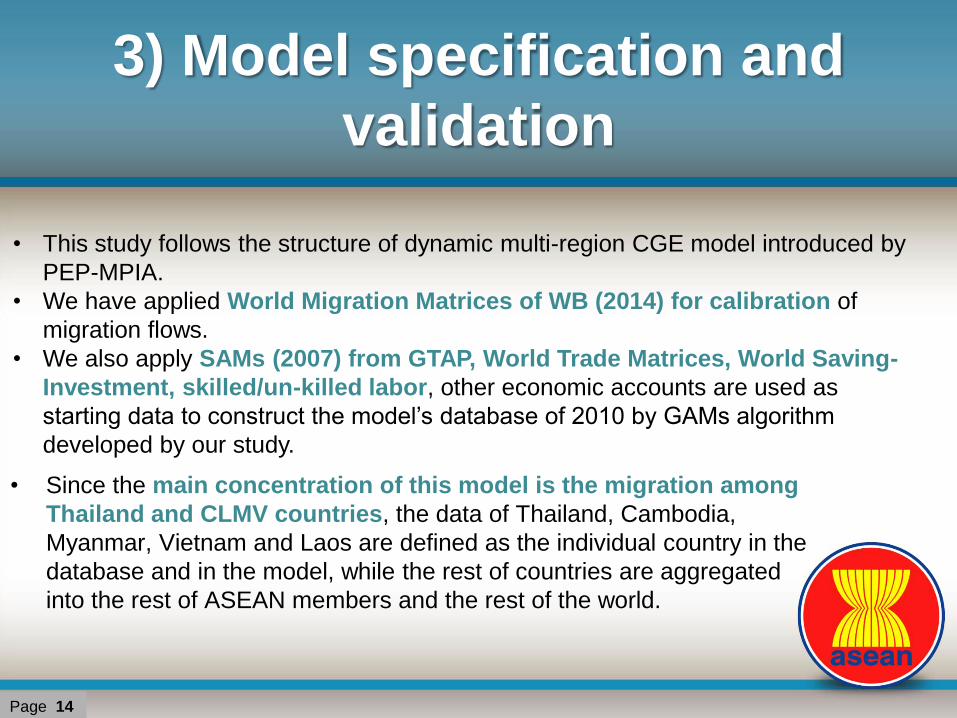
• Since the main concentration of this model is the migration among
Thailand and CLMV countries, the data of Thailand, Cambodia,
Myanmar, Vietnam and Laos are defined as the individual country in the
database and in the model, while the rest of countries are aggregated
into the rest of ASEAN members and the rest of the world.
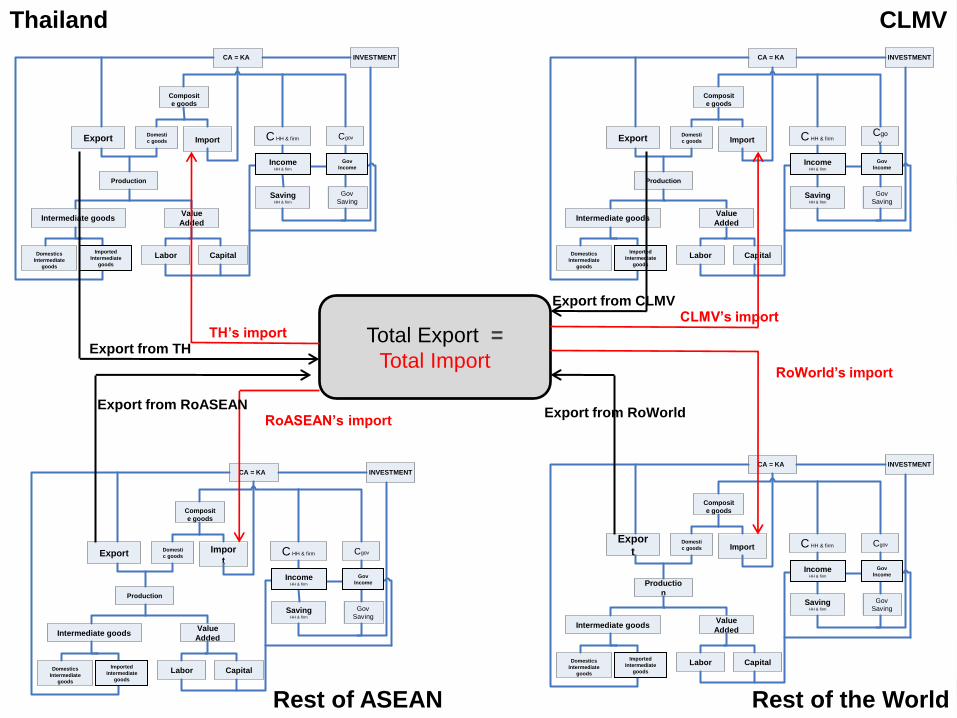
• This study follows the structure of dynamic multi-region CGE model introduced by
PEP-MPIA.
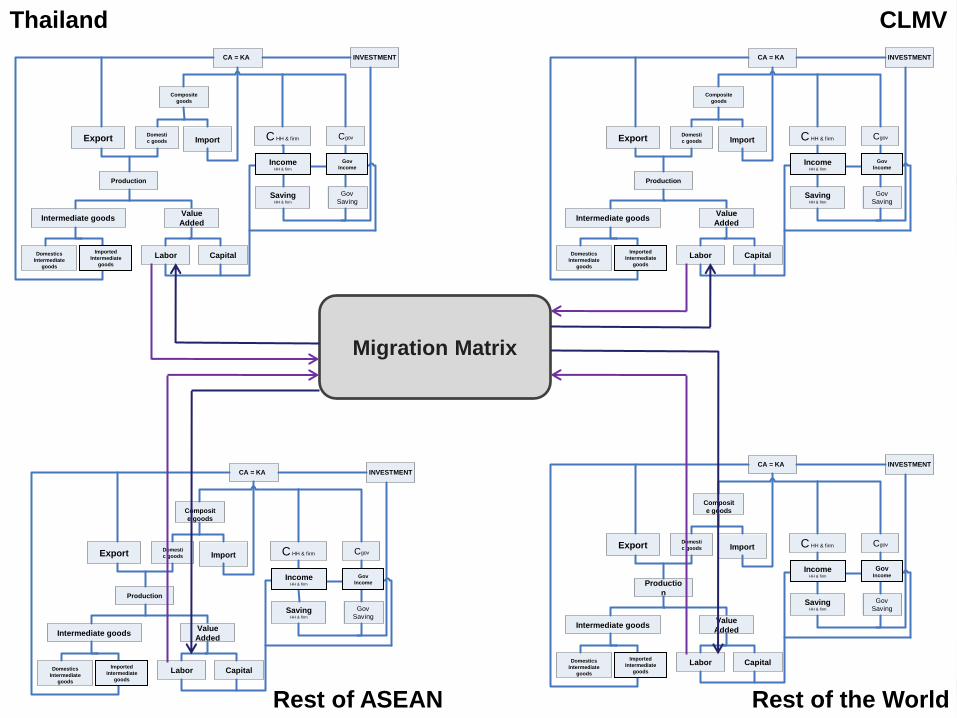
• We have applied World Migration Matrices of WB (2014) for calibration of
migration flows.
• We also apply SAMs (2007) from GTAP, World Trade Matrices, World Saving-
Investment, skilled/un-killed labor, other economic accounts are used as
starting data to construct the model’s database of 2010 by GAMs algorithm
developed by our study.
Page 14
3) Model’s specification and
validation
• The dynamic multi-region model has been specified the
classification based on the aggregate data of labor
migration.
• Particularly there are labors with 7 nationalities, which
are Thailand, Myanmar, Laos PDR, Cambodia, Vietnam,
the rest of ASEAN, and the rest of the world.
• There are two levels of labor’s skill which are skilled
and unskilled.
• Following the GTAP’s database, this classification is
based on occupation.
15
Page 15
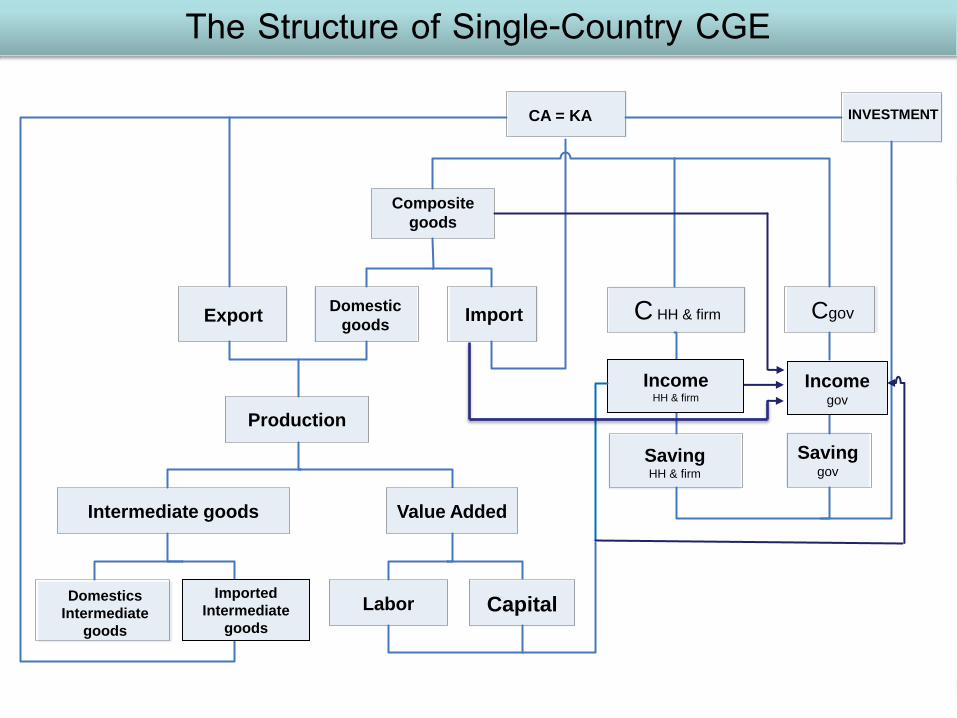
Production
Intermediate goods
Labor Capital
Export Domestic
goods
Composite
goods
Import
CA = KA INVESTMENT
C HH & firm Cgov
Saving HH & firm
Saving gov
Value Added
Domestics
Intermediate
goods
Income HH & firm
Income gov
Imported
Intermediate
goods
The Structure of Single-Country CGE
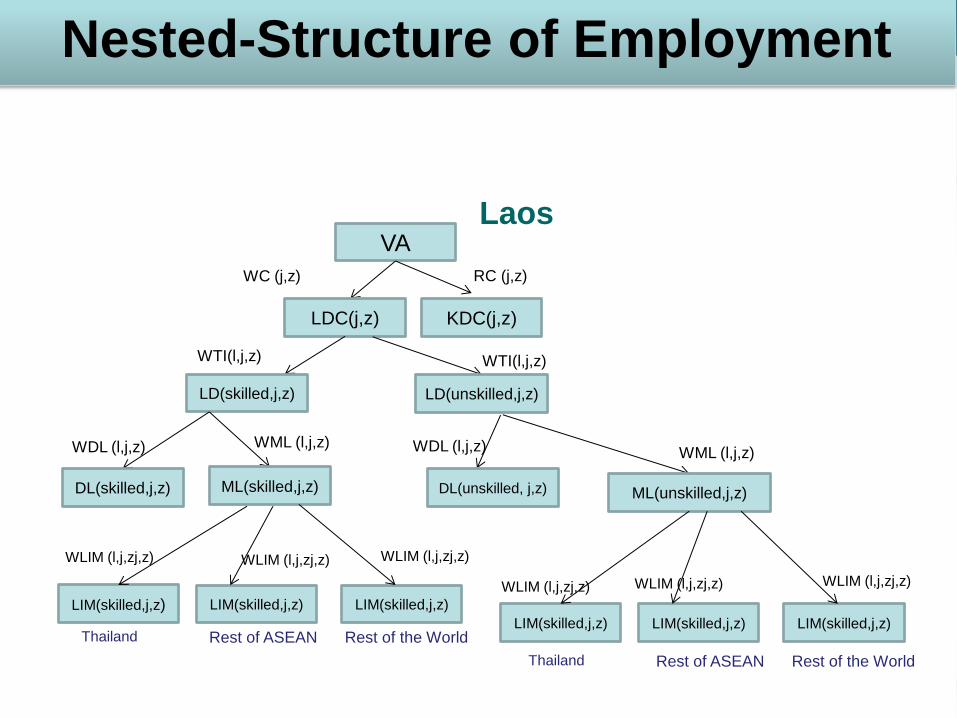
VA
LDC(j,z) KDC(j,z)
LD(skilled,j,z) LD(unskilled,j,z)
WTI(l,j,z)
WC (j,z) RC (j,z)
DL(unskilled, j,z) ML(unskilled,j,z)
WDL (l,j,z)
DL(skilled,j,z) ML(skilled,j,z)
WDL (l,j,z) WML (l,j,z) WML (l,j,z)
LIM(skilled,j,z) LIM(skilled,j,z) LIM(skilled,j,z)
LIM(skilled,j,z) LIM(skilled,j,z) LIM(skilled,j,z)
WLIM (l,j,zj,z) WLIM (l,j,zj,z) WLIM (l,j,zj,z)
WLIM (l,j,zj,z) WLIM (l,j,zj,z) WLIM (l,j,zj,z)
WTI(l,j,z)
Nested-Structure of Employment
Thailand Rest of ASEAN Rest of the World
Thailand Rest of ASEAN Rest of the World
Laos
Production
Intermediate goods
Labor Capital
Export Domesti
c goods
Composit
e goods
Import
CA = KA INVESTMENT
C HH & firm Cgo
v
Saving HH & firm
Gov
Saving
Value
Added
Domestics
Intermediate
goods
Income HH & firm
Gov
Income
Imported
Intermediate
goods
Production
Intermediate goods
Labor Capital
Export Domesti
c goods
Composit
e goods
Import
CA = KA INVESTMENT
C HH & firm Cgov
Saving HH & firm
Gov
Saving
Value
Added
Domestics
Intermediate
goods
Income HH & firm
Gov
Income
Imported
Intermediate
goods
Production
Intermediate goods
Labor Capital
Export Domesti
c goods
Composit
e goods
Impor
t
CA = KA INVESTMENT
C HH & firm Cgov
Saving HH & firm
Gov
Saving
Value
Added
Domestics
Intermediate
goods
Income HH & firm
Gov
Income
Imported
Intermediate
goods
Productio
n
Intermediate goods
Labor Capital
Expor
t Domesti
c goods
Composit
e goods
Import
CA = KA INVESTMENT
C HH & firm Cgov
Saving HH & firm
Gov
Saving
Value
Added
Domestics
Intermediate
goods
Income HH & firm
Gov
Income
Imported
Intermediate
goods
Total Export =
Total Import
TH’s import Export from TH
CLMV’s import Export from CLMV
RoASEAN’s import Export from RoASEAN
Export from RoWorld
RoWorld’s import
Thailand CLMV
Rest of ASEAN Rest of the World
Production
Intermediate goods
Labor Capital
Export Domesti
c goods
Composite
goods
Import
CA = KA INVESTMENT
C HH & firm Cgov
Saving HH & firm
Gov
Saving
Value
Added
Domestics
Intermediate
goods
Income HH & firm
Gov
Income
Imported
Intermediate
goods
Production
Intermediate goods
Labor Capital
Export Domesti
c goods
Composite
goods
Import
CA = KA INVESTMENT
C HH & firm Cgov
Saving HH & firm
Gov
Saving
Value
Added
Domestics
Intermediate
goods
Income HH & firm
Gov
Income
Imported
Intermediate
goods
Production
Intermediate goods
Labor Capital
Export Domesti
c goods
Composit
e goods
Import
CA = KA INVESTMENT
C HH & firm Cgov
Saving HH & firm
Gov
Saving
Value
Added
Domestics
Intermediate
goods
Income HH & firm
Gov
Income
Imported
Intermediate
goods
Productio
n
Intermediate goods
Labor Capital
Export Domesti
c goods
Composit
e goods
Import
CA = KA INVESTMENT
C HH & firm Cgov
Saving HH & firm
Gov
Saving
Value
Added
Domestics
Intermediate
goods
Income HH & firm
Gov Income
Imported
Intermediate
goods
Migration Matrix
Thailand CLMV
Rest of ASEAN Rest of the World

3) Model’s specification and
validation
• In order to replicate the key adjustment behavior of each
region, the model has been calibrated by adjusting some shift
coefficients in the nested structure of production functions.
• The calibration has enabled the simulation to closely
replicate the adjustment of main 6 economic indicators of
each region, which are: (1) real GDP
(2) total private consumption
(3) total investment
(4) total government revenue
(5) total export
(6) total import .
Page 20

Model’s validation (comparing simulation results with actual data) Thailand Laos Vietnam Cambodia Rest of ASEAN
Rest of the
World
(1) Real GDP
Root-Mean-Square Error (RMSE) (unit: million US dollar)
4,957.3 10.1
214.3 118.0
13,617,273,285 716,298.3
RMSE as % of the average real GDP during 2007-2010 2.48% 0.28% 0.30% 1.44% 1.68% 1.44%
(2) Total private consumption
Root-Mean-Square Error (RMSE) (unit: million US dollar)
1,416.2 34.5
1,434.9 411.1
6,635.6
247,101.5
RMSE as % of the average of the private consumption during
2007-2010 1.29% 1.38% 3.00% 6.06% 1.49% 0.84%
(3) Total investment
Root-Mean-Square Error (RMSE) (unit: million US dollar)
2,445.9 58.6
1,133.0 136.8
3,442.6
553,789.8
RMSE as % of the average of total investment during 2007-2010 4.63% 5.46% 4.17% 8.05% 1.79% 4.95%
(4) Total government expenditure
Root-Mean-Square Error (RMSE) (unit: million US dollar) 301.1 31.0
69.2 17.4
1,227.8
43,455.7
RMSE as % of the average of government expenditure during
2007-2010 1.18% 9.01% 1.64% 3.30% 1.51% 0.51%
(5) Total export
Root-Mean-Square Error (RMSE) (unit: million US dollar)
9,123.3 51.4
3,456.1 576.2
35,314.3
1,059,801.1
RMSE as % of the average of total export during 2007-2010 5.94% 4.30% 6.86% 9.77% 4.90% 7.31%
(6) Total import
Root-Mean-Square Error (RMSE) (unit: million US dollar)
13,574.0 142.3
3,577.8 838.2
40,835.0
865,334.6
RMSE as % of the average of total export during 2007-2010 9.59% 9.38% 5.95% 12.22% 6.48% 6.10%

4) Simulation result
There are 3 simulations:
Scenario 1: Base case (no AEC integration)
Scenario 2: With AEC integration (free flows of
goods and labors)
Scenario 3: With AEC integration and
Thailand’s restructure
Page 22

4) Simulation result
Scenario 1: Base case (no AEC integration)
• Thai economy will grow at the rate of
3.88% to 4.16% annually.
• The annual growth of CLMV will be higher,
at around 6.3 to 7.84%, due to their stage
of development.
Page 23
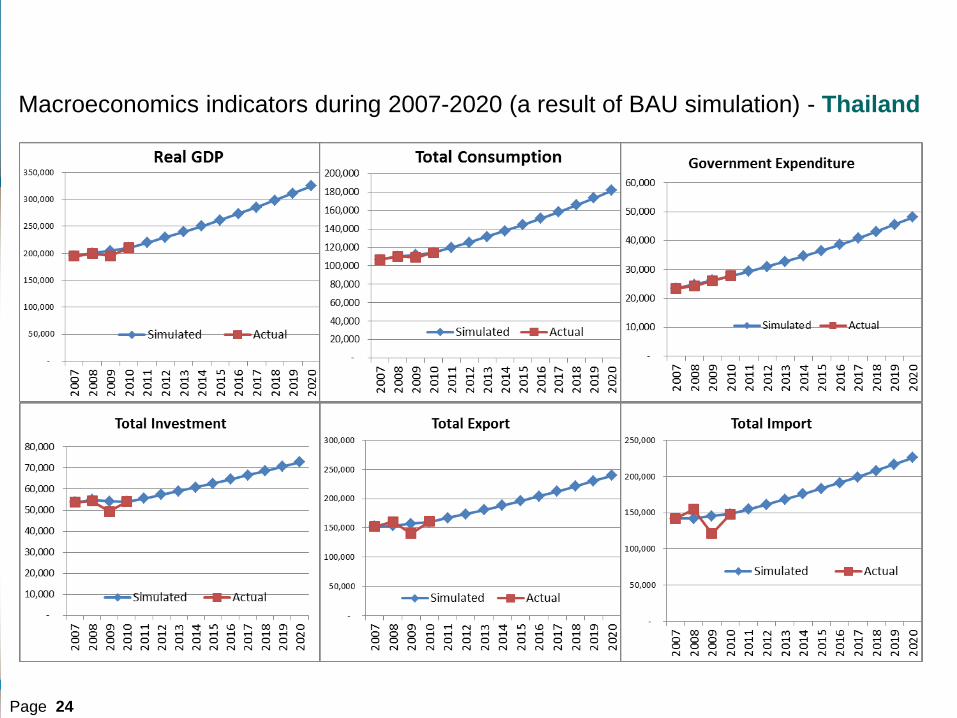
Macroeconomics indicators during 2007-2020 (a result of BAU simulation) - Thailand
Page 24

Macroeconomics indicators during 2007-2020 (a result of BAU simulation) - Cambodia
Page 25
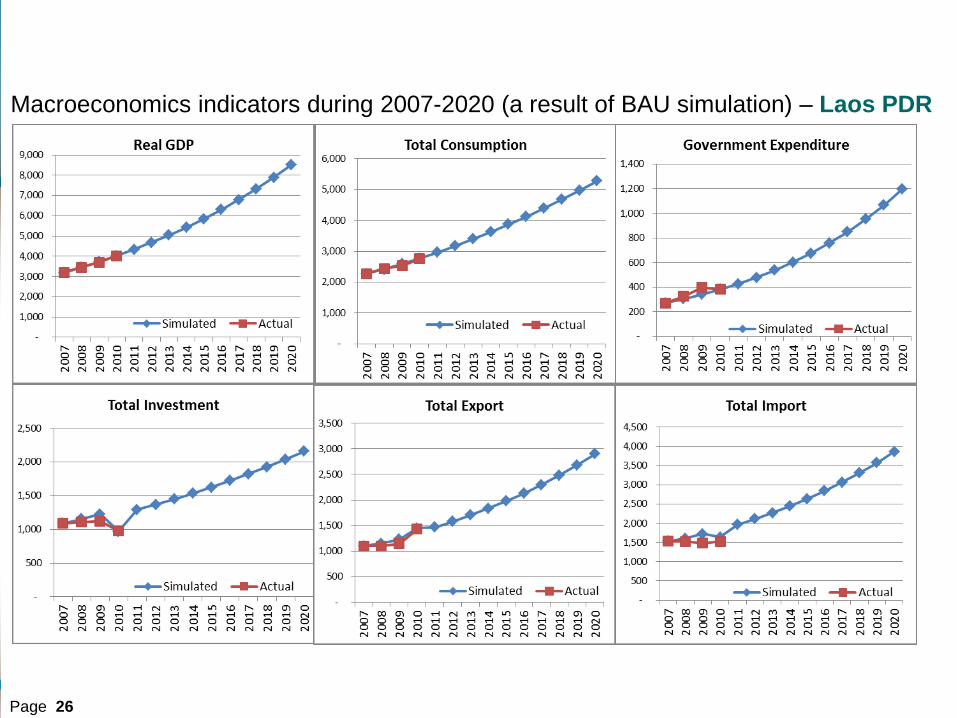
Macroeconomics indicators during 2007-2020 (a result of BAU simulation) – Laos PDR
Page 26
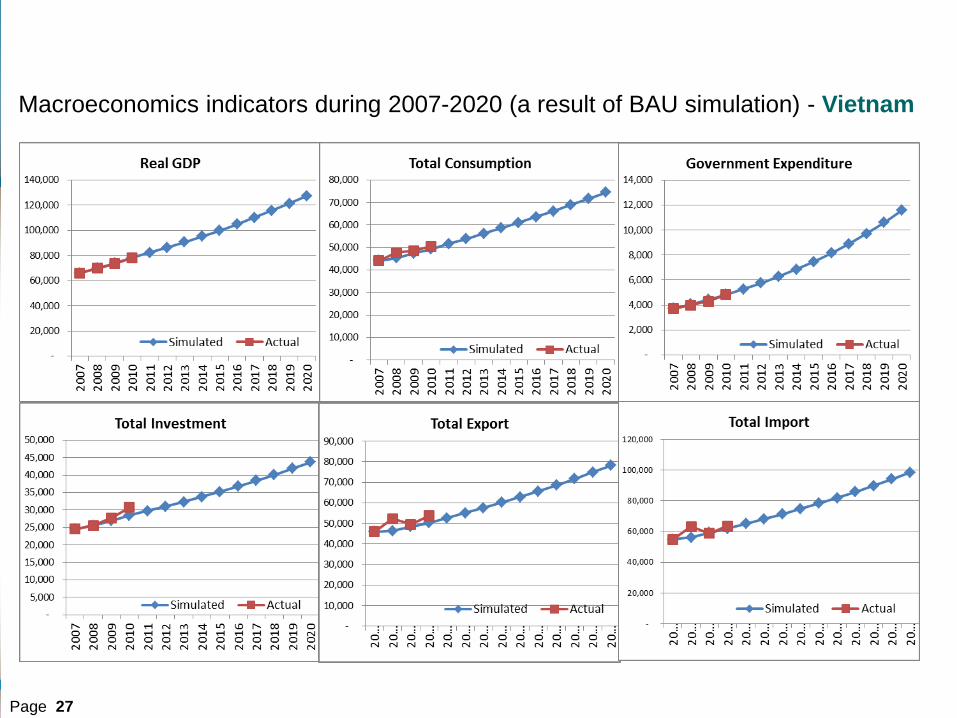
Macroeconomics indicators during 2007-2020 (a result of BAU simulation) - Vietnam
Page 27
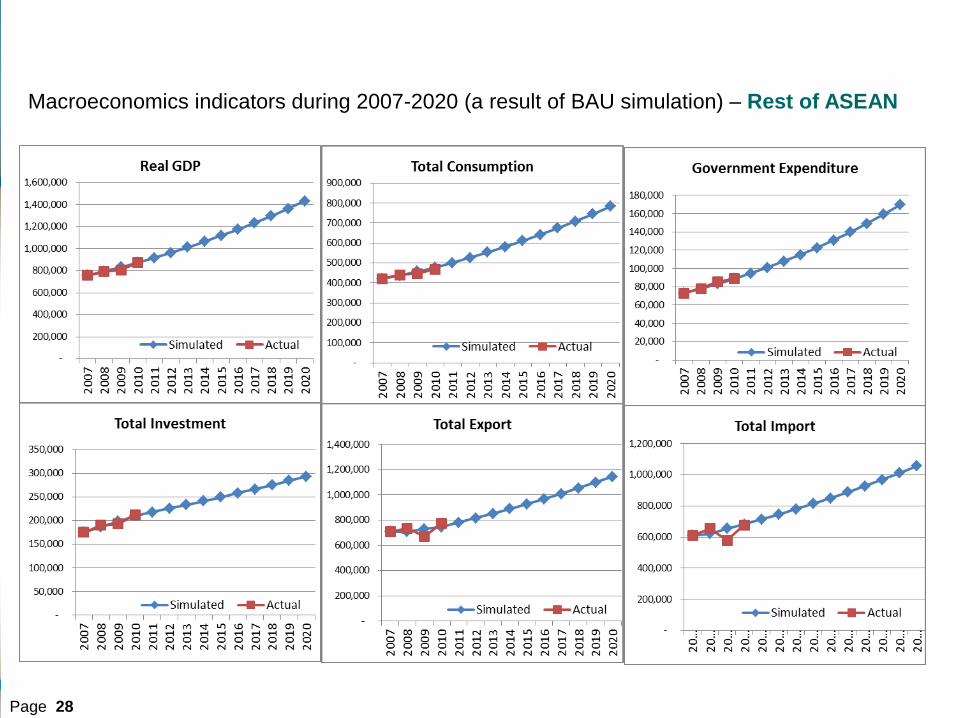
Macroeconomics indicators during 2007-2020 (a result of BAU simulation) – Rest of ASEAN
Page 28
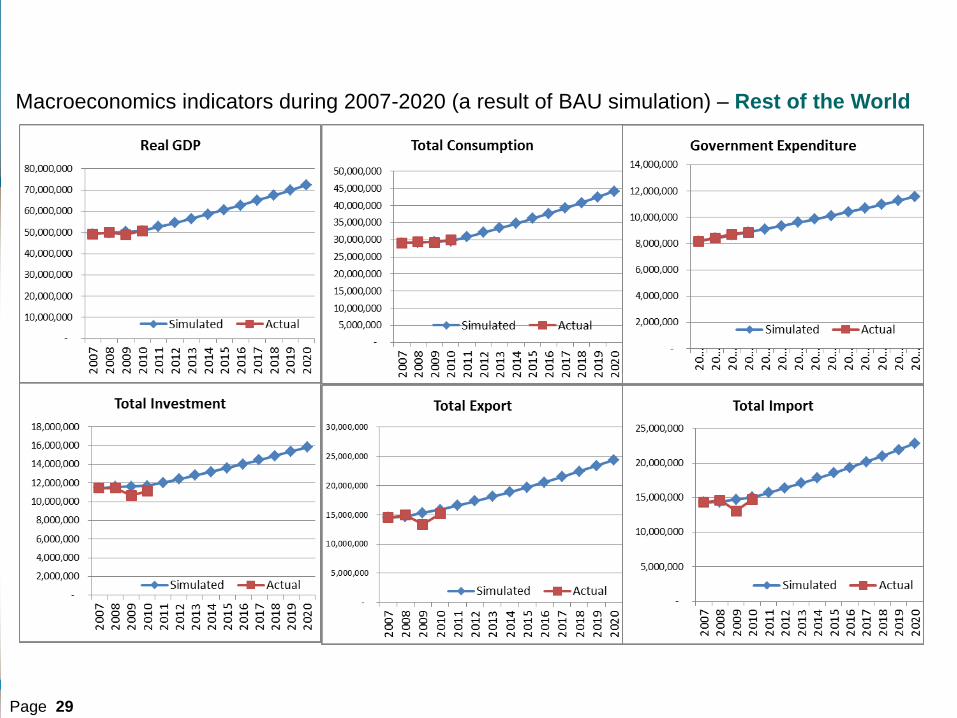
Macroeconomics indicators during 2007-2020 (a result of BAU simulation) – Rest of the World
Page 29
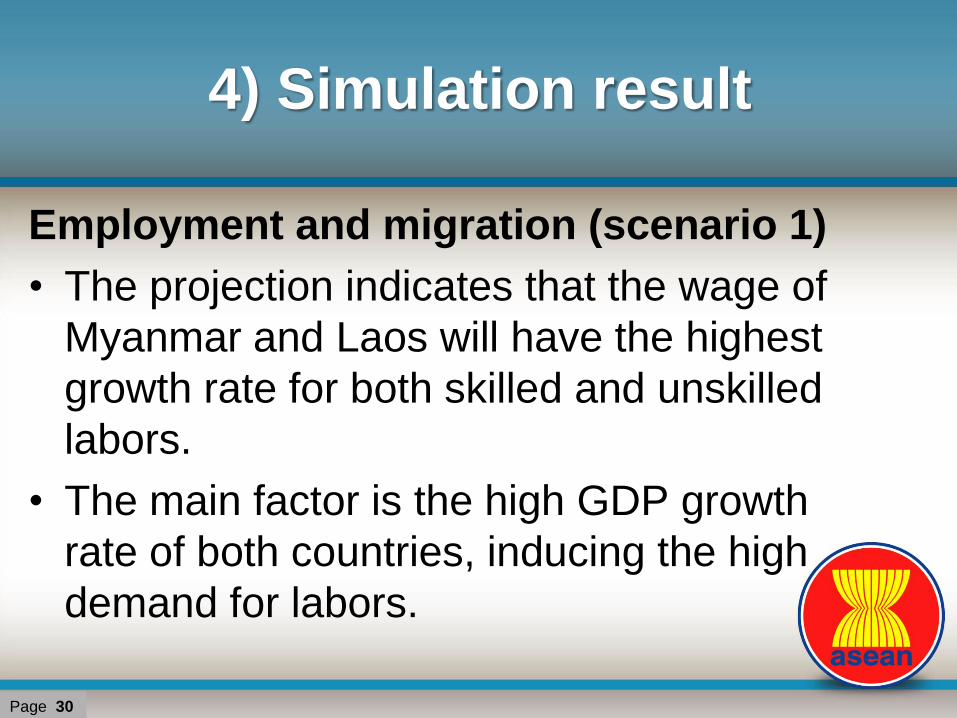
4) Simulation result
Employment and migration (scenario 1)
• The projection indicates that the wage of
Myanmar and Laos will have the highest
growth rate for both skilled and unskilled
labors.
• The main factor is the high GDP growth
rate of both countries, inducing the high
demand for labors.
Page 30

4) Simulation result
Page 31
Scenario 1 : Wage index (year 2007 = 1.000)
Cambodia Cambodia
Laos PDR
Laos PDR
Myanmar Myanmar
Thailand Thailand
Vietnam
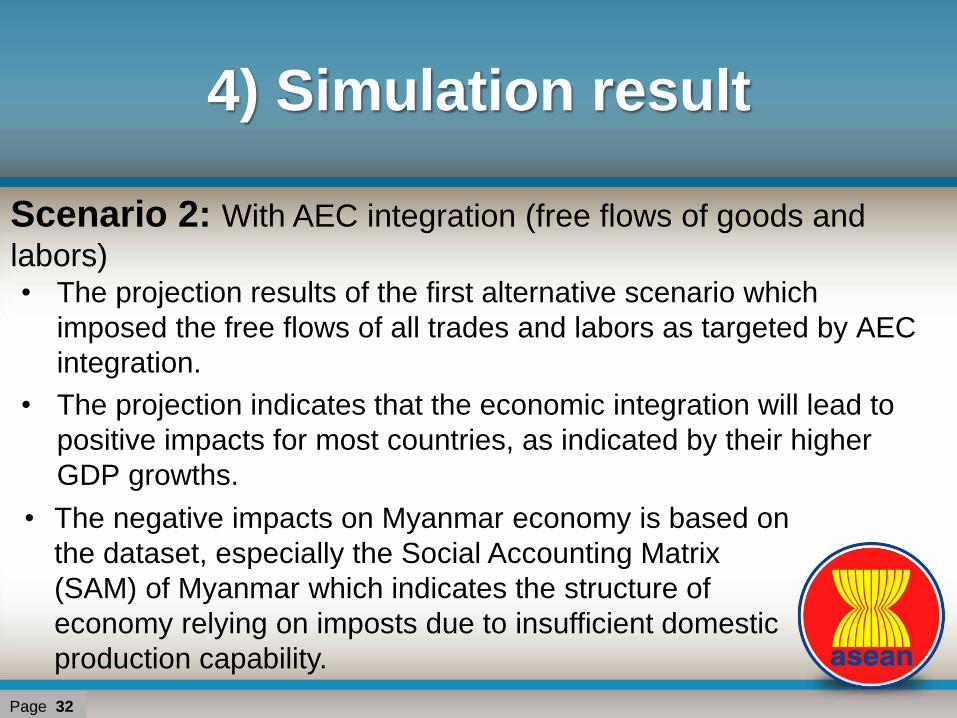
4) Simulation result
• The projection results of the first alternative scenario which
imposed the free flows of all trades and labors as targeted by AEC
integration.
• The projection indicates that the economic integration will lead to
positive impacts for most countries, as indicated by their higher
GDP growths.
• The negative impacts on Myanmar economy is based on
the dataset, especially the Social Accounting Matrix
(SAM) of Myanmar which indicates the structure of
economy relying on imposts due to insufficient domestic
production capability.
Scenario 2: With AEC integration (free flows of goods and
labors)
Page 32

% Change of GDP due to AEC 2015 2016 2017 2018 2019 2020
Cambodia
Business As Usual 1.119 1.186 1.256 1.331 1.410 1.494
AEC integration 1.119 1.186 1.257 1.333 1.413 1.498
Percentage Change 0.000% 0.001% 0.081% 0.158% 0.231% 0.301%
Laos PDR
Business As Usual 0.745 0.803 0.865 0.933 1.005 1.084
AEC integration 0.745 0.803 0.866 0.933 1.006 1.084
Percentage Change 0.000% 0.035% 0.050% 0.064% 0.077% 0.090%
Myanmar
Business As Usual 0.560 0.610 0.665 0.725 0.790 0.861
AEC integration 0.560 0.610 0.665 0.725 0.790 0.861
Percentage Change 0.000% 0.005% -0.007% -0.015% -0.021% -0.024%
Rest of ASEAN
Business As Usual 132.147 138.841 145.874 153.263 161.026 169.183
AEC integration 132.147 138.841 145.887 153.290 161.068 169.240
Percentage Change 0.000% 0.000% 0.009% 0.018% 0.026% 0.034%
Rest of the World
Business As Usual 6,343.194 6,571.537 6,808.100 7,053.179 7,307.080 7,570.121
AEC integration 6,343.194 6,571.540 6,808.088 7,053.155 7,307.044 7,570.074
Percentage Change 0.000% 0.000% 0.000% 0.000% 0.000% -0.001%
Thailand
Business As Usual 30.016 31.353 32.750 34.209 35.732 37.324
AEC integration 30.016 31.353 32.754 34.218 35.746 37.342
Percentage Change 0.000% -0.001% 0.013% 0.026% 0.038% 0.049%
Vietnam
Business As Usual 8.593 9.023 9.475 9.949 10.447 10.970
AEC integration 8.593 9.036 9.491 9.968 10.467 10.991
Percentage Change 0.000% 0.136% 0.170% 0.187% 0.195% 0.197%
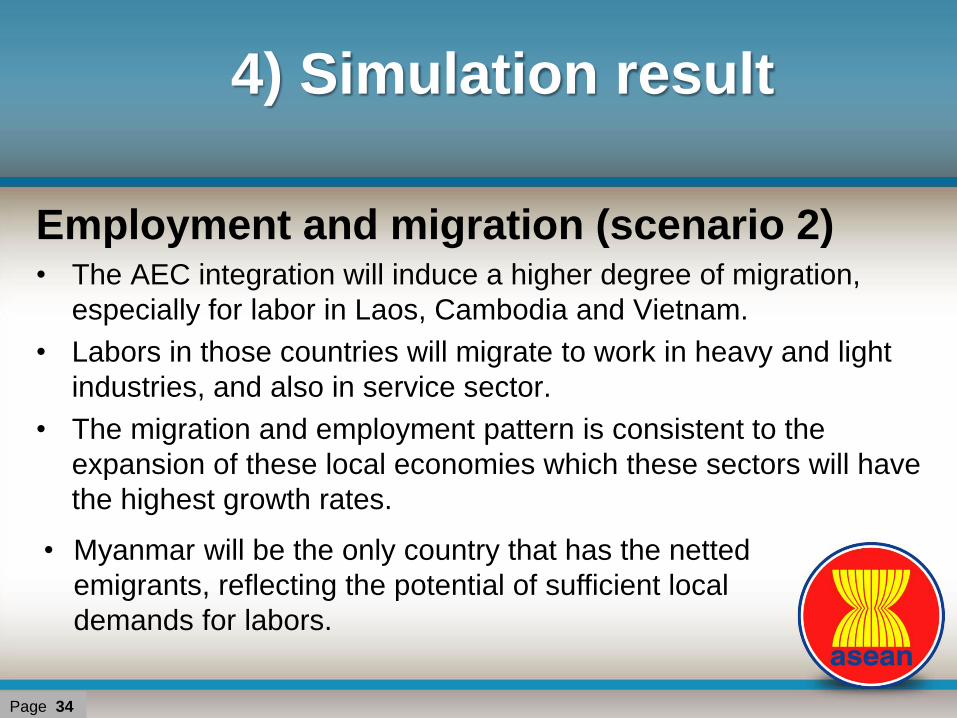
4) Simulation result
Employment and migration (scenario 2) • The AEC integration will induce a higher degree of migration,
especially for labor in Laos, Cambodia and Vietnam.
• Labors in those countries will migrate to work in heavy and light
industries, and also in service sector.
• The migration and employment pattern is consistent to the
expansion of these local economies which these sectors will have
the highest growth rates.
Page 34
• Myanmar will be the only country that has the netted
emigrants, reflecting the potential of sufficient local
demands for labors.
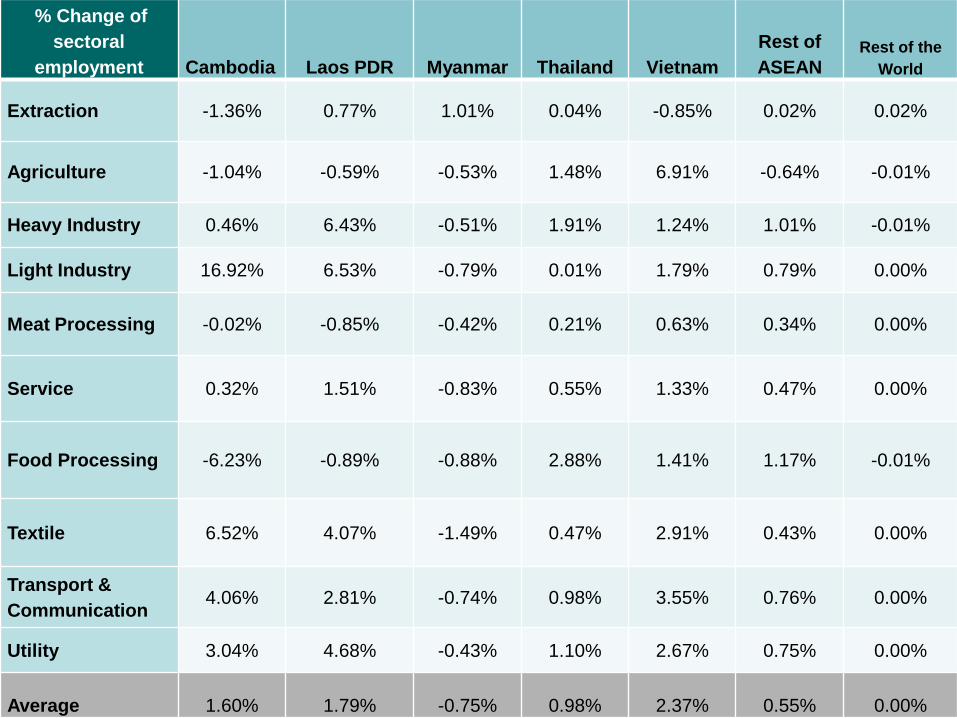
% Change of
sectoral
employment Cambodia Laos PDR Myanmar Thailand Vietnam
Rest of
ASEAN Rest of the
World
Extraction -1.36% 0.77% 1.01% 0.04% -0.85% 0.02% 0.02%
Agriculture -1.04% -0.59% -0.53% 1.48% 6.91% -0.64% -0.01%
Heavy Industry 0.46% 6.43% -0.51% 1.91% 1.24% 1.01% -0.01%
Light Industry 16.92% 6.53% -0.79% 0.01% 1.79% 0.79% 0.00%
Meat Processing -0.02% -0.85% -0.42% 0.21% 0.63% 0.34% 0.00%
Service 0.32% 1.51% -0.83% 0.55% 1.33% 0.47% 0.00%
Food Processing -6.23% -0.89% -0.88% 2.88% 1.41% 1.17% -0.01%
Textile 6.52% 4.07% -1.49% 0.47% 2.91% 0.43% 0.00%
Transport &
Communication 4.06% 2.81% -0.74% 0.98% 3.55% 0.76% 0.00%
Utility 3.04% 4.68% -0.43% 1.10% 2.67% 0.75% 0.00%
Average 1.60% 1.79% -0.75% 0.98% 2.37% 0.55% 0.00%

Change in Migration Stock in Thailand after
AEC integration (unit: persons)
Scenario 1 (Base case ) Scenario 2 difference % change
2016 2,420,084 2,441,200 21,117 0.87%
2017 2,531,547 2,554,635 23,087 0.90%
2018 2,650,326 2,675,276 24,951 0.93%
2019 2,777,006 2,803,859 26,853 0.96%
2020 2,912,331 2,941,160 28,829 0.98%
Page 36
4) Simulation result
• This scenario assumes that Thailand will re-structure the
economy through investment in innovation and technology
that leads to the capital intensive activity.
• Also it is assumed that this investment will influence the Marginal
Productivity of Capital to be at the rate of 1% higher than that of
previous scenario throughout the years after AEC integration.
Scenario 3: With AEC integration and Thailand’s
restructure
• In addition this scenario assumes that all labor will retire
at the age of 64 years old, and this will increase the
domestic labor supply by approximately 2%.
Page 37

4) Simulation result
Scenario 1 (Base case) (unit:
10 billion $ at constant price)
% Annual
Growth
Scenario 3 (unit: 10 billion $
at constant price)
% Annual
Growth
% change
from
Basecase
2015 30.016 - 30.016 - -
2016 31.353 4.45% 31.583 5.22% 0.73%
2017 32.750 4.45% 33.241 5.25% 1.50%
2018 34.209 4.45% 35.237 6.01% 3.01%
2019 35.732 4.45% 37.095 5.27% 3.81%
2020 37.324 4.45% 39.049 5.27% 4.62%
Scenario 3: Impact on GDP of Thailand
All macroeconomic indicators exhibit all expansions, especially
the real GDP in 2020 that will be 4.62% higher than that of the
base case (i.e. scenario 1).
Page 38
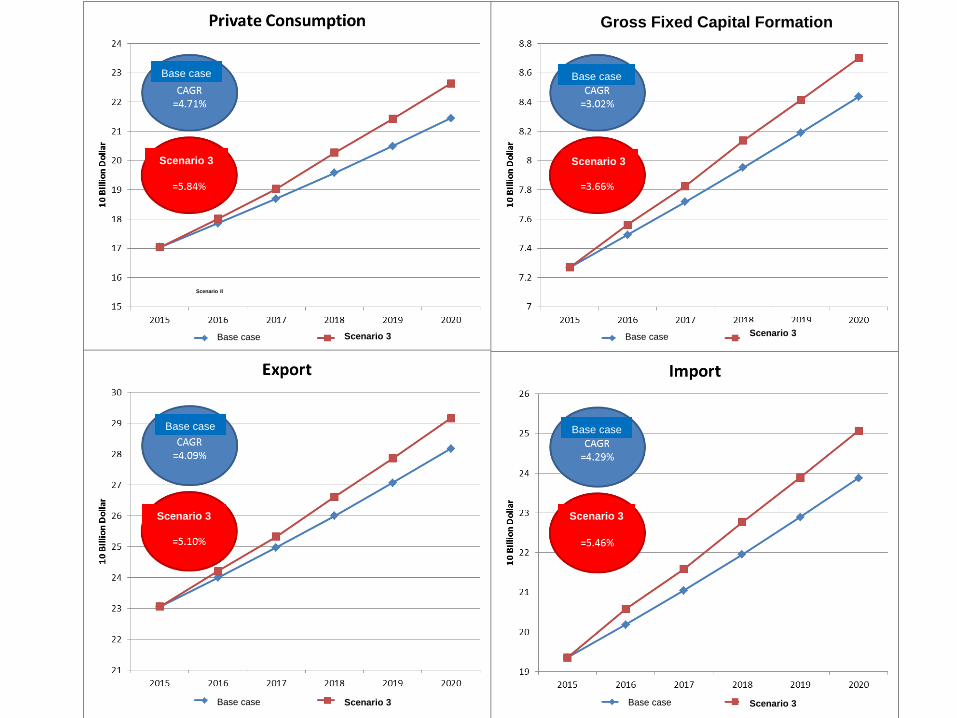
Scenario 3
Scenario II
Scenario 3
Scenario 3
Scenario 3
Scenario 3
Scenario 3
Scenario 3
Scenario 3 Base case Base case
Base case Base case
Gross Fixed Capital Formation
Base case Base case
Base case Base case
4) Simulation result
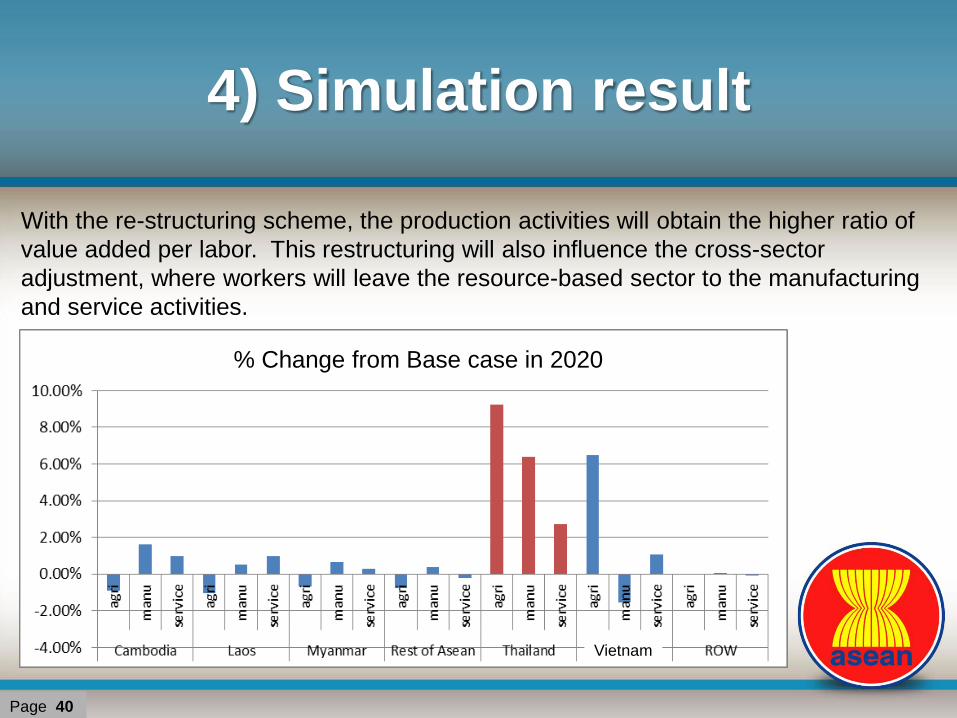
With the re-structuring scheme, the production activities will obtain the higher ratio of
value added per labor. This restructuring will also influence the cross-sector
adjustment, where workers will leave the resource-based sector to the manufacturing
and service activities.
Page 40
Vietnam
% Change from Base case in 2020
4) Simulation result
Employment and migration (scenario 3)
• With the higher labor productivity and expanding labor
supply, this simulation shows that Thailand’s demand for
immigrants will be 2,521,257 persons, lower than that of
previous scenario (2,912,331 persons).
• The majority of immigrant is still Myanmar workers. This
result identifies the significance of investment in innovation
and technology and also the domestic policy regarding
ageing society and mobility of labors
Page 41
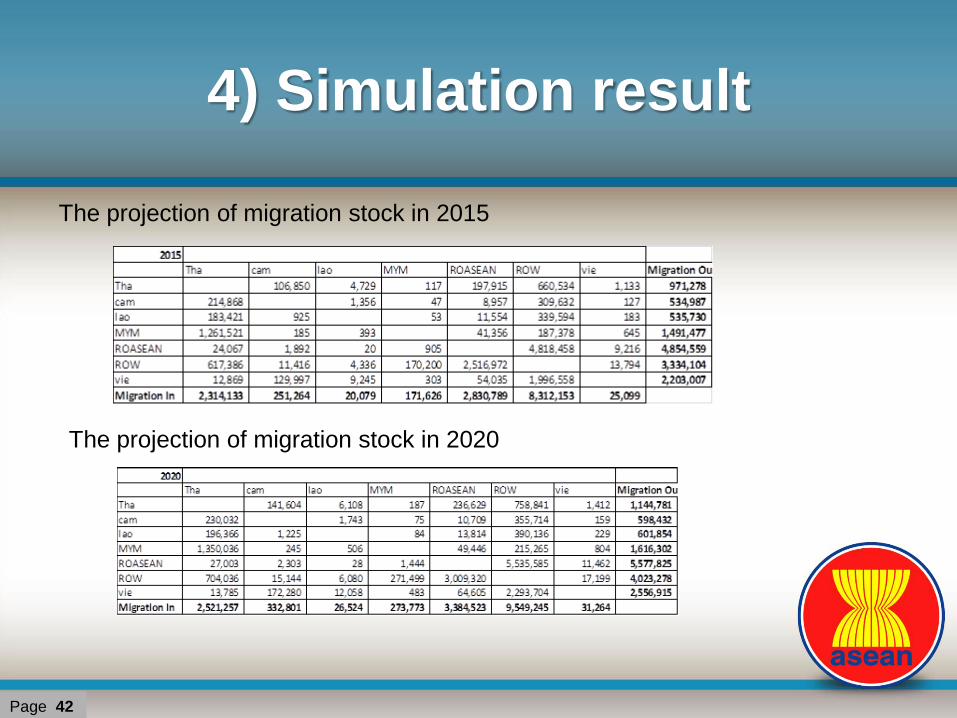
4) Simulation result
The projection of migration stock in 2015
The projection of migration stock in 2020
Page 42

5) Policy recommendations
Recommendation 1: Eradicating any
obstruction to obstruct the process of AEC
integration.
Page 43
• Without doubt, AEC integration would create the larger markets
and opportunities in exploiting lower labor cost. The free flow
would also increase the mutual wealth and welfare among
ASEAN members.
5) Policy recommendations
Recommendation 2: Thailand would need to
prepare for the proper labor law and regulation as
well as enhancement on labor qualification and
competency scheme.
• The model simulation has shown the demand for the
composite labor which is the combination of both skilled
and unskilled labors.
• Without the proper regulation and the development of
labor’s skills, the implementation of AEC integration may
not fully benefit the country as targeted.
Page 44

5) Policy recommendations
Recommendation 3: A policy on production
relocation is required, especially for the labor-
intensive industries.
45
Page 45
• The simulation result has shown that the proper capital deepening
and investment in human capita would gain the positive impacts on
Thai economy after AEC integration.
• This relocation policy should consider implicit costs which also
include cultural issues, language barriers, and labor laws in other
countries. Hence, more studies on these issues are required to
support the proposed policy.
46

Thank you
Page 47
Acknowledgement: All PowerPoint templates used in this presentation were obtained
from www.fppt.com
Related Documents